

Compact Muon Solenoid
LHC, CERN
| CMS-SUS-23-006 ; CERN-EP-2025-244 | ||
| Search for $ \mathrm{Z}^{'} $ bosons decaying into charginos in final states with two oppositely charged leptons and missing transverse momentum in pp collisions at $ \sqrt{s} = $ 13 TeV | ||
| CMS Collaboration | ||
| 11 March 2026 | ||
| Submitted to the Journal of High Energy Physics | ||
| Abstract: Massive leptophobic $ \mathrm{Z}^{'} $ bosons decaying to a pair of charginos are searched for in proton-proton collisions at $ \sqrt{s} = $ 13 TeV, using data samples collected by the CMS experiment in 2016, 2017, and 2018, corresponding to a total integrated luminosity of 138 fb$ ^{-1} $. The $ \mathrm{Z}^{'} $ bosons originate from an additional $ U(1)^\prime $ gauge symmetry extended to the minimal supersymmetric standard model. The final state consists of two oppositely charged leptons and missing transverse momentum. The signal extraction is performed with a parametrized neural network. The measurements are found to be consistent with the standard model expectations. Upper limits are set on the $ \mathrm{Z}^{'} $ boson production cross sections as a function of the $ \mathrm{Z}^{'} $ and chargino masses. The analysis excludes $ \mathrm{Z}^{'} $ boson masses up to about 3.5 TeV for the specific case of $ \mathrm{Z}^{'} $ bosons decaying exclusively to charginos, with the charginos decaying to W bosons and neutralinos. | ||
| Links: e-print arXiv:2603.11035 [hep-ex] (PDF) ; CDS record ; inSPIRE record ; CADI line (restricted) ; | ||
| Figures | |
png pdf |
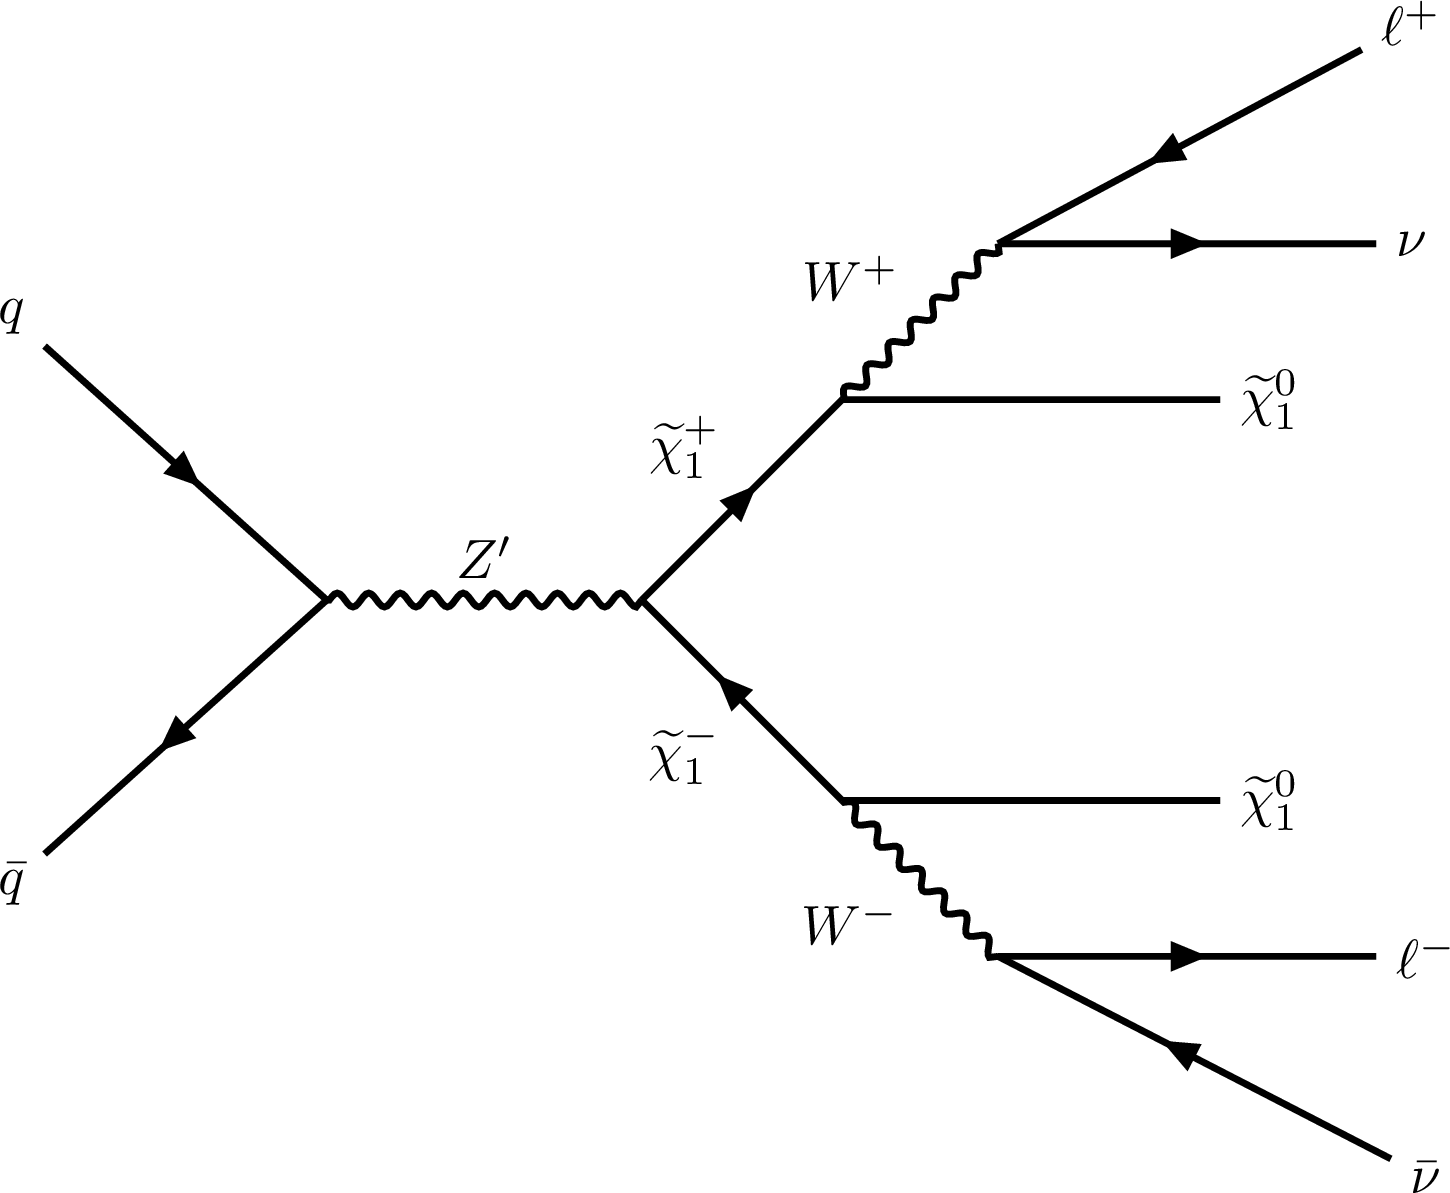
Figure 1:
Diagram showing the signal process studied in this analysis: a leptophobic $ \mathrm{Z}^{'} $ boson decaying into two charginos, each subsequently decaying into a lepton, a neutrino, and a neutralino. |
png pdf |
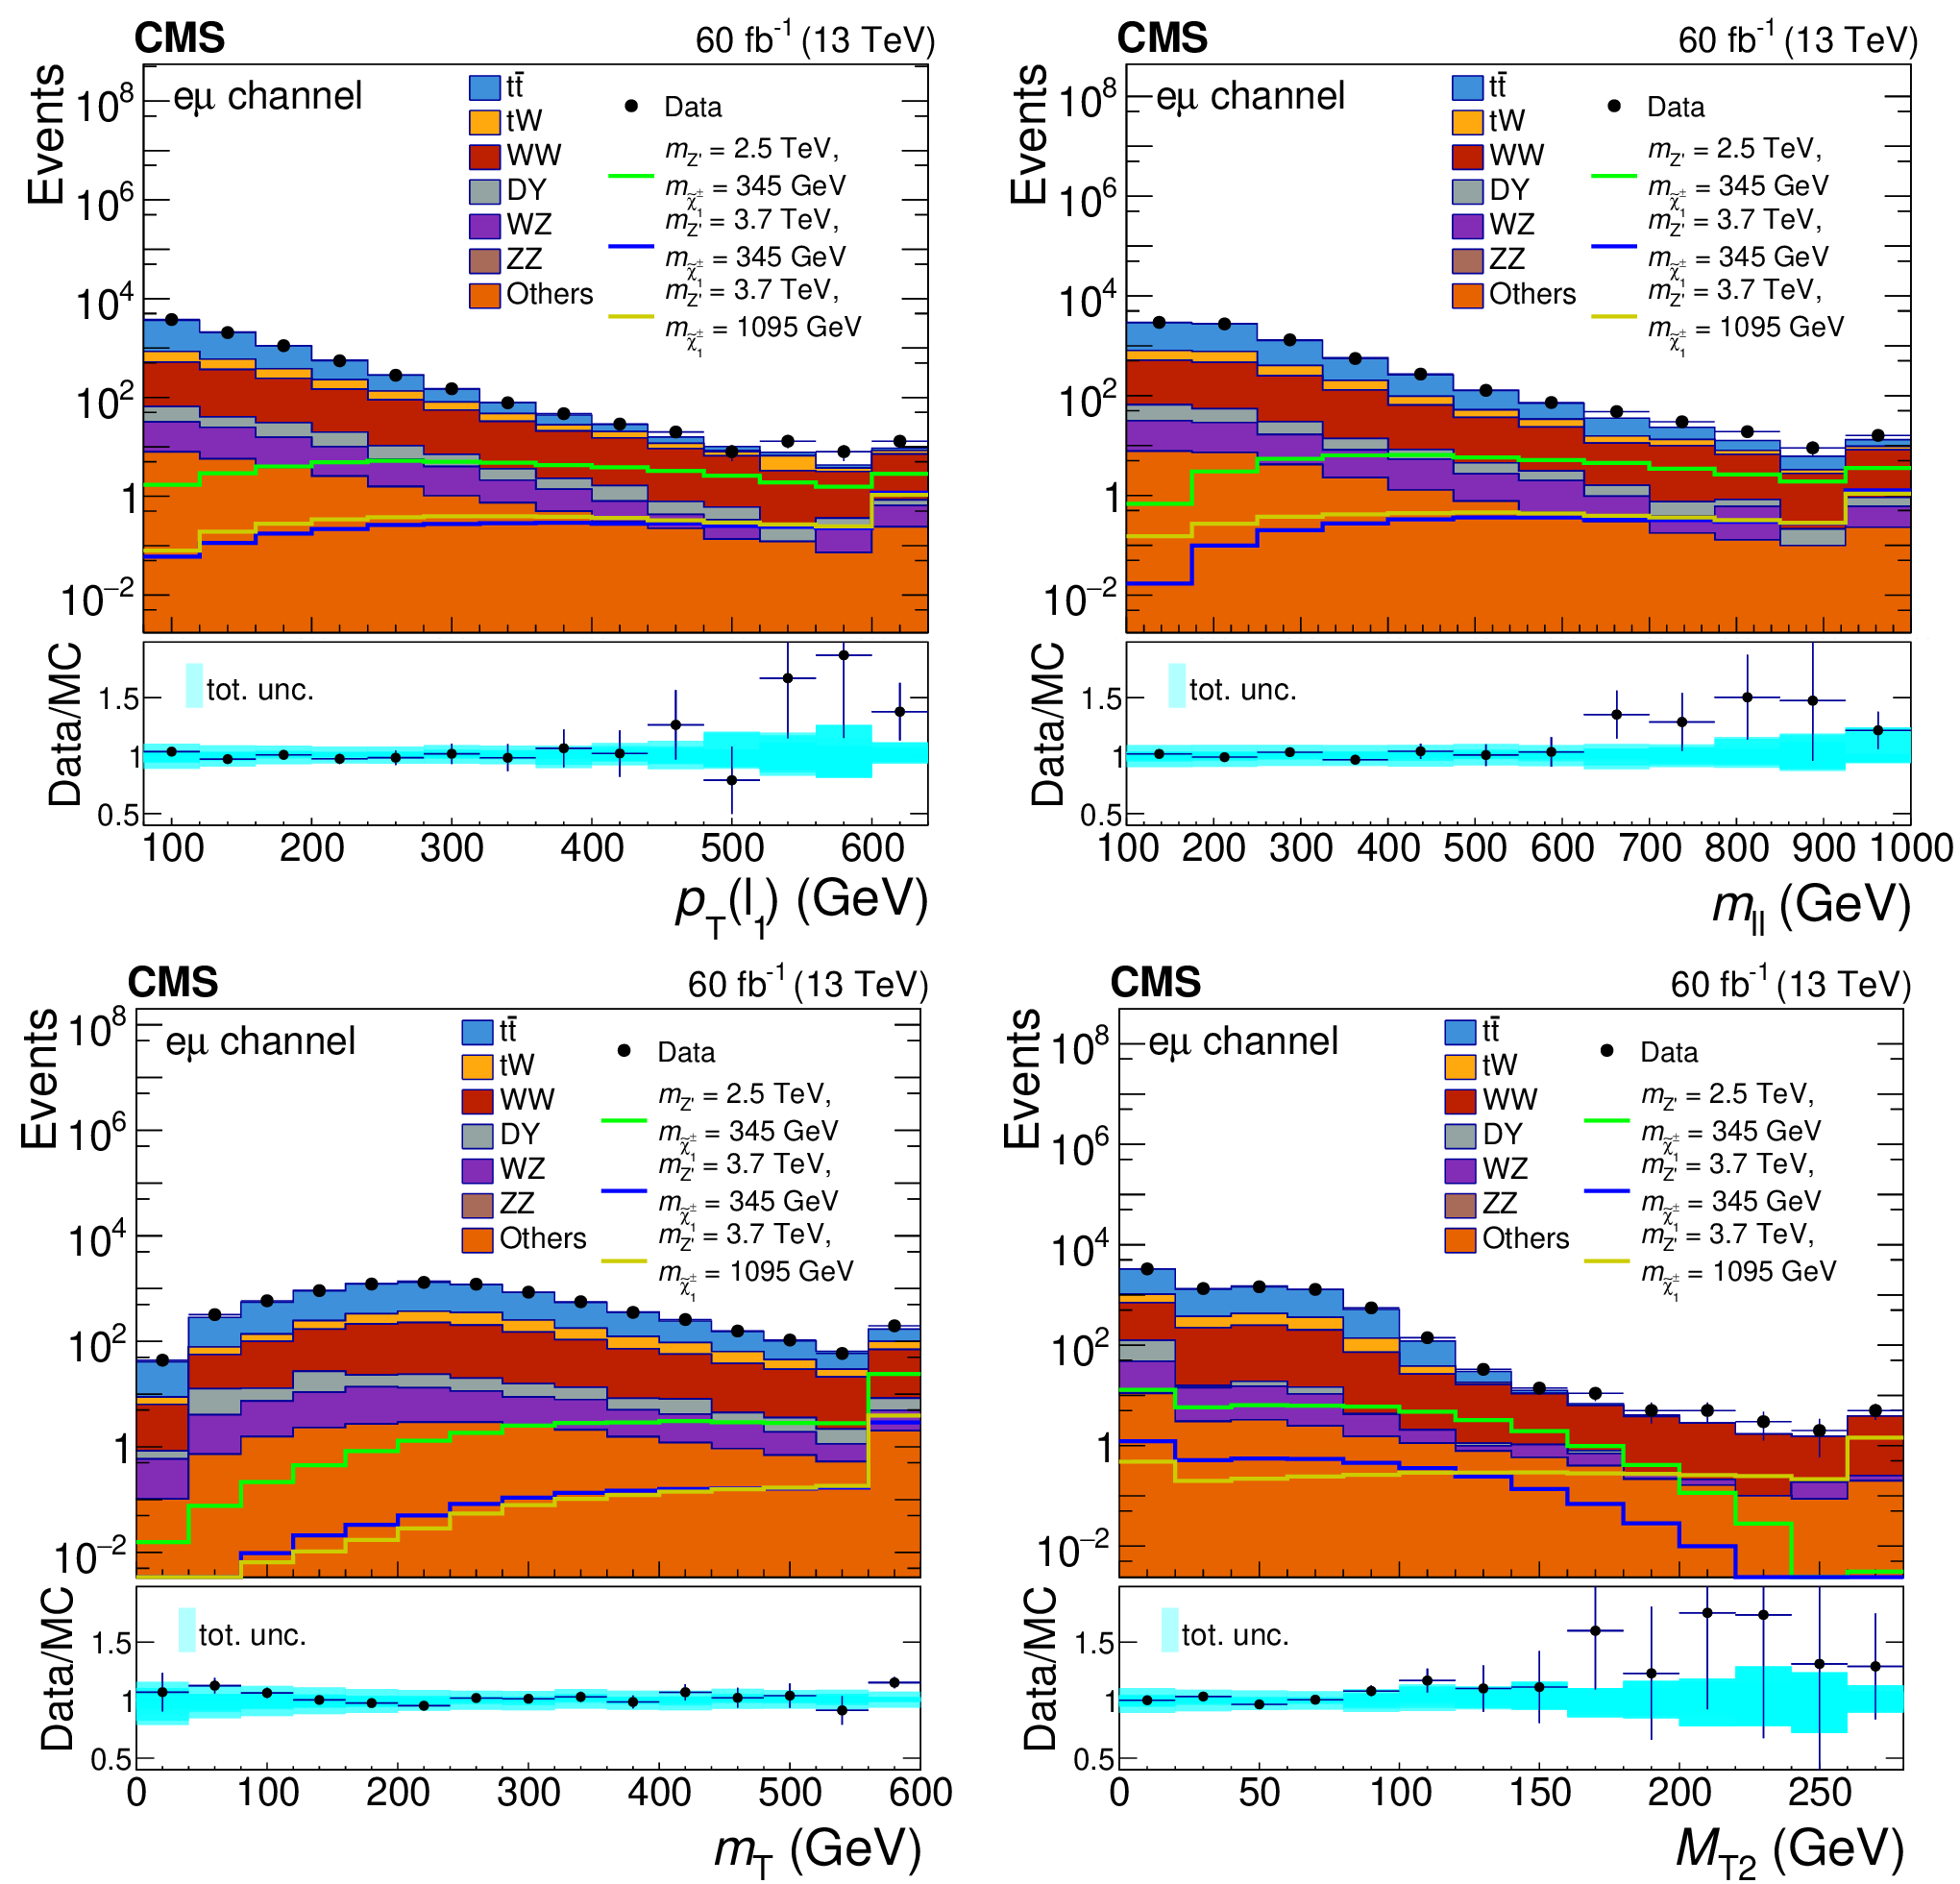
Figure 2:
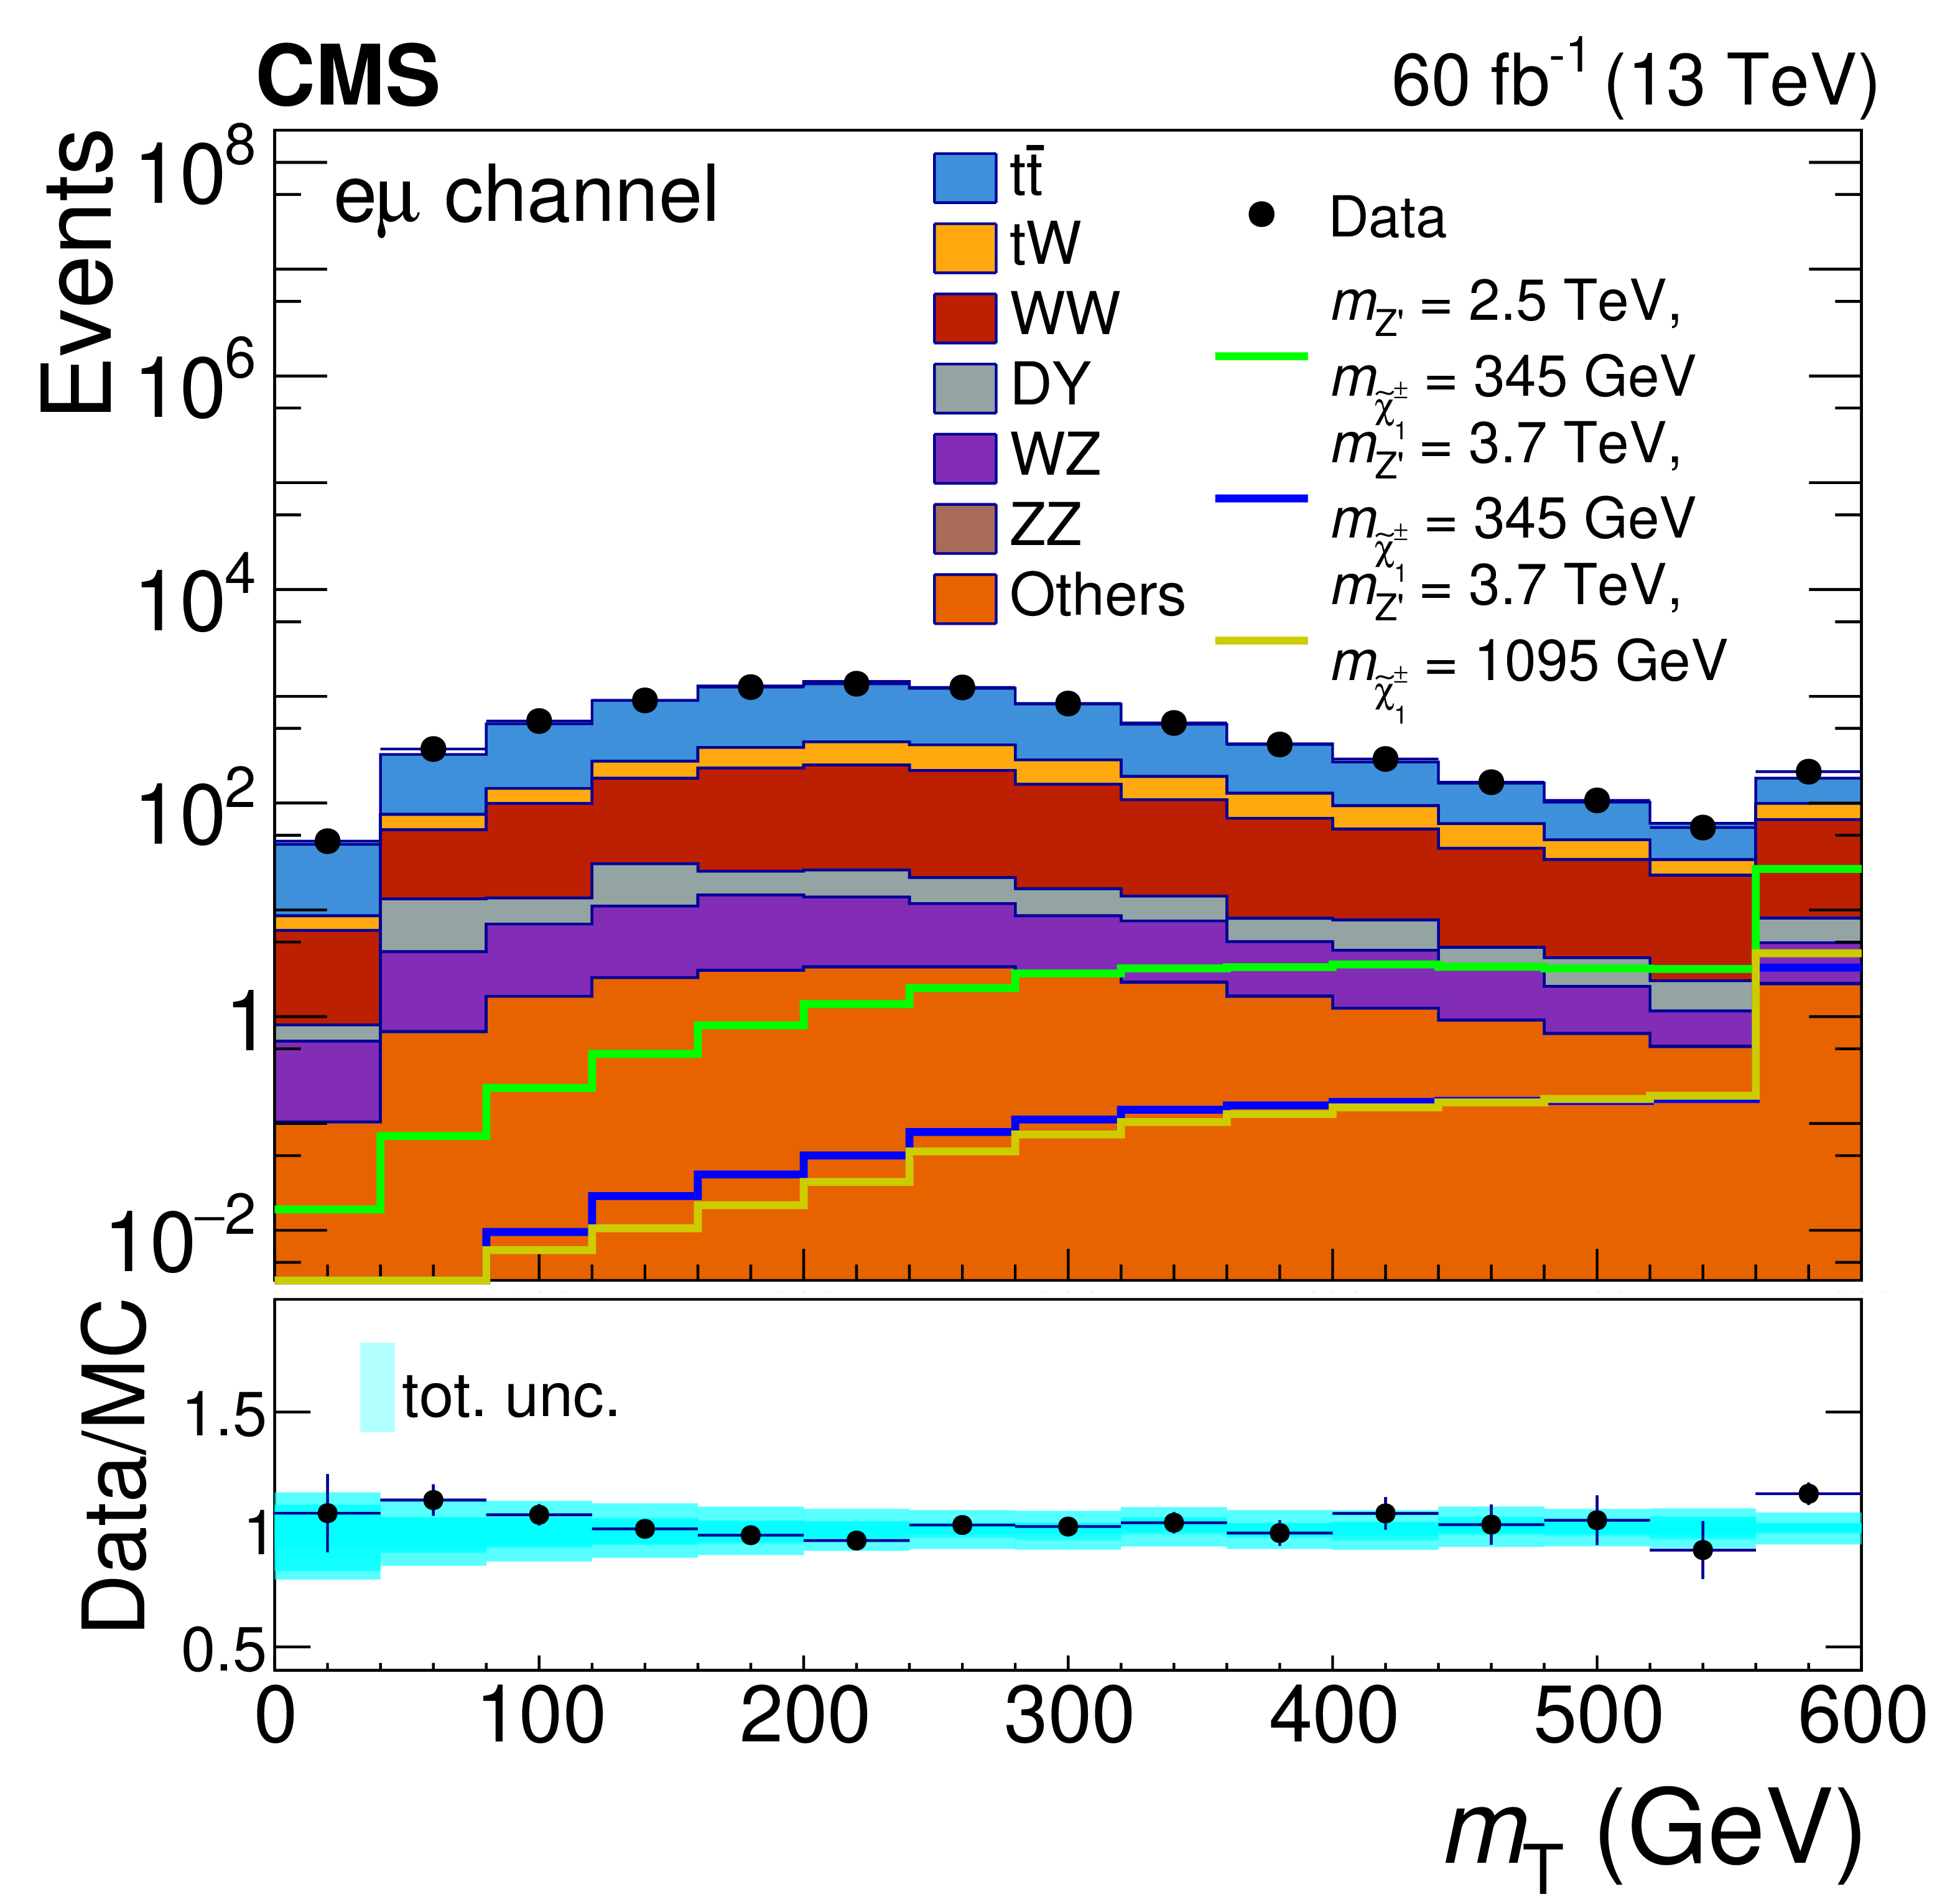
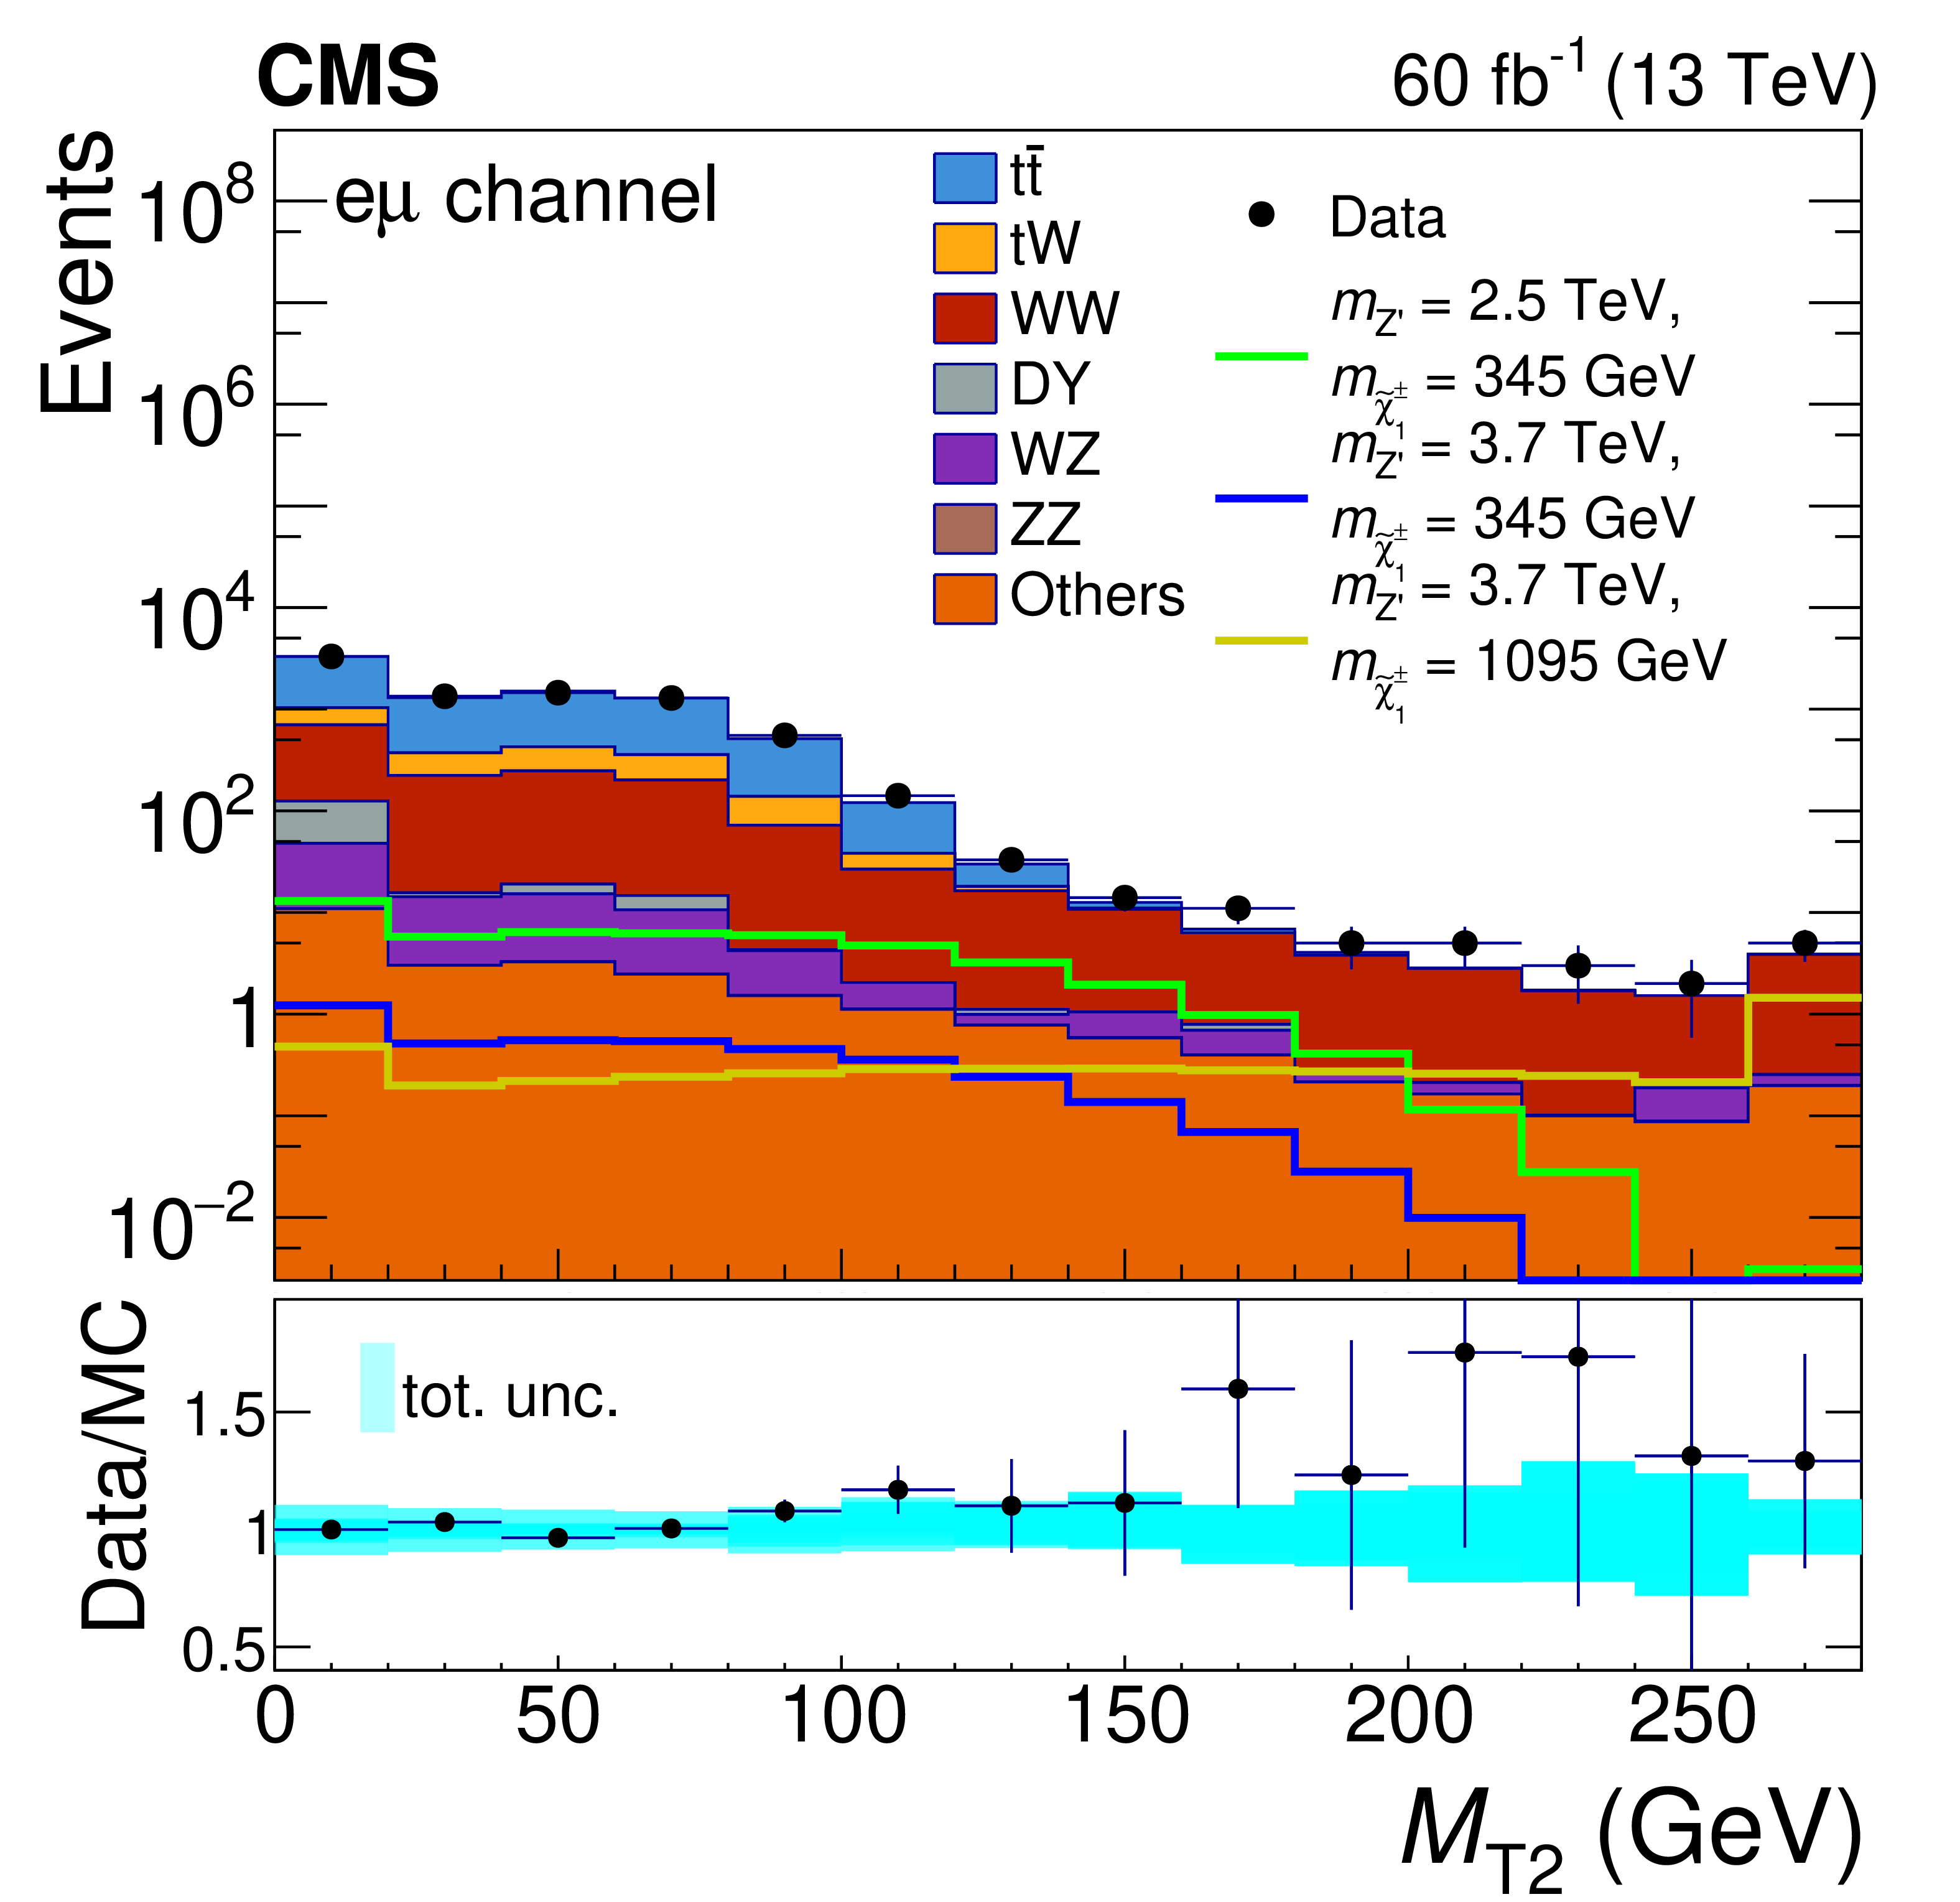
Distributions measured from the $ \mathrm{e}^\pm\mu^\mp $ sample collected in 2018, for $ p_{\mathrm{T}}(\ell_1) $ (upper left), $ m_{\ell\ell} $ (upper right), $ m_{\mathrm{T}} $ (lower left), and $ M_\mathrm{T2} $ (lower right). Several benchmark signal distributions are overlaid (colored lines), illustrating the separation power between signal and background. The panel under each plot shows the data-to-background ratio, along with the corresponding total uncertainty band (in cyan). |
png pdf |
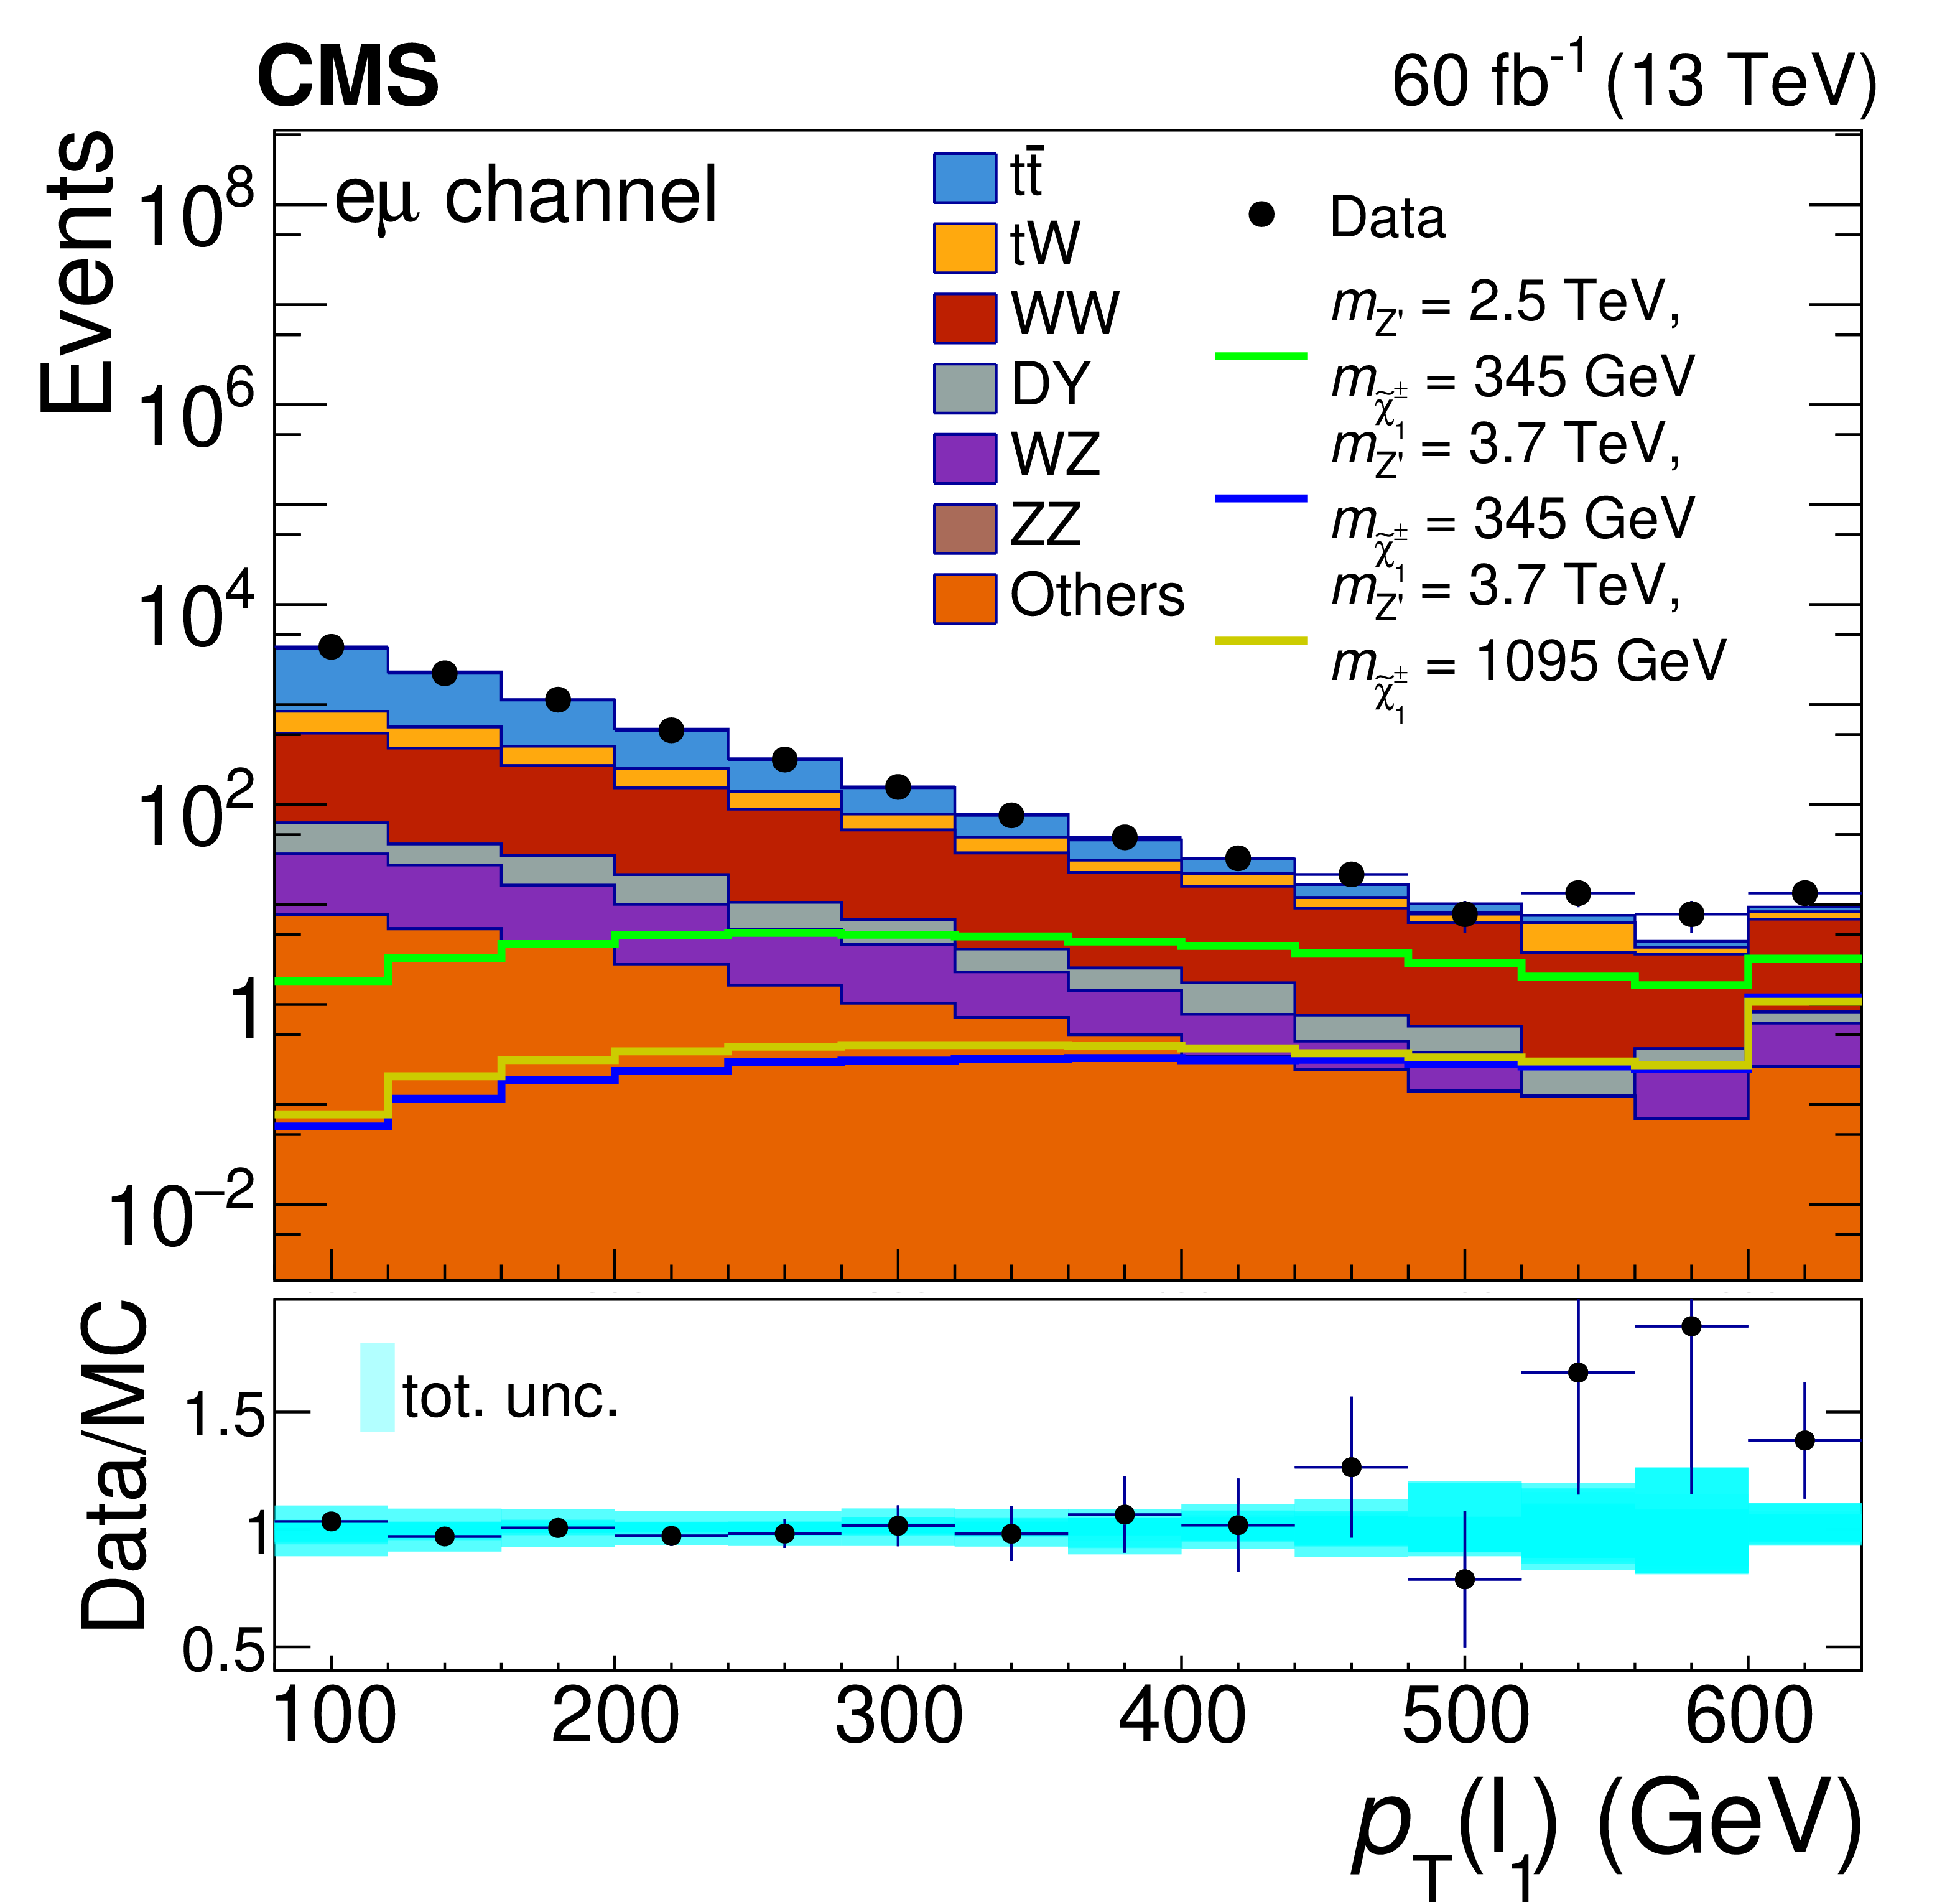
Figure 2-a:
Distributions measured from the $ \mathrm{e}^\pm\mu^\mp $ sample collected in 2018, for $ p_{\mathrm{T}}(\ell_1) $ (upper left), $ m_{\ell\ell} $ (upper right), $ m_{\mathrm{T}} $ (lower left), and $ M_\mathrm{T2} $ (lower right). Several benchmark signal distributions are overlaid (colored lines), illustrating the separation power between signal and background. The panel under each plot shows the data-to-background ratio, along with the corresponding total uncertainty band (in cyan). |
png pdf |
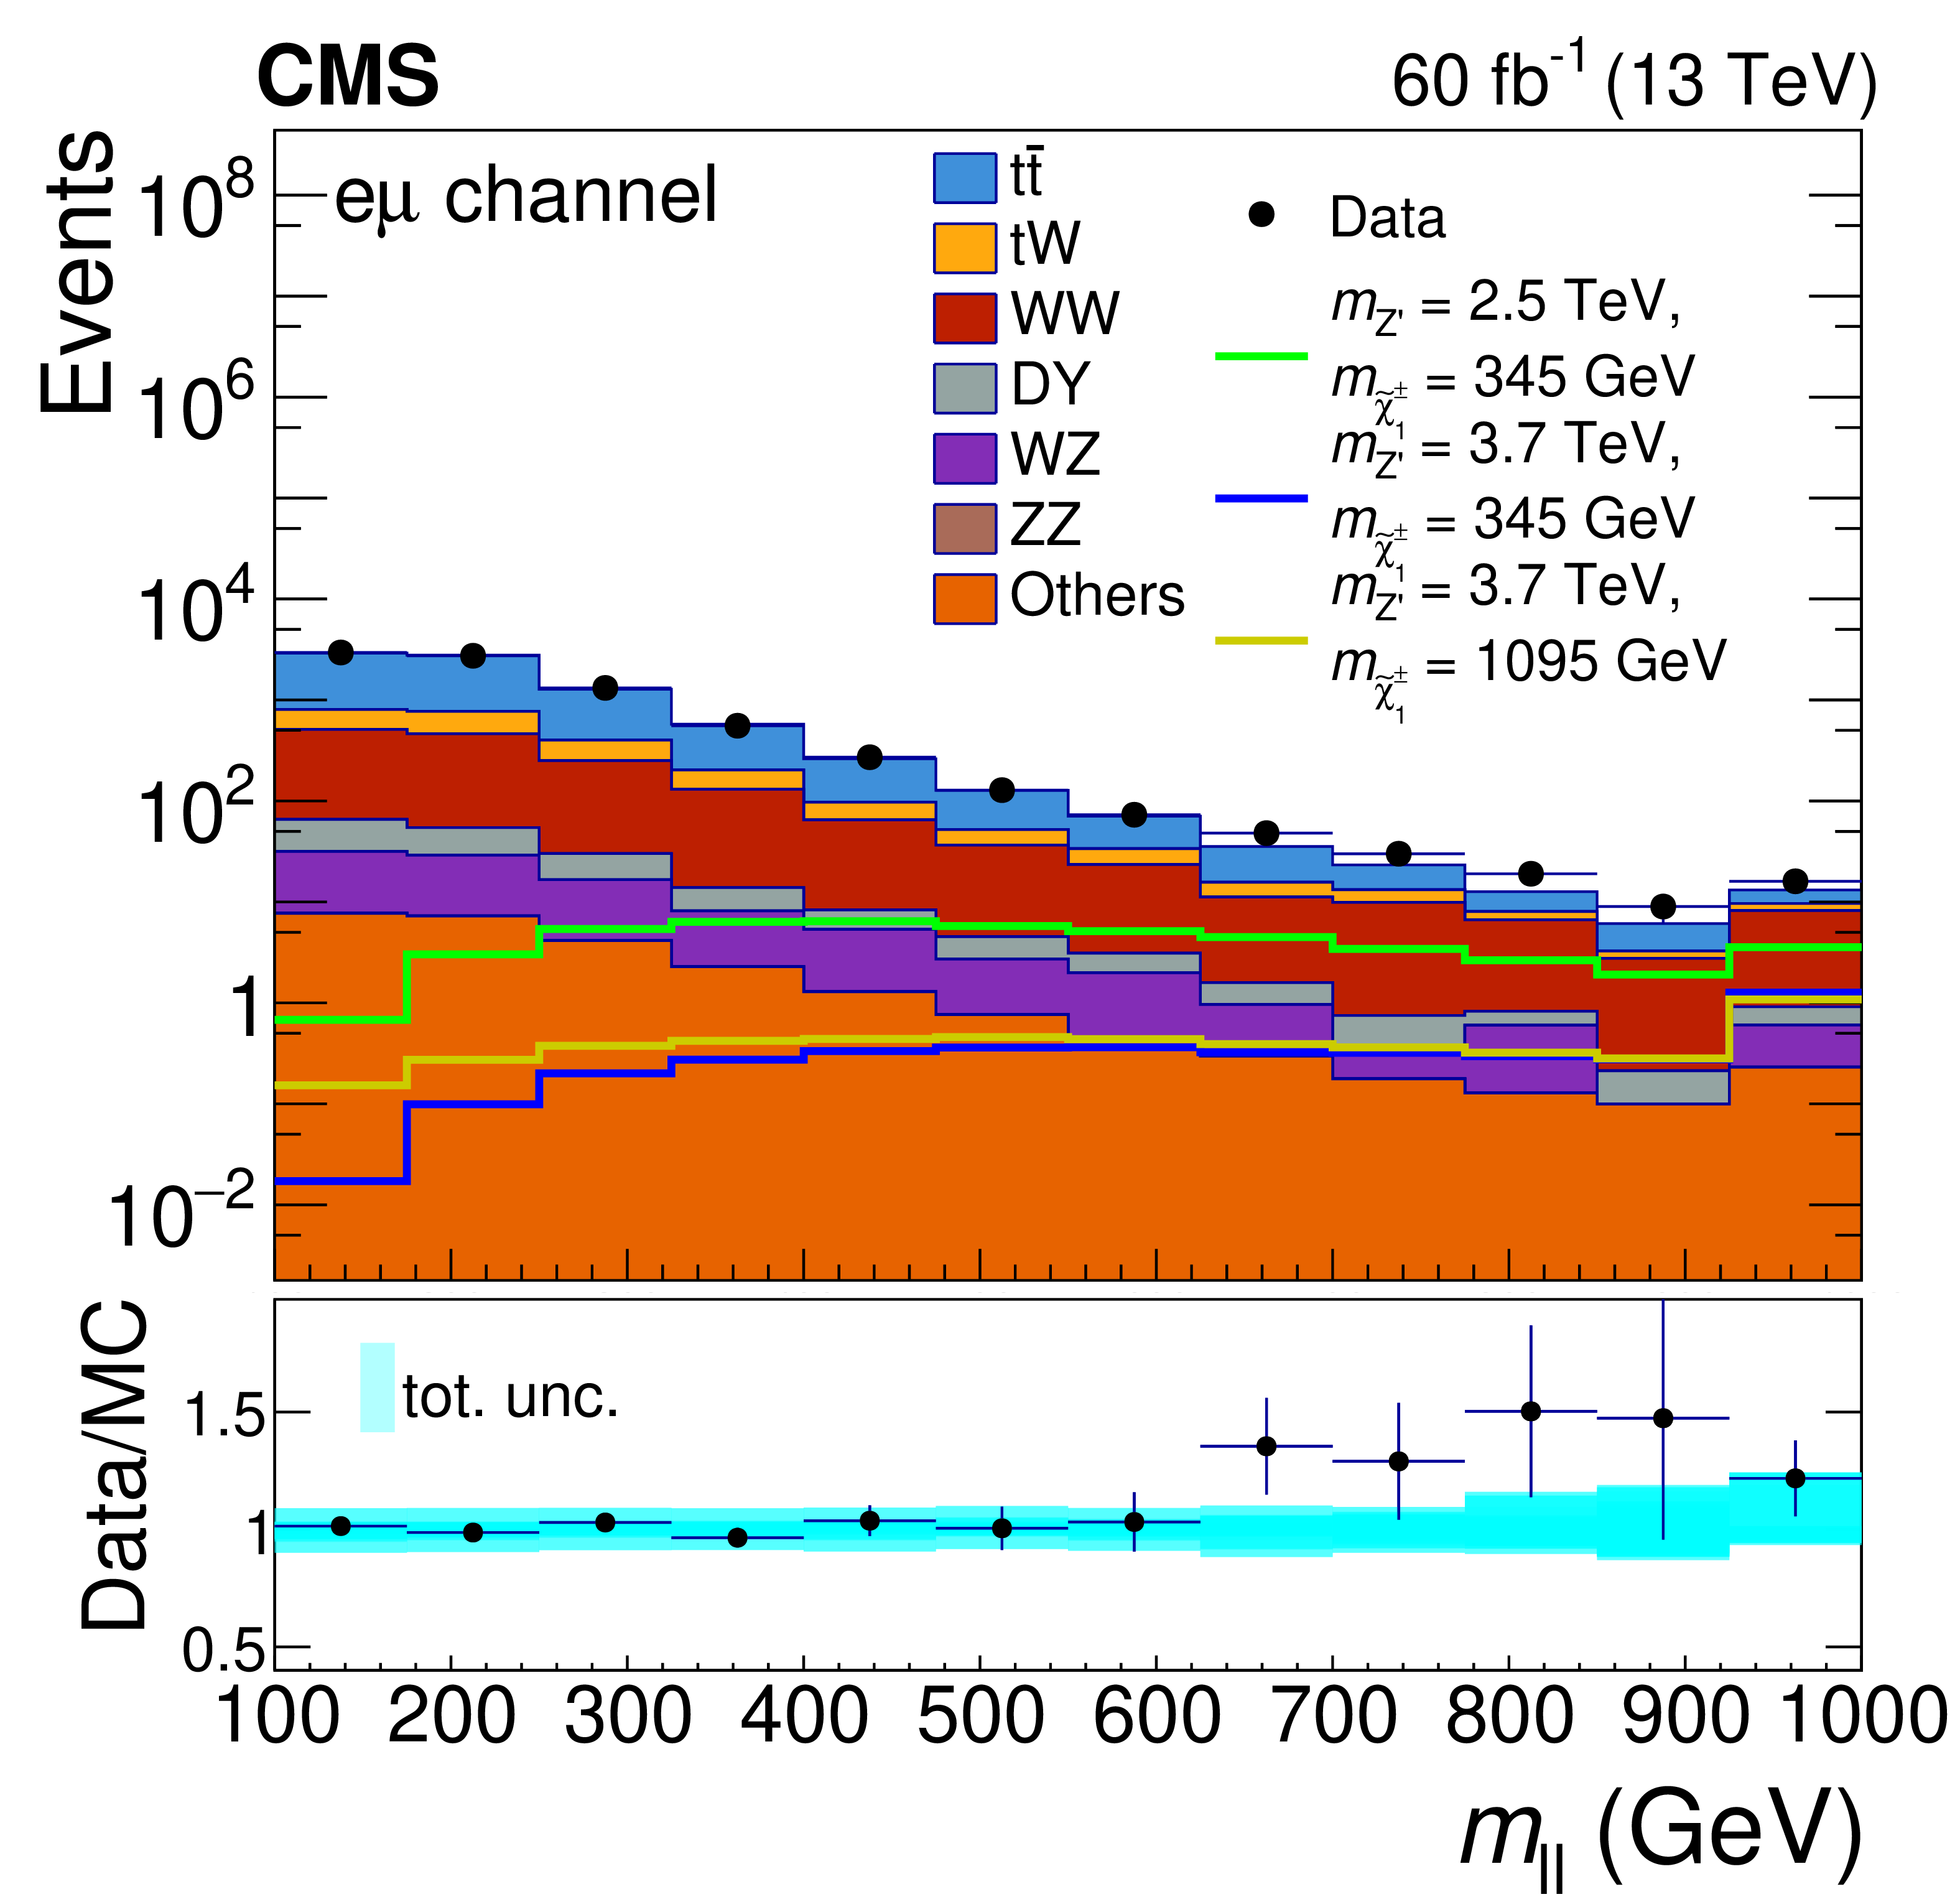
Figure 2-b:
Distributions measured from the $ \mathrm{e}^\pm\mu^\mp $ sample collected in 2018, for $ p_{\mathrm{T}}(\ell_1) $ (upper left), $ m_{\ell\ell} $ (upper right), $ m_{\mathrm{T}} $ (lower left), and $ M_\mathrm{T2} $ (lower right). Several benchmark signal distributions are overlaid (colored lines), illustrating the separation power between signal and background. The panel under each plot shows the data-to-background ratio, along with the corresponding total uncertainty band (in cyan). |
png pdf |
Figure 2-c:
Distributions measured from the $ \mathrm{e}^\pm\mu^\mp $ sample collected in 2018, for $ p_{\mathrm{T}}(\ell_1) $ (upper left), $ m_{\ell\ell} $ (upper right), $ m_{\mathrm{T}} $ (lower left), and $ M_\mathrm{T2} $ (lower right). Several benchmark signal distributions are overlaid (colored lines), illustrating the separation power between signal and background. The panel under each plot shows the data-to-background ratio, along with the corresponding total uncertainty band (in cyan). |
png pdf |
Figure 2-d:
Distributions measured from the $ \mathrm{e}^\pm\mu^\mp $ sample collected in 2018, for $ p_{\mathrm{T}}(\ell_1) $ (upper left), $ m_{\ell\ell} $ (upper right), $ m_{\mathrm{T}} $ (lower left), and $ M_\mathrm{T2} $ (lower right). Several benchmark signal distributions are overlaid (colored lines), illustrating the separation power between signal and background. The panel under each plot shows the data-to-background ratio, along with the corresponding total uncertainty band (in cyan). |
png pdf |
Figure 3:
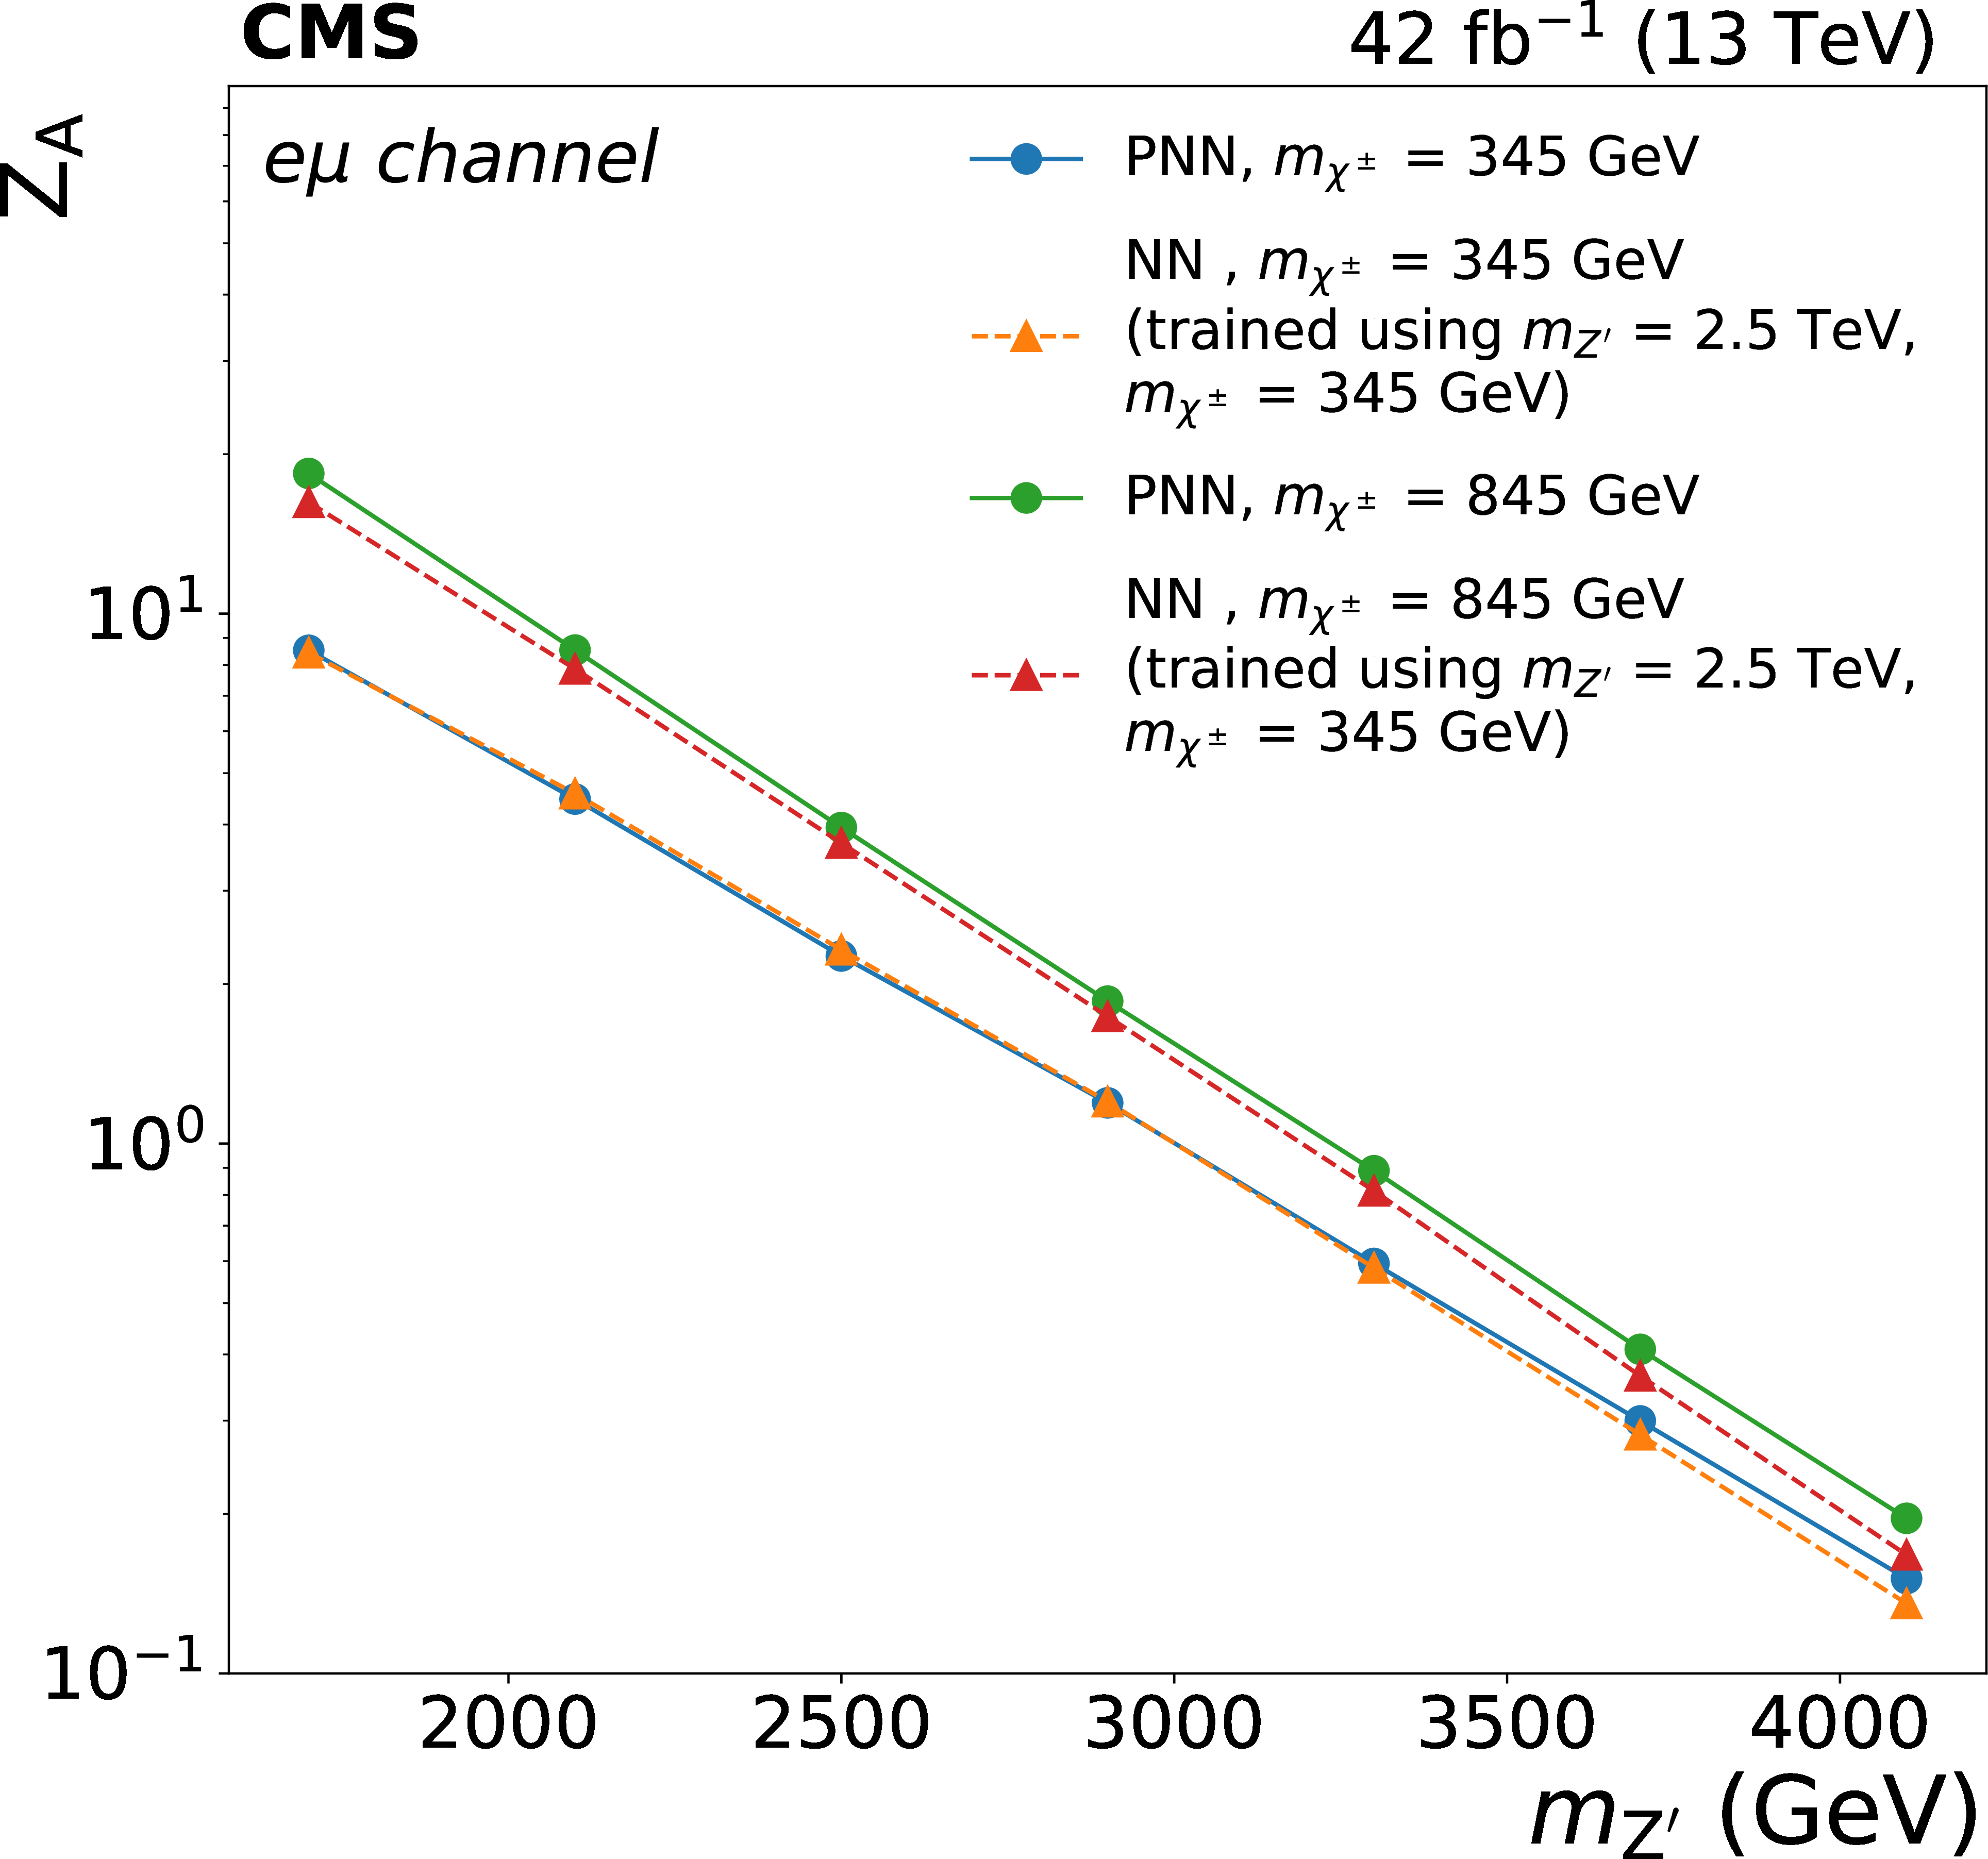
Asimov significance, $ Z_A $, vs. $ m_\mathrm{Z}^{'} $ for the PNN model (circles) and for a NN model trained on a specific signal point (triangles) for the 2017 simulated event sample, in the $ \mathrm{e}^\pm\mu^\mp $ channel. Two chargino masses have been considered, as indicated. |
png pdf |
Figure 4:
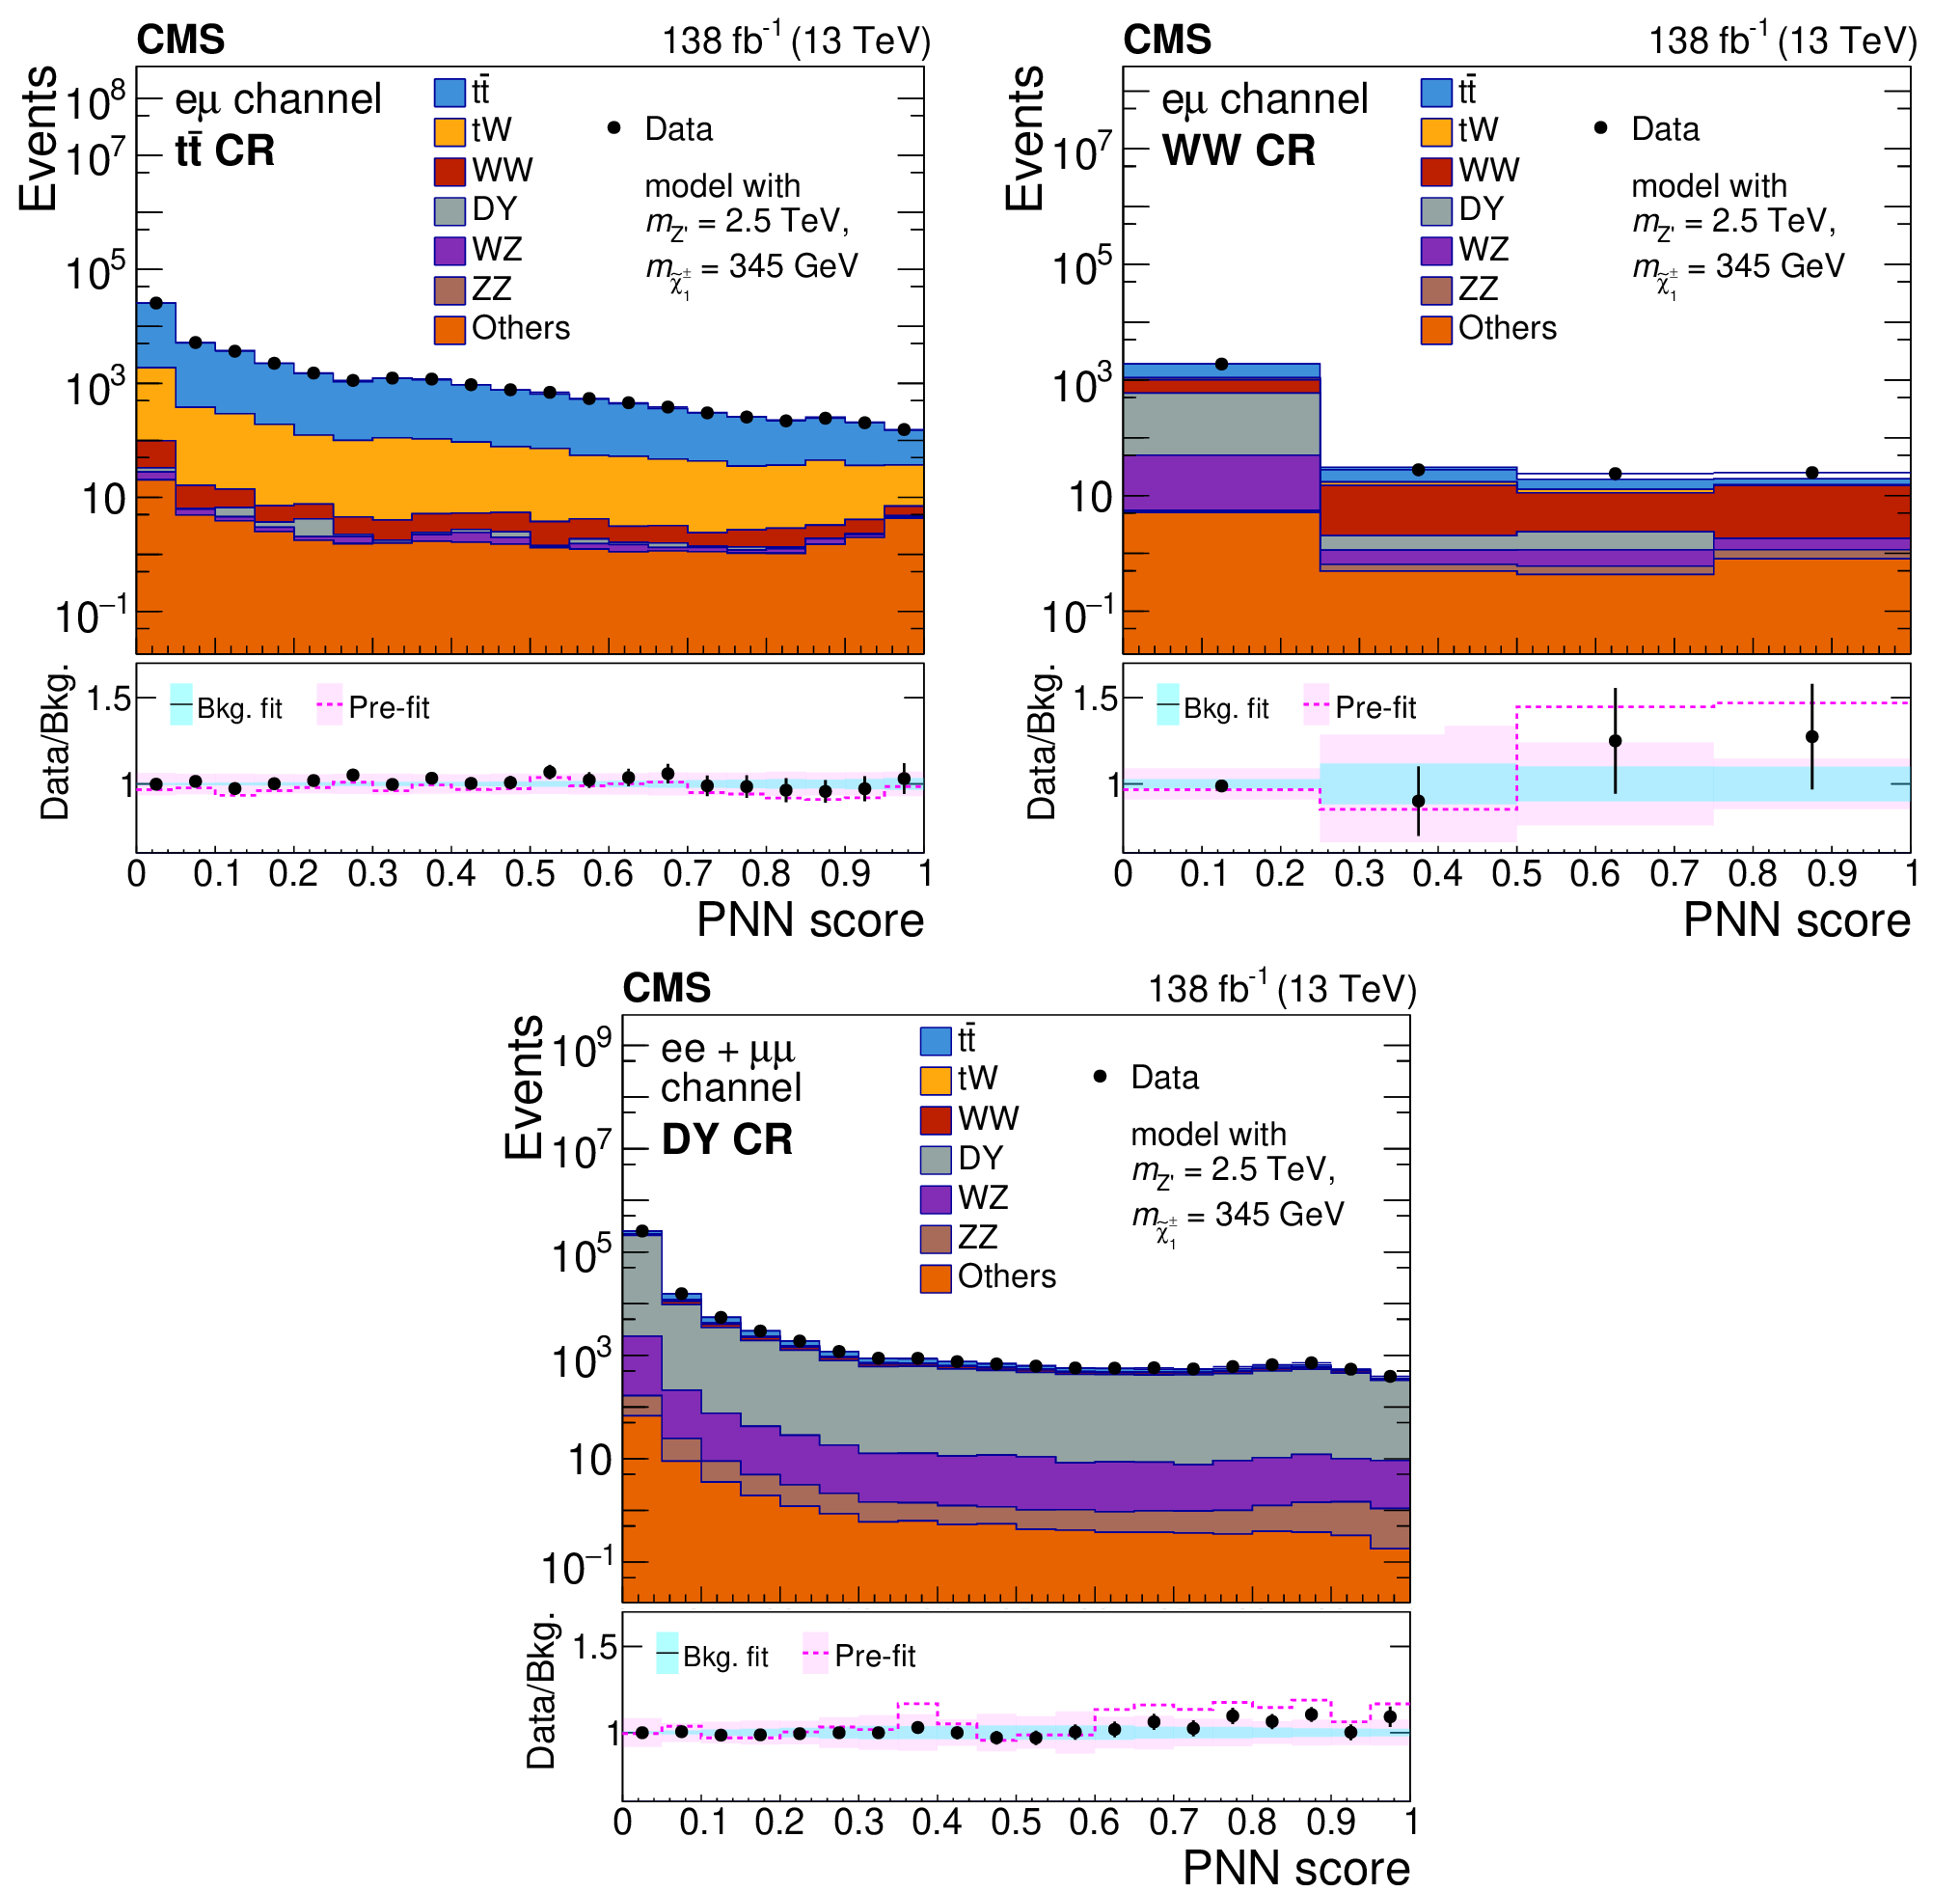
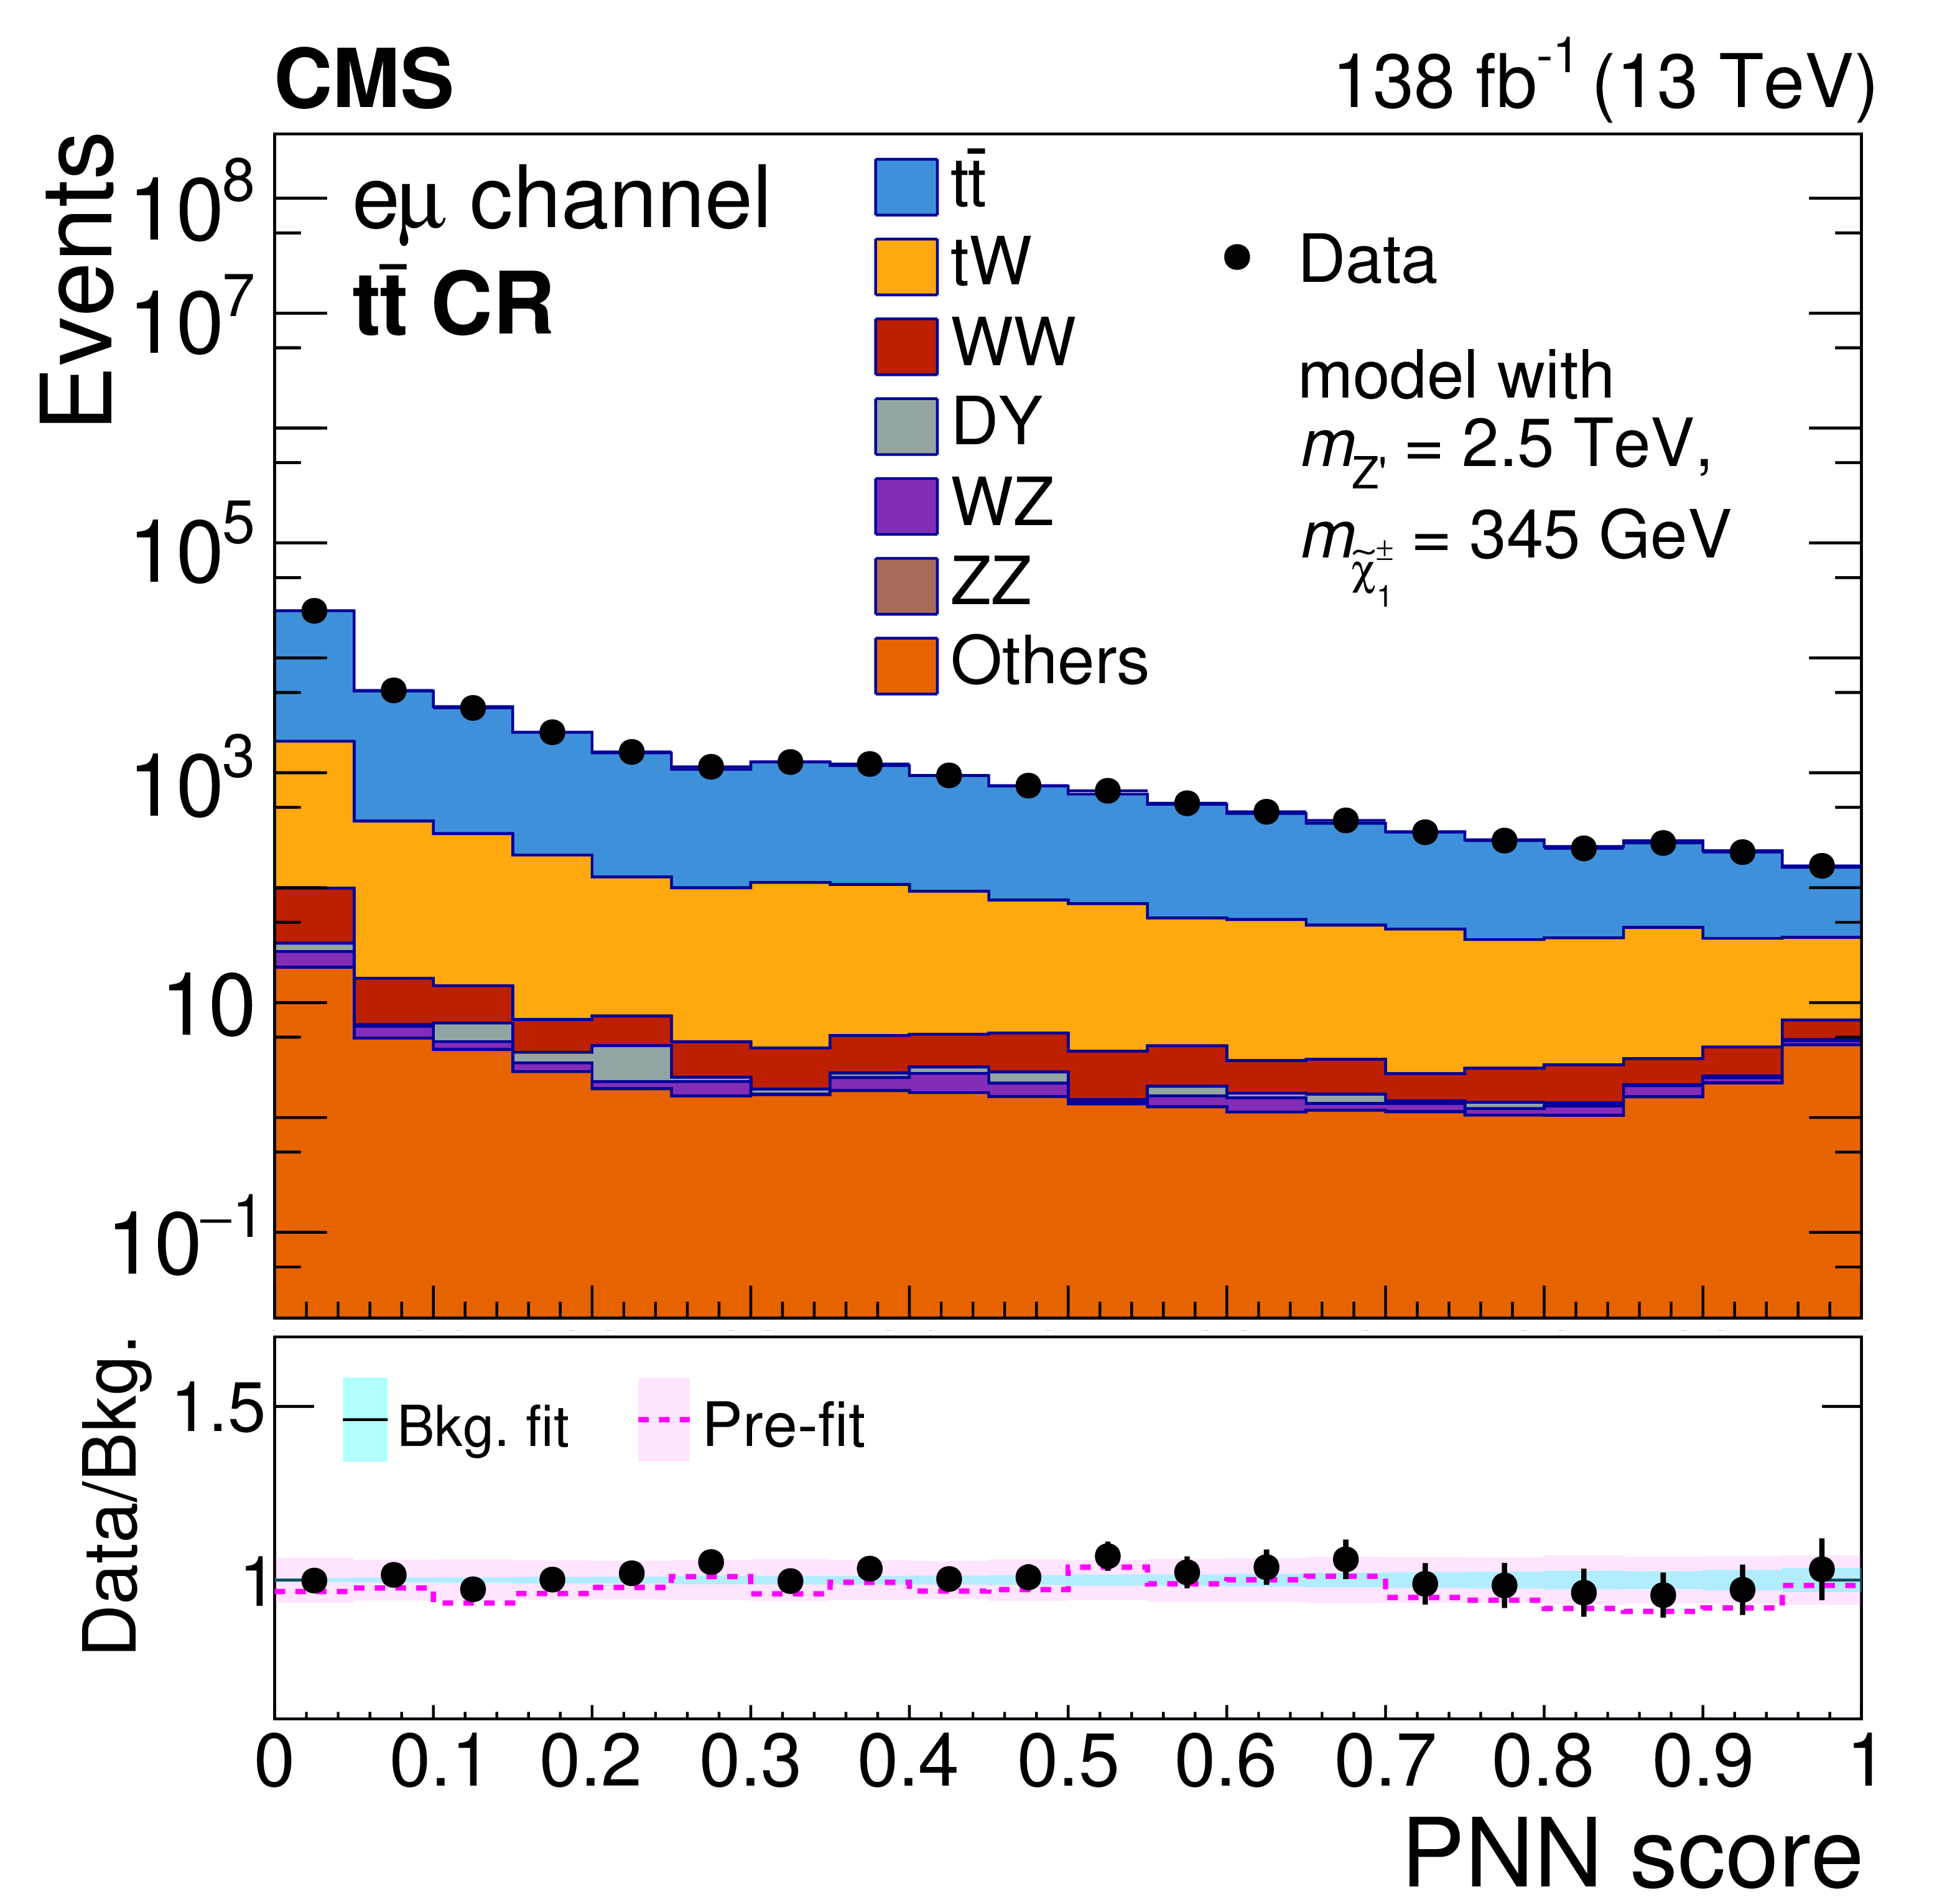
Measured and simulated SM PNN score distributions for a model with $ m_{\mathrm{Z}^{'}} = $ 2.5 TeV and $ m_{\tilde{\chi}_{1}^{\pm}} = $ 345 GeV, for the $ \mathrm{t} \overline{\mathrm{t}} $ (upper left) and WW (upper right) CRs in the $ \mathrm{e}^\pm\mu^\mp $ channel and for the DY CR in the $ \mathrm{e}^+\mathrm{e}^-+\mu^{+} \mu^{-} $ channel (lower). The panel under each plot shows the data-to-background ratios using either a background-only fit (black circles and cyan band) or a pre-fit (magenta dashed line and band). The uncertainties are displayed around the unity line. |
png pdf |
Figure 4-a:
Measured and simulated SM PNN score distributions for a model with $ m_{\mathrm{Z}^{'}} = $ 2.5 TeV and $ m_{\tilde{\chi}_{1}^{\pm}} = $ 345 GeV, for the $ \mathrm{t} \overline{\mathrm{t}} $ (upper left) and WW (upper right) CRs in the $ \mathrm{e}^\pm\mu^\mp $ channel and for the DY CR in the $ \mathrm{e}^+\mathrm{e}^-+\mu^{+} \mu^{-} $ channel (lower). The panel under each plot shows the data-to-background ratios using either a background-only fit (black circles and cyan band) or a pre-fit (magenta dashed line and band). The uncertainties are displayed around the unity line. |
png pdf |
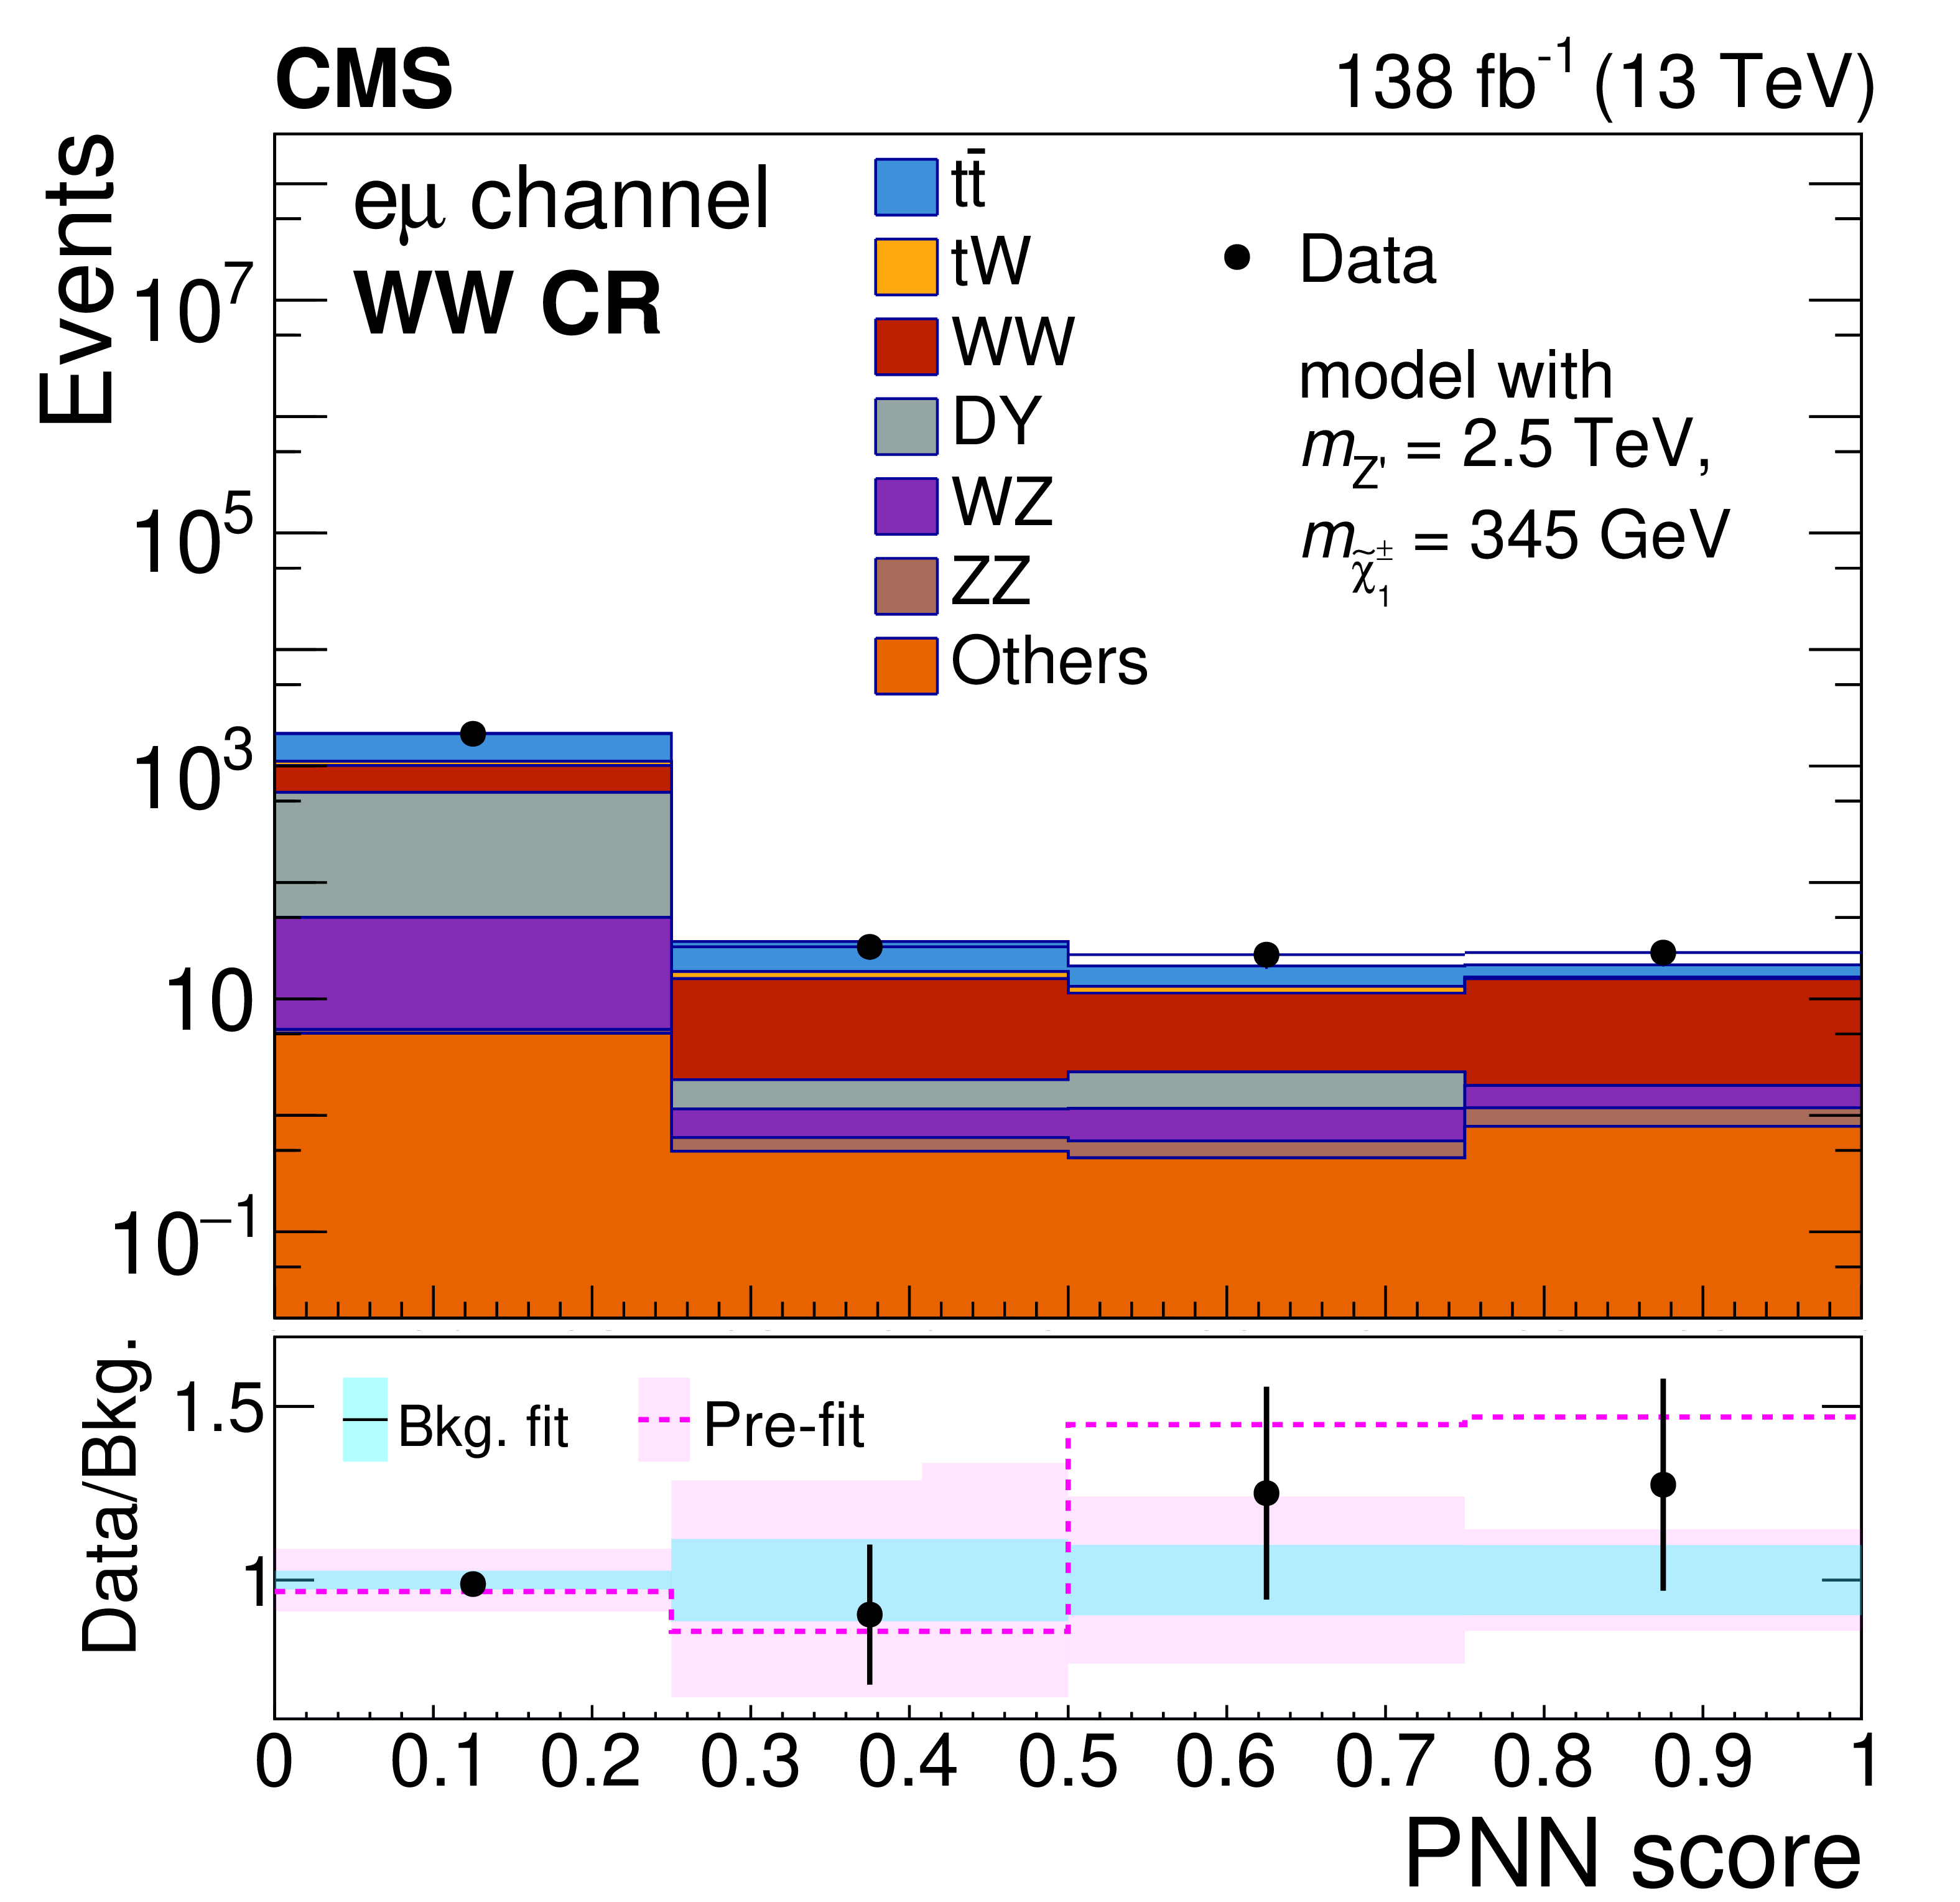
Figure 4-b:
Measured and simulated SM PNN score distributions for a model with $ m_{\mathrm{Z}^{'}} = $ 2.5 TeV and $ m_{\tilde{\chi}_{1}^{\pm}} = $ 345 GeV, for the $ \mathrm{t} \overline{\mathrm{t}} $ (upper left) and WW (upper right) CRs in the $ \mathrm{e}^\pm\mu^\mp $ channel and for the DY CR in the $ \mathrm{e}^+\mathrm{e}^-+\mu^{+} \mu^{-} $ channel (lower). The panel under each plot shows the data-to-background ratios using either a background-only fit (black circles and cyan band) or a pre-fit (magenta dashed line and band). The uncertainties are displayed around the unity line. |
png pdf |
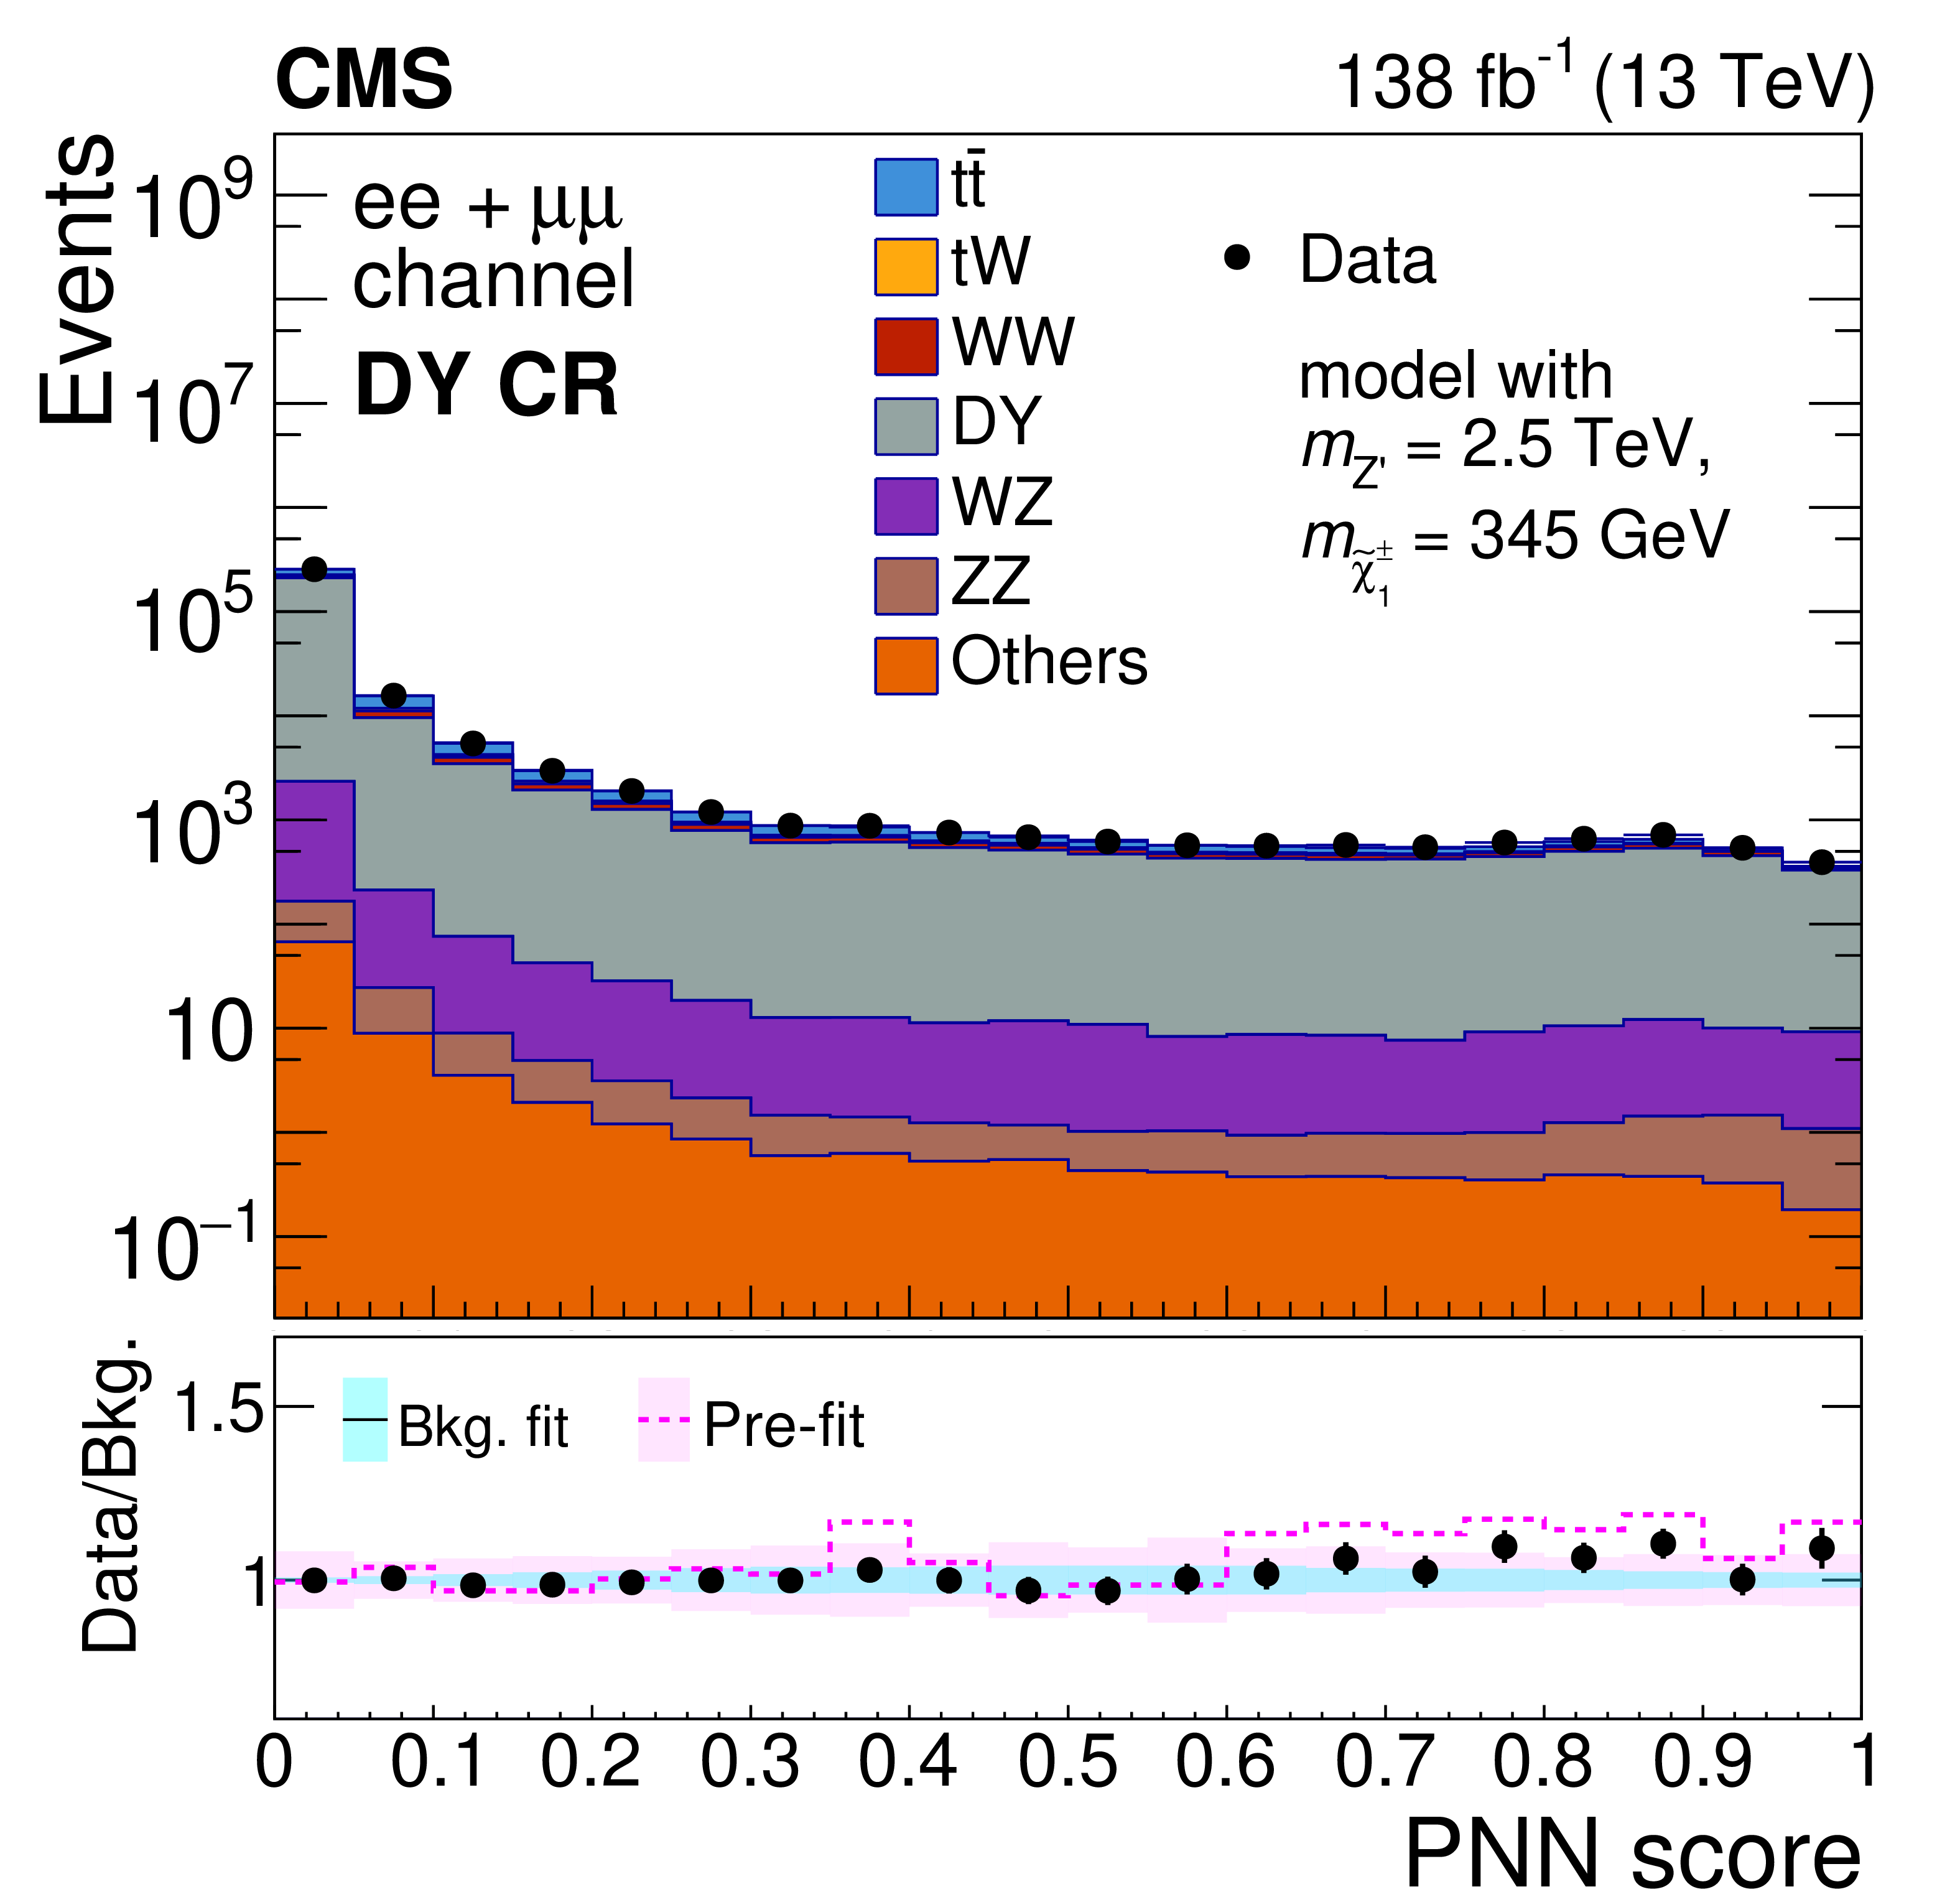
Figure 4-c:
Measured and simulated SM PNN score distributions for a model with $ m_{\mathrm{Z}^{'}} = $ 2.5 TeV and $ m_{\tilde{\chi}_{1}^{\pm}} = $ 345 GeV, for the $ \mathrm{t} \overline{\mathrm{t}} $ (upper left) and WW (upper right) CRs in the $ \mathrm{e}^\pm\mu^\mp $ channel and for the DY CR in the $ \mathrm{e}^+\mathrm{e}^-+\mu^{+} \mu^{-} $ channel (lower). The panel under each plot shows the data-to-background ratios using either a background-only fit (black circles and cyan band) or a pre-fit (magenta dashed line and band). The uncertainties are displayed around the unity line. |
png pdf |
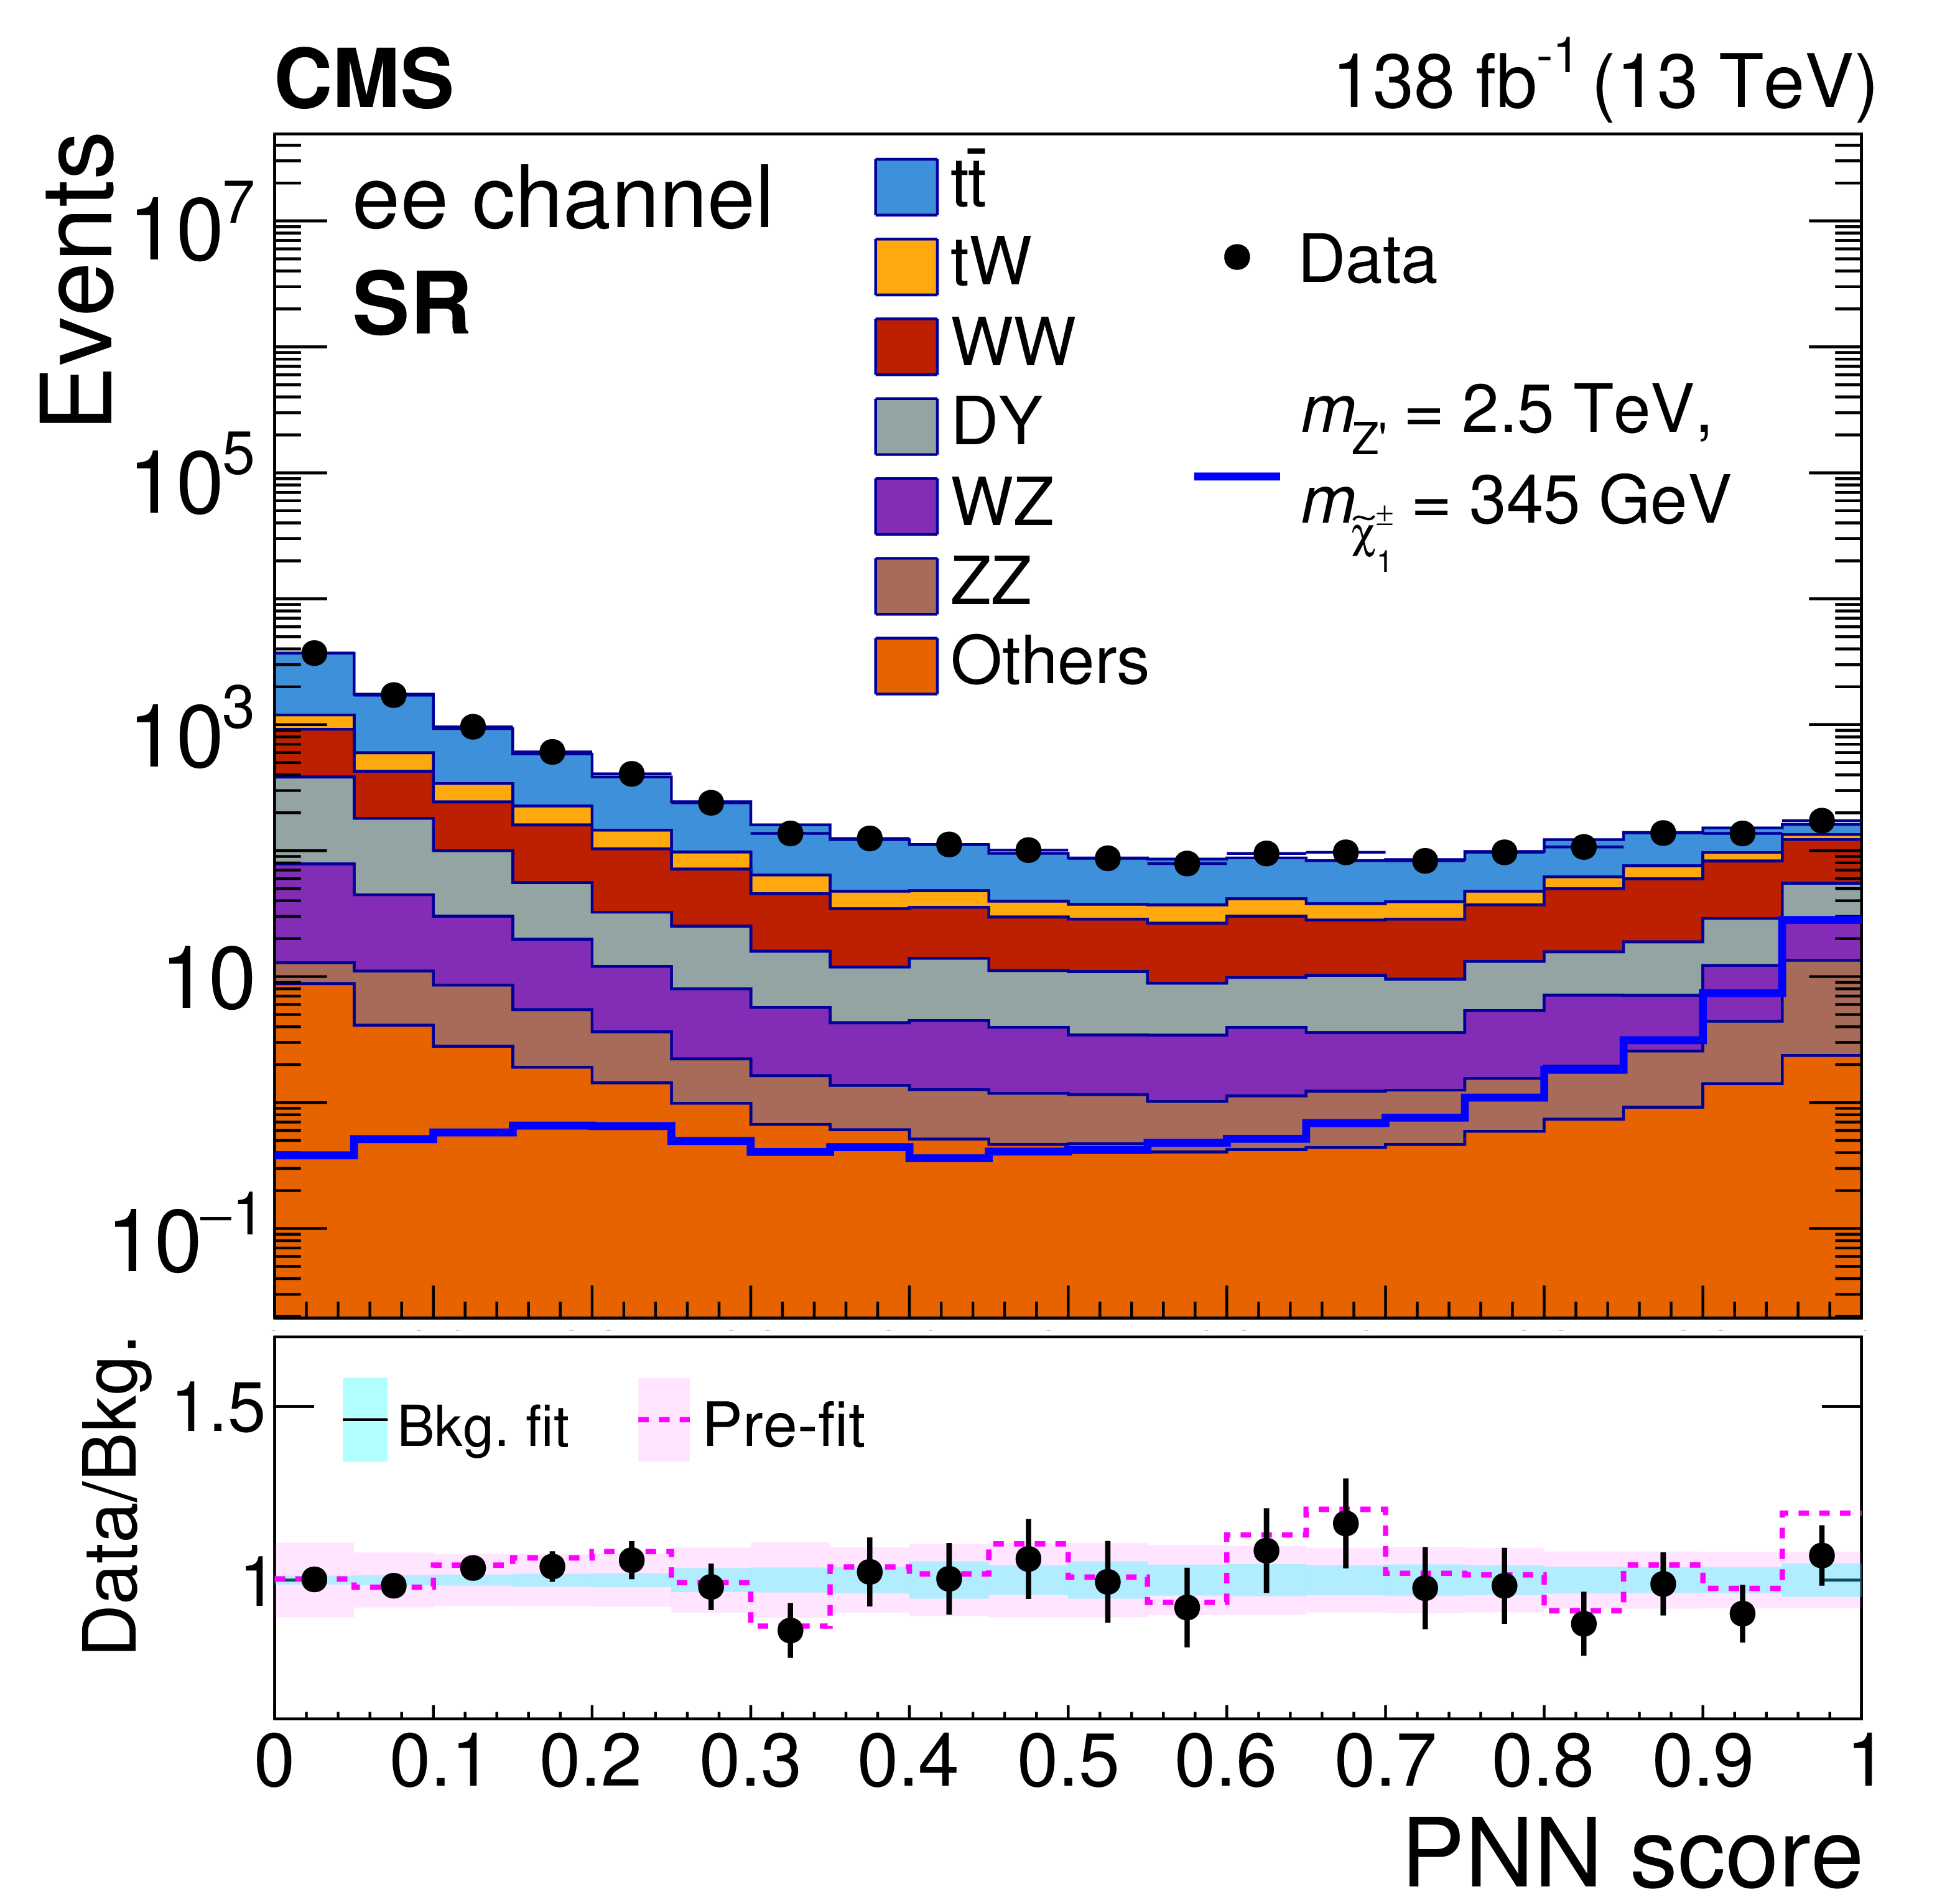
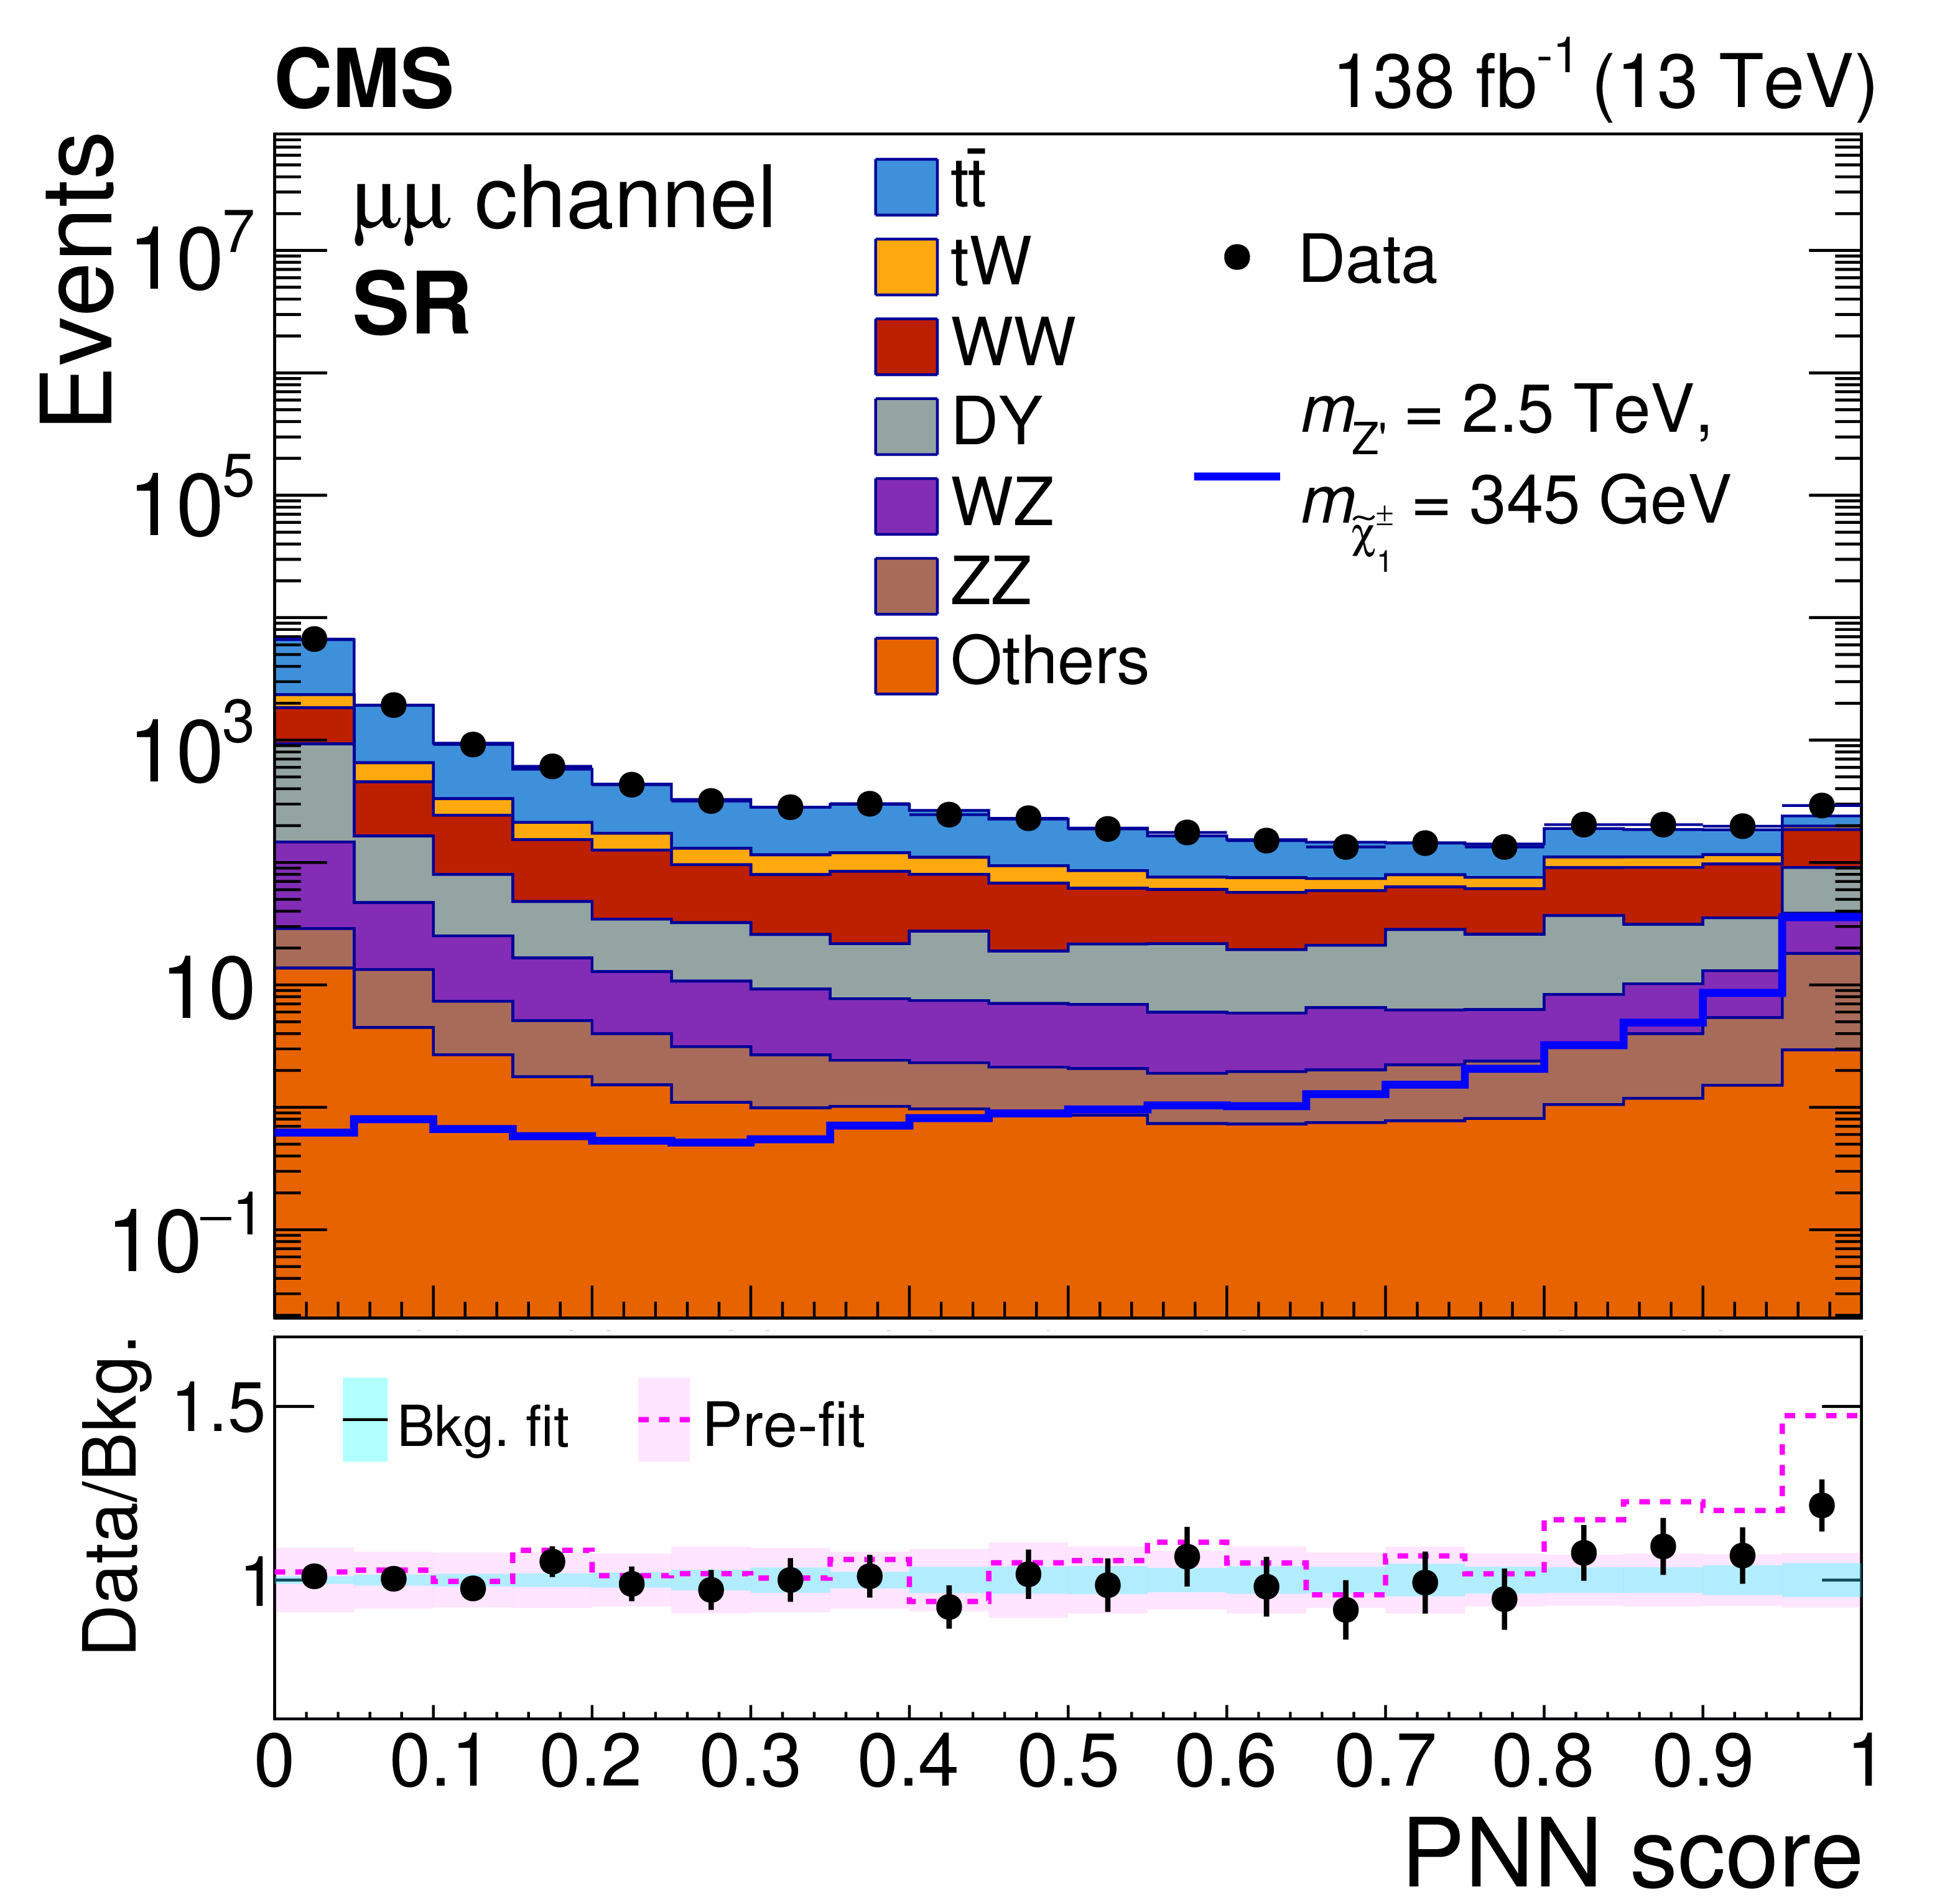
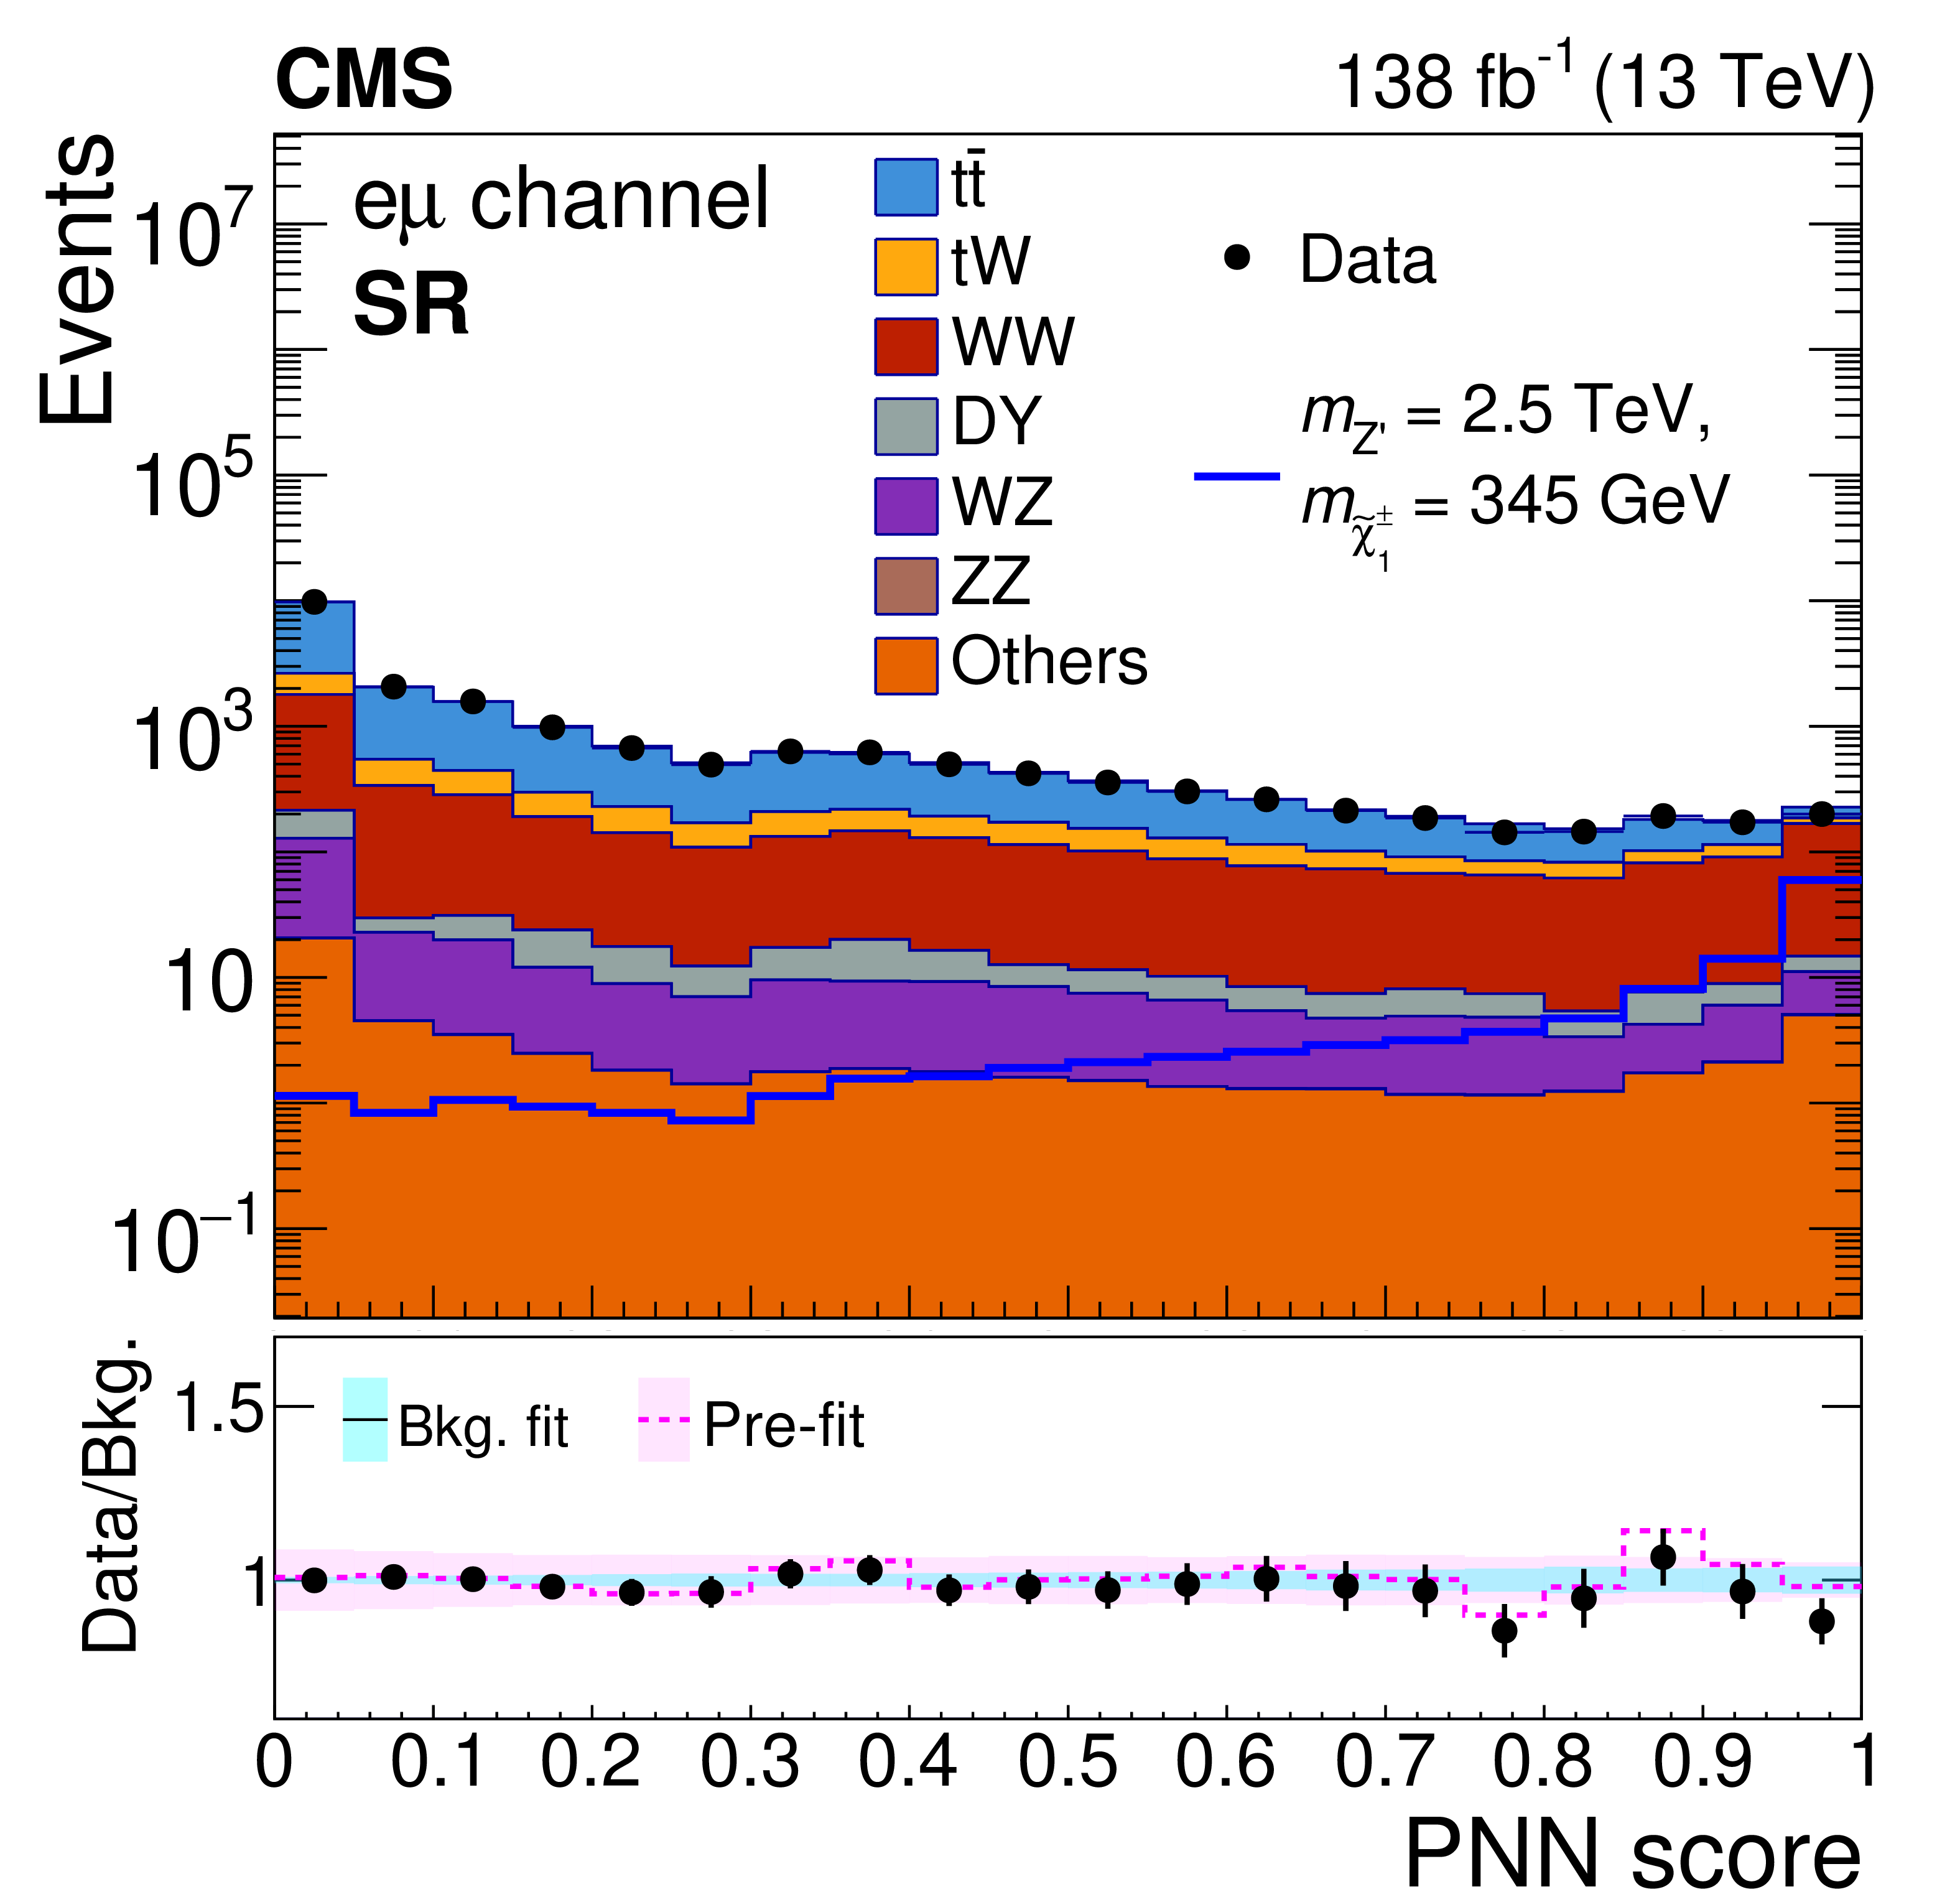
Figure 5:
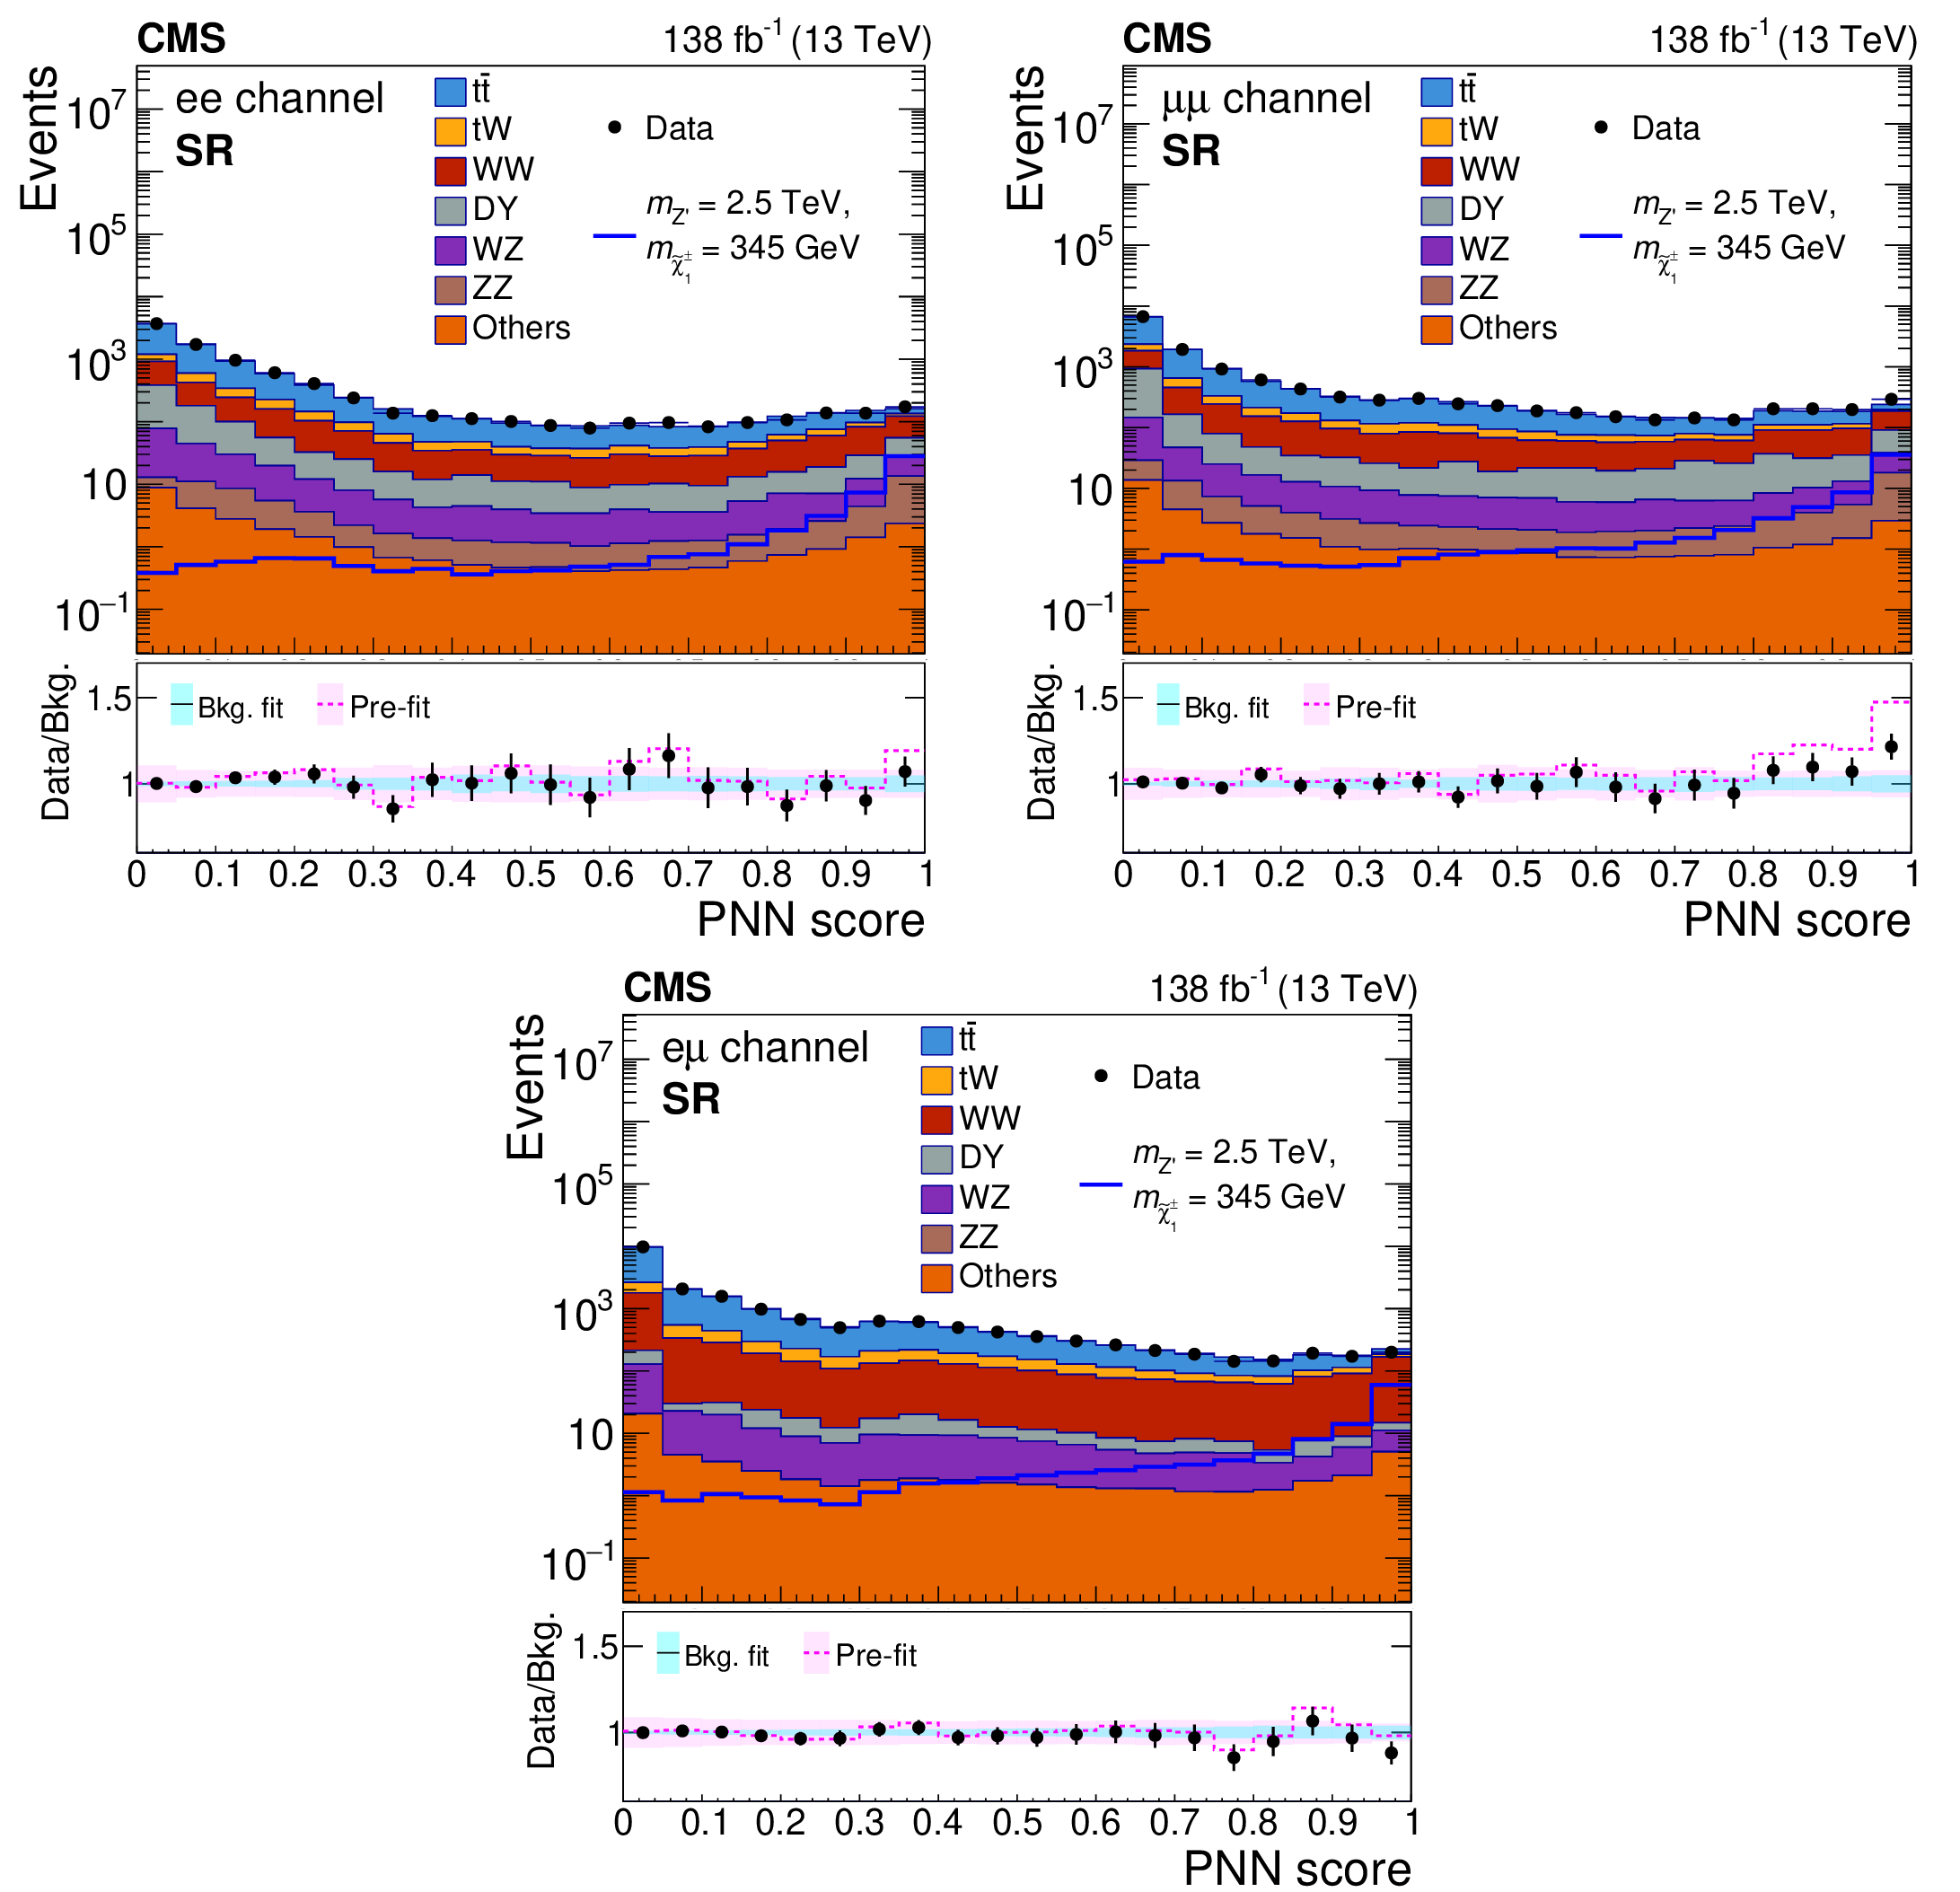
Measured and estimated background PNN score distributions, in the SRs of the three search channels. Signal distributions for a model with $ m_{\mathrm{Z}^{'}} = $ 2.5 TeV and $ m_{\tilde{\chi}_{1}^{\pm}} = $ 345 GeV are superimposed on the plots. The panel under each plot shows the data-to-background ratios using either a background-only fit (black circles and cyan band) or a pre-fit (magenta dashed line and band). The uncertainties are displayed around the unity line. |
png pdf |
Figure 5-a:
Measured and estimated background PNN score distributions, in the SRs of the three search channels. Signal distributions for a model with $ m_{\mathrm{Z}^{'}} = $ 2.5 TeV and $ m_{\tilde{\chi}_{1}^{\pm}} = $ 345 GeV are superimposed on the plots. The panel under each plot shows the data-to-background ratios using either a background-only fit (black circles and cyan band) or a pre-fit (magenta dashed line and band). The uncertainties are displayed around the unity line. |
png pdf |
Figure 5-b:
Measured and estimated background PNN score distributions, in the SRs of the three search channels. Signal distributions for a model with $ m_{\mathrm{Z}^{'}} = $ 2.5 TeV and $ m_{\tilde{\chi}_{1}^{\pm}} = $ 345 GeV are superimposed on the plots. The panel under each plot shows the data-to-background ratios using either a background-only fit (black circles and cyan band) or a pre-fit (magenta dashed line and band). The uncertainties are displayed around the unity line. |
png pdf |
Figure 5-c:
Measured and estimated background PNN score distributions, in the SRs of the three search channels. Signal distributions for a model with $ m_{\mathrm{Z}^{'}} = $ 2.5 TeV and $ m_{\tilde{\chi}_{1}^{\pm}} = $ 345 GeV are superimposed on the plots. The panel under each plot shows the data-to-background ratios using either a background-only fit (black circles and cyan band) or a pre-fit (magenta dashed line and band). The uncertainties are displayed around the unity line. |
png pdf |
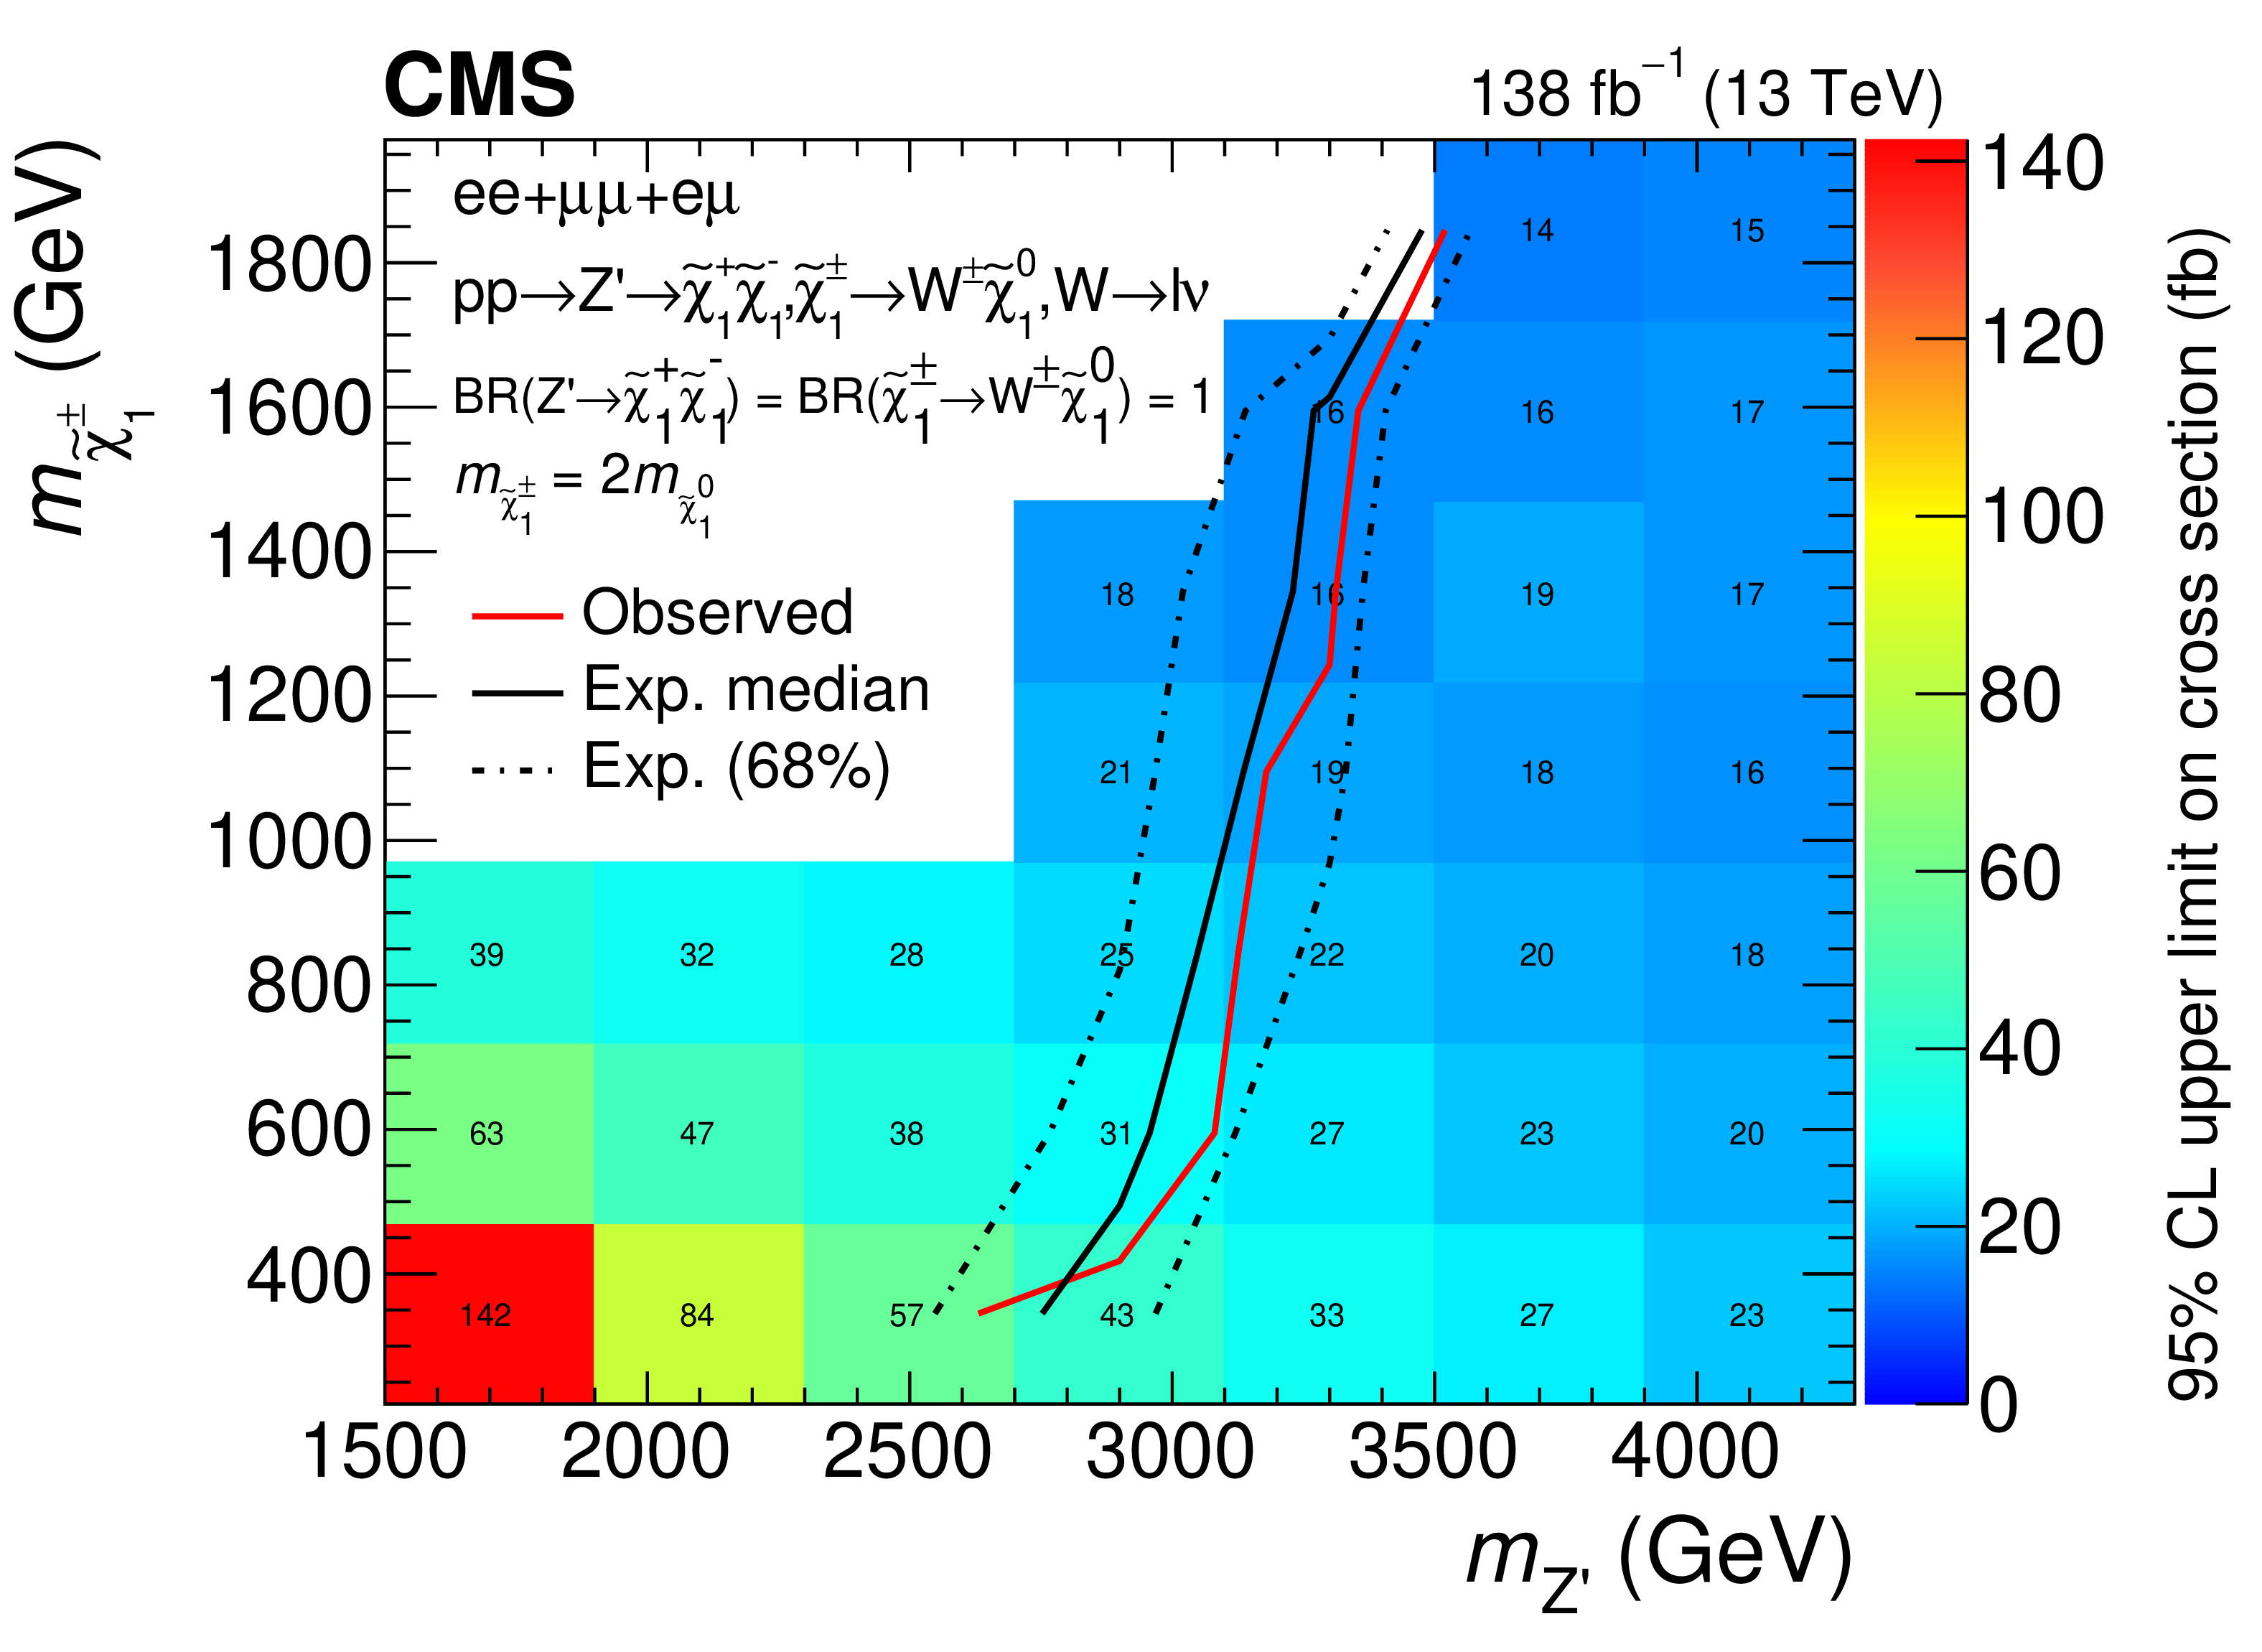
Figure 6:
Upper limits, at 95% CL, on the $ \mathrm{p}\mathrm{p} \to \mathrm{Z}^{'} $ cross section, in the $ \mathrm{Z}^{'} $ boson mass vs. $ \tilde{\chi}_{1}^{\pm} $ mass plane, combining the $ \mathrm{e}^+\mathrm{e}^- $, $ \mu^{+} \mu^{-} $, and $ \mathrm{e}^\pm\mu^\mp $ channels, as determined from the measured data (red line) and as expected from the simulation studies (black lines: median exclusion in solid and 68% quantiles in dashed). The region to the left of the curves is excluded. The color grid shows median expected upper limits. |
png pdf |
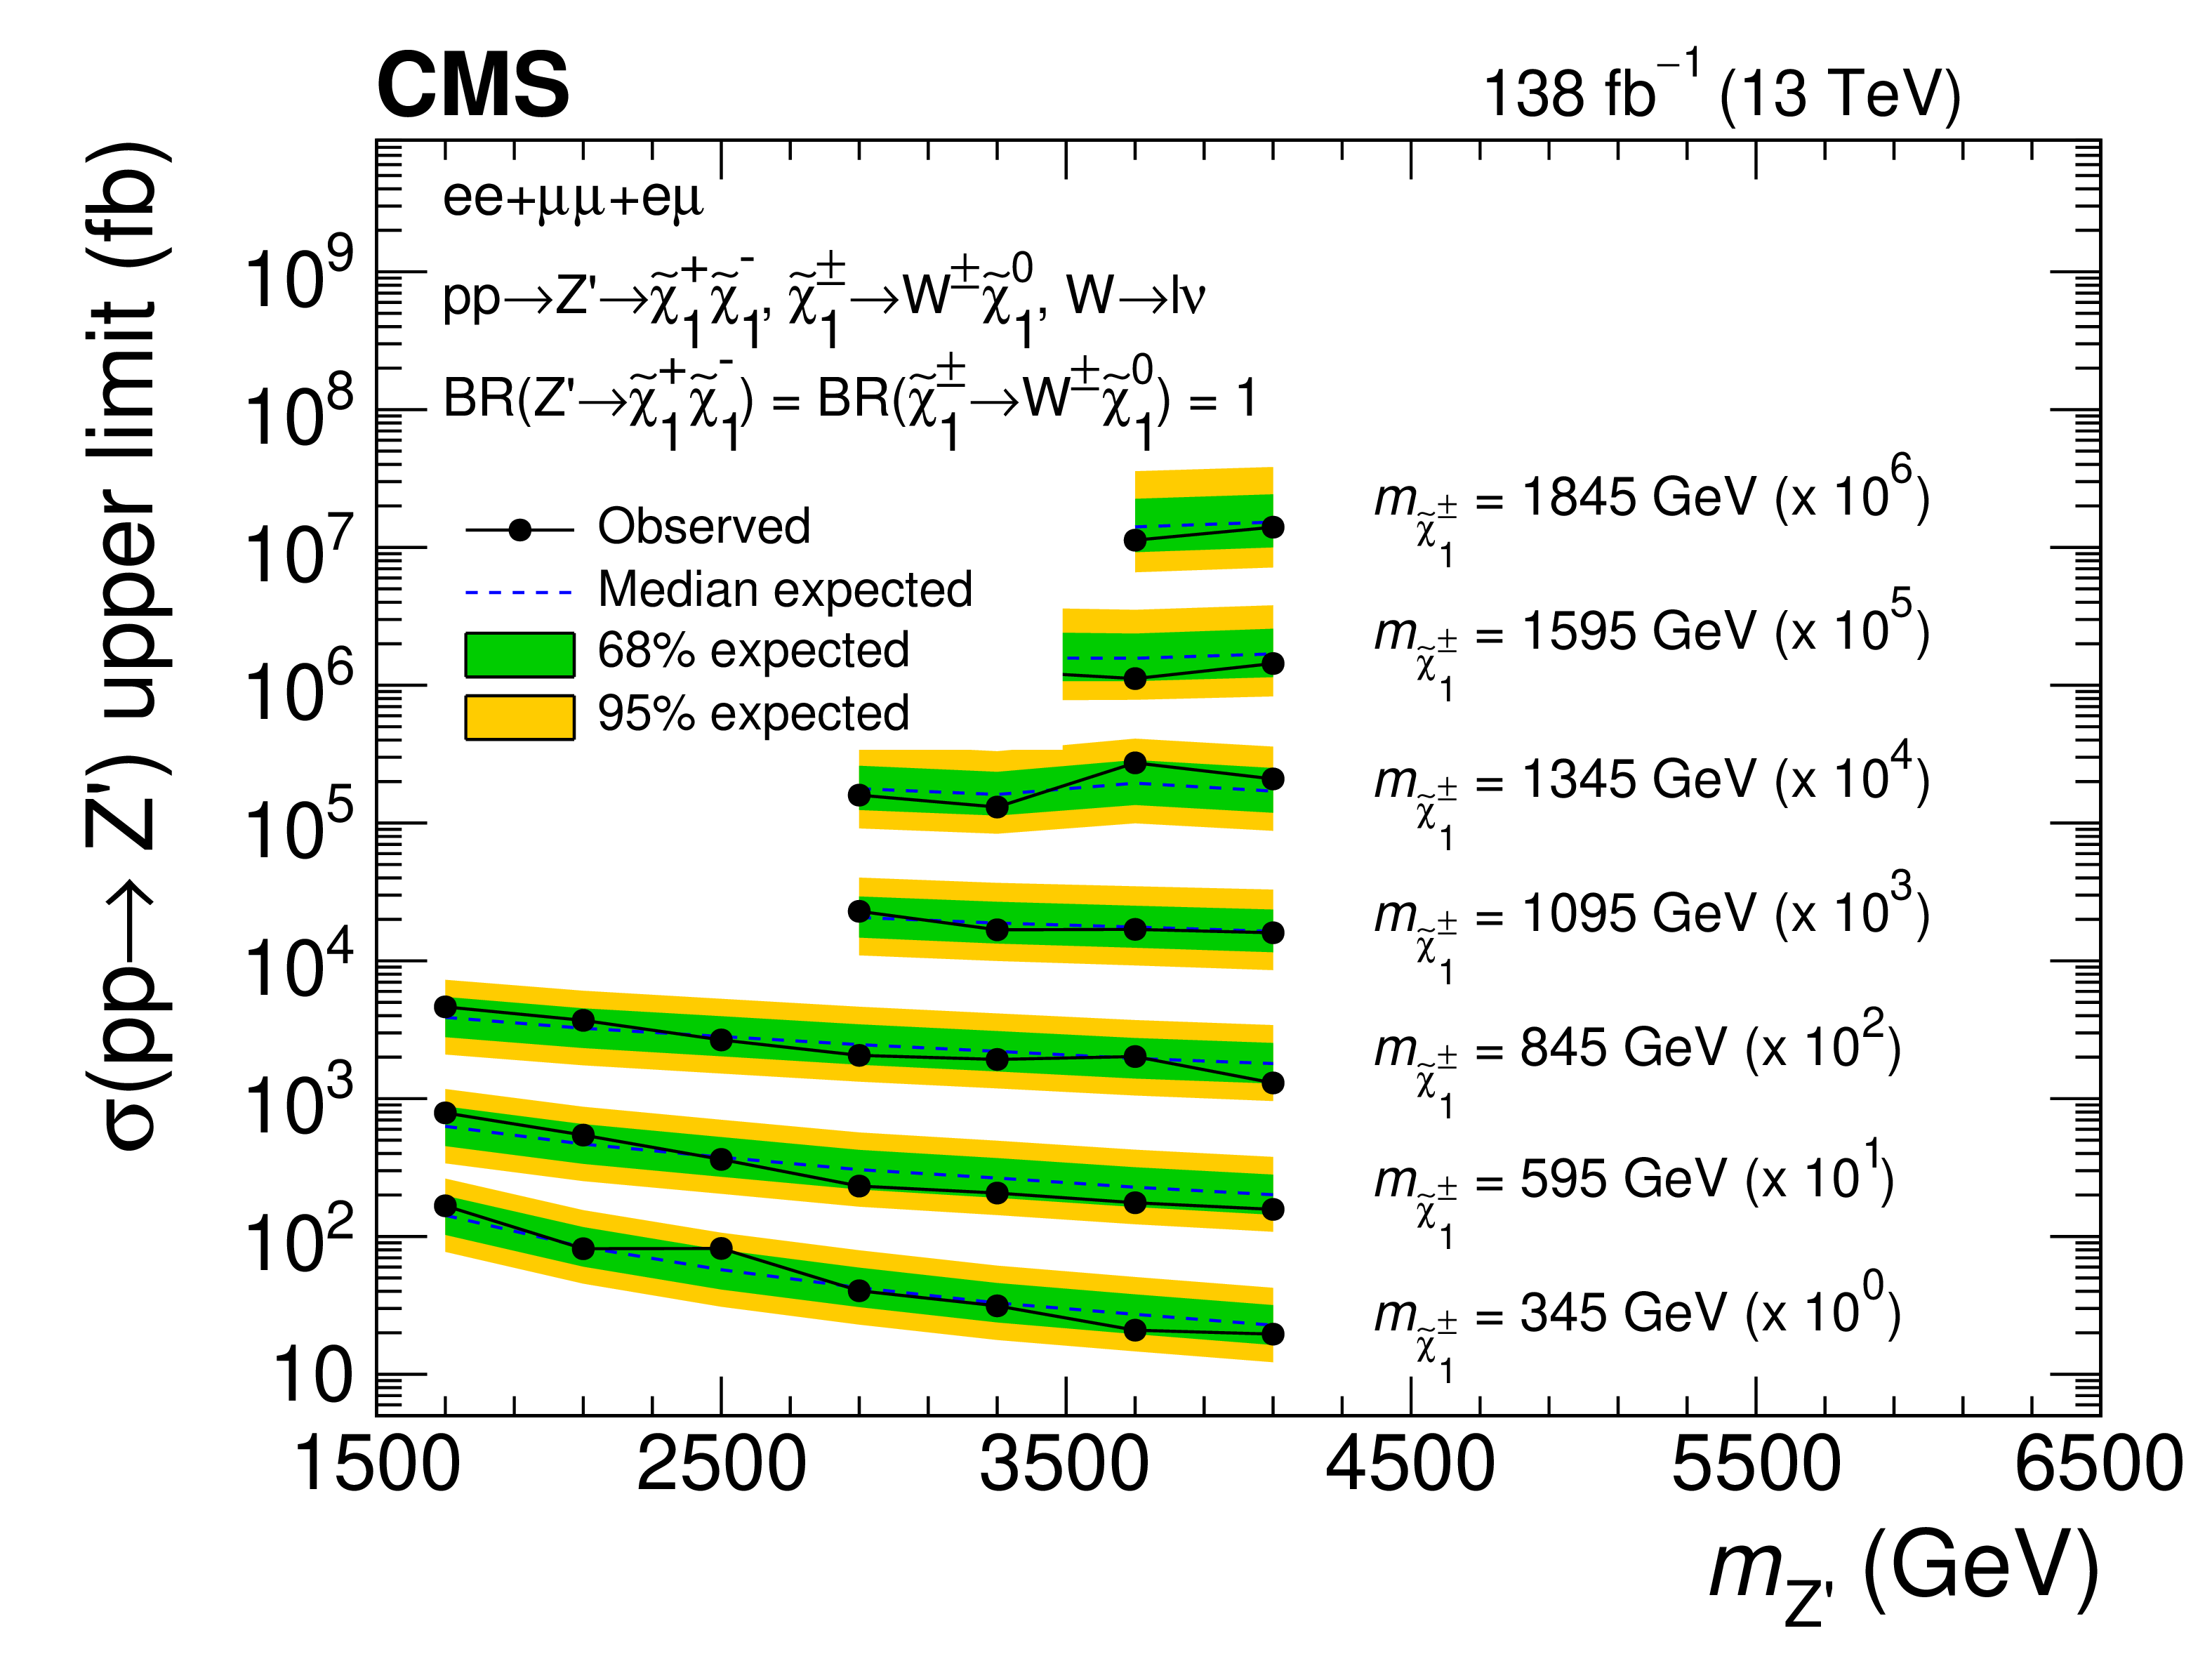
Figure 7:
Upper limits, at 95% CL, on the $ \mathrm{p}\mathrm{p} \to \mathrm{Z}^{'} $ cross section, vs. $ \mathrm{Z}^{'} $ boson mass for several $ \tilde{\chi}_{1}^{\pm} $ mass values, combining the $ \mathrm{e}^+\mathrm{e}^- $, $ \mu^{+} \mu^{-} $, and $ \mathrm{e}^\pm\mu^\mp $ channels, as determined from the measured data (black circles) and as expected from the simulation studies (dashed lines with green and yellow uncertainty bands). The limits for different $m_{\tilde{\chi}^{\pm}_1}$ values are shifted vertically, for visibility purposes. |
| Tables | |
png pdf |
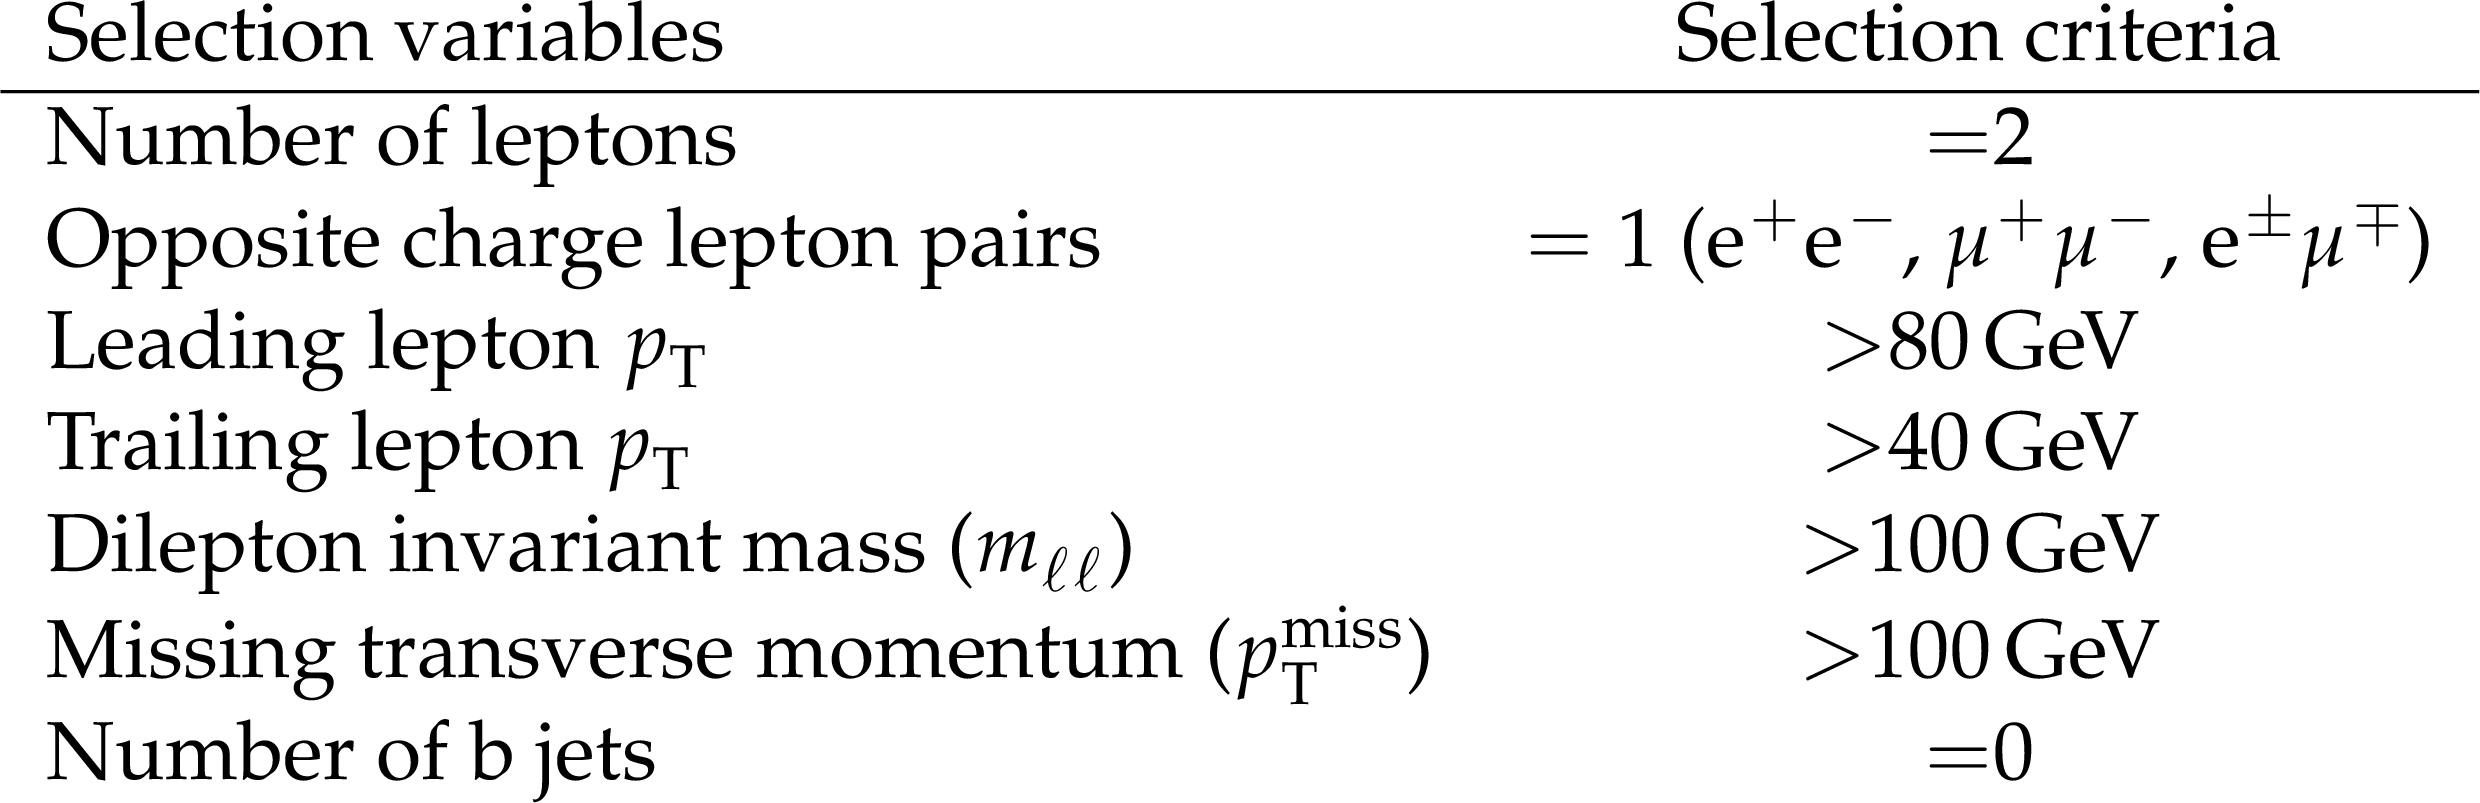
Table 1:
Signal event selection and search channels. |
png pdf |
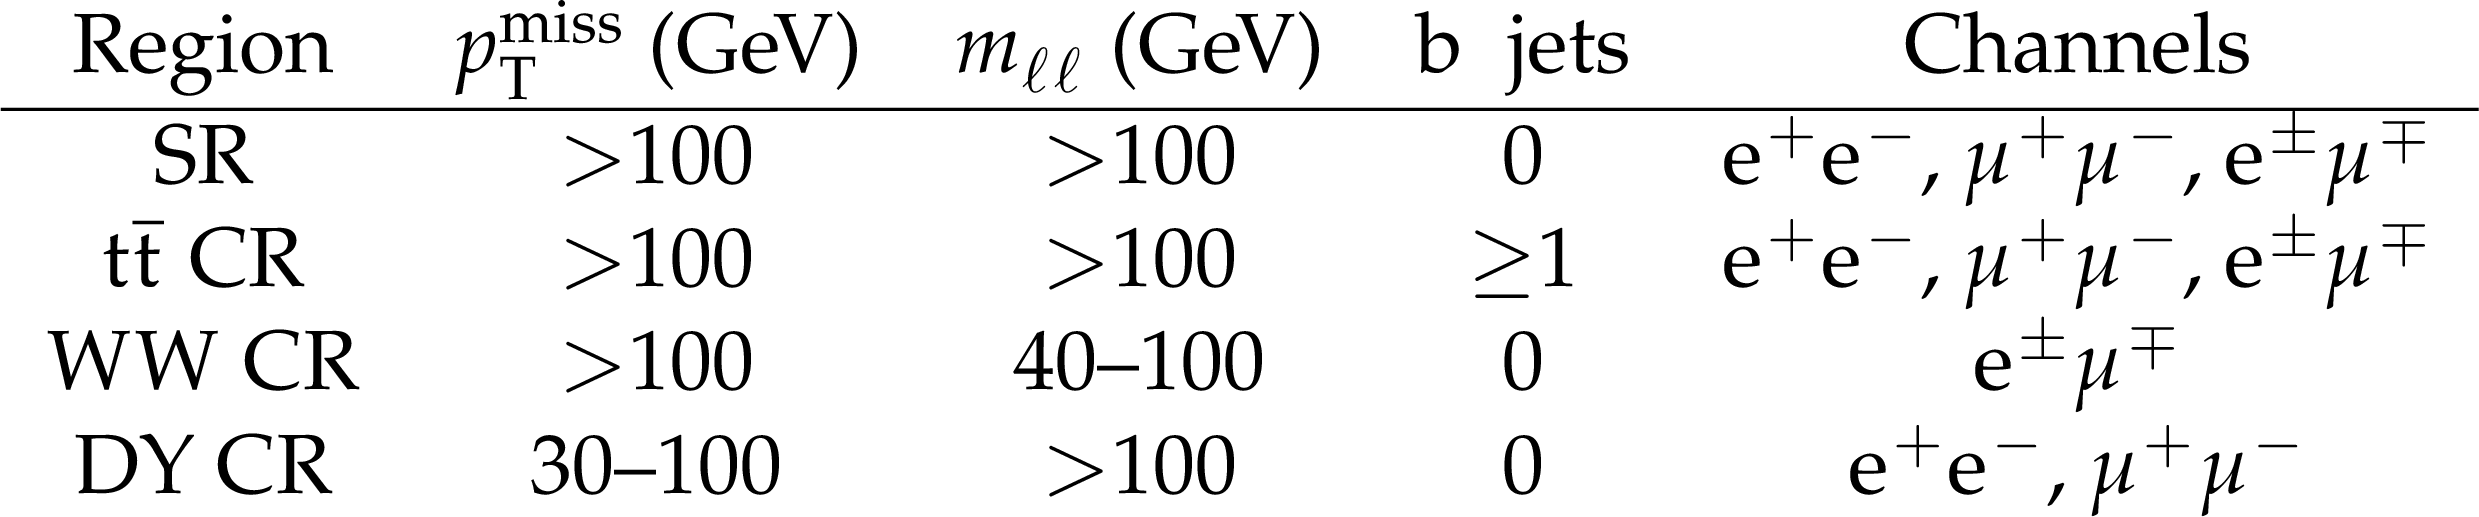
Table 2:
Definitions of the signal and control regions used in the analysis. |
| Summary |
| A search has been conducted for a leptophobic $ \mathrm{Z}^{'} $ boson decaying into two charginos, which subsequently decay into W bosons and neutralinos. A data sample of proton-proton collisions at a center-of-mass energy of 13 TeV, corresponding to an integrated luminosity of 138 fb$ ^{-1} $, was analyzed. This is the first search for this process using LHC data. An analysis was designed in the dilepton plus missing transverse momentum final state, in the $ \mathrm{e}^+\mathrm{e}^- $, $ \mu^{+} \mu^{-} $, and $ \mathrm{e}^\pm\mu^\mp $ channels. A parametrized neural network was employed to enhance the signal sensitivity. The analysis was interpreted using simplified model spectra featuring the production and decay process of the leptophobic $ \mathrm{Z}^{'} $ boson derived from the $ U(1)^\prime $ extension of the minimal supersymmetric standard model. The measurements were found to be consistent with the standard model expectations. Upper limits on the $ \mathrm{Z}^{'} $ boson production cross section were presented in the $ \mathrm{Z}^{'} $ boson mass vs.chargino mass plane, with $ m_{\tilde{\chi}_{1}^{\pm}} = 2 m_{\tilde{\chi}_{1}^{0}} $. The analysis excludes $ \mathrm{Z}^{'} $ boson masses up to about 3.5 TeV for the specific case of $ \mathrm{Z}^{'} $ bosons decaying exclusively to charginos, with the charginos decaying to W bosons and neutralinos. Under the assumption of 2.9 TeV $ \mathrm{Z}^{'} $ boson decaying exclusively to charginos, observations rule out chargino masses in the 400--1400 GeV range. |
| References | ||||
| 1 | ATLAS Collaboration | Search for high-mass dilepton resonances using 139 fb$ ^{-1} $ of pp collision data collected at $ \sqrt{s} = $ 13 TeV with the ATLAS detector | PLB 796 (2019) 68 | 1903.06248 |
| 2 | CMS Collaboration | Search for resonant and nonresonant new phenomena in high-mass dilepton final states at $ \sqrt{s} = $ 13 TeV | JHEP 07 (2021) 208 | CMS-EXO-19-019 2103.02708 |
| 3 | CMS Collaboration | Search for high mass dijet resonances with a new background prediction method in proton-proton collisions at $ \sqrt{s} = $ 13 TeV | JHEP 05 (2020) 033 | CMS-EXO-19-012 1911.03947 |
| 4 | ATLAS Collaboration | Search for heavy diboson resonances in semileptonic final states in pp collisions at $ \sqrt{s} = $ 13 TeV with the ATLAS detector | EPJC 80 (2020) 1165 | 2004.14636 |
| 5 | CMS Collaboration | Search for new heavy resonances decaying to WW, WZ, ZZ, WH, or ZH boson pairs in the all-jets final state in proton-proton collisions at $ \sqrt{s} = $ 13 TeV | PLB 844 (2023) 137813 | 2210.00043 |
| 6 | G. Corcella and S. Gentile | Heavy neutral gauge bosons at the LHC in an extended MSSM | NPB 866 (2013) 293 | 1205.5780 |
| 7 | J. L. Hewett and T. G. Rizzo | Low-energy phenomenology of superstring inspired E(6) models | Phys. Rept. 183 (1989) 193 | |
| 8 | P. Langacker | The physics of heavy $ \mathrm{Z}^\prime $ gauge bosons | Rev. Mod. Phys. 81 (2009) 1199 | 0801.1345 |
| 9 | J. Y. Araz, G. Corcella, M. Frank, and B. Fuks | Loopholes in $ \mathrm{Z} ^\prime $ searches at the LHC: exploring supersymmetric and leptophobic scenarios | JHEP 02 (2018) 092 | 1711.06302 |
| 10 | S. P. Martin | A supersymmetry primer | Adv. Ser. Direct. High Energy Phys. 18 (1998) 1 | hep-ph/9709356 |
| 11 | M. Frank, Y. Hiçyılmaz, S. Moretti, and O . Ozdal | Leptophobic Z$ ^\prime $ bosons in the secluded UMSSM | PRD 102 (2020) 115025 | 2005.08472 |
| 12 | M. Frank, Y. Hiçyılmaz, S. Moretti, and O . Ozdal | $ E_{6} $ motivated UMSSM confronts experimental data | JHEP 05 (2020) 123 | 2004.01415 |
| 13 | ATLAS Collaboration | Search for direct pair production of sleptons and charginos decaying to two leptons and neutralinos with mass splittings near the W-boson mass in $ \sqrt{s} = $ 13 TeV pp collisions with the ATLAS detector | JHEP 06 (2023) 031 | 2209.13935 |
| 14 | CMS Collaboration | Combined search for electroweak production of winos, binos, higgsinos, and sleptons in proton-proton collisions at $ \sqrt{s} = $ 13 TeV | PRD 109 (2024) 112001 | CMS-SUS-21-008 2402.01888 |
| 15 | CMS Collaboration | The CMS experiment at the CERN LHC | JINST 3 (2008) S08004 | |
| 16 | CMS Collaboration | Electron and photon reconstruction and identification with the CMS experiment at the CERN LHC | JINST 16 (2021) P05014 | CMS-EGM-17-001 2012.06888 |
| 17 | CMS Collaboration | Performance of the CMS muon detector and muon reconstruction with proton-proton collisions at $ \sqrt{s} = $ 13 TeV | JINST 13 (2018) P06015 | CMS-MUO-16-001 1804.04528 |
| 18 | CMS Collaboration | Description and performance of track and primary-vertex reconstruction with the CMS tracker | JINST 9 (2014) P10009 | CMS-TRK-11-001 1405.6569 |
| 19 | CMS Collaboration | Performance of the CMS Level-1 trigger in proton-proton collisions at $ \sqrt{s} = $ 13 TeV | JINST 15 (2020) P10017 | CMS-TRG-17-001 2006.10165 |
| 20 | CMS Collaboration | The CMS trigger system | JINST 12 (2017) P01020 | CMS-TRG-12-001 1609.02366 |
| 21 | CMS Collaboration | Performance of the CMS high-level trigger during LHC Run 2 | JINST 19 (2024) P11021 | CMS-TRG-19-001 2410.17038 |
| 22 | CMS Collaboration | Development of the CMS detector for the CERN LHC Run 3 | JINST 19 (2024) P05064 | CMS-PRF-21-001 2309.05466 |
| 23 | CMS Collaboration | Precision luminosity measurement in proton-proton collisions at $ \sqrt{s}= $ 13 TeV in 2015 and 2016 at CMS | EPJC 81 (2021) 800 | CMS-LUM-17-003 2104.01927 |
| 24 | CMS Collaboration | CMS luminosity measurement for the 2017 data-taking period at $ \sqrt{s} = $ 13 TeV | CMS Physics Analysis Summary, 2018 link |
CMS-PAS-LUM-17-004 |
| 25 | CMS Collaboration | CMS luminosity measurement for the 2018 data-taking period at $ \sqrt{s} = $ 13 TeV | CMS Physics Analysis Summary, 2019 link |
CMS-PAS-LUM-18-002 |
| 26 | J. Alwall et al. | The automated computation of tree-level and next-to-leading order differential cross sections, and their matching to parton shower simulations | JHEP 07 (2014) 079 | 1405.0301 |
| 27 | NNPDF Collaboration | Parton distributions from high-precision collider data | EPJC 77 (2017) 663 | 1706.00428 |
| 28 | Particle Data Group , S. Navas et al. | Review of particle physics | PRD 110 (2024) 030001 | |
| 29 | P. Nason | A new method for combining NLO QCD with shower Monte Carlo algorithms | JHEP 11 (2004) 040 | hep-ph/0409146 |
| 30 | S. Frixione, P. Nason, and C. Oleari | Matching NLO QCD computations with parton shower simulations: the POWHEG method | JHEP 11 (2007) 070 | 0709.2092 |
| 31 | S. Alioli, P. Nason, C. Oleari, and E. Re | A general framework for implementing NLO calculations in shower Monte Carlo programs: the POWHEG BOX | JHEP 06 (2010) 043 | 1002.2581 |
| 32 | S. Frixione, P. Nason, and G. Ridolfi | A positive-weight next-to-leading-order Monte Carlo for heavy flavour hadroproduction | JHEP 09 (2007) 126 | 0707.3088 |
| 33 | T. Sjöstrand et al. | An introduction to PYTHIA 8.2 | Comput. Phys. Commun. 191 (2015) 159 | 1410.3012 |
| 34 | R. Frederix and S. Frixione | Merging meets matching in MC@NLO | JHEP 12 (2012) 061 | 1209.6215 |
| 35 | CMS Collaboration | Extraction and validation of a new set of CMS PYTHIA8 tunes from underlying-event measurements | EPJC 80 (2020) 4 | CMS-GEN-17-001 1903.12179 |
| 36 | GEANT4 Collaboration | GEANT4---a simulation toolkit | NIM A 506 (2003) 250 | |
| 37 | CMS Collaboration | Particle-flow reconstruction and global event description with the CMS detector | JINST 12 (2017) P10003 | CMS-PRF-14-001 1706.04965 |
| 38 | CMS Collaboration | ECAL 2016 refined calibration and Run 2 summary plots | CMS Detector Performance Note CMS-DP-2020-021, 2020 CDS |
|
| 39 | CMS Collaboration | Performance of the CMS electromagnetic calorimeter in pp collisions at $ \sqrt{s} = $ 13 TeV | JINST 19 (2024) P09004 | CMS-EGM-18-002 2403.15518 |
| 40 | M. Cacciari, G. P. Salam, and G. Soyez | The anti-$ k_{\mathrm{T}} $ jet clustering algorithm | JHEP 04 (2008) 063 | 0802.1189 |
| 41 | M. Cacciari, G. P. Salam, and G. Soyez | FastJet user manual | EPJC 72 (2012) 1896 | 1111.6097 |
| 42 | CMS Collaboration | Pileup mitigation at CMS in 13 TeV data | JINST 15 (2020) P09018 | CMS-JME-18-001 2003.00503 |
| 43 | CMS Collaboration | Jet energy scale and resolution in the CMS experiment in pp collisions at 8 TeV | JINST 12 (2017) P02014 | CMS-JME-13-004 1607.03663 |
| 44 | CMS Collaboration | Identification of heavy-flavour jets with the CMS detector in pp collisions at 13 TeV | JINST 13 (2018) P05011 | CMS-BTV-16-002 1712.07158 |
| 45 | CMS Collaboration | Performance of missing transverse momentum reconstruction in proton-proton collisions at $ \sqrt{s} = $ 13 TeV using the CMS detector | JINST 14 (2019) P07004 | CMS-JME-17-001 1903.06078 |
| 46 | D. Bertolini, P. Harris, M. Low, and N. Tran | Pileup per particle identification | JHEP 10 (2014) 059 | 1407.6013 |
| 47 | CMS Collaboration | Performance of the CMS muon trigger system in proton-proton collisions at $ \sqrt{s}= $ 13 TeV | JINST 16 (2021) P07001 | CMS-MUO-19-001 2102.04790 |
| 48 | P. Baldi et al. | Parameterized neural networks for high-energy physics | EPJC 76 (2016) 235 | 1601.07913 |
| 49 | C. G. Lester and D. J. Summers | Measuring masses of semiinvisibly decaying particles pair produced at hadron colliders | PLB 463 (1999) 99 | hep-ph/9906349 |
| 50 | A. Barr, C. Lester, and P. Stephens | A variable for measuring masses at hadron colliders when missing energy is expected; $ m_{T2} $: the truth behind the glamour | JPG 29 (2003) 2343 | hep-ph/0304226 |
| 51 | M. Abadi et al. | TensorFlow: Large-scale machine learning on heterogeneous systems | technical report, Software available from tensorflow.org, 2015 link |
1605.08695 |
| 52 | Chollet et al. | Keras | https://keras.io, 2015 | |
| 53 | S. Ruder | An overview of gradient descent optimization algorithms | 1609.04747 | |
| 54 | B. Shahriari et al. | Taking the human out of the loop: A review of Bayesian optimization | Proceedings of the IEEE 104 (2016) 148 | |
| 55 | G. Cowan, K. Cranmer, E. Gross, and O. Vitells | Asymptotic formulae for likelihood-based tests of new physics | EPJC 71 (2011) 1554 | 1007.1727 |
| 56 | J. Butterworth et al. | PDF4LHC recommendations for LHC Run II | JPG 43 (2016) 023001 | 1510.03865 |
| 57 | M. Czakon et al. | Top-pair production at the LHC through NNLO QCD and NLO EW | JHEP 10 (2017) 186 | 1705.04105 |
| 58 | R. J. Barlow and C. Beeston | Fitting using finite monte carlo samples | Comput. Phys. Commun. 77 (1993) 219 | |
| 59 | T. Junk | Confidence level computation for combining searches with small statistics | NIM A 434 (1999) 435 | hep-ex/9902006 |
| 60 | A. L. Read | Presentation of search results: The $ \text{CL}_\text{s} $ technique | JPG 28 (2002) 2693 | |
| 61 | ATLAS and CMS Collaborations, and LHC Higgs Combination Group | Procedure for the LHC Higgs boson search combination in Summer 2011 | Technical Report CMS-NOTE-2011-005, ATL-PHYS-PUB-2011-11, 2011 | |
| 62 | CMS Collaboration | The CMS Statistical Analysis and Combination Tool: Combine | Comput. Softw. Big Sci. 8 (2024) 19 | CMS-CAT-23-001 2404.06614 |
| 63 | W. Verkerke and D. P. Kirkby | The RooFit toolkit for data modeling | in CHEP03 onference Proceedings, L. Lyons and M. Karagoz, eds, 2003 Computing in High Energy and Nuclear Physics 2003 (2003) C |
physics/0306116 |
| 64 | L. Moneta et al. | The RooStats Project | PoS ACAT 057, 2010 link |
1009.1003 |
| 65 | CMS Collaboration | HEPData record for this analysis | link | |
|
|
Compact Muon Solenoid LHC, CERN |
|

|

|

|

|

|