

Compact Muon Solenoid
LHC, CERN
| CMS-SMP-22-009 ; CERN-EP-2025-206 | ||
| Measurement of the $ \mathrm{Z}\gamma $ production cross section and search for anomalous neutral triple gauge couplings in pp collisions at $ \sqrt{s}= $ 13 TeV | ||
| CMS Collaboration | ||
| 20 January 2026 | ||
| Accepted for publication in J. High Energy Phys. | ||
| Abstract: A measurement of the fiducial cross section of the associated production of a Z boson and a high-$ p_{\mathrm{T}} $ photon, where the Z decays to two neutrinos, and a search for anomalous triple gauge couplings are reported. The results are based on data collected by the CMS experiment at the LHC in proton-proton collisions at $ \sqrt{s}= $ 13 TeV during 2016--2018, corresponding to an integrated luminosity of 138 fb$ ^{-1} $. The fiducial $ \mathrm{Z}\gamma $ cross section, where a photon with a $ p_{\mathrm{T}} $ greater than 225 GeV is produced in association with a Z, and the Z decays to a $ \nu\overline{\nu} $ pair ($ \mathrm{Z}(\nu\overline{\nu})\gamma $), is measured to be 23.3 $ ^{+1.4}_{-1.3} $ fb, in agreement, within uncertainties, with the standard model prediction. The differential cross section as a function of the photon $ p_{\mathrm{T}} $ has been measured and compared with standard model predictions computed at next-to-leading and at next-to-next-to-leading order in perturbative quantum chromodynamics. Constraints have been placed on the presence of anomalous couplings that affect the $ \mathrm{Z}\mathrm{Z}\gamma $ and $ \mathrm{Z}\gamma\gamma $ vertex using the $ p_{\mathrm{T}} $ spectrum of the photons. The observed 95% confidence level intervals for $ CP $-conserving $ h_3^{\gamma} $ and $ h_4^{\gamma} $ are determined to be (-3.4, 3.5)$ \times10^{-4} $ and (-6.8, 6.8)$ \times10^{-7} $, and for $ h_3^{\mathrm{Z}} $ and $ h_4^{\mathrm{Z}} $ they are (-2.2, 2.2)$ \times10^{-4} $ and (-4.1, 4.2)$ \times10^{-7} $, respectively. These are the strictest limits to date on $ h_3^{\gamma} $, $ h_3^{\mathrm{Z}} $ and $ h_4^{\mathrm{Z}} $. | ||
| Links: e-print arXiv:2601.14102 [hep-ex] (PDF) ; CDS record ; inSPIRE record ; CADI line (restricted) ; | ||
| Figures | |
png pdf |
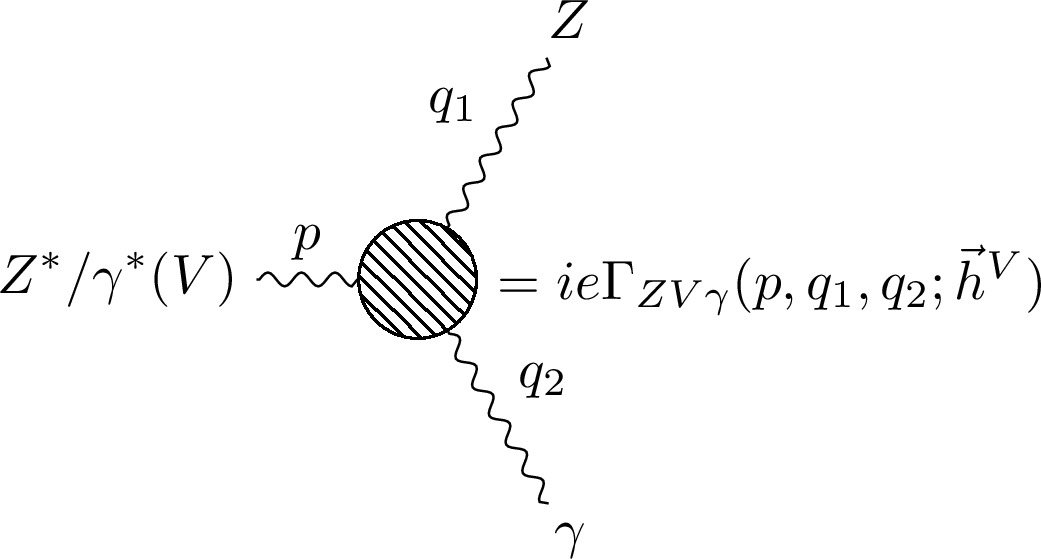
Figure 1:
The Feynman diagram for the $ \mathrm{Z}\mathrm{V}\gamma $ vertex, where $ \mathrm{V} =\gamma^{*}/\mathrm{Z}^{*} $, in the presence of an aNTGC. |

png pdf |
Figure 2:
The leading-order Feynman diagram for SM $ \mathrm{Z}\gamma $ production in the $ t $-channel (left), and (right) the additional diagram for the beyond SM \textits-channel $ \mathrm{Z}\gamma $ production due to the presence of aNTGCs. |

png pdf |
Figure 2-a:
The leading-order Feynman diagram for SM $ \mathrm{Z}\gamma $ production in the $ t $-channel (left), and (right) the additional diagram for the beyond SM \textits-channel $ \mathrm{Z}\gamma $ production due to the presence of aNTGCs. |

png pdf |
Figure 2-b:
The leading-order Feynman diagram for SM $ \mathrm{Z}\gamma $ production in the $ t $-channel (left), and (right) the additional diagram for the beyond SM \textits-channel $ \mathrm{Z}\gamma $ production due to the presence of aNTGCs. |
png pdf |
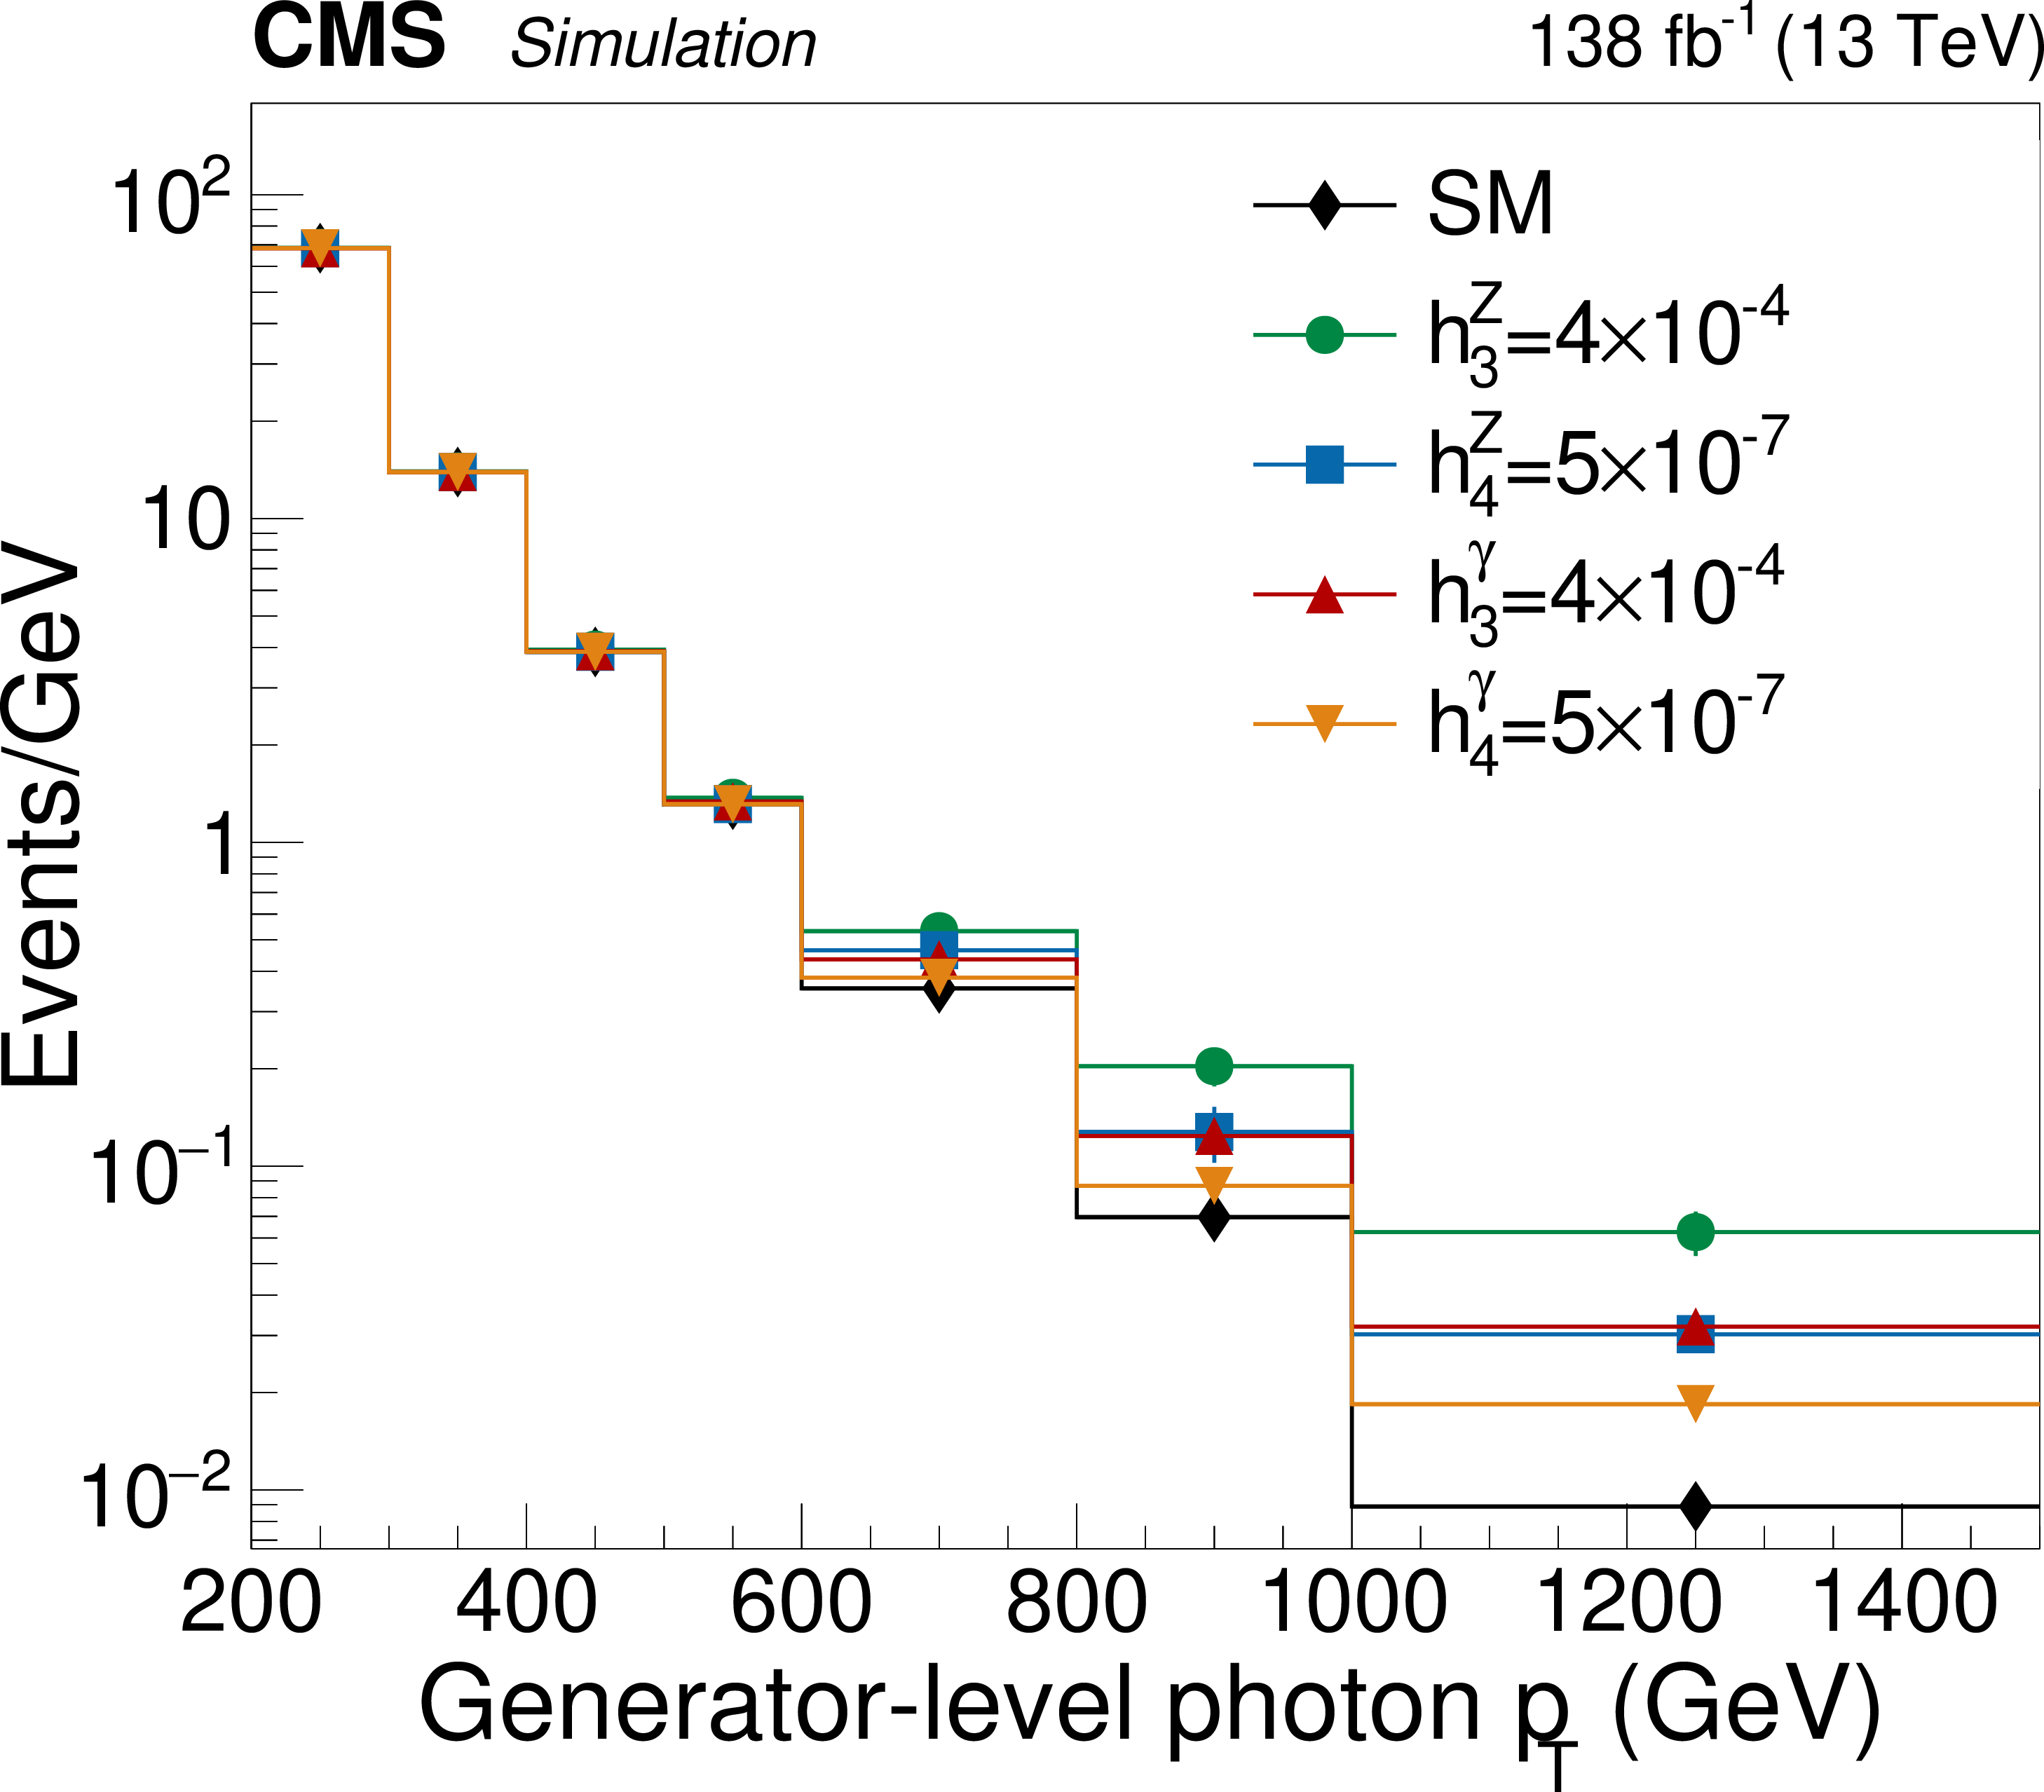
Figure 3:
The photon $ p_{\mathrm{T}} $ spectrum for various values of aNTGC couplings and the SM predictions. |
png pdf |
Figure 4:
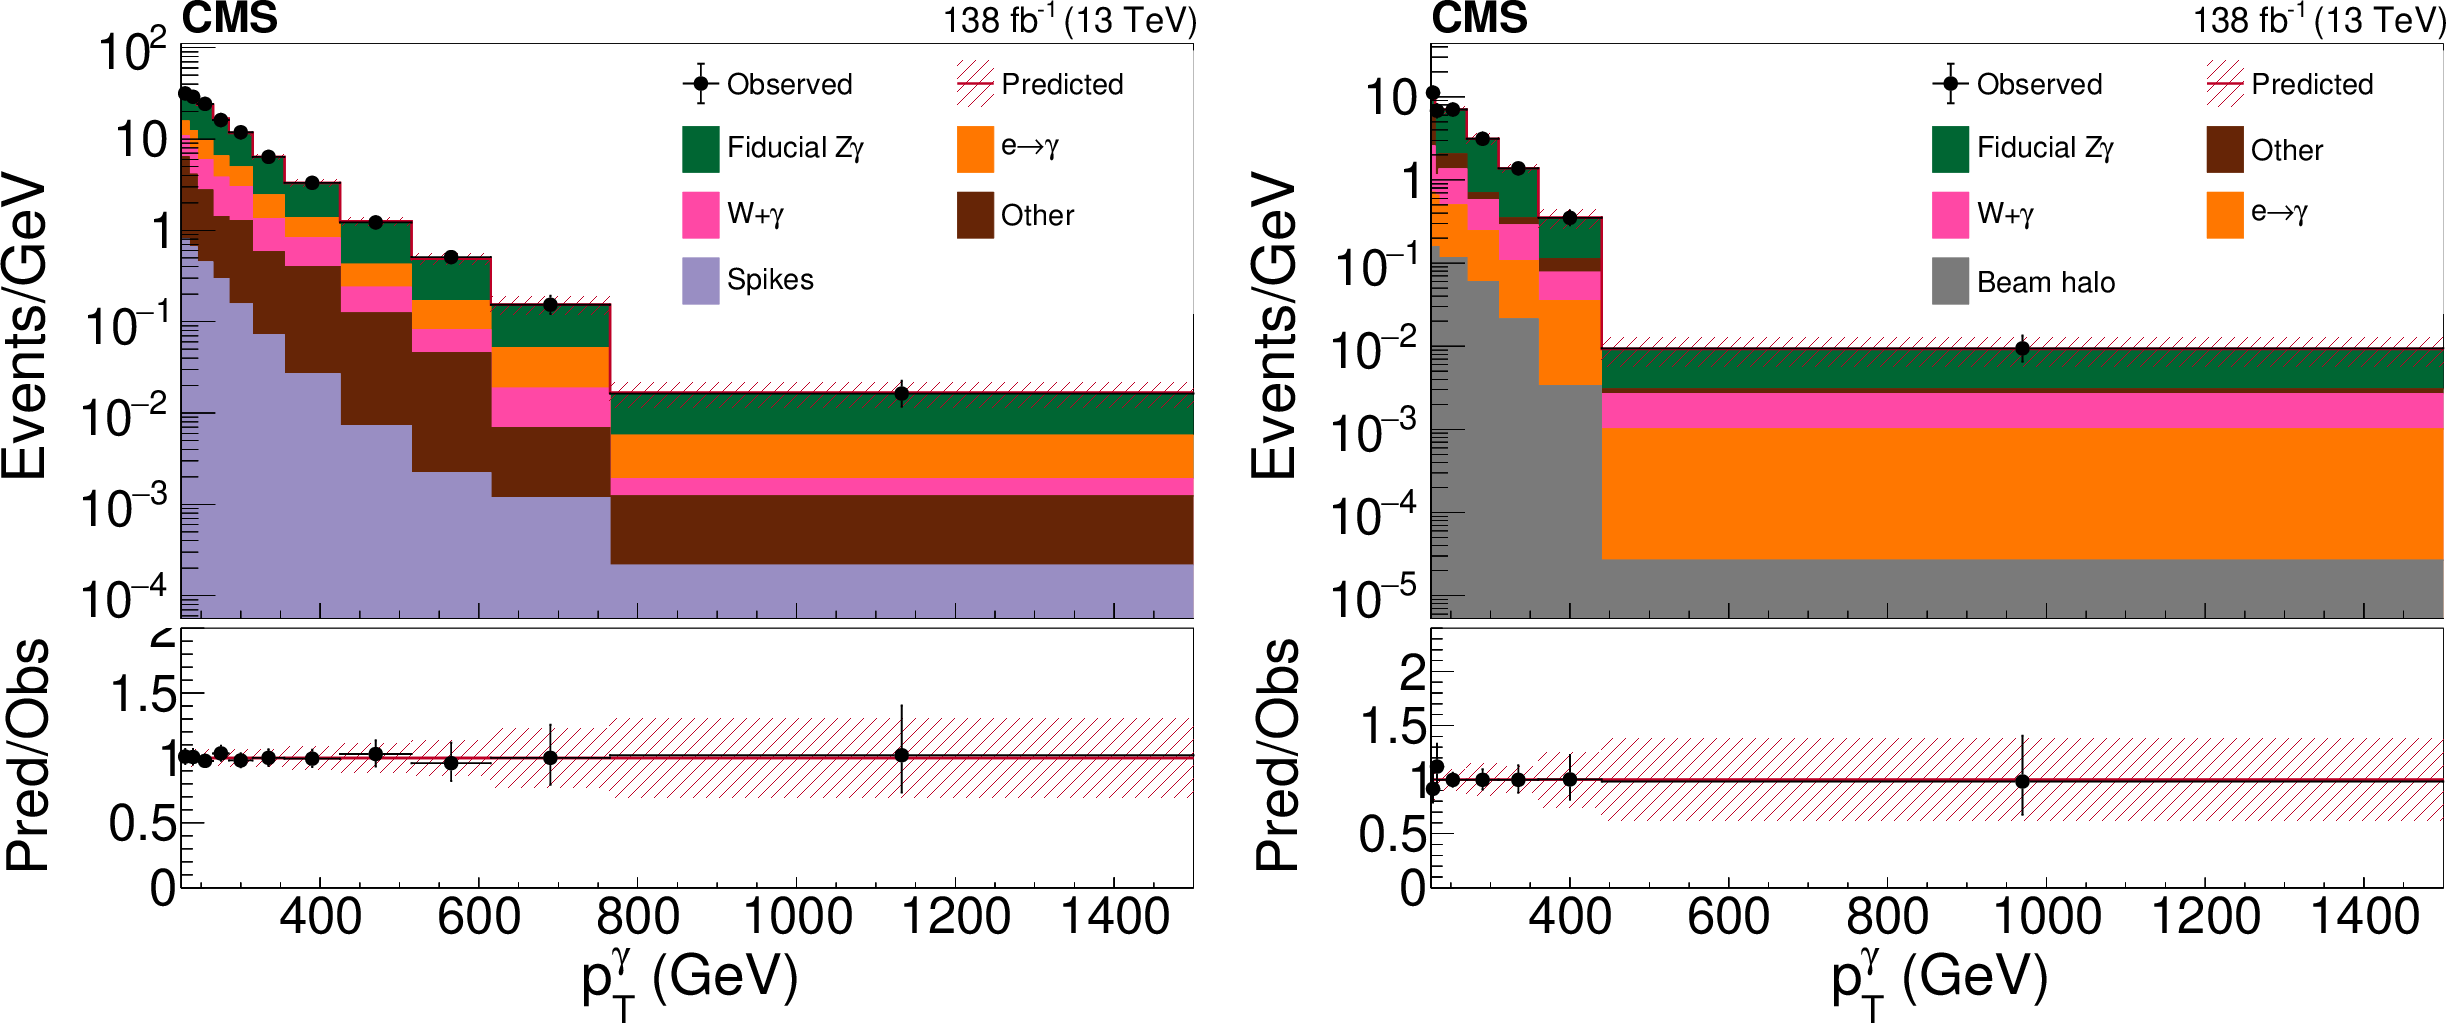
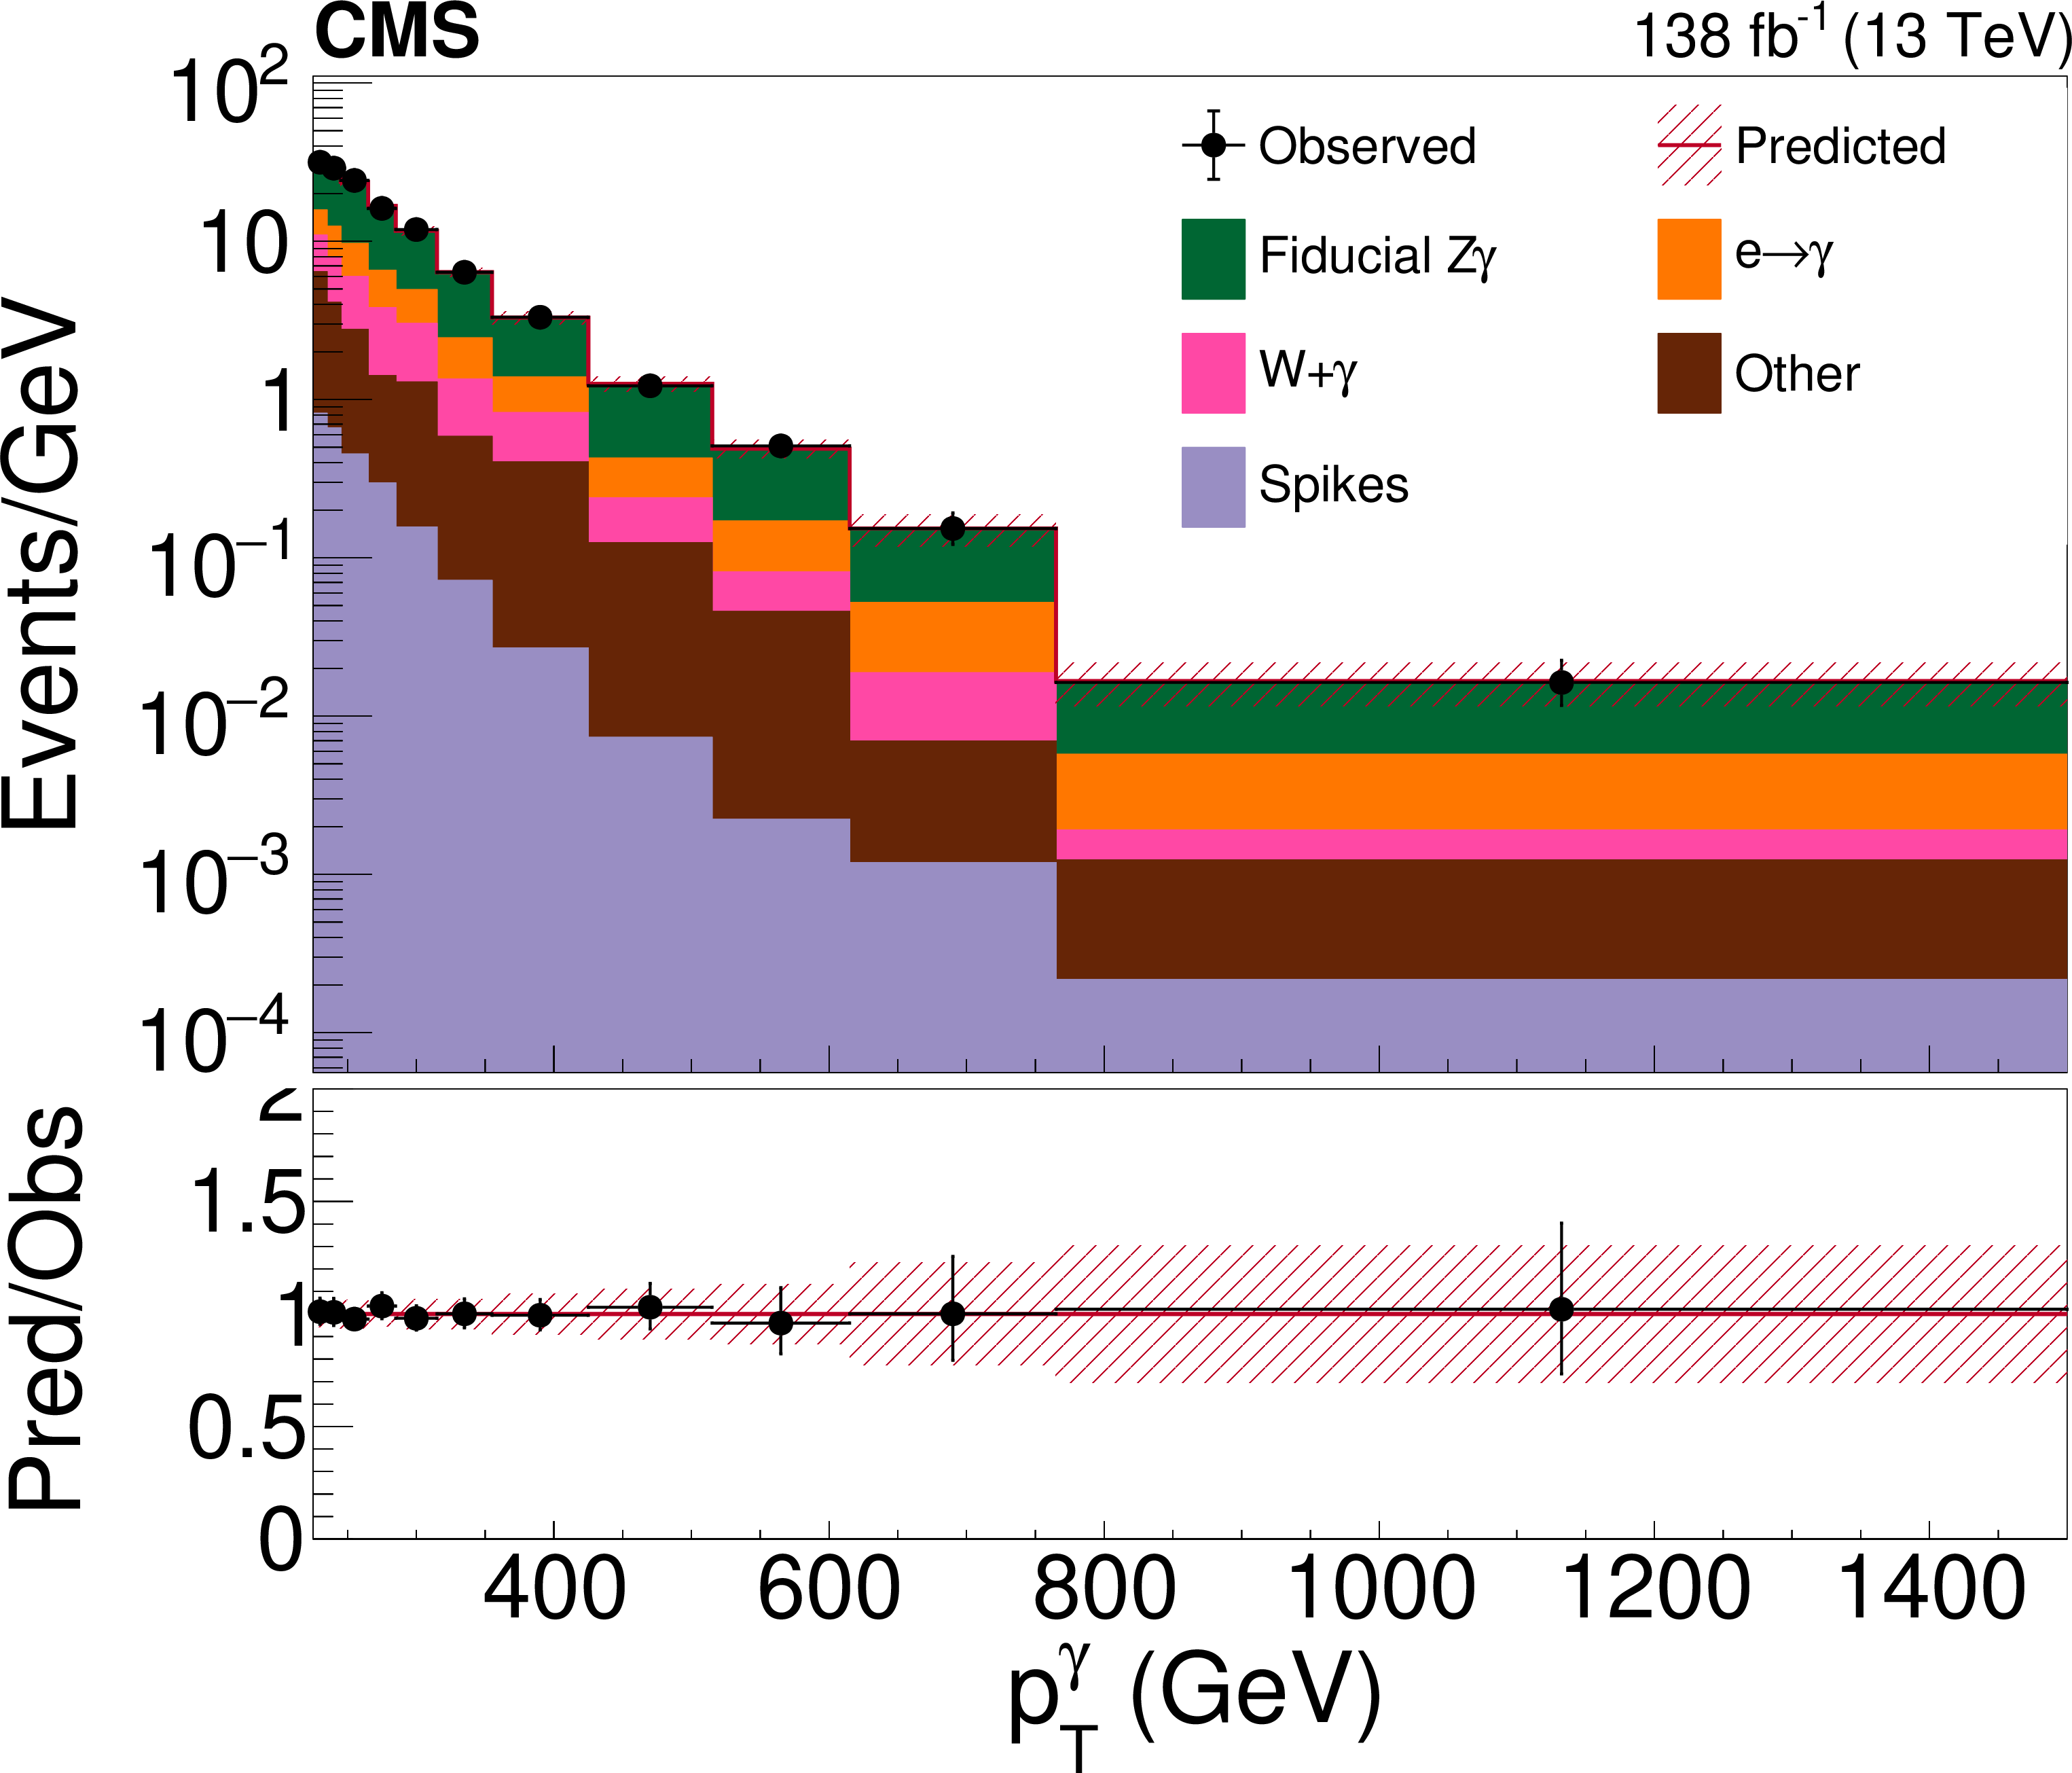
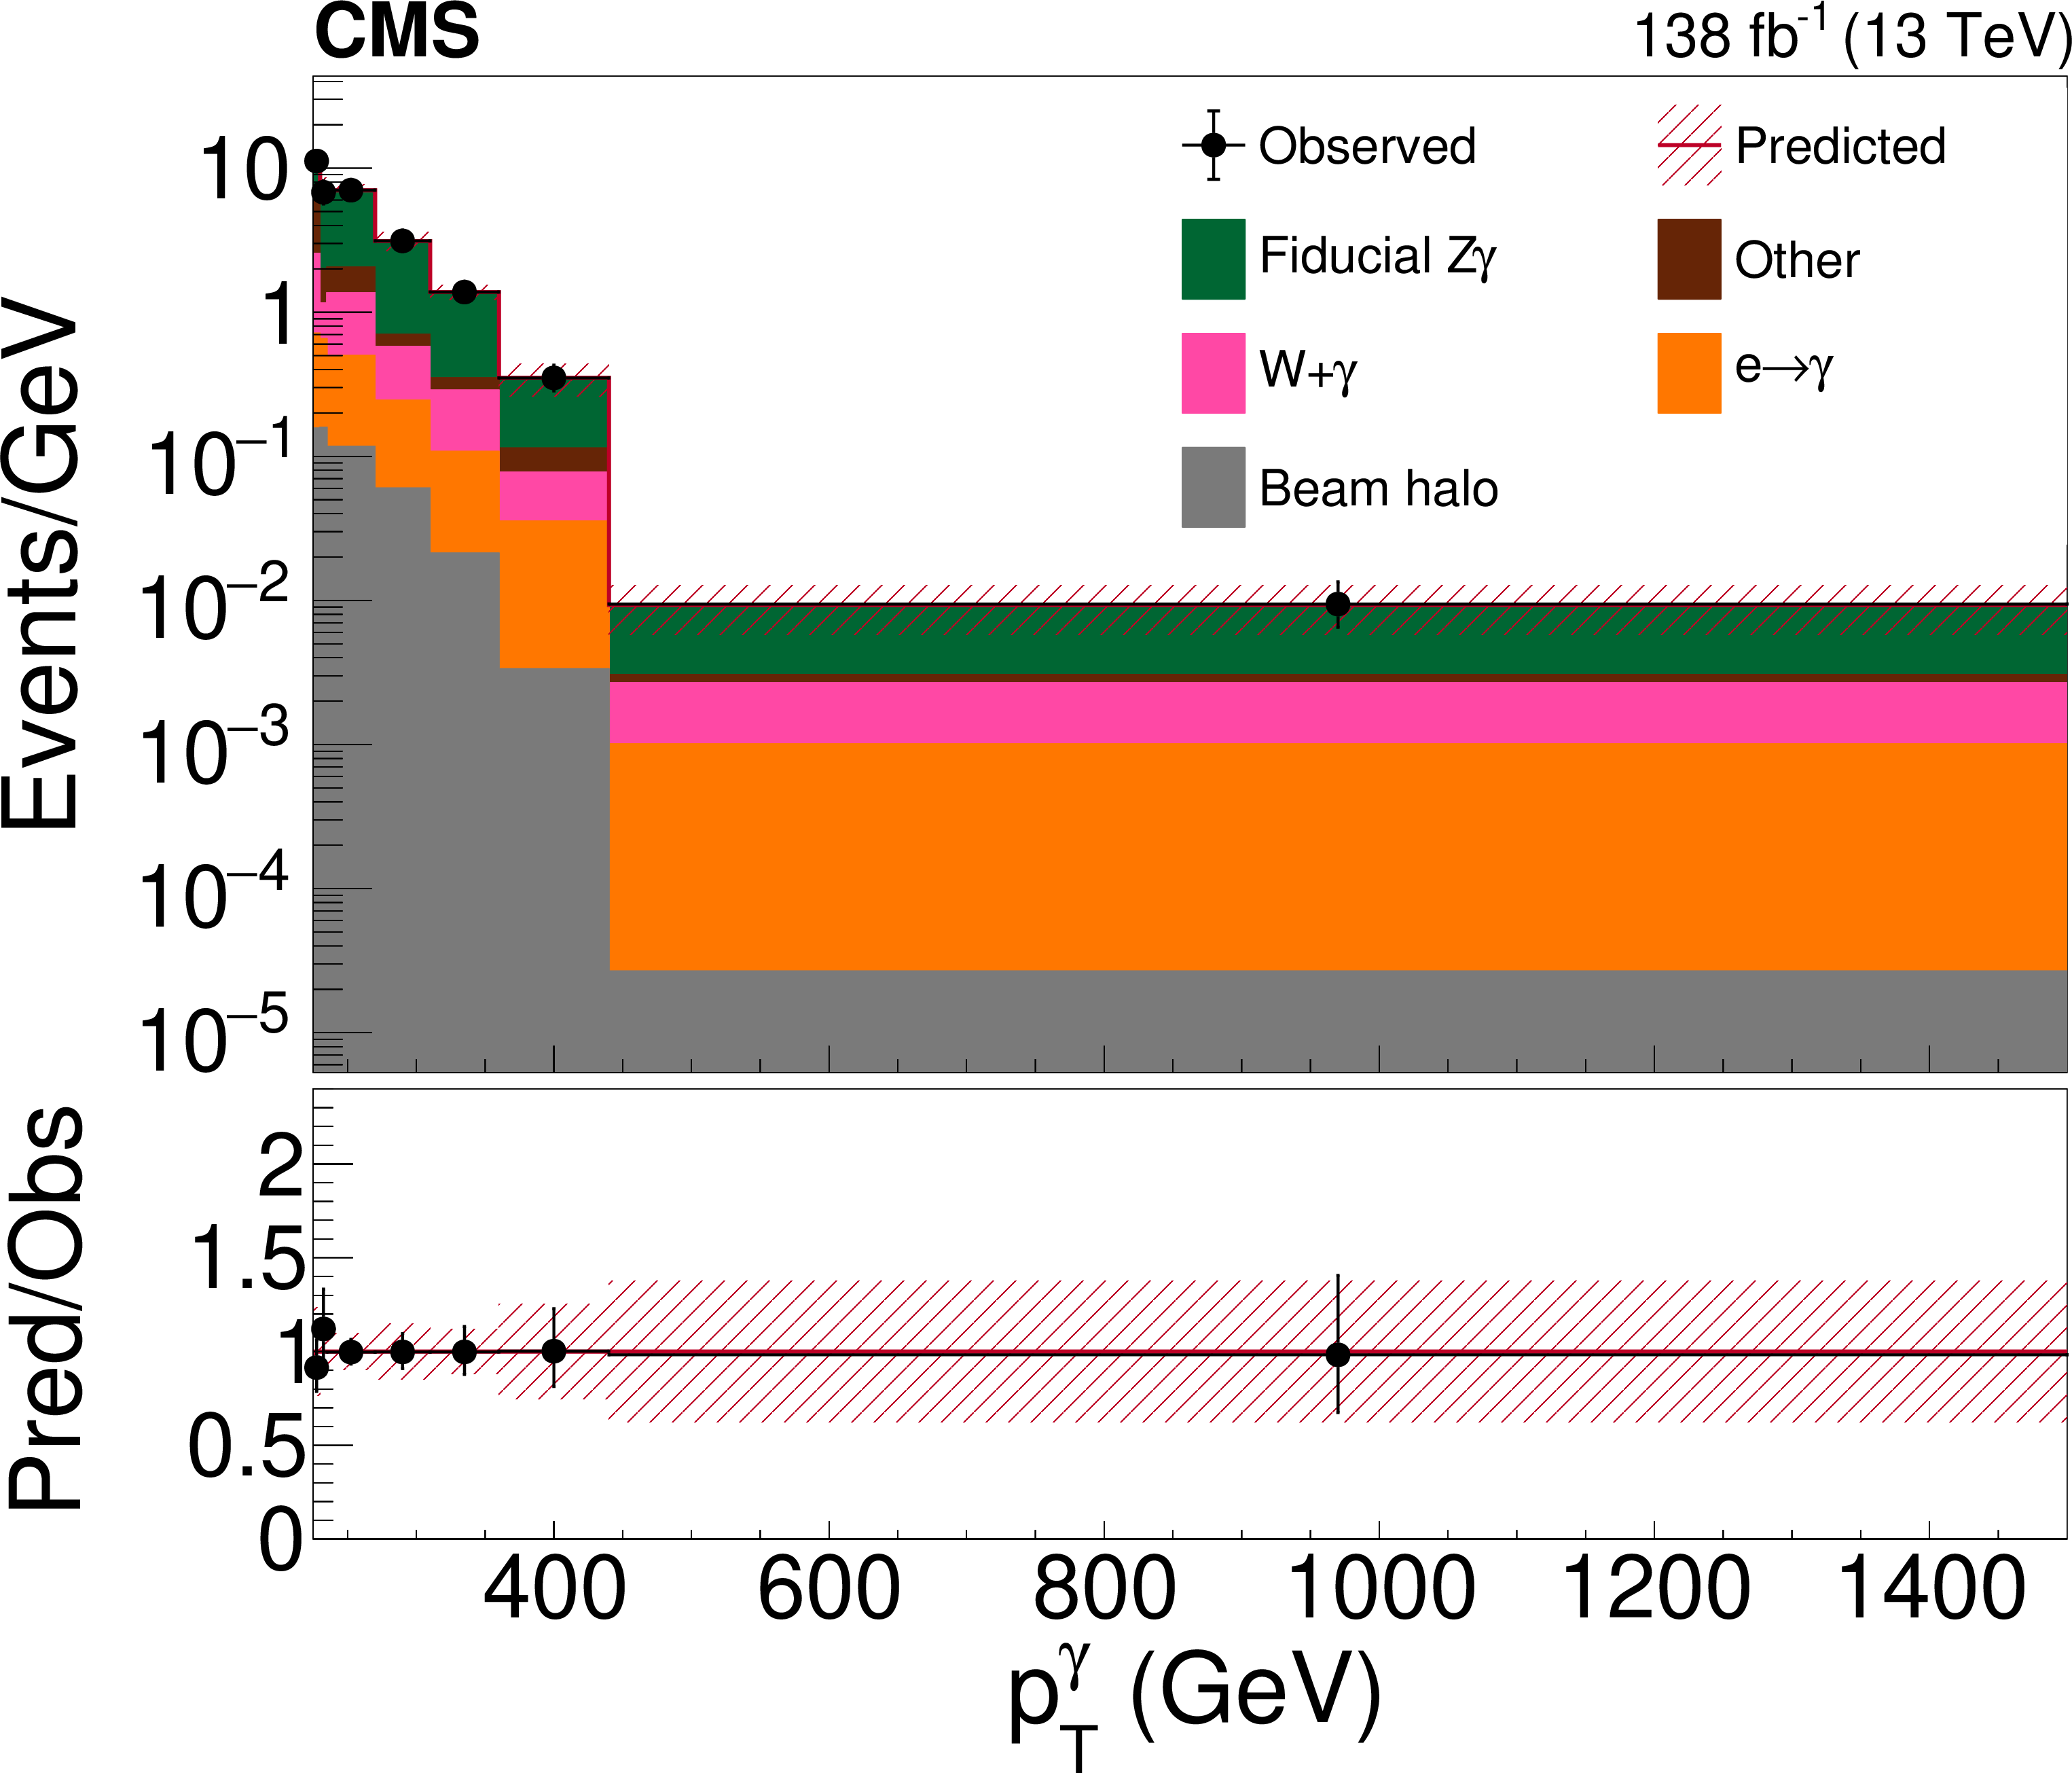
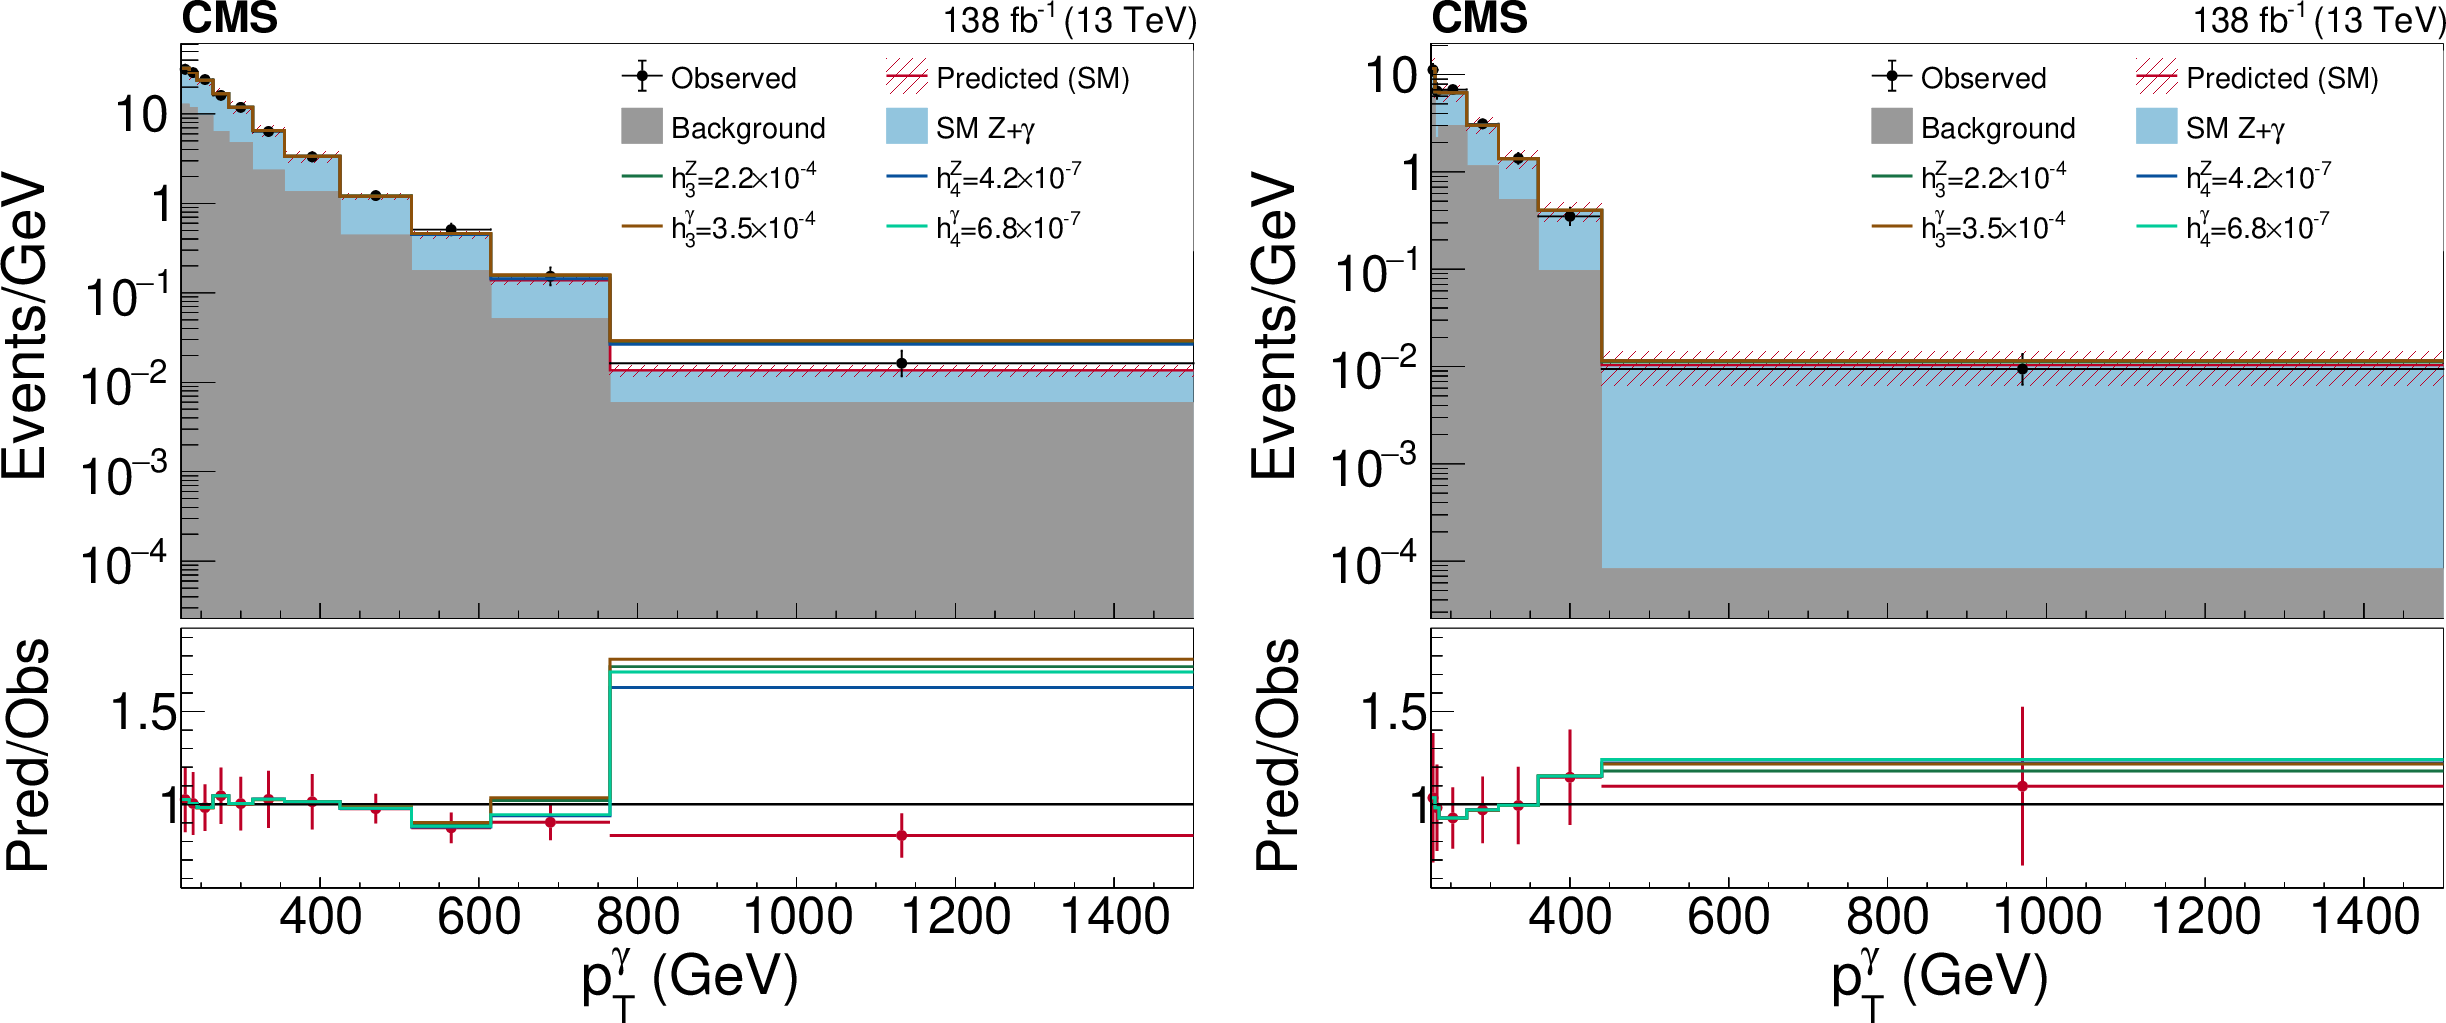
The post-fit reconstruction-level distributions in the signal region after the combined (barrel+endcap) differential cross section fit (left: barrel region, right: endcap region). The Predicted distribution is the full model with all parameters fixed to their post-fit values. Note in particular that the free cross section parameters for the signal are also fixed to their post-fit values and then propagated through the response matrix. The bars on the black data points indicate the statistical uncertainty in the data, while the red band shows the total post-fit model uncertainty. |
png pdf |
Figure 4-a:
The post-fit reconstruction-level distributions in the signal region after the combined (barrel+endcap) differential cross section fit (left: barrel region, right: endcap region). The Predicted distribution is the full model with all parameters fixed to their post-fit values. Note in particular that the free cross section parameters for the signal are also fixed to their post-fit values and then propagated through the response matrix. The bars on the black data points indicate the statistical uncertainty in the data, while the red band shows the total post-fit model uncertainty. |
png pdf |
Figure 4-b:
The post-fit reconstruction-level distributions in the signal region after the combined (barrel+endcap) differential cross section fit (left: barrel region, right: endcap region). The Predicted distribution is the full model with all parameters fixed to their post-fit values. Note in particular that the free cross section parameters for the signal are also fixed to their post-fit values and then propagated through the response matrix. The bars on the black data points indicate the statistical uncertainty in the data, while the red band shows the total post-fit model uncertainty. |
png pdf |
Figure 5:
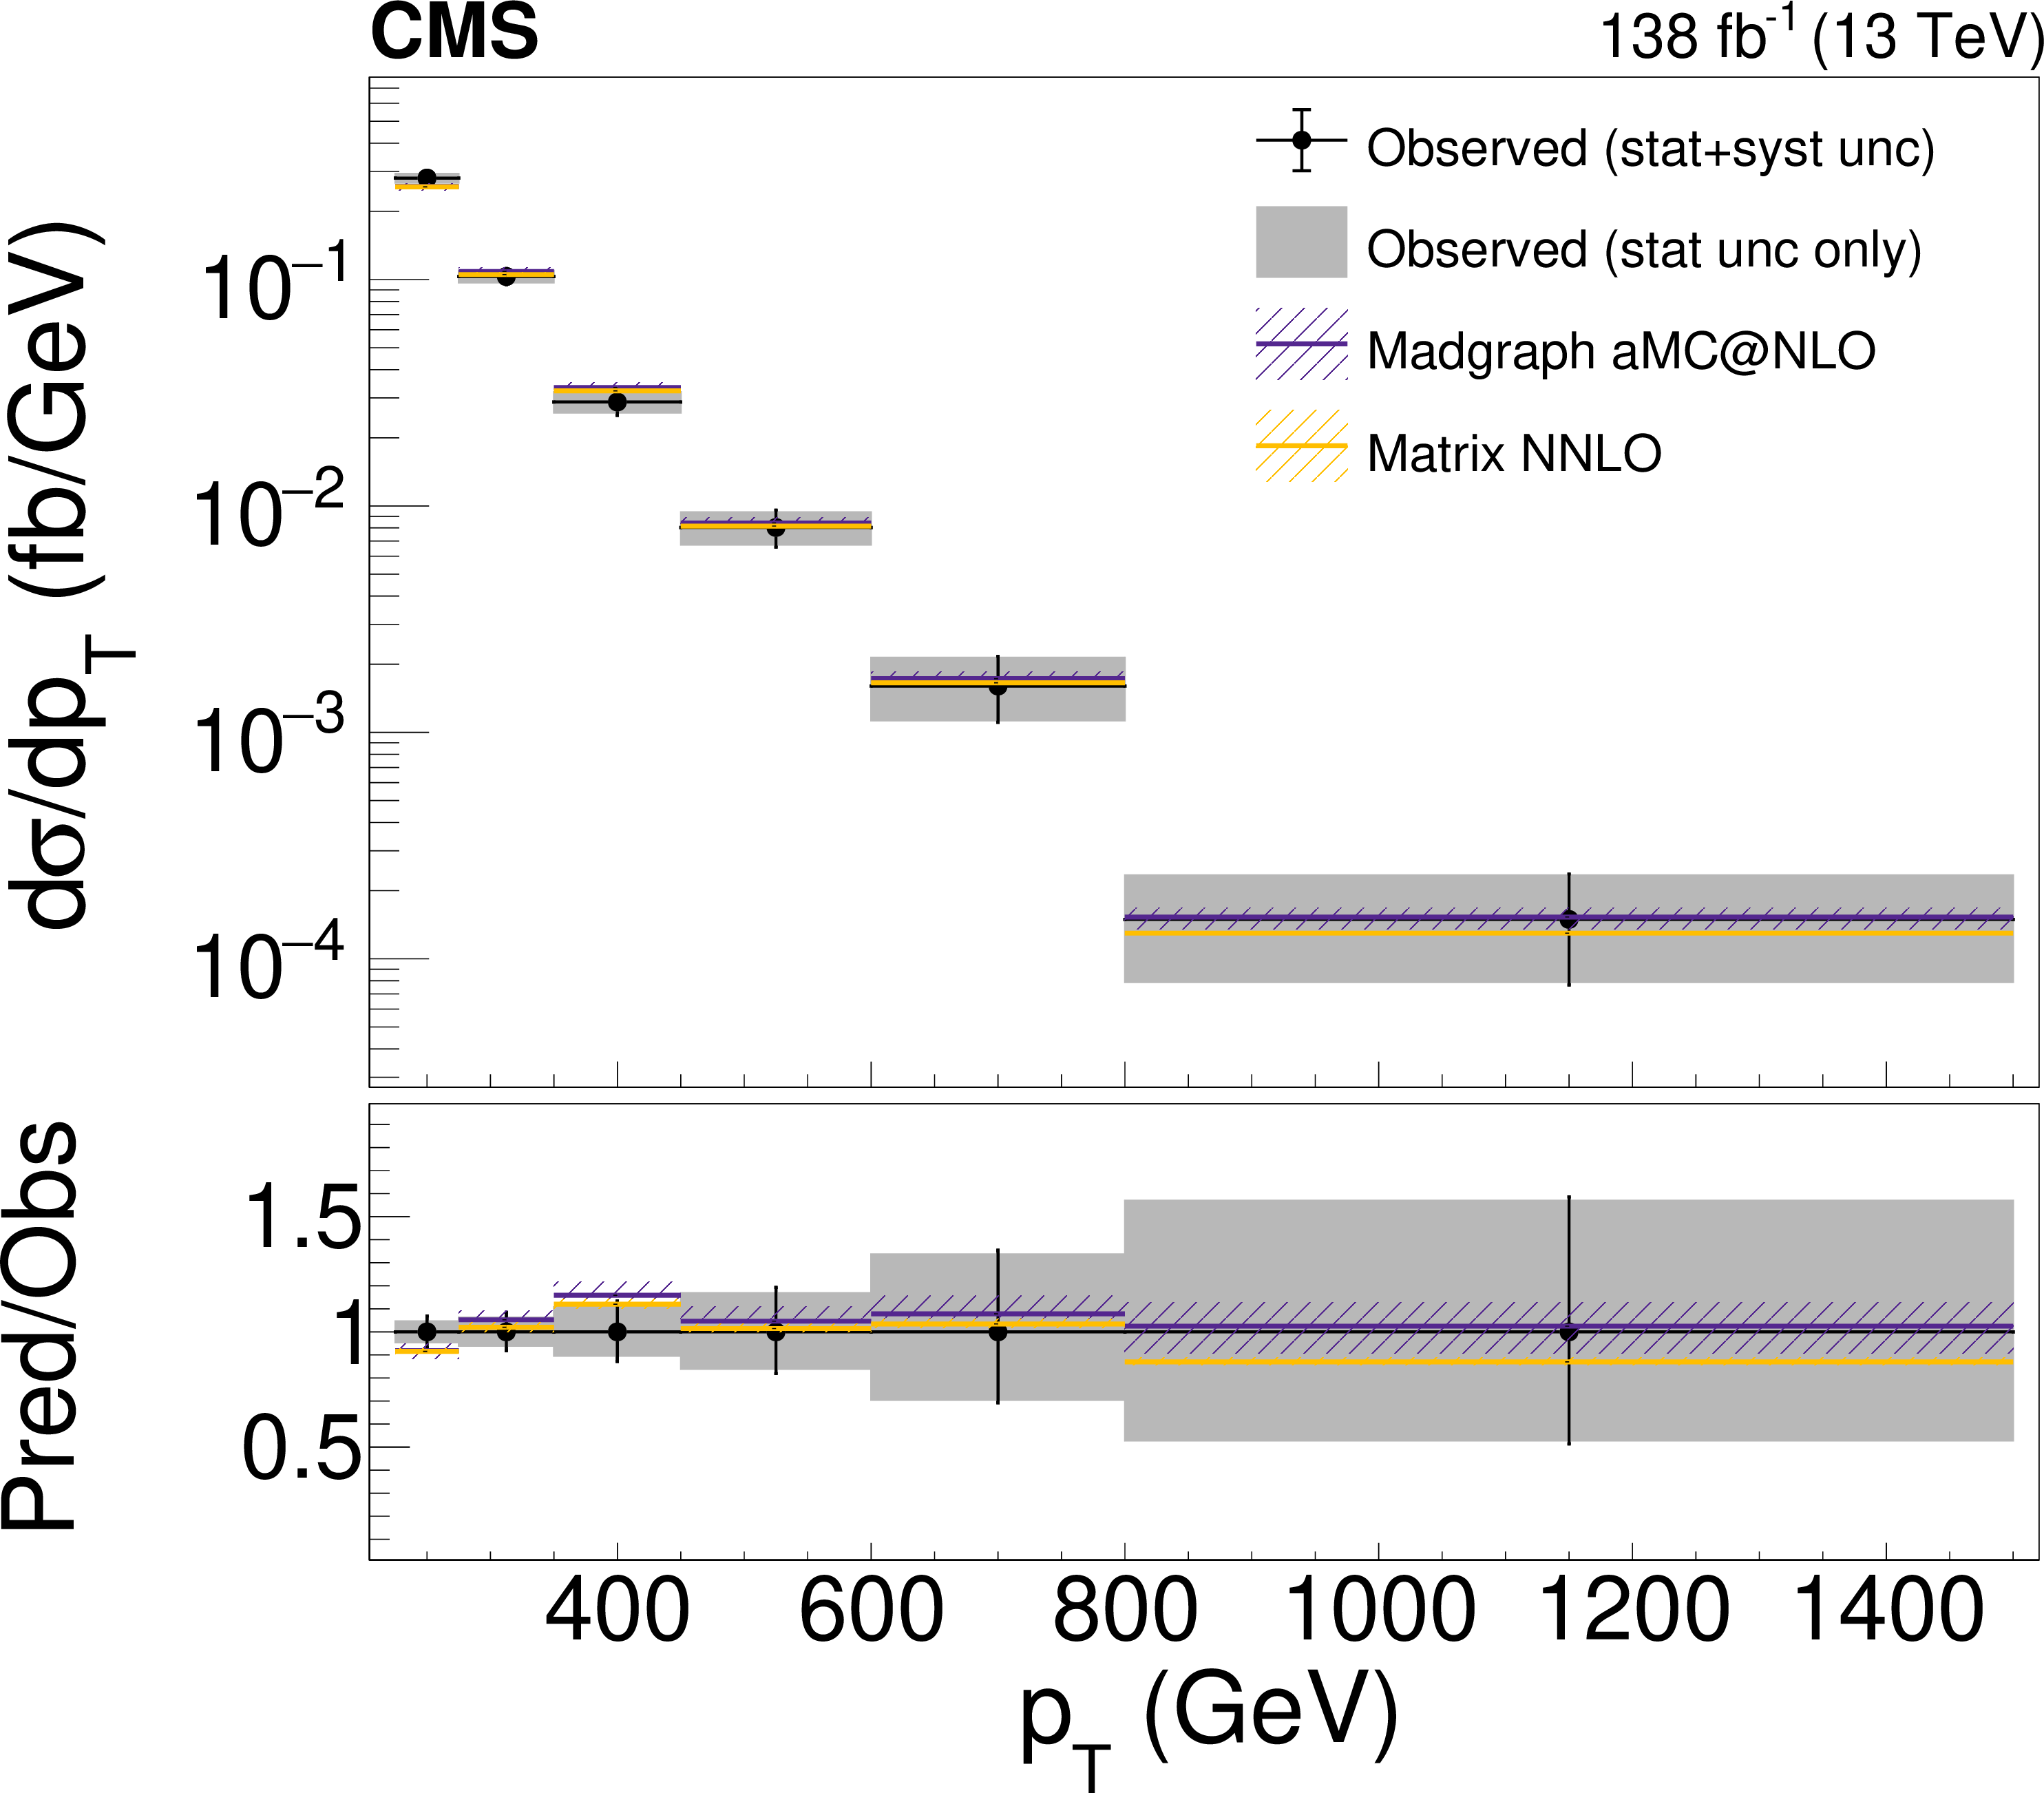
Measured and predicted differential cross sections as function of $ p_{\mathrm{T}}^{\gamma} $ for the combined fiducial phase space. The colored bands associated with the predictions indicate the theoretical uncertainties associated with the MadGraph-5\_aMC@NLO and MATRIX generators. For the measured cross sections, the grey band indicates the statistical uncertainty of the fit, while the error bars on the black data points indicate the total uncertainty of the fit, including both statistical and systematic components. |
png pdf |
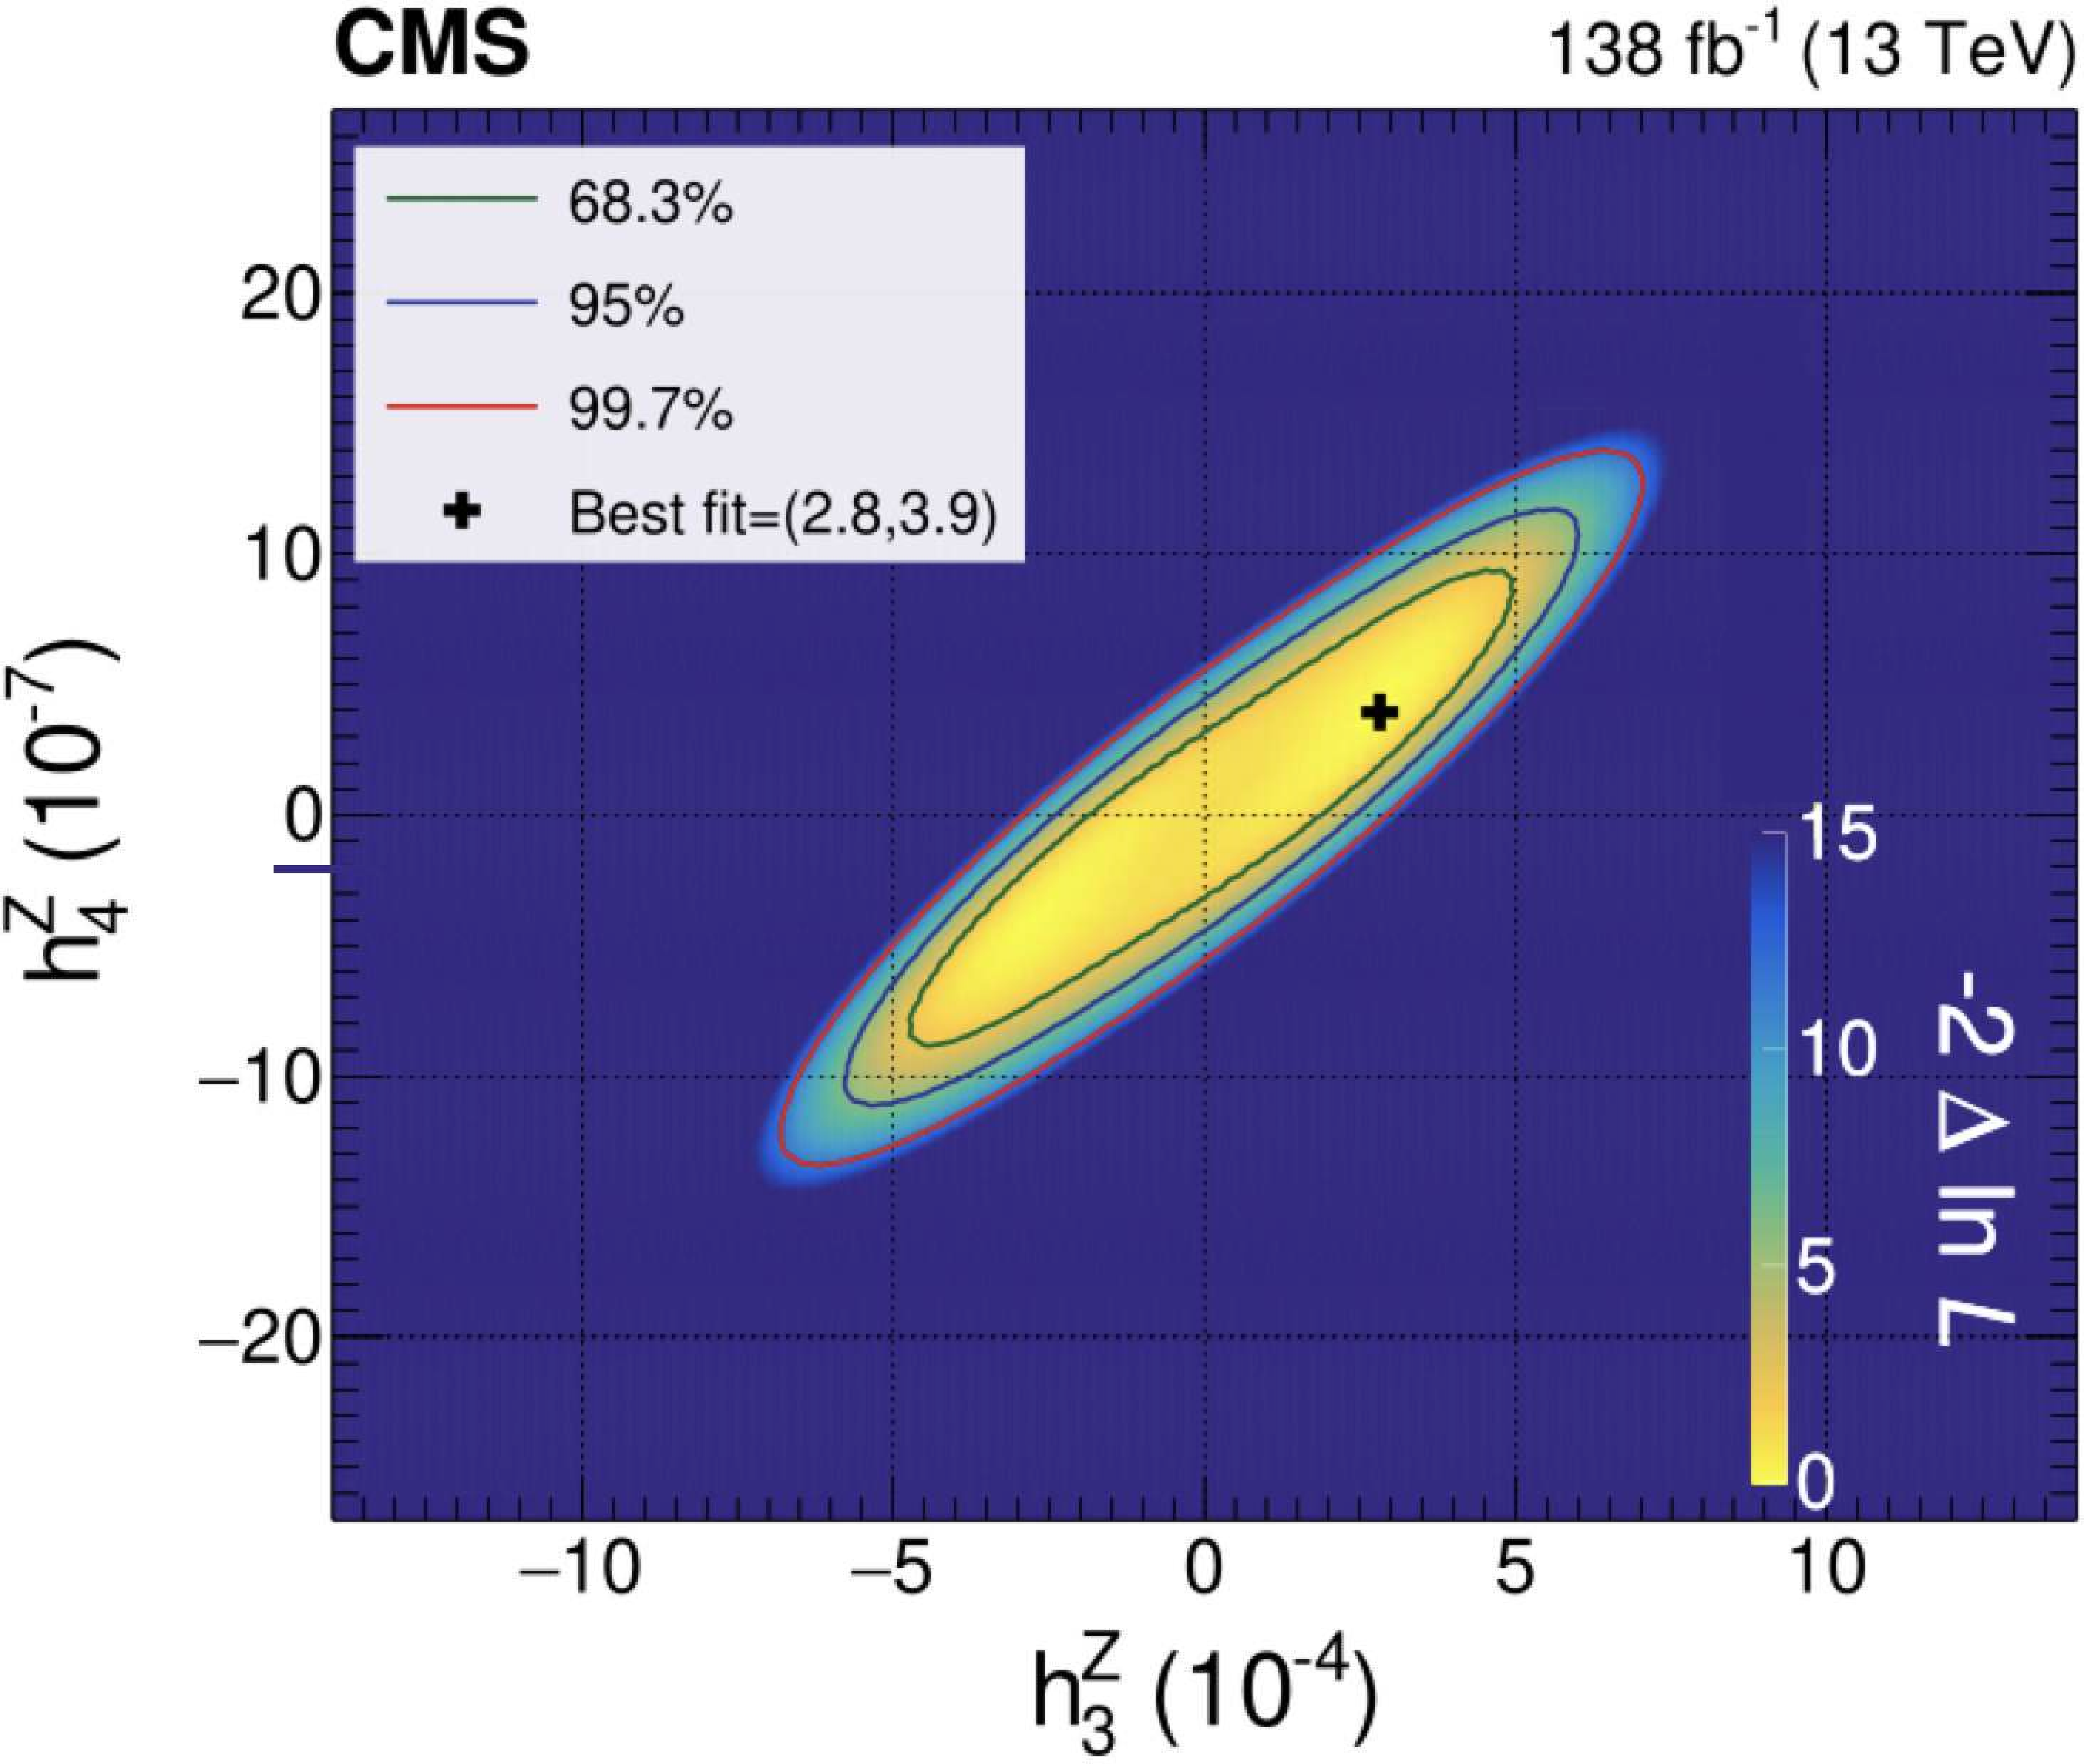
Figure 6:
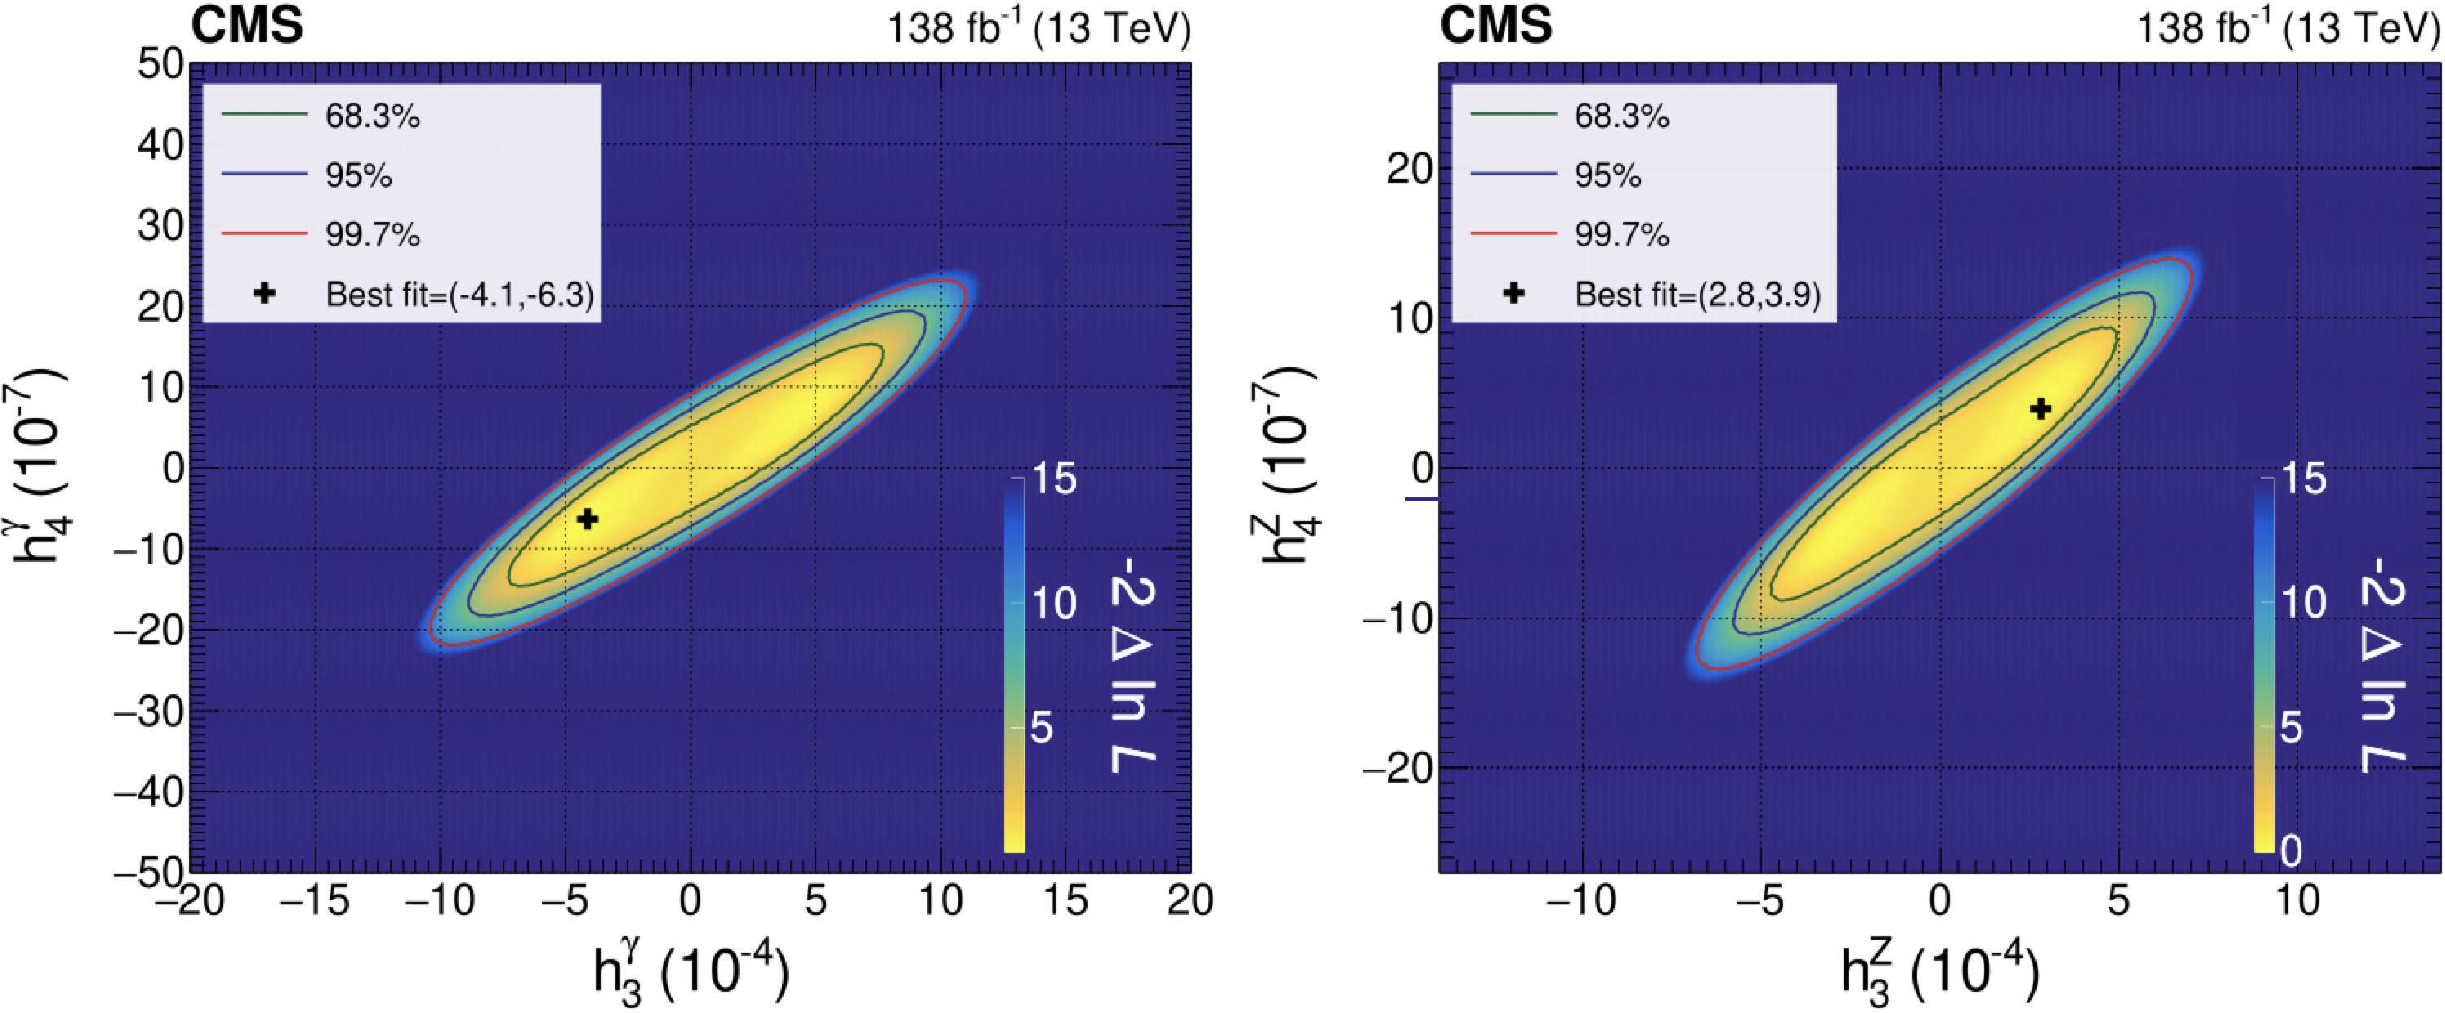
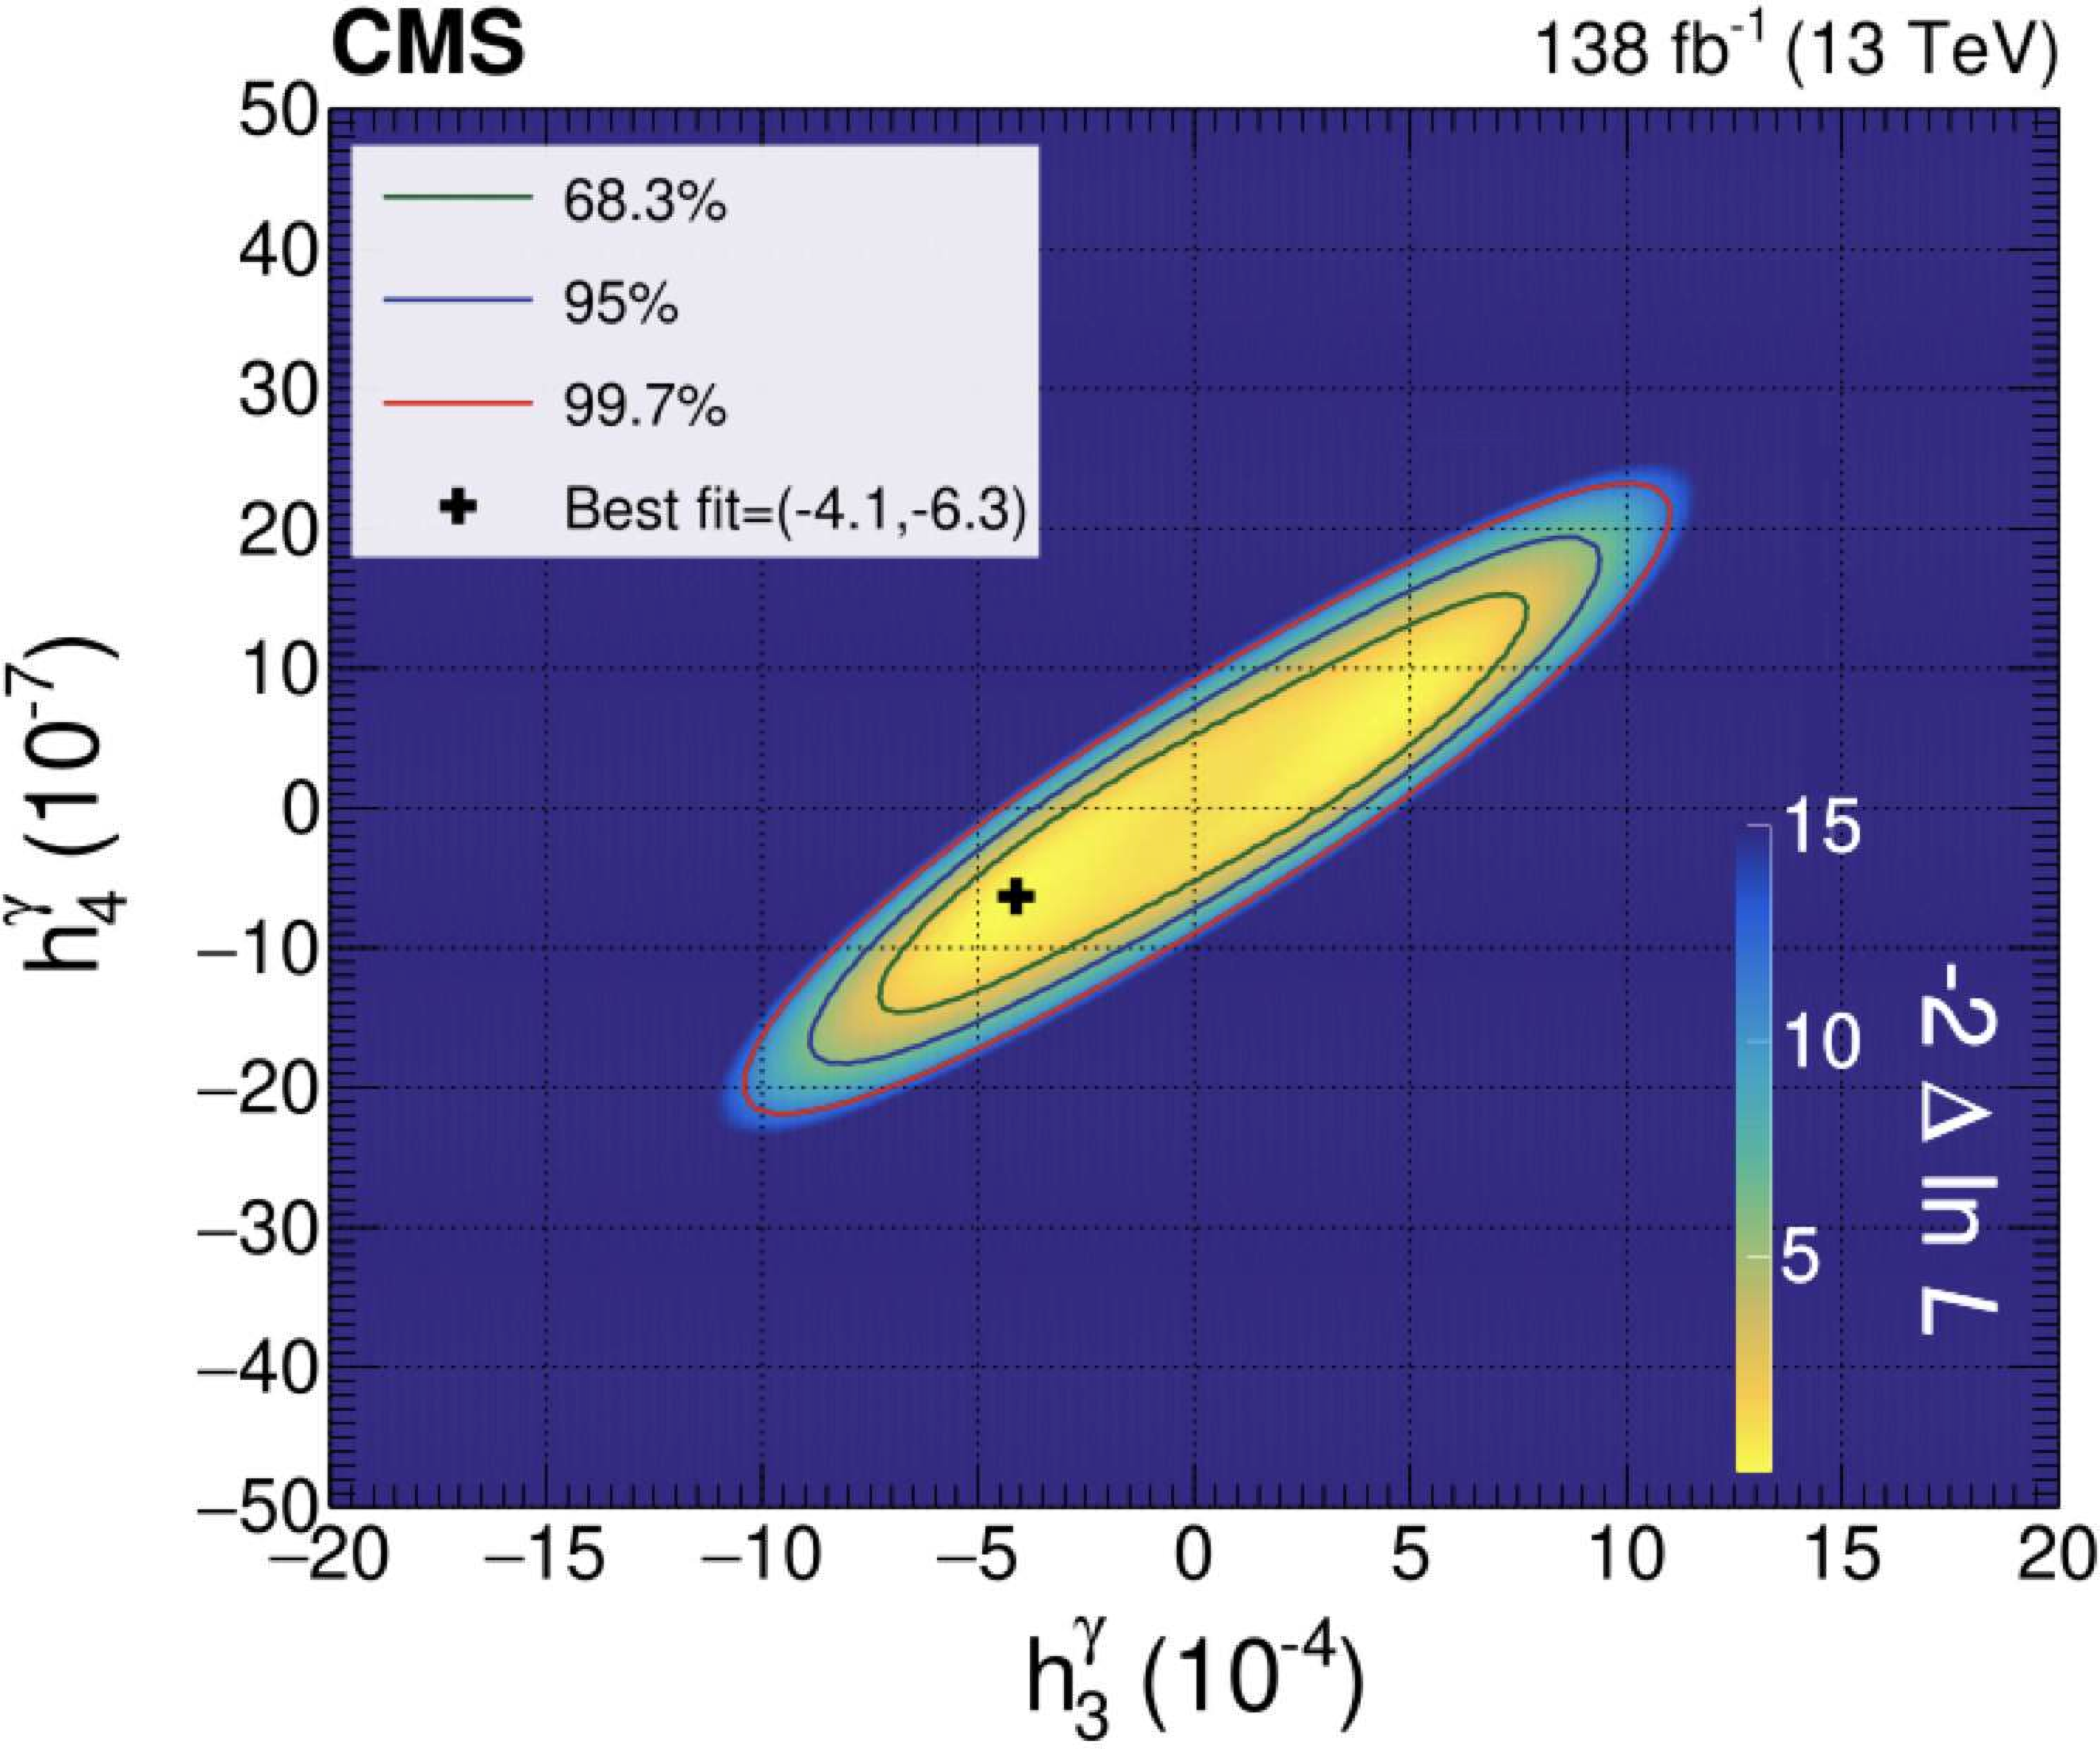
Confidence contours of the aNTGC parameters $ h_3^\gamma, h_4^\gamma $ (left) and $ h_3^\mathrm{Z}, h_4^\mathrm{Z} $ (right) with the best fit points, which are the local minima of the negative log likelihood. |
png pdf |
Figure 6-a:
Confidence contours of the aNTGC parameters $ h_3^\gamma, h_4^\gamma $ (left) and $ h_3^\mathrm{Z}, h_4^\mathrm{Z} $ (right) with the best fit points, which are the local minima of the negative log likelihood. |
png pdf |
Figure 6-b:
Confidence contours of the aNTGC parameters $ h_3^\gamma, h_4^\gamma $ (left) and $ h_3^\mathrm{Z}, h_4^\mathrm{Z} $ (right) with the best fit points, which are the local minima of the negative log likelihood. |
png pdf |
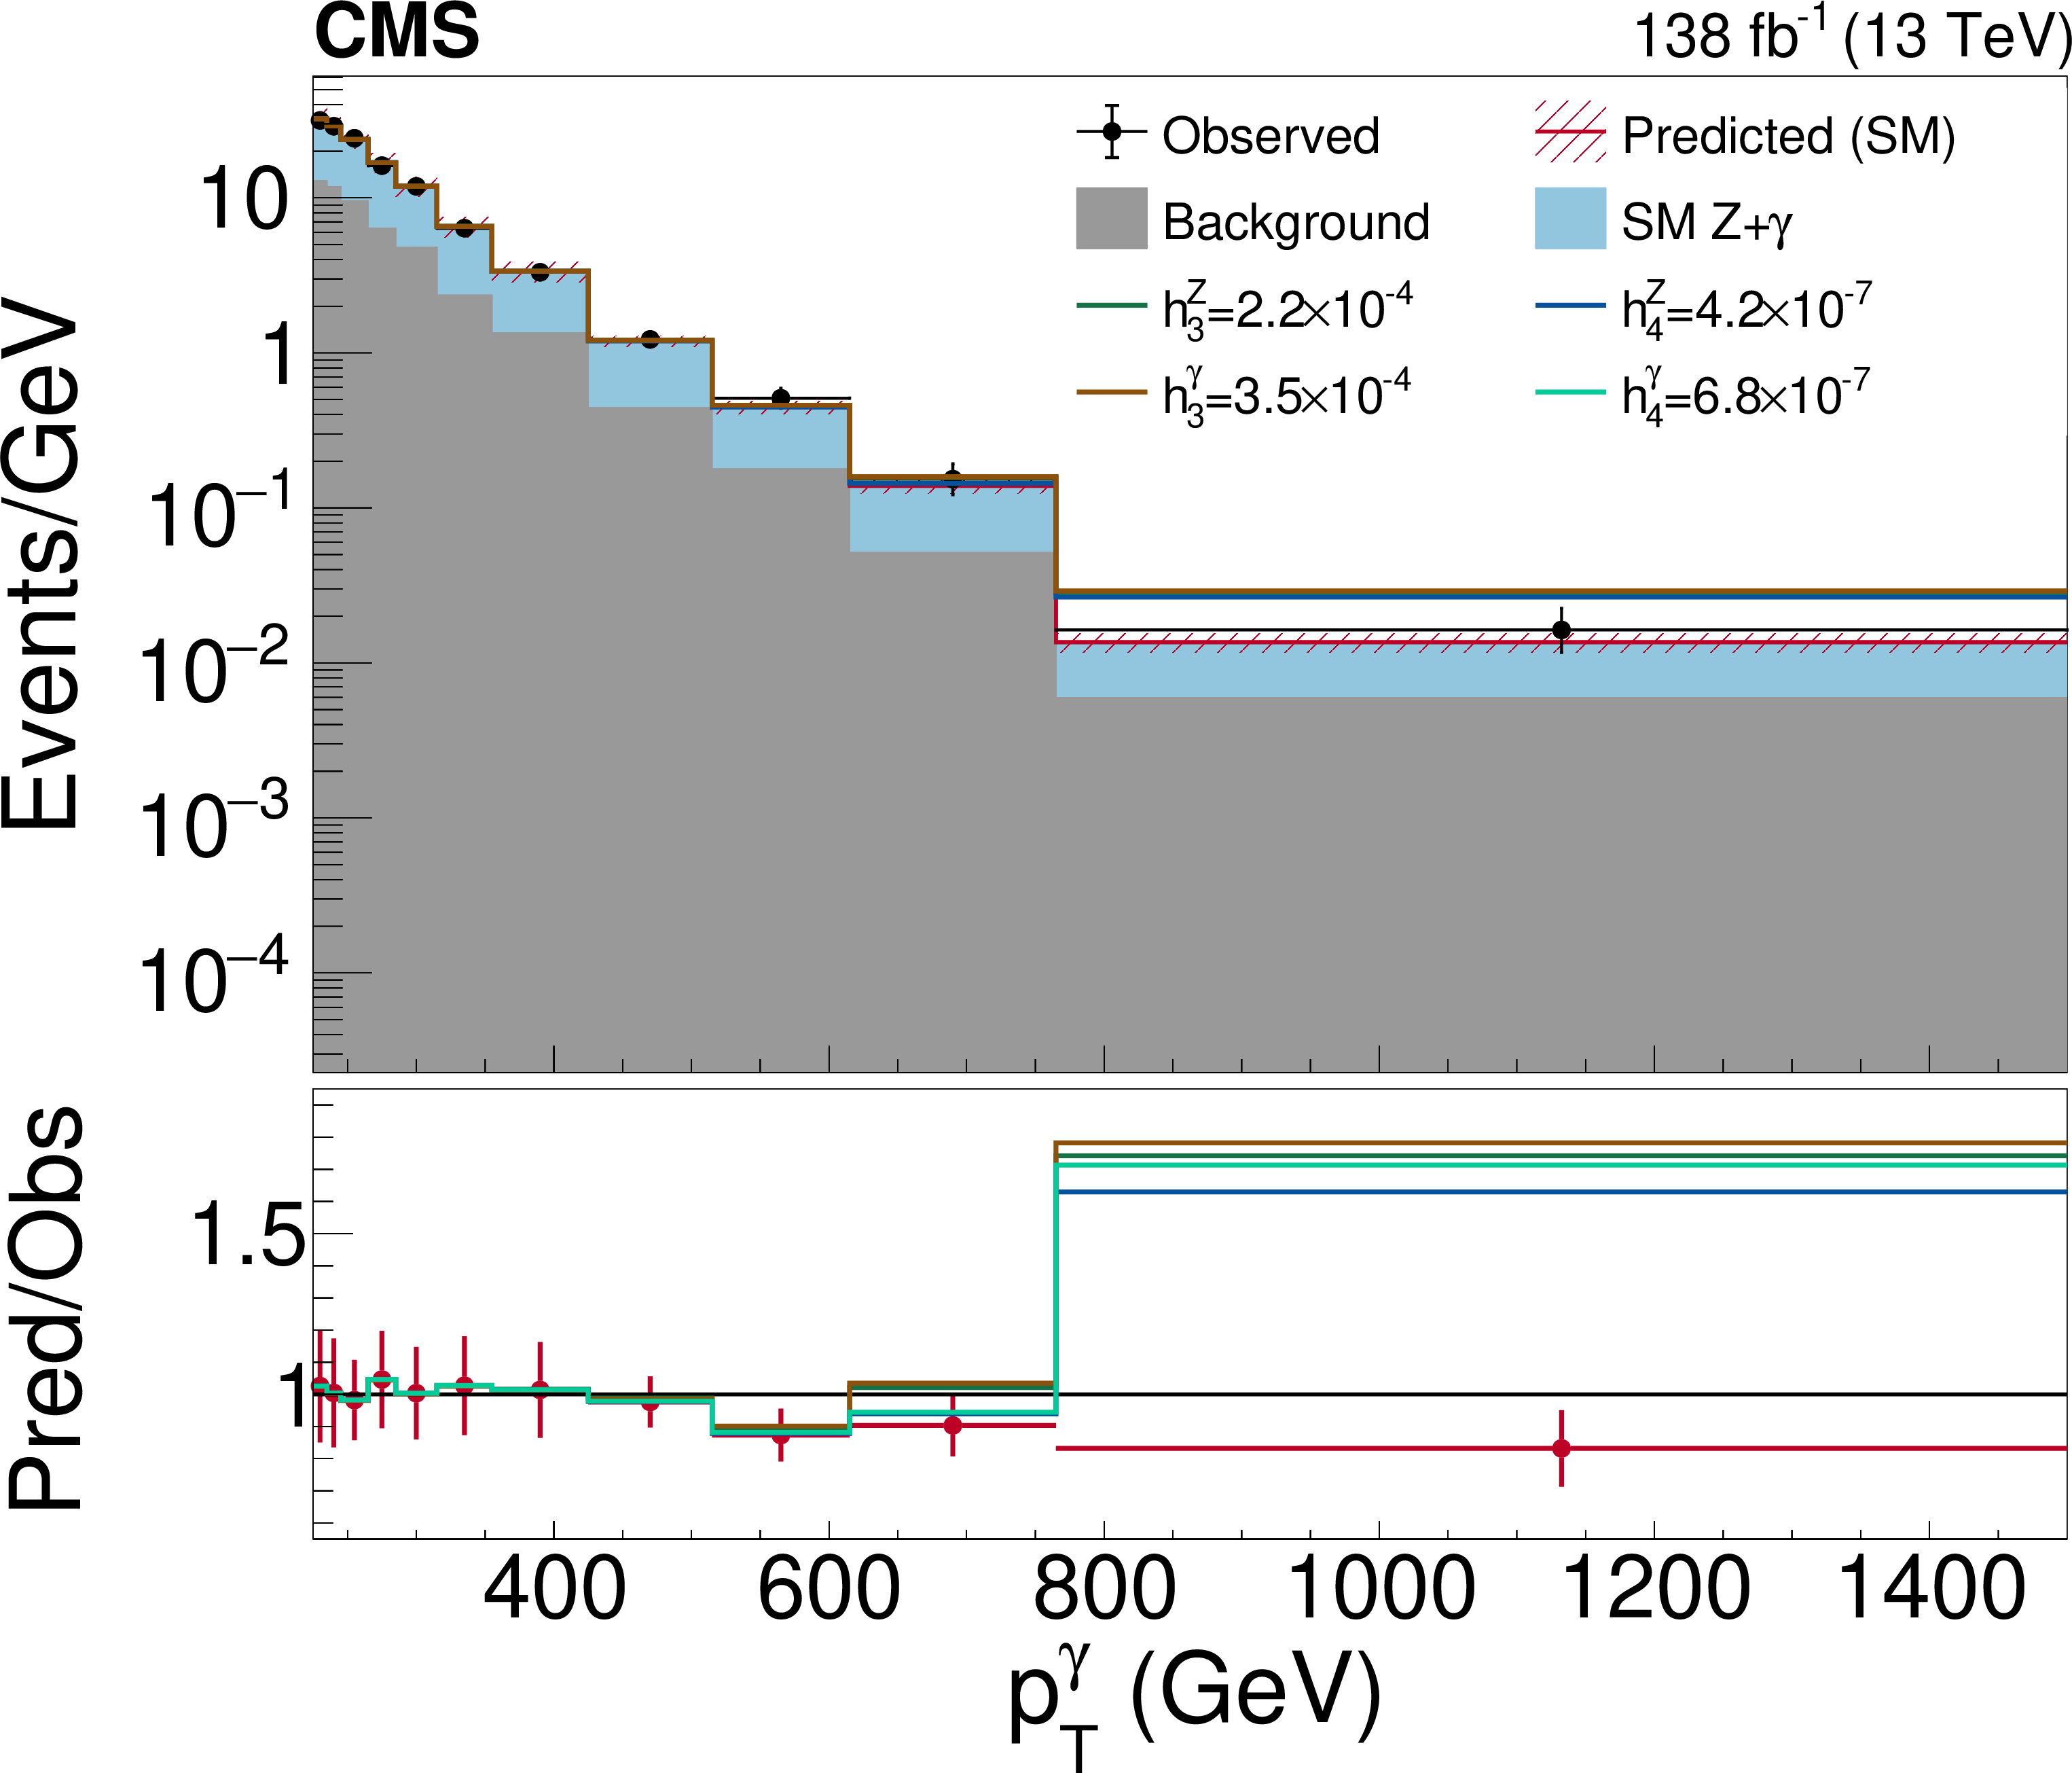
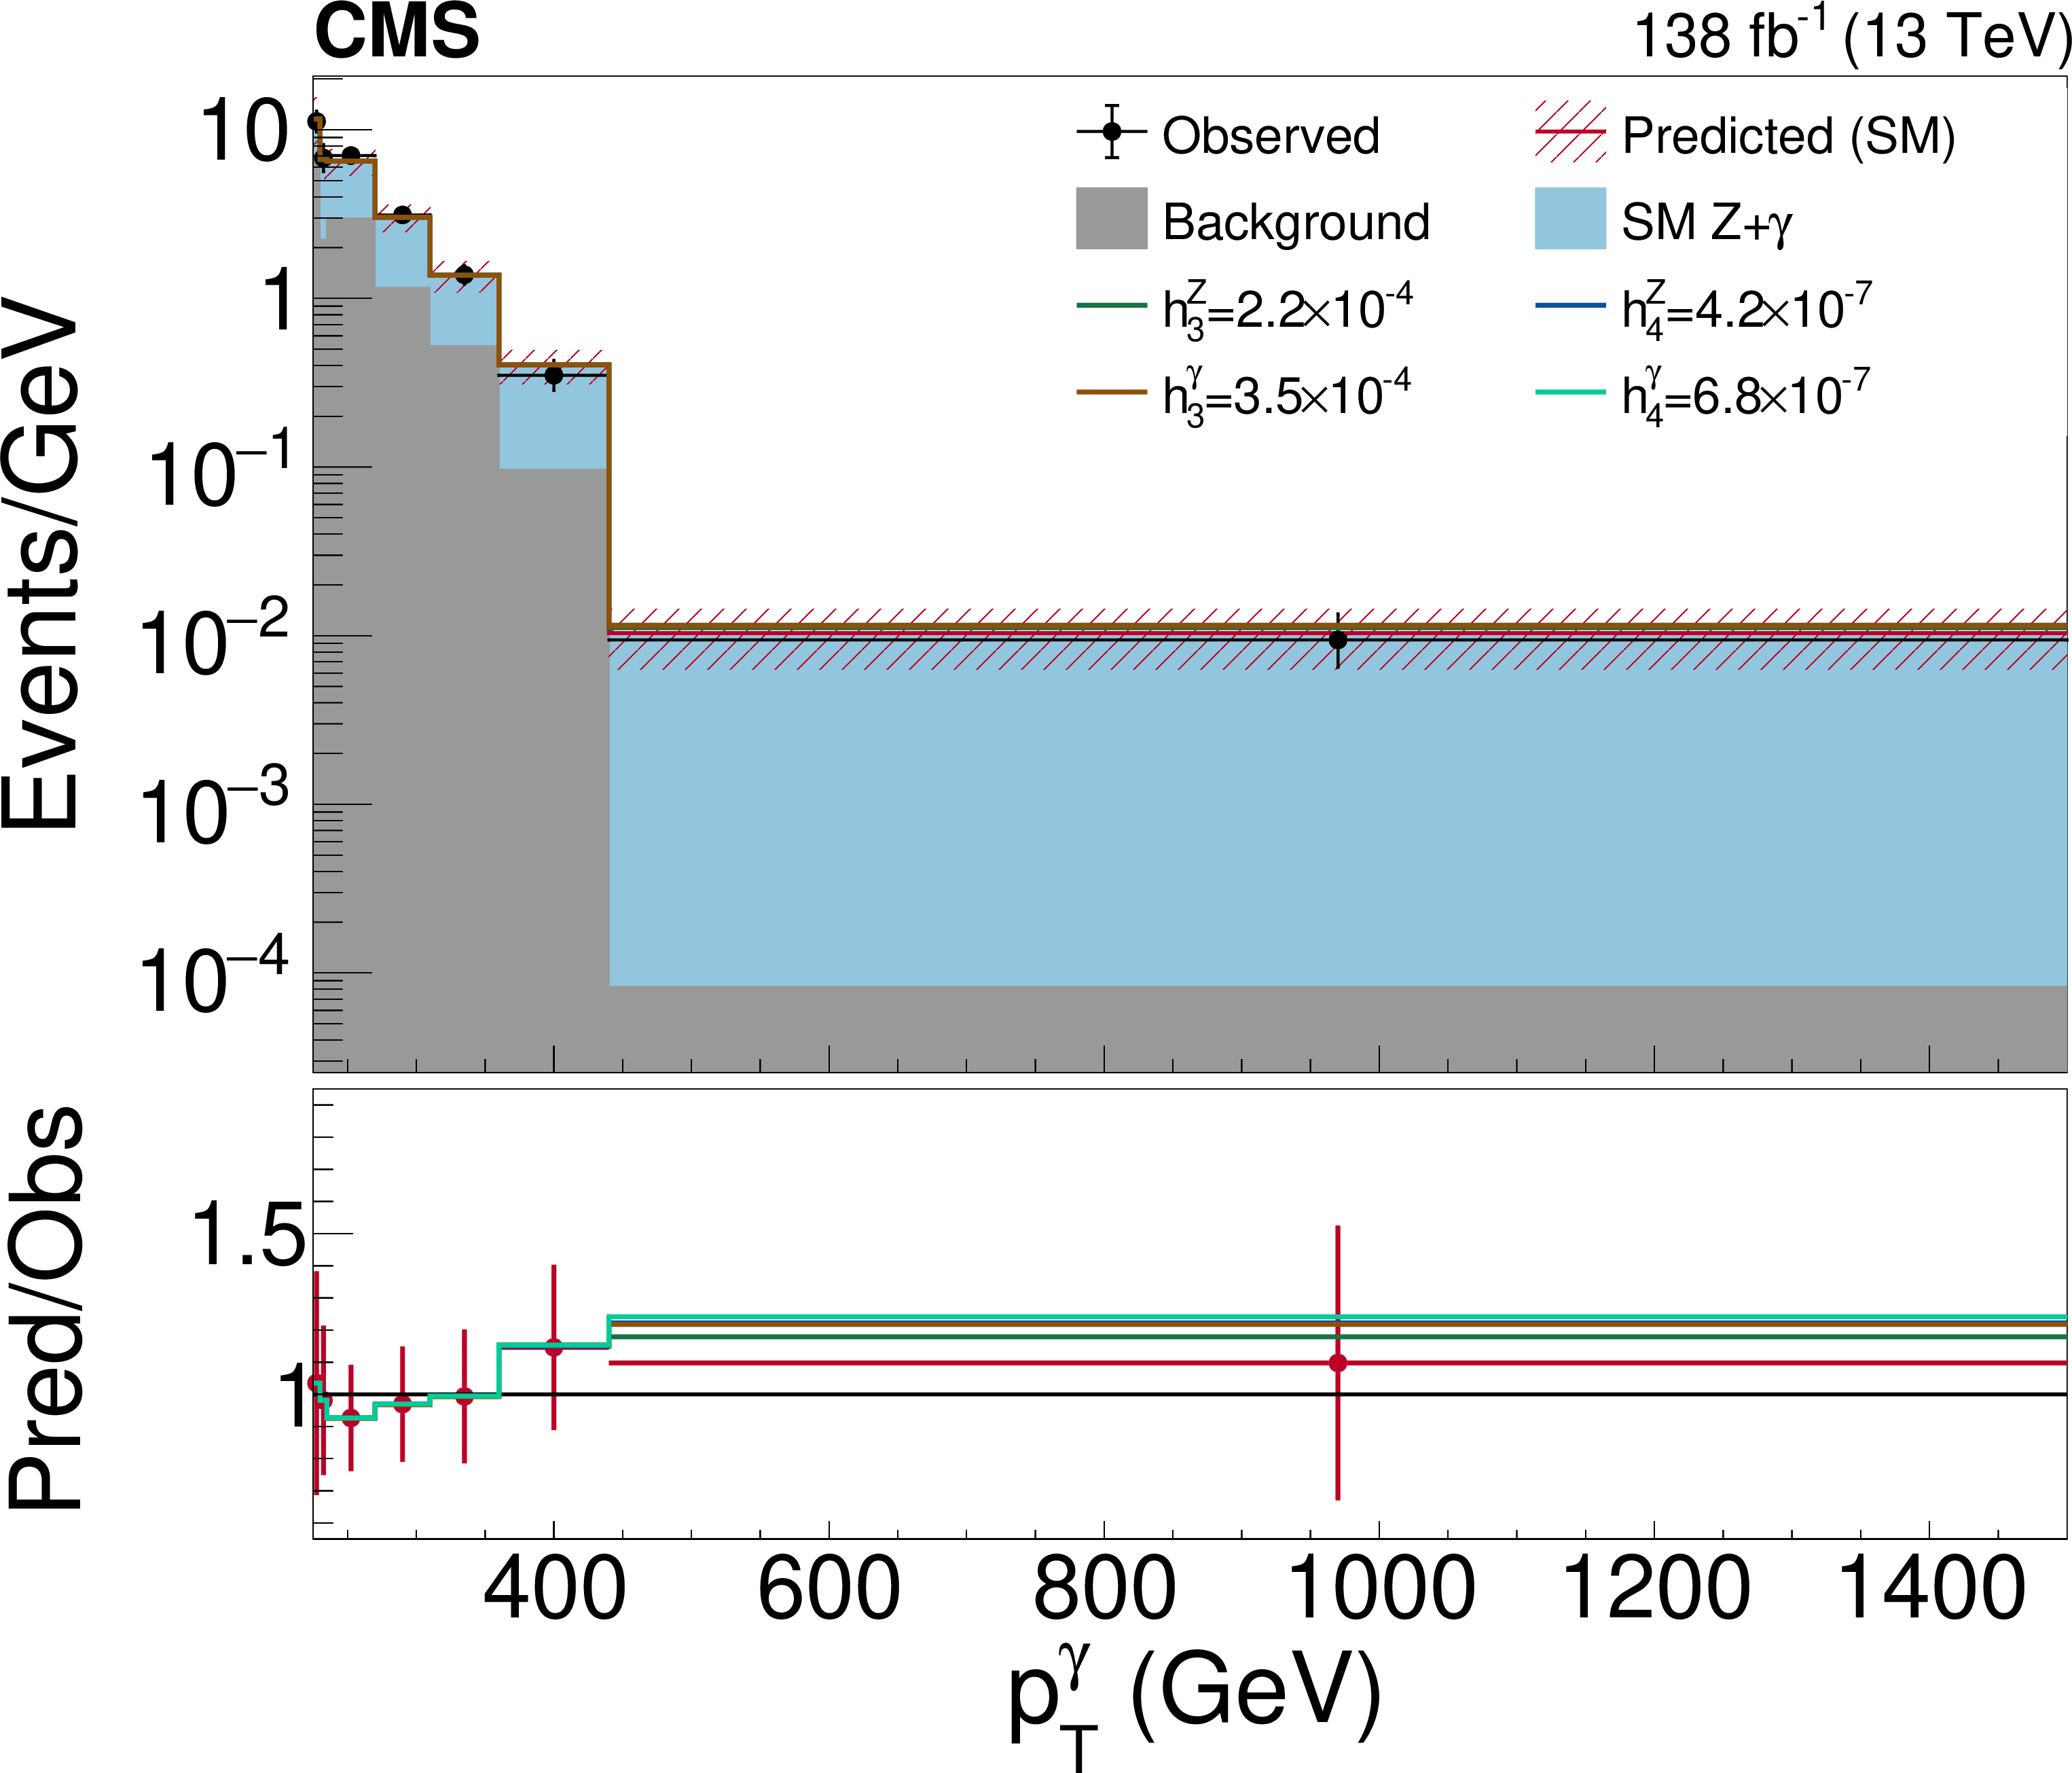
Figure 7:
Comparison of the predicted distribution of $ p_{\mathrm{T}}^{\gamma} $ under the SM-only hypothesis in the barrel (left), and in the endcaps (right) phase space with the predictions at the upper boundaries of the observed 1D confidence intervals of the coupling parameters. The lower panels compare the SM (shown in red) and the aNTGC predictions, with the observed $ p_{\mathrm{T}}^{\gamma} $ distribution (shown in black). The error bars in both the upper and the lower panels are statistical only. |
png pdf |
Figure 7-a:
Comparison of the predicted distribution of $ p_{\mathrm{T}}^{\gamma} $ under the SM-only hypothesis in the barrel (left), and in the endcaps (right) phase space with the predictions at the upper boundaries of the observed 1D confidence intervals of the coupling parameters. The lower panels compare the SM (shown in red) and the aNTGC predictions, with the observed $ p_{\mathrm{T}}^{\gamma} $ distribution (shown in black). The error bars in both the upper and the lower panels are statistical only. |
png pdf |
Figure 7-b:
Comparison of the predicted distribution of $ p_{\mathrm{T}}^{\gamma} $ under the SM-only hypothesis in the barrel (left), and in the endcaps (right) phase space with the predictions at the upper boundaries of the observed 1D confidence intervals of the coupling parameters. The lower panels compare the SM (shown in red) and the aNTGC predictions, with the observed $ p_{\mathrm{T}}^{\gamma} $ distribution (shown in black). The error bars in both the upper and the lower panels are statistical only. |
| Tables | |
png pdf |
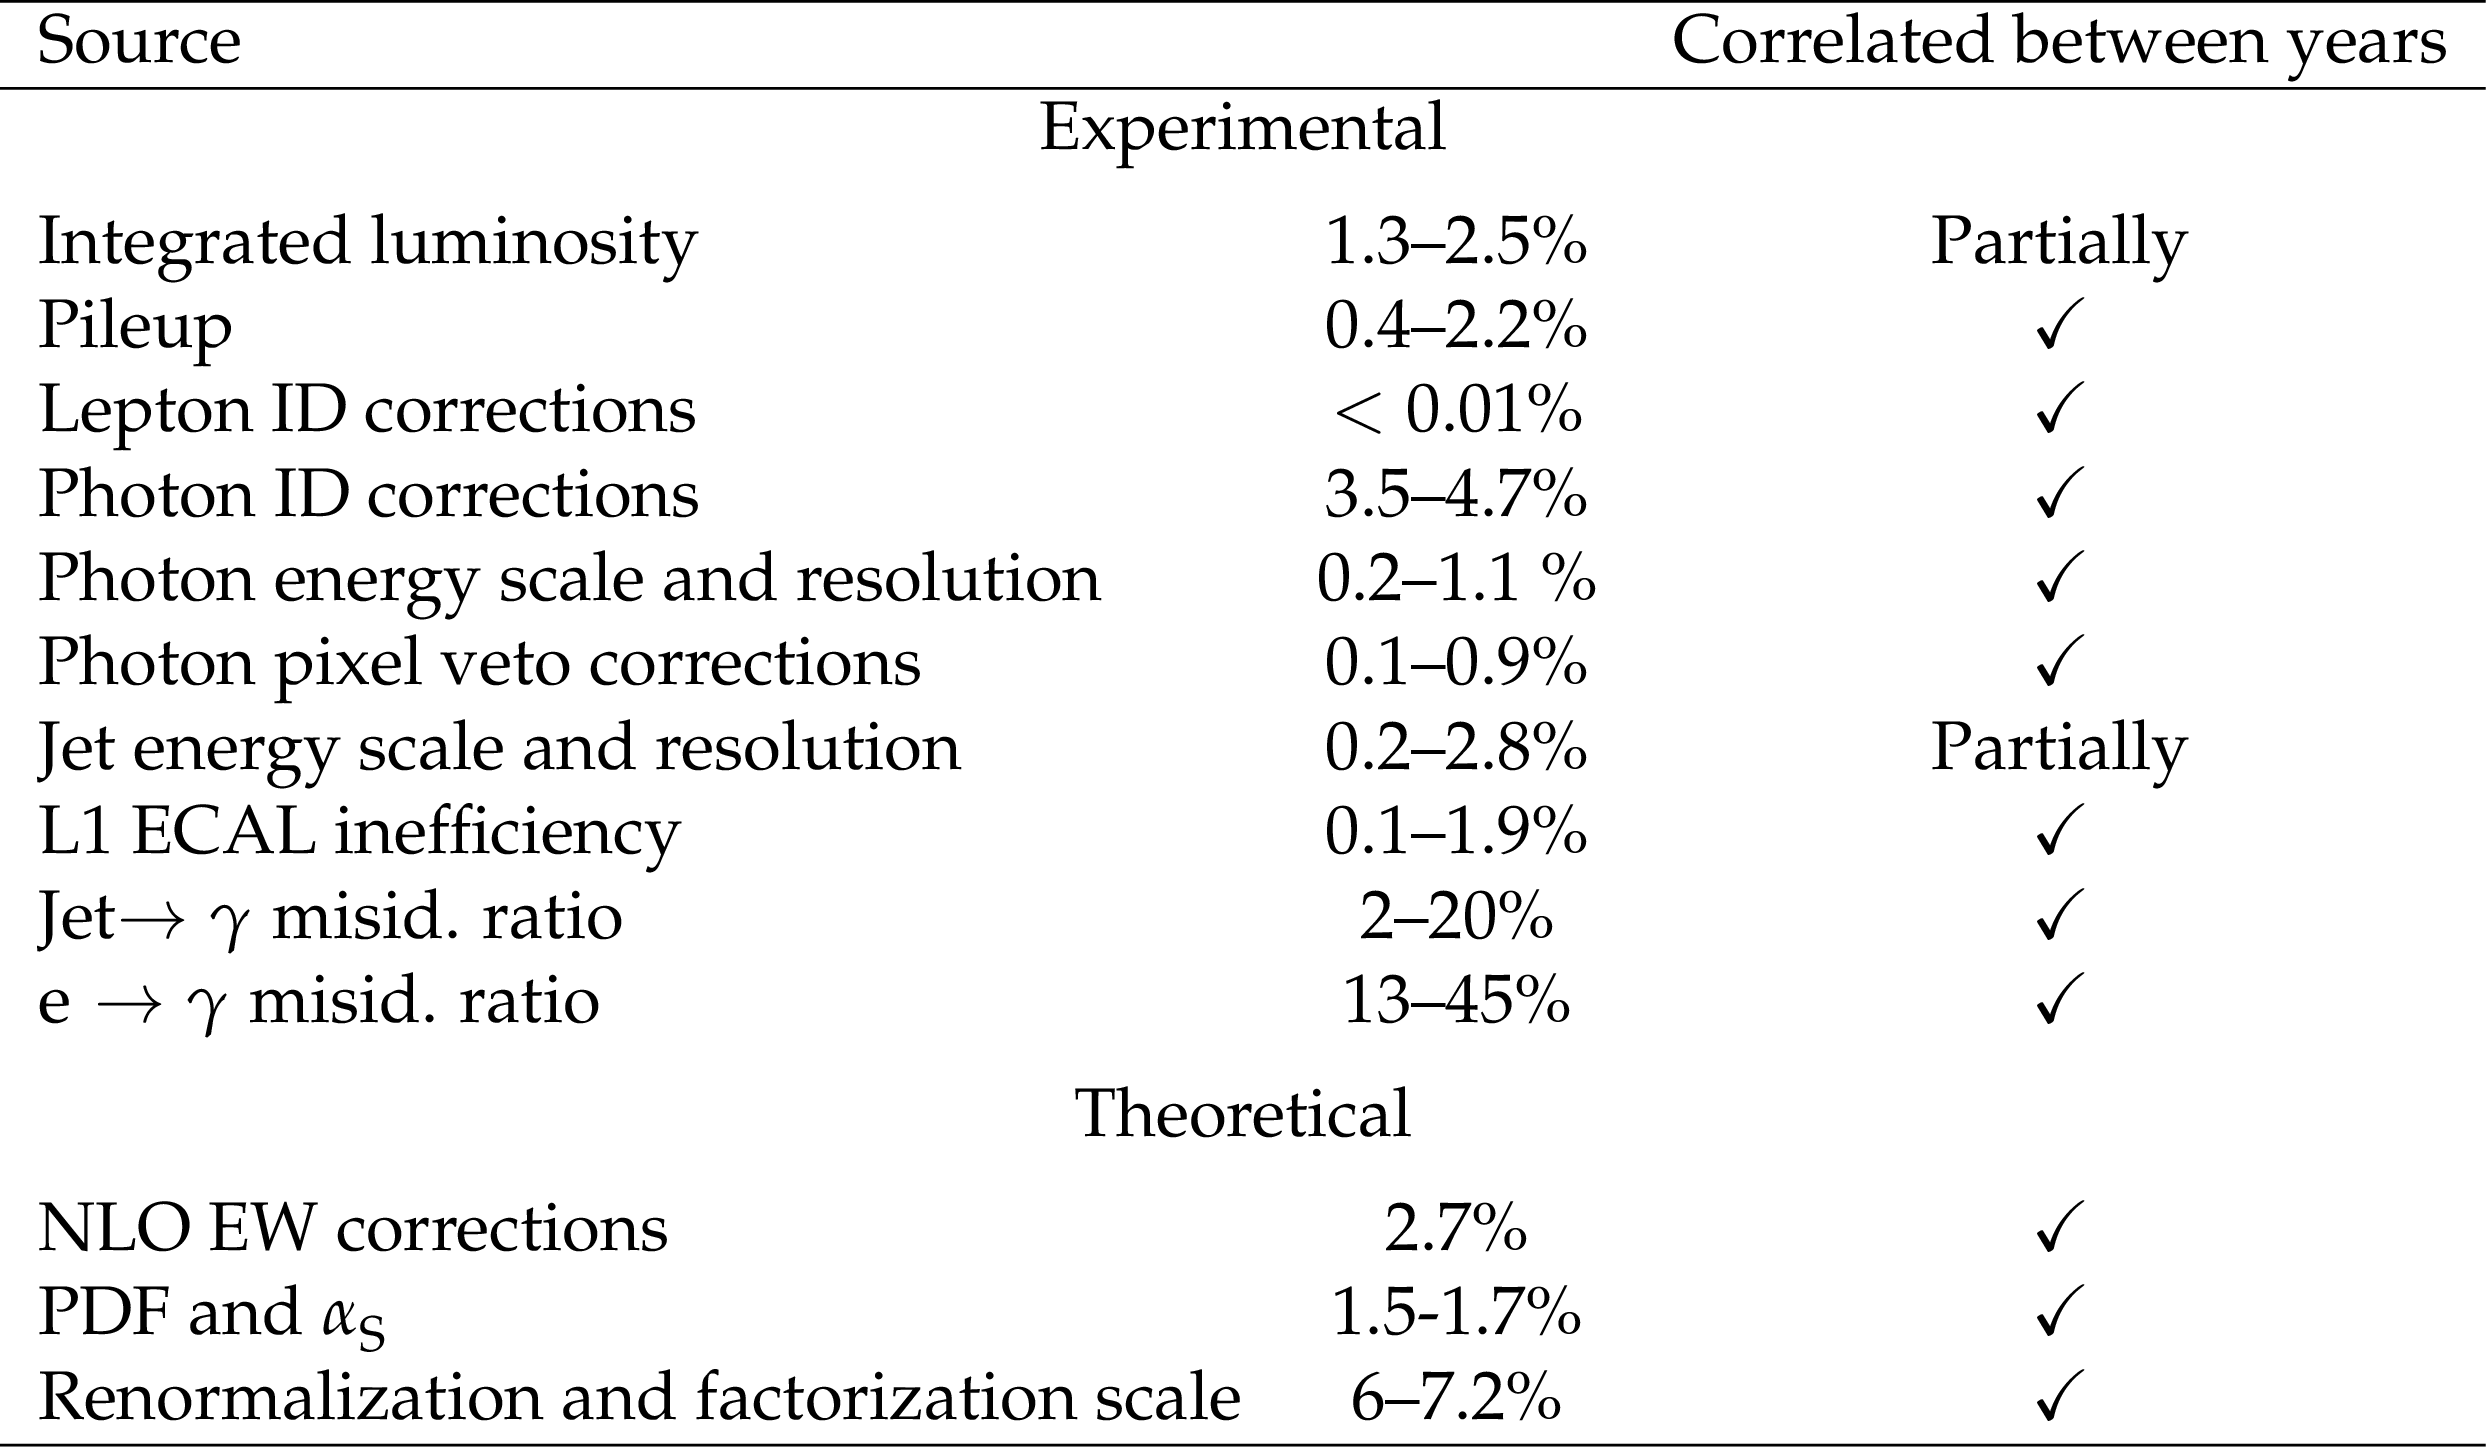
Table 1:
Sources of systematic uncertainties and their estimated contributions. The $ \checkmark $ symbol indicates full correlation between the data-taking years. |
png pdf |
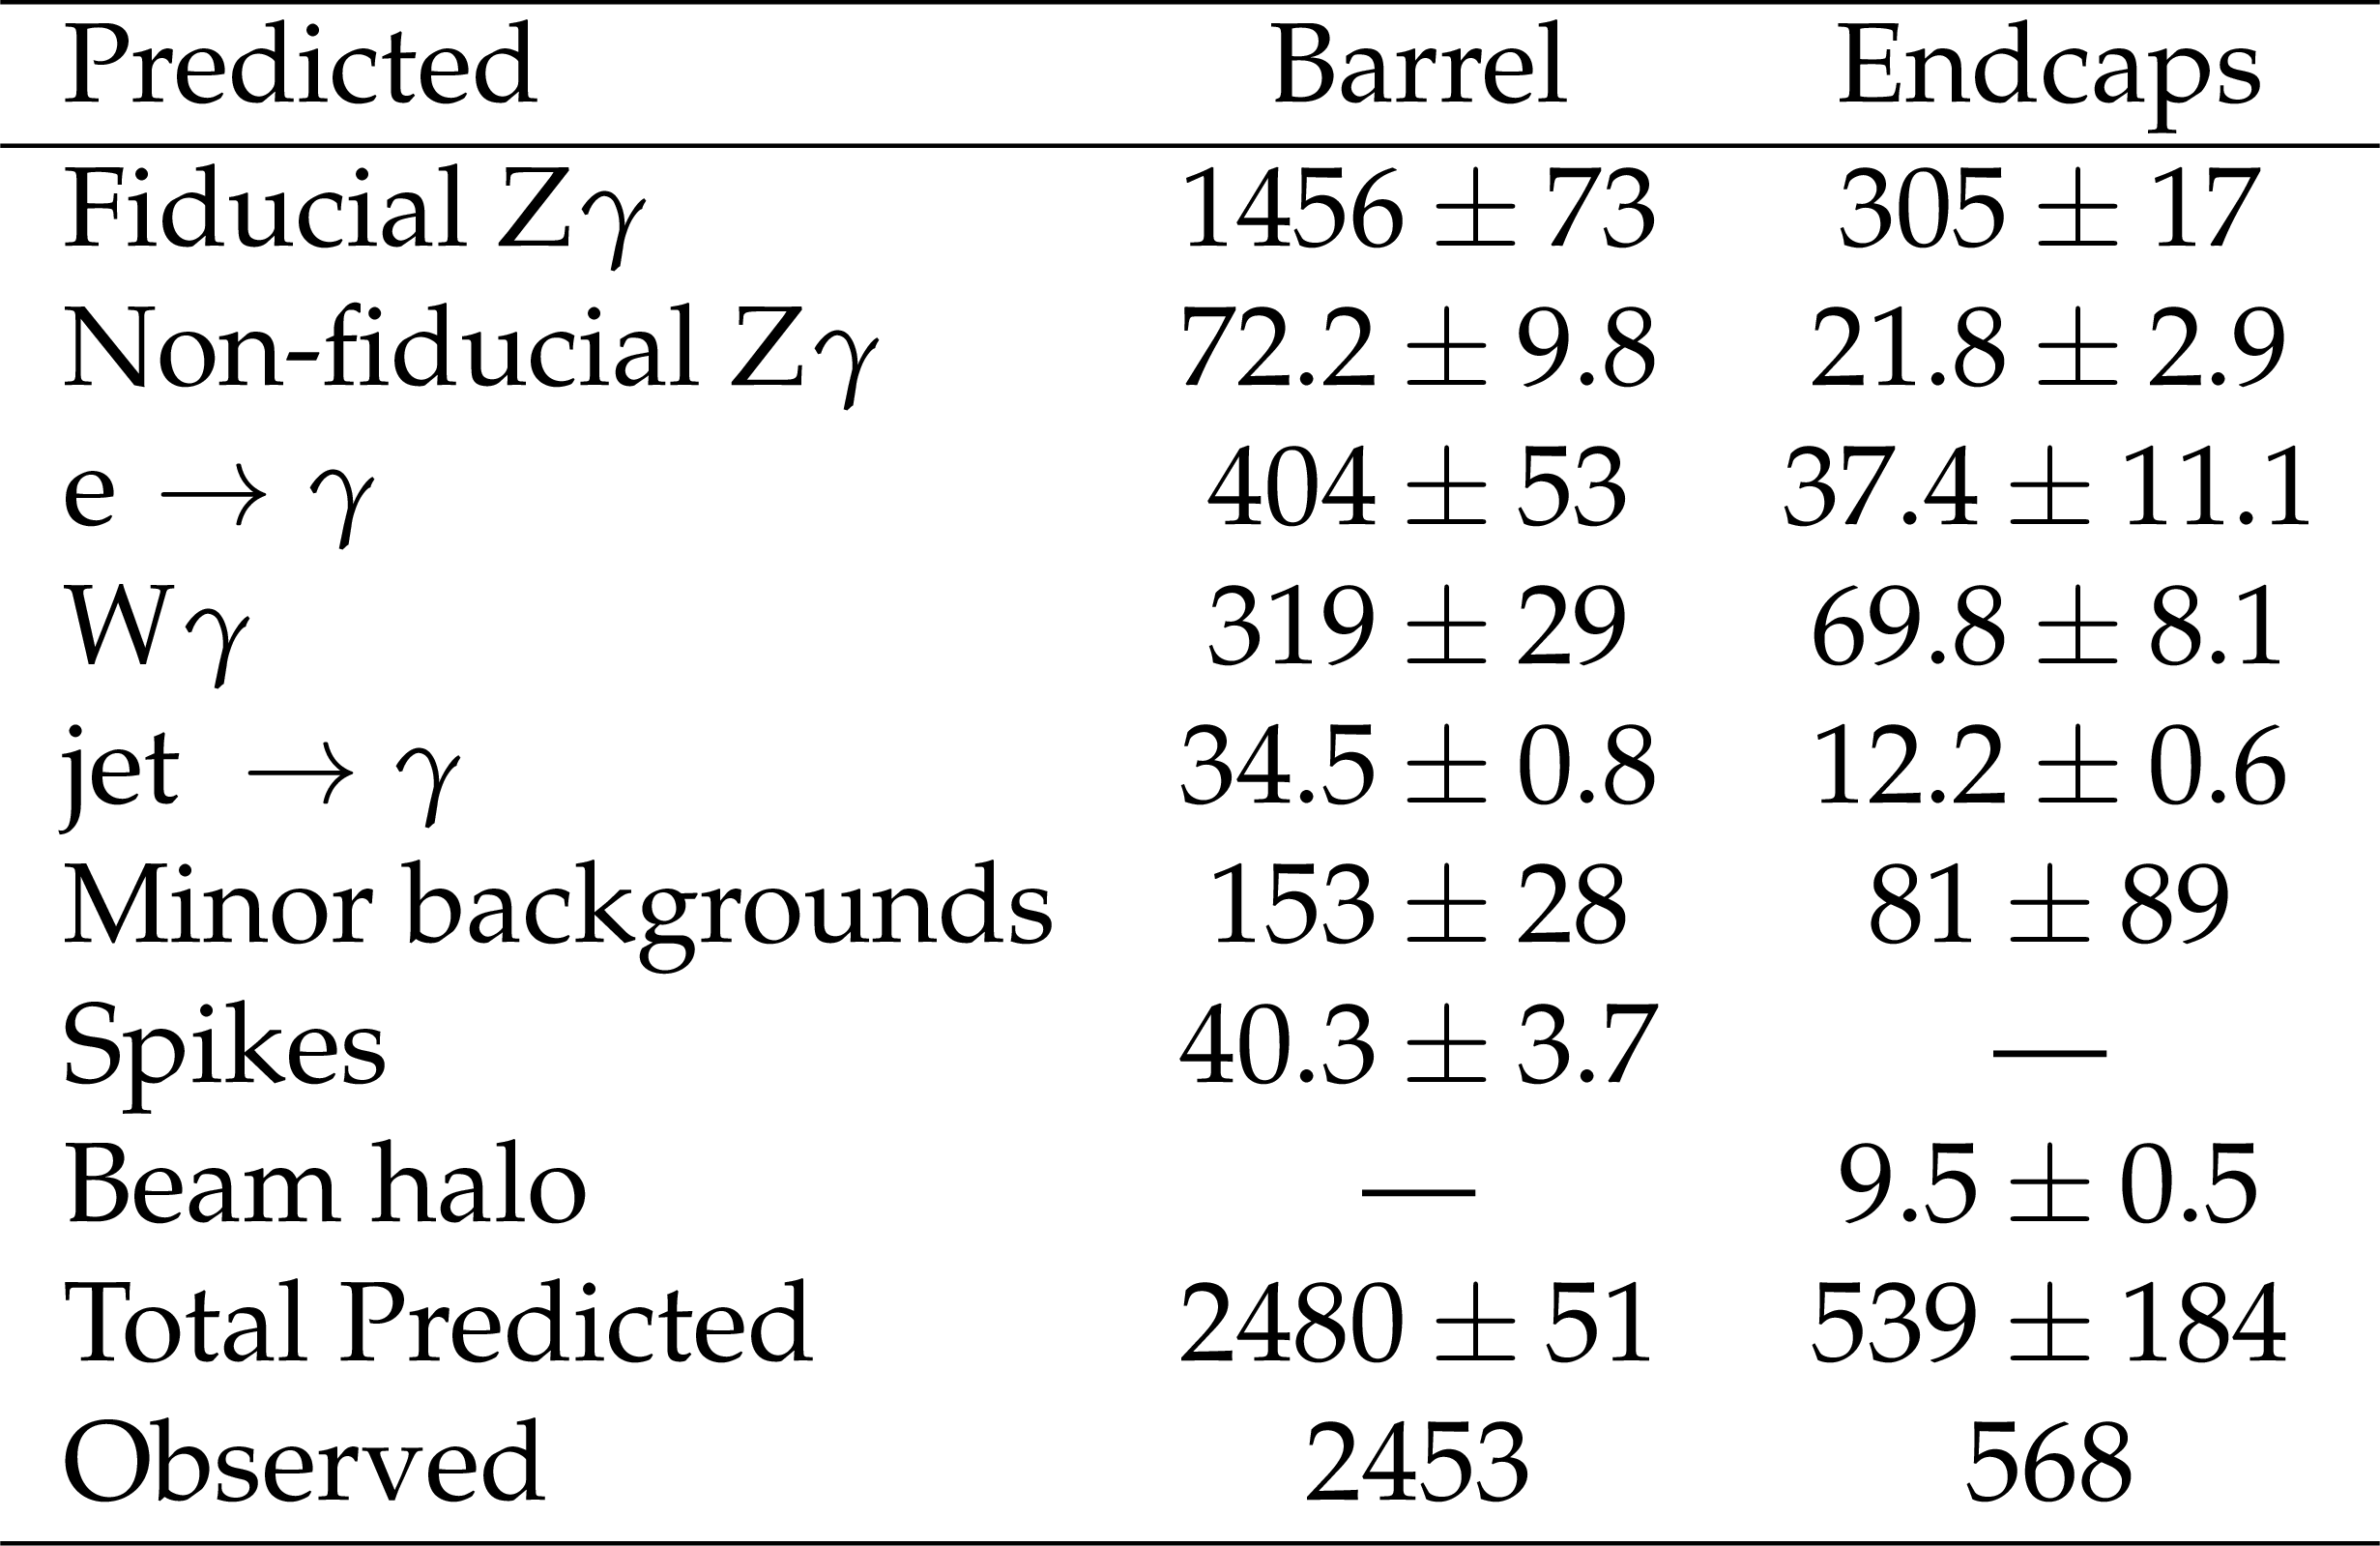
Table 2:
Post-fit event yields in the photon-$ p_{\mathrm{T}} $ spectrum for the combined phase space. These numbers are extracted after a simultaneous fit to the data in the signal and control regions. The ``others'' background include contributions from $ \text{nonfiducial} \mathrm{Z}(\nu\overline{\nu})\gamma $, $ \mathrm{Z}/\gamma^{\ast}(\ell^+\ell^-)\gamma $, $ {\mathrm{t}\overline{\mathrm{t}}} \gamma $, $ \mathrm{W}\mathrm{V}\gamma $, single-t+$ \gamma $, VV, single-W, and jet misidentified as a photon. |

png pdf |
Table 3:
Measured and predicted cross sections in femtobarns evaluated in the barrel, the endcaps, and the combined fiducial phase space. The predicted cross sections are calculated at NLO and NNLO in QCD. Due to nuisance parameters being pulled to different values in different fit configurations, the sum of the cross section in the EB and EE is not exactly equal to the combined cross section. |
png pdf |
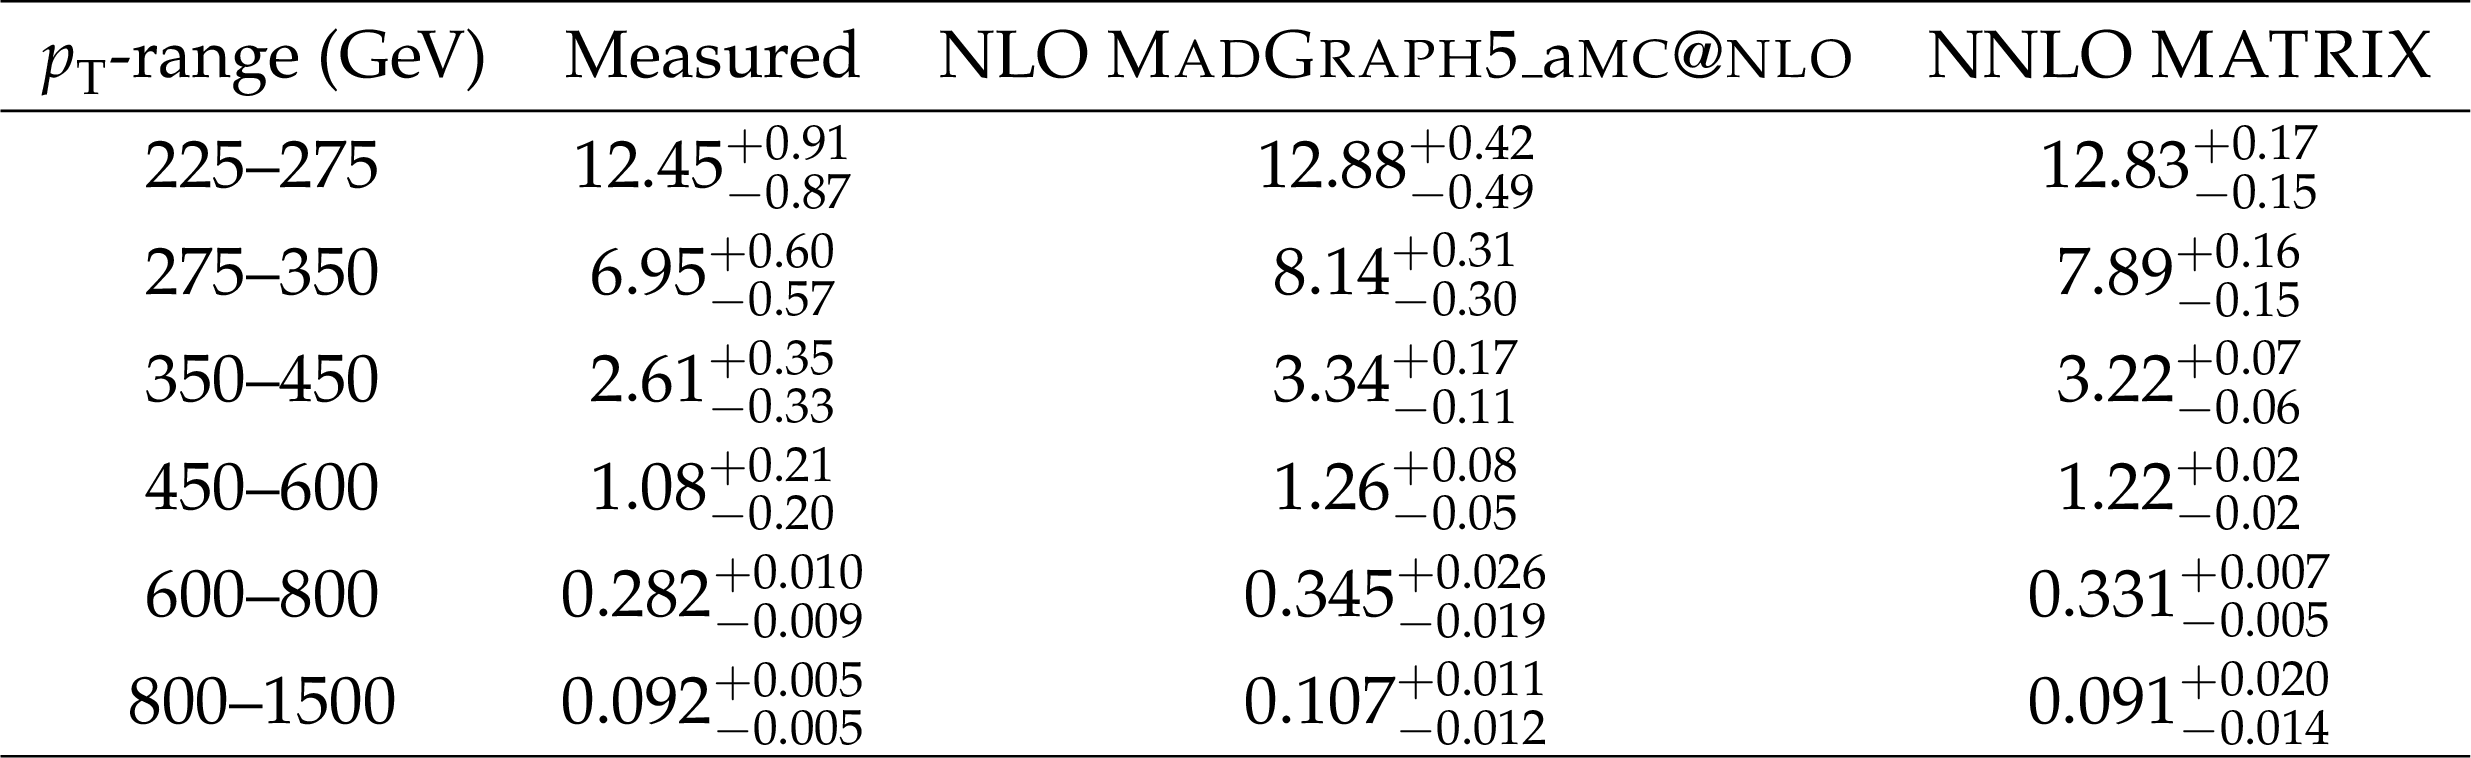
Table 4:
Measured and predicted cross sections in femtobarns in bins of $ p_{\mathrm{T}}^{\gamma} $. |
png pdf |
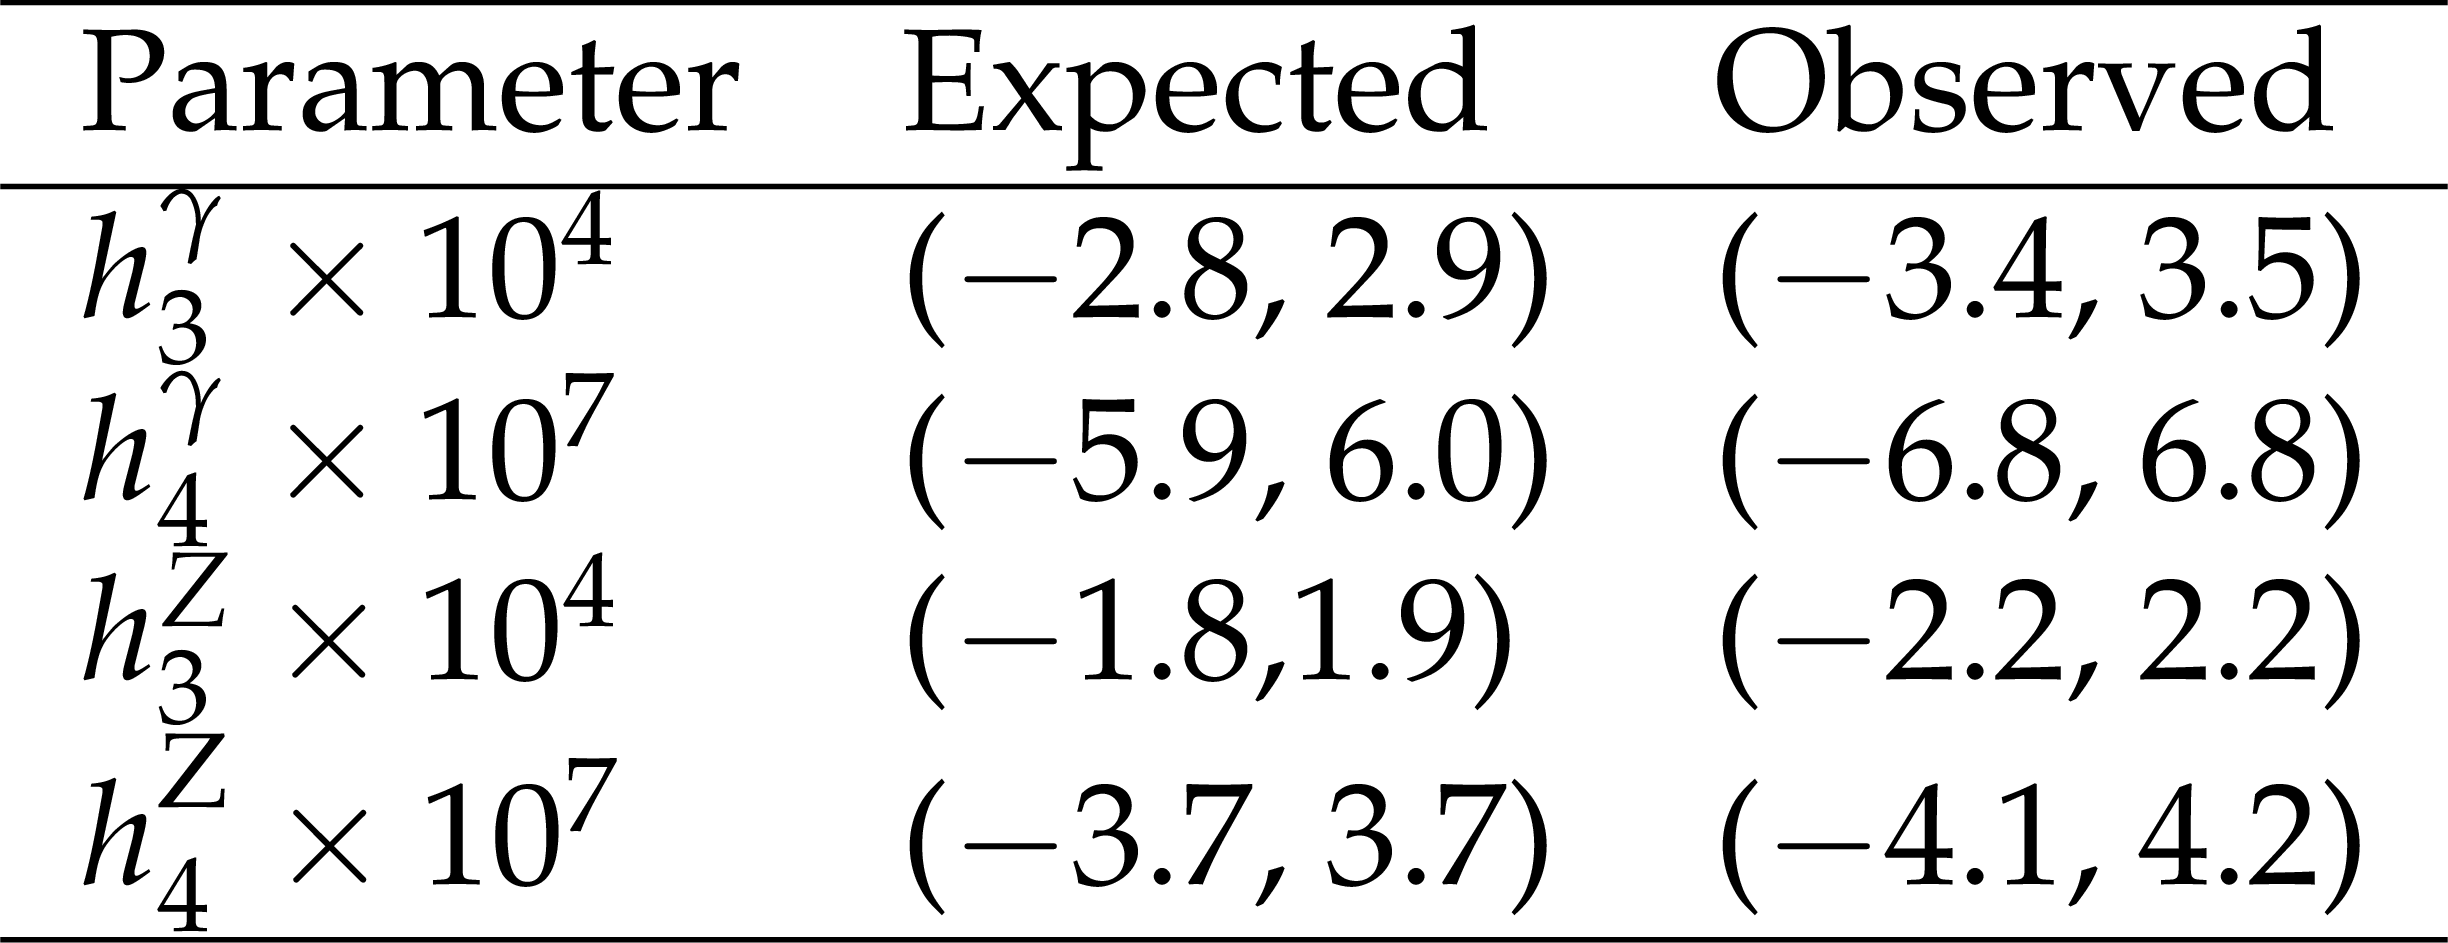
Table 5:
Expected and observed 95% confidence level intervals of the parameters of anomalous couplings (with the other parameters fixed at zero). |
| Summary |
| We have measured the inclusive and differential cross sections of $ \mathrm{Z}(\nu\overline{\nu})\gamma $ in proton-proton collisions at $ \sqrt{s}= $ 13 TeV using data collected with the CMS detector between 2016 and 2018, corresponding to an integrated luminosity of 138 fb$ ^{-1} $. The fiducial $ \mathrm{Z}\gamma $ cross section, where a photon with a $ p_{\mathrm{T}} $ greater than 225 GeV is produced in association with a Z, and the Z decays to a $ \nu\overline{\nu} $ pair ($ \mathrm{Z}(\nu\overline{\nu})\gamma $), is measured to be 23.3 $ ^{+1.4}_{-1.3} $ fb$ ^{-1} $, in agreement, within uncertainties, with the standard model prediction, which are 26.07 $ ^{+0.96}_{-0.97} $ fb from MadGraph-5\_aMC@NLO and 25.45 $ ^{+0.41}_{-0.33} $ fb from MATRIX (NNLO). The differential $ \mathrm{Z}(\nu\overline{\nu})\gamma $ cross section as function of photon transverse momentum has been measured and compared with the standard model predictions computed at next-to-leading and next-to-next-to-leading orders in perturbative quantum chromodynamics. With these data we have probed the presence of anomalous couplings that affect the $ \mathrm{Z}\mathrm{Z}\gamma $ vertex by using the $ p_{\mathrm{T}} $ spectrum of the photons as the sensitive variable. No evidence is found for anomalous neutral trilinear gauge couplings in $ \mathrm{Z}\gamma $ production. The observed 95% confidence level intervals for $ h_3^{\gamma} $ and $ h_4^{\gamma} $ are determined to be (-3.4, 3.5)$ \times10^{-4} $ and (-6.8, 6.8)$ \times10^{-7} $; and for $ h_3^{\mathrm{Z}} $ and $ h_4^{\mathrm{Z}} $ (-2.2, 2.2)$ \times10^{-4} $ and (-4.1, 4.2)$ \times10^{-7} $, respectively. These are stricter than the earlier limits on $ h_3^{\gamma} $, $ h_3^{\mathrm{Z}} $, and $ h_4^{\mathrm{Z}} $. |
| References | ||||
| 1 | K. Hagiwara, R. D. Peccei, D. Zeppenfeld, and K. Hikasa | Probing the weak boson sector in $ \mathrm{e}^++ \mathrm{e}^- \to \mathrm{W^+} + \mathrm{W^-} $ | NPB 282 (1987) 253 | |
| 2 | U. Baur and E. L. Berger | Probing the weak-boson sector in $ \mathrm{Z}\gamma $ production at hadron colliders | PRD 47 (1993) 4889 | |
| 3 | U. Baur, T. Han, and J. Ohnemus | QCD corrections and anomalous couplings in $ \mathrm{Z}\gamma $ production at hadron colliders | PRD 57 (1998) 2823 | |
| 4 | G. J. Gounaris, J. Layssac, and F. M. Renard | Signatures of the anomalous $ \mathrm{Z}\gamma $ and $ \mathrm{ZZ} $ production at lepton and hadron colliders | PRD 61 (2000) 073013 | hep-ph/9910395 |
| 5 | B. Bellazzini and F. Riva | New phenomenological and theoretical perspective on anomalous $ ZZ $ and $ Z\gamma $ processes | PRD 98 (2018) 095021 | 1806.09640 |
| 6 | D0 Collaboration | Study of $ \mathrm{Z}\gamma $ events and limits on anomalous $ \mathrm{Z}\mathrm{Z}\gamma $ and $ \mathrm{Z}\gamma\gamma $ couplings in $ \mathrm{p}\overline{\mathrm{p}} $ collisions at $ \sqrt{s}= $ 1.96 TeV | PRL 95 (2005) 051802 | hep-ex/0502036 |
| 7 | CDF Collaboration | Measurement of $ \mathrm{Z}\gamma $ production in $ \mathrm{p}\overline{\mathrm{p}} $ collisions at $ \sqrt{s}= $ 1.96 TeV | PRD 82 (2010) 031103 | 1004.1140 |
| 8 | CDF Collaboration | Limits on anomalous trilinear gauge couplings in $ \mathrm{Z}\gamma $ events from $ \mathrm{p}\overline{\mathrm{p}} $ collisions at $ \sqrt{s}= $ 1.96 TeV | PRL 107 (2011) 051802 | 1103.2990 |
| 9 | CMS Collaboration | Measurement of the $ \mathrm{Z}\gamma $ production cross section in pp collisions at $ \sqrt{s}= $ 8 TeV and search for anomalous triple gauge boson couplings | JHEP 15 (2015) 164 | CMS-SMP-13-014 1502.05664 |
| 10 | CMS Collaboration | Measurement of the $ \mathrm{Z}\gamma \rightarrow \nu\bar{\nu}\gamma $ production cross section in ppcollisions at $ \sqrt{s}= $ 8 TeV and limits on anomalous $ \mathrm{Z}\mathrm{Z}\gamma $ and $ \mathrm{Z}\gamma\gamma $ trilinear gauge boson couplings | PLB 760 (2016) 448 | CMS-SMP-14-019 1602.07152 |
| 11 | ATLAS Collaboration | Measurements of $ \mathrm{Z}\gamma $ and $ \mathrm{Z}\gamma\gamma $ production in pp collisions at $ \sqrt{s}= $ 8 TeV with the ATLAS detector | PRD 93 (2016) 112002 | 1604.05232 |
| 12 | ATLAS Collaboration | Measurement of the $ \mathrm{Z}\gamma \rightarrow \nu\bar{\nu}\gamma $ production cross section in pp collisions at $ \sqrt{s}= $ 13 TeV with the ATLAS detector and limits on anomalous triple gauge-boson couplings | JHEP 12 (2018) 010 | 1810.04995 |
| 13 | D0 Collaboration | $ \mathrm{Z}\gamma $ production and limits on anomalous $ \mathrm{Z}\mathrm{Z}\gamma $ and $ \mathrm{Z}\gamma\gamma $ couplings in $ \mathrm{p}\overline{\mathrm{p}} $ collisions at $ \sqrt{s}= $ 1.96 TeV | PLB 653 (2007) 378 | 0705.1550 |
| 14 | The ATLAS collaboration | Measurement of W$ \gamma $ and Z$ \gamma $ production in proton-proton collisions at $ \sqrt{s}= $ 7 TeV with the ATLAS detector | JHEP 09 (2011) 072 | 1106.1592 |
| 15 | CMS Collaboration | HEPData record for this analysis | link | |
| 16 | CMS Collaboration | The CMS experiment at the CERN LHC | JINST 3 (2008) S08004 | |
| 17 | CMS Collaboration | Development of the CMS detector for the CERN LHC Run 3 | JINST 19 (2024) P05064 | CMS-PRF-21-001 2309.05466 |
| 18 | CMS Collaboration | Performance of the CMS Level-1 trigger in proton-proton collisions at $ \sqrt{s} = $ 13TeV | JINST 15 (2020) P10017 | CMS-TRG-17-001 2006.10165 |
| 19 | CMS Collaboration | The CMS trigger system | JINST 12 (2017) P01020 | CMS-TRG-12-001 1609.02366 |
| 20 | CMS Collaboration | Performance of the CMS high-level trigger during LHC run 2 | JINST 19 (2024) P11021 | CMS-TRG-19-001 2410.17038 |
| 21 | CMS Collaboration | Electron and photon reconstruction and identification with the CMS experiment at the CERN LHC | JINST 16 (2021) P05014 | CMS-EGM-17-001 2012.06888 |
| 22 | CMS Collaboration | Performance of the CMS muon detector and muon reconstruction with proton-proton collisions at $ \sqrt{s}= $ 13 TeV | JINST 13 (2018) P06015 | CMS-MUO-16-001 1804.04528 |
| 23 | CMS Collaboration | Description and performance of track and primary-vertex reconstruction with the CMS tracker | JINST 9 (2014) P10009 | CMS-TRK-11-001 1405.6569 |
| 24 | CMS Collaboration | Particle-flow reconstruction and global event description with the CMS detector | JINST 12 (2017) P10003 | CMS-PRF-14-001 1706.04965 |
| 25 | CMS Collaboration | Technical proposal for the Phase-II upgrade of the Compact Muon Solenoid | CMS Technical Proposal CERN-LHCC-2015-010, CMS-TDR-15-02, 2015 CDS |
|
| 26 | M. Cacciari, G. P. Salam, and G. Soyez | The anti-$ k_{\mathrm{T}} $ jet clustering algorithm | JHEP 04 (2008) 063 | 0802.1189 |
| 27 | M. Cacciari, G. P. Salam, and G. Soyez | FastJet user manual | EPJC 72 (2012) 1896 | 1111.6097 |
| 28 | CMS Collaboration | Pileup mitigation at CMS in 13 TeV data | JINST 15 (2020) P09018 | CMS-JME-18-001 2003.00503 |
| 29 | CMS Collaboration | Jet energy scale and resolution in the CMS experiment in pp collisions at 8 TeV | JINST 12 (2017) P02014 | CMS-JME-13-004 1607.03663 |
| 30 | CMS Collaboration | Performance of missing transverse momentum reconstruction in proton-proton collisions at $ \sqrt{s} = $ 13 TeV using the CMS detector | JINST 14 (2019) P07004 | CMS-JME-17-001 1903.06078 |
| 31 | CMS Collaboration | Measurements of inclusive W and Z cross sections in pp collisions at $ \sqrt{s}= $ 7 TeV | JHEP 01 (2011) 080 | CMS-EWK-10-002 1012.2466 |
| 32 | A. Bodek et al. | Extracting muon momentum scale corrections for hadron collider experiments | EPJC 72 (2012) 2194 | 1208.3710 |
| 33 | CMS Collaboration | Mitigation of anomalous APD signals in the CMS electromagnetic calorimeter | J. Phys. Conf. Ser. 404 (2012) 012043 | |
| 34 | A. P. Singh, P. C. Bhat, N. V. Mokhov, and S. Beri | Beam-induced radiation in the compact muon solenoid tracker at the large hadron collider | Pramana 74 (2010) 719 | |
| 35 | J. Alwall et al. | The automated computation of tree-level and next-to-leading order differential cross sections, and their matching to parton shower simulations | JHEP 07 (2014) 079 | 1405.0301 |
| 36 | CMS Collaboration | Extraction and validation of a new set of CMS PYTHIA8 tunes from underlying-event measurements | EPJC 80 (2020) 4 | CMS-GEN-17-001 1903.12179 |
| 37 | T. Sjöstrand et al. | An introduction to PYTHIA 8.2 | Comput. Phys. Commun. 191 (2015) 159 | 1410.3012 |
| 38 | GEANT4 Collaboration | GEANT 4---a simulation toolkit | NIM A 506 (2003) 250 | |
| 39 | M. Grazzini, S. Kallweit, and D. Rathlev | W$ \gamma $ and Z$ \gamma $ production at the LHC in NNLO QCD | JHEP 07 (2015) 085 | 1504.01330 |
| 40 | A. Denner, S. Dittmaier, M. Hecht, and C. Pasold | NLO QCD and electroweak corrections to Z + $ \gamma $ production with leptonic Z-boson decays | JHEP 02 (2016) 057 | 1510.08742 |
| 41 | A. Denner, S. Dittmaier, M. Hecht, and C. Pasold | NLO QCD and electroweak corrections to W + $ \gamma $ production with leptonic W-boson decays | JHEP 04 (2015) 018 | 1412.7421 |
| 42 | V. Bertone, S. Carrazza, N. P. Hartland, and J. Rojo | Illuminating the photon content of the proton within a global PDF analysis | SciPost Phys. 5 (2018) 008 | 1712.07053 |
| 43 | M. A. Wadud | Measurements on the production of a Z boson in association with a photon in proton-proton collisions and a search for anomalous triple gauge couplings at the CERN Large Hadron Collider | PhD thesis, University of Minnesota, 2023 link |
|
| 44 | CMS Collaboration | Muon reconstruction and identification performance with Run-2 data | CMS Detector Performance Summary CMS-DP-2020-040, 2020 CDS |
|
| 45 | CMS collaboration | Search for new physics in final states with a single photon and missing transverse momentum in proton-proton collisions at $ \sqrt{s}= $ 13 TeV | JHEP 0 (2019) 2 | 1810.00196 |
| 46 | CMS Collaboration | Precision luminosity measurement in proton-proton collisions at $ \sqrt{s} = $ 13 TeV in 2015 and 2016 at CMS | EPJC 81 (2021) | CMS-LUM-17-003 2104.01927 |
| 47 | CMS Collaboration | CMS luminosity measurement for the 2017 data-taking period at $ \sqrt{s}= $ 13 TeV | CMS Physics Analysis Summary, 2018 CMS-PAS-LUM-17-004 |
CMS-PAS-LUM-17-004 |
| 48 | CMS Collaboration | CMS luminosity measurement for the 2018 data-taking period at $ \sqrt{s}= $ 13 TeV | CMS Physics Analysis Summary, 2019 CMS-PAS-LUM-18-002 |
CMS-PAS-LUM-18-002 |
| 49 | CMS Collaboration | Measurement of the inelastic proton-proton cross section at $ \sqrt{s}= $ 13 TeV | JHEP 07 (2018) 161 | CMS-FSQ-15-005 1802.02613 |
| 50 | M. Grazzini, S. Kallweit, and M. Wiesemann | Fully differential NNLO computations with MATRIX | EPJC 78 (2018) 537 | 1711.06631 |
| 51 | J. M. Lindert et al. | Precise predictions for $ V+ $ jets dark matter backgrounds | EPJC 77 (2017) | 1705.04664 |
| 52 | J. Butterworth et al. | PDF4LHC recommendations for LHC Run II | JPG 43 (2016) 023001 | 1510.03865 |
| 53 | CMS Collaboration | The CMS statistical analysis and combination tool: Combine | Comput. Softw. Big Sci. 8 (2024) | CMS-CAT-23-001 2404.06614 |
| 54 | R. J. Barlow and C. Beeston | Fitting using finite Monte Carlo samples | Comput. Phys. Commun. 77 (1993) 219 | |
| 55 | A. Gaponenko | A practical way to regularize unfolding of sharply varying spectra with low data statistics | NIM A 960 (2020) 163612 | 1906.07918 |
| 56 | B. Pollack, S. Bhattacharya, and M. Schmitt | Bayesian block histogramming for high energy physics | 1708.00810 | |
|
|
Compact Muon Solenoid LHC, CERN |
|

|

|

|

|

|