

Compact Muon Solenoid
LHC, CERN
| CMS-HIN-24-004 ; CERN-EP-2025-210 | ||
| Characterizing the initial state and dynamical evolution in XeXe and PbPb collisions using multiparticle cumulants | ||
| CMS Collaboration | ||
| 30 October 2025 | ||
| Accepted for publication in Phys. Lett. B | ||
| Abstract: For the first time, correlations among mixed-order moments of two or three flow harmonics $-$($ v_{n}^{k},v_{m}^{l} $) and ($ v_{n}^{k},v_{m}^{l}, v_{p}^{q} $), with $ k $, $ l $, and $ q $ denoting the respective orders$-$are measured in xenon-xenon (XeXe) collisions and compared with lead-lead (PbPb) results, providing a novel probe of collective behavior in heavy ion collisions. These measurements compare a nearly spherical, doubly-magic $ ^{208} $Pb nucleus to a triaxially deformed $ ^{129} $Xe nucleus, emphasizing the sensitivity to dynamic nuclear deformation. The dependence of these results ($ v_{n} $, $ n = 2, 3, $ 4) on the shape and size of the nuclear overlap region is studied. Comparisons between $ v_{2} $, $ v_{3} $, and $ v_{4} $ demonstrate the importance of $ v_{3} $ and $ v_{4} $ in exploring the nonlinear hydrodynamic response of the quark-gluon plasma (QGP) to the initial spatial anisotropy. The results constrain initial-state model parameters that influence the evolution of the QGP. The CMS detector was used to collect XeXe and PbPb data at nucleon-nucleon center-of-mass energies of $ \sqrt{\smash[b]{s_{_{\mathrm{NN}}}}} = $ 5.44 and 5.36 TeV, respectively. Correlations are extracted using multiparticle mixed-harmonic cumulants (up to eight-particle cumulants) with charged particles in the pseudorapidity range $ |\eta| < $ 2.4 and transverse momentum range 0.5 $ < p_{\mathrm{T}} < $ 3 GeV/$c$. | ||
| Links: e-print arXiv:2510.26766 [hep-ex] (PDF) ; CDS record ; inSPIRE record ; HepData record ; CADI line (restricted) ; | ||
| Figures | |
png pdf |
Figure 1:
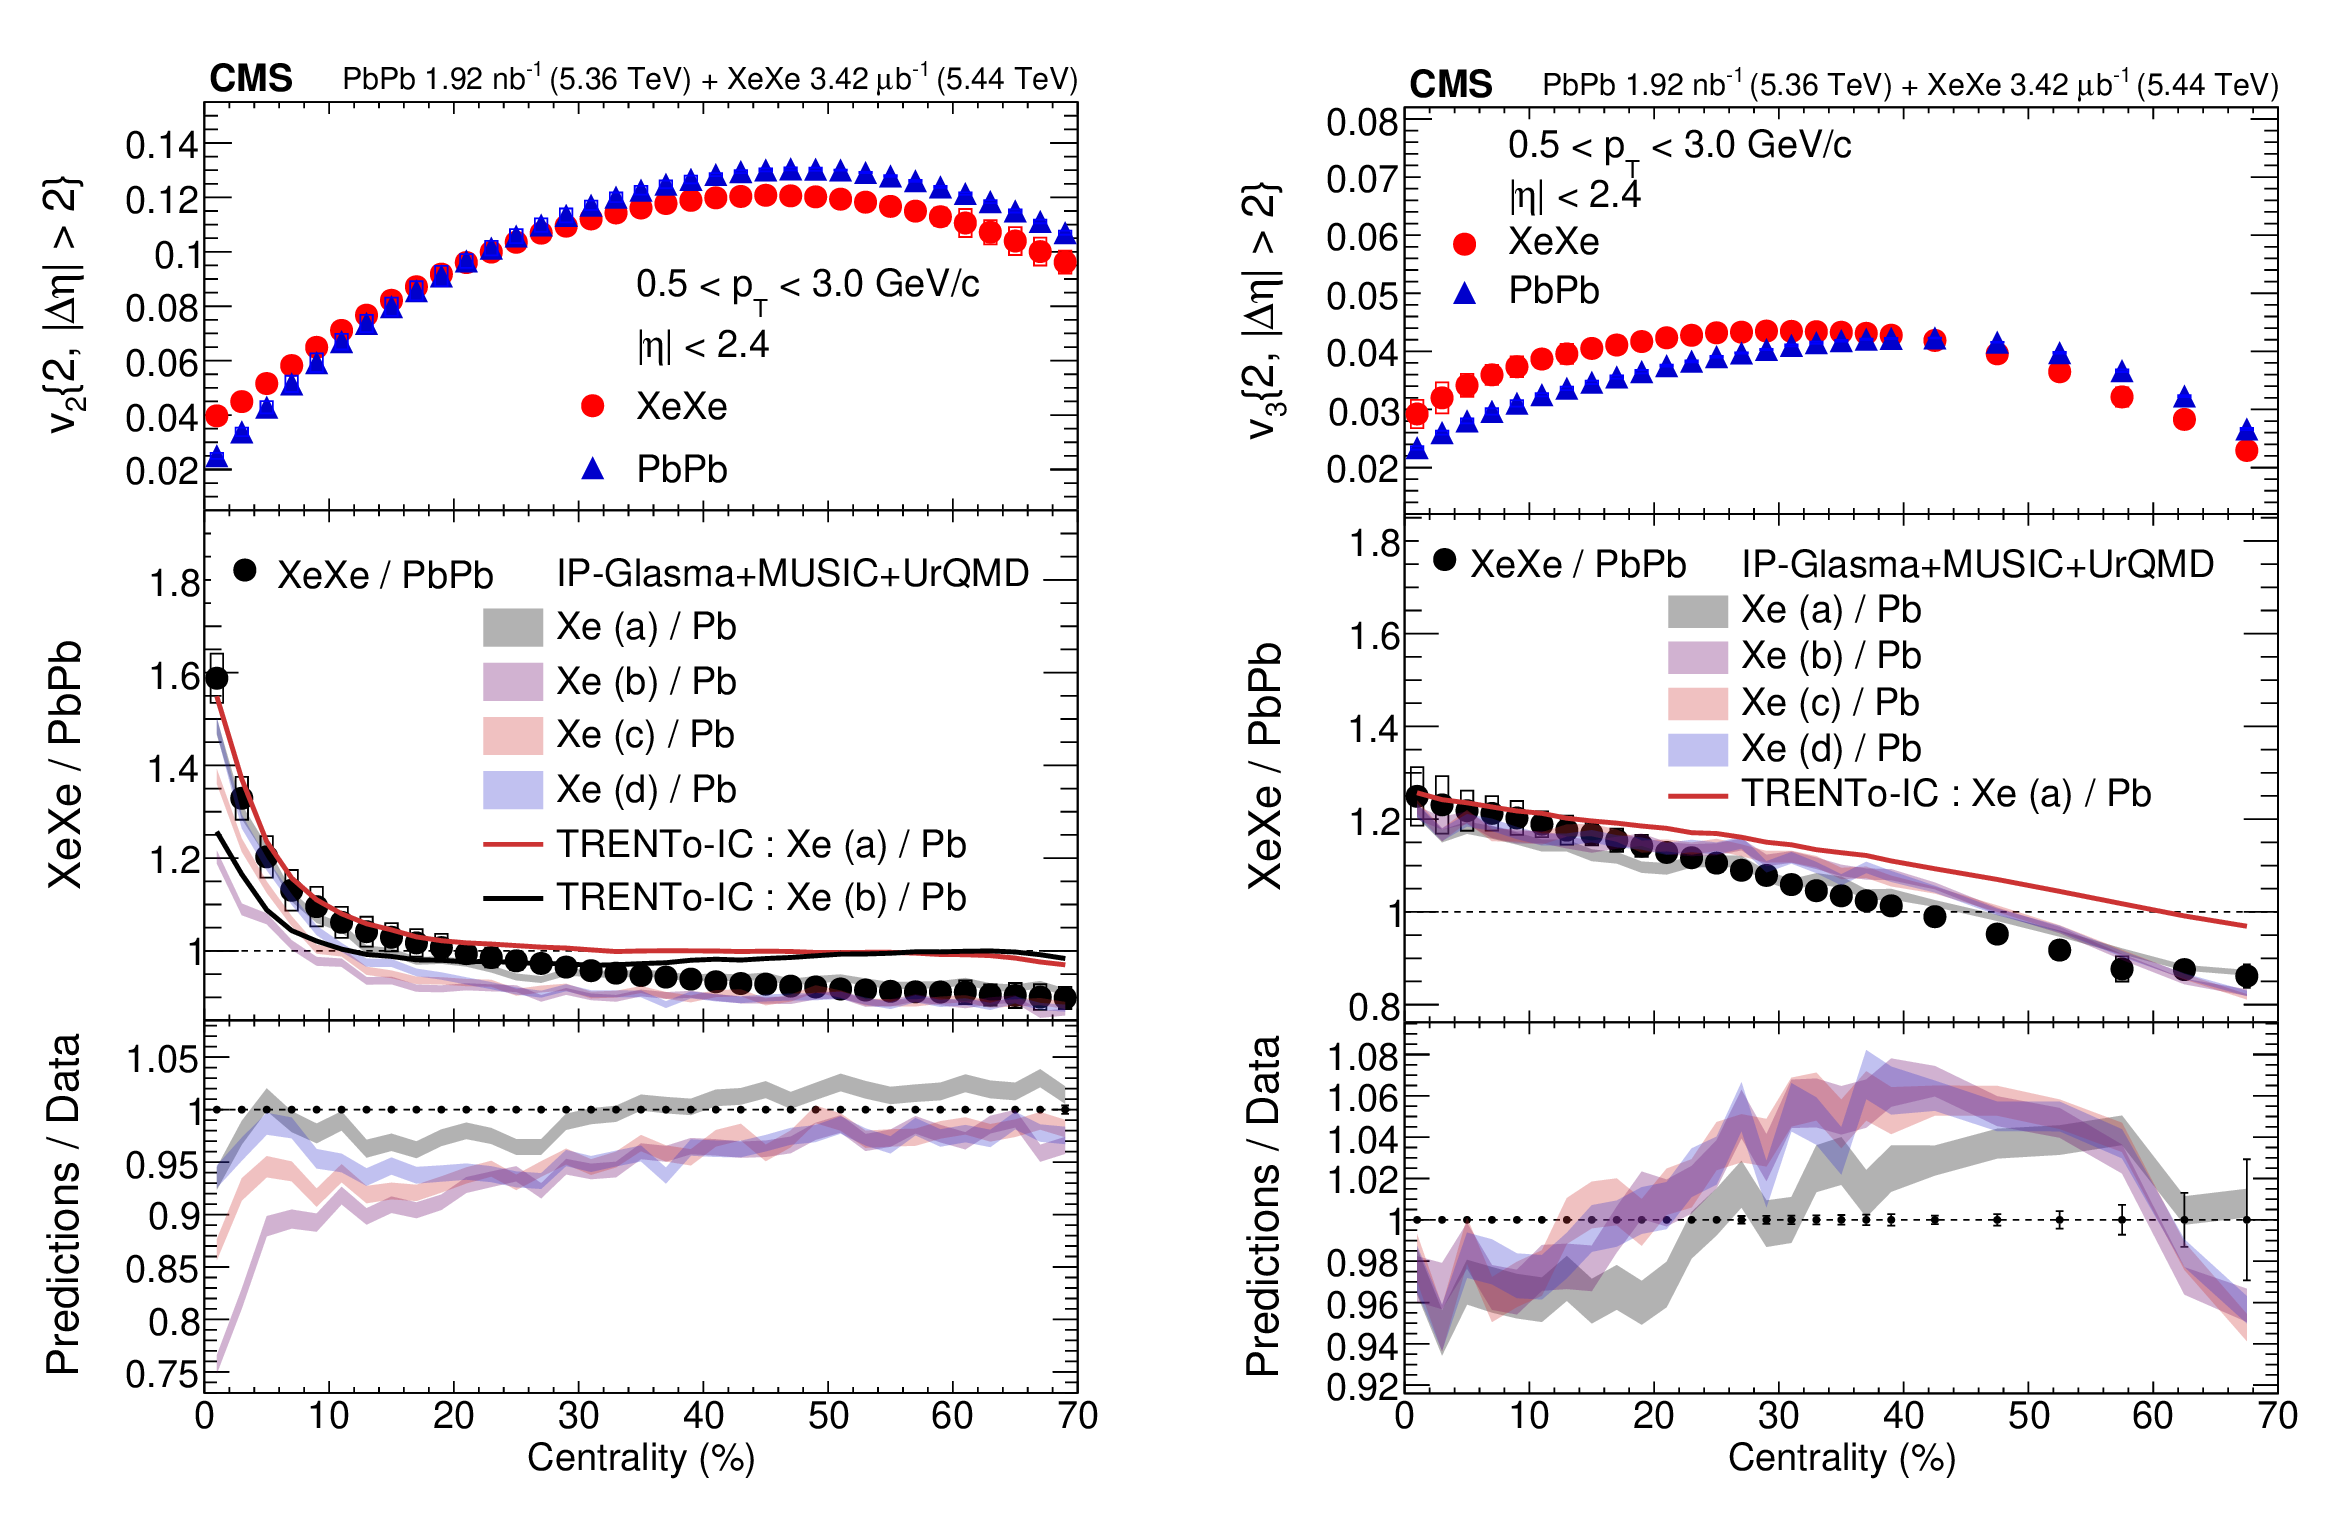
The upper row shows $ v_{n}\{2,|\Delta\eta| > 2\} $ for elliptic ($ n = $ 2, left) and triangular ($ n = $ 3, right) flow, as a function of centrality in XeXe and PbPb collisions, calculated using the 2-particle correlation method. The vertical bars (mostly smaller than the marker size) and the open boxes represent the statistical and systematic uncertainties, respectively. The middle row compares various theoretical predictions to the data for the XeXe/PbPb ratios. The red and black solid lines show predictions using ratios of the initial-state eccentricities $ \varepsilon_{n} $ from the TRENTO-IC model using deformed (Xe (a)) and spherical (Xe (b)) parameters, respectively, both taken as ratios with respect to the Pb nucleus. The shaded bands represent four different hydrodynamic predictions from the IP-GLASMA+MUSIC+URQMD model using four Xe parameter sets. The lower row shows the ratios of the hydrodynamic predictions to data. |
png pdf |
Figure 1-a:
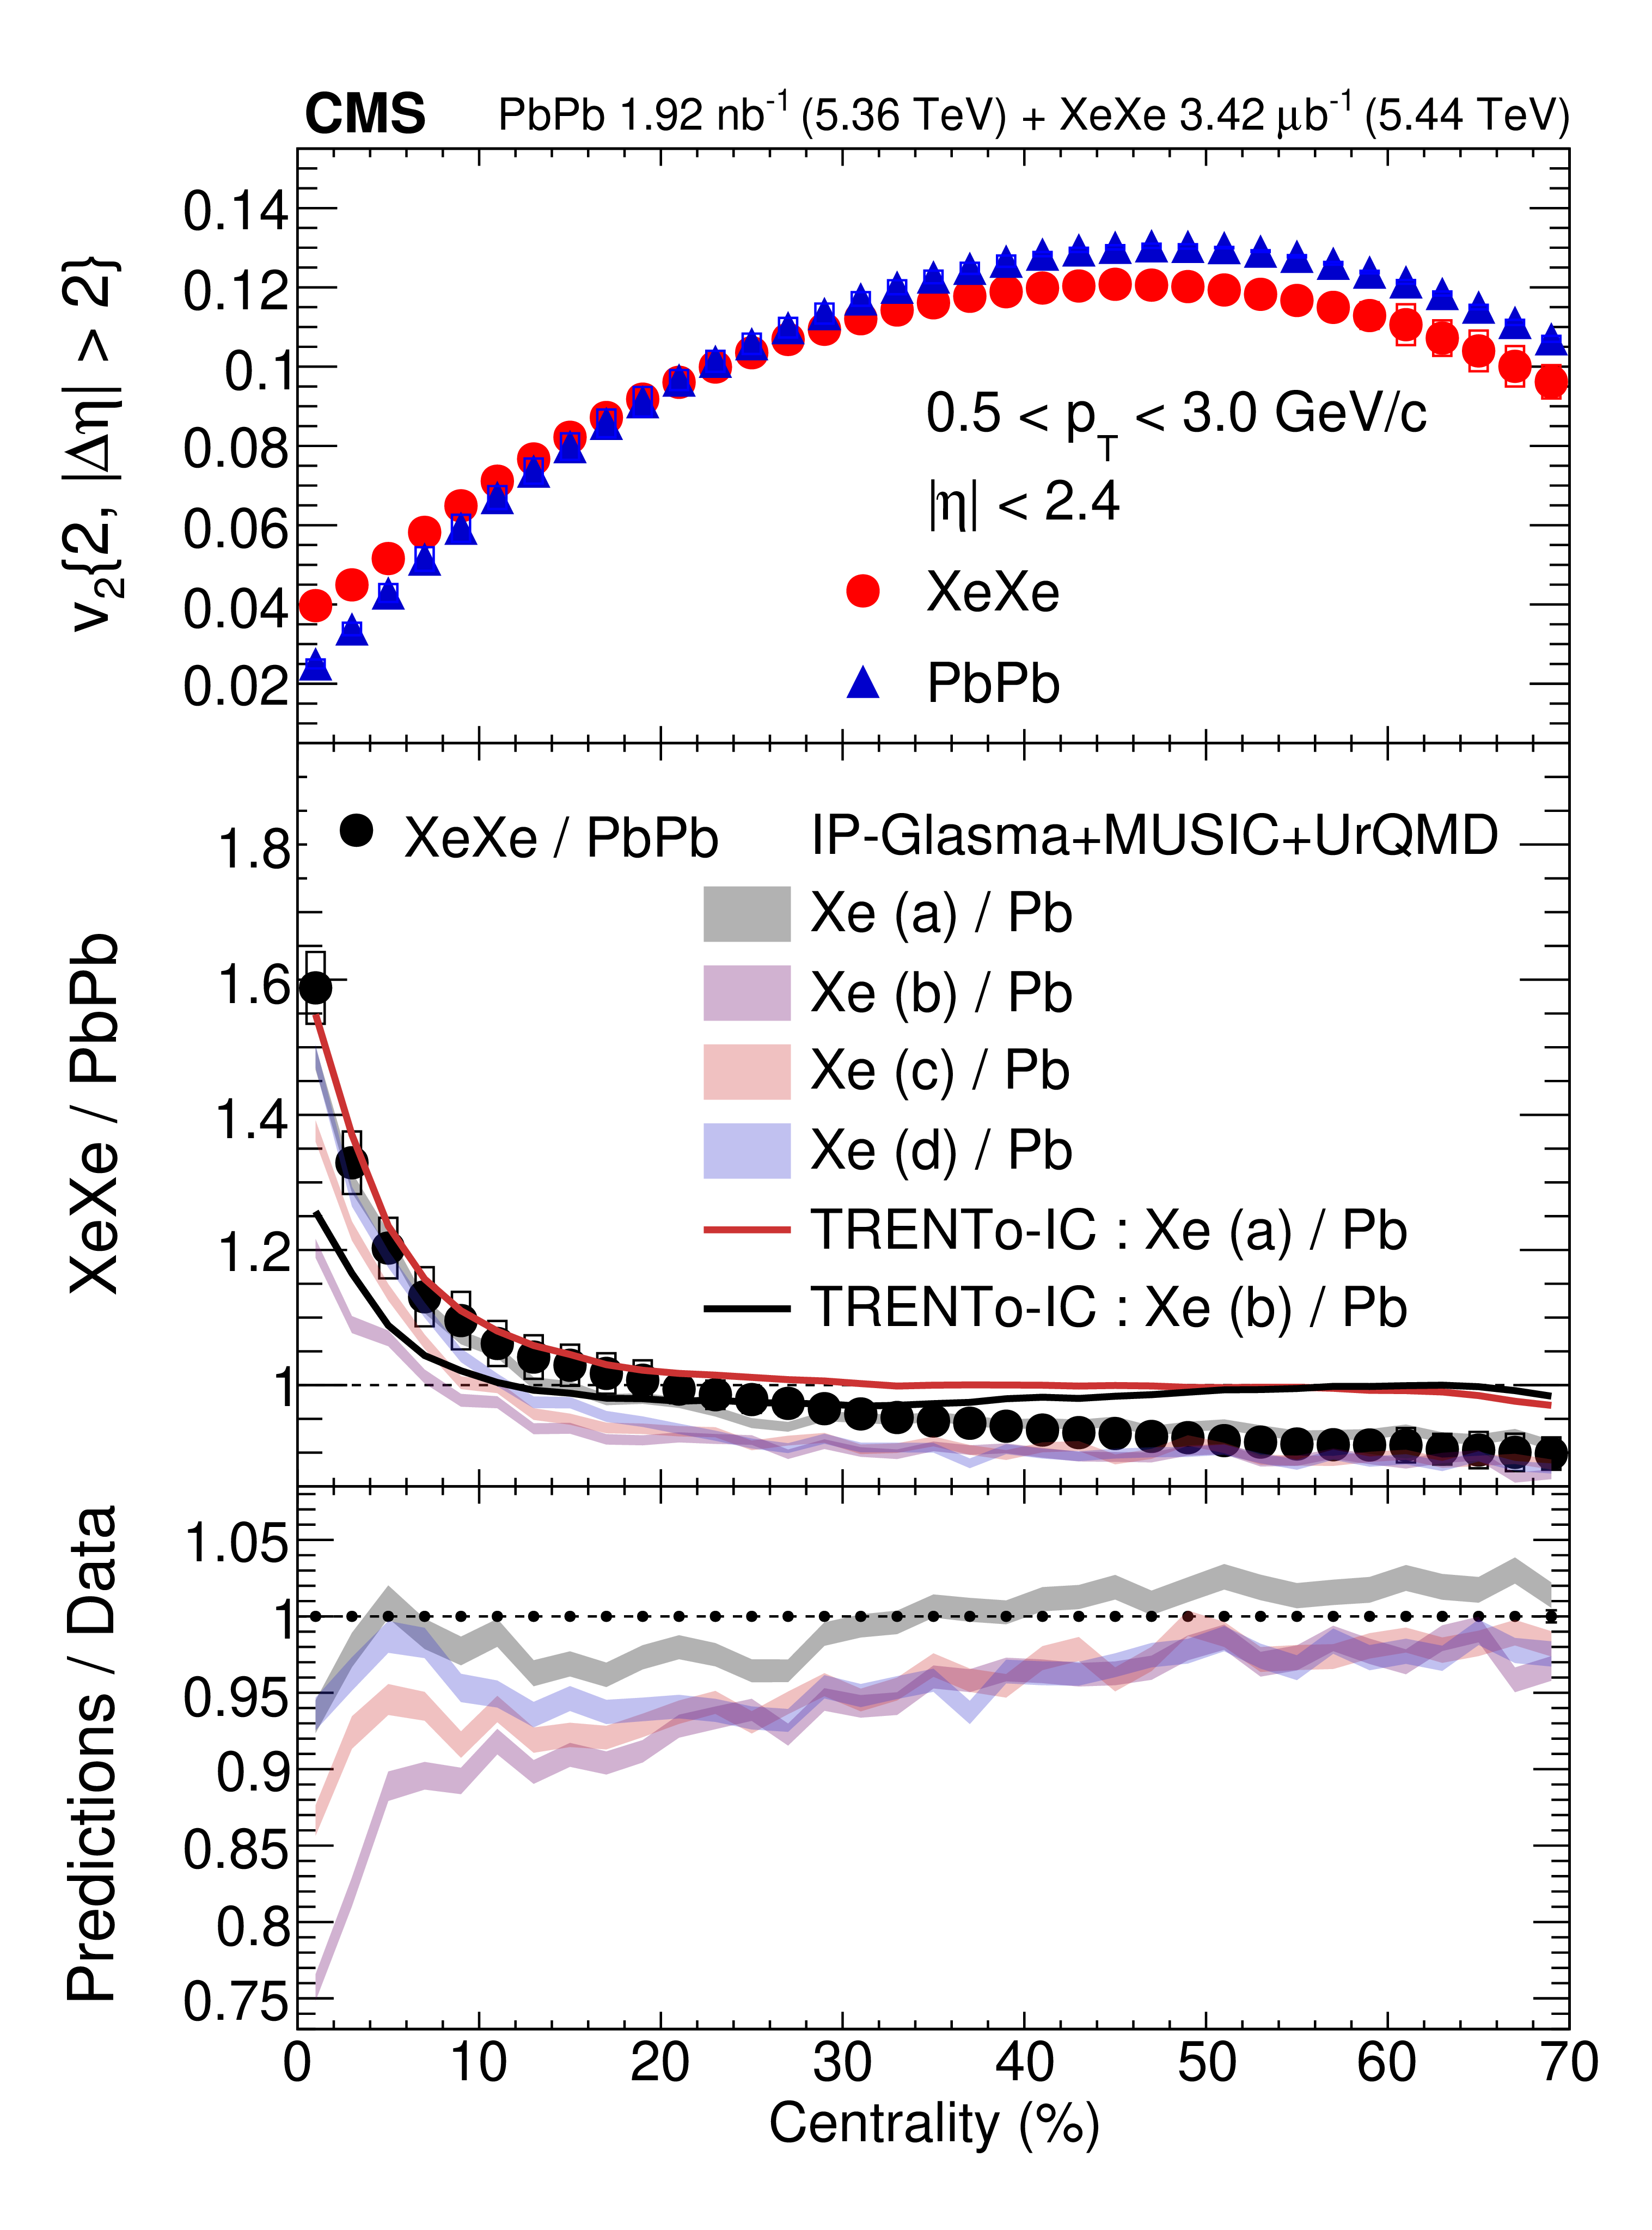
The upper row shows $ v_{n}\{2,|\Delta\eta| > 2\} $ for elliptic ($ n = $ 2, left) and triangular ($ n = $ 3, right) flow, as a function of centrality in XeXe and PbPb collisions, calculated using the 2-particle correlation method. The vertical bars (mostly smaller than the marker size) and the open boxes represent the statistical and systematic uncertainties, respectively. The middle row compares various theoretical predictions to the data for the XeXe/PbPb ratios. The red and black solid lines show predictions using ratios of the initial-state eccentricities $ \varepsilon_{n} $ from the TRENTO-IC model using deformed (Xe (a)) and spherical (Xe (b)) parameters, respectively, both taken as ratios with respect to the Pb nucleus. The shaded bands represent four different hydrodynamic predictions from the IP-GLASMA+MUSIC+URQMD model using four Xe parameter sets. The lower row shows the ratios of the hydrodynamic predictions to data. |
png pdf |
Figure 1-b:
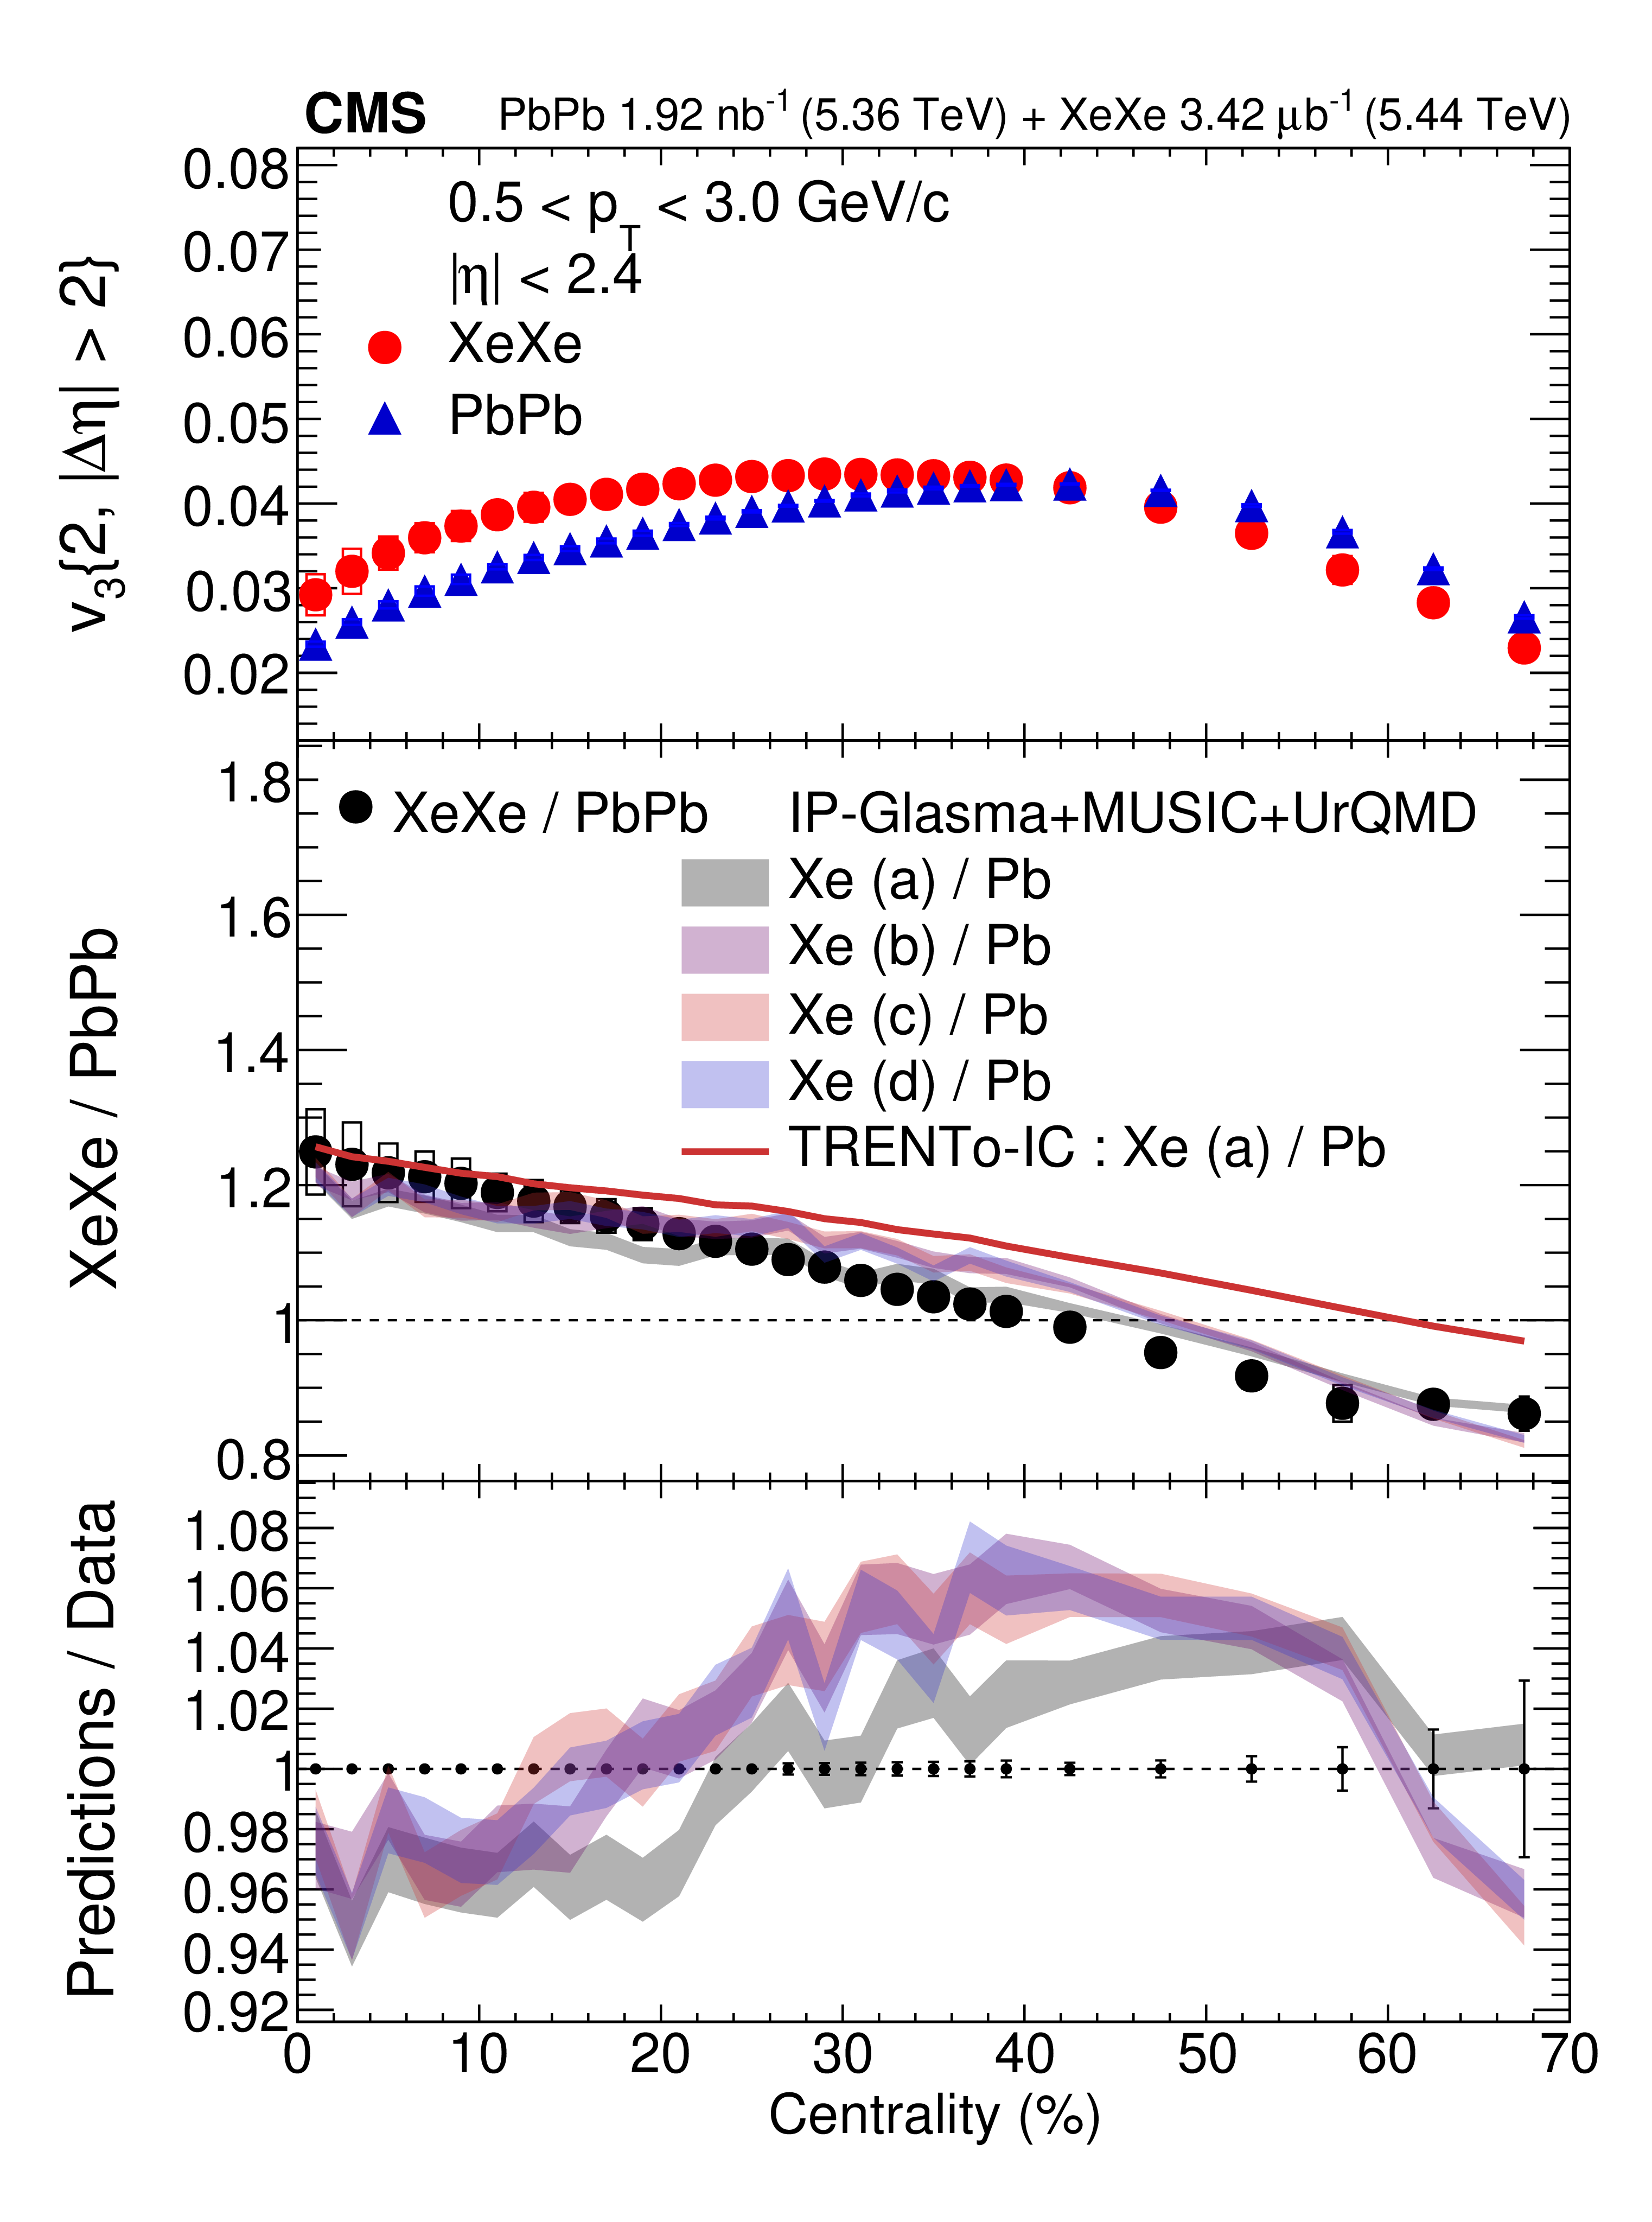
The upper row shows $ v_{n}\{2,|\Delta\eta| > 2\} $ for elliptic ($ n = $ 2, left) and triangular ($ n = $ 3, right) flow, as a function of centrality in XeXe and PbPb collisions, calculated using the 2-particle correlation method. The vertical bars (mostly smaller than the marker size) and the open boxes represent the statistical and systematic uncertainties, respectively. The middle row compares various theoretical predictions to the data for the XeXe/PbPb ratios. The red and black solid lines show predictions using ratios of the initial-state eccentricities $ \varepsilon_{n} $ from the TRENTO-IC model using deformed (Xe (a)) and spherical (Xe (b)) parameters, respectively, both taken as ratios with respect to the Pb nucleus. The shaded bands represent four different hydrodynamic predictions from the IP-GLASMA+MUSIC+URQMD model using four Xe parameter sets. The lower row shows the ratios of the hydrodynamic predictions to data. |
png pdf |
Figure 2:
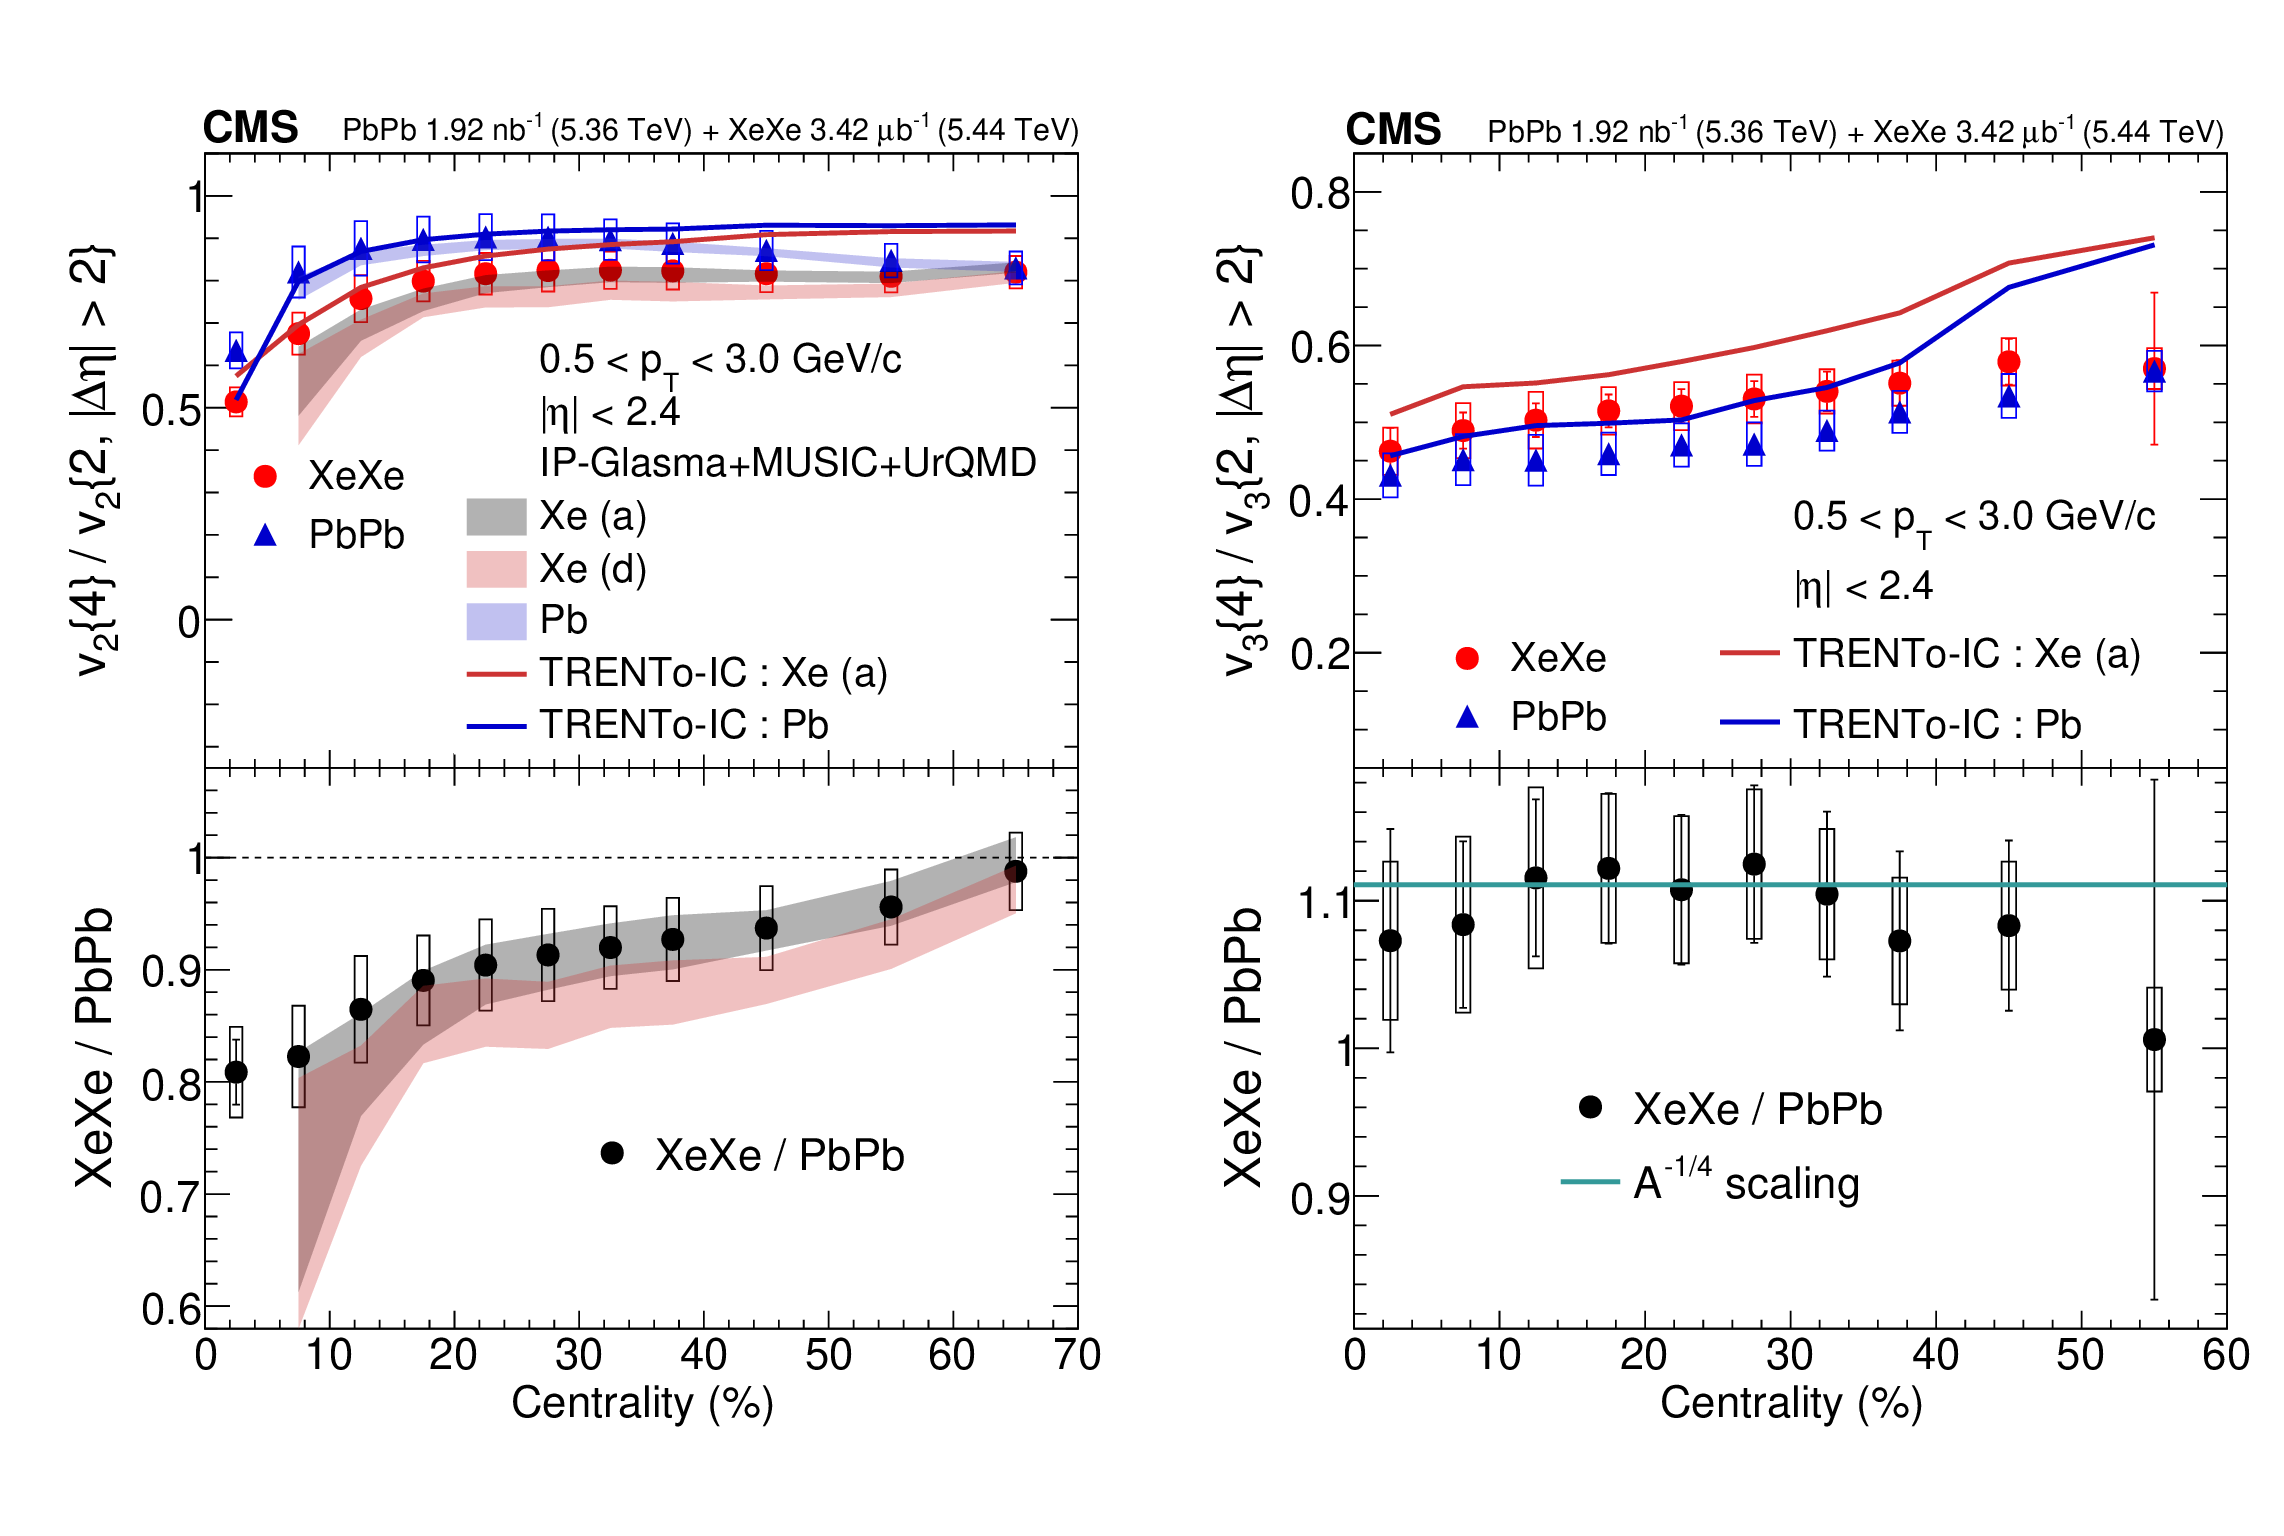
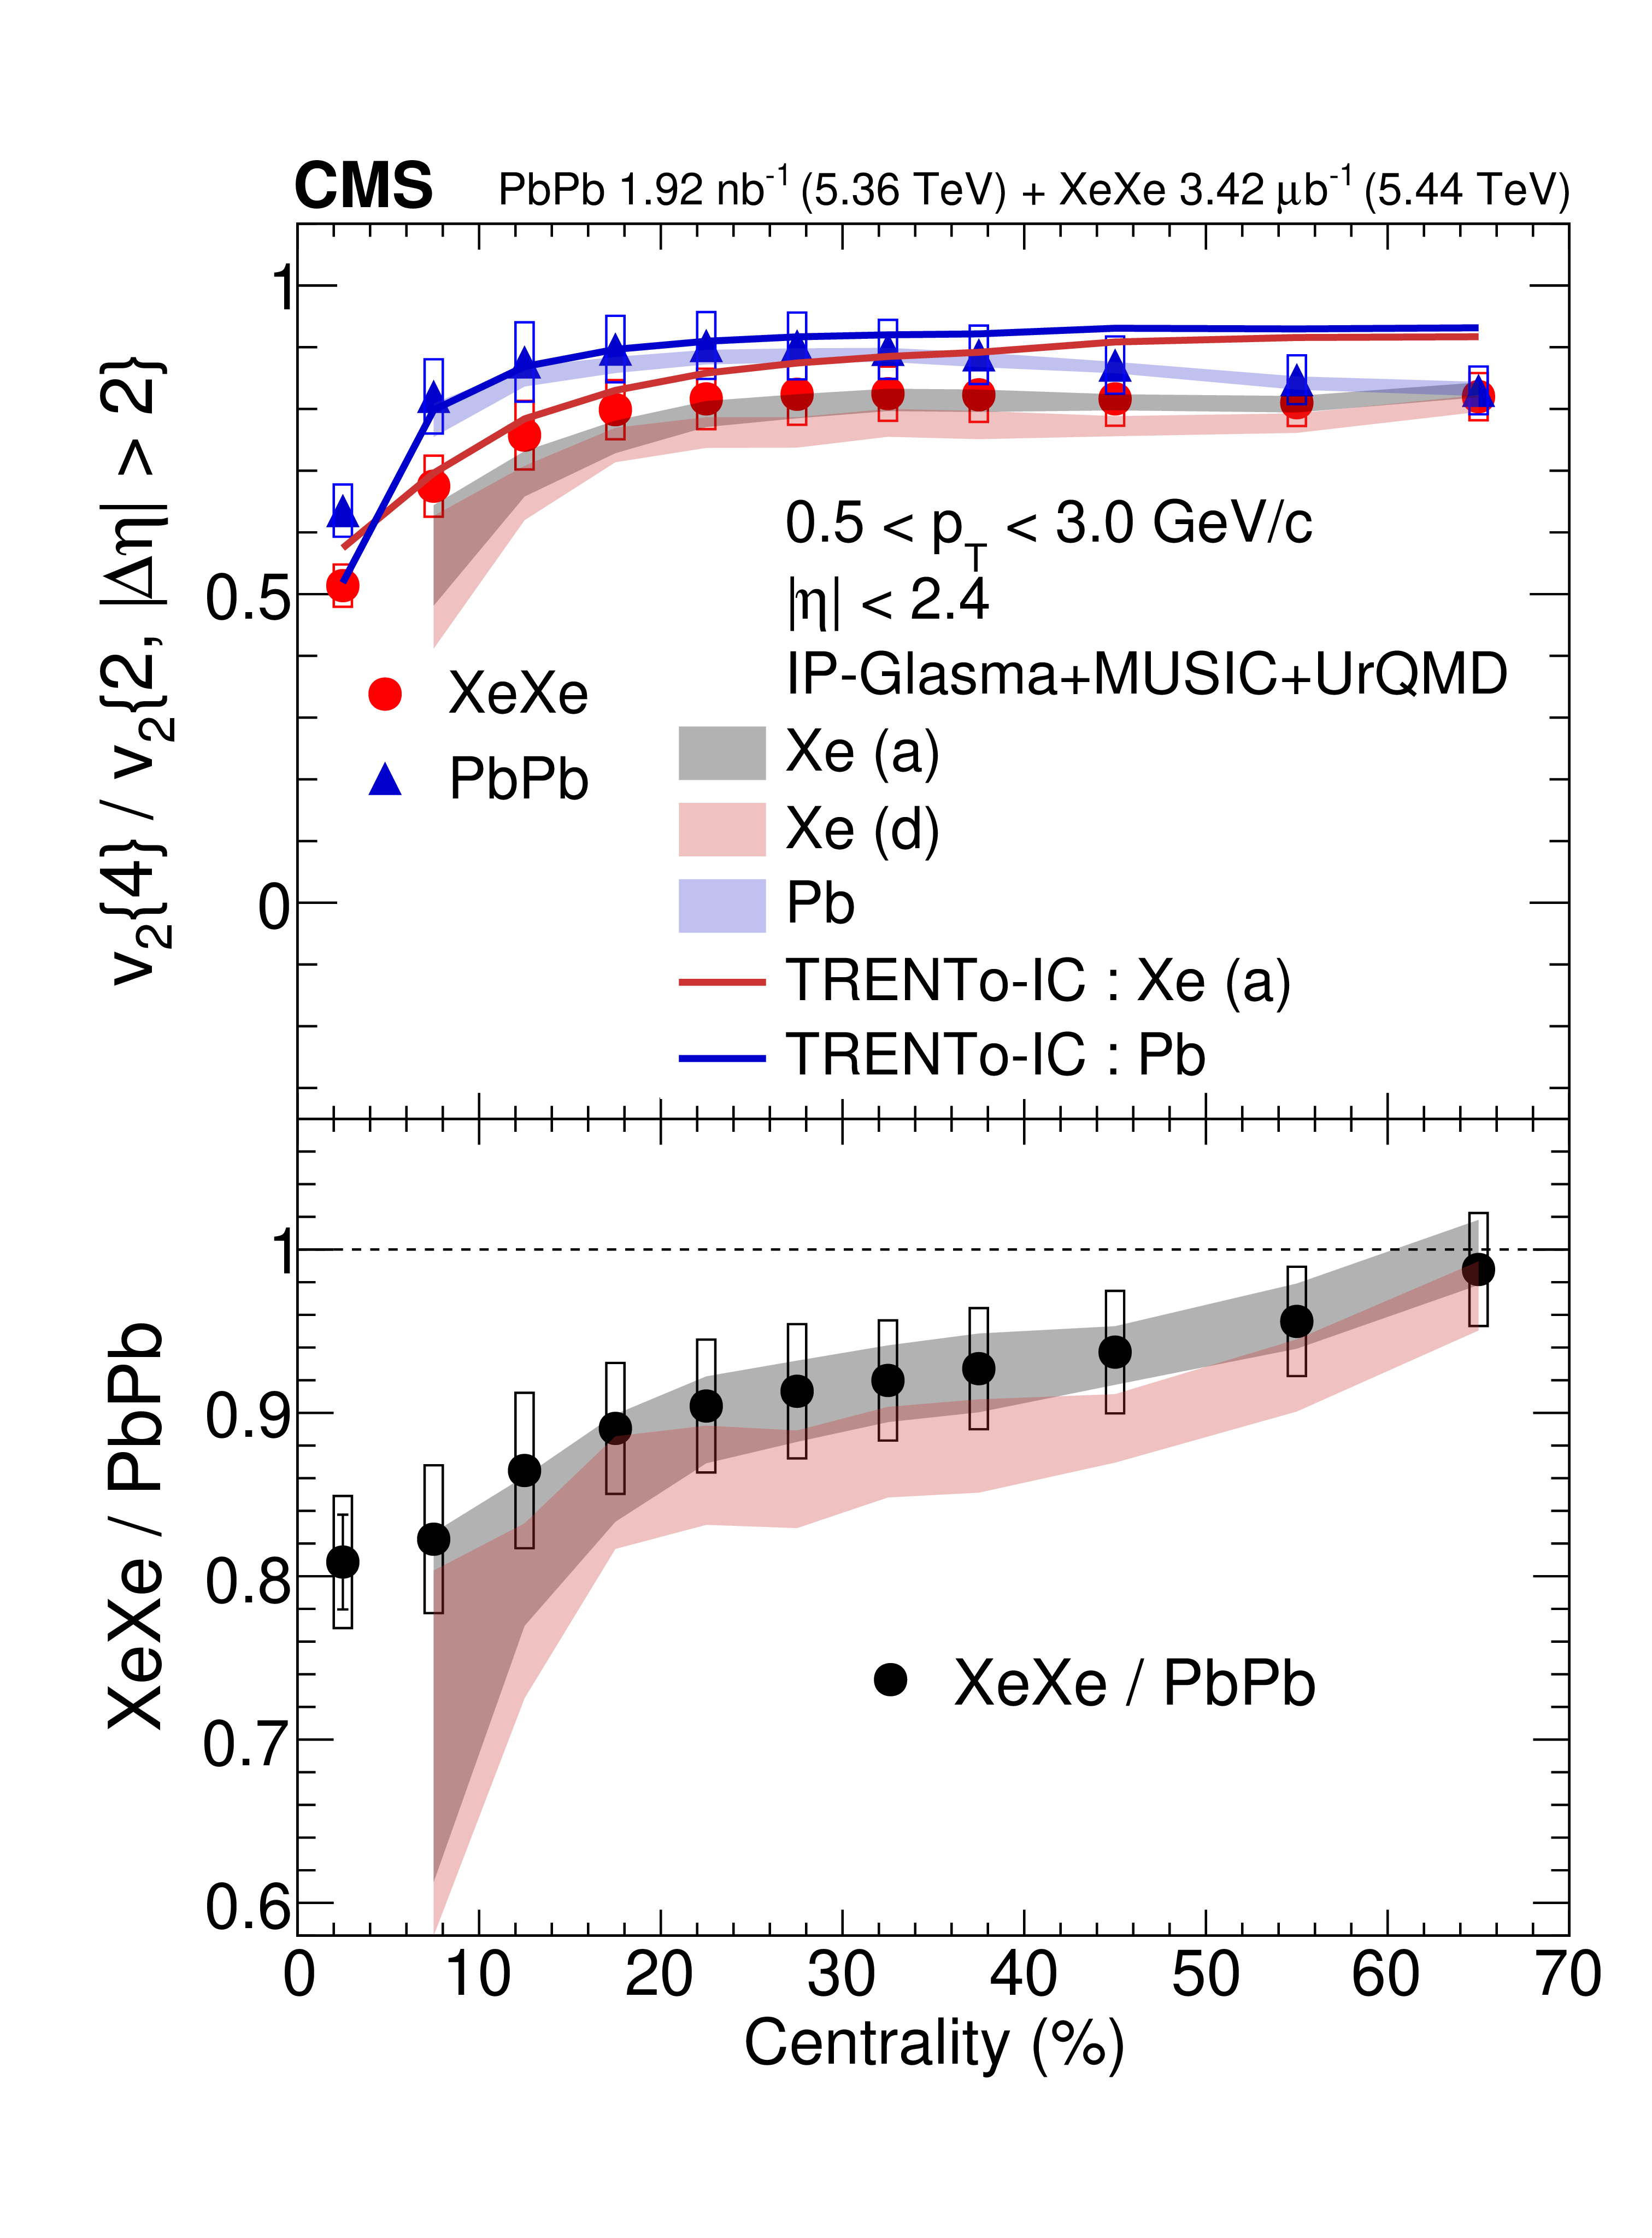
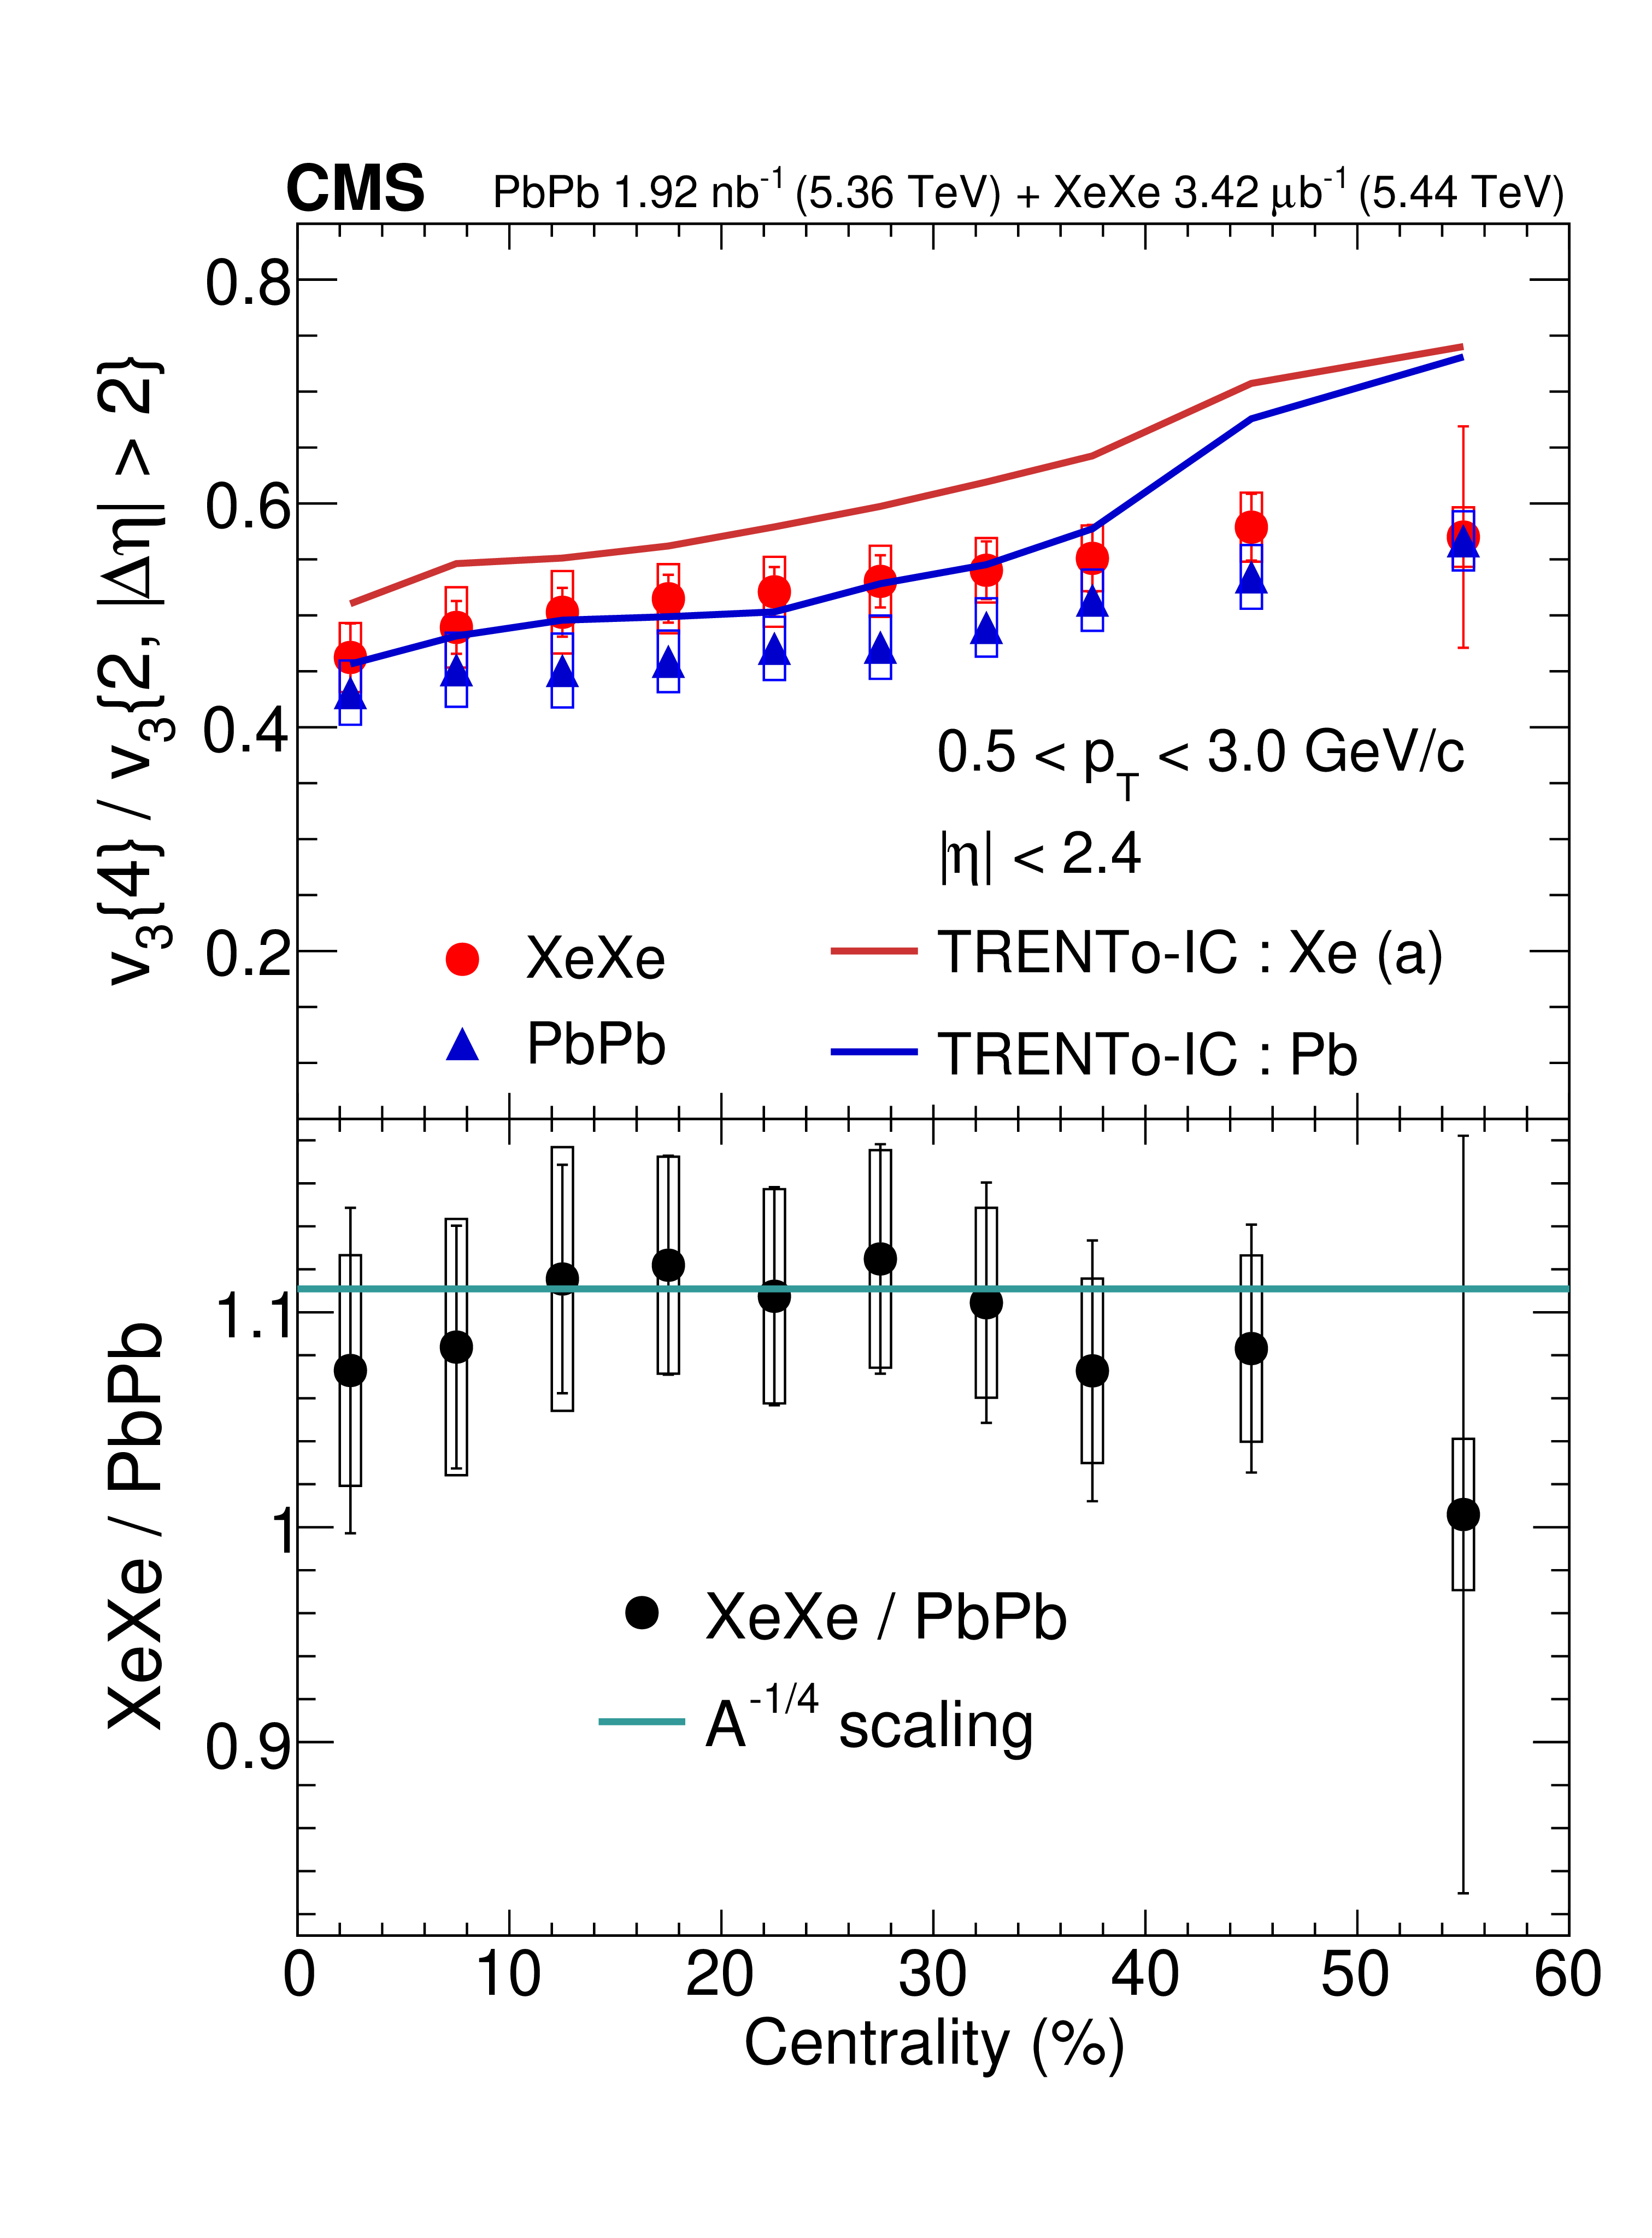
The upper plots show $ v_{n}\{4\}/v_{n}\{2,|\Delta\eta| > 2\} $ for elliptic ($ n = $ 2, left) and triangular ($ n = $ 3, right) flow, calculated from multiparticle cumulants, as a function of centrality in XeXe and PbPb collisions. The vertical bars (mostly smaller than the marker size) on the dots and the open boxes represent the statistical and systematic uncertainties in the data, respectively. The red and blue solid lines show the predictions from TRENTO-IC in terms of the initial-state eccentricities $ \varepsilon_{n} $ for deformed Xe (Xe (a)) and Pb nuclei. The shaded bands show the hydrodynamic predictions from the IP-GLASMA+MUSIC+URQMD model for Xe (a) and Xe (d). The lower plots display the ratio of the XeXe to the PbPb results. The cyan line in the lower right plot shows the theoretical prediction for $ v_{3}\{4\}/v_{3}\{2,|\Delta\eta| > 2\} $ based on $ A^{-1/4} $ scaling. |
png pdf |
Figure 2-a:
The upper plots show $ v_{n}\{4\}/v_{n}\{2,|\Delta\eta| > 2\} $ for elliptic ($ n = $ 2, left) and triangular ($ n = $ 3, right) flow, calculated from multiparticle cumulants, as a function of centrality in XeXe and PbPb collisions. The vertical bars (mostly smaller than the marker size) on the dots and the open boxes represent the statistical and systematic uncertainties in the data, respectively. The red and blue solid lines show the predictions from TRENTO-IC in terms of the initial-state eccentricities $ \varepsilon_{n} $ for deformed Xe (Xe (a)) and Pb nuclei. The shaded bands show the hydrodynamic predictions from the IP-GLASMA+MUSIC+URQMD model for Xe (a) and Xe (d). The lower plots display the ratio of the XeXe to the PbPb results. The cyan line in the lower right plot shows the theoretical prediction for $ v_{3}\{4\}/v_{3}\{2,|\Delta\eta| > 2\} $ based on $ A^{-1/4} $ scaling. |
png pdf |
Figure 2-b:
The upper plots show $ v_{n}\{4\}/v_{n}\{2,|\Delta\eta| > 2\} $ for elliptic ($ n = $ 2, left) and triangular ($ n = $ 3, right) flow, calculated from multiparticle cumulants, as a function of centrality in XeXe and PbPb collisions. The vertical bars (mostly smaller than the marker size) on the dots and the open boxes represent the statistical and systematic uncertainties in the data, respectively. The red and blue solid lines show the predictions from TRENTO-IC in terms of the initial-state eccentricities $ \varepsilon_{n} $ for deformed Xe (Xe (a)) and Pb nuclei. The shaded bands show the hydrodynamic predictions from the IP-GLASMA+MUSIC+URQMD model for Xe (a) and Xe (d). The lower plots display the ratio of the XeXe to the PbPb results. The cyan line in the lower right plot shows the theoretical prediction for $ v_{3}\{4\}/v_{3}\{2,|\Delta\eta| > 2\} $ based on $ A^{-1/4} $ scaling. |
png pdf |
Figure 3:
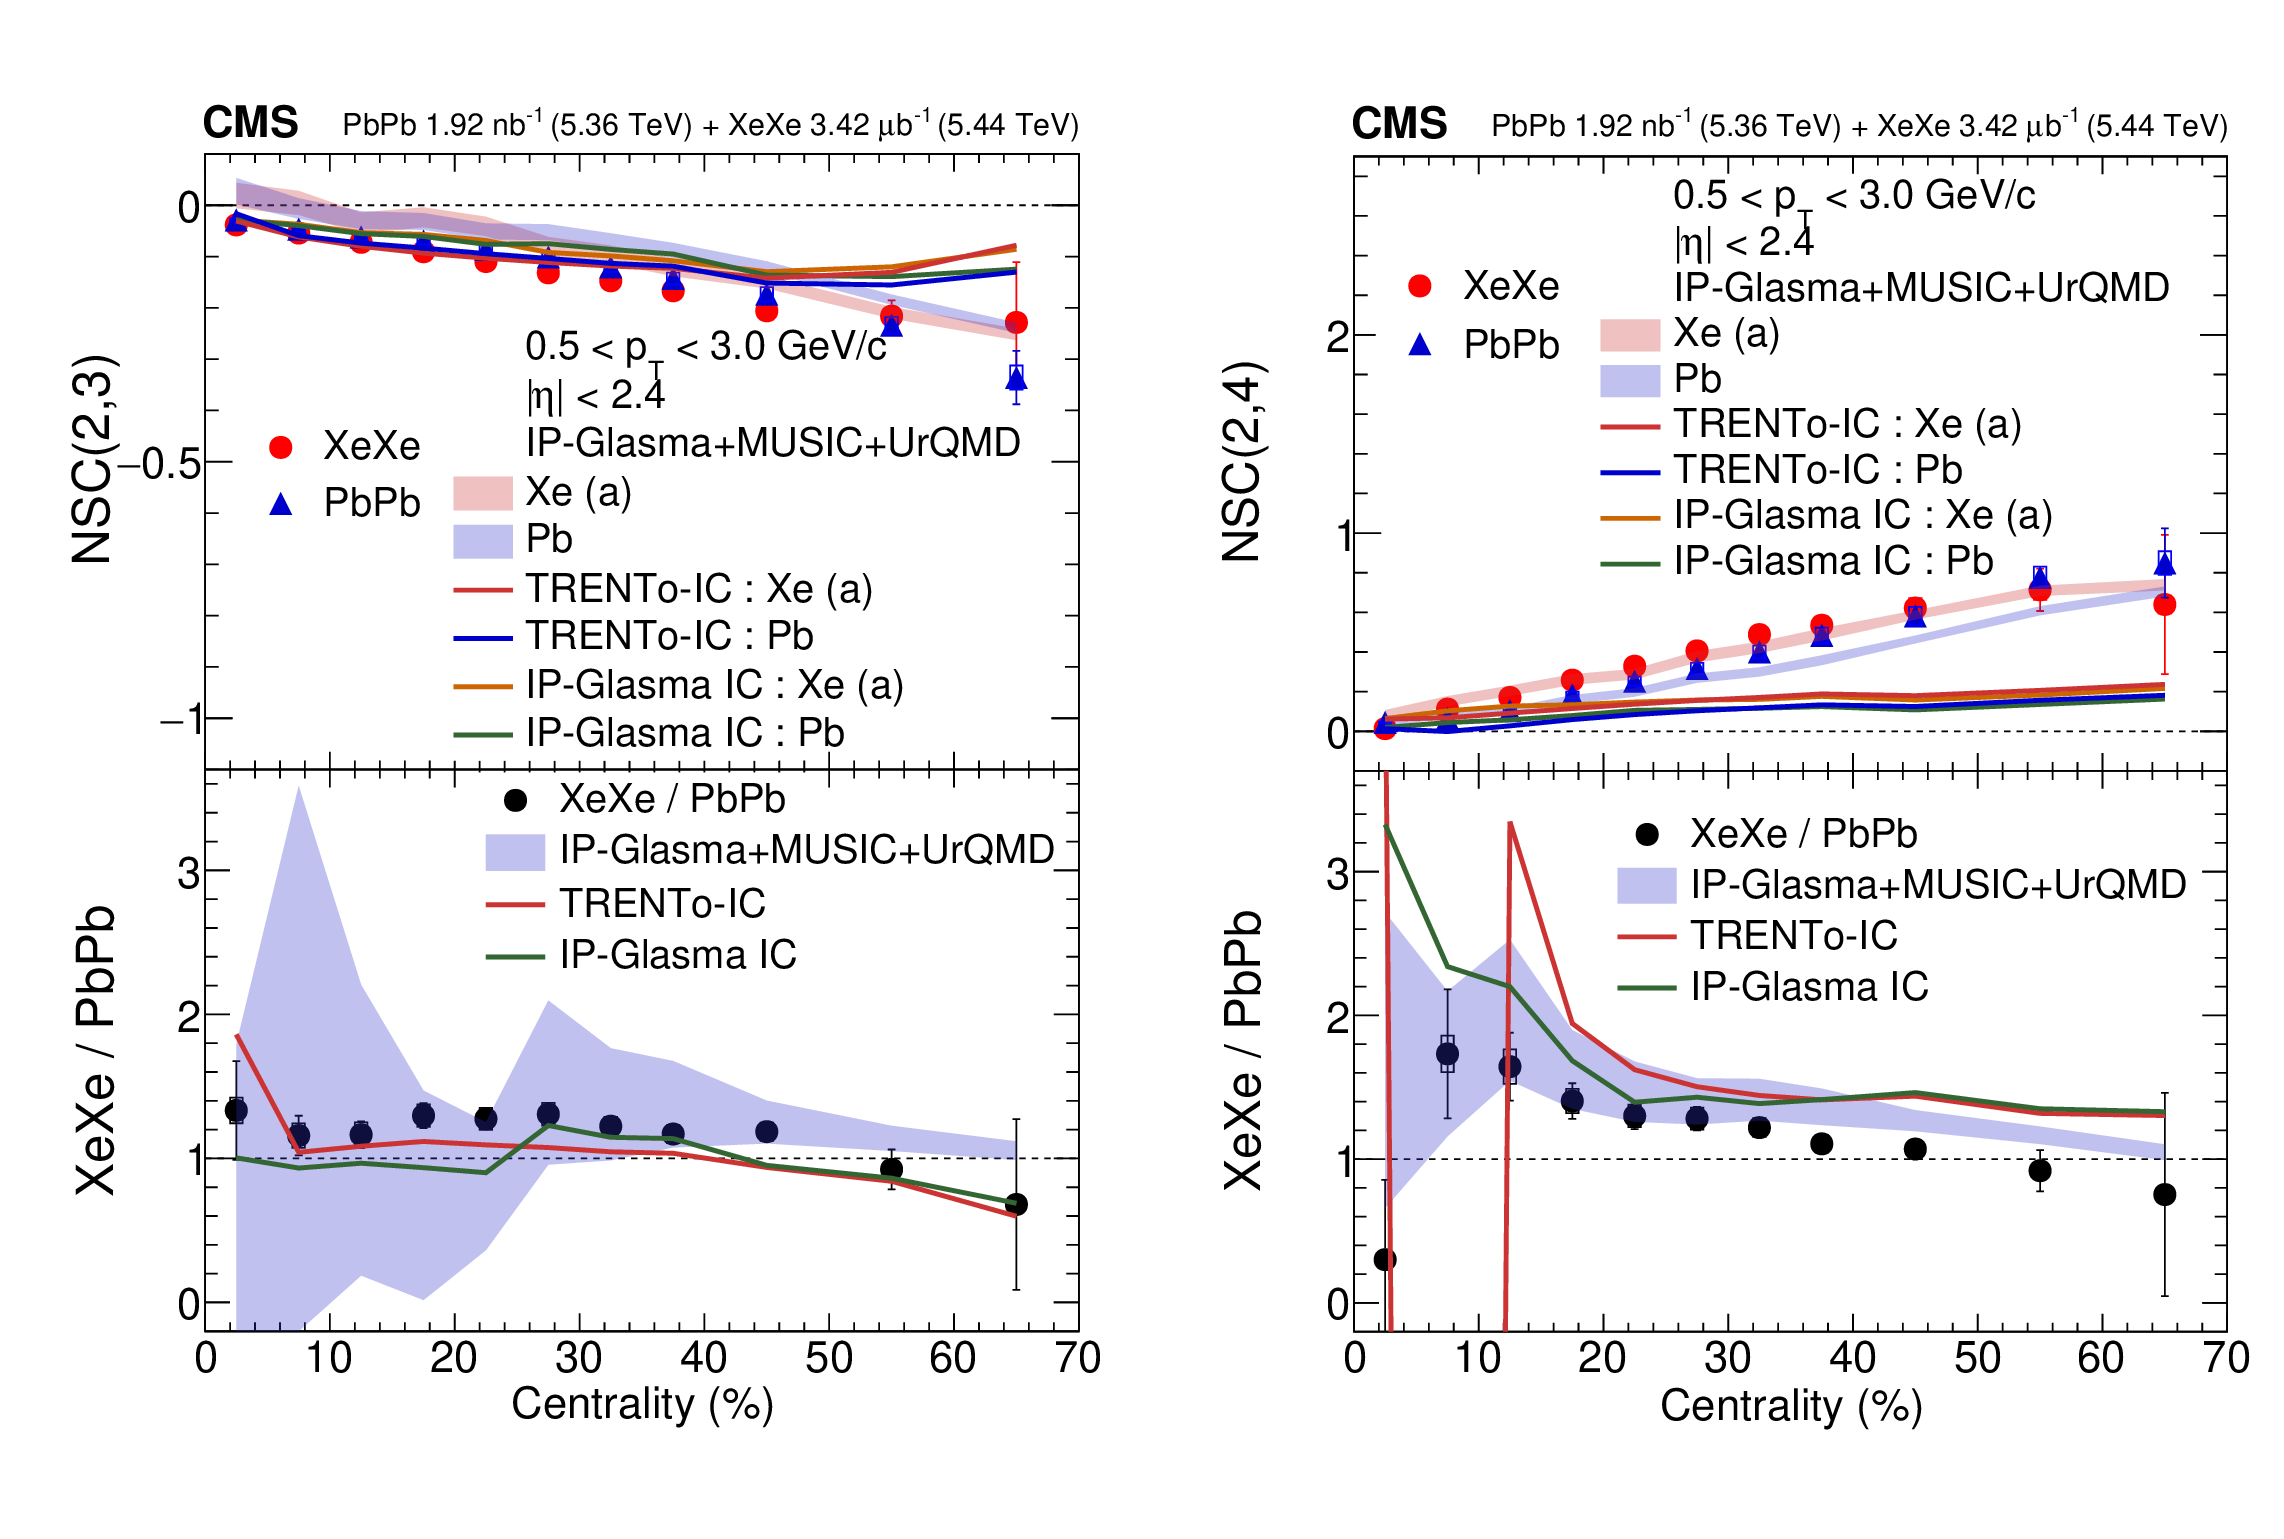
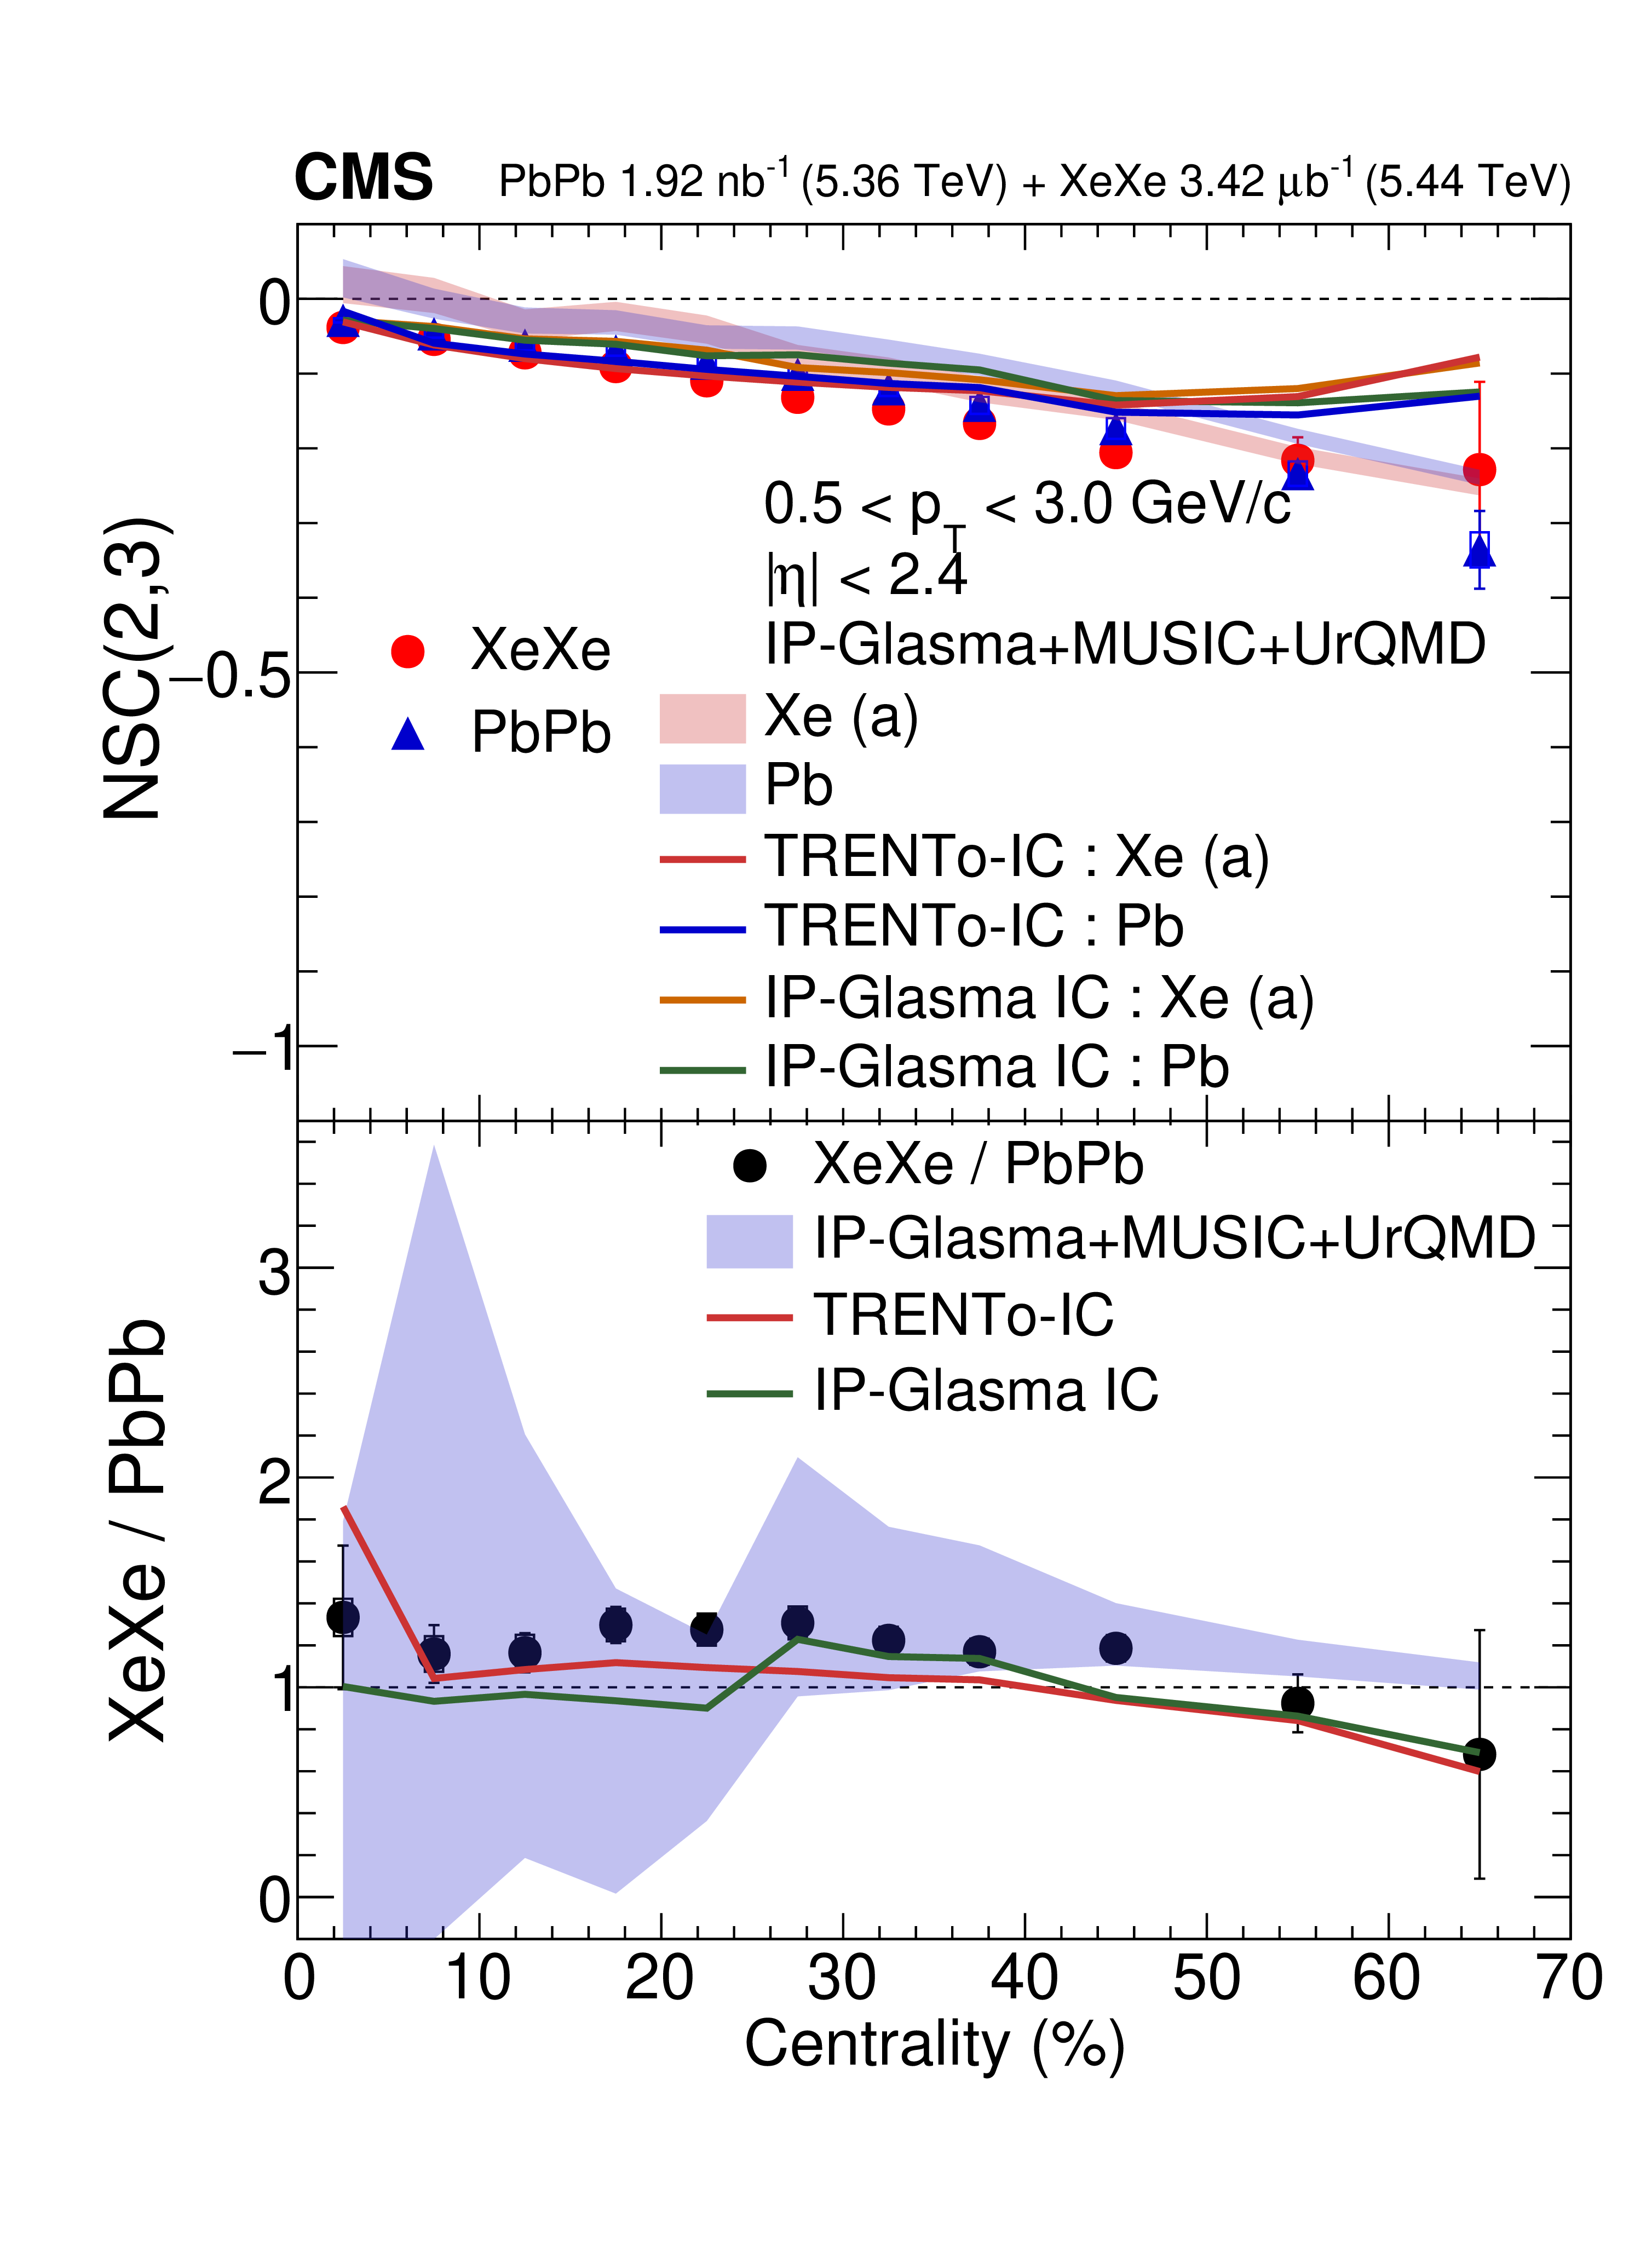
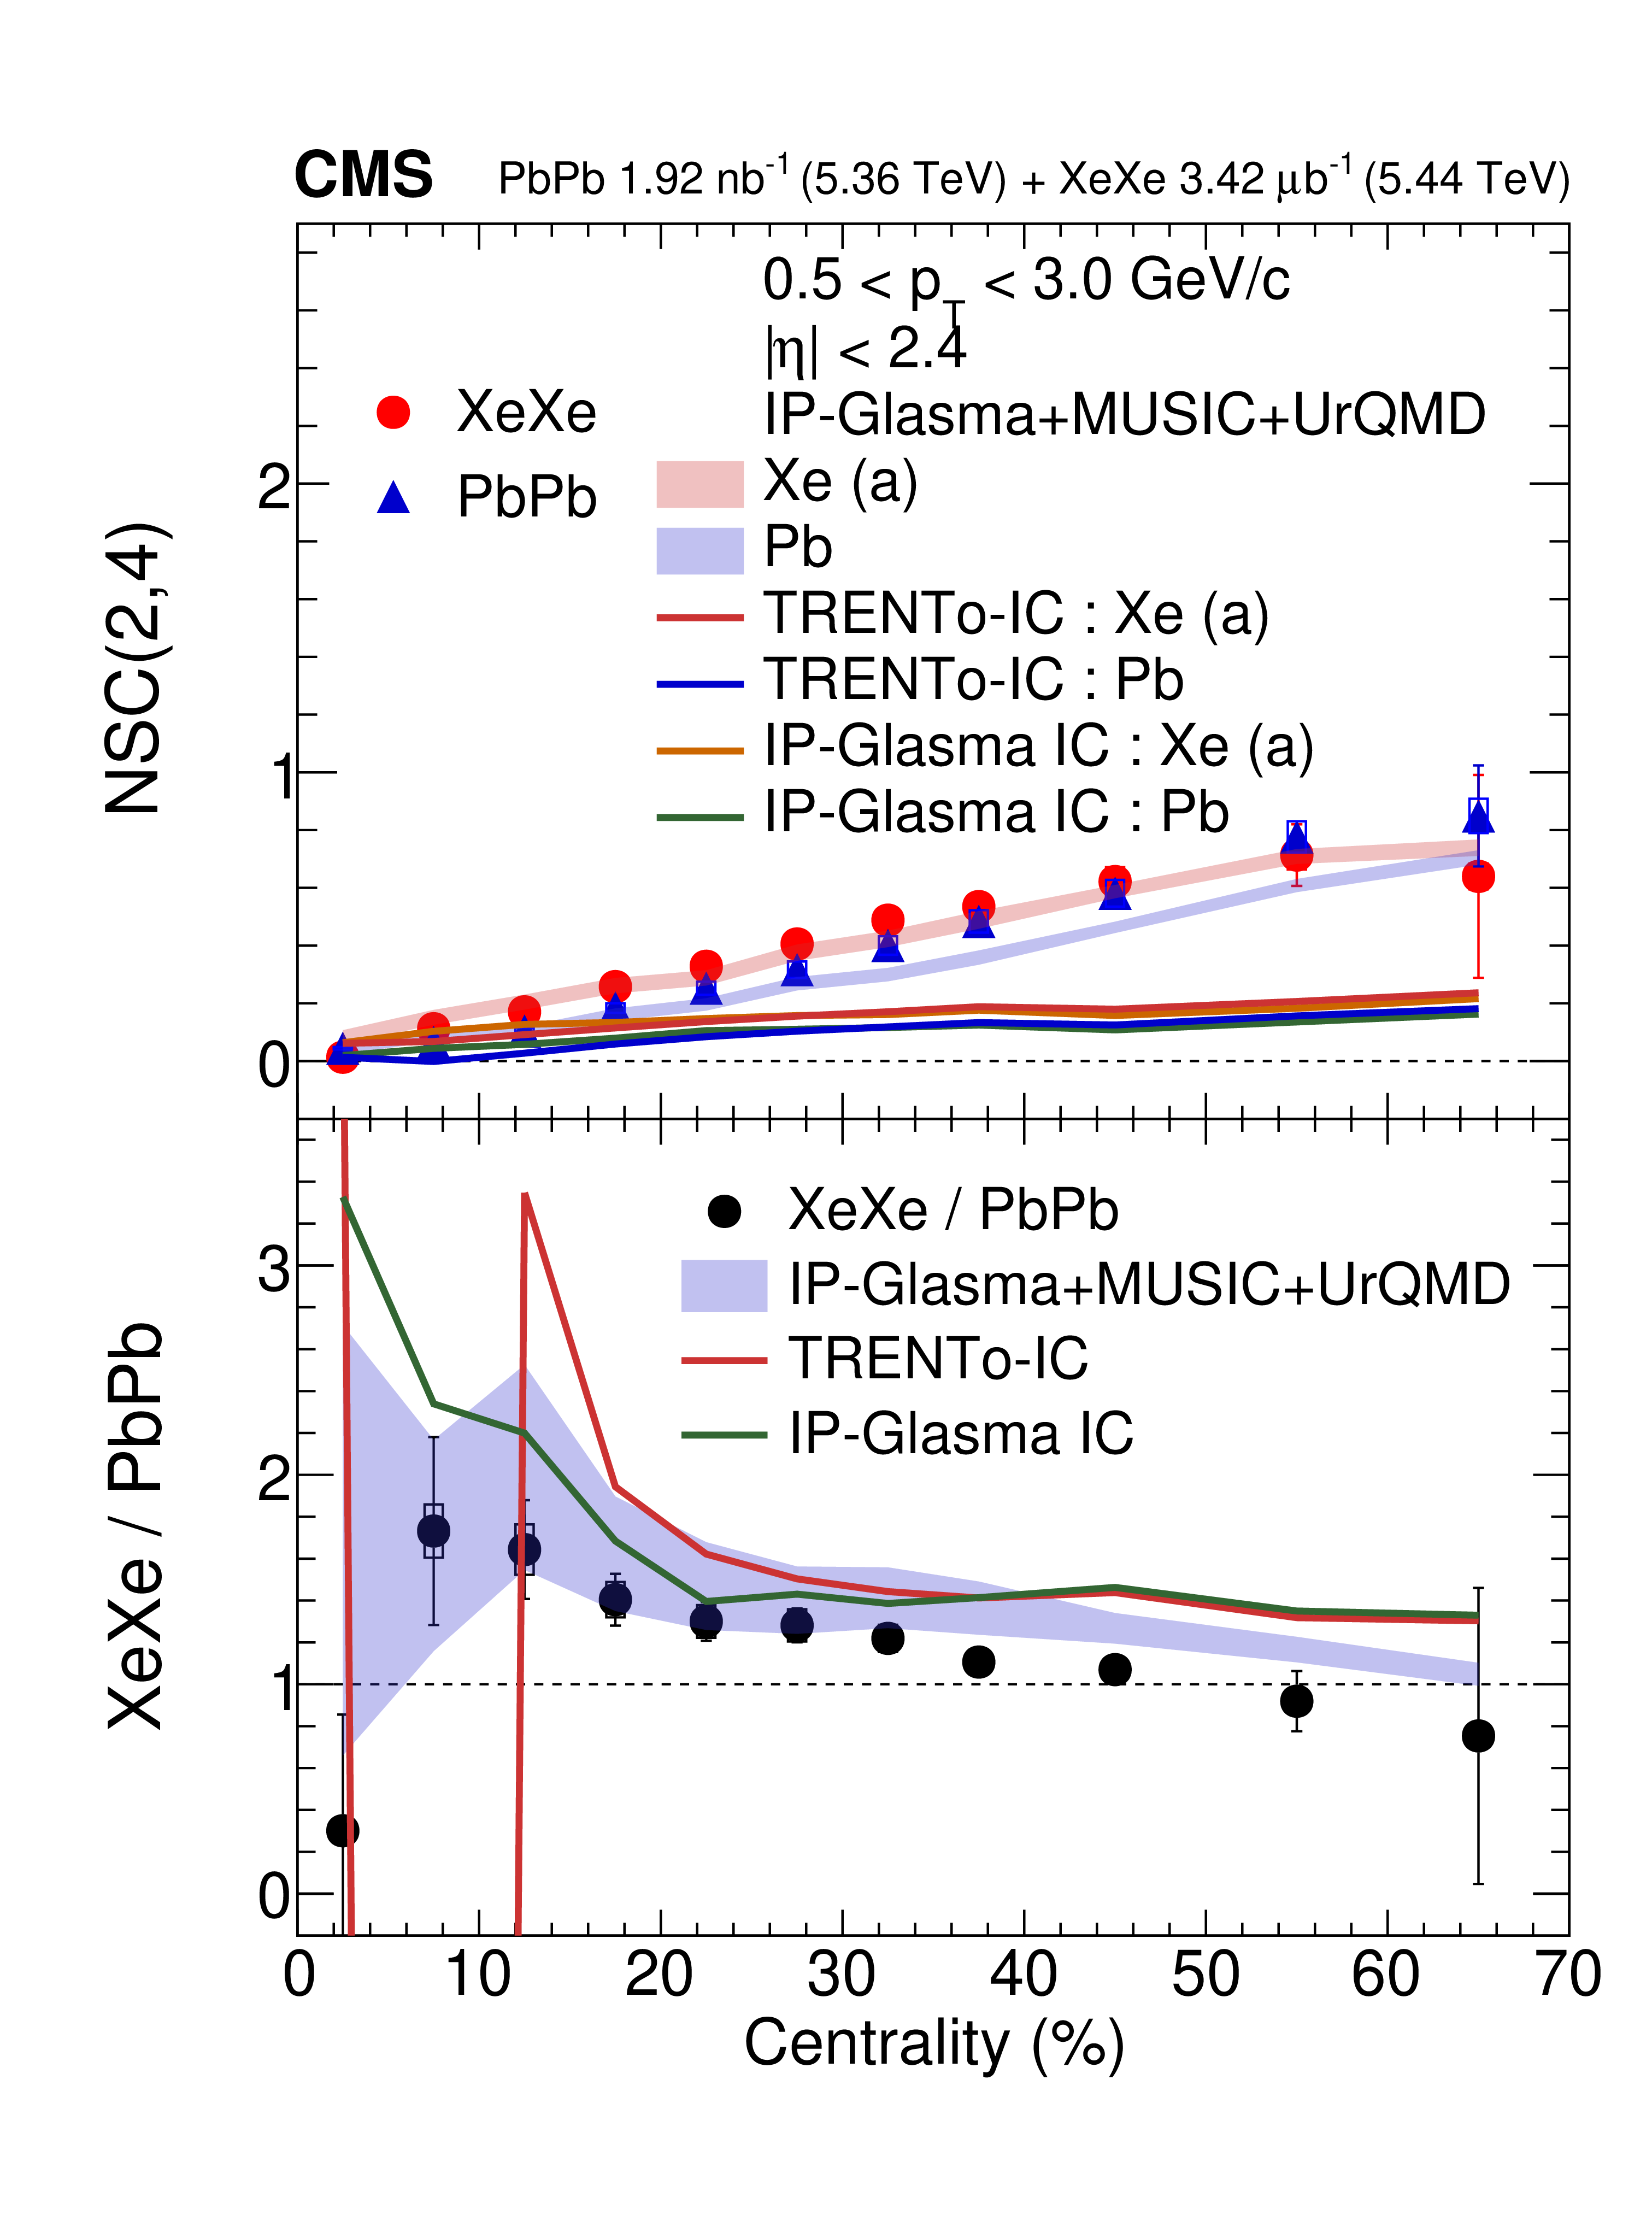
The upper plots show the normalized symmetric cumulants NSC(2 $, $ 3) (left) and NSC(2 $, $ 4) (right) as functions of centrality in XeXe and PbPb collisions, calculated from multiparticle cumulants. The vertical bars and the open boxes represent the statistical and systematic uncertainties, respectively. The red and blue solid lines show the predictions from TRENTO-IC in terms of initial-state eccentricities $ \varepsilon_{n} $ for deformed Xe (Xe (a)) and Pb nuclei. The orange and green solid lines show the predictions from the IP-GLASMA-IC model with the same Xe and Pb nucleus parameters, while the shaded bands show the hydrodynamic predictions from the IP-GLASMA+MUSIC+URQMD model. The lower plots display the corresponding ratios of NSC($ m,n $) for XeXe/PbPb. The red solid lines show the initial-state predictions from TRENTO-IC, while the green solid lines show those from IP-GLASMA-IC. The blue shaded band is the hydrodynamic prediction from IP-GLASMA+MUSIC+URQMD. In the 5-10% centrality range, the TRENTO-IC NSC(2 $, $ 4) ratio is negative because the PbPb prediction lies just below zero. |
png pdf |
Figure 3-a:
The upper plots show the normalized symmetric cumulants NSC(2 $, $ 3) (left) and NSC(2 $, $ 4) (right) as functions of centrality in XeXe and PbPb collisions, calculated from multiparticle cumulants. The vertical bars and the open boxes represent the statistical and systematic uncertainties, respectively. The red and blue solid lines show the predictions from TRENTO-IC in terms of initial-state eccentricities $ \varepsilon_{n} $ for deformed Xe (Xe (a)) and Pb nuclei. The orange and green solid lines show the predictions from the IP-GLASMA-IC model with the same Xe and Pb nucleus parameters, while the shaded bands show the hydrodynamic predictions from the IP-GLASMA+MUSIC+URQMD model. The lower plots display the corresponding ratios of NSC($ m,n $) for XeXe/PbPb. The red solid lines show the initial-state predictions from TRENTO-IC, while the green solid lines show those from IP-GLASMA-IC. The blue shaded band is the hydrodynamic prediction from IP-GLASMA+MUSIC+URQMD. In the 5-10% centrality range, the TRENTO-IC NSC(2 $, $ 4) ratio is negative because the PbPb prediction lies just below zero. |
png pdf |
Figure 3-b:
The upper plots show the normalized symmetric cumulants NSC(2 $, $ 3) (left) and NSC(2 $, $ 4) (right) as functions of centrality in XeXe and PbPb collisions, calculated from multiparticle cumulants. The vertical bars and the open boxes represent the statistical and systematic uncertainties, respectively. The red and blue solid lines show the predictions from TRENTO-IC in terms of initial-state eccentricities $ \varepsilon_{n} $ for deformed Xe (Xe (a)) and Pb nuclei. The orange and green solid lines show the predictions from the IP-GLASMA-IC model with the same Xe and Pb nucleus parameters, while the shaded bands show the hydrodynamic predictions from the IP-GLASMA+MUSIC+URQMD model. The lower plots display the corresponding ratios of NSC($ m,n $) for XeXe/PbPb. The red solid lines show the initial-state predictions from TRENTO-IC, while the green solid lines show those from IP-GLASMA-IC. The blue shaded band is the hydrodynamic prediction from IP-GLASMA+MUSIC+URQMD. In the 5-10% centrality range, the TRENTO-IC NSC(2 $, $ 4) ratio is negative because the PbPb prediction lies just below zero. |
png pdf |
Figure 4:
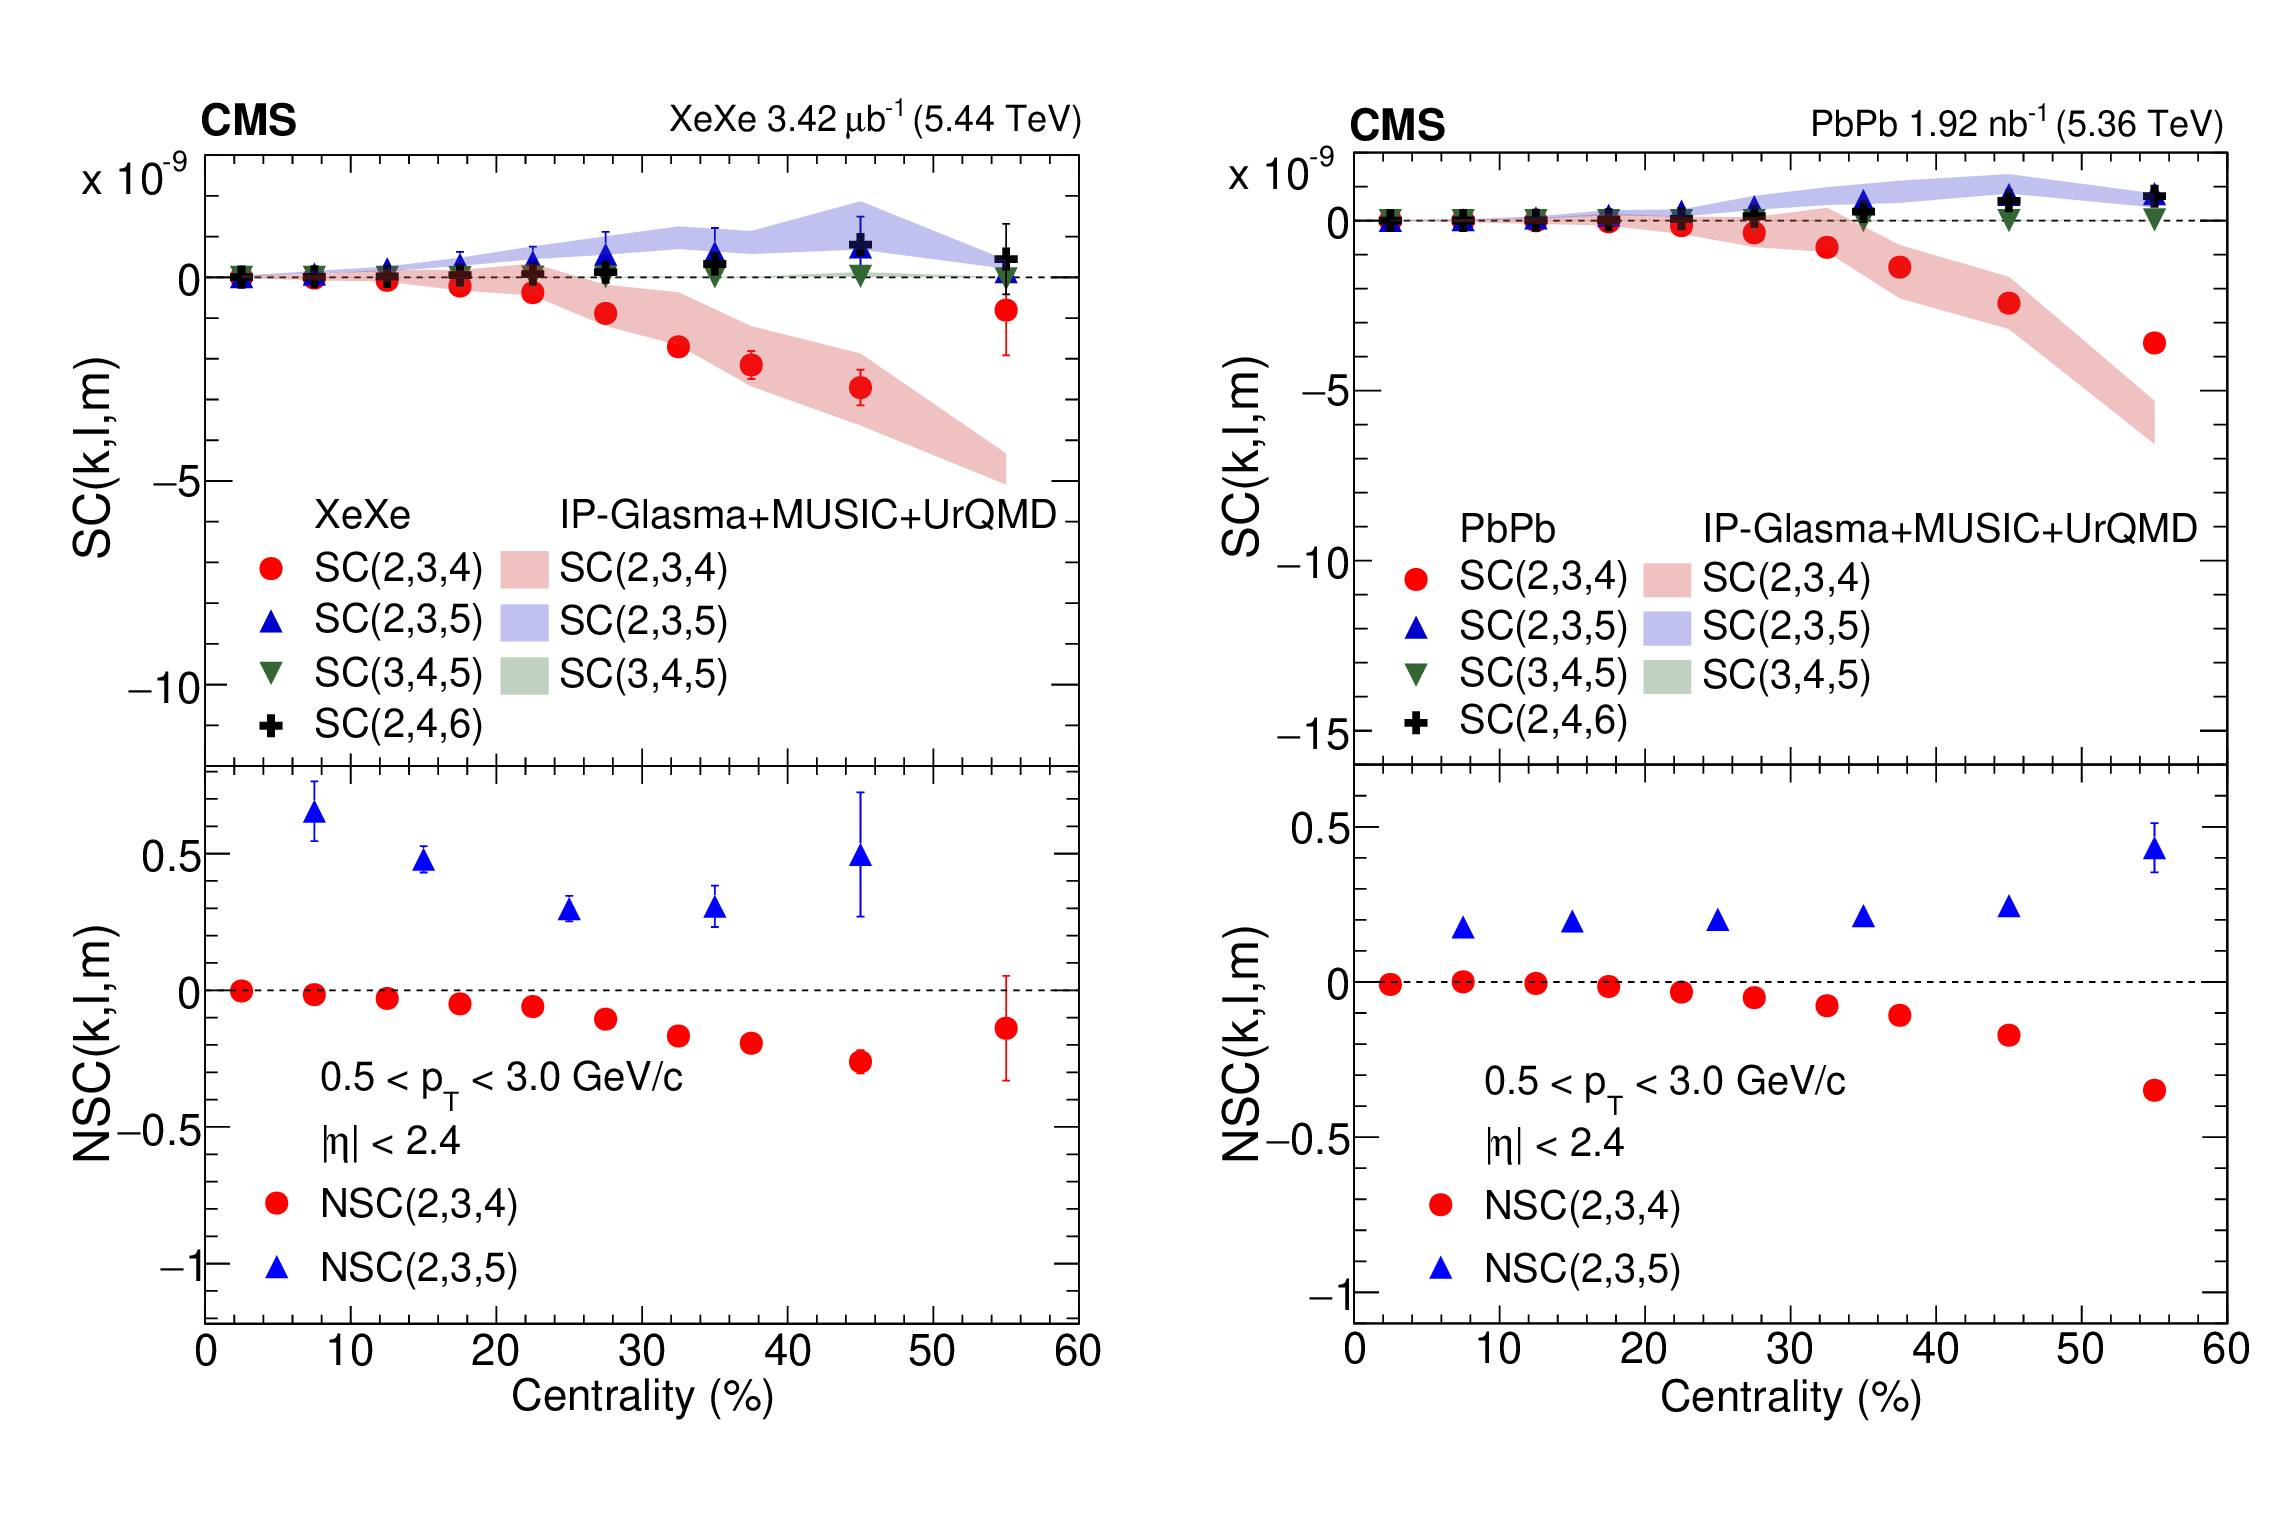
A selection of six-particle three-harmonic SC and NSC cumulants as functions of centrality in XeXe (left) and PbPb (right) collisions, calculated from multiparticle cumulants. The vertical bars represent the statistical uncertainties, with the systematic uncertainties being negligible. The shaded bands show hydrodynamic predictions from the IP-GLASMA+MUSIC+URQMD model for the Xe (a) deformed nuclear shape parameters and for the spherical Pb nucleus. |
png pdf |
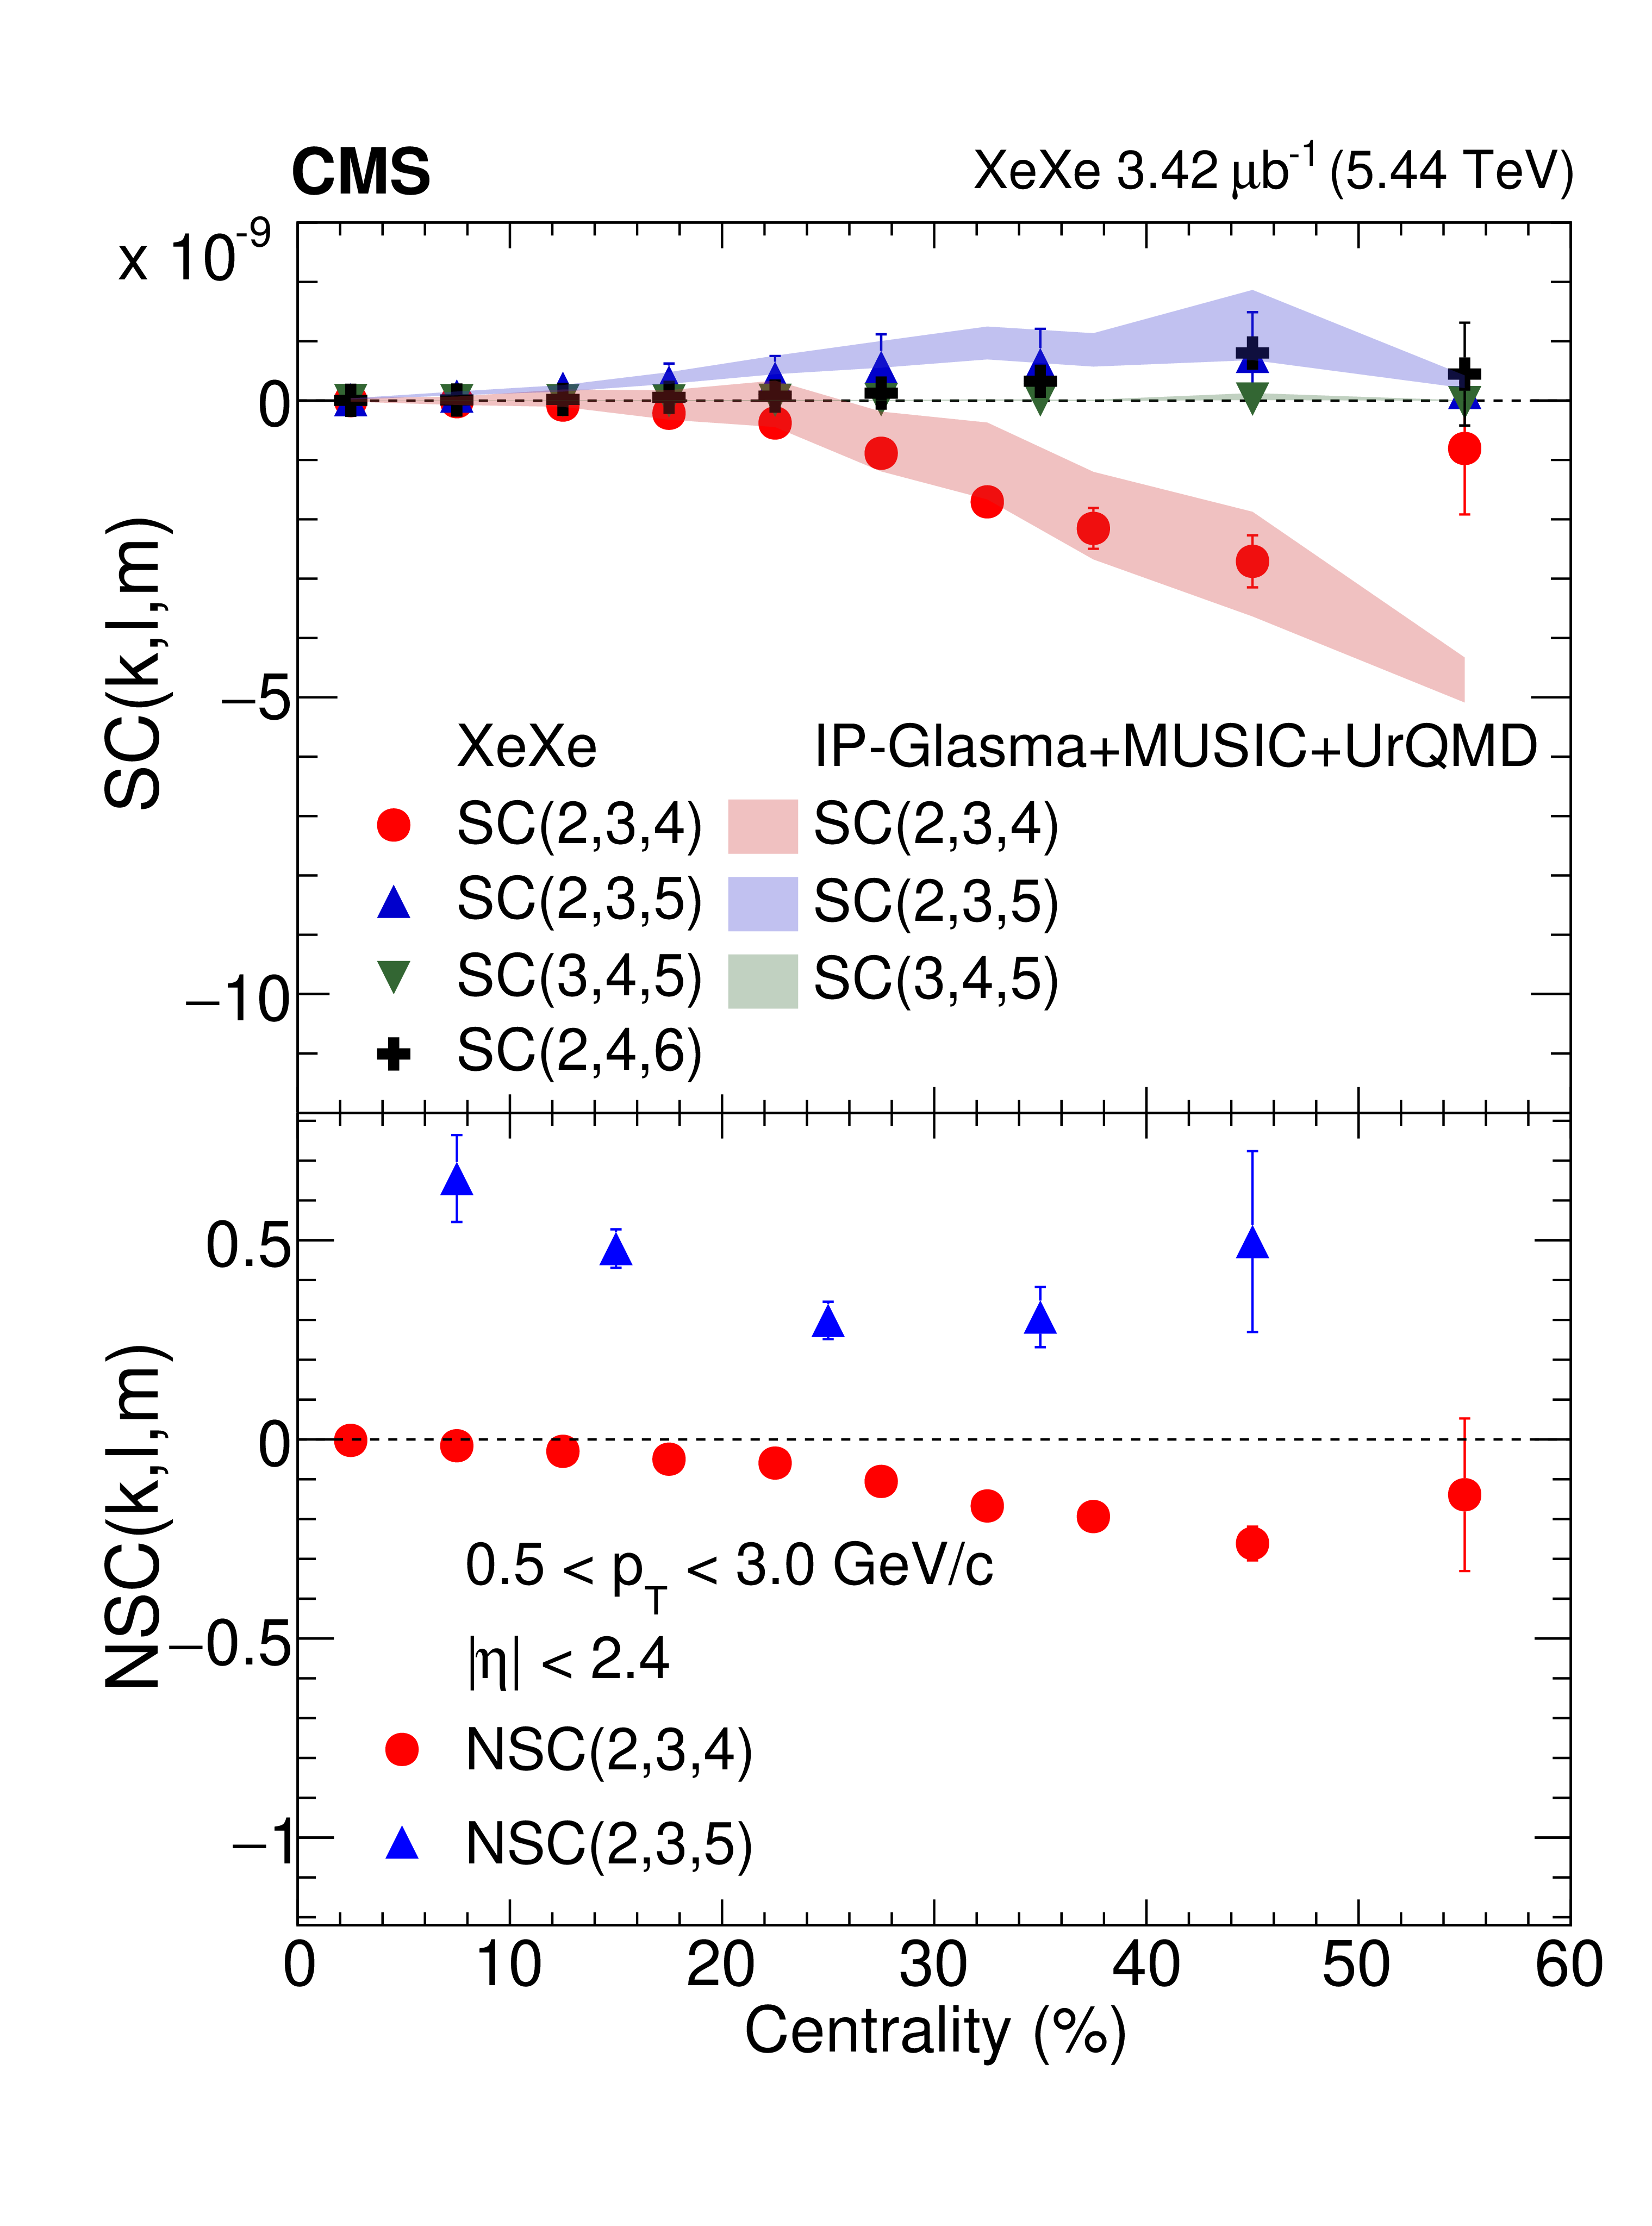
Figure 4-a:
A selection of six-particle three-harmonic SC and NSC cumulants as functions of centrality in XeXe (left) and PbPb (right) collisions, calculated from multiparticle cumulants. The vertical bars represent the statistical uncertainties, with the systematic uncertainties being negligible. The shaded bands show hydrodynamic predictions from the IP-GLASMA+MUSIC+URQMD model for the Xe (a) deformed nuclear shape parameters and for the spherical Pb nucleus. |
png pdf |
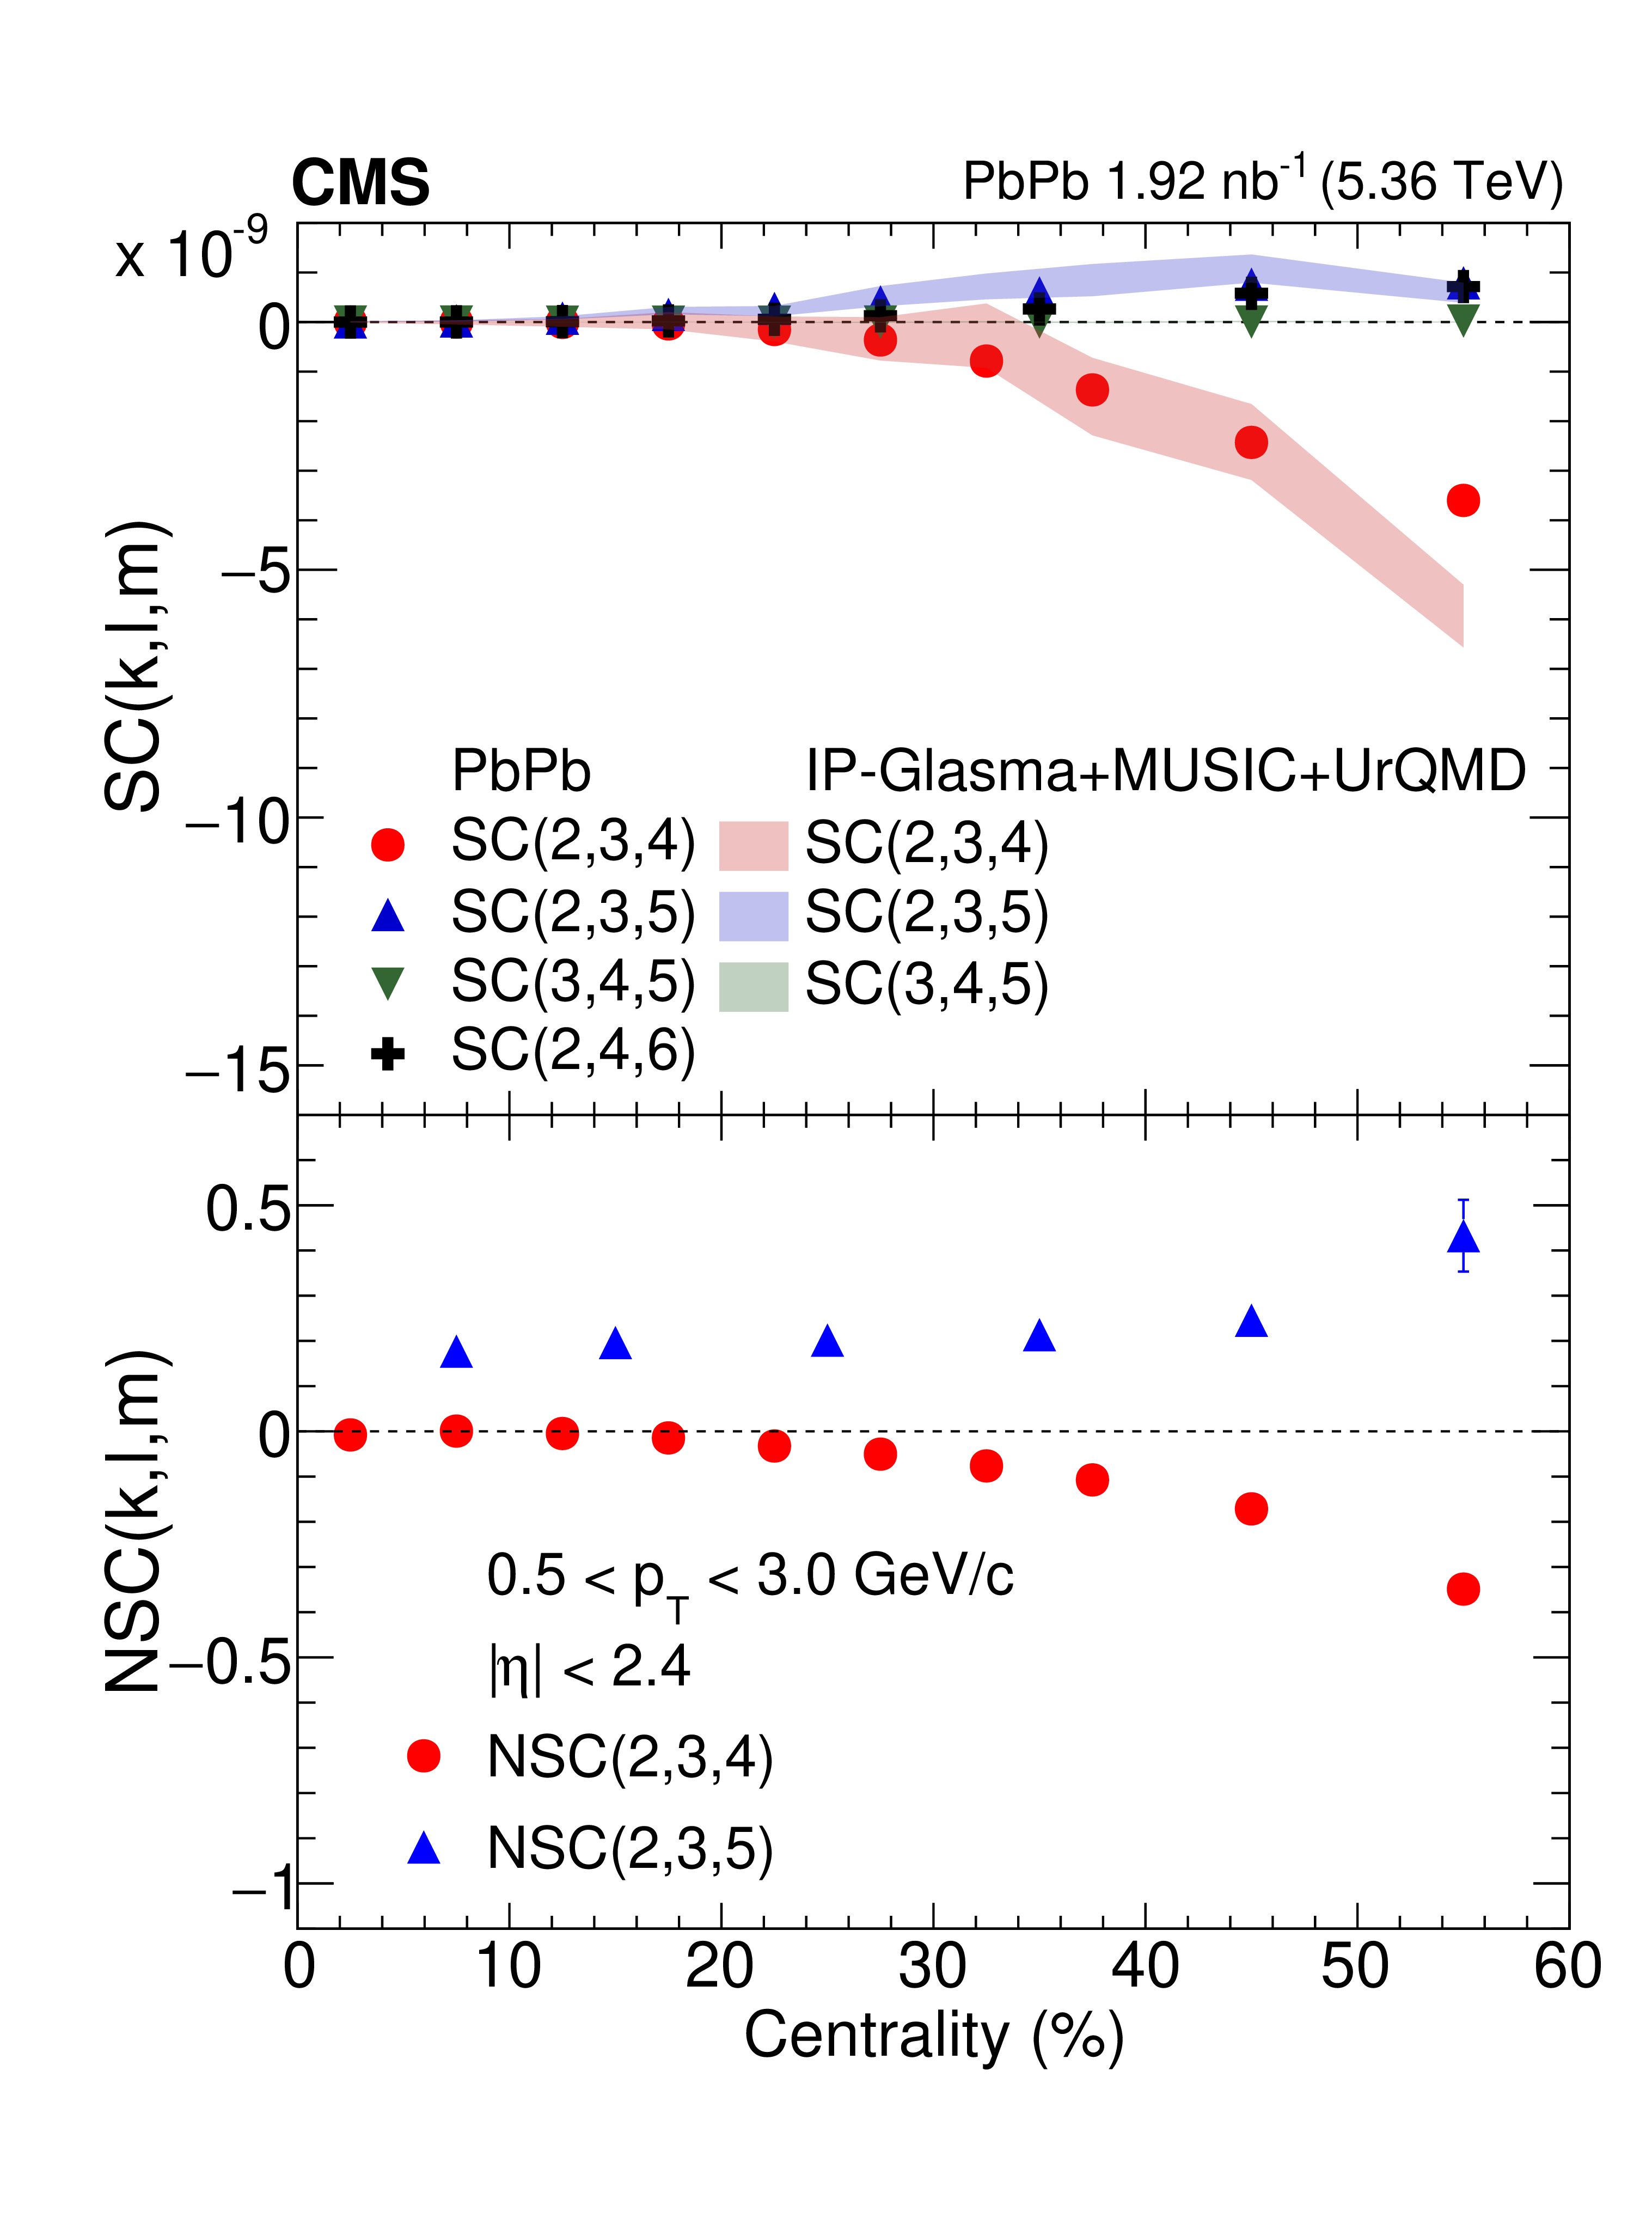
Figure 4-b:
A selection of six-particle three-harmonic SC and NSC cumulants as functions of centrality in XeXe (left) and PbPb (right) collisions, calculated from multiparticle cumulants. The vertical bars represent the statistical uncertainties, with the systematic uncertainties being negligible. The shaded bands show hydrodynamic predictions from the IP-GLASMA+MUSIC+URQMD model for the Xe (a) deformed nuclear shape parameters and for the spherical Pb nucleus. |
png pdf |
Figure 5:
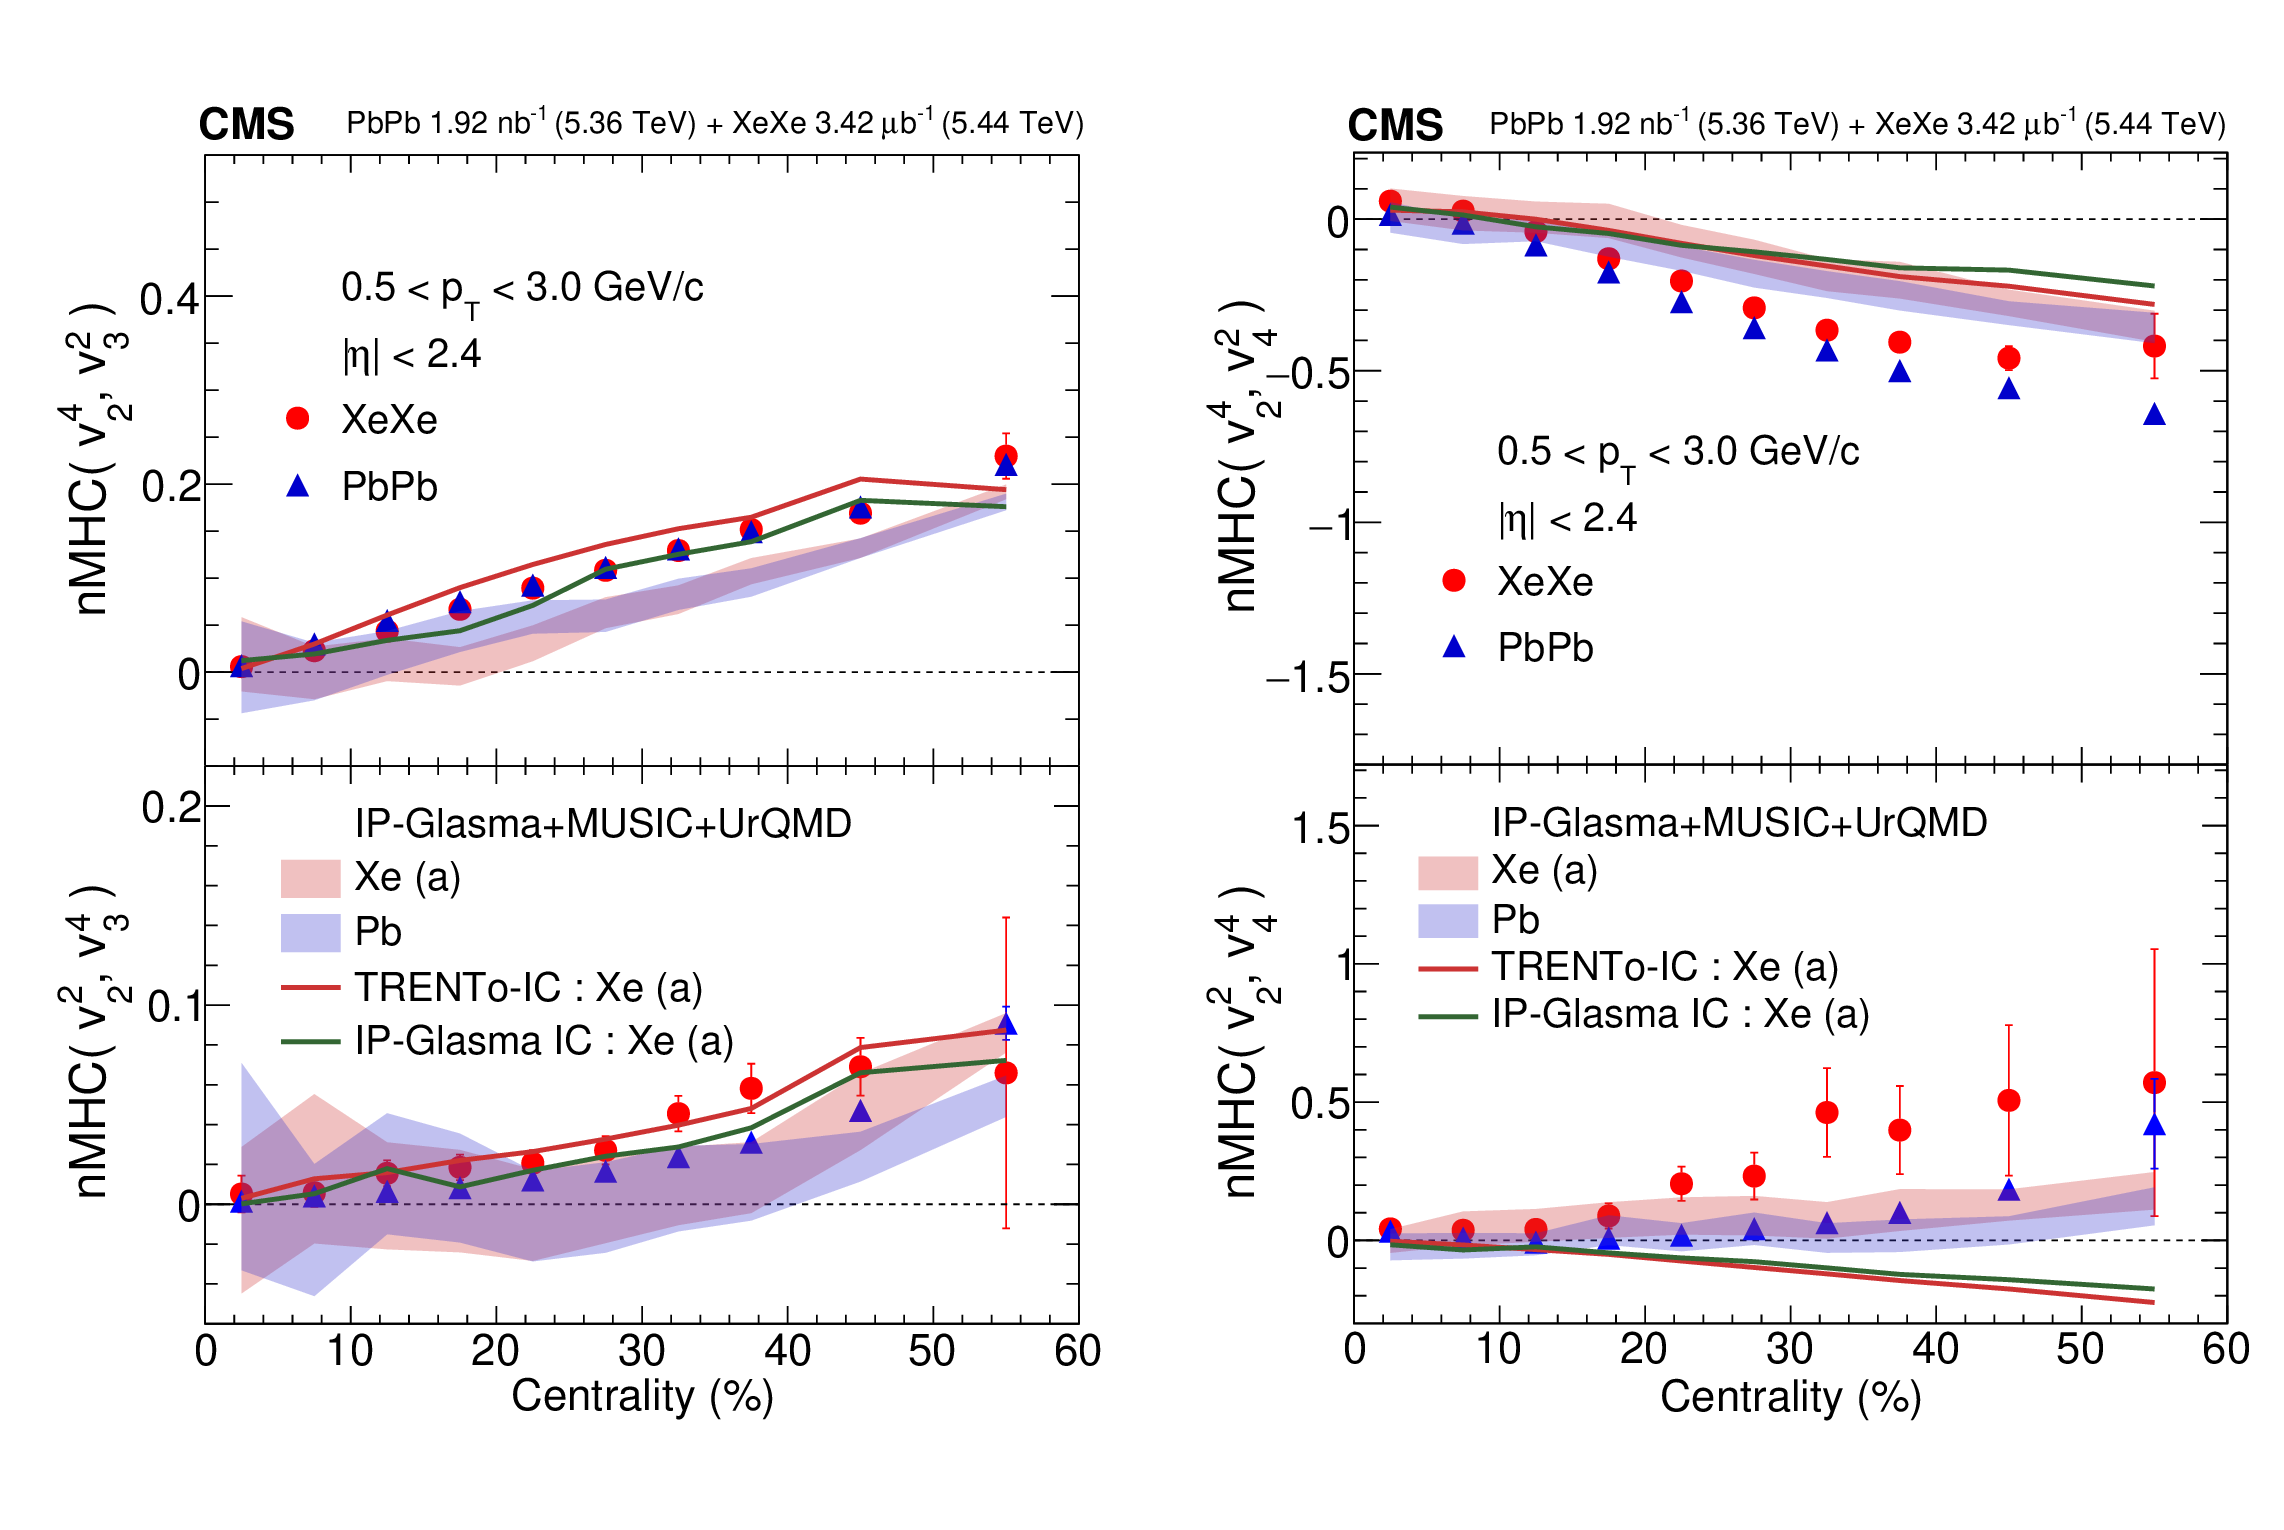
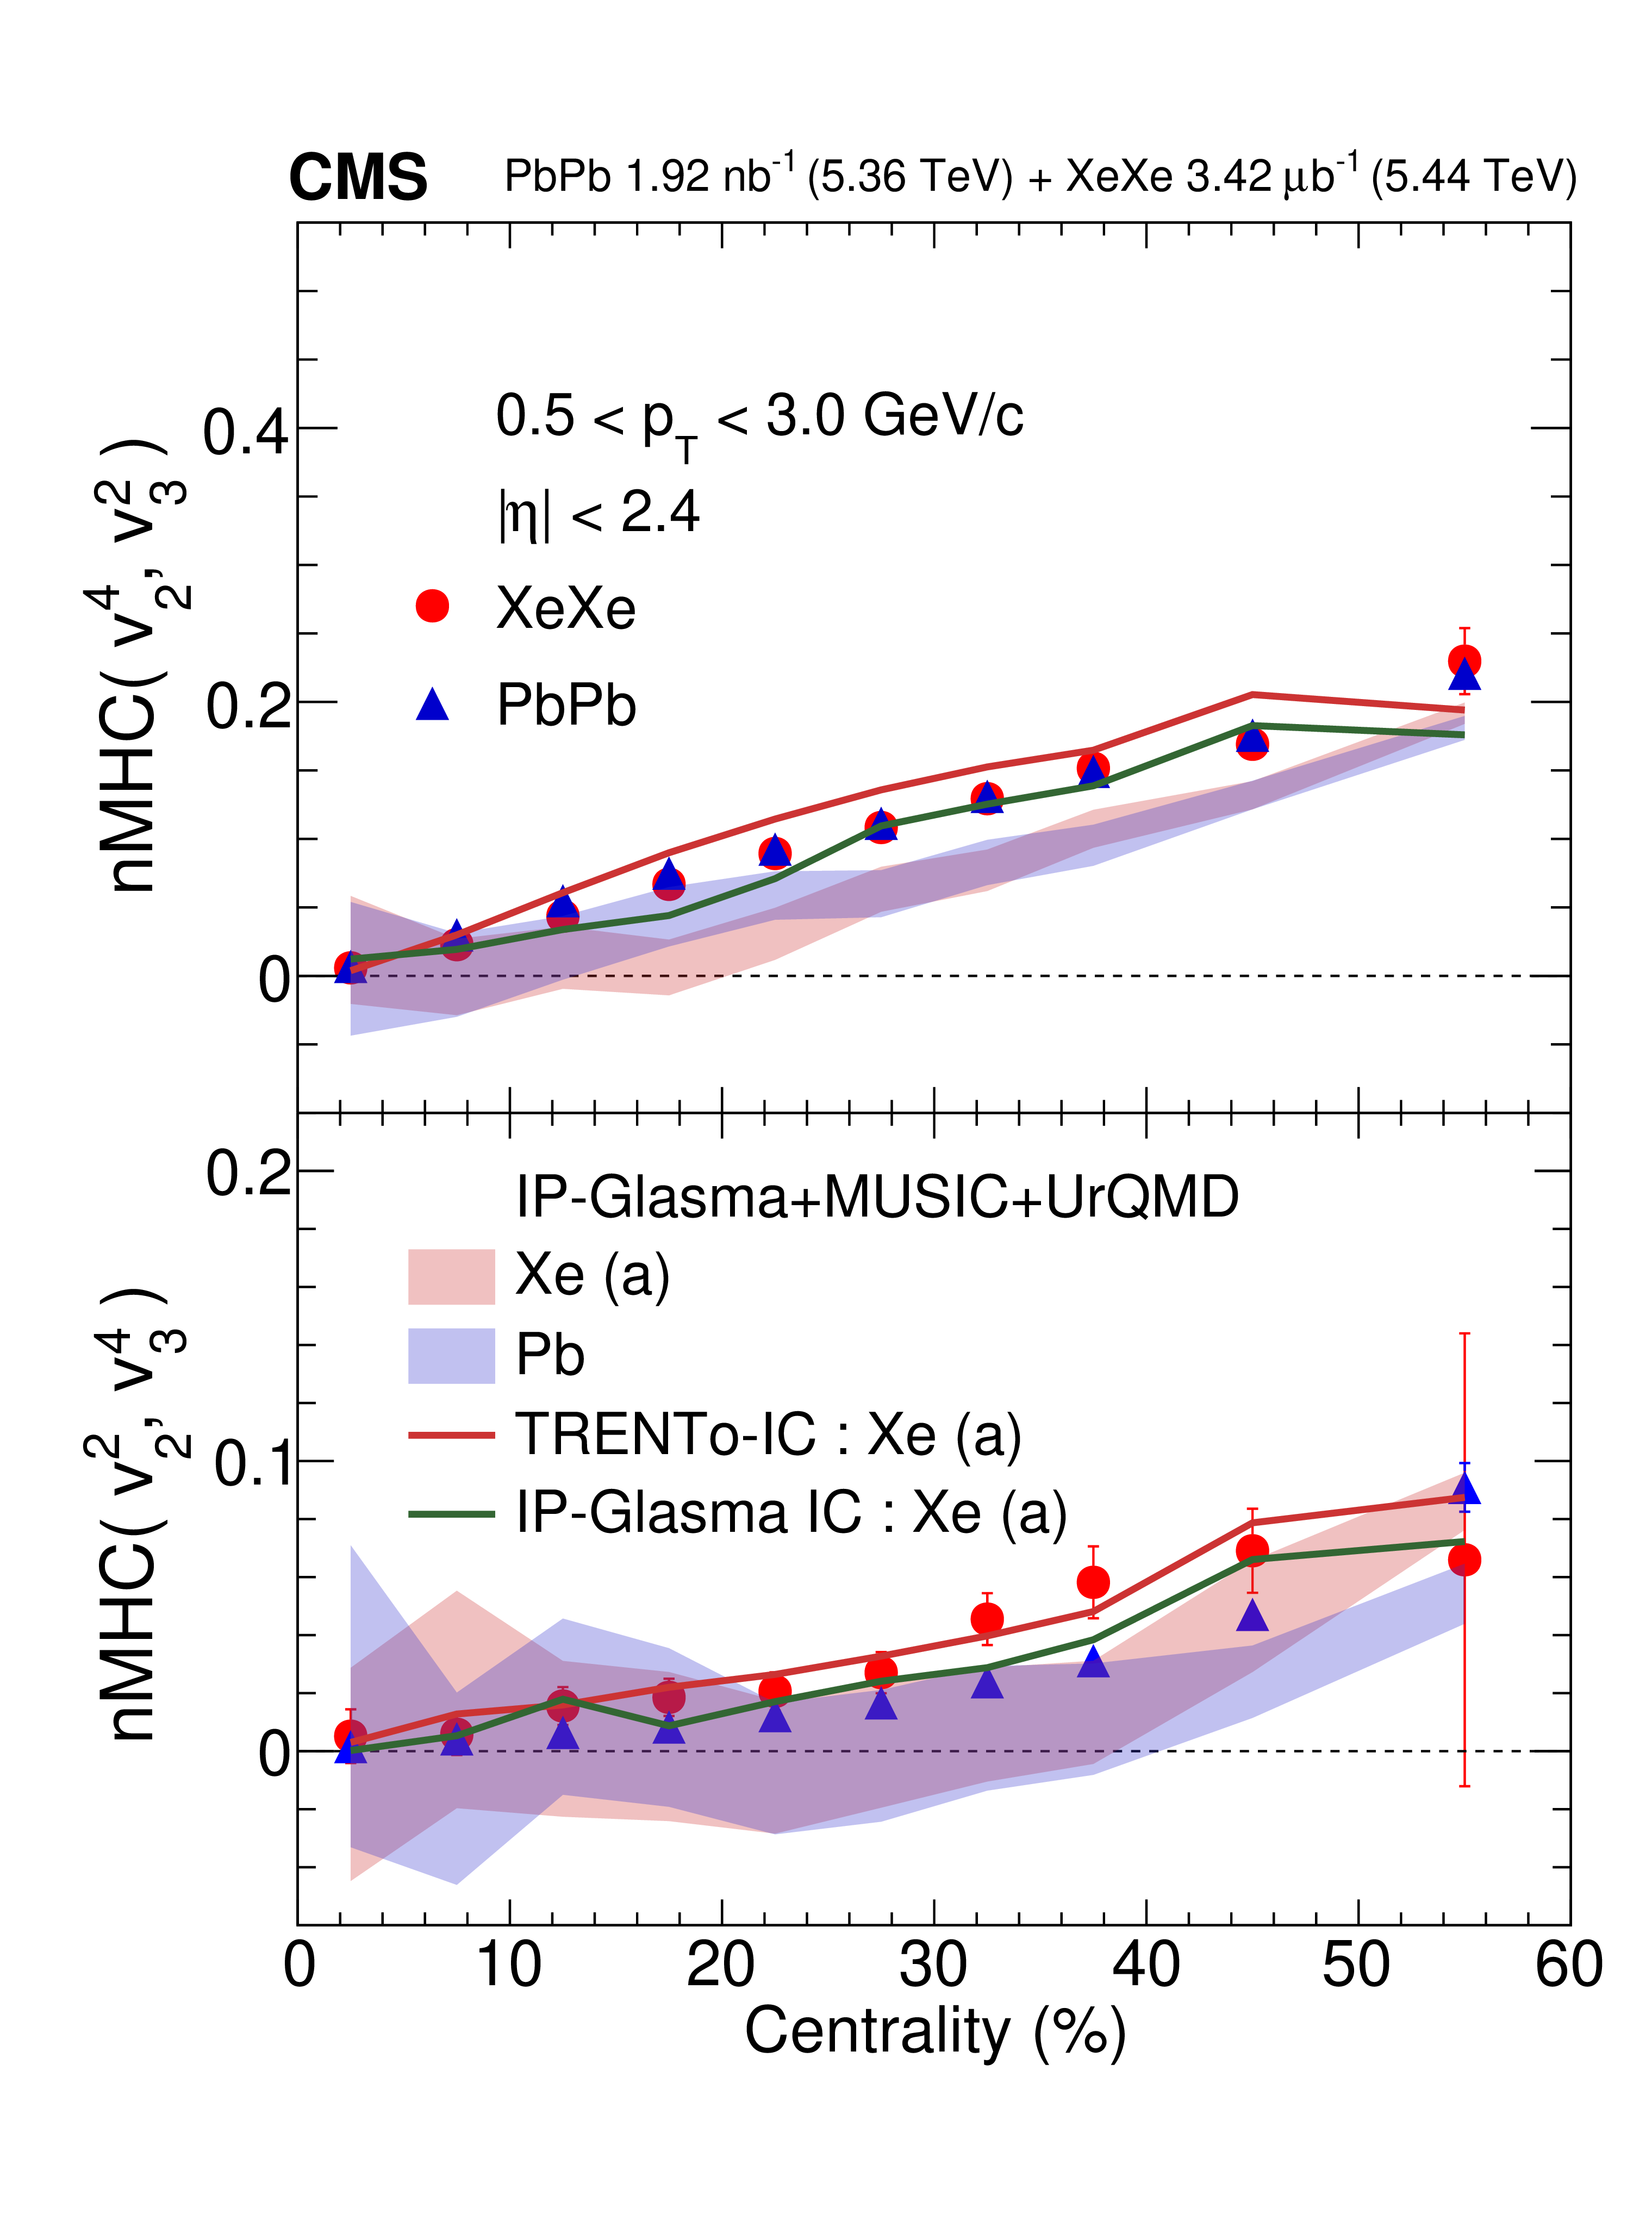
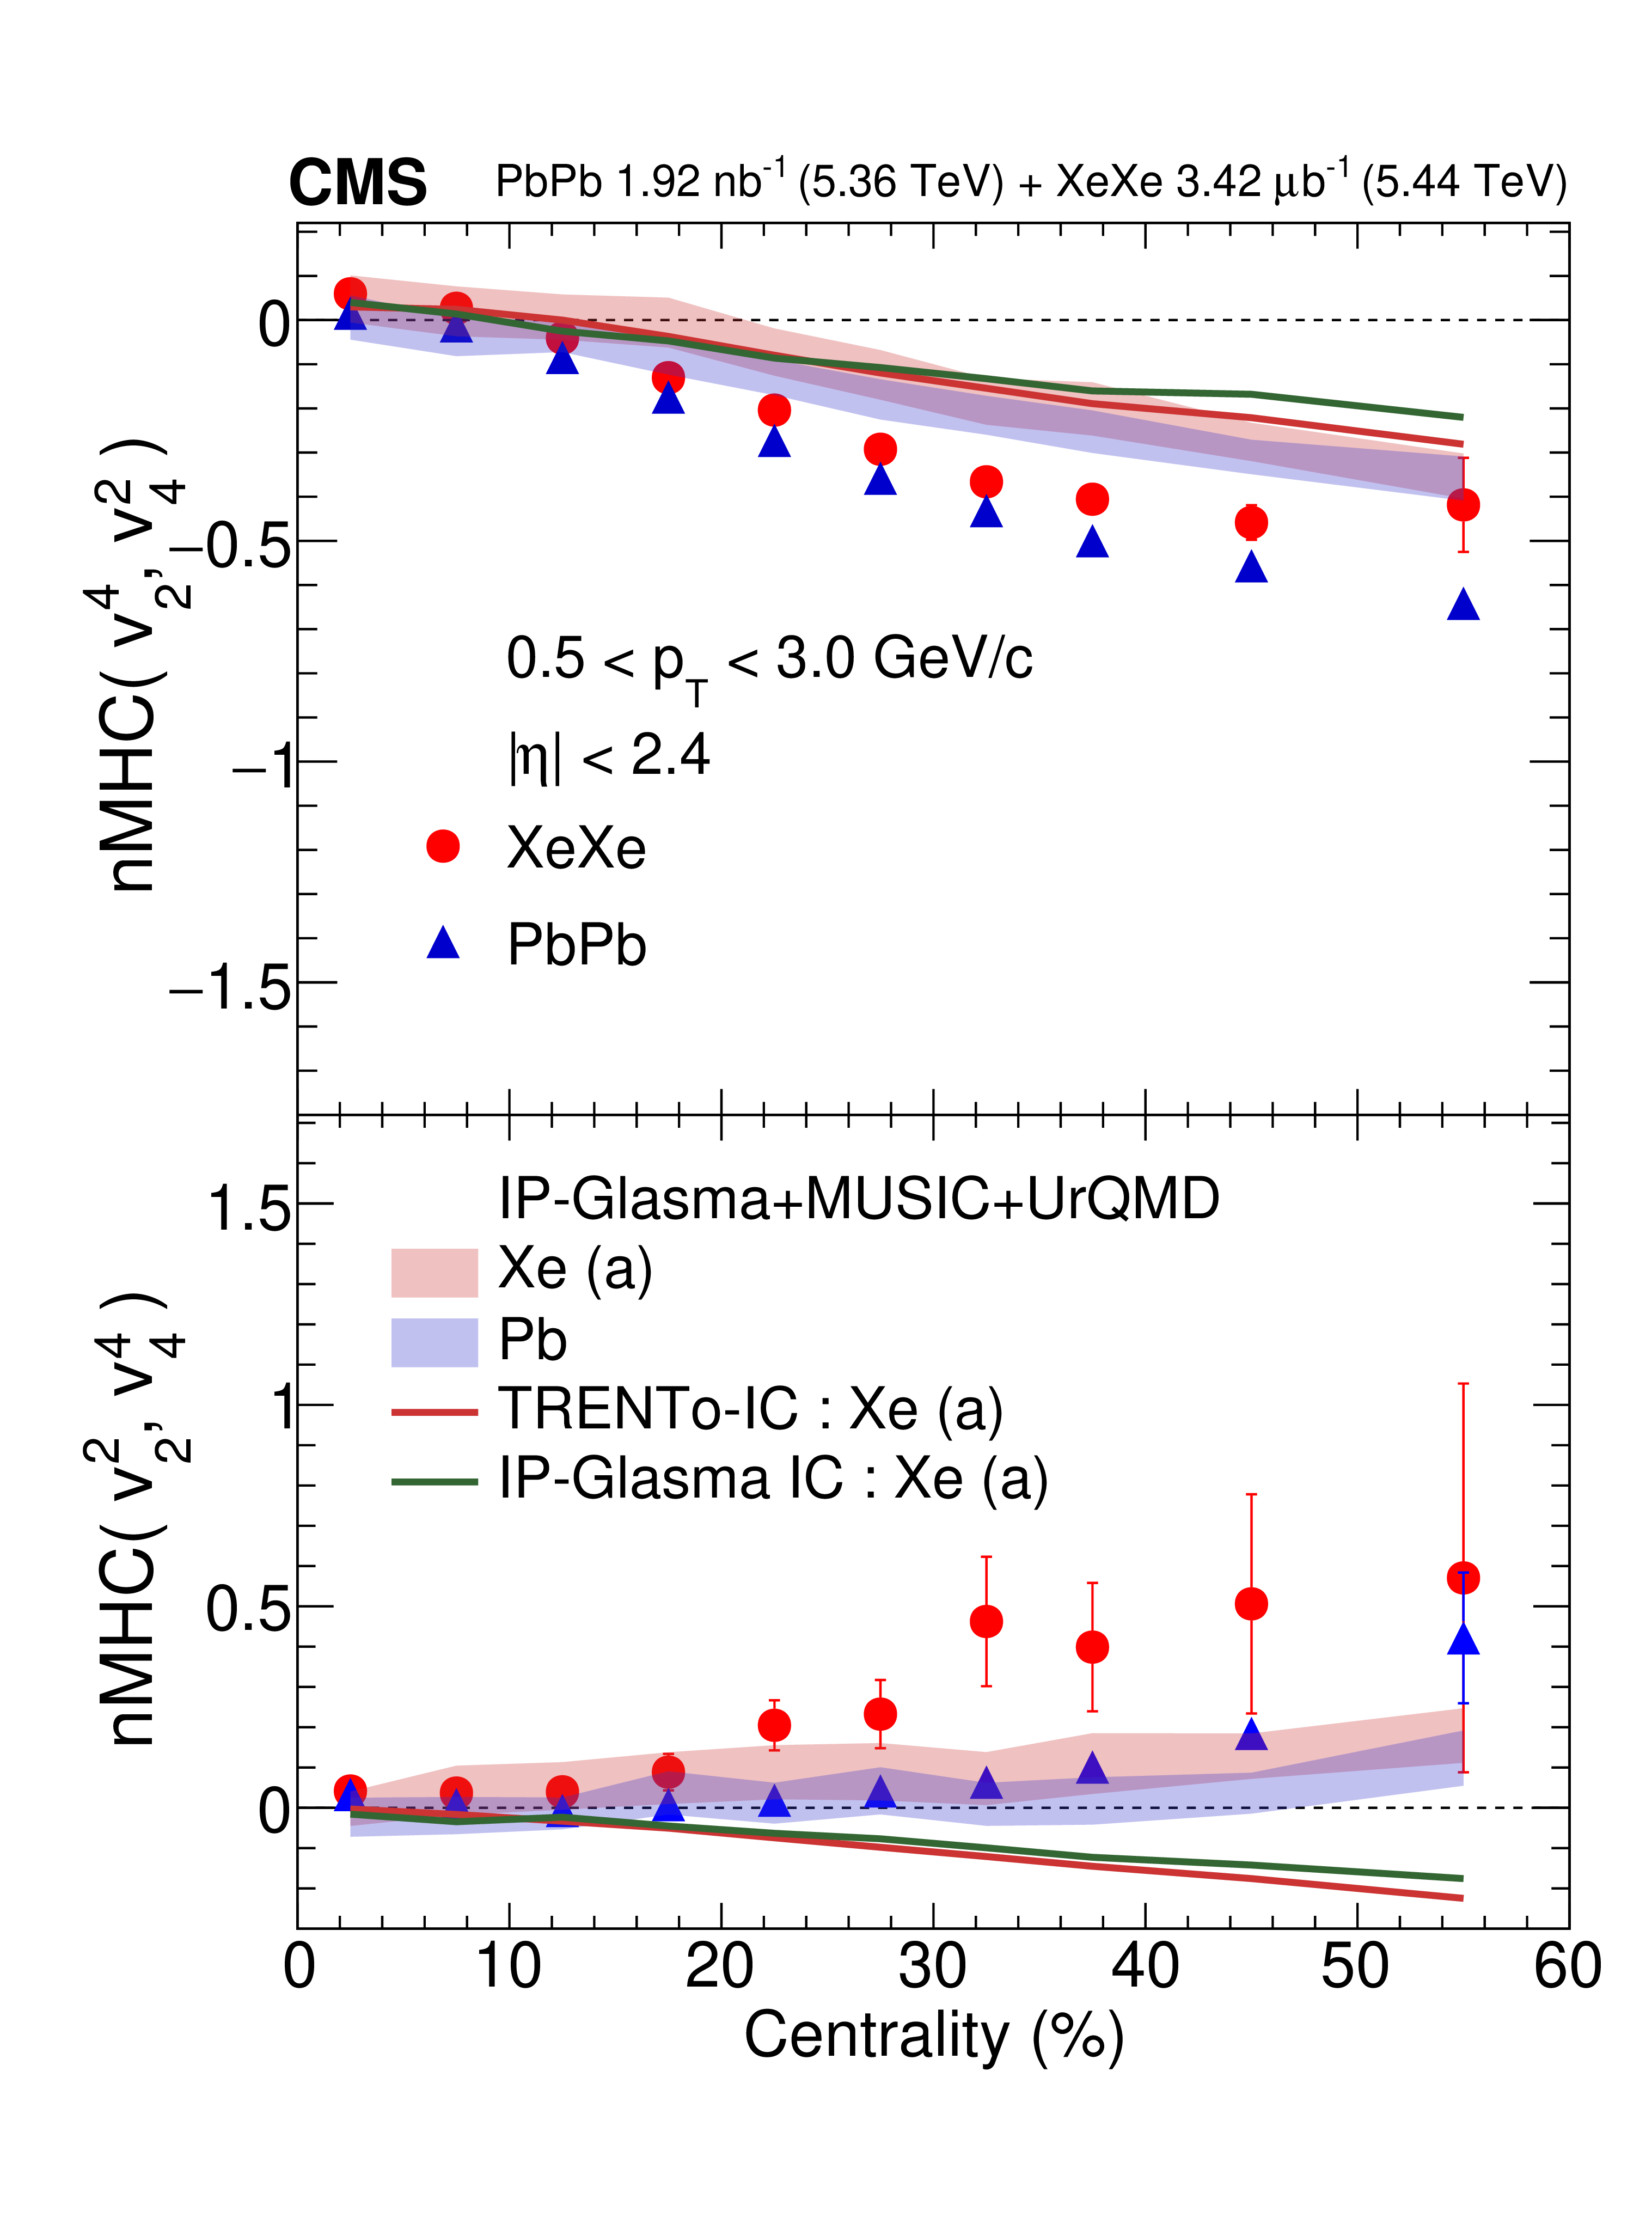
Six-particle normalized mixed harmonic cumulants (nMHC) as functions of centrality in XeXe and PbPb collisions, calculated from multiparticle cumulants. Upper panels: nMHC($ v_2^4, v_3^2 $) (left) and nMHC($ v_2^4, v_4^2 $) (right). Lower panels: nMHC($ v_2^2, v_3^4 $) (left) and nMHC($ v_2^2, v_4^4 $) (right). The vertical bars represent the statistical uncertainties and the systematic uncertainties are negligible. The shaded bands show hydrodynamic predictions from the IP-GLASMA+MUSIC+URQMD model for deformed Xe (Xe (a)) and Pb nuclei. The solid lines represent initial-state model predictions. |
png pdf |
Figure 5-a:
Six-particle normalized mixed harmonic cumulants (nMHC) as functions of centrality in XeXe and PbPb collisions, calculated from multiparticle cumulants. Upper panels: nMHC($ v_2^4, v_3^2 $) (left) and nMHC($ v_2^4, v_4^2 $) (right). Lower panels: nMHC($ v_2^2, v_3^4 $) (left) and nMHC($ v_2^2, v_4^4 $) (right). The vertical bars represent the statistical uncertainties and the systematic uncertainties are negligible. The shaded bands show hydrodynamic predictions from the IP-GLASMA+MUSIC+URQMD model for deformed Xe (Xe (a)) and Pb nuclei. The solid lines represent initial-state model predictions. |
png pdf |
Figure 5-b:
Six-particle normalized mixed harmonic cumulants (nMHC) as functions of centrality in XeXe and PbPb collisions, calculated from multiparticle cumulants. Upper panels: nMHC($ v_2^4, v_3^2 $) (left) and nMHC($ v_2^4, v_4^2 $) (right). Lower panels: nMHC($ v_2^2, v_3^4 $) (left) and nMHC($ v_2^2, v_4^4 $) (right). The vertical bars represent the statistical uncertainties and the systematic uncertainties are negligible. The shaded bands show hydrodynamic predictions from the IP-GLASMA+MUSIC+URQMD model for deformed Xe (Xe (a)) and Pb nuclei. The solid lines represent initial-state model predictions. |
png pdf |
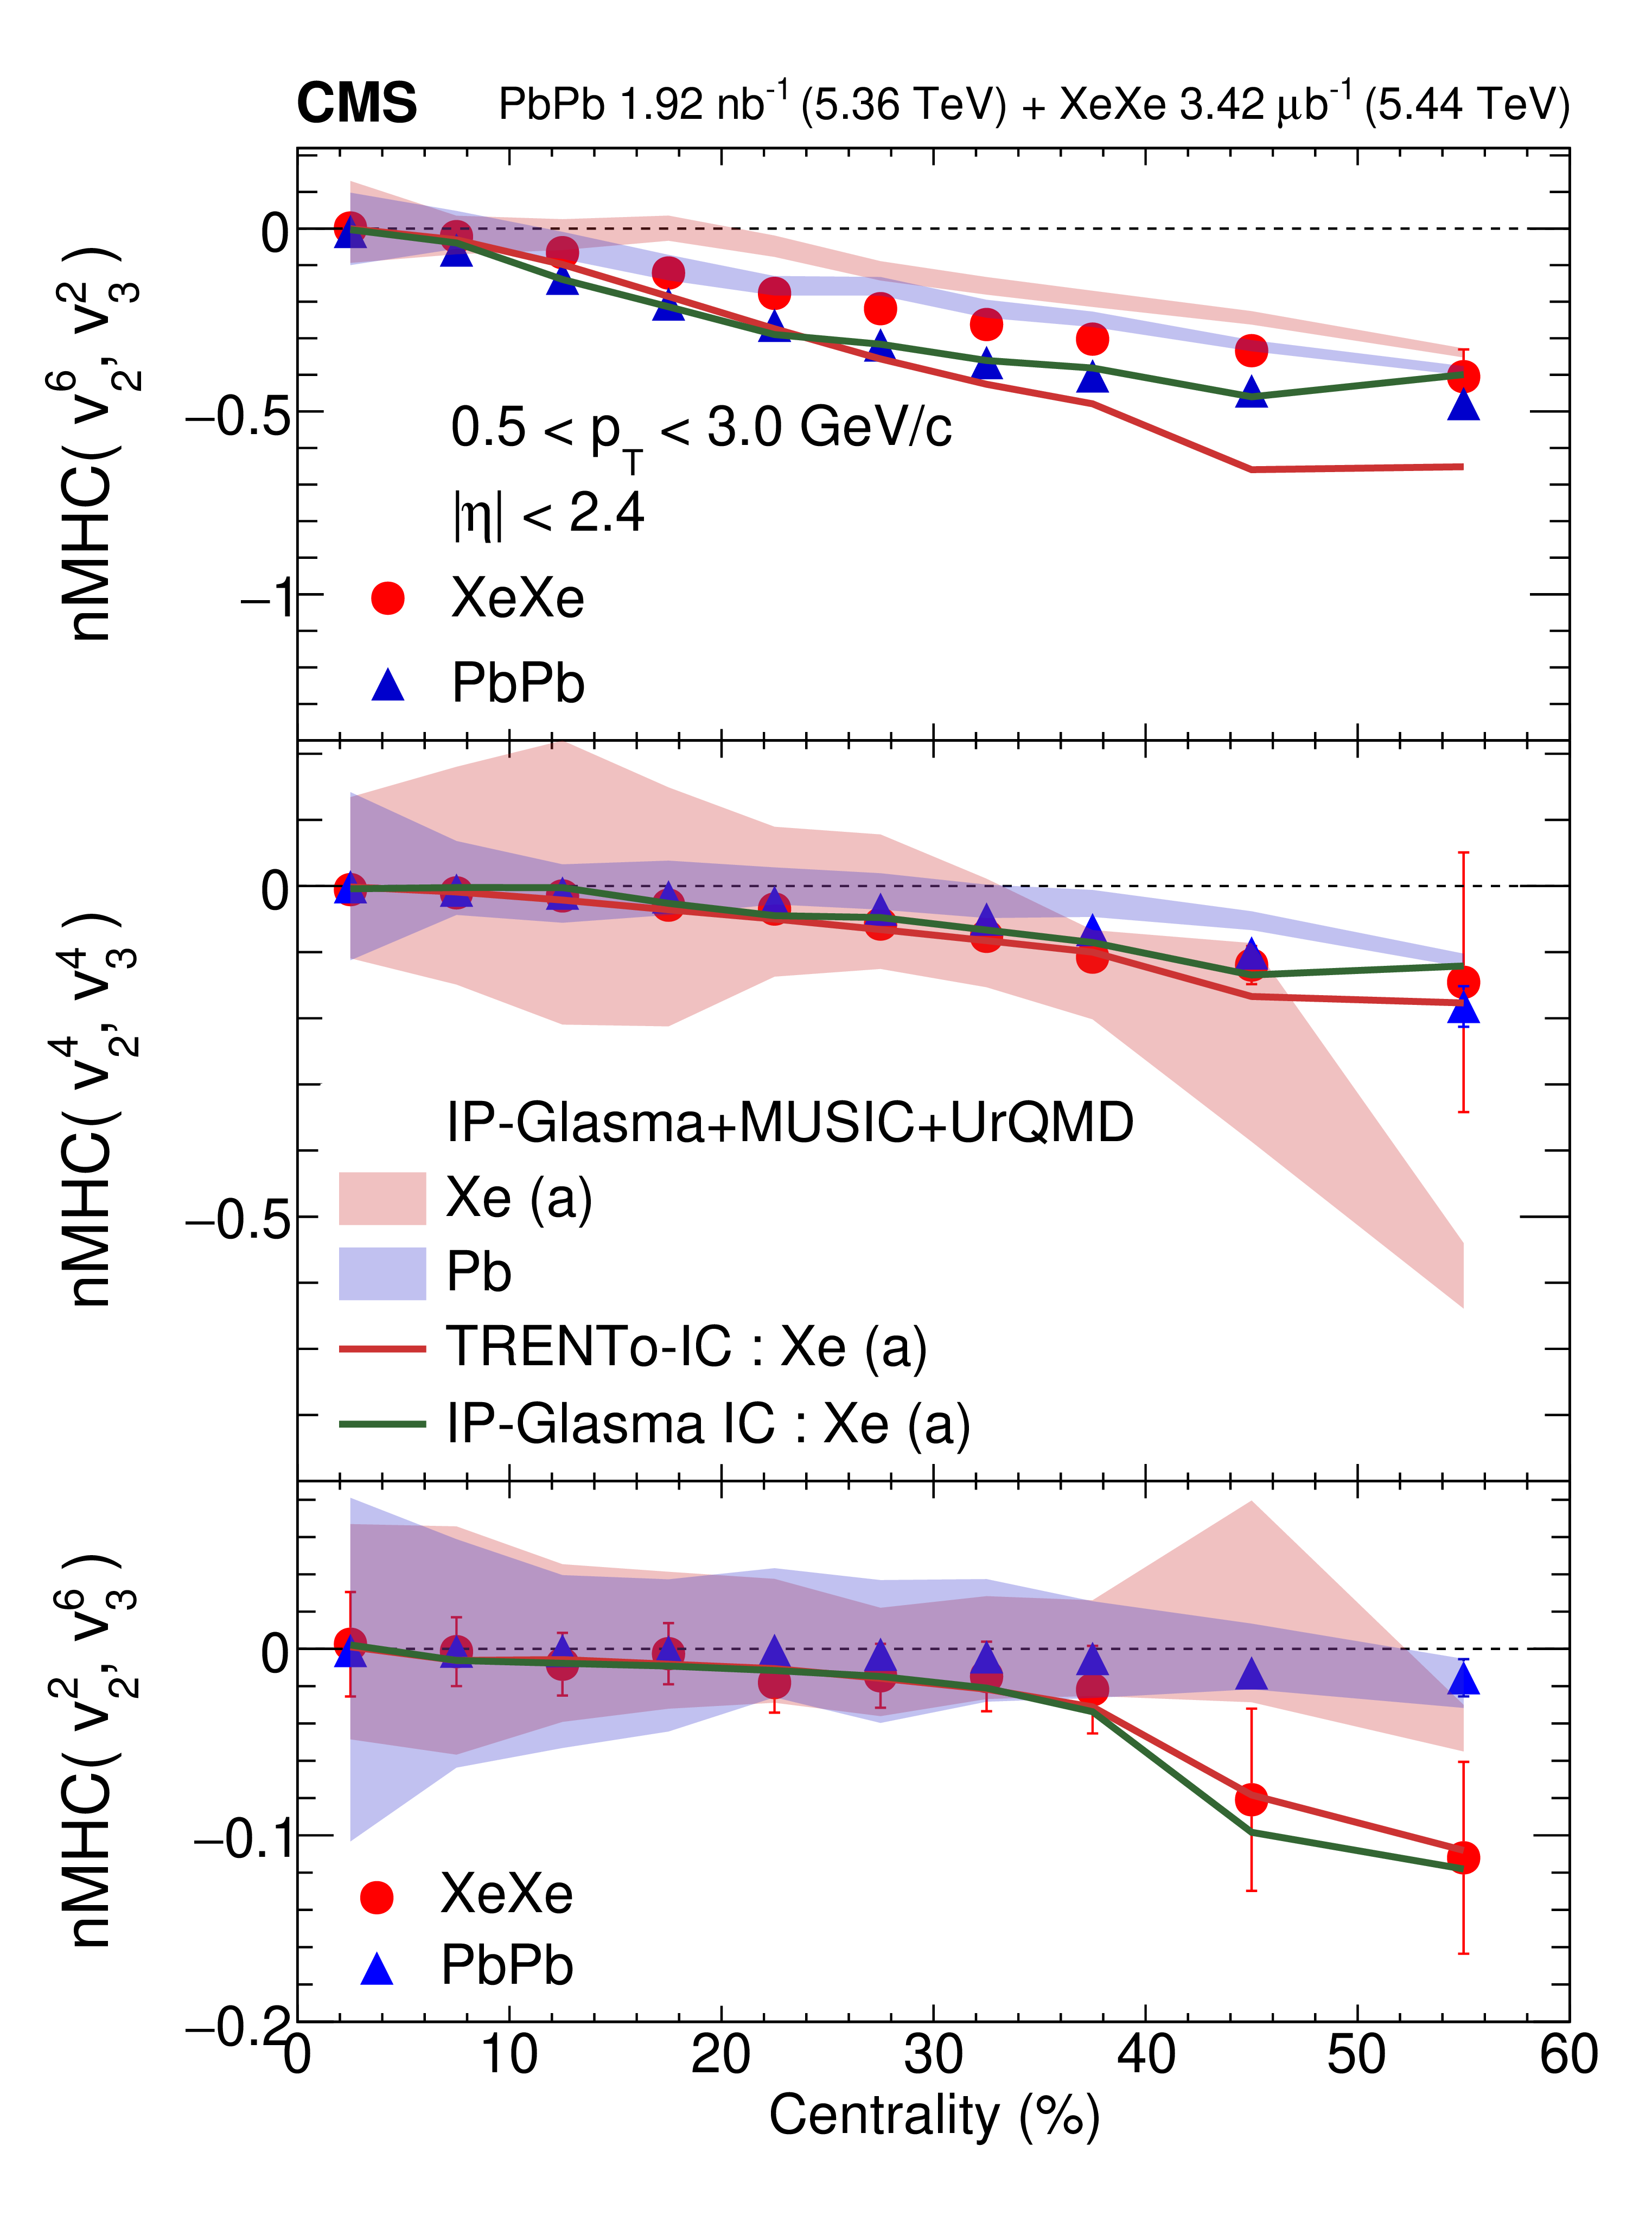
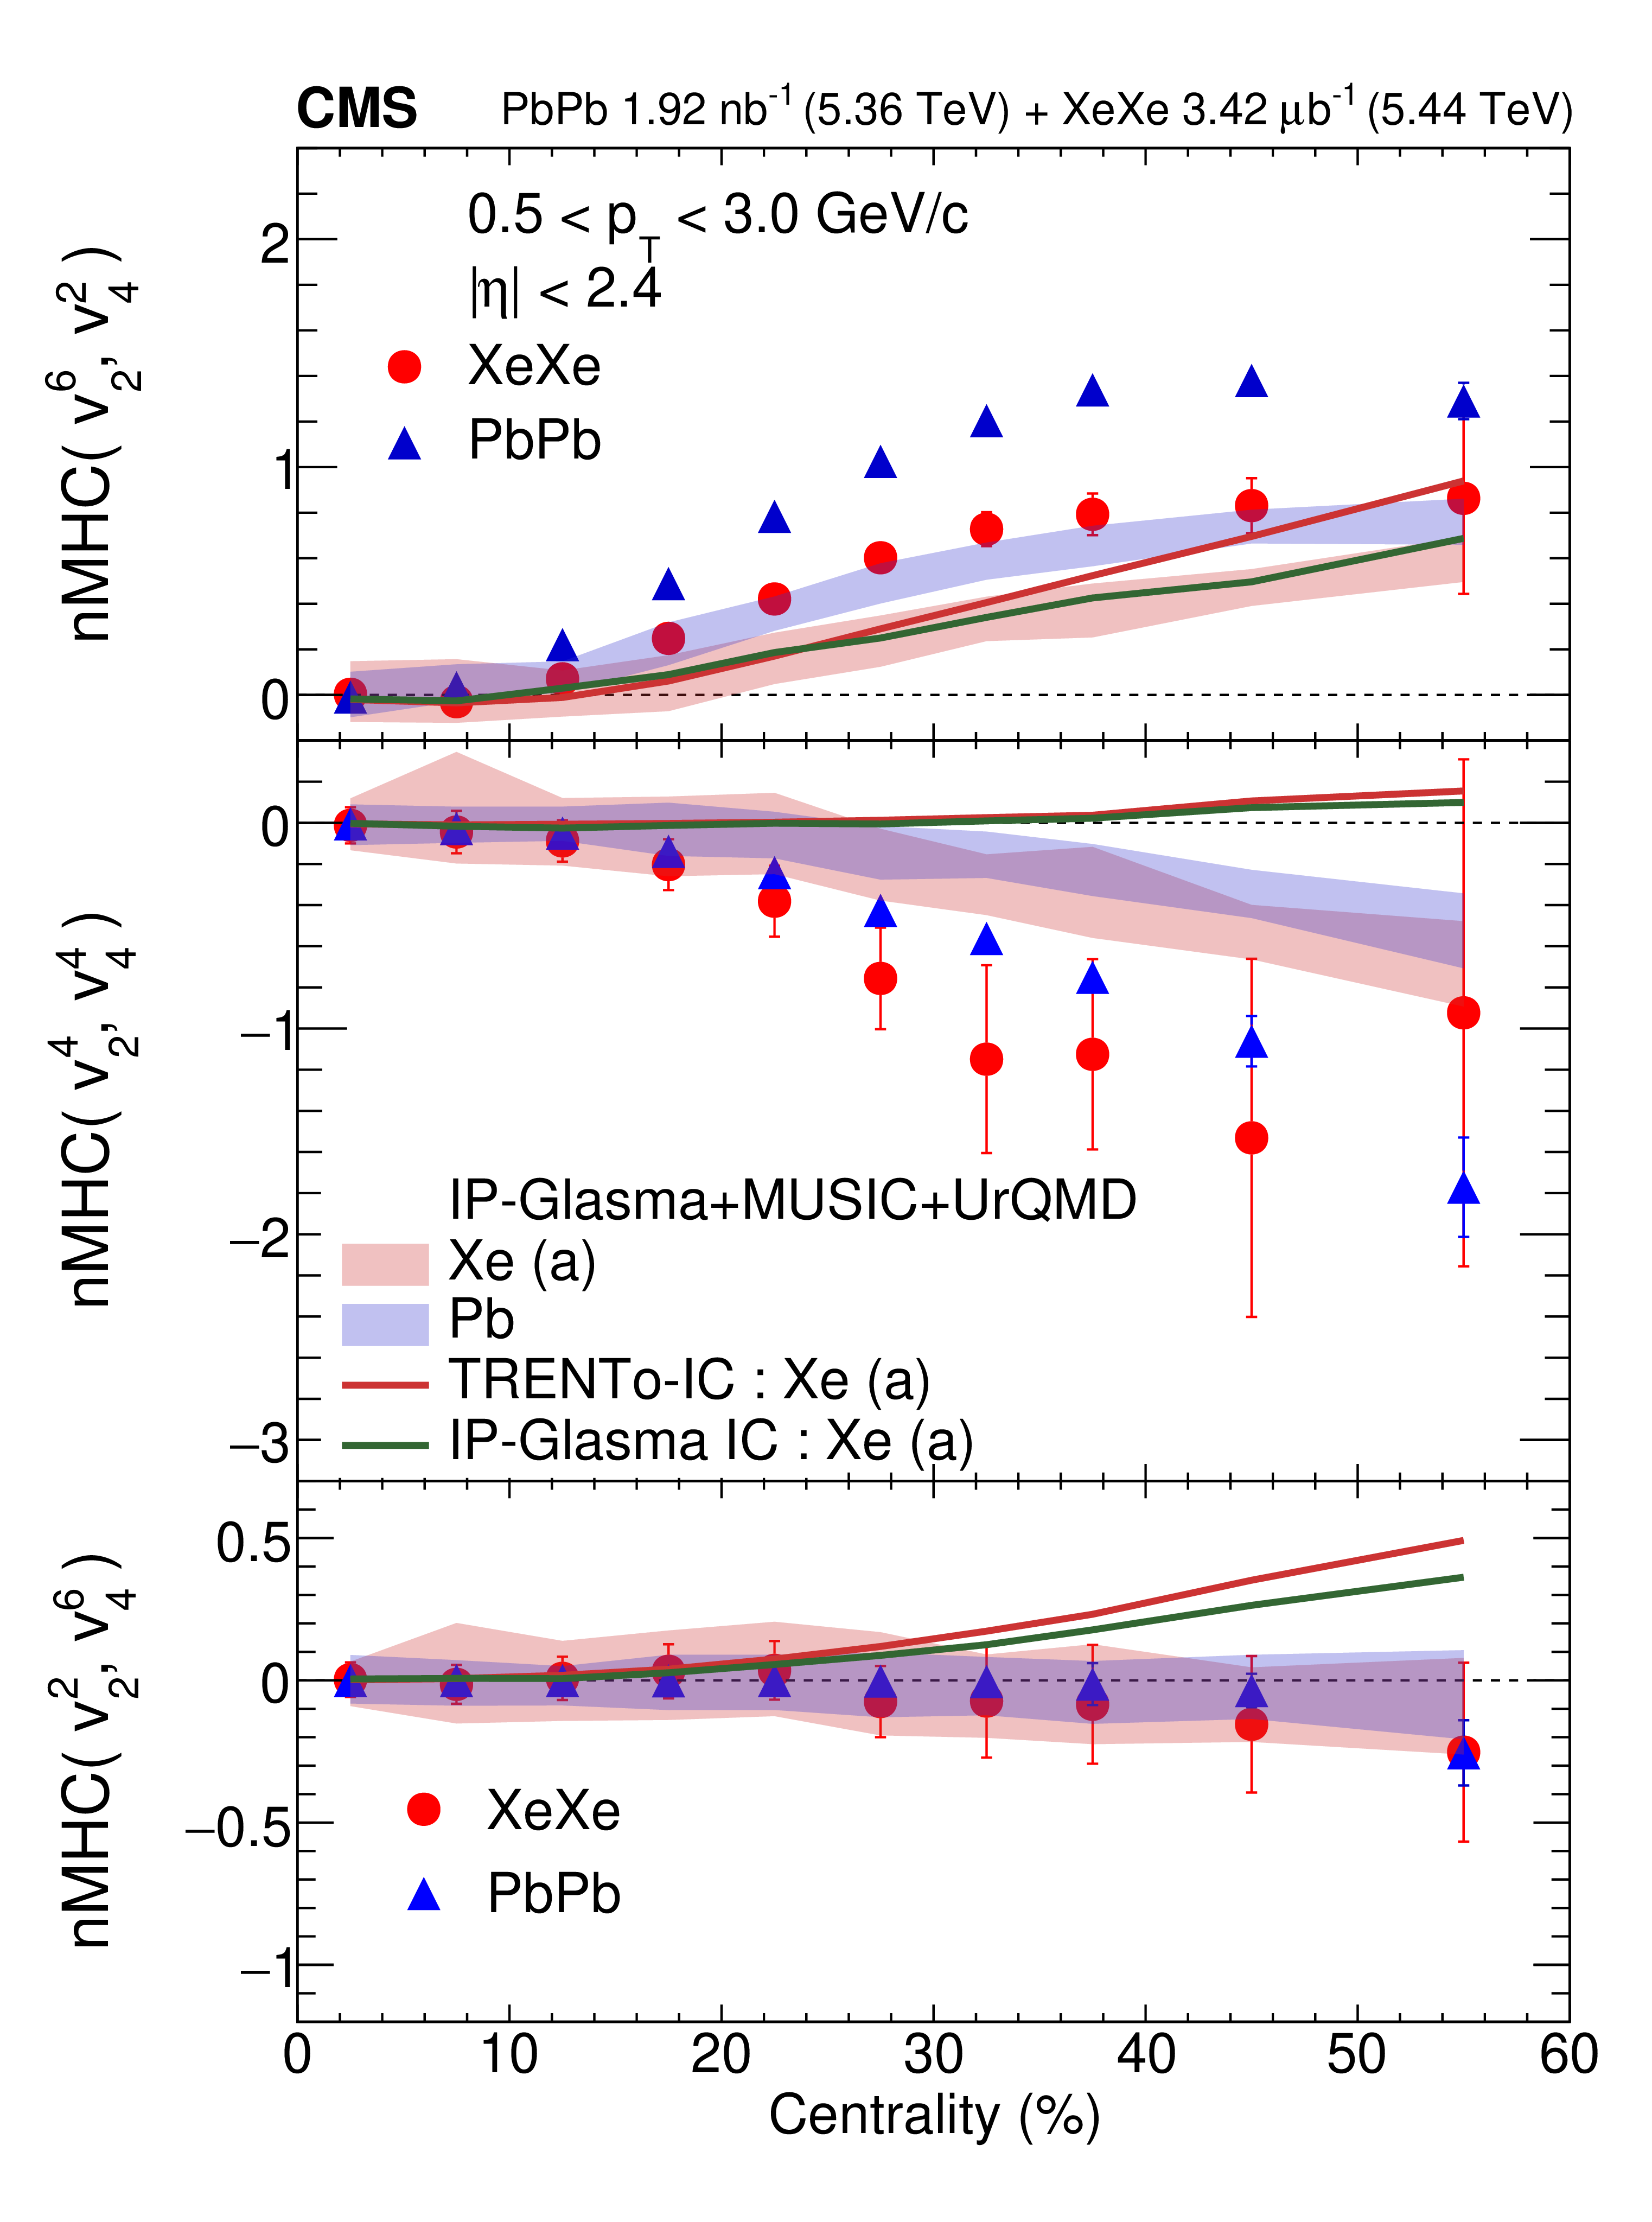
Figure 6:
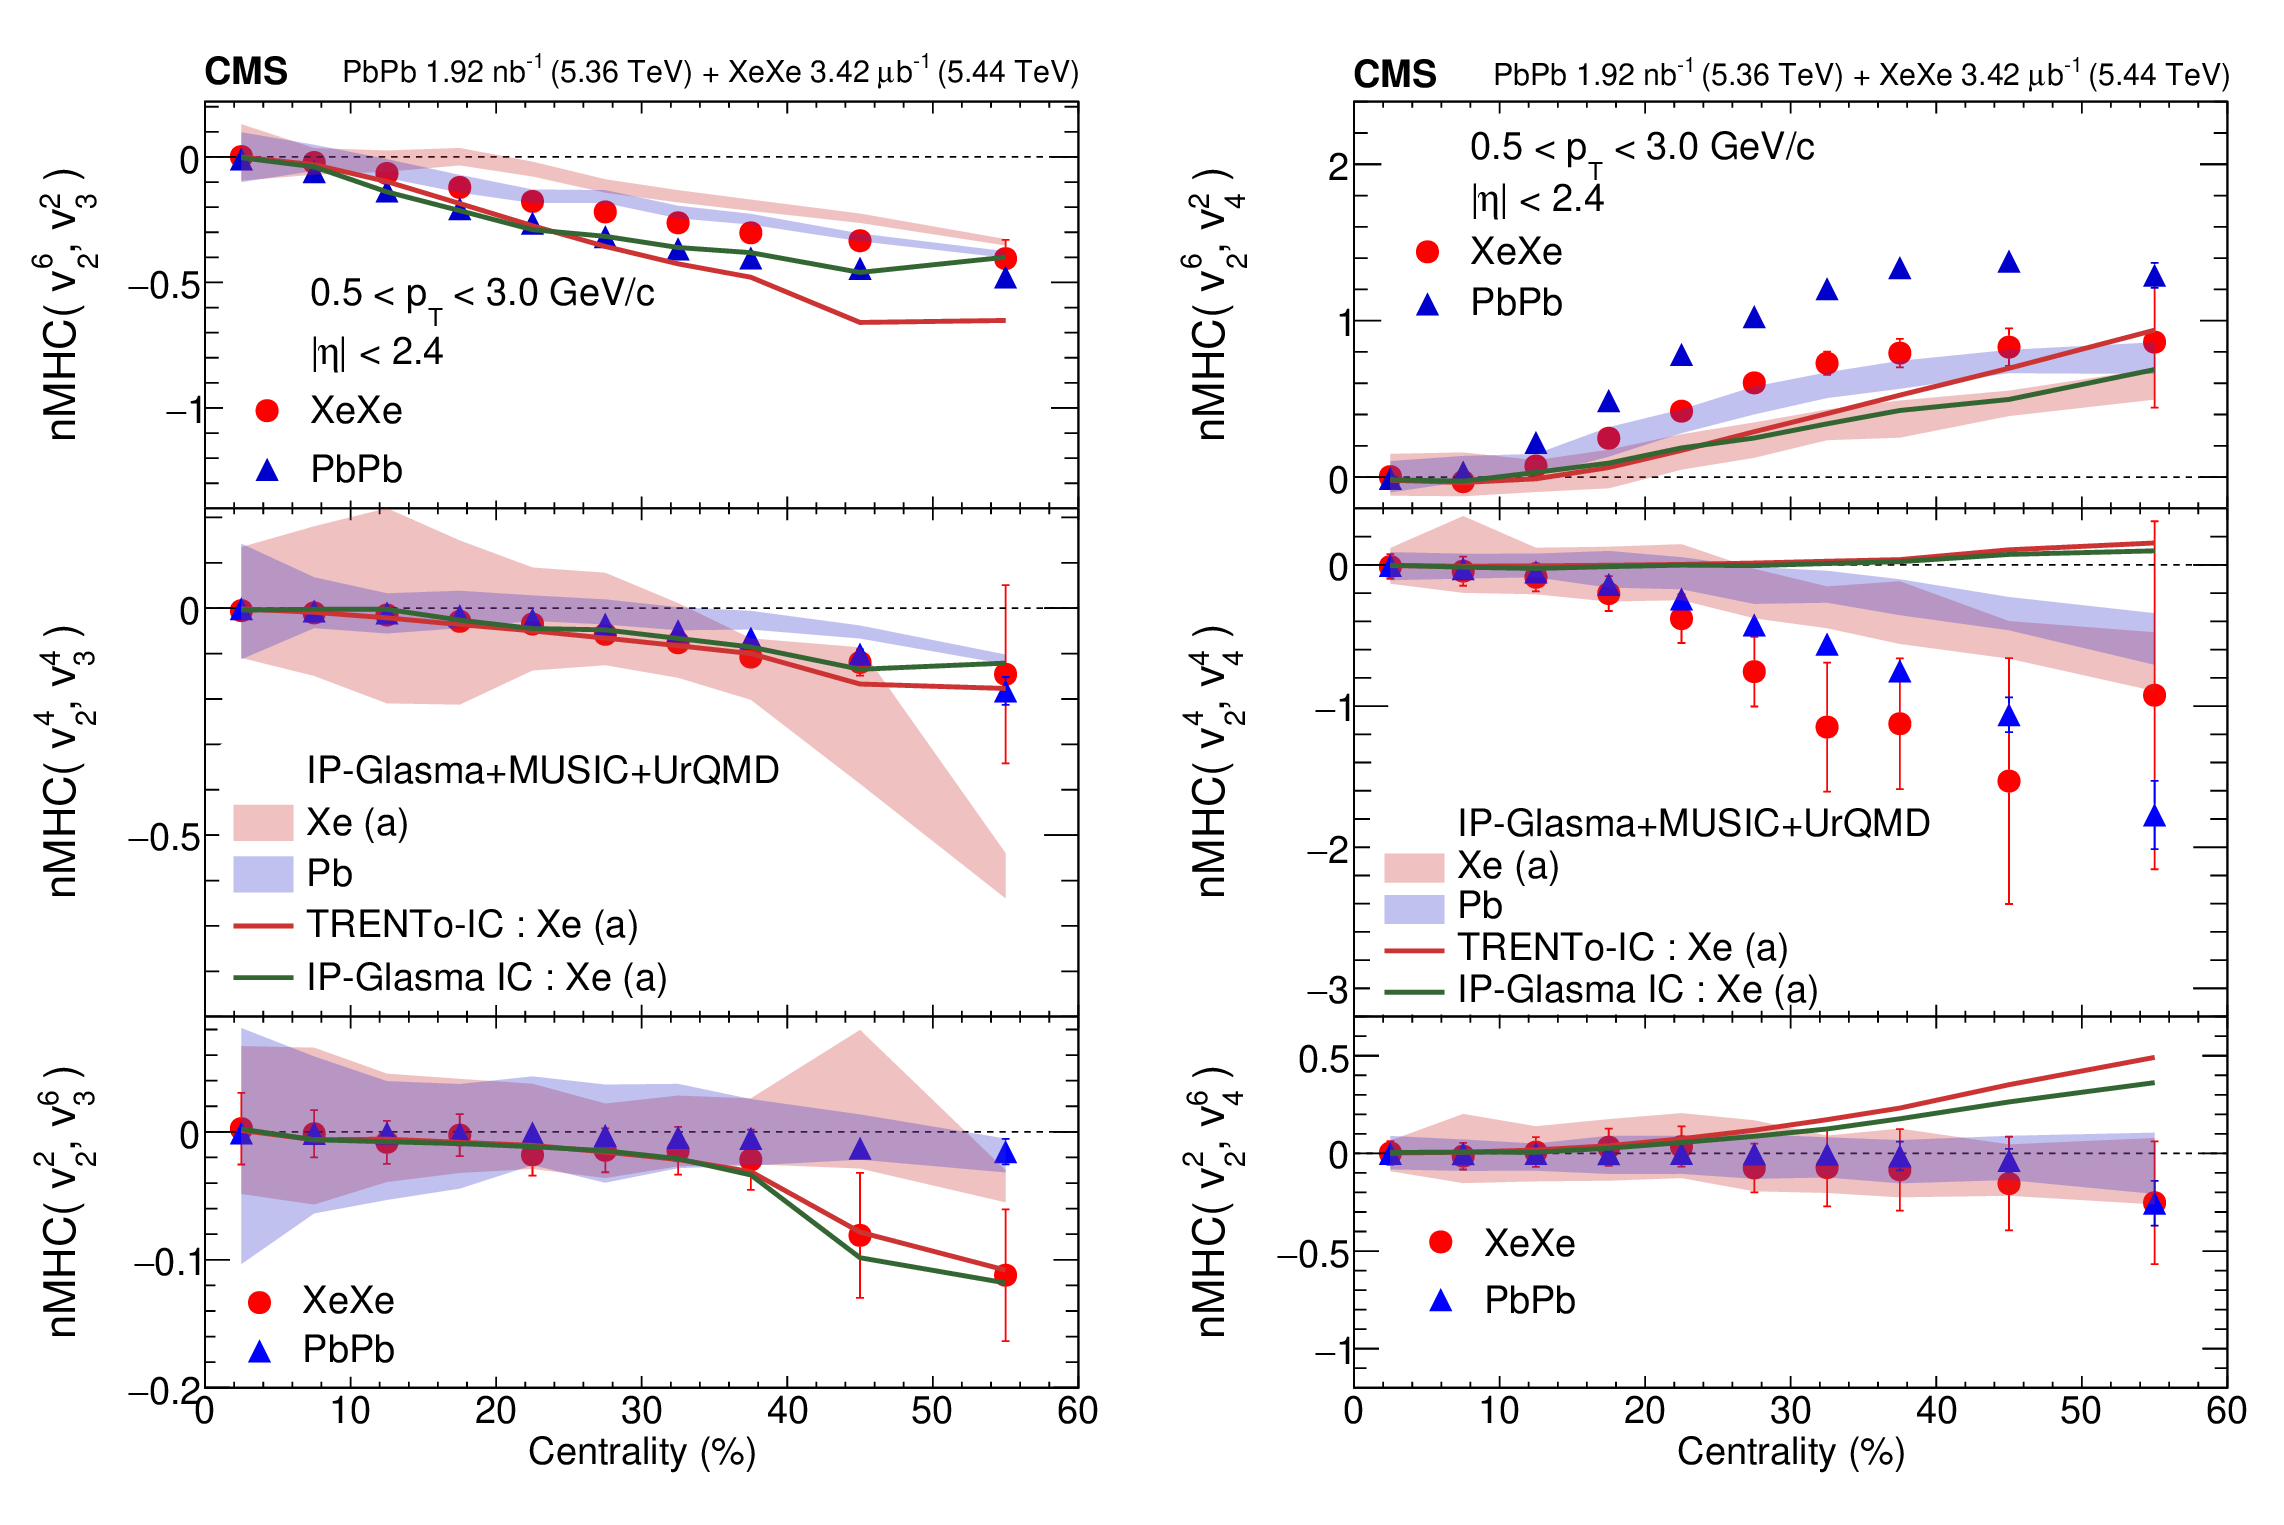
Eight-particle normalized mixed harmonic cumulants (nMHC) as functions of centrality in XeXe and PbPb collisions, calculated from multiparticle cumulants. Left panels: nMHC($ v_2^6, v_3^2 $) (upper), nMHC($ v_2^4, v_3^4 $) (middle), and nMHC($ v_2^2, v_3^6 $) (lower). Right panels: nMHC($ v_2^6, v_4^2 $) (upper), nMHC($ v_2^4, v_4^4 $) (middle), and nMHC($ v_2^2, v_4^6 $) (lower). The vertical bars represent statistical uncertainties and the systematic uncertainties are negligible. Shaded bands show hydrodynamic predictions from the IP-GLASMA+MUSIC+URQMD model for deformed Xe (Xe (a)) and Pb nuclei, and the solid lines represent initial-state model predictions. |
png pdf |
Figure 6-a:
Eight-particle normalized mixed harmonic cumulants (nMHC) as functions of centrality in XeXe and PbPb collisions, calculated from multiparticle cumulants. Left panels: nMHC($ v_2^6, v_3^2 $) (upper), nMHC($ v_2^4, v_3^4 $) (middle), and nMHC($ v_2^2, v_3^6 $) (lower). Right panels: nMHC($ v_2^6, v_4^2 $) (upper), nMHC($ v_2^4, v_4^4 $) (middle), and nMHC($ v_2^2, v_4^6 $) (lower). The vertical bars represent statistical uncertainties and the systematic uncertainties are negligible. Shaded bands show hydrodynamic predictions from the IP-GLASMA+MUSIC+URQMD model for deformed Xe (Xe (a)) and Pb nuclei, and the solid lines represent initial-state model predictions. |
png pdf |
Figure 6-b:
Eight-particle normalized mixed harmonic cumulants (nMHC) as functions of centrality in XeXe and PbPb collisions, calculated from multiparticle cumulants. Left panels: nMHC($ v_2^6, v_3^2 $) (upper), nMHC($ v_2^4, v_3^4 $) (middle), and nMHC($ v_2^2, v_3^6 $) (lower). Right panels: nMHC($ v_2^6, v_4^2 $) (upper), nMHC($ v_2^4, v_4^4 $) (middle), and nMHC($ v_2^2, v_4^6 $) (lower). The vertical bars represent statistical uncertainties and the systematic uncertainties are negligible. Shaded bands show hydrodynamic predictions from the IP-GLASMA+MUSIC+URQMD model for deformed Xe (Xe (a)) and Pb nuclei, and the solid lines represent initial-state model predictions. |
png pdf |
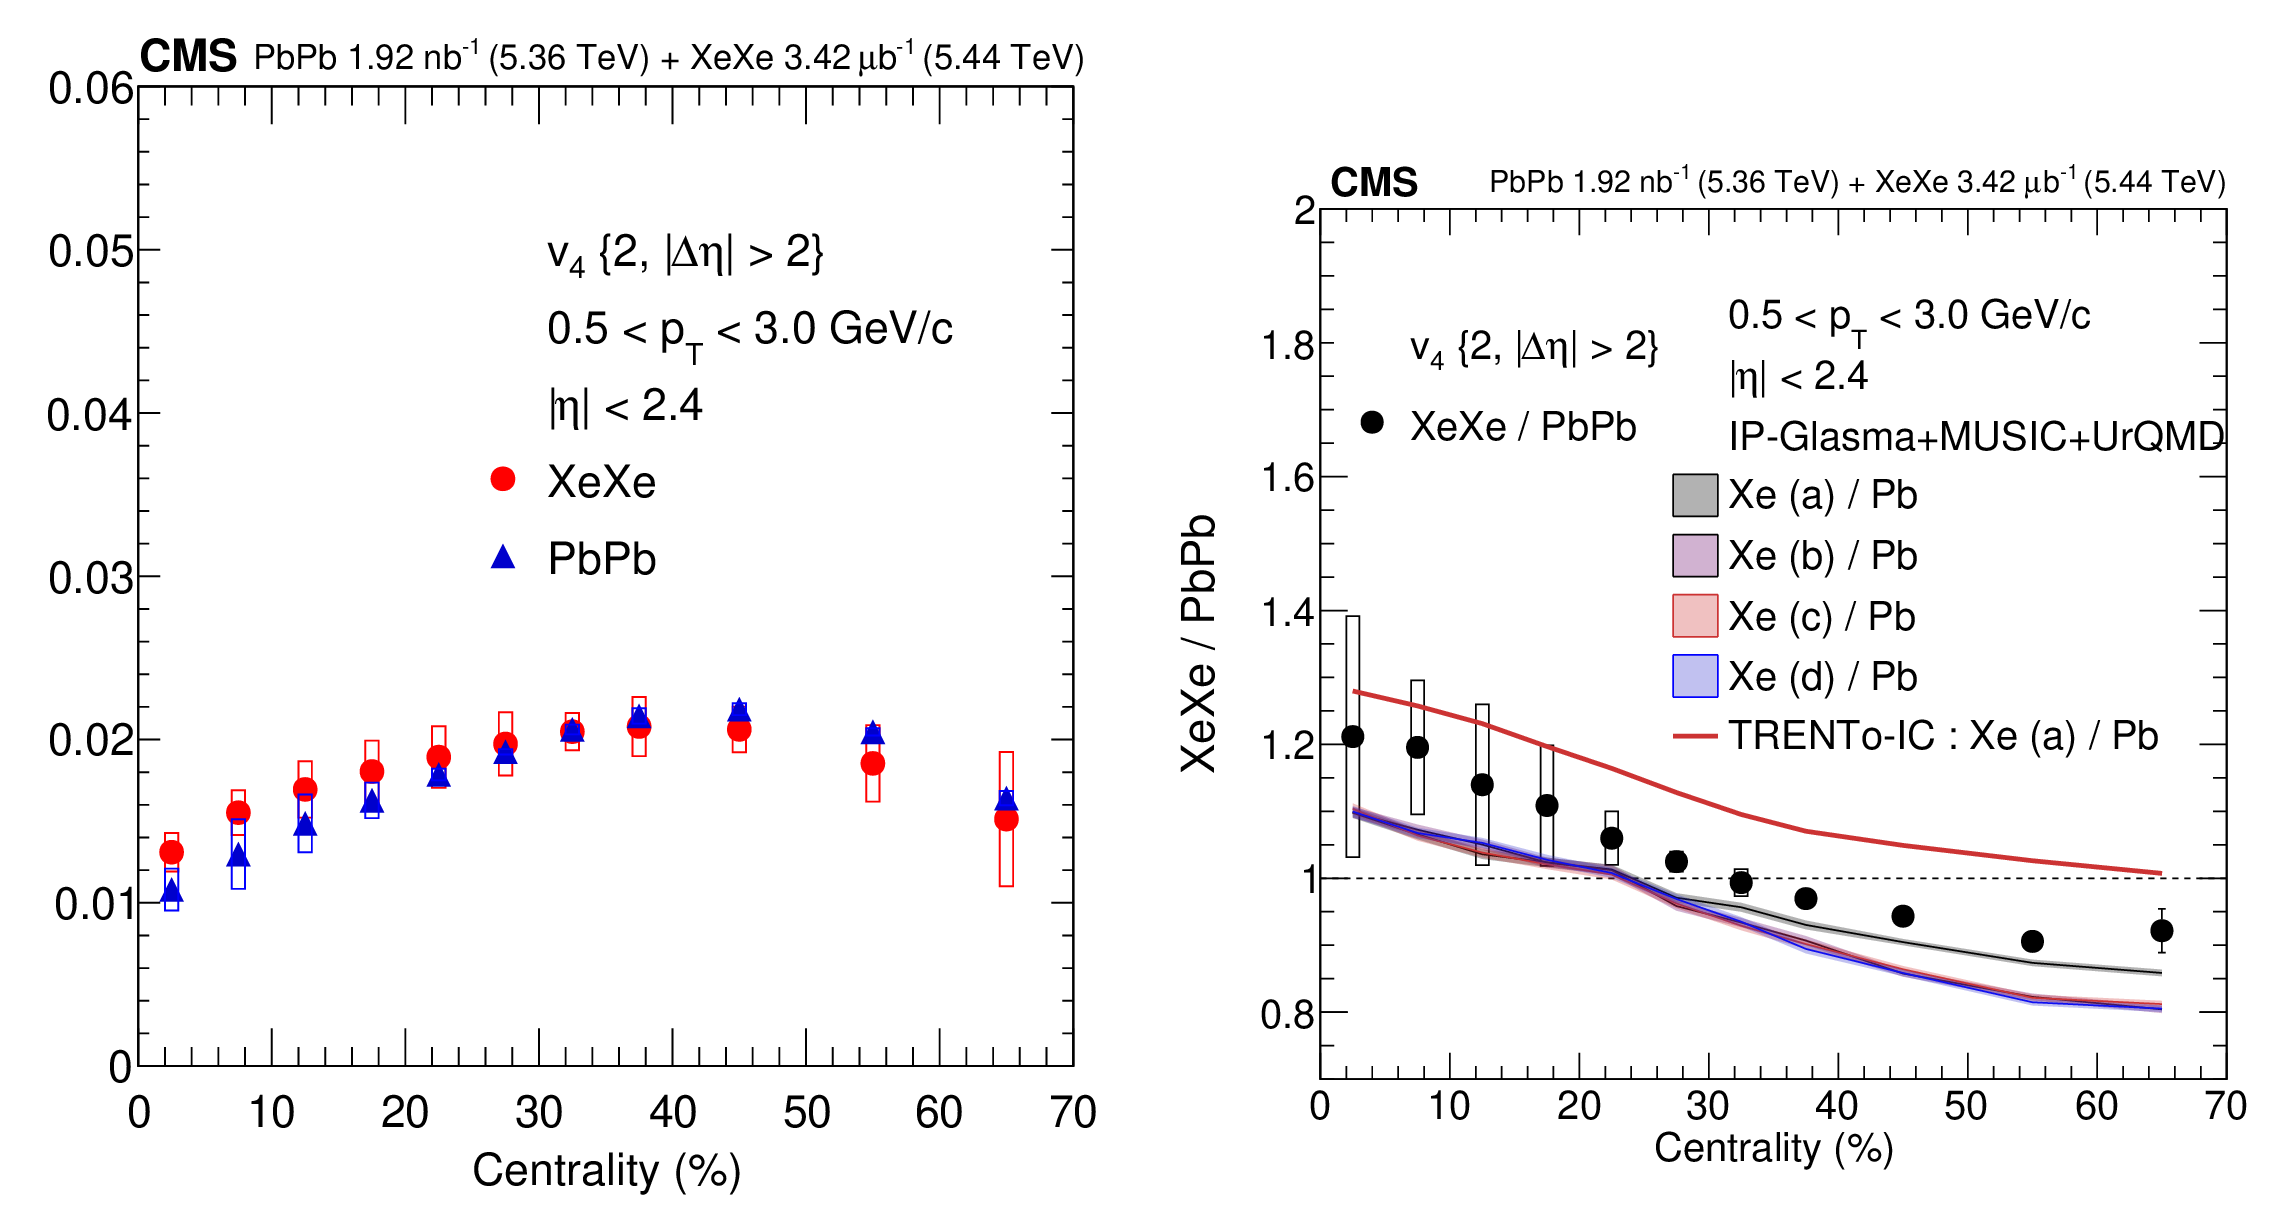
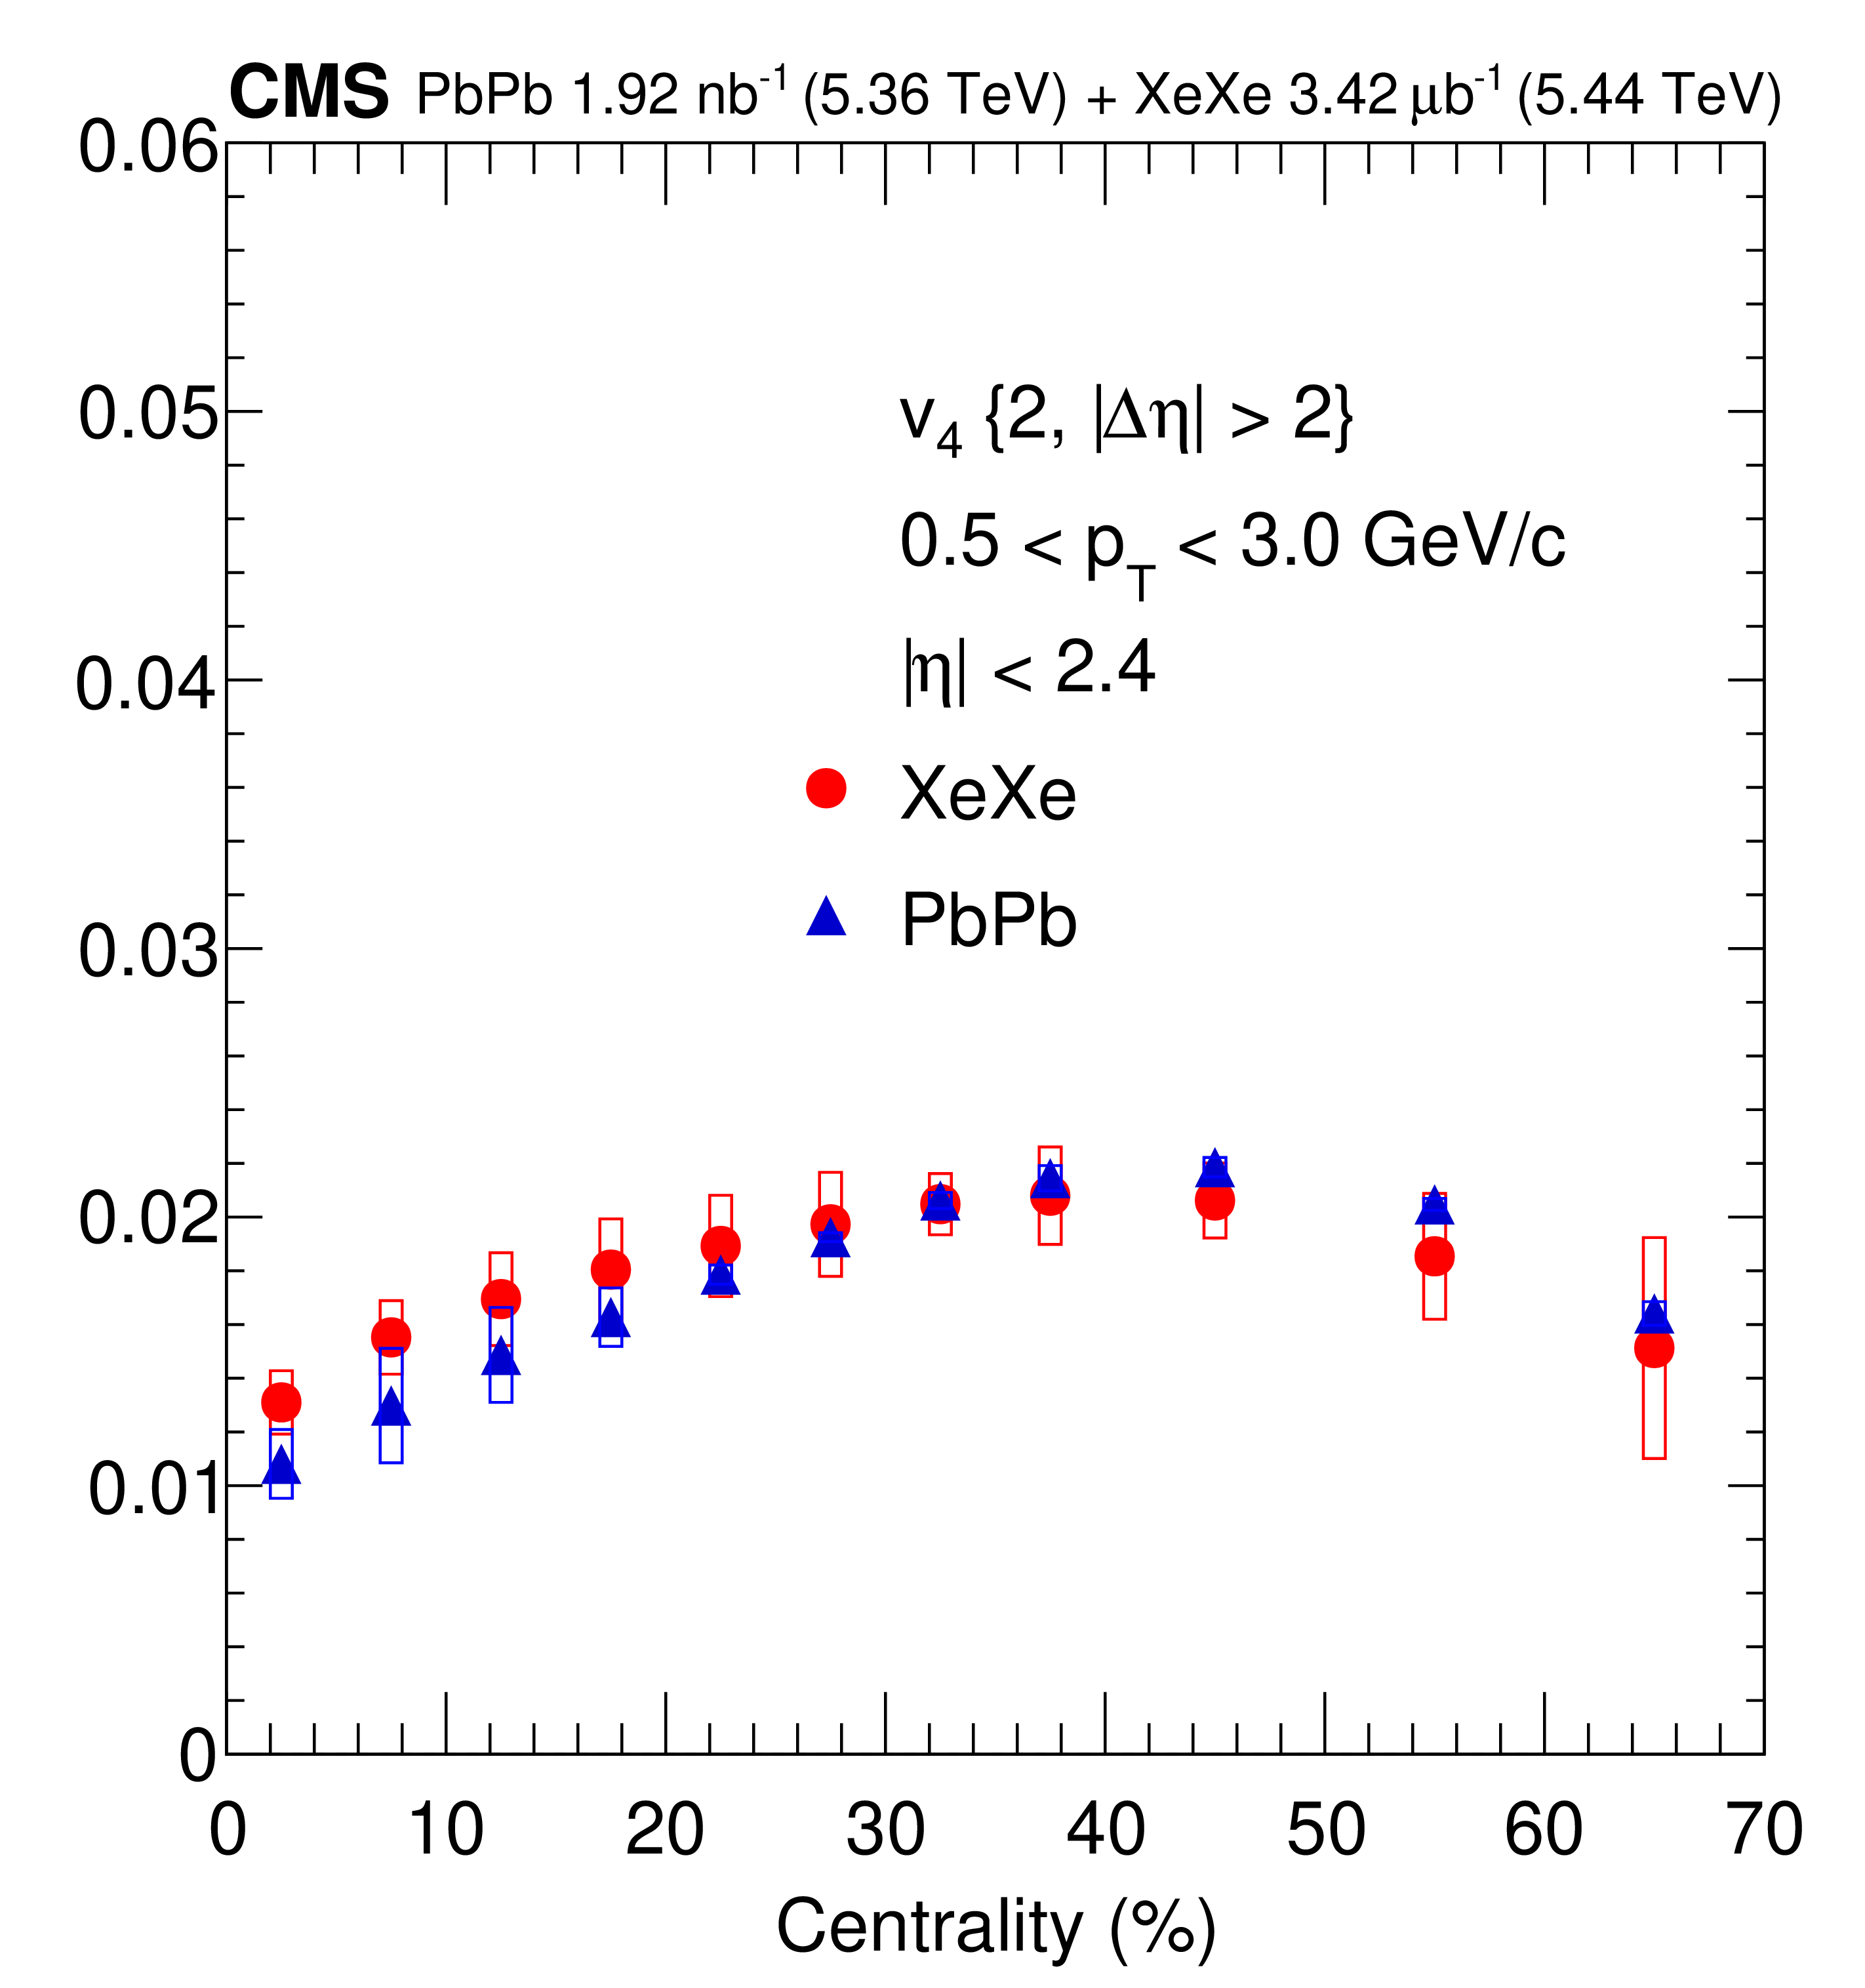
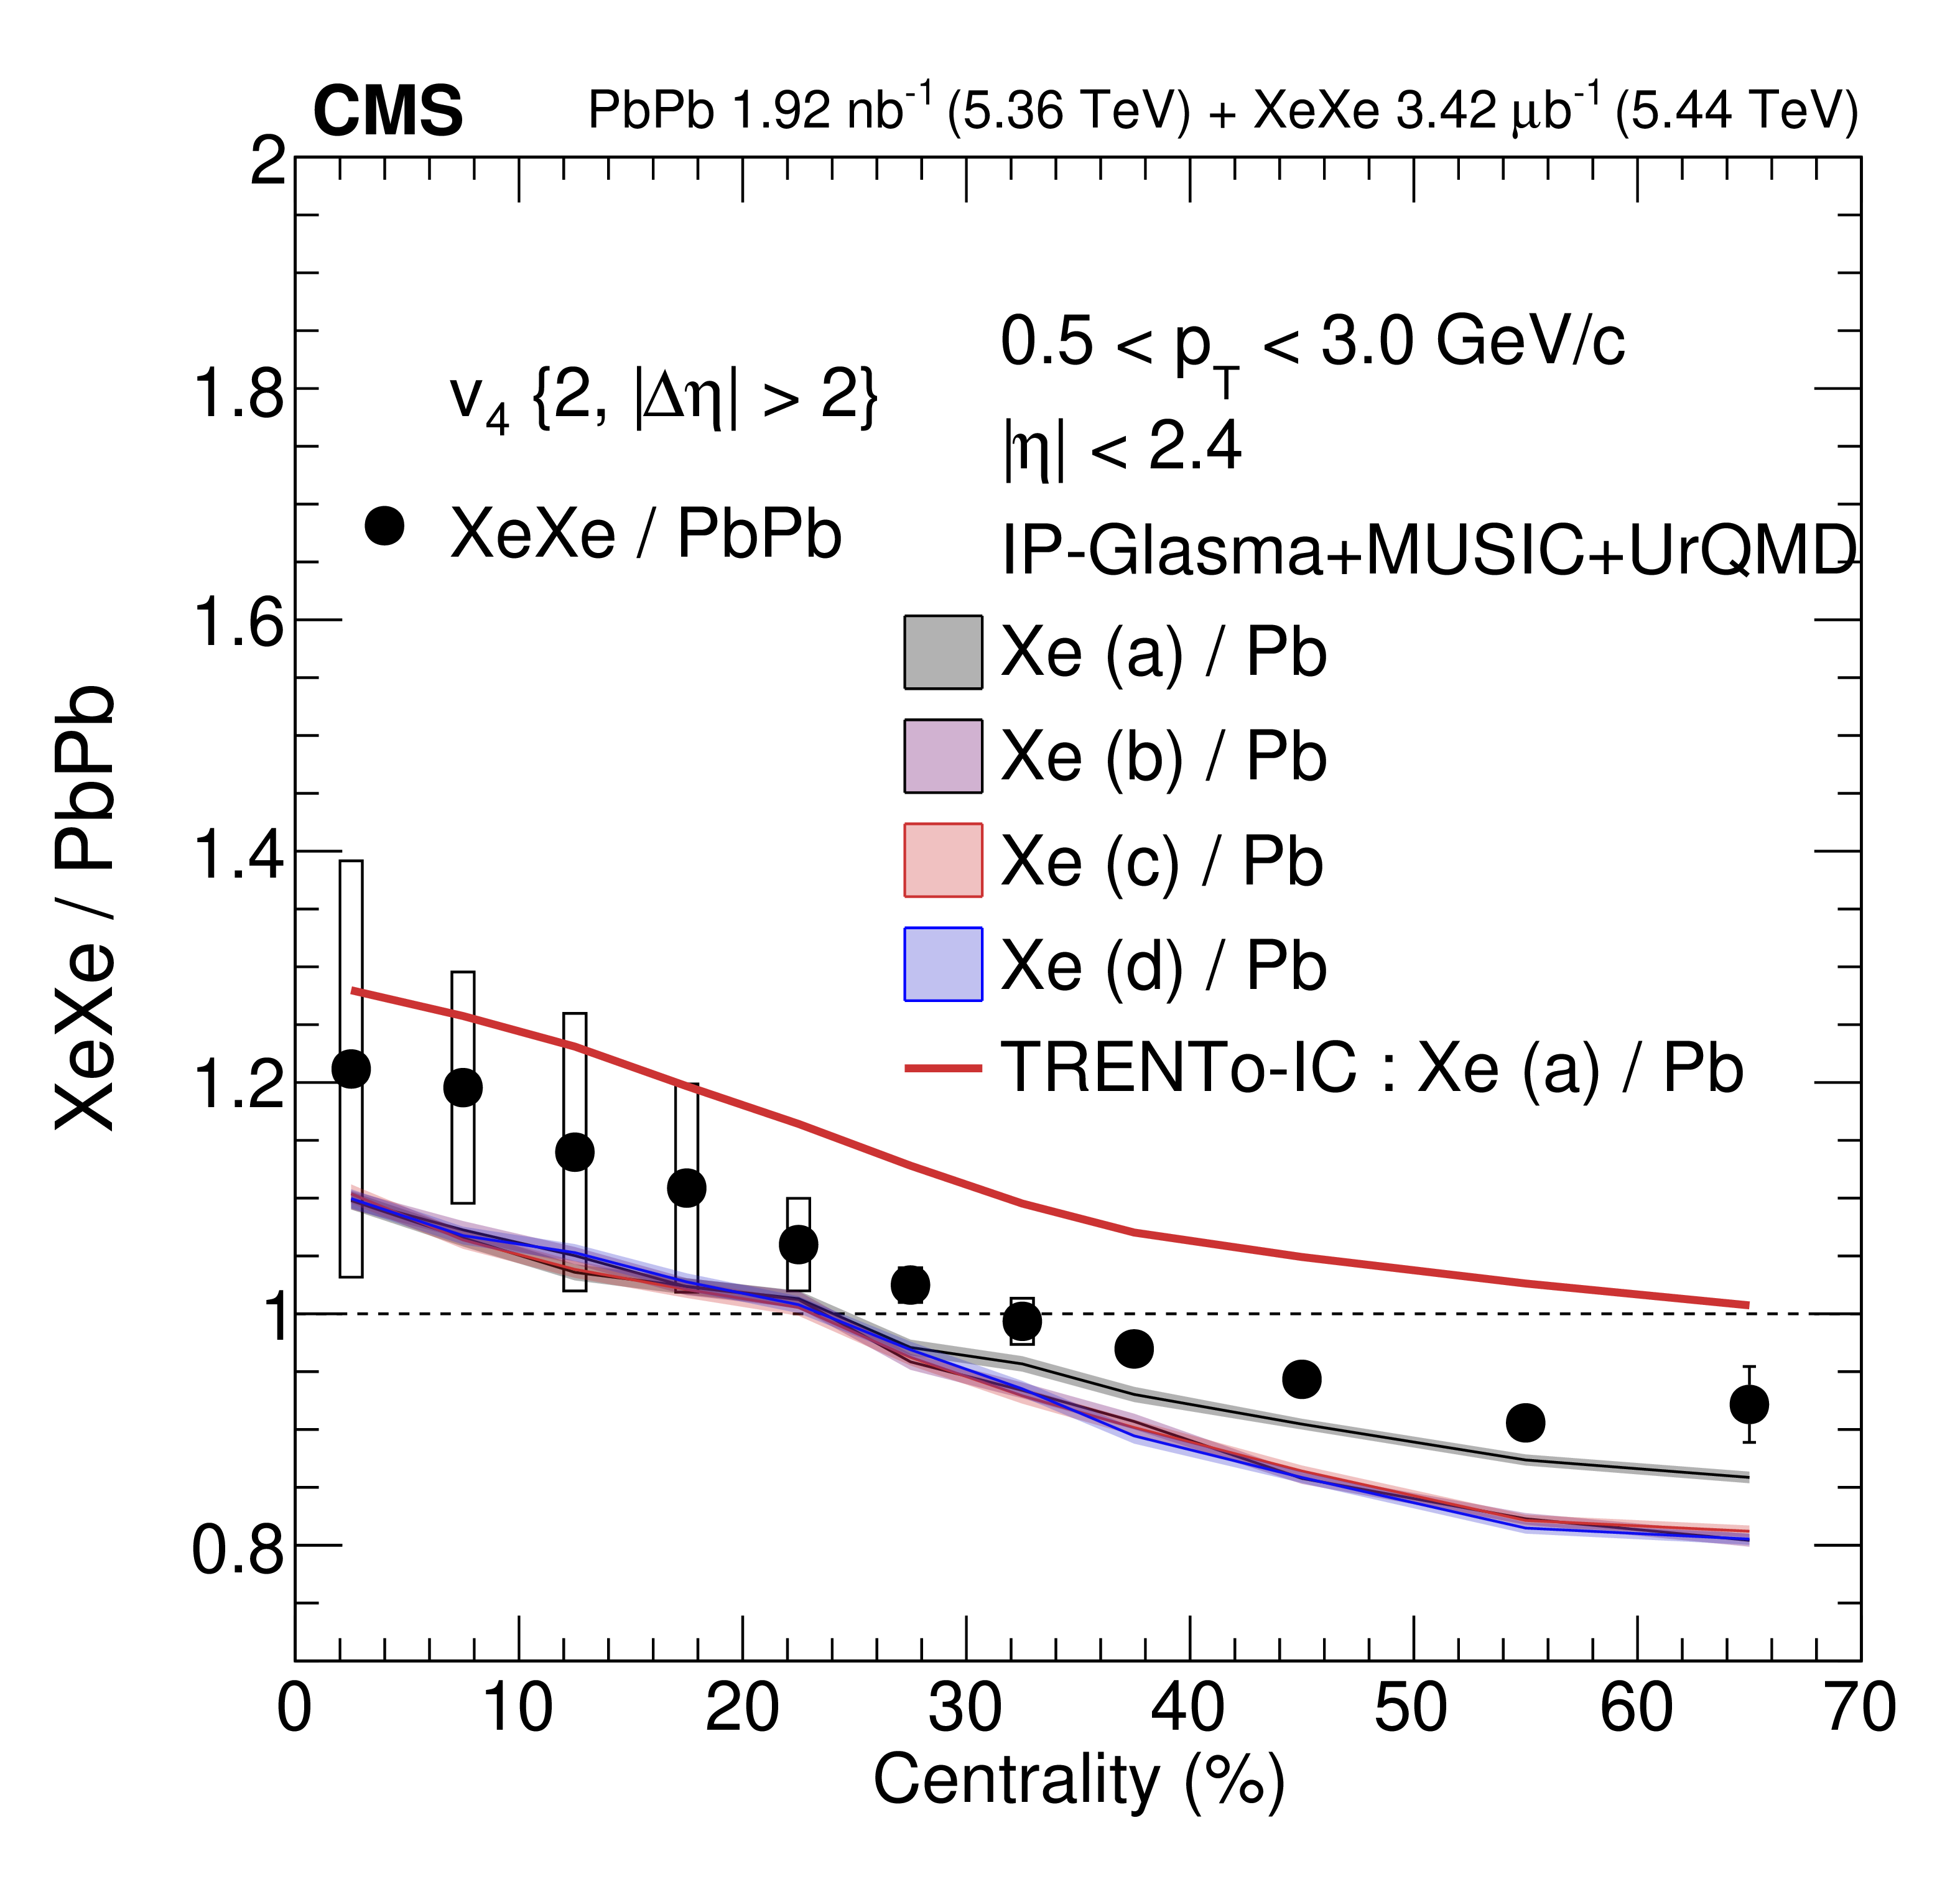
Figure A1:
Measured $ v_{4}\{2,|\Delta\eta| > 2\} $ cumulant values (left) as a function of centrality in XeXe and PbPb collisions, calculated using the 2-particle correlation method. The ratio of the cumulant values (right) in XeXe vs PbPb collisions is shown as a function of centrality. The vertical bars and open bands represent the statistical and systematic uncertainties in the data, respectively. The red line in the right plot shows the prediction from TRENTO-IC in terms of $ \varepsilon_{4} $ for Xe (a), while the shaded bands display the different hydrodynamic predictions for four sets ofXe deformations from the IP-GLASMA+MUSIC+URQMD model. |
png pdf |
Figure A1-a:
Measured $ v_{4}\{2,|\Delta\eta| > 2\} $ cumulant values (left) as a function of centrality in XeXe and PbPb collisions, calculated using the 2-particle correlation method. The ratio of the cumulant values (right) in XeXe vs PbPb collisions is shown as a function of centrality. The vertical bars and open bands represent the statistical and systematic uncertainties in the data, respectively. The red line in the right plot shows the prediction from TRENTO-IC in terms of $ \varepsilon_{4} $ for Xe (a), while the shaded bands display the different hydrodynamic predictions for four sets ofXe deformations from the IP-GLASMA+MUSIC+URQMD model. |
png pdf |
Figure A1-b:
Measured $ v_{4}\{2,|\Delta\eta| > 2\} $ cumulant values (left) as a function of centrality in XeXe and PbPb collisions, calculated using the 2-particle correlation method. The ratio of the cumulant values (right) in XeXe vs PbPb collisions is shown as a function of centrality. The vertical bars and open bands represent the statistical and systematic uncertainties in the data, respectively. The red line in the right plot shows the prediction from TRENTO-IC in terms of $ \varepsilon_{4} $ for Xe (a), while the shaded bands display the different hydrodynamic predictions for four sets ofXe deformations from the IP-GLASMA+MUSIC+URQMD model. |
png pdf |
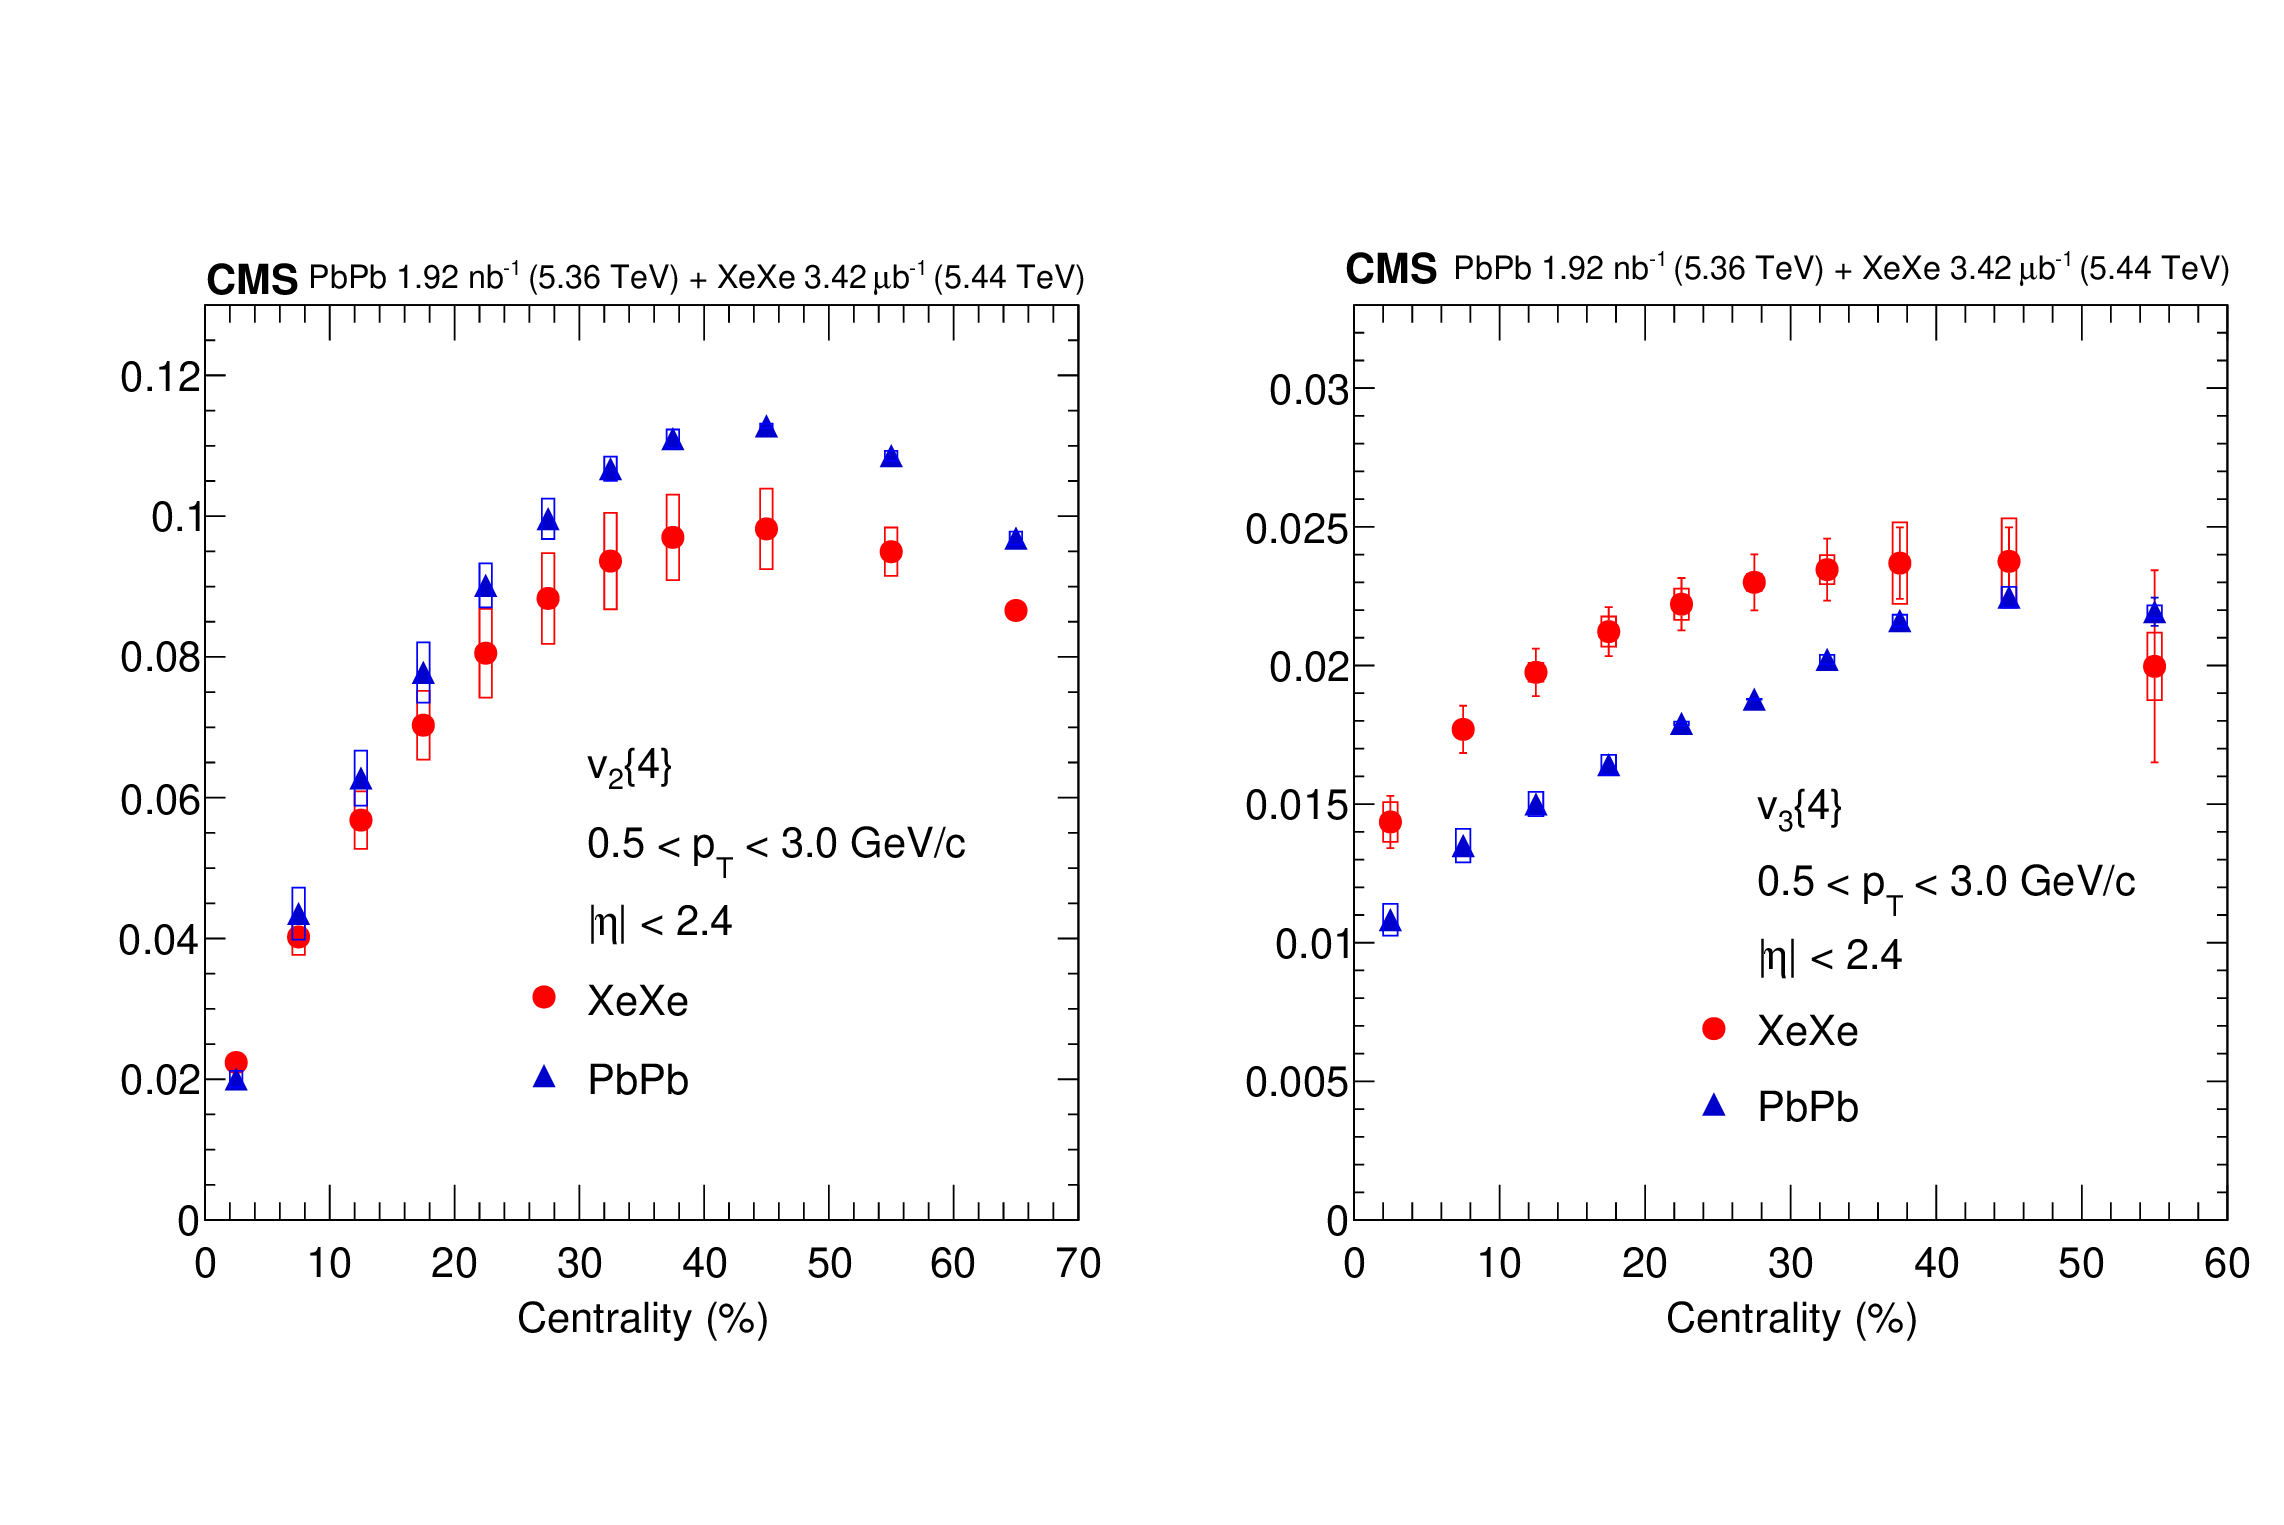
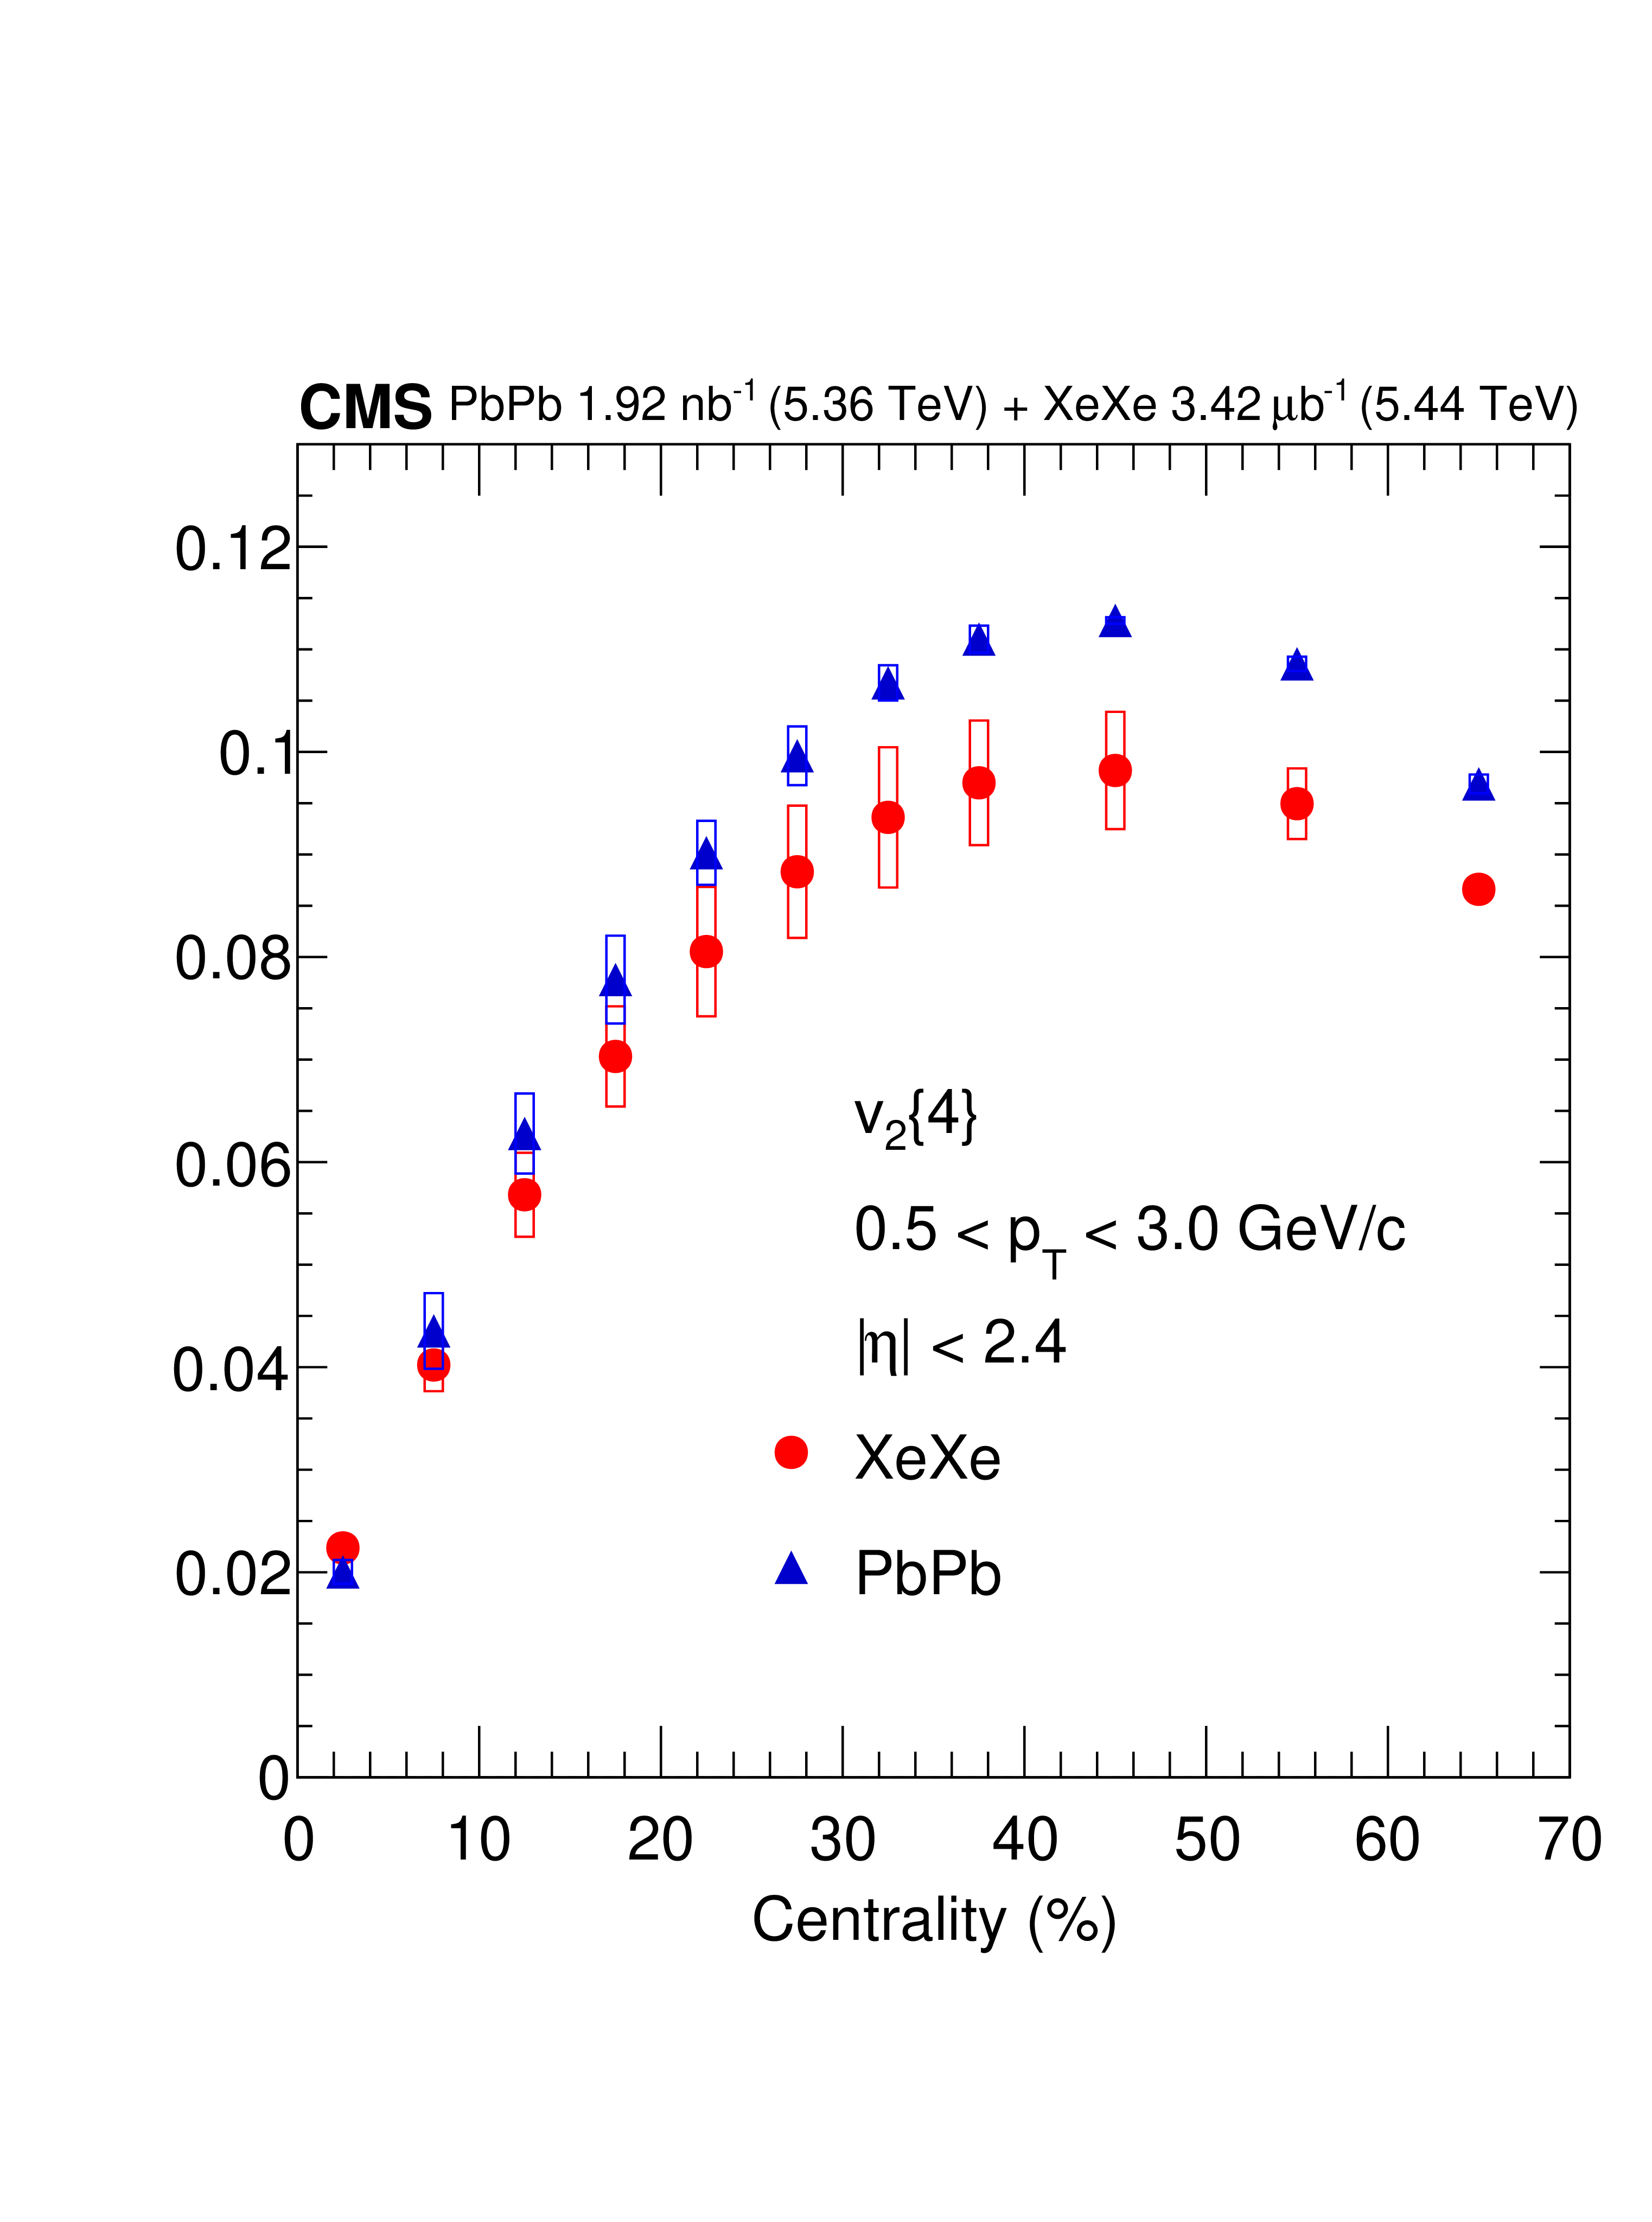
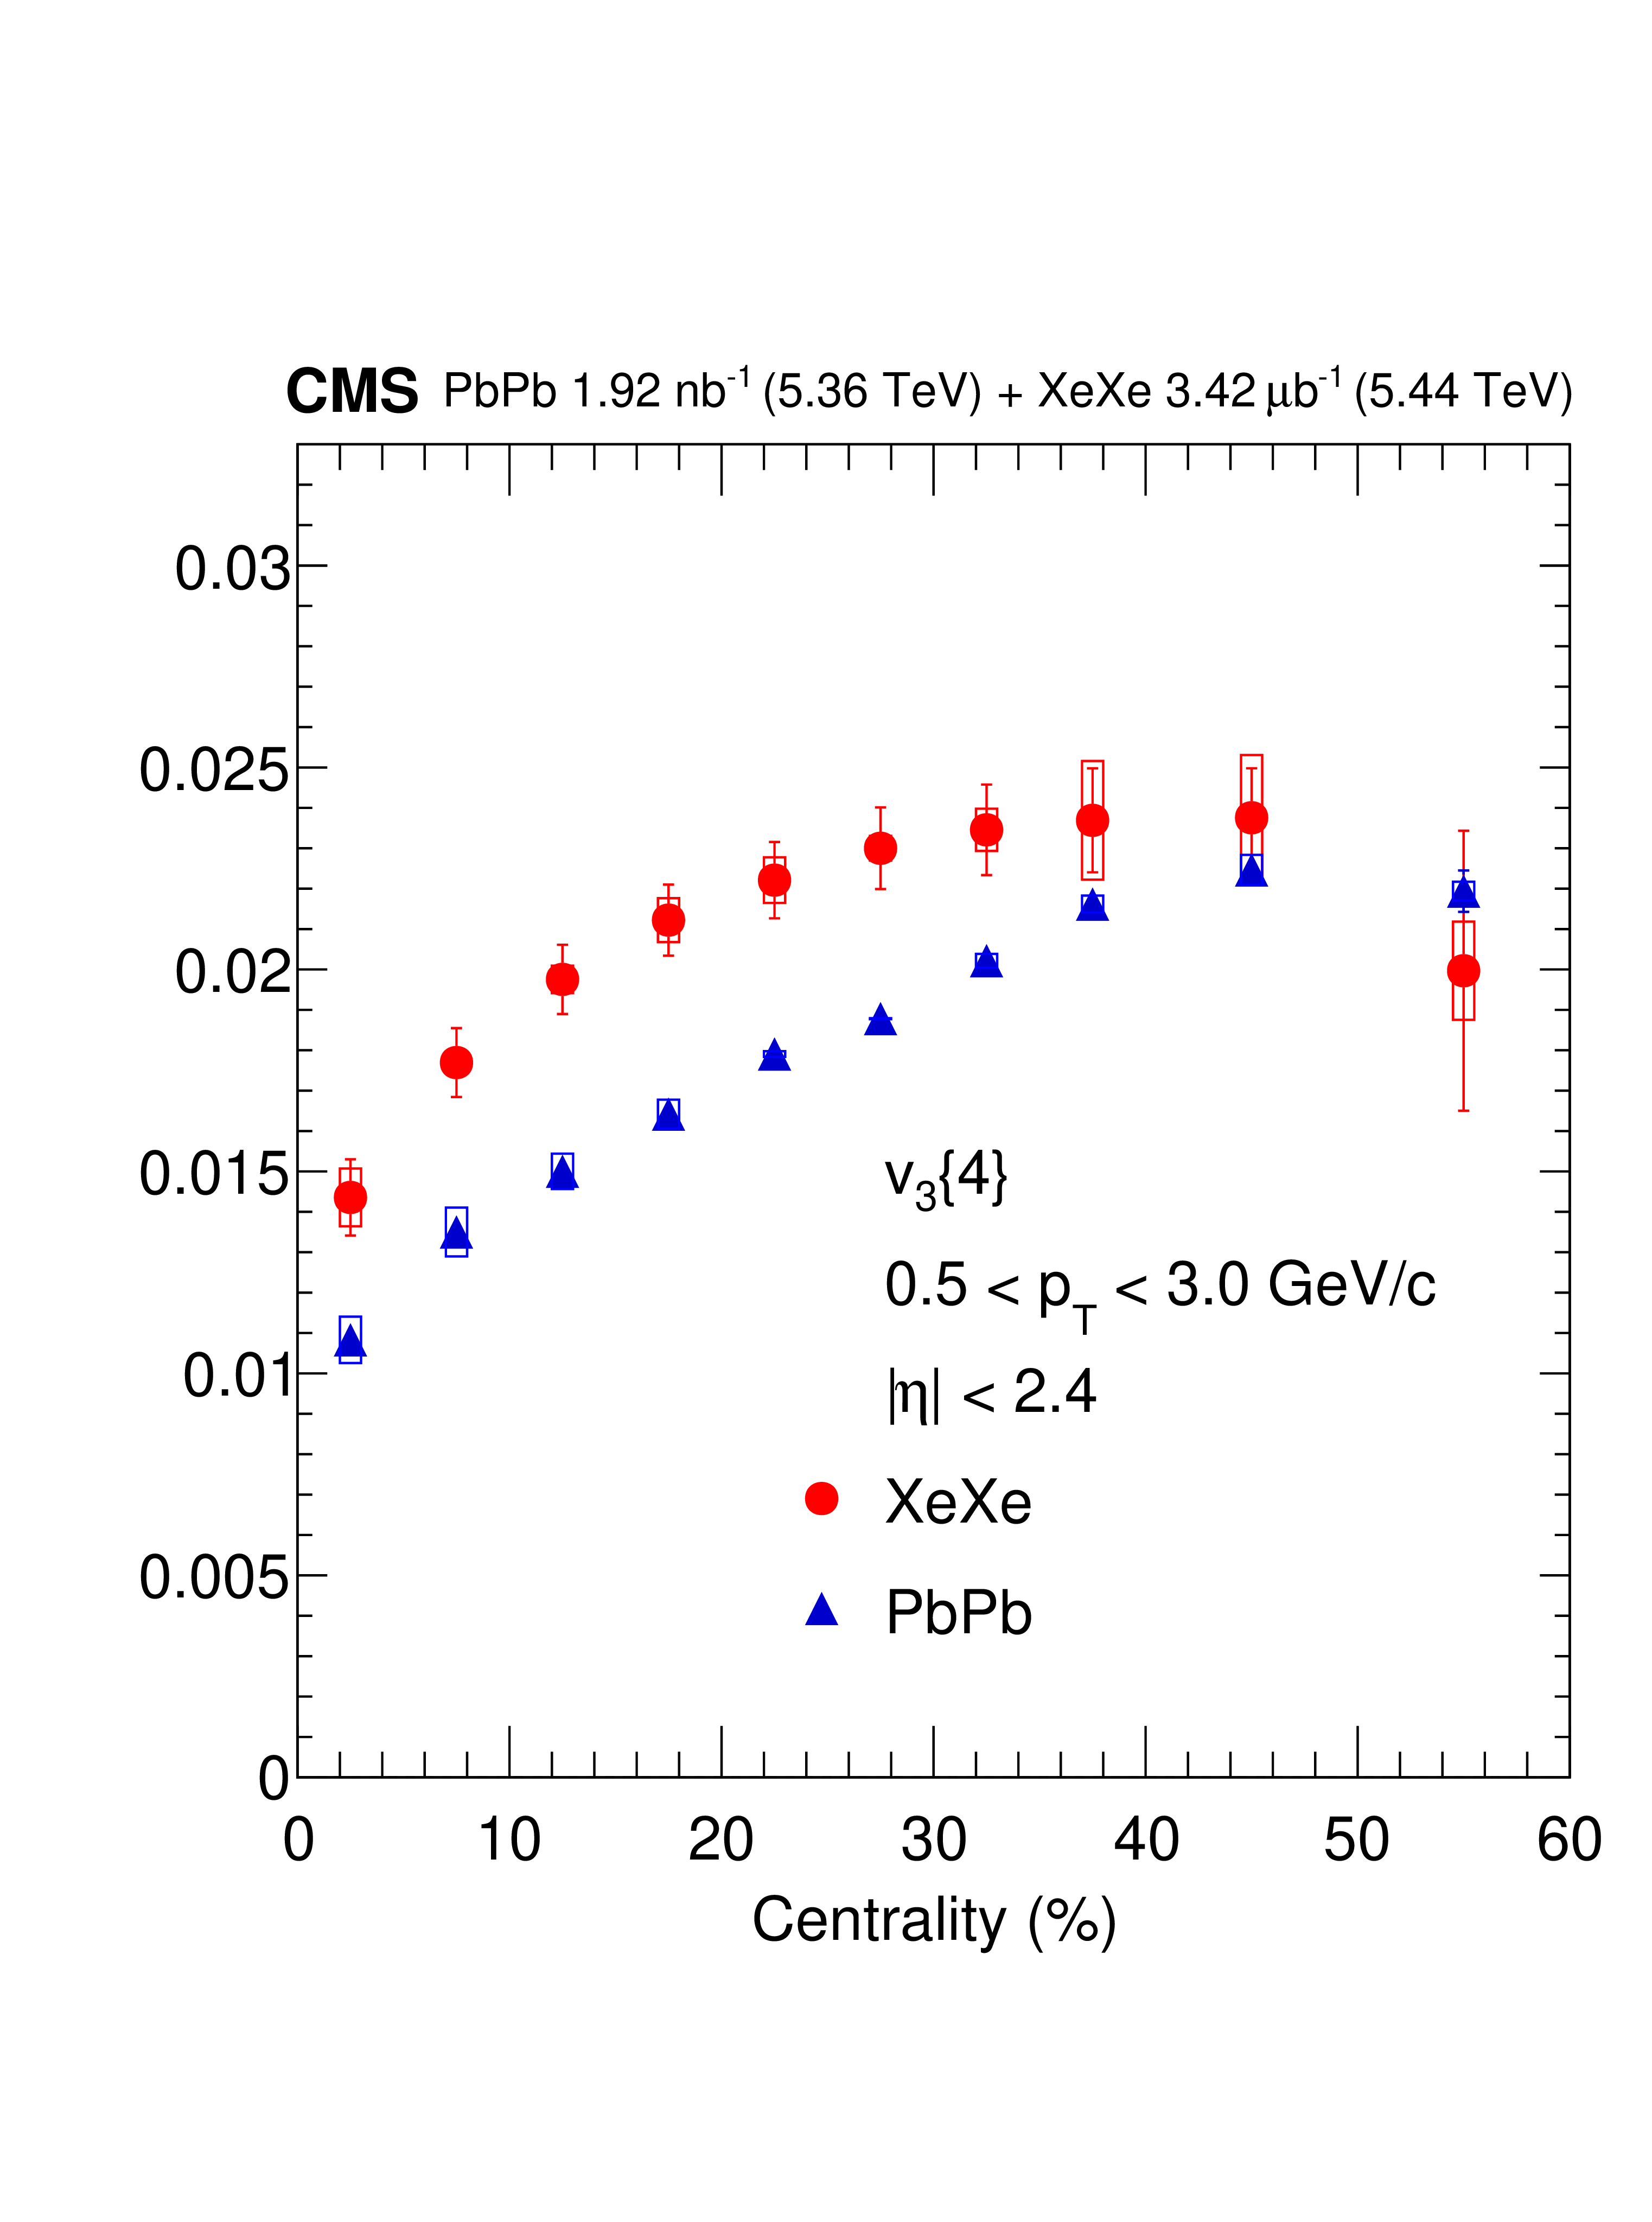
Figure A2:
Measured $ v_2\{4\} $ (left) and $ v_3\{4\} $ (right) cumulant values as a function of centrality for XeXe and PbPb collisions, calculated using 4-particle cumulants. The vertical bars and open boxes represent the statistical and systematic uncertainties, respectively. |
png pdf |
Figure A2-a:
Measured $ v_2\{4\} $ (left) and $ v_3\{4\} $ (right) cumulant values as a function of centrality for XeXe and PbPb collisions, calculated using 4-particle cumulants. The vertical bars and open boxes represent the statistical and systematic uncertainties, respectively. |
png pdf |
Figure A2-b:
Measured $ v_2\{4\} $ (left) and $ v_3\{4\} $ (right) cumulant values as a function of centrality for XeXe and PbPb collisions, calculated using 4-particle cumulants. The vertical bars and open boxes represent the statistical and systematic uncertainties, respectively. |
| Tables | |
png pdf |
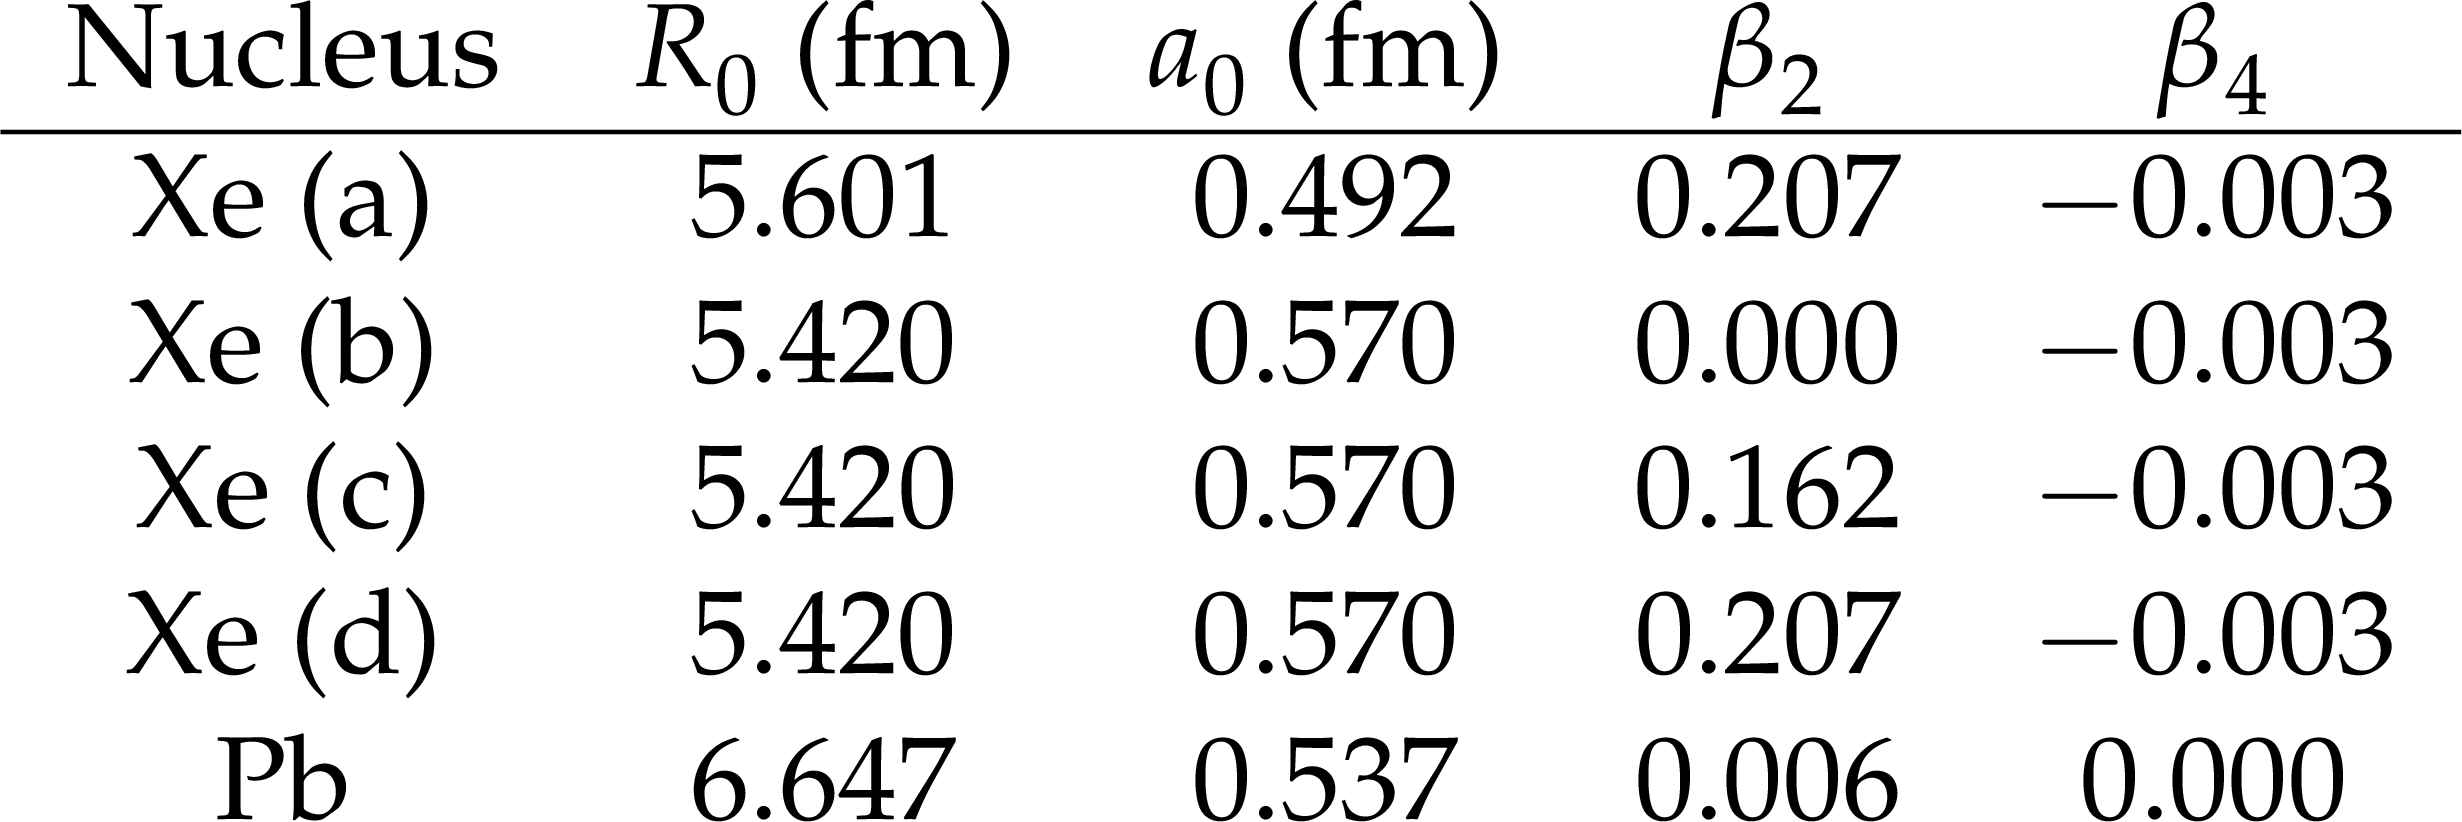
Table 1:
Woods-Saxon parameters used to model the nuclear density distributions for the $ ^{129} $Xe nucleus in four different deformation configurations and for the $ ^{208} $Pb nucleus. The parameters $ R_0 $, $ a_0 $, $ \beta_2 $, and $ \beta_4 $ are defined in Eq. (3). |
png pdf |
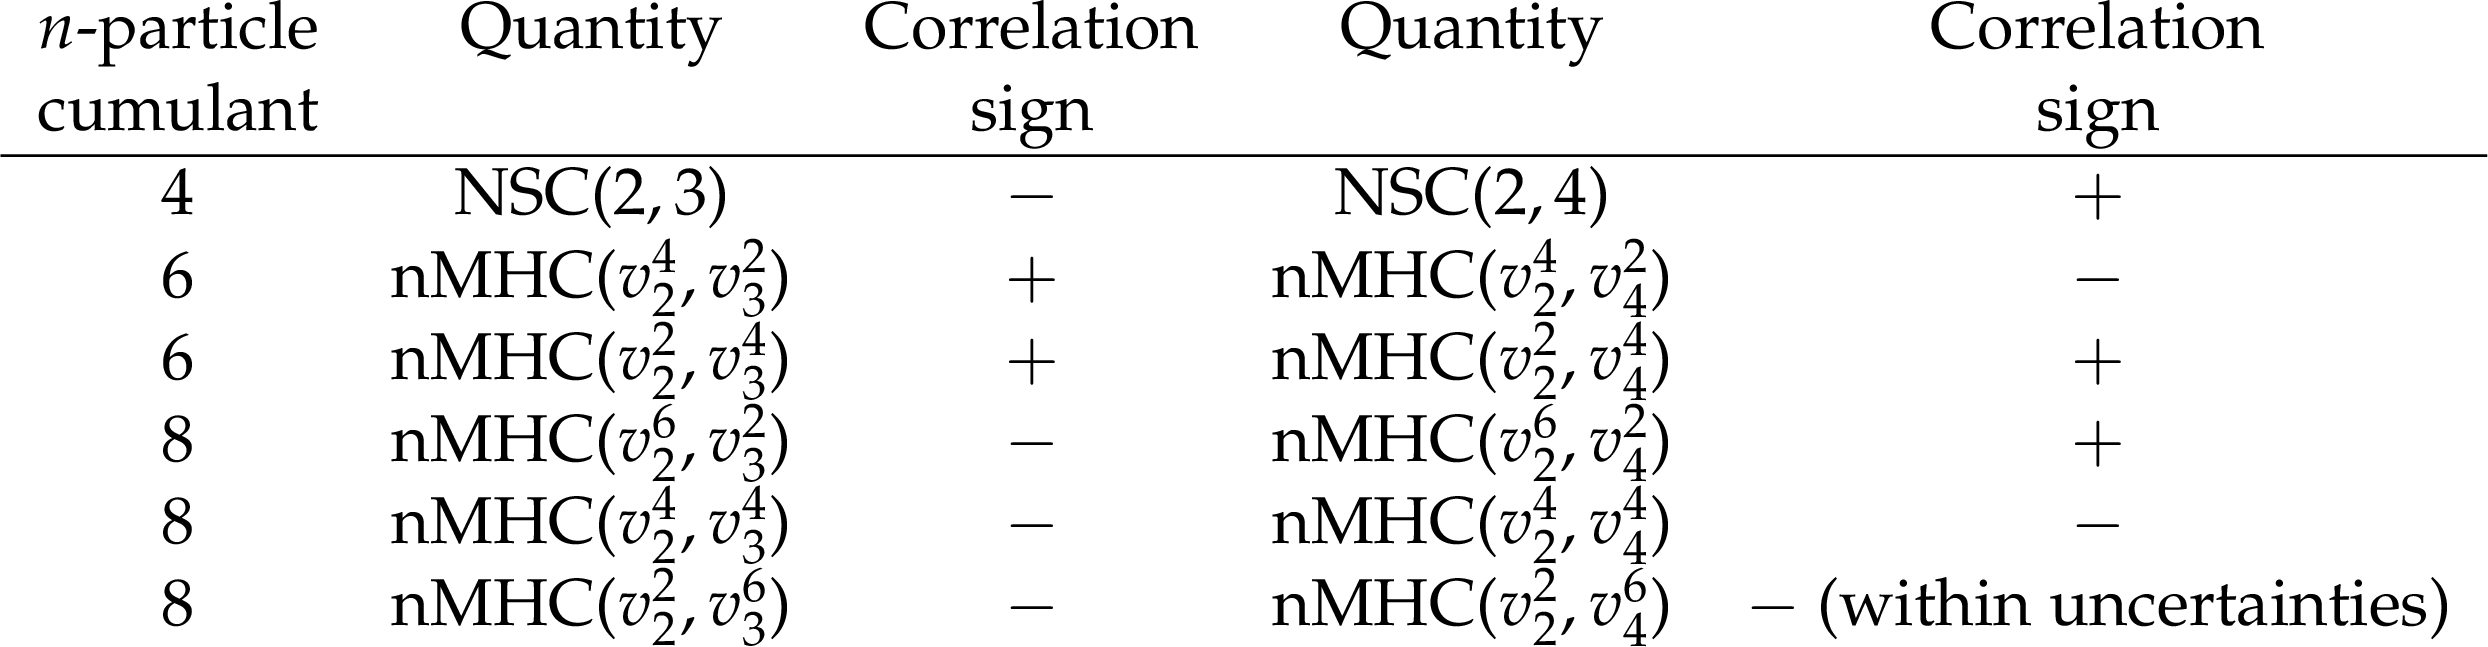
Table 2:
Signs of correlations between different moments of $ v_2 $ and $ v_3/v_4 $ as functions of centrality. |
| Summary |
| For the first time, individual flow harmonics, two- and three-harmonic correlations, and higher-order mixed harmonic cumulants are measured and compared in detail for xenon-xenon (XeXe) and lead-lead (PbPb) collisions at $ \sqrt{\smash[b]{s_{_{\mathrm{NN}}}}} = $ 5.44 and 5.36 TeV, respectively. Theoretical predictions of the IP-GLASMA+MUSIC+URQMD hydrodynamic model, and the TRENTO-IC and IP-GLASMA-IC initial-state models, calculated with various sets of deformation parameters for the $ ^{129} $Xe nucleus, are compared to the data. The final-state model calculation from IP-GLASMA+MUSIC+URQMD with dynamic nuclear deformation parameters $ a_{0} = $ 0.492 and $ \beta_{2} = $ 0.207 for $ ^{129} $Xe provides the best agreement among tested parameter sets. Here, $ a_{0} $ is the nuclear skin depth, and $ \beta_{2} $ is the quadrupole deformation parameter. This comparison indicates that including a prolate deformation in the parameterization of the $ ^{129} $Xe nuclear shape (in contrast to the doubly magic, nearly spherical $ ^{208} $Pb nucleus) is necessary to reproduce the measured flow observables within the IP-GLASMA+MUSIC+URQMD framework. On the other hand, the difference in initial-state predictions from the TRENTO-IC and IP-GLASMA-IC models not only point to the sensitivity of these observables to the pre-equilibrium dynamics needed to model the experimental data, but also to the increasing nonlinearity of the higher-order moments of the flow harmonics in peripheral collisions. While differences between the two initial-state models are visible, a definitive conclusion about their relative performance cannot be drawn, as such a comparison without the inclusion of hydrodynamic evolution and freeze-out stages remains incomplete. The comparison of higher-order moments in XeXe and PbPb collisions provides insight into the impact of system size and shape on these observables. Measurements involving higher-order moments of fluctuation-driven flow harmonics, such as $ v_{3} $ and $ v_{4} $, are, as expected, larger in the smaller XeXe system. Subtle differences exist between data and model calculations with the current sets of parameters. These differences highlight the importance of fine-tuning the model parameters, including not only the nuclear deformation parameters but also those related to hydrodynamic calculations, such as transport coefficients and freeze-out criteria. Such analyses can significantly improve the overall understanding of initial conditions in heavy ion collisions and transport properties of the quark-gluon plasma created at the LHC. Furthermore, this work provides a data-driven, multi-faceted probe of flow fluctuations, offering direct sensitivity to correlations arising from nonlinear hydrodynamic response. |
| References | ||||
| 1 | BRAHMS Collaboration | Quark gluon plasma and color glass condensate at RHIC? the perspective from the BRAHMS experiment | Nucl. Phys. A 757 (2005) 1 | nucl-ex/0410020 |
| 2 | CMS Collaboration | Overview of high-density QCD studies with the CMS experiment at the LHC | Phys. Rept, 2025 link |
CMS-HIN-23-011 2405.10785 |
| 3 | J.-Y. Ollitrault | Anisotropy as a signature of transverse collective flow | PRD 46 (1992) 229 | |
| 4 | CMS Collaboration | Observation of correlated azimuthal anisotropy fourier harmonics in pp and p+Pb collisions at the LHC | PRL 120 (2018) 092301 | CMS-HIN-16-022 1709.09189 |
| 5 | ALICE Collaboration | Investigations of anisotropic flow using multiparticle azimuthal correlations in pp, p-Pb, Xe-Xe, and Pb-Pb collisions at the LHC | PRL 123 (2019) 142301 | 1903.01790 |
| 6 | J. Noronha-Hostler, L. Yan, F. G. Gardim, and J.-Y. Ollitrault | Linear and cubic response to the initial eccentricity in heavy-ion collisions | Phys. Rev. C 93 (2016) 014909 | 1511.03896 |
| 7 | J. Jia | Shape of atomic nuclei in heavy ion collisions | Phys. Rev. C 105 (2022) 014905 | 2106.08768 |
| 8 | CMS Collaboration | Precision luminosity measurement in proton-proton collisions at $ \sqrt{s} = $ 13 TeV in 2015 and 2016 at CMS | EPJC 81 (2021) 800 | CMS-LUM-17-003 2104.01927 |
| 9 | CMS Collaboration | CMS luminosity measurement using 2017 proton-proton collisions at $ \sqrt{s} = $ 13 TeV | CMS Physics Analysis Summary, 2018 CMS-PAS-LUM-17-004 |
CMS-PAS-LUM-17-004 |
| 10 | CMS Collaboration | CMS luminosity measurement using nucleus--nucleus collisions at $ \sqrt {\smash [b]{s_{_{\mathrm {NN}}}}} = $ 5.02 TeV in 2018 | CMS Physics Analysis Summary, 2022 CMS-PAS-LUM-18-002 |
CMS-PAS-LUM-18-002 |
| 11 | CMSnoop | none | \hrefHEPData record for this analysis, 2025 link |
|
| 12 | CMS Collaboration | Description and performance of track and primary-vertex reconstruction with the CMS tracker | JINST 9 (2014) P10009 | CMS-TRK-11-001 1405.6569 |
| 13 | CMS Collaboration | The CMS experiment at the CERN LHC | JINST 3 (2008) S08004 | |
| 14 | GEANT4 Collaboration | GEANT 4---a simulation toolkit | NIM A 506 (2003) 250 | |
| 15 | CMS Collaboration | Charged-particle angular correlations in XeXe collisions at $ \sqrt{{s_\mathrm{NN}}} = $ 5.44 TeV | Phys. Rev. C 100 (2019) 044902 | CMS-HIN-18-001 1901.07997 |
| 16 | CMS Collaboration | The CMS trigger system | JINST 12 (2017) P01020 | CMS-TRG-12-001 1609.02366 |
| 17 | CMS Collaboration | Measurement of the pseudorapidity and centrality dependence of the transverse energy density in PbPb collisions at $ \sqrt{{s_\mathrm{NN}}} = $ 2.76 TeV | PRL 109 (2012) 152303 | CMS-HIN-11-003 1205.2488 |
| 18 | ALICE Collaboration | Measurements of mixed harmonic cumulants in Pb-Pb collisions at $ \sqrt{{s_\mathrm{NN}}} = $ 5.02 TeV | PLB 818 (2021) 136354 | 2102.12180 |
| 19 | CMS Collaboration | Evidence for collectivity in pp collisions at the LHC | PLB 765 (2017) 193 | CMS-HIN-16-010 1606.06198 |
| 20 | A. Bilandzic, R. Snellings, and S. Voloshin | Flow analysis with cumulants: Direct calculations | Phys. Rev. C 83 (2011) 044913 | 1010.0233 |
| 21 | A. Bilandzic et al. | Generic framework for anisotropic flow analyses with multiparticle azimuthal correlations | Phys. Rev. C 89 (2014) 064904 | 1312.3572 |
| 22 | ALICE Collaboration | Correlated event-by-event fluctuations of flow harmonics in Pb-Pb collisions at $ \sqrt{{s_\mathrm{NN}}} = $ 2.76 TeV | PRL 117 (2016) 182301 | 1604.07663 |
| 23 | C. Mordasini, A. Bilandzic, D. Karako \c c , and S. F. Taghavi | Higher order symmetric cumulants | Phys. Rev. C 102 (2020) 024907 | 1901.06968 |
| 24 | Z. Moravcova, K. Gulbrandsen, and Y. Zhou | Generic algorithm for multiparticle cumulants of azimuthal correlations in high energy nucleus collisions | Phys. Rev. C 103 (2021) 024913 | 2005.07974 |
| 25 | I. P. Lokhtin and A. M. Snigirev | A model of jet quenching in ultrarelativistic heavy ion collisions and high-$ p_{\mathrm{T}} $ hadron spectra at RHIC | EPJC 45 (2006) 211 | hep-ph/0506189 |
| 26 | B. Schenke, P. Tribedy, and R. Venugopalan | Fluctuating glasma initial conditions and flow in heavy ion collisions | PRL 108 (2012) 252301 | 1202.6646 |
| 27 | S. McDonald et al. | A detailed study and synthesis of flow observables in the IP-Glasma+MUSIC+UrQMD framework | Nucl. Phys. A 967 (2017) 393 | 1704.05362 |
| 28 | C. Gale, S. Jeon, and B. Schenke | Hydrodynamic modeling of heavy-ion collisions | Int. J. Mod. Phys. A 28 (2013) 1340011 | 1301.5893 |
| 29 | S. A. Bass et al. | Microscopic models for ultrarelativistic heavy ion collisions | Prog. Part. Nucl. Phys. 41 (1998) 255 | nucl-th/9803035 |
| 30 | J. S. Moreland, J. E. Bernhard, and S. A. Bass | Alternative ansatz to wounded nucleon and binary collision scaling in high-energy nuclear collisions | Phys. Rev. C 92 (2015) 011901 | 1412.4708 |
| 31 | G. Giacalone, J. Noronha-Hostler, M. Luzum, and J.-Y. Ollitrault | Hydrodynamic predictions for 5.44 TeV Xe+Xe collisions | Phys. Rev. C 97 (2018) 034904 | 1711.08499 |
| 32 | H. Mäntysaari, B. Schenke, C. Shen, and W. Zhao | Probing nuclear structure of heavy ions at energies available at the CERN Large Hadron Collider | Phys. Rev. C 110 (2024) 054913 | 2409.19064 |
| 33 | S. Zhao et al. | Exploring the nuclear shape phase transition in ultra-relativistic $ ^{129}\mathrm{Xe}+^{129}\mathrm{Xe} $ collisions at the LHC | PRL 133 (2024) 192301 | 2403.07441 |
| 34 | K. Werner | Core-corona separation in ultrarelativistic heavy ion collisions | PRL 98 (2007) 152301 | 0704.1270 |
| 35 | ALICE Collaboration | Multiharmonic correlations of different flow amplitudes in Pb-Pb collisions at $ \sqrt{{s_\mathrm{NN}}} = $ 2.76 TeV | PRL 127 (2021) 092302 | 2101.02579 |
| 36 | W. Zhao, H.-j. Xu, and H. Song | Collective flow in 2.76 A TeV and 5.02 A TeV Pb+Pb collisions | EPJC 77 (2017) 645 | 1703.10792 |
|
|
Compact Muon Solenoid LHC, CERN |
|

|

|

|

|

|