Compact Muon Solenoid
LHC, CERN
 Visit us: CMS Public Website, CMS Physics ;
Contact us: CMS Publications Committee
Visit us: CMS Public Website, CMS Physics ;
Contact us: CMS Publications Committee
| CMS-HIG-24-007 ; CERN-EP-2026-195 | ||
| A measurement of the Higgs boson mass in the diphoton decay channel in proton-proton collisions at $ \sqrt{s} = $ 13 TeV | ||
| CMS Collaboration | ||
| 30 July 2026 | ||
| Submitted to Physics Letters B | ||
| Abstract: A measurement of the Higgs boson mass in the diphoton decay channel is performed using proton-proton collision data at a center-of-mass energy of 13 TeV. The data set recorded with the CMS detector between 2016 and 2018 is used, corresponding to an integrated luminosity of 138 fb$ ^{-1} $. A refined detector calibration and new analysis techniques are employed to improve the precision of the results compared to earlier measurements. The Higgs boson mass is measured to be $ m_{\mathrm{H}} = $ 125.13 $ \pm $ 0.15 $ \text{GeV} = $ 125.13 $ \pm $ 0.10 (stat) $ \pm $ 0.12 (syst) GeV. In addition, a combination with the mass measurement at center-of-mass energies of 7 and 8 TeV in the diphoton final state is performed resulting in $ m_{\mathrm{H}} = $ 125.06 $ \pm $ 0.14 $ \text{GeV} = $ 125.06 $ \pm $ 0.09 (stat) $ \pm $ 0.11 (syst) GeV. | ||
| Links: e-print arXiv:2607.28396 [hep-ex] (PDF) ; CDS record ; inSPIRE record ; HepData record ; CADI line (restricted) ; | ||
| Figures & Tables | Summary | Additional Figures | References | CMS Publications |
|---|
| Figures | |
png pdf |
Figure 1:
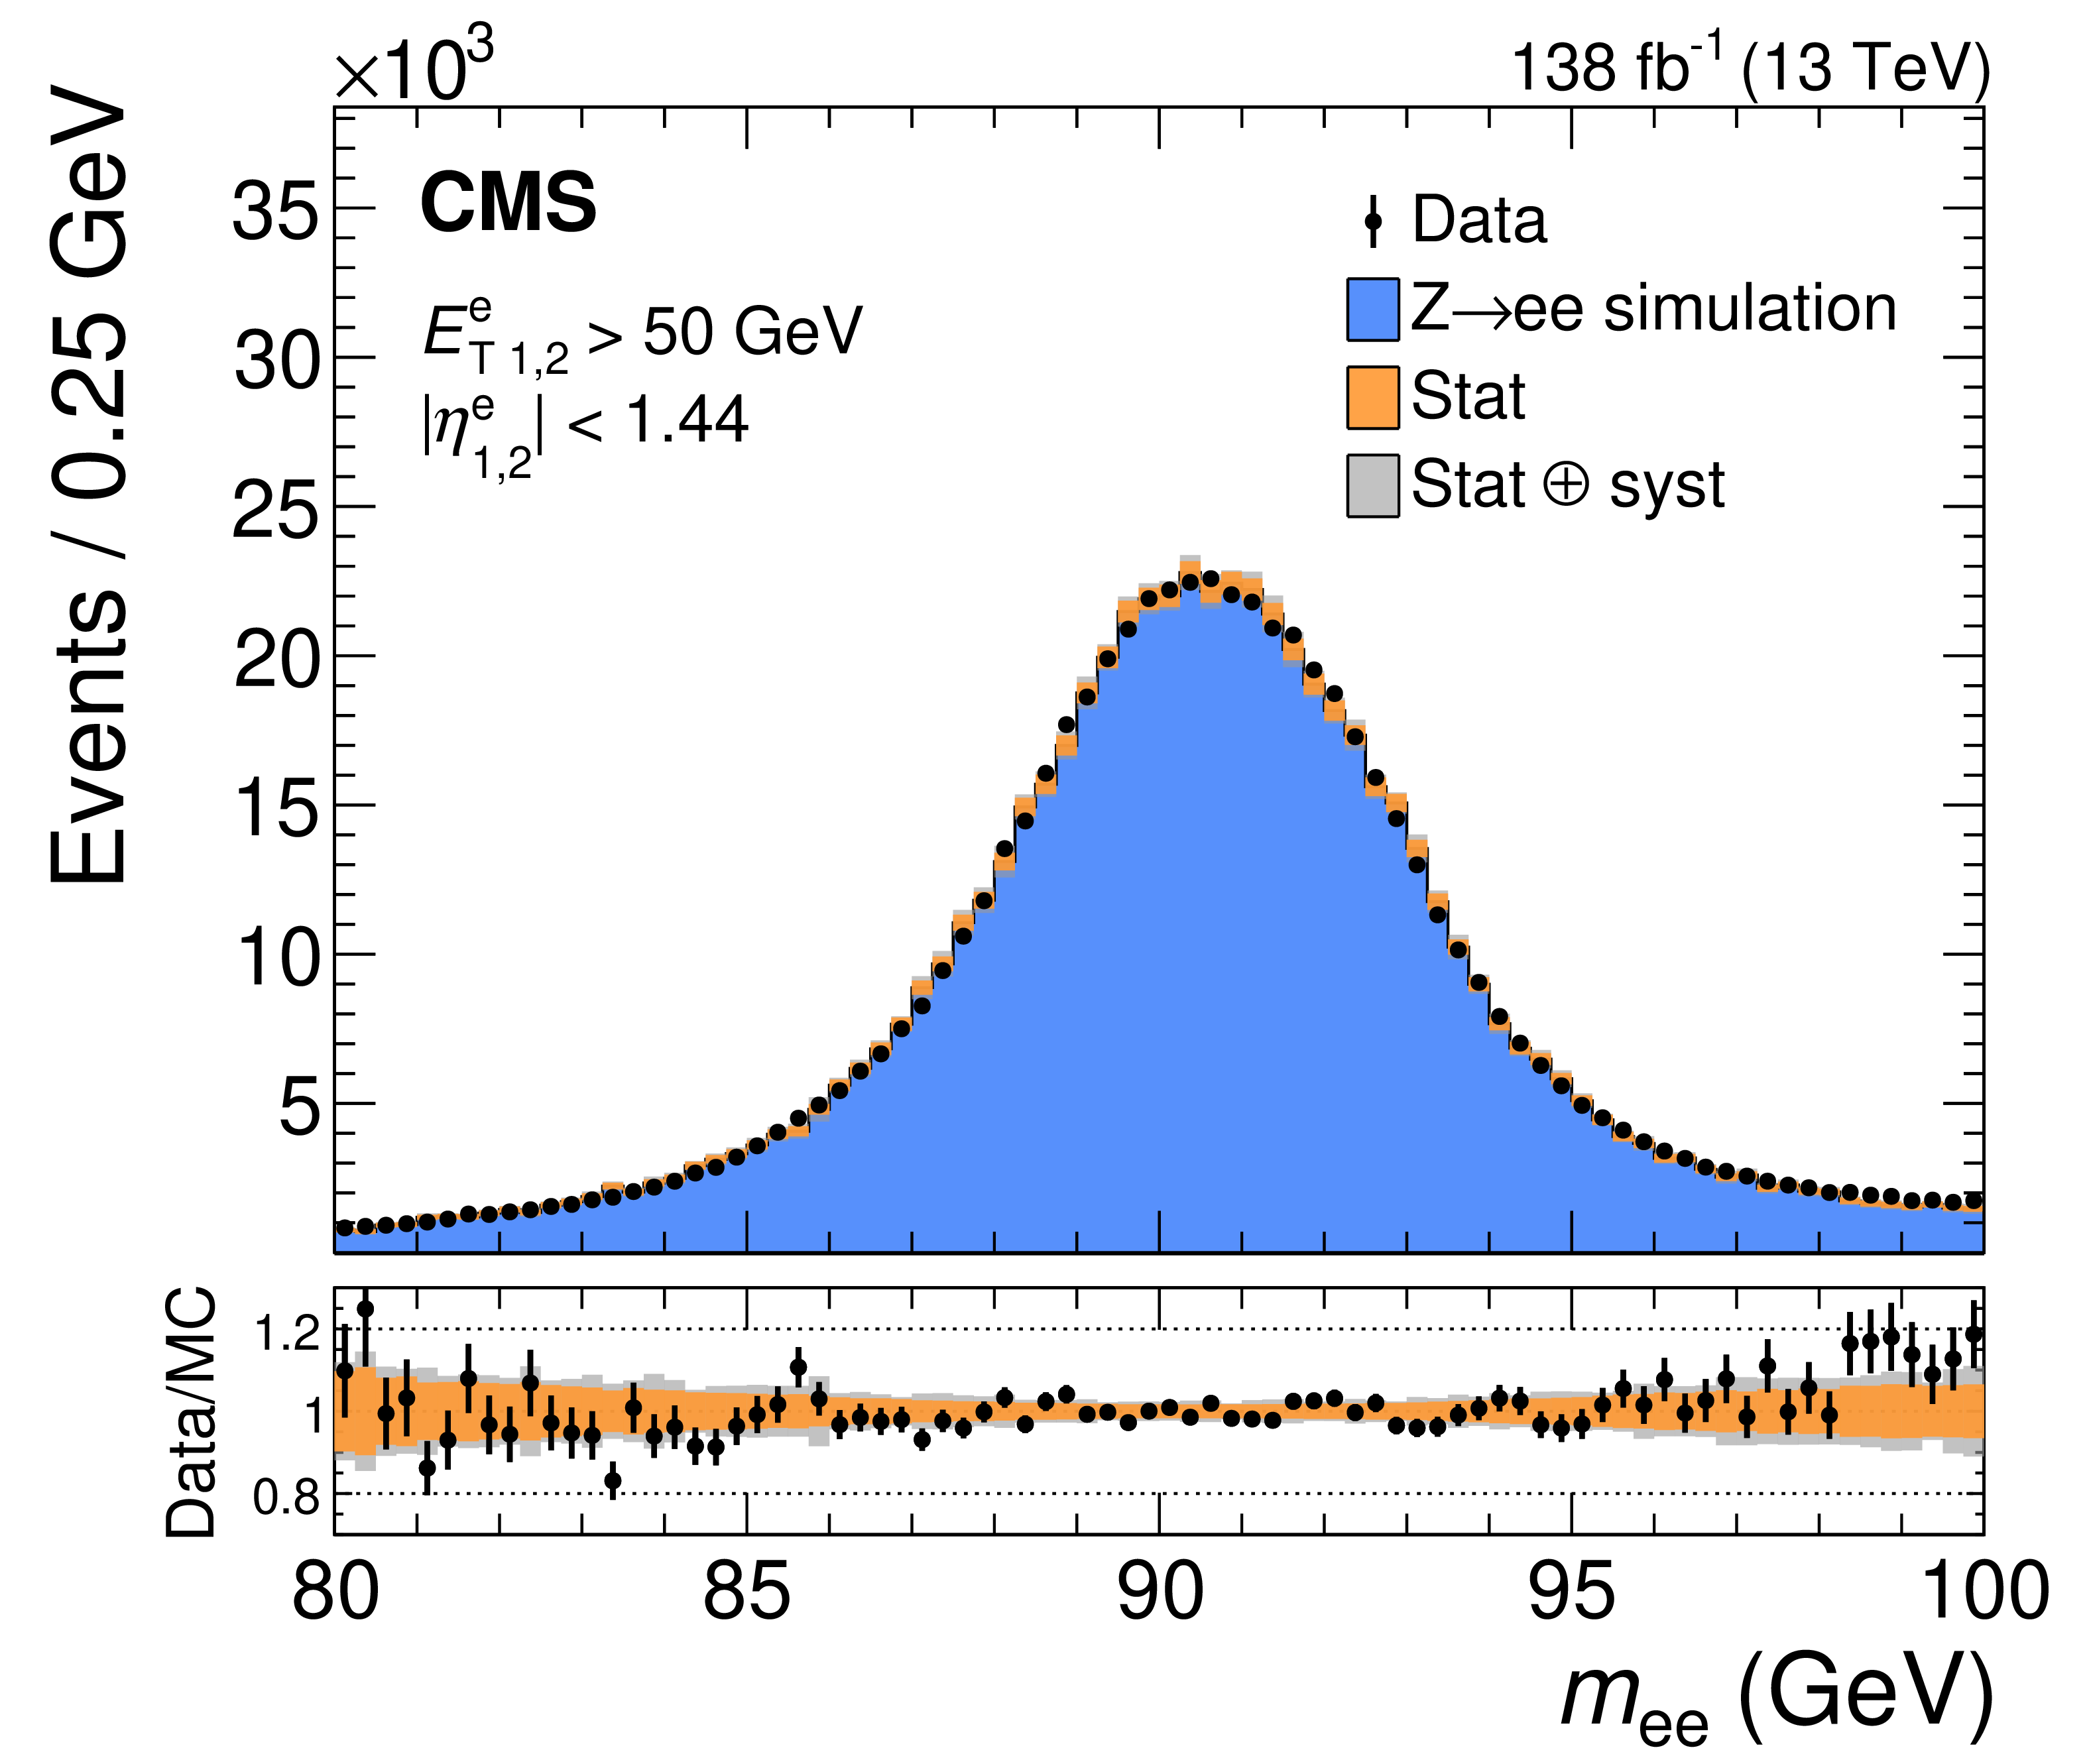
Comparison of the dielectron invariant mass distribution in data and simulation for $ \mathrm{Z}\to\mathrm{e}\mathrm{e} $ events after applying only the electron energy corrections. Both electrons are required to have $ E^{\mathrm{e}}_{\mathrm{T}} > $ 50 GeV and to be reconstructed in the ECAL barrel region. The lower panel shows the bin-by-bin ratio of the data to the simulation (MC). The error bands account for the statistical and systematic uncertainties associated with the energy scale corrections. |
png pdf |
Figure 2:
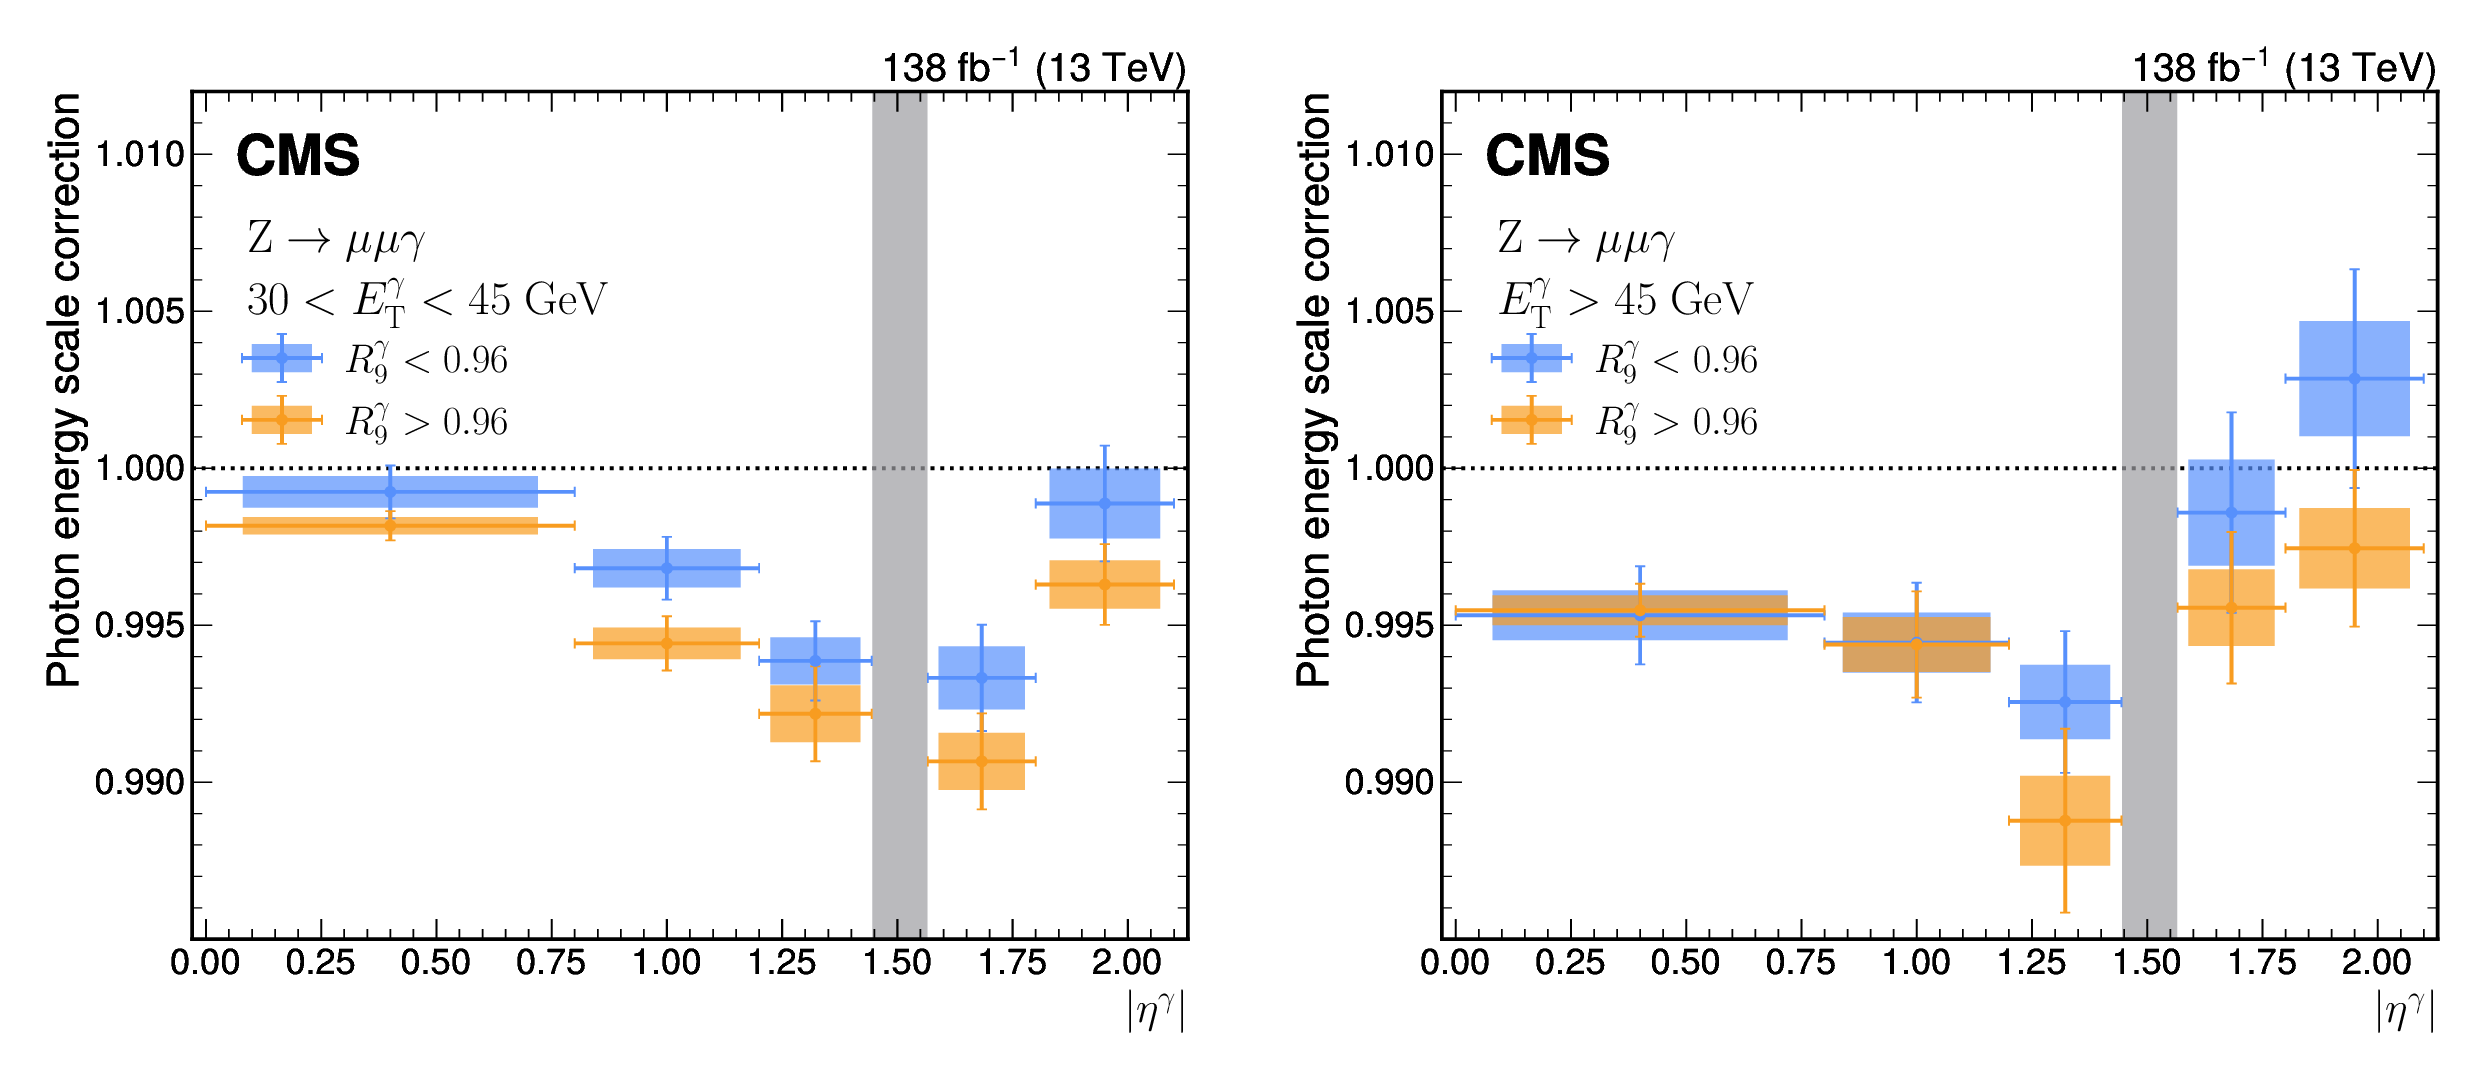
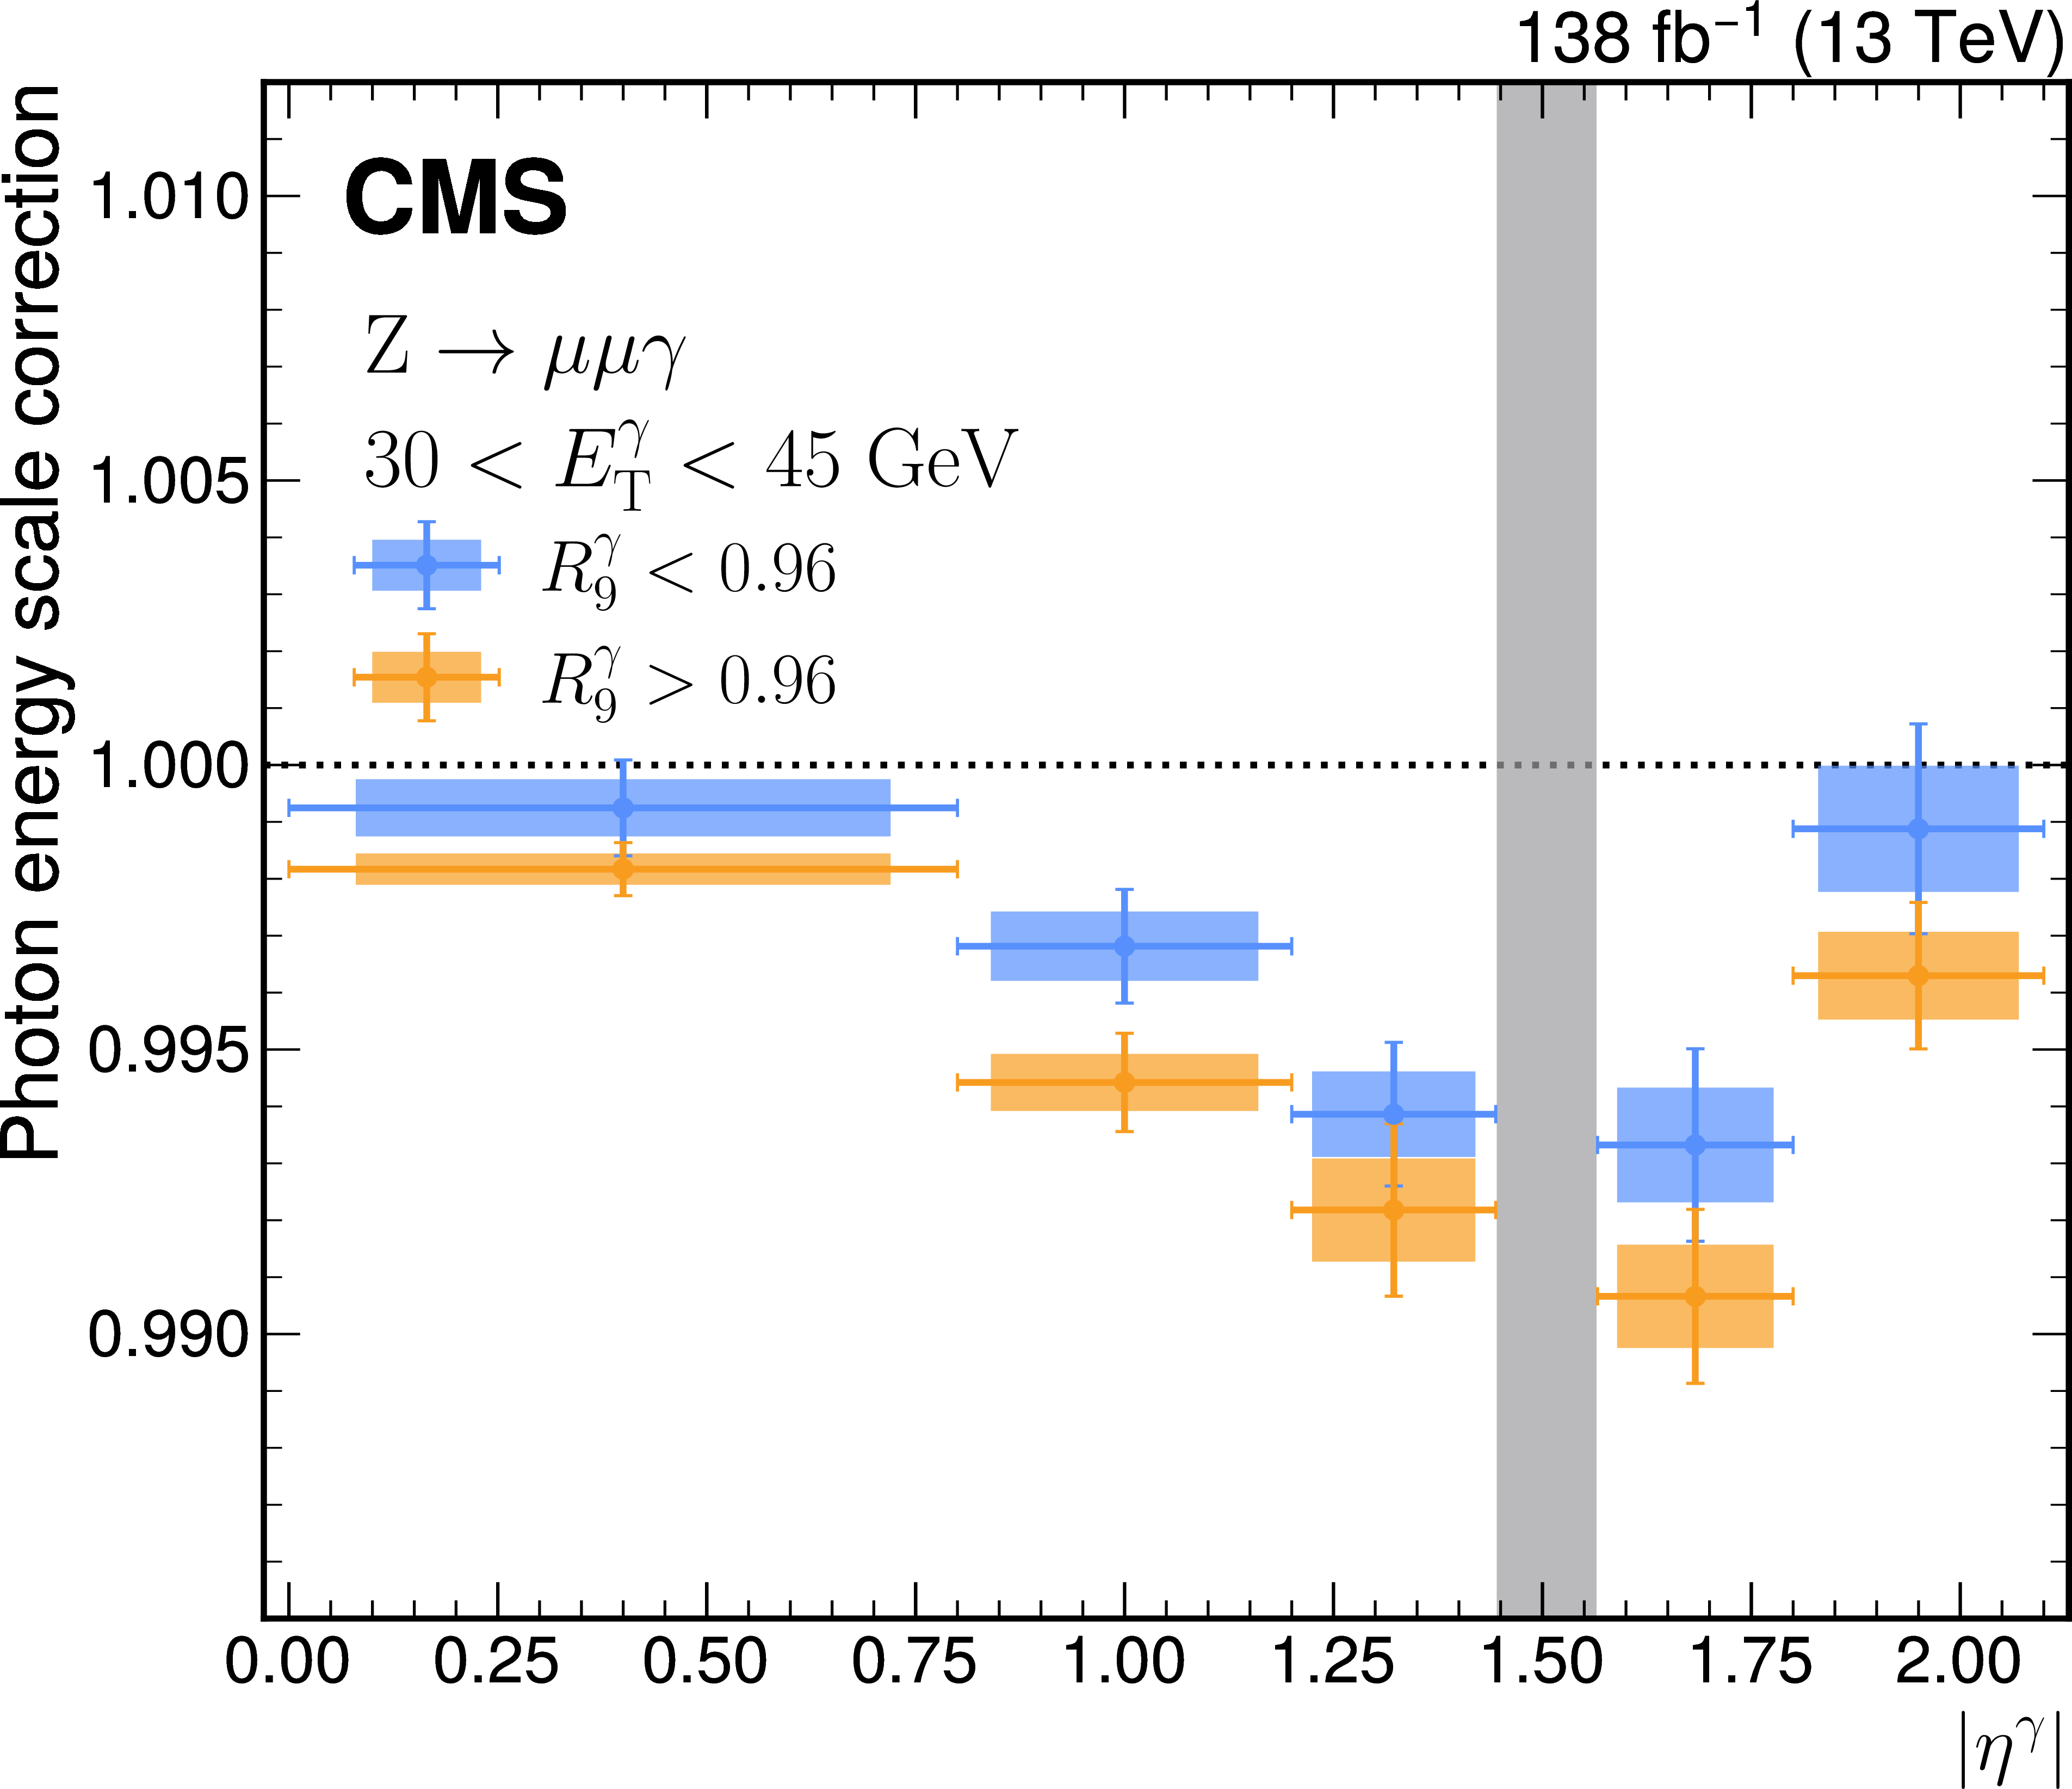
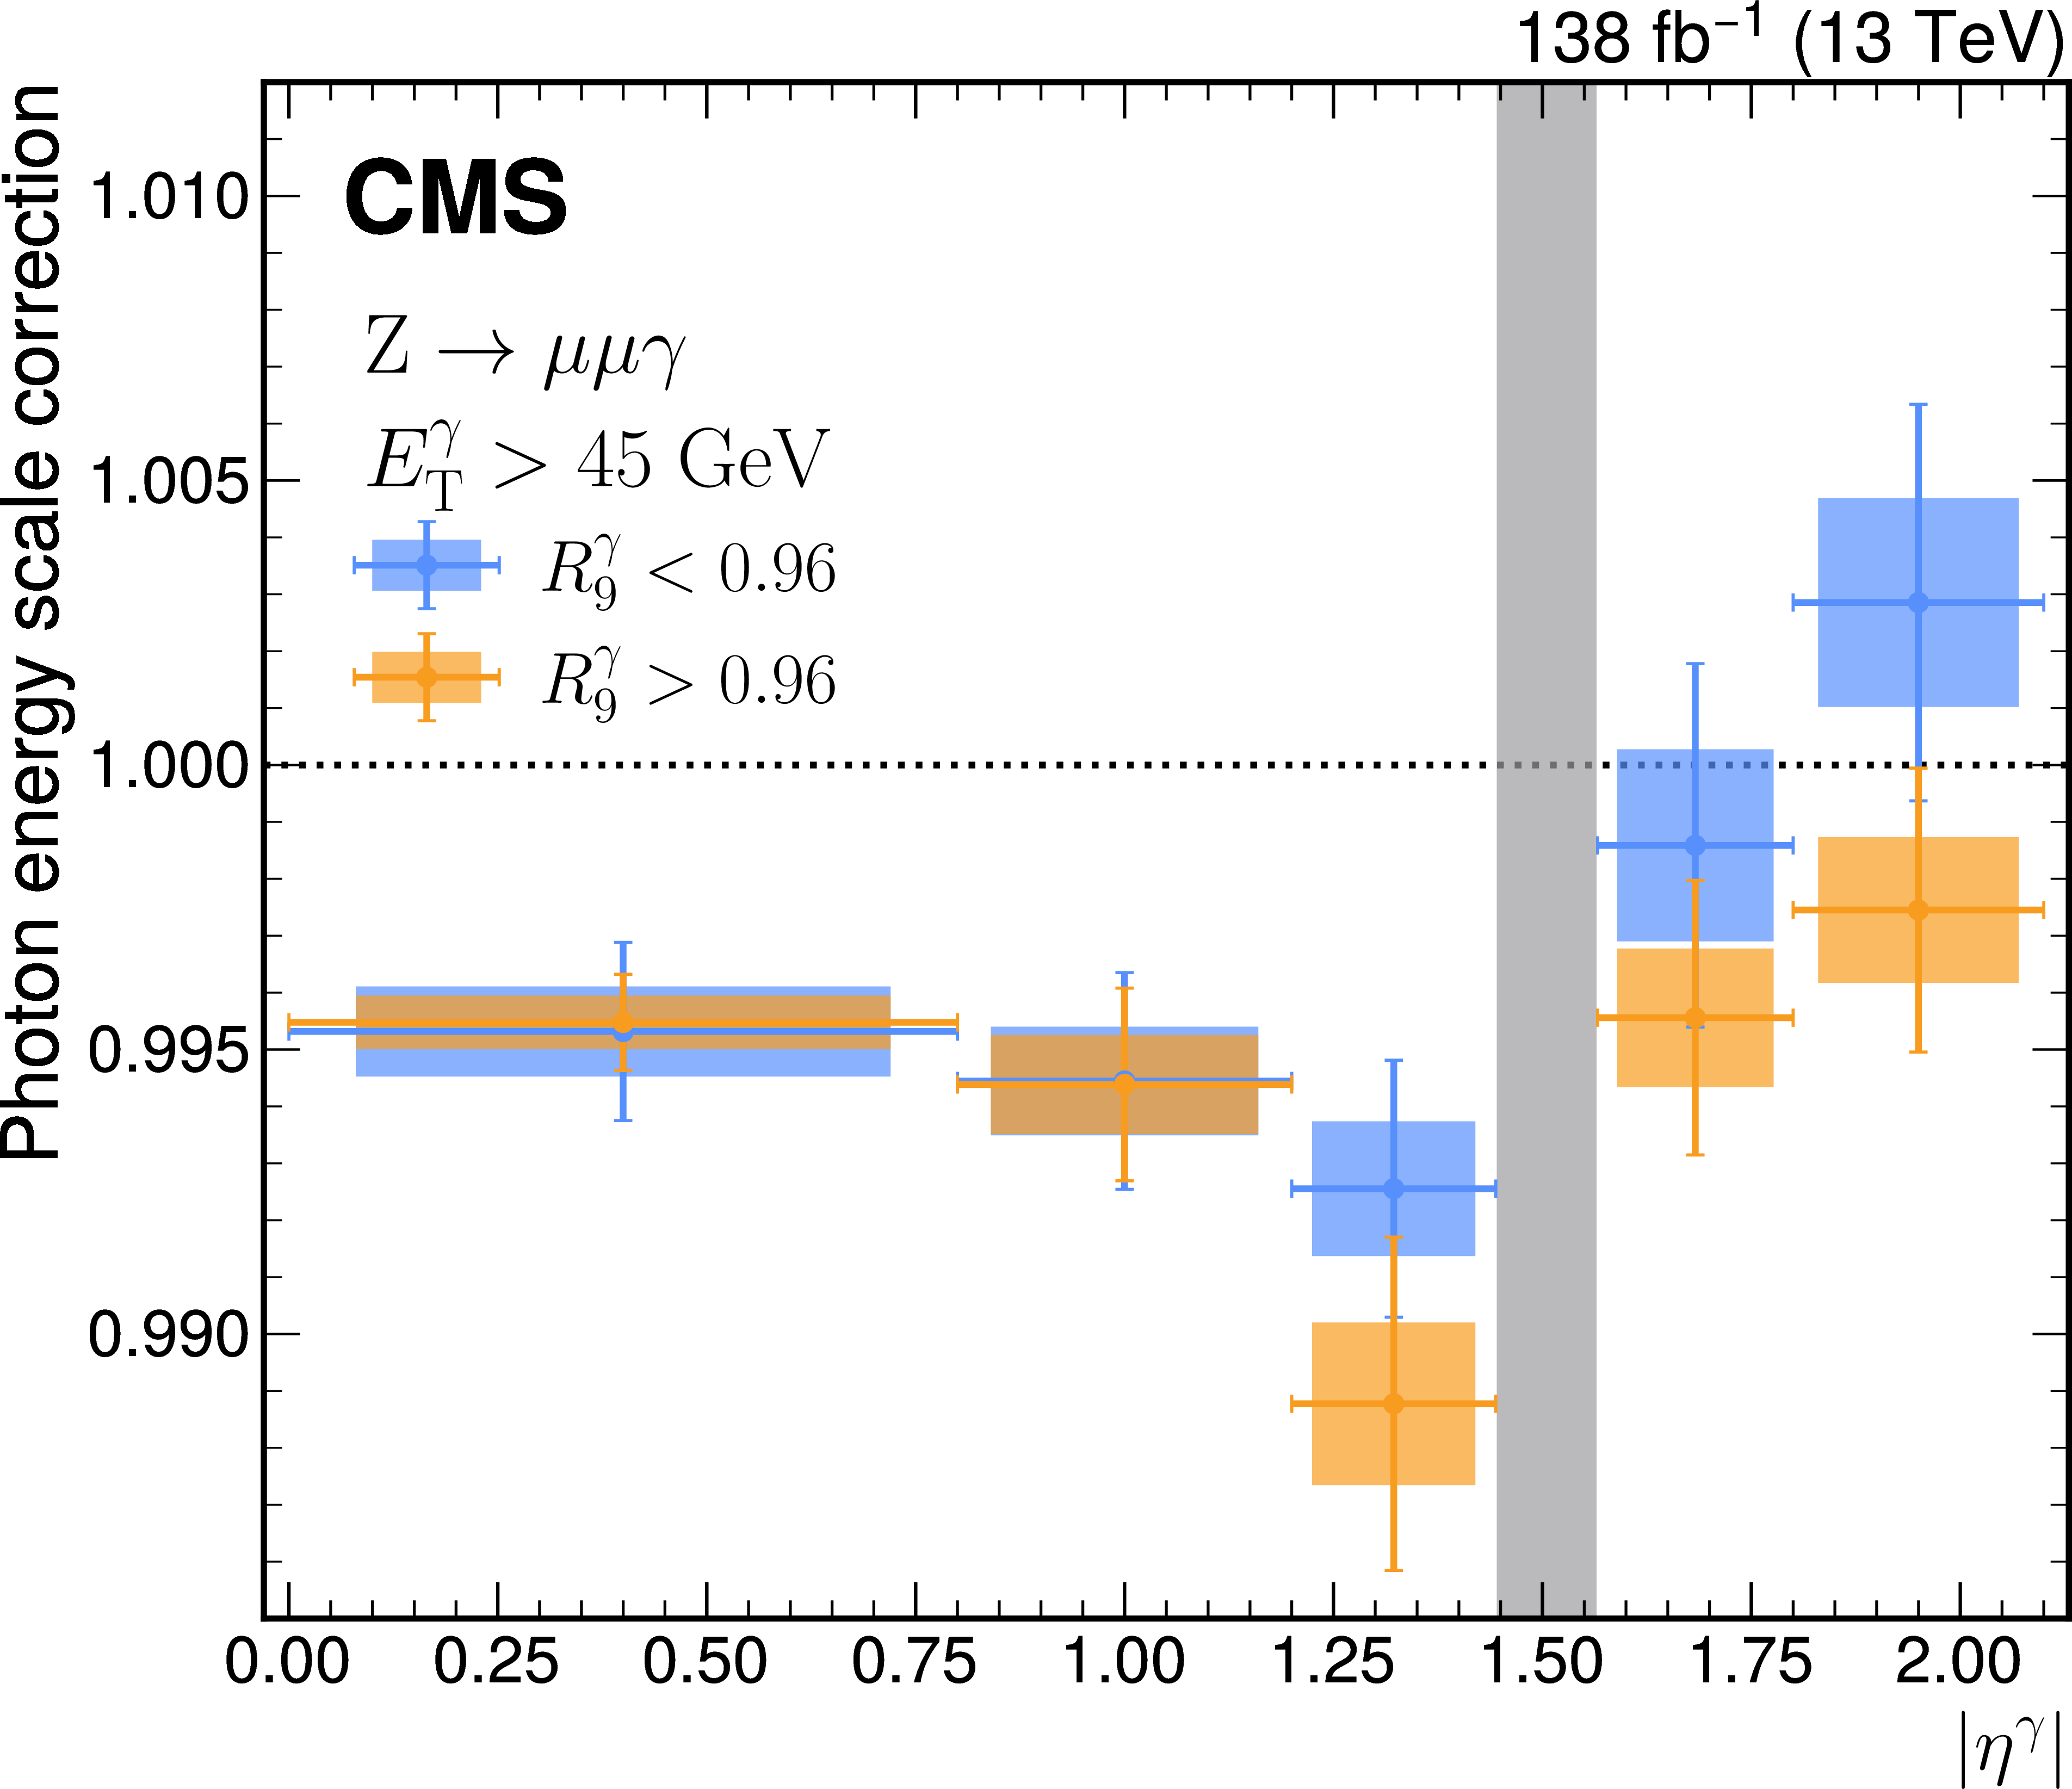
Photon energy scale corrections applied to the data as functions of $ |\eta^\gamma| $ shown separately for the two $ E^{\gamma}_{\mathrm{T}} $ bins and the two $ R^{\gamma}_{\mathrm{9}} $ bins, using $ \mathrm{Z}\to\mu\mu\gamma $ events, after applying the electron energy scale and uniformity corrections. The shaded bands indicate the statistical uncertainties from the simulation, while the error bars show the total statistical uncertainties obtained by summing in quadrature the uncertainties from the data and the simulation. The gray vertical band represents the ECAL barrel-endcap transition region, which is not used in the analysis. |
png pdf |
Figure 2-a:
Photon energy scale corrections applied to the data as functions of $ |\eta^\gamma| $ shown separately for the two $ E^{\gamma}_{\mathrm{T}} $ bins and the two $ R^{\gamma}_{\mathrm{9}} $ bins, using $ \mathrm{Z}\to\mu\mu\gamma $ events, after applying the electron energy scale and uniformity corrections. The shaded bands indicate the statistical uncertainties from the simulation, while the error bars show the total statistical uncertainties obtained by summing in quadrature the uncertainties from the data and the simulation. The gray vertical band represents the ECAL barrel-endcap transition region, which is not used in the analysis. |
png pdf |
Figure 2-b:
Photon energy scale corrections applied to the data as functions of $ |\eta^\gamma| $ shown separately for the two $ E^{\gamma}_{\mathrm{T}} $ bins and the two $ R^{\gamma}_{\mathrm{9}} $ bins, using $ \mathrm{Z}\to\mu\mu\gamma $ events, after applying the electron energy scale and uniformity corrections. The shaded bands indicate the statistical uncertainties from the simulation, while the error bars show the total statistical uncertainties obtained by summing in quadrature the uncertainties from the data and the simulation. The gray vertical band represents the ECAL barrel-endcap transition region, which is not used in the analysis. |
png pdf |
Figure 3:
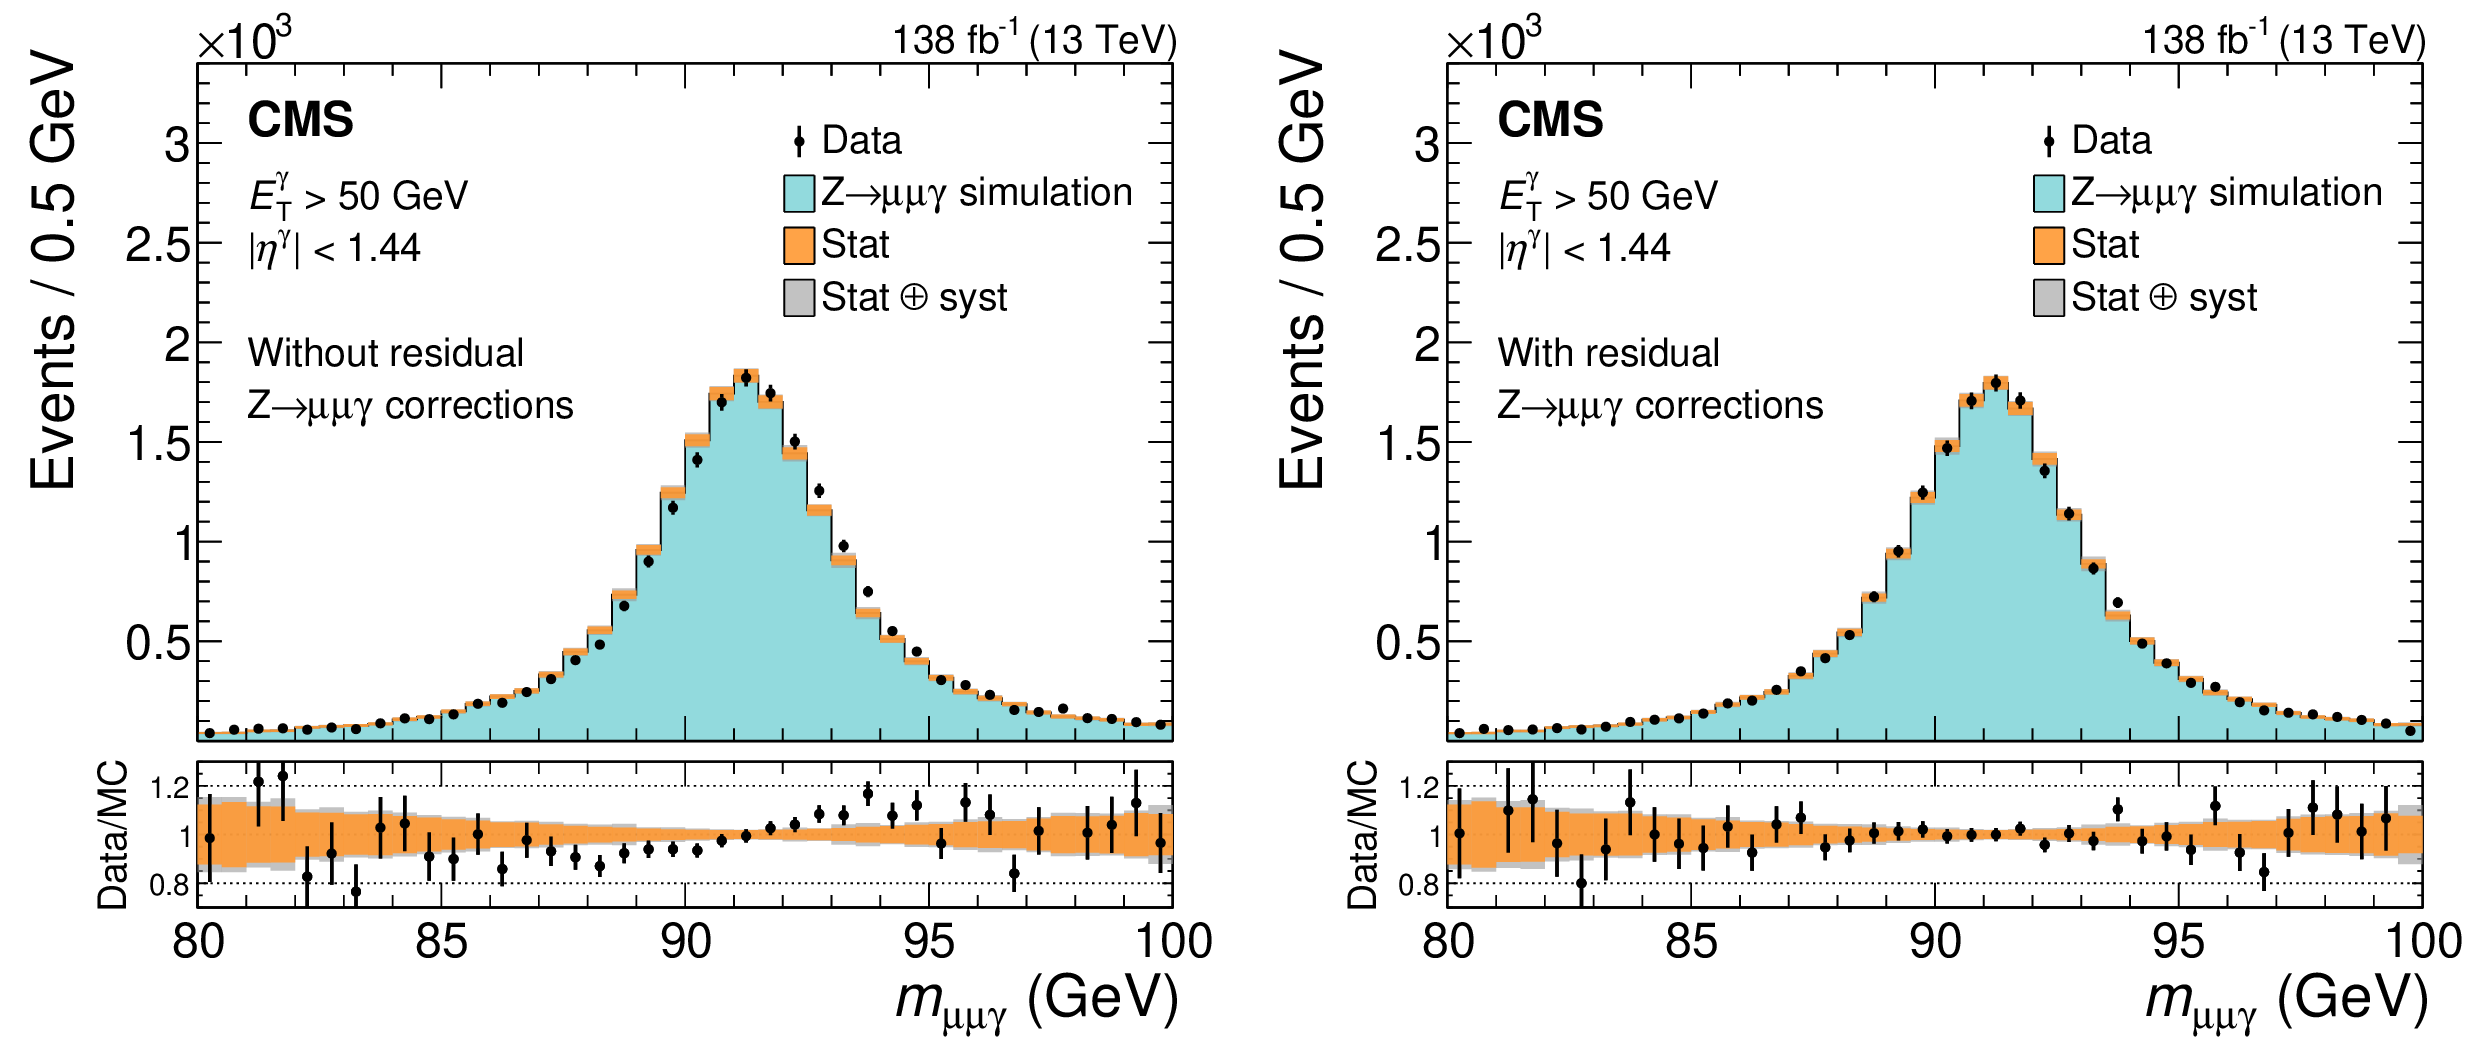
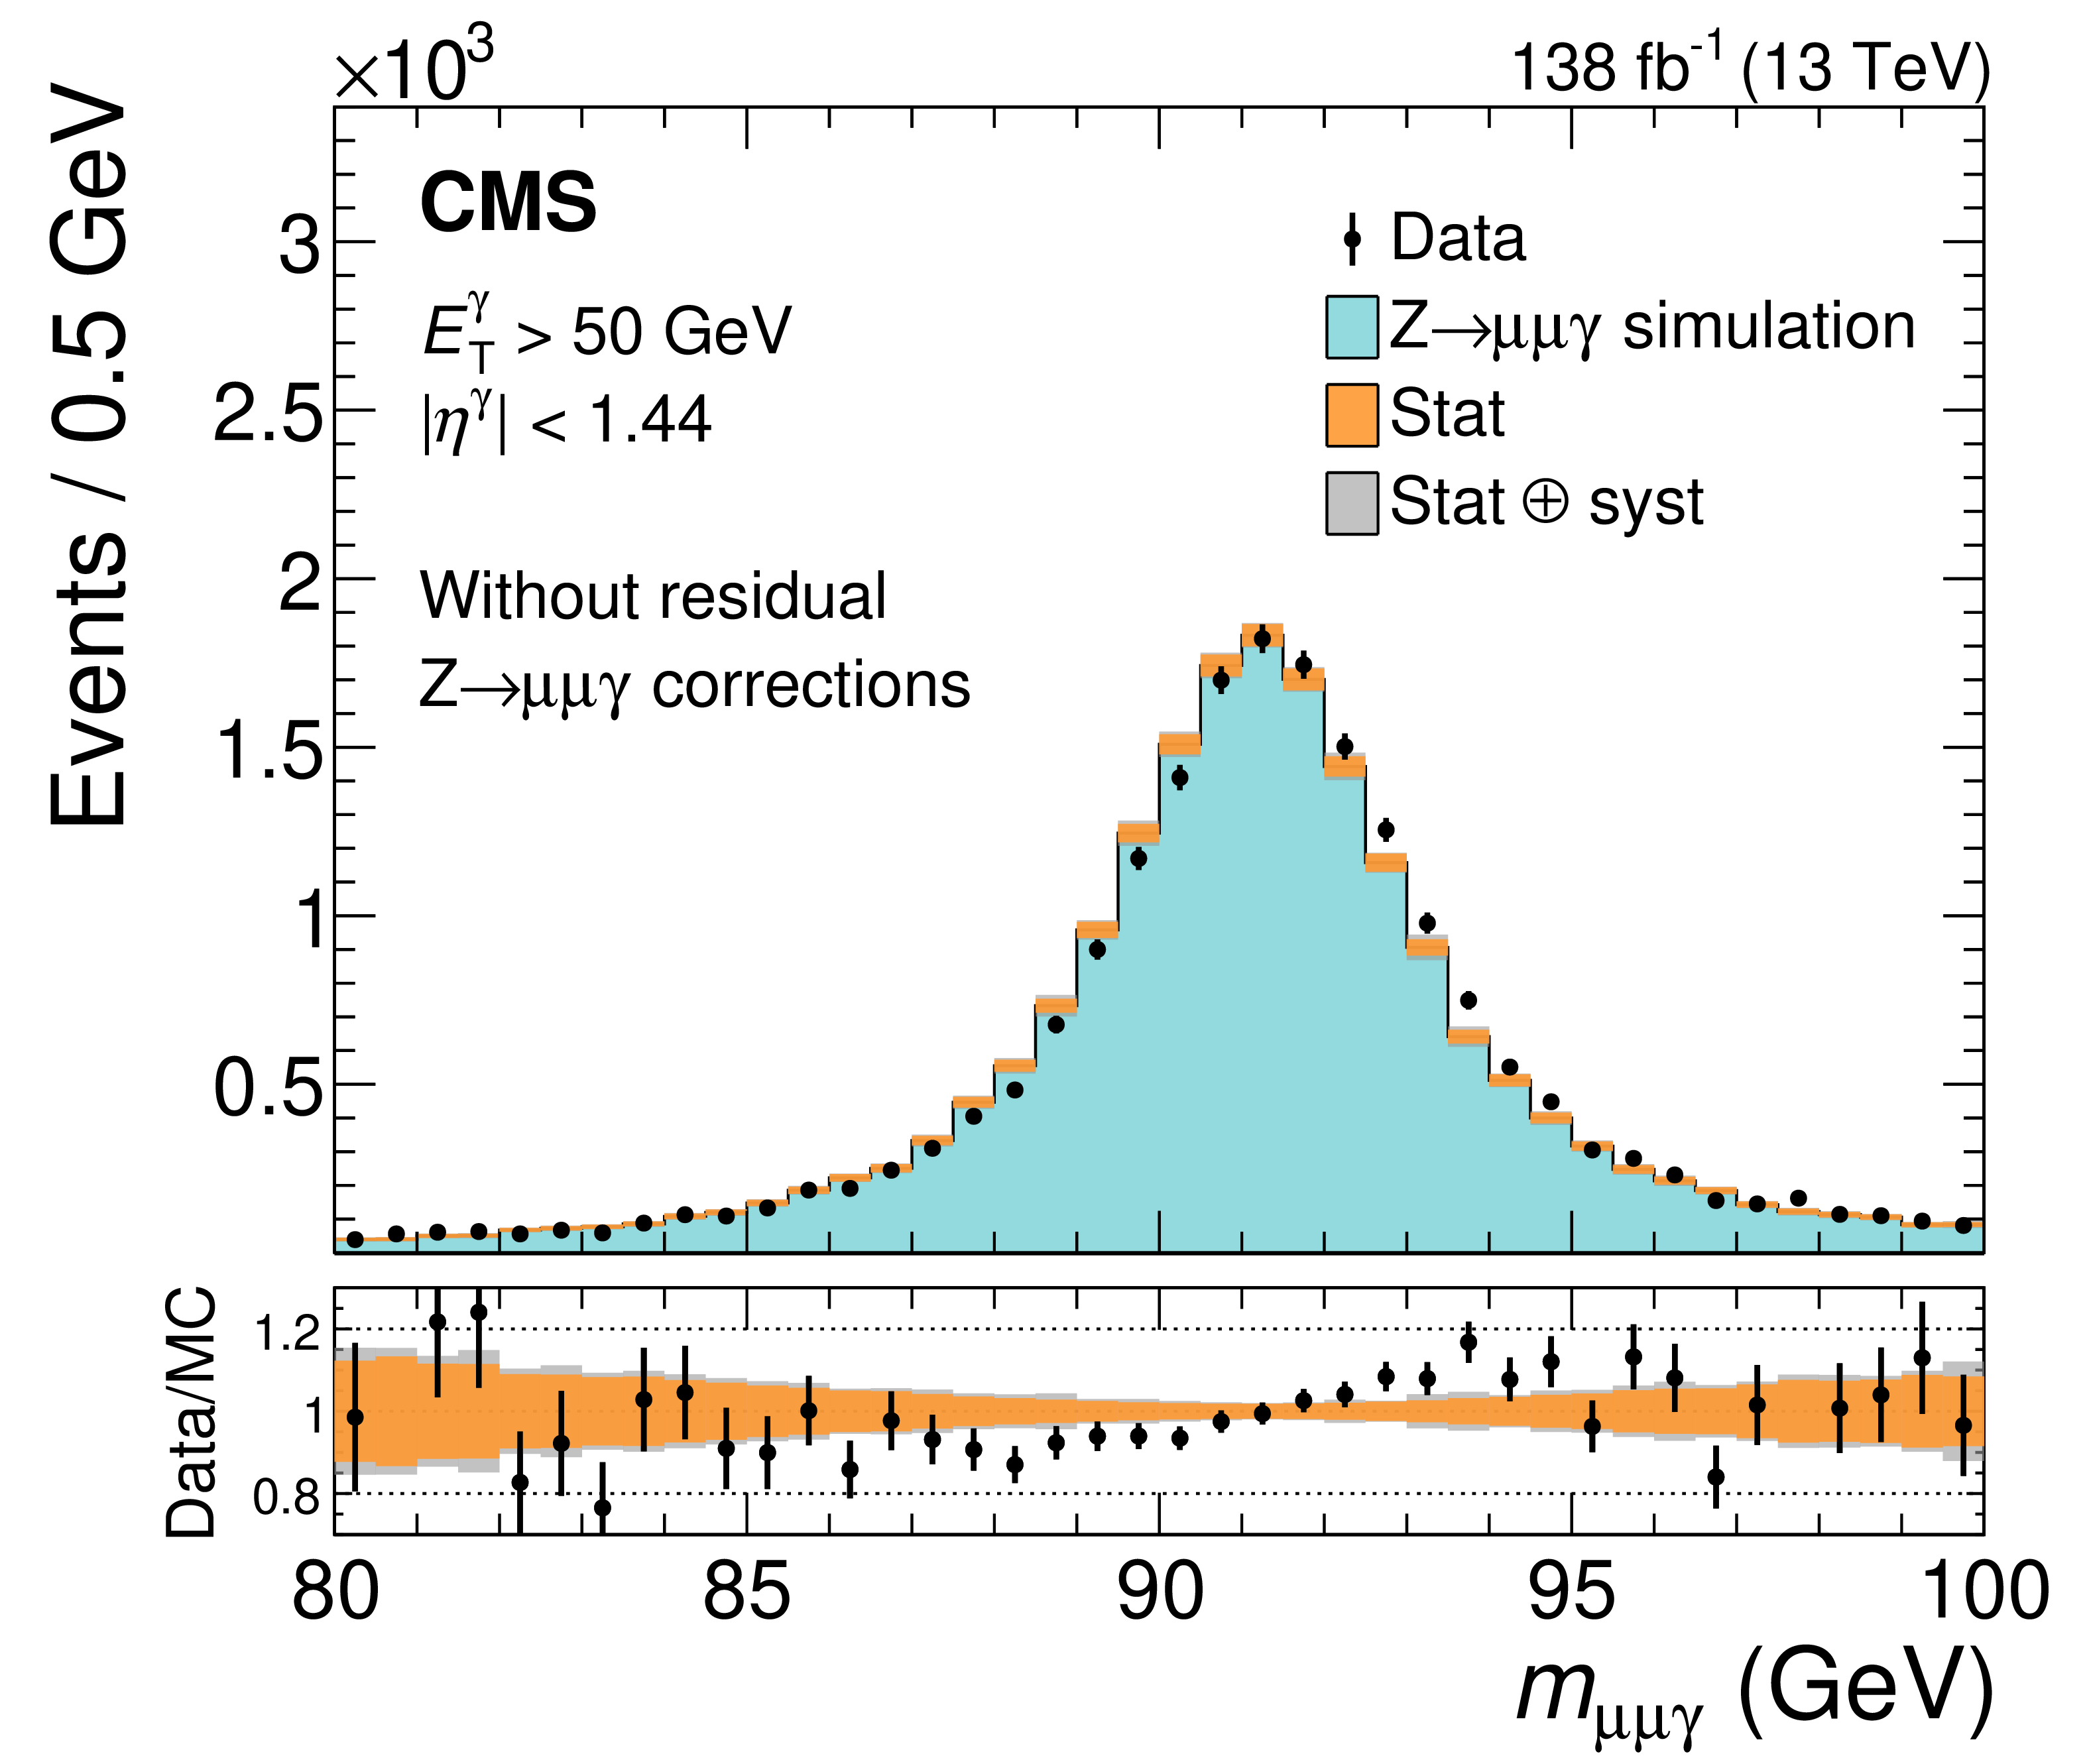
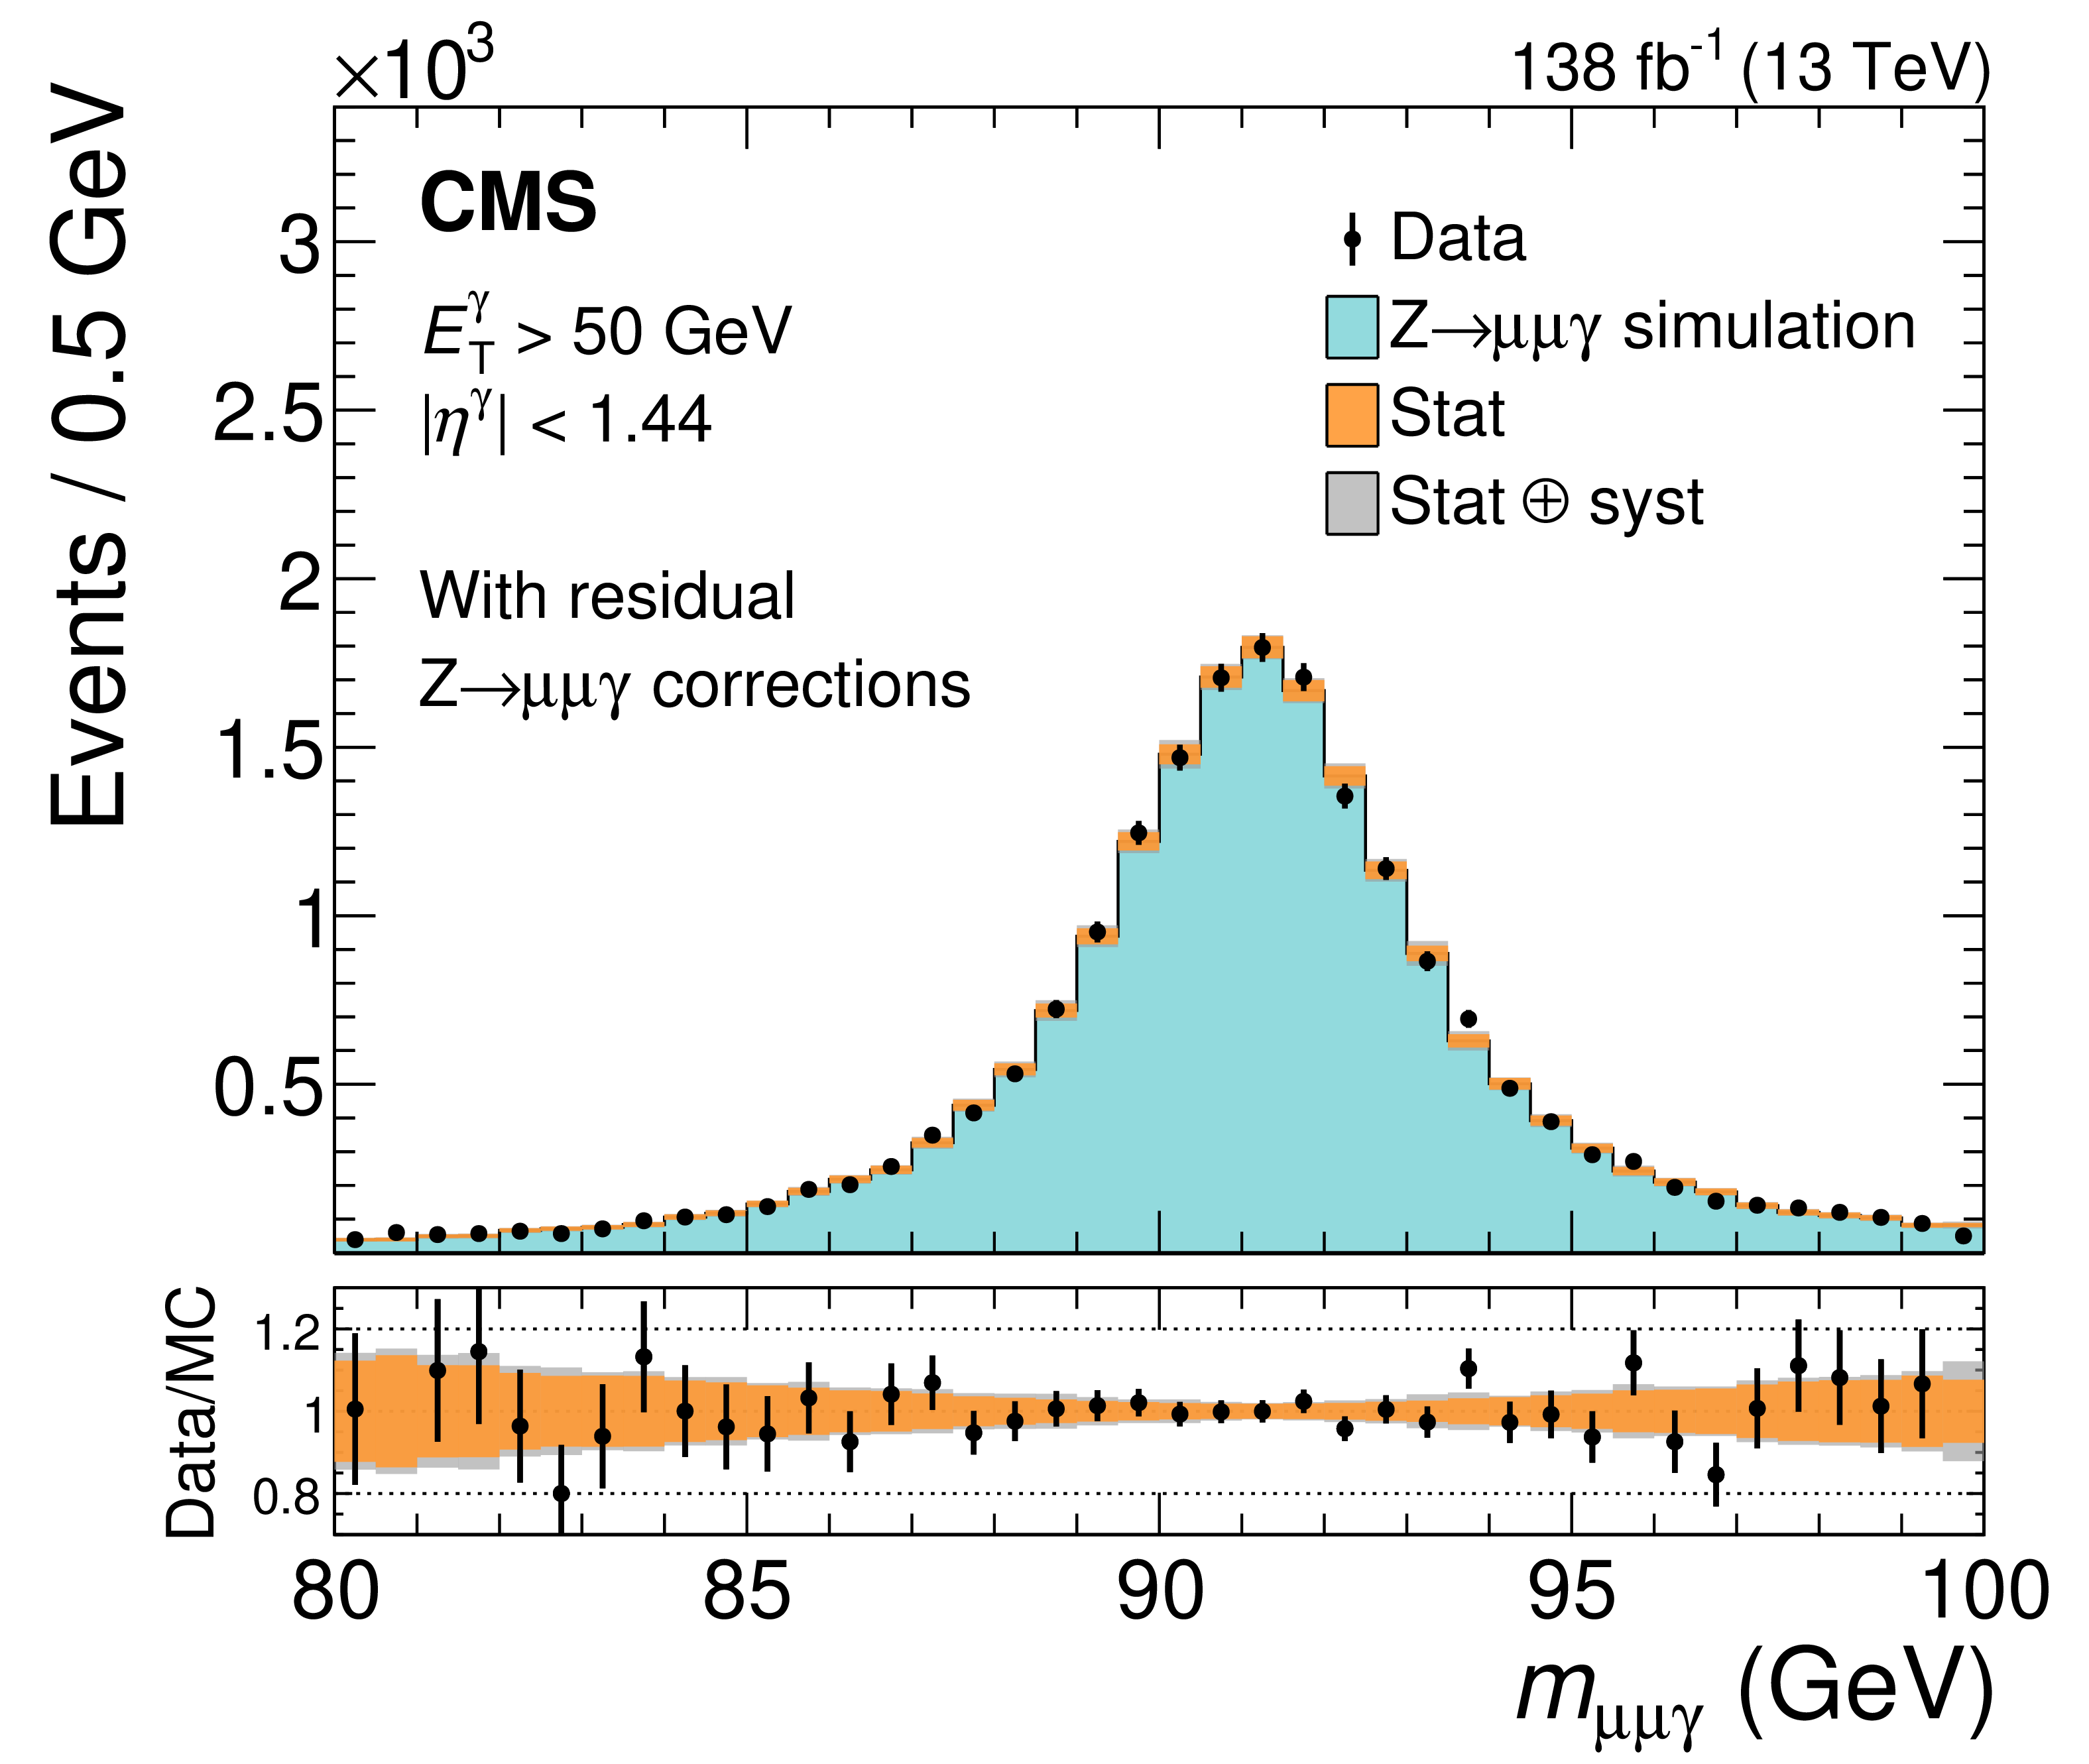
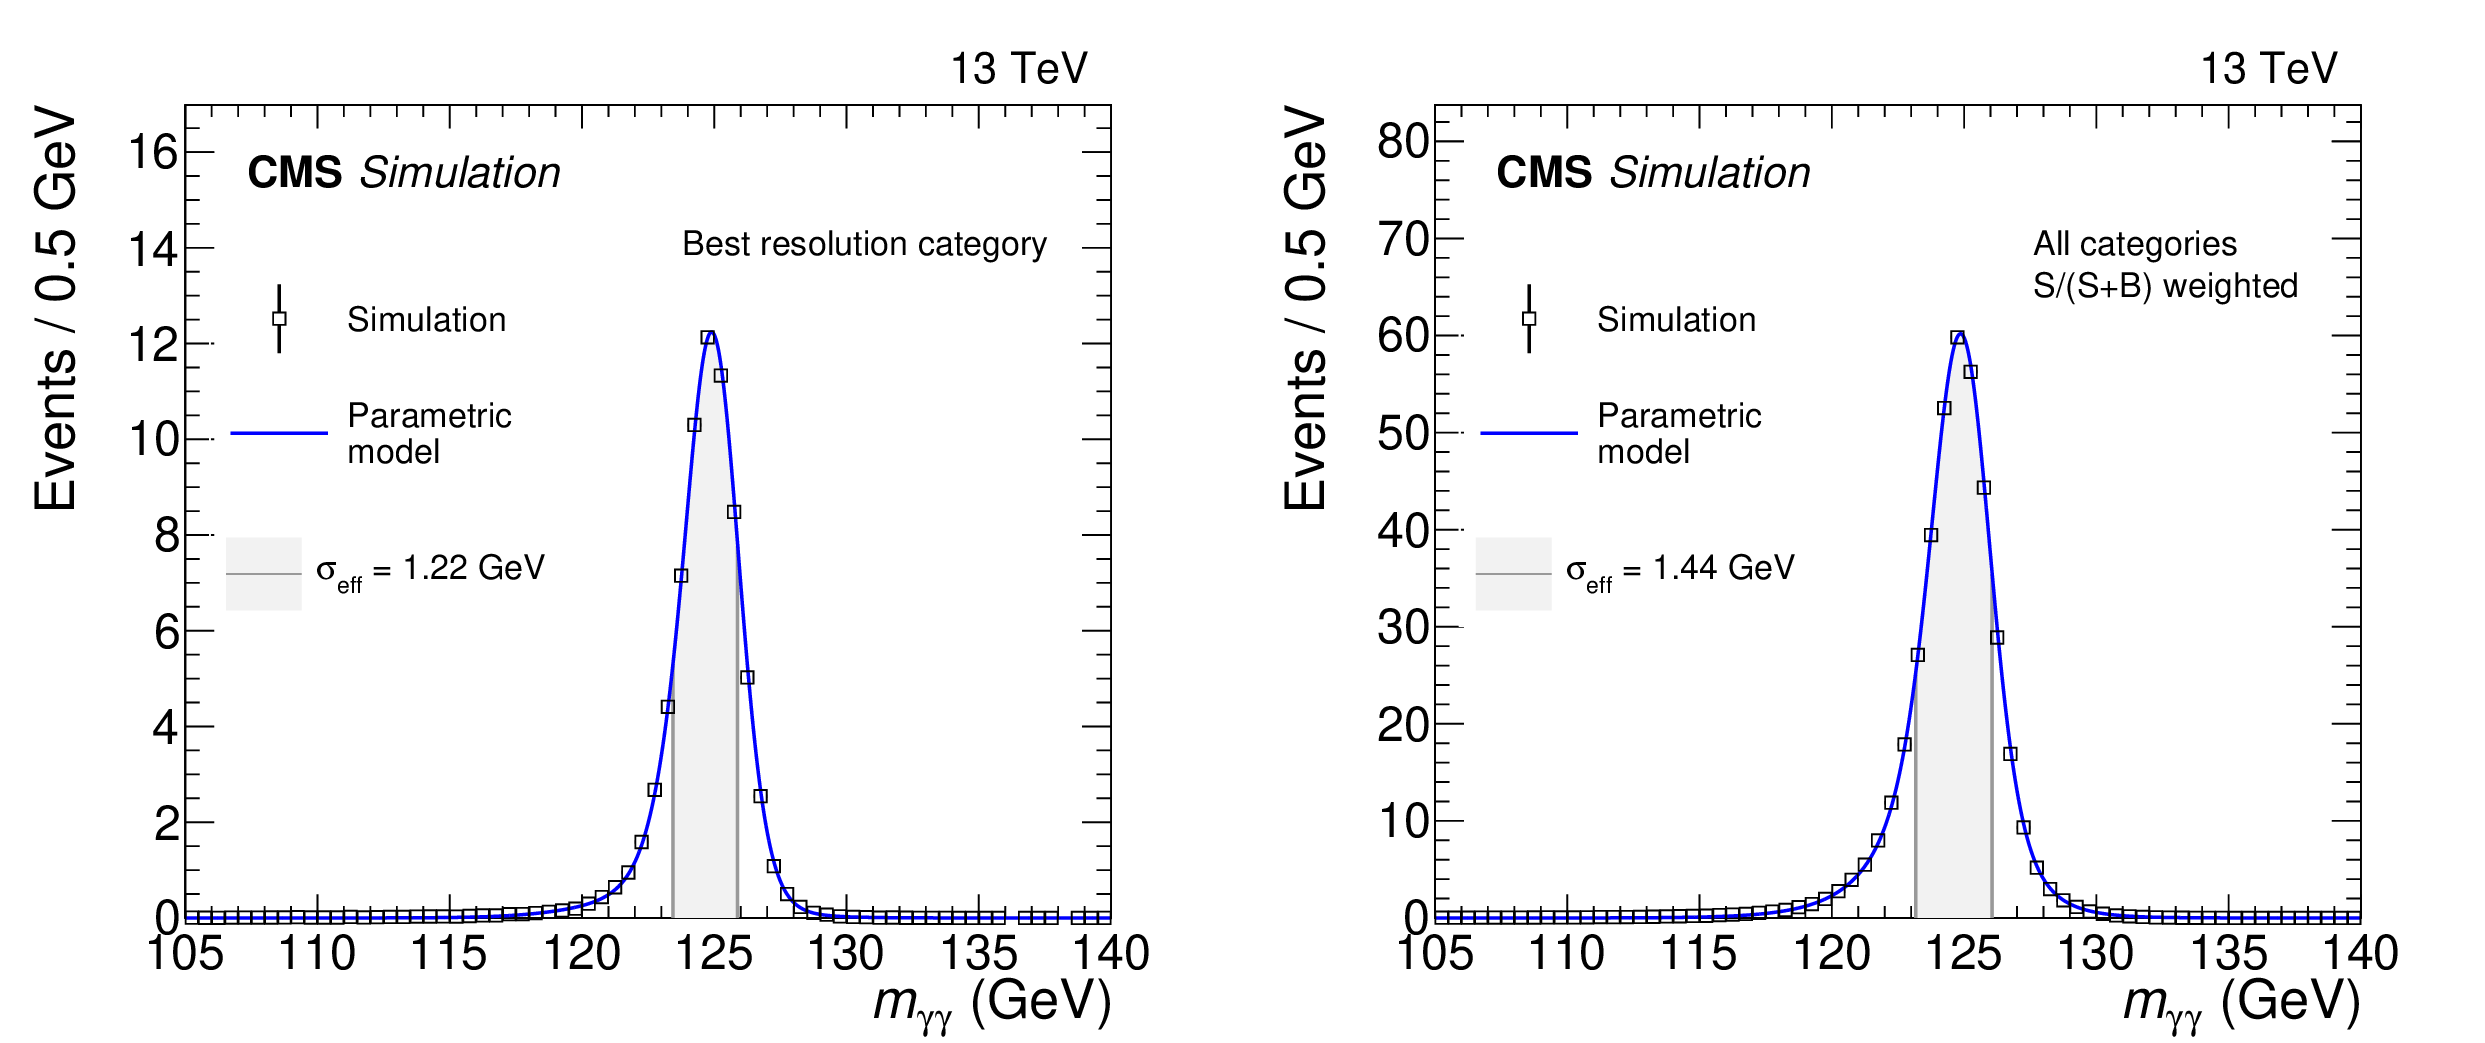
Comparison of the three-body invariant mass distribution in data and simulation for $ \mathrm{Z}\to\mu\mu\gamma $ events in the ECAL barrel region ($ |\eta^\gamma| < $ 1.44) with $ E^{\gamma}_{\mathrm{T}} > $ 50 GeV. The left panel shows the distribution after the first two calibration stages, without the final photon energy scale correction derived from FSR photons. The right panel shows the same distribution after applying the final photon energy scale corrections. The lower panels show the bin-by-bin ratio of the data to the simulation (MC). The error bands account for the statistical and systematic uncertainties associated with the energy scale corrections. |
png pdf |
Figure 3-a:
Comparison of the three-body invariant mass distribution in data and simulation for $ \mathrm{Z}\to\mu\mu\gamma $ events in the ECAL barrel region ($ |\eta^\gamma| < $ 1.44) with $ E^{\gamma}_{\mathrm{T}} > $ 50 GeV. The left panel shows the distribution after the first two calibration stages, without the final photon energy scale correction derived from FSR photons. The right panel shows the same distribution after applying the final photon energy scale corrections. The lower panels show the bin-by-bin ratio of the data to the simulation (MC). The error bands account for the statistical and systematic uncertainties associated with the energy scale corrections. |
png pdf |
Figure 3-b:
Comparison of the three-body invariant mass distribution in data and simulation for $ \mathrm{Z}\to\mu\mu\gamma $ events in the ECAL barrel region ($ |\eta^\gamma| < $ 1.44) with $ E^{\gamma}_{\mathrm{T}} > $ 50 GeV. The left panel shows the distribution after the first two calibration stages, without the final photon energy scale correction derived from FSR photons. The right panel shows the same distribution after applying the final photon energy scale corrections. The lower panels show the bin-by-bin ratio of the data to the simulation (MC). The error bands account for the statistical and systematic uncertainties associated with the energy scale corrections. |
png pdf |
Figure 4:
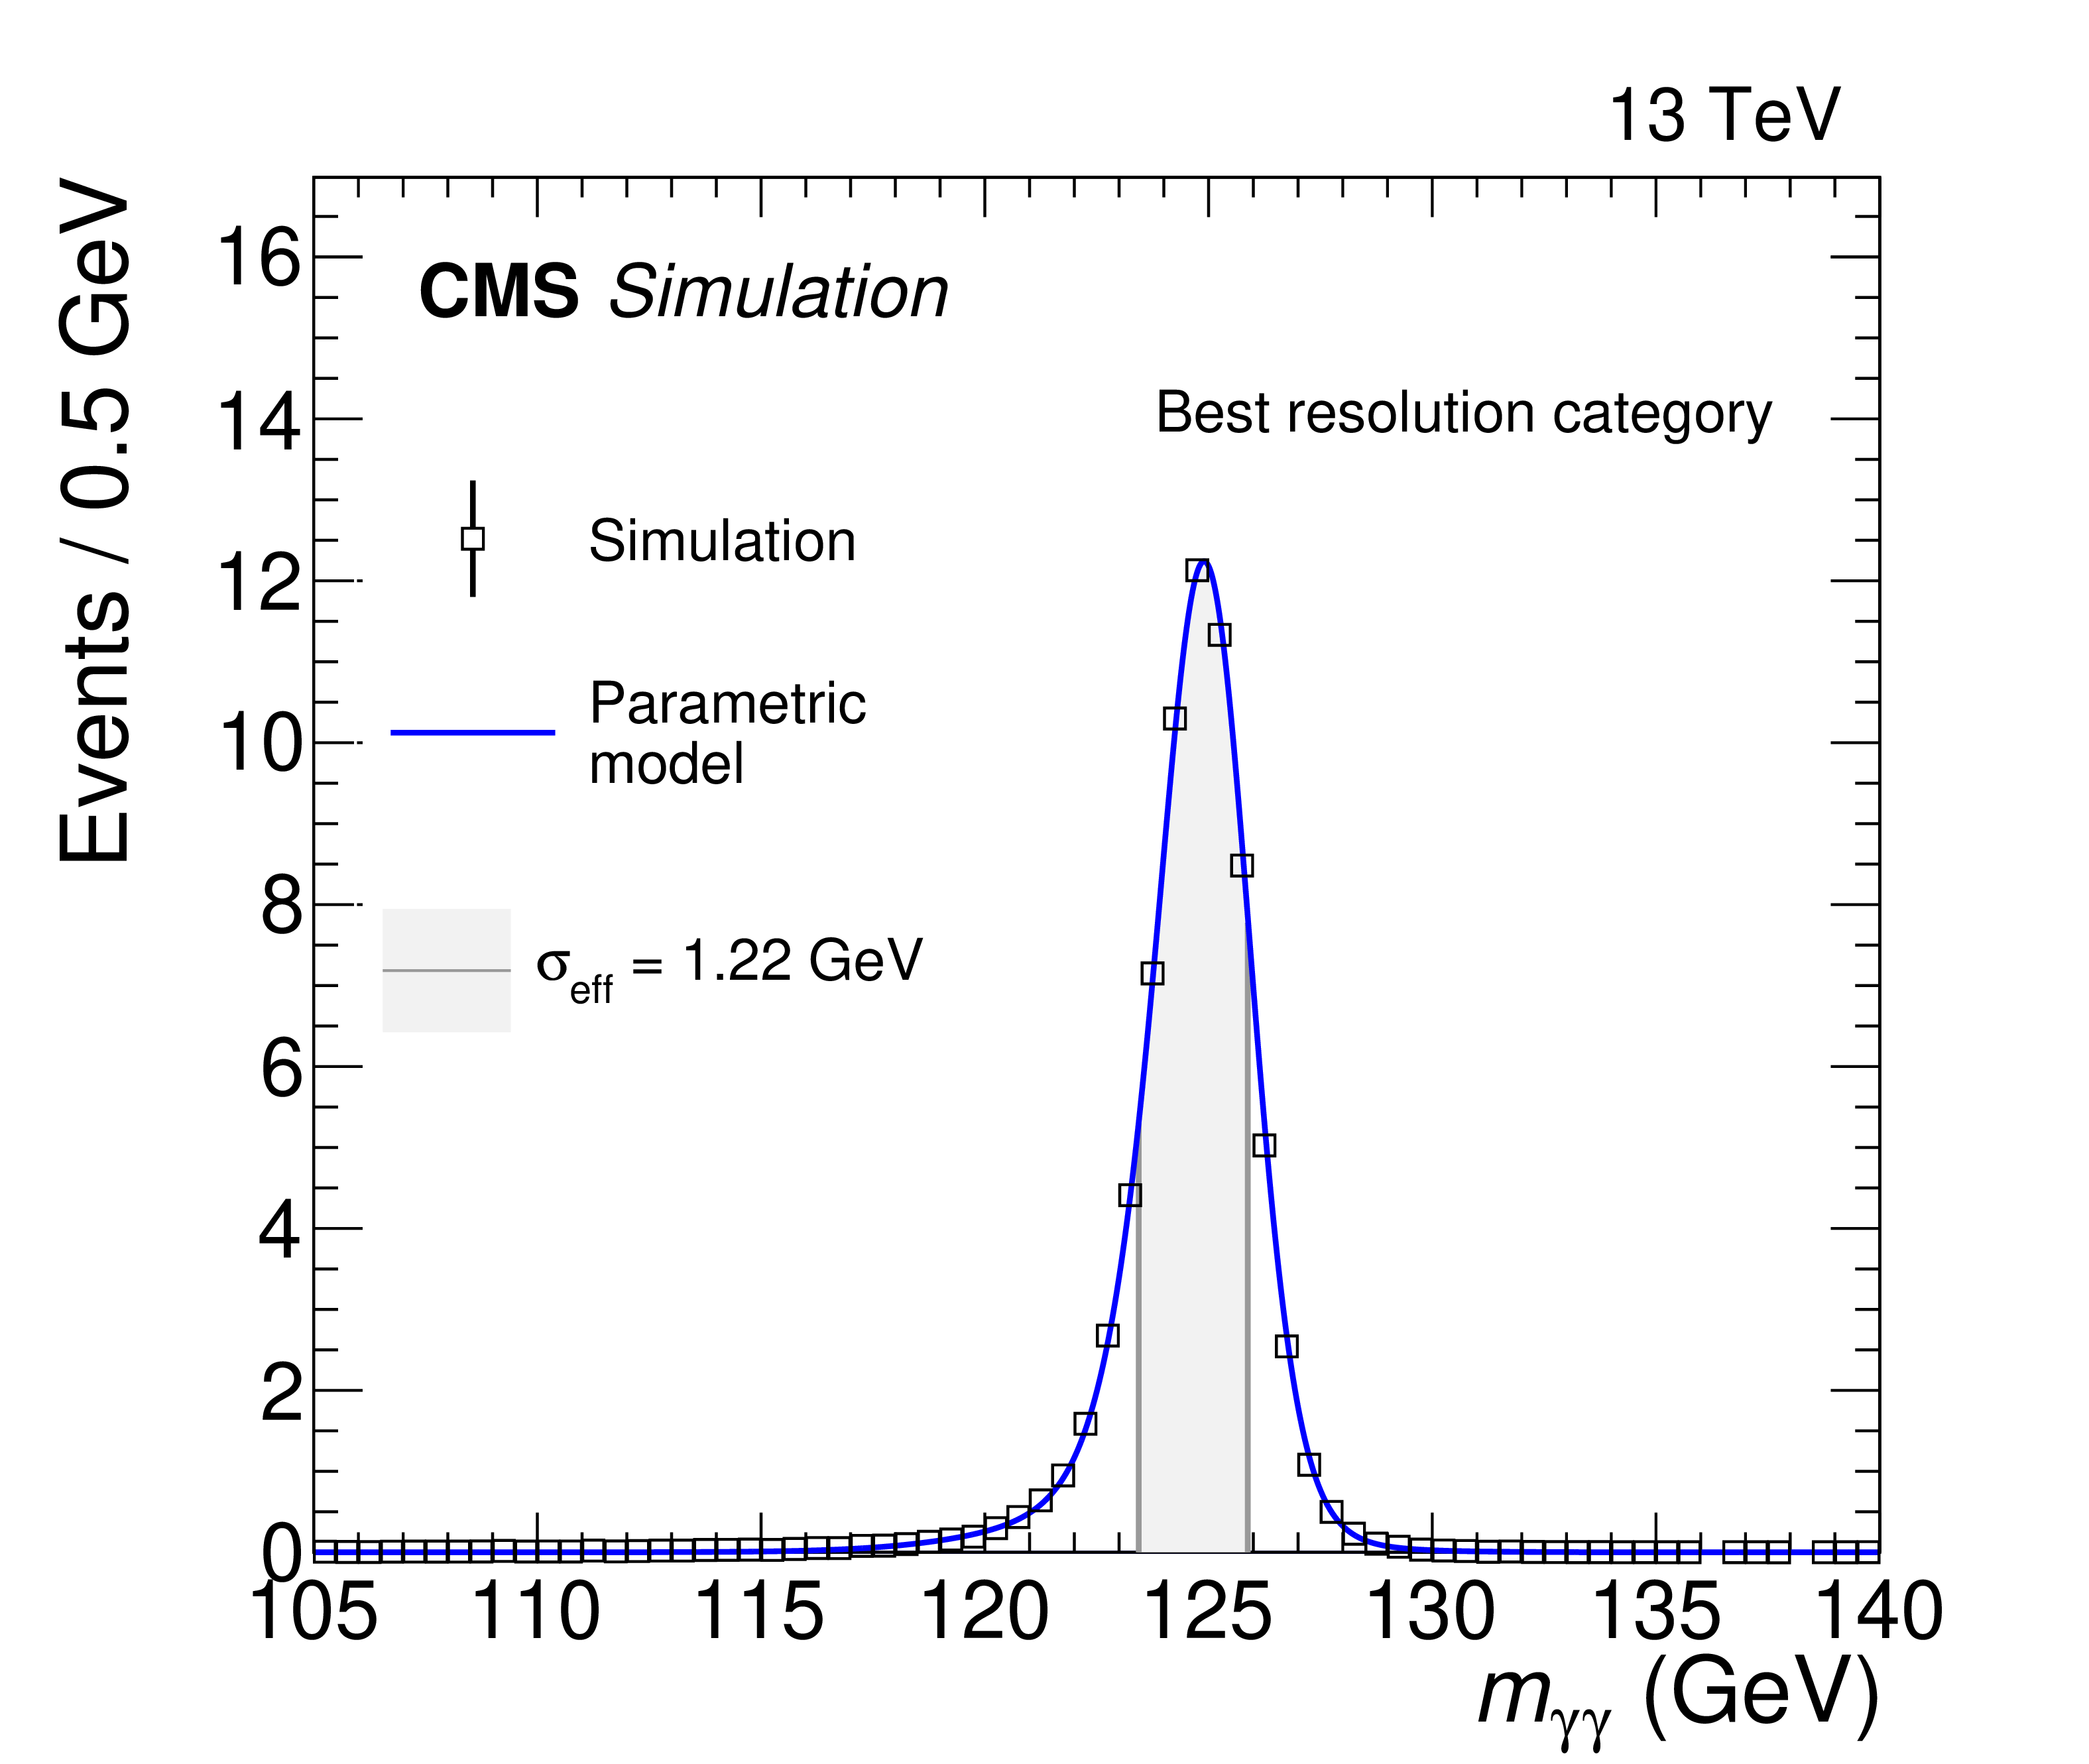
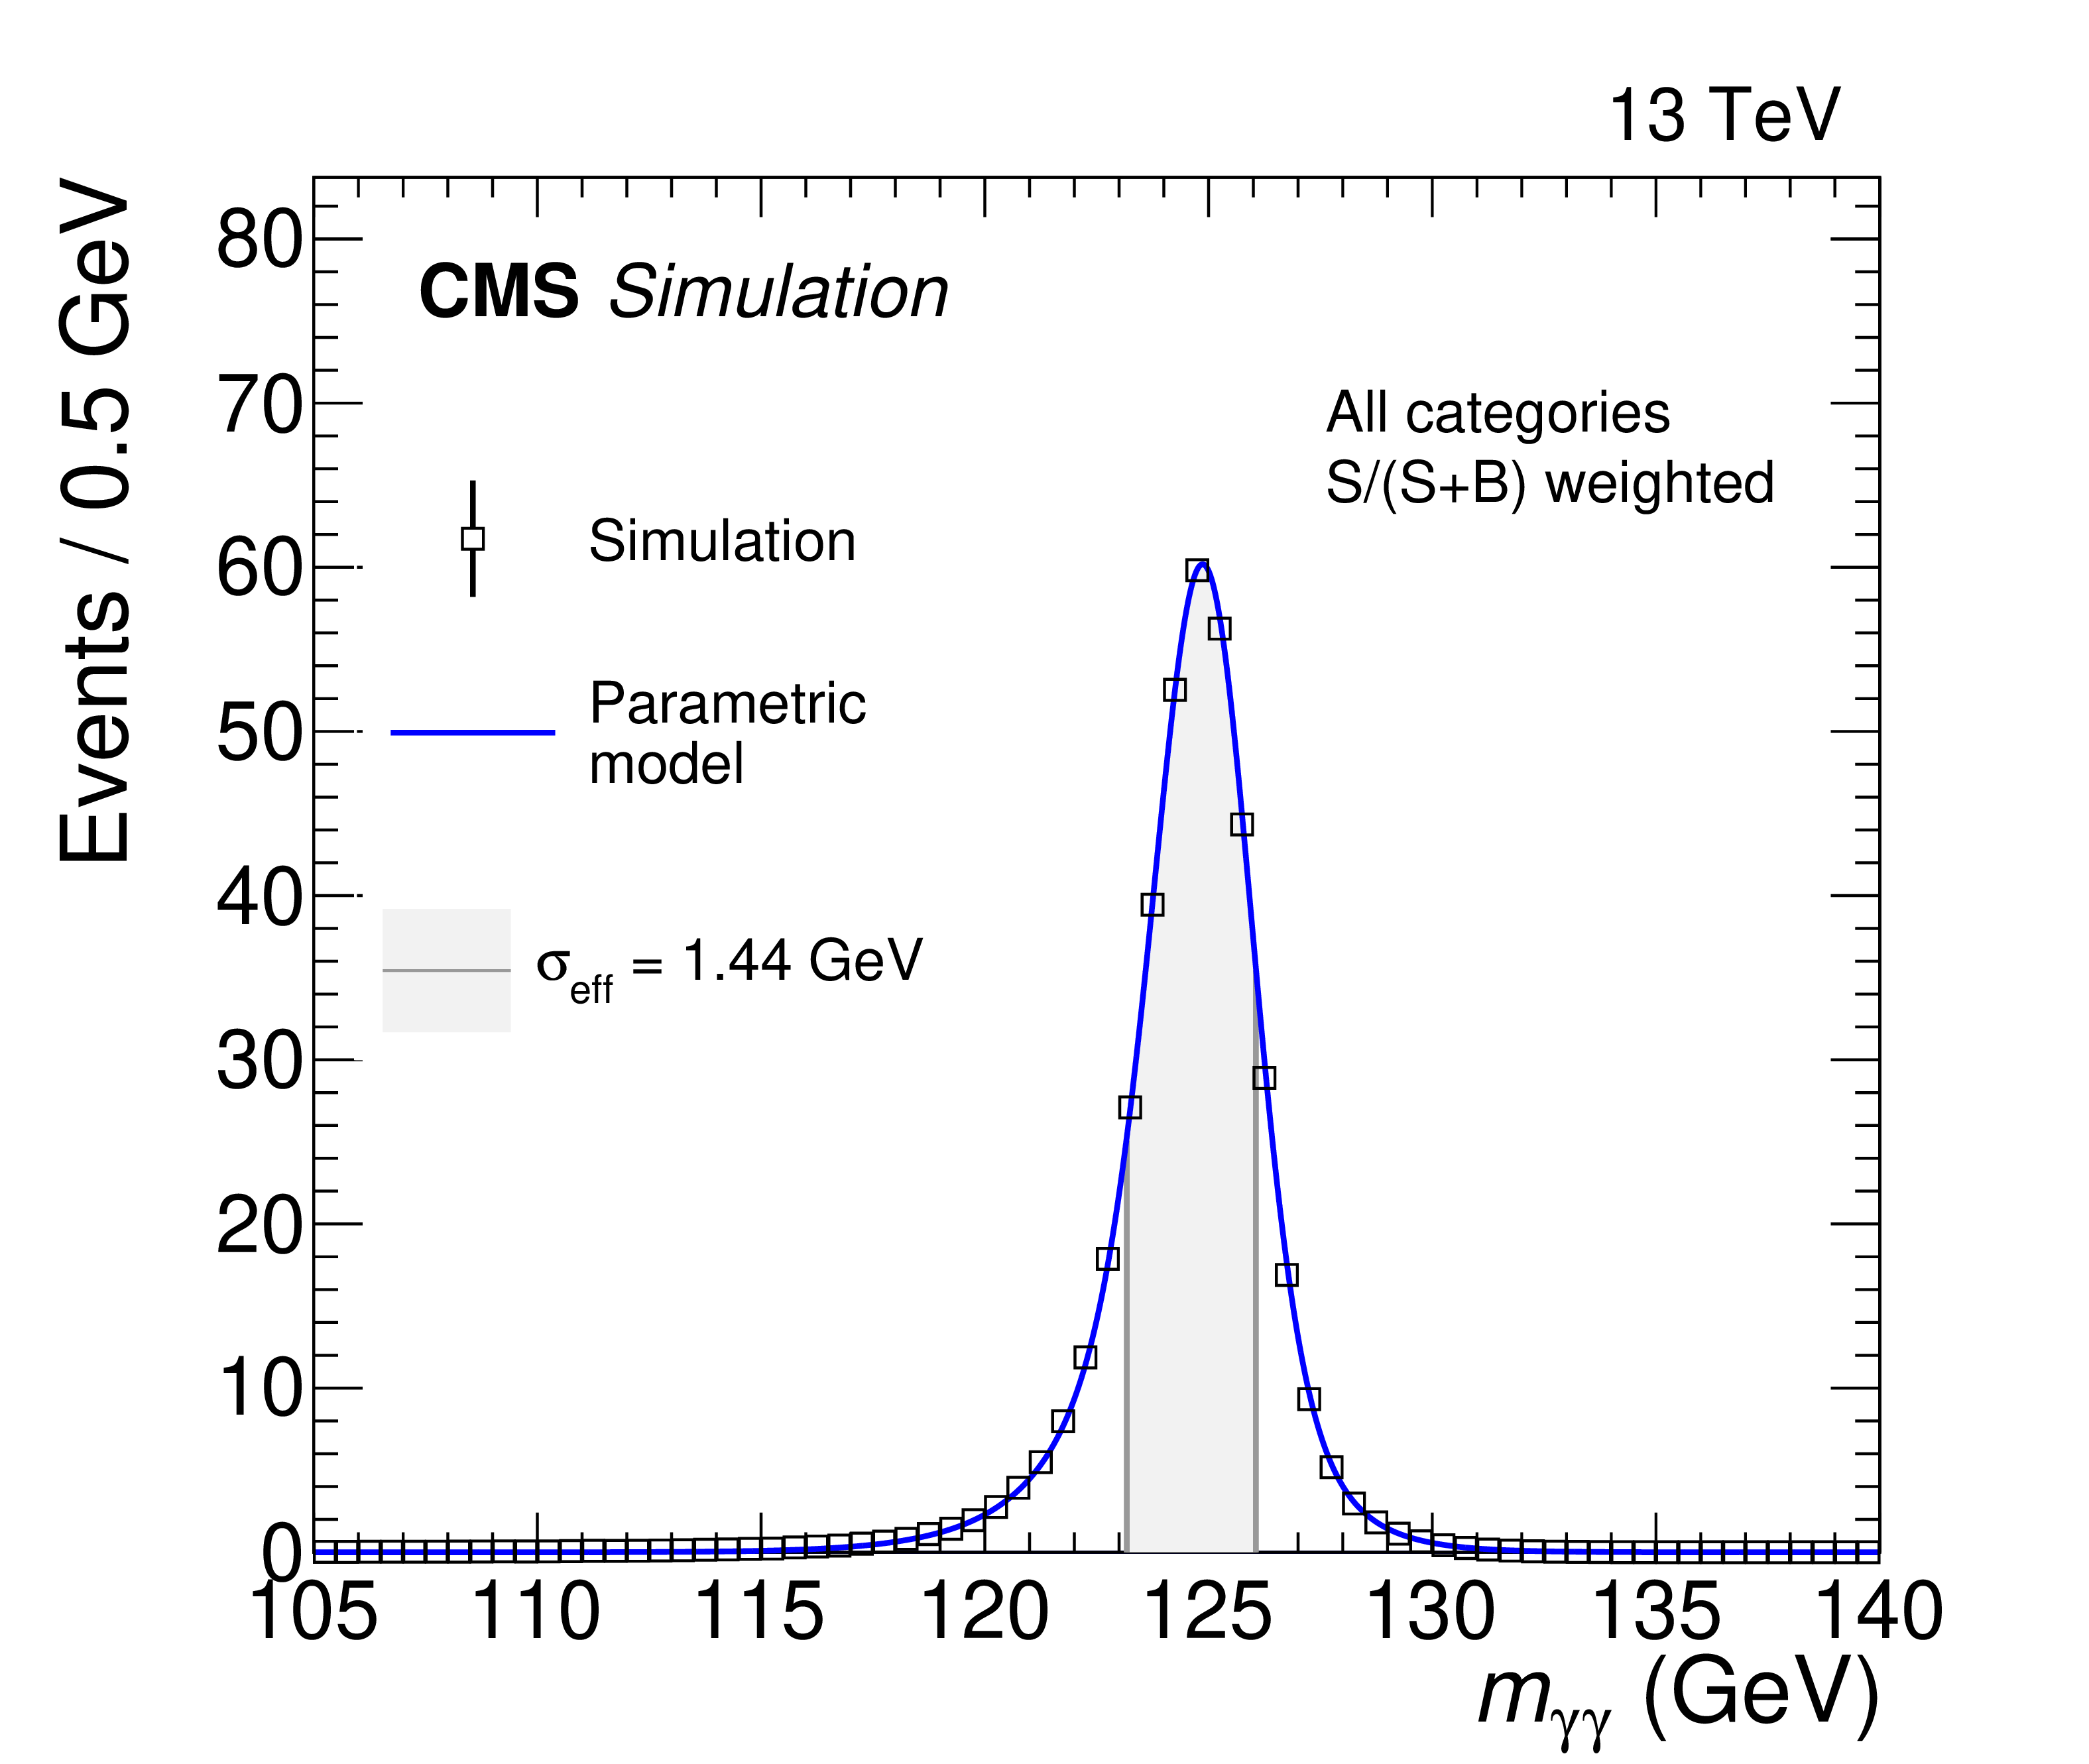
Signal model for the analysis category with the best mass resolution (left), and for all categories combined after scaling by their corresponding $ \textrm{S/(S+B)} $ ratios (right), for a simulated $ \mathrm{H}\to\gamma\gamma $ signal sample with $ m_{\mathrm{H}} = $ 125 GeV. All Higgs boson production modes are summed. |
png pdf |
Figure 4-a:
Signal model for the analysis category with the best mass resolution (left), and for all categories combined after scaling by their corresponding $ \textrm{S/(S+B)} $ ratios (right), for a simulated $ \mathrm{H}\to\gamma\gamma $ signal sample with $ m_{\mathrm{H}} = $ 125 GeV. All Higgs boson production modes are summed. |
png pdf |
Figure 4-b:
Signal model for the analysis category with the best mass resolution (left), and for all categories combined after scaling by their corresponding $ \textrm{S/(S+B)} $ ratios (right), for a simulated $ \mathrm{H}\to\gamma\gamma $ signal sample with $ m_{\mathrm{H}} = $ 125 GeV. All Higgs boson production modes are summed. |
png pdf |
Figure 5:
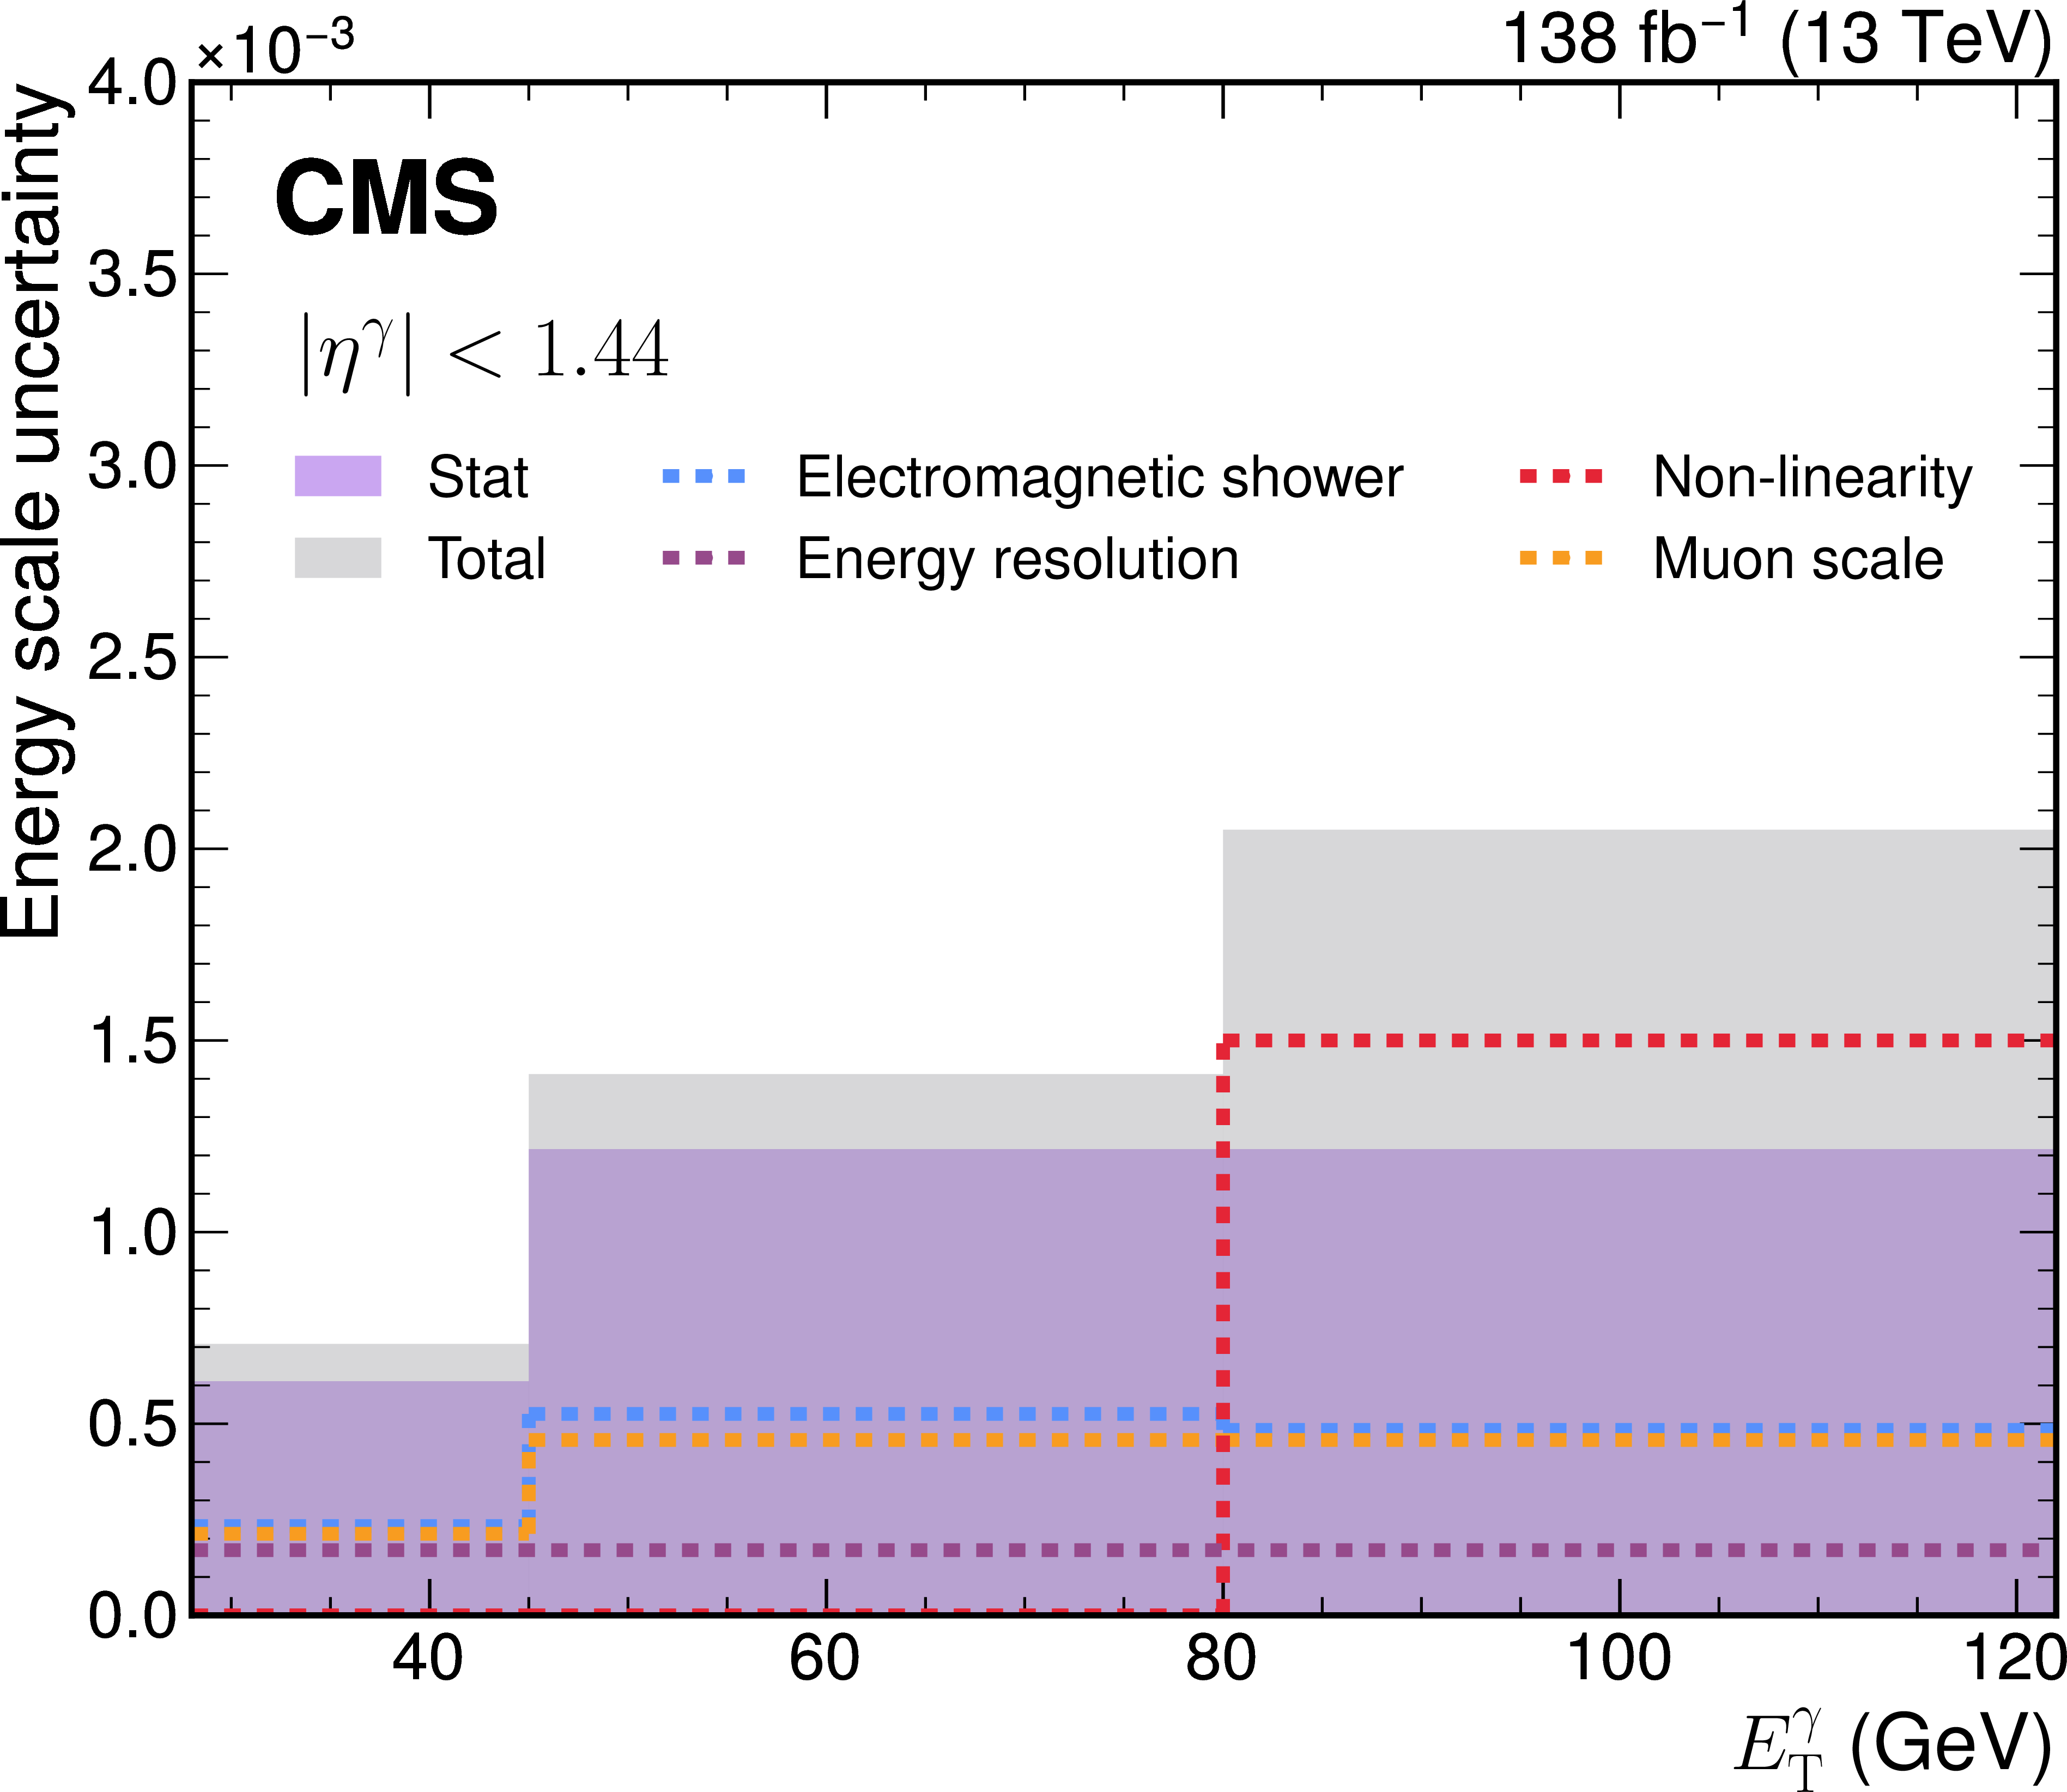
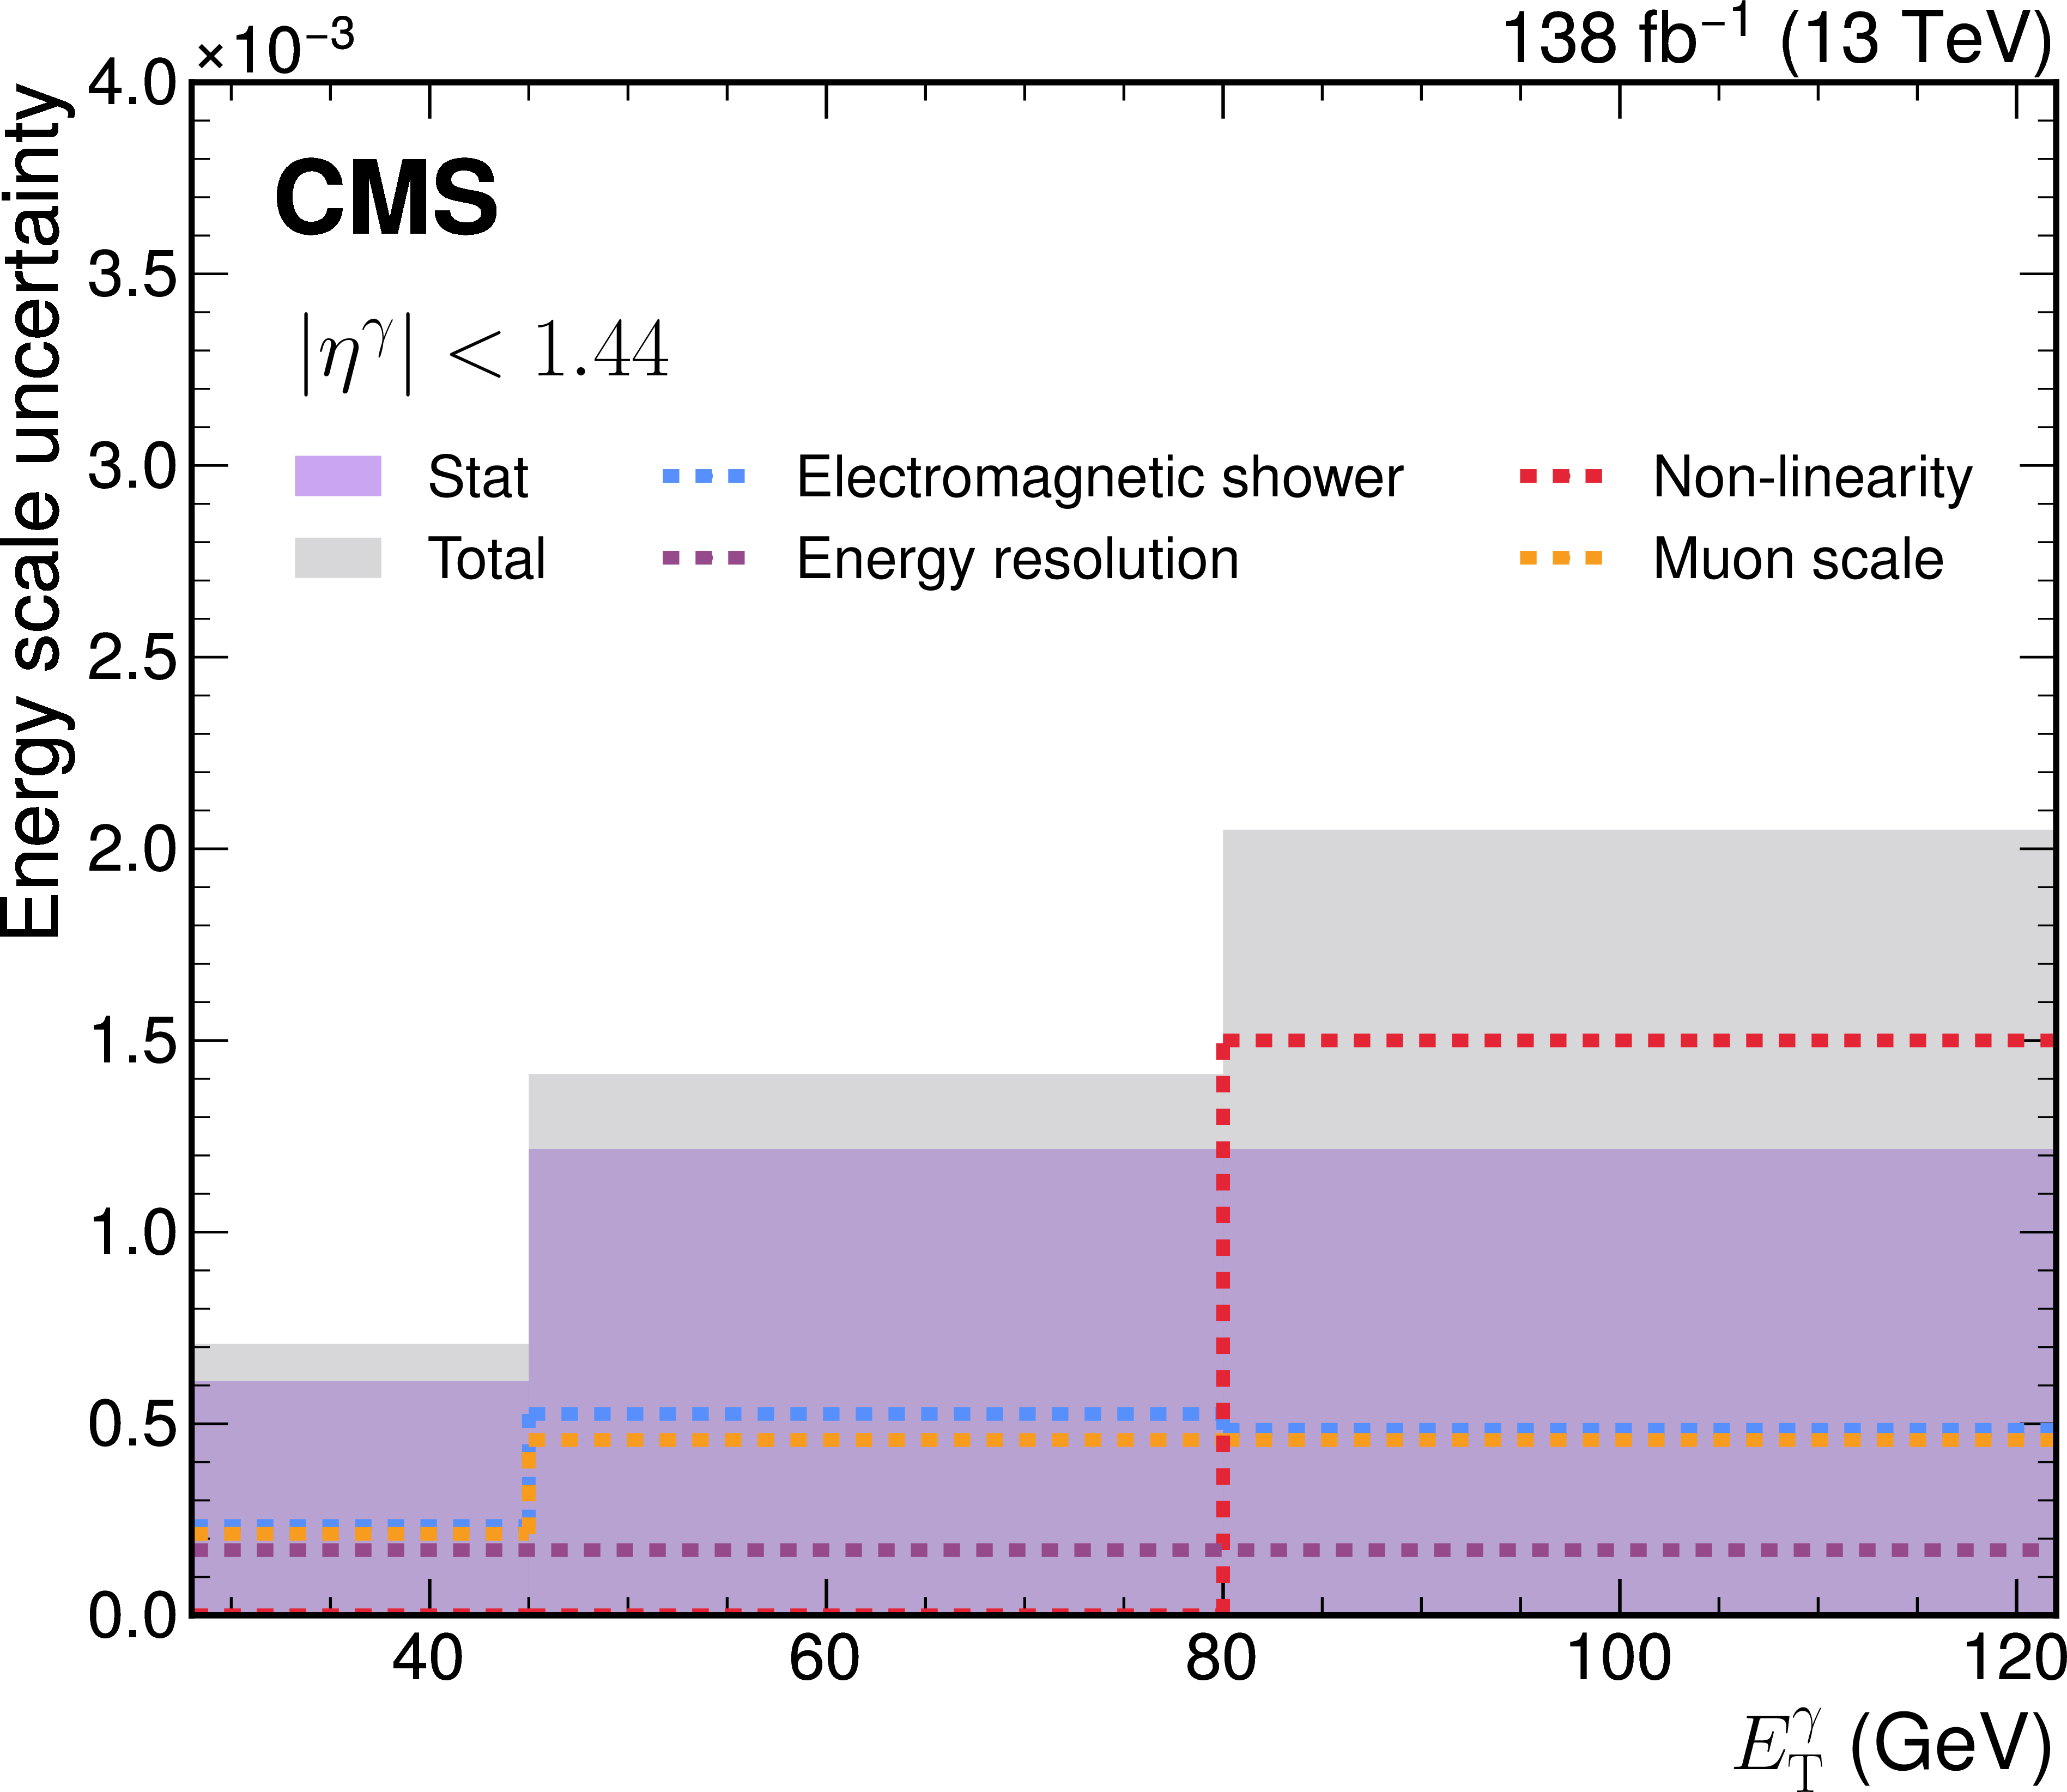
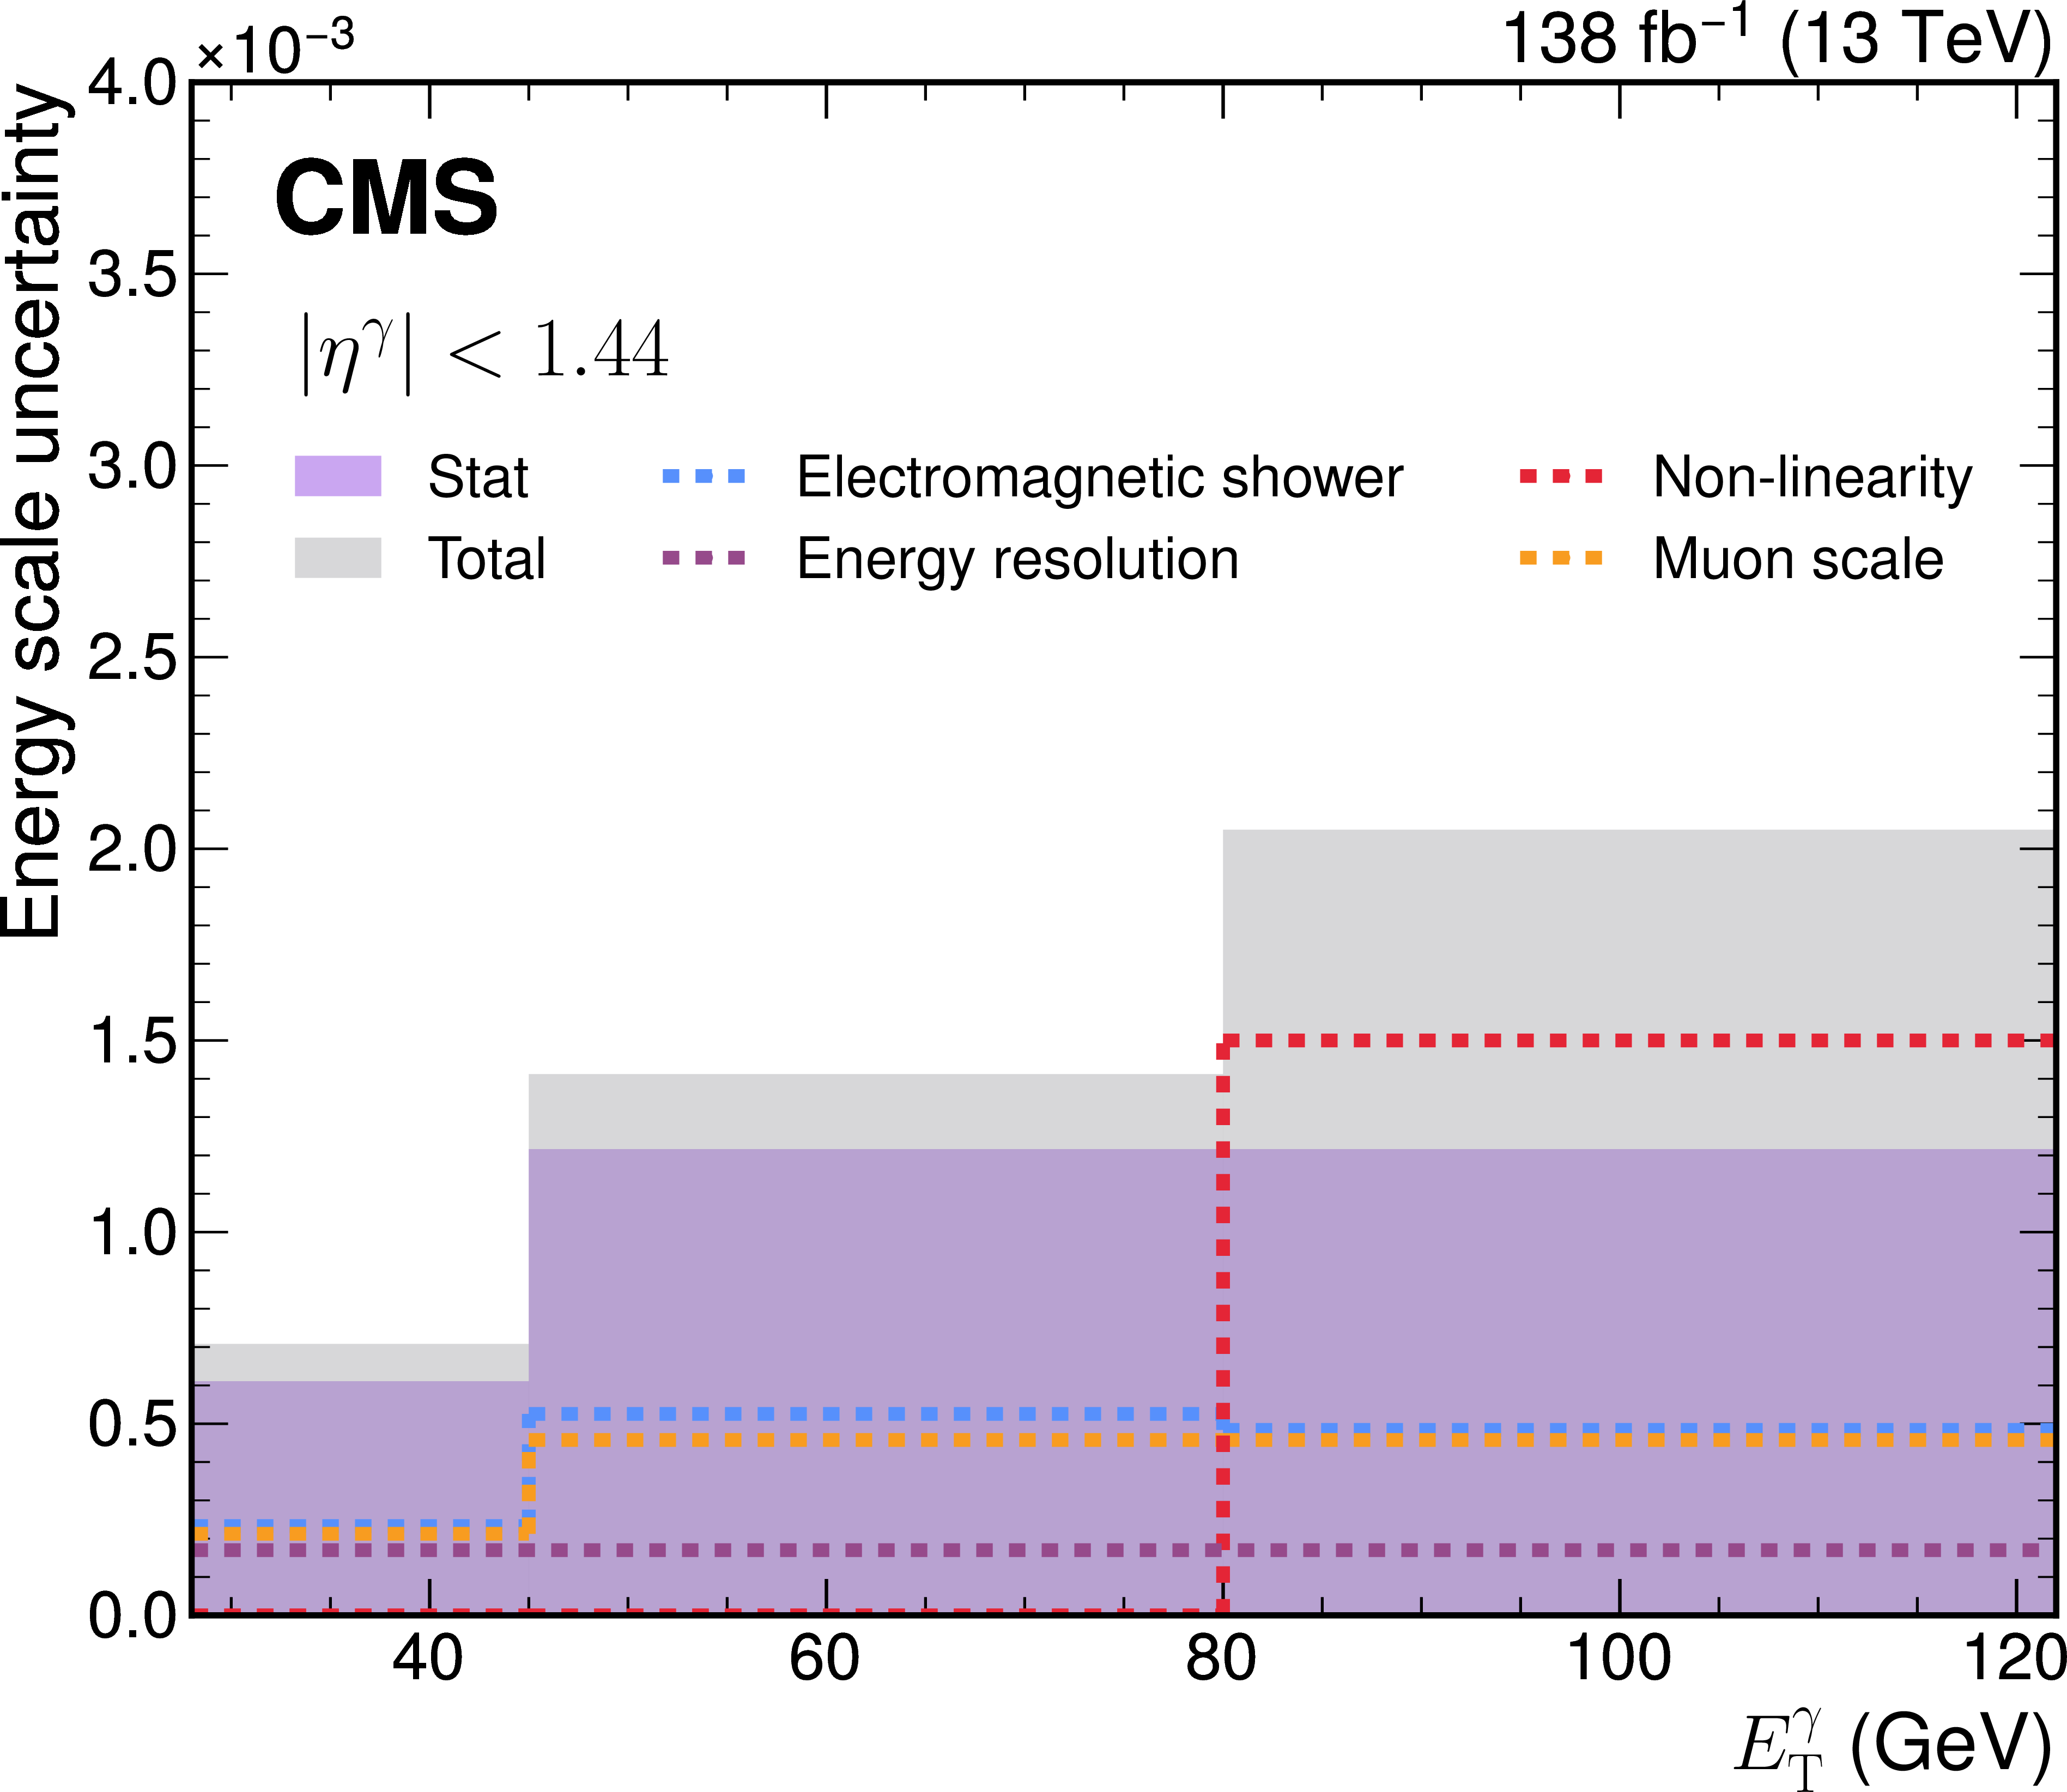
Uncertainties in the energy scale as a function of $ E^{\gamma}_{\mathrm{T}} $ of the photon in the barrel region, derived from $ \mathrm{Z}\to\mu\mu\gamma $ events. The shaded bands indicate the statistical and total uncertainties, while the dashed lines show the individual contributions from energy resolution, electromagnetic shower modeling, muon momentum scale, and non-linearity. |
png pdf |
Figure 6:
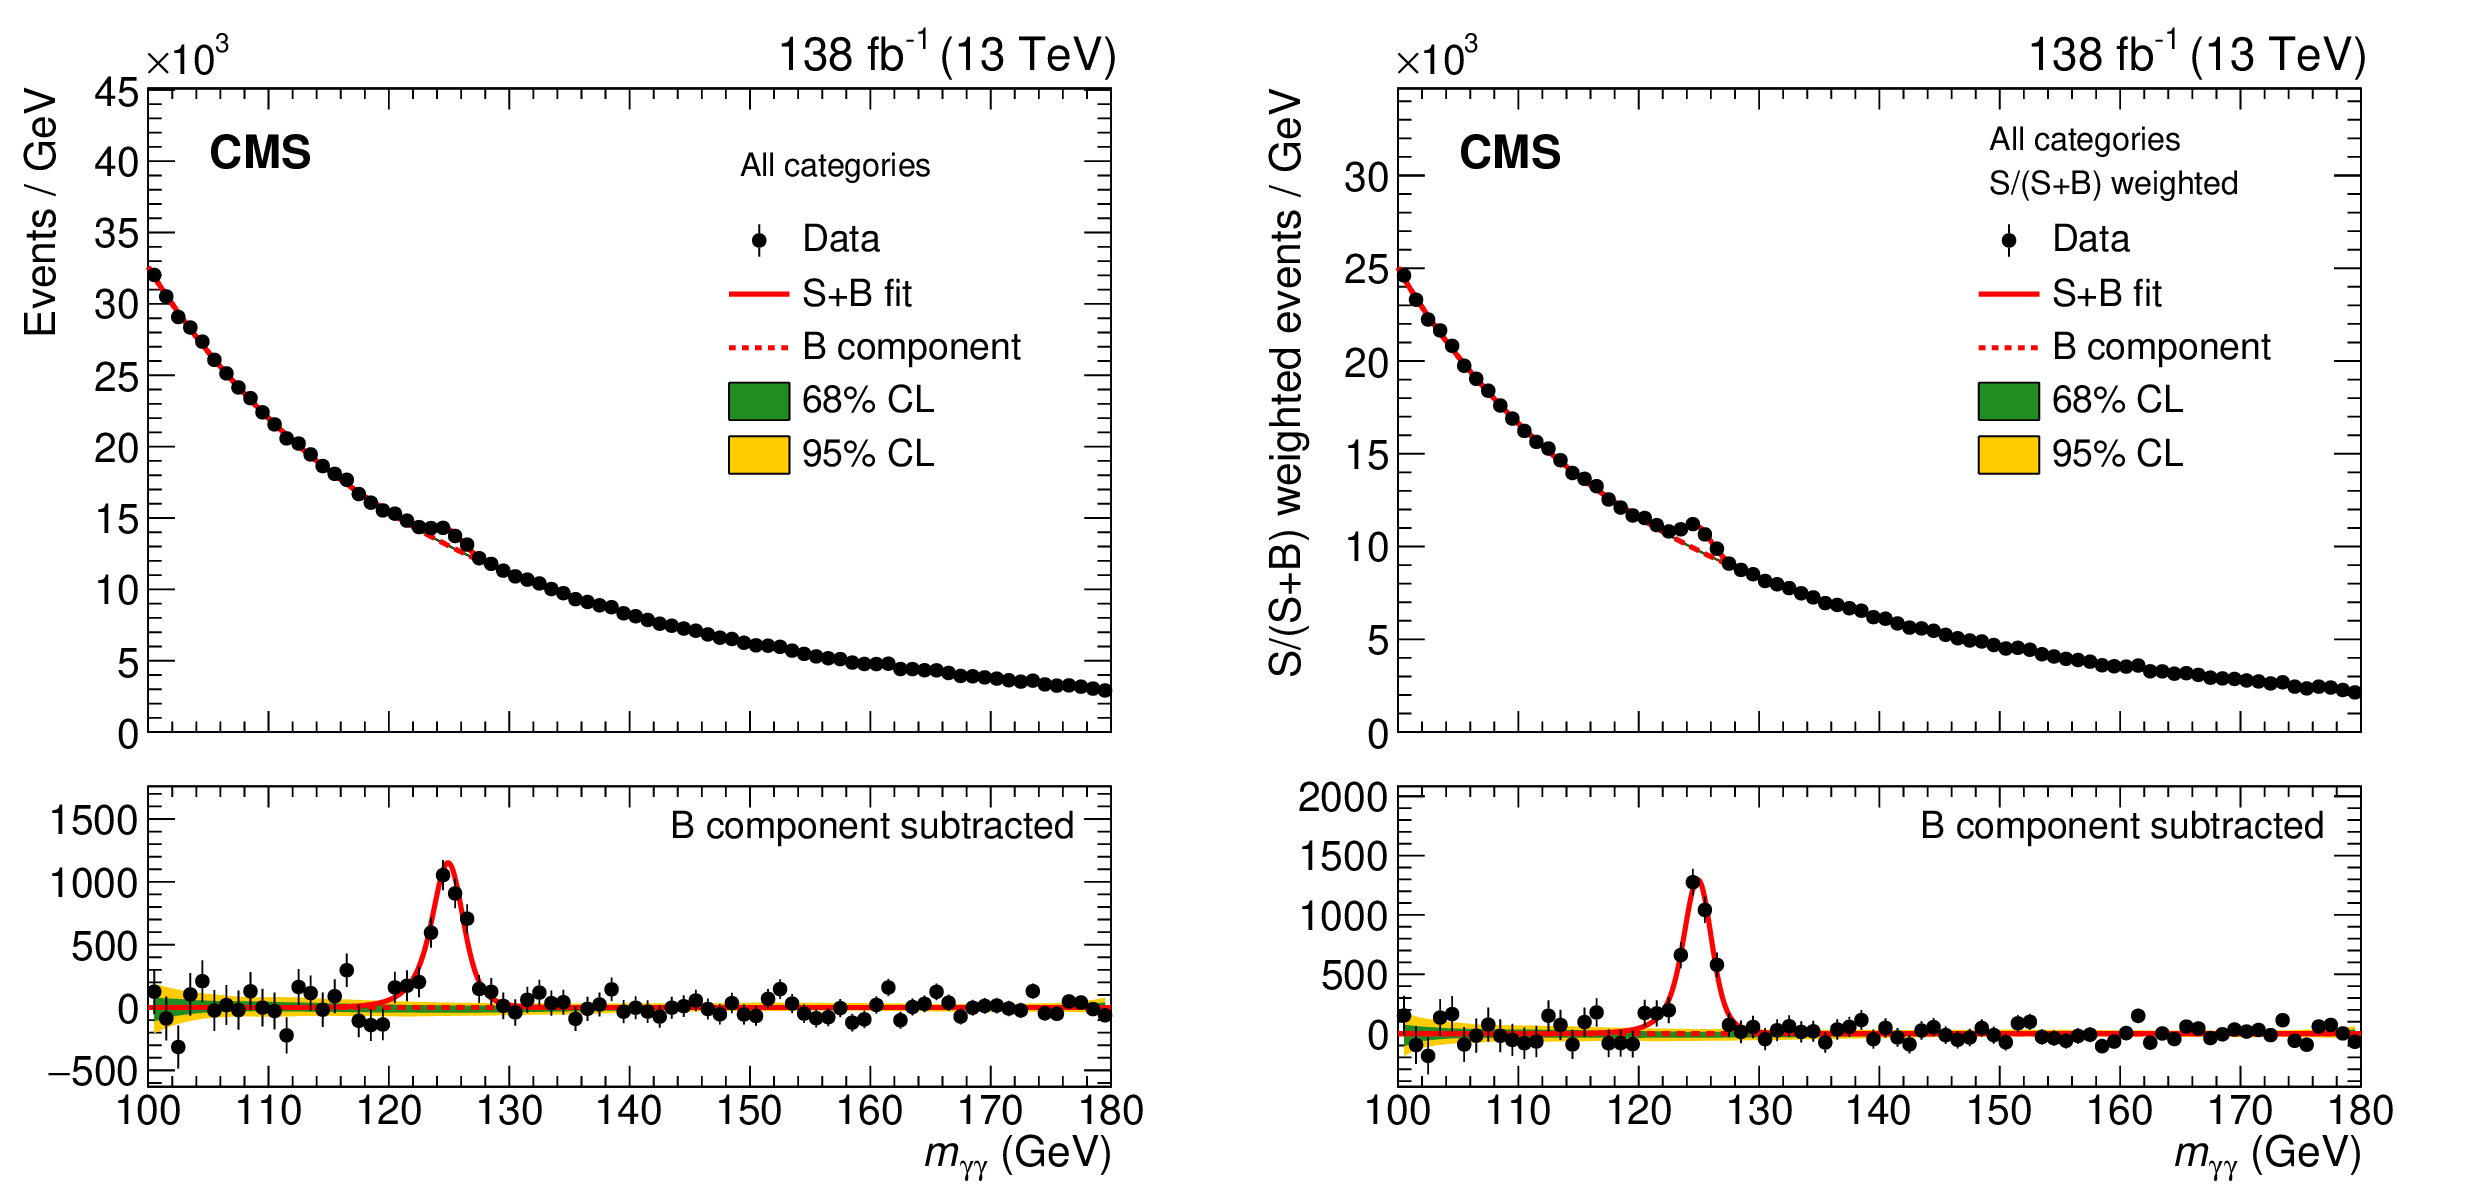
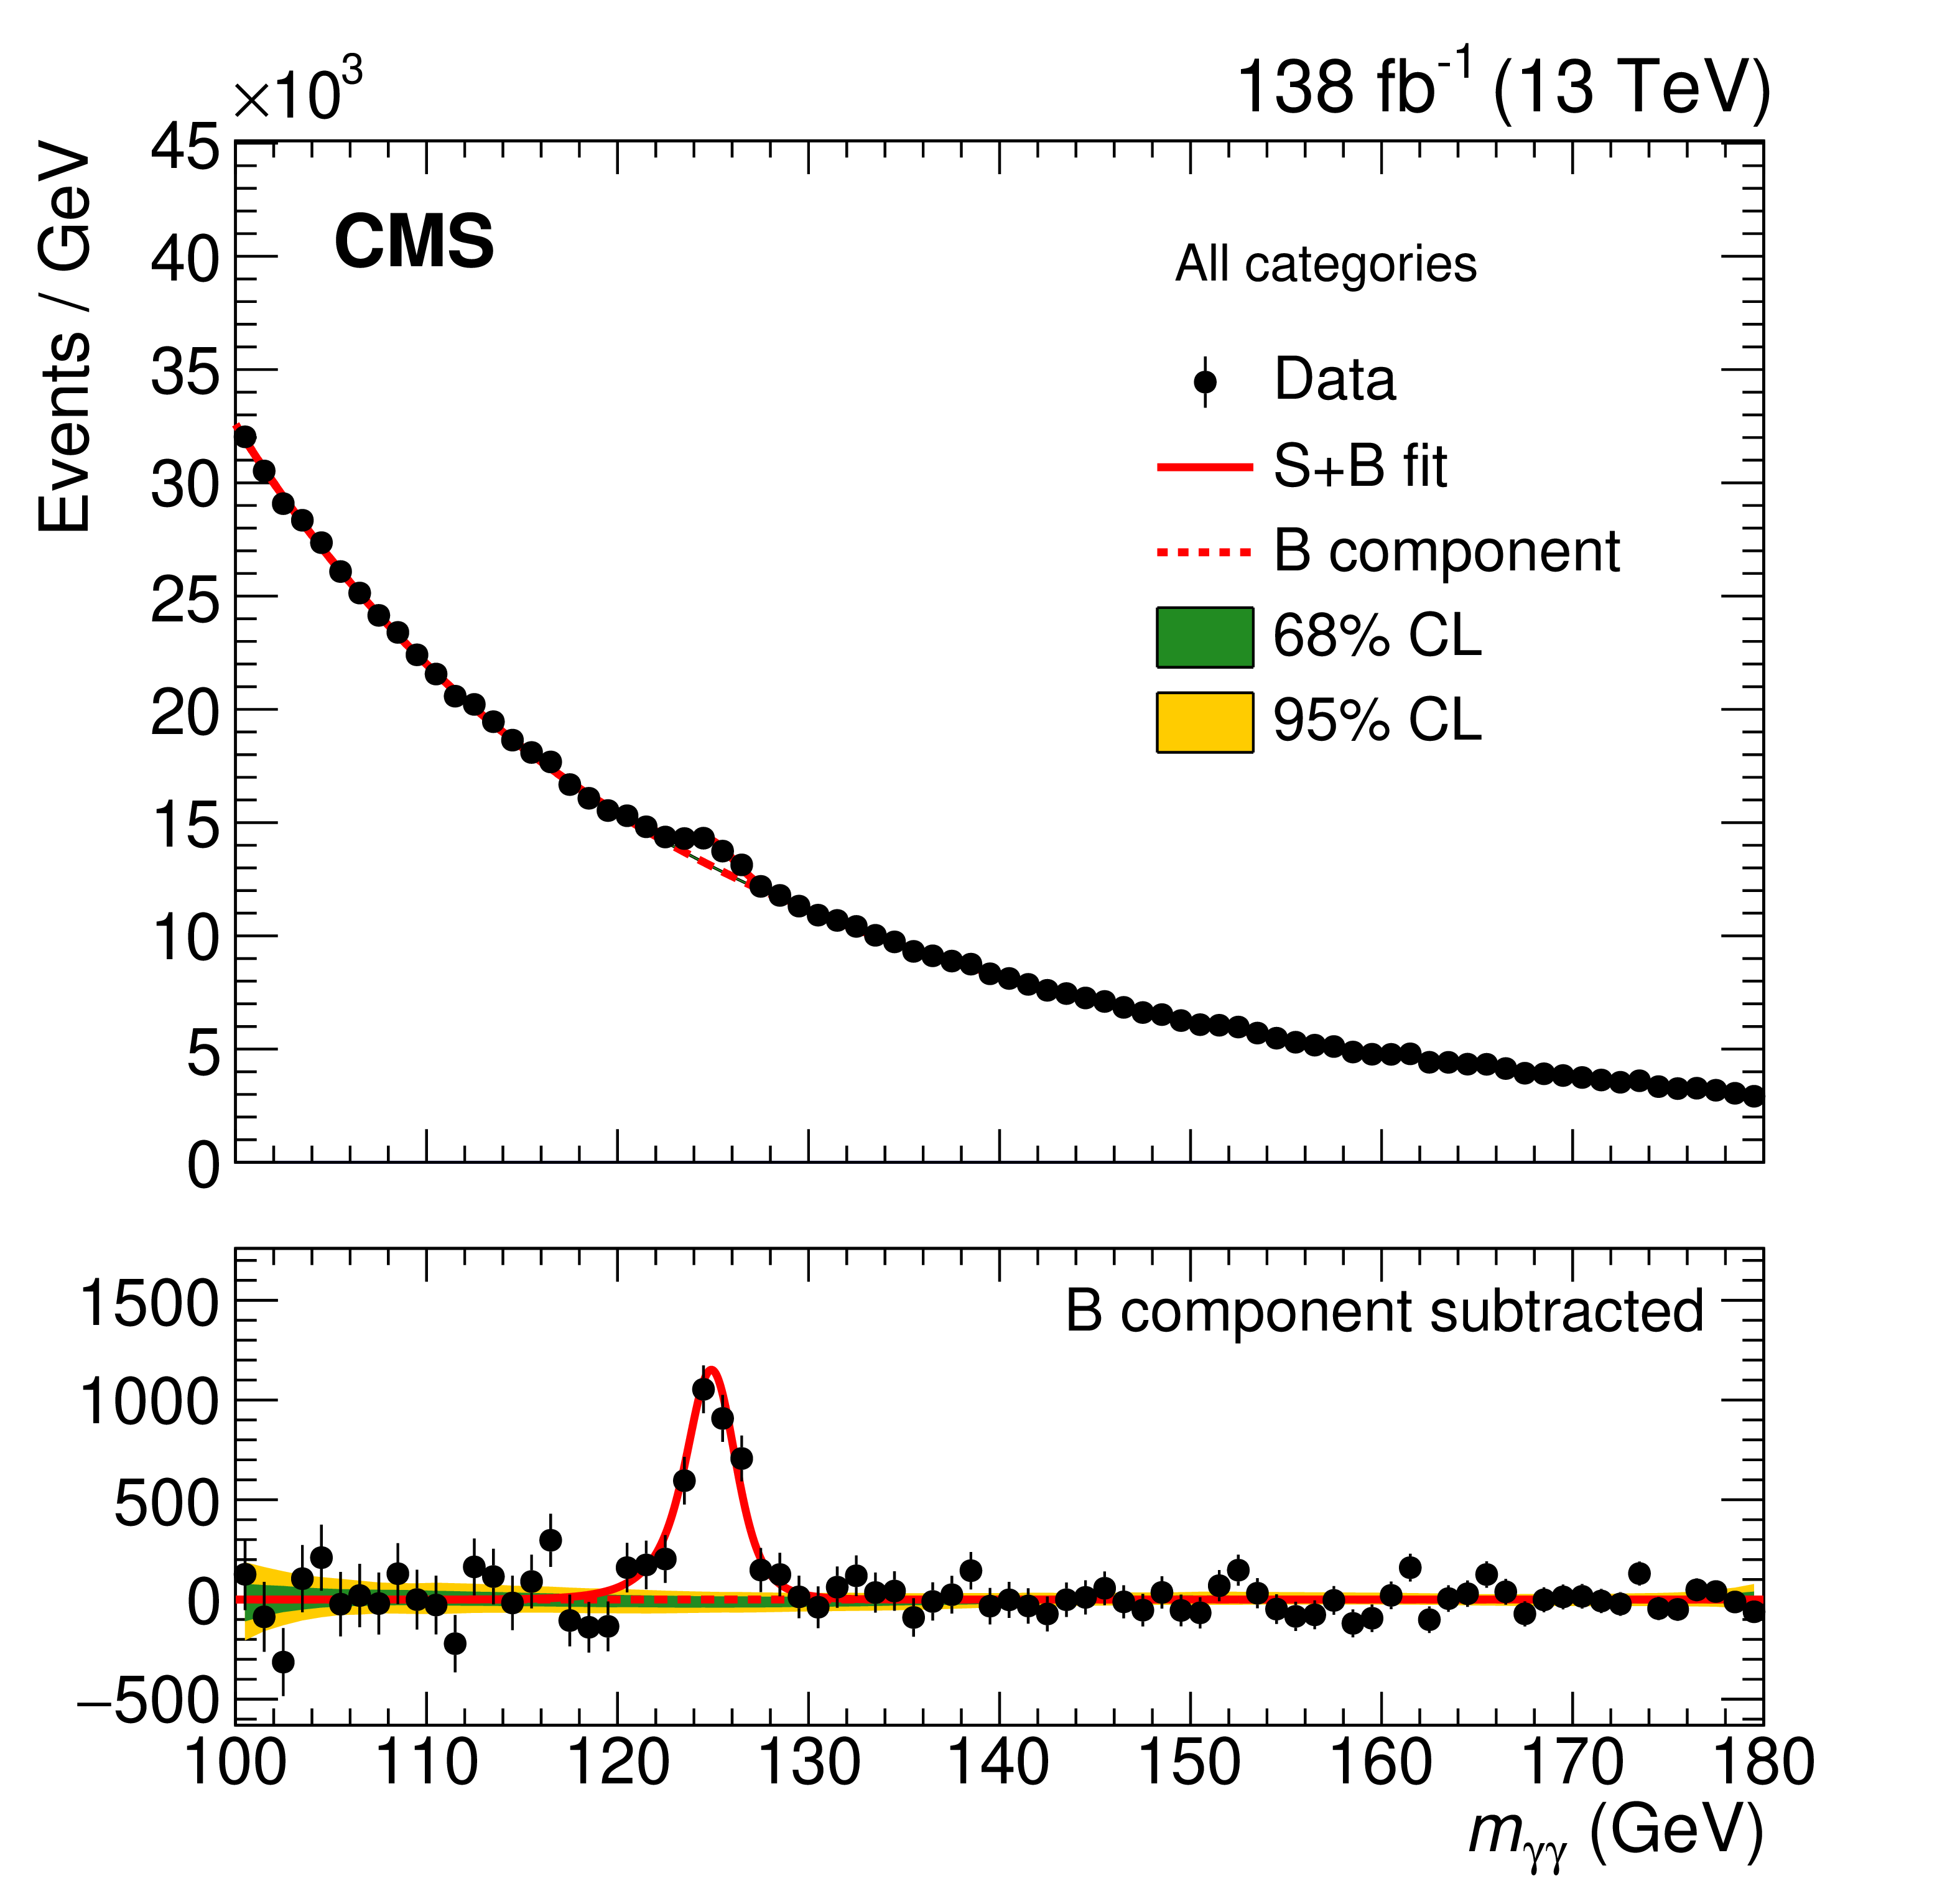
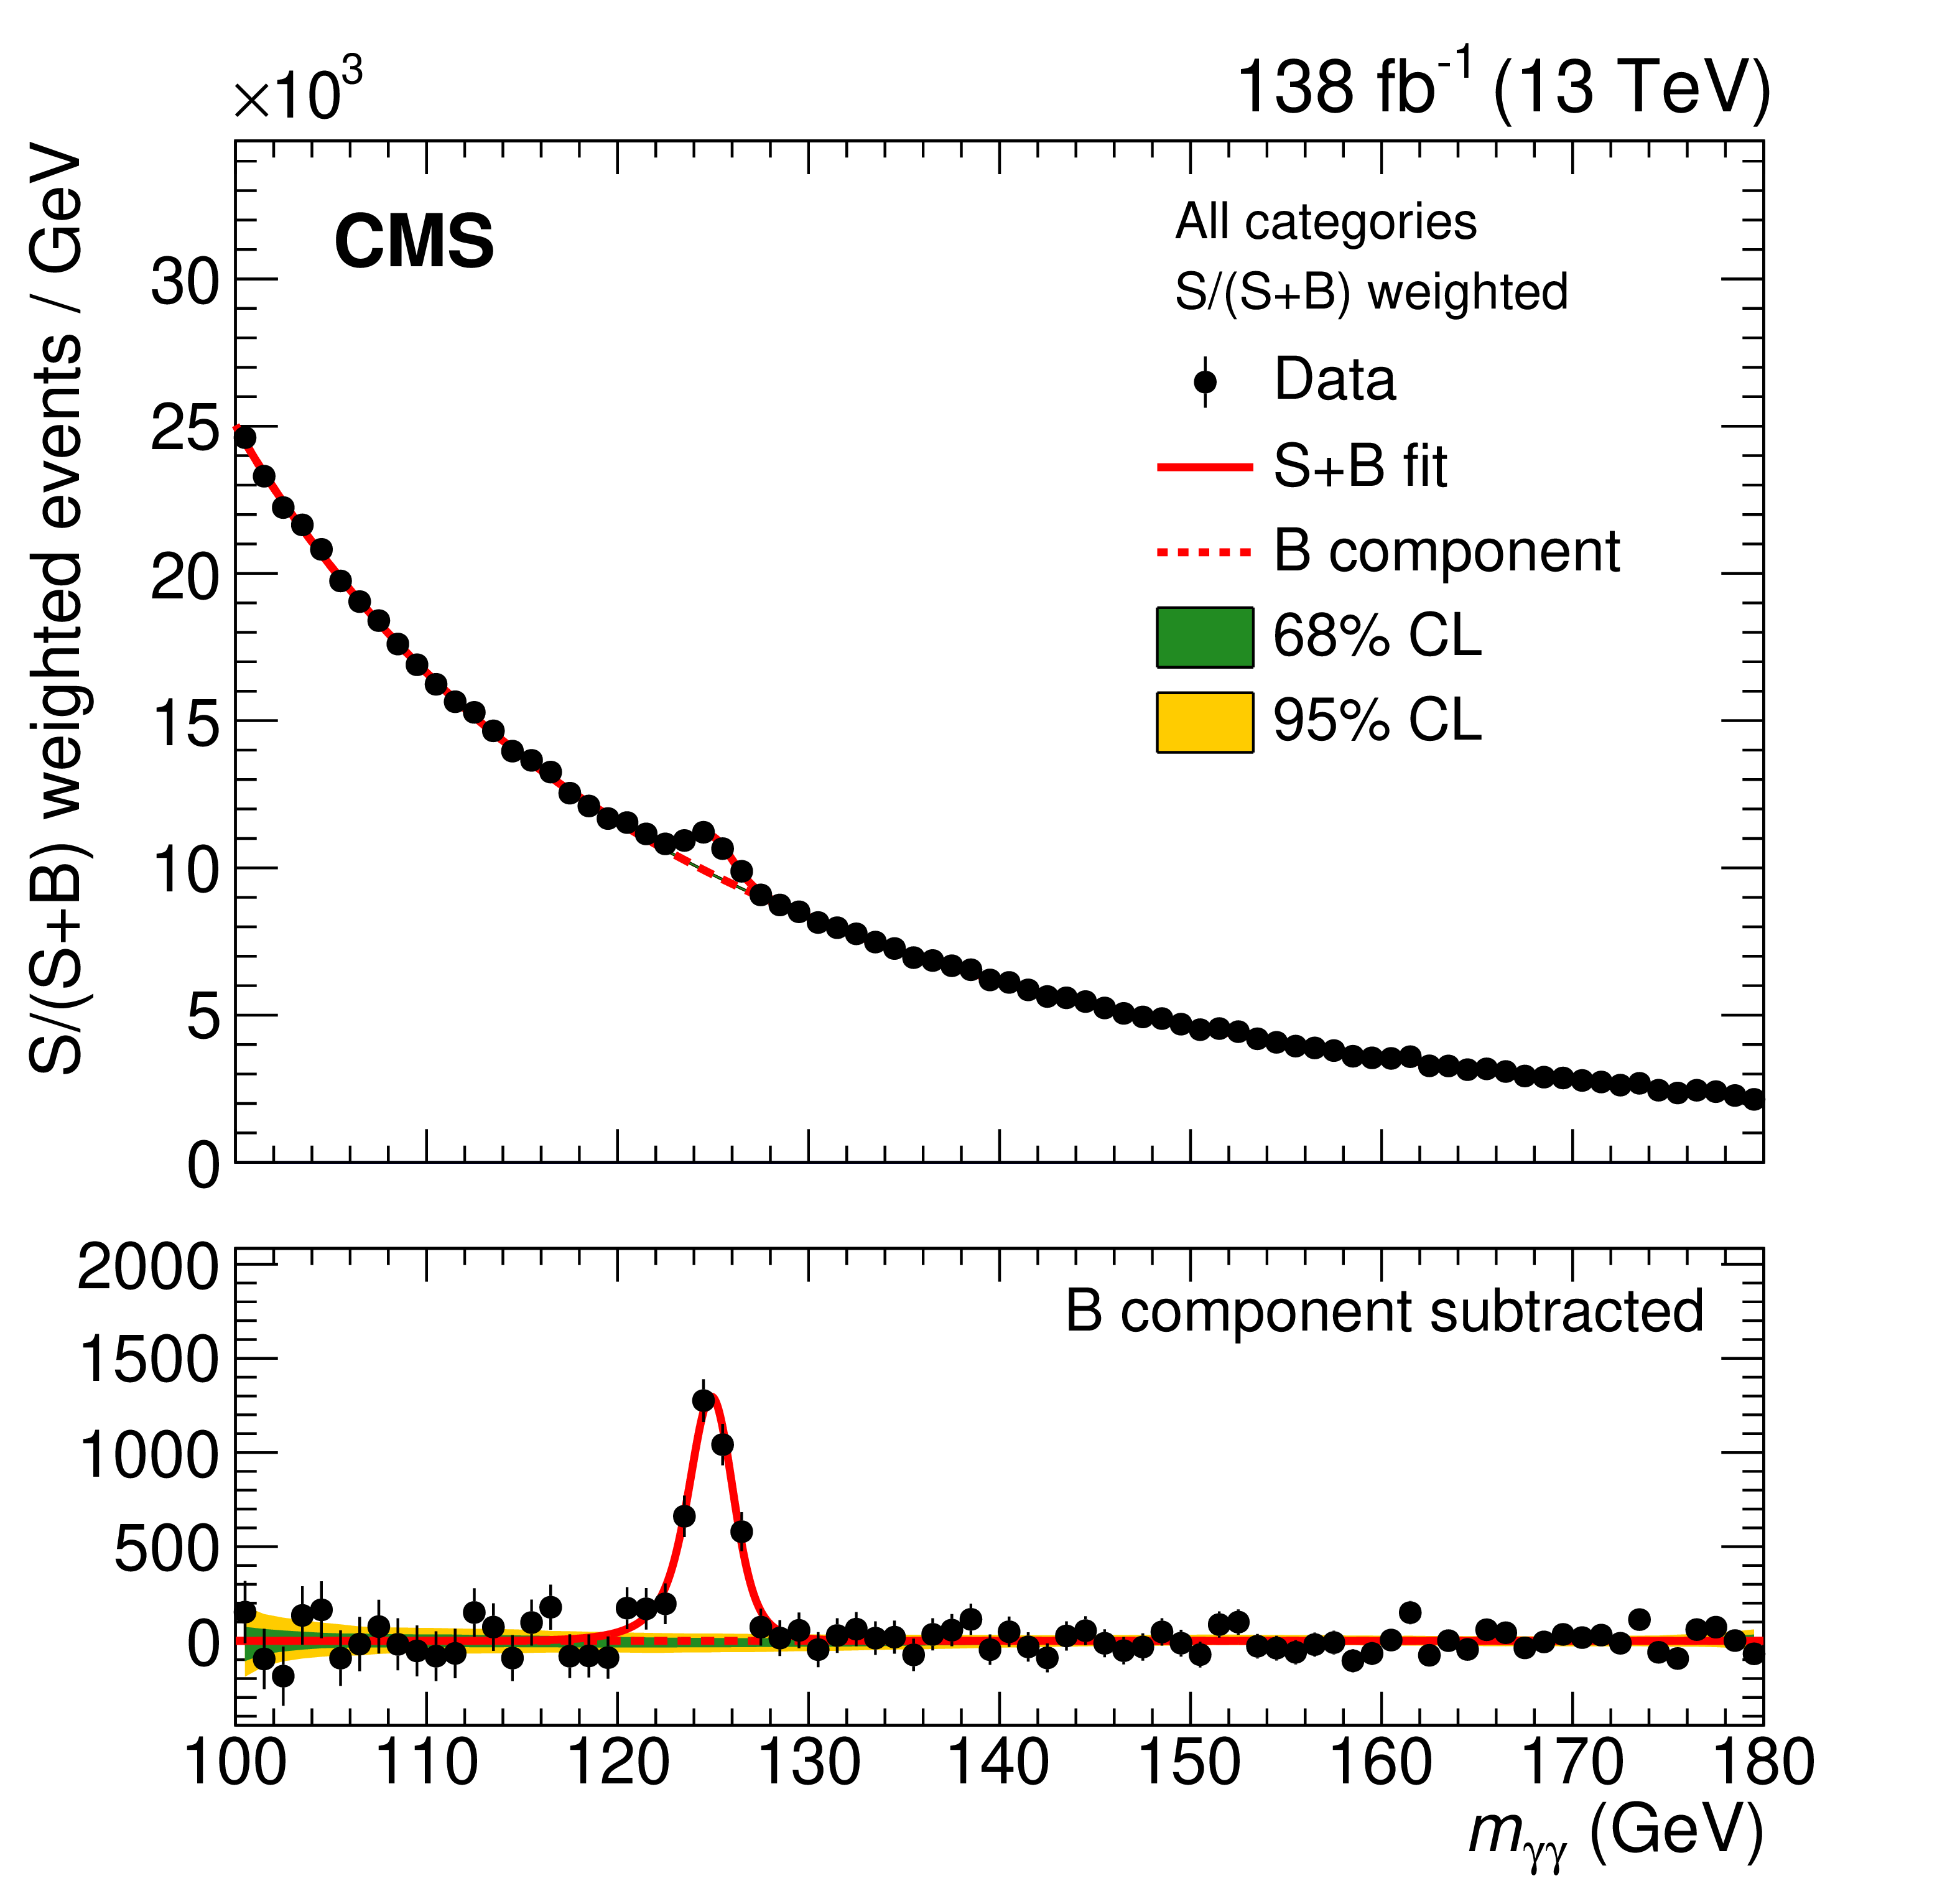
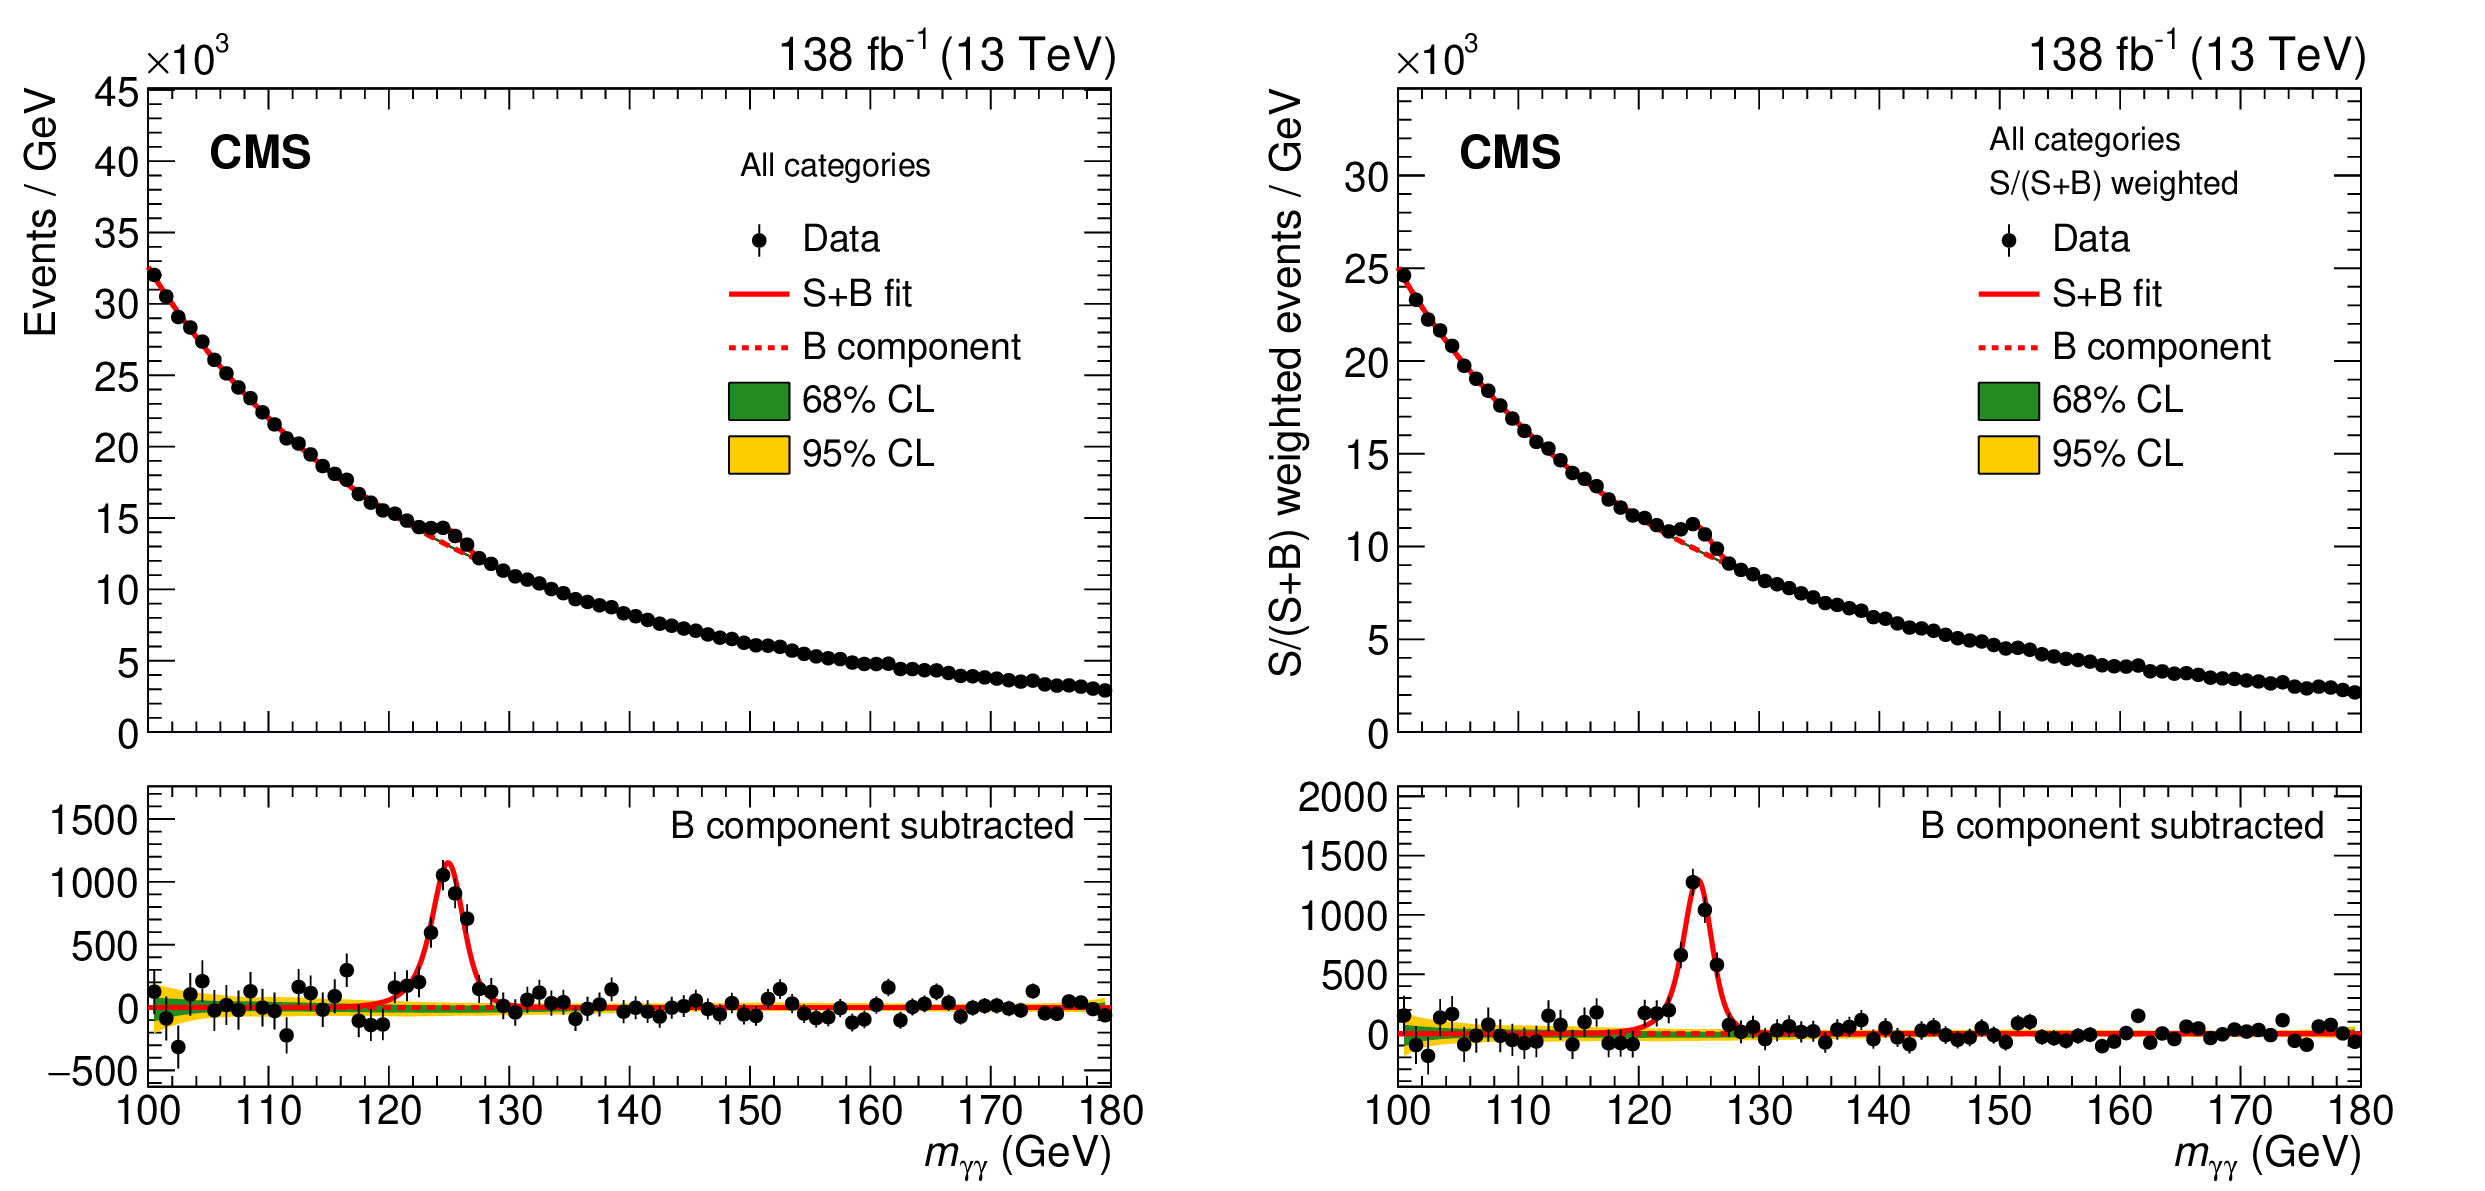
Data and combined signal and background model fit for all analysis categories, unweighted (left) and weighted by their sensitivity (right). The one (green) and two (yellow) standard deviation bands include the uncertainties in the background component of the fit. The lower panel shows the residuals after the background is subtracted. |
png pdf |
Figure 6-a:
Data and combined signal and background model fit for all analysis categories, unweighted (left) and weighted by their sensitivity (right). The one (green) and two (yellow) standard deviation bands include the uncertainties in the background component of the fit. The lower panel shows the residuals after the background is subtracted. |
png pdf |
Figure 6-b:
Data and combined signal and background model fit for all analysis categories, unweighted (left) and weighted by their sensitivity (right). The one (green) and two (yellow) standard deviation bands include the uncertainties in the background component of the fit. The lower panel shows the residuals after the background is subtracted. |
png pdf |
Figure 7:
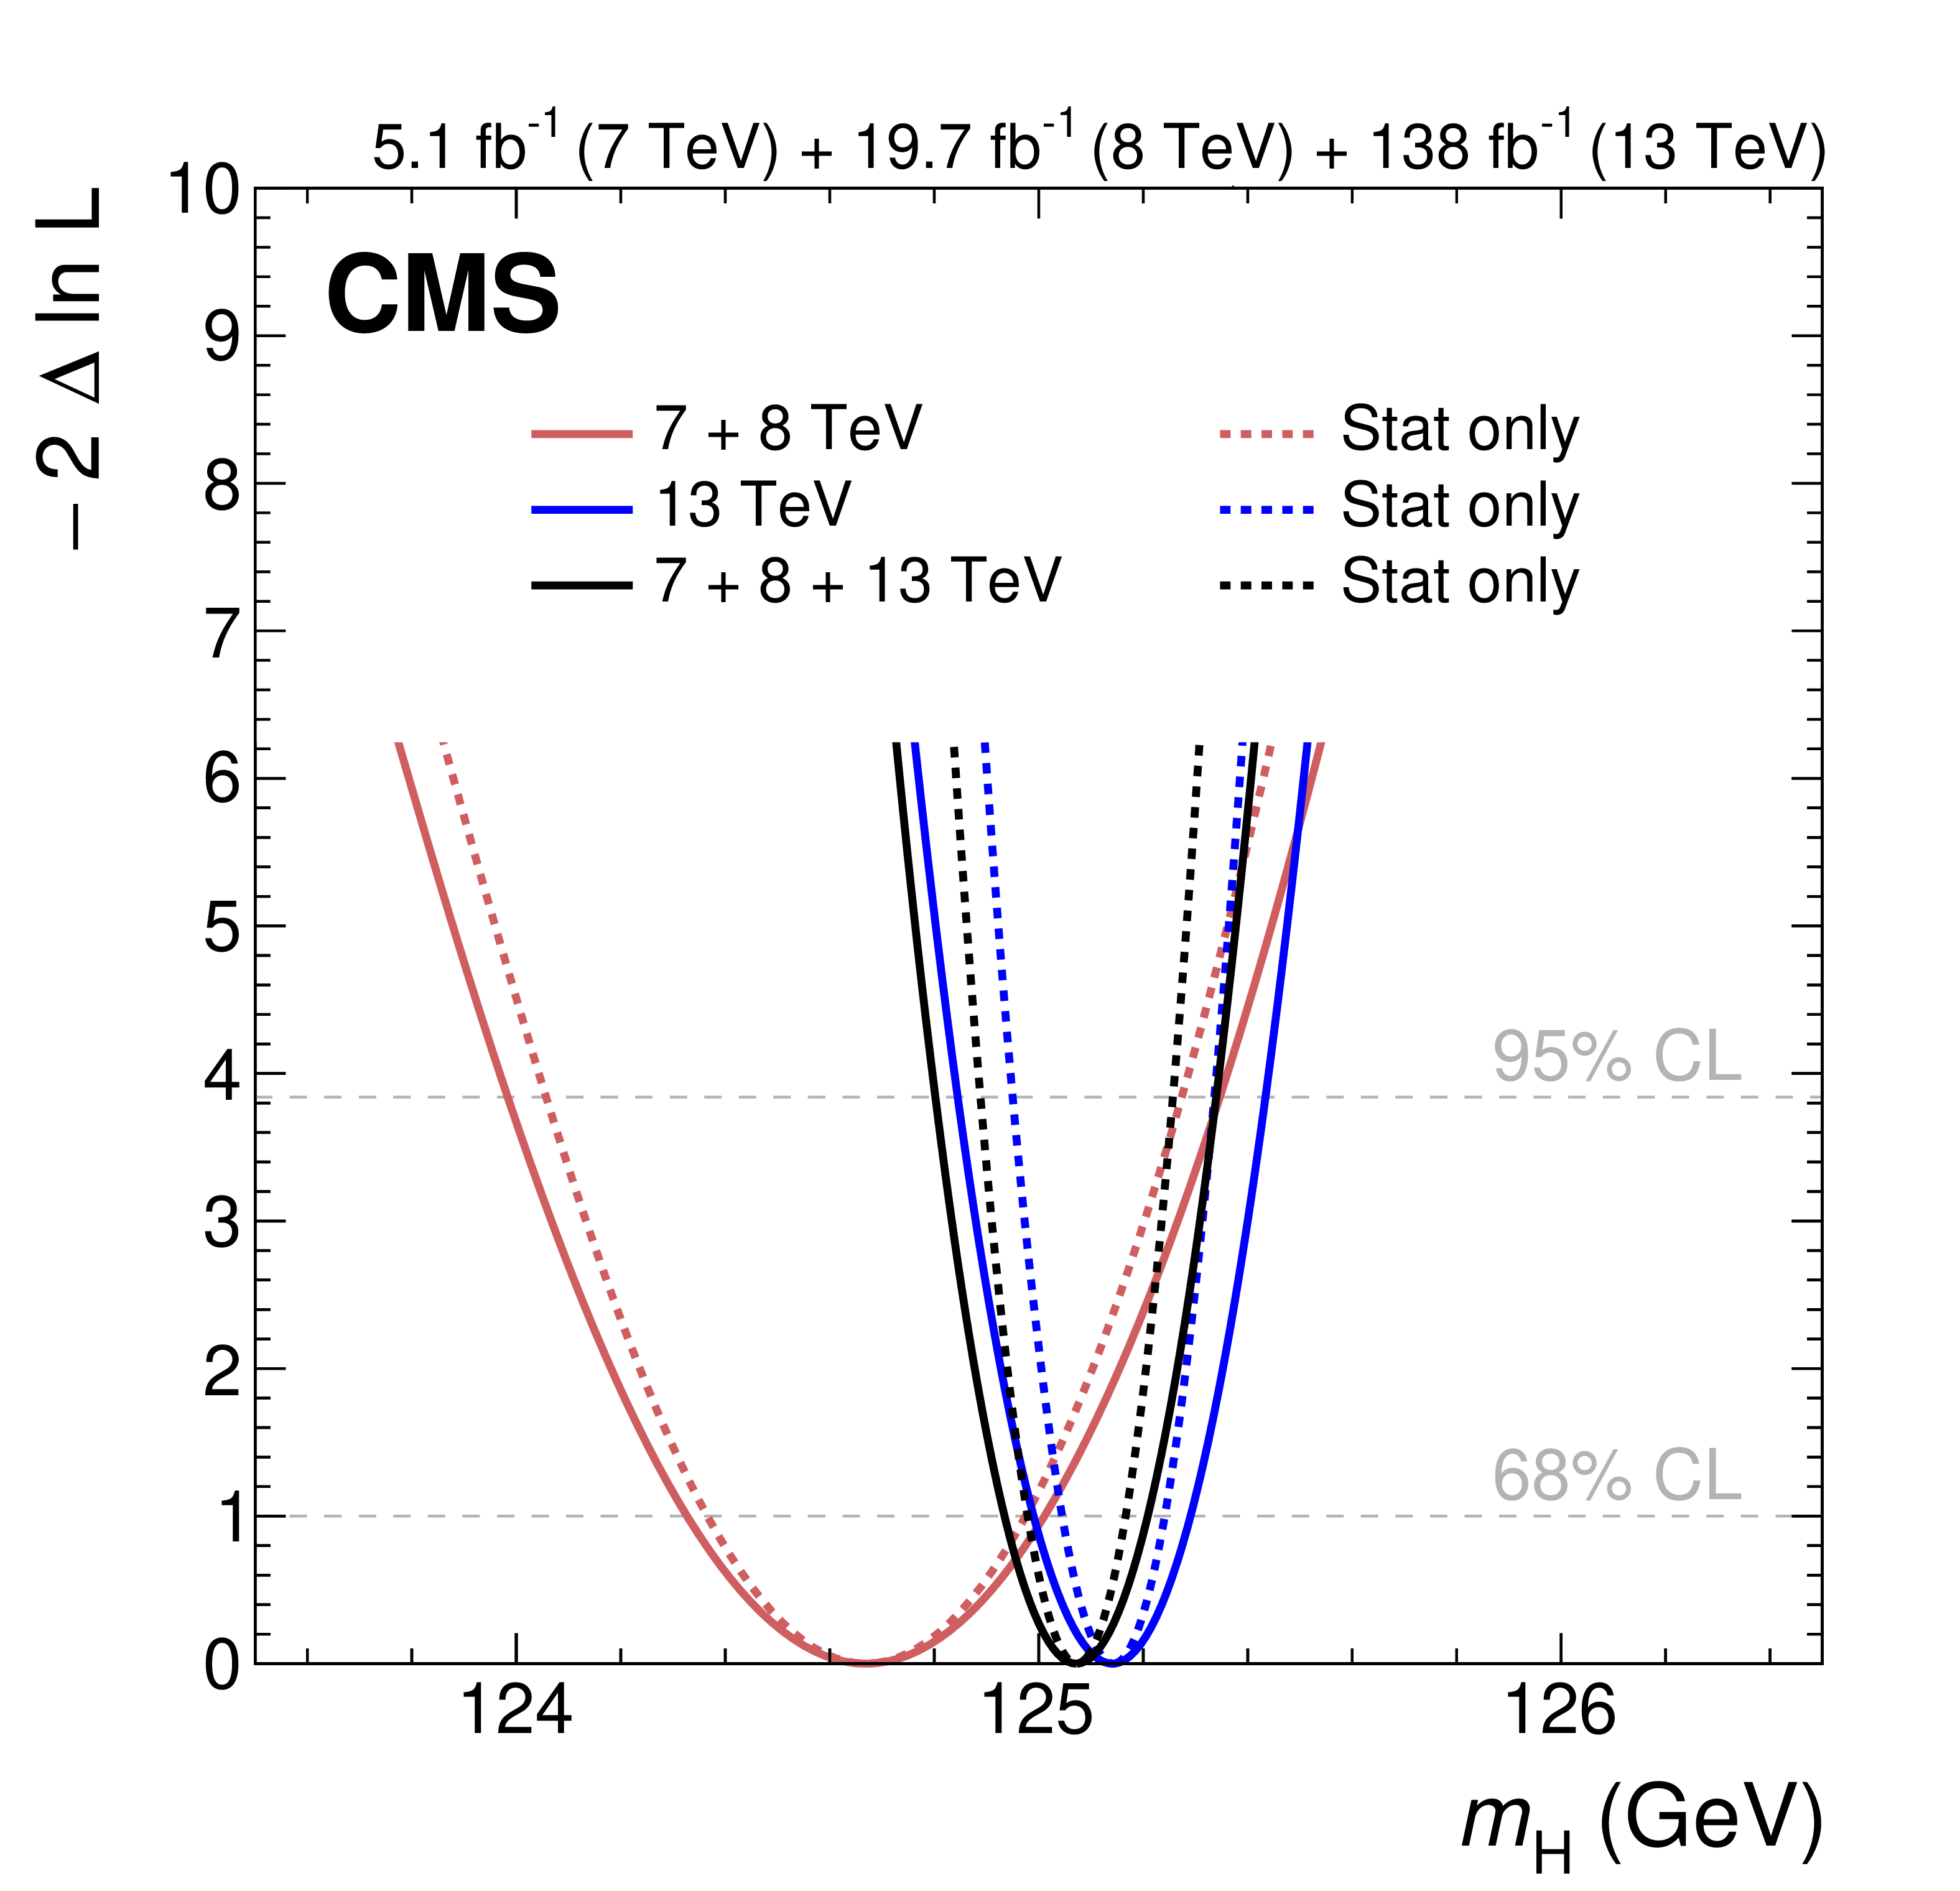
Likelihood scans of the Higgs boson mass measured in the $ \mathrm{H}\to\gamma\gamma $ decay channel for the $ \sqrt{s} = $ 7 and 8 TeV data sets, the $ \sqrt{s} = $ 13 TeV data set, and their combination. Solid lines show the full likelihood scan including systematic uncertainties, while dashed lines correspond to the statistical-only case. |
png pdf |
Figure 8:
Summary of the ATLAS and CMS Higgs boson mass measurements using the diphoton and the four-lepton final states, combining results at $ \sqrt{s} = $ 7, 8 and 13 TeV. The black points represent the best fit values of each measurement. The yellow and gray bands show the statistical and systematic uncertainties in each measurement, respectively. The horizontal black bars show the total uncertainties. The value of each measurement is given, along with the total uncertainties, splitting statistical only and systematic only uncertainties in parentheses. |
| Tables | |
png pdf |
Table 1:
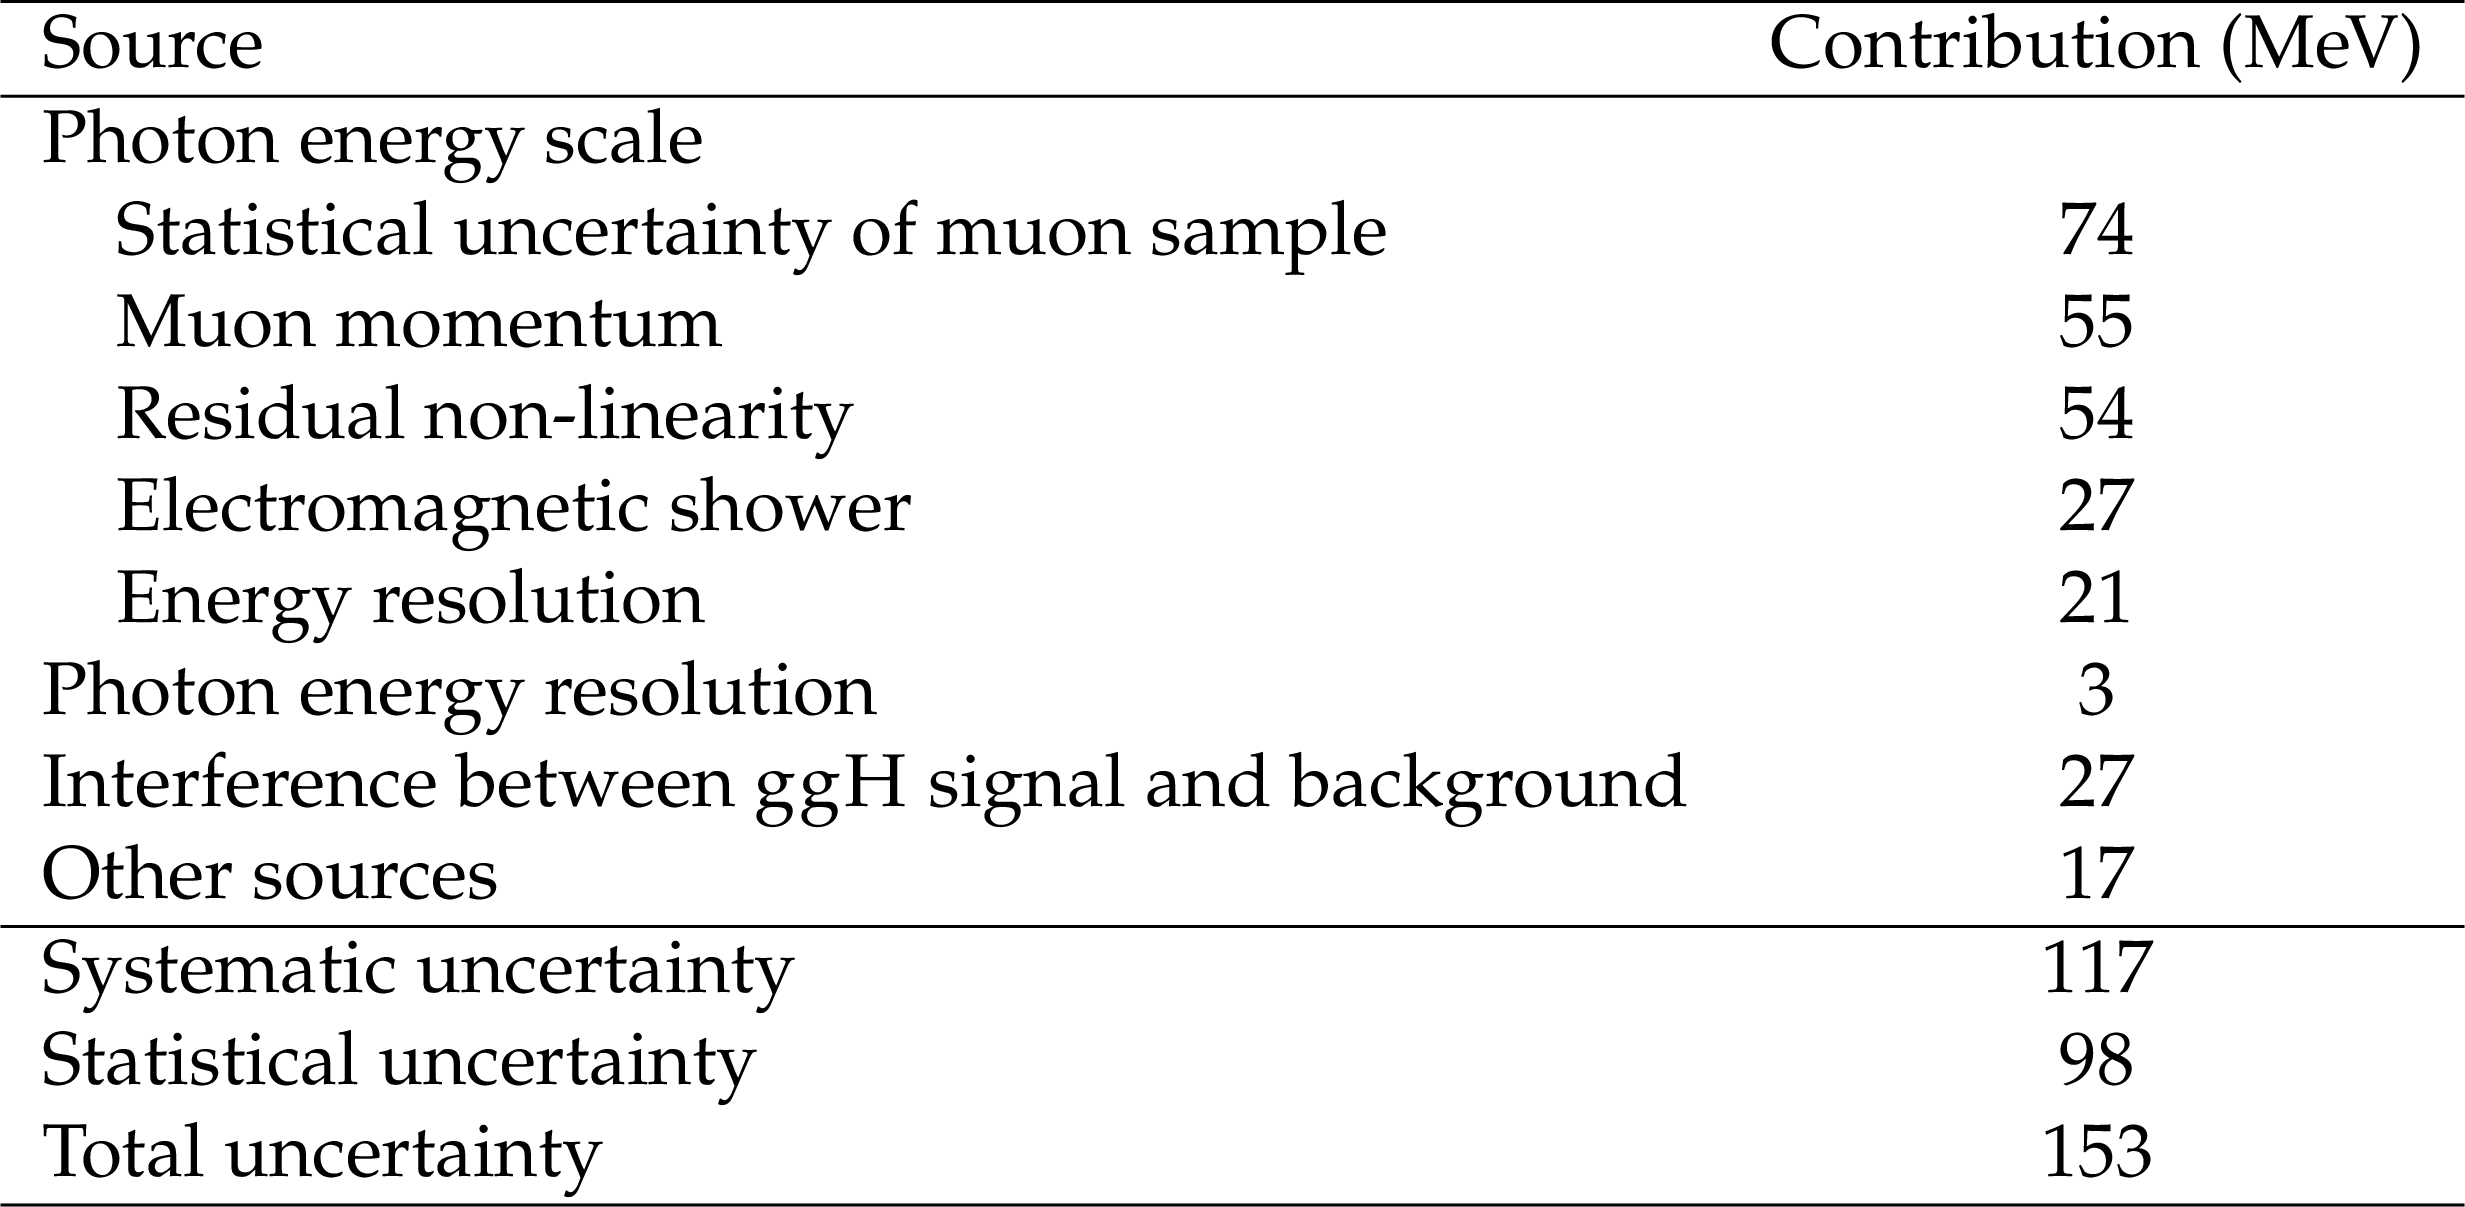
Observed impact of the different sources of uncertainty in the measurement of $ m_{\mathrm{H}} $ |
| Summary |
| A new measurement of the Higgs boson mass has been conducted in the diphoton decay channel, using the data set collected by CMS between 2016 and 2018 at $ \sqrt{s} = $ 13 TeV at the CERN LHC. New analysis techniques, enabled by the increased integrated luminosity, were used to improve the measurement precision, refine the detector calibration, and derive corrections accounting for differences between photons and electrons, resulting in a nearly factor-of-two reduction in the systematic uncertainty compared to previous measurements by the CMS Collaboration. The main improvements with respect to the previous analysis [10] include the derivation of granular $ E_\mathrm{T} $-dependent energy resolution corrections, a new simulation-based method to correct for differences between the photon and electron energy scales due to radiation damage in the ECAL crystals, and a calibration procedure using $ \mathrm{Z}\to\mu\mu\gamma $ events to correct residual energy scale differences between electrons and photons. In addition, a novel signal-to-background classifier was employed, with backgrounds containing at least one jet misidentified as a photon estimated using a technique based on control samples in data. To further enhance the measurement precision, multiple analysis categories were defined according to the classifier output, using a figure of merit that accounts for both the signal-to-background ratio and the relative diphoton mass resolution. The Higgs boson mass is measured to be $ m_{\mathrm{H}} = $ 125.13 $ \pm $ 0.15 $ \text{GeV} = $ 125.13 $ \pm $ 0.10 (stat) $ \pm $ 0.12 (syst) GeV using data collected at $ \sqrt{s} = $ 13 TeV. When combined with the corresponding measurement from CMS data at $ \sqrt{s} = $ 7 and 8 TeV, the mass is determined to be $ m_{\mathrm{H}} = $ 125.06 $ \pm $ 0.14 $ \text{GeV} = $ 125.06 $ \pm $ 0.09 (stat) $ \pm $ 0.11 (syst) GeV. |
| Additional Figures | |
png pdf |
Additional Figure 1:
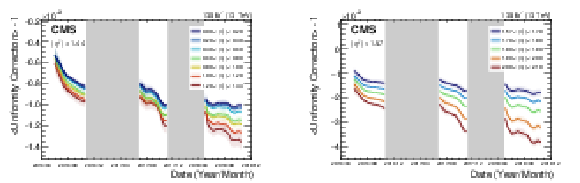
Median of the uniformity correction distribution in bins of photon pseudorapidity as a function of time during the 2016--2018 data-taking period, for photons in data passing the analysis selections. The error bands are computed as half of the central 68% quantile interval. The uniformity correction takes into account the increase in the radiation damage to the crystals, and any radiation-induced change in the response of the photodetectors. It is computed as the ratio of the electron and photon responses in the ECAL, where the response is defined as the convolution of the shower profile, simulated with $\textrm{GEANT4}$ [23], and the light collection efficiency. A $\textrm{FLUKA}$ [36] simulation is used to estimate the radiation damage and $\textrm{Litrani}$ [37] is used as a ray-tracing simulation to estimate the non-uniformity of light collection. The recovery of the crystal response during the periods without collisions is visible. The gray vertical band denotes the period with no LHC data taking. This correction is applied only to high-$R_\mathrm{9}$ photons ($R_\mathrm{9} > 0.96$), since a low-$R_\mathrm{9}$ photon ($R_\mathrm{9} \leq 0.96$) has a shower profile that is closer to that of an electron. The left panel shows the corrections for photons in the barrel region within $|{\eta^\gamma}| < 1.44$, while the right panel shows the corrections for photons in the endcap regions within $1.57 < |{\eta^\gamma}| < 2.10$. |

png pdf |
Additional Figure 1-a:
Median of the uniformity correction distribution in bins of photon pseudorapidity as a function of time during the 2016--2018 data-taking period, for photons in data passing the analysis selections. The error bands are computed as half of the central 68% quantile interval. The uniformity correction takes into account the increase in the radiation damage to the crystals, and any radiation-induced change in the response of the photodetectors. It is computed as the ratio of the electron and photon responses in the ECAL, where the response is defined as the convolution of the shower profile, simulated with $\textrm{GEANT4}$ [23], and the light collection efficiency. A $\textrm{FLUKA}$ [36] simulation is used to estimate the radiation damage and $\textrm{Litrani}$ [37] is used as a ray-tracing simulation to estimate the non-uniformity of light collection. The recovery of the crystal response during the periods without collisions is visible. The gray vertical band denotes the period with no LHC data taking. This correction is applied only to high-$R_\mathrm{9}$ photons ($R_\mathrm{9} > 0.96$), since a low-$R_\mathrm{9}$ photon ($R_\mathrm{9} \leq 0.96$) has a shower profile that is closer to that of an electron. The left panel shows the corrections for photons in the barrel region within $|{\eta^\gamma}| < 1.44$, while the right panel shows the corrections for photons in the endcap regions within $1.57 < |{\eta^\gamma}| < 2.10$. |
png pdf |
Additional Figure 1-b:
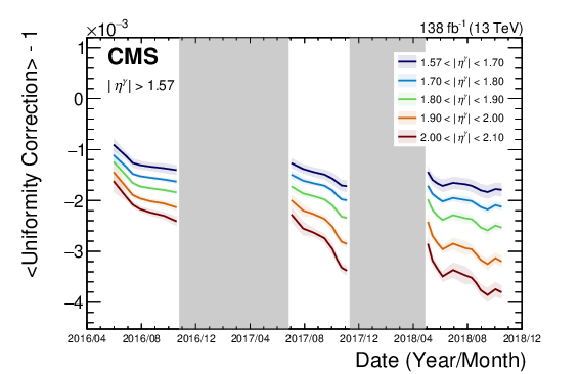
Median of the uniformity correction distribution in bins of photon pseudorapidity as a function of time during the 2016--2018 data-taking period, for photons in data passing the analysis selections. The error bands are computed as half of the central 68% quantile interval. The uniformity correction takes into account the increase in the radiation damage to the crystals, and any radiation-induced change in the response of the photodetectors. It is computed as the ratio of the electron and photon responses in the ECAL, where the response is defined as the convolution of the shower profile, simulated with $\textrm{GEANT4}$ [23], and the light collection efficiency. A $\textrm{FLUKA}$ [36] simulation is used to estimate the radiation damage and $\textrm{Litrani}$ [37] is used as a ray-tracing simulation to estimate the non-uniformity of light collection. The recovery of the crystal response during the periods without collisions is visible. The gray vertical band denotes the period with no LHC data taking. This correction is applied only to high-$R_\mathrm{9}$ photons ($R_\mathrm{9} > 0.96$), since a low-$R_\mathrm{9}$ photon ($R_\mathrm{9} \leq 0.96$) has a shower profile that is closer to that of an electron. The left panel shows the corrections for photons in the barrel region within $|{\eta^\gamma}| < 1.44$, while the right panel shows the corrections for photons in the endcap regions within $1.57 < |{\eta^\gamma}| < 2.10$. |
png pdf |
Additional Figure 2:
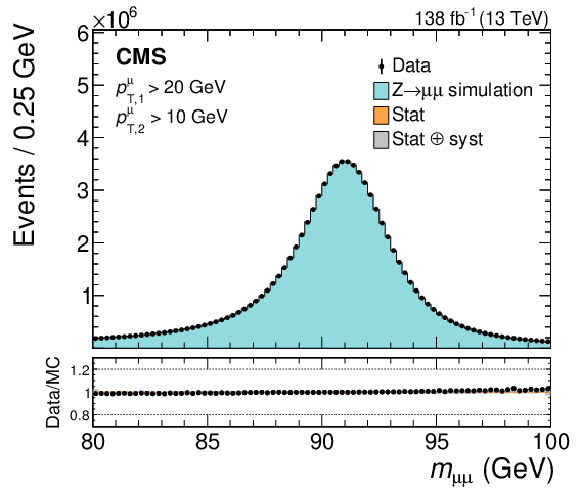
Comparison of the dimuon invariant mass distribution in data and simulation for $Z\to\mu\mu$ events after applying calibrations to the momentum [43]. Events are selected by requiring the presence of two muons with opposite charge satisfying tight identification criteria [18]. The leading and subleading muons are required to have a transverse momentum exceeding 20 and 10 GeV, respectively. Events from the data collected by the CMS experiment during the 2016--2018 LHC data-taking period are considered, corresponding to an integrated luminosity of 138 fb$ ^{-1} $. The lower panel shows the bin-by-bin ratio of the data to the simulation (MC). The error bands account for the statistical and systematic uncertainties associated with the momentum scale corrections. |
png pdf |
Additional Figure 3:
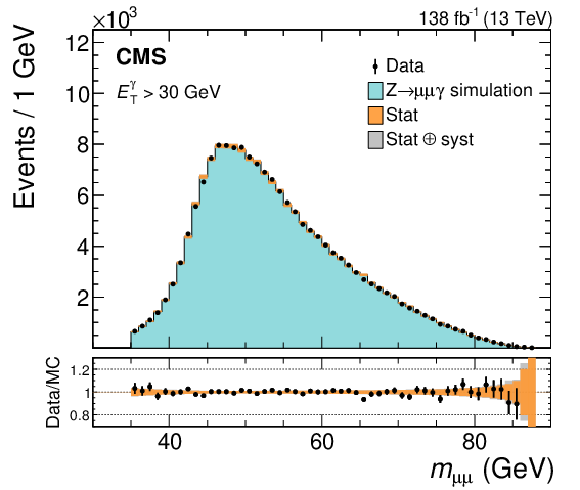
Comparison of the dimuon invariant mass distribution in data and simulation for $Z\to\mu\mu\gamma$ events after applying calibrations to the muon momentum [43] and to the photon energy scale. Events are selected by requiring the presence of two muons with opposite charge satisfying tight identification criteria [18]. The leading and subleading muons are required to have a transverse momentum exceeding 20 and 10 GeV, respectively. In addition, the photon is required to have $E^{\gamma}_{\mathrm{T}} > 30$ GeV, to pass a loose requirement on the photon ID score [17], and to be separated from the nearest muon by $0.01 < \Delta R(\mu, \gamma) < 0.8$. Events from the data collected by the CMS experiment during the 2016--2018 LHC data-taking period are considered, corresponding to an integrated luminosity of 138 fb$ ^{-1} $ The lower panel shows the bin-by-bin ratio of the data to the simulation (MC). The error bands account for the statistical and systematic uncertainties associated with the momentum scale corrections. |
png pdf |
Additional Figure 4:
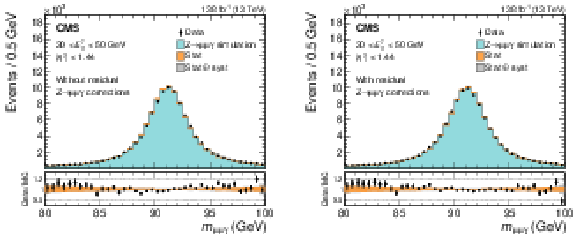
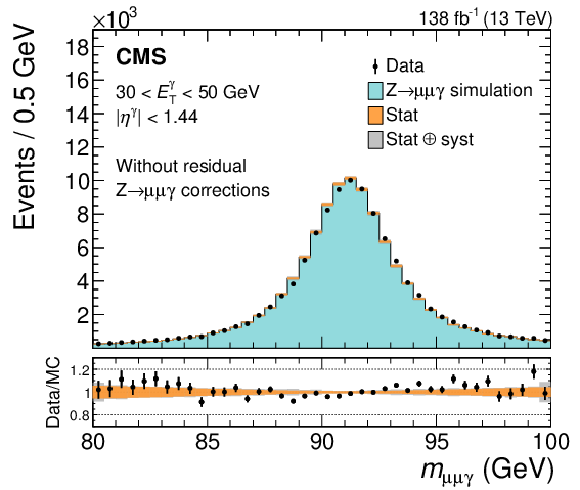
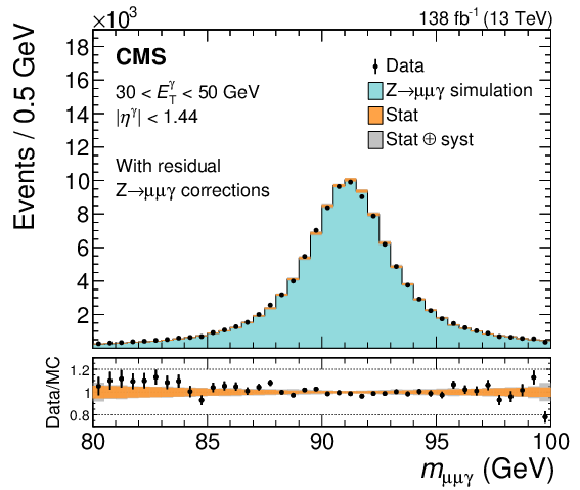
Comparison of the three-body invariant mass distribution in data and simulation for $Z\to\mu\mu\gamma$ events after applying calibrations to the muon momentum [43] and to the photon energy scale. Events are selected by requiring the presence of two muons with opposite charge satisfying tight identification criteria [18]. The leading and subleading muons are required to have a transverse momentum exceeding 20 and 10 GeV, respectively. In addition, the photon is required to have $30 < E^{\gamma}_{\mathrm{T}} < 50$ GeV and $|{\eta^\gamma}| < 1.44$, to pass a loose requirement on the photon ID score [17], and to be separated from the nearest muon by $0.01 < \Delta R(\mu, \gamma) < 0.8$. Events from the data collected by the CMS experiment during the 2016--2018 LHC data-taking period are considered, corresponding to an integrated luminosity of 1138 fb$ ^{-1} $ The lower panel shows the bin-by-bin ratio of the data to the simulation (MC). The left panel shows the distribution after the first two calibration stages, without the final photon energy scale correction derived from FSR photons. The right panel shows the same distribution after applying the final photon energy scale corrections. The error bands account for the statistical and systematic uncertainties associated with the momentum scale corrections. |
png pdf |
Additional Figure 4-a:
Comparison of the three-body invariant mass distribution in data and simulation for $Z\to\mu\mu\gamma$ events after applying calibrations to the muon momentum [43] and to the photon energy scale. Events are selected by requiring the presence of two muons with opposite charge satisfying tight identification criteria [18]. The leading and subleading muons are required to have a transverse momentum exceeding 20 and 10 GeV, respectively. In addition, the photon is required to have $30 < E^{\gamma}_{\mathrm{T}} < 50$ GeV and $|{\eta^\gamma}| < 1.44$, to pass a loose requirement on the photon ID score [17], and to be separated from the nearest muon by $0.01 < \Delta R(\mu, \gamma) < 0.8$. Events from the data collected by the CMS experiment during the 2016--2018 LHC data-taking period are considered, corresponding to an integrated luminosity of 1138 fb$ ^{-1} $ The lower panel shows the bin-by-bin ratio of the data to the simulation (MC). The left panel shows the distribution after the first two calibration stages, without the final photon energy scale correction derived from FSR photons. The right panel shows the same distribution after applying the final photon energy scale corrections. The error bands account for the statistical and systematic uncertainties associated with the momentum scale corrections. |
png pdf |
Additional Figure 4-b:
Comparison of the three-body invariant mass distribution in data and simulation for $Z\to\mu\mu\gamma$ events after applying calibrations to the muon momentum [43] and to the photon energy scale. Events are selected by requiring the presence of two muons with opposite charge satisfying tight identification criteria [18]. The leading and subleading muons are required to have a transverse momentum exceeding 20 and 10 GeV, respectively. In addition, the photon is required to have $30 < E^{\gamma}_{\mathrm{T}} < 50$ GeV and $|{\eta^\gamma}| < 1.44$, to pass a loose requirement on the photon ID score [17], and to be separated from the nearest muon by $0.01 < \Delta R(\mu, \gamma) < 0.8$. Events from the data collected by the CMS experiment during the 2016--2018 LHC data-taking period are considered, corresponding to an integrated luminosity of 1138 fb$ ^{-1} $ The lower panel shows the bin-by-bin ratio of the data to the simulation (MC). The left panel shows the distribution after the first two calibration stages, without the final photon energy scale correction derived from FSR photons. The right panel shows the same distribution after applying the final photon energy scale corrections. The error bands account for the statistical and systematic uncertainties associated with the momentum scale corrections. |
png pdf |
Additional Figure 5:
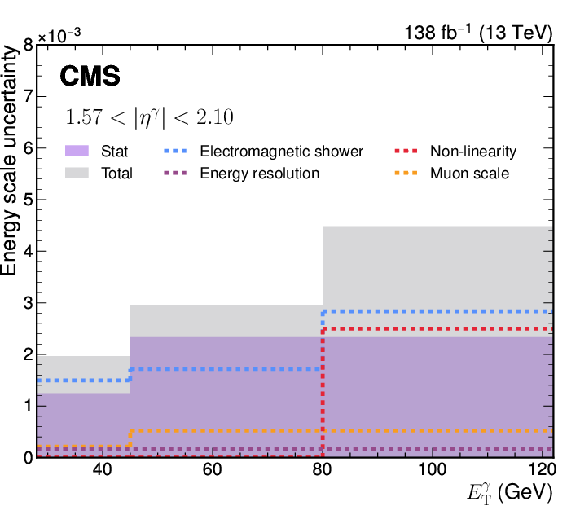
Uncertainties in the energy scale as a function of $E^{\gamma}_{\mathrm{T}}$ of the photon for $1.57 < |{\eta^\gamma}| < 2.10$, derived from $Z\to\mu\mu\gamma$ events. The shaded bands indicate the statistical and total uncertainties, while the dashed lines show the individual contributions from energy resolution, electromagnetic shower modeling, muon momentum scale, and non-linearity. |
png pdf |
Additional Figure 6:
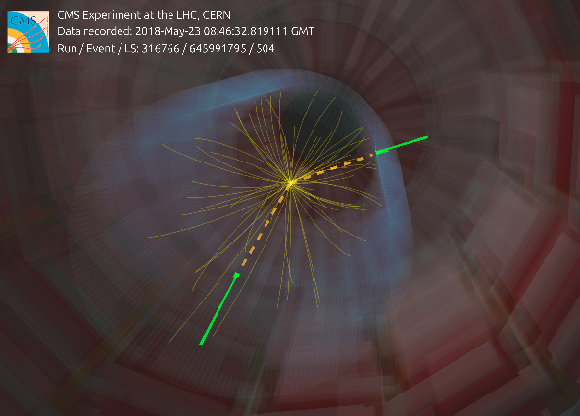
An event in which a candidate Higgs boson decays to two photons. The energy deposits of each photon are represented by the green volumes and the inferred trajectory of the photons are represented by the dashed lines. |
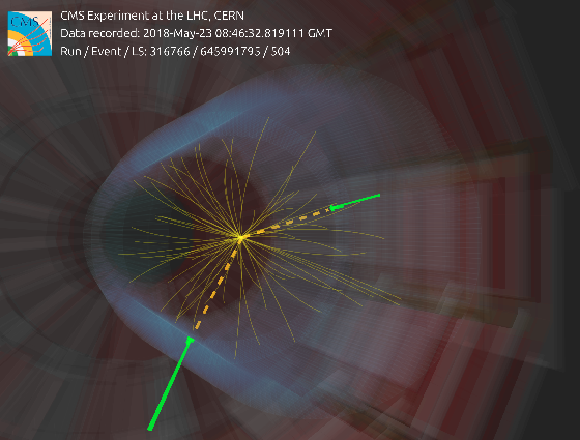
png pdf |
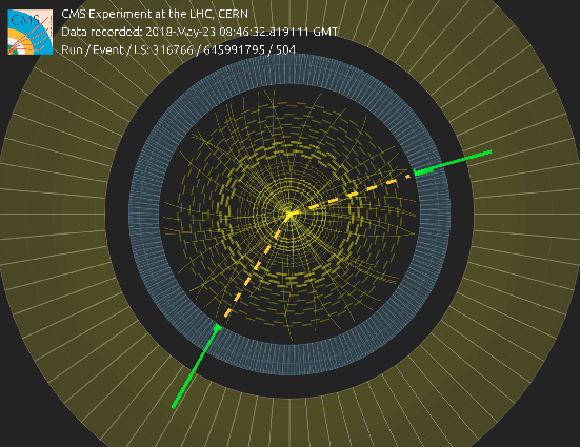
Additional Figure 7:
An event in which a candidate Higgs boson decays to two photons. The energy deposits of each photon are represented by the green volumes and the inferred trajectory of the photons are represented by the dashed lines. |
png pdf |
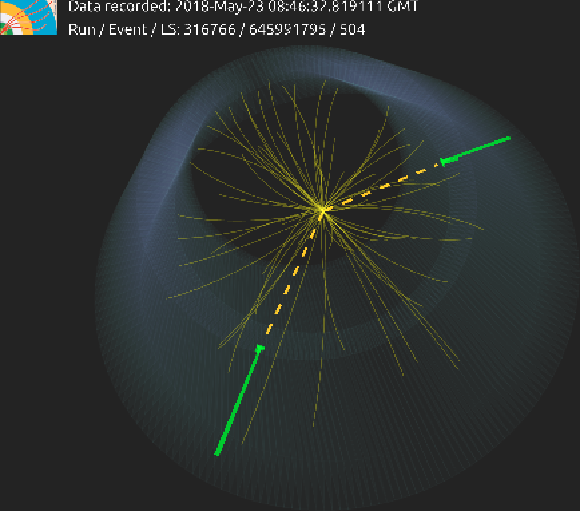
Additional Figure 8:
An event in which a candidate Higgs boson decays to two photons. The energy deposits of each photon are represented by the green volumes and the inferred trajectory of the photons are represented by the dashed lines. |
png pdf |
Additional Figure 9:
An event in which a candidate Higgs boson decays to two photons. The energy deposits of each photon are represented by the green volumes and the inferred trajectory of the photons are represented by the dashed lines. |
| References | ||||
| 1 | ATLAS Collaboration | Observation of a new particle in the search for the standard model Higgs boson with the ATLAS detector at the LHC | PLB 716 (2012) 1 | 1207.7214 |
| 2 | CMS Collaboration | Observation of a new boson at a mass of 125 GeV with the CMS experiment at the LHC | PLB 716 (2012) 30 | CMS-HIG-12-028 1207.7235 |
| 3 | CMS Collaboration | Observation of a new boson with mass near 125 GeV in pp collisions at $ \sqrt{s}= $ 7 and 8 TeV | JHEP 06 (2013) 081 | CMS-HIG-12-036 1303.4571 |
| 4 | T. Markkanen, A. Rajantie, and S. Stopyra | Cosmological aspects of Higgs vacuum metastability | Front. Astron. Space Sci. 5 (2018) 40 | 1809.06923 |
| 5 | J. Erler and M. Schott | Electroweak precision tests of the standard model after the discovery of the Higgs boson | Prog. Part. Nucl. Phys. 106 (2019) 68 | 1902.05142 |
| 6 | A. Sirlin | Radiative corrections in the SU(2)-L $ \times $ U(1) theory: a simple renormalization framework | PRD 22 (1980) 971 | |
| 7 | LHC Higgs Working Group | Handbook of LHC Higgs cross sections: 4. Deciphering the nature of the Higgs sector | Monogr. 2 (2016) 1 | 1610.07922 |
| 8 | ATLAS Collaboration | Combined measurement of the Higgs boson mass from the $ {H}\rightarrow\gamma\gamma $ and $ {H}\rightarrow{Z}{Z}^{*}\rightarrow4\ell $ decay channels with the ATLAS detector using $ \sqrt{s}= $ 7, 8, and 13 TeV pp collision data | PRL 131 (2023) 251802 | 2308.04775 |
| 9 | CMS Collaboration | Observation of the diphoton decay of the Higgs boson and measurement of its properties | EPJC 74 (2014) 3076 | CMS-HIG-13-001 1407.0558 |
| 10 | CMS Collaboration | A measurement of the Higgs boson mass in the diphoton decay channel | PLB 805 (2020) 135425 | CMS-HIG-19-004 2002.06398 |
| 11 | CMS Collaboration | Measurement of the Higgs boson mass and width using the four-lepton final state in proton-proton collisions at $ \sqrt{s} = 13 \textrm{TeV} $ | PRD 111 (2025) 092014 | CMS-HIG-21-019 2409.13663 |
| 12 | CMS Collaboration | The CMS experiment at the CERN LHC | JINST 3 (2008) S08004 | |
| 13 | CMS Collaboration | Development of the CMS detector for the CERN LHC Run 3 | JINST 19 (2024) P05064 | CMS-PRF-21-001 2309.05466 |
| 14 | CMS Collaboration | Performance of the CMS Level-1 trigger in proton-proton collisions at $ \sqrt{s} = $ 13 TeV | JINST 15 (2020) P10017 | CMS-TRG-17-001 2006.10165 |
| 15 | CMS Collaboration | The CMS trigger system | JINST 12 (2017) P01020 | CMS-TRG-12-001 1609.02366 |
| 16 | CMS Collaboration | Performance of the CMS high-level trigger during LHC Run 2 | JINST 19 (2024) P11021 | CMS-TRG-19-001 2410.17038 |
| 17 | CMS Collaboration | Electron and photon reconstruction and identification with the CMS experiment at the CERN LHC | JINST 16 (2021) P05014 | CMS-EGM-17-001 2012.06888 |
| 18 | CMS Collaboration | Performance of the CMS muon detector and muon reconstruction with proton-proton collisions at $ \sqrt{s}= $ 13 TeV | JINST 13 (2018) P06015 | CMS-MUO-16-001 1804.04528 |
| 19 | CMS Collaboration | Description and performance of track and primary-vertex reconstruction with the CMS tracker | JINST 9 (2014) P10009 | CMS-TRK-11-001 1405.6569 |
| 20 | CMS Collaboration | Performance of the CMS electromagnetic calorimeter in pp collisions at $ \sqrt{s} = $ 13 TeV | JINST 19 (2024) P09004 | CMS-EGM-18-002 2403.15518 |
| 21 | Z. Bern, L. Dixon, and C. Schmidt | Isolating a light Higgs boson from the diphoton background at the CERN LHC | PRD 66 (2002) 074018 | hep-ph/0206194 |
| 22 | L. J. Dixon and Y. Li | Bounding the Higgs boson width through interferometry | PRL 111 (2013) 111802 | 1305.3854 |
| 23 | GEANT4 Collaboration | GEANT 4---a simulation toolkit | NIM A 506 (2003) 250 | |
| 24 | F. Couderc, P. Gaigne, and M. Sahin | Lepton and photon energy scale and resolution corrections based on the minimization of an analytical likelihood: IJazZ2.0 | Results Phys. 88 (2026) 108728 | 2602.17300 |
| 25 | CMS Collaboration | Precision luminosity measurement in proton-proton collisions at $ \sqrt{s} = $ 13 TeV in 2015 and 2016 at CMS | EPJC 81 (2021) 800 | CMS-LUM-17-003 2104.01927 |
| 26 | CMS Collaboration | CMS luminosity measurement for the 2017 data-taking period at $ \sqrt{s} = $ 13 TeV | technical report, CERN, Geneva, 2018 CDS |
|
| 27 | CMS Collaboration | CMS luminosity measurement for the 2018 data-taking period at $ \sqrt{s} = $ 13 TeV | technical report, CERN, Geneva, 2019 CDS |
|
| 28 | CMS Collaboration | Measurements of Higgs boson production cross sections and couplings in the diphoton decay channel at $ \sqrt{\mathrm{s}} = $ 13 TeV | JHEP 07 (2021) 027 | CMS-HIG-19-015 2103.06956 |
| 29 | J. Alwall et al. | The automated computation of tree-level and next-to-leading order differential cross sections, and their matching to parton shower simulations | JHEP 07 (2014) 079 | 1405.0301 |
| 30 | T. Sjöstrand et al. | An introduction to PYTHIA 8.2 | Comput. Phys. Commun. 191 (2015) 159 | 1410.3012 |
| 31 | R. Frederix and S. Frixione | Merging meets matching in MC@NLO | JHEP 12 (2012) 061 | 1209.6215 |
| 32 | CMS Collaboration | Extraction and validation of a new set of CMS PYTHIA8 tunes from underlying-event measurements | EPJC 80 (2020) 4 | CMS-GEN-17-001 1903.12179 |
| 33 | E. Bothmann et al. | Event generation with Sherpa 2.2 | SciPost Phys. 7 (2019) 034 | 1905.09127 |
| 34 | CMS Collaboration | Measurements of Higgs boson properties in the diphoton decay channel in proton-proton collisions at $ \sqrt{s} = $ 13 TeV | JHEP 11 (2018) 185 | CMS-HIG-16-040 1804.02716 |
| 35 | CMS Collaboration | Particle-flow reconstruction and global event description with the CMS detector | JINST 12 (2017) P10003 | CMS-PRF-14-001 1706.04965 |
| 36 | G. Battistoni et al. | Overview of the Fluka code | Ann. Nucl. Energy 82 (2015) | |
| 37 | F. Gentit | Litrani: a general purpose Monte-Carlo program simulating light propagation in isotropic or anisotropic media | Nucl. Instrum. Methods Phys. Res. A 485 (2002) | |
| 38 | T. Chen and C. Guestrin | XGBoost: A Scalable Tree Boosting System | link | 1603.02754 |
| 39 | CMS Collaboration | Measurements of $ \text{t}\overline{\text{t}}\text{H} $ production and the CP structure of the Yukawa interaction between the Higgs boson and top quark in the diphoton decay channel | PRL 125 (2020) 061801 | CMS-HIG-19-013 2003.10866 |
| 40 | W. Voigt | Uber das Gesetz der Intensitätsverteilung innerhalb der Linien eines Gasspektrums | Sitzungsber. Bayer. Akad. Wiss., Math.-, 1912 Phys. Kl. 60 (1912) 3 |
|
| 41 | P. D. Dauncey, M. Kenzie, N. Wardle, and G. J. Davies | Handling uncertainties in background shapes: the discrete profiling method | JINST 10 (2015) P04015 | 1408.6865 |
| 42 | R. A. Fisher | On the interpretation of $ \chi^2 $ from contingency tables, and the calculation of P | J. R. Stat. Soc. 85 (1922) 87 | |
| 43 | A. Bodek et al. | Extracting muon momentum scale corrections for hadron collider experiments | EPJC 72 (2012) 2194 | 1208.3710 |
| 44 | T. Junk | Confidence level computation for combining searches with small statistics | NIM A 434 (1999) 435 | hep-ex/9902006 |
| 45 | A. L. Read | Presentation of search results: the CLs technique | JPG 28 (2002) 2693 | |
| 46 | G. Cowan, K. Cranmer, E. Gross, and O. Vitells | Asymptotic formulae for likelihood-based tests of new physics | EPJC 71 (2011) 1554 | 1007.1727 |
| 47 | CMS Collaboration | The CMS statistical analysis and combination tool: Combine | Comput. Softw. Big Sci. 8 (2024) 19 | CMS-CAT-23-001 2404.06614 |
| 48 | CMS Collaboration | HEPData record for this analysis | link | |
|
|
Compact Muon Solenoid LHC, CERN |

|

|

|

|

|

|