

Compact Muon Solenoid
LHC, CERN
| CMS-EXO-25-010 ; CERN-EP-2025-301 | ||
| Search for heavy long-lived charged particles with level-1 trigger scouting data from proton-proton collisions at $ \sqrt{s} = $ 13.6 TeV | ||
| CMS Collaboration | ||
| 27 January 2026 | ||
| Accepted for publication in Physics Letters B | ||
| Abstract: A search for heavy long-lived charged particles at the LHC is presented. Particles interacting with the CMS muon detector across several bunch crossings are searched for using a data sample of proton-proton collisions at $ \sqrt{s}= $ 13.6 TeV collected with the CMS detector in 2024, corresponding to an integrated luminosity of 3.7 fb$ ^{-1} $. This is the first search relying on the novel level-1 trigger scouting data set collected without any trigger selection, allowing correlations between bunch crossings to be analyzed. The results are interpreted as upper limits on the cross sections of several benchmark processes with pair production of heavy long-lived charged particles. Upper limits on the fiducial cross section of a heavy long-lived charged particle with $ p_{\mathrm{T}} > $ 500 GeV and $ |\eta| < $ 0.83 are also set in different ranges of $ \beta=v/c $. This analysis is a crucial proof of concept for the level-1 trigger data scouting system and complements existing searches for heavy long-lived charged particles by extending the sensitivity to lower $ \beta $ values. | ||
| Links: e-print arXiv:2601.20063 [hep-ex] (PDF) ; CDS record ; inSPIRE record ; Physics Briefing ; CADI line (restricted) ; | ||
| Figures | |
png pdf |
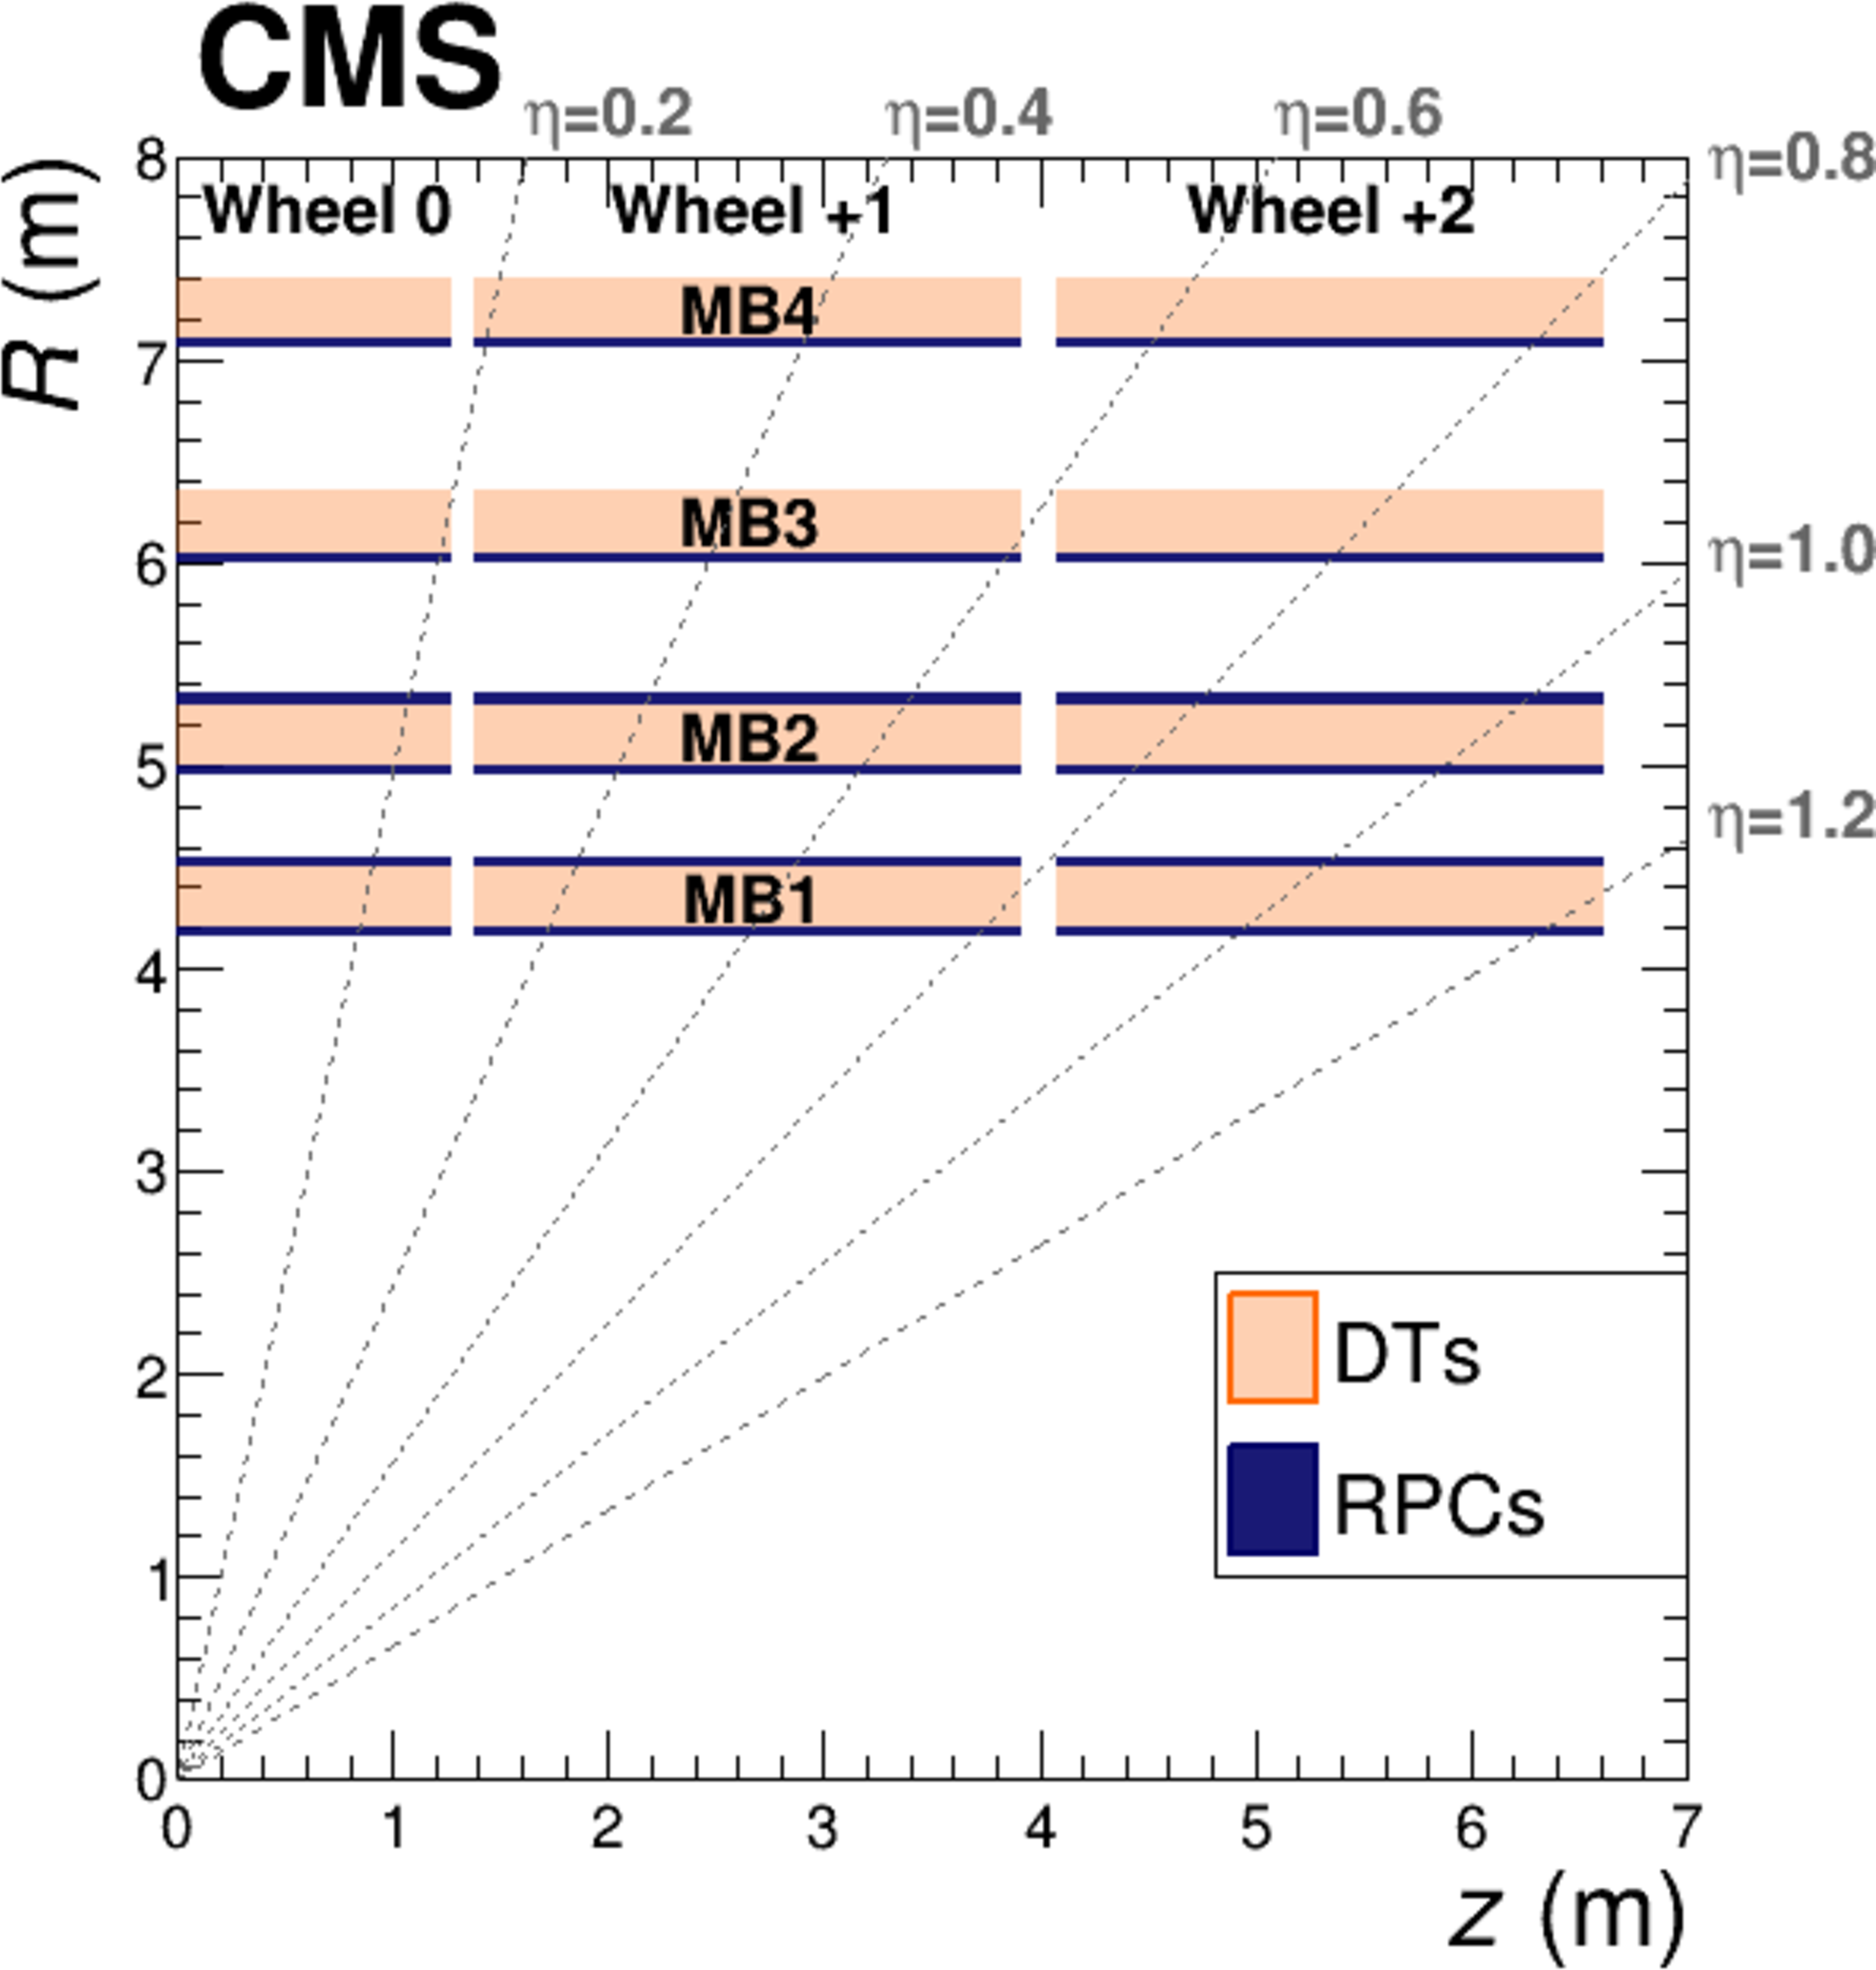
Figure 1:
The $ R $--$ z $ projection of a quarter of the CMS barrel muon system, where $ R $ is the radial distance from the beamline. |
png pdf |
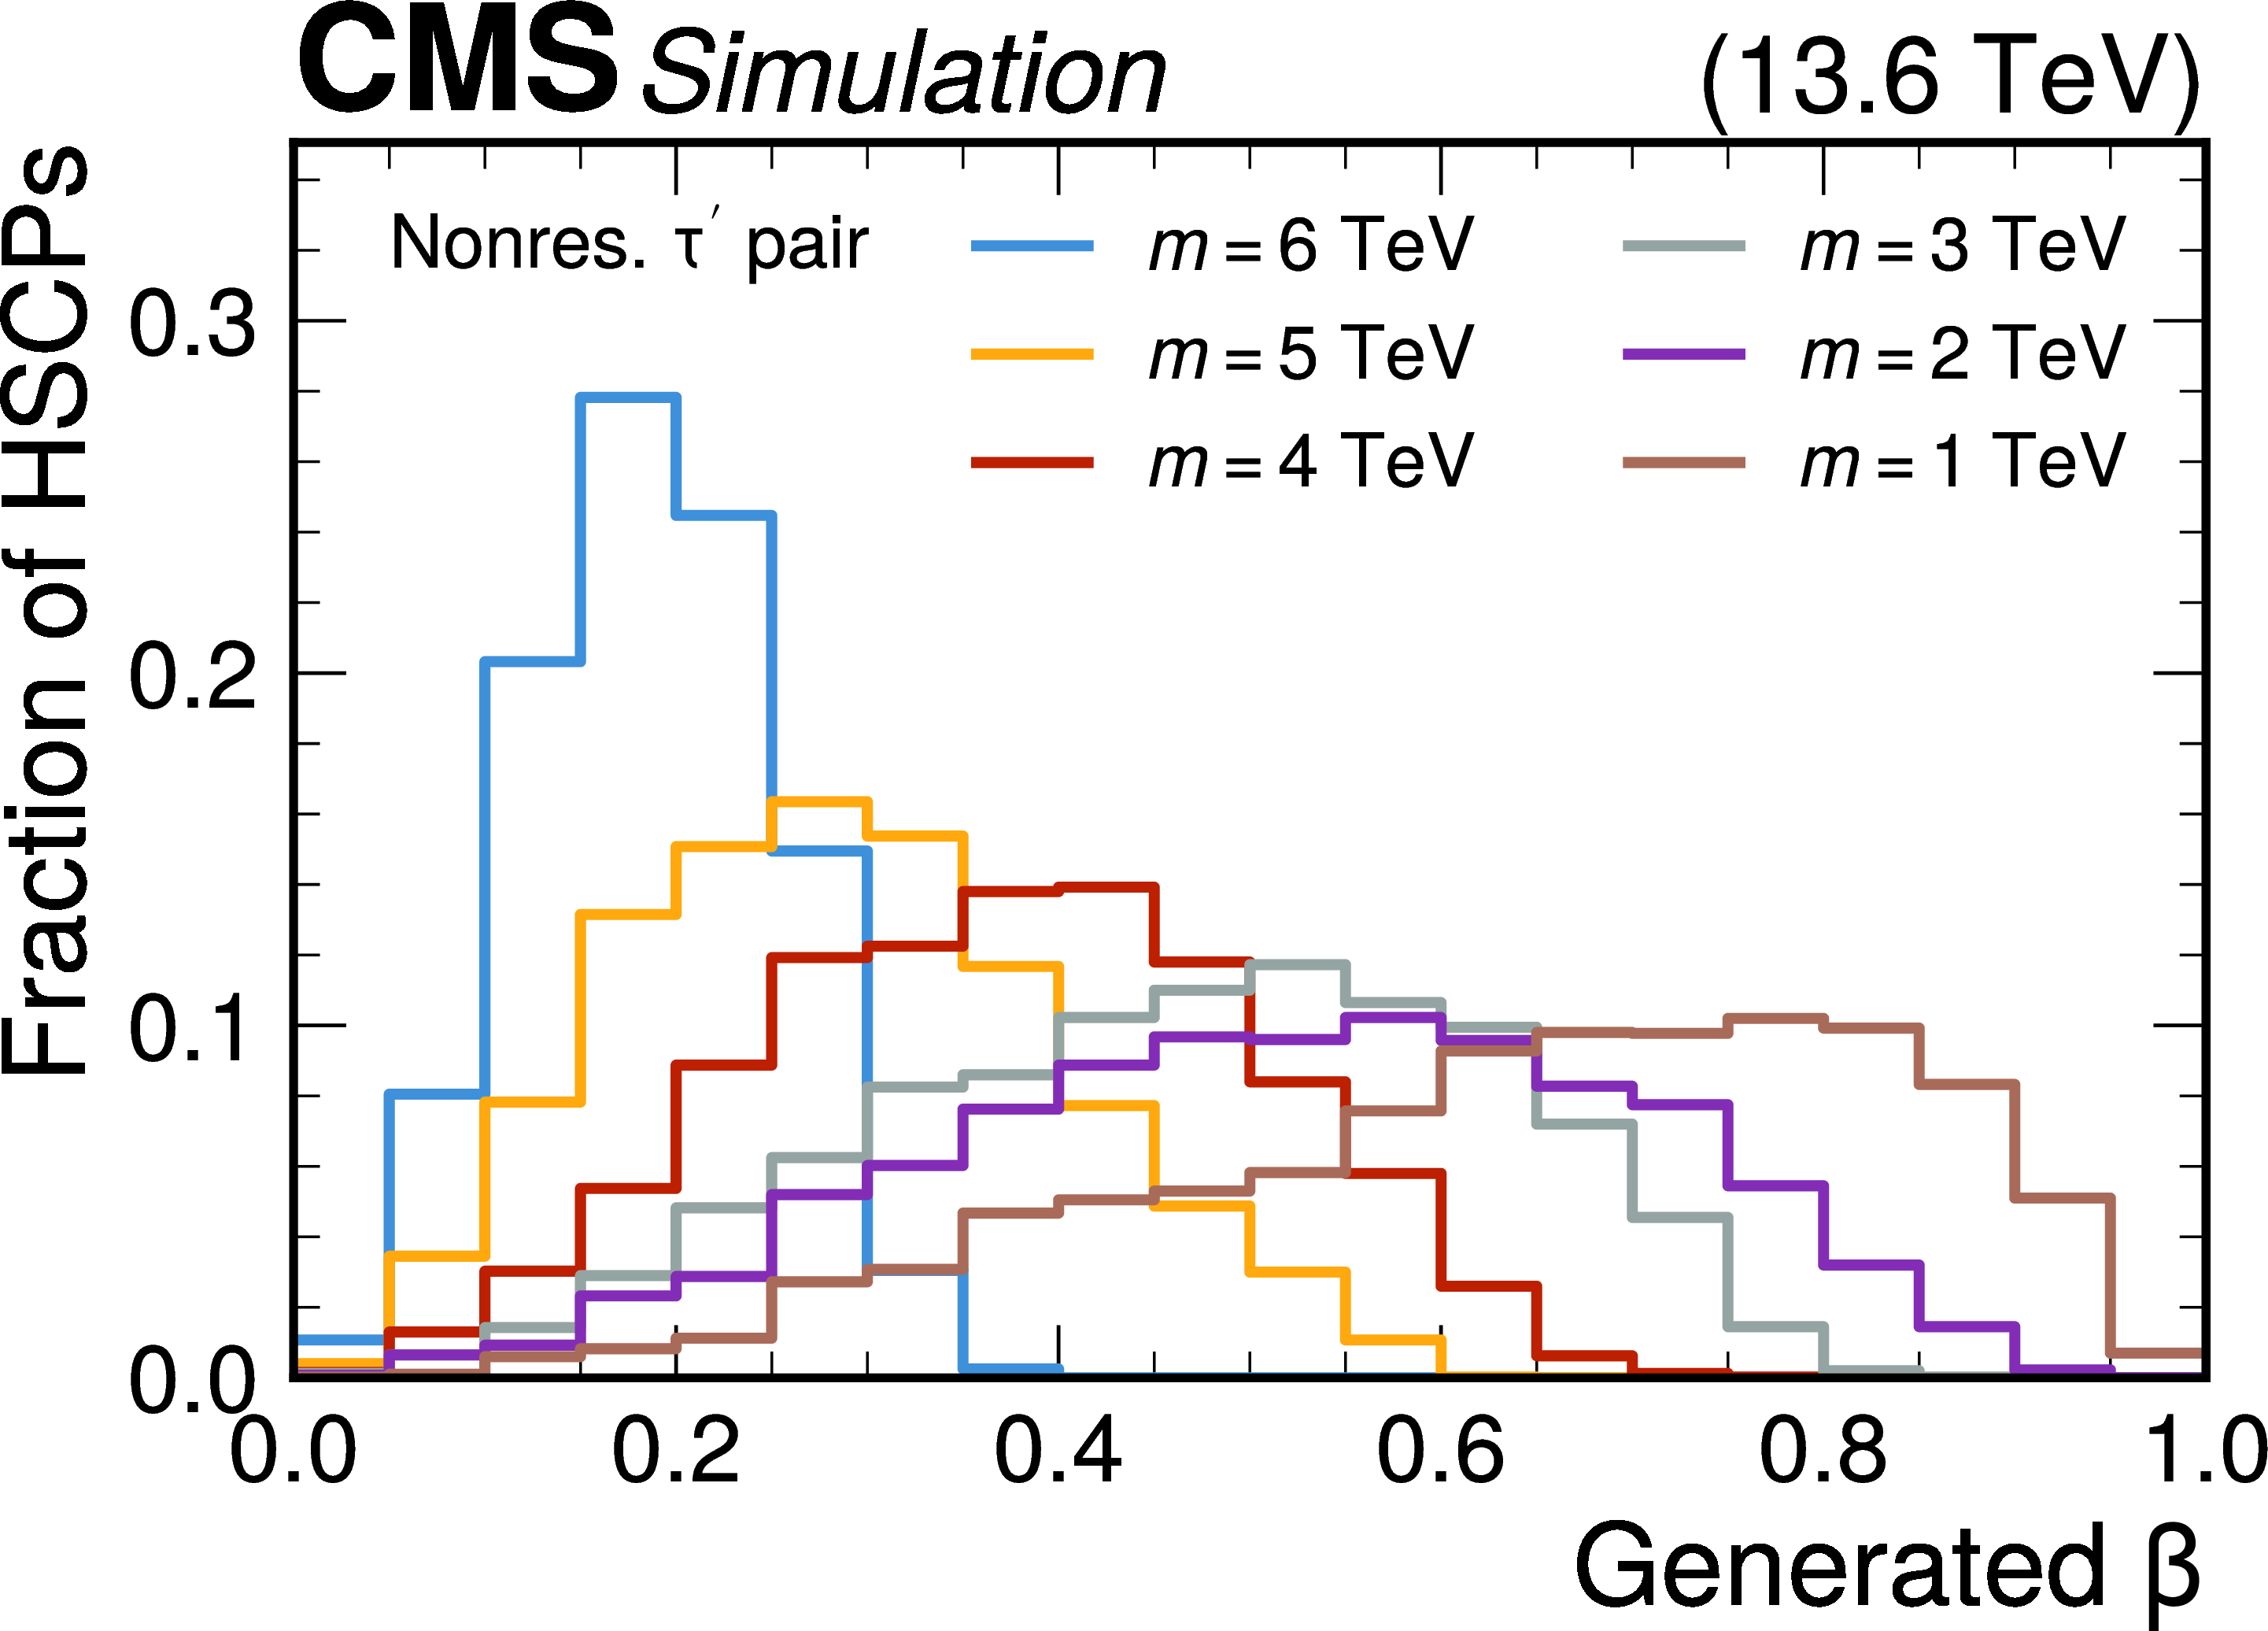
Figure 2:
Generated $ \beta $ distributions of the fourth-generation $ \tau^{'} $ leptons from nonresonant DY production, for various $ \tau^{'} $ masses $ m $. The histograms are normalized to unity. |
png pdf |
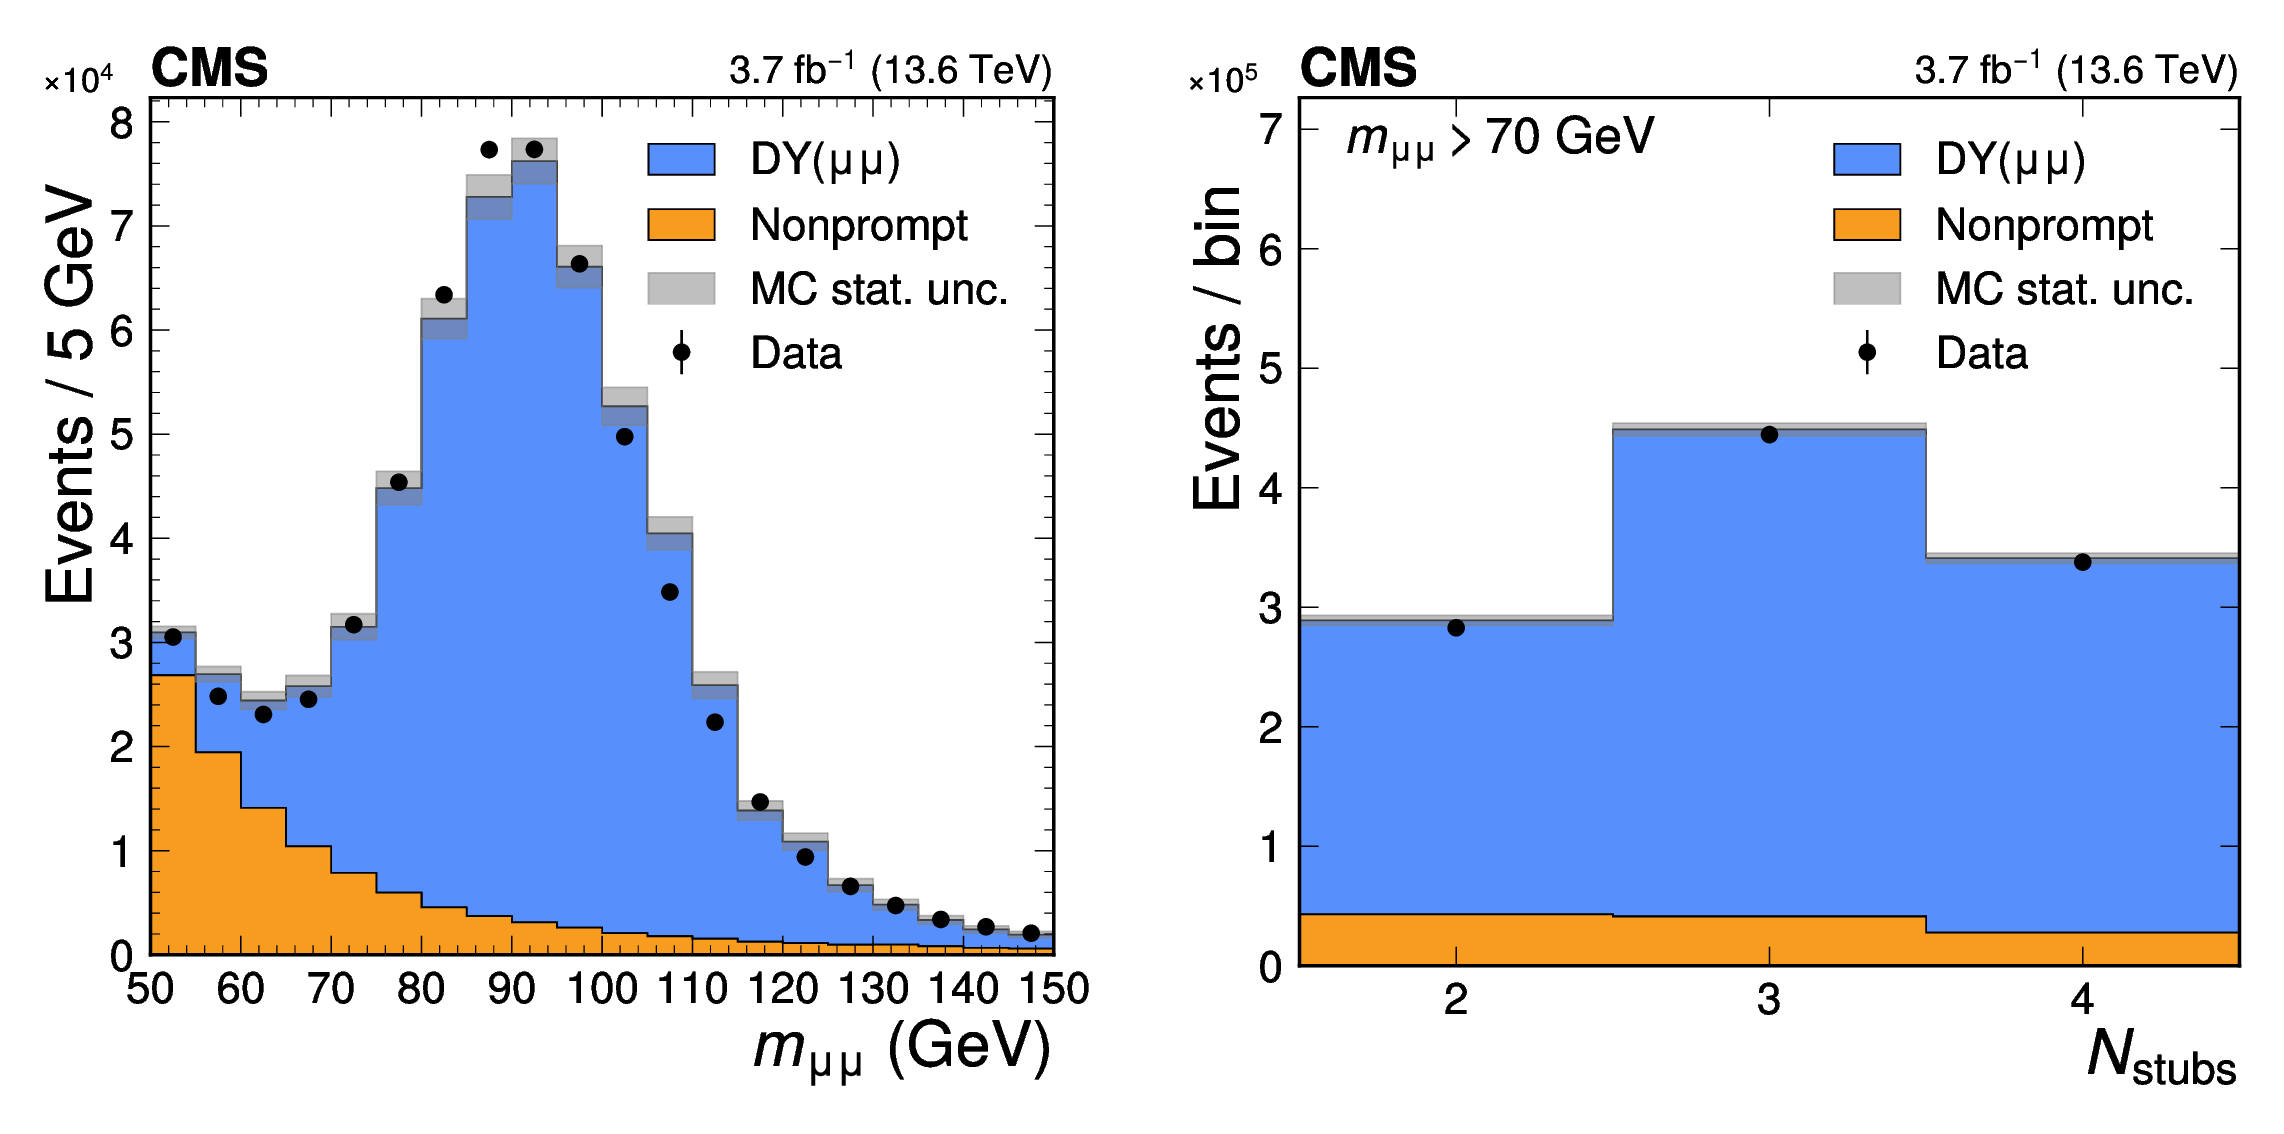
Figure 3:
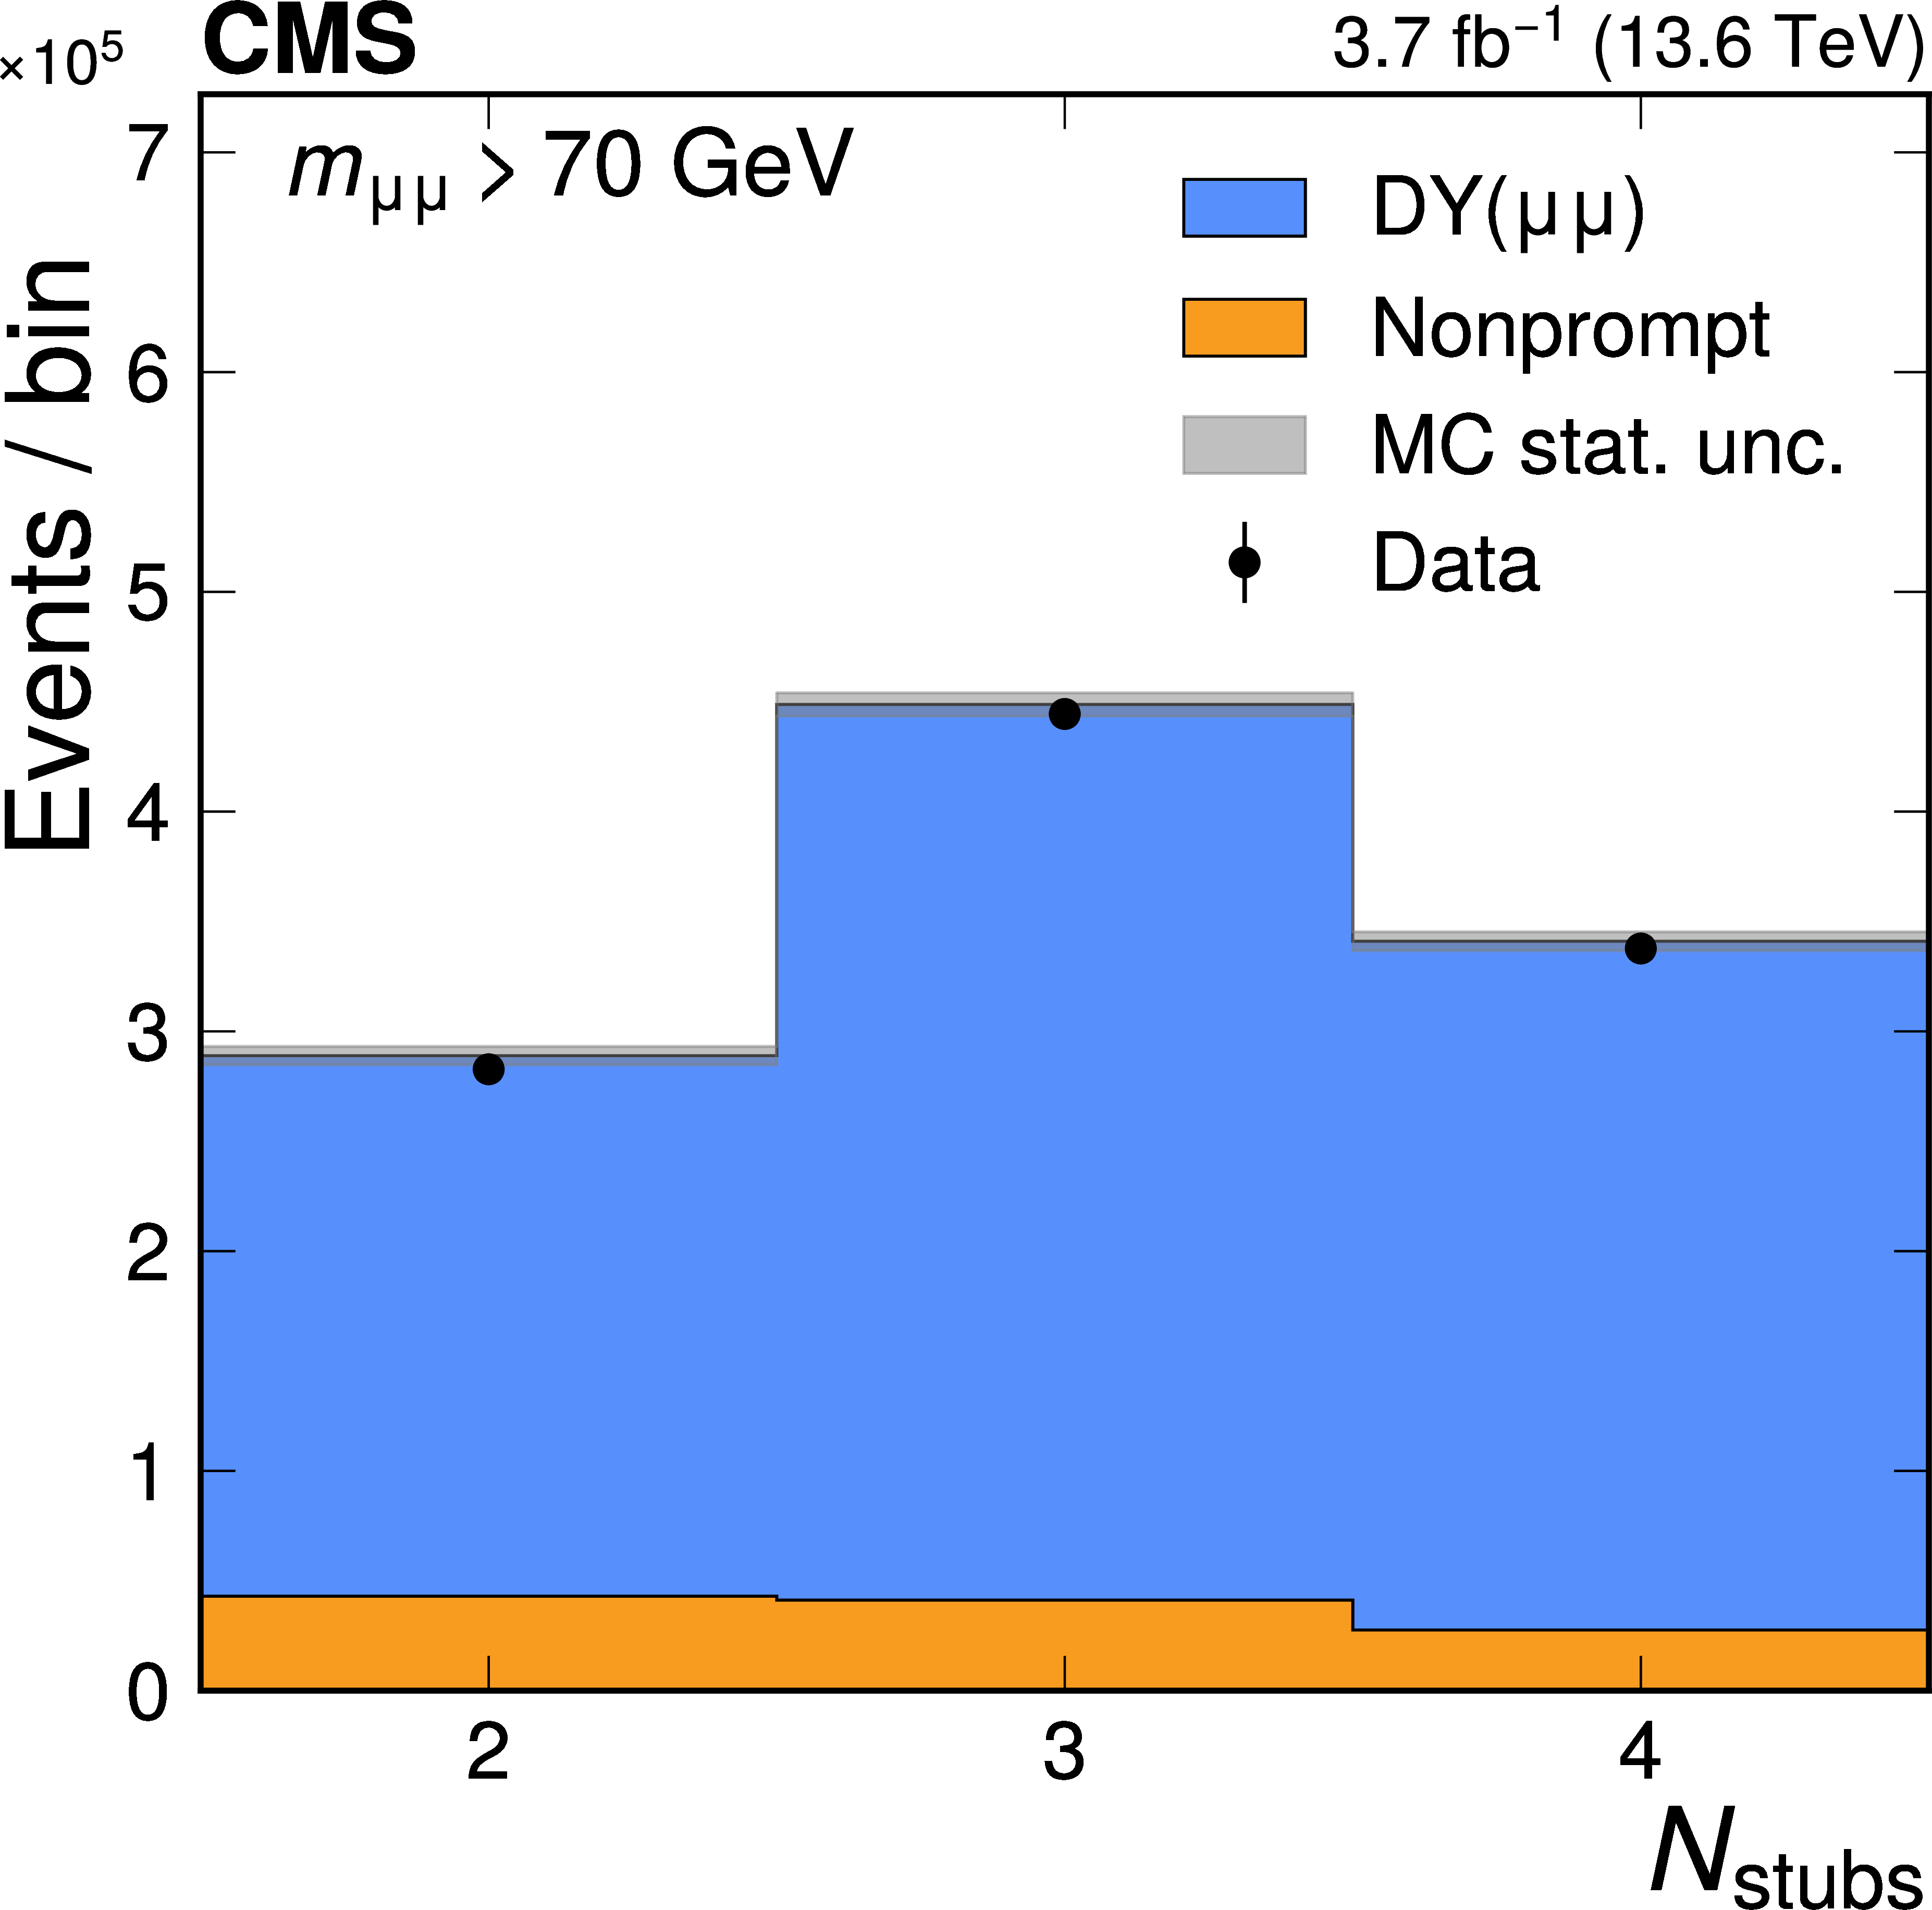
Distributions of the dimuon invariant mass (left) and per-track stub multiplicity (right) for events with two opposite-sign modified kBMTF tracks reconstructed from individual stubs in the same or different BXs. The invariant mass is required to be greater than 70 GeV in the stub multiplicity distributions to increase the purity. The muons are selected with $ p_{\mathrm{T}} > $ 15 GeV and $ |\eta| < $ 0.83. The nonprompt-background contribution is estimated by rescaling the data with two same-sign modified kBMTF tracks. The statistical uncertainty is indicated in the gray shaded area. The agreement between simulation and data is good by construction since the efficiency, energy scale, and energy smearing corrections derived from the same events have been applied. |
png pdf |
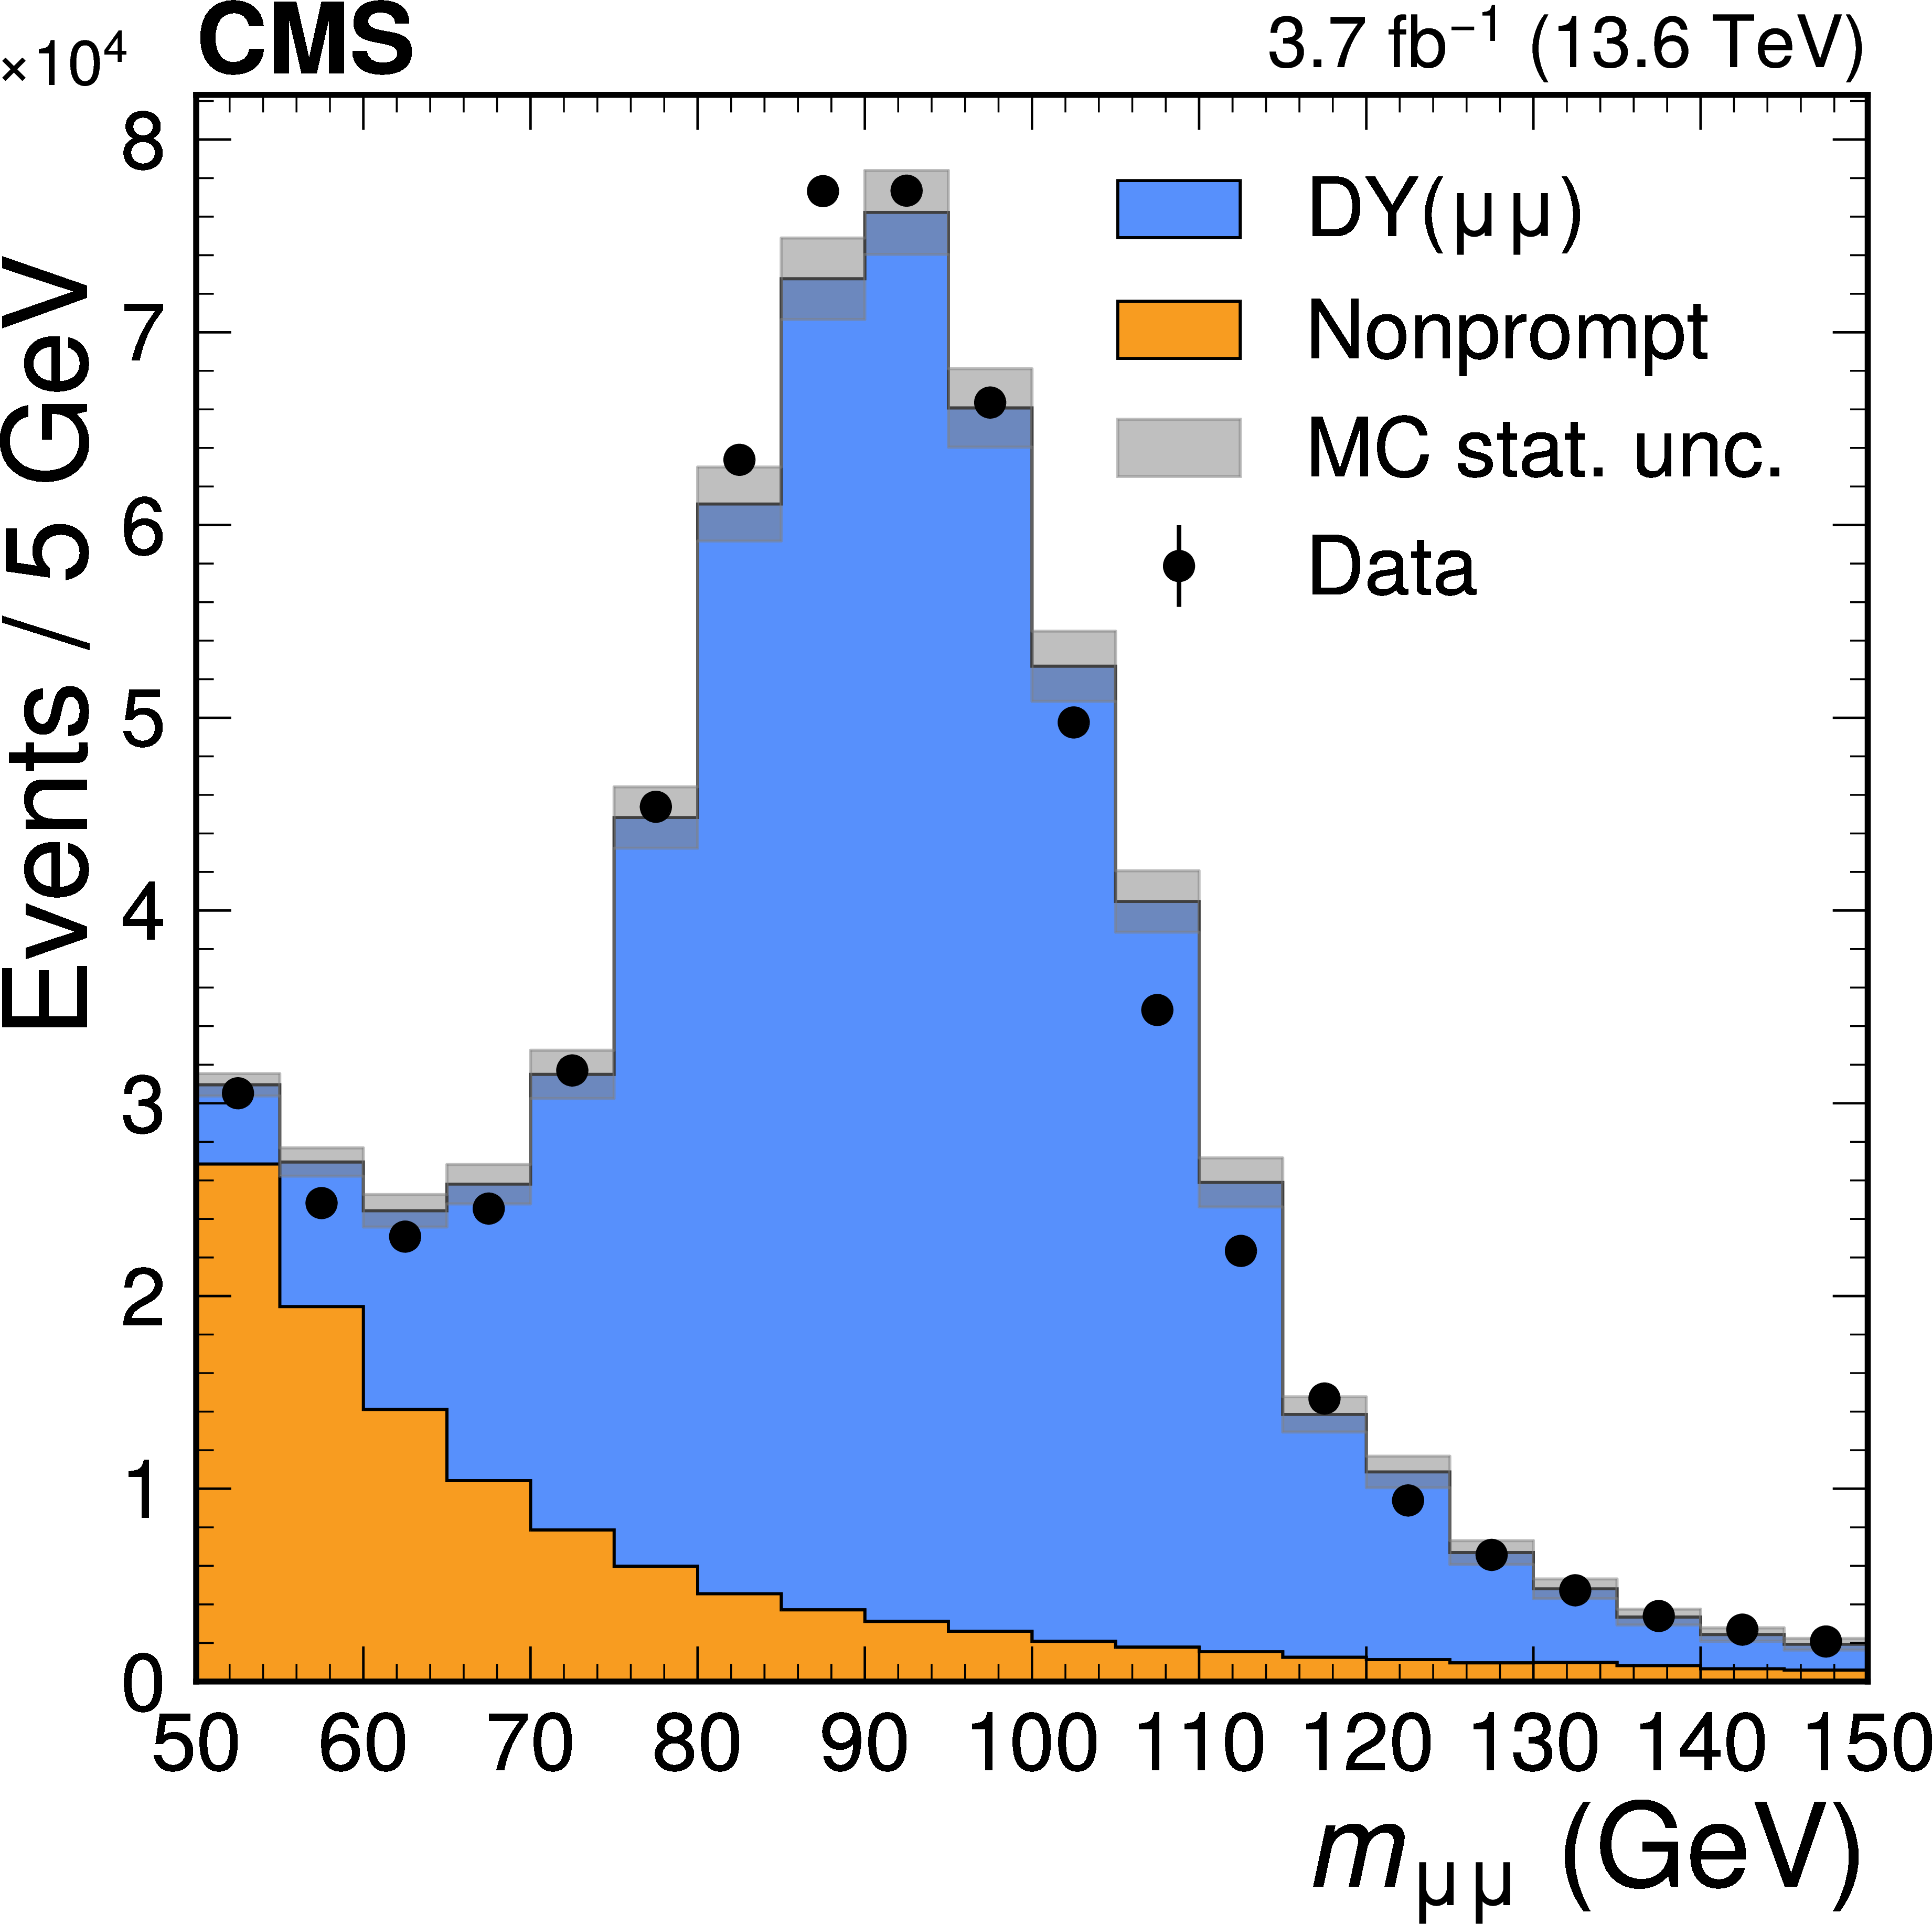
Figure 3-a:
Distributions of the dimuon invariant mass (left) and per-track stub multiplicity (right) for events with two opposite-sign modified kBMTF tracks reconstructed from individual stubs in the same or different BXs. The invariant mass is required to be greater than 70 GeV in the stub multiplicity distributions to increase the purity. The muons are selected with $ p_{\mathrm{T}} > $ 15 GeV and $ |\eta| < $ 0.83. The nonprompt-background contribution is estimated by rescaling the data with two same-sign modified kBMTF tracks. The statistical uncertainty is indicated in the gray shaded area. The agreement between simulation and data is good by construction since the efficiency, energy scale, and energy smearing corrections derived from the same events have been applied. |
png pdf |
Figure 3-b:
Distributions of the dimuon invariant mass (left) and per-track stub multiplicity (right) for events with two opposite-sign modified kBMTF tracks reconstructed from individual stubs in the same or different BXs. The invariant mass is required to be greater than 70 GeV in the stub multiplicity distributions to increase the purity. The muons are selected with $ p_{\mathrm{T}} > $ 15 GeV and $ |\eta| < $ 0.83. The nonprompt-background contribution is estimated by rescaling the data with two same-sign modified kBMTF tracks. The statistical uncertainty is indicated in the gray shaded area. The agreement between simulation and data is good by construction since the efficiency, energy scale, and energy smearing corrections derived from the same events have been applied. |
png pdf |
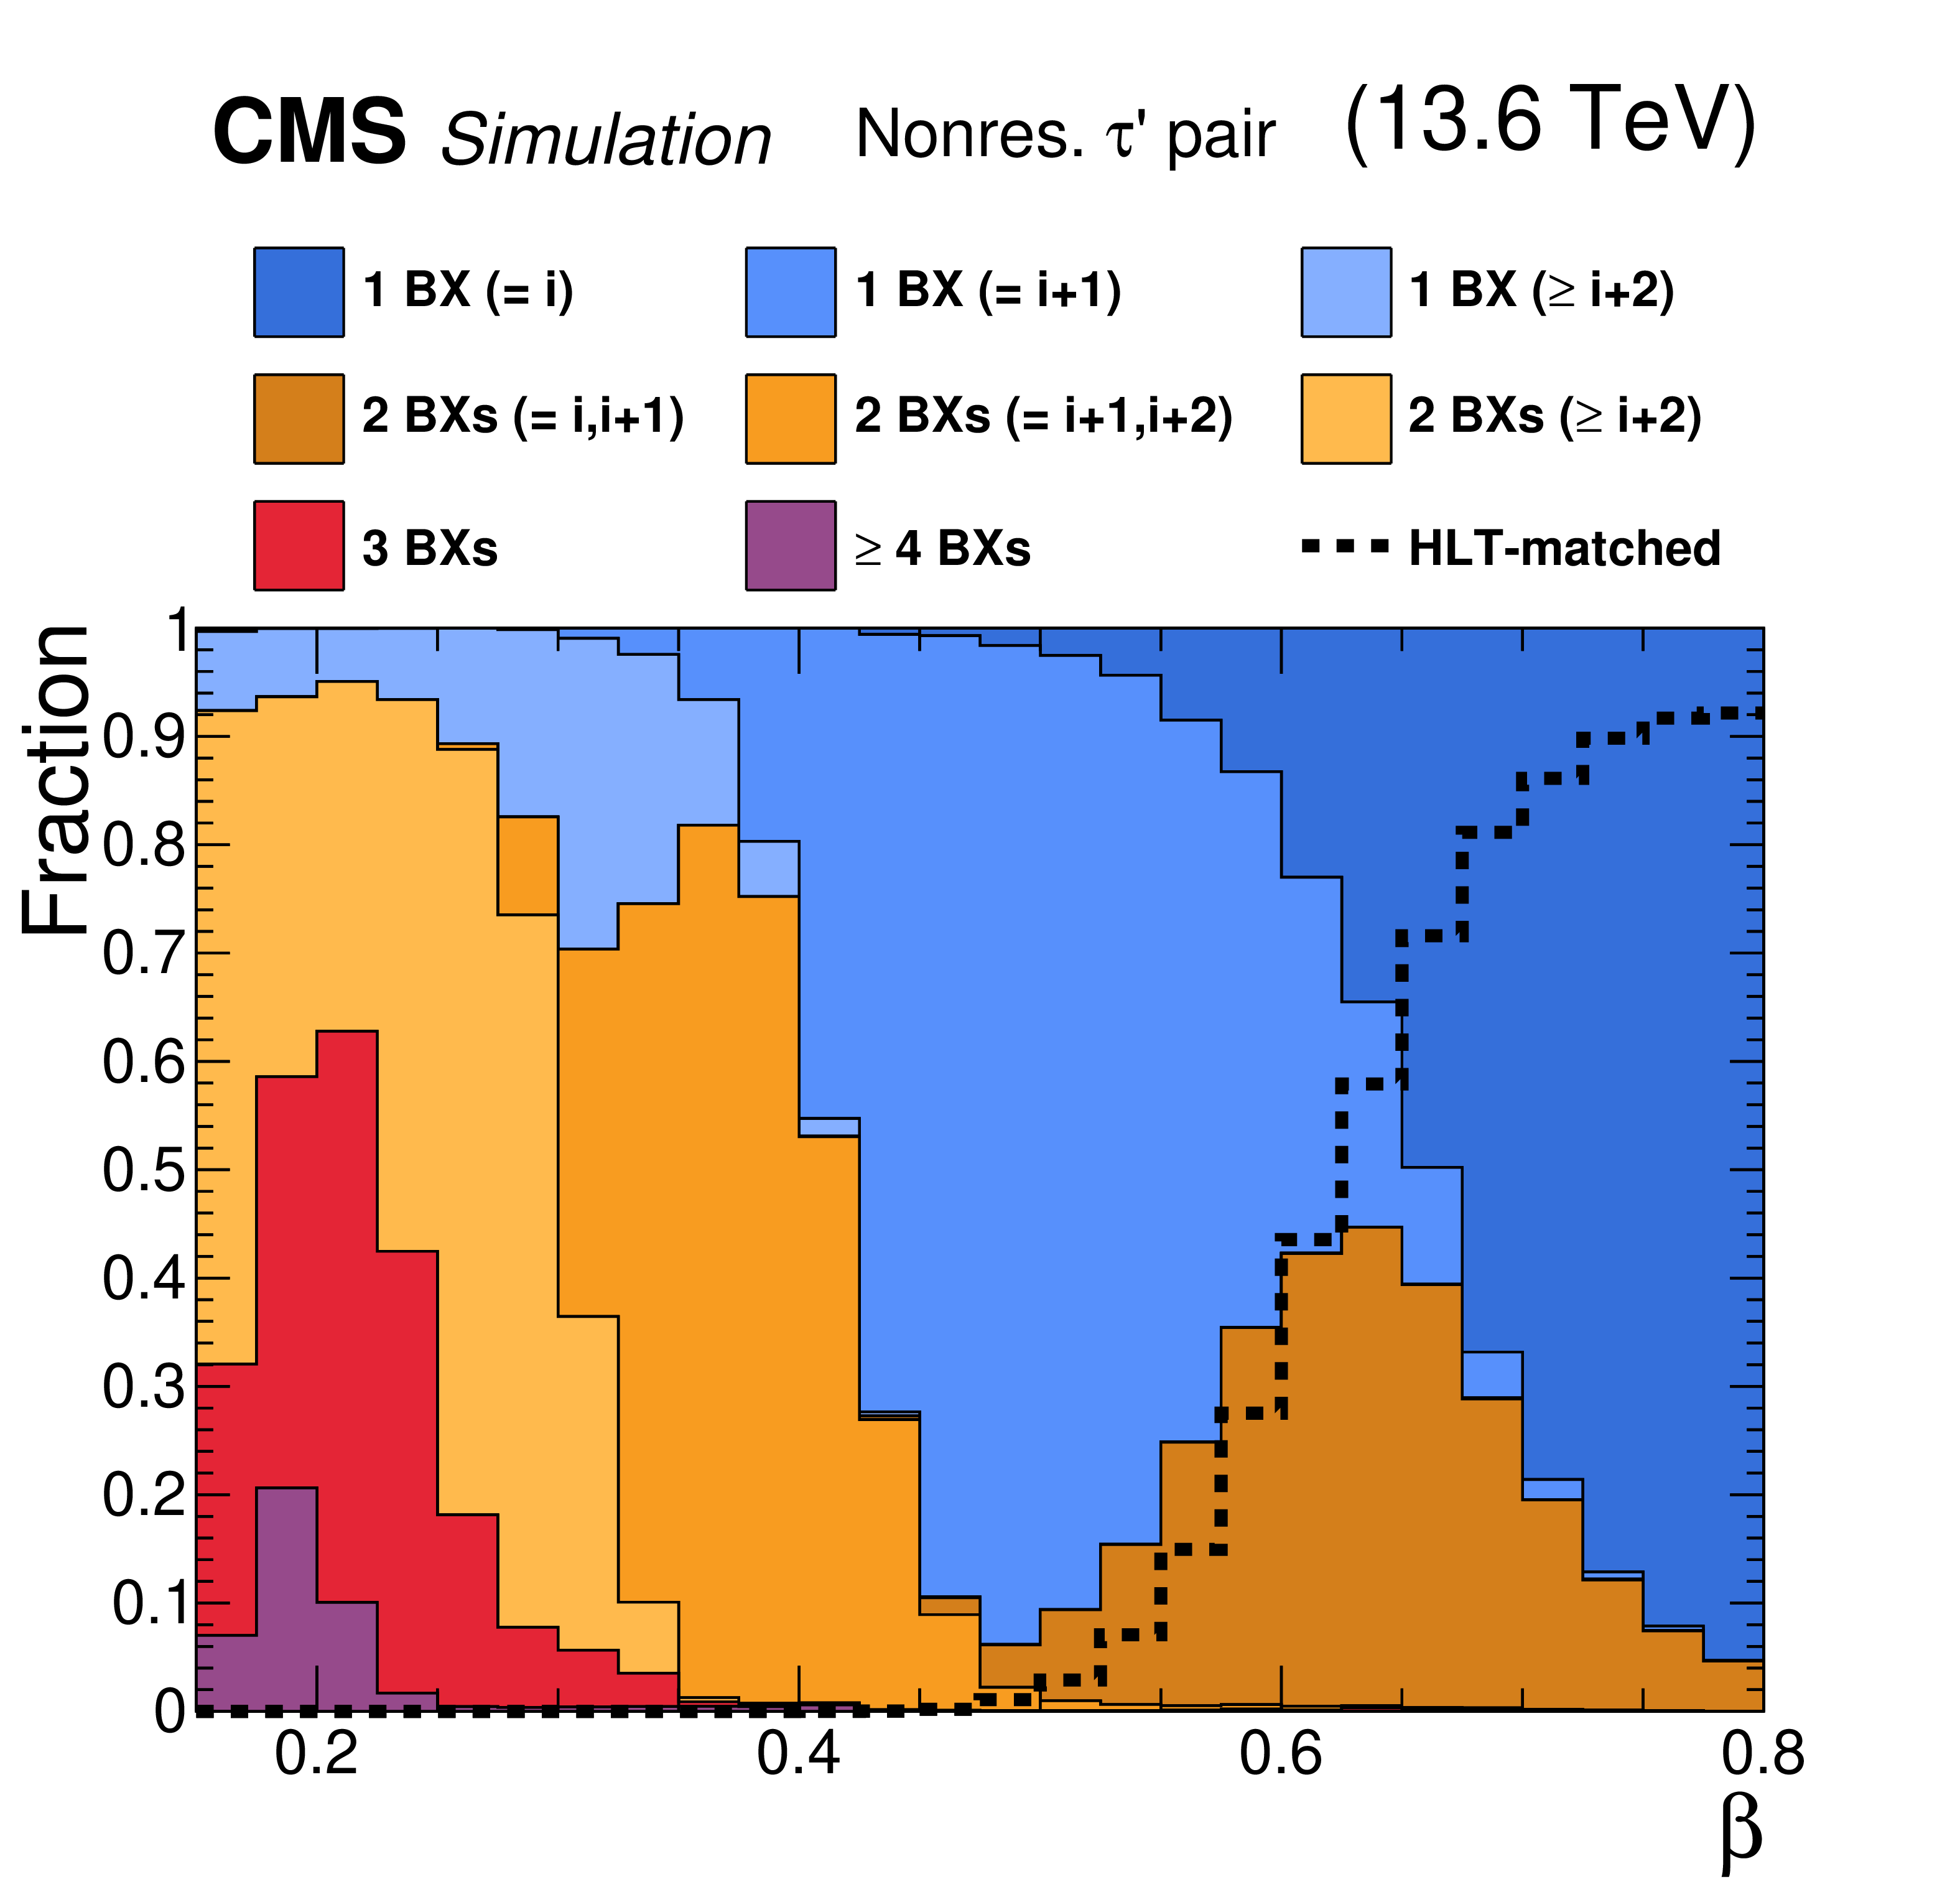
Figure 4:
Fractions of the BX signatures of tracks reconstructed with the modified kBMTF algorithm as functions of the generated particle $ \beta $. This figure corresponds to the nonresonant fourth-generation lepton signal model with a mixture of HSCP masses between 1 and 6 TeV. The filled histograms are stacked to sum to unity. The blue histograms correspond to tracks reconstructed in a single BX. Different shades represent different BXs with respect to the collision BX ($ \mathrm{BX} = i $), as indicated in parentheses in the legend. The orange histograms correspond to tracks reconstructed over 2 BXs, with different shades corresponding to different BXs with respect to the collision BX. Different shades of the same color are indistinguishable experimentally since the production BX cannot be determined. The red and purple histograms represent tracks reconstructed over 3 or at least 4 BXs, respectively. The dashed line indicates the efficiency for the reconstructed tracks to satisfy the single-muon HLT selection. For $ \beta < $ 0.15, the efficiency goes to zero because the particles get stopped in the detector. For $ \beta > $ 0.8, the particles are increasingly reconstructed in the same BX and the HLT selection is fully efficient. |
png pdf |
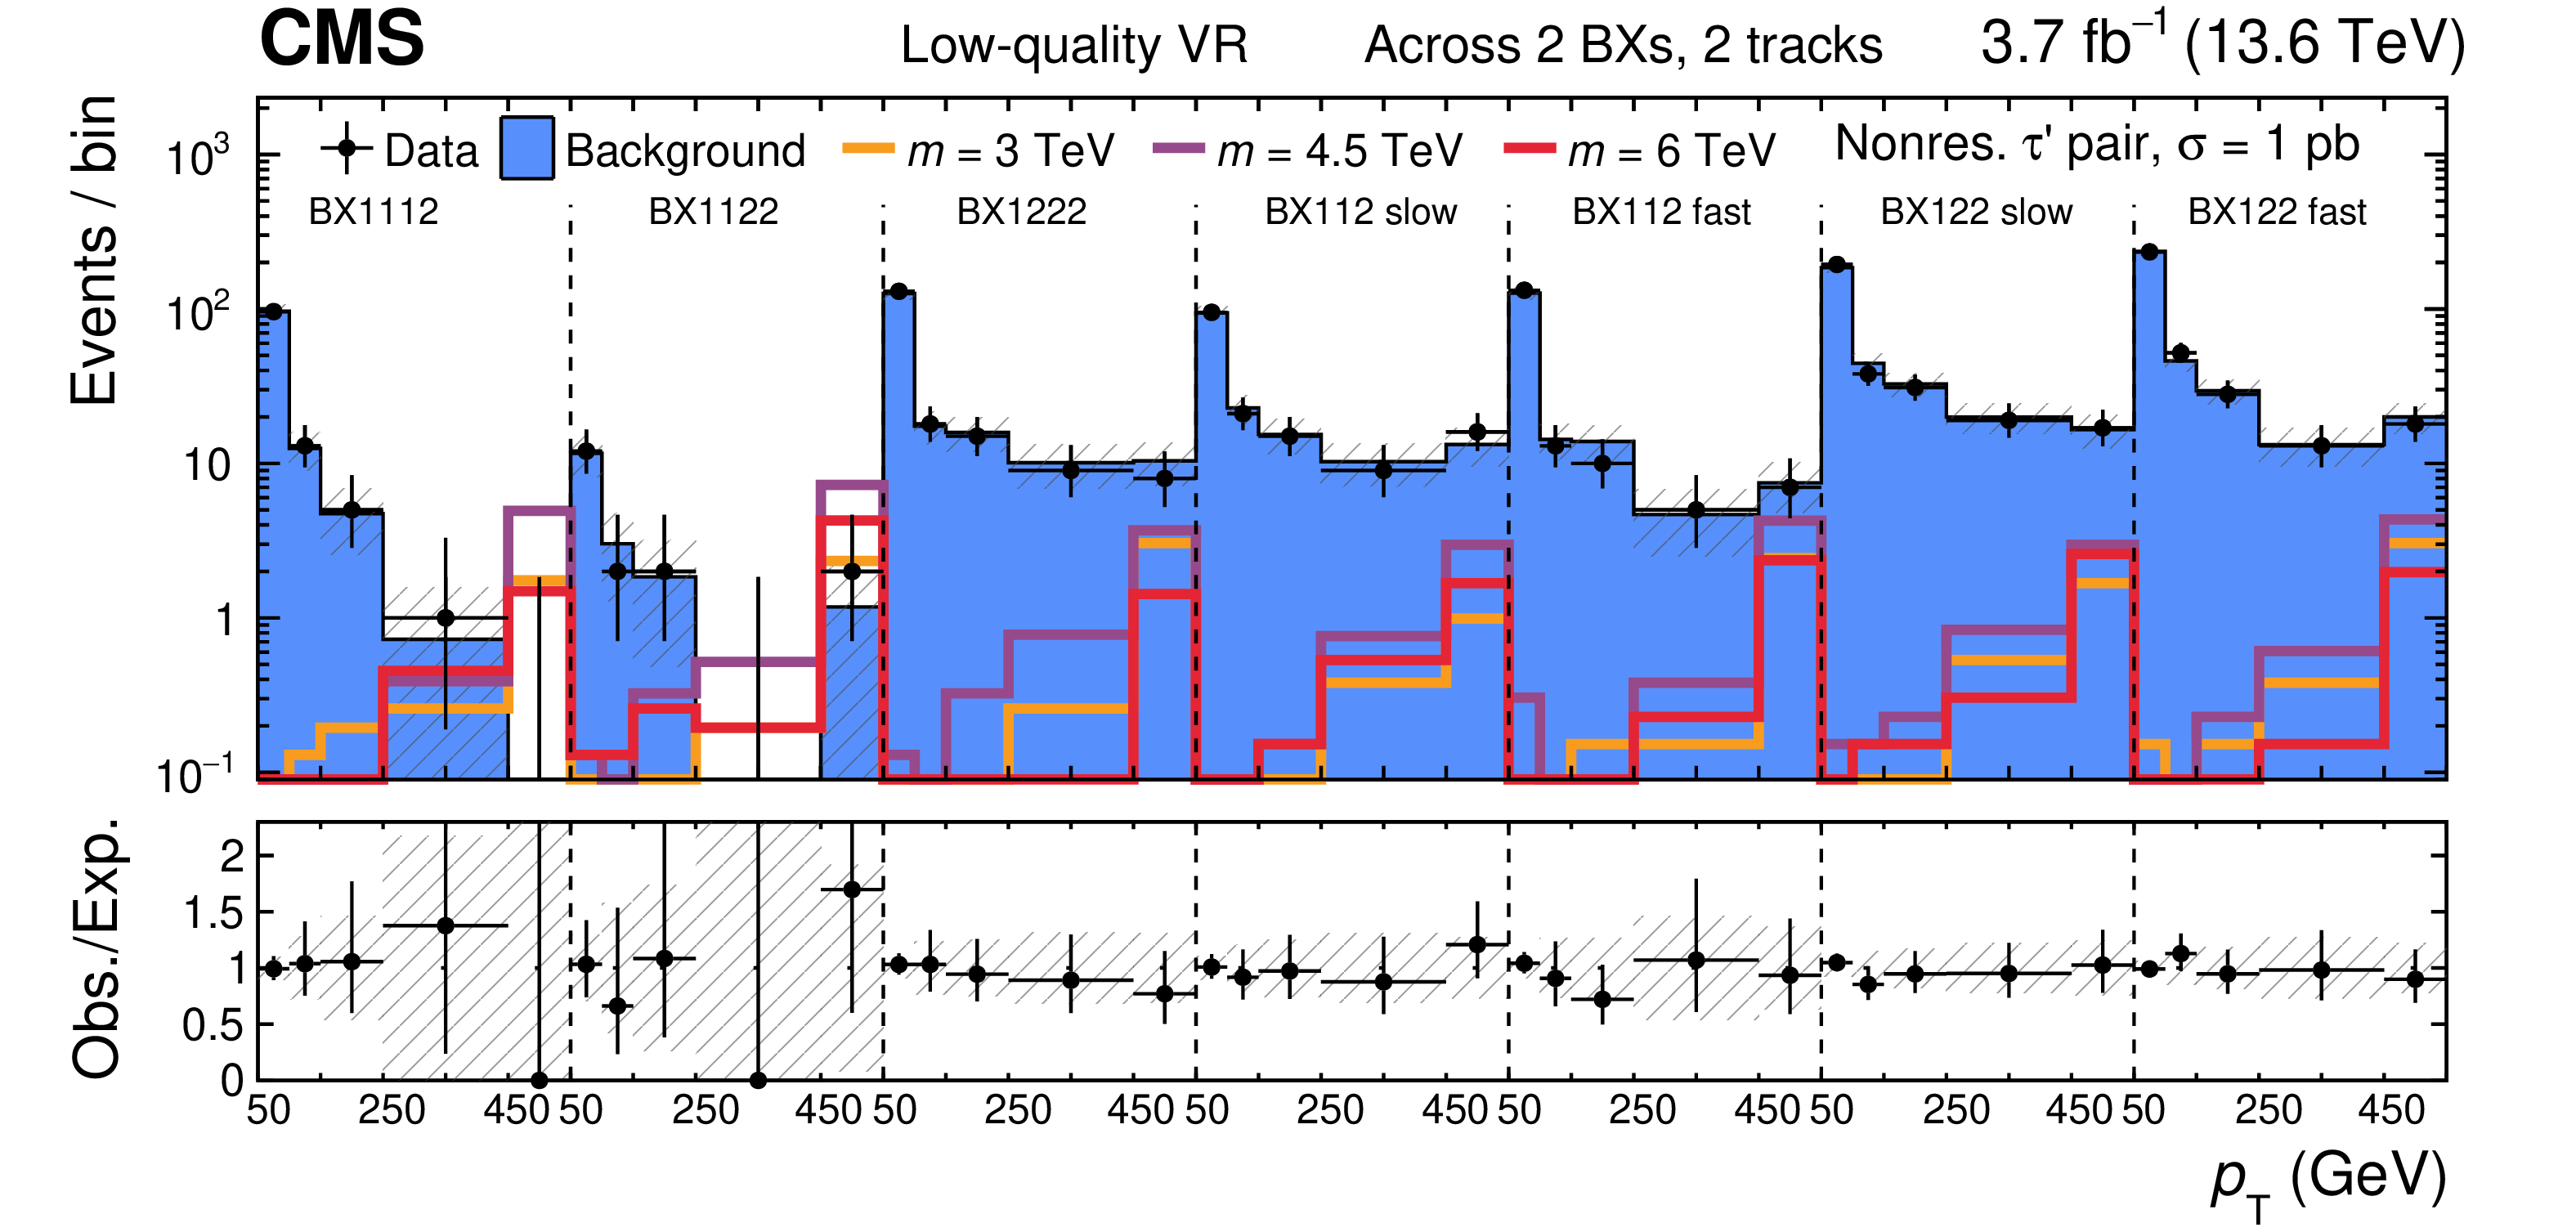
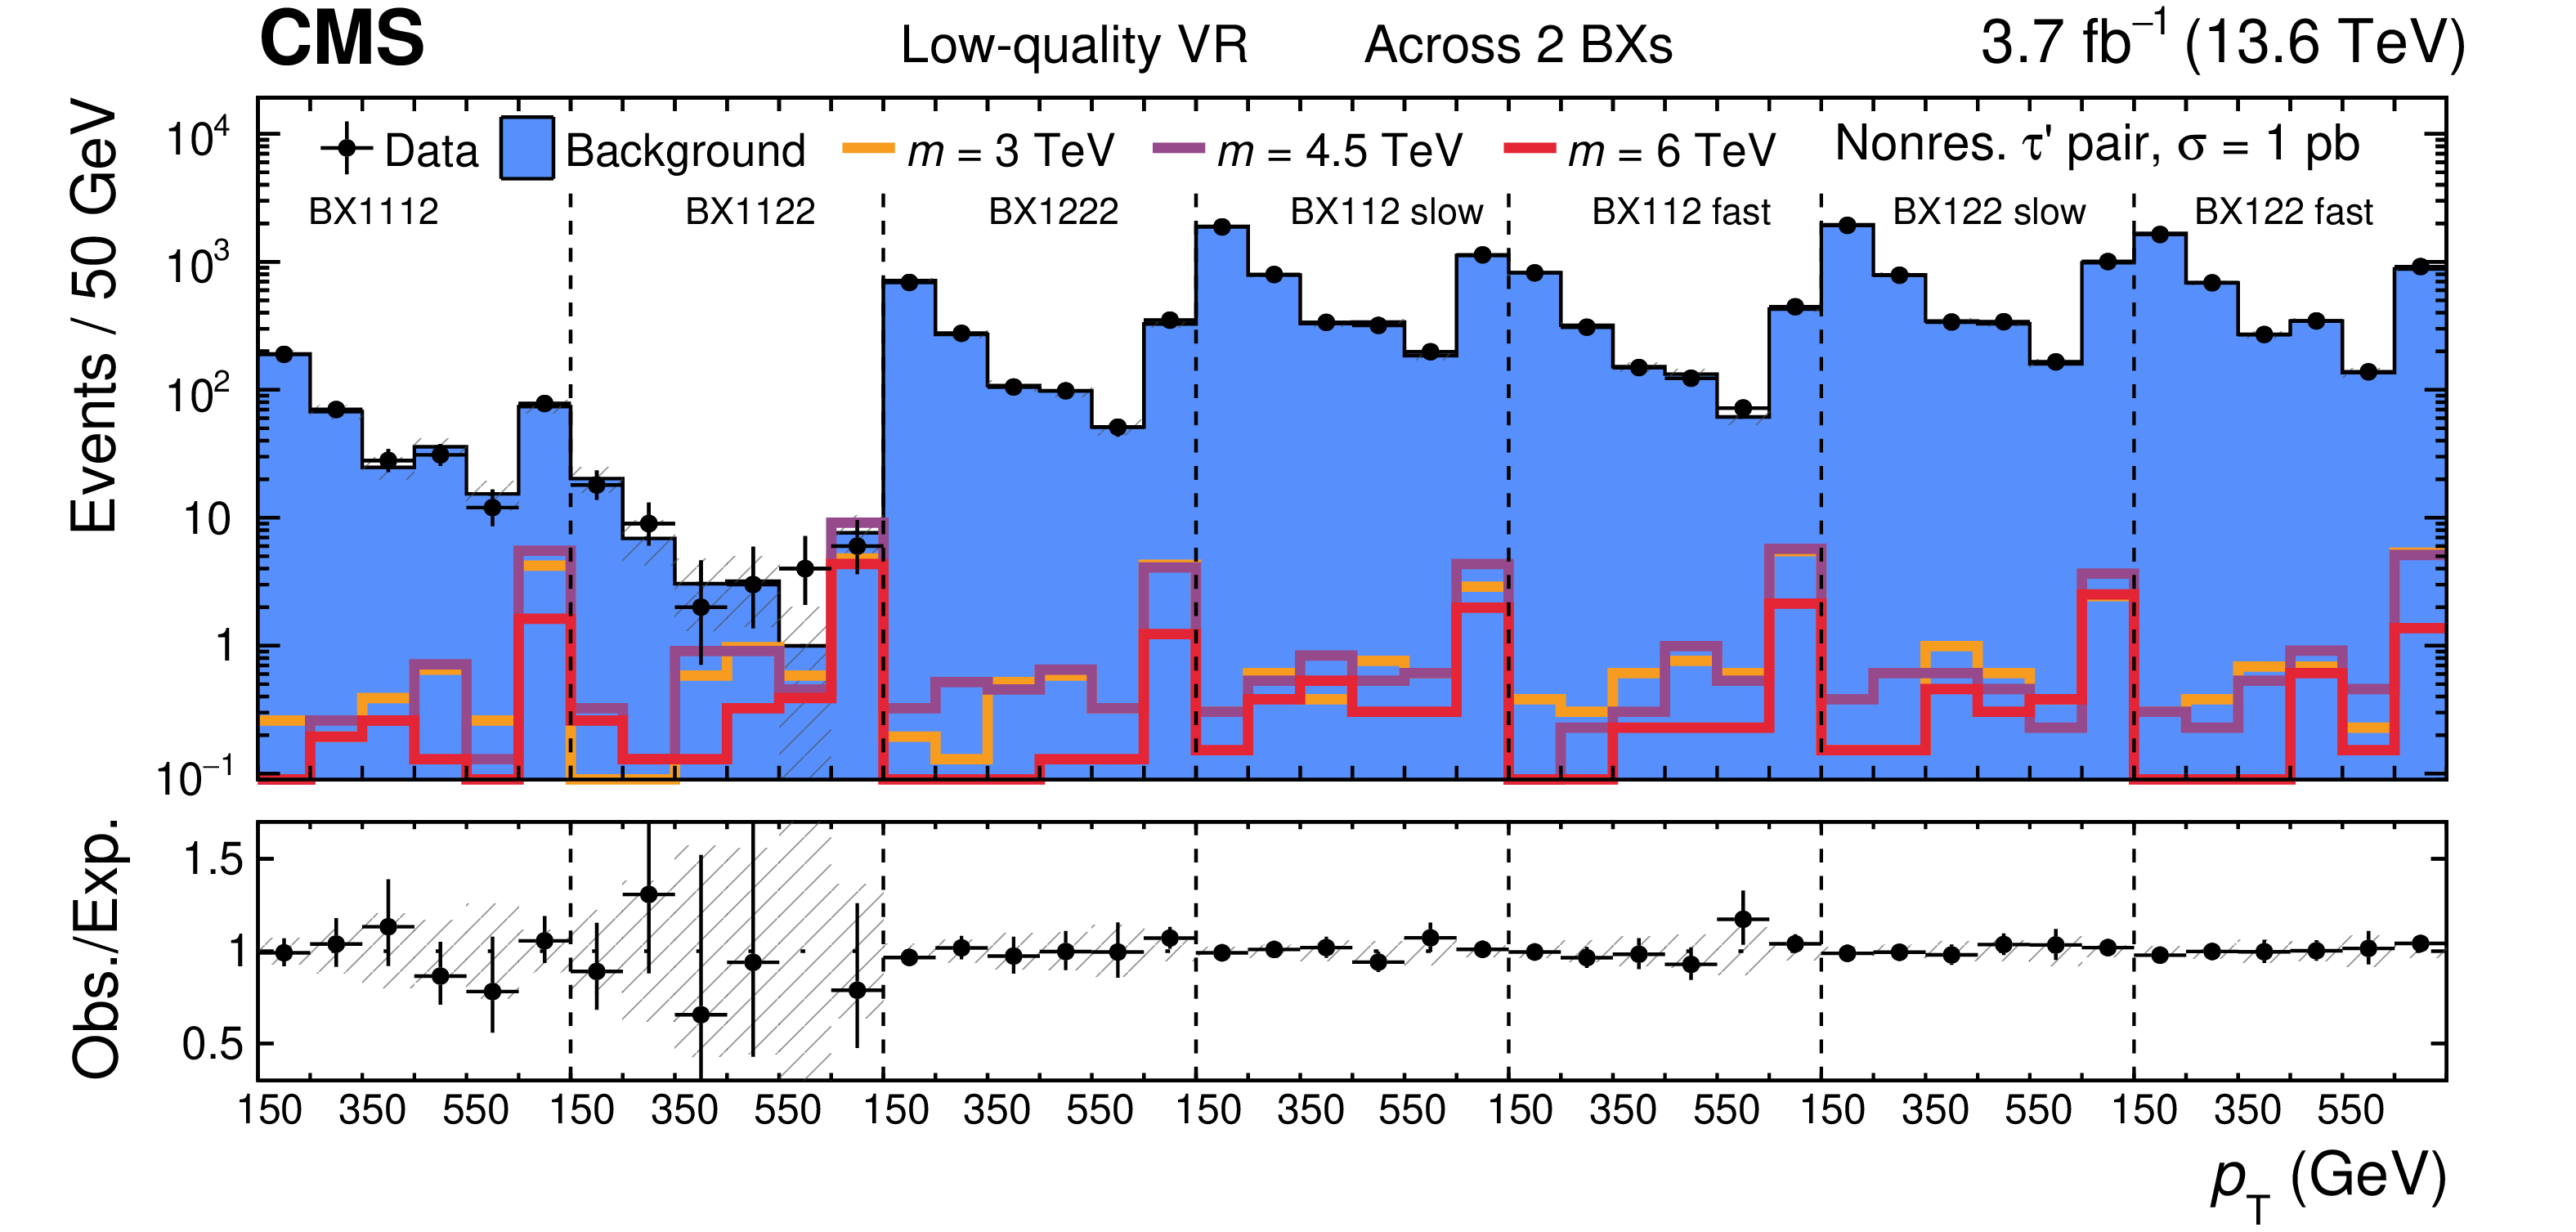
Figure 5:
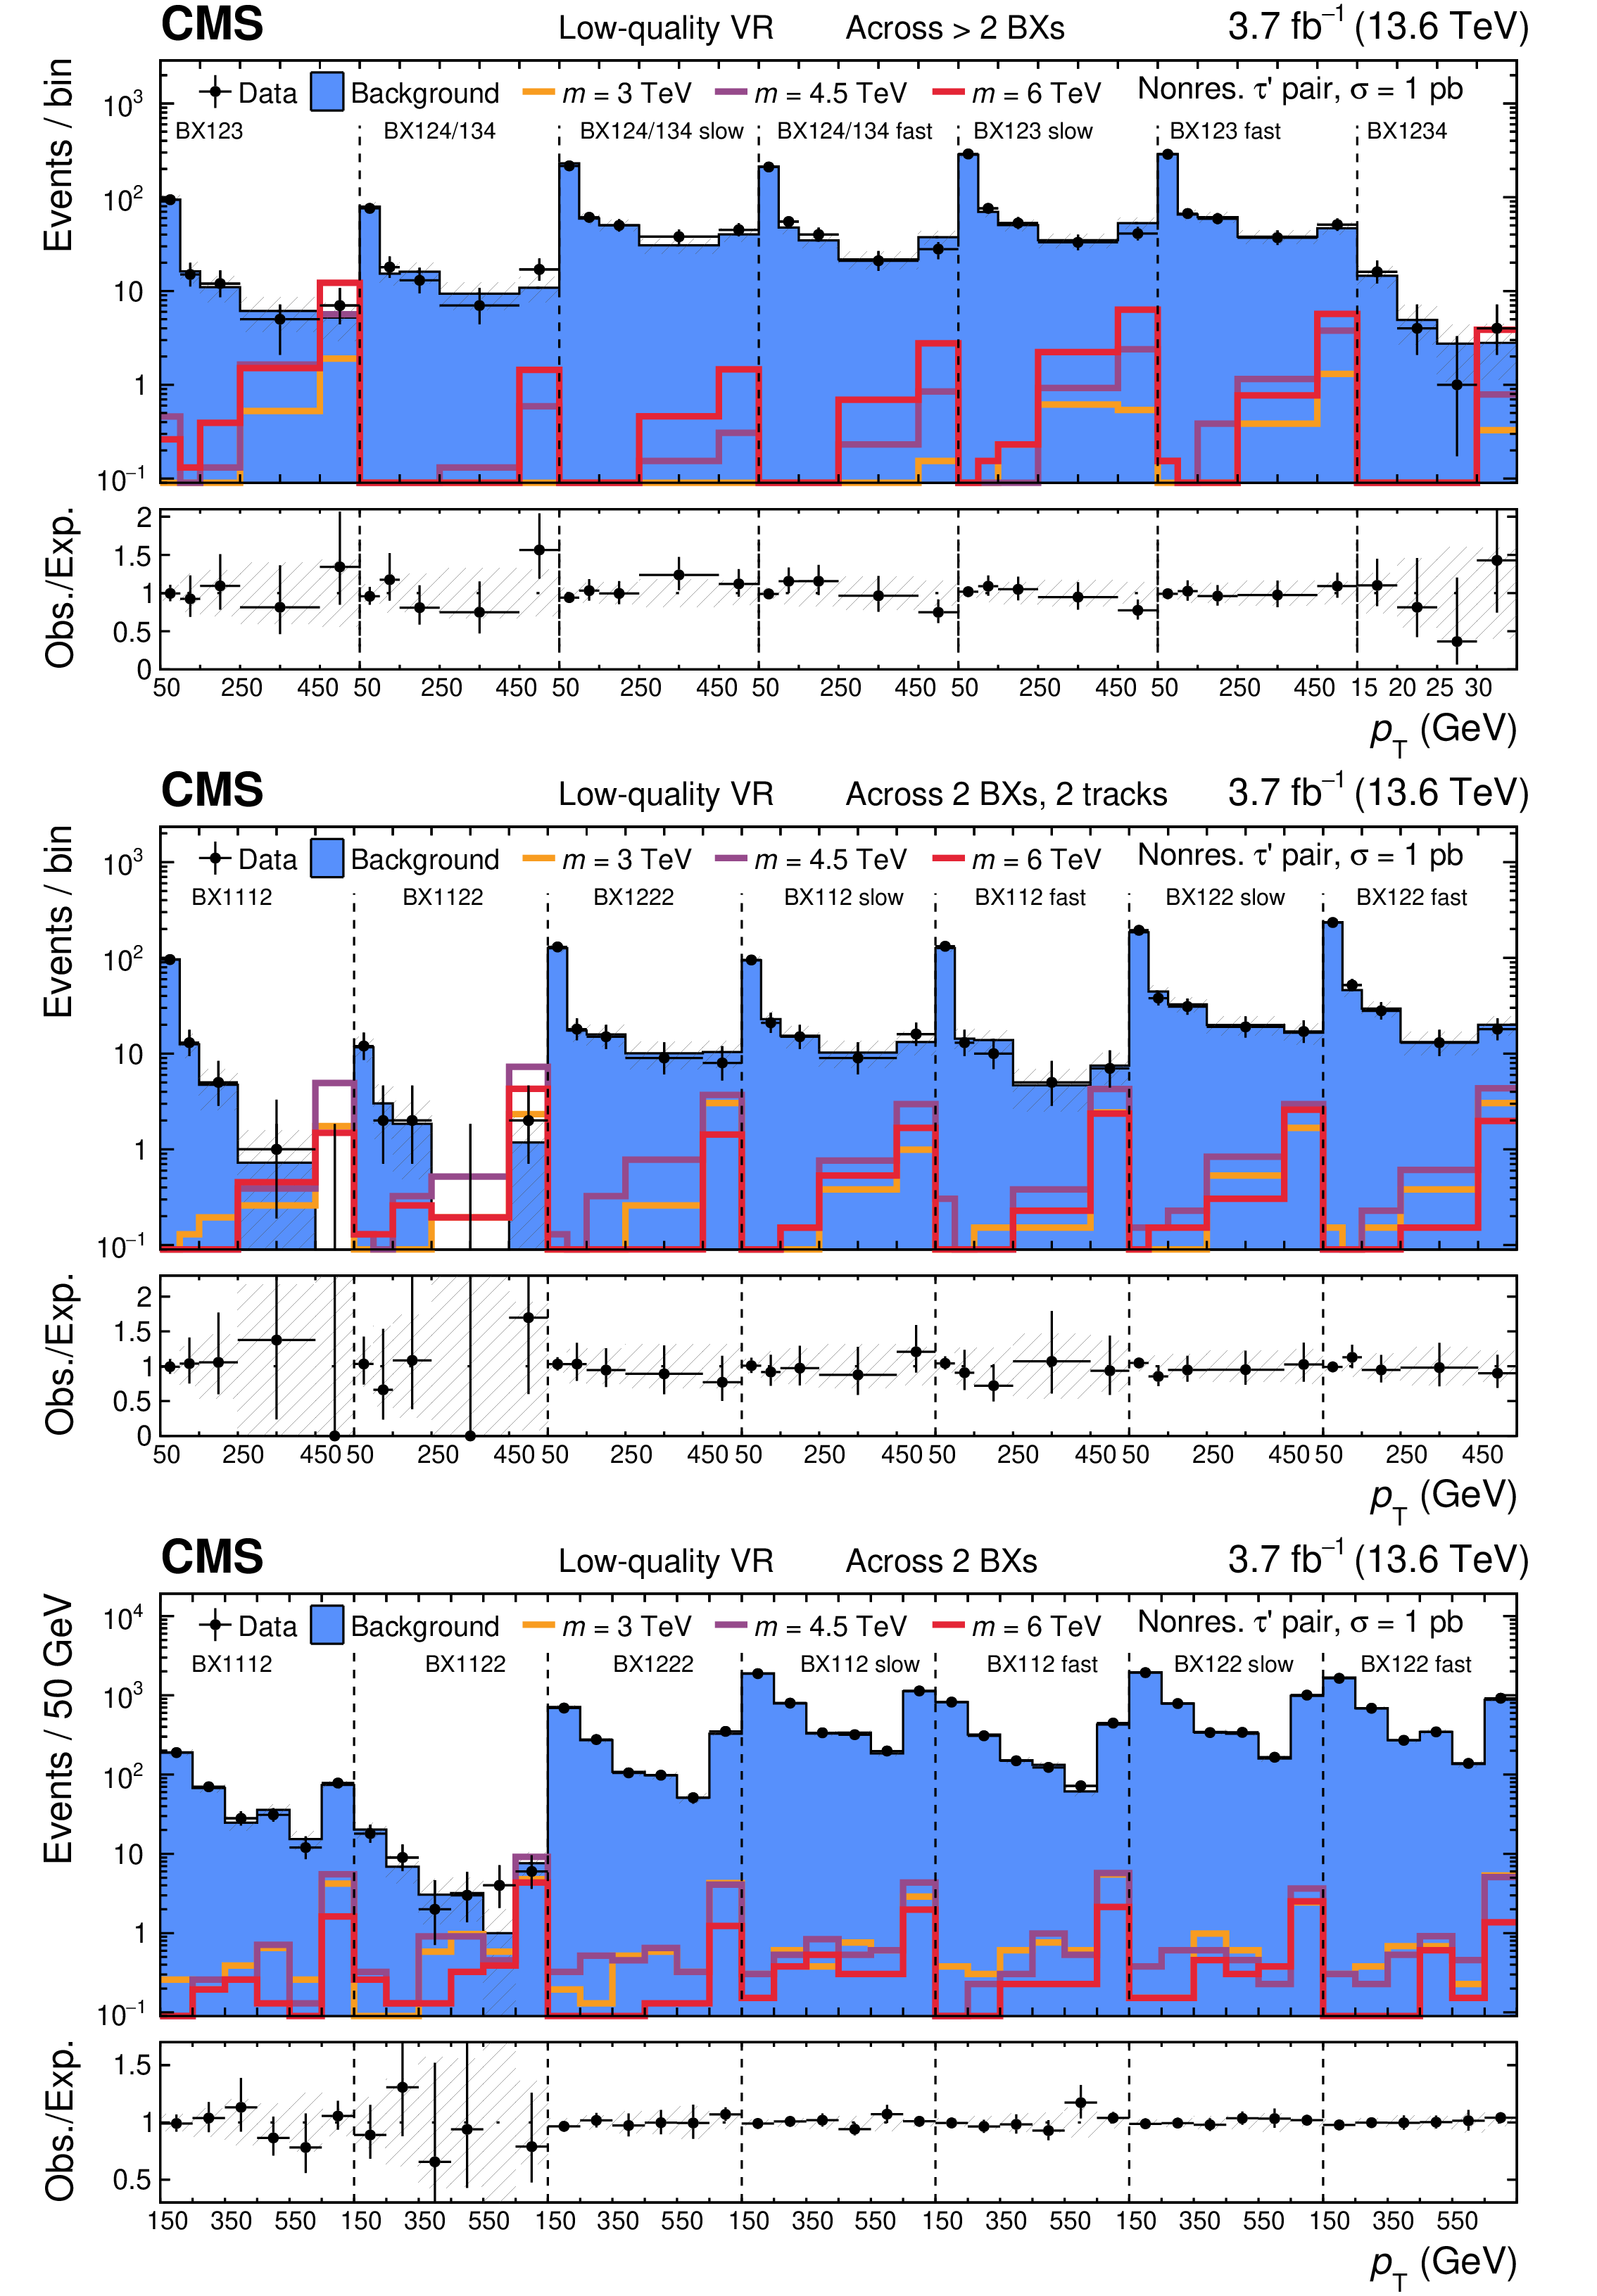
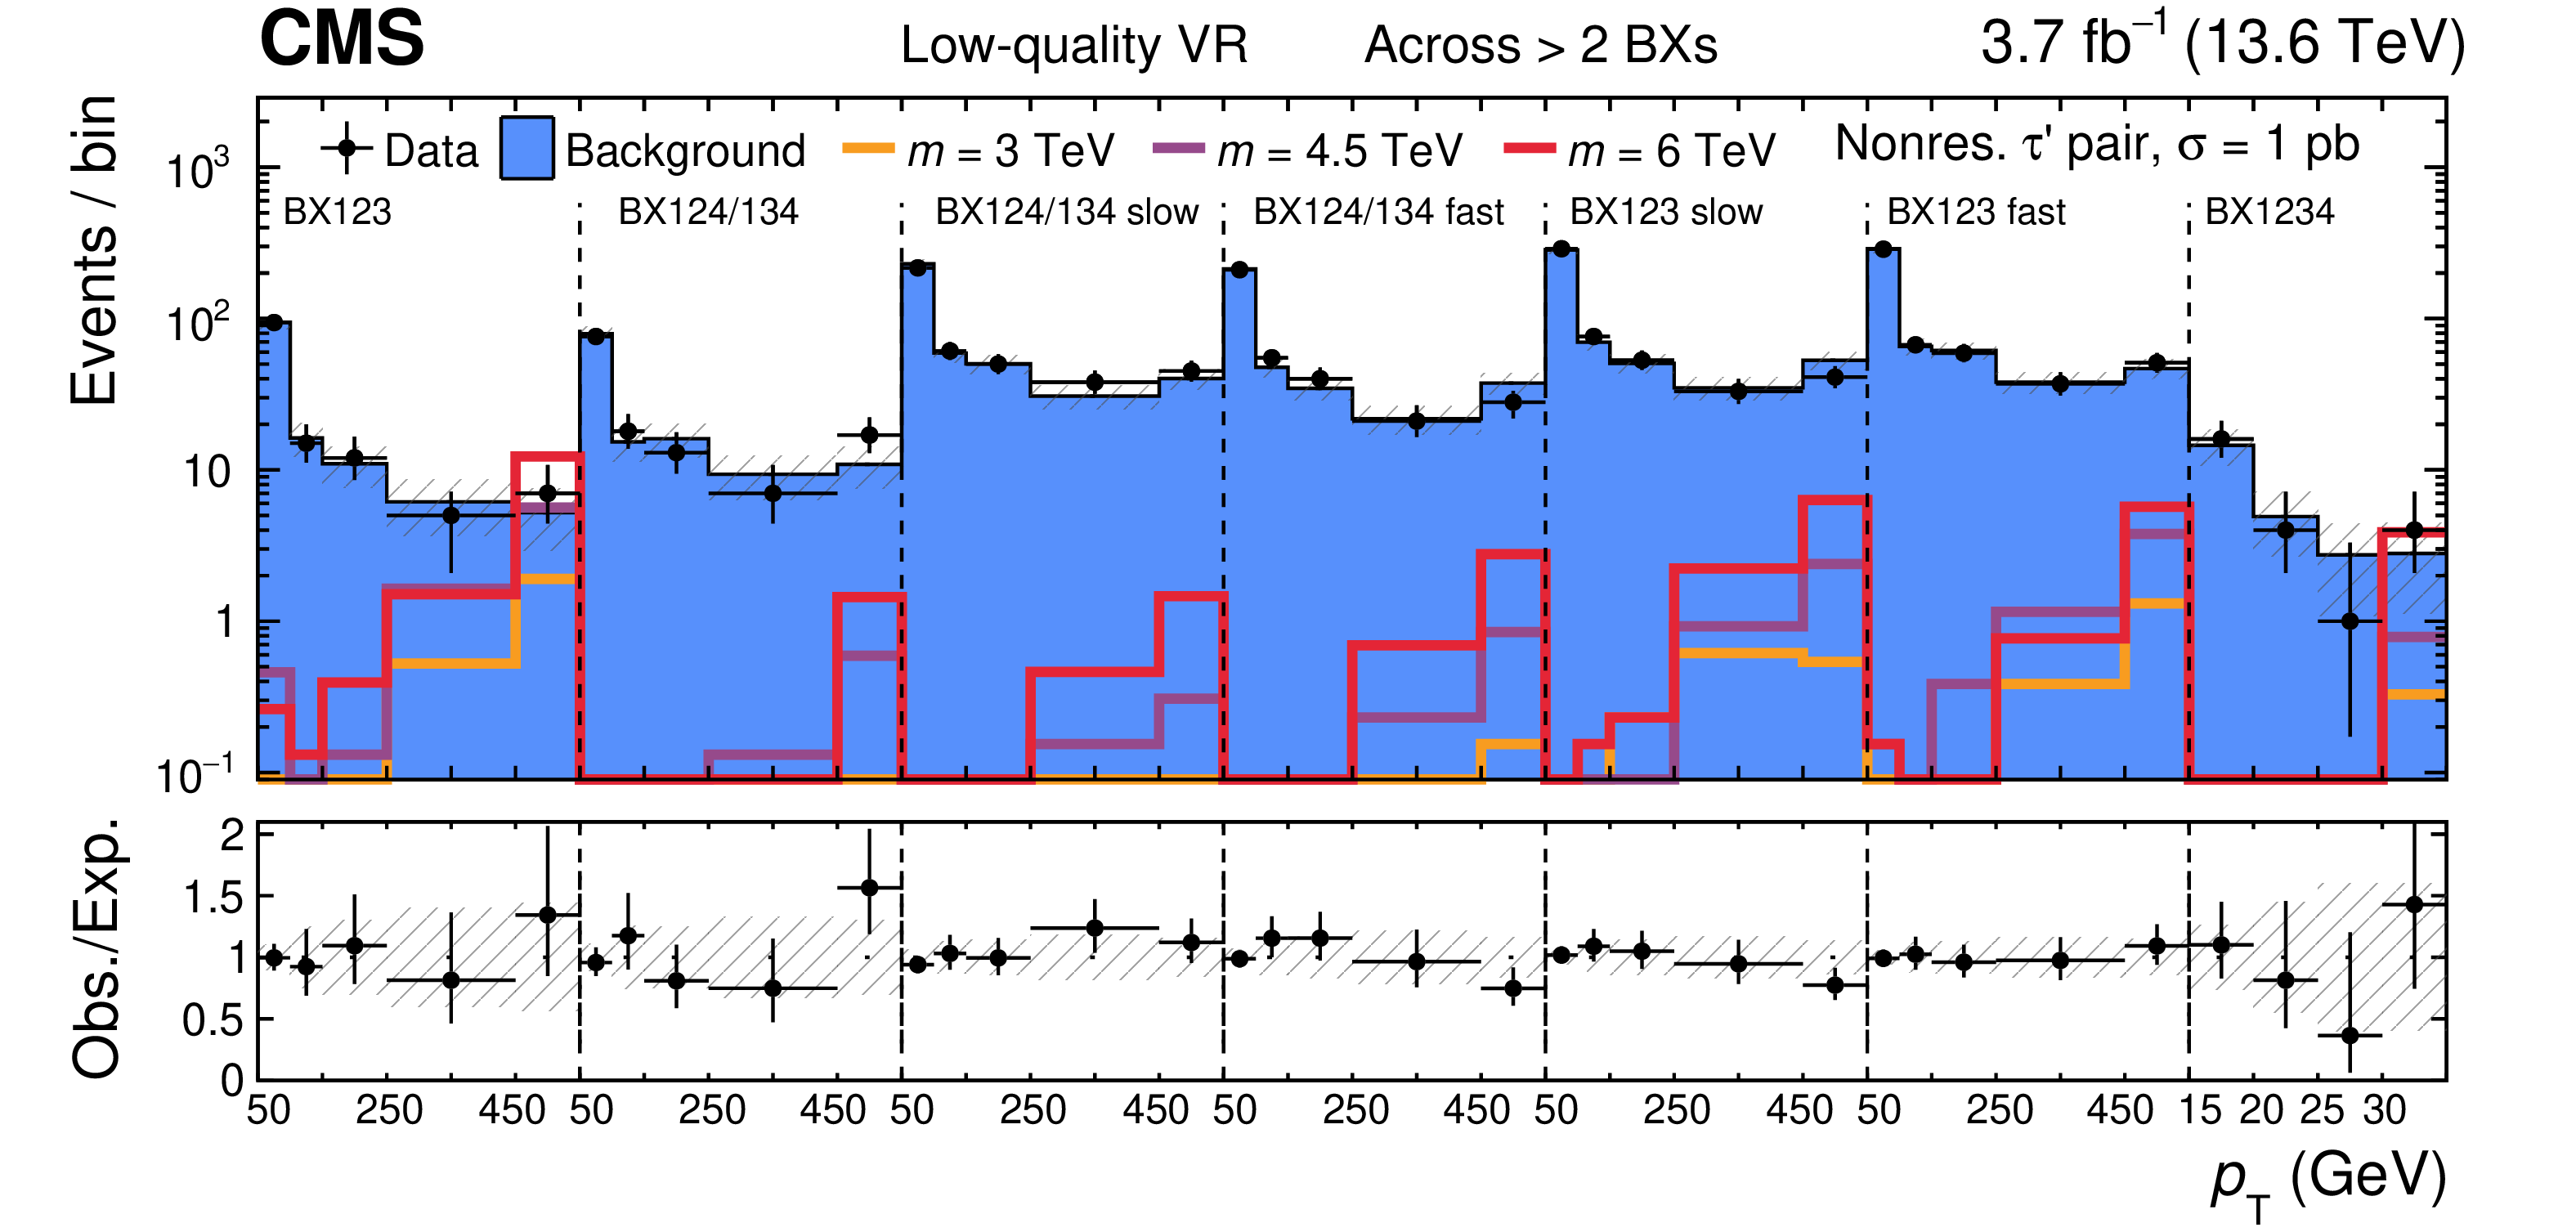
Low-track-quality validation region distributions for the categories with tracks across $ > $2 ( = $ $2, = $ $2) BXs without (with, without) additional track requirement are shown in the upper (center, lower) part of the figure. The expected background distributions are the result of the maximum likelihood fit. The uncertainty bands account for all sources of background uncertainty, systematic as well as statistical, after the maximum likelihood fit. The signal is shown for a few mass hypotheses of the nonresonant fourth-generation lepton model, using a production cross section of 1\unitpb. The lower panels show the observed to expected ratio. The last $ p_{\mathrm{T}} $ bins include the overflow. |
png pdf |
Figure 5-a:
Low-track-quality validation region distributions for the categories with tracks across $ > $2 ( = $ $2, = $ $2) BXs without (with, without) additional track requirement are shown in the upper (center, lower) part of the figure. The expected background distributions are the result of the maximum likelihood fit. The uncertainty bands account for all sources of background uncertainty, systematic as well as statistical, after the maximum likelihood fit. The signal is shown for a few mass hypotheses of the nonresonant fourth-generation lepton model, using a production cross section of 1\unitpb. The lower panels show the observed to expected ratio. The last $ p_{\mathrm{T}} $ bins include the overflow. |
png pdf |
Figure 5-b:
Low-track-quality validation region distributions for the categories with tracks across $ > $2 ( = $ $2, = $ $2) BXs without (with, without) additional track requirement are shown in the upper (center, lower) part of the figure. The expected background distributions are the result of the maximum likelihood fit. The uncertainty bands account for all sources of background uncertainty, systematic as well as statistical, after the maximum likelihood fit. The signal is shown for a few mass hypotheses of the nonresonant fourth-generation lepton model, using a production cross section of 1\unitpb. The lower panels show the observed to expected ratio. The last $ p_{\mathrm{T}} $ bins include the overflow. |
png pdf |
Figure 5-c:
Low-track-quality validation region distributions for the categories with tracks across $ > $2 ( = $ $2, = $ $2) BXs without (with, without) additional track requirement are shown in the upper (center, lower) part of the figure. The expected background distributions are the result of the maximum likelihood fit. The uncertainty bands account for all sources of background uncertainty, systematic as well as statistical, after the maximum likelihood fit. The signal is shown for a few mass hypotheses of the nonresonant fourth-generation lepton model, using a production cross section of 1\unitpb. The lower panels show the observed to expected ratio. The last $ p_{\mathrm{T}} $ bins include the overflow. |
png pdf |
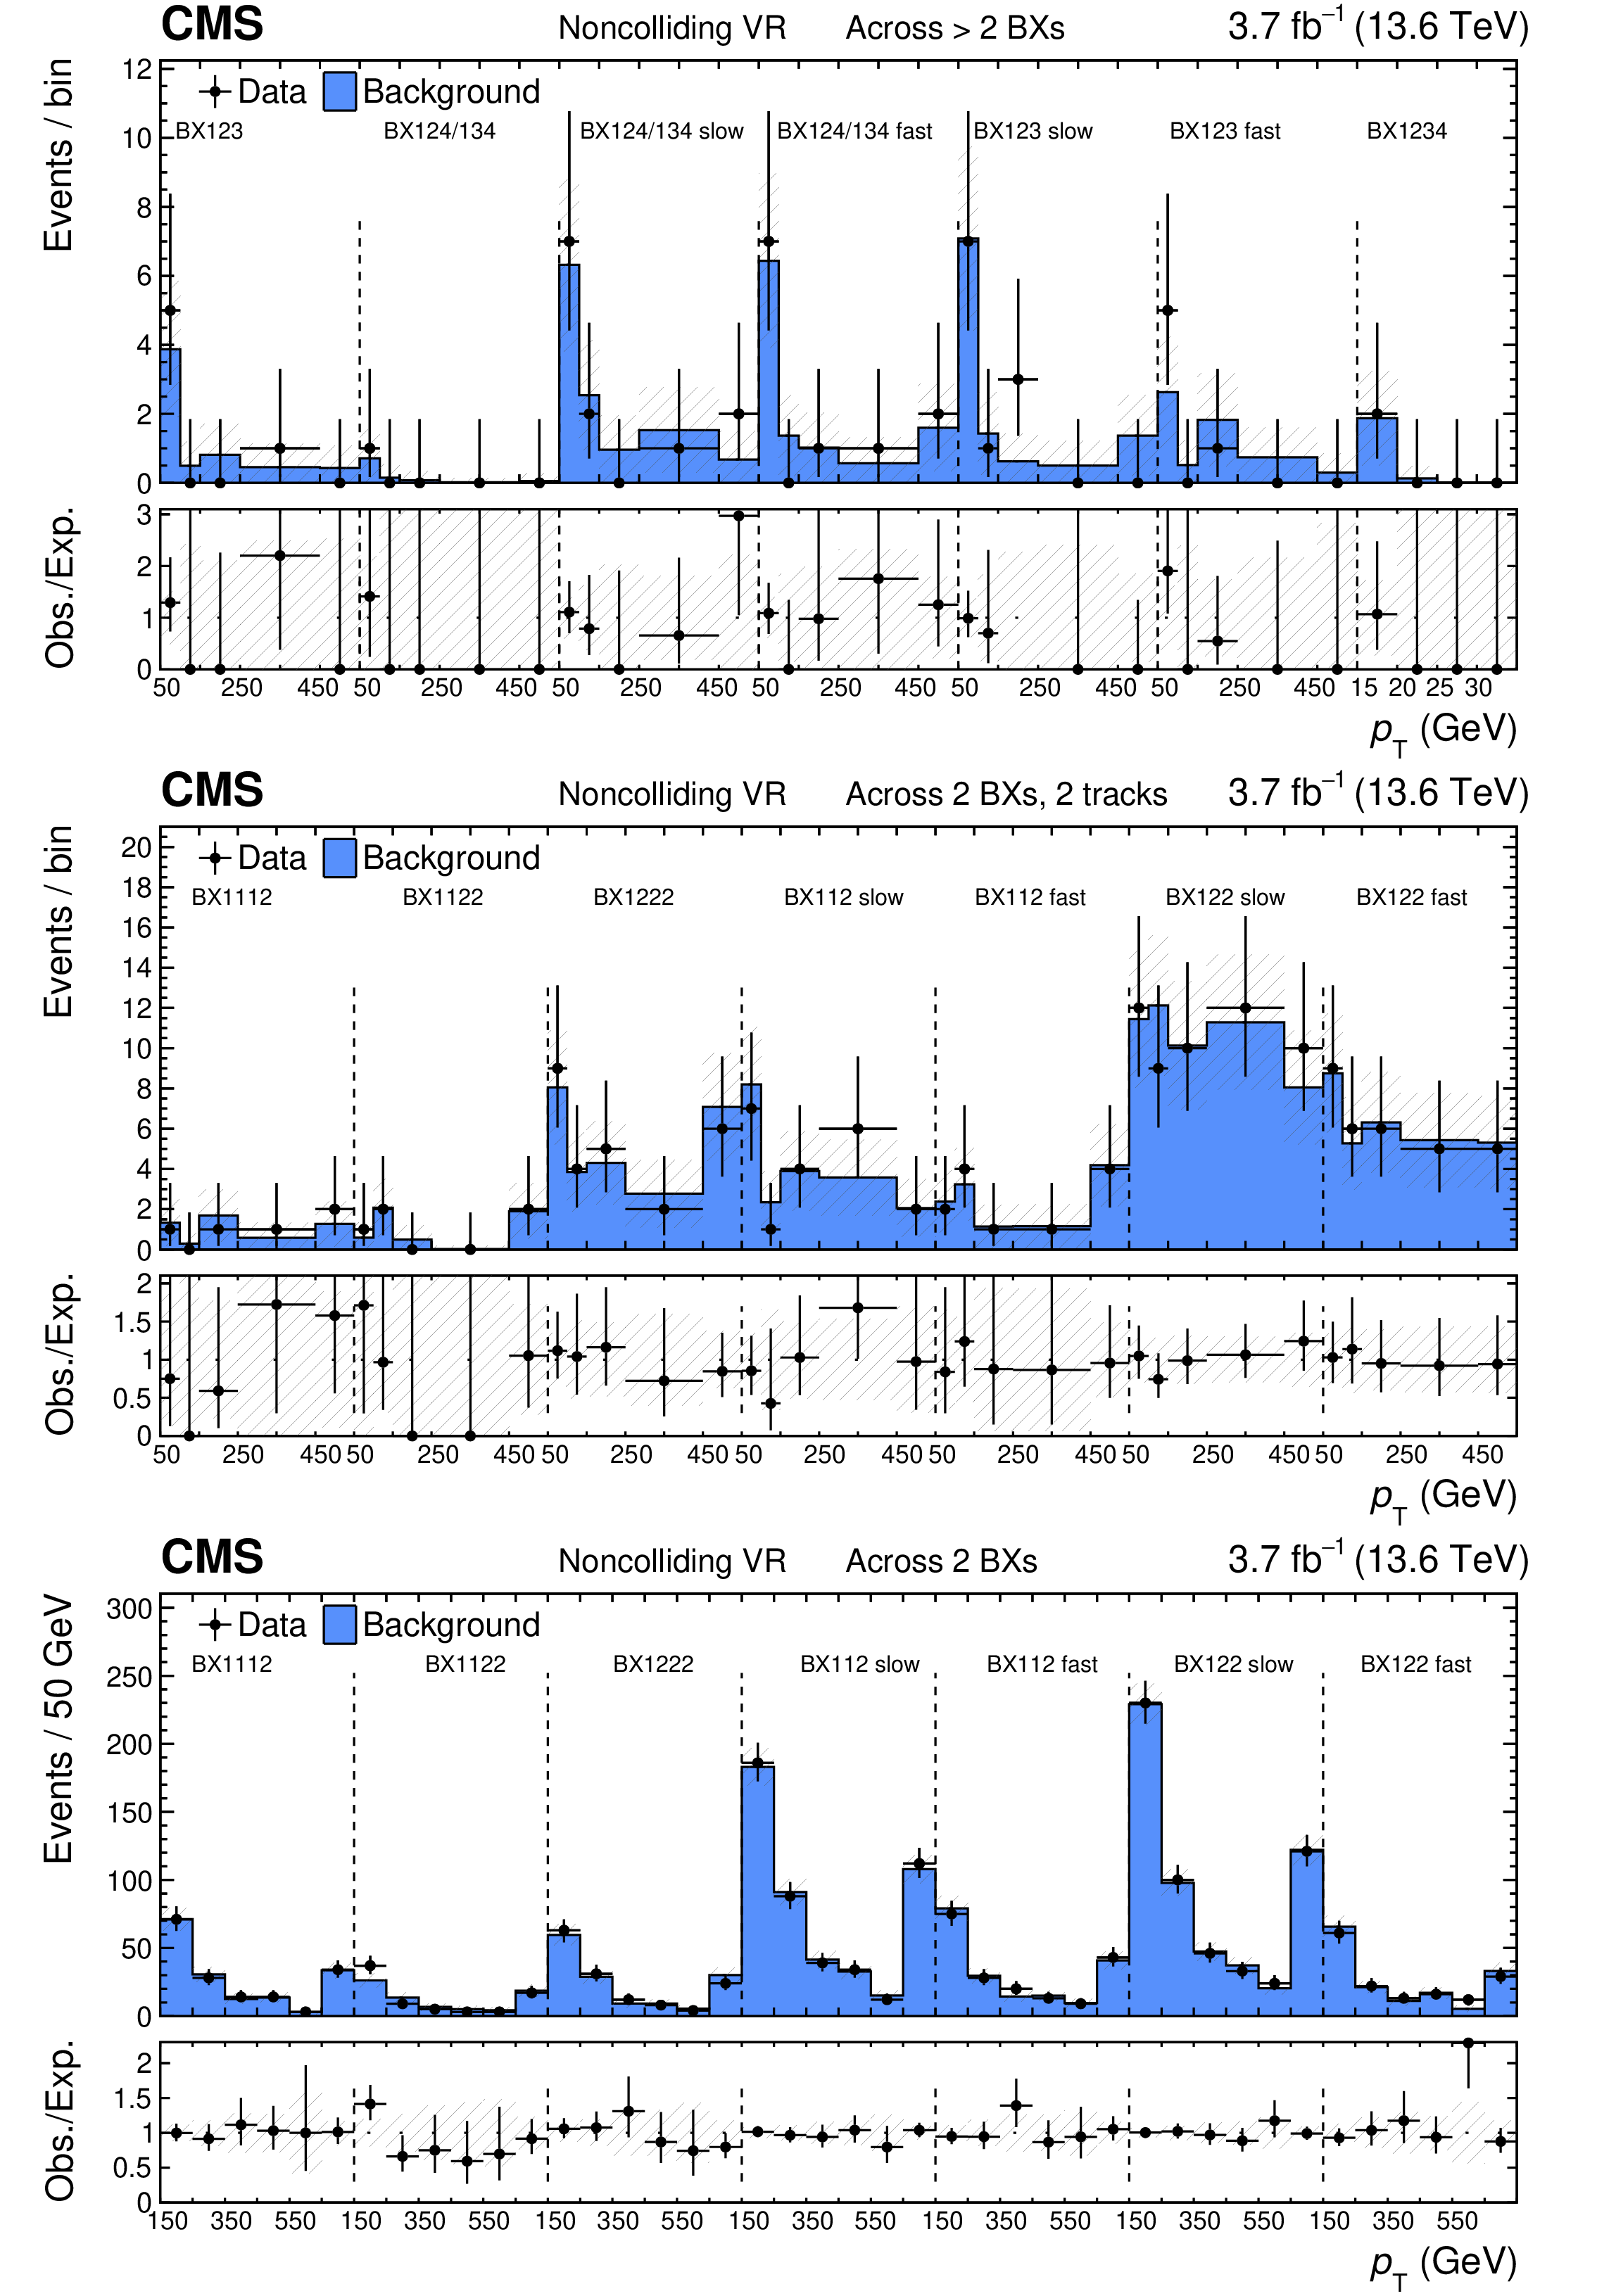
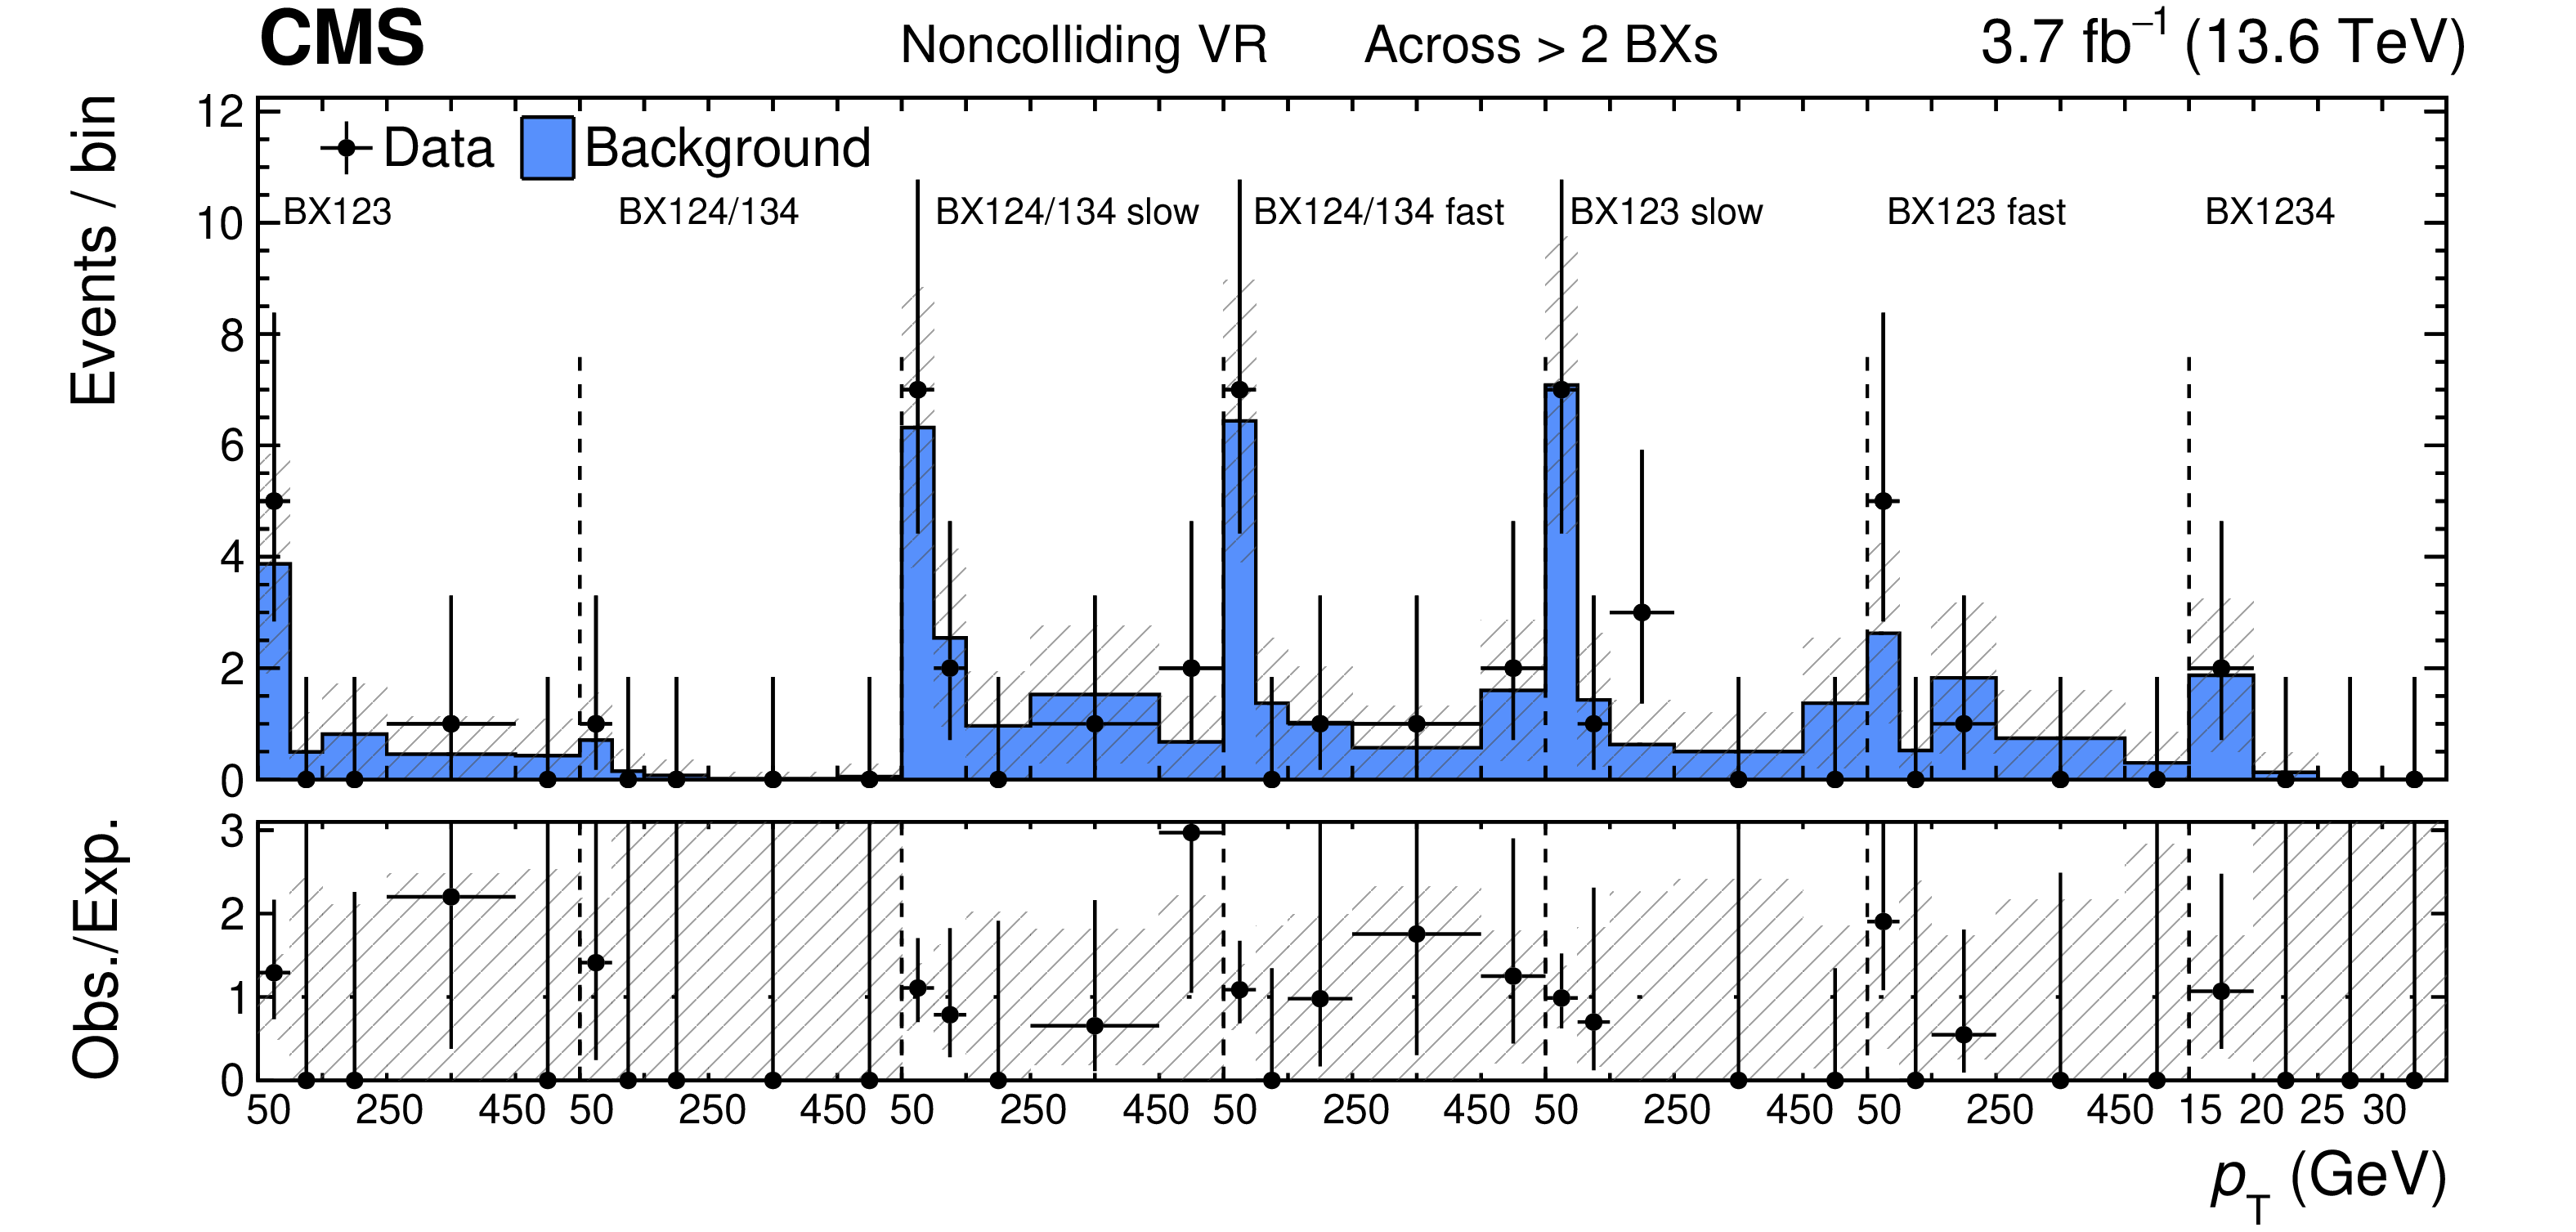
Figure 6:
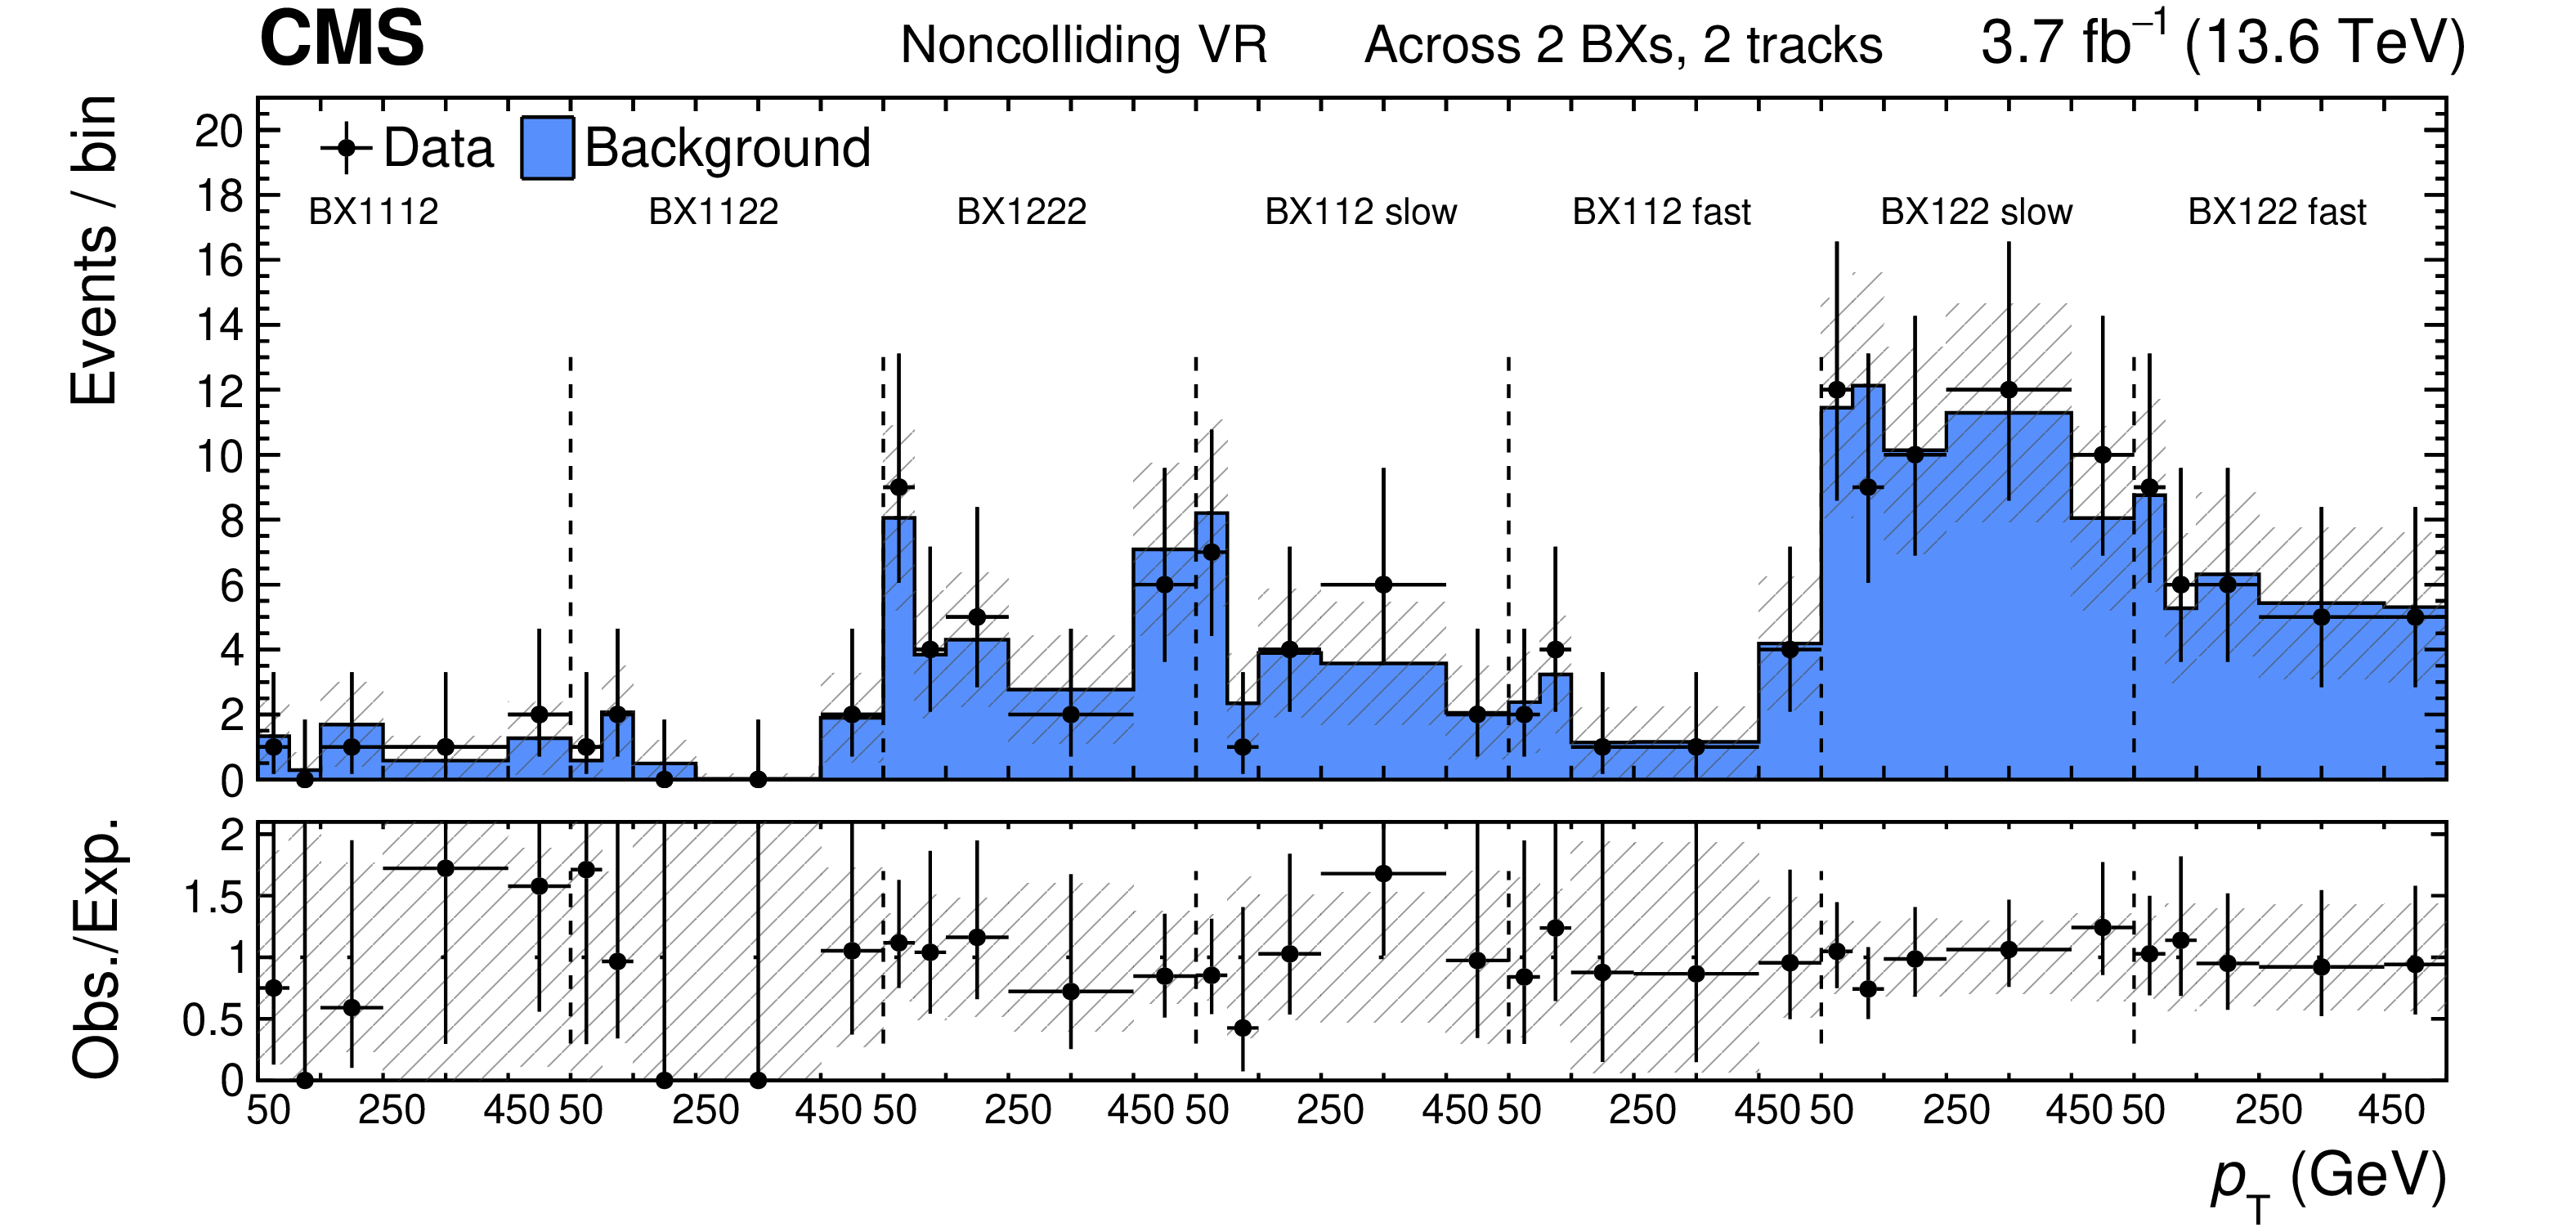
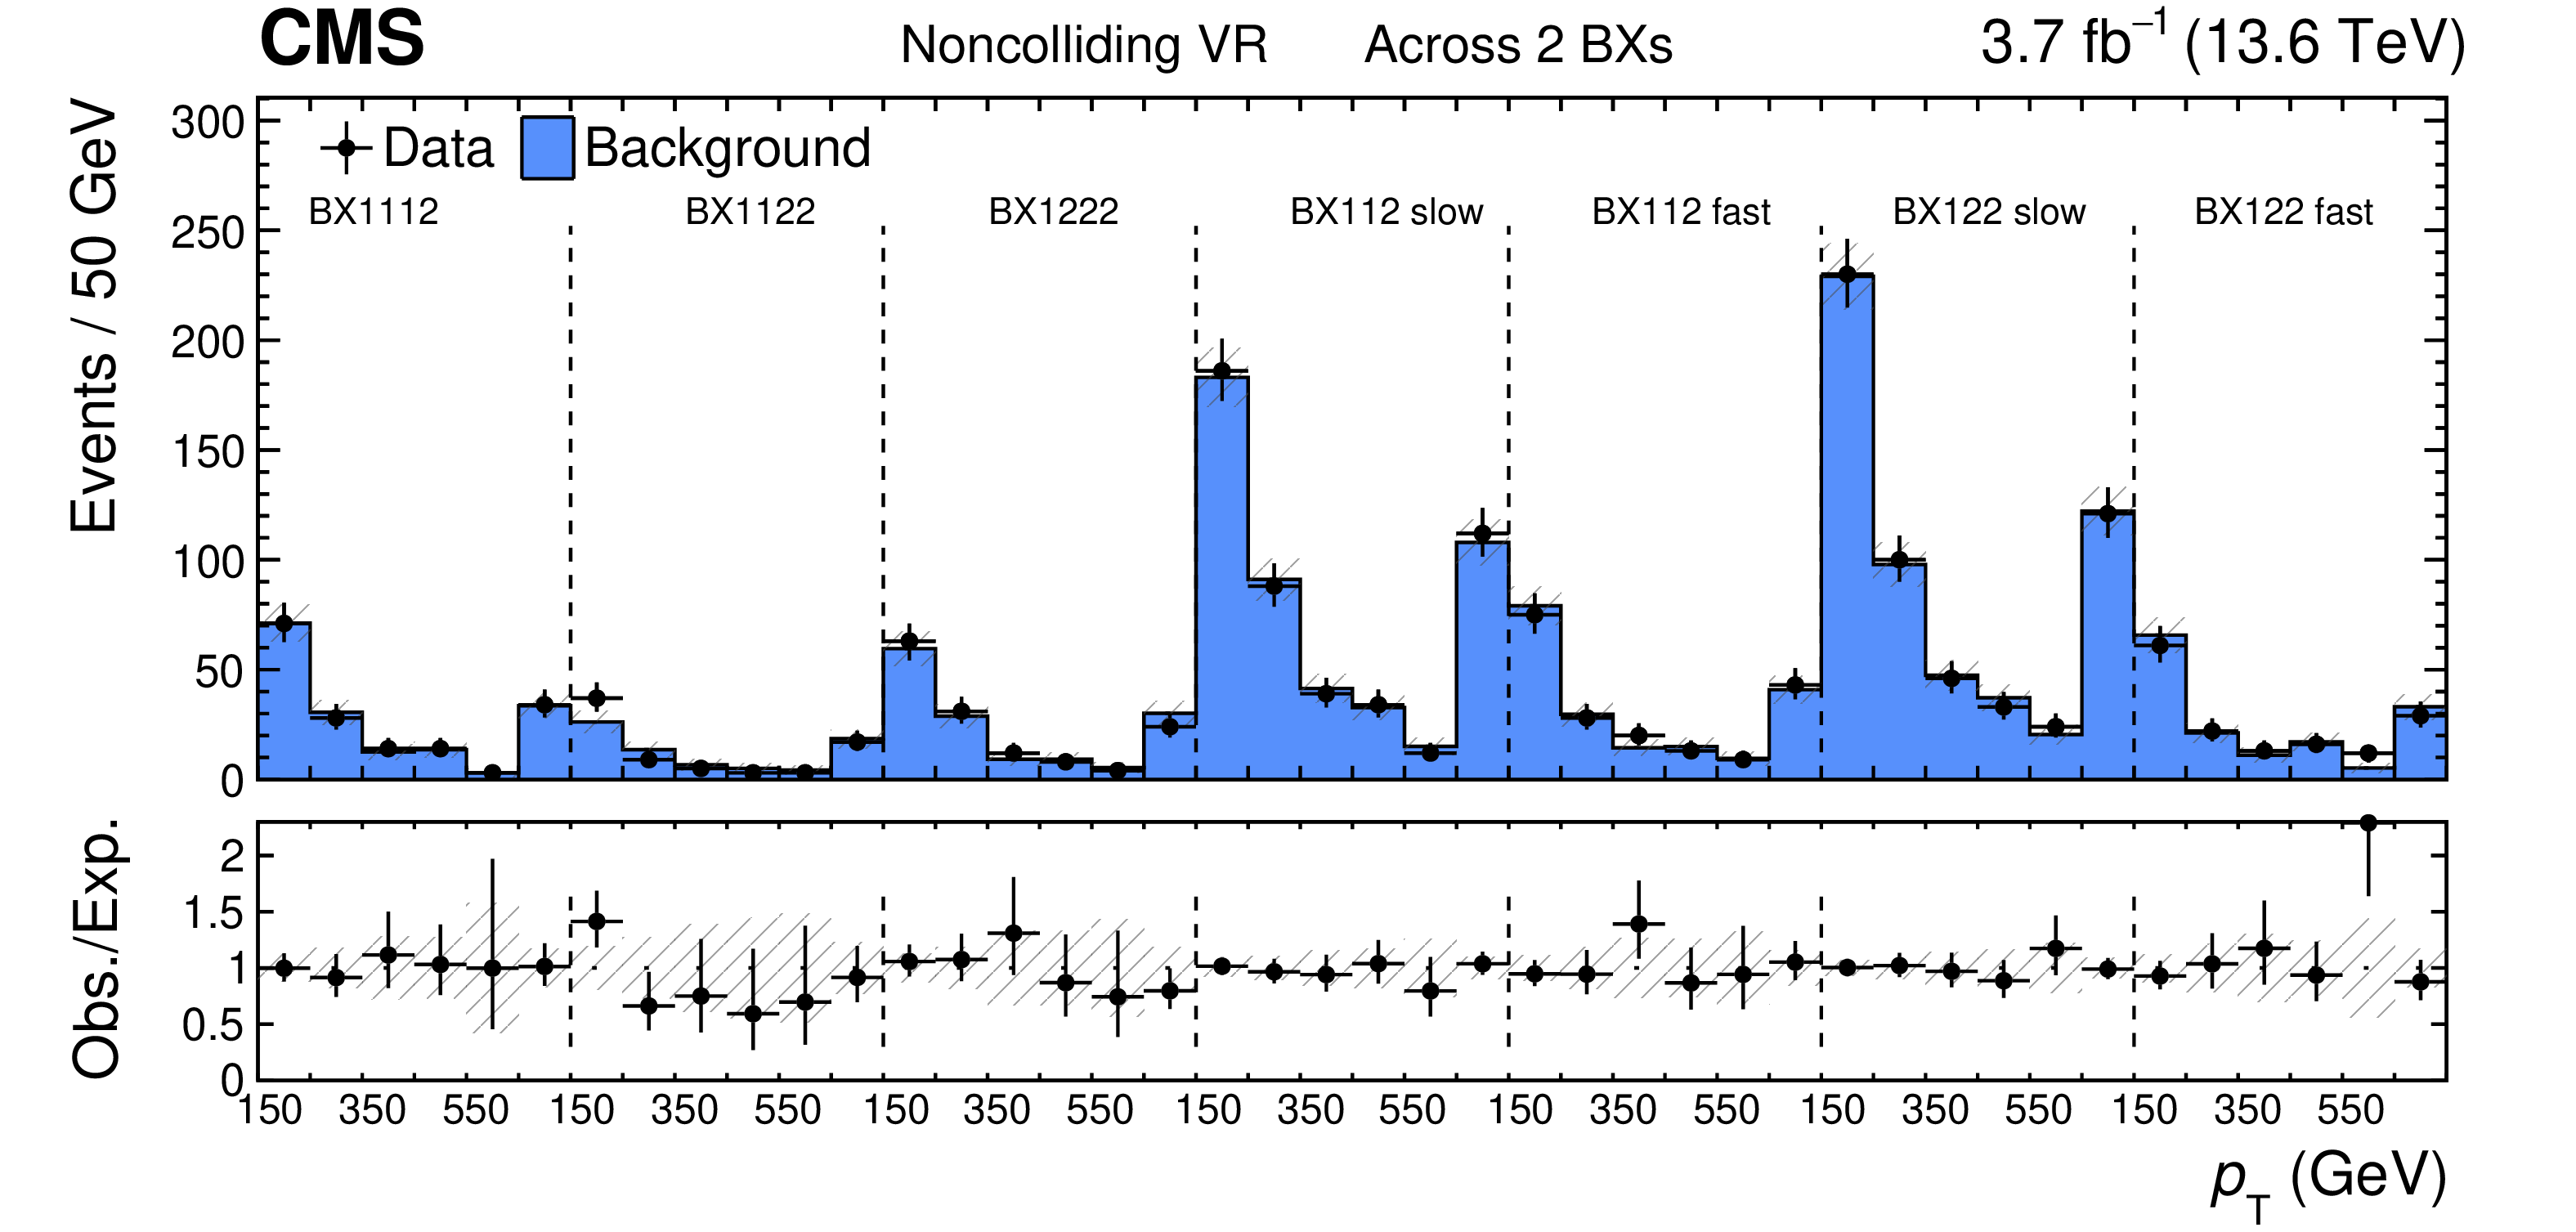
Noncolliding validation region distributions for the categories with tracks across $ > $2 ( = $ $2, = $ $2) BXs without (with, without) additional track requirement are shown in the upper (center, lower) part of the figure. The expected background distributions are the result of the maximum likelihood fit. The uncertainty bands account for all sources of background uncertainty, systematic as well as statistical, after the maximum likelihood fit. The lower panels show the observed to expected ratio. The last $ p_{\mathrm{T}} $ bins include the overflow. |
png pdf |
Figure 6-a:
Noncolliding validation region distributions for the categories with tracks across $ > $2 ( = $ $2, = $ $2) BXs without (with, without) additional track requirement are shown in the upper (center, lower) part of the figure. The expected background distributions are the result of the maximum likelihood fit. The uncertainty bands account for all sources of background uncertainty, systematic as well as statistical, after the maximum likelihood fit. The lower panels show the observed to expected ratio. The last $ p_{\mathrm{T}} $ bins include the overflow. |
png pdf |
Figure 6-b:
Noncolliding validation region distributions for the categories with tracks across $ > $2 ( = $ $2, = $ $2) BXs without (with, without) additional track requirement are shown in the upper (center, lower) part of the figure. The expected background distributions are the result of the maximum likelihood fit. The uncertainty bands account for all sources of background uncertainty, systematic as well as statistical, after the maximum likelihood fit. The lower panels show the observed to expected ratio. The last $ p_{\mathrm{T}} $ bins include the overflow. |
png pdf |
Figure 6-c:
Noncolliding validation region distributions for the categories with tracks across $ > $2 ( = $ $2, = $ $2) BXs without (with, without) additional track requirement are shown in the upper (center, lower) part of the figure. The expected background distributions are the result of the maximum likelihood fit. The uncertainty bands account for all sources of background uncertainty, systematic as well as statistical, after the maximum likelihood fit. The lower panels show the observed to expected ratio. The last $ p_{\mathrm{T}} $ bins include the overflow. |
png pdf |
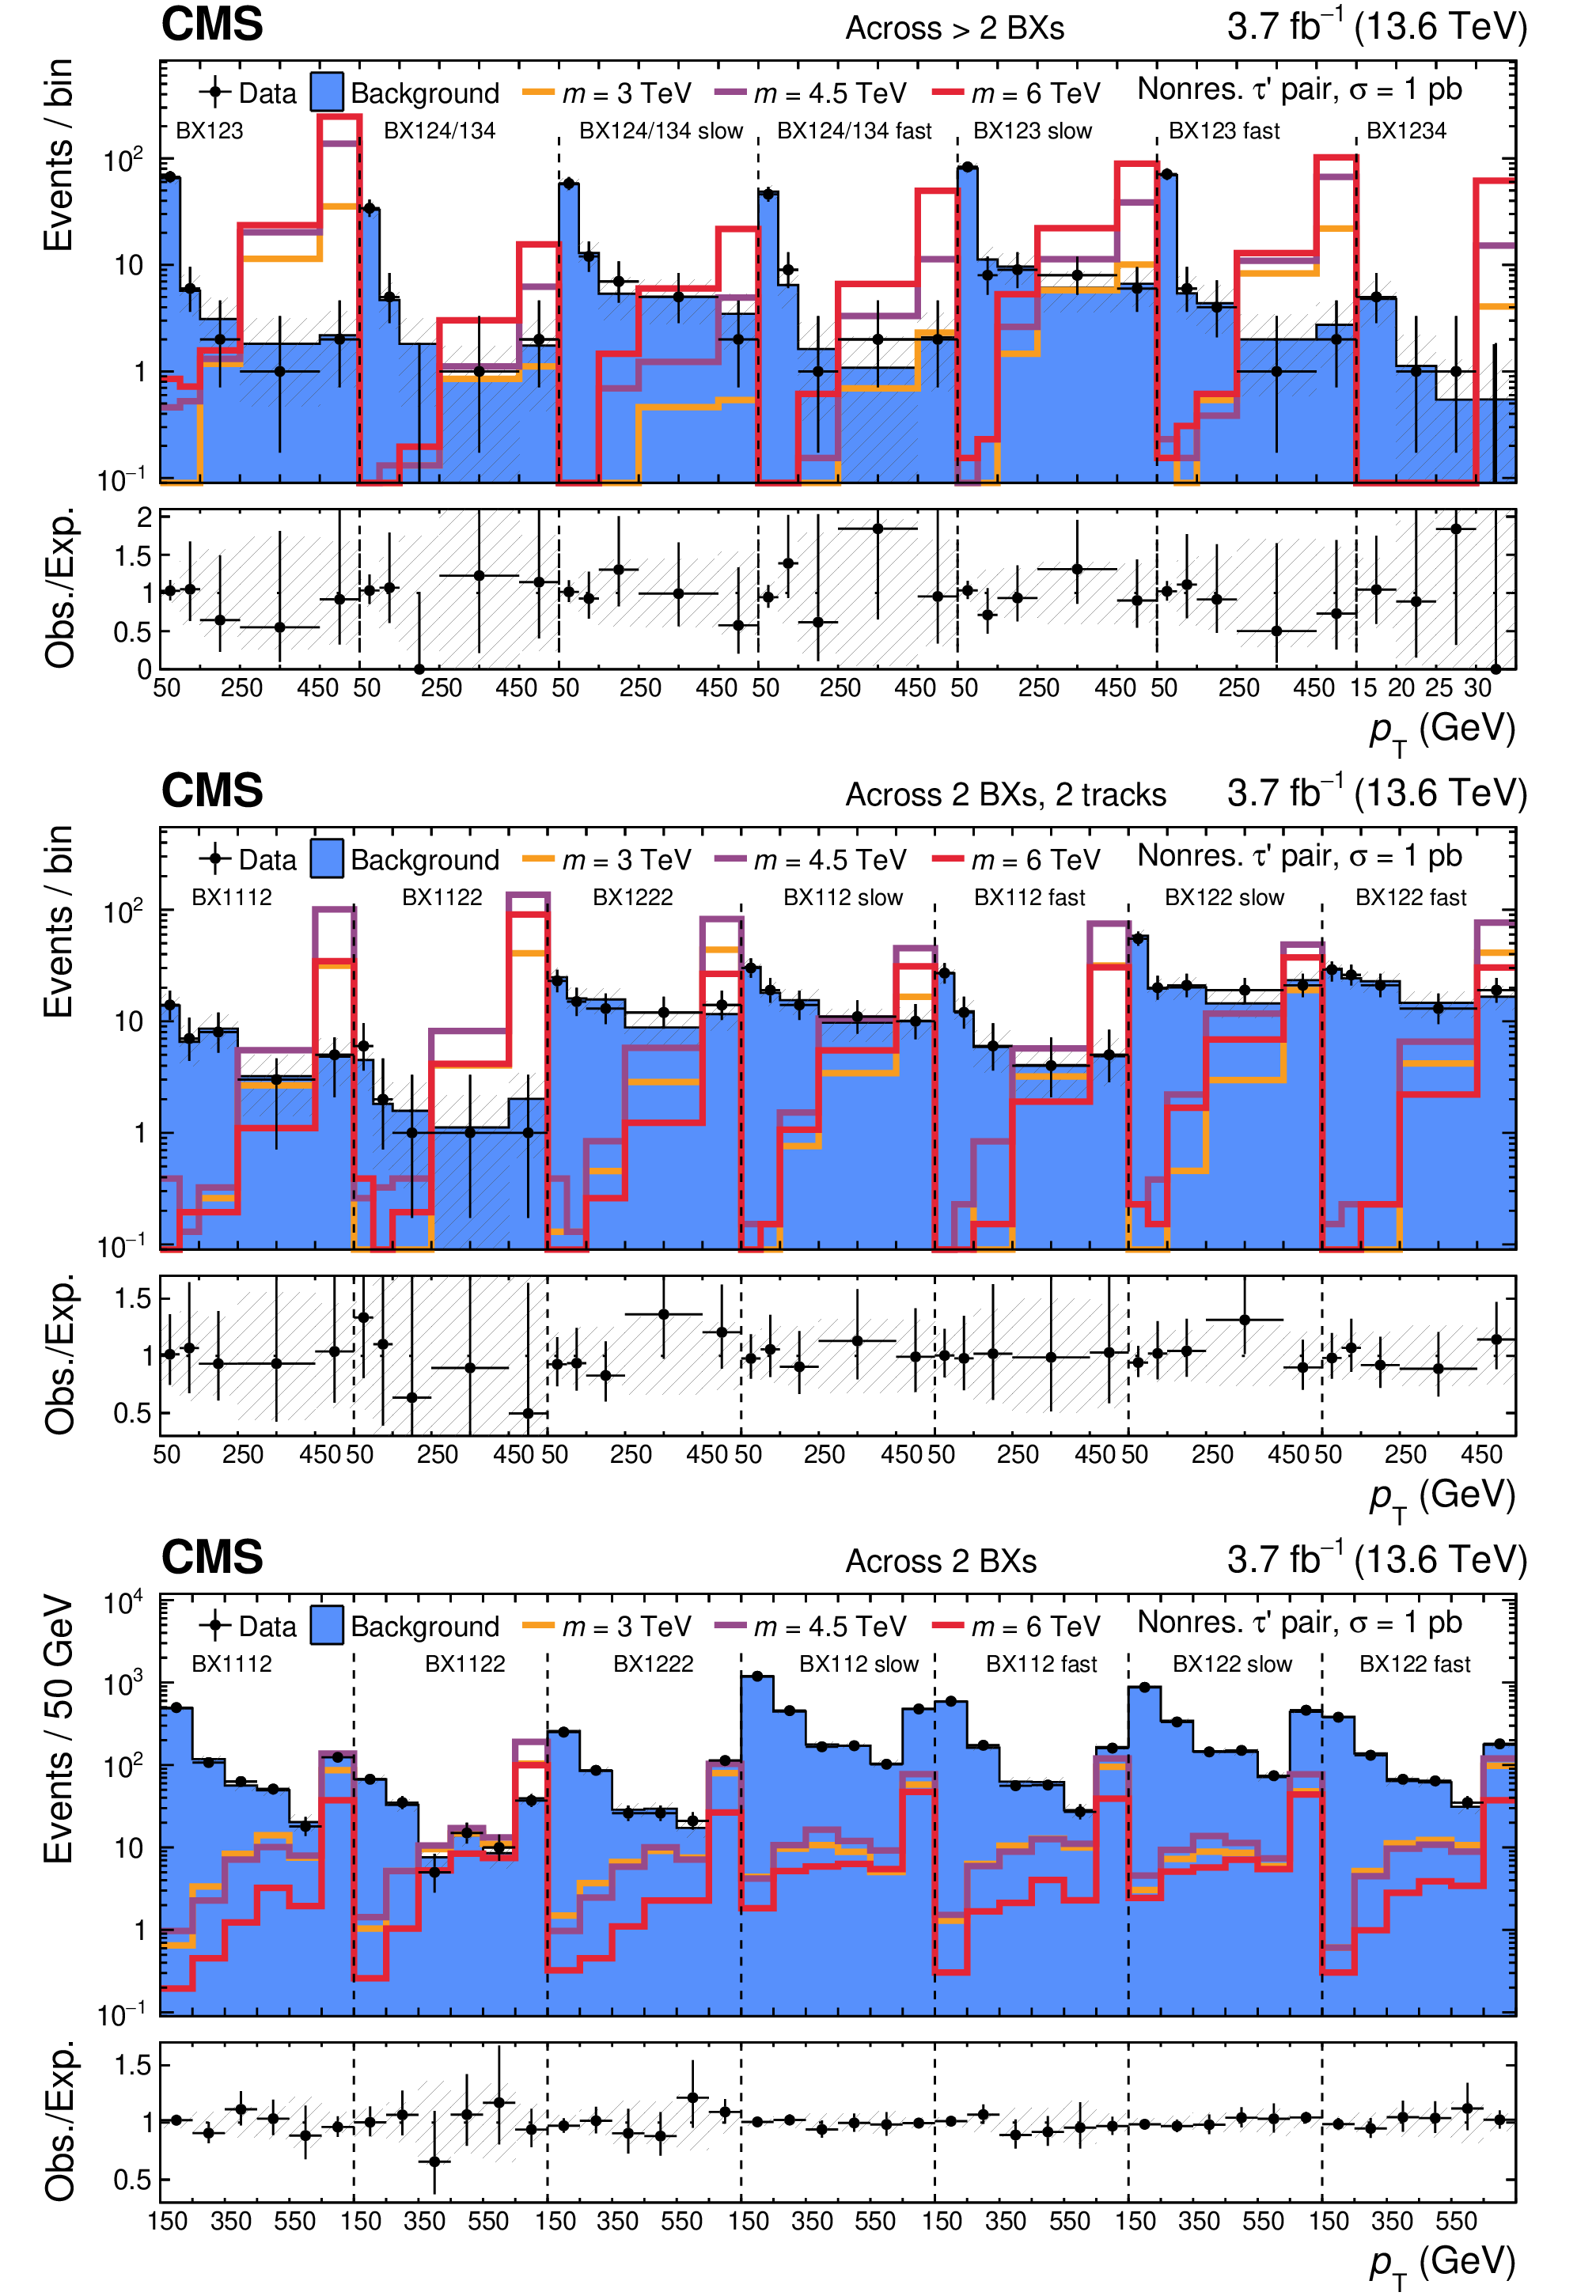
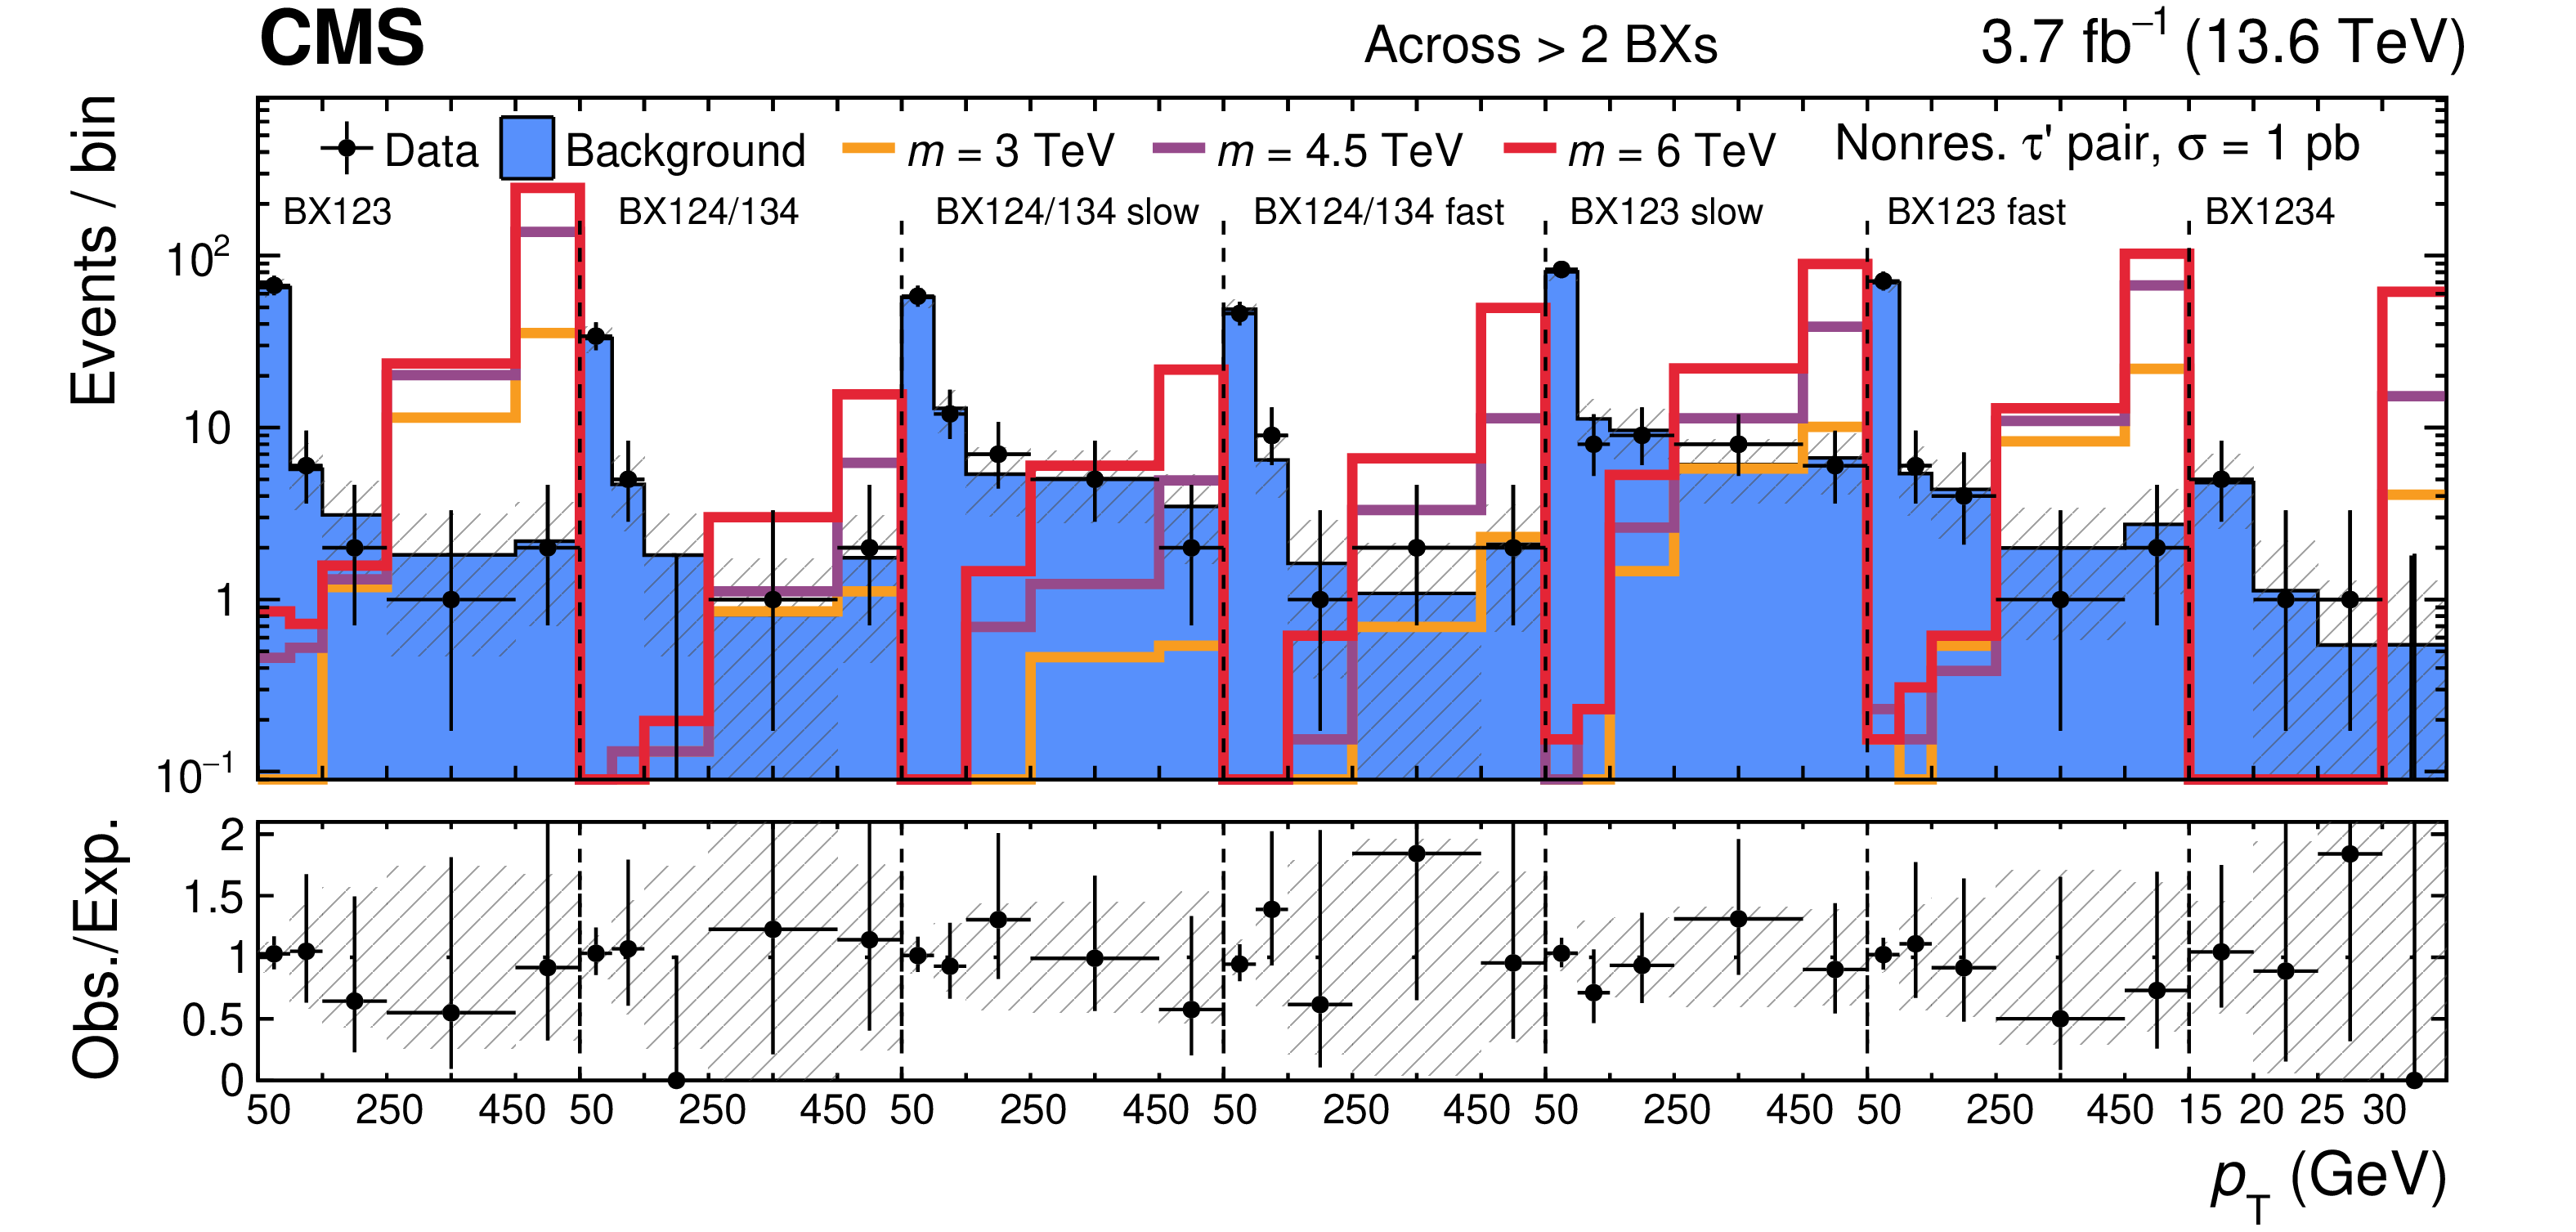
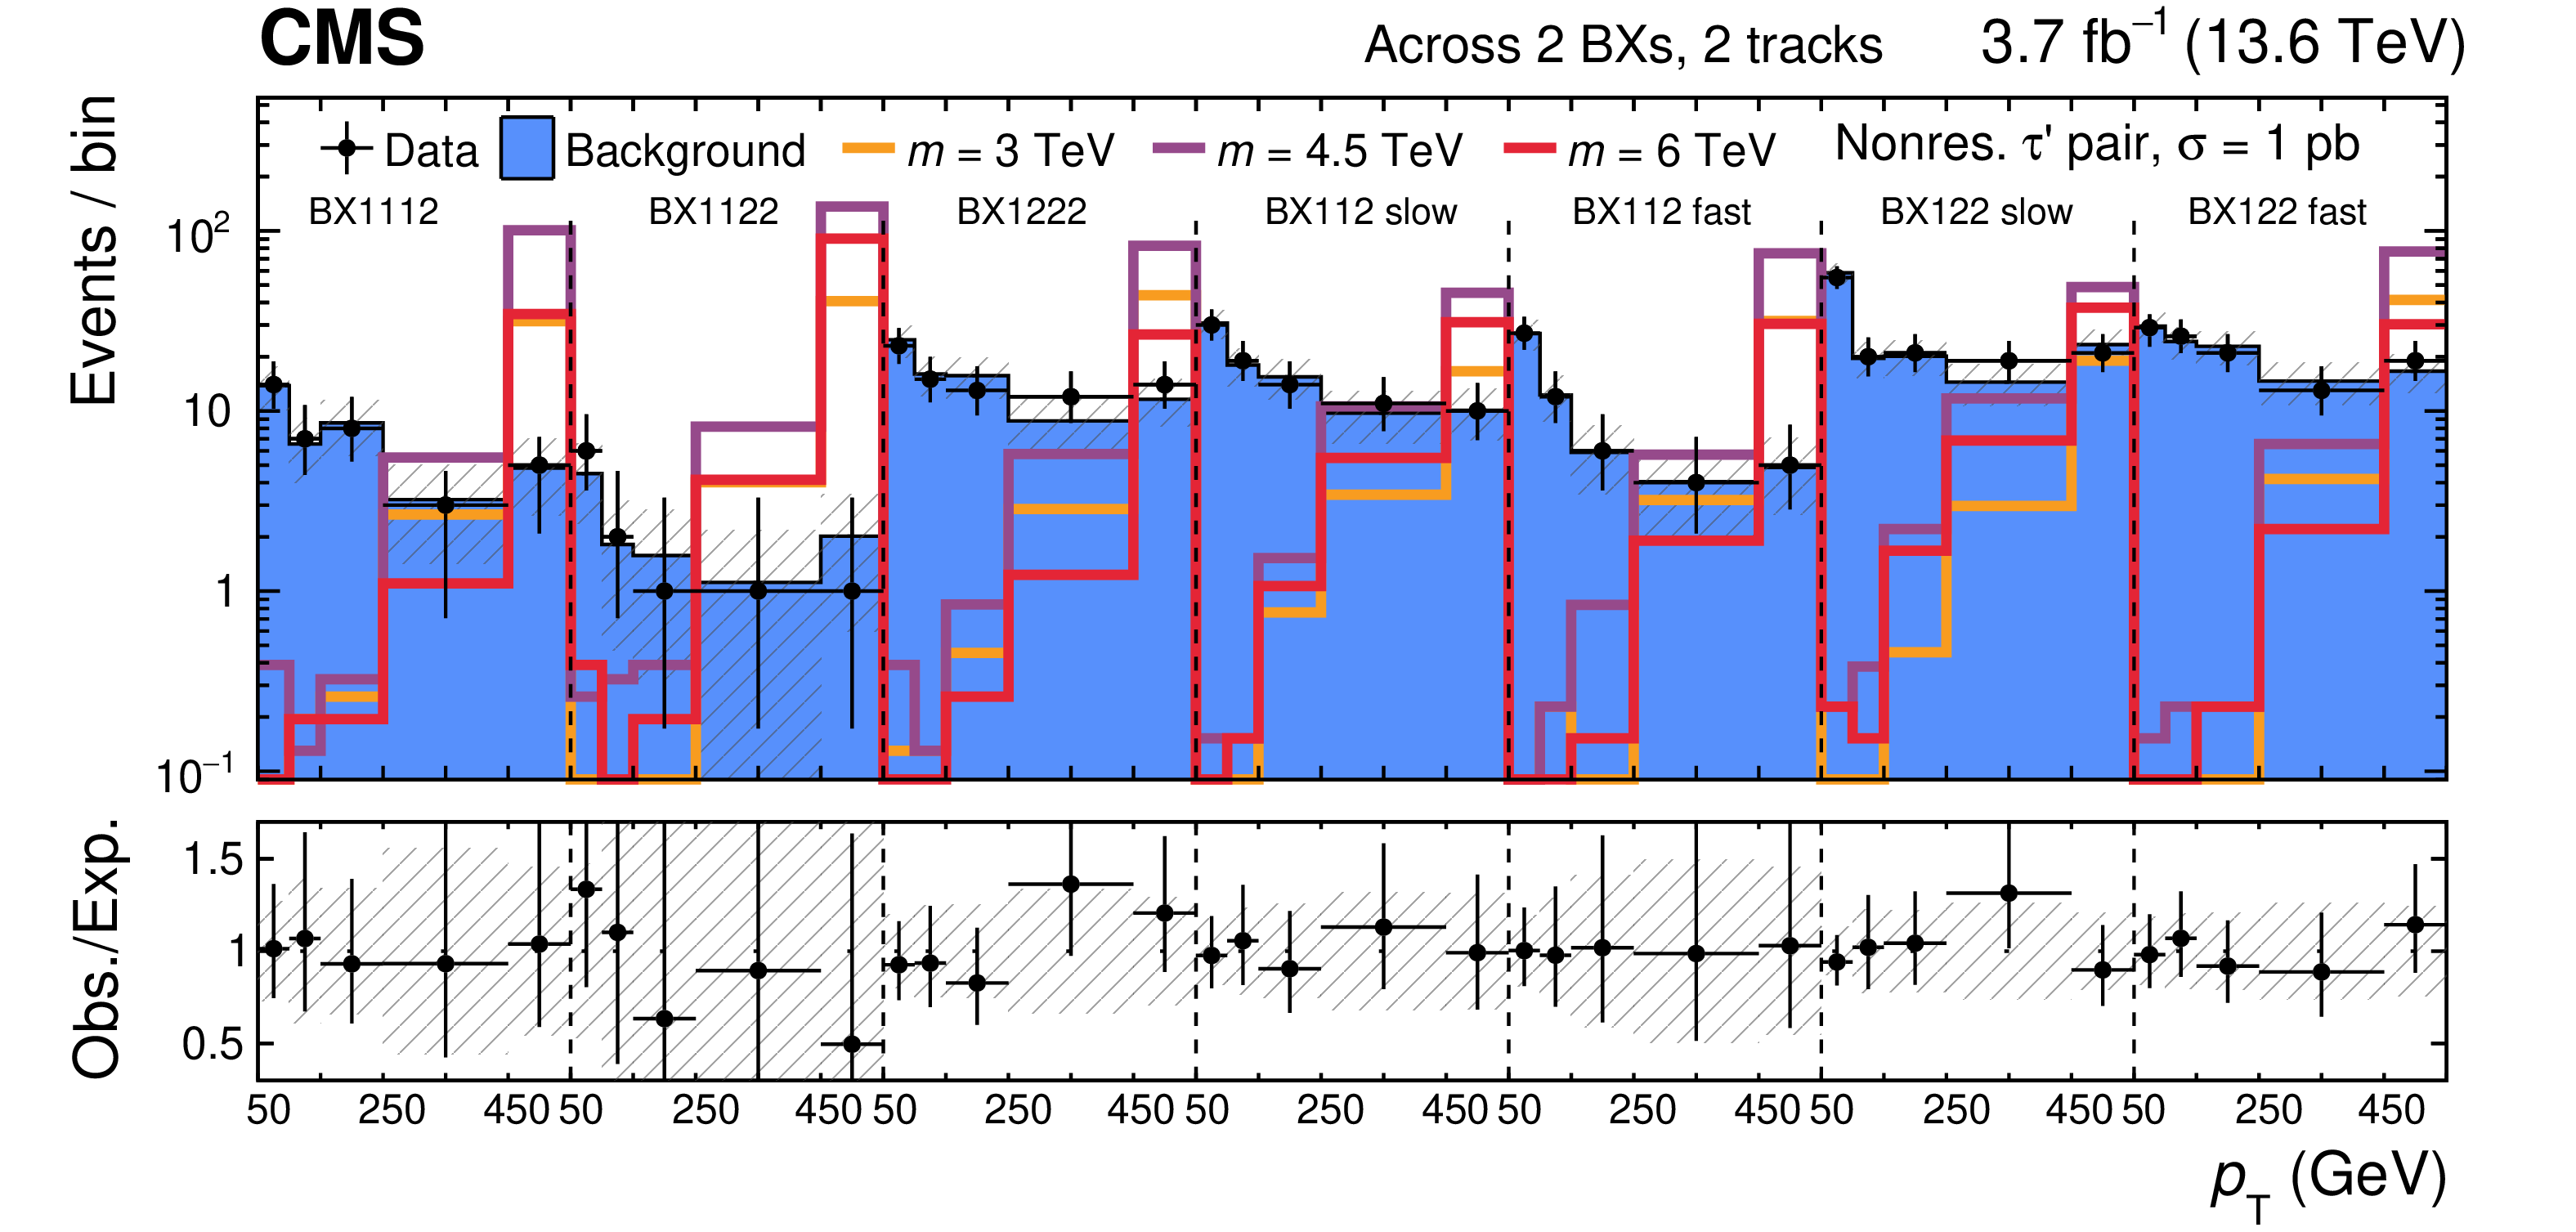
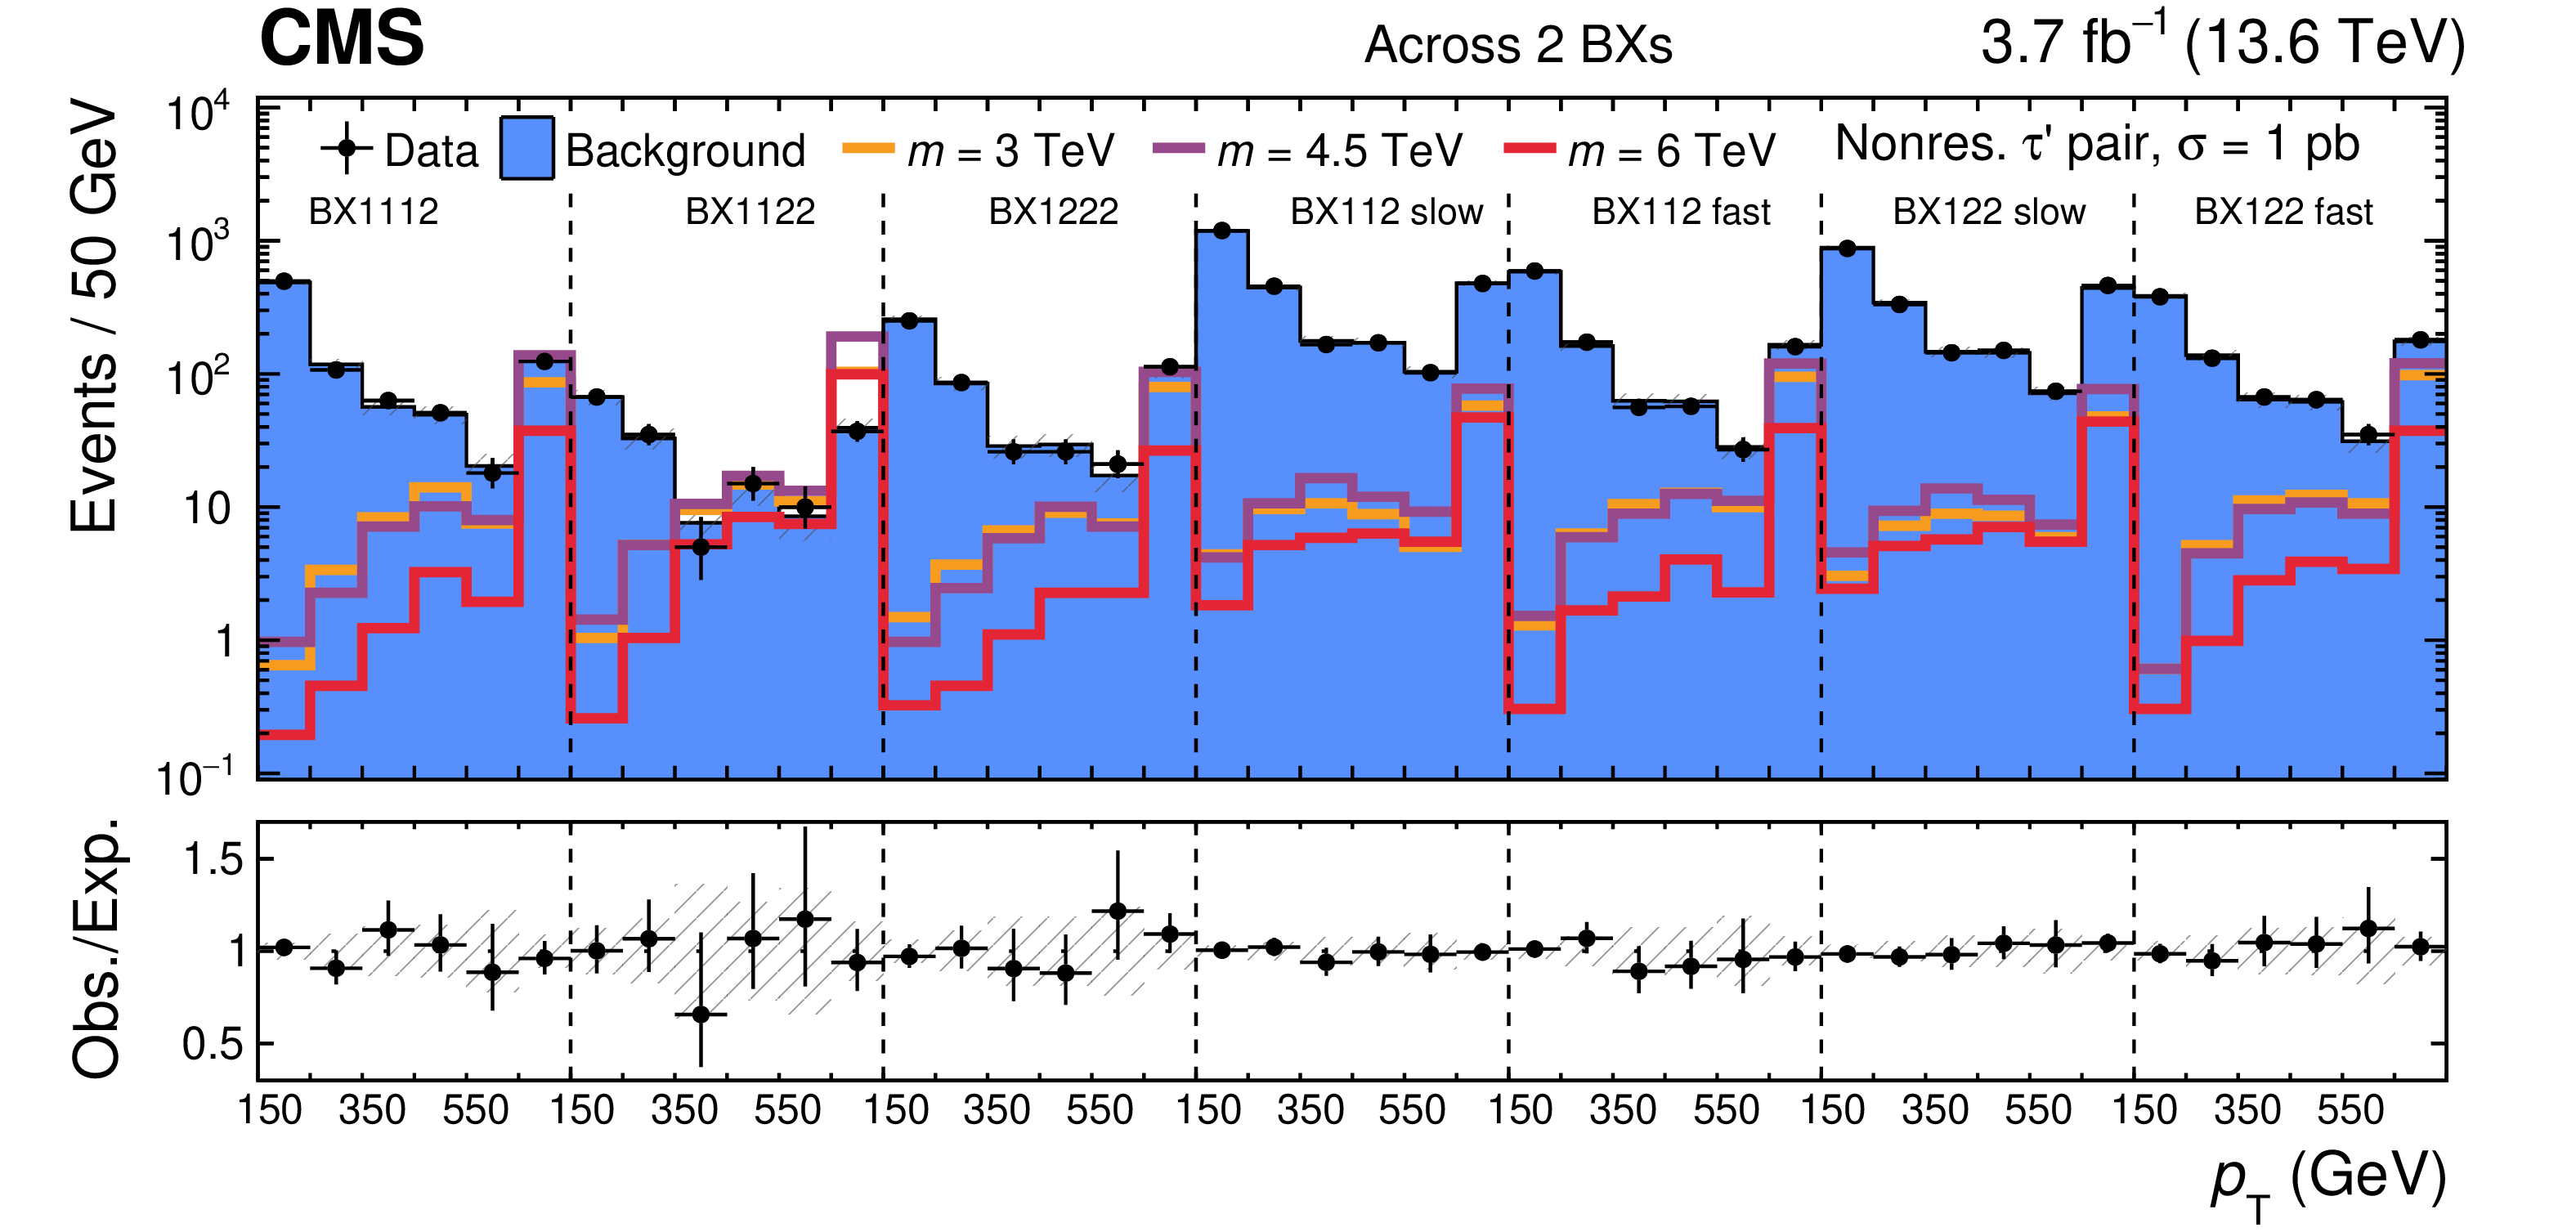
Figure 7:
The $ p_{\mathrm{T}} $ distributions in the signal region for the categories with tracks across $ > $2 ( = $ $2, = $ $2) BXs without (with, without) additional track requirement are shown in the upper (center, lower) part of the figure. The expected background distributions are the result of the maximum likelihood fit. The uncertainty bands account for all sources of background uncertainty, systematic as well as statistical, after the maximum likelihood fit. The lower panels show the observed to expected ratio. The signal is shown for a few mass hypotheses of the nonresonant fourth-generation lepton model, using a production cross section of 1\unitpb. The last $ p_{\mathrm{T}} $ bins include the overflow. |
png pdf |
Figure 7-a:
The $ p_{\mathrm{T}} $ distributions in the signal region for the categories with tracks across $ > $2 ( = $ $2, = $ $2) BXs without (with, without) additional track requirement are shown in the upper (center, lower) part of the figure. The expected background distributions are the result of the maximum likelihood fit. The uncertainty bands account for all sources of background uncertainty, systematic as well as statistical, after the maximum likelihood fit. The lower panels show the observed to expected ratio. The signal is shown for a few mass hypotheses of the nonresonant fourth-generation lepton model, using a production cross section of 1\unitpb. The last $ p_{\mathrm{T}} $ bins include the overflow. |
png pdf |
Figure 7-b:
The $ p_{\mathrm{T}} $ distributions in the signal region for the categories with tracks across $ > $2 ( = $ $2, = $ $2) BXs without (with, without) additional track requirement are shown in the upper (center, lower) part of the figure. The expected background distributions are the result of the maximum likelihood fit. The uncertainty bands account for all sources of background uncertainty, systematic as well as statistical, after the maximum likelihood fit. The lower panels show the observed to expected ratio. The signal is shown for a few mass hypotheses of the nonresonant fourth-generation lepton model, using a production cross section of 1\unitpb. The last $ p_{\mathrm{T}} $ bins include the overflow. |
png pdf |
Figure 7-c:
The $ p_{\mathrm{T}} $ distributions in the signal region for the categories with tracks across $ > $2 ( = $ $2, = $ $2) BXs without (with, without) additional track requirement are shown in the upper (center, lower) part of the figure. The expected background distributions are the result of the maximum likelihood fit. The uncertainty bands account for all sources of background uncertainty, systematic as well as statistical, after the maximum likelihood fit. The lower panels show the observed to expected ratio. The signal is shown for a few mass hypotheses of the nonresonant fourth-generation lepton model, using a production cross section of 1\unitpb. The last $ p_{\mathrm{T}} $ bins include the overflow. |
png pdf |
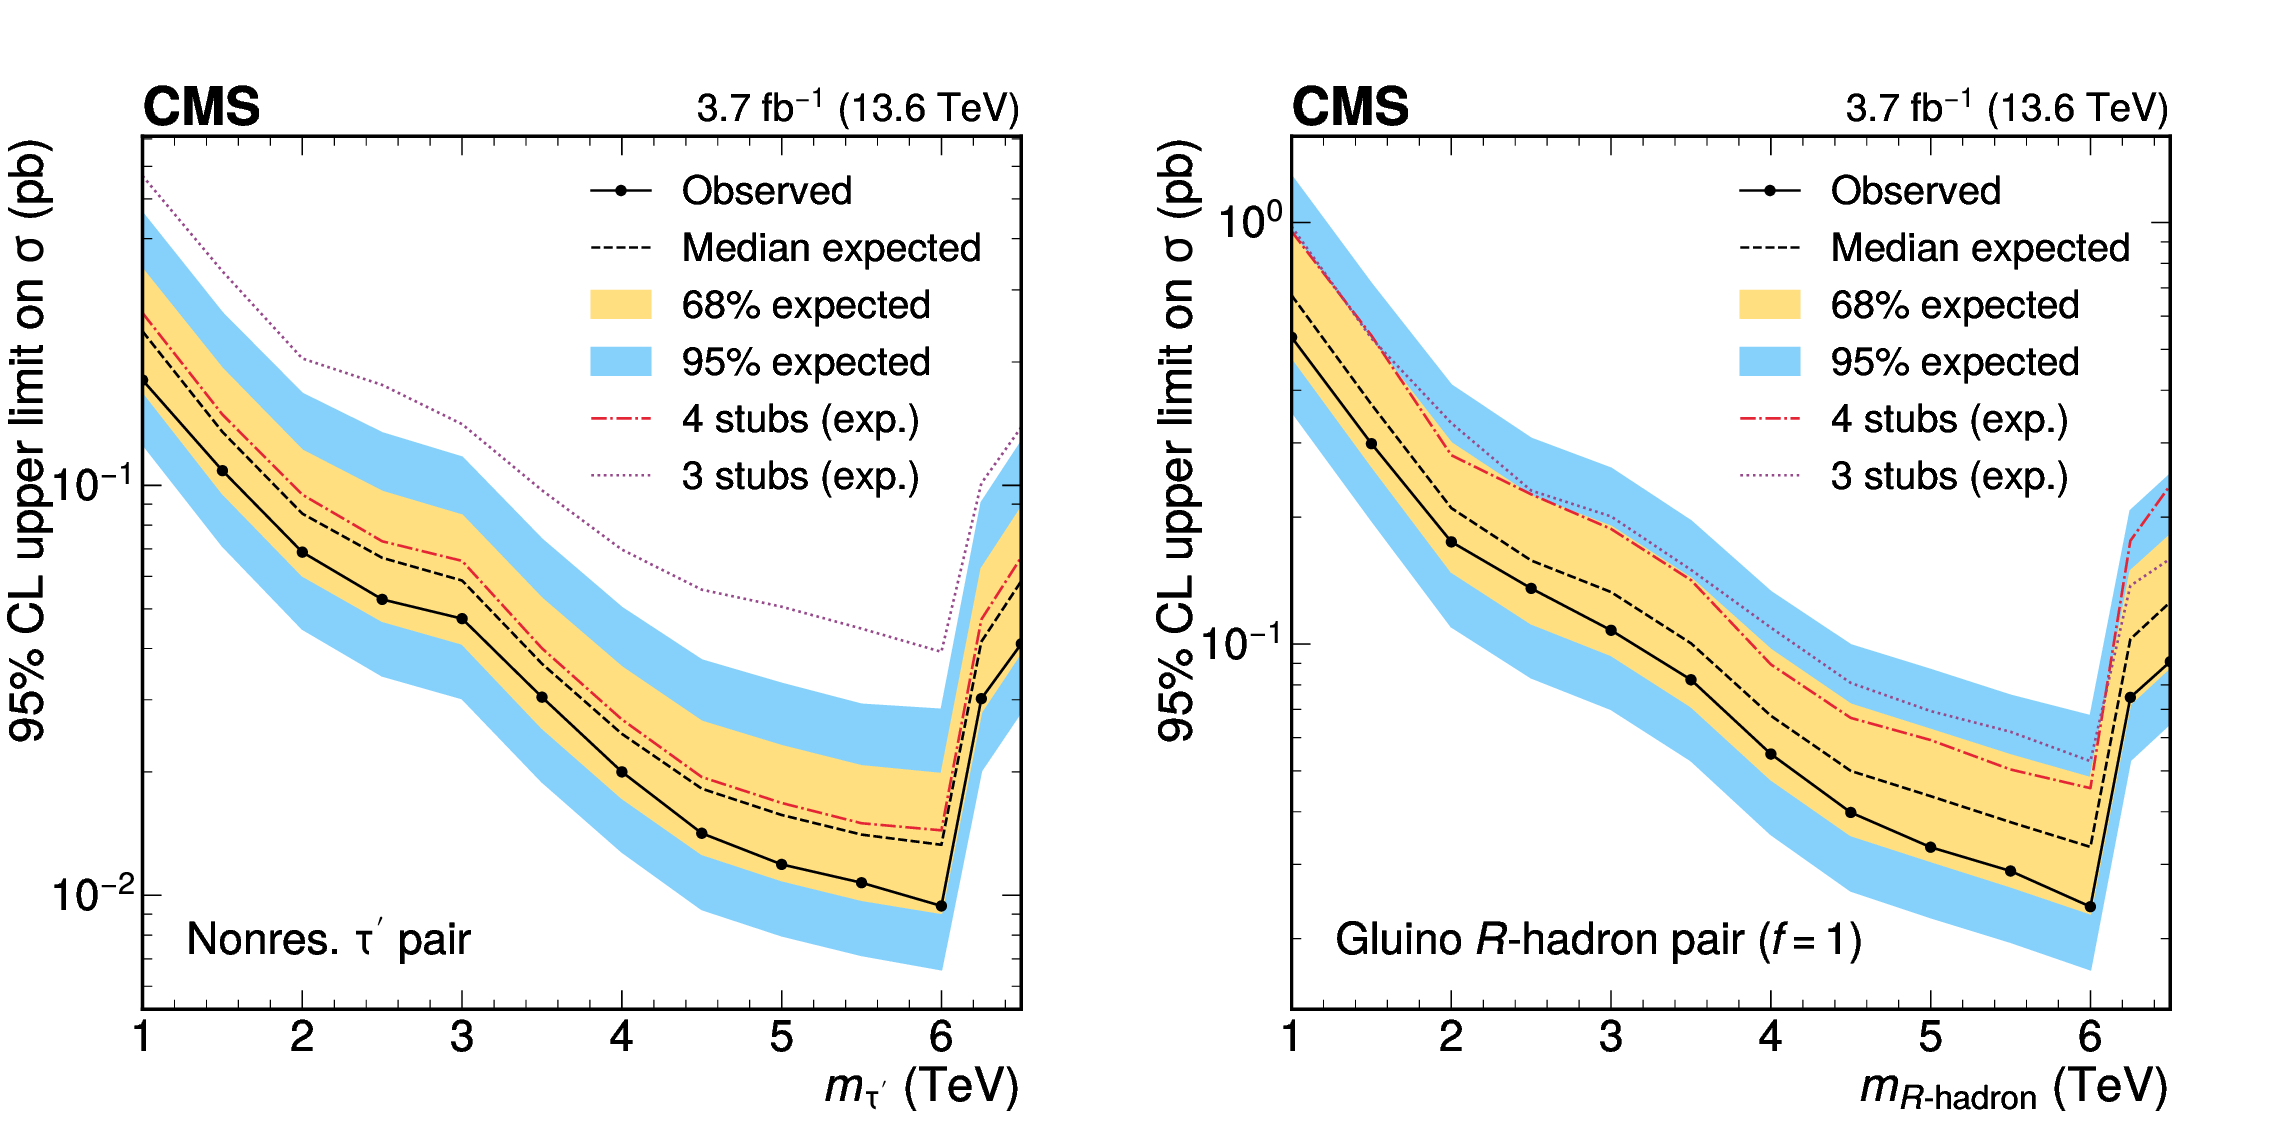
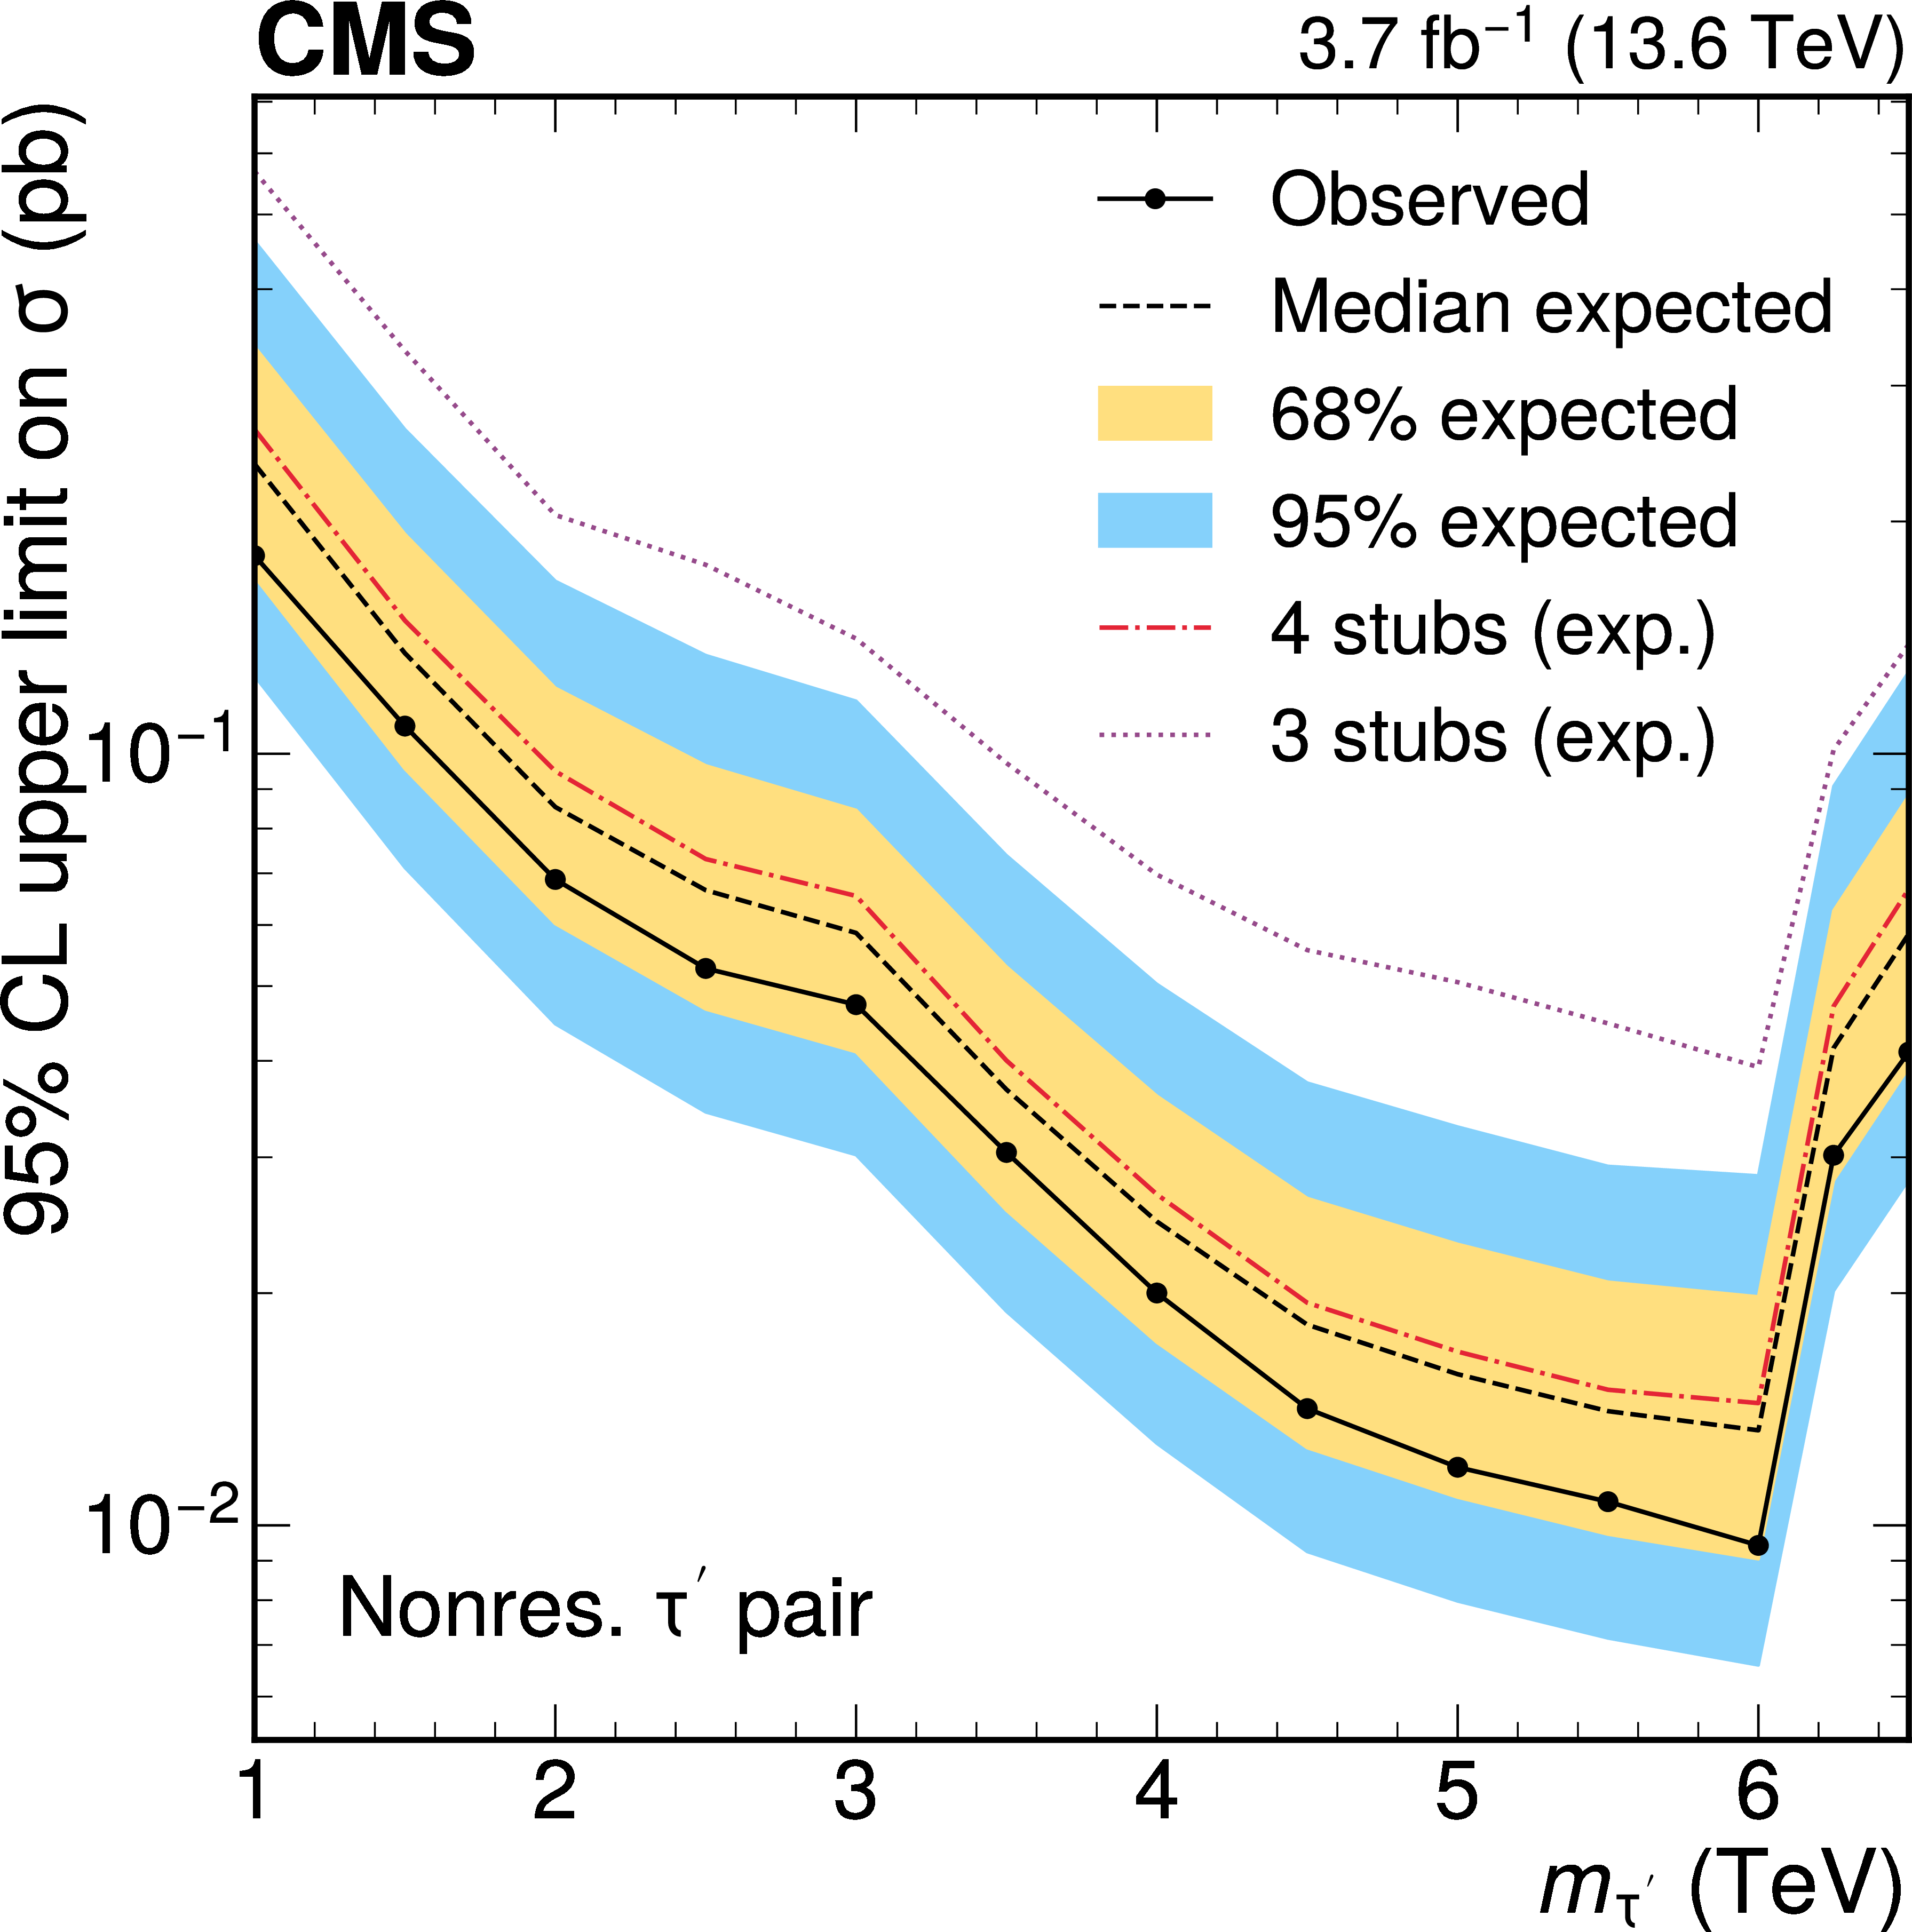
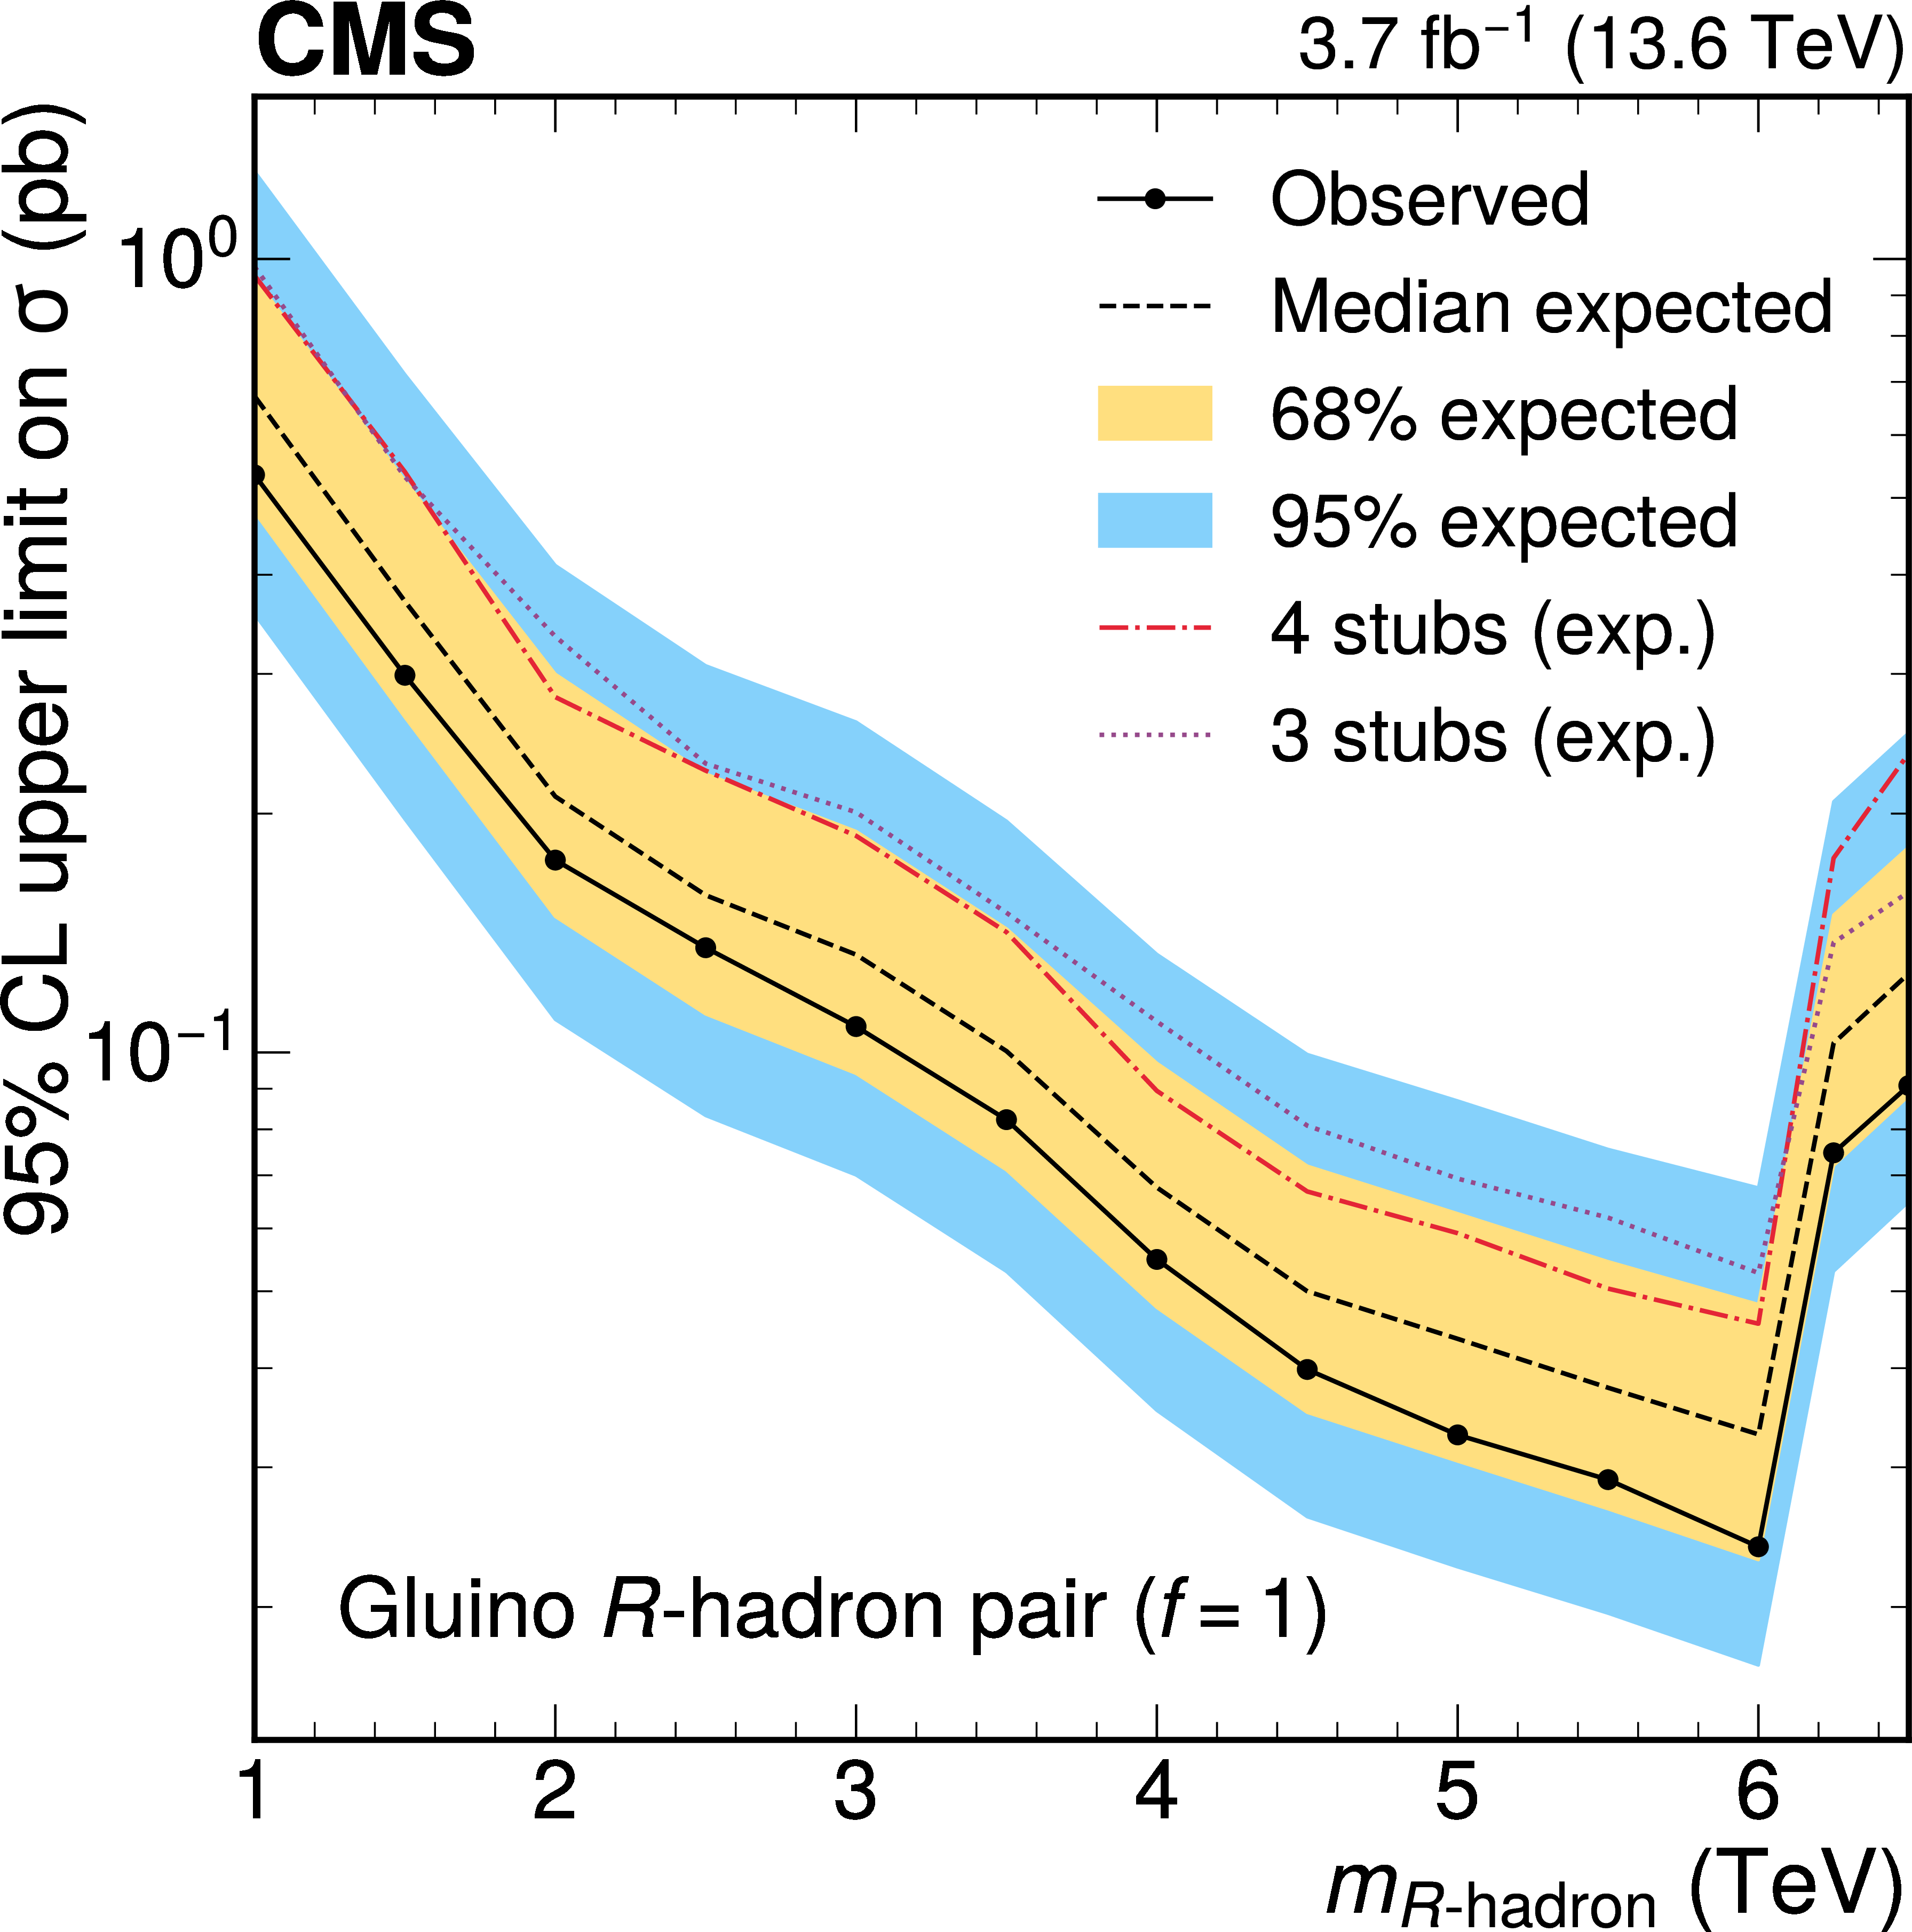
Figure 8:
Observed (solid line with markers) and expected (dashed black line) upper limits at 95% CL on the production cross section of heavy fourth-generation leptons through nonresonant DY production (left) and of a gluino $ R $-hadron pair with $ f= $ 1 (right). The inner (yellow) and the outer (blue) bands indicate the regions containing 68 and 95%, respectively, of the distribution of limits expected under the background-only hypothesis. The expected limits for the combinations of 3-stub (dashed purple line) and 4-stub (dashed-red line) categories are also shown. |
png pdf |
Figure 8-a:
Observed (solid line with markers) and expected (dashed black line) upper limits at 95% CL on the production cross section of heavy fourth-generation leptons through nonresonant DY production (left) and of a gluino $ R $-hadron pair with $ f= $ 1 (right). The inner (yellow) and the outer (blue) bands indicate the regions containing 68 and 95%, respectively, of the distribution of limits expected under the background-only hypothesis. The expected limits for the combinations of 3-stub (dashed purple line) and 4-stub (dashed-red line) categories are also shown. |
png pdf |
Figure 8-b:
Observed (solid line with markers) and expected (dashed black line) upper limits at 95% CL on the production cross section of heavy fourth-generation leptons through nonresonant DY production (left) and of a gluino $ R $-hadron pair with $ f= $ 1 (right). The inner (yellow) and the outer (blue) bands indicate the regions containing 68 and 95%, respectively, of the distribution of limits expected under the background-only hypothesis. The expected limits for the combinations of 3-stub (dashed purple line) and 4-stub (dashed-red line) categories are also shown. |
png pdf |
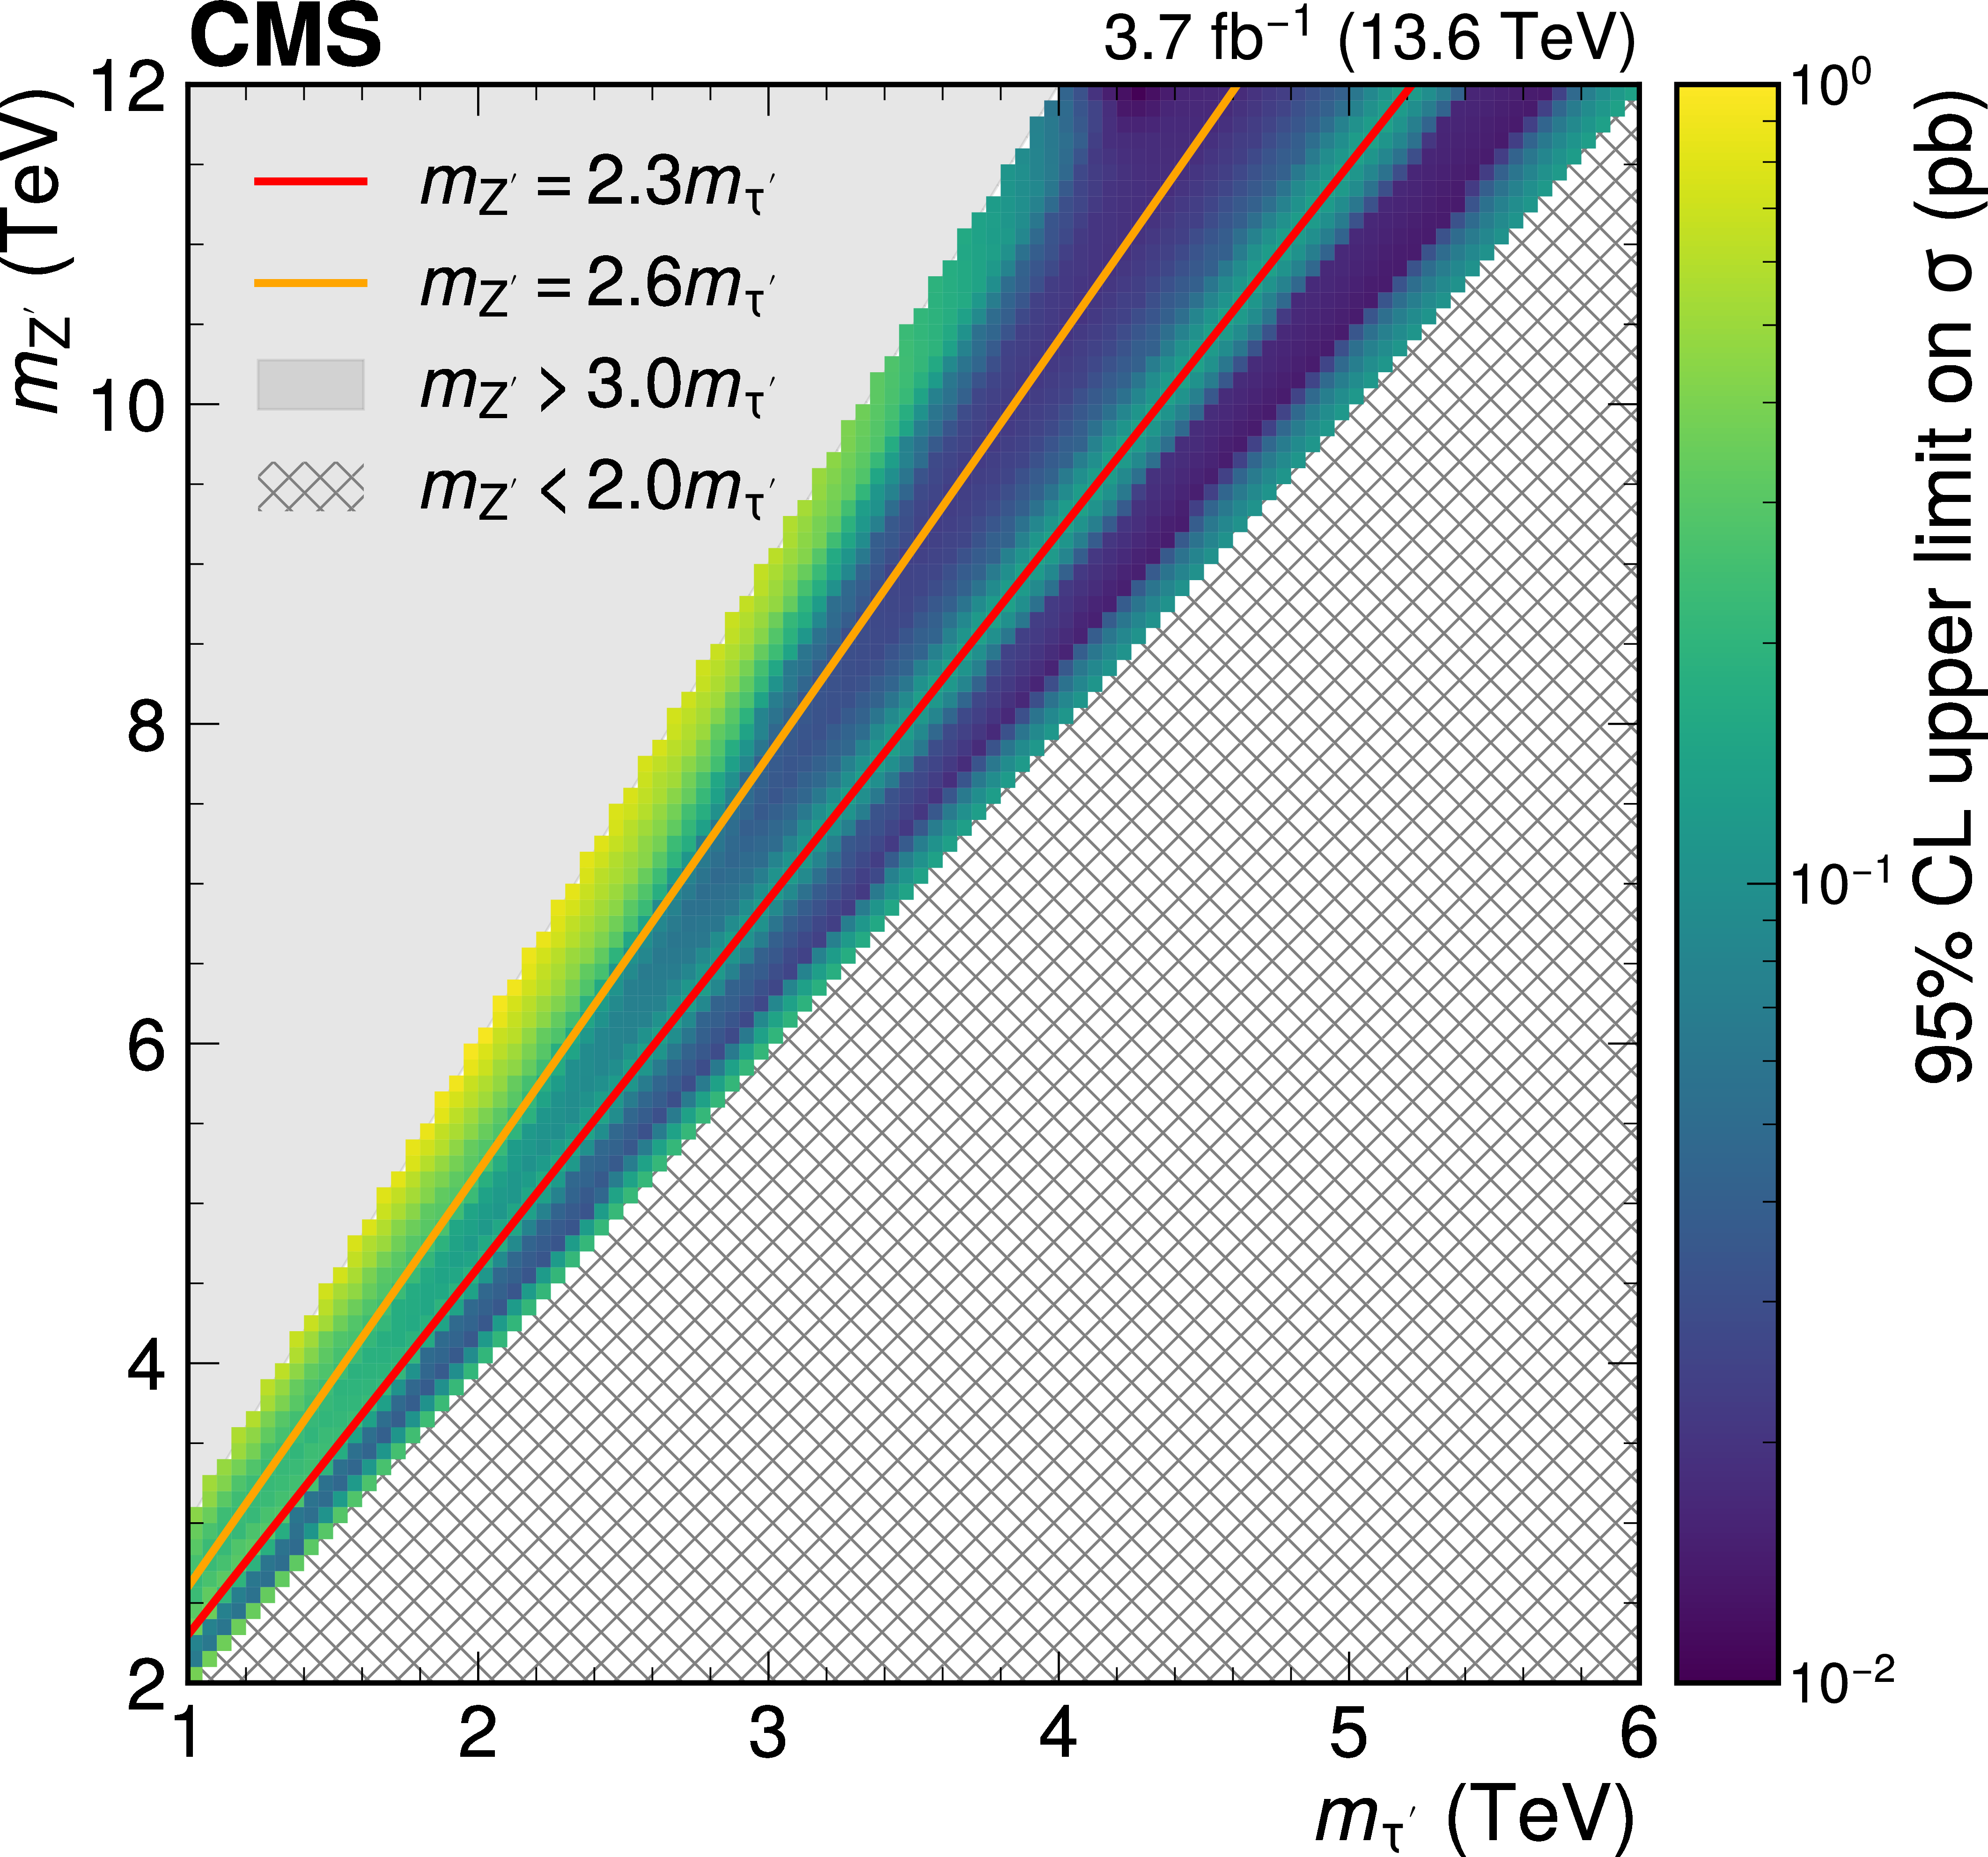
Figure 9:
Observed upper limits at 95% CL on the production cross section of heavy fourth-generation leptons through $ \mathrm{Z}^{'} $ boson decays. Lines indicate different values of the ratio of $ \mathrm{Z}^{'} $ to $ \tau^{'} $ masses, for which $ \beta $ values are typically similar. Signal hypotheses with 2 $ m_{\tau^{'}} < m_{\mathrm{Z}^{'}} < 3m_{\tau^{'}} $ are probed. For $ m_{\mathrm{Z}^{'}} > 3m_{\tau^{'}} $, the HSCPs typically have high $ \beta $ and are reconstructed in the same BX. The lowest limits are obtained for $ m_{\mathrm{Z}^{'}}/m_{\tau^{'}}\approx $ 2.15 (2.60), for which HSCPs are dominantly produced with $ \beta\approx $ 0.2 (0.6). The higher limits for $ m_{\mathrm{Z}^{'}}/m_{\tau^{'}}\approx $ 2.30 are related to the low analysis acceptance for HSCPs produced with $ \beta\approx $ 0.5 and largely reconstructed in a single BX. |
png pdf |
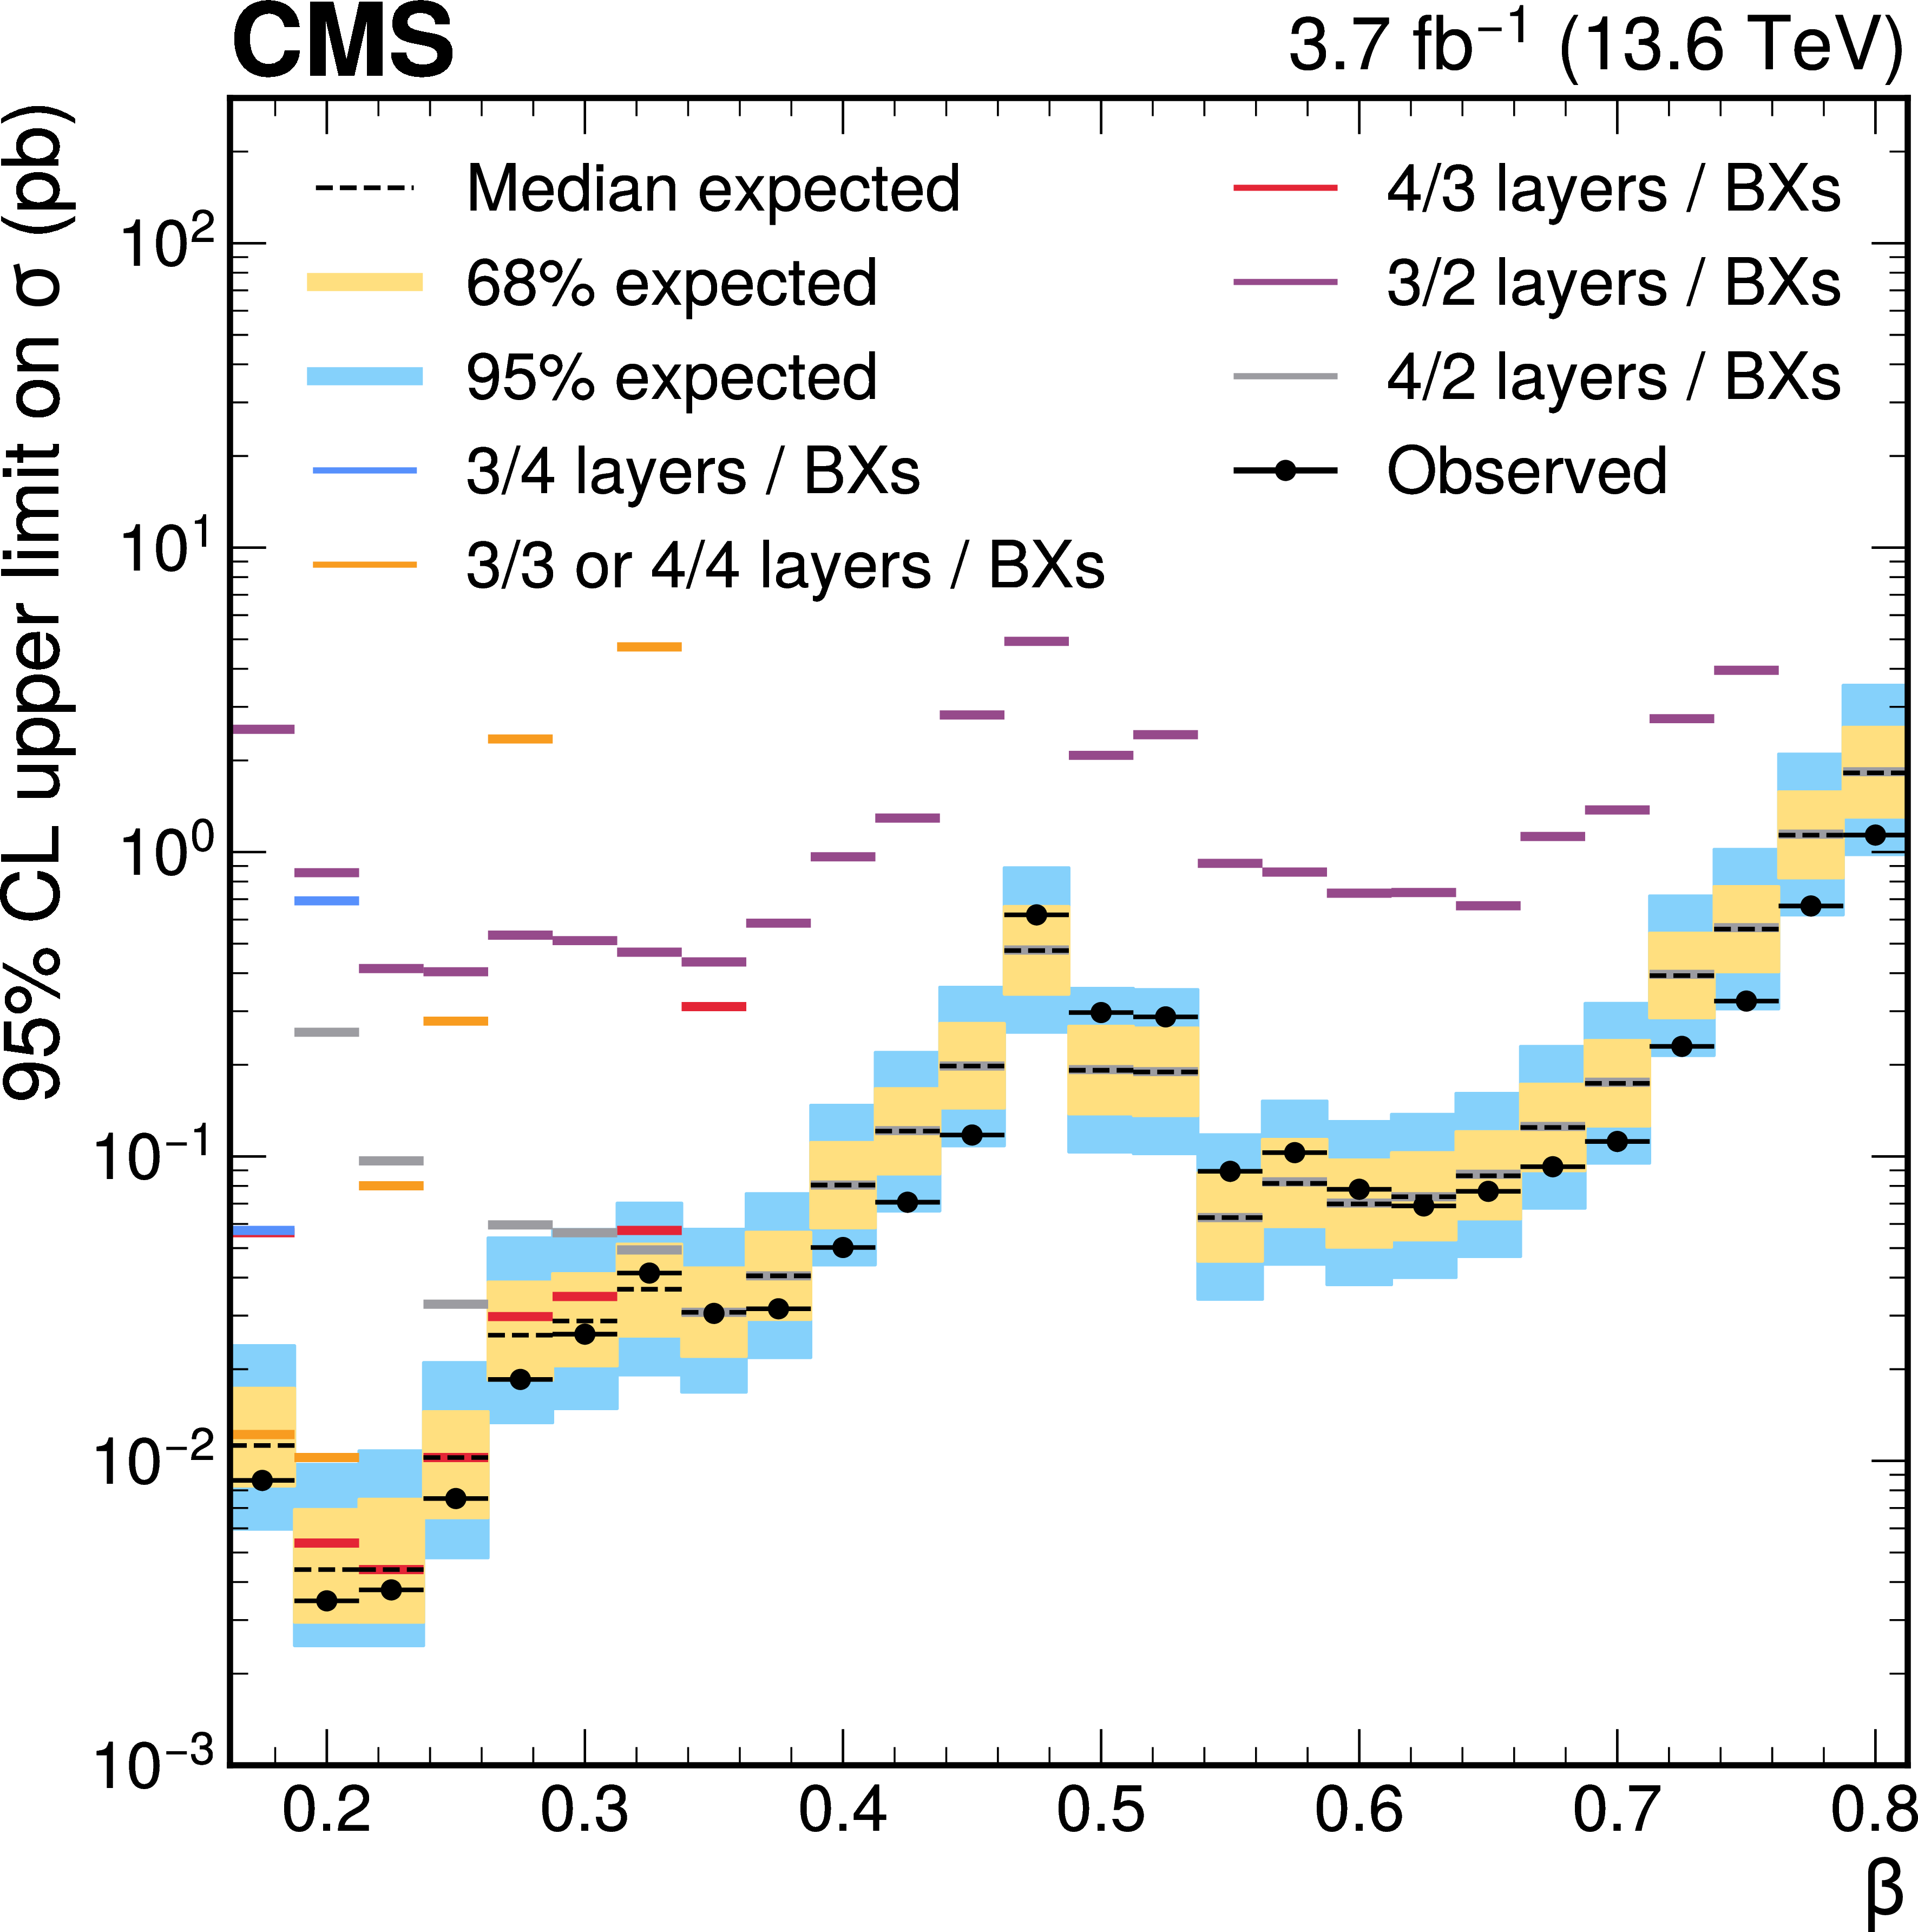
Figure 10:
Observed and expected upper limits at 95% CL on the fiducial cross section of a heavy particle leaving a signature in the muon detector with $ |\eta| < $ 0.83, $ p_{\mathrm{T}} > $ 500 GeV, in bins of $ \beta $. The inner (yellow) and the outer (blue) bands indicate the regions containing 68 and 95%, respectively, of the distribution of limits expected under the background-only hypothesis. The expected limits for groups of categories corresponding to a different number of muon detector layers crossed per BX are also shown with colored dashed lines. The limited sensitivity around $ \beta= $ 0.5 corresponds to a loss of acceptance from particles reconstructed entirely in the BX that followed the collision. |
png pdf |
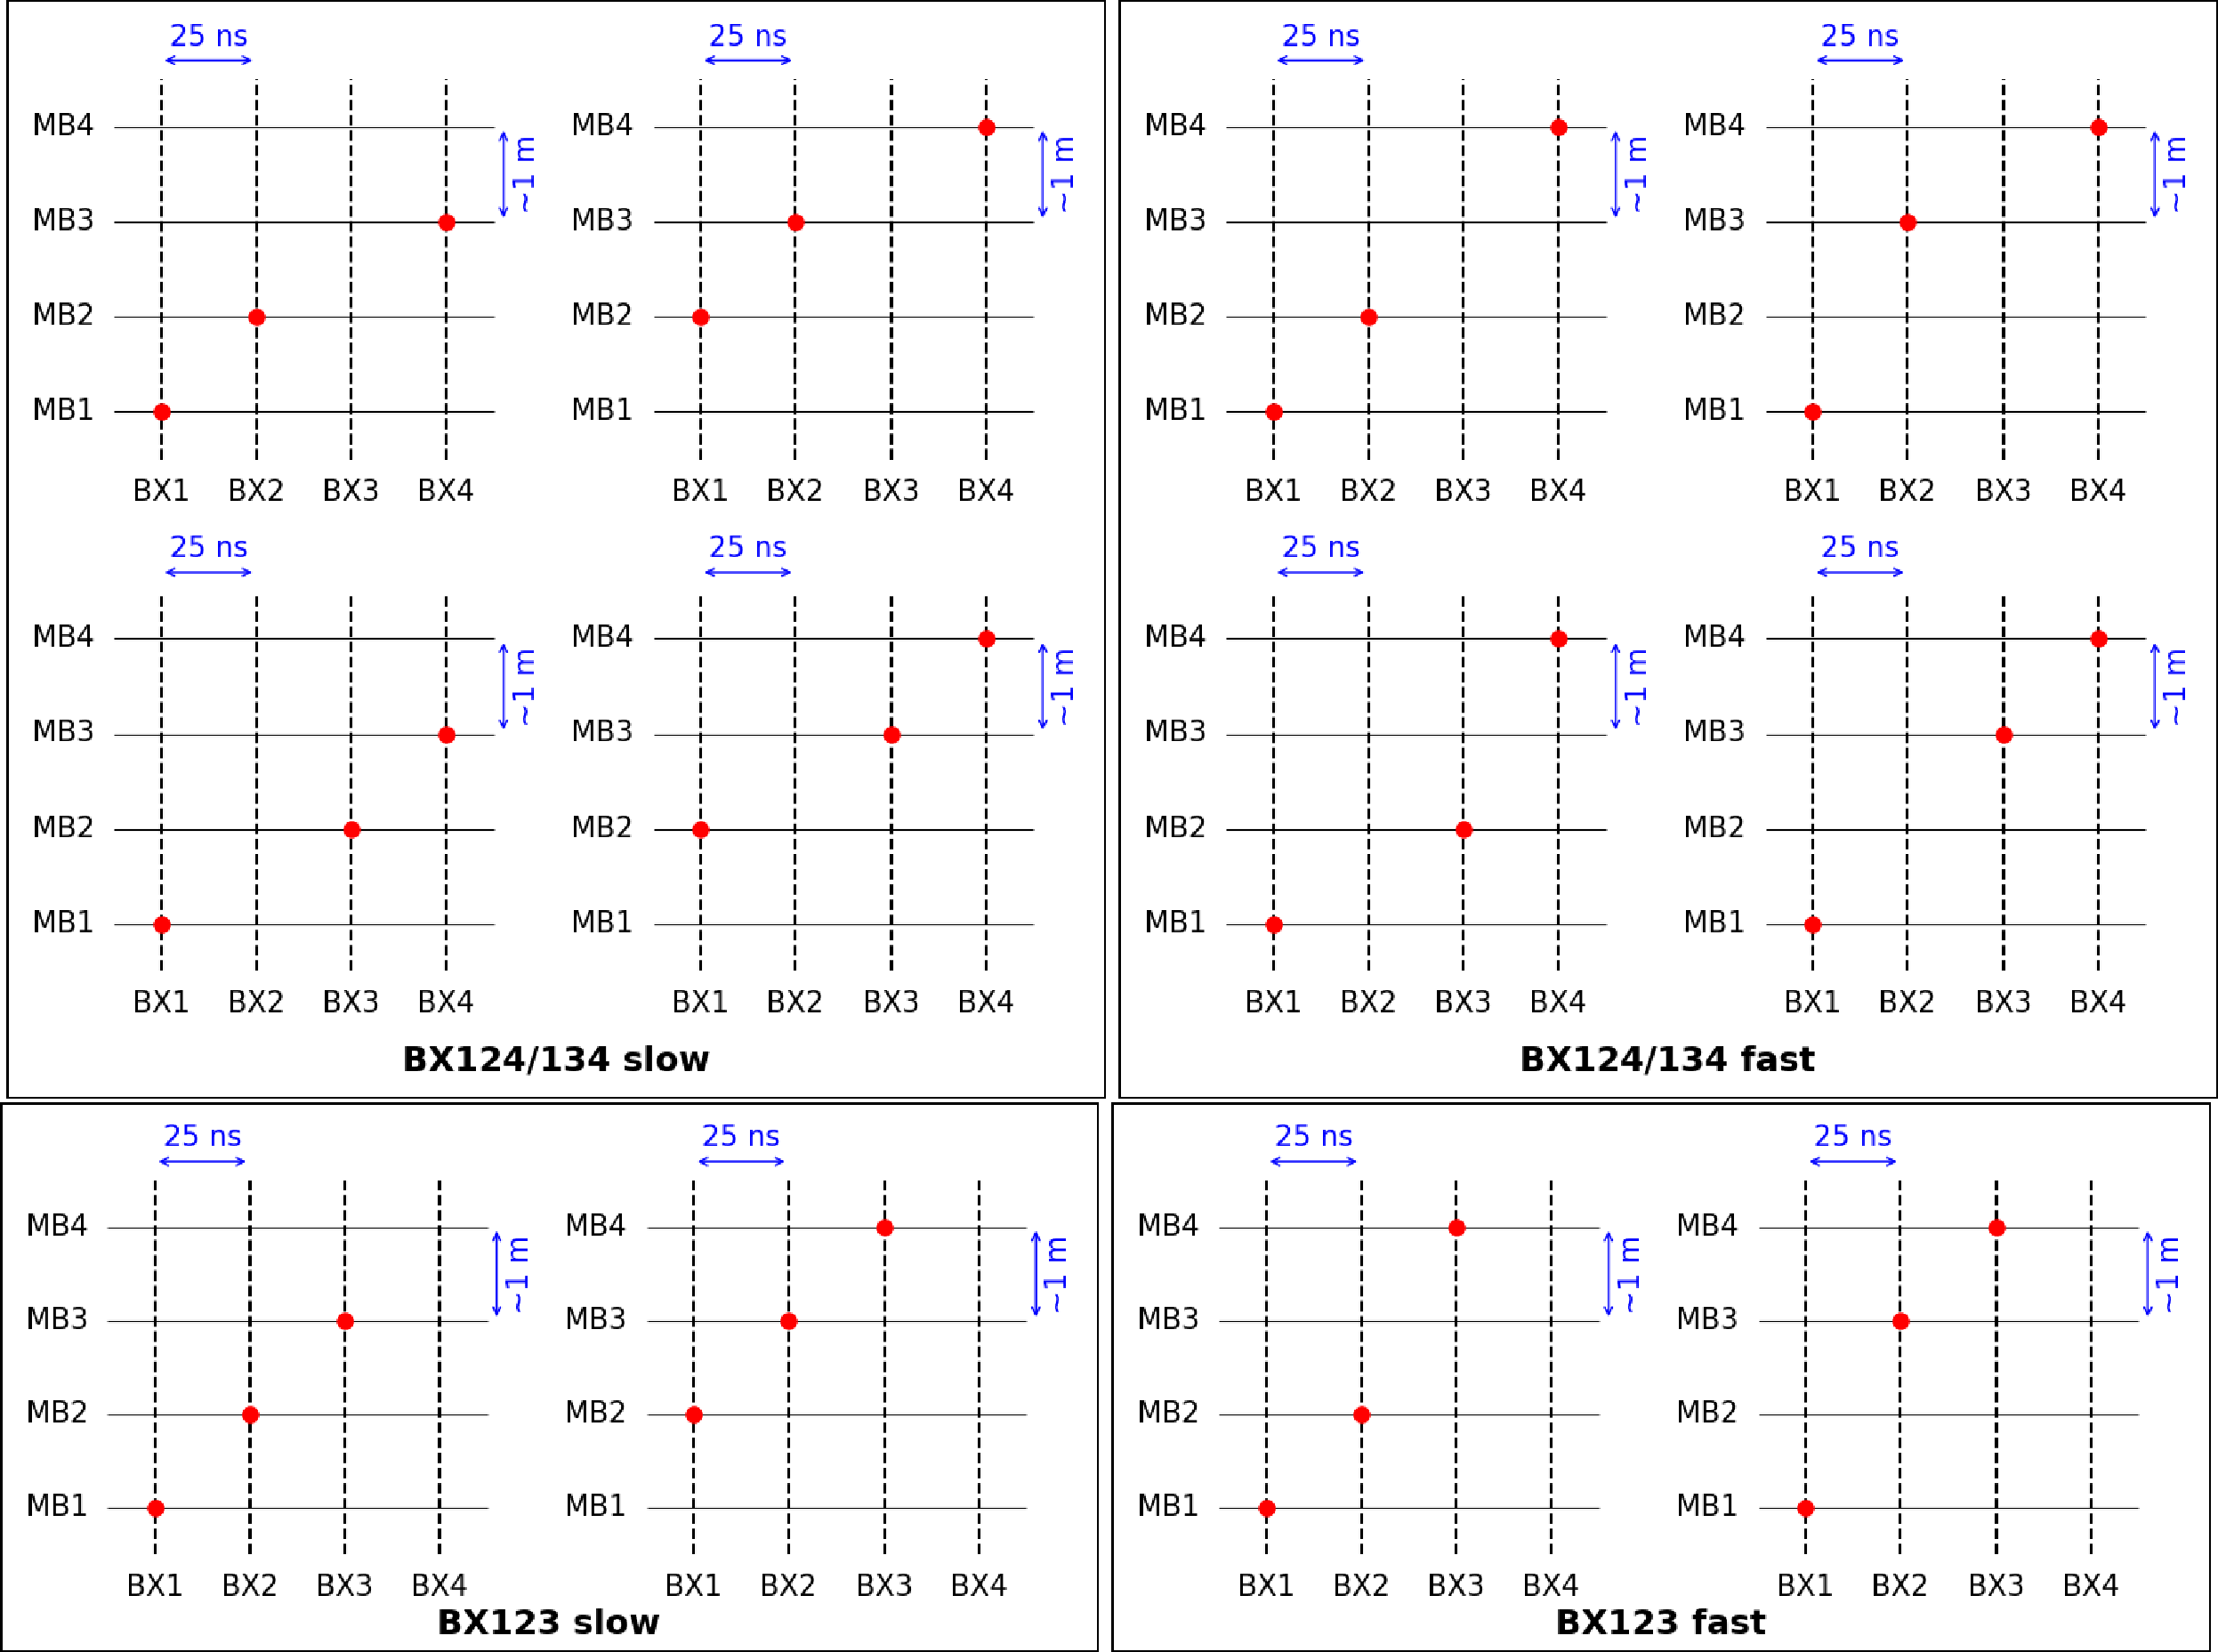
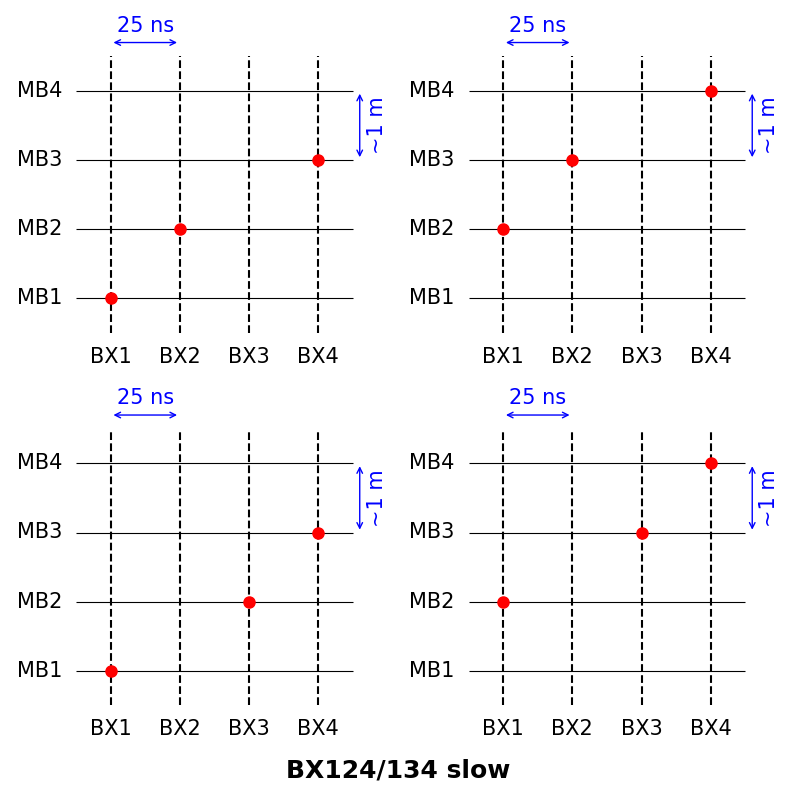
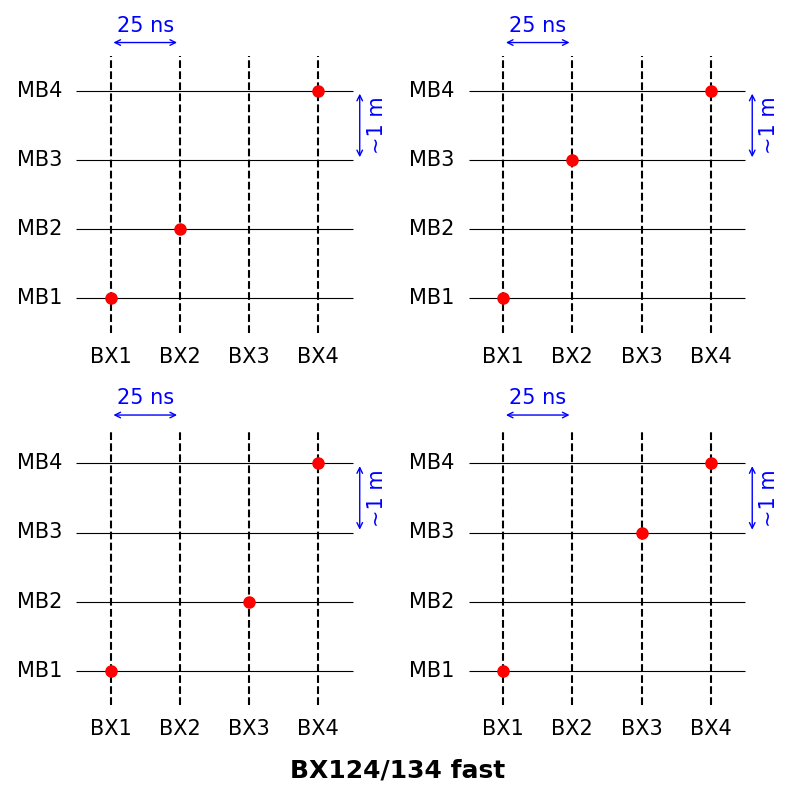
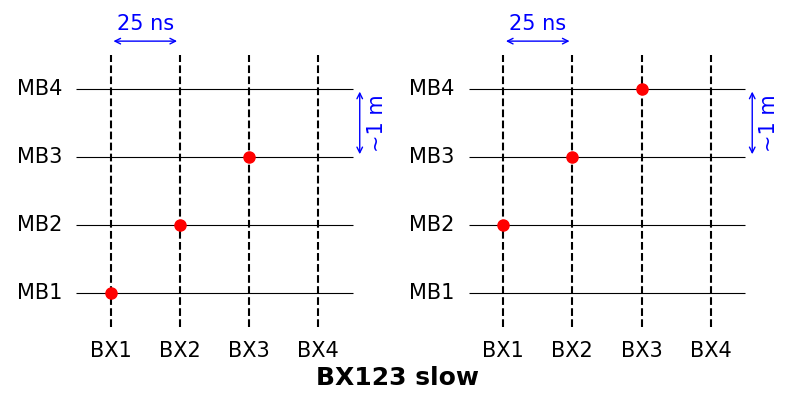
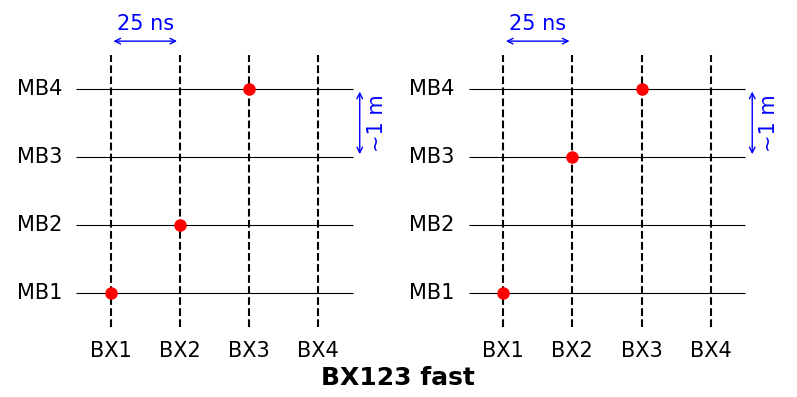
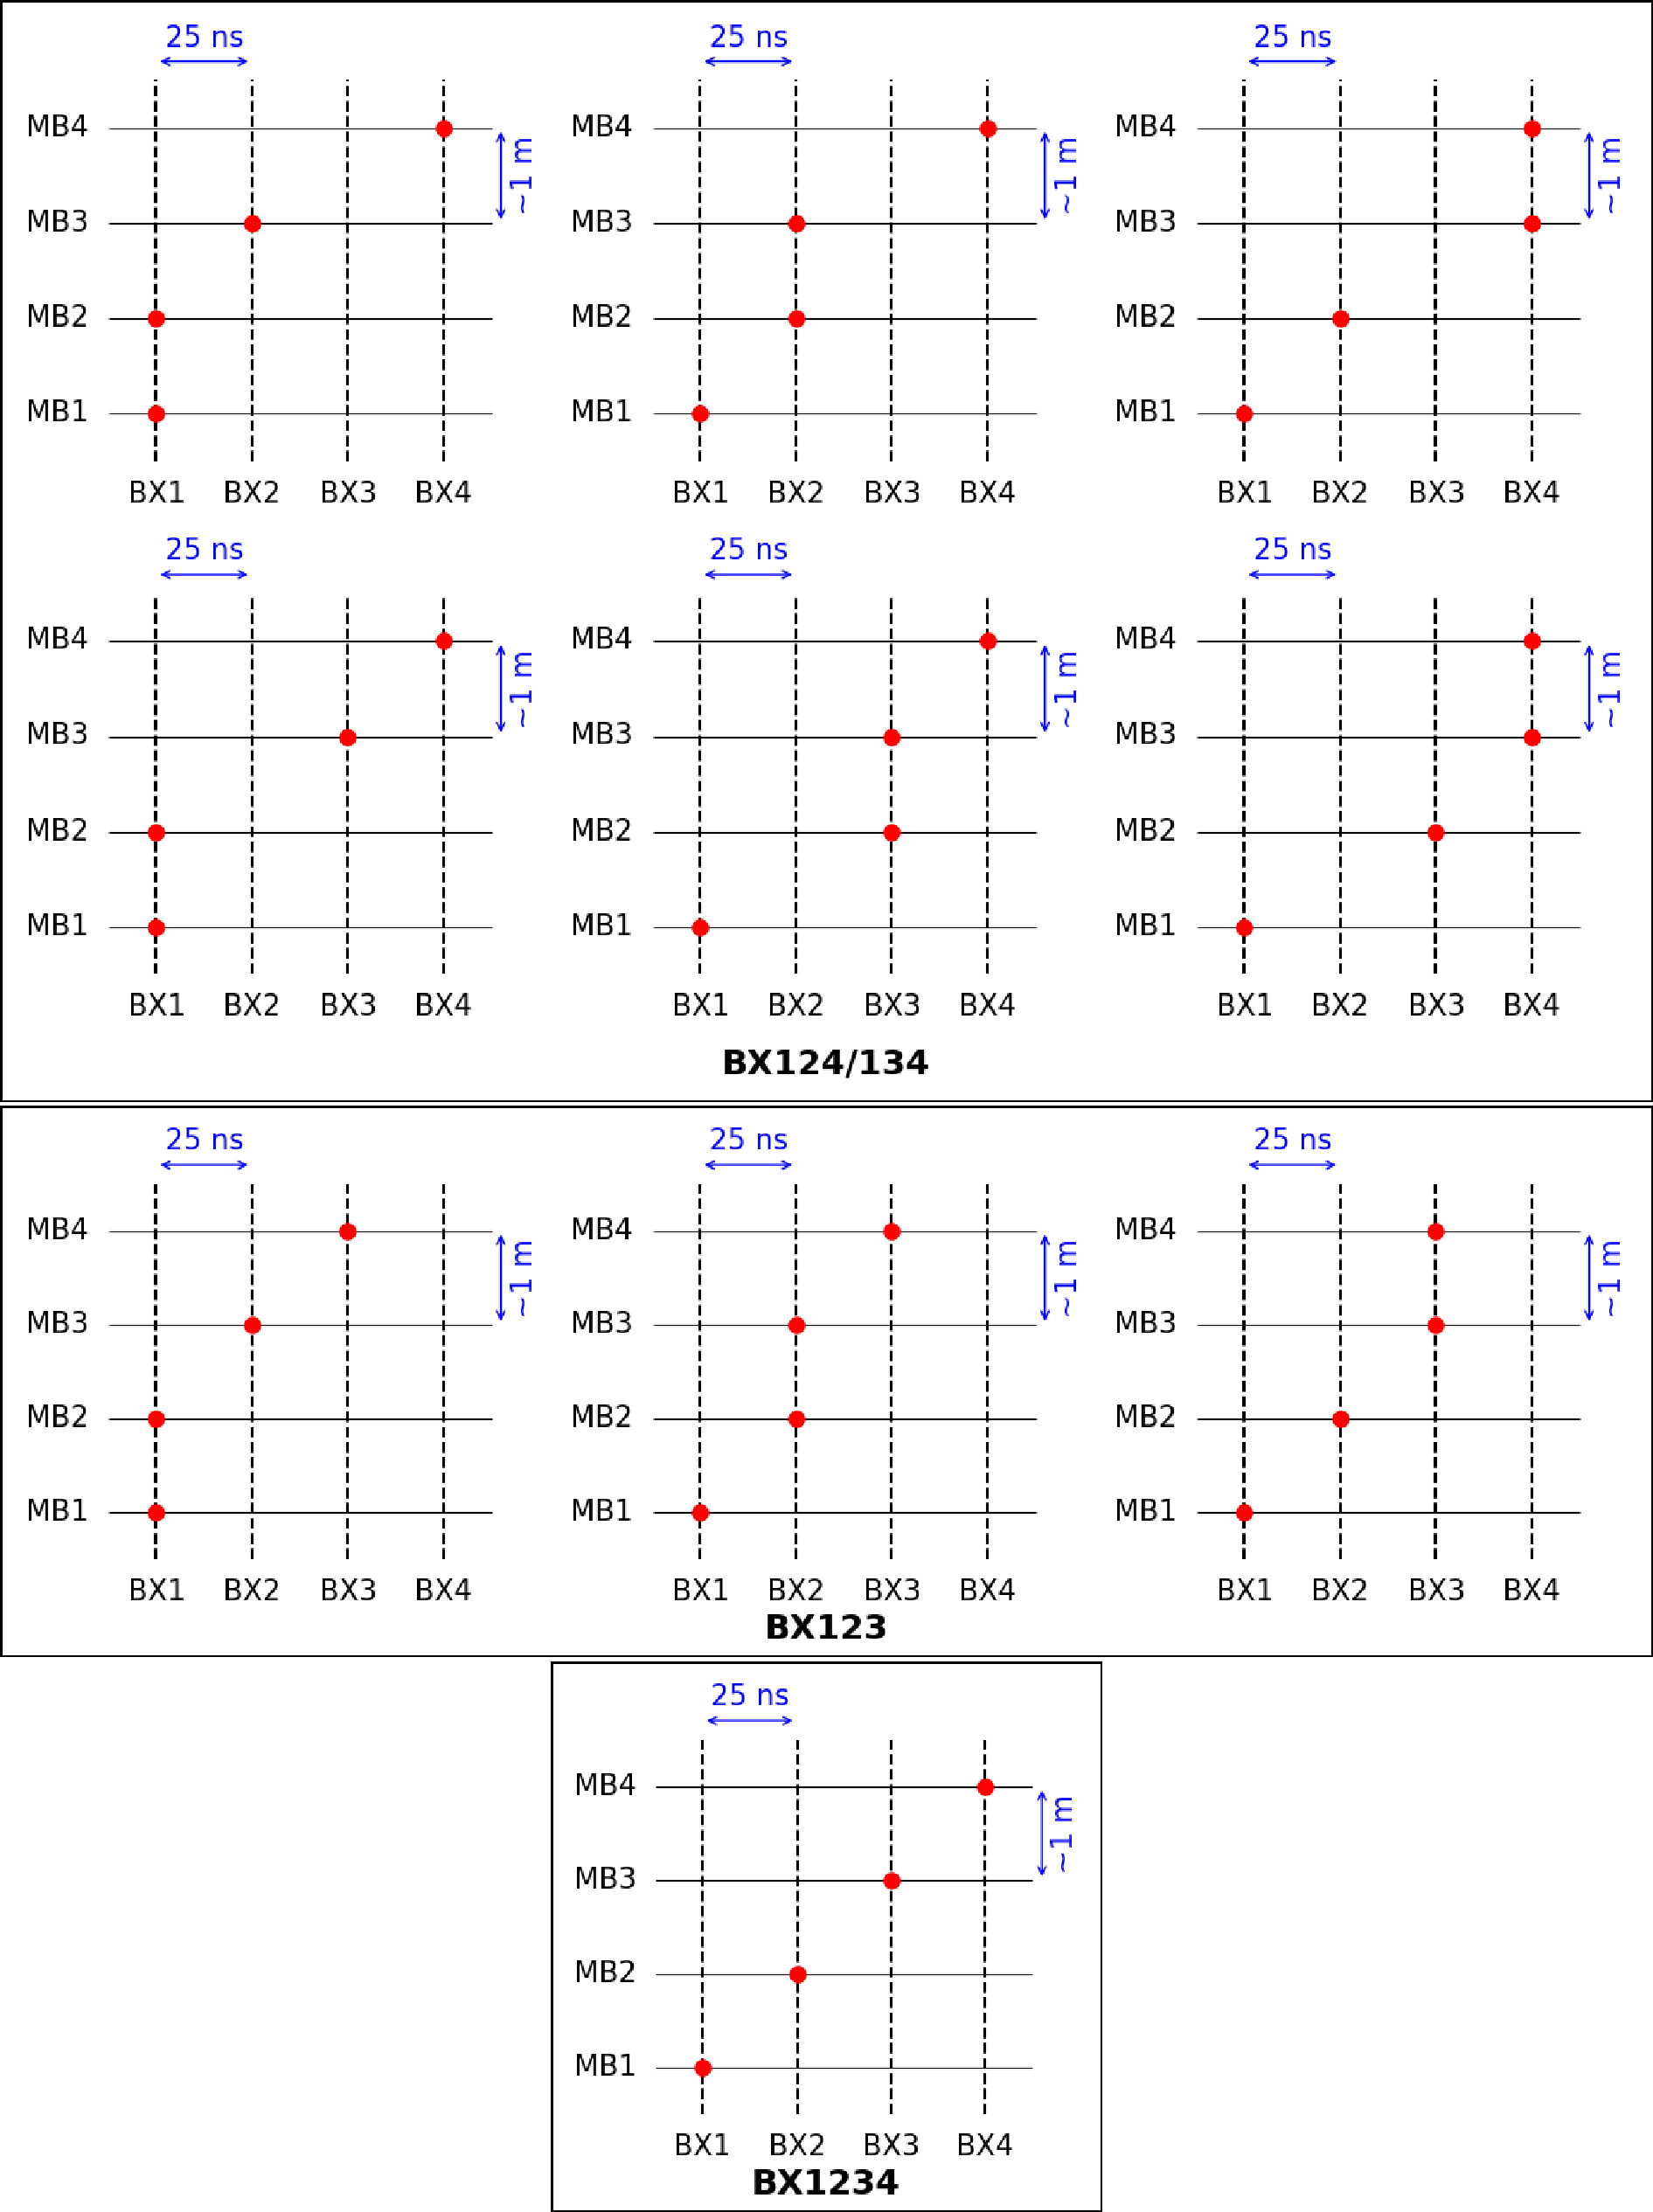
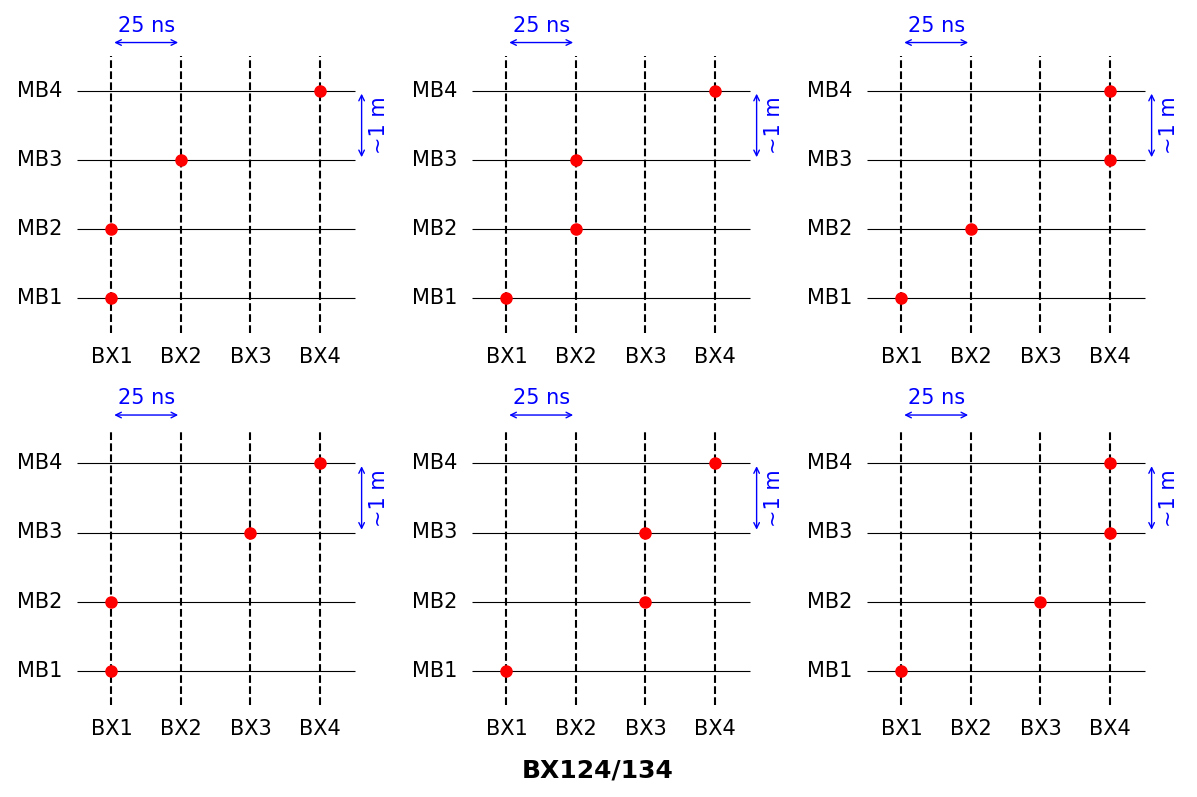
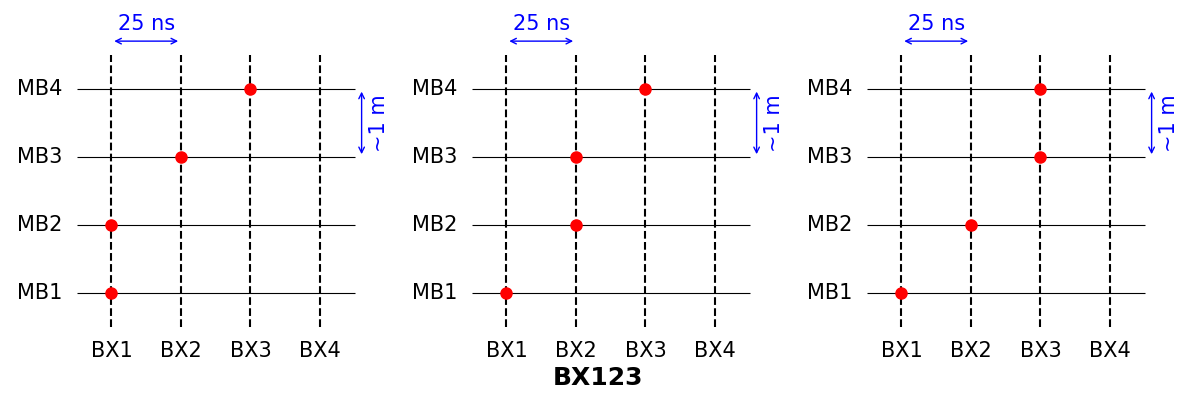
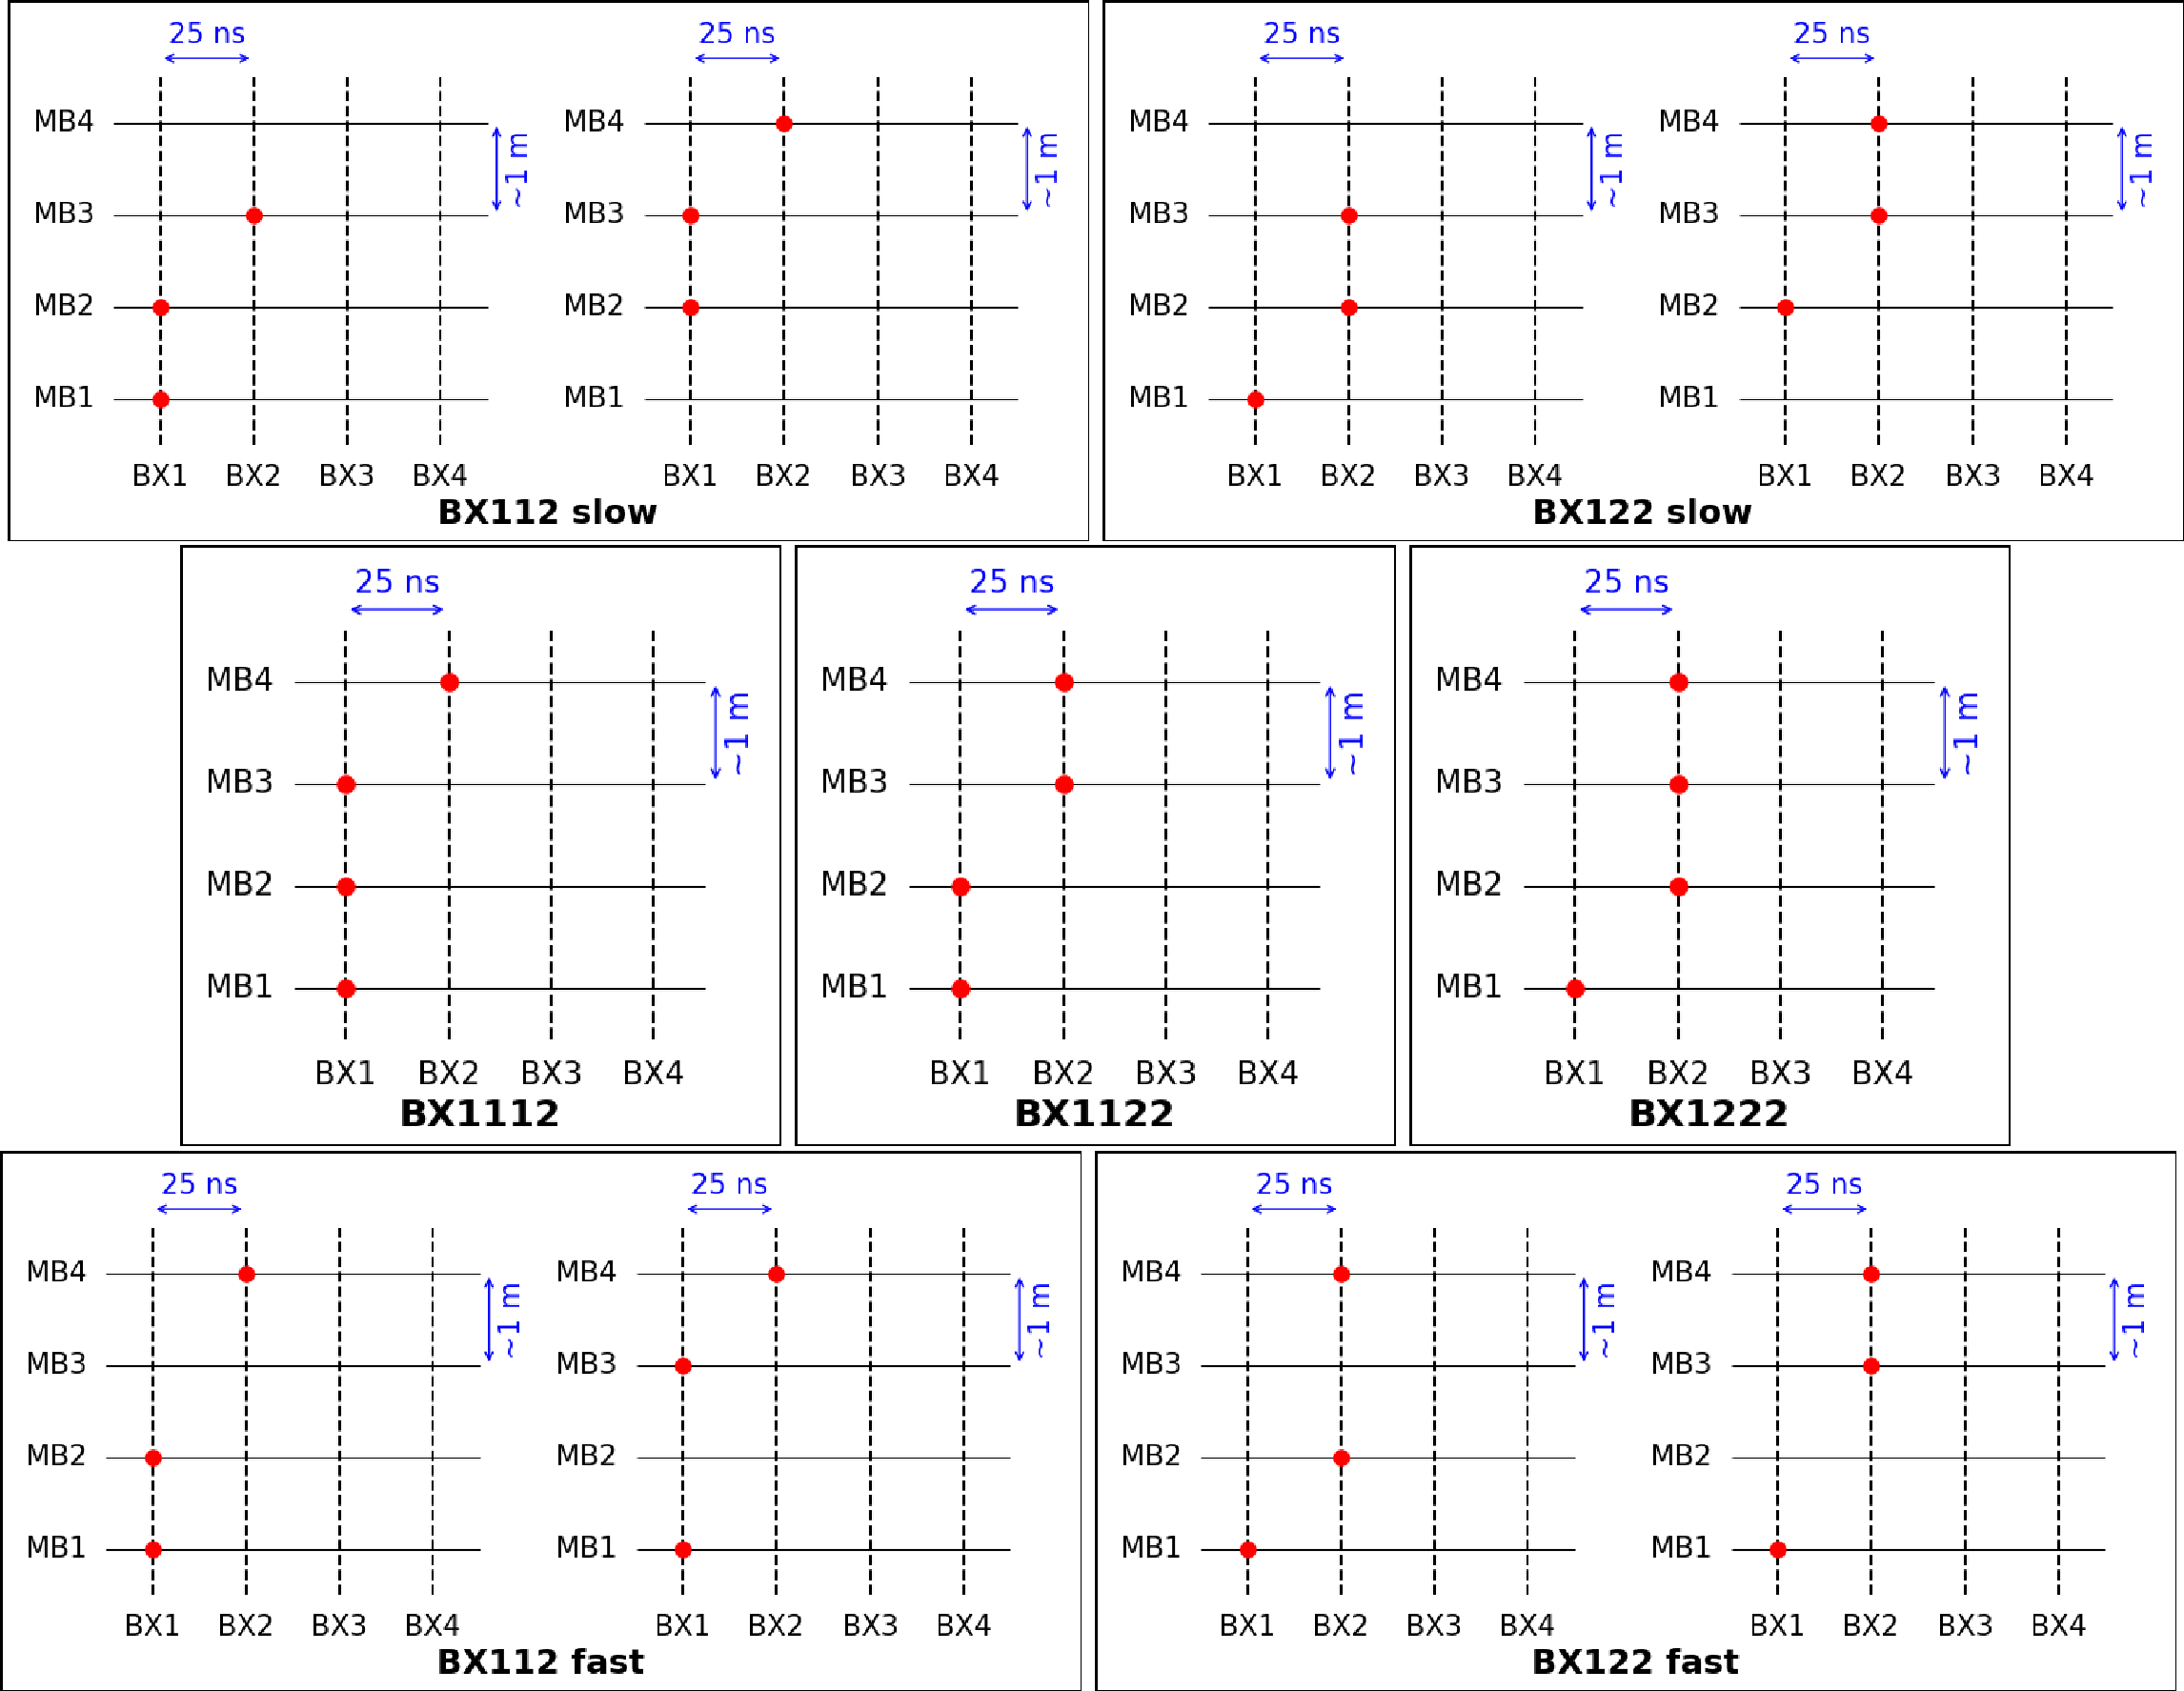
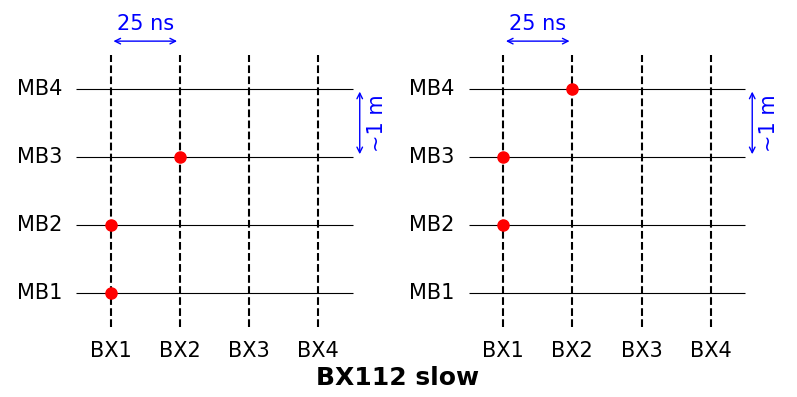
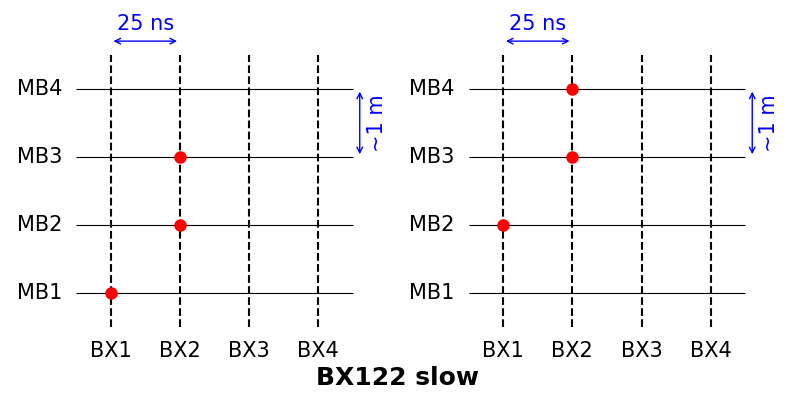
Figure 11:
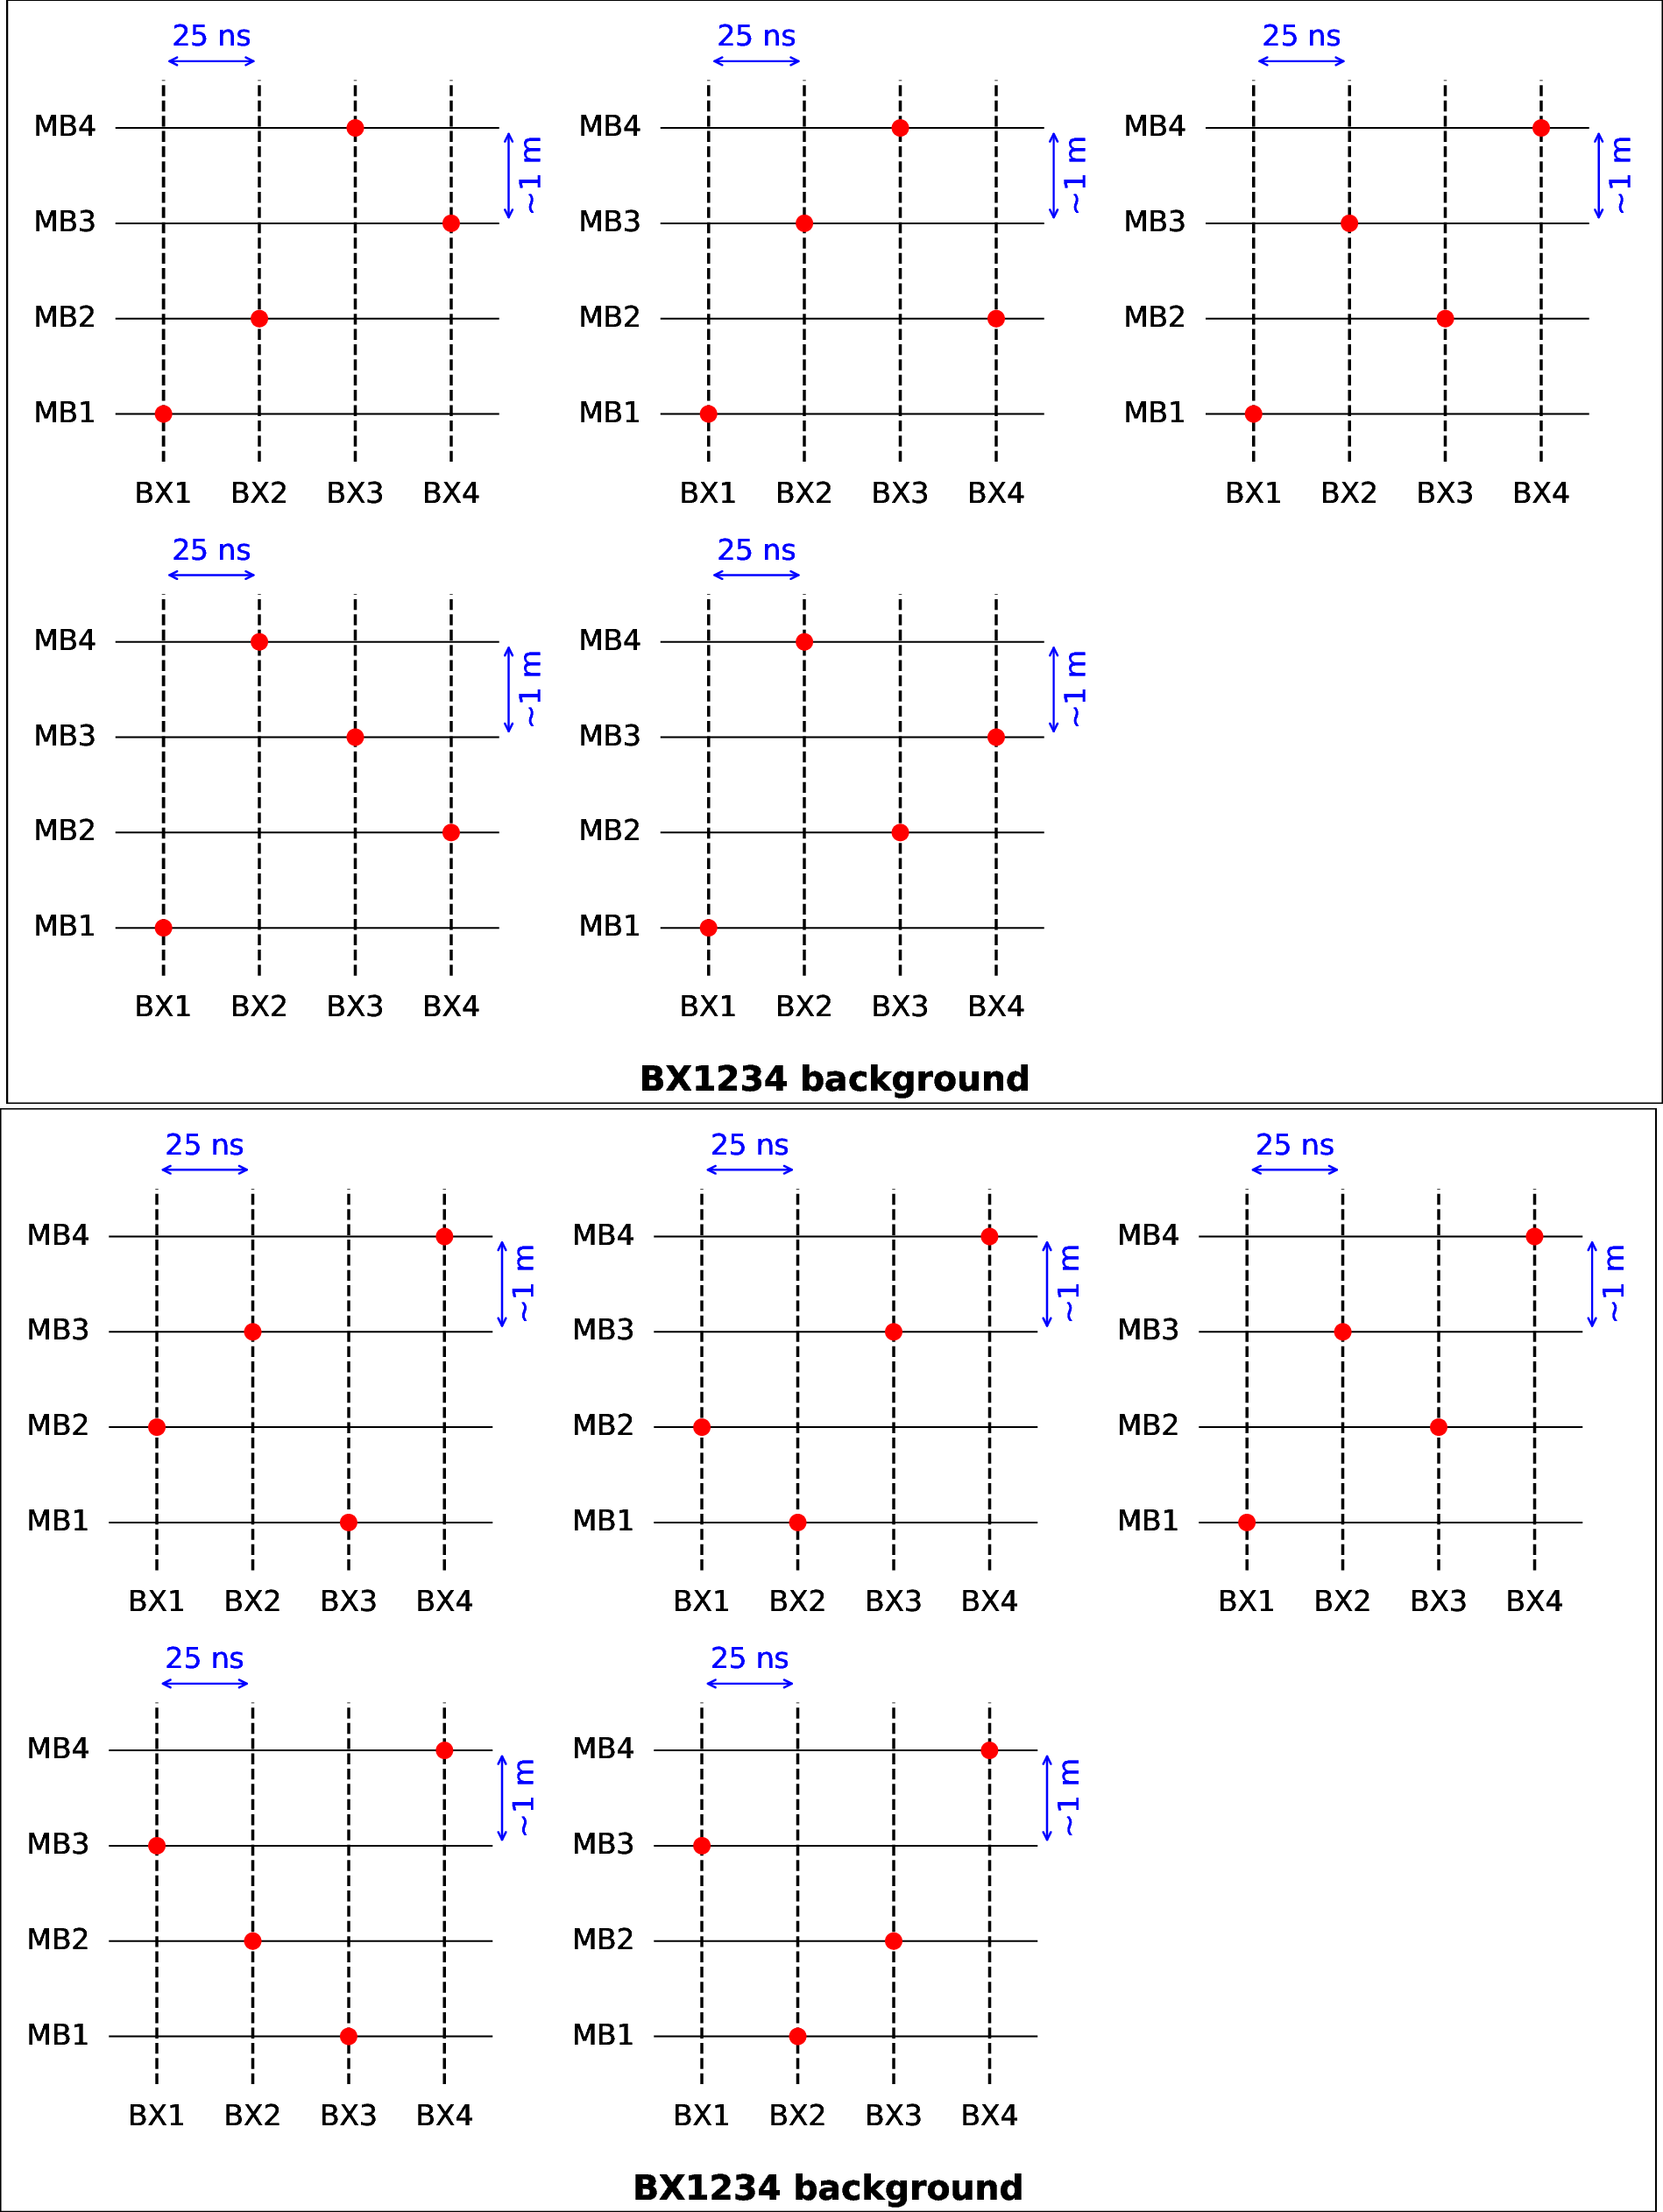
Schematic definition of the 3-stub categories with tracks across $ > $2 BXs. |
png pdf |
Figure 11-a:
Schematic definition of the 3-stub categories with tracks across $ > $2 BXs. |
png pdf |
Figure 11-b:
Schematic definition of the 3-stub categories with tracks across $ > $2 BXs. |
png pdf |
Figure 11-c:
Schematic definition of the 3-stub categories with tracks across $ > $2 BXs. |
png pdf |
Figure 11-d:
Schematic definition of the 3-stub categories with tracks across $ > $2 BXs. |
png pdf |
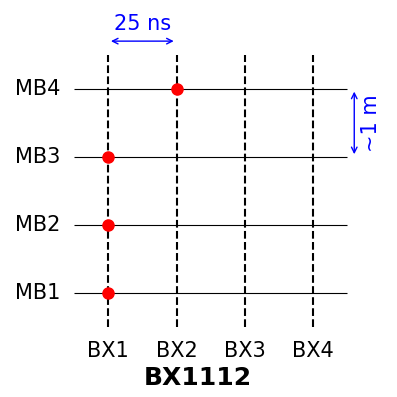
Figure 12:
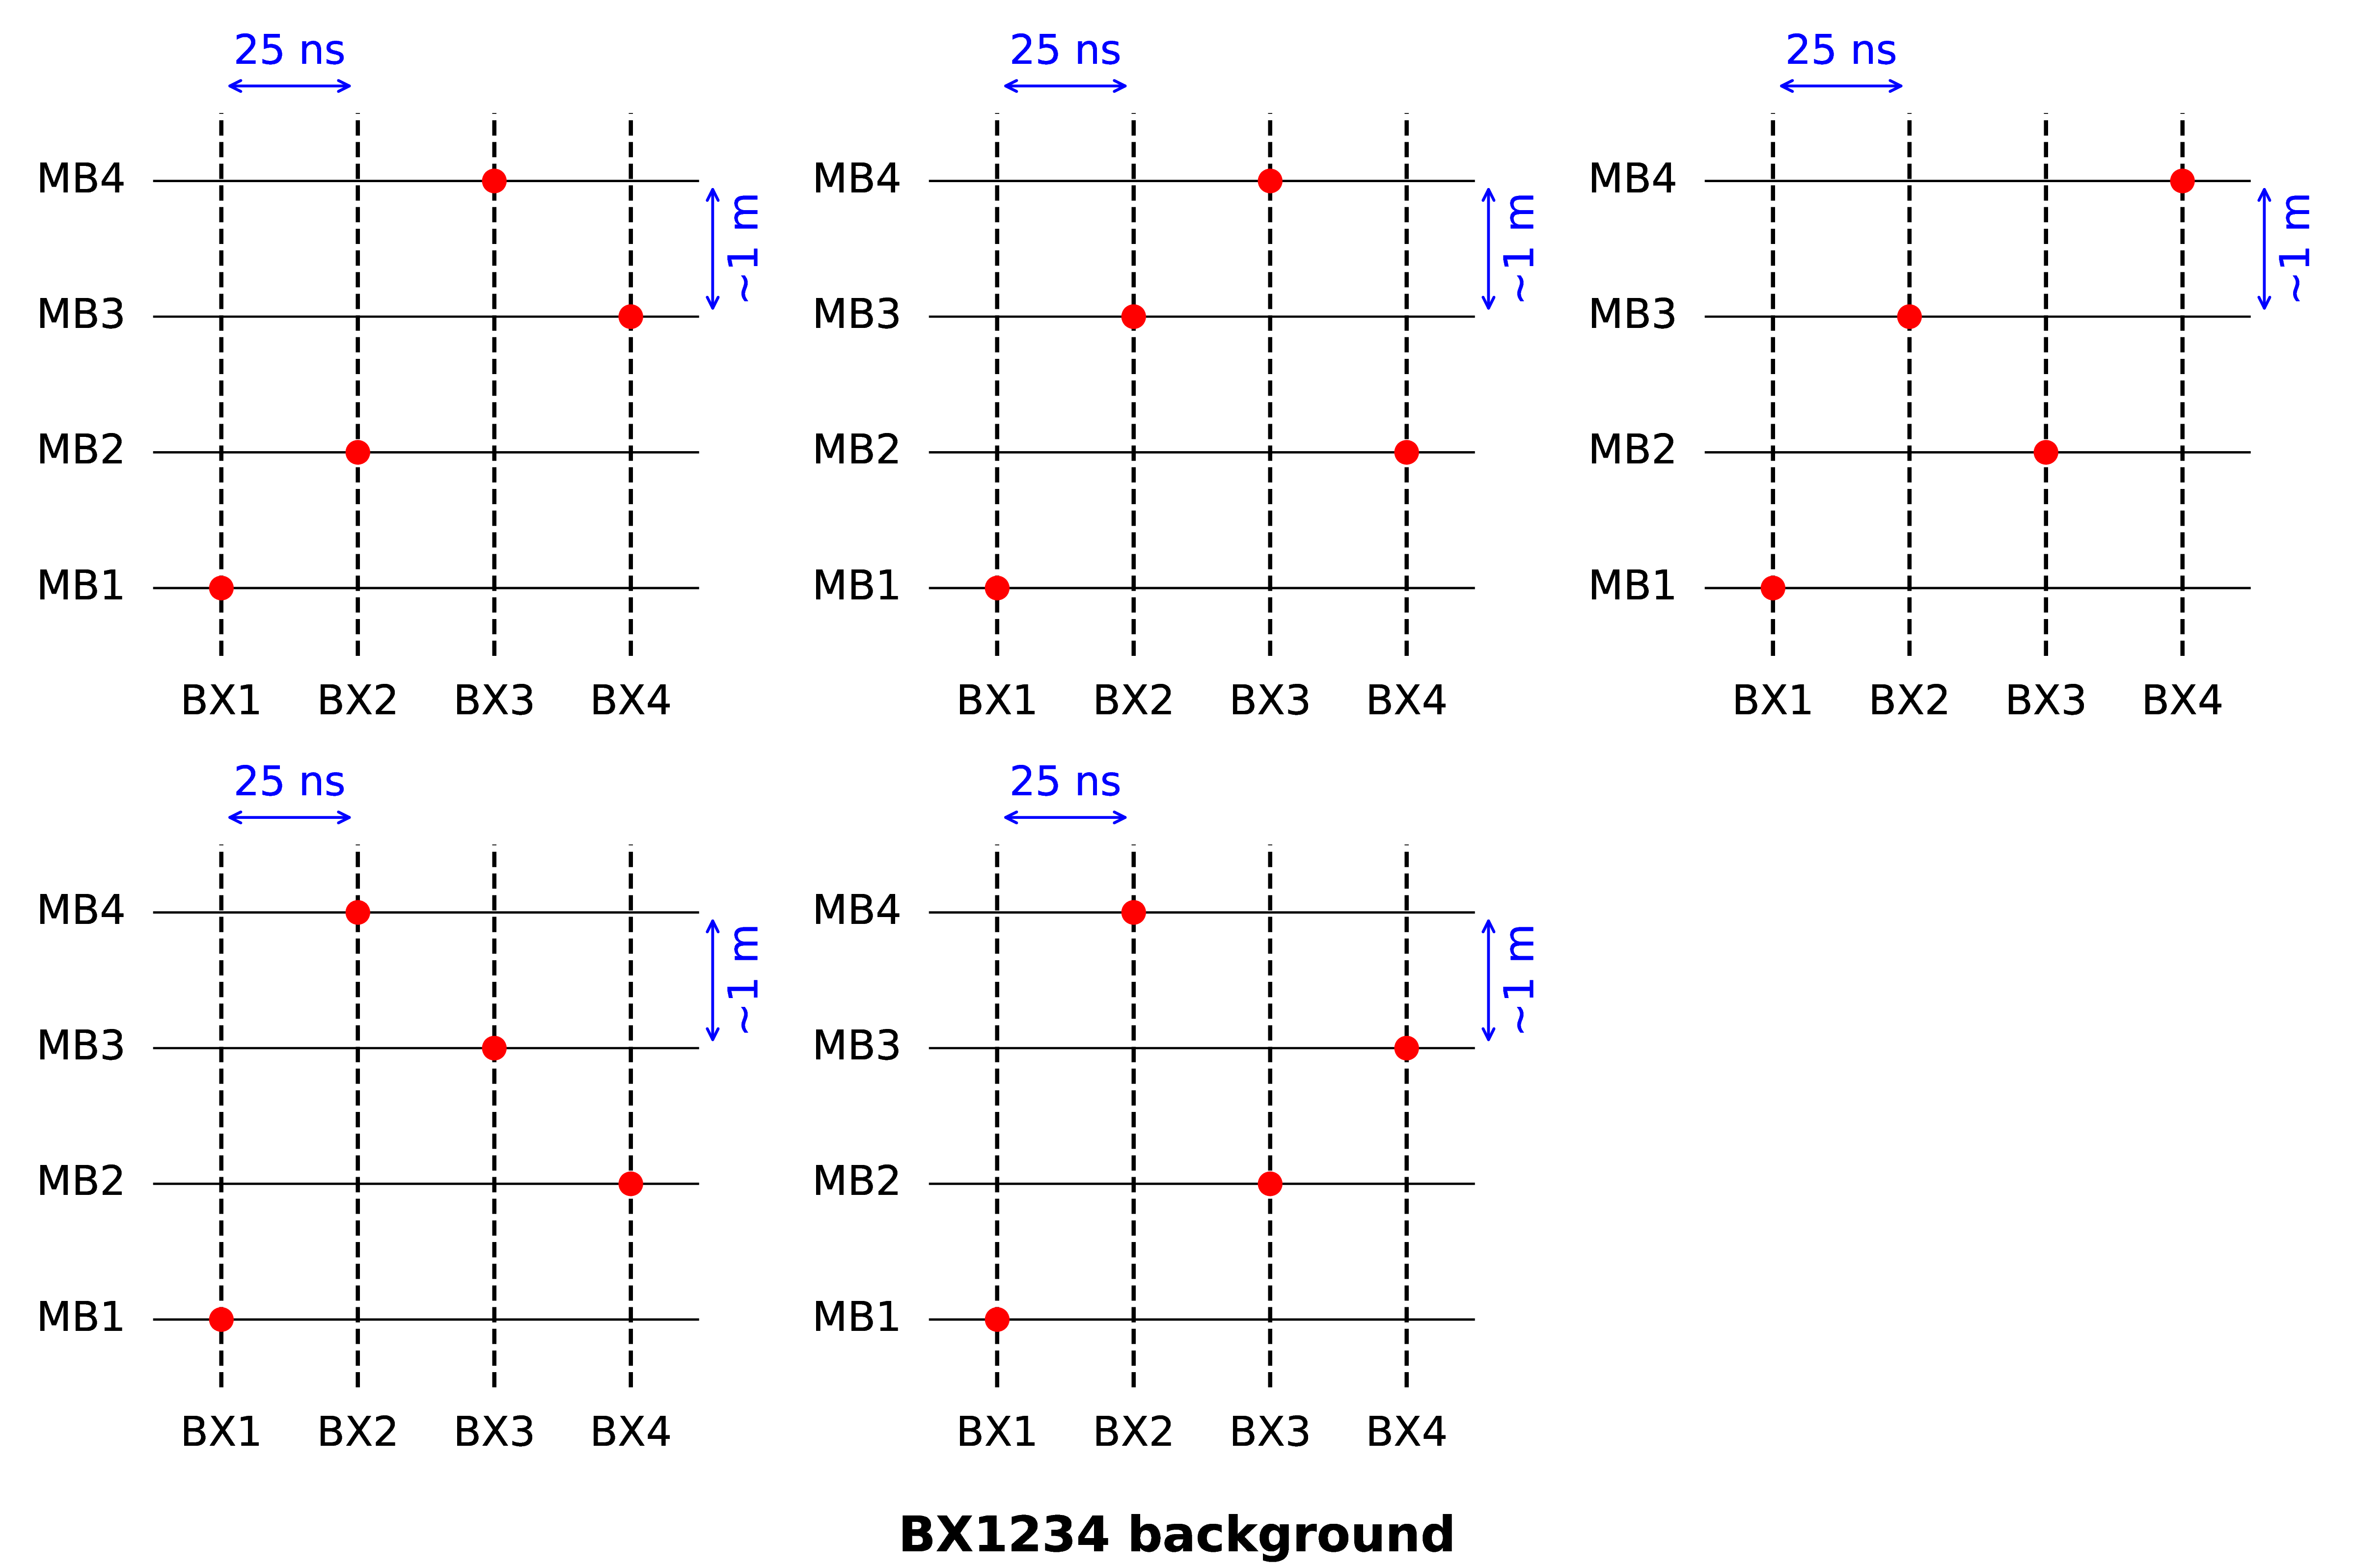
Schematic definition of the 4-stub categories with tracks across $ > $2 BXs. |
png pdf |
Figure 12-a:
Schematic definition of the 4-stub categories with tracks across $ > $2 BXs. |
png pdf |
Figure 12-b:
Schematic definition of the 4-stub categories with tracks across $ > $2 BXs. |
png pdf |
Figure 12-c:
Schematic definition of the 4-stub categories with tracks across $ > $2 BXs. |
png pdf |
Figure 13:
Schematic definition of the categories with tracks across 2 BXs. |
png pdf |
Figure 13-a:
Schematic definition of the categories with tracks across 2 BXs. |
png pdf |
Figure 13-b:
Schematic definition of the categories with tracks across 2 BXs. |
png pdf |
Figure 13-c:
Schematic definition of the categories with tracks across 2 BXs. |
png pdf |
Figure 13-d:
Schematic definition of the categories with tracks across 2 BXs. |
png pdf |
Figure 13-e:
Schematic definition of the categories with tracks across 2 BXs. |
png pdf |
Figure 13-f:
Schematic definition of the categories with tracks across 2 BXs. |
png pdf |
Figure 13-g:
Schematic definition of the categories with tracks across 2 BXs. |
png pdf |
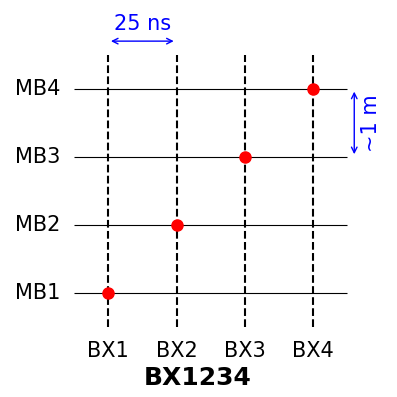
Figure 14:
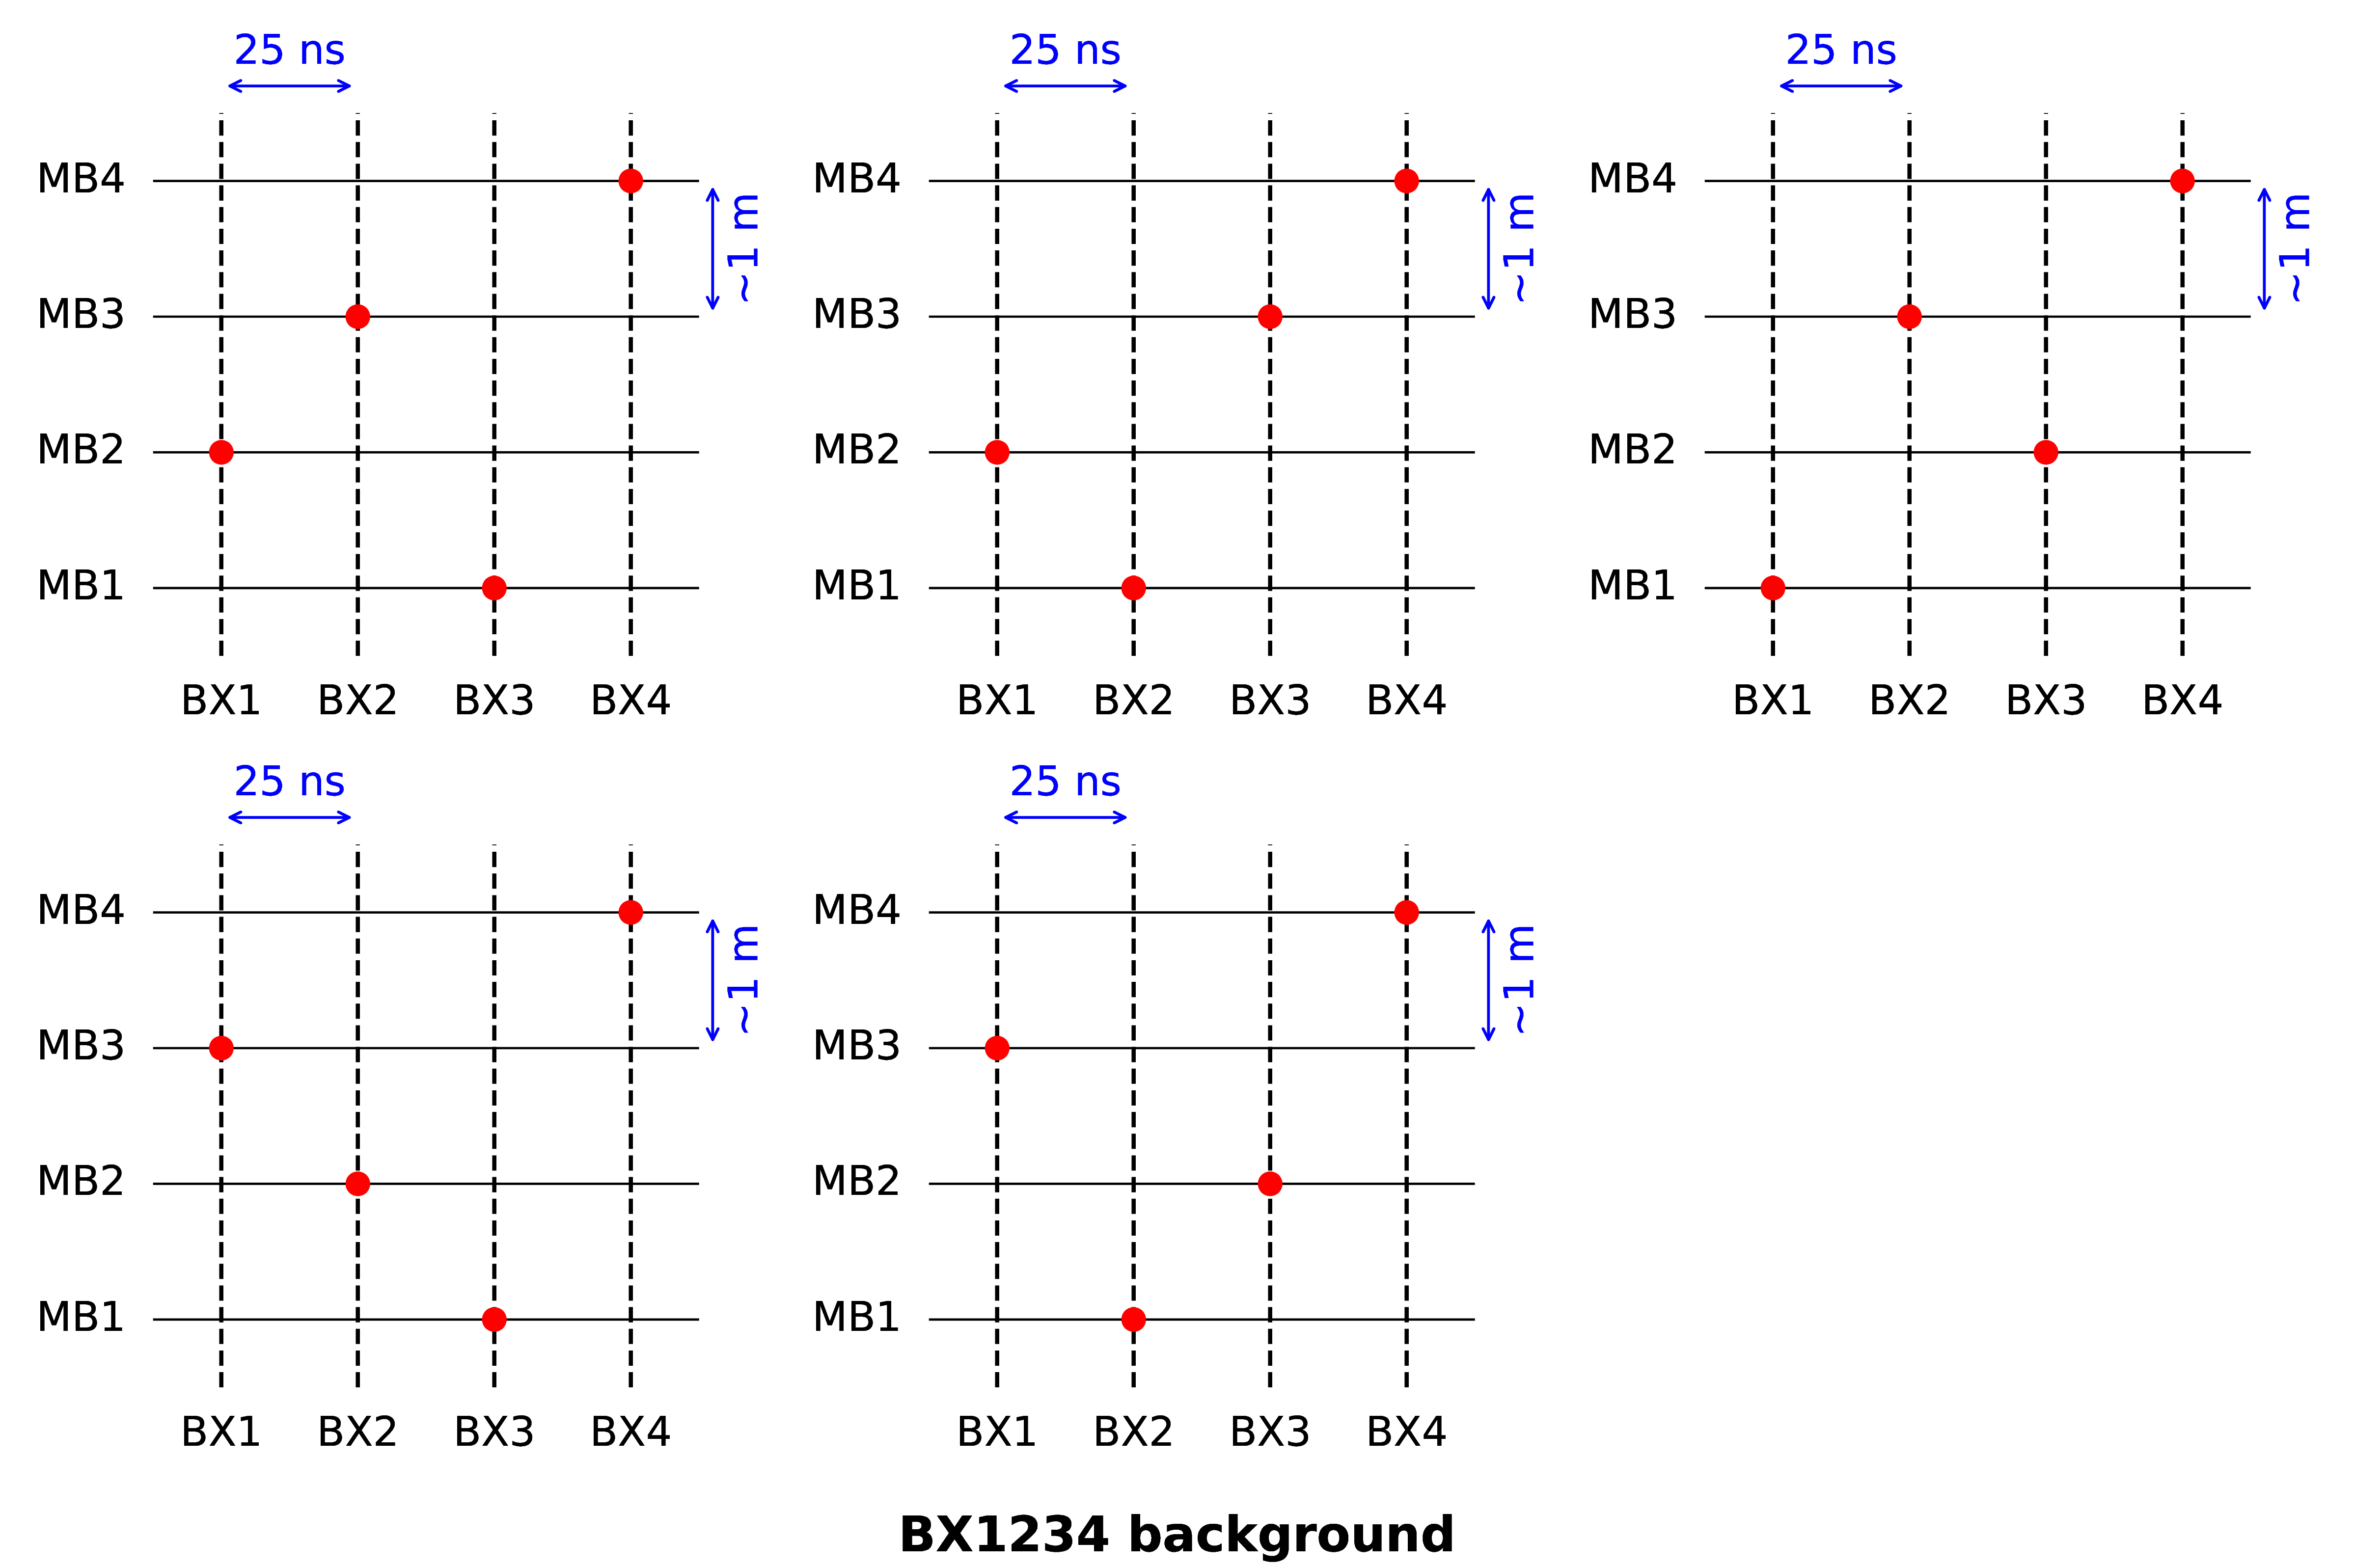
Schematic definition of the asynchronous orderings used to estimate the backgrounds in the BX1234 category. The upper (lower) half includes orderings with the first (last) stub in MB1 (MB4). |
png pdf |
Figure 14-a:
Schematic definition of the asynchronous orderings used to estimate the backgrounds in the BX1234 category. The upper (lower) half includes orderings with the first (last) stub in MB1 (MB4). |
png pdf |
Figure 14-b:
Schematic definition of the asynchronous orderings used to estimate the backgrounds in the BX1234 category. The upper (lower) half includes orderings with the first (last) stub in MB1 (MB4). |
png pdf |
Figure 15:
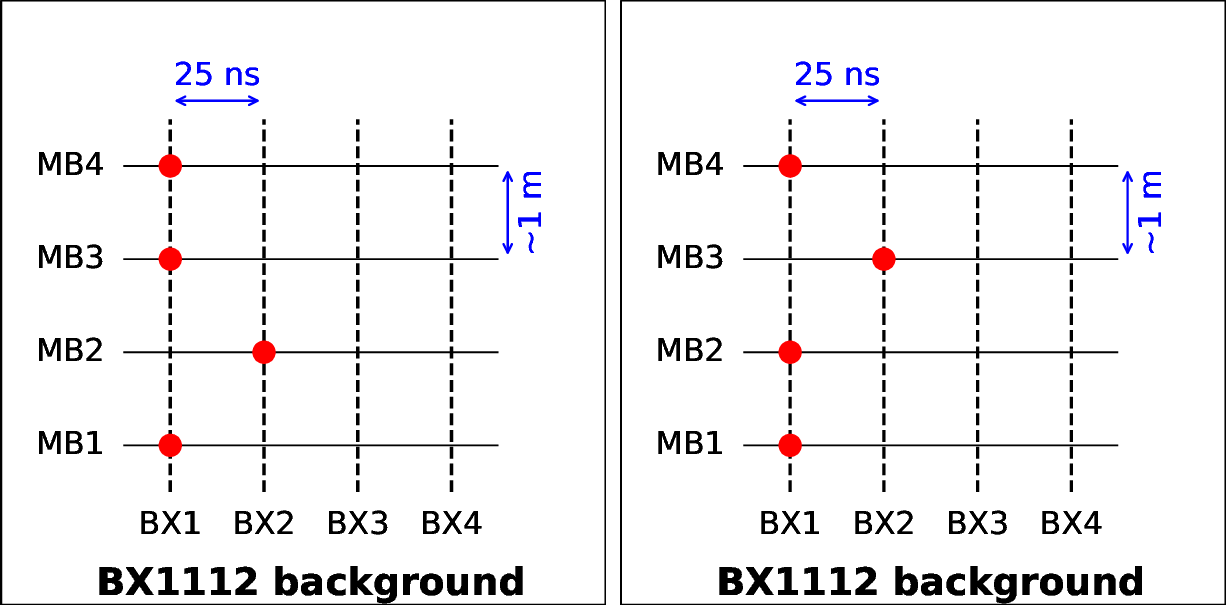
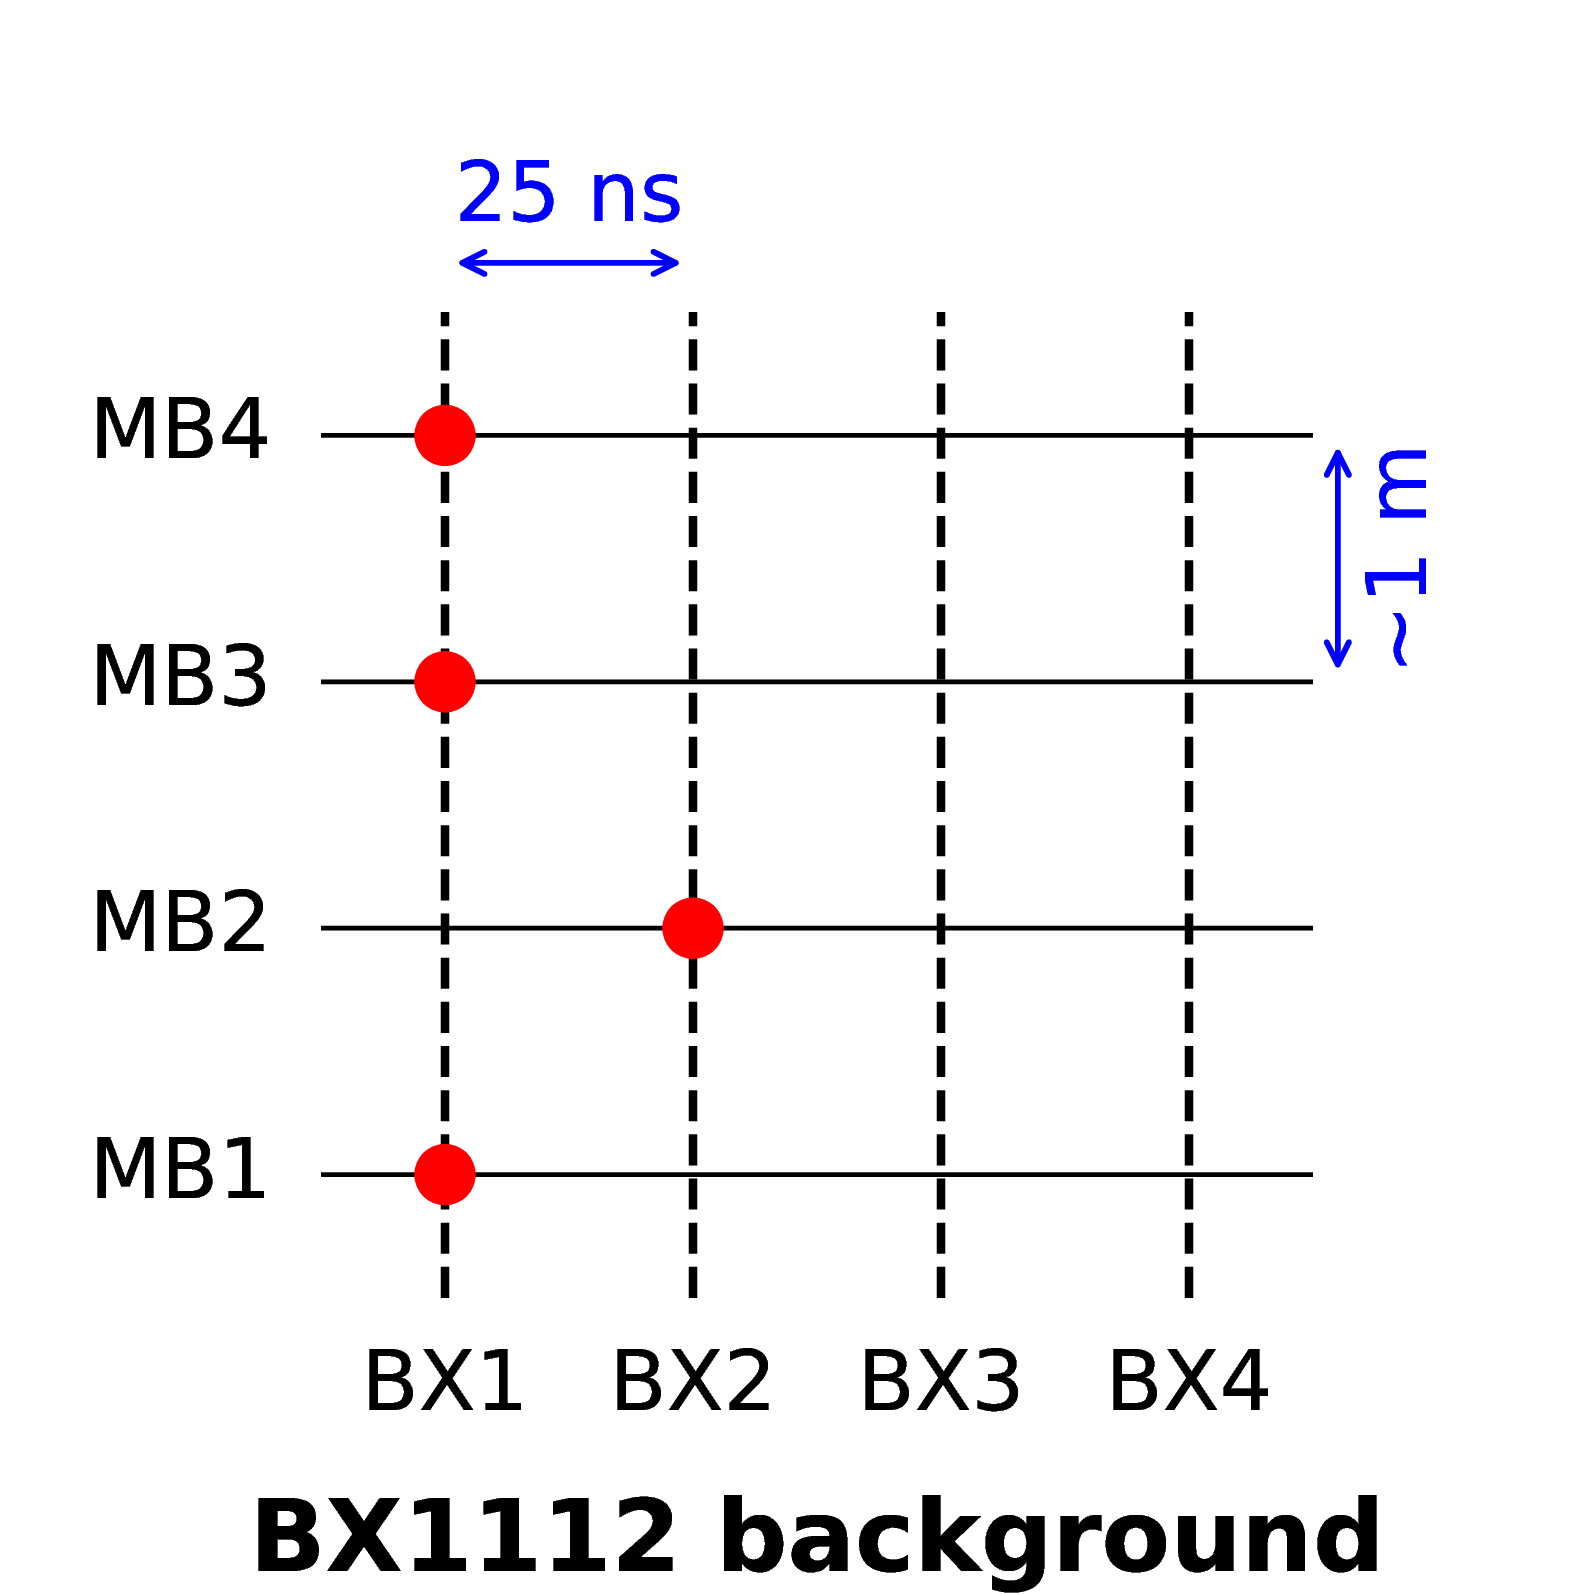
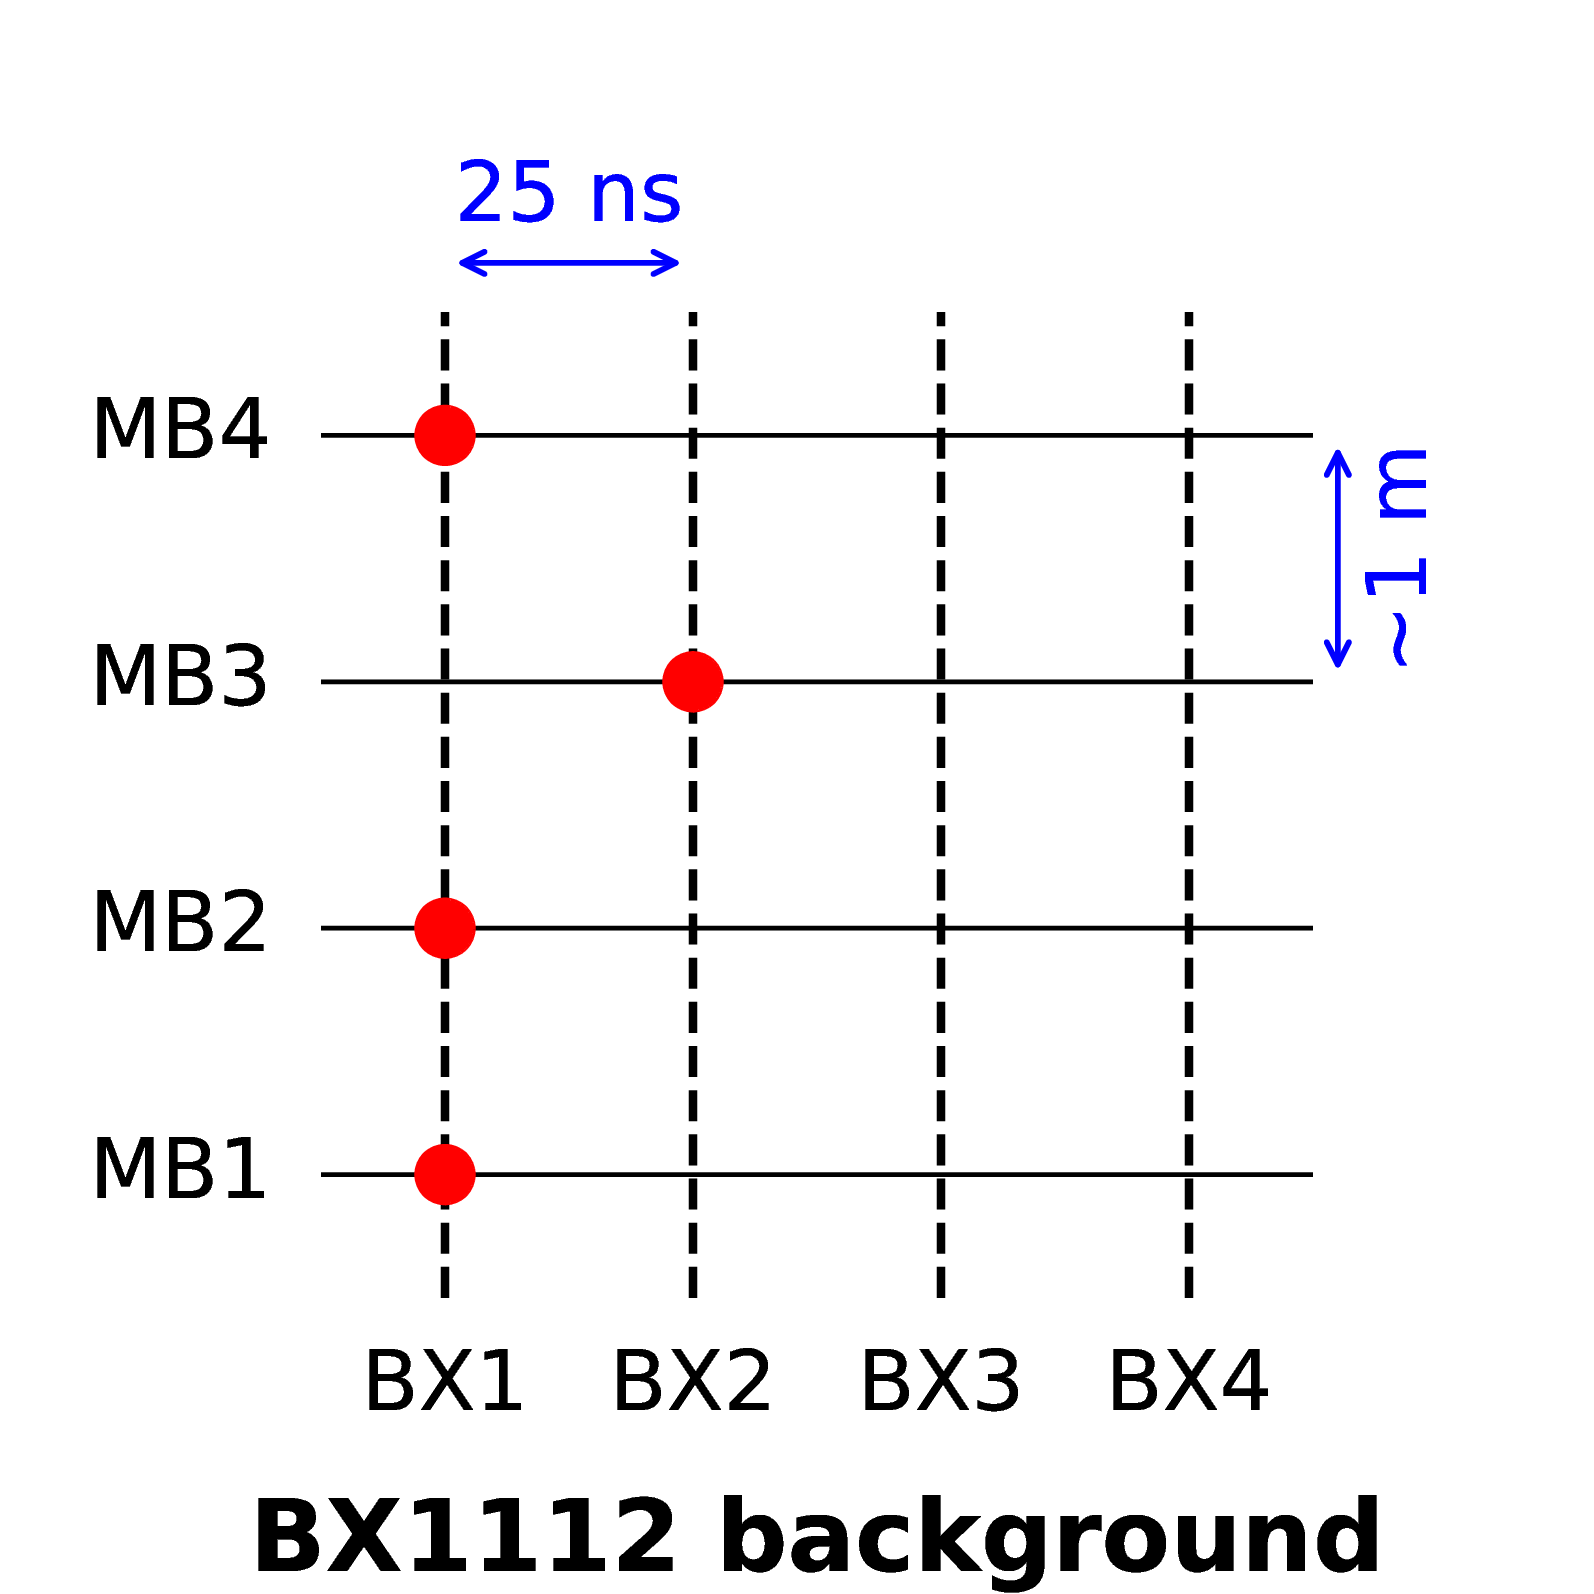
Schematic definition of the asynchronous orderings used to estimate the backgrounds in the BX1112 category. The left (right) diagram shows the ordering where the stub detected in a different BX than the other three stubs is in MB2 (MB3). |
png pdf |
Figure 15-a:
Schematic definition of the asynchronous orderings used to estimate the backgrounds in the BX1112 category. The left (right) diagram shows the ordering where the stub detected in a different BX than the other three stubs is in MB2 (MB3). |
png pdf |
Figure 15-b:
Schematic definition of the asynchronous orderings used to estimate the backgrounds in the BX1112 category. The left (right) diagram shows the ordering where the stub detected in a different BX than the other three stubs is in MB2 (MB3). |
| Tables | |

png pdf |
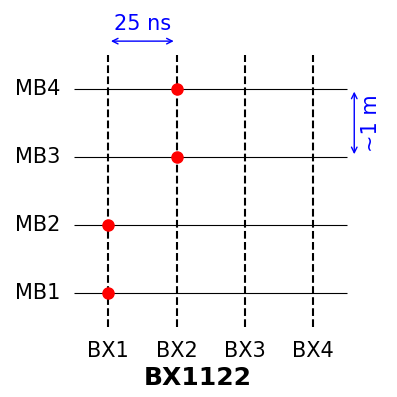
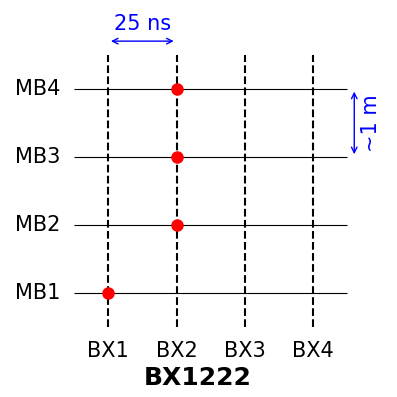
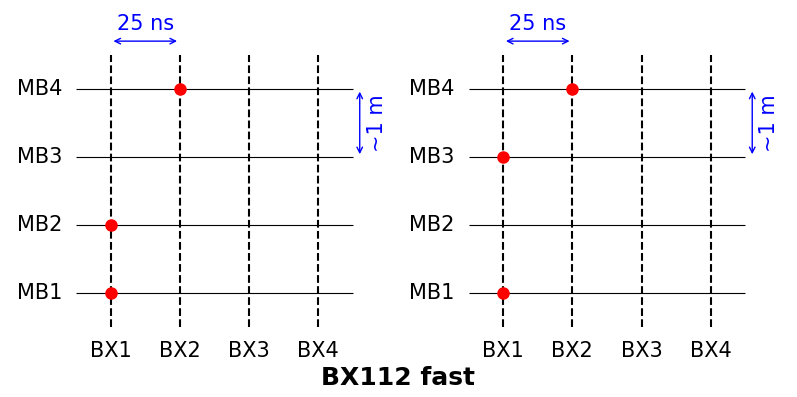
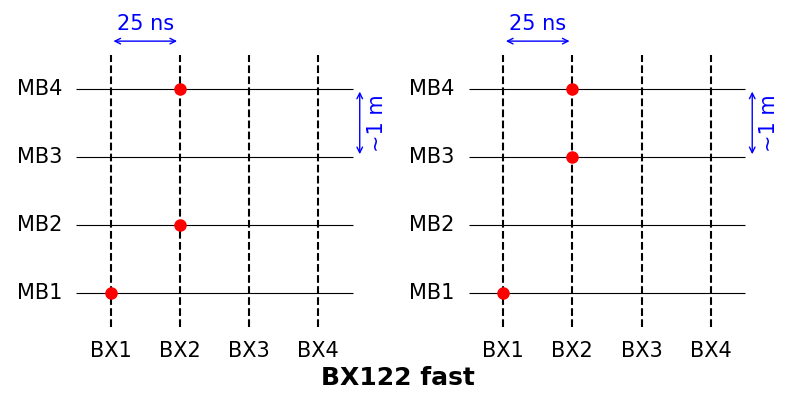
Table 1:
Categories based on muon detector layers with stubs and speed expressed as the number of crossed layers divided by the number of BXs spent to cross them. The BX1234 category includes 4-stub tracks for which the 4 stubs are in 4 subsequent BXs. For 3-stub (4-stub) tracks, the BX123 categories correspond to 3 (4) stubs in 3 different BXs across a range of 3 BXs, whereas the BX124/134 categories correspond to 3 (4) stubs in 3 different BXs across a range of 4 BXs. The 4-stub category BX1112 (1122, 1222) corresponds to 3 (2, 1) stubs in the first BX, and 1 (2, 3) stubs in the next BX. Similarly, the 3-stub categories BX112 (122) correspond to 2 (1) stubs in the first BX and 1 (2) stub in the next BX. The 3-stub categories are further separated into fast and slow subcategories: those denoted ``fast" feature a track with the first stub in MB1 and the last one in MB4, corresponding to a longer distance crossed in the same amount of time as their ``slow" counterparts, which do have exactly one stub within the innermost and outermost detector layers. The symbol $ \oplus $ represents the exclusive ``or", whereas $ \land $ is the logical ``and". |
png pdf |
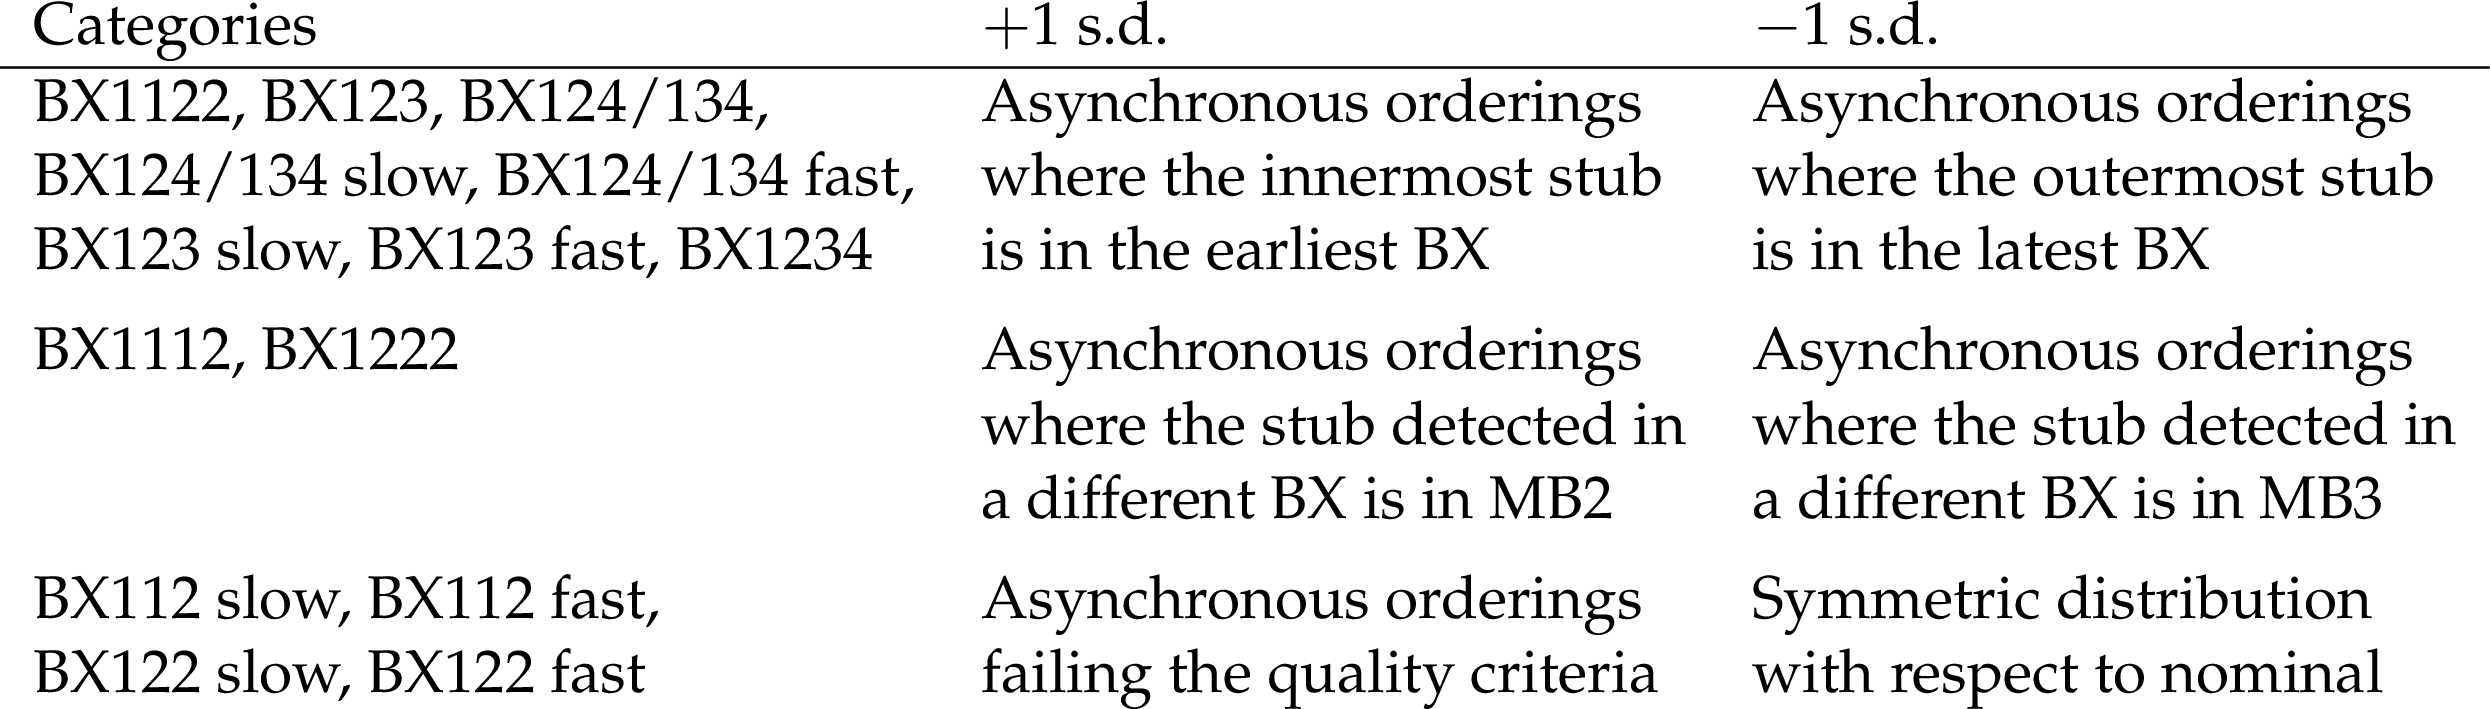
Table 2:
Definition of asynchronous track orderings used to build the alternative $ p_{\mathrm{T}} $ distributions corresponding to a $ \pm $ 1 s.d. of the background systematic uncertainty. |
| Summary |
| A search for long-lived massive charged particles has been presented, exploiting a muon-like signature in the barrel muon detectors spread across several LHC proton bunch crossings. This is the first time that an analysis relies on the novel CMS level-1 trigger scouting data set, for which no trigger selection is applied. A method based on control samples in data is used to estimate the backgrounds, relying on tracks not compatible in time with the expectations from a slow particle exiting the detector. No significant excess of data above the predicted standard model backgrounds is observed. Upper limits are set on the production cross section of heavy stable charged particles in several models, and fiducial upper limits on the production cross section for different $ \beta=v/c $ ranges are also set for a model-independent interpretation. The analysis has unique sensitivity to particles with 0.15 $ \lesssim \beta \lesssim $ 0.5, which are challenging to trigger on, and to neutral particles that acquire a charge when crossing the detector, which do not leave an ionization-loss signature in the tracker. Upper limits as low as 3.5\unitfb at 95% confidence level are set on the fiducial production cross section of lepton-like charged particles with $ |\eta| < $ 0.83 and $ p_{\mathrm{T}} > $ 500 GeV, in several bins of $ \beta $, extending the reach of the existing searches to higher masses and lower values of $ \beta $. |
| References | ||||
| 1 | M. Fairbairn et al. | Stable massive particles at colliders | Phys. Rept. 438 (2007) 1 | hep-ph/0611040 |
| 2 | C. W. Bauer et al. | Supermodels for early LHC | PLB 690 (2010) 280 | 0909.5213 |
| 3 | ALEPH Collaboration | Search for pair production of longlived heavy charged particles in $ \mathrm{e}^+ \mathrm{e}^- $ annihilation | PLB 405 (1997) 379 | hep-ex/9706013 |
| 4 | DELPHI Collaboration | Search for heavy stable and longlived particles in $ \mathrm{e}^+ \mathrm{e}^- $ collisions at $ \sqrt{s} = $ 189 GeV | PLB 478 (2000) 65 | hep-ex/0103038 |
| 5 | L3 Collaboration | Search for heavy neutral and charged leptons in $ \mathrm{e}^+ \mathrm{e}^- $ annihilation at LEP | PLB 517 (2001) 75 | hep-ex/0107015 |
| 6 | OPAL Collaboration | Search for stable and longlived massive charged particles in $ \mathrm{e}^+ \mathrm{e}^- $ collisions at $ \sqrt{s}= $ 130 GeV to 209 GeV | PLB 572 (2003) 8 | hep-ex/0305031 |
| 7 | H1 Collaboration | Measurement of anti-deuteron photoproduction and a search for heavy stable charged particles at HERA | EPJC 36 (2004) 413 | hep-ex/0403056 |
| 8 | CDF Collaboration | Search for long-lived massive charged particles in 1.96 TeV $ \bar{\mathrm{p}}\mathrm{p} $ collisions | PRL 103 (2009) 021802 | 0902.1266 |
| 9 | D0 Collaboration | Search for long-lived charged massive particles with the D0 detector | PRL 102 (2009) 161802 | 0809.4472 |
| 10 | D0 Collaboration | A search for charged massive long-lived particles | PRL 108 (2012) 121802 | 1110.3302 |
| 11 | D0 Collaboration | Search for charged massive long-lived particles at $ \sqrt{s}= $ 1.96 TeV | PRD 87 (2013) 052011 | 1211.2466 |
| 12 | ATLAS Collaboration | Search for heavy long-lived charged particles with the ATLAS detector in pp collisions at $ \sqrt{s}= $ 7 TeV | PLB 703 (2011) 428 | 1106.4495 |
| 13 | ATLAS Collaboration | Search for stable hadronising squarks and gluinos with the ATLAS experiment at the LHC | PLB 701 (2011) 1 | 1103.1984 |
| 14 | ATLAS Collaboration | Search for massive long-lived highly ionising particles with the ATLAS detector at the LHC | PLB 698 (2011) 353 | 1102.0459 |
| 15 | ATLAS Collaboration | Searches for heavy long-lived sleptons and $ R $-hadrons with the ATLAS detector in pp collisions at $ \sqrt{s}= $ 7 TeV | PLB 720 (2013) 277 | 1211.1597 |
| 16 | ATLAS Collaboration | Search for long-lived, multi-charged particles in pp collisions at $ \sqrt{s}= $ 7 TeV using the ATLAS detector | PLB 722 (2013) 305 | 1301.5272 |
| 17 | ATLAS Collaboration | Searches for heavy long-lived charged particles with the ATLAS detector in proton-proton collisions at $ \sqrt{s}= $ 8 TeV | JHEP 01 (2015) 068 | 1411.6795 |
| 18 | ATLAS Collaboration | Search for heavy long-lived multi-charged particles in pp collisions at $ \sqrt{s}= $ 8 TeV using the ATLAS detector | EPJC 75 (2015) 362 | 1504.04188 |
| 19 | ATLAS Collaboration | Search for metastable heavy charged particles with large ionisation energy loss in pp collisions at $ \sqrt{s} = $ 8 TeV using the ATLAS experiment | EPJC 75 (2015) 407 | 1506.05332 |
| 20 | ATLAS Collaboration | Search for metastable heavy charged particles with large ionization energy loss in pp collisions at $ \sqrt{s} = $ 13 TeV using the ATLAS experiment | PRD 93 (2016) 112015 | 1604.04520 |
| 21 | ATLAS Collaboration | Search for heavy long-lived charged $ R $-hadrons with the ATLAS detector in 3.2 fb$ ^{-1} $ of proton--proton collision data at $ \sqrt{s} = $ 13 TeV | PLB 760 (2016) 647 | 1606.05129 |
| 22 | CMS Collaboration | Search for heavy stable charged particles in pp collisions at $ \sqrt{s}= $ 7 TeV | JHEP 03 (2011) 024 | CMS-EXO-10-011 1101.1645 |
| 23 | CMS Collaboration | Search for fractionally charged particles in pp collisions at $ \sqrt{s}= $ 7 TeV | PRD 87 (2013) 092008 | CMS-EXO-11-074 1210.2311 |
| 24 | CMS Collaboration | Search for heavy long-lived charged particles in pp collisions at $ \sqrt{s}= $ 7 TeV | PLB 713 (2012) 408 | CMS-EXO-11-022 1205.0272 |
| 25 | CMS Collaboration | Searches for long-lived charged particles in pp collisions at $ \sqrt{s}= $ 7 and 8 TeV | JHEP 07 (2013) 122 | CMS-EXO-12-026 1305.0491 |
| 26 | CMS Collaboration | Search for long-lived charged particles in proton-proton collisions at $ \sqrt s= $ 13 TeV | PRD 94 (2016) 112004 | CMS-EXO-15-010 1609.08382 |
| 27 | CMS Collaboration | Search for decays of stopped exotic long-lived particles produced in proton-proton collisions at $ \sqrt{s}= $ 13 TeV | JHEP 05 (2018) 127 | CMS-EXO-16-004 1801.00359 |
| 28 | ATLAS Collaboration | Search for heavy, long-lived, charged particles with large ionisation energy loss in pp collisions at $ \sqrt{s} = $ 13 TeV using the ATLAS experiment and the full Run 2 dataset | JHEP 06 (2023) 158 | 2205.06013 |
| 29 | CMS Collaboration | Search for fractionally charged particles in proton-proton collisions at $ \sqrt{s}= $ 13 TeV | PRL 134 (2025) 131802 | CMS-EXO-19-006 2402.09932 |
| 30 | CMS Collaboration | Search for heavy long-lived charged particles with large ionization energy loss in proton-proton collisions at $ \sqrt{s} = $ 13 TeV | JHEP 04 (2025) 109 | CMS-EXO-18-002 2410.09164 |
| 31 | ATLAS Collaboration | Search for long-lived charged particles using large specific ionisation loss and time of flight in 140 fb$ ^{-1} $ of pp collisions at $ \sqrt{s} = $ 13 TeV with the ATLAS detector | JHEP 07 (2025) 140 | 2502.06694 |
| 32 | CMS Collaboration | The Phase-2 upgrade of the CMS Level-1 trigger | CMS Technical Design Report CERN-LHCC-2020-004; CMS-TDR-021, 2020 CDS |
|
| 33 | CMS Collaboration | Development of the CMS detector for the CERN LHC Run 3 | JINST 19 (2024) P05064 | CMS-PRF-21-001 2309.05466 |
| 34 | M. Migliorini | 40\unitMHz scouting at the CMS experiment | PhD thesis, Padua University, CERN-THESIS-2024-288, 2024 link |
|
| 35 | R. Ardino | Search for rare boson decays with the CMS detector at LHC and the CMS Level-1 trigger Data Scouting | PhD thesis, Padua University, CERN-THESIS-2024-303, 2024 link |
|
| 36 | CMS Collaboration | HEPData record for this analysis | link | |
| 37 | CMS Collaboration | The CMS experiment at the CERN LHC | JINST 3 (2008) S08004 | |
| 38 | CMS Collaboration | Performance of the CMS Level-1 trigger in proton-proton collisions at $ \sqrt{s} = $ 13 TeV | JINST 15 (2020) P10017 | CMS-TRG-17-001 2006.10165 |
| 39 | CMS Collaboration | The CMS barrel muon trigger upgrade | JINST 12 (2017) C01095 | |
| 40 | G. F. Giudice, M. McCullough, and D. Teresi | dE/dx from boosted long-lived particles | JHEP 08 (2022) 012 | 2205.04473 |
| 41 | G. R. Farrar and P. Fayet | Phenomenology of the production, decay, and detection of new hadronic states associated with supersymmetry | PLB 76 (1978) 575 | |
| 42 | G. F. Giudice and A. Romanino | Split supersymmetry | NPB 699 (2004) 65 | hep-ph/0406088 |
| 43 | N. Arkani-Hamed and S. Dimopoulos | Supersymmetric unification without low energy supersymmetry and signatures for fine-tuning at the LHC | JHEP 06 (2005) 073 | hep-th/0405159 |
| 44 | A. C. Kraan | Interactions of heavy stable hadronizing particles | EPJC 37 (2004) 91 | hep-ex/0404001 |
| 45 | R. Mackeprang and A. Rizzi | Interactions of coloured heavy stable particles in matter | EPJC 50 (2007) 353 | hep-ph/0612161 |
| 46 | T. Sjöstrand et al. | An introduction to PYTHIA 8.2 | Comput. Phys. Commun. 191 (2015) 159 | 1410.3012 |
| 47 | CMS Collaboration | Extraction and validation of a new set of CMS PYTHIA8 tunes from underlying-event measurements | EPJC 80 (2020) 4 | CMS-GEN-17-001 1903.12179 |
| 48 | R. D. Ball et al. | Unbiased global determination of parton distributions and their uncertainties at NNLO and at LO | NPB 855 (2012) 153 | 1107.2652 |
| 49 | NNPDF Collaboration | Parton distributions with QED corrections | NPB 877 (2013) 290 | 1308.0598 |
| 50 | NNPDF Collaboration | Parton distributions from high-precision collider data | EPJC 77 (2017) 663 | 1706.00428 |
| 51 | R. Frederix and S. Frixione | Merging meets matching in MC@NLO | JHEP 12 (2012) 061 | 1209.6215 |
| 52 | GEANT4 Collaboration | GEANT 4 --- a simulation toolkit | NIM A 506 (2003) 250 | |
| 53 | CMS Collaboration | Bunch crossing identification studies for the CMS muon barrel local trigger | CMS Detector Performance Note CMS-DP-2025-008, 2025 CDS |
|
| 54 | CMS Collaboration | The CMS statistical analysis and combination tool: Combine | Comput. Softw. Big Sci. 8 (2024) 19 | CMS-CAT-23-001 2404.06614 |
| 55 | T. Junk | Confidence level computation for combining searches with small statistics | NIM A 434 (1999) 435 | hep-ex/9902006 |
| 56 | A. L. Read | Presentation of search results: The $ \text{CL}_\text{s} $ technique | JPG 28 (2002) 2693 | |
| 57 | G. Cowan, K. Cranmer, E. Gross, and O. Vitells | Asymptotic formulae for likelihood-based tests of new physics | EPJC 71 (2011) 1554 | 1007.1727 |
|
|
Compact Muon Solenoid LHC, CERN |
|

|

|

|

|

|