

Compact Muon Solenoid
LHC, CERN
| CMS-EXO-19-006 ; CERN-EP-2024-002 | ||
| Search for fractionally charged particles in proton-proton collisions at $ \sqrt{s} = $ 13 TeV | ||
| CMS Collaboration | ||
| 15 February 2024 | ||
| Phys. Rev. Lett. 134 (2025) 131802 | ||
| Abstract: A search is presented for fractionally charged particles with charge below 1$ e $, using their small energy loss in the tracking detector as a key variable to observe a signal. The analyzed data set corresponds to an integrated luminosity of 138 fb$ ^{-1} $ of proton-proton collisions collected at $ \sqrt{s} = $ 13 TeV in 2016-2018 at the CERN LHC. This is the first search at the LHC for new particles with a charge between $ e$/3 and 0.9$ e $, including an extension of previous results at a charge of 2$ e$/3. Masses up to 640 GeV and charges as low as $ e$/3 are excluded at 95% confidence level. These are the most stringent limits to date for the considered Drell-Yan-like production mode. | ||
| Links: e-print arXiv:2402.09932 [hep-ex] (PDF) ; CDS record ; inSPIRE record ; HepData record ; CADI line (restricted) ; | ||
| Figures | |
png pdf |
Figure 1:
Feynman diagram of the kinetic mixing between the SM hypercharge field $ B $ and a new U(1) gauge field $ A' $. In this work, FCPs are considered to be pair-produced through this process. |
png pdf |
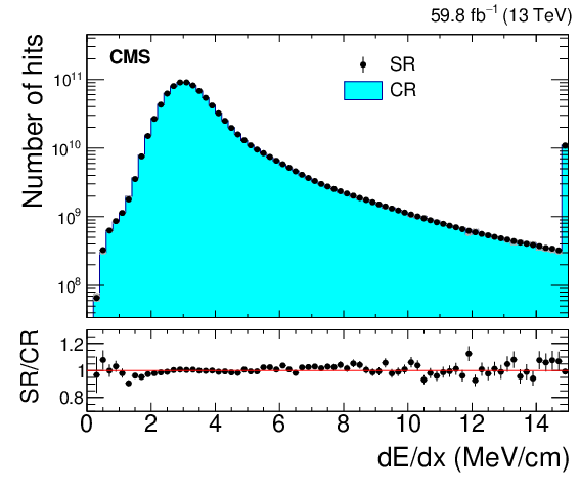
Figure 2:
The d$E$/d$x$ distribution for hits on candidate tracks in the CR and SR in 2018 data. The last bin is an overflow bin. The vertical bars and the shaded area correspond to the statistical uncertainty in the SR and the CR, respectively. |
png pdf |
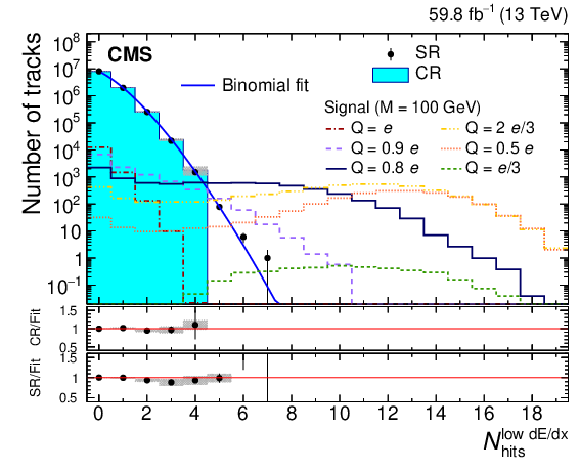
Figure 3:
Distribution of $ N_{\text{hits}}^{\text{low} $ e$/3} $ in the SR and the CR for the 2018 data set, as well as for an FCP signal at a mass of 100 GeV and different charge scenarios. The vertical bars and the shaded area correspond to the statistical uncertainty in the SR and the CR, respectively. The $ p $-value of the fit is 9%. The two lower panels show the ratio of the number of tracks observed in the CR (upper) and SR (lower), and the fit function. The vertical bars correspond to the uncertainty from statistical sources, while the shaded area shows the systematic uncertainty in the binomial fit (see text). |
png pdf |
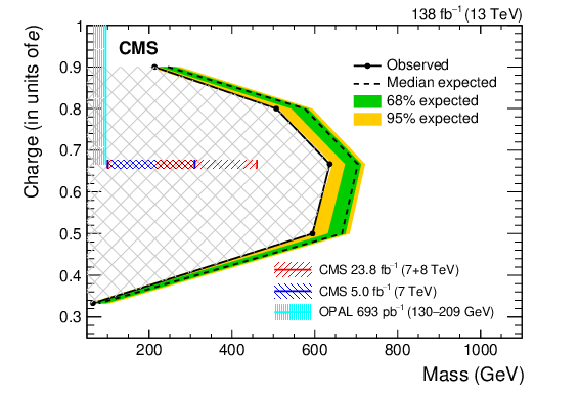
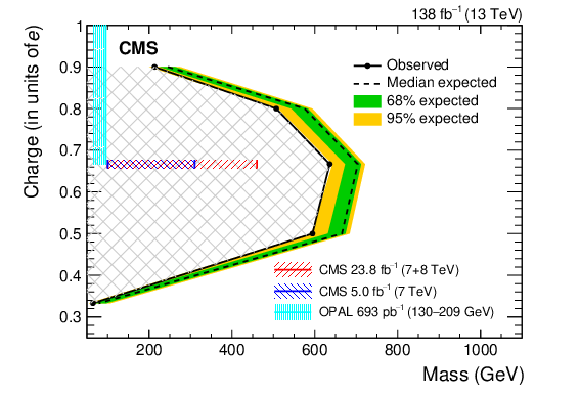
Figure 4:
Exclusion region (hatched) at 95% CL in the FCP charge-mass plane for the considered signal. The expected exclusion is shown with the associated 1 (green) and 2 (orange) standard deviations bands. Signal points at charges 0.9, 0.8, 2/3, 0.5, and 1 $ /3e $ are connected by straight lines to guide the eye. This is a conservative interpolation. Previous exclusions from CMS [8,9] as well as OPAL [13] are given for comparison. |
png pdf |
Figure 5:
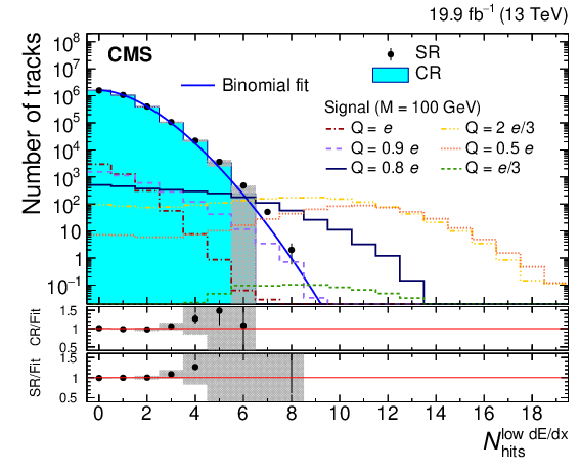
Distribution of $ N_{\text{hits}}^{\text{low}\ \mathrm{d}E/\mathrm{d}x } $ in the SR and the CR for the early 2016 data set, as well as for an FCP signal at a mass of 100 GeV and different charge scenarios. The vertical bars and the shaded area correspond to the statistical uncertainty in the SR and the CR, respectively. The $ p $-value of the fit is 6%. The two lower panels show the ratio of the number of tracks observed in the CR (upper) and SR (lower), and the fit function. The vertical bars correspond to the uncertainty from statistical sources, while the shaded area shows the systematic uncertainty in the fit due to the choice of the fitting function and the binomial fit range as explained in the main text. Comparing with respect to the binomial fit starting at $ N_{\text{hits}}^{\text{low}\ \mathrm{d}E/\mathrm{d}x } = $ 2, and not $ N_{\text{hits}}^{\text{low}\ \mathrm{d}E/\mathrm{d}x } = $ 1, is needed to account for the fact that early 2016 data is more strongly affected by instrumental effects that widen the $ N_{\text{hits}}^{\text{low}\ \mathrm{d}E/\mathrm{d}x } $ distribution. |
png pdf |
Figure 6:
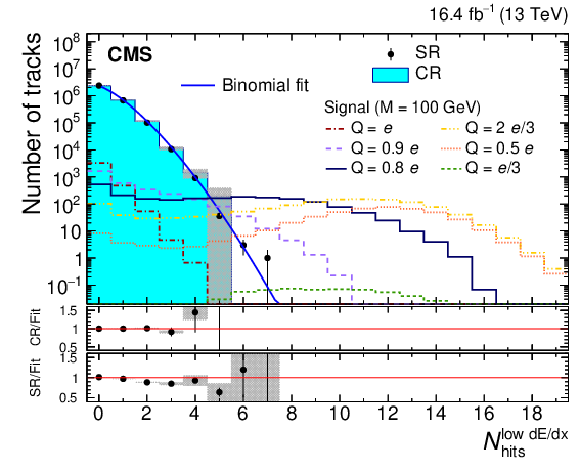
Distribution of $ N_{\text{hits}}^{\text{low}\ \mathrm{d}E/\mathrm{d}x } $ in the SR and the CR for the late 2016 data set, as well as for an FCP signal at a mass of 100 GeV and different charge scenarios. The vertical bars and the shaded area correspond to the statistical uncertainty in the SR and the CR, respectively. The $ p $-value of the fit is 78%. The two lower panels show the ratio of the number of tracks observed in the CR (upper) and SR (lower), and the fit function. The vertical bars correspond to the uncertainty from statistical sources, while the shaded area shows the systematic uncertainty in the fit due to the choice of the fitting function and the binomial fit range as explained in the main text. |
png pdf |
Figure 7:
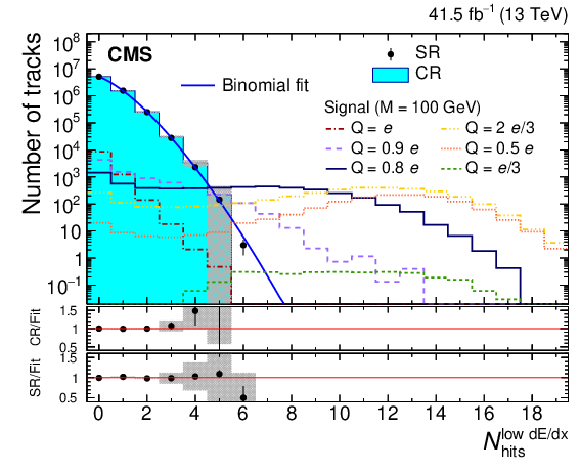
Distribution of $ N_{\text{hits}}^{\text{low}\ \mathrm{d}E/\mathrm{d}x } $ in the SR and the CR for the 2017 data set, as well as for an FCP signal at a mass of 100 GeV and different charge scenarios. The vertical bars and the shaded area correspond to the statistical uncertainty on the SR and the CR, respectively. The $ p $-value of the fit is 65%. The two lower panels show the ratio of the number of tracks observed in the CR (upper) and SR (lower), and the fit function. The vertical bars correspond to the uncertainty from statistical sources, while the shaded area shows the systematic uncertainty in the fit due to the choice of the fitting function and the binomial fit range as explained in the main text. |
| Tables | |
png pdf |
Table 1:
Number of tracks observed and expected from the background in the $ N_{\text{hits}}^{\text{low}\ \mathrm{d}E/\mathrm{d}x } $ bin with highest signal significance for early 2016 ($ \geq $ 9 hits), late 2016 ($ \geq $ 7 hits), 2017 ($ \geq $ 7 hits), and 2018 data ($ \geq $ 7 hits). The corresponding systematic uncertainties in the background estimation are also listed. |

png pdf |
Table 2:
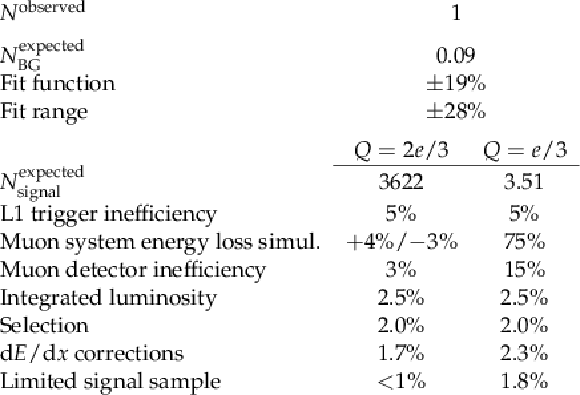
Number of tracks observed and expected for background and signal events, in the $ N_{\text{hits}}^{\text{low}\ \mathrm{d}E/\mathrm{d}x } $ bin with highest signal significance ($ \geq $9), for early 2016 data. The corresponding systematic uncertainties are also listed. They are considered to follow a log-normal distribution. The results are shown for FCP scenarios at a mass of 100 GeV with a charge of 2$ e $/3 (the most sensitive scenario) and $ e $/3 (the lowest considered charge). |
png pdf |
Table 3:
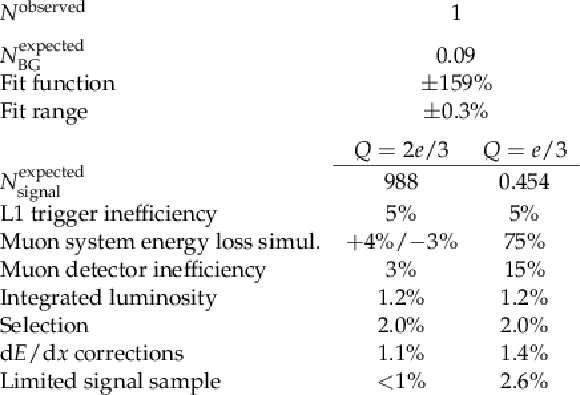
Number of tracks observed and expected for background and signal events, in the $ N_{\text{hits}}^{\text{low}\ \mathrm{d}E/\mathrm{d}x } $ bin with highest signal significance ($ \geq $7), for late 2016 data. The corresponding systematic uncertainties are also listed. They are considered to follow a log-normal distribution. The results are shown for FCP scenarios at a mass of 100 GeV with a charge of 2$ e$/3 (the most sensitive scenario) and $ e$/3 (the lowest considered charge). |
png pdf |
Table 4:
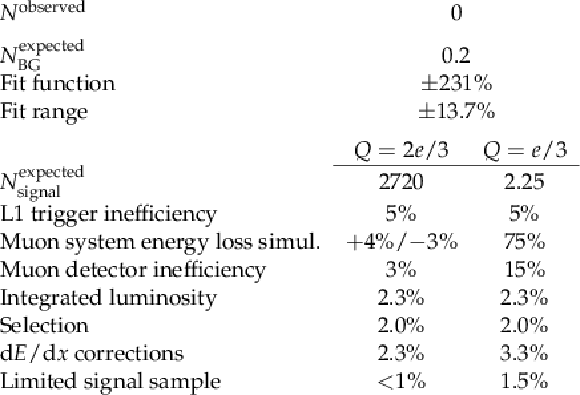
Number of tracks observed and expected for background and signal events, in the $ N_{\text{hits}}^{\text{low}\ \mathrm{d}E/\mathrm{d}x } $ bin with highest signal significance ($ \geq $7), for 2017 data. The corresponding systematic uncertainties are also listed. They are considered to follow a log-normal distribution. The results are shown for FCP scenarios at a mass of 100 GeV with a charge of 2$ e$/3 (the most sensitive scenario) and $ e$/3 (the lowest considered charge). |
png pdf |
Table 5:
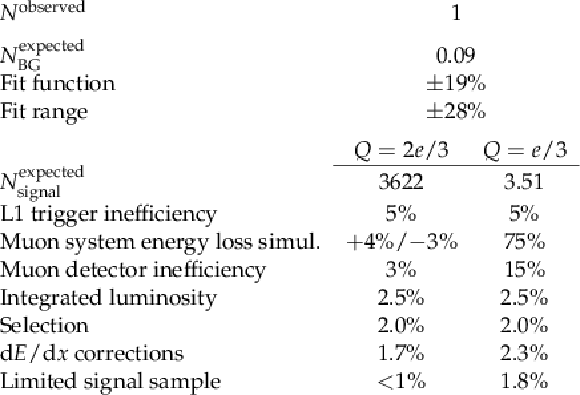
Number of tracks observed and expected for background and signal events, in the $ N_{\text{hits}}^{\text{low}\ \mathrm{d}E/\mathrm{d}x } $ bin with highest signal significance ($ \geq $7), for 2018 data. The corresponding systematic uncertainties are also listed. They are considered to follow a log-normal distribution. The results are shown for FCP scenarios at a mass of 100 GeV with a charge of 2$ e$/3 (the most sensitive scenario) and $ e$/3 (the lowest considered charge). |
| Summary |
| In summary, we presented a search for fractionally charged particles using proton-proton collisions corresponding to an integrated luminosity of 138 fb$ ^{-1} $, collected at $ \sqrt{s} = $ 13 TeV with the CMS detector. The key feature of low ionization energy in the CMS tracker detector is used to discriminate a potential signal from the background. No significant deviation is observed in data with respect to the expected background. The search presents for the first time a scan of the new particle charge between $ e$/3 and $ e $. The existence of fractionally charged particles arising from the considered DY-like pair production is excluded in the mass range between 50 and 640 (60) GeV for a signal of charge $ Q = $ 2$e$/3 ($e$/3). These are the most stringent limits to date for this production mode. |
| References | ||||
| 1 | B. Holdom | Two U(1)'s and $ \epsilon $ charge shifts | PLB 166 (1986) 196 | |
| 2 | S. A. Abel et al. | Kinetic mixing of the photon with hidden U(1)s in string phenomenology | JHEP 07 (2008) 124 | 0803.1449 |
| 3 | X.-G. Wen and E. Witten | Electric and magnetic charges in superstring models | Nuclear Physics B 261 (1985) 651 | |
| 4 | X. Gan and Y.-D. Tsai | Cosmic millicharge background and reheating probes | 8, 2023 | 2308.07951 |
| 5 | P. Langacker | The physics of heavy $ \mathrm{Z}^{'} $ gauge bosons | Rev. Mod. Phys. 81 (2009) 1199 | 0801.1345 |
| 6 | G. Shiu, P. Soler, and F. Ye | Milli-charged dark matter in quantum gravity and string theory | PRL 110 (2013) 241304 | 1302.5471 |
| 7 | D. E. Morrissey, D. Poland, and K. M. Zurek | Abelian hidden sectors at a GeV | JHEP 07 (2009) 050 | 0904.2567 |
| 8 | CMS Collaboration | Search for fractionally charged particles in pp collisions at $ \sqrt{s}= $ 7 TeV | PRD 87 (2013) 092008 | CMS-EXO-11-074 1210.2311 |
| 9 | CMS Collaboration | Searches for long-lived charged particles in pp collisions at $ \sqrt{s} = $ 7 and 8 TeV | JHEP 07 (2013) 122 | CMS-EXO-12-026 1305.0491 |
| 10 | S. L. Dubovsky, D. S. Gorbunov, and G. I. Rubtsov | Narrowing the window for millicharged particles by CMB anisotropy | JETP Lett. 79 (2004) 1 | hep-ph/0311189 |
| 11 | H. Vogel and J. Redondo | Dark Radiation constraints on minicharged particles in models with a hidden photon | JCAP 02 (2014) 029 | 1311.2600 |
| 12 | S. Davidson, S. Hannestad, and G. Raffelt | Updated bounds on millicharged particles | JHEP 05 (2000) 003 | hep-ph/0001179 |
| 13 | OPAL Collaboration | Search for stable and long-lived massive charged particles in e+e- collisions at $ \sqrt{s} = $ 130--209 GeV | PLB 572 (2003) 8 | hep-ex/0305031 |
| 14 | A. Haas, C. S. Hill, E. Izaguirre, and I. Yavin | Looking for milli-charged particles with a new experiment at the LHC | PLB 746 (2015) 117 | 1410.6816 |
| 15 | A. Ball et al. | A letter of intent to install a milli-charged particle detector at LHC P5 | 1607.04669 | |
| 16 | M. Kalliokoski et al. | Searching for minicharged particles at the energy frontier with the MoEDAL-MAPP experiment at the LHC | JHEP 04 (2024) 137 | 2311.02185 |
| 17 | A. Ball et al. | Search for millicharged particles in proton-proton collisions at $ \sqrt{s} = $ 13 TeV | PRD 102 (2020) 032002 | 2005.06518 |
| 18 | milliQan Collaboration | Sensitivity to millicharged particles in future proton-proton collisions at the LHC with the milliQan detector | PRD 104 (2021) 032002 | 2104.07151 |
| 19 | P.-K. Hu, A. Kusenko, and V. Takhistov | Dark cosmic rays | PLB 768 (2017) 18 | 1611.04599 |
| 20 | R. Plestid et al. | Constraints on millicharged particles from cosmic-ray production | PRD 102 (2020) 115032 | 2002.11732 |
| 21 | I. T. Lee et al. | Large bulk matter search for fractional charge particles | PRD 66 (2002) 012002 | |
| 22 | P. C. Kim et al. | Search for fractional-charge particles in meteoritic material | PRL 99 (2007) 161804 | |
| 23 | The Tracker Group of the CMS Collaboration | The CMS phase-1 pixel detector upgrade | JINST 16 (2021) P02027 | 2012.14304 |
| 24 | CMS Collaboration | The CMS experiment at the CERN LHC | JINST 3 (2008) S08004 | |
| 25 | CMS Collaboration | Performance of the CMS muon detector and muon reconstruction with proton-proton collisions at $ \sqrt{s} = $ 13 TeV | JINST 13 (2018) P06015 | CMS-MUO-16-001 1804.04528 |
| 26 | T. Sjöstrand et al. | An introduction to PYTHIA 8.2 | Comput. Phys. Commun. 191 (2015) 159 | 1410.3012 |
| 27 | J. Alwall et al. | The automated computation of tree-level and next-to-leading order differential cross sections, and their matching to parton shower simulations | JHEP 07 (2014) 079 | 1405.0301 |
| 28 | NNPDF Collaboration | Parton distributions from high-precision collider data | EPJC 77 (2017) 663 | 1706.00428 |
| 29 | CMS Collaboration | Event generator tunes obtained from underlying event and multiparton scattering measurements | EPJC 76 (2016) 155 | CMS-GEN-14-001 1512.00815 |
| 30 | CMS Collaboration | Investigations of the impact of the parton shower tuning in PYTHIA8 in the modelling of $ \mathrm{t} \overline{\mathrm{t}} $ at $ \sqrt{s}= $ 8 and 13 TeV | CMS Physics Analysis Summary, 2016 CDS |
|
| 31 | CMS Collaboration | Extraction and validation of a new set of CMS PYTHIA8 tunes from underlying-event measurements | EPJC 80 (2020) 4 | CMS-GEN-17-001 1903.12179 |
| 32 | GEANT4 Collaboration | GEANT 4---a simulation toolkit | NIM A 506 (2003) 250 | |
| 33 | CMS Collaboration | The CMS trigger system | JINST 12 (2017) P01020 | CMS-TRG-12-001 1609.02366 |
| 34 | CMS Collaboration | Strategies and performance of the CMS silicon tracker alignment during LHC Run 2 | NIM A 1037 (2022) 166795 | CMS-TRK-20-001 2111.08757 |
| 35 | CMS Collaboration | Simulation of the silicon strip tracker pre-amplifier in early 2016 data | CMS Detector Performance Summary CMS-DP-2020-045, 2020 CDS |
|
| 36 | CMS Collaboration | Operation and performance of the CMS outer tracker | PoS Vertex 2017 (2018) 013 | |
| 37 | CMS Collaboration | Supplemental Material | See the Supplemental Material for additional figures reporting the distributions for 2016 and 2017 data sets, as well as tables with the corresponding observed and expected event yields for both signal and background. link |
|
| 38 | CMS Collaboration | HEPData record for this analysis | link | |
| 39 | E. Gross and O. Vitells | Trial factors for the look elsewhere effect in high energy physics | EPJC 70 (2010) 525 | 1005.1891 |
| 40 | CMS Collaboration | Precision luminosity measurement in proton-proton collisions at $ \sqrt{s} = $ 13 TeV in 2015 and 2016 at CMS | EPJC 81 (2021) 800 | CMS-LUM-17-003 2104.01927 |
| 41 | CMS Collaboration | CMS luminosity measurement for the 2017 data-taking period at $ \sqrt{s} = $ 13 TeV | CMS Physics Analysis Summary, 2018 CMS-PAS-LUM-17-004 |
CMS-PAS-LUM-17-004 |
| 42 | CMS Collaboration | CMS luminosity measurements for the 2018 data-taking period at $ \sqrt{s} = $ 13 TeV | CMS Physics Analysis Summary, 2018 CMS-PAS-LUM-18-002 |
CMS-PAS-LUM-18-002 |
| 43 | T. Junk | Confidence level computation for combining searches with small statistics | NIM A 434 (1999) 435 | hep-ex/9902006 |
| 44 | A. L. Read | Presentation of search results: the $ \text{CL}_\text{s} $ technique | JPG 28 (2002) 2693 | |

|
Compact Muon Solenoid LHC, CERN |

|

|

|

|

|

|