

Compact Muon Solenoid
LHC, CERN
| CMS-EXO-24-038 ; CERN-EP-2025-156 | ||
| Search for resonant production of pairs of dijet resonances through broad mediators in proton-proton collisions at $ \sqrt{s} = $ 13 TeV | ||
| CMS Collaboration | ||
| 23 July 2025 | ||
| Submitted to J. High Energy Phys. | ||
| Abstract: A reinterpretation of a prior narrow-resonance search is performed to investigate the resonant production of pairs of dijet resonances via broad mediators. This analysis targets events with four resolved jets, requiring dijet invariant masses greater than 0.2 TeV and four-jet invariant masses greater than 1.6 TeV. The search uses a data sample corresponding to an integrated luminosity of 138 fb$ ^{-1} $ collected by the CMS experiment in proton-proton collisions at $ \sqrt{s} = $ 13 TeV. The reinterpretation considers the production of new heavy four-jet resonances, with widths ranging from 1.5 to 10% of their mass, which decay to a pair of dijet resonances. This analysis probes resonant production in the four-jet and dijet mass distributions. Upper limits at 95% confidence level and significances are reported on the production cross section of new resonances as functions of their widths and masses, between 2 and 10 TeV. In particular, at a four-jet resonance mass of 8.6 TeV, the local (global) significance ranges from 3.9 (1.6) to 3.6 (1.4) standard deviations (s.d.) as the resonance width is increased from 1.5 to 10%. This relative insensitivity to the choice of width indicates that a broad resonance is an equally valid interpretation of this excess. The broad resonance hypothesis at a resonance mass of 8.6 TeV is supported by the presence of an event with a four-jet mass of 5.8 TeV and an average dijet mass of 2.0 TeV. Also, we report the reinterpretation of a second effect, at a four-jet resonance mass of 3.6 TeV, which has a local (global) significance of up to 3.9 (2.2) s.d. | ||
| Links: e-print arXiv:2507.17884 [hep-ex] (PDF) ; CDS record ; inSPIRE record ; CADI line (restricted) ; | ||
| Figures | |
png pdf |
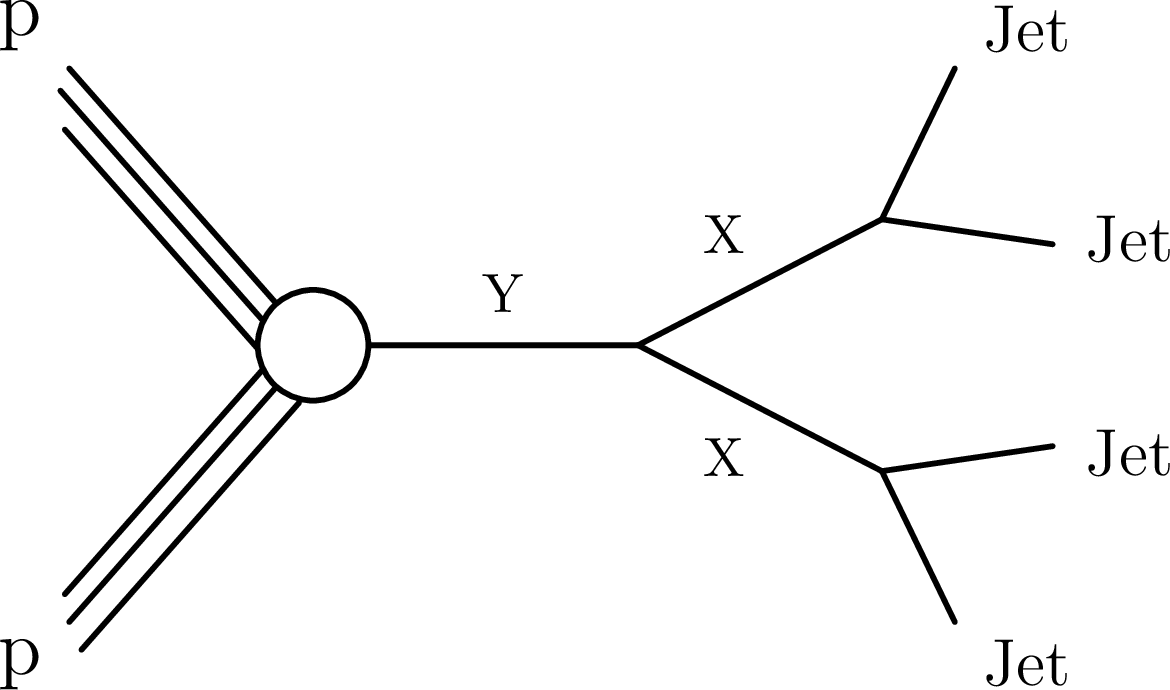
Figure 1:
Resonant production via a particle, $ \mathrm{Y} $, of pairs of dijet resonances, $ \mathrm{X} $. |
png pdf |
Figure 2:
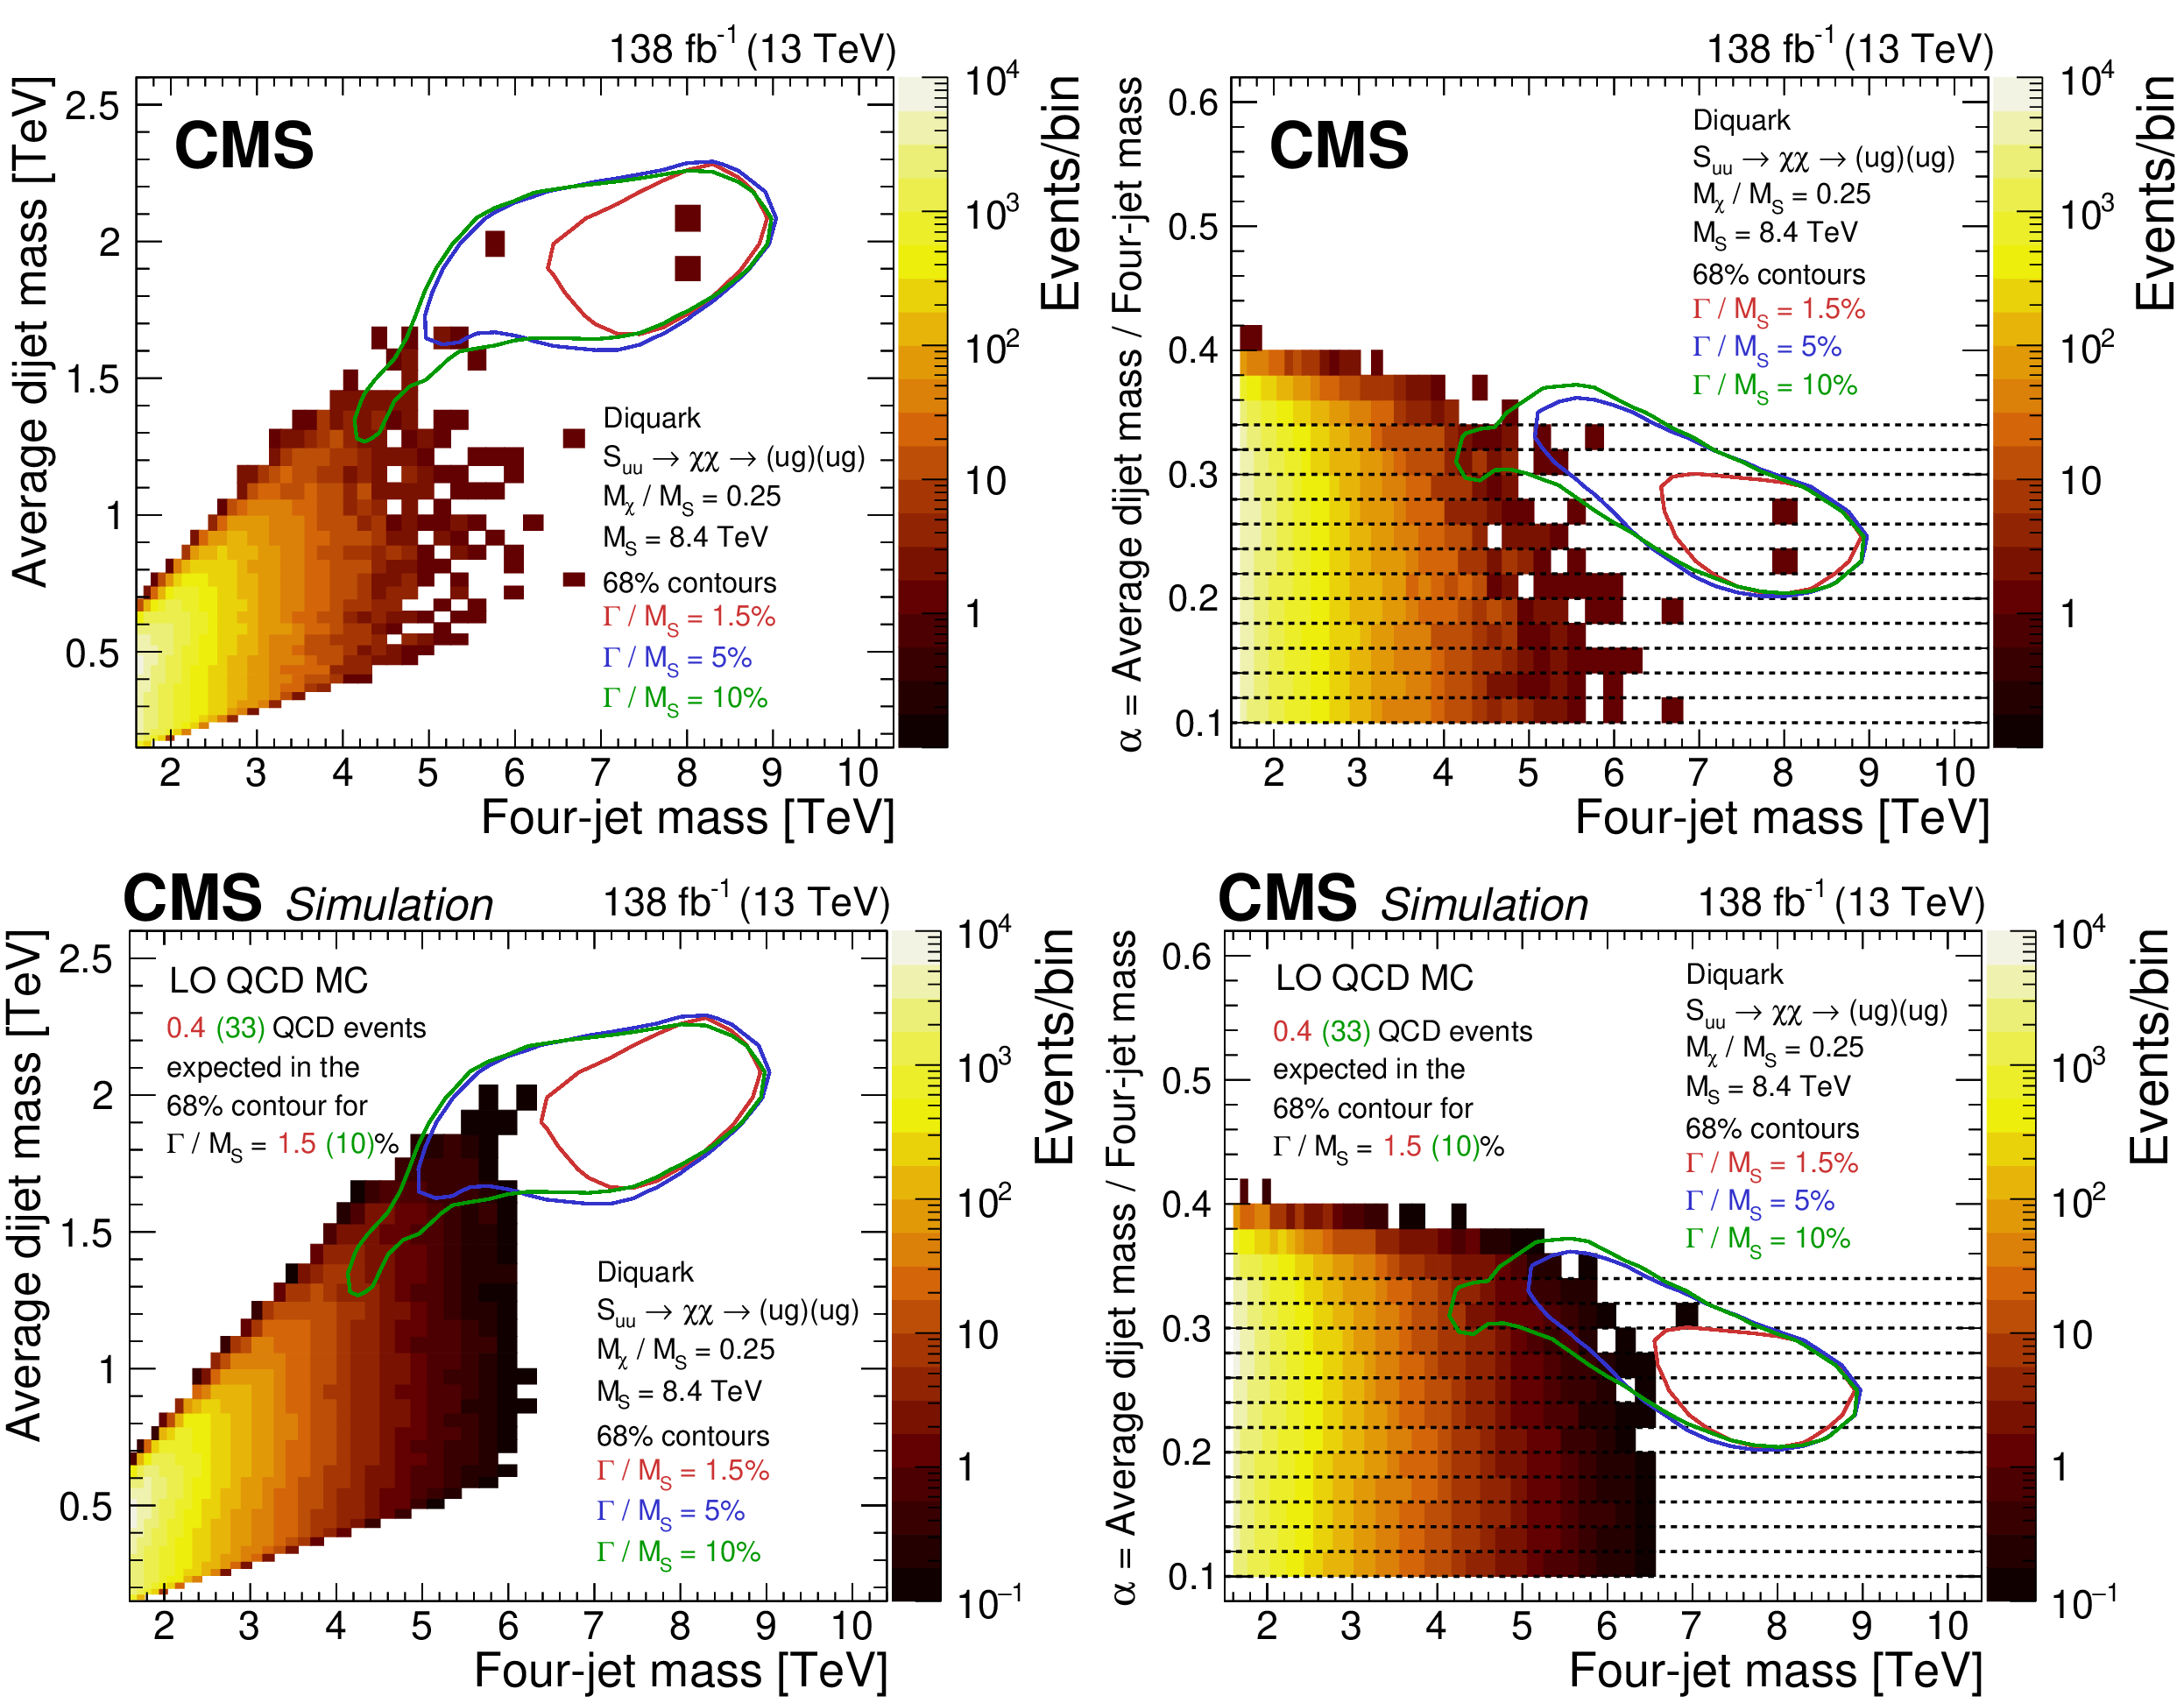
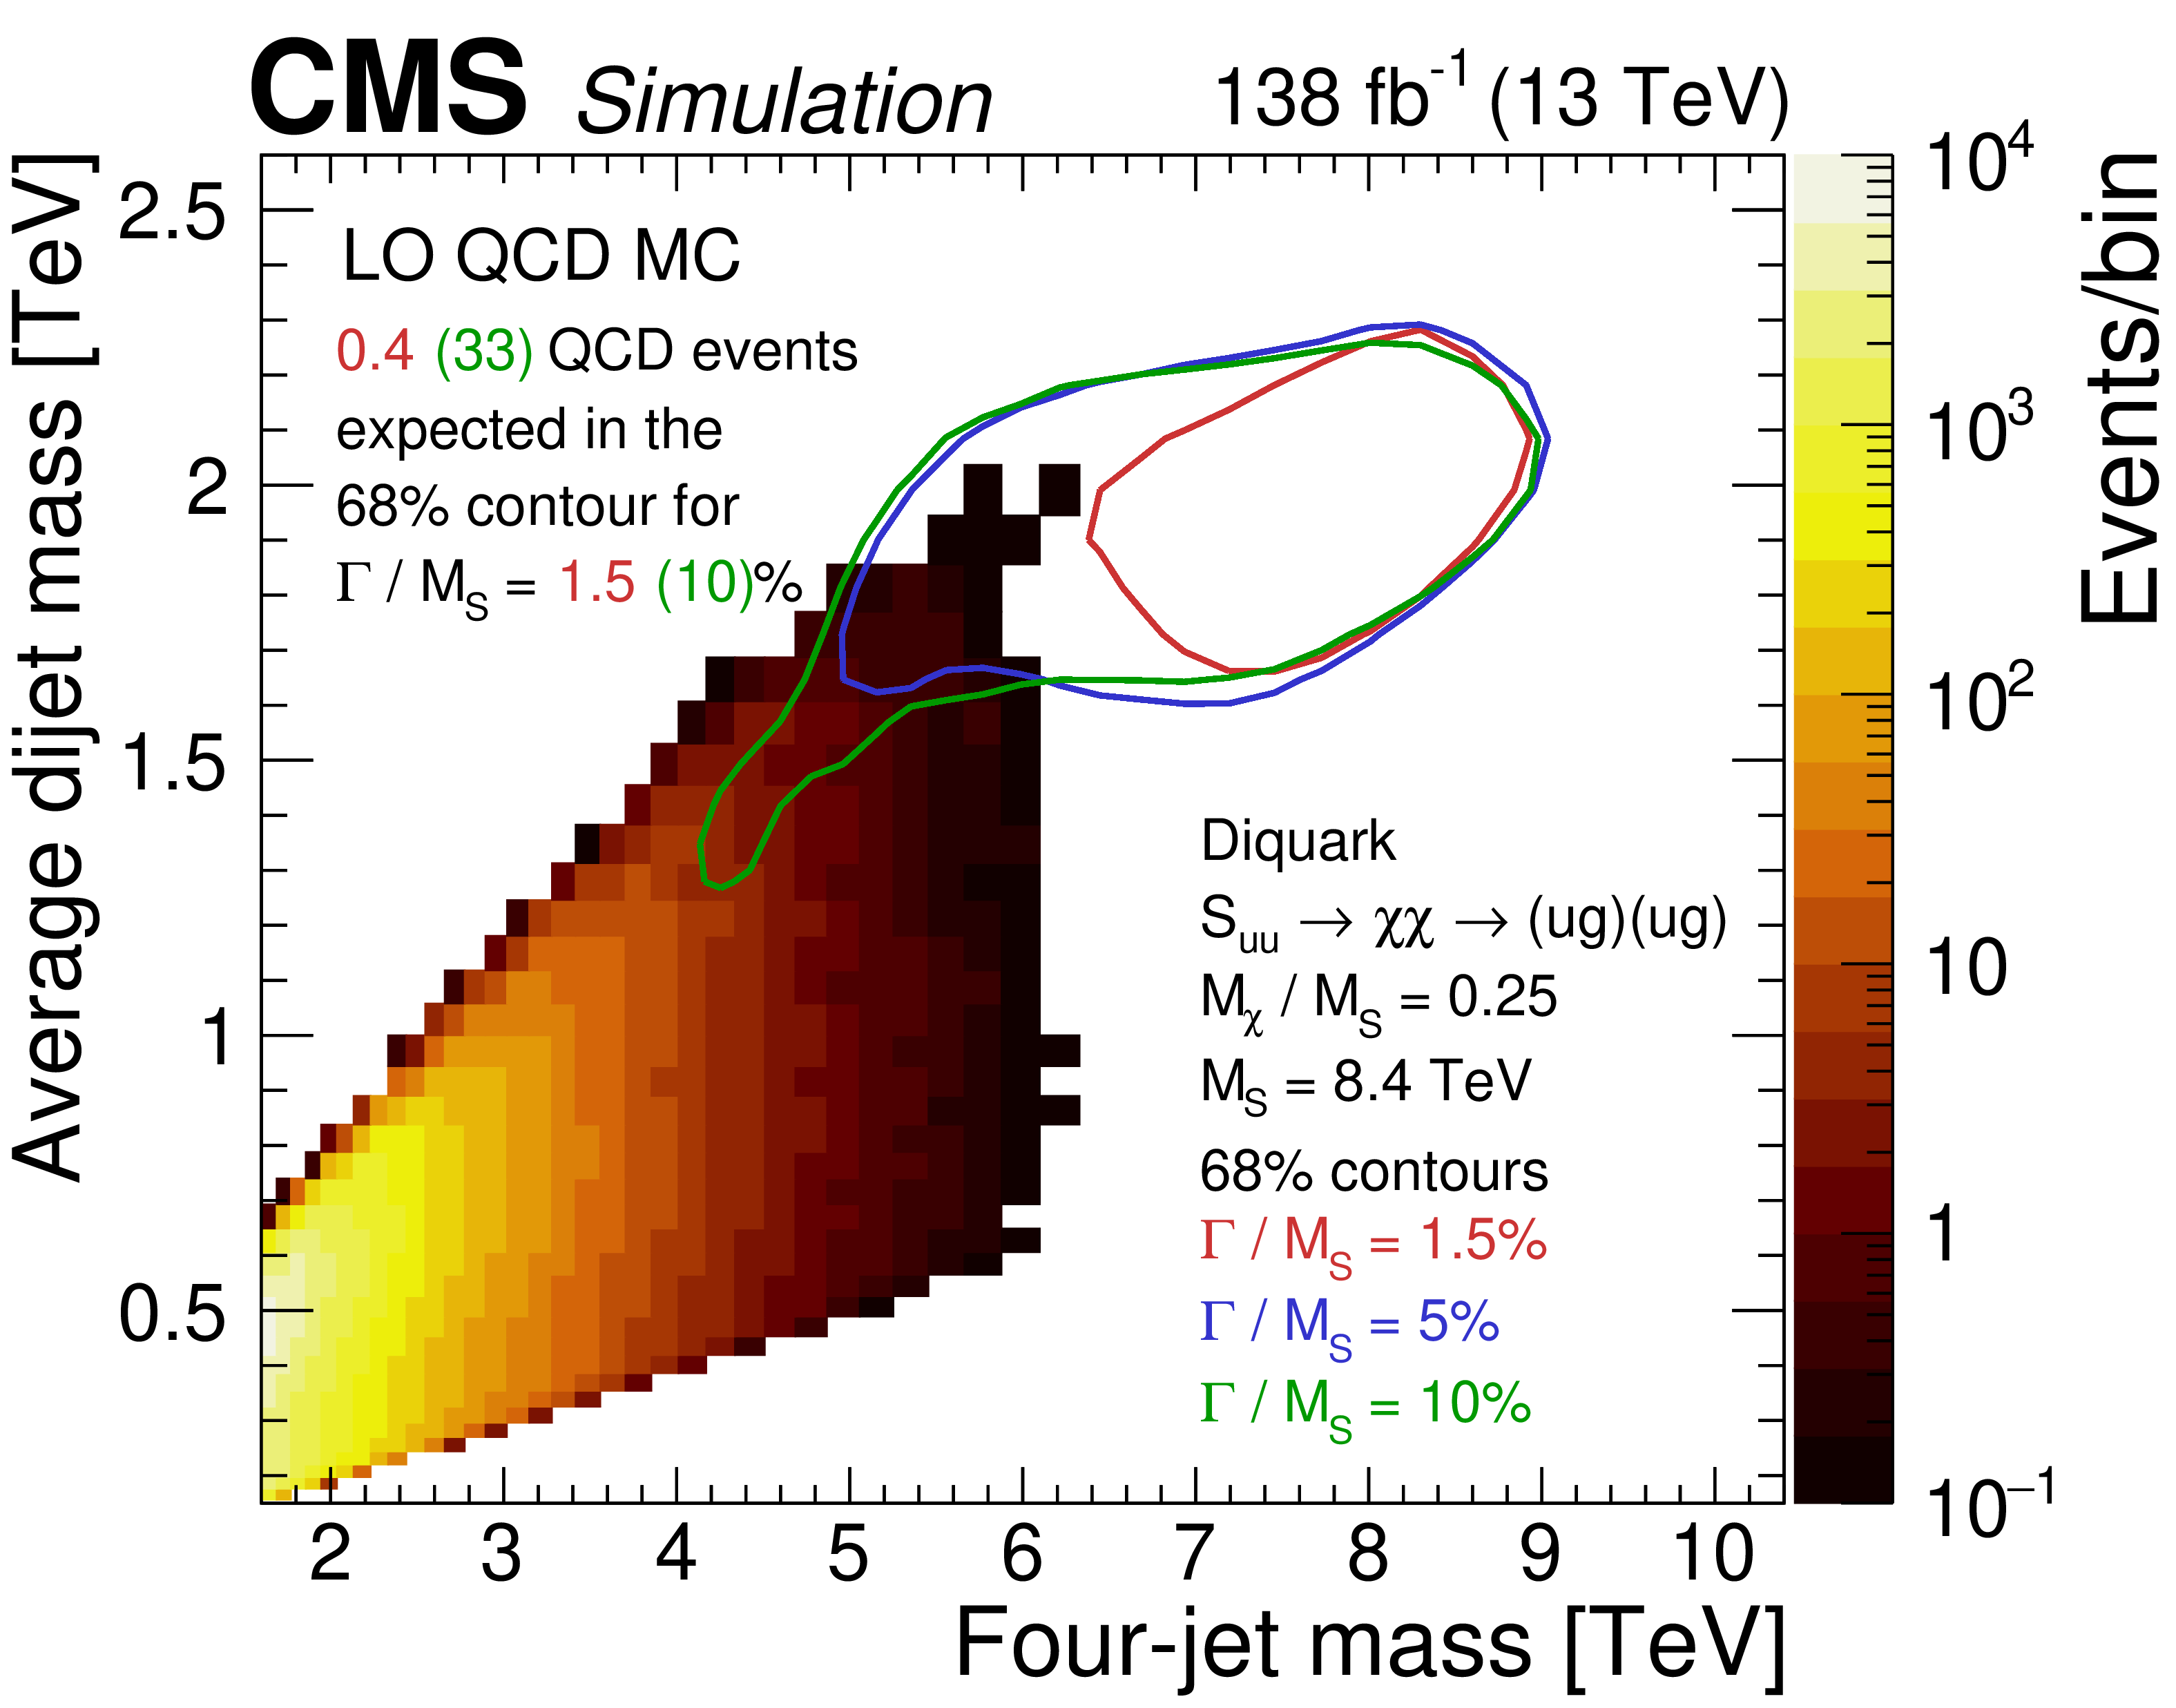
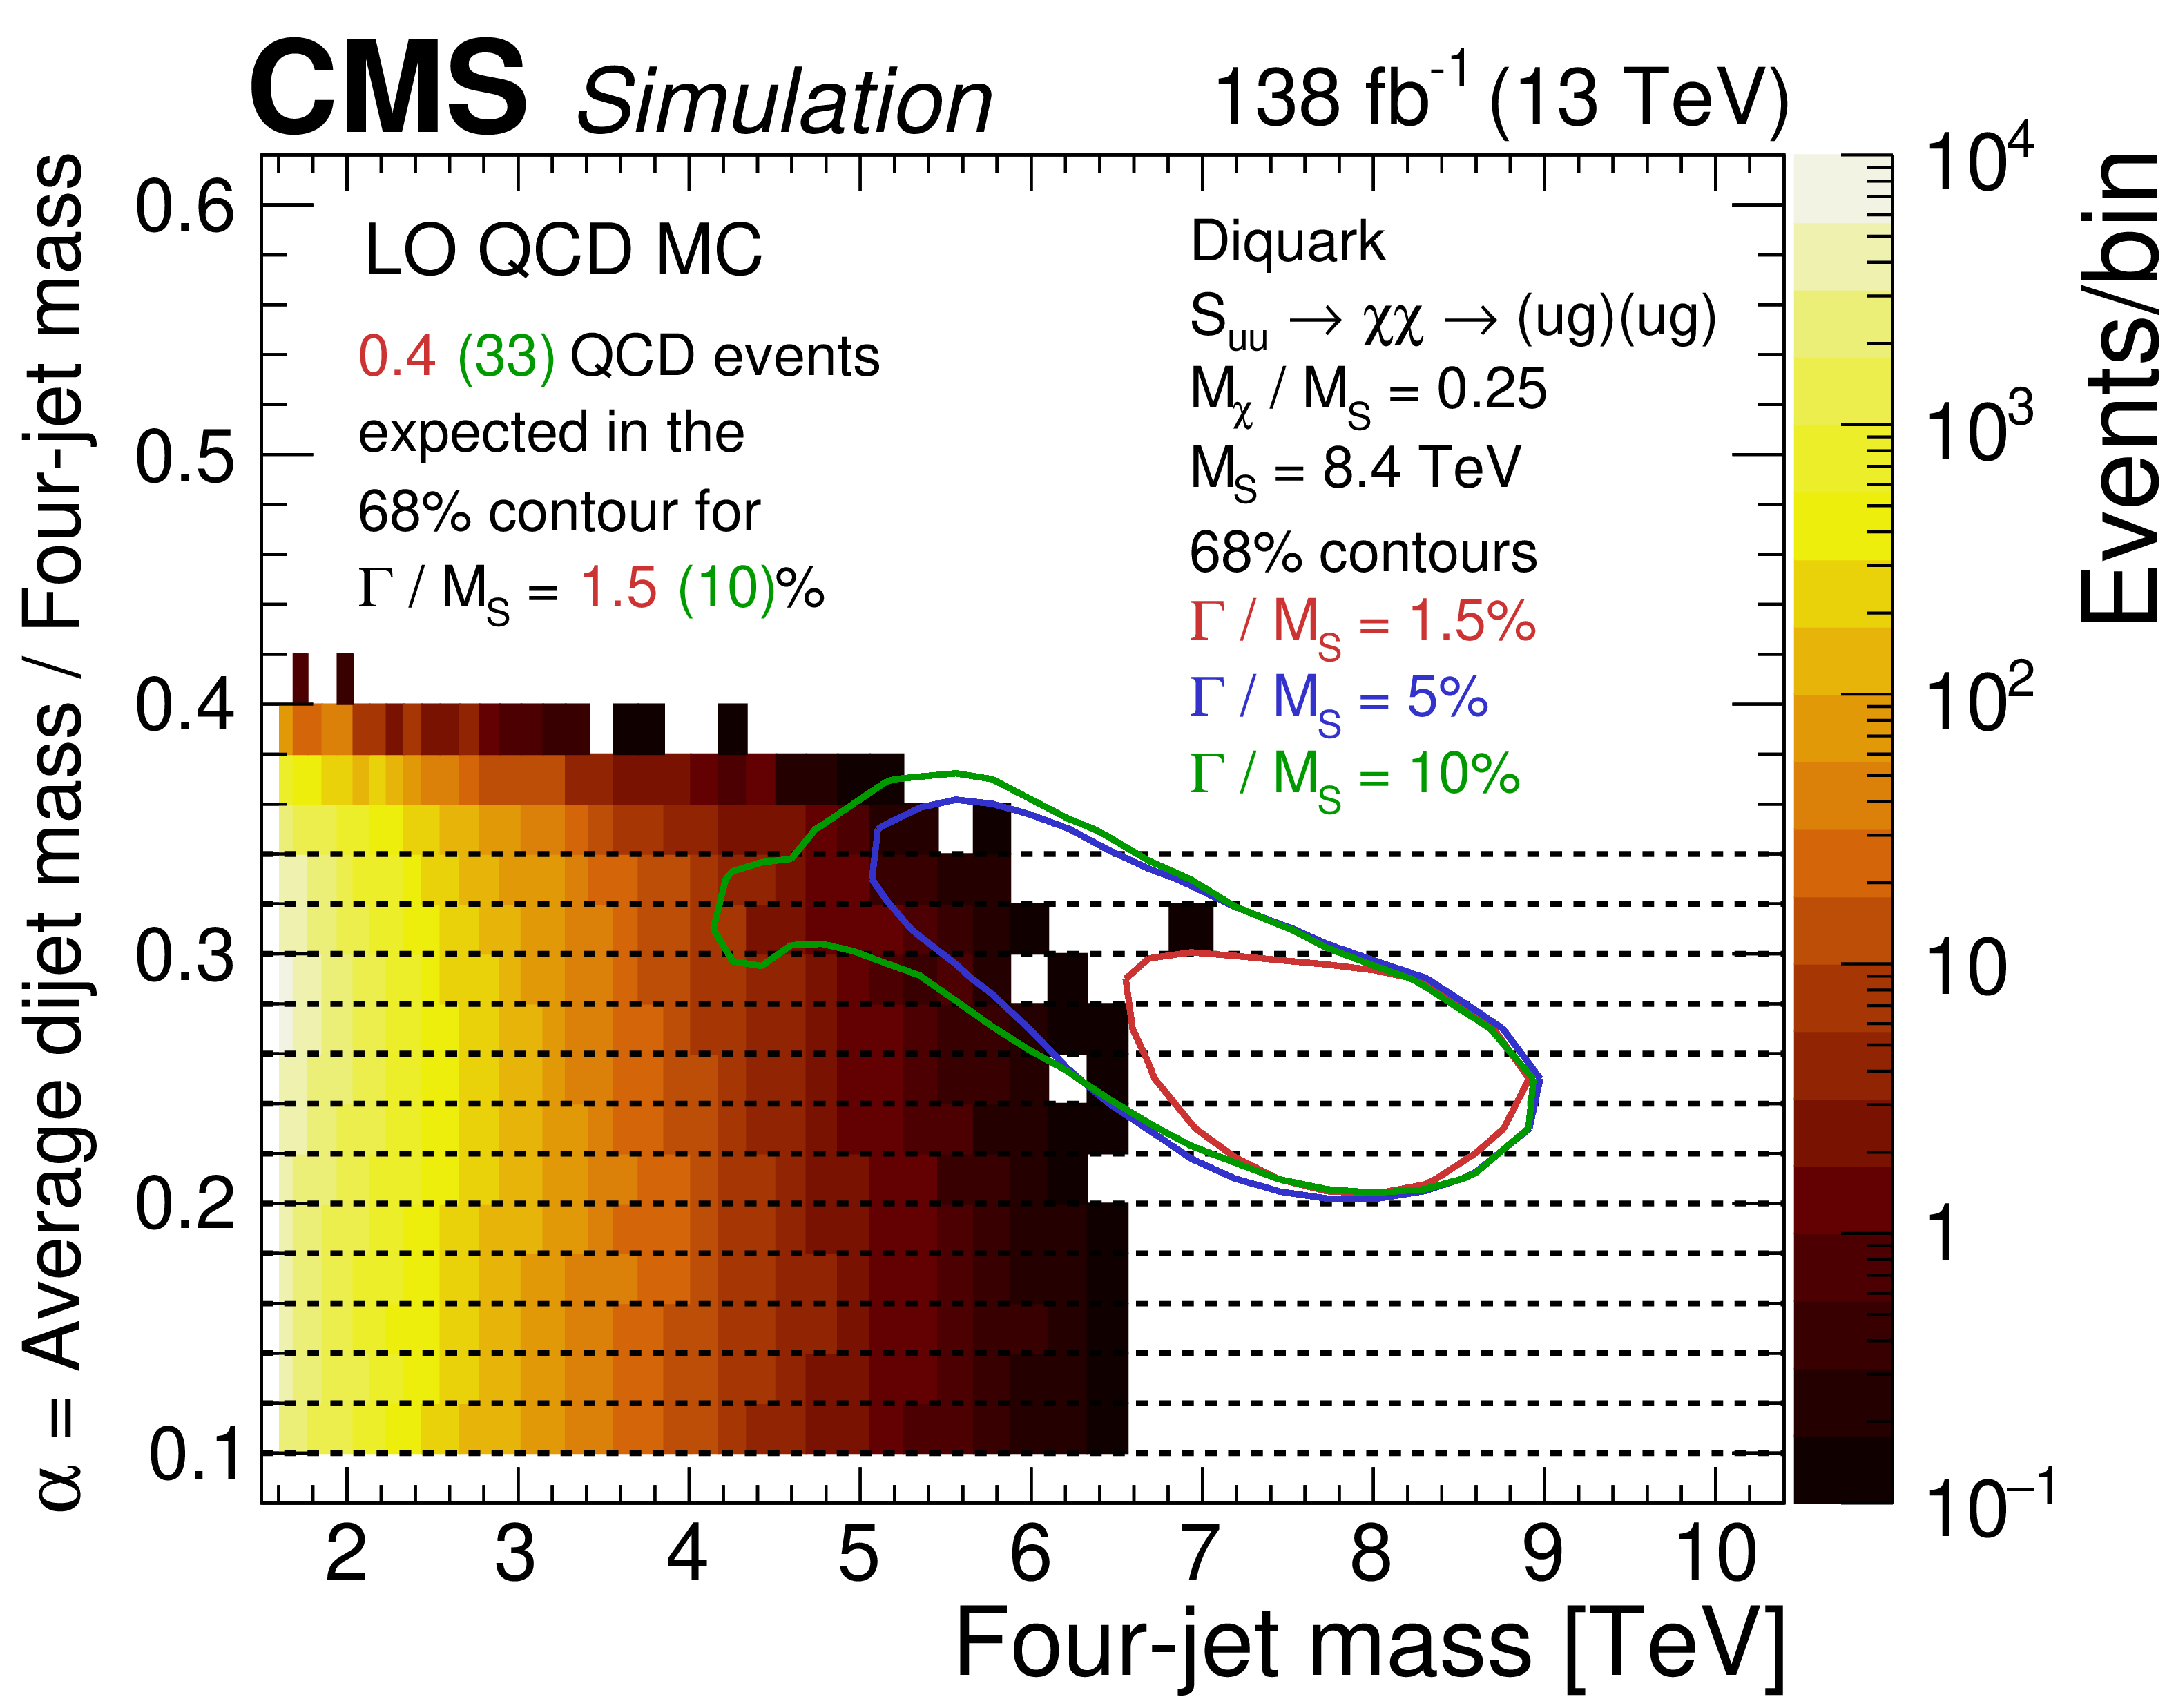
Observed number of events (upper) and predictions of a leading order (LO) QCD simulation (lower), normalized to an integrated luminosity of 138 fb$ ^{-1} $. The number of events (color scale) are examined within bins of the four-jet mass and the average mass of the two dijets (left) and within bins of $ m_{\mathrm{4j}} $ and the ratio $ \alpha $ (right), which is $ \overline{m}_{\mathrm{2j}} $ divided by $ m_{\mathrm{4j}} $. The solid curves show the 68% probability contours from a signal simulation of a diquark with a mass of 8.4 TeV, decaying to a pair of vector-like quarks, each with a mass of 2.1 TeV. The red, blue, and green probability contours correspond to 1.5, 5, and 10% diquark widths, respectively. The right plots also show the thirteen $ \alpha $ bins used to define the $ m_{\mathrm{4j}} $ distributions (dashed lines). The number of SM events, predicted by the LO QCD simulation, enclosed within the 68% probability contours of signals with 1.5 and 10% widths are 0.4 and 33, respectively. |
png pdf |
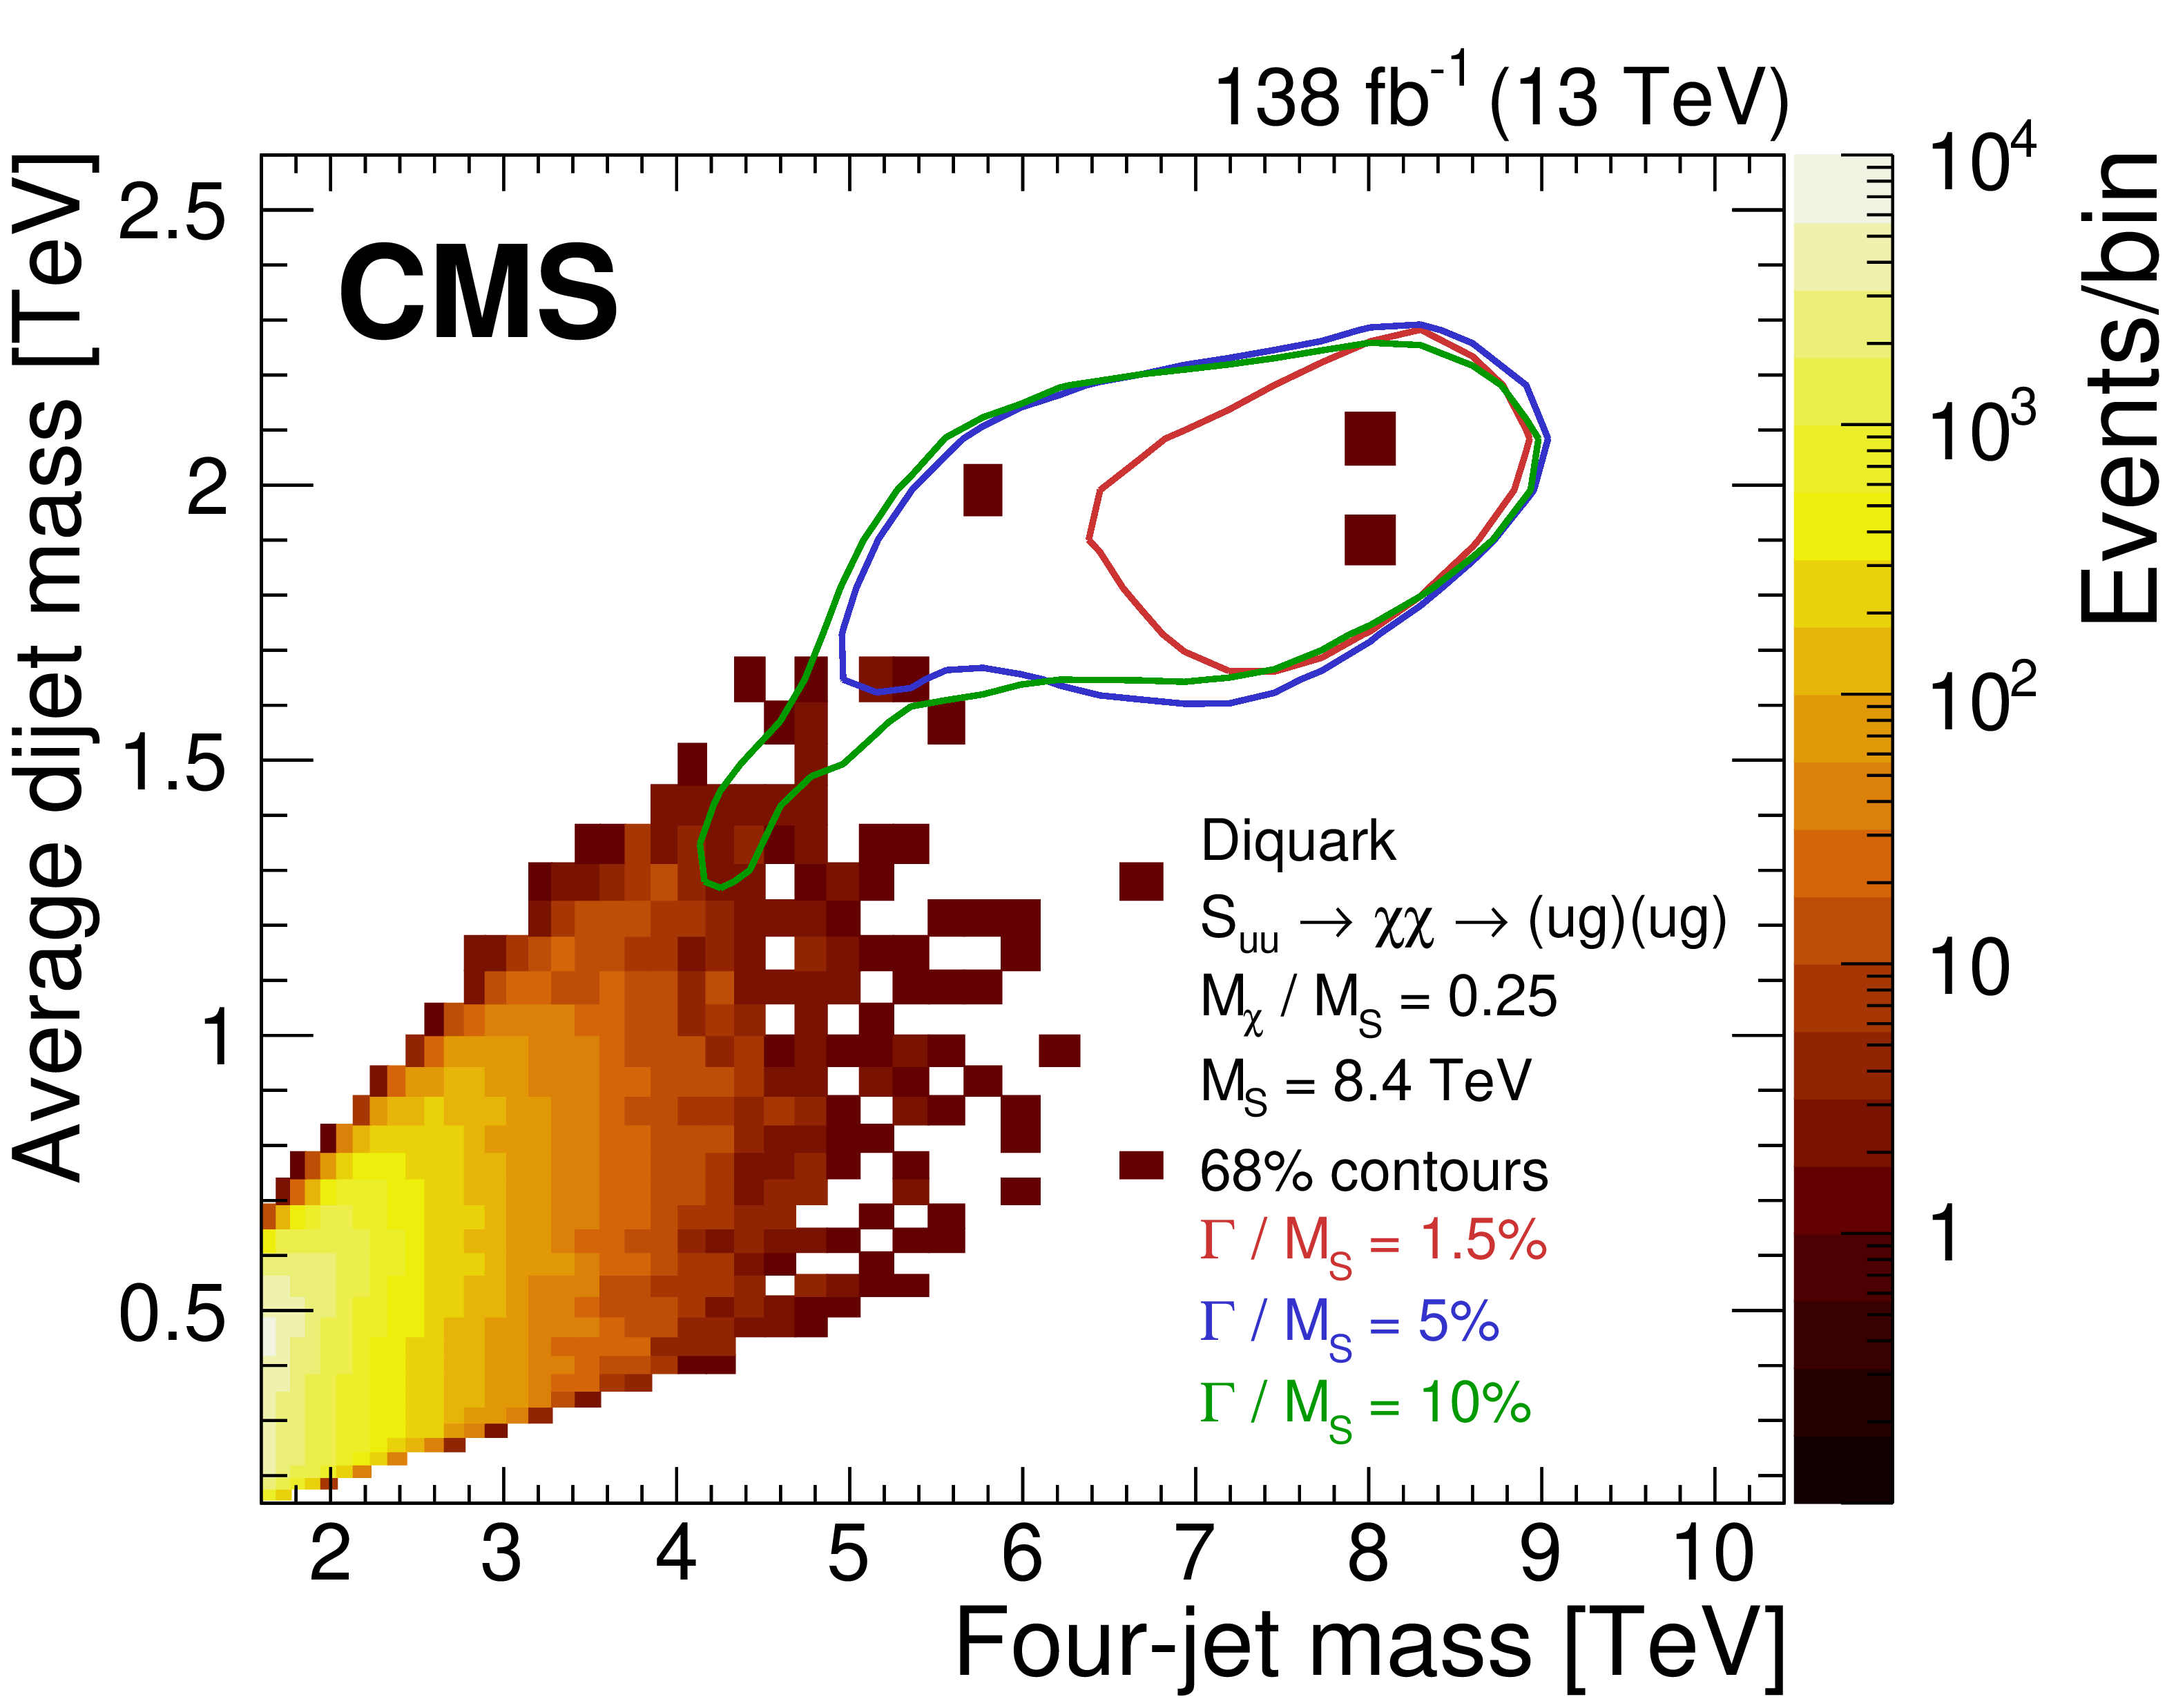
Figure 2-a:
Observed number of events (upper) and predictions of a leading order (LO) QCD simulation (lower), normalized to an integrated luminosity of 138 fb$ ^{-1} $. The number of events (color scale) are examined within bins of the four-jet mass and the average mass of the two dijets (left) and within bins of $ m_{\mathrm{4j}} $ and the ratio $ \alpha $ (right), which is $ \overline{m}_{\mathrm{2j}} $ divided by $ m_{\mathrm{4j}} $. The solid curves show the 68% probability contours from a signal simulation of a diquark with a mass of 8.4 TeV, decaying to a pair of vector-like quarks, each with a mass of 2.1 TeV. The red, blue, and green probability contours correspond to 1.5, 5, and 10% diquark widths, respectively. The right plots also show the thirteen $ \alpha $ bins used to define the $ m_{\mathrm{4j}} $ distributions (dashed lines). The number of SM events, predicted by the LO QCD simulation, enclosed within the 68% probability contours of signals with 1.5 and 10% widths are 0.4 and 33, respectively. |
png pdf |
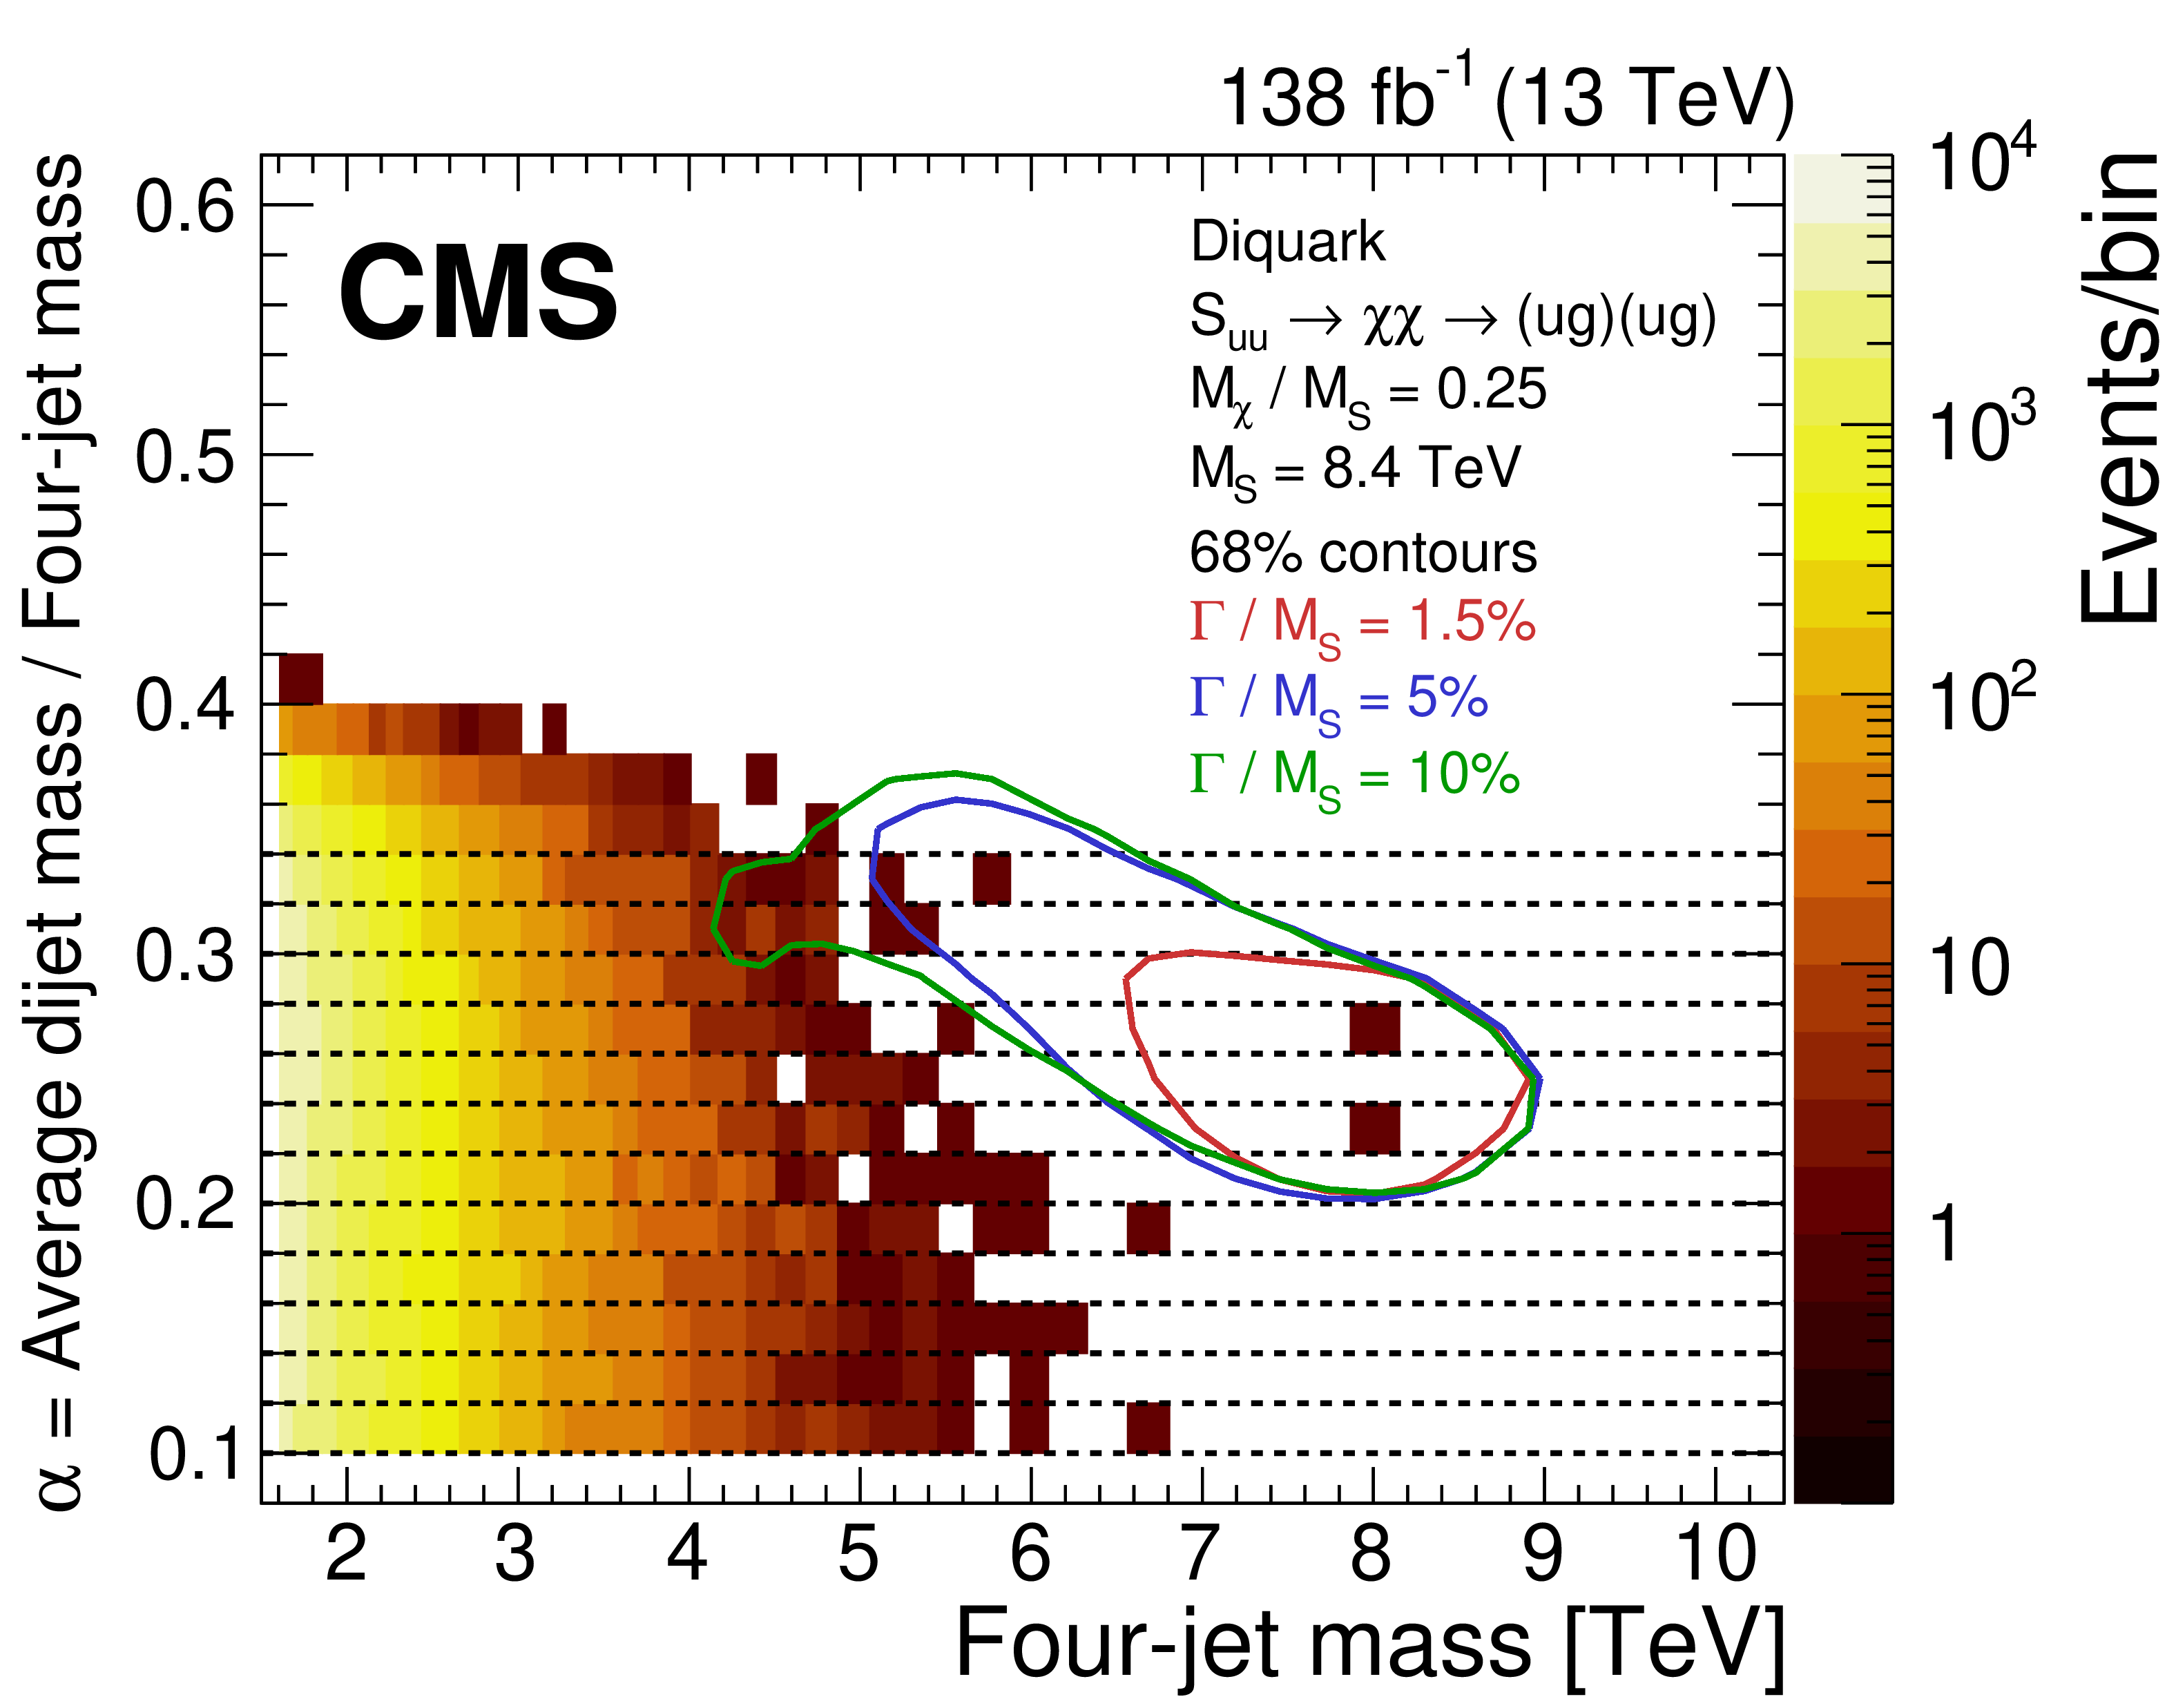
Figure 2-b:
Observed number of events (upper) and predictions of a leading order (LO) QCD simulation (lower), normalized to an integrated luminosity of 138 fb$ ^{-1} $. The number of events (color scale) are examined within bins of the four-jet mass and the average mass of the two dijets (left) and within bins of $ m_{\mathrm{4j}} $ and the ratio $ \alpha $ (right), which is $ \overline{m}_{\mathrm{2j}} $ divided by $ m_{\mathrm{4j}} $. The solid curves show the 68% probability contours from a signal simulation of a diquark with a mass of 8.4 TeV, decaying to a pair of vector-like quarks, each with a mass of 2.1 TeV. The red, blue, and green probability contours correspond to 1.5, 5, and 10% diquark widths, respectively. The right plots also show the thirteen $ \alpha $ bins used to define the $ m_{\mathrm{4j}} $ distributions (dashed lines). The number of SM events, predicted by the LO QCD simulation, enclosed within the 68% probability contours of signals with 1.5 and 10% widths are 0.4 and 33, respectively. |
png pdf |
Figure 2-c:
Observed number of events (upper) and predictions of a leading order (LO) QCD simulation (lower), normalized to an integrated luminosity of 138 fb$ ^{-1} $. The number of events (color scale) are examined within bins of the four-jet mass and the average mass of the two dijets (left) and within bins of $ m_{\mathrm{4j}} $ and the ratio $ \alpha $ (right), which is $ \overline{m}_{\mathrm{2j}} $ divided by $ m_{\mathrm{4j}} $. The solid curves show the 68% probability contours from a signal simulation of a diquark with a mass of 8.4 TeV, decaying to a pair of vector-like quarks, each with a mass of 2.1 TeV. The red, blue, and green probability contours correspond to 1.5, 5, and 10% diquark widths, respectively. The right plots also show the thirteen $ \alpha $ bins used to define the $ m_{\mathrm{4j}} $ distributions (dashed lines). The number of SM events, predicted by the LO QCD simulation, enclosed within the 68% probability contours of signals with 1.5 and 10% widths are 0.4 and 33, respectively. |
png pdf |
Figure 2-d:
Observed number of events (upper) and predictions of a leading order (LO) QCD simulation (lower), normalized to an integrated luminosity of 138 fb$ ^{-1} $. The number of events (color scale) are examined within bins of the four-jet mass and the average mass of the two dijets (left) and within bins of $ m_{\mathrm{4j}} $ and the ratio $ \alpha $ (right), which is $ \overline{m}_{\mathrm{2j}} $ divided by $ m_{\mathrm{4j}} $. The solid curves show the 68% probability contours from a signal simulation of a diquark with a mass of 8.4 TeV, decaying to a pair of vector-like quarks, each with a mass of 2.1 TeV. The red, blue, and green probability contours correspond to 1.5, 5, and 10% diquark widths, respectively. The right plots also show the thirteen $ \alpha $ bins used to define the $ m_{\mathrm{4j}} $ distributions (dashed lines). The number of SM events, predicted by the LO QCD simulation, enclosed within the 68% probability contours of signals with 1.5 and 10% widths are 0.4 and 33, respectively. |
png pdf |
Figure 3:
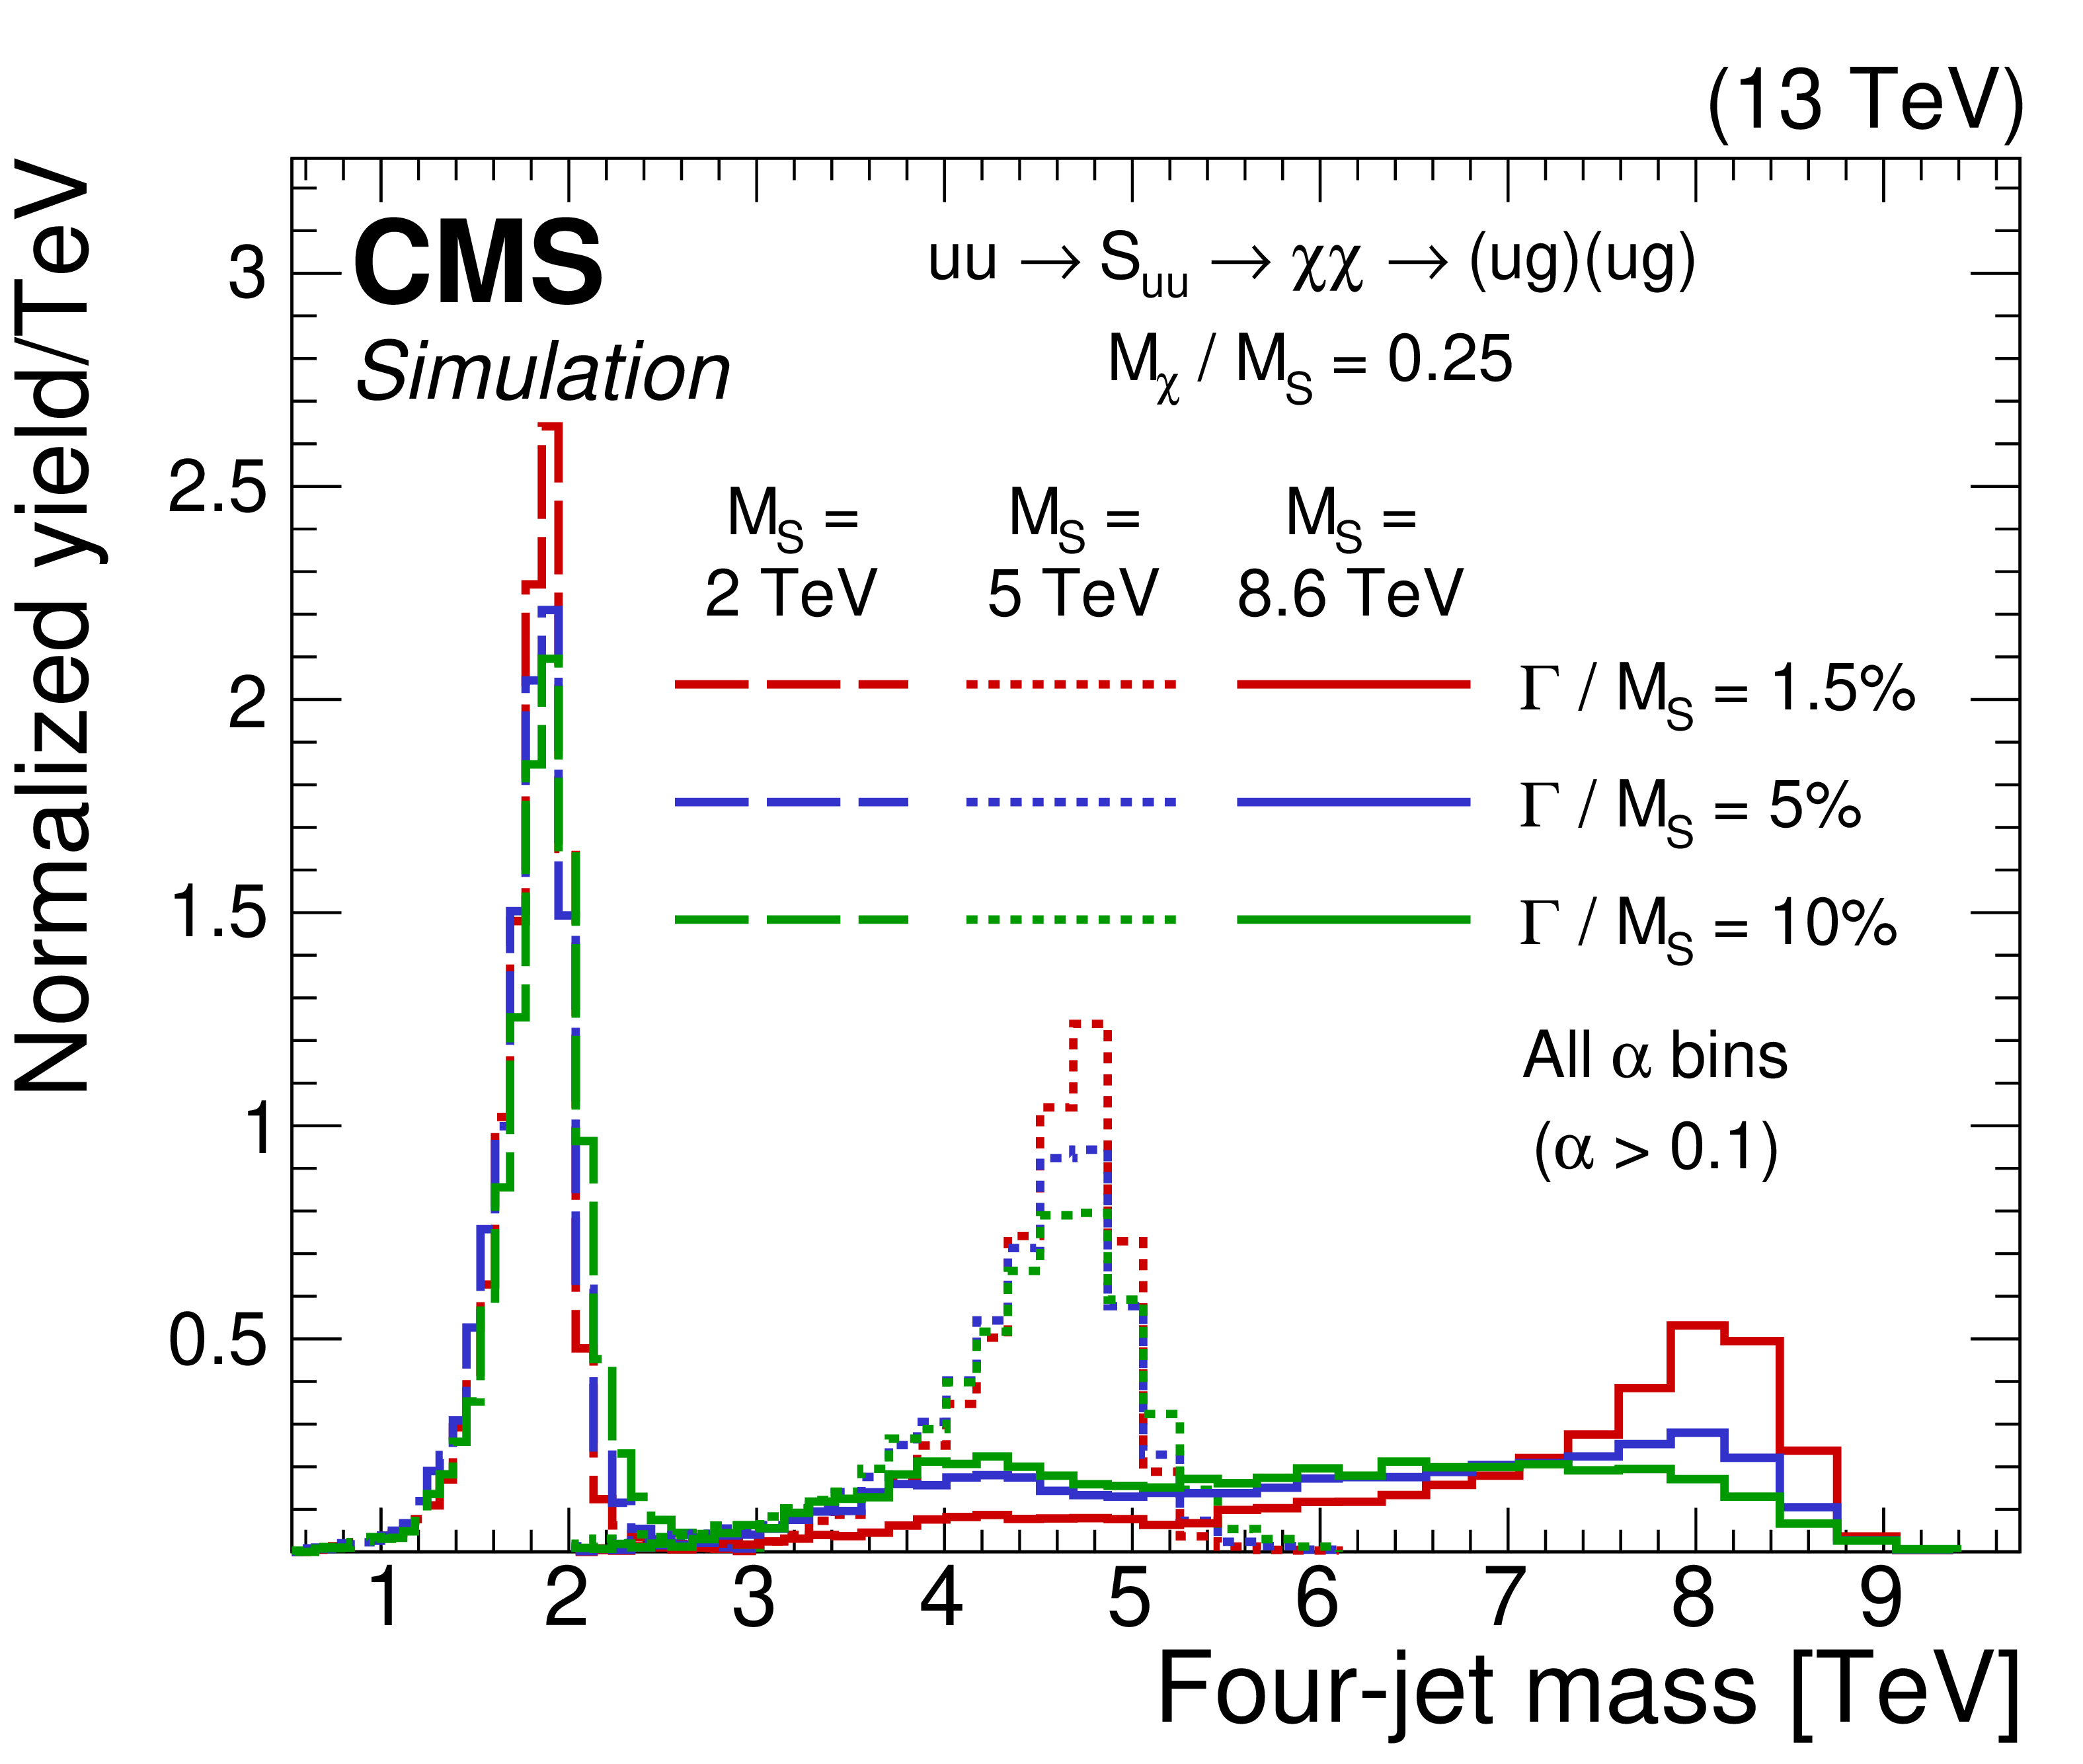
Signal differential distributions as a function of $ m_{\mathrm{4j}} $ for $ \alpha_{\mathrm{true}} = $ 0.25, diquark masses of 2, 5, 8.6 TeV and various widths, for all $ \alpha $ bins inclusively. The integral of each distribution has been normalized to unity. |
png pdf |
Figure 4:
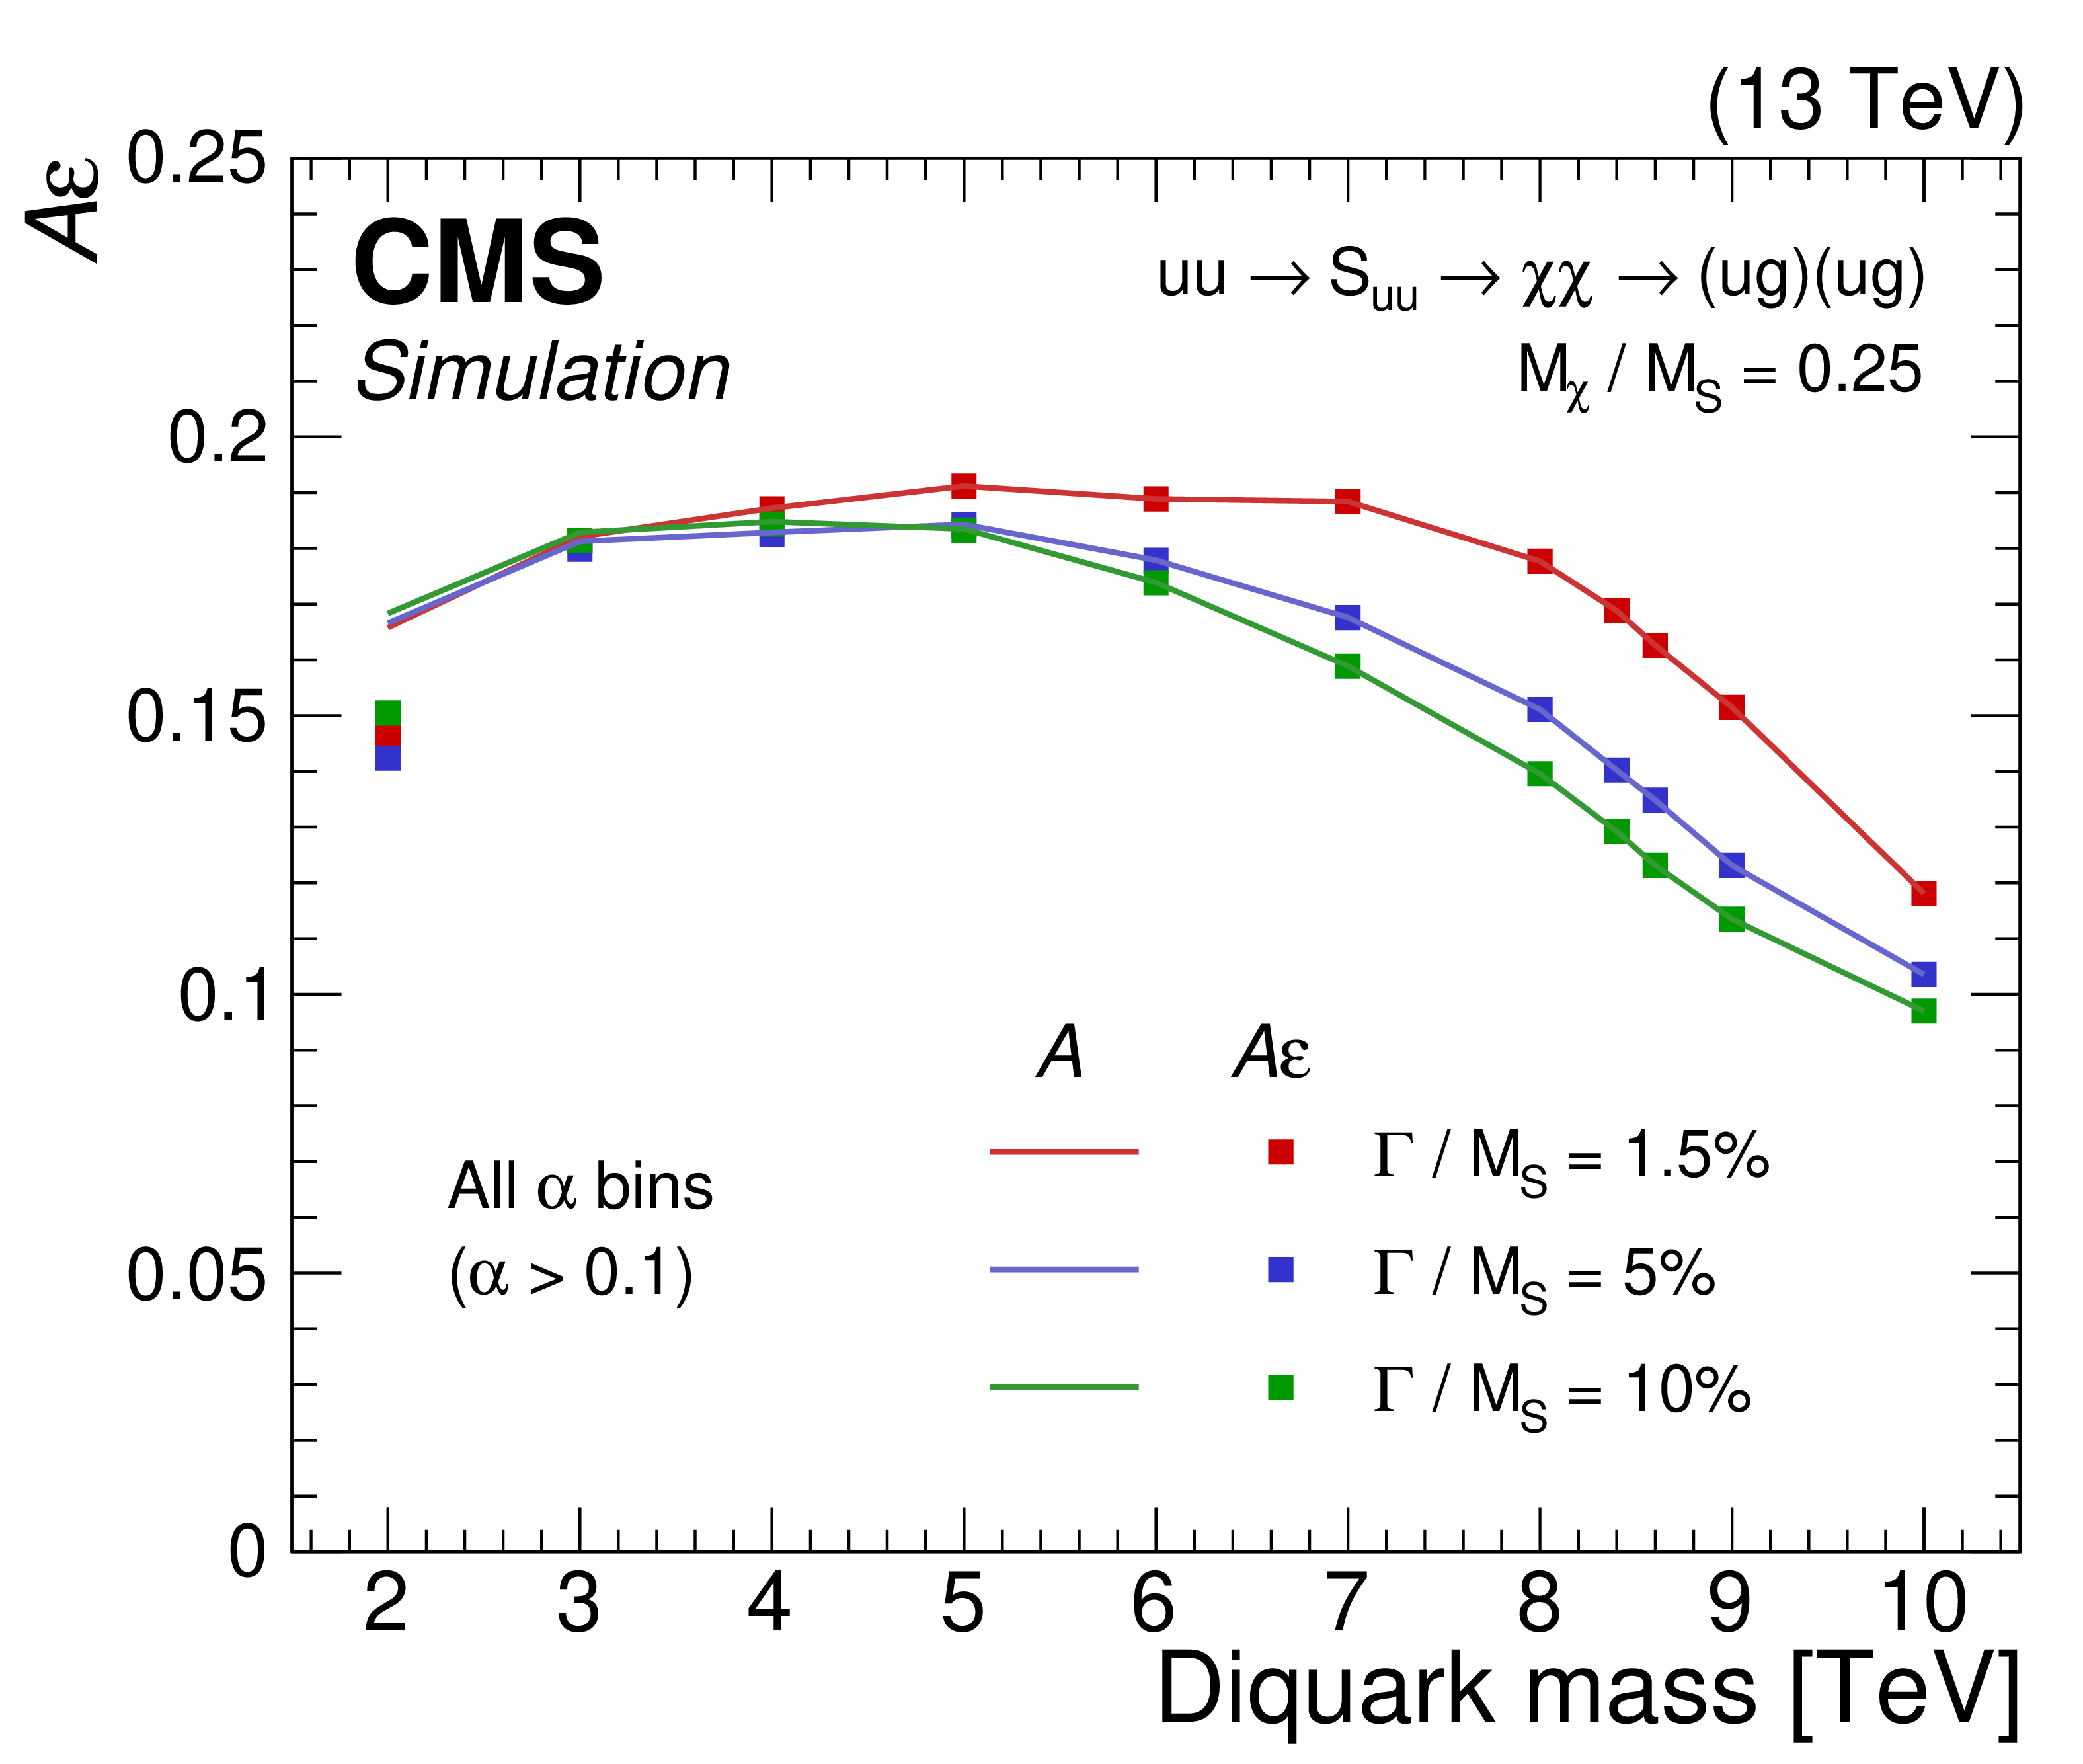
The product of the acceptance ($ A $) and efficiency of the mass selection ($ \varepsilon $) for a resonant signal with $ \alpha_{\mathrm{true}} = $ 0.25, shown with filled squares as a function of the diquark mass and for various diquark widths, for all $ \alpha $ bins inclusively. The case when $ \varepsilon= $ 1 is also shown as solid lines. |
png pdf |
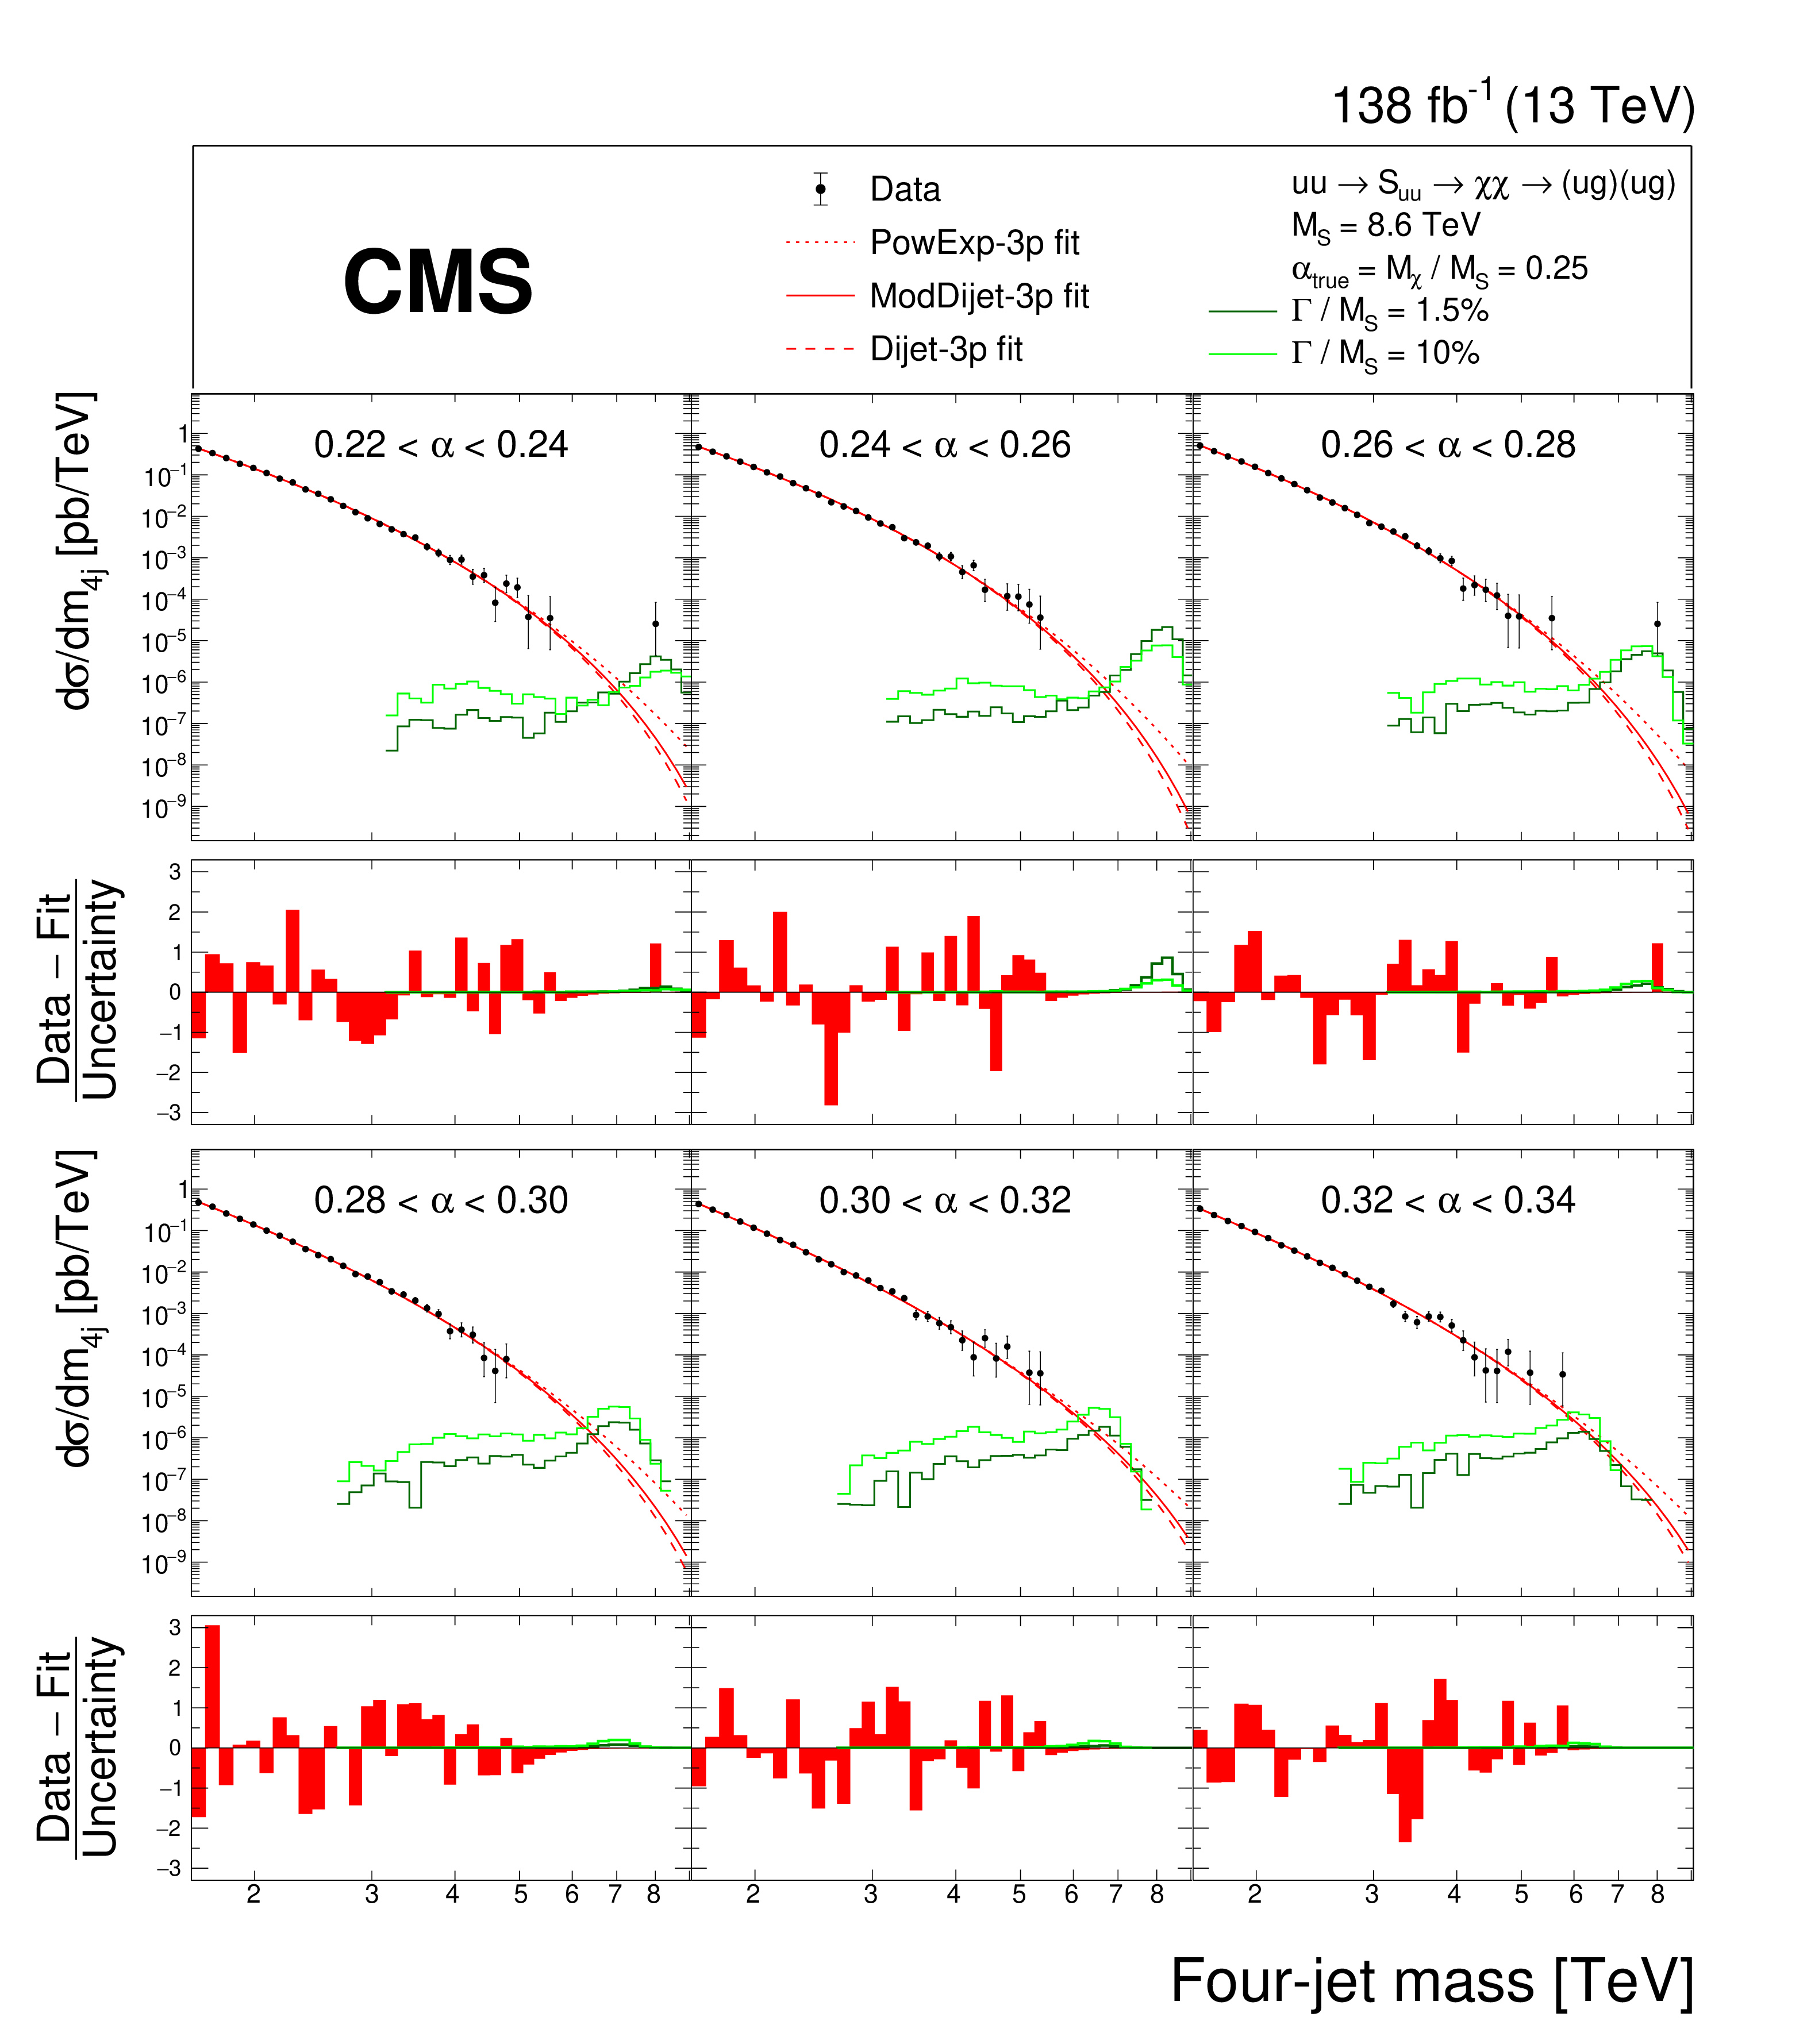
Figure 5:
The $ m_{\mathrm{4j}} $ distribution in data (points), within six of the thirteen $ \alpha $ bins, fitted with the background-only function, ModDijet-3p (red solid), and two alternative background functions, PowExp-3p and Dijet-3p (red dotted and dashed), with three free parameters. Examples of predicted diquark resonances with $ \alpha_{\mathrm{true}} = $ 0.25, $ M_{\mathrm{S}} = $ 8.6 TeV, and 1.5 or 10% widths are shown, with cross sections equal to the observed upper limits at 95% CL. The percentage of signal across the depicted $ \alpha $ bins is 90 (80)% for the 1.5 (10)% width. The lower panels show the pulls from the fit with the background-only function to data, calculated using the statistical uncertainty of the data. |
png pdf |
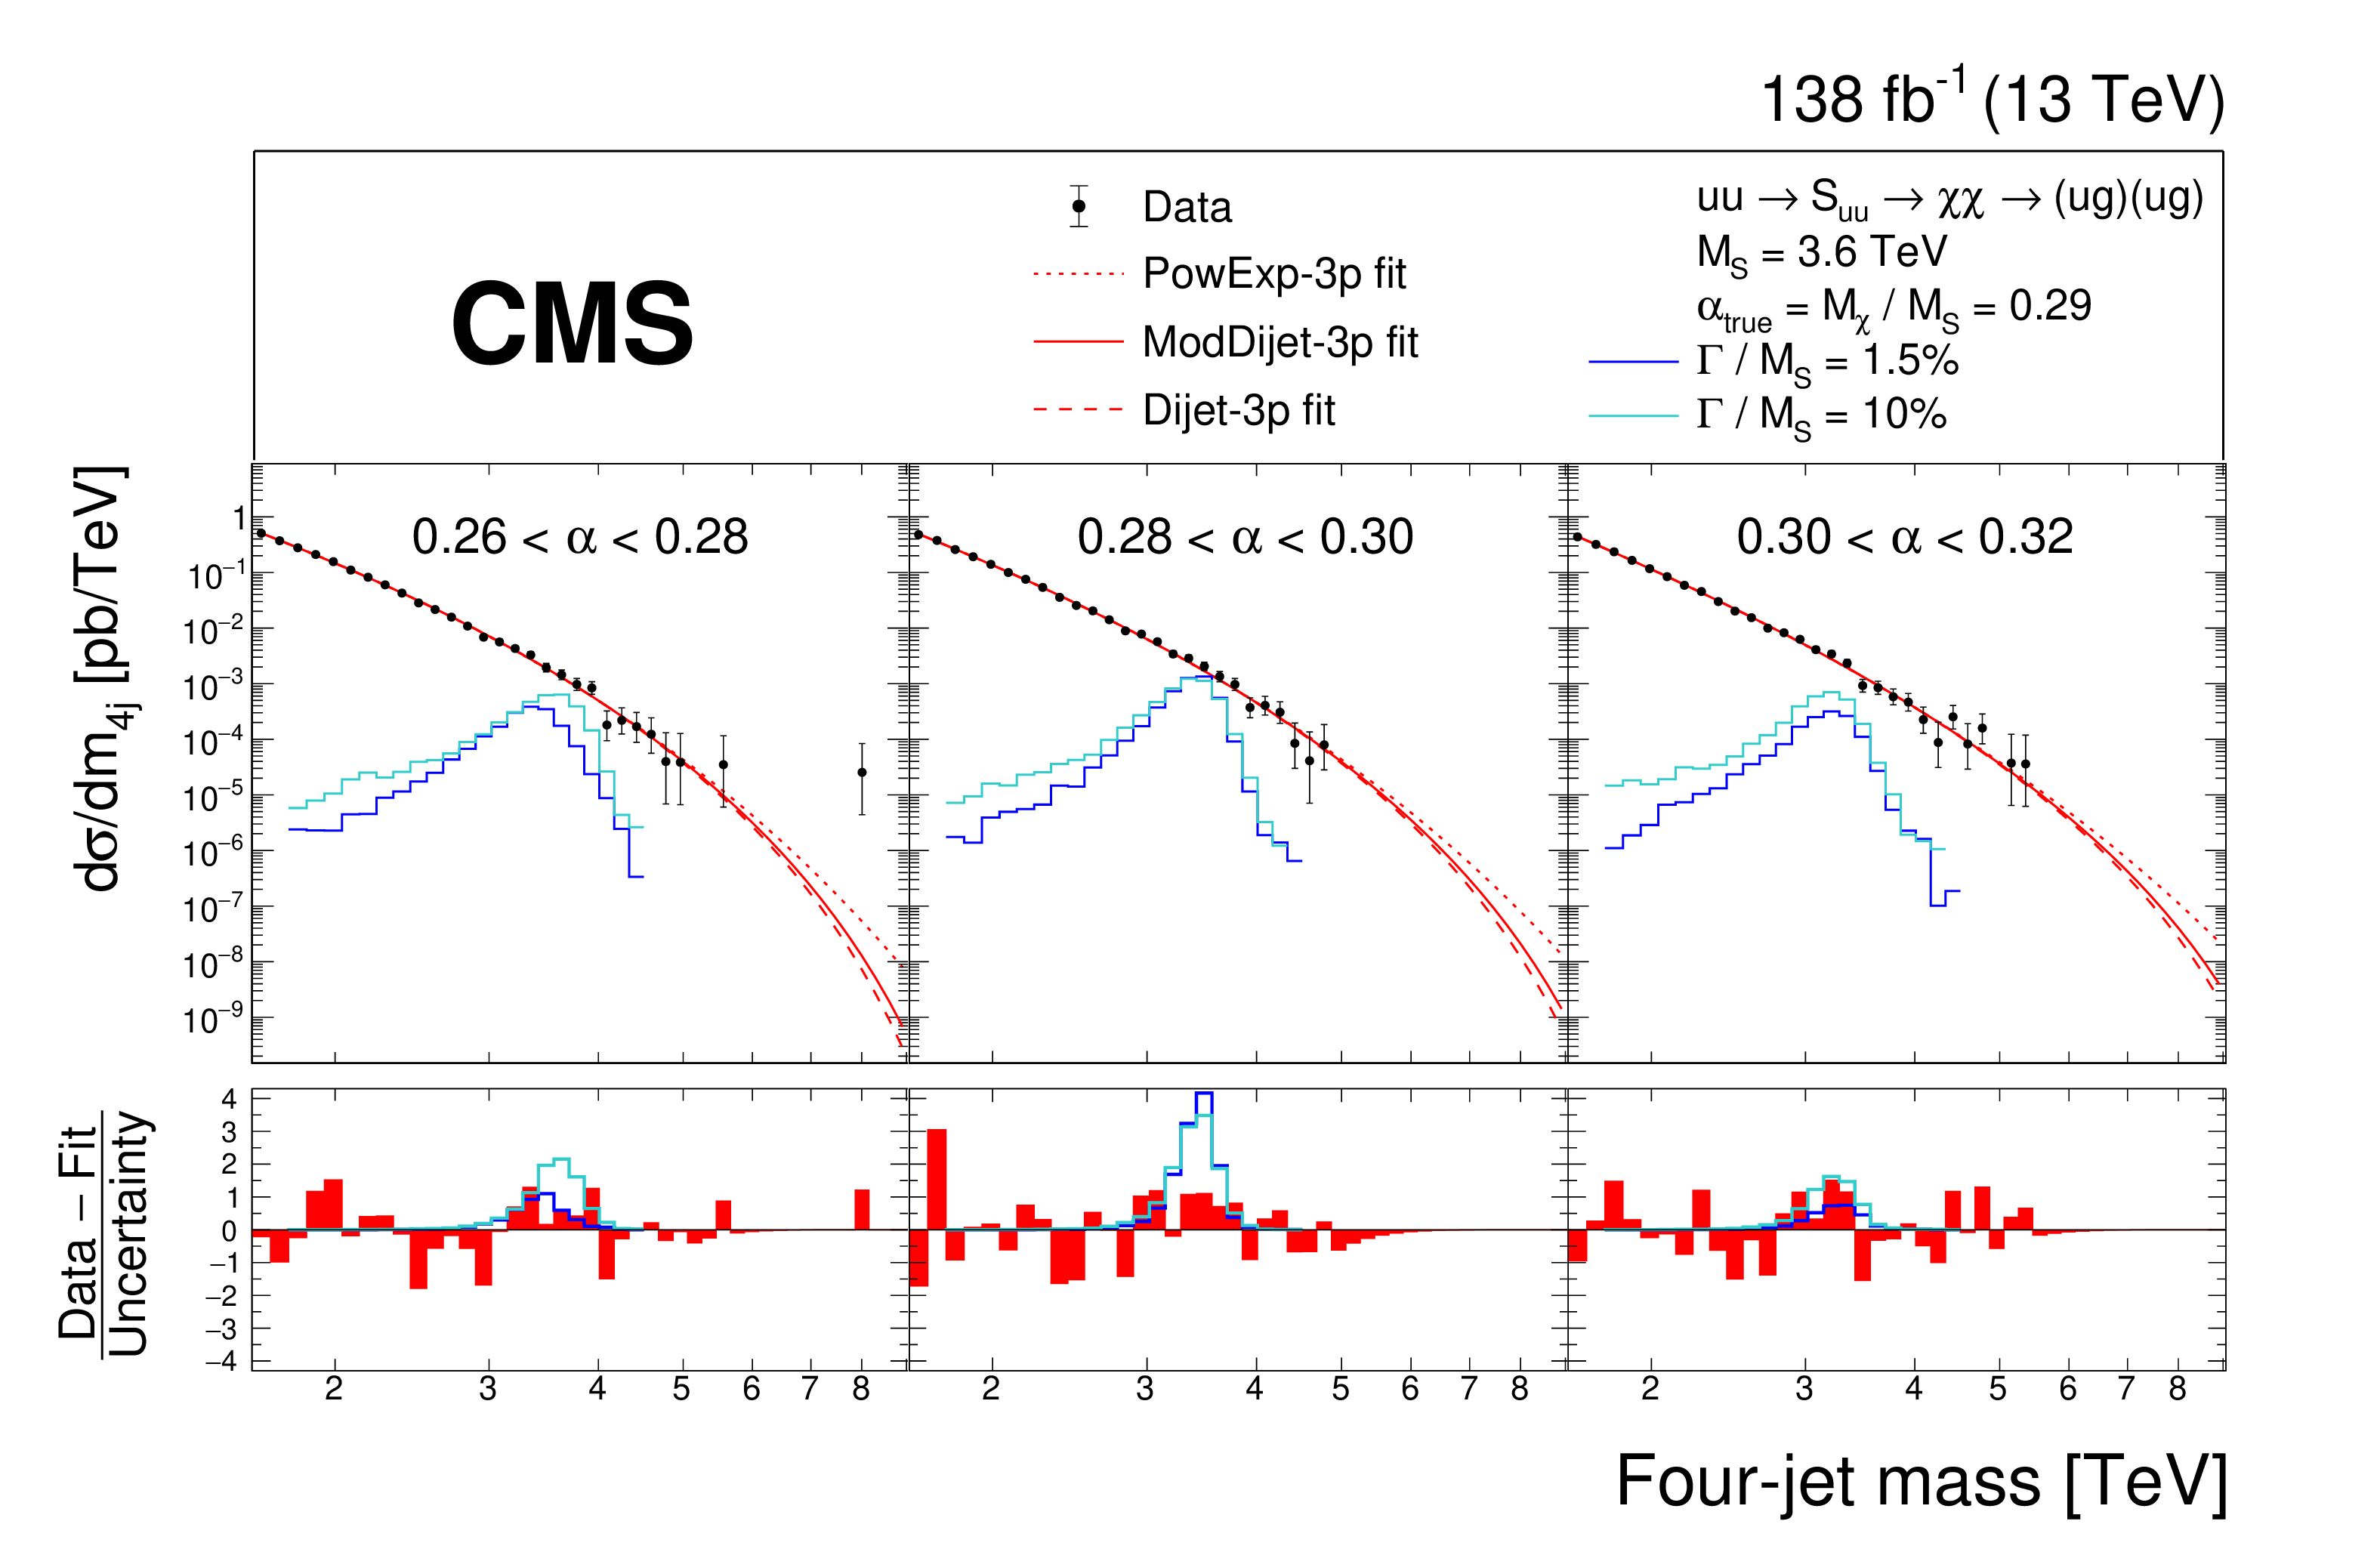
Figure 6:
The $ m_{\mathrm{4j}} $ distributions of the data (points), within three of the thirteen $ \alpha $ bins, fitted with the background-only function, ModDijet-3p (red solid), and two alternative background functions, PowExp-3p and Dijet-3p (red dotted and dashed), with three free parameters. Examples of predicted diquark resonances with $ \alpha_{\mathrm{true}} = $ 0.29, $ M_{\mathrm{S}} = $ 3.6 TeV, and 1.5 or 10% widths are shown, with cross sections equal to the observed upper limits at 95% CL. The percentage of signal across the depicted $ \alpha $ bins is 80 (70)% for the 1.5 (10)% width. The lower panels show the pulls from the fit with the background-only function to data, calculated using the statistical uncertainty of the data. |
png pdf |
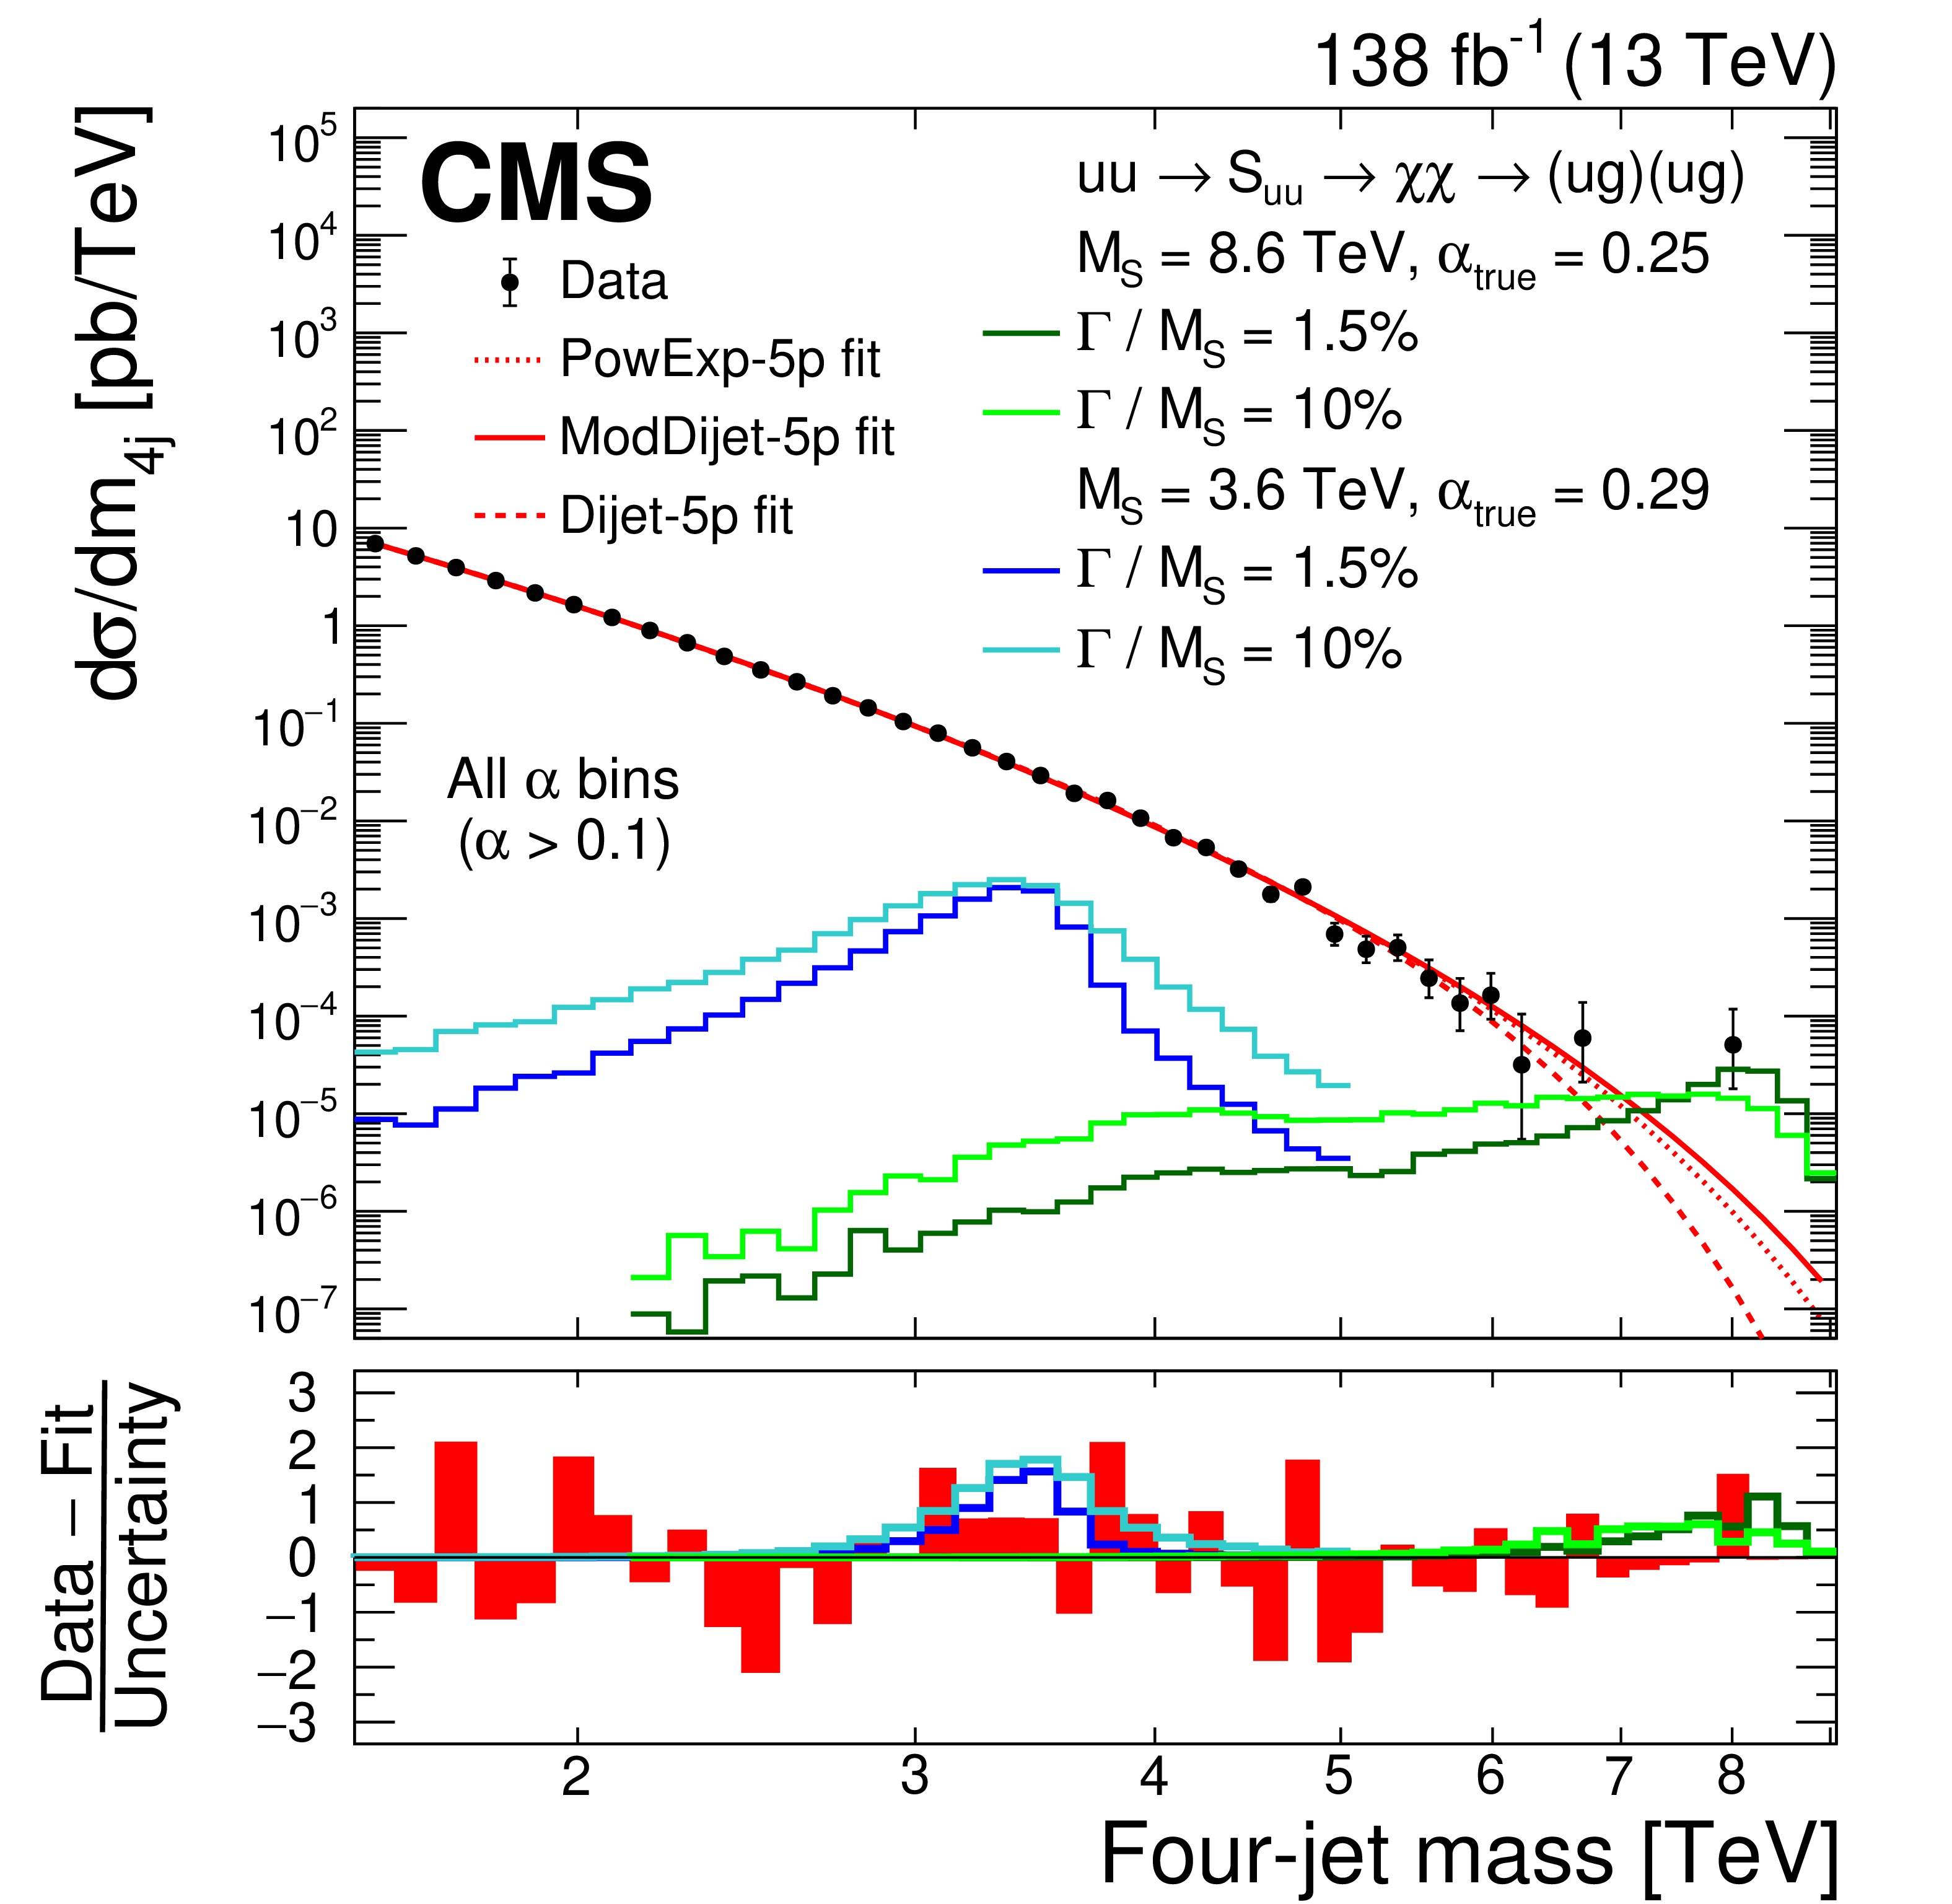
Figure 7:
The $ m_{\mathrm{4j}} $ distribution in data (points), for all $ \alpha $ bins combined, fitted with the background-only function, ModDijet-5p (red solid), and two alternative background functions, PowExp-5p and Dijet-5p (red dotted and dashed), with five free parameters. Examples of predicted diquark resonances with $ \alpha_{\mathrm{true}} = $ 0.25, $ M_{\mathrm{S}} = $ 8.6 TeV and $ \alpha_{\mathrm{true}} = $ 0.29, $ M_{\mathrm{S}} = $ 3.6 TeV are shown, with widths equal to 1.5 and 10%. Their cross sections are equal to the observed upper limits at 95% CL. The lower panel shows the pulls from the fit with the background-only function to data, calculated using the statistical uncertainty of the data. |
png pdf |
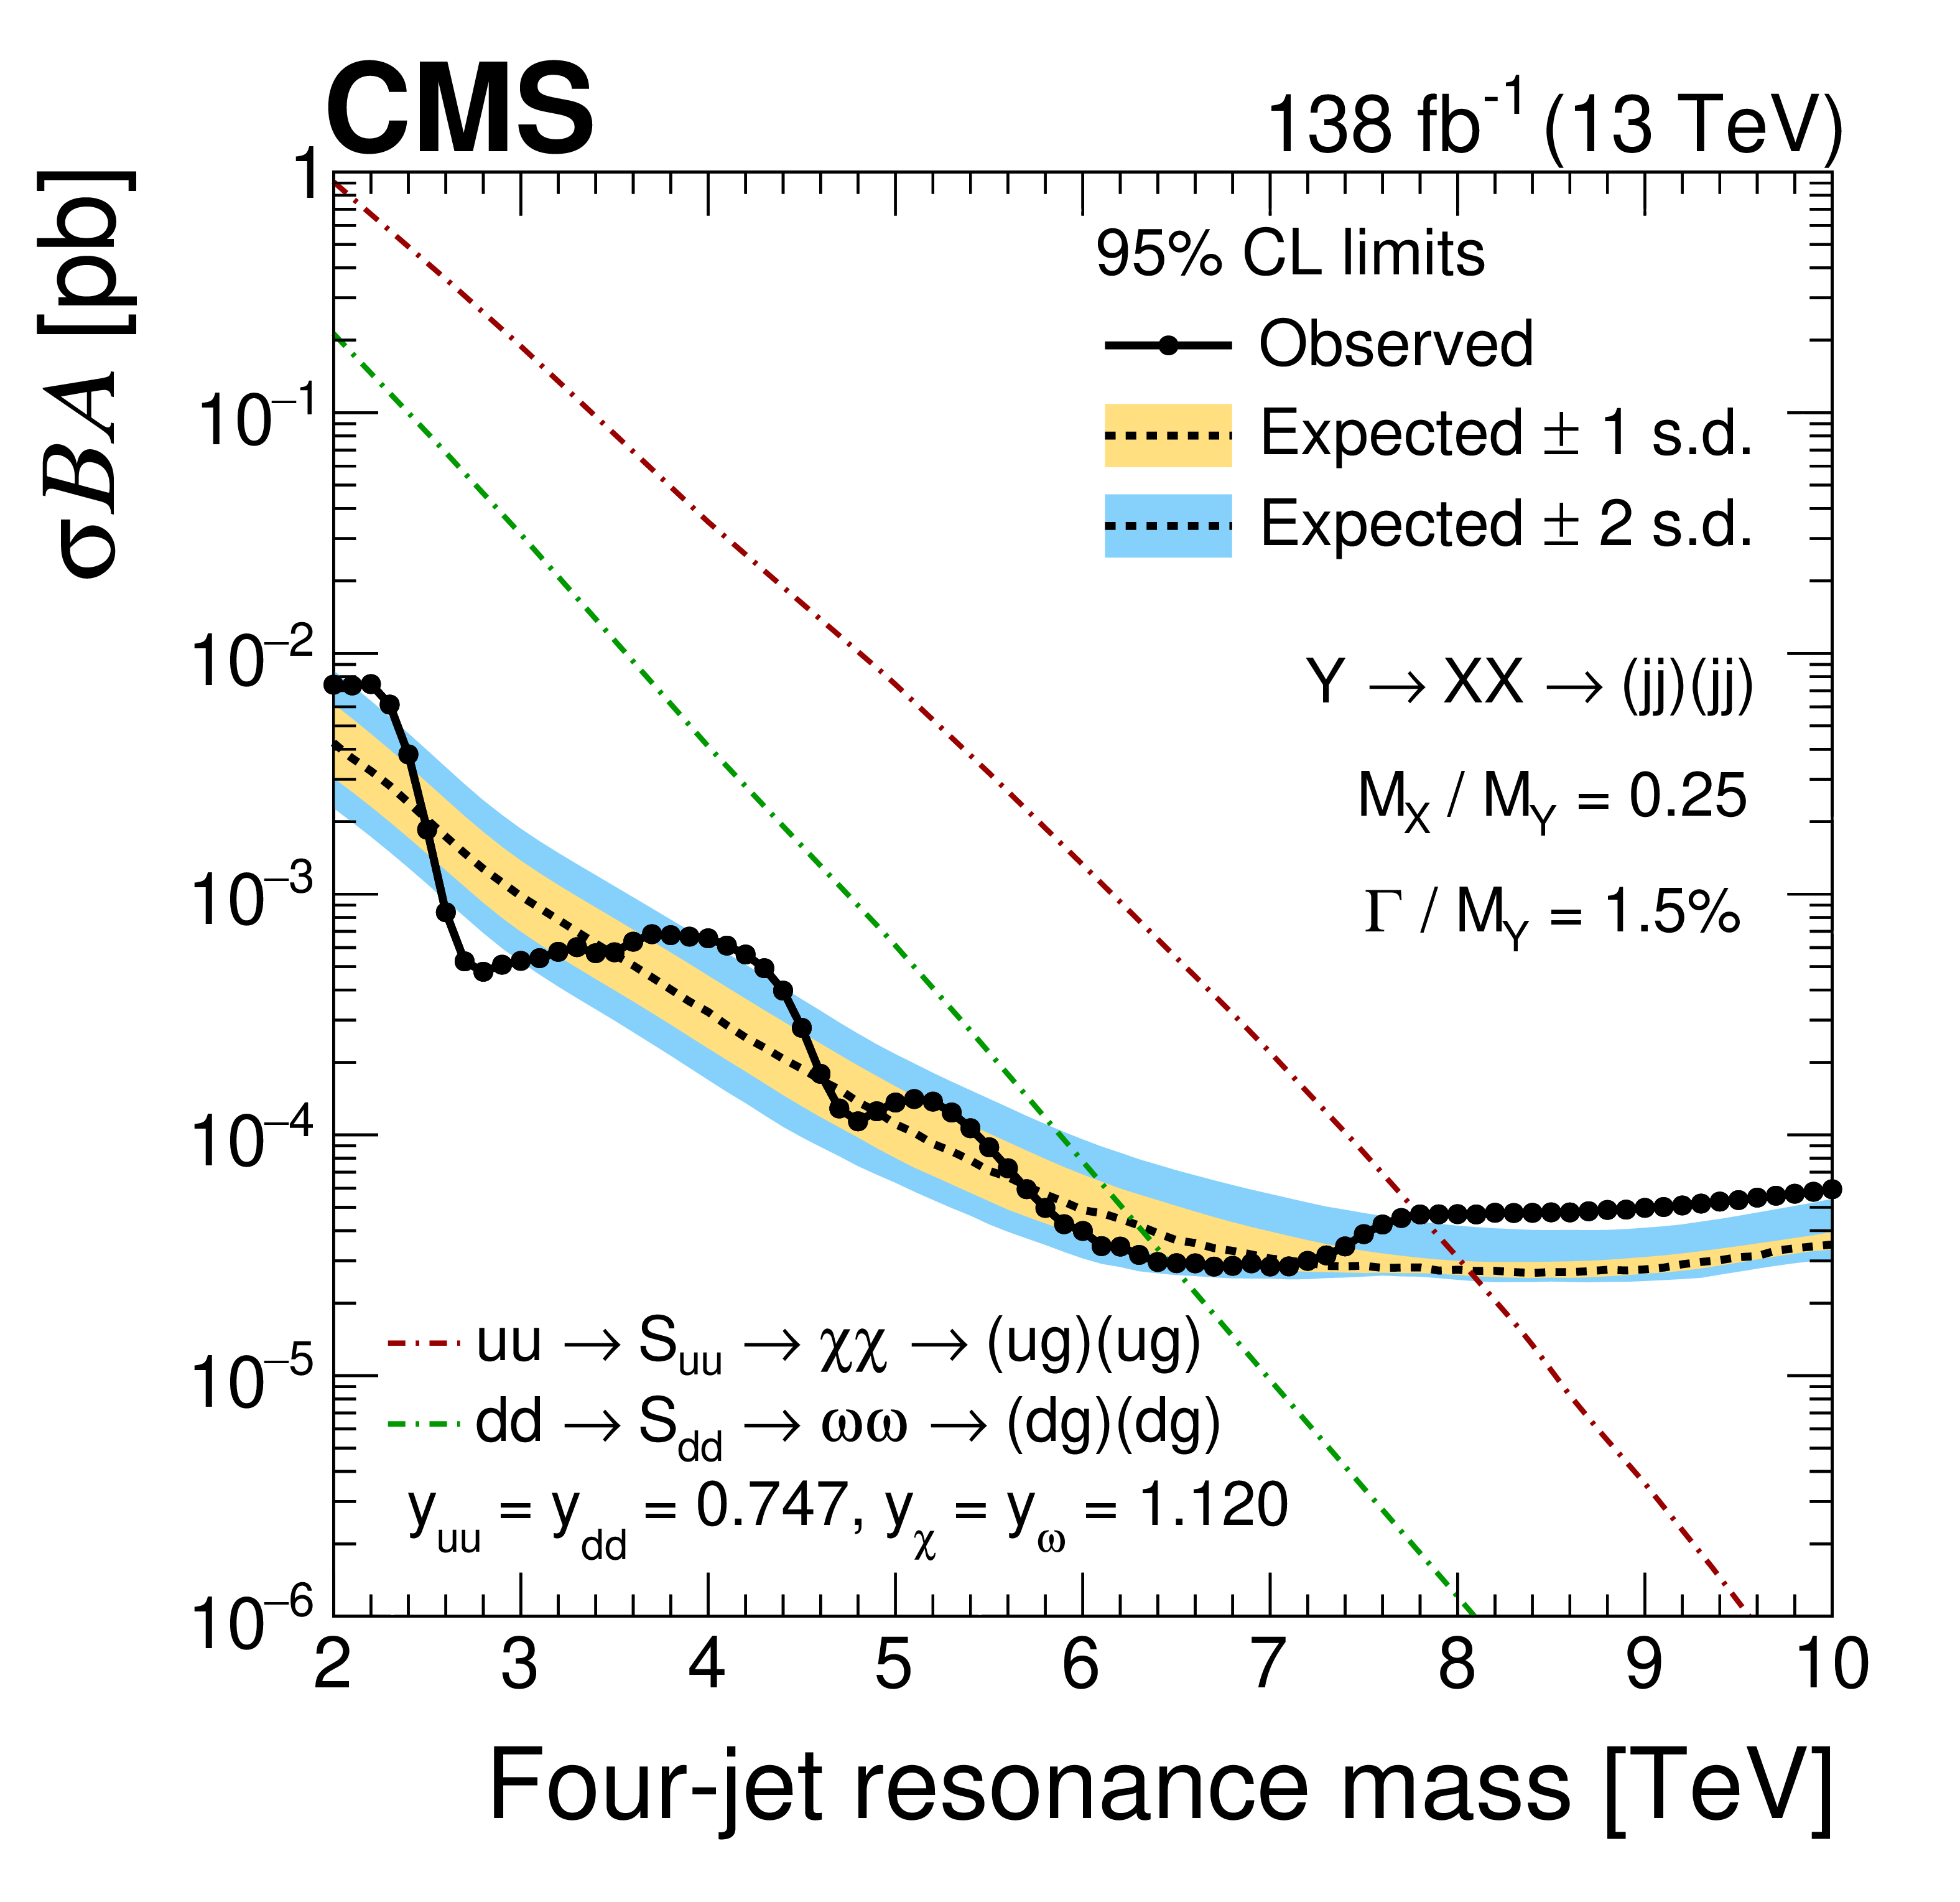
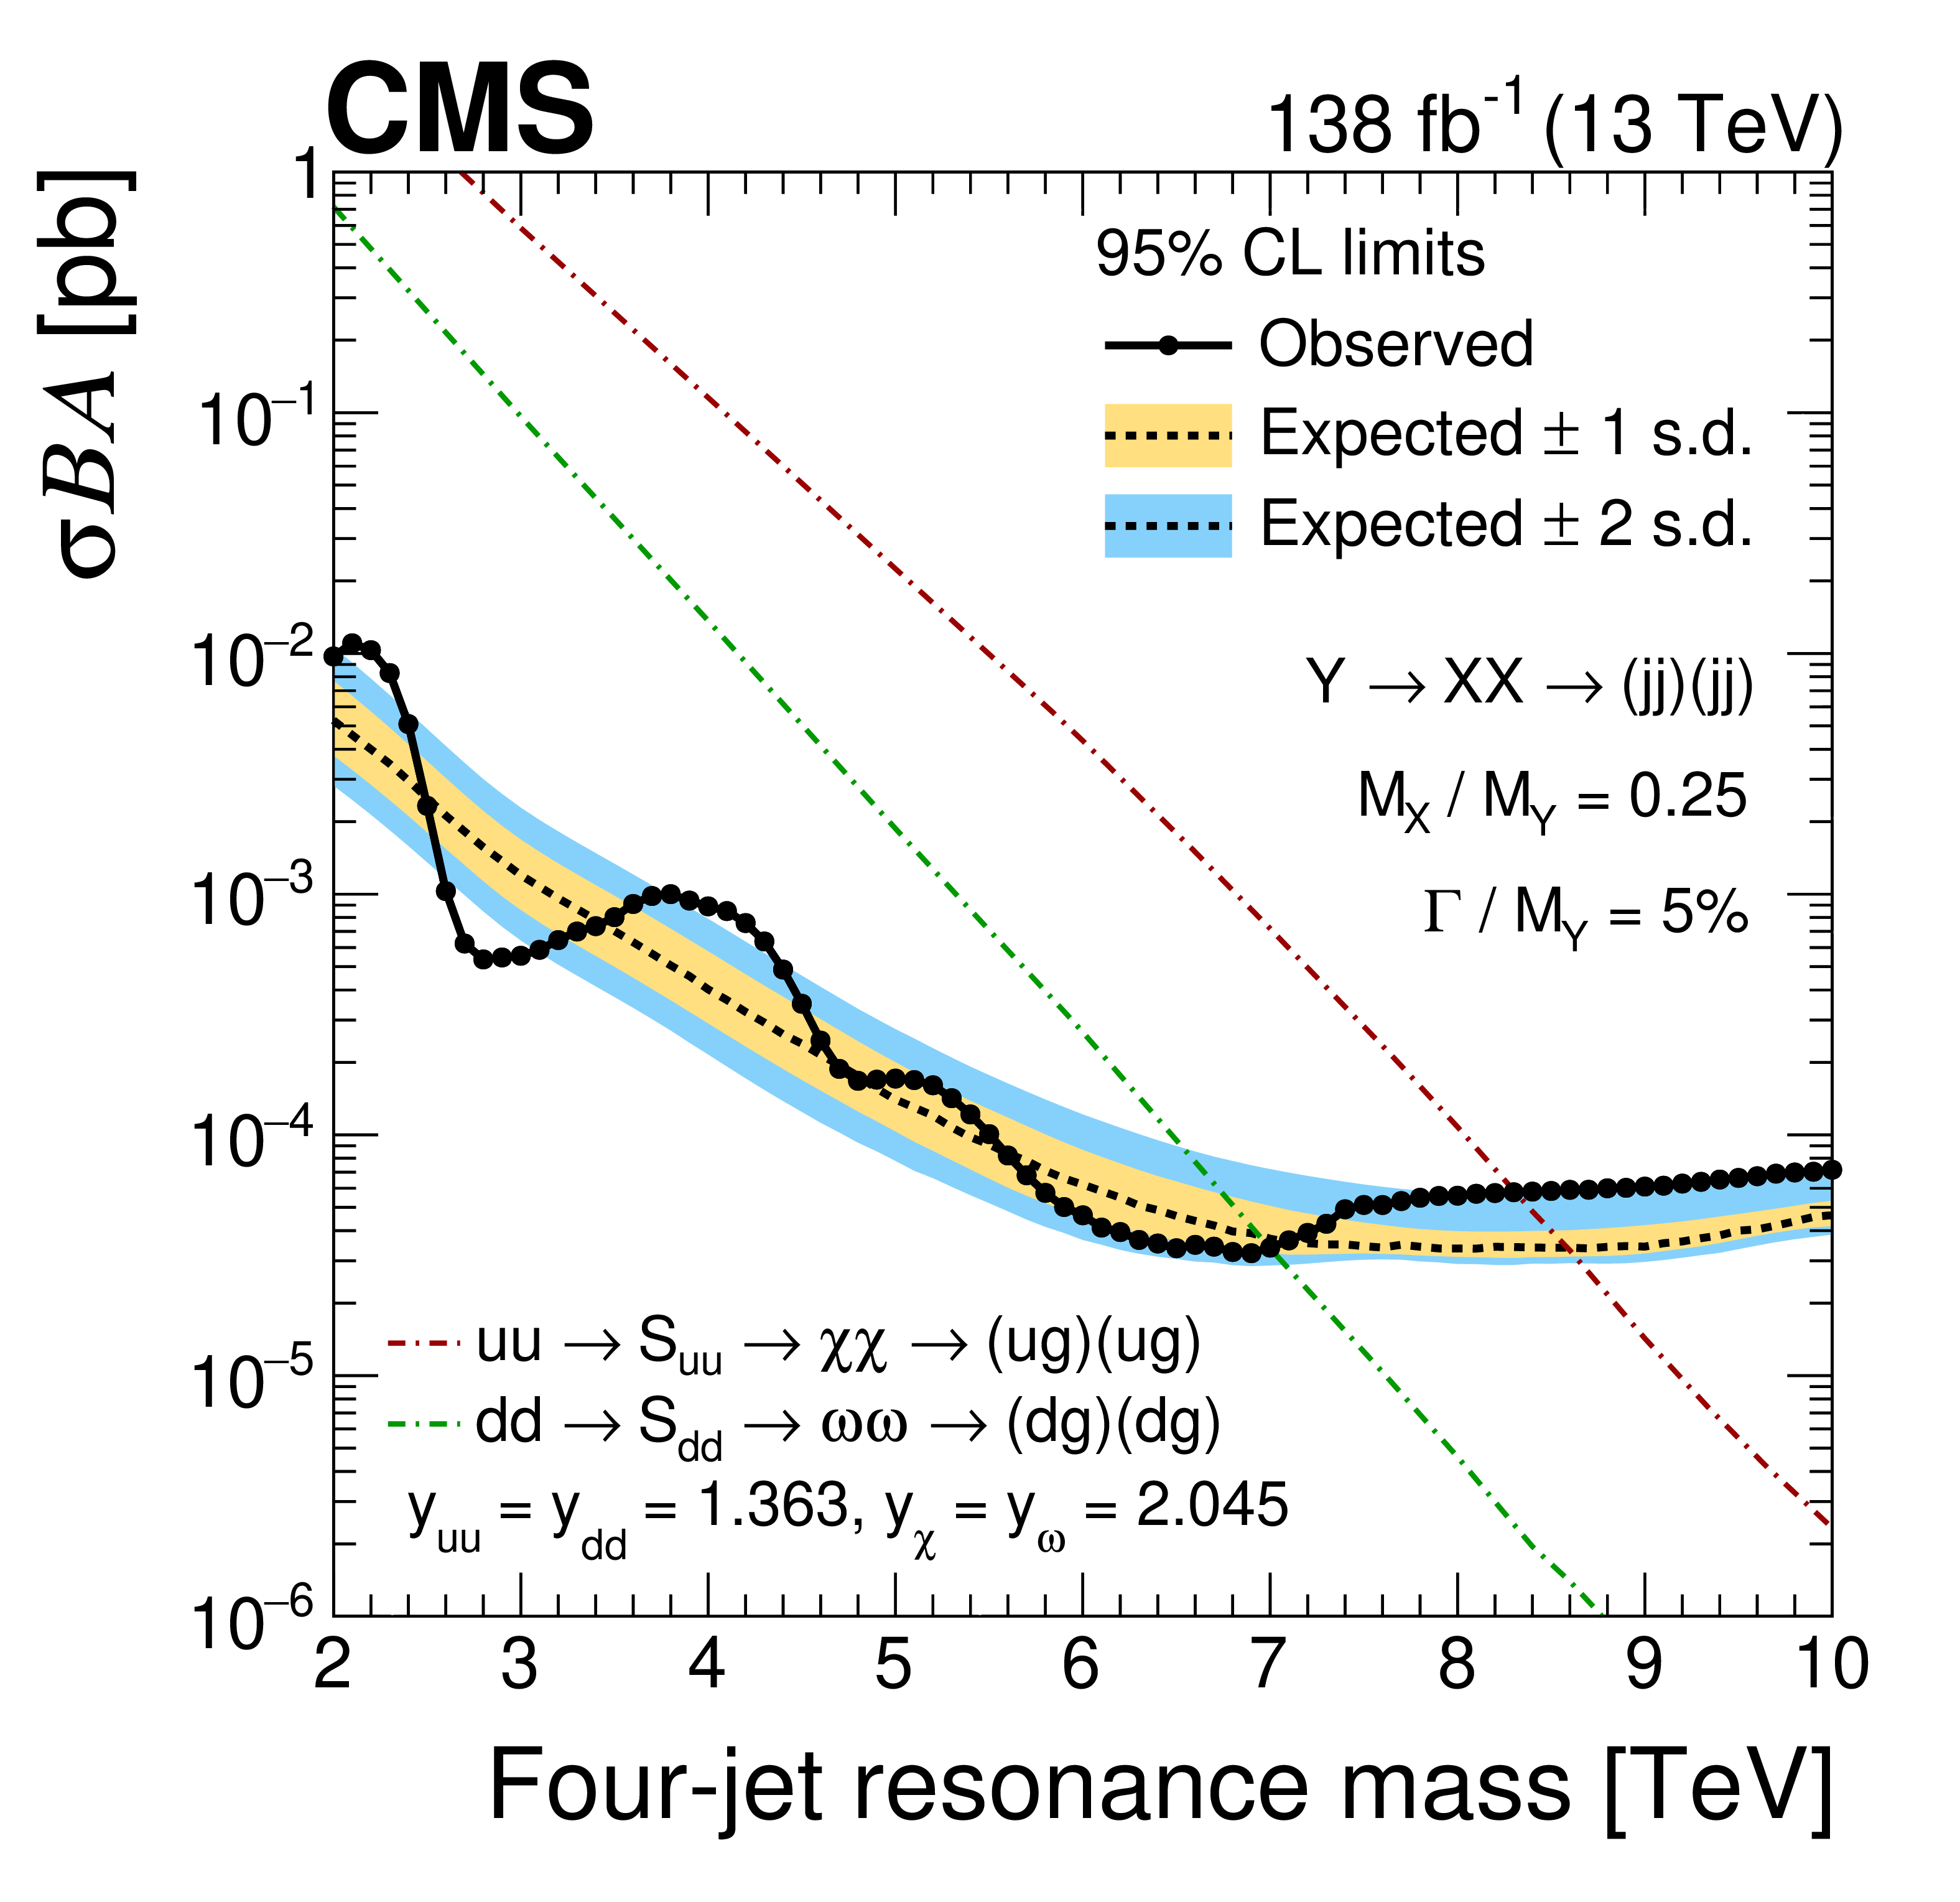
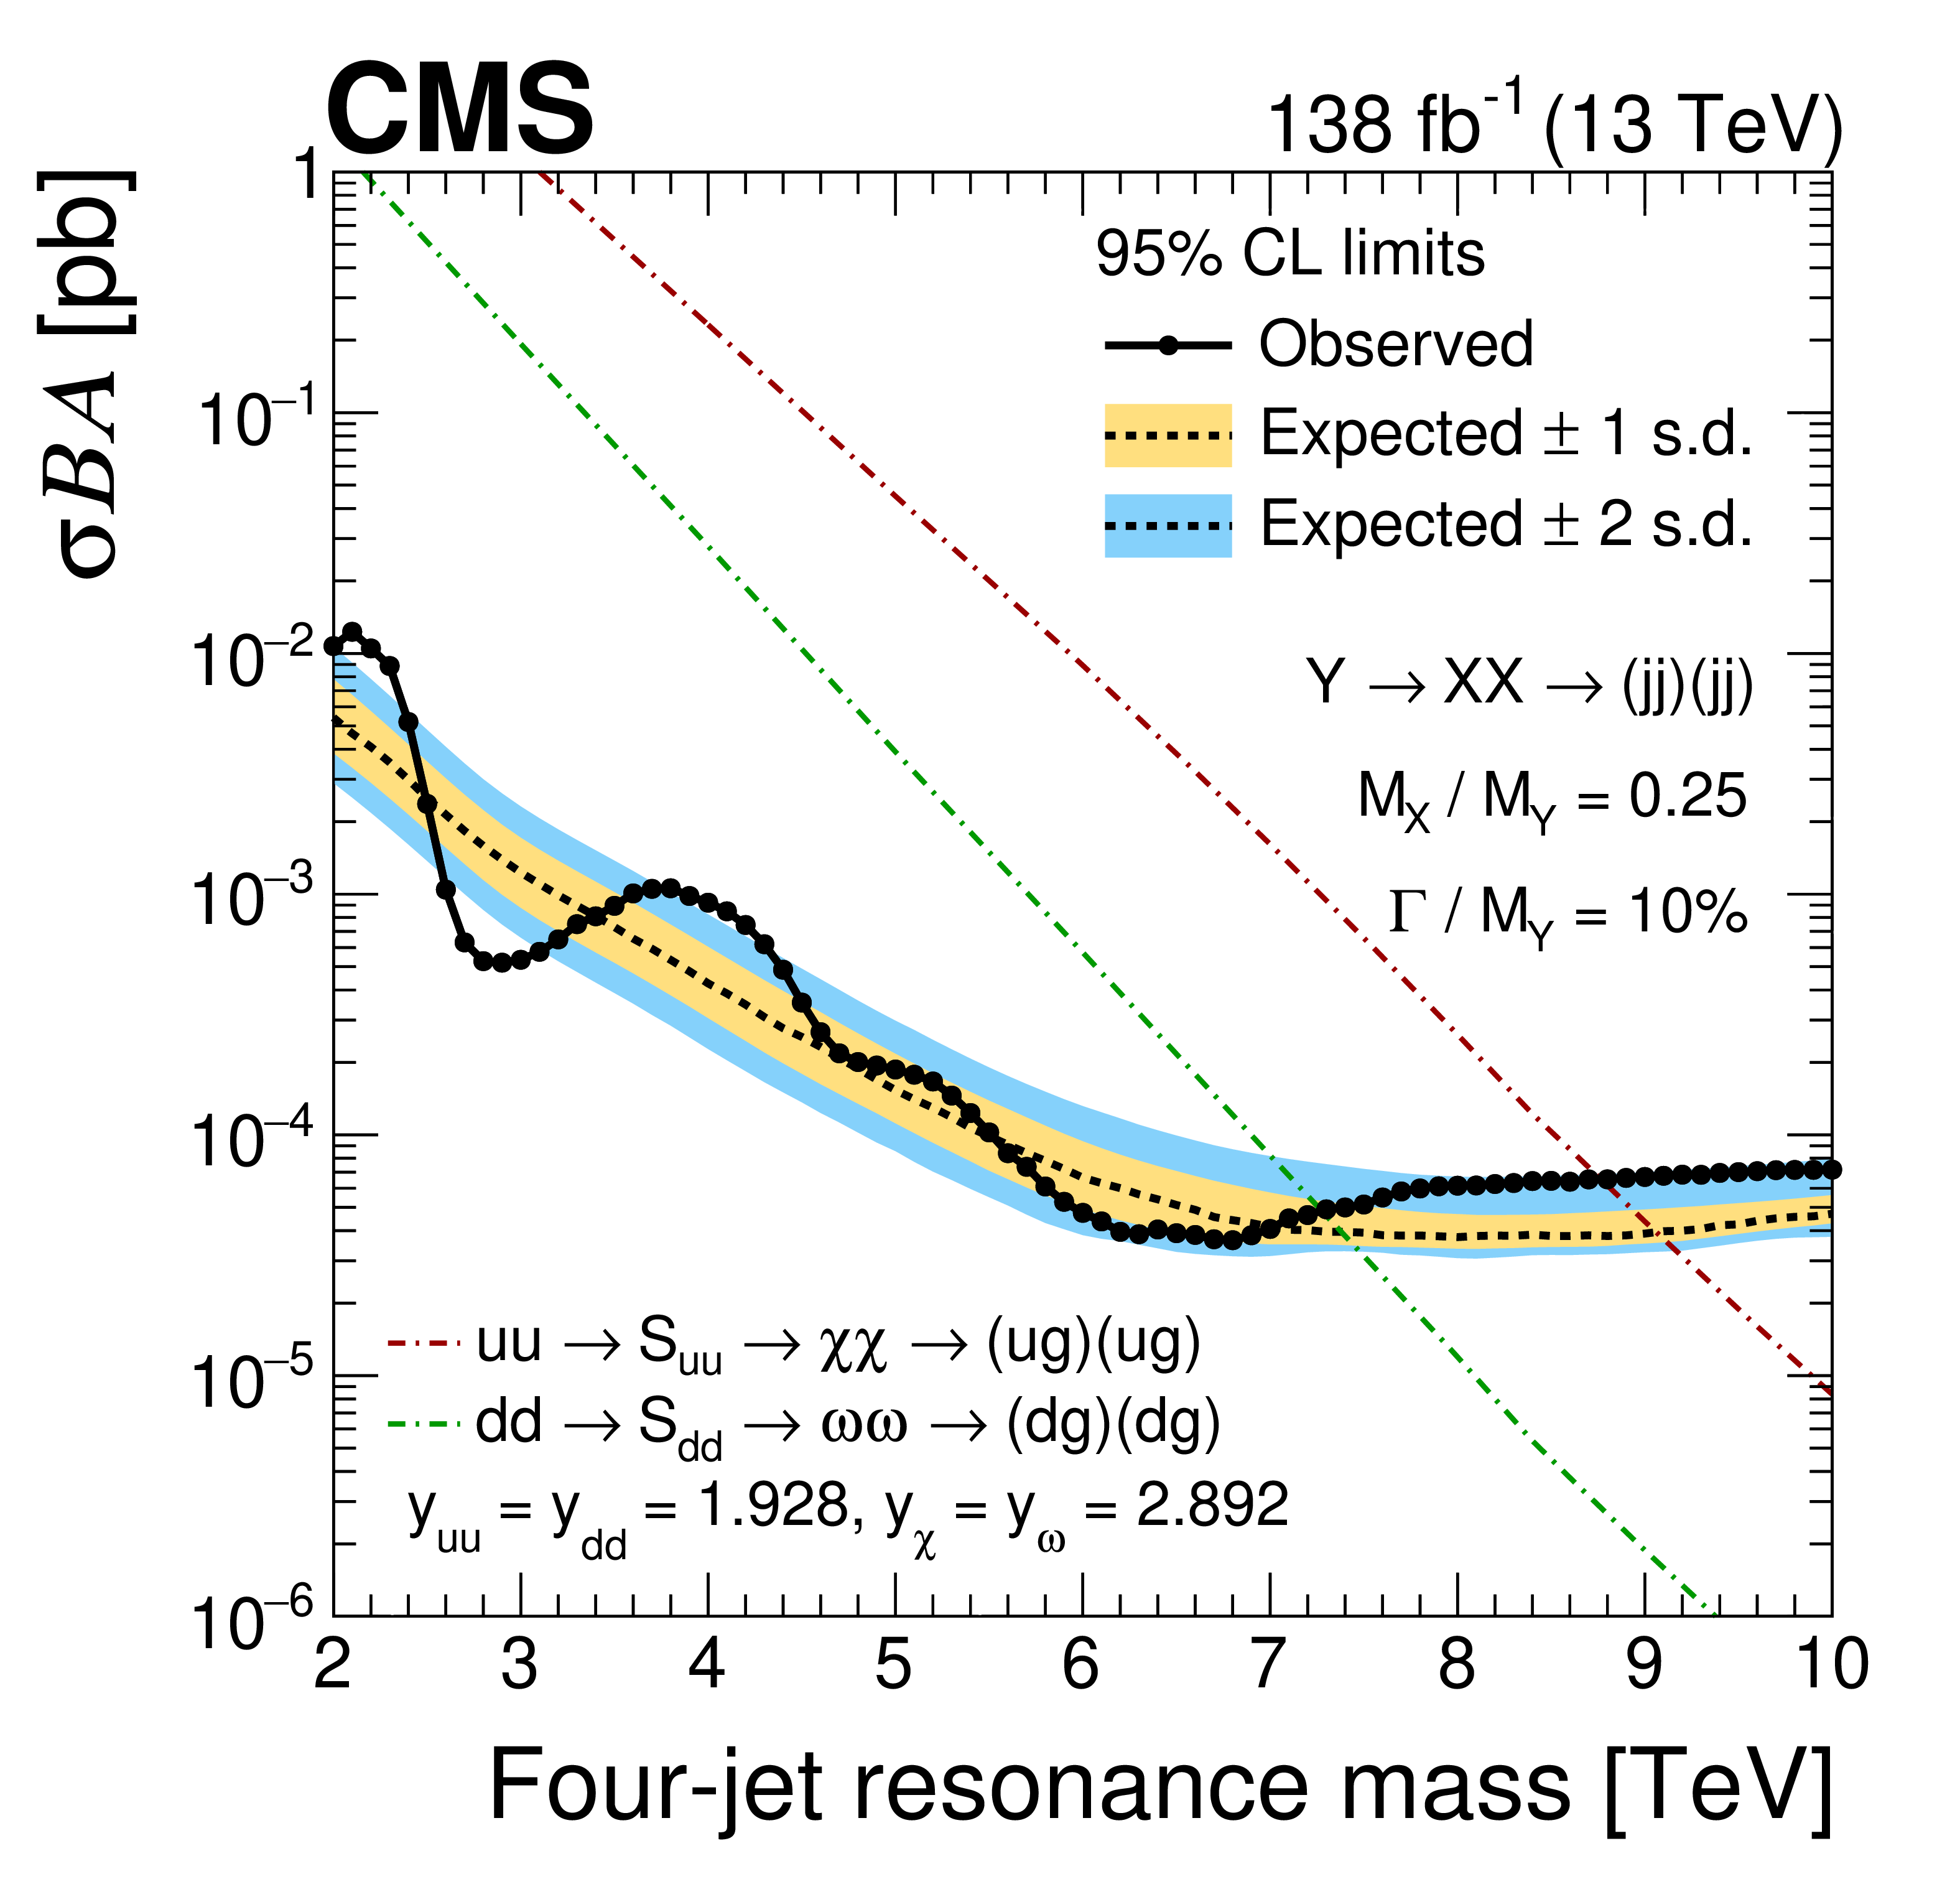
Figure 8:
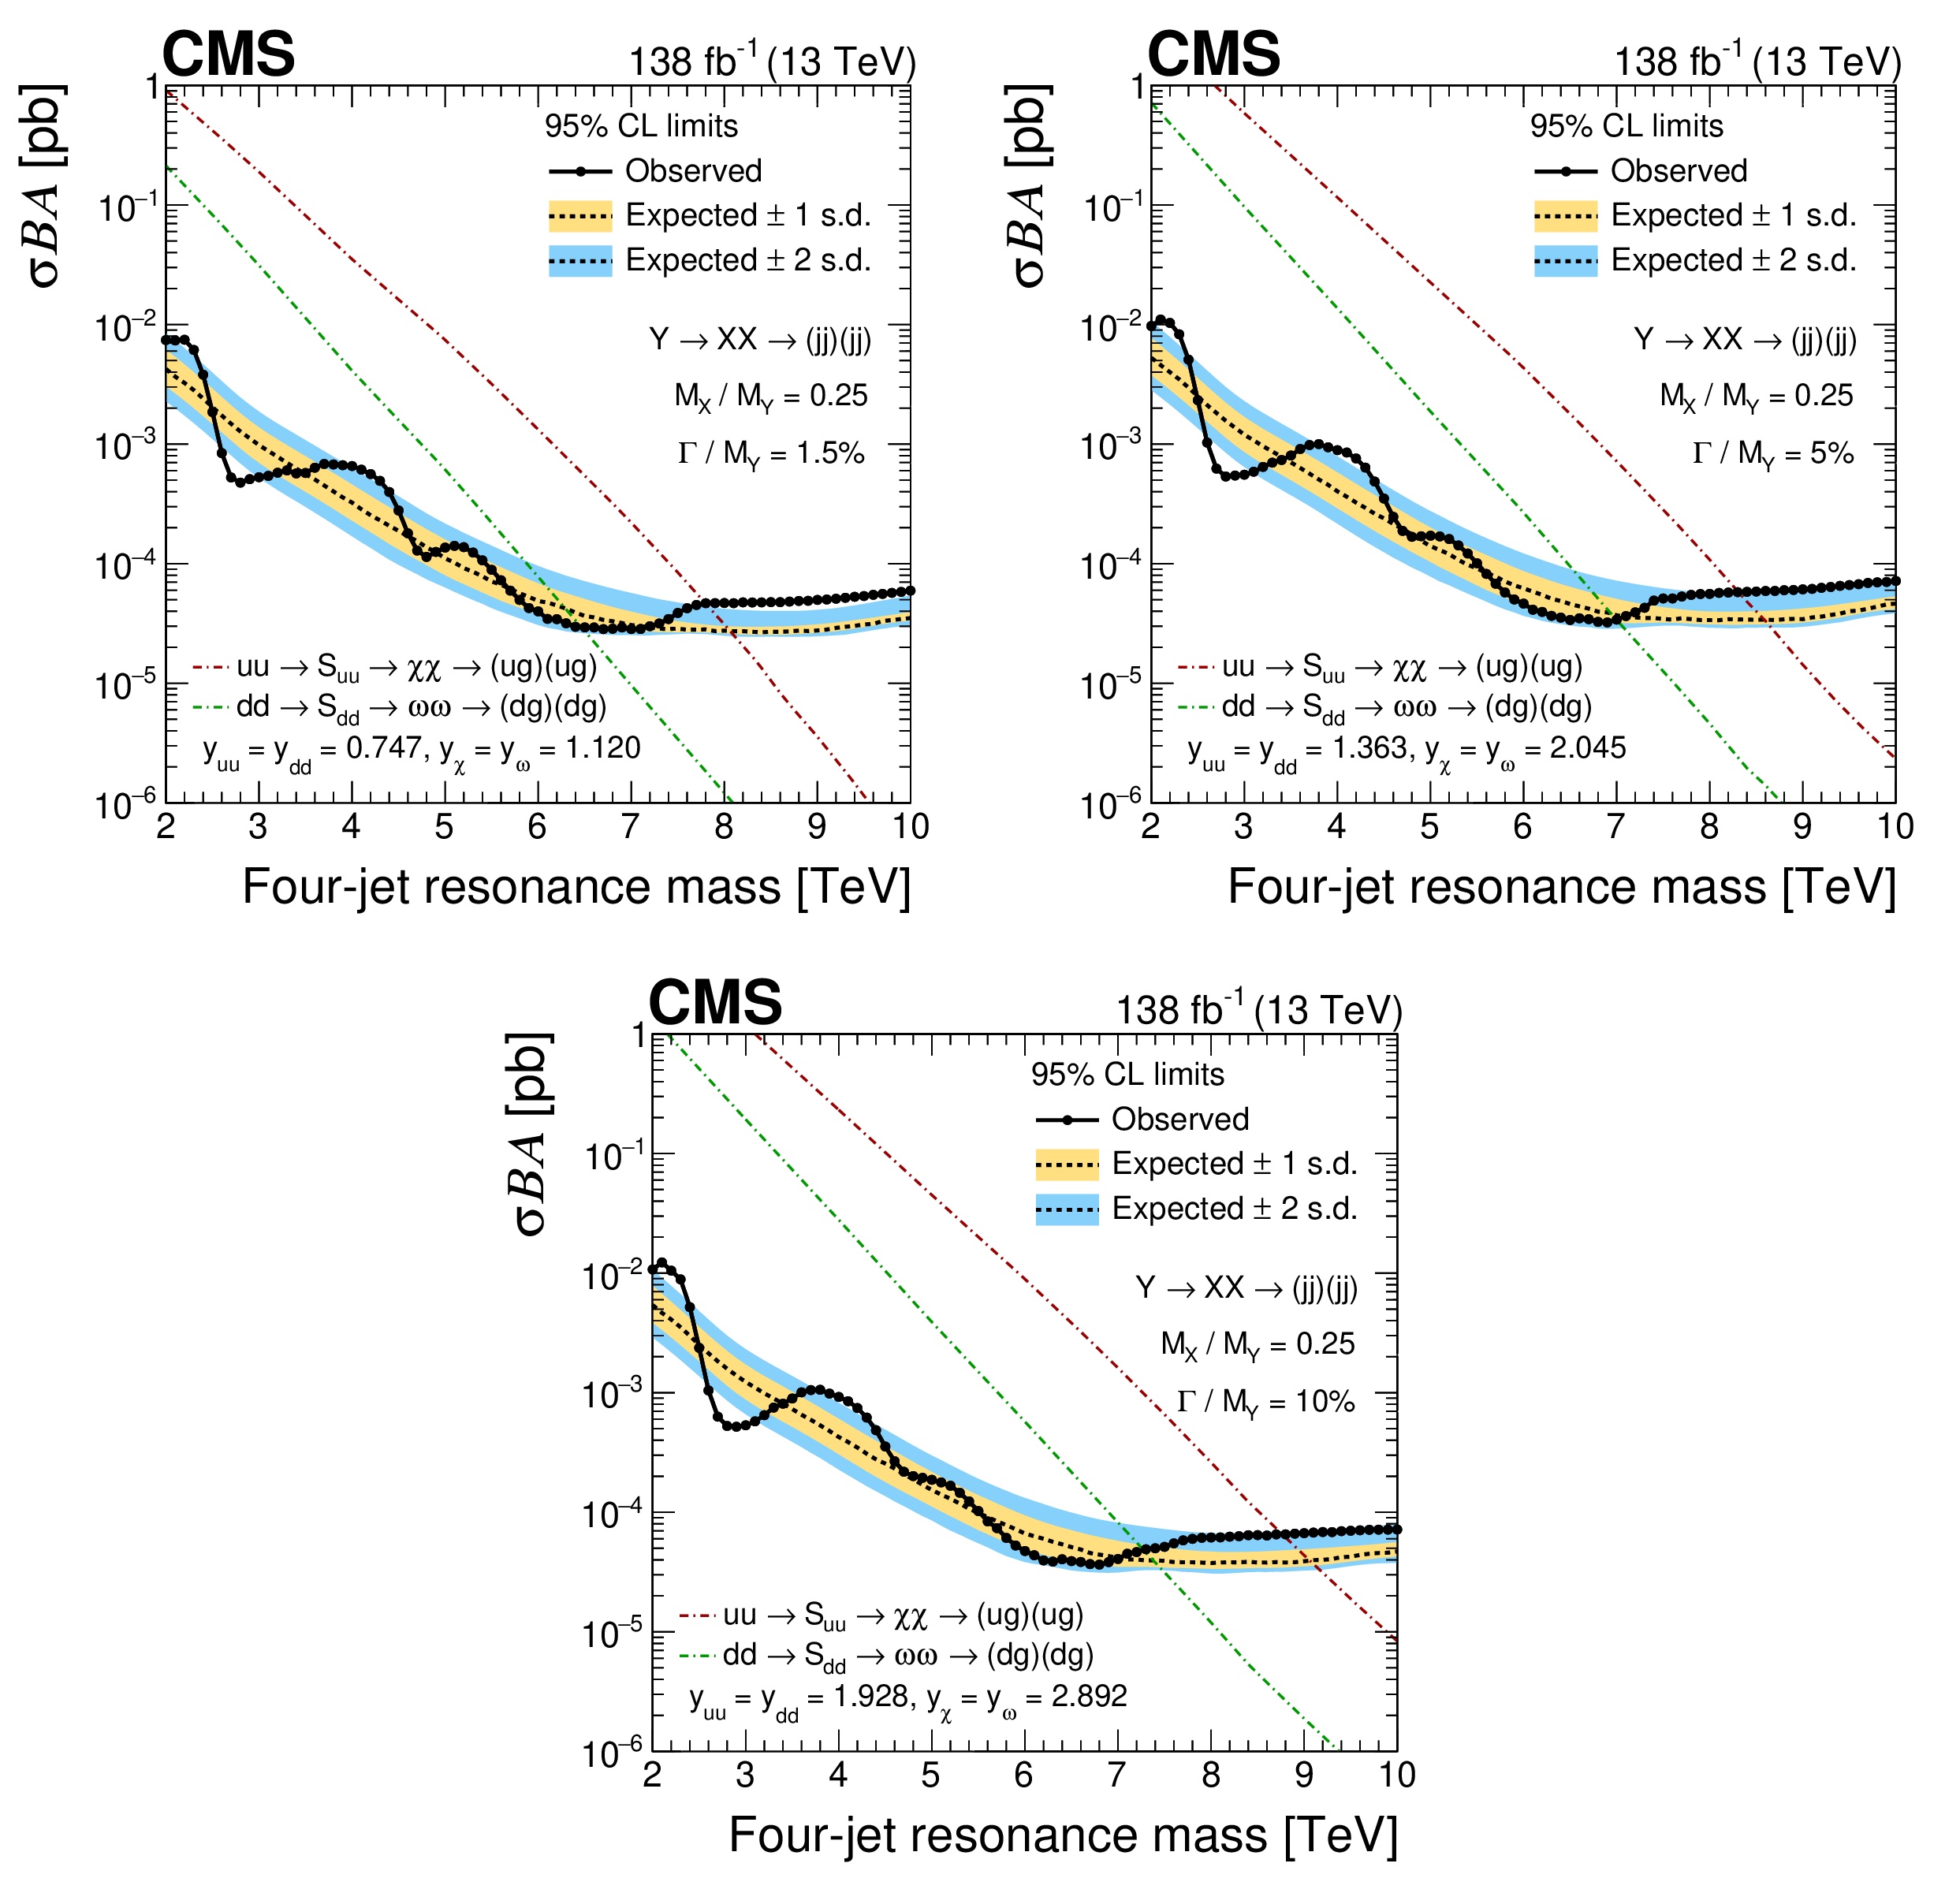
The observed 95% CL upper limits (points) on the product of the cross section, branching fraction, and acceptance for resonant production of paired dijet resonances, $ \mathrm{X} $, with $ \alpha_{\mathrm{true}} = M_{\mathrm{X}} / M_{\mathrm{Y}} = $ 0.25 and width of the initial resonance $ \mathrm{Y} $ equal to 1.5 (upper left), 5 (upper right) and 10% (lower). The corresponding expected limits (dashed) and their variations at the 1 and 2 s.d. levels (shaded bands) are also shown. Limits are compared to predictions for scalar $ \mathrm{S}_{\mathrm{u}\mathrm{u}} $ and $ \mathrm{S}_{\mathrm{d}\mathrm{d}} $ diquarks [3] (dot-dashed lines) with couplings to pairs of up and down quarks, $ y_{\mathrm{u}\mathrm{u}} $ and $ y_{\mathrm{d}\mathrm{d}} $, and to pairs of vector-like quarks, $ y_{\chi} $ and $ y_{\omega} $, set appropriately in order to generate the corresponding widths. |
png pdf |
Figure 8-a:
The observed 95% CL upper limits (points) on the product of the cross section, branching fraction, and acceptance for resonant production of paired dijet resonances, $ \mathrm{X} $, with $ \alpha_{\mathrm{true}} = M_{\mathrm{X}} / M_{\mathrm{Y}} = $ 0.25 and width of the initial resonance $ \mathrm{Y} $ equal to 1.5 (upper left), 5 (upper right) and 10% (lower). The corresponding expected limits (dashed) and their variations at the 1 and 2 s.d. levels (shaded bands) are also shown. Limits are compared to predictions for scalar $ \mathrm{S}_{\mathrm{u}\mathrm{u}} $ and $ \mathrm{S}_{\mathrm{d}\mathrm{d}} $ diquarks [3] (dot-dashed lines) with couplings to pairs of up and down quarks, $ y_{\mathrm{u}\mathrm{u}} $ and $ y_{\mathrm{d}\mathrm{d}} $, and to pairs of vector-like quarks, $ y_{\chi} $ and $ y_{\omega} $, set appropriately in order to generate the corresponding widths. |
png pdf |
Figure 8-b:
The observed 95% CL upper limits (points) on the product of the cross section, branching fraction, and acceptance for resonant production of paired dijet resonances, $ \mathrm{X} $, with $ \alpha_{\mathrm{true}} = M_{\mathrm{X}} / M_{\mathrm{Y}} = $ 0.25 and width of the initial resonance $ \mathrm{Y} $ equal to 1.5 (upper left), 5 (upper right) and 10% (lower). The corresponding expected limits (dashed) and their variations at the 1 and 2 s.d. levels (shaded bands) are also shown. Limits are compared to predictions for scalar $ \mathrm{S}_{\mathrm{u}\mathrm{u}} $ and $ \mathrm{S}_{\mathrm{d}\mathrm{d}} $ diquarks [3] (dot-dashed lines) with couplings to pairs of up and down quarks, $ y_{\mathrm{u}\mathrm{u}} $ and $ y_{\mathrm{d}\mathrm{d}} $, and to pairs of vector-like quarks, $ y_{\chi} $ and $ y_{\omega} $, set appropriately in order to generate the corresponding widths. |
png pdf |
Figure 8-c:
The observed 95% CL upper limits (points) on the product of the cross section, branching fraction, and acceptance for resonant production of paired dijet resonances, $ \mathrm{X} $, with $ \alpha_{\mathrm{true}} = M_{\mathrm{X}} / M_{\mathrm{Y}} = $ 0.25 and width of the initial resonance $ \mathrm{Y} $ equal to 1.5 (upper left), 5 (upper right) and 10% (lower). The corresponding expected limits (dashed) and their variations at the 1 and 2 s.d. levels (shaded bands) are also shown. Limits are compared to predictions for scalar $ \mathrm{S}_{\mathrm{u}\mathrm{u}} $ and $ \mathrm{S}_{\mathrm{d}\mathrm{d}} $ diquarks [3] (dot-dashed lines) with couplings to pairs of up and down quarks, $ y_{\mathrm{u}\mathrm{u}} $ and $ y_{\mathrm{d}\mathrm{d}} $, and to pairs of vector-like quarks, $ y_{\chi} $ and $ y_{\omega} $, set appropriately in order to generate the corresponding widths. |
png pdf |
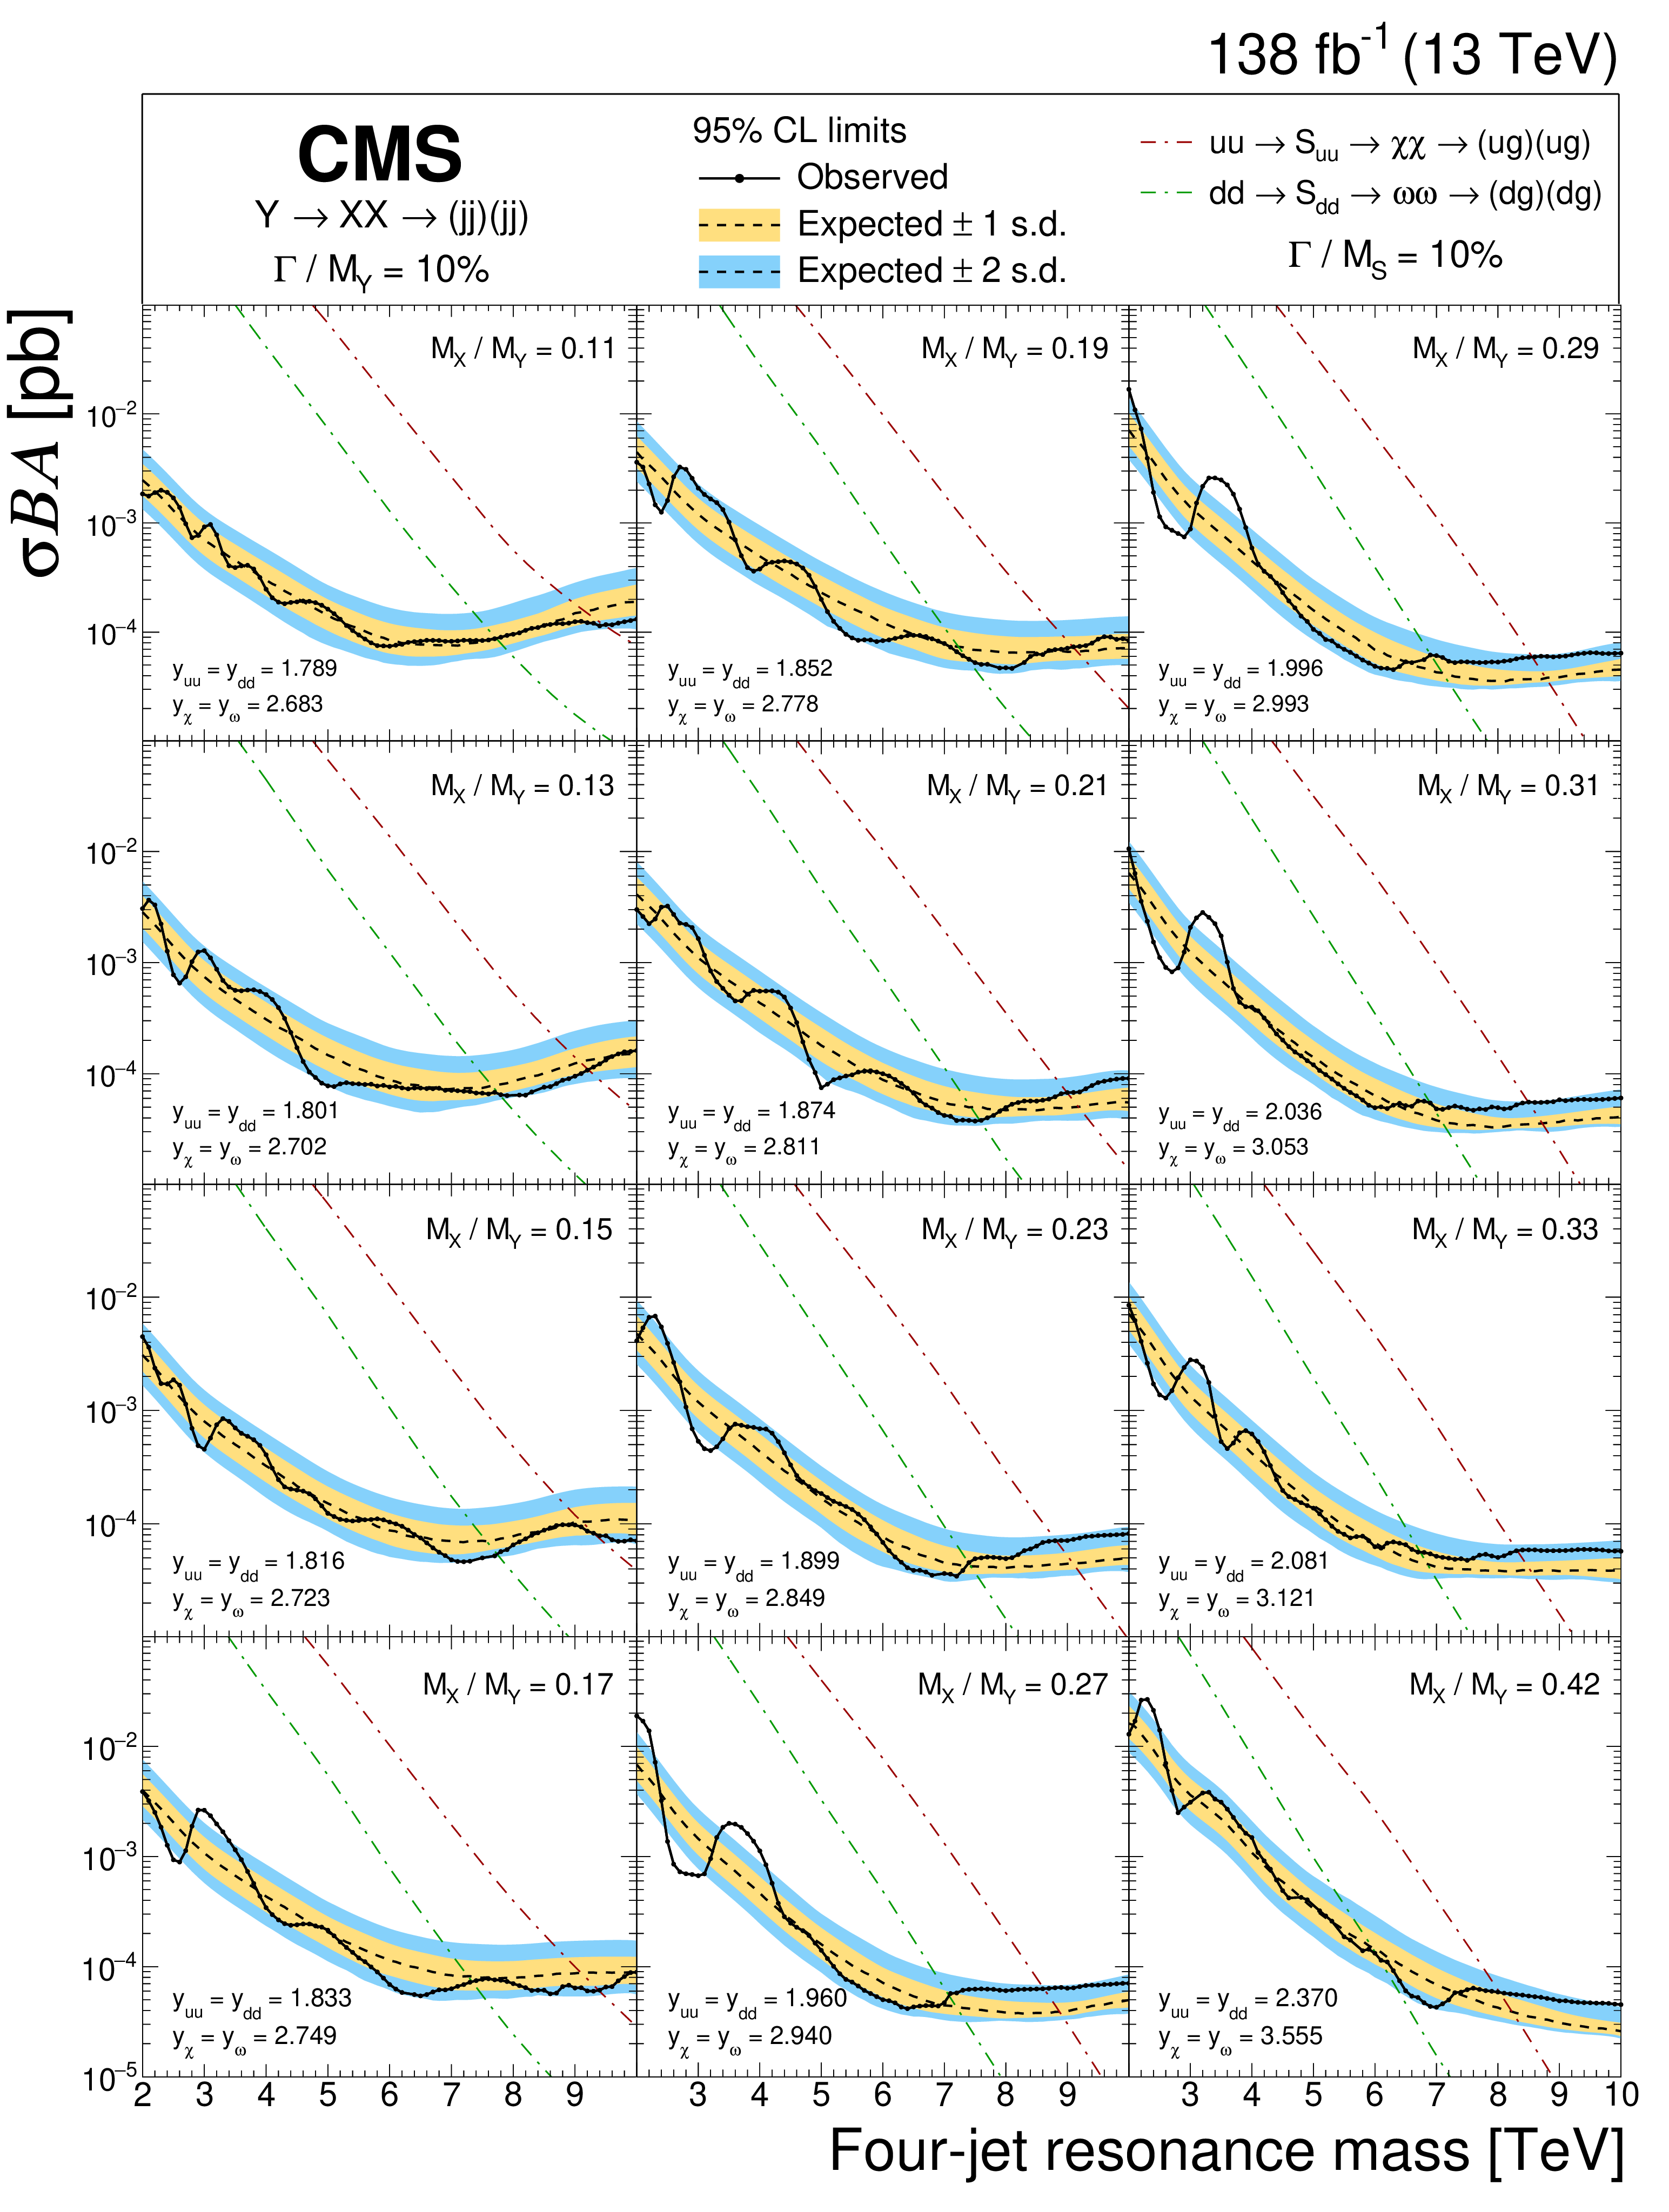
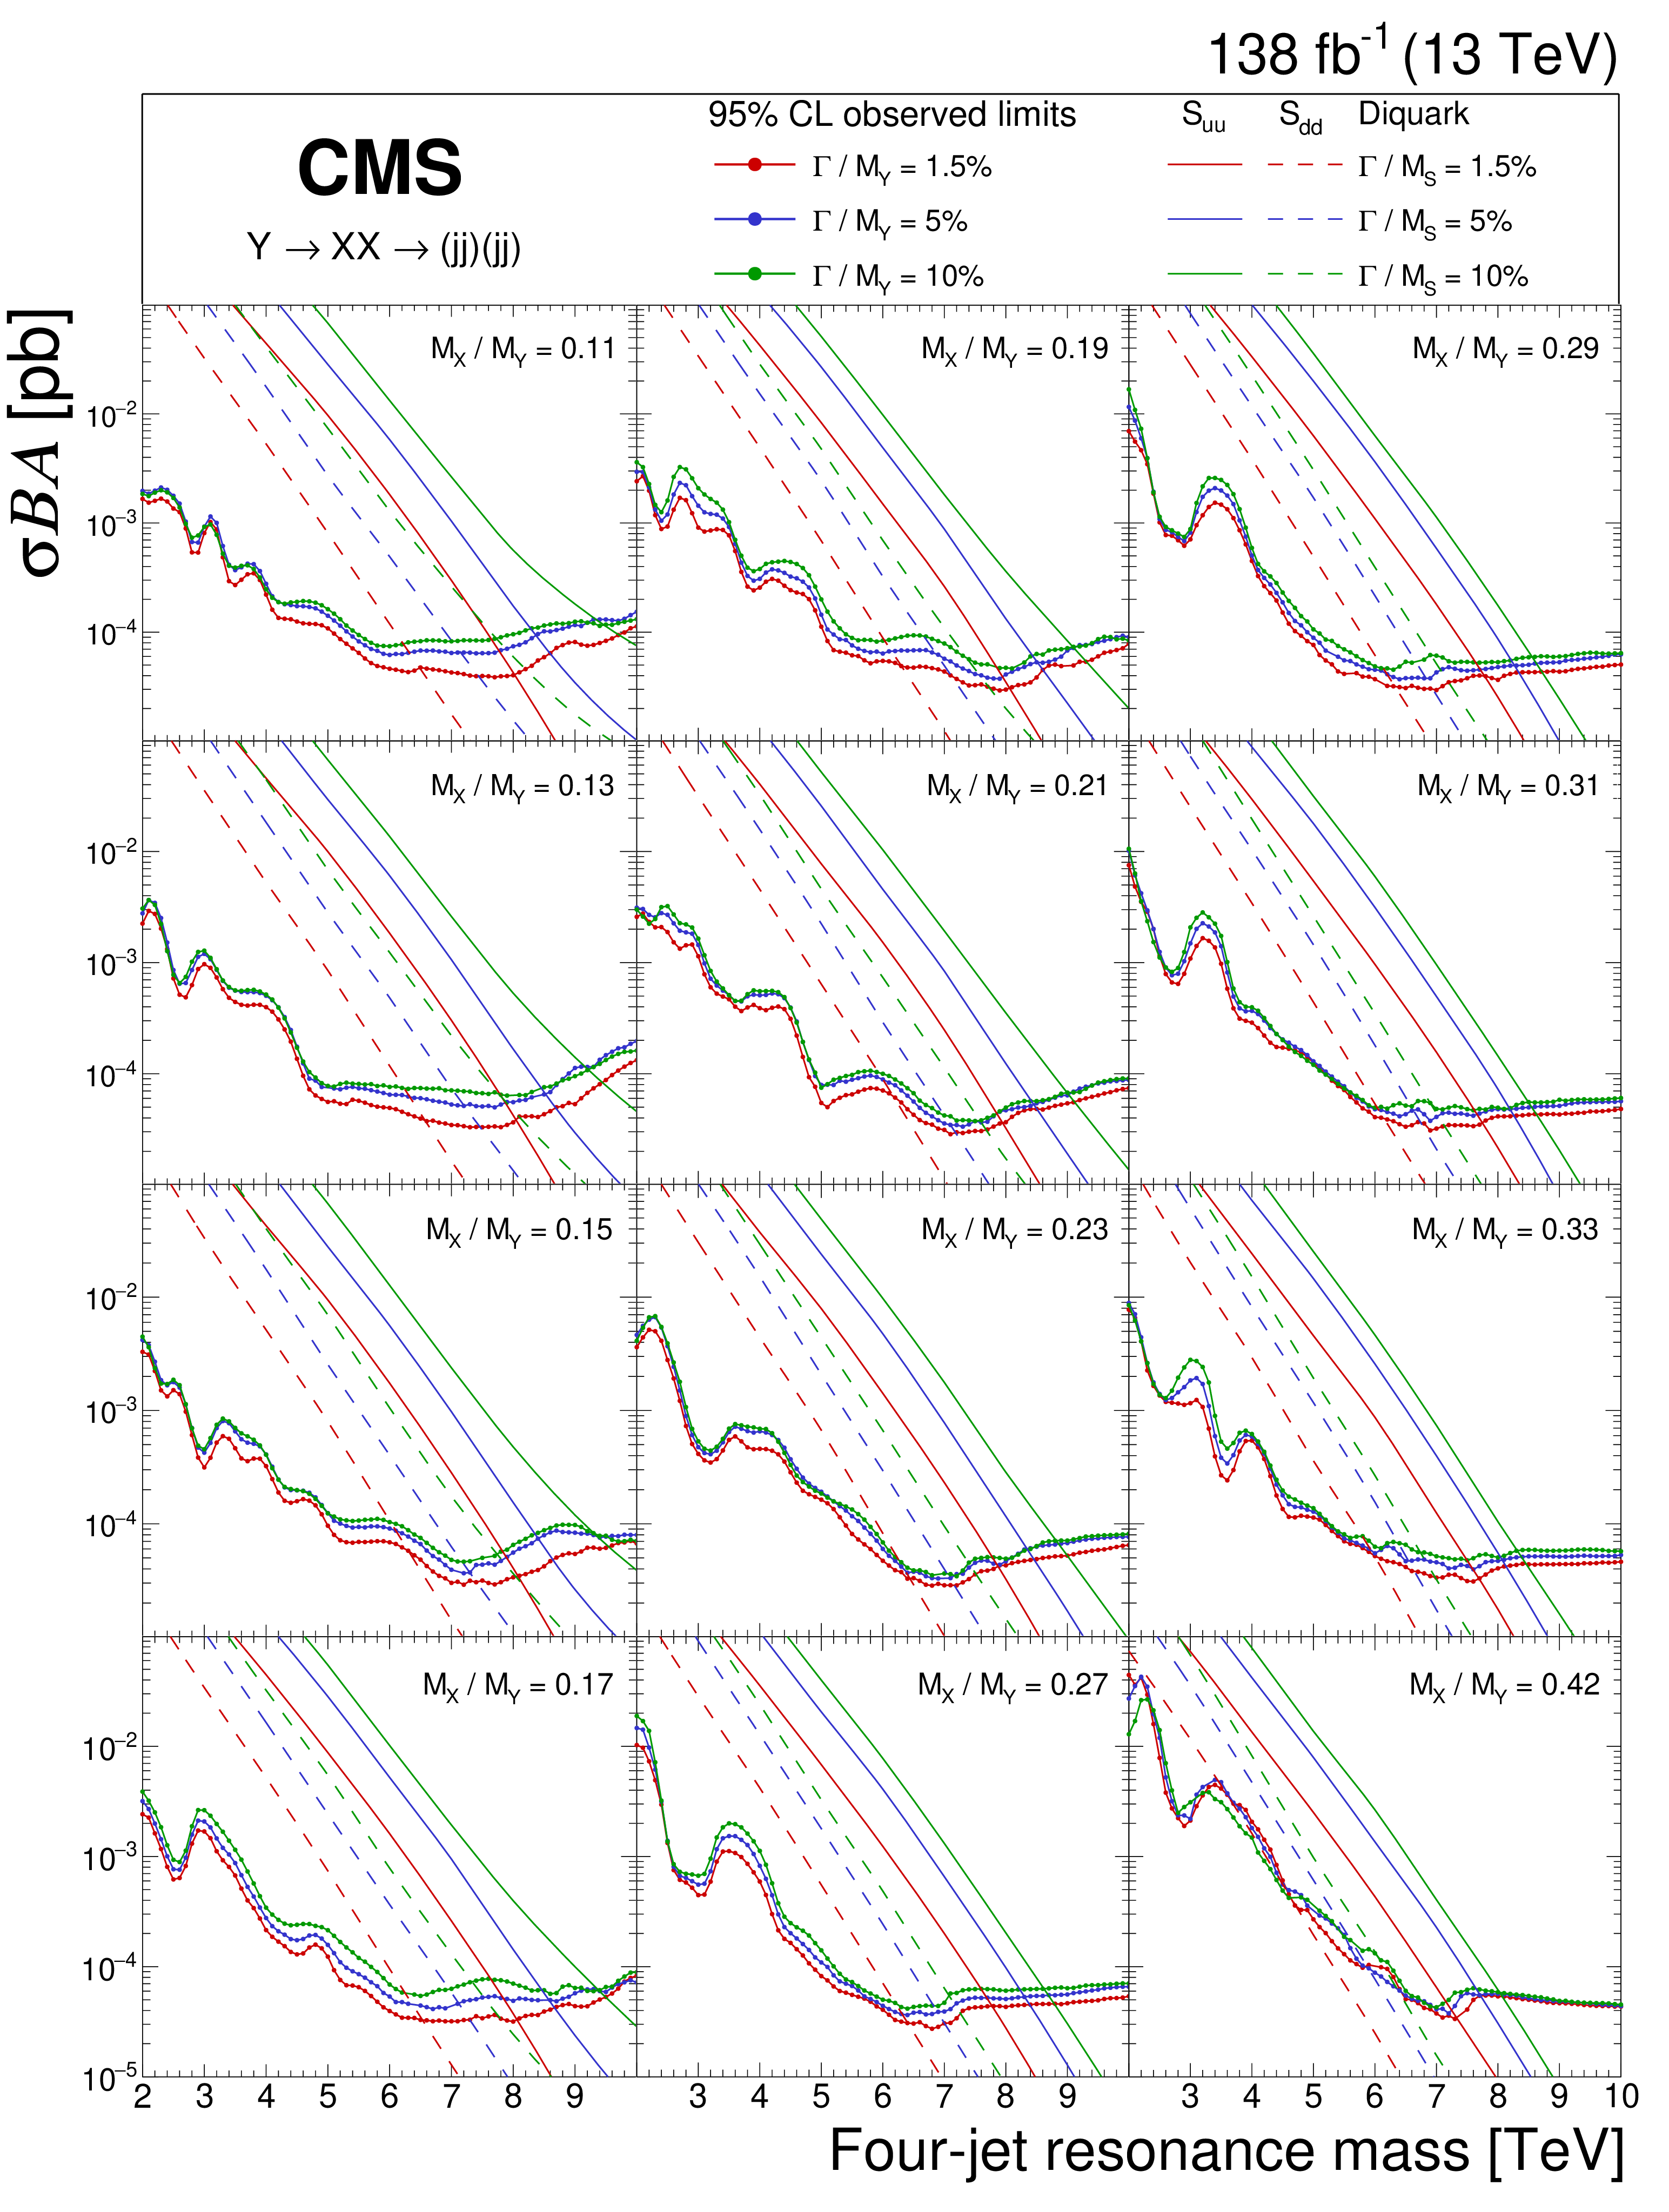
Figure 9:
The observed 95% CL upper limits (points) on the product of the cross section, branching fraction, and acceptance for resonant production of paired dijet resonances, $ \mathrm{X} $, with width of the initial resonance $ \mathrm{Y} $ equal to 10%, and values of $ \alpha_{\mathrm{true}} = M_{\mathrm{X}} / M_{\mathrm{Y}} $ shown in each panel. The corresponding expected limits (dashed) and their variations at the 1 and 2 s.d. levels (shaded bands) are also shown. Limits are compared to predictions for scalar $ \mathrm{S}_{\mathrm{u}\mathrm{u}} $ and $ \mathrm{S}_{\mathrm{d}\mathrm{d}} $ diquarks [3] (dot-dashed lines) with couplings to pairs of up and down quarks, $ y_{\mathrm{u}\mathrm{u}} $ and $ y_{\mathrm{d}\mathrm{d}} $, and to pairs of vector-like quarks, $ y_{\chi} $ and $ y_{\omega} $, set appropriately in order to generate a 10% width. |
png pdf |
Figure 10:
The observed 95% CL upper limits (points) on the product of the cross section, branching fraction, and acceptance for resonant production of paired dijet resonances, $ \mathrm{X} $, with the values of $ \alpha_{\mathrm{true}} = M_{\mathrm{X}} / M_{\mathrm{Y}} $ shown in each panel. Different colors correspond to the various widths of the $ \mathrm{Y} $ resonance. Limits are compared to predictions for scalar $ \mathrm{S}_{\mathrm{u}\mathrm{u}} $ (solid lines) and $ \mathrm{S}_{\mathrm{d}\mathrm{d}} $ (dashed lines) diquarks [3] with couplings to pairs of up and down quarks, $ y_{\mathrm{u}\mathrm{u}} $ and $ y_{\mathrm{d}\mathrm{d}} $, and to pairs of vector-like quarks, $ y_{\chi} $ and $ y_{\omega} $, set appropriately in order to generate the corresponding widths. |
png pdf |
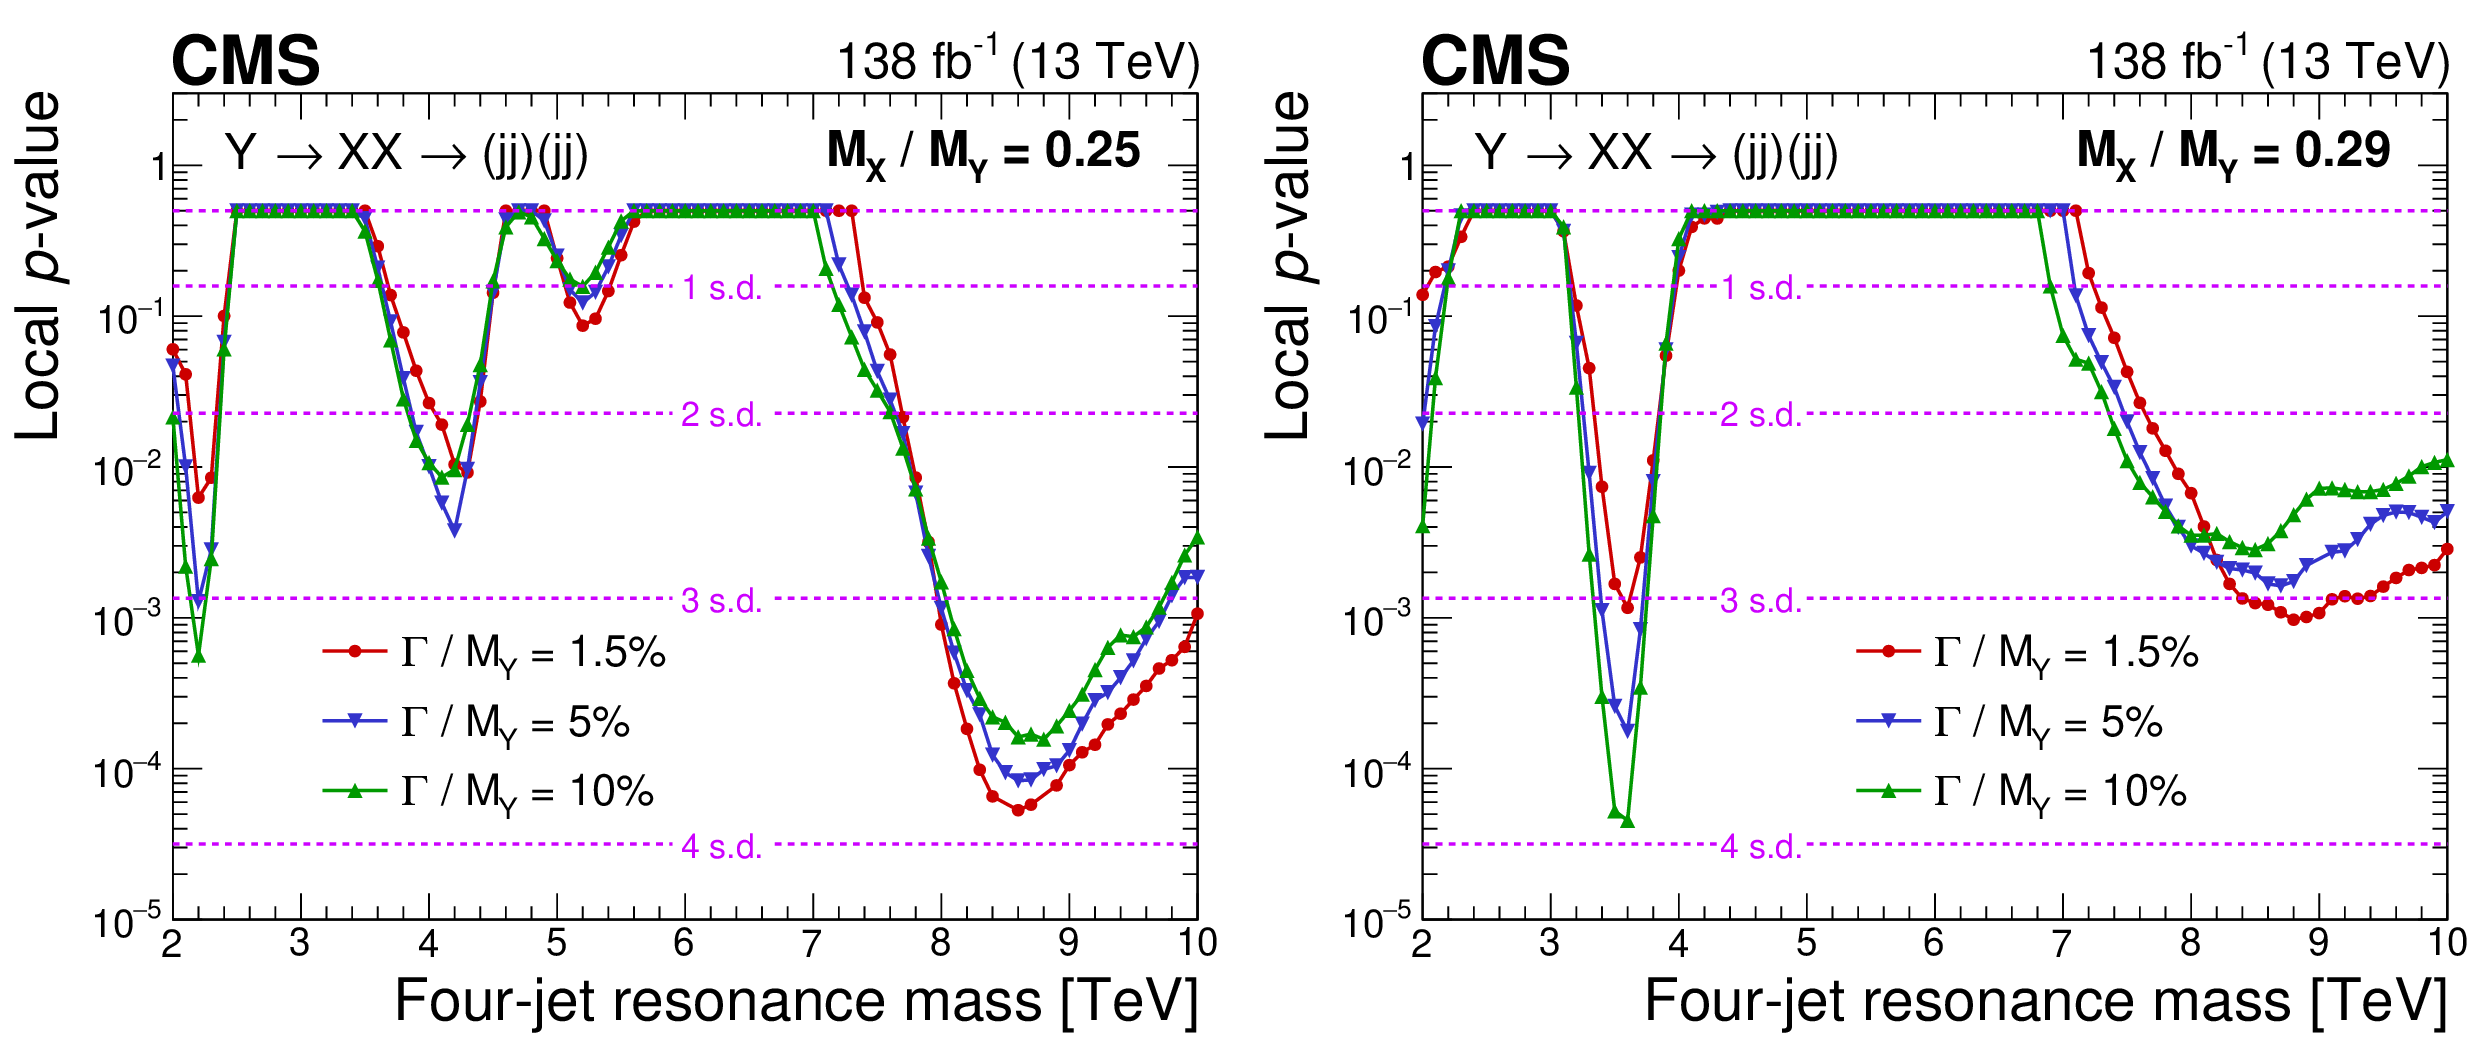
Figure 11:
Observed local $ p $-value for a four-jet resonance, $ \mathrm{Y} $, decaying to a pair of dijet resonances, $ \mathrm{X} $, with $ \alpha_{\mathrm{true}} = M_{\mathrm{X}} / M_{\mathrm{Y}} = $ 0.25 (left) and 0.29 (right), and various widths of $ \mathrm{Y} $ superimposed. Also shown are corresponding levels of local significance (dashed lines) in units of s.d. |
png pdf |
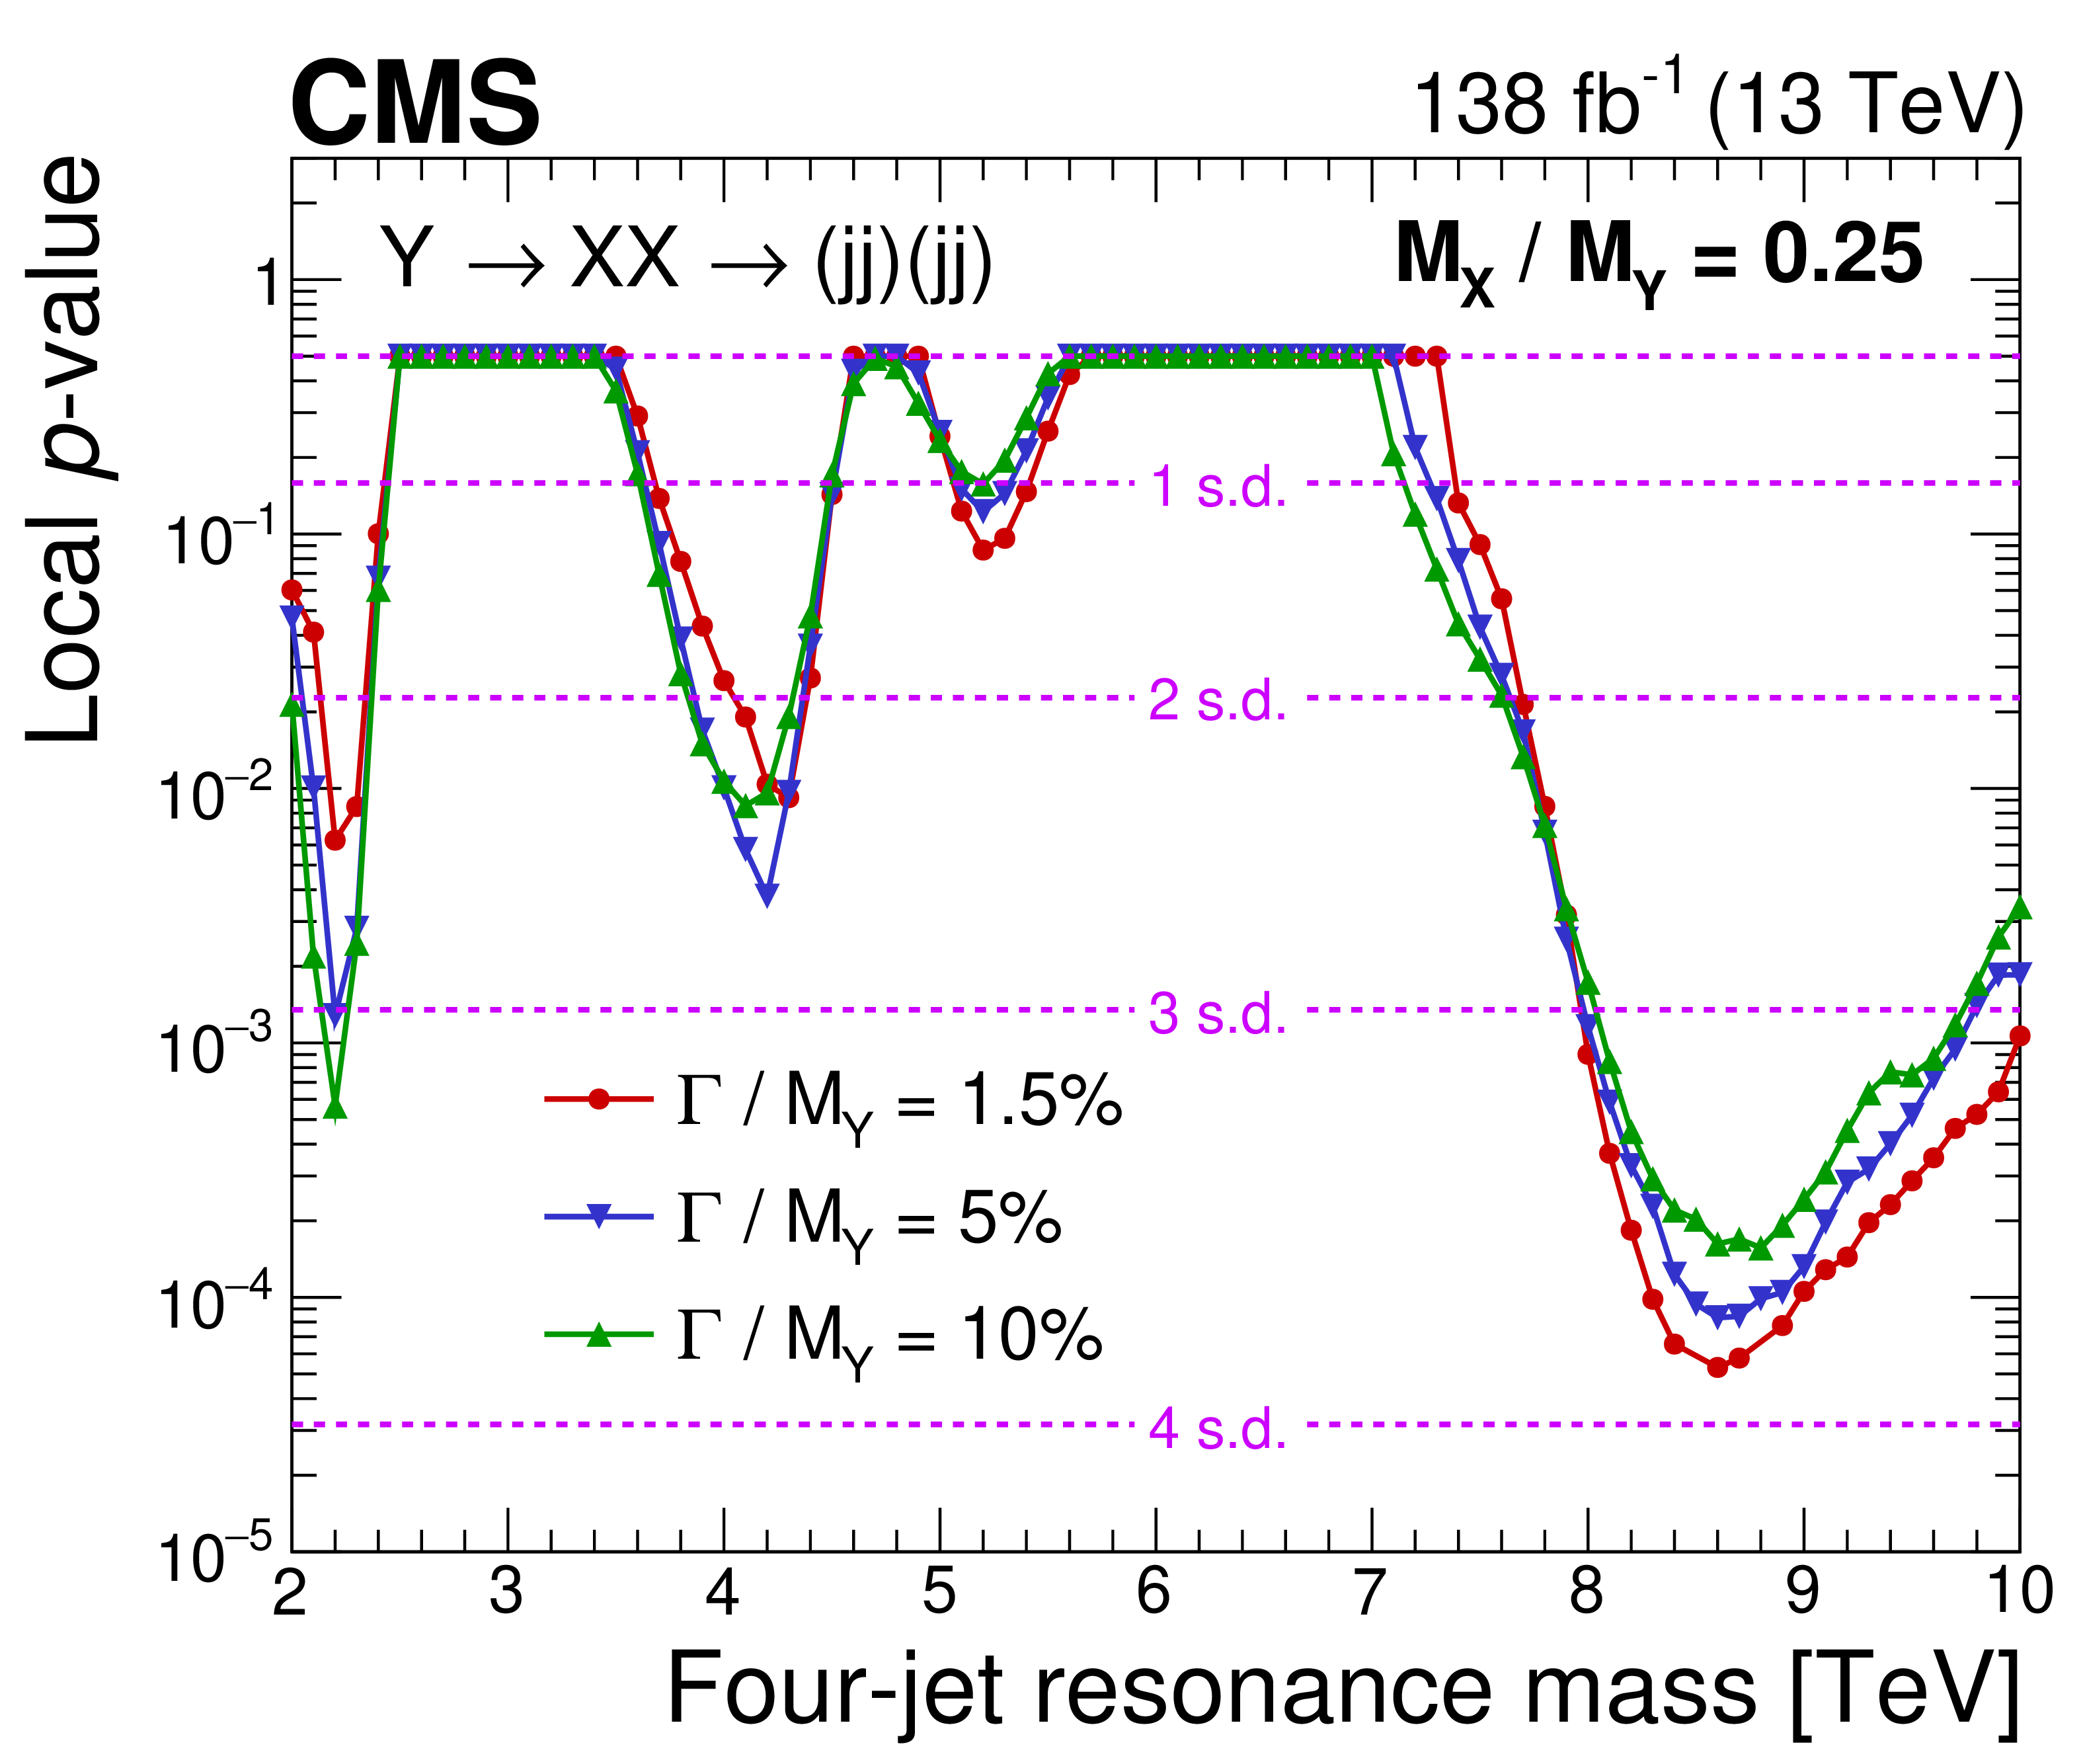
Figure 11-a:
Observed local $ p $-value for a four-jet resonance, $ \mathrm{Y} $, decaying to a pair of dijet resonances, $ \mathrm{X} $, with $ \alpha_{\mathrm{true}} = M_{\mathrm{X}} / M_{\mathrm{Y}} = $ 0.25 (left) and 0.29 (right), and various widths of $ \mathrm{Y} $ superimposed. Also shown are corresponding levels of local significance (dashed lines) in units of s.d. |
png pdf |
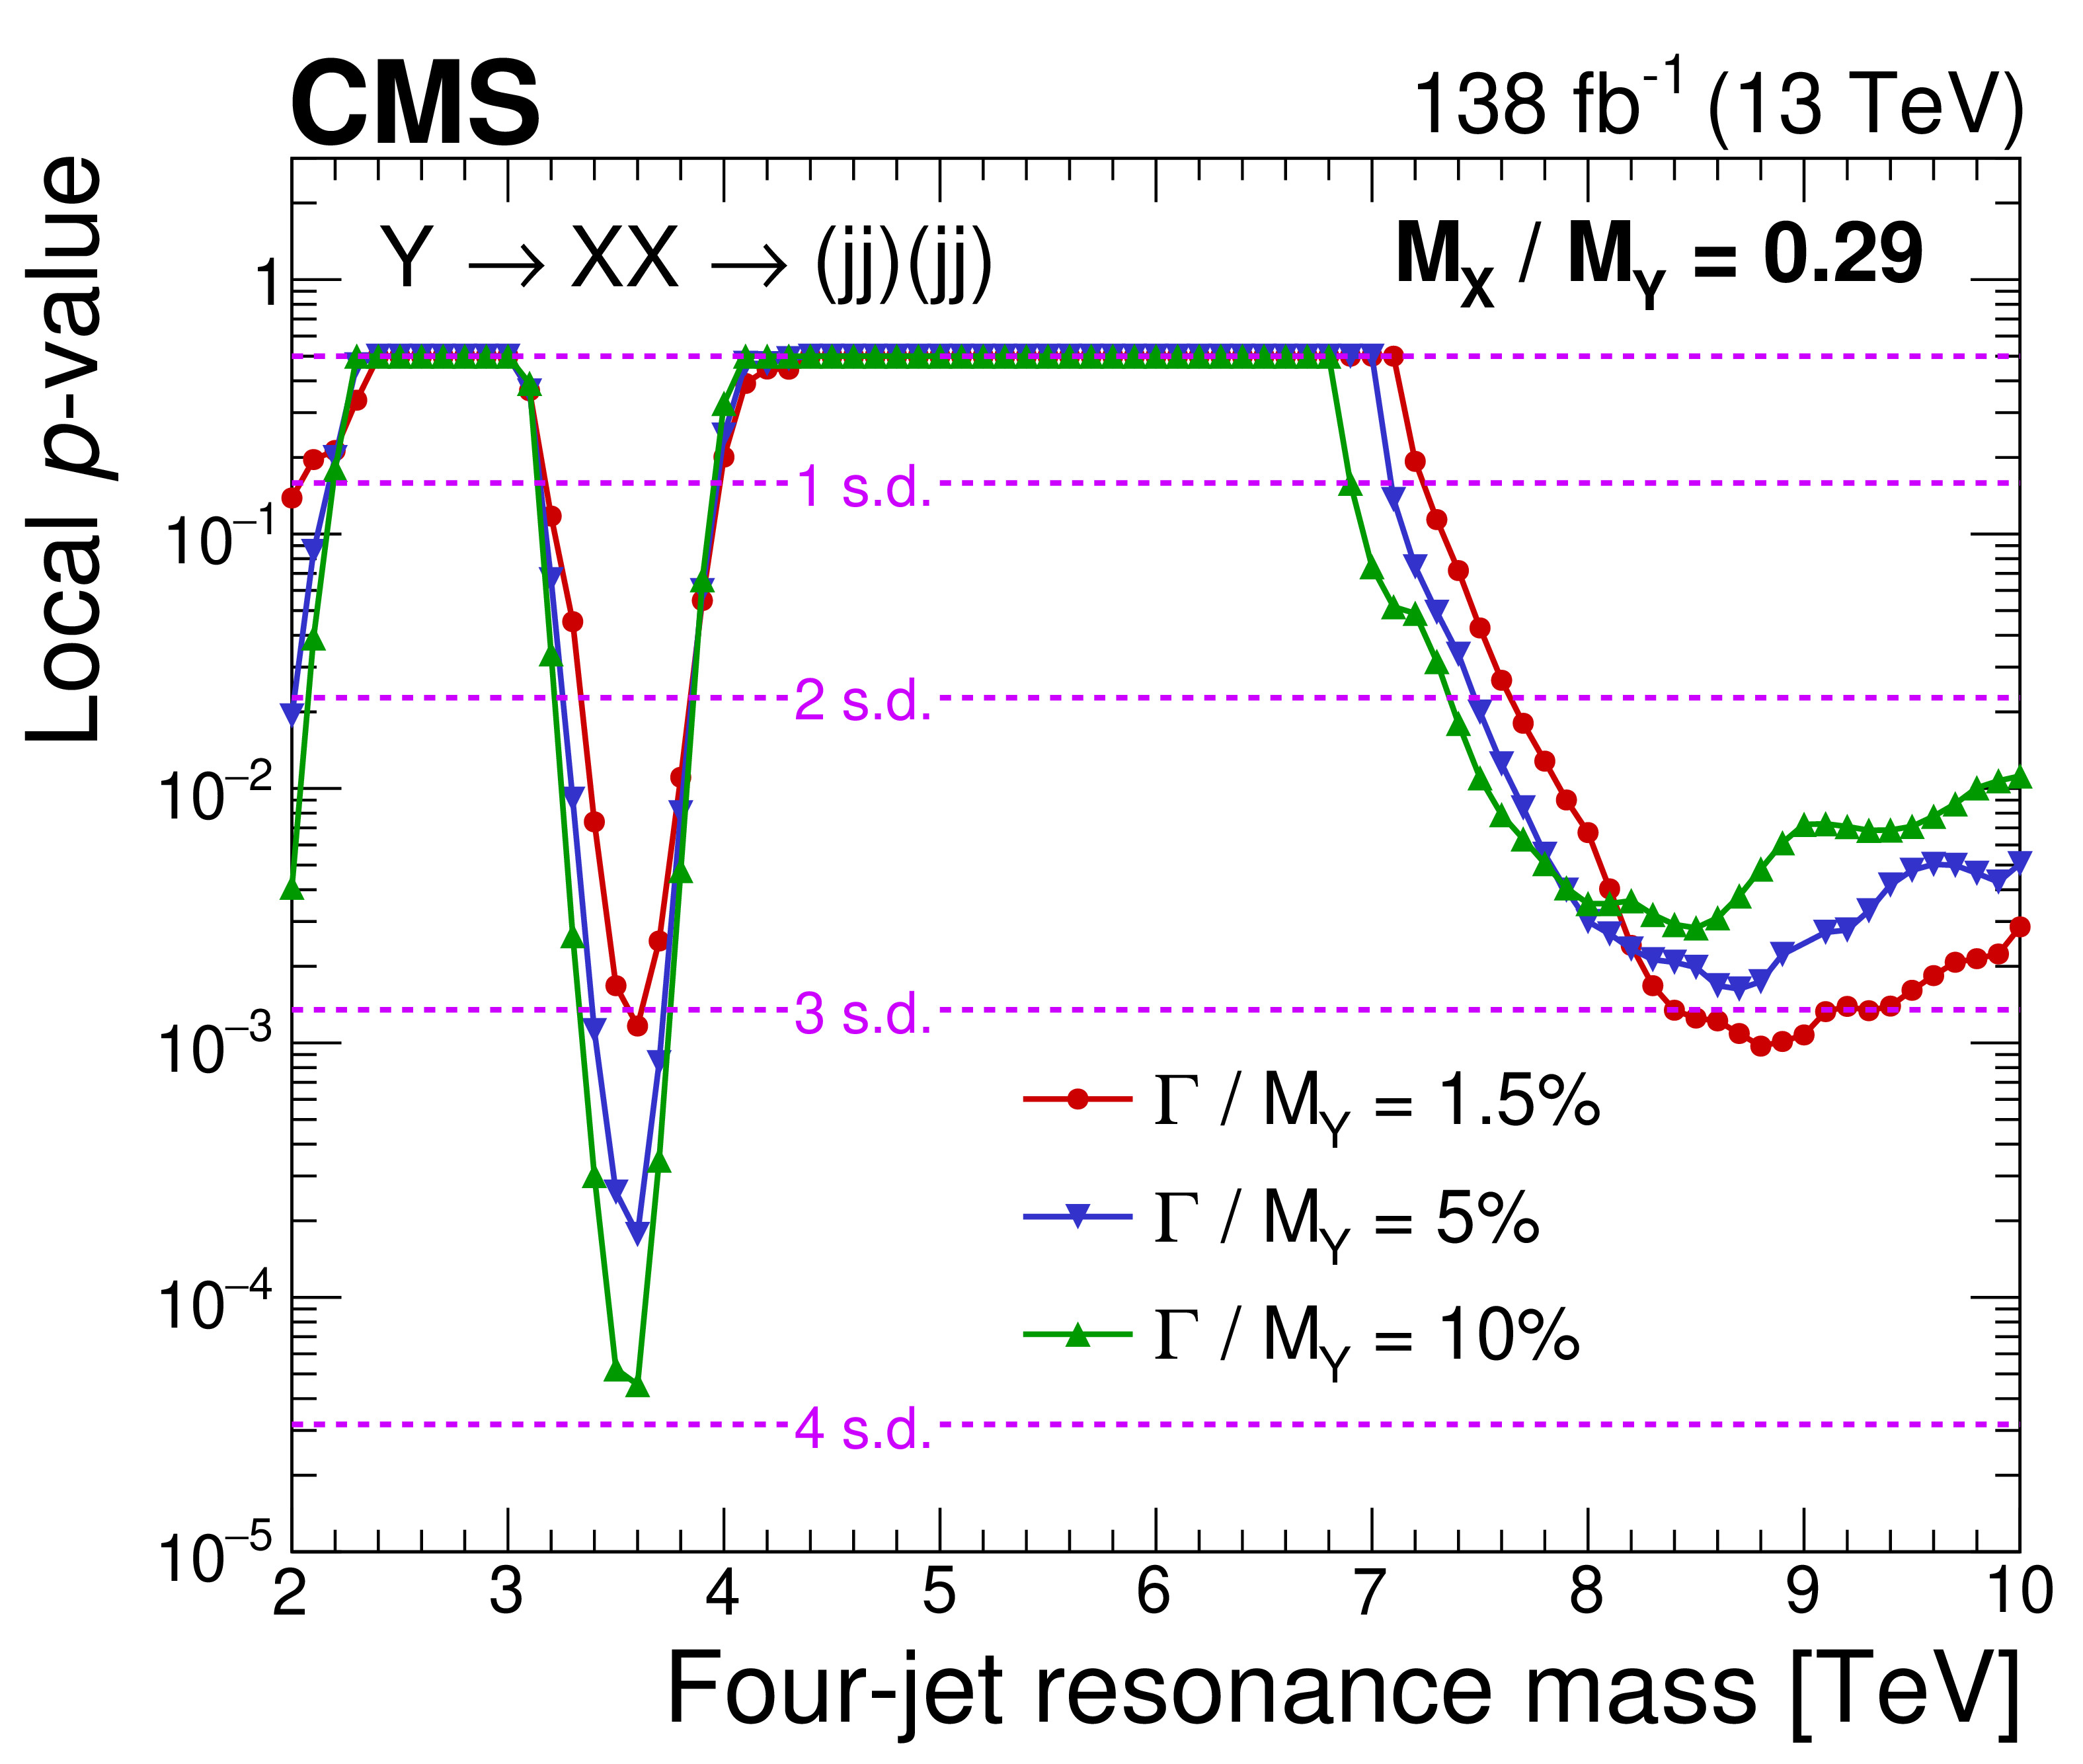
Figure 11-b:
Observed local $ p $-value for a four-jet resonance, $ \mathrm{Y} $, decaying to a pair of dijet resonances, $ \mathrm{X} $, with $ \alpha_{\mathrm{true}} = M_{\mathrm{X}} / M_{\mathrm{Y}} = $ 0.25 (left) and 0.29 (right), and various widths of $ \mathrm{Y} $ superimposed. Also shown are corresponding levels of local significance (dashed lines) in units of s.d. |
png pdf |
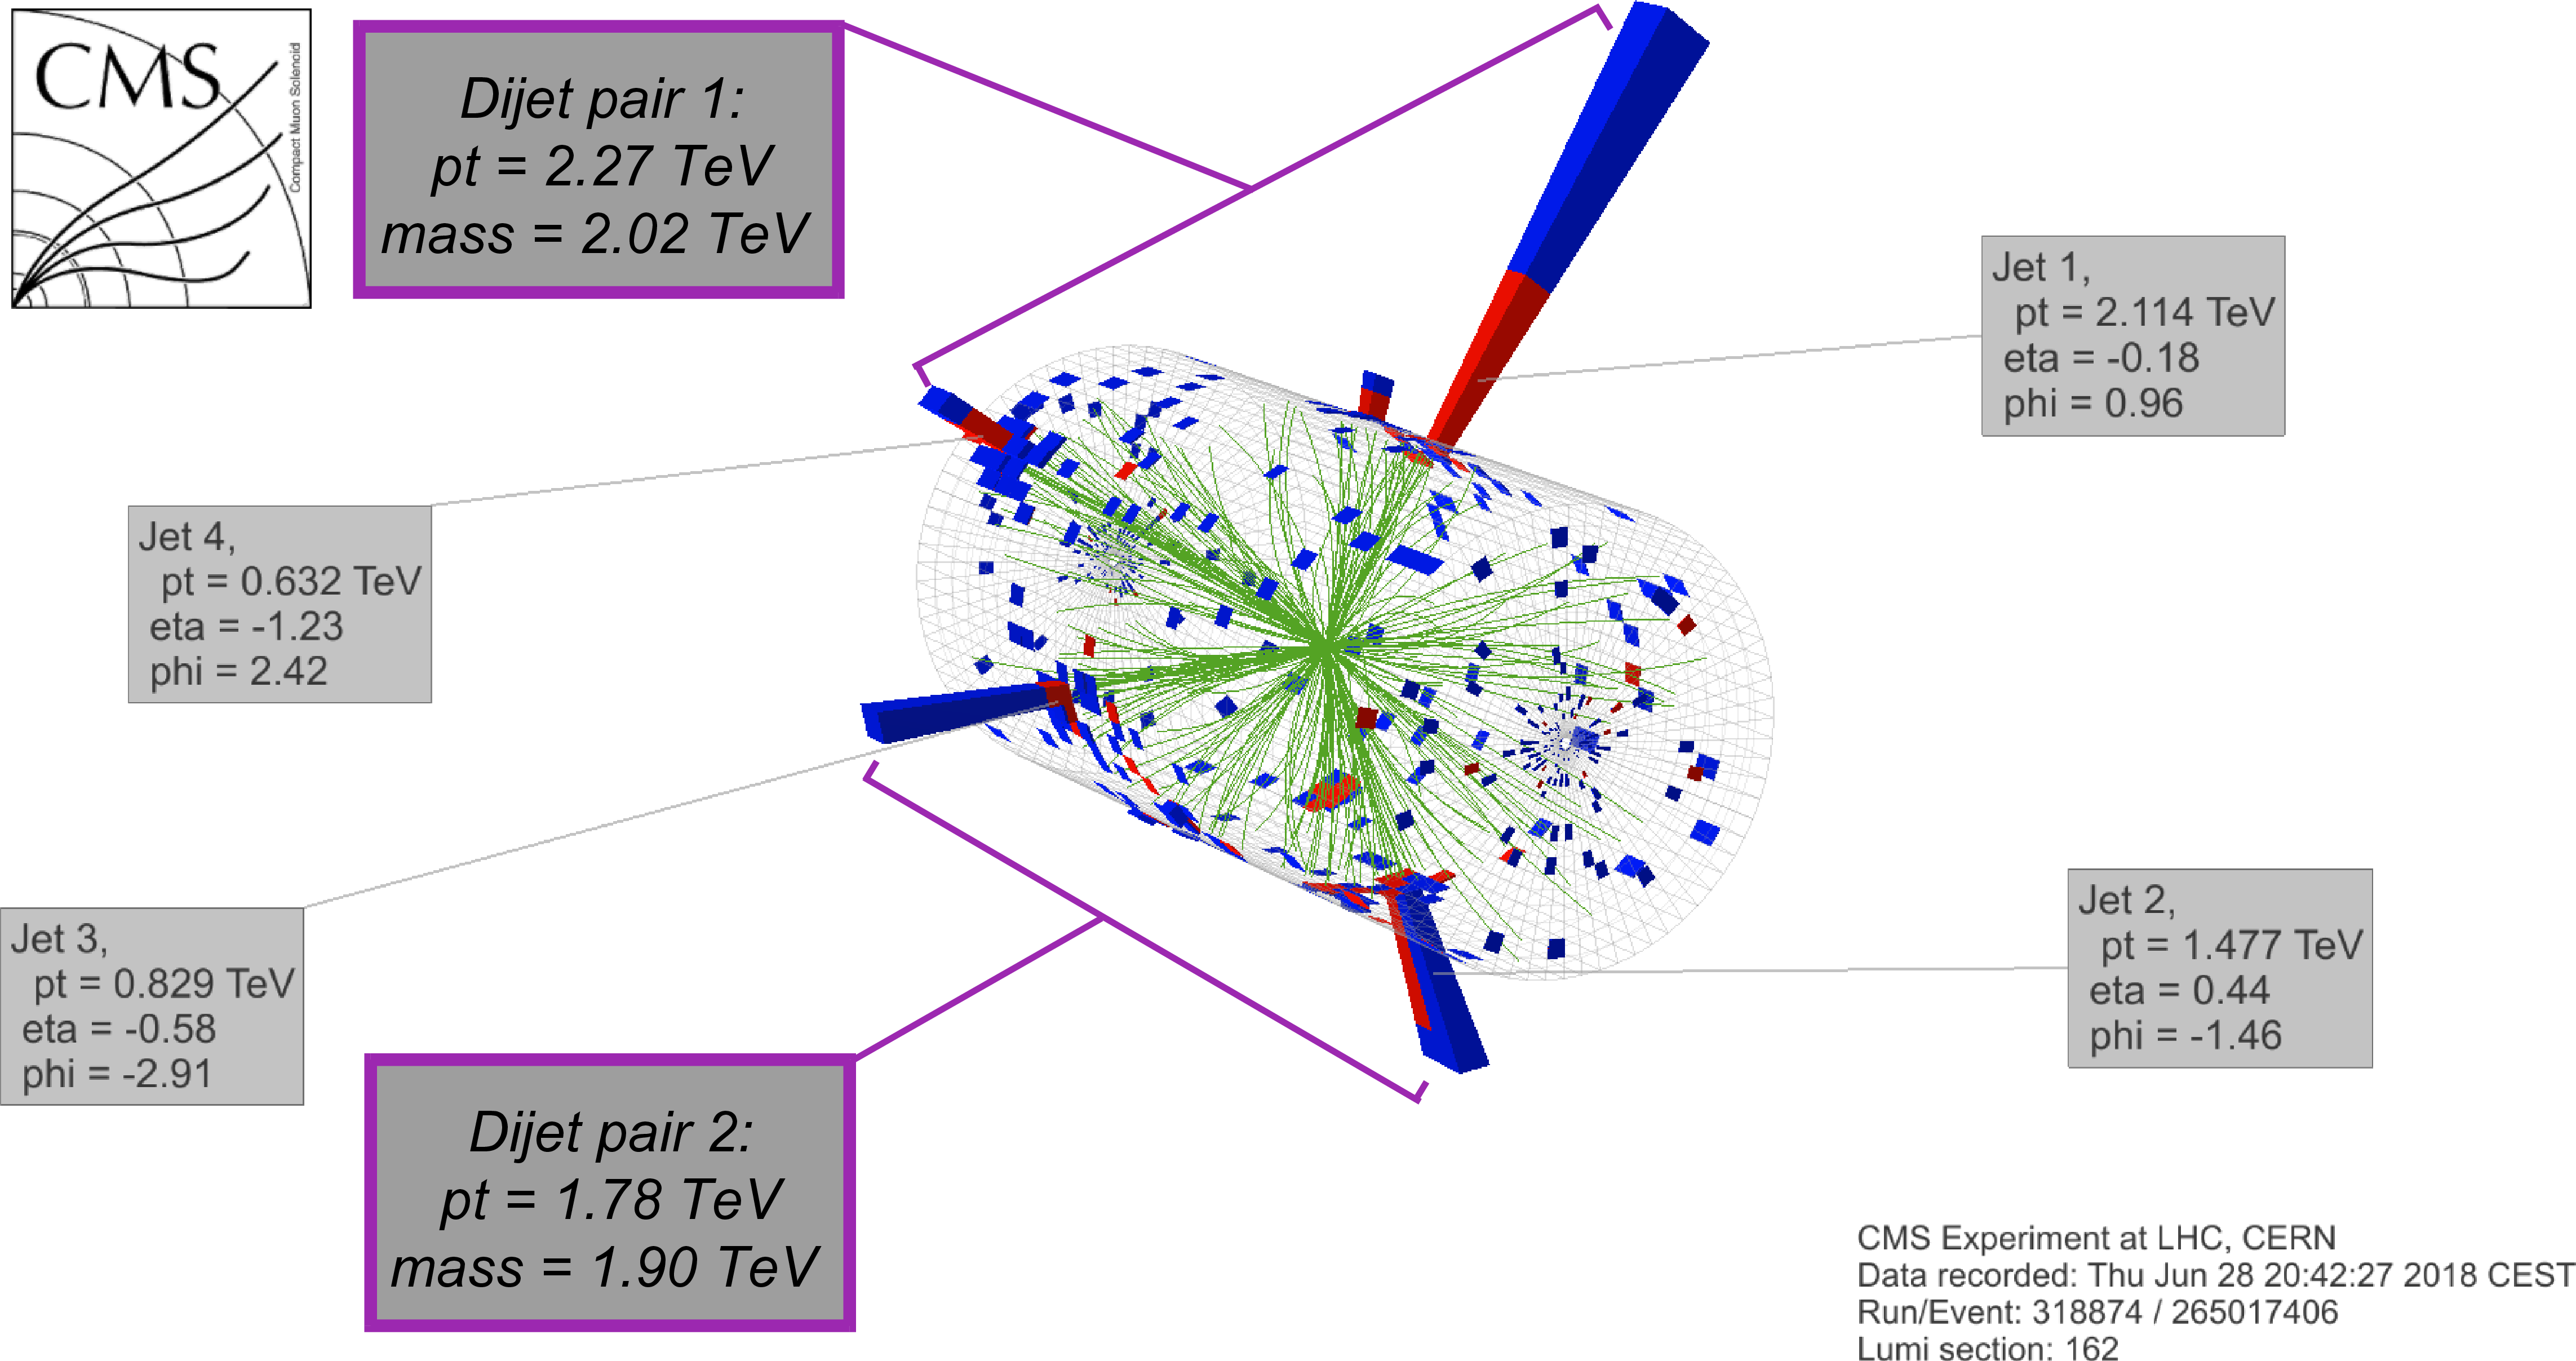
Figure 12:
The 3D display of the candidate event for broad resonances with a four-jet mass of 5.8 TeV. The display shows the energy deposited in the electromagnetic (red) and hadronic (blue) calorimeters and the reconstructed tracks of charged particles (green). The grouping of the four observed jets into two dijet pairs (purple boxes) is discussed in the text. |
| Tables | |
png pdf |
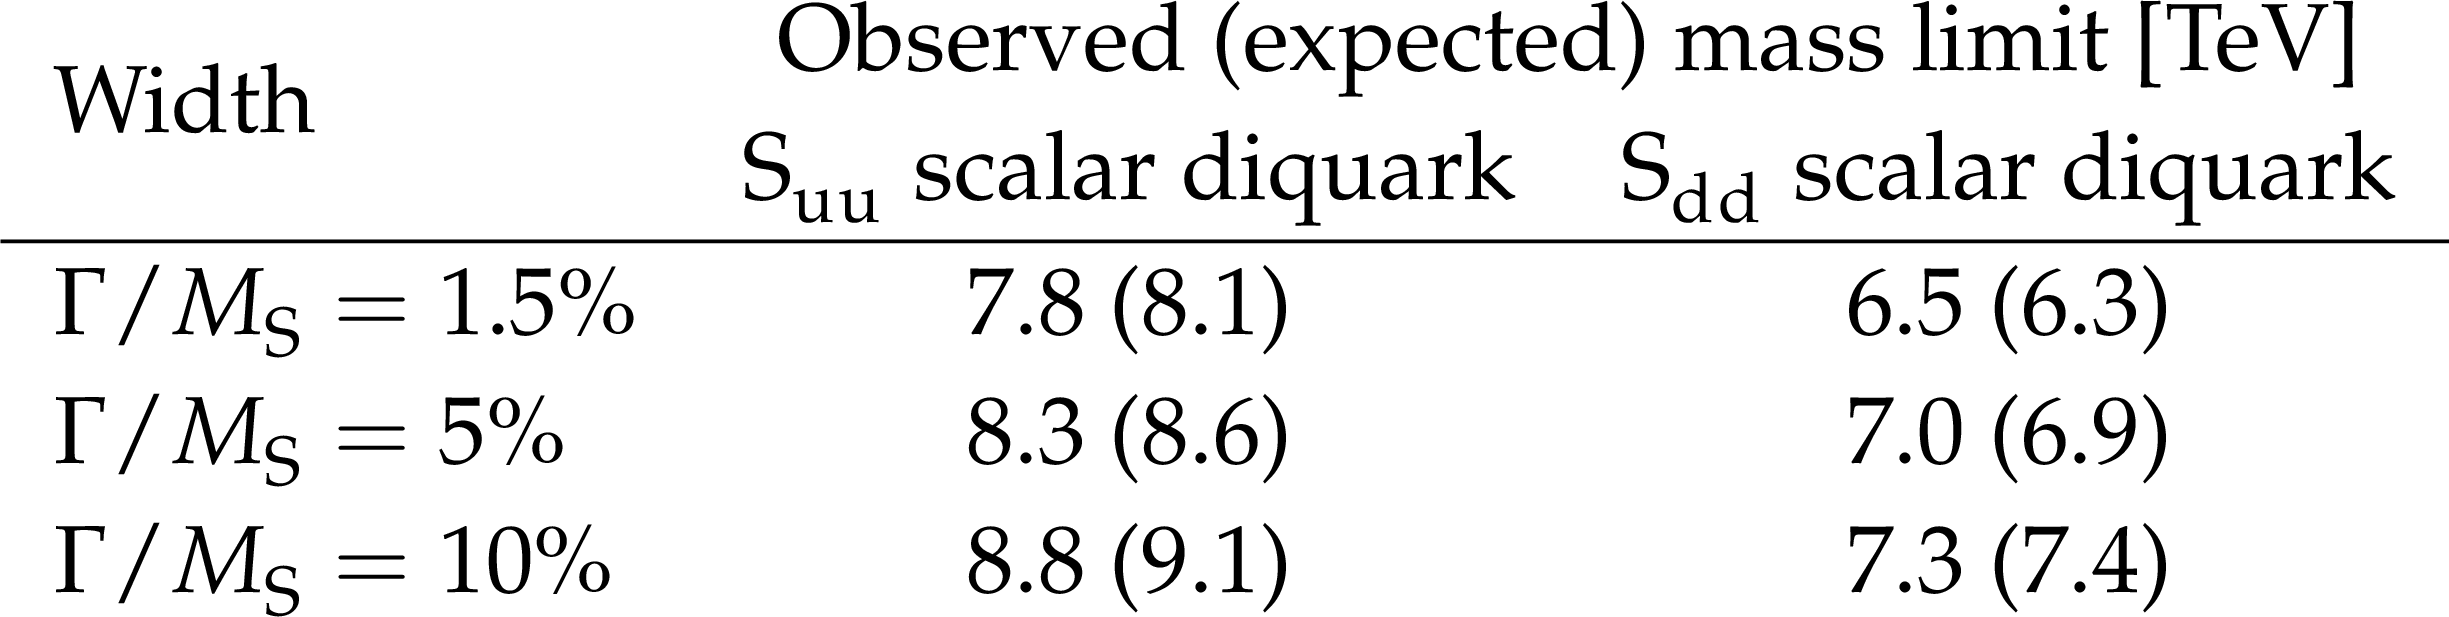
Table 1:
Observed and expected mass limits at 95% CL for $ \mathrm{S}_{\mathrm{u}\mathrm{u}} $ and $ \mathrm{S}_{\mathrm{d}\mathrm{d}} $ diquark models with $ \alpha_{\mathrm{true}} = $ 0.25. |
png pdf |
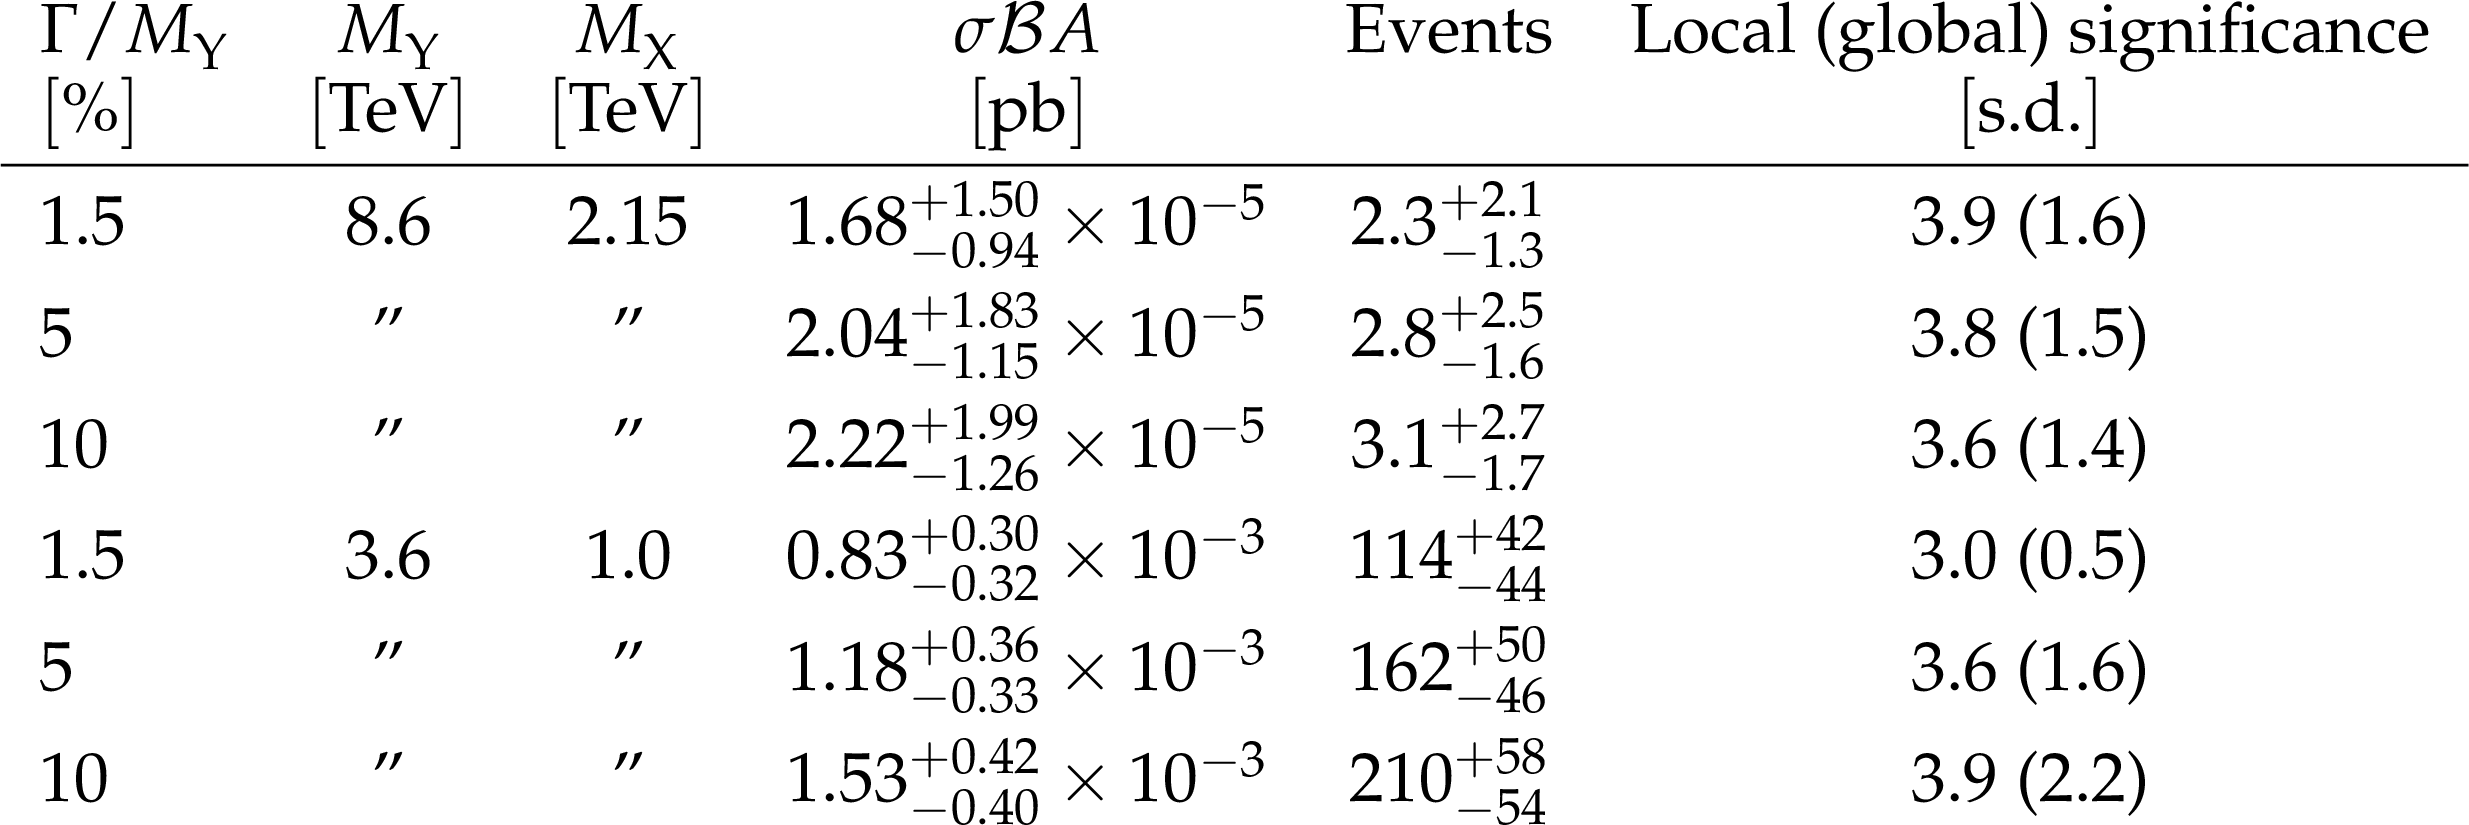
Table 2:
For each resonance width, for the two most significant resonance hypotheses found, we list the $ \mathrm{Y} $ and $ \mathrm{X} $ resonance masses, the best fit values of signal $ \sigma \mathcal{B} A $ from the signal plus background fit, the corresponding number of signal events, and the local and global significance. |
| Summary |
| A search for broad resonances, decaying to pairs of dijet resonances with equal masses, has been presented. The results are a reinterpretation of a similar narrow resonance search [1], using data corresponding to an integrated luminosity of 138 fb$ ^{-1} $, from proton-proton collisions at $ \sqrt{s}= $ 13 TeV. Empirical functions that model the background, and simulated shapes of resonance signals with widths of 1.5, 5, and 10%, are fit to the observed four-jet mass ($ m_{\mathrm{4j}} $) distributions, separated into bins of the ratio of the dijet to four-jet distributions. There are three events in the tails of the distributions, two with an $ m_{\mathrm{4j}} $ of 8 TeV and one with an $ m_{\mathrm{4j}} $ of 5.8 TeV, all of which have an average dijet mass of approximately 2 TeV, that result in an excess. Although the event with an $ m_{\mathrm{4j}} $ of 5.8 TeV contributes minimally to a fit with narrow resonances, it is far more compatible with broad resonances of the same mass. Hence, the local significance for a four-jet resonance remains above 3.6 standard deviations (s.d.) even for the largest width considered, leading to the conclusion that broad resonances are an equally valid interpretation of the excess. An event reported by the ATLAS Collaboration [2], with an $ m_{\mathrm{4j}} $ of 6.6 TeV and an $ \overline{m}_{\mathrm{2j}} $ of 2.2 TeV, falls within the CMS 68% probability contour for a 5 or 10% broad resonance with a mass of 8.4 TeV, and hence is likely compatible with those two hypotheses. A second excess with a local (global) significance of 3.9 (2.2) s.d. is observed at a four-jet resonance mass of 3.6 TeV, with an average dijet resonance mass of 1.0 TeV, for a mediator width of 10%. This excess was previously reported with local and global significances of 3.6 and 2.5 s.d., respectively, in Ref. [1], originating from the dijet data near a mass of 1 TeV, in the search for nonresonant production of pairs of dijet resonances. Model-independent upper limits at 95% confidence level are presented on the product of the cross section, branching fraction and acceptance as a function of the four-jet resonance mass between 2 and 10 TeV, for all accessible values of the ratio of the dijet to four-jet resonance masses, for widths ranging from 1.5 to 10%. Limits are compared to models [3] of diquarks, which decay to pairs of vector-like quarks, which in turn decay to a quark and a gluon. Mass limits are presented for all accessible values of the ratio of the vector-like quark to diquark masses, for the three values of diquark width considered. |
| References | ||||
| 1 | CMS Collaboration | Search for resonant and nonresonant production of pairs of dijet resonances in proton-proton collisions at $ \sqrt{s} $ = 13 TeV | JHEP 07 (2023) 161 | CMS-EXO-21-010 2206.09997 |
| 2 | ATLAS Collaboration | Pursuit of paired dijet resonances in the Run 2 dataset with ATLAS | PRD 108 (2023) 112005 | 2307.14944 |
| 3 | B. A. Dobrescu, R. M. Harris, and J. Isaacson | Ultraheavy resonances at the LHC: beyond the QCD background | 1810.09429 | |
| 4 | B. A. Dobrescu | TeV-scale particles and LHC events with dijet pairs | JHEP 06 (2025) 113 | 2411.04121 |
| 5 | B. A. Dobrescu | LHC probes of the 10 TeV scale | 1912.13155 | |
| 6 | I. Duminica et al. | Ultraheavy diquark decaying into vectorlike quarks at the LHC | PRD 111 (2025) 115025 | 2503.17031 |
| 7 | CMSnoop | none | \hrefHEPData record for this analysis, 2025 link |
|
| 8 | J. Alwall et al. | The automated computation of tree-level and next-to-leading order differential cross sections, and their matching to parton shower simulations | JHEP 07 (2014) 079 | 1405.0301 |
| 9 | T. Sjöstrand et al. | An introduction to PYTHIA 8.2 | Comput. Phys. Commun. 191 (2015) 159 | 1410.3012 |
| 10 | CMS Collaboration | Event generator tunes obtained from underlying event and multiparton scattering measurements | EPJC 76 (2016) 155 | CMS-GEN-14-001 1512.00815 |
| 11 | NNPDF Collaboration | Parton distributions for the LHC Run II | JHEP 04 (2015) 040 | 1410.8849 |
| 12 | CMS Collaboration | The CMS experiment at the CERN LHC | JINST 3 (2008) S08004 | |
| 13 | GEANT4 Collaboration | GEANT4 --- a simulation toolkit | Nucl. Instr. Meth. A 506 (2003) 250 | |
| 14 | CMS Collaboration | Search for narrow and broad dijet resonances in proton-proton collisions at $ \sqrt{s}= $ 13 TeV and constraints on dark matter mediators and other new particles | JHEP 08 (2018) 130 | CMS-EXO-16-056 1806.00843 |
| 15 | CMS Collaboration | Search for dijet resonances in proton-proton collisions at $ \sqrt{s} $ = 13 TeV and constraints on dark matter and other models | PLB 769 (2017) 520 | CMS-EXO-16-032 1611.03568 |
| 16 | CMS Collaboration | Search for narrow resonances in dijet final states at $ \sqrt{s}= $ 8 TeV with the novel CMS technique of data scouting | PRL 117 (2016) 031802 | CMS-EXO-14-005 1604.08907 |
| 17 | CMS Collaboration | Search for narrow resonances decaying to dijets in proton-proton collisions at $ \sqrt{s} = $ 13 TeV | PRL 116 (2016) 071801 | CMS-EXO-15-001 1512.01224 |
| 18 | CMS Collaboration | Search for dijet resonances in 7 TeV pp collisions at CMS | [Erratum \DOI10.1103/PhysRevLett.106.02], 2010 PRL 105 (2010) 211801 |
CMS-EXO-10-010 1010.0203 |
| 19 | CMS Collaboration | Search for resonances in the dijet mass spectrum from 7 TeV pp collisions at CMS | PLB 704 (2011) 123 | CMS-EXO-11-015 1107.4771 |
| 20 | CMS Collaboration | Search for narrow resonances and quantum black holes in inclusive and b-tagged dijet mass spectra from pp collisions at $ \sqrt{s}= $ 7 TeV | JHEP 01 (2013) 013 | CMS-EXO-11-094 1210.2387 |
| 21 | CMS Collaboration | Search for narrow resonances using the dijet mass spectrum in pp collisions at $ \sqrt{s} $ = 8 TeV | PRD 87 (2013) 114015 | CMS-EXO-12-016 1302.4794 |
| 22 | CMS Collaboration | Search for resonances and quantum black holes using dijet mass spectra in proton-proton collisions at $ \sqrt{s} = $ 8 TeV | PRD 91 (2015) 052009 | CMS-EXO-12-059 1501.04198 |
| 23 | ATLAS Collaboration | Search for new phenomena in dijet mass and angular distributions from pp collisions at $ \sqrt{s}= $ 13 TeV with the ATLAS detector | PLB 754 (2016) 302 | 1512.01530 |
| 24 | ATLAS Collaboration | Search for new particles in two-jet final states in 7 TeV proton-proton collisions with the ATLAS detector at the LHC | PRL 105 (2010) 161801 | 1008.2461 |
| 25 | ATLAS Collaboration | Search for new physics in dijet mass and angular distributions in $ pp $ collisions at $ \sqrt{s} = $ 7 TeV measured with the ATLAS detector | New J. Phys. 13 (2011) 053044 | 1103.3864 |
| 26 | ATLAS Collaboration | Search for new physics in the dijet mass distribution using 1 fb$ ^{-1} $ of $ pp $ collision data at $ \sqrt{s} $ = 7 TeV collected by the ATLAS detector | PLB 708 (2012) 37 | 1108.6311 |
| 27 | ATLAS Collaboration | ATLAS search for new phenomena in dijet mass and angular distributions using pp collisions at $ \sqrt{s}= $ 7 TeV | JHEP 01 (2013) 029 | 1210.1718 |
| 28 | ATLAS Collaboration | Search for new phenomena in the dijet mass distribution using pp collision data at $ \sqrt{s}= $ 8 TeV with the ATLAS detector | PRD 91 (2015) 052007 | 1407.1376 |
| 29 | CDF Collaboration | Search for new particles decaying into dijets in proton-antiproton collisions at $ \sqrt{s} = $ 1.96 TeV | PRD 79 (2009) 112002 | 0812.4036 |
| 30 | E. Gross and O. Vitells | Trial factors for the look elsewhere effect in high energy physics | \hrefhttp://www.arXiv.org/abs/.1891v3\textttarXiv:.1891v3, 2010 EPJC 70 (2010) 525 |
|
| 31 | P. D. Dauncey, M. Kenzie, N. Wardle, and G. J. Davies | Handling uncertainties in background shapes: the discrete profiling method | JINST 10 (2015) P04015 | 1408.6865 |
| 32 | CMS Collaboration | The CMS statistical analysis and combination tool: Combine | Comput. Softw. Big Sci. 8 (2024) 19 | CMS-CAT-23-001 2404.06614 |
| 33 | T. Junk | Confidence level computation for combining searches with small statistics | Nucl. Instr. Meth. A 434 (1999) 435 | hep-ex/9902006 |
| 34 | A. L. Read | Presentation of search results: the $ \text{CL}_\text{s} $ technique | JPG 28 (2002) 2693 | |
| 35 | ATLAS and CMS Collaborations, and LHC Higgs Combination Group | Procedure for the LHC Higgs boson search combination in summer 2011 | Technical Report CMS-NOTE-2011-005, ATL-PHYS-PUB-2011-11, . \urlhttps://cds.cern.ch/record/1379837, 2011 | |
| 36 | G. Cowan, K. Cranmer, E. Gross, and O. Vitells | Asymptotic formulae for likelihood-based tests of new physics | EPJC 71 (2011) 1554 | 1007.1727 |
| 37 | A. Crivellin, C. A. Manzari, B. Mellado, and S.-E. Dahbi | Consistency and interpretation of the LHC dijet excesses | PRD 107 (2023) 054045 | 2208.12254 |
|
|
Compact Muon Solenoid LHC, CERN |
|

|

|

|

|

|