

Compact Muon Solenoid
LHC, CERN
| CMS-BPH-24-011 ; CERN-EP-2025-162 | ||
| First exclusive reconstruction of the $ \mathrm{B}^{*+} $, $ \mathrm{B}^{*0} $, and $ \mathrm{B}_{s}^{*0} $ mesons and precise measurement of their masses | ||
| CMS Collaboration | ||
| 6 August 2025 | ||
| Phys. Rev. Lett. 136 (2026) 031902 | ||
| Abstract: Using proton-proton collision data collected by the CMS experiment at $ \sqrt{s}= $ 13 TeV in 2016-2018, corresponding to an integrated luminosity of 140 fb$^{-1}$, the first full reconstruction of the three vector $ {\mathrm{B}} $ meson states, $ \mathrm{B}^{*+} $, $ \mathrm{B}^{*0} $, and $ \mathrm{B}_{s}^{*0} $, is performed. The mass differences between the excited mesons and their corresponding ground states are measured to be $ m(\mathrm{B}^{*+})-m({\mathrm{B}^{+}}) = $ 45.277 $ \pm $ 0.039 $ \pm $ 0.027 MeV, $ m(\mathrm{B}^{*0})-m({\mathrm{B}^0}) = $ 45.471 $ \pm $ 0.056 $ \pm $ 0.028 MeV, and $ m(\mathrm{B}_{s}^{*0})-m(\mathrm{B}_{s}^{0}) = $ 49.407 $ \pm $ 0.132 $ \pm $ 0.041 MeV, where the first uncertainties are statistical and the second are systematic. These results improve on the precision of previous measurements by an order of magnitude. | ||
| Links: e-print arXiv:2508.05820 [hep-ex] (PDF) ; CDS record ; inSPIRE record ; HepData record ; Physics Briefing ; CADI line (restricted) ; | ||
| Figures | |
png pdf |
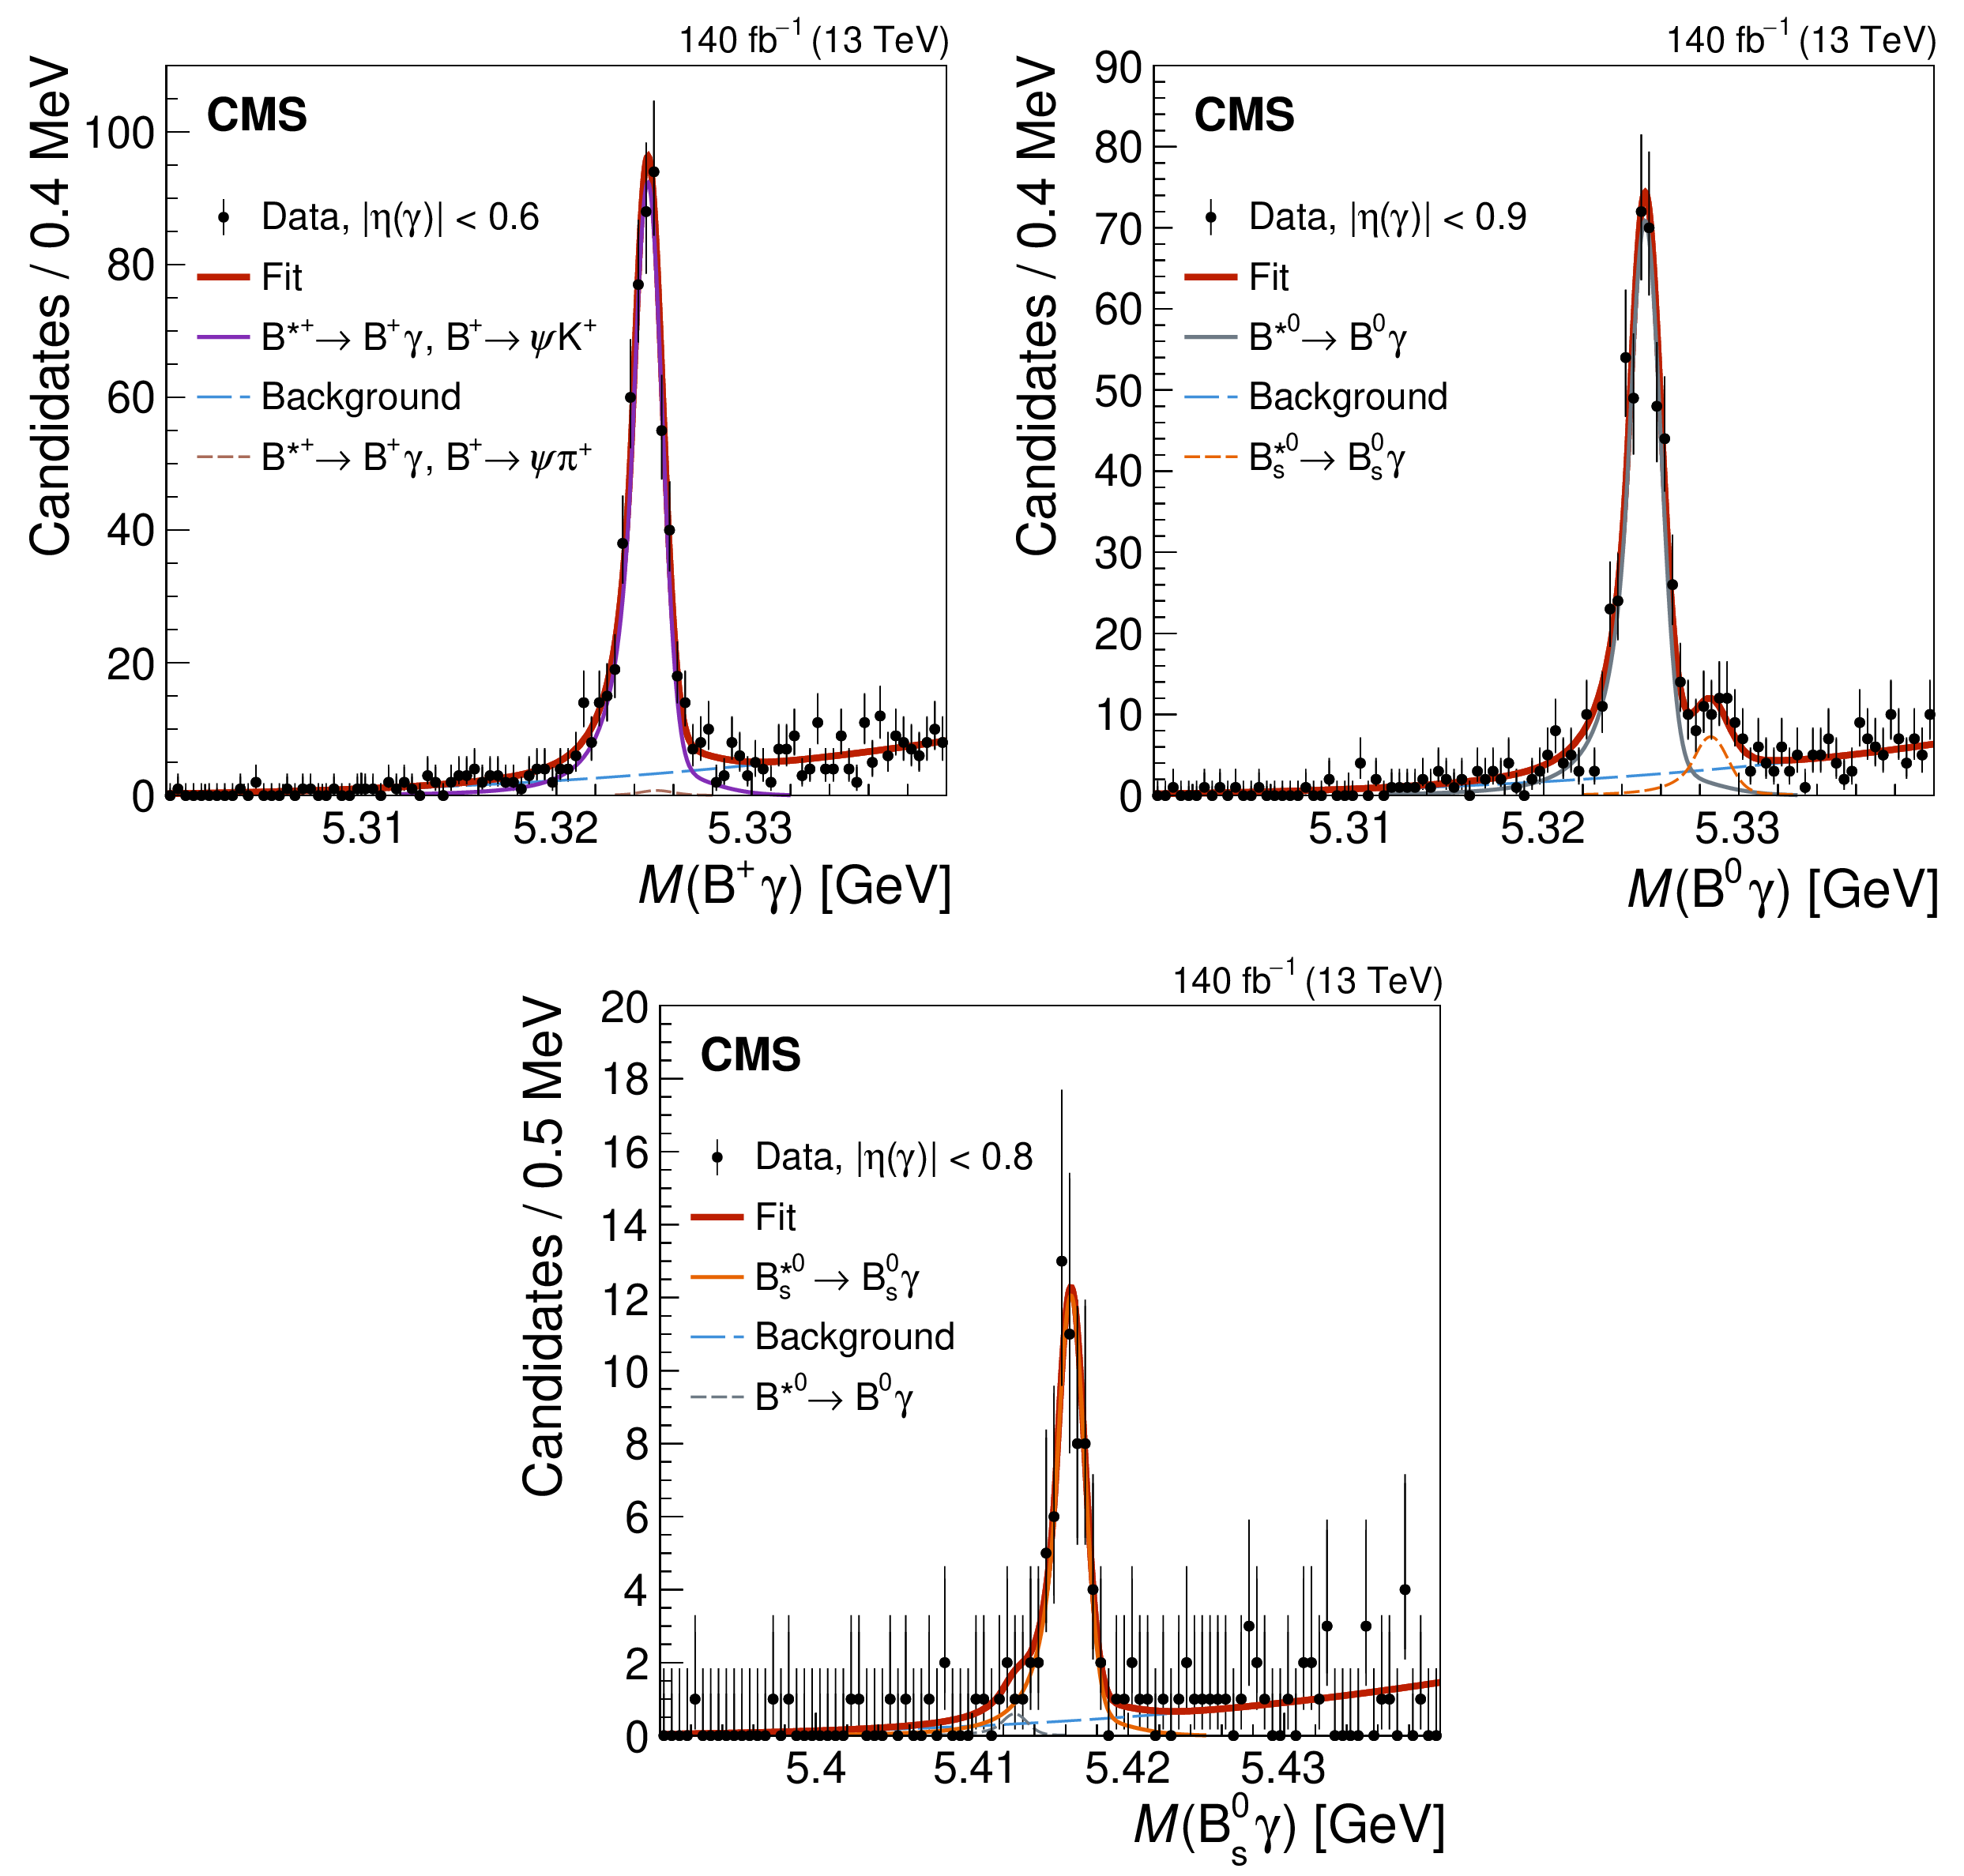
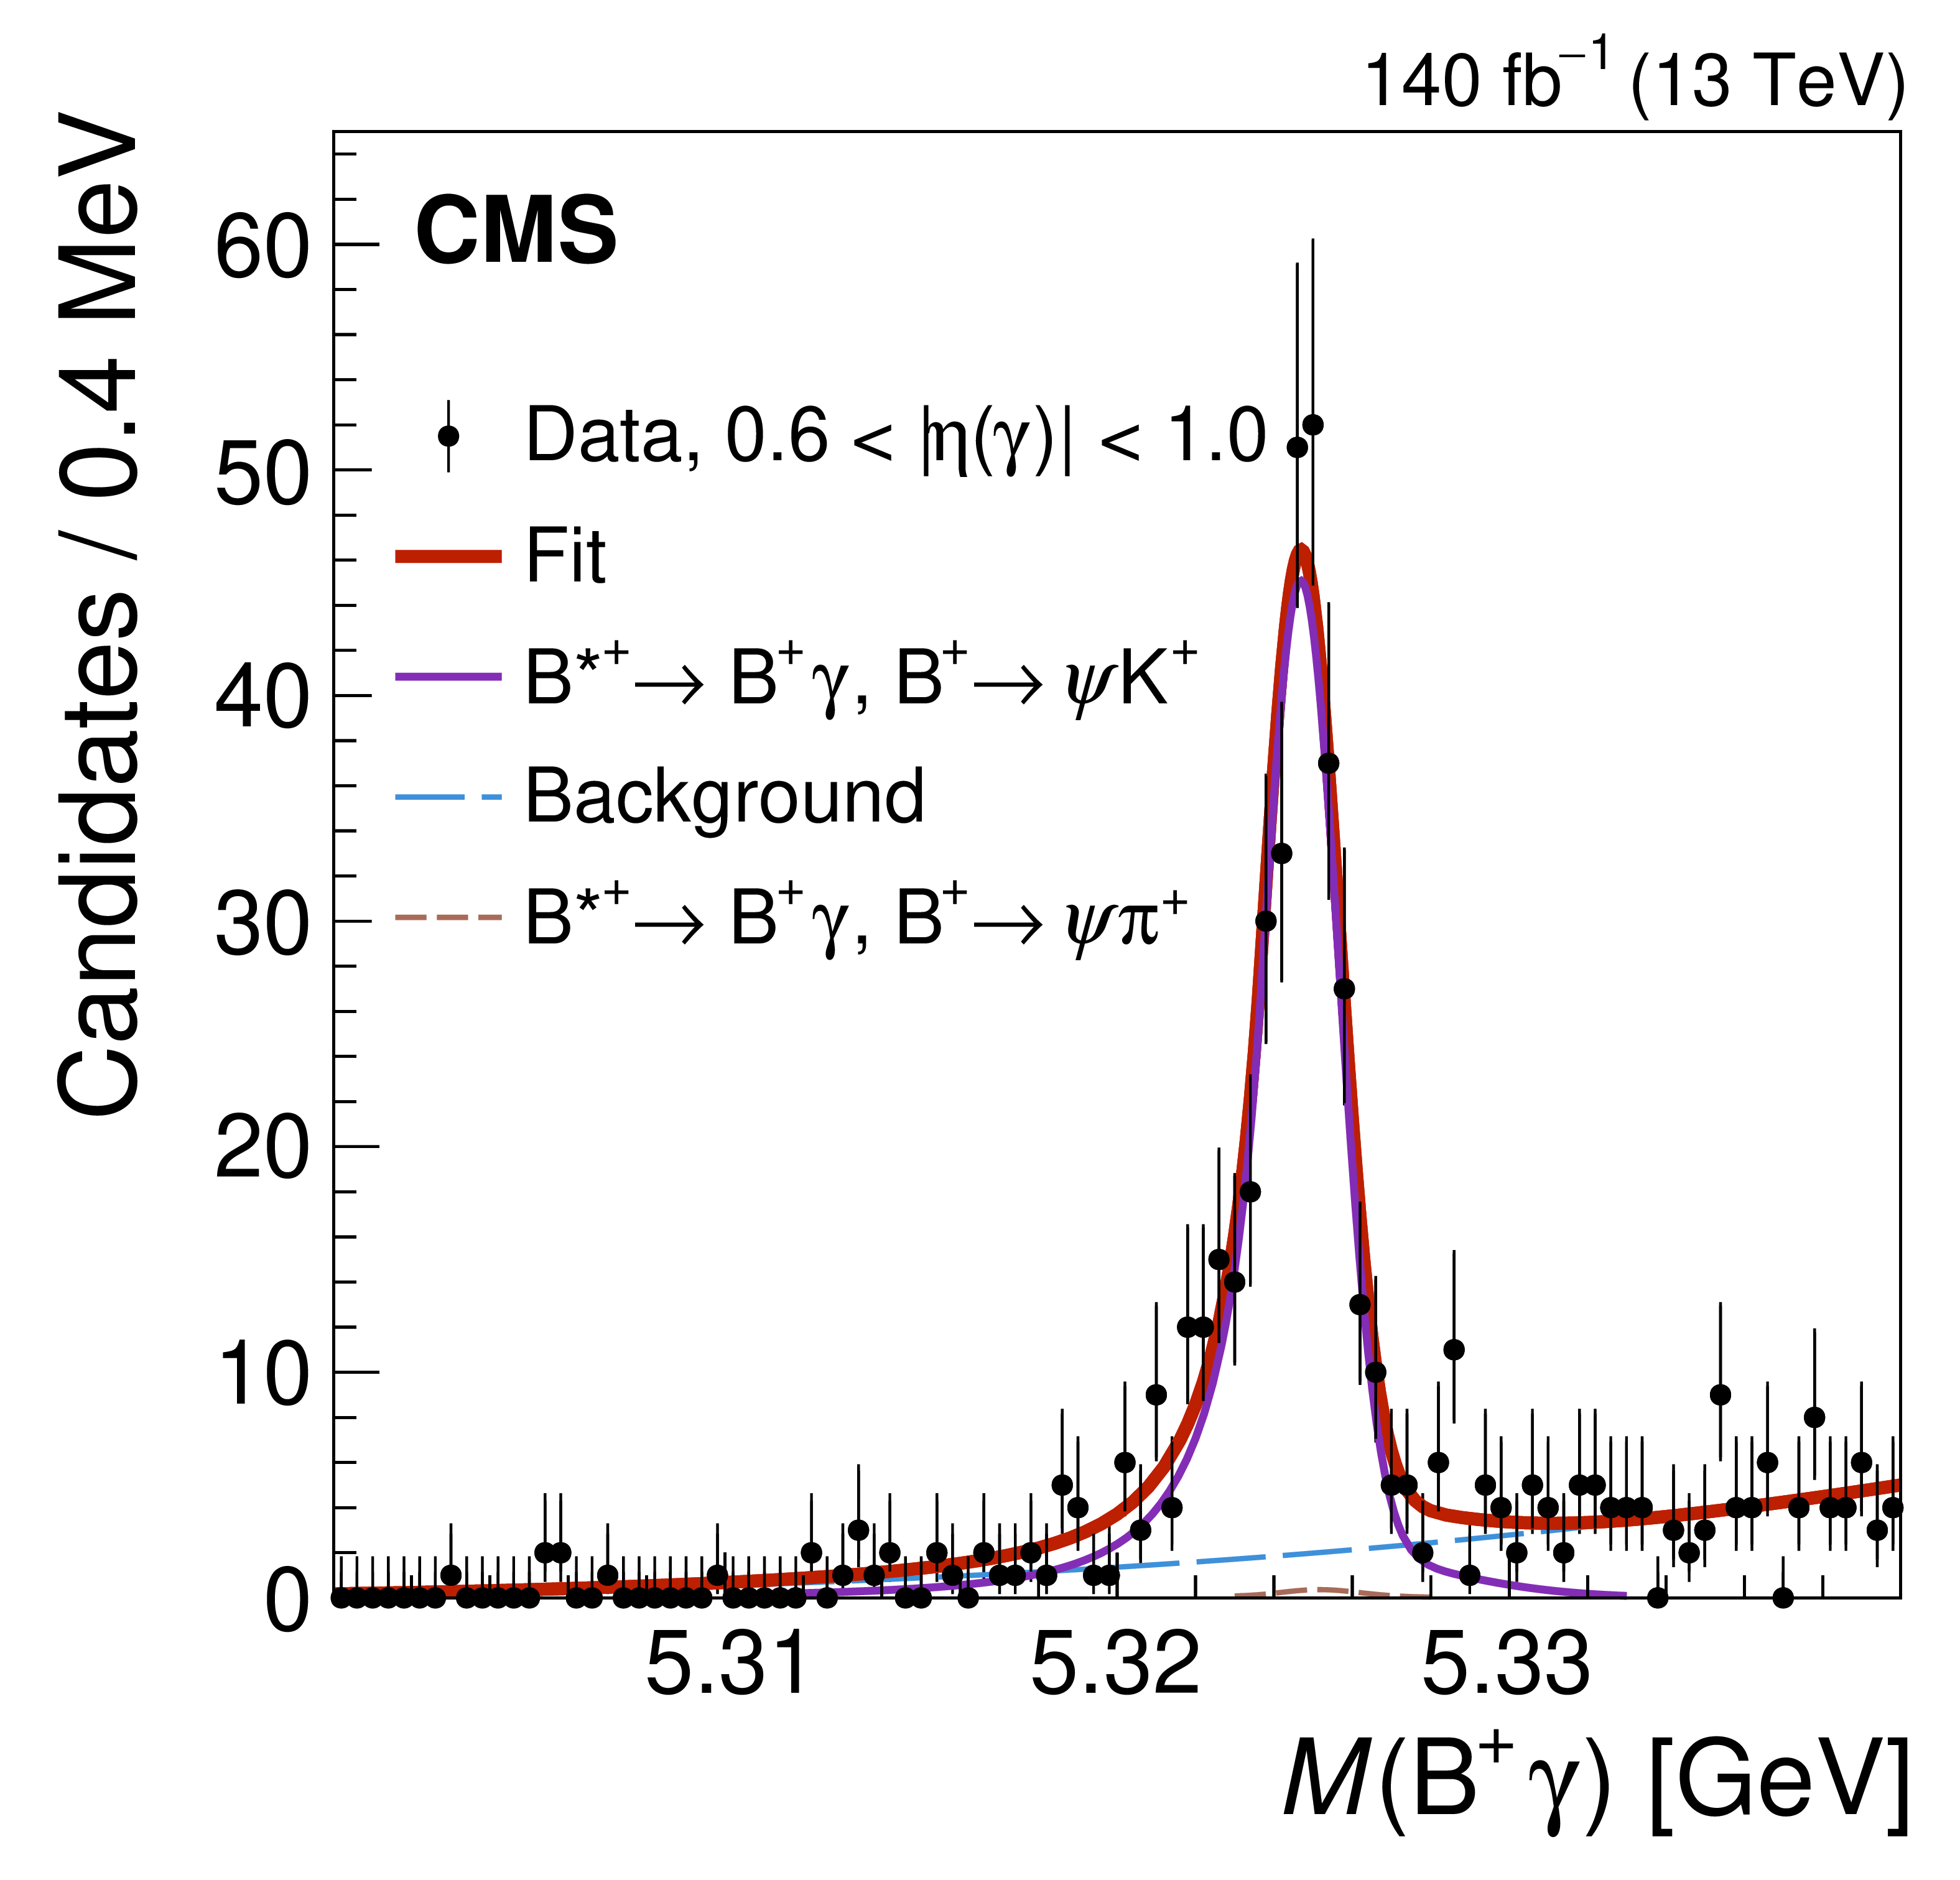
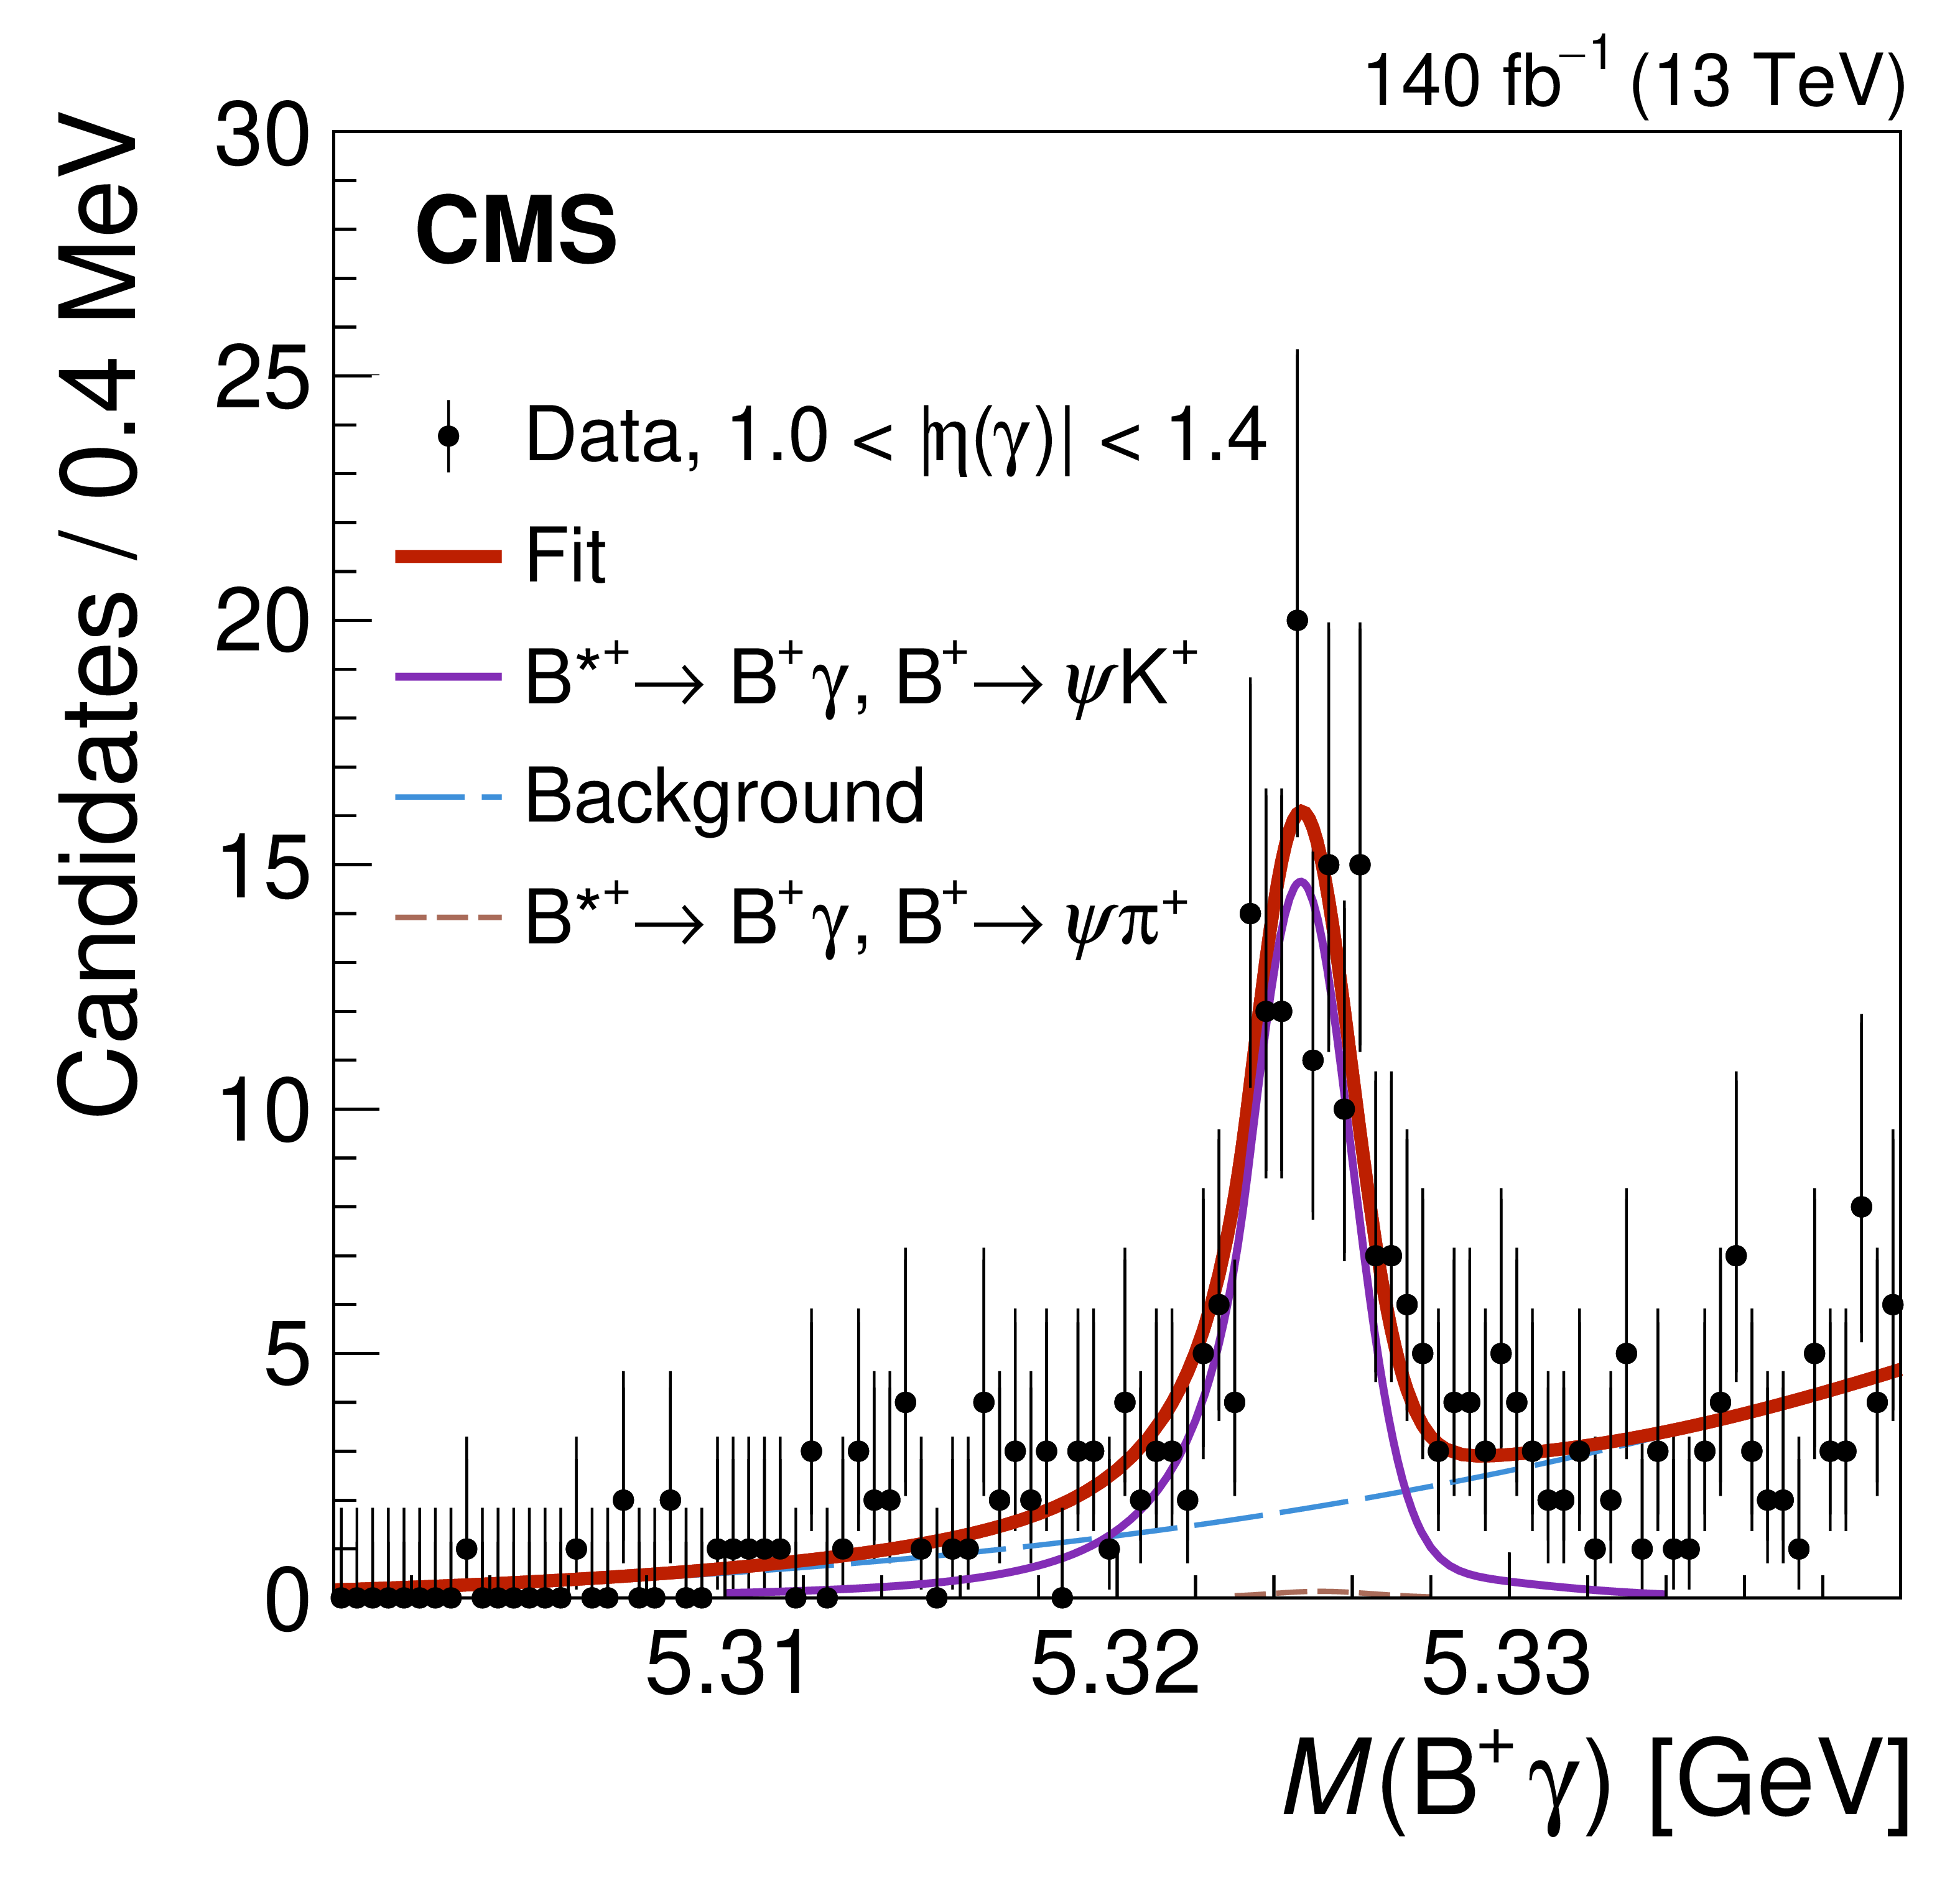
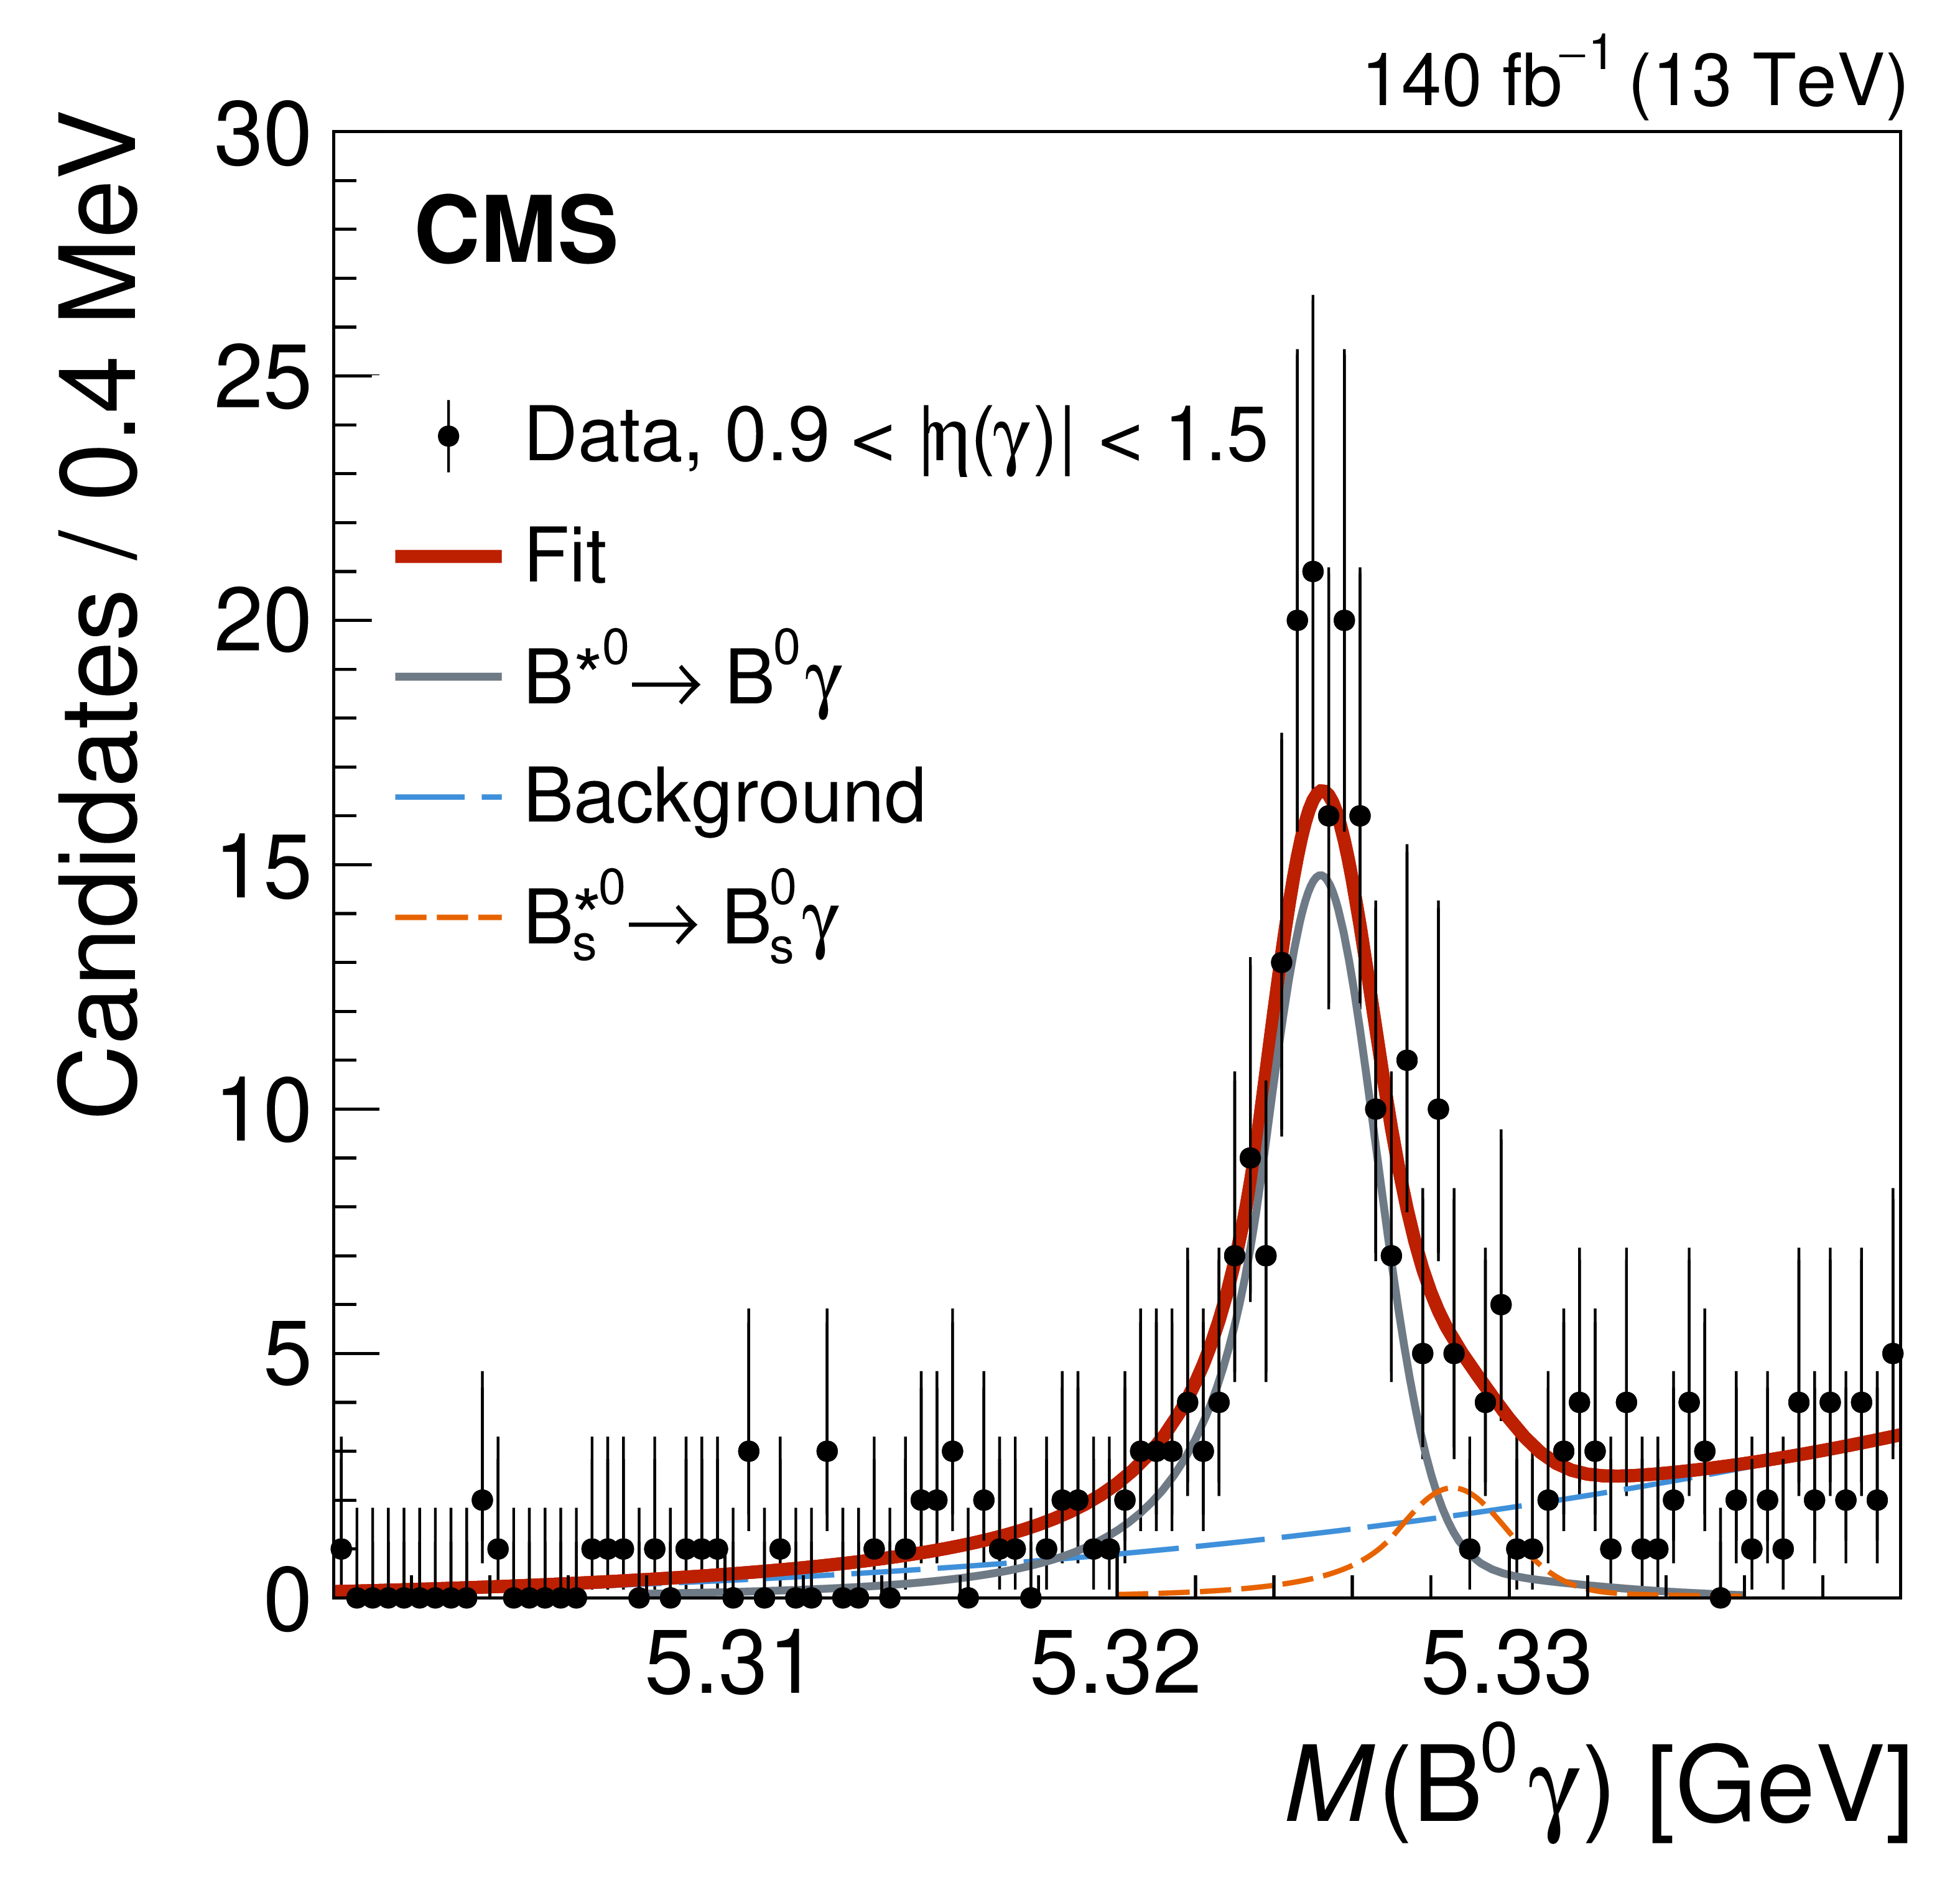
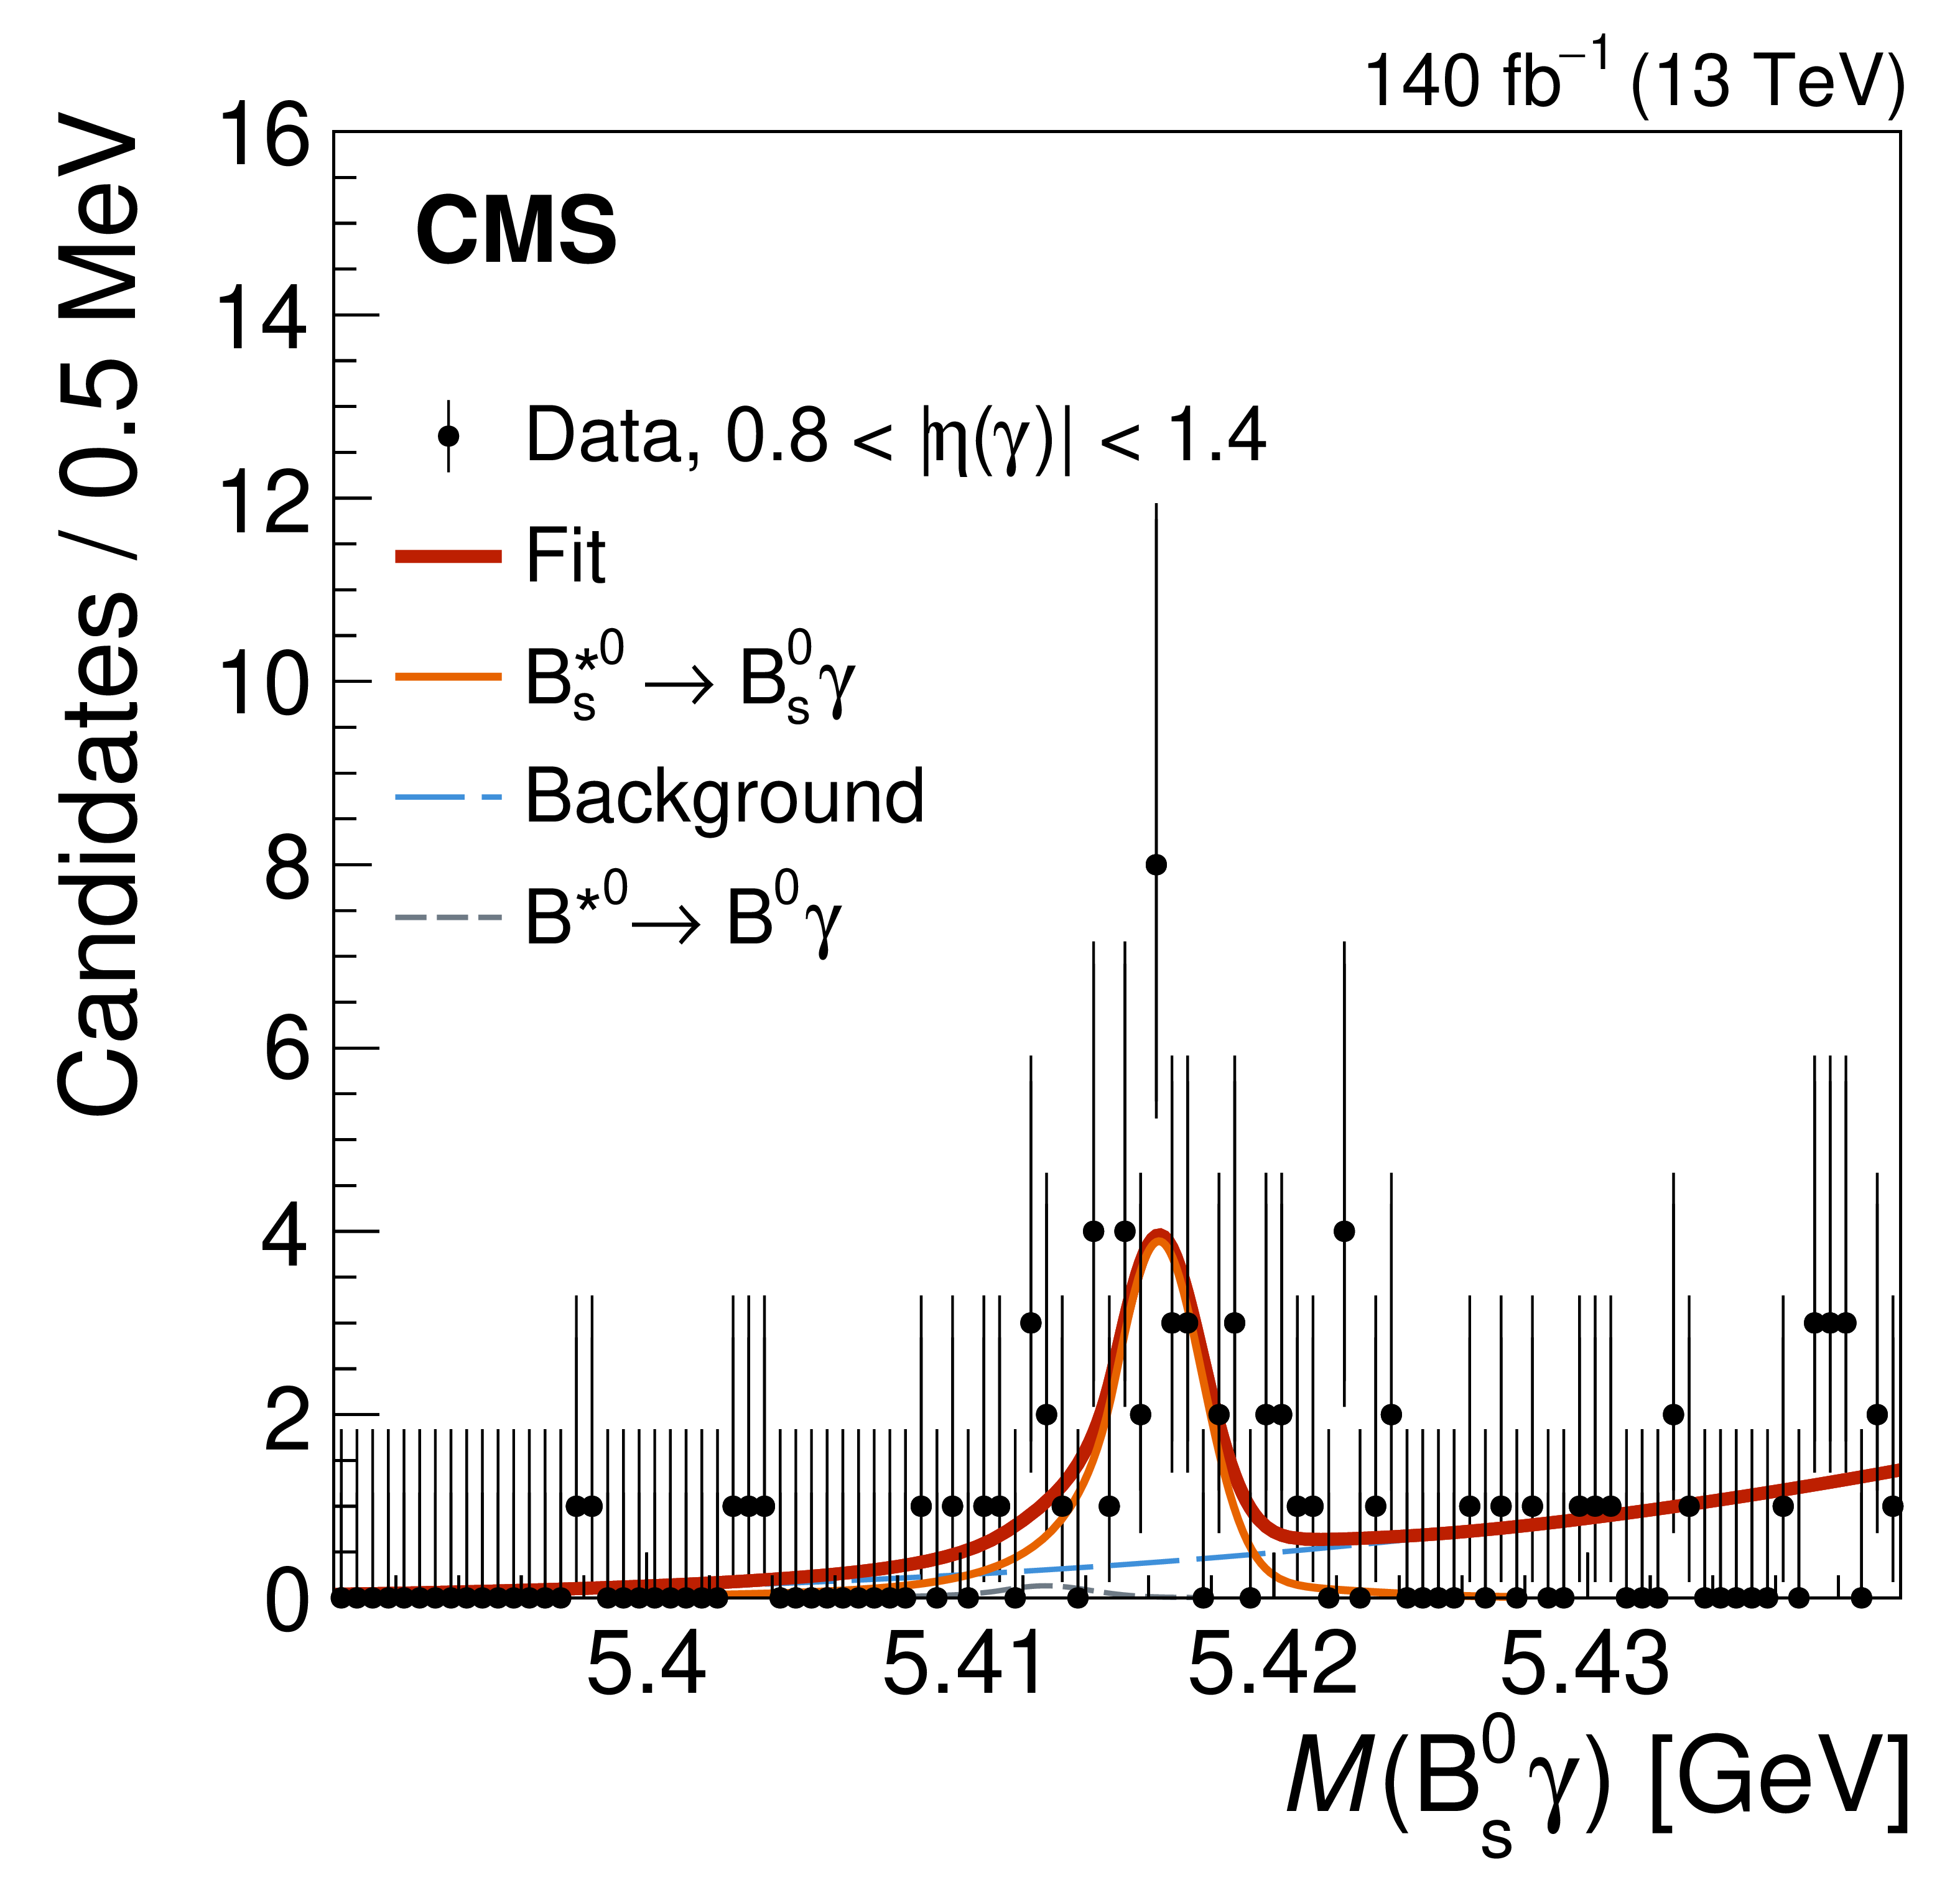
Figure 1:
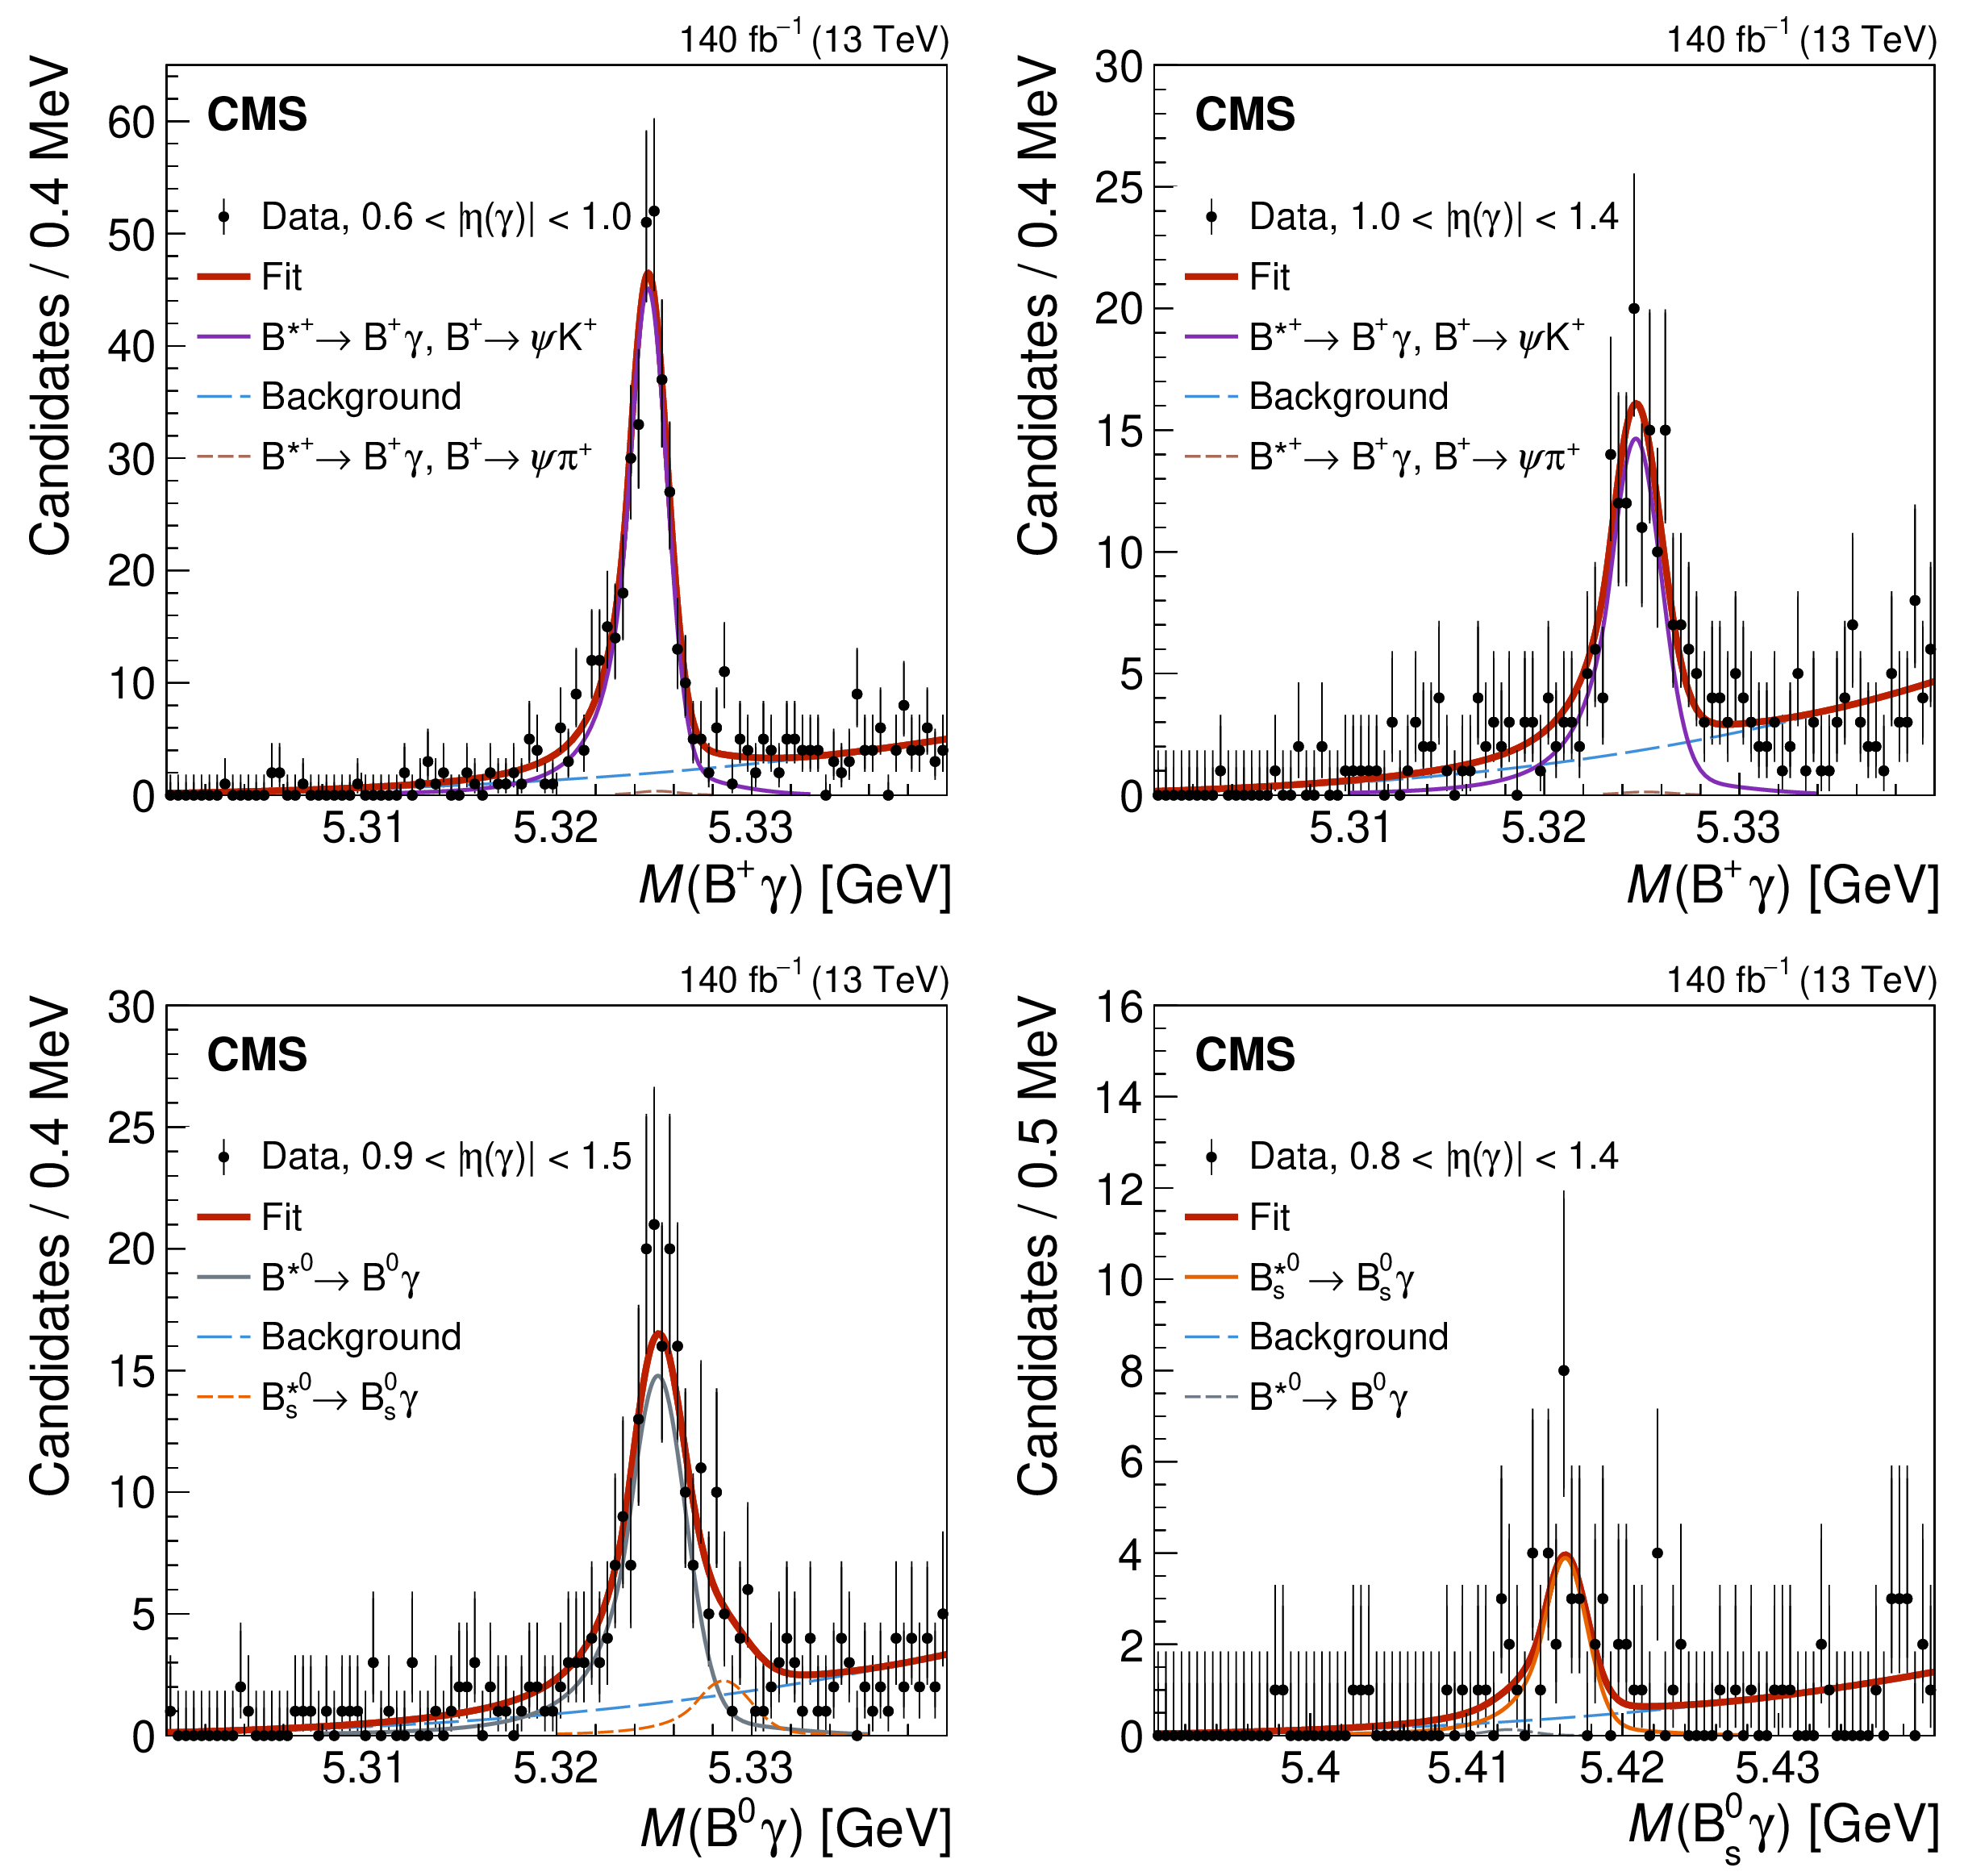
The measured distributions (filled circles) of the $ {\mathrm{B}^{+}}\gamma $ (upper left), $ {\mathrm{B}^0}\gamma $ (upper right), and $ \mathrm{B}_{s}^{0}\gamma $ (lower) invariant mass in the lowest $ |\eta(\gamma)| $ range, which has the best invariant mass resolution. The simultaneous fit projections are shown with thick red lines, and the other components are described in the legends. The error bars represent statistical uncertainties in data. |
png pdf |
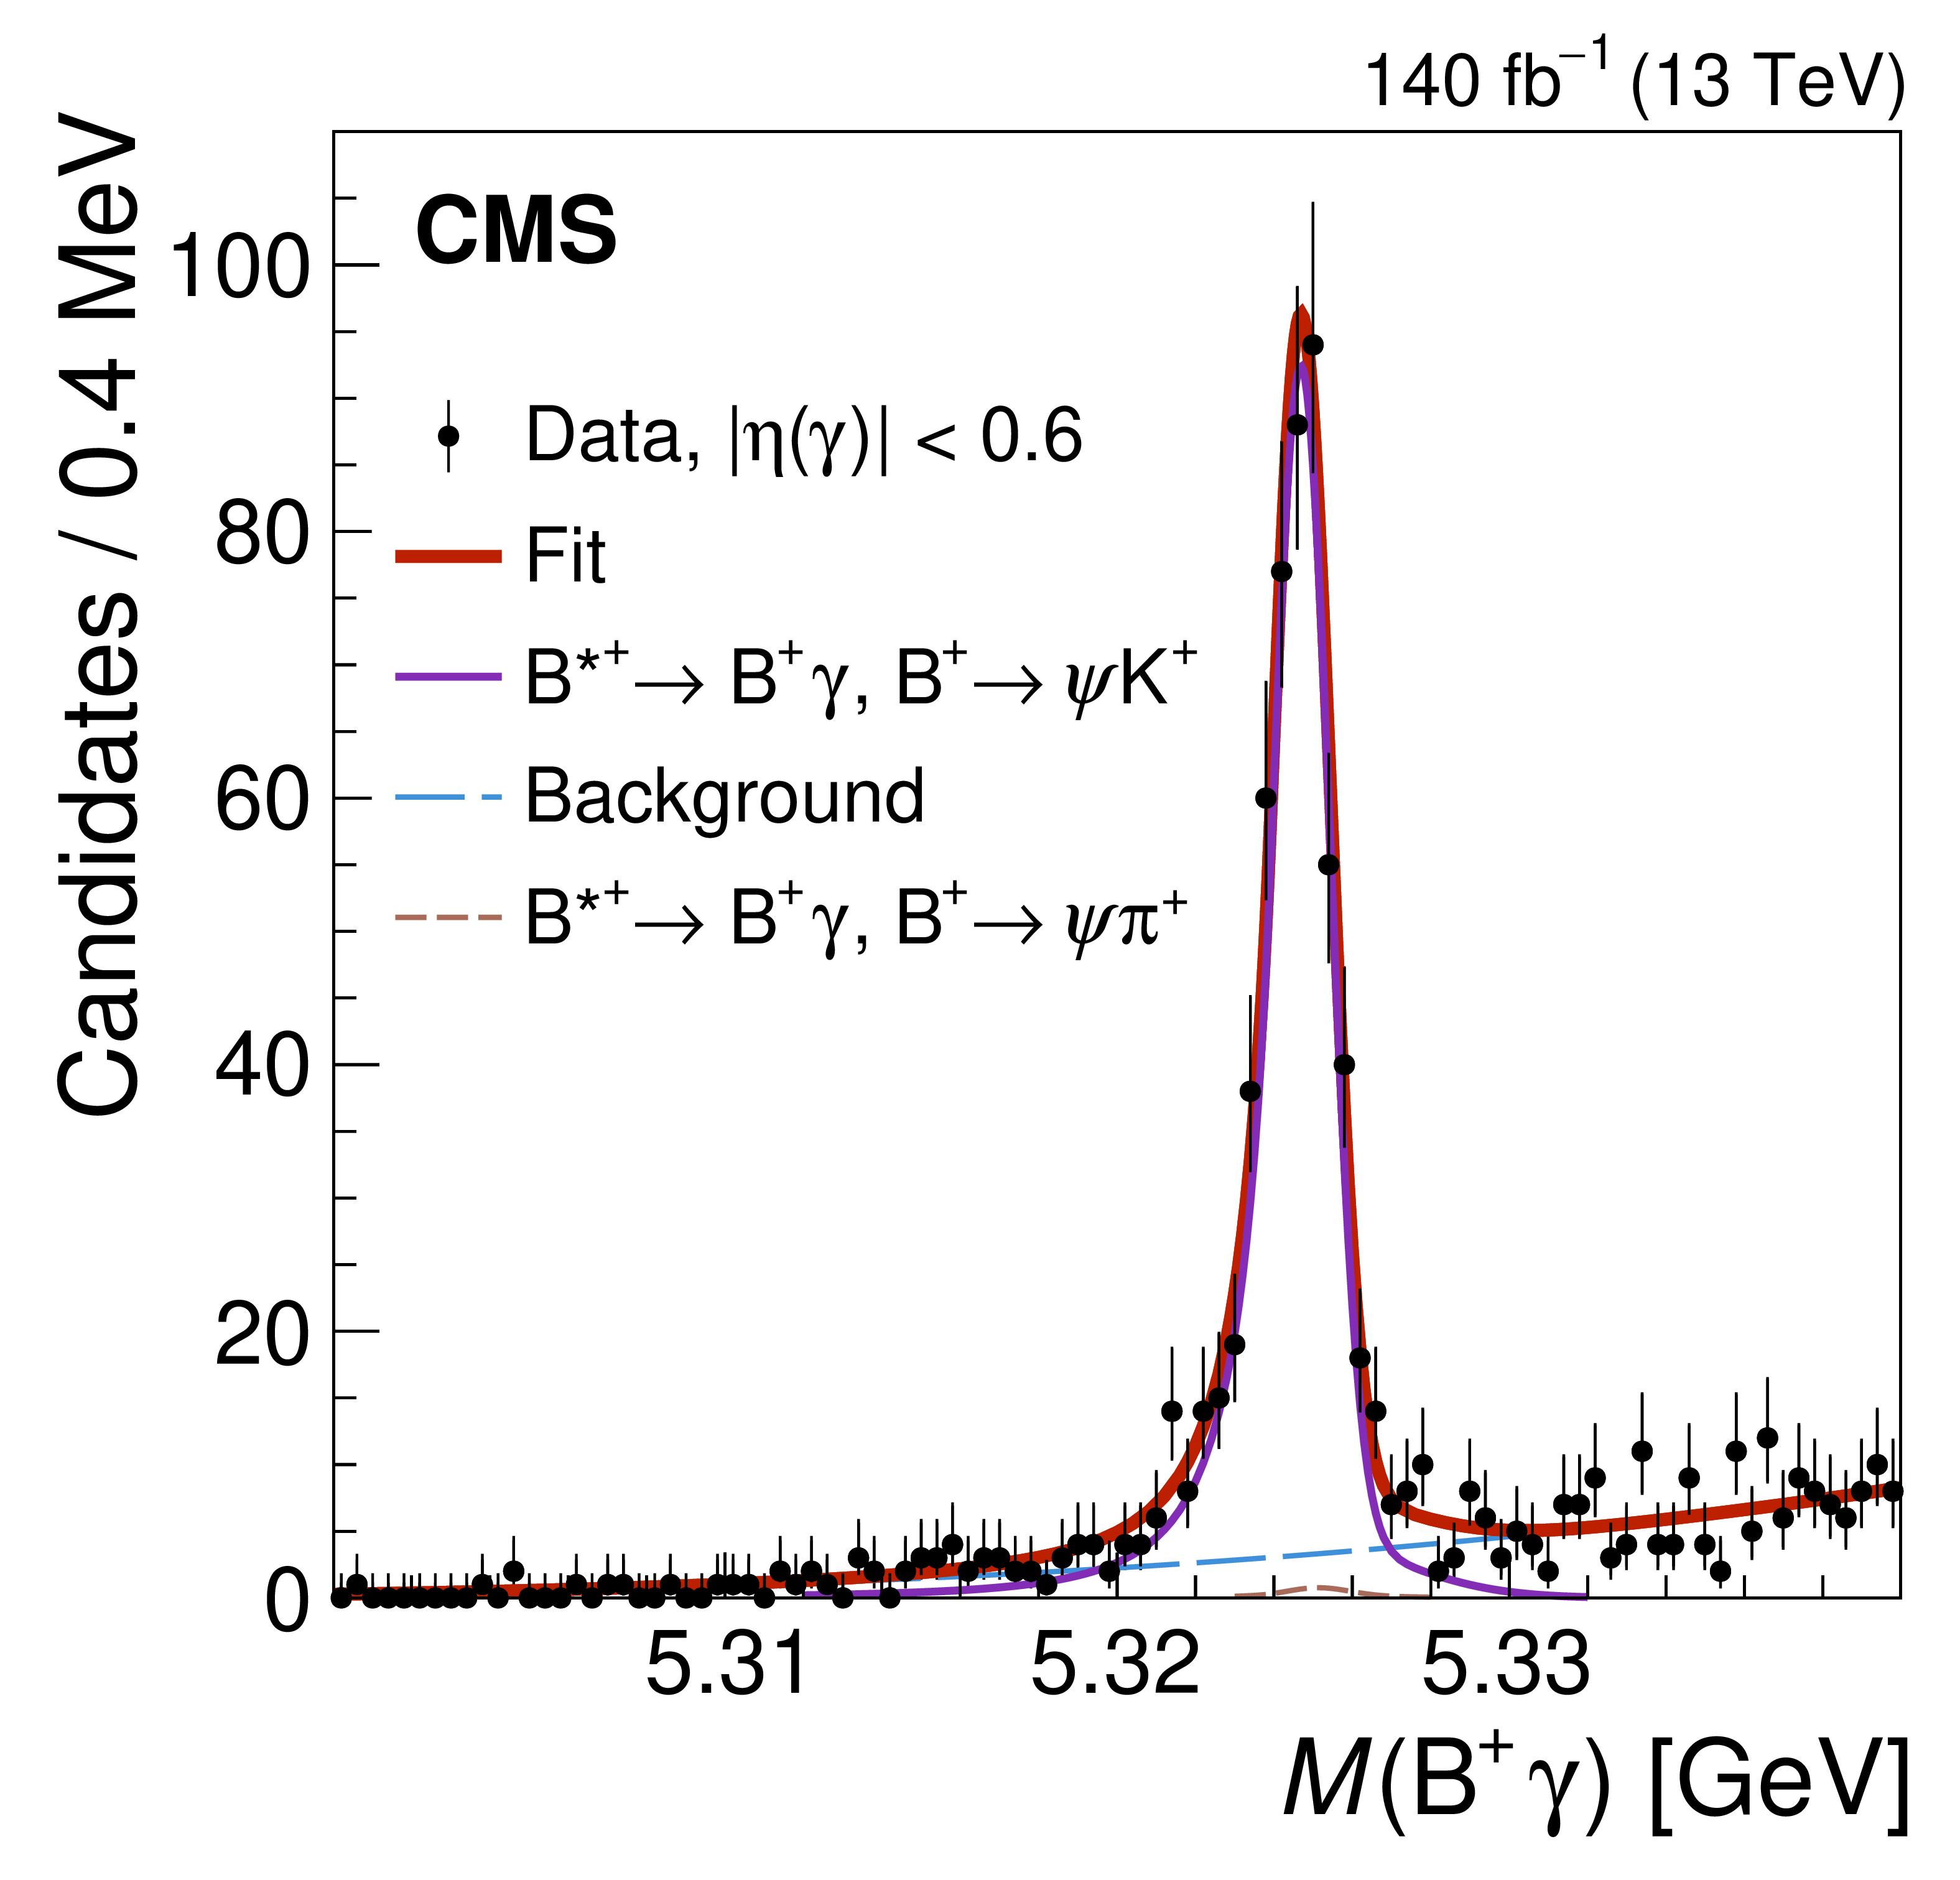
Figure 1-a:
The measured distributions (filled circles) of the $ {\mathrm{B}^{+}}\gamma $ (upper left), $ {\mathrm{B}^0}\gamma $ (upper right), and $ \mathrm{B}_{s}^{0}\gamma $ (lower) invariant mass in the lowest $ |\eta(\gamma)| $ range, which has the best invariant mass resolution. The simultaneous fit projections are shown with thick red lines, and the other components are described in the legends. The error bars represent statistical uncertainties in data. |
png pdf |
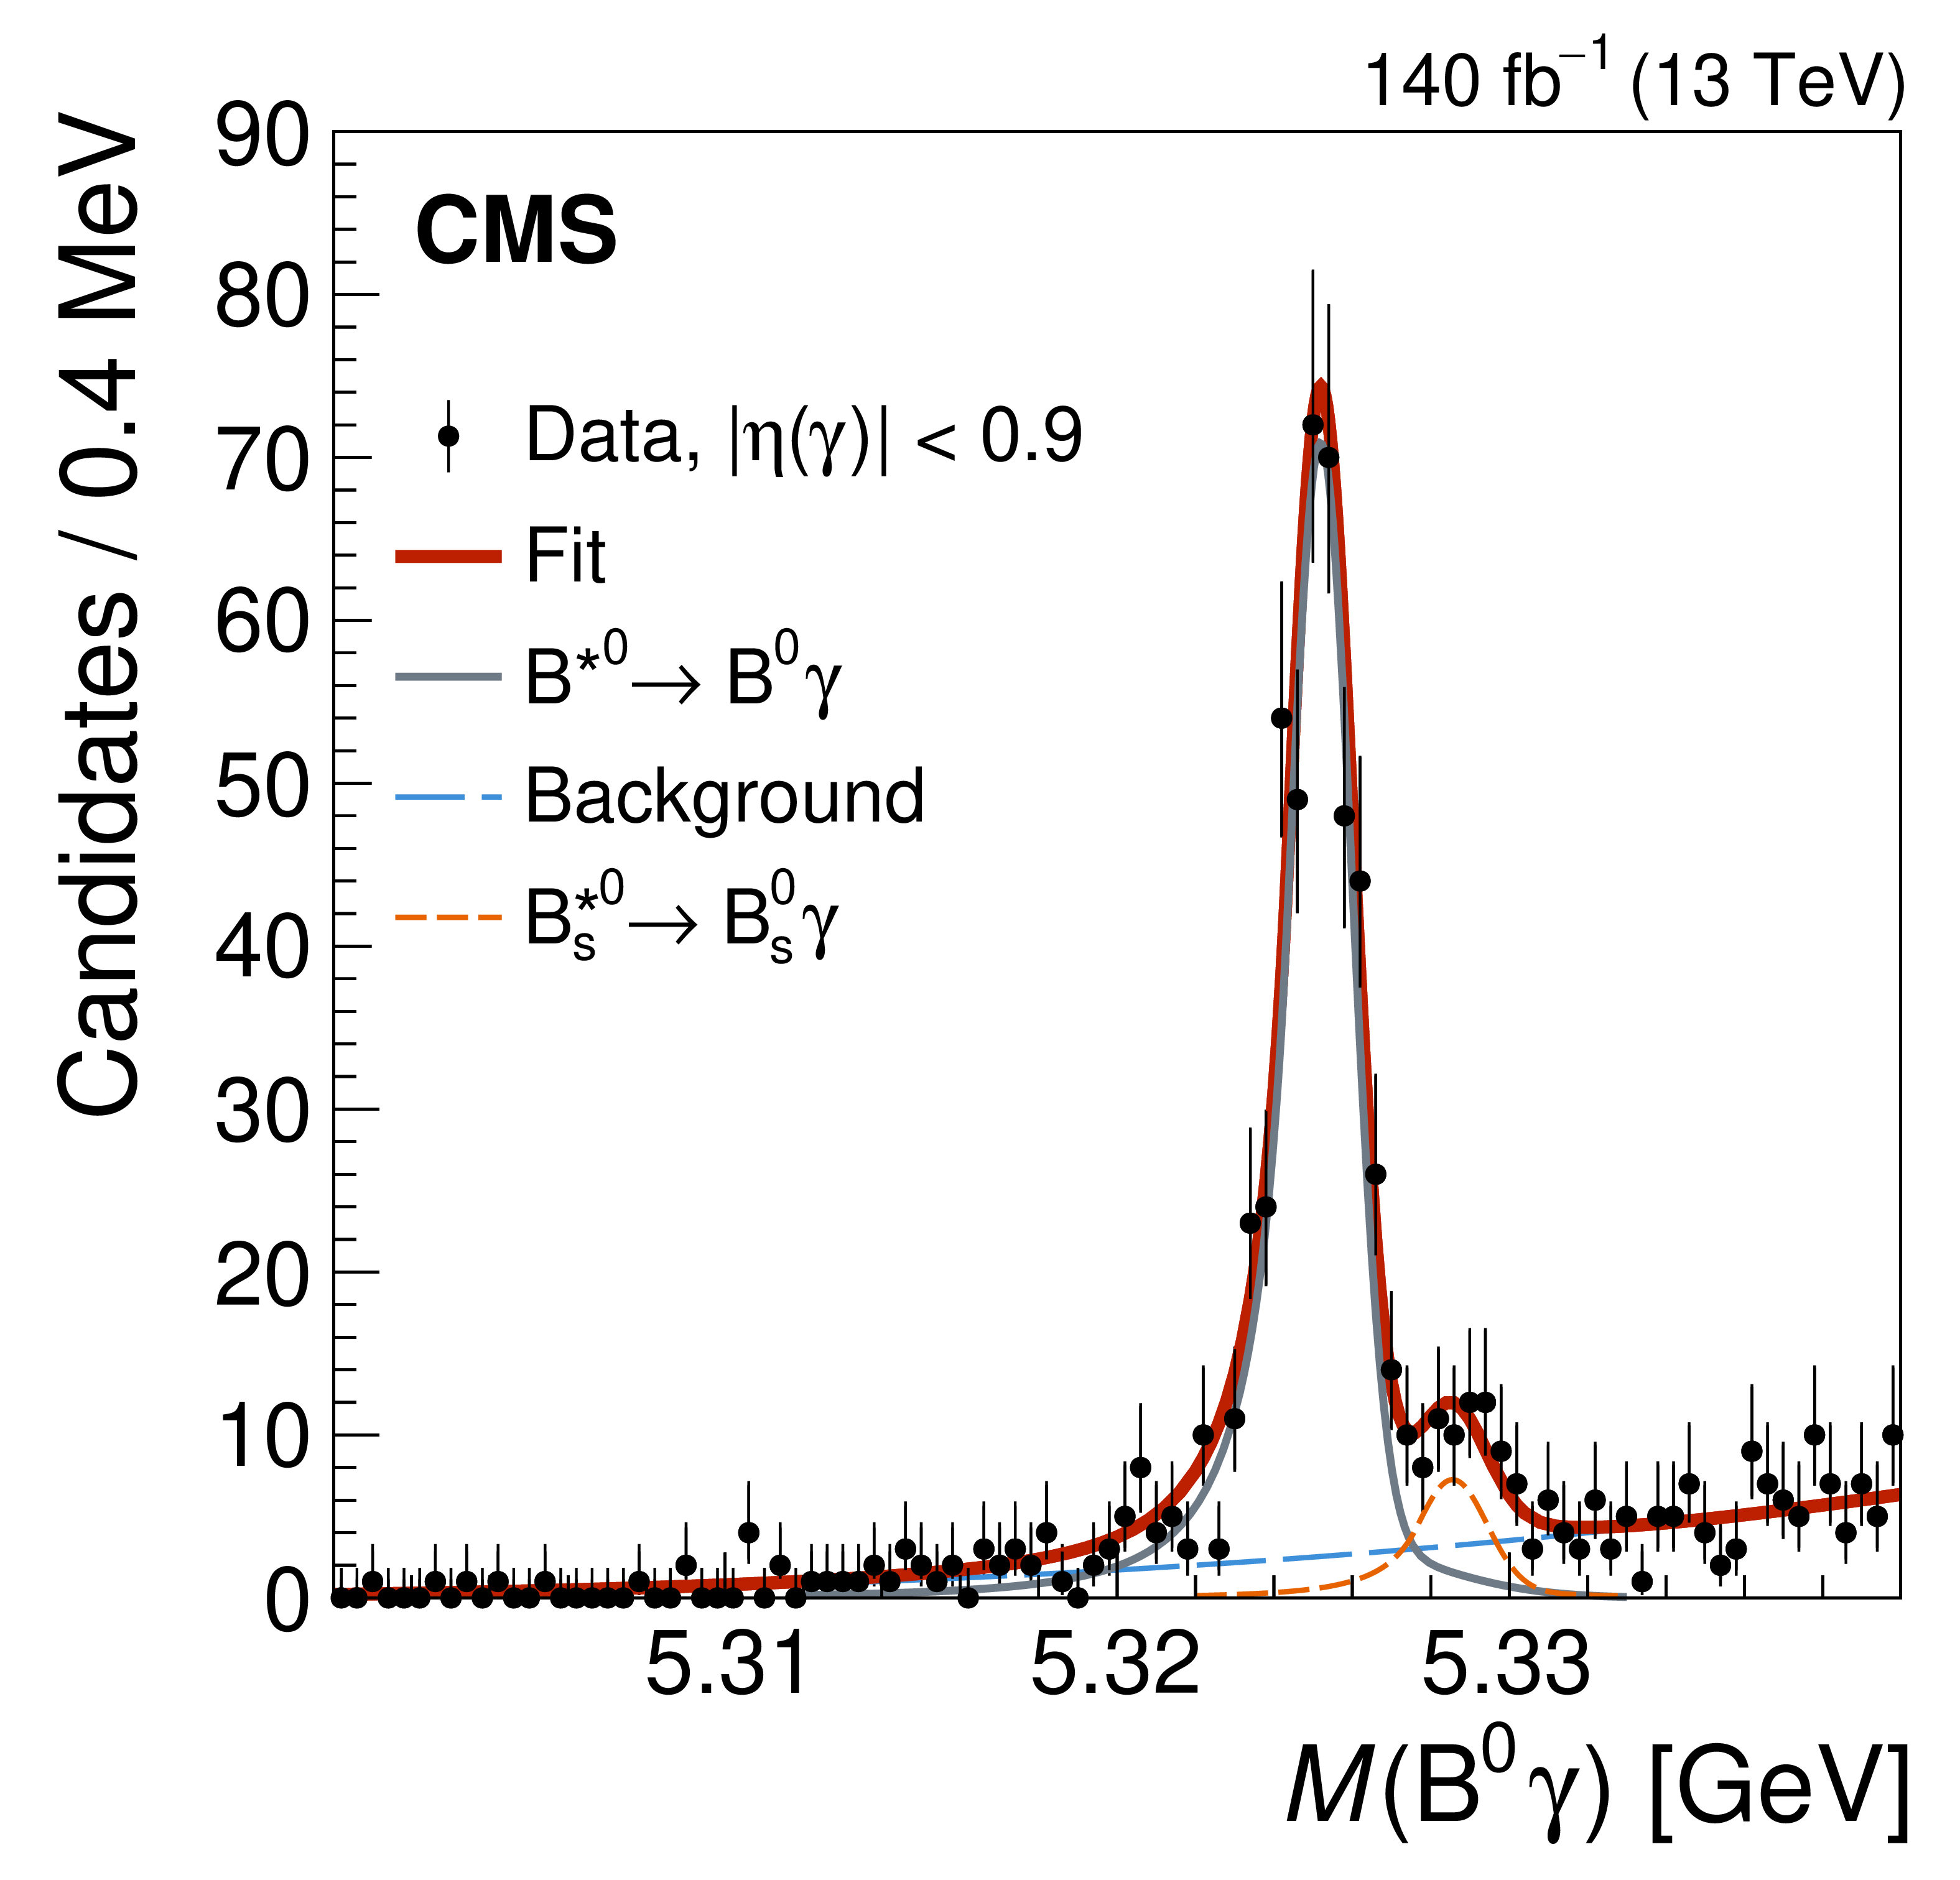
Figure 1-b:
The measured distributions (filled circles) of the $ {\mathrm{B}^{+}}\gamma $ (upper left), $ {\mathrm{B}^0}\gamma $ (upper right), and $ \mathrm{B}_{s}^{0}\gamma $ (lower) invariant mass in the lowest $ |\eta(\gamma)| $ range, which has the best invariant mass resolution. The simultaneous fit projections are shown with thick red lines, and the other components are described in the legends. The error bars represent statistical uncertainties in data. |
png pdf |
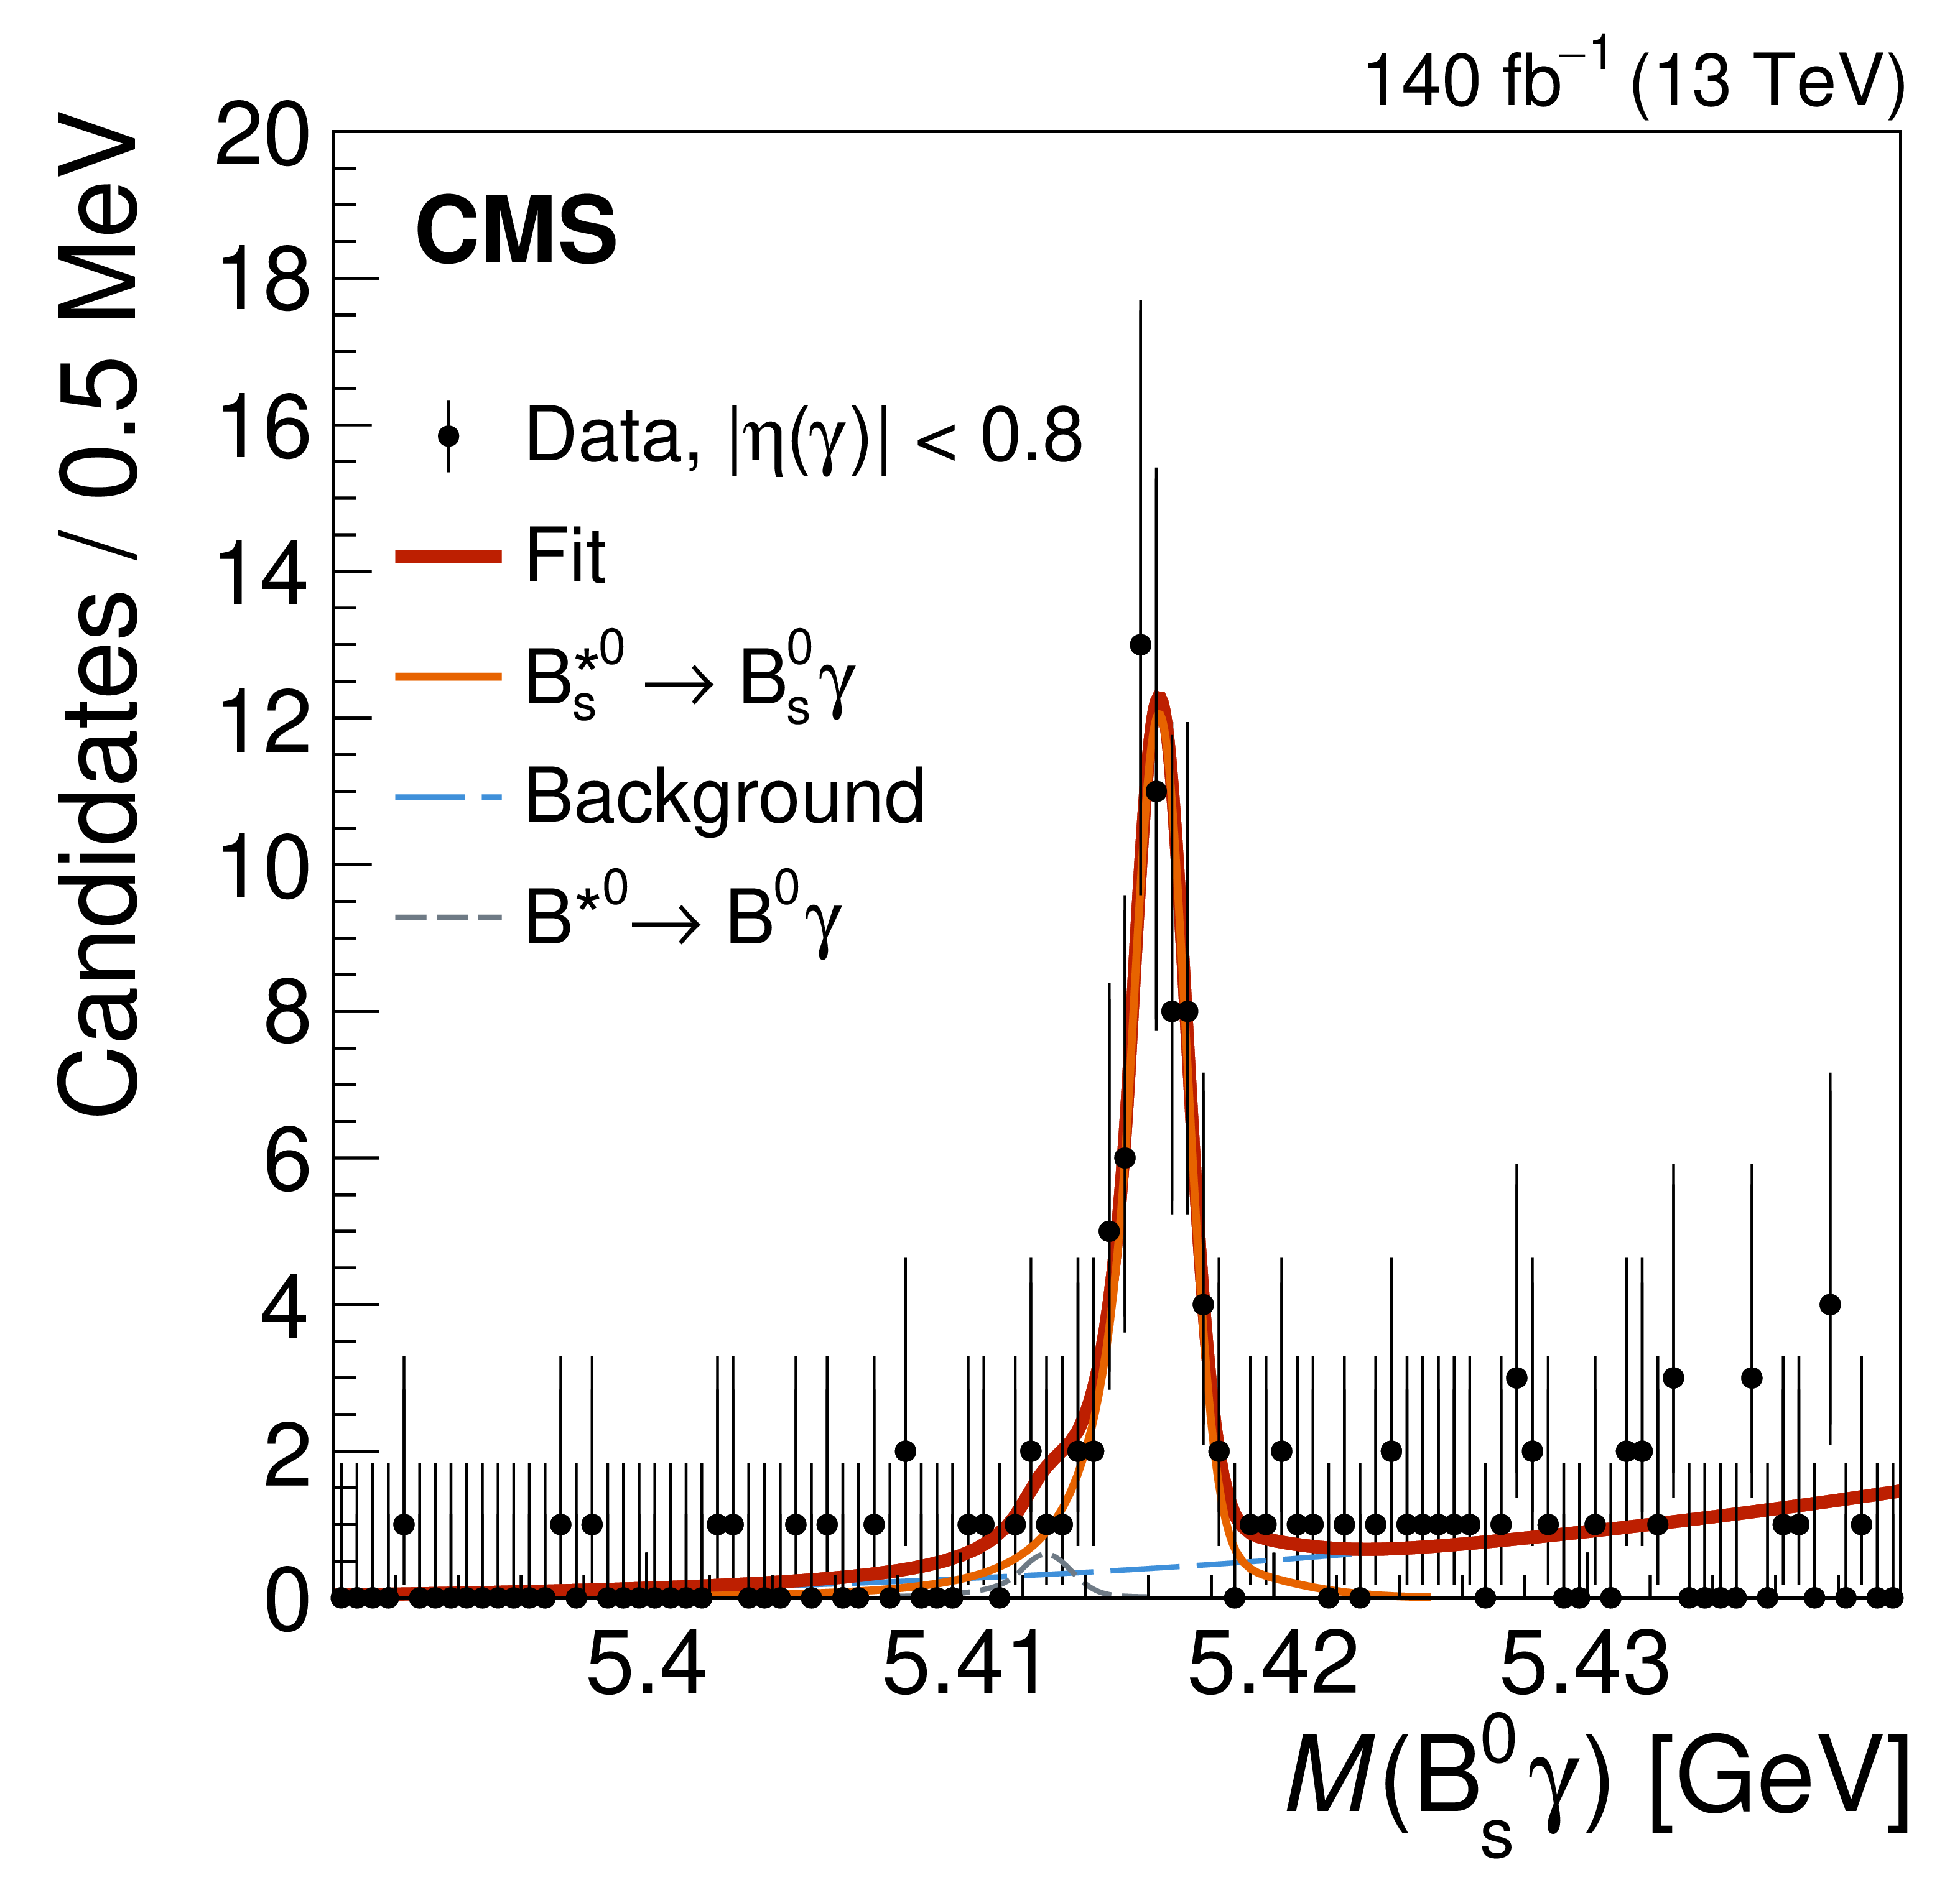
Figure 1-c:
The measured distributions (filled circles) of the $ {\mathrm{B}^{+}}\gamma $ (upper left), $ {\mathrm{B}^0}\gamma $ (upper right), and $ \mathrm{B}_{s}^{0}\gamma $ (lower) invariant mass in the lowest $ |\eta(\gamma)| $ range, which has the best invariant mass resolution. The simultaneous fit projections are shown with thick red lines, and the other components are described in the legends. The error bars represent statistical uncertainties in data. |
png pdf |
Figure A1:
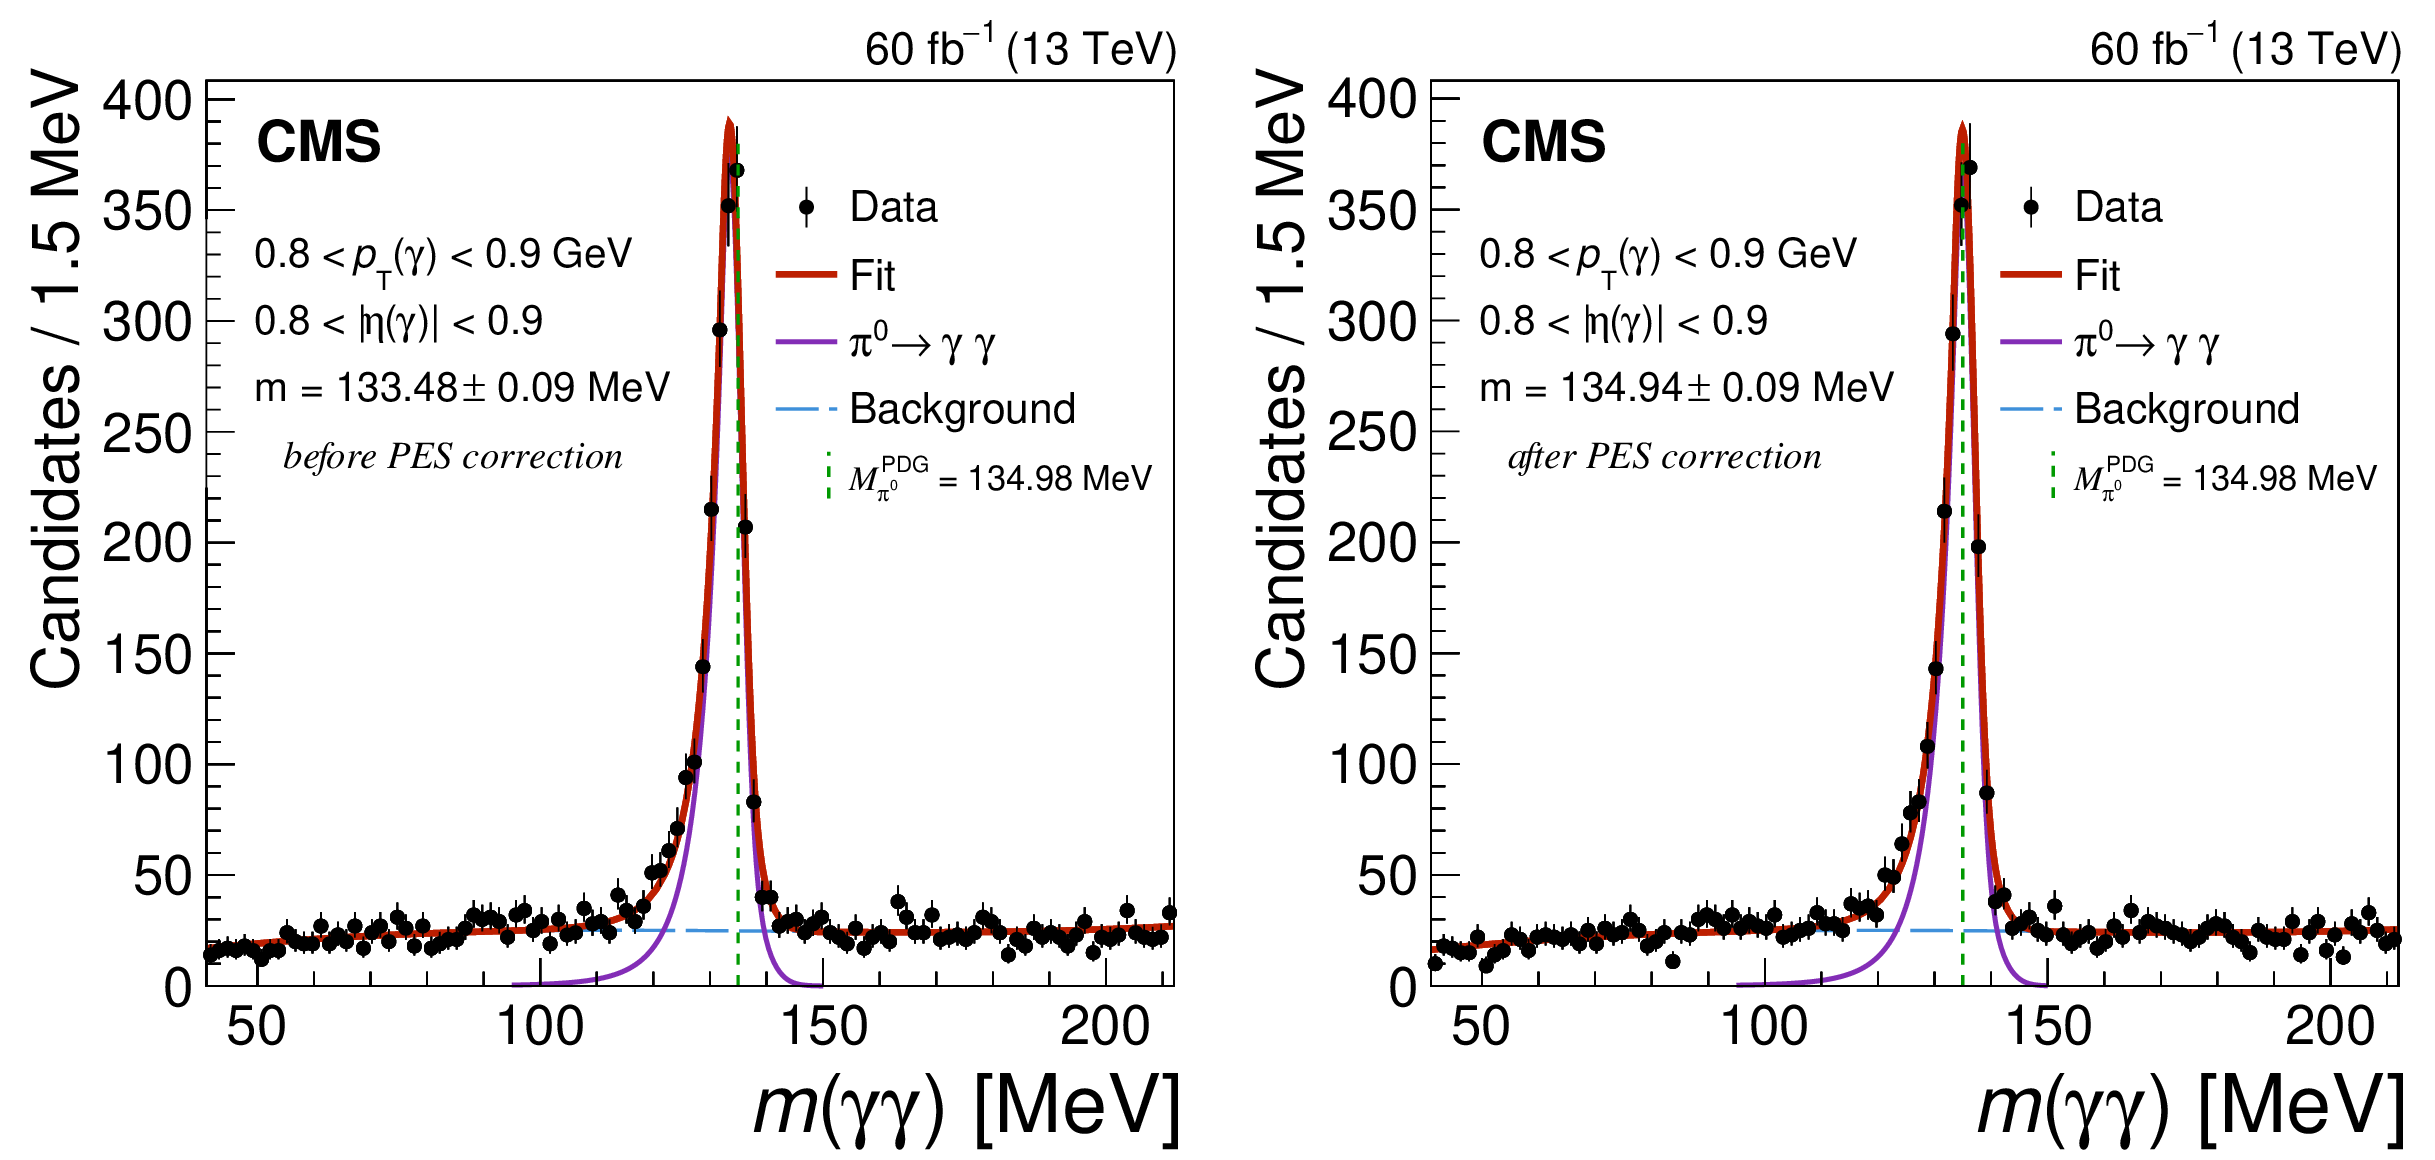
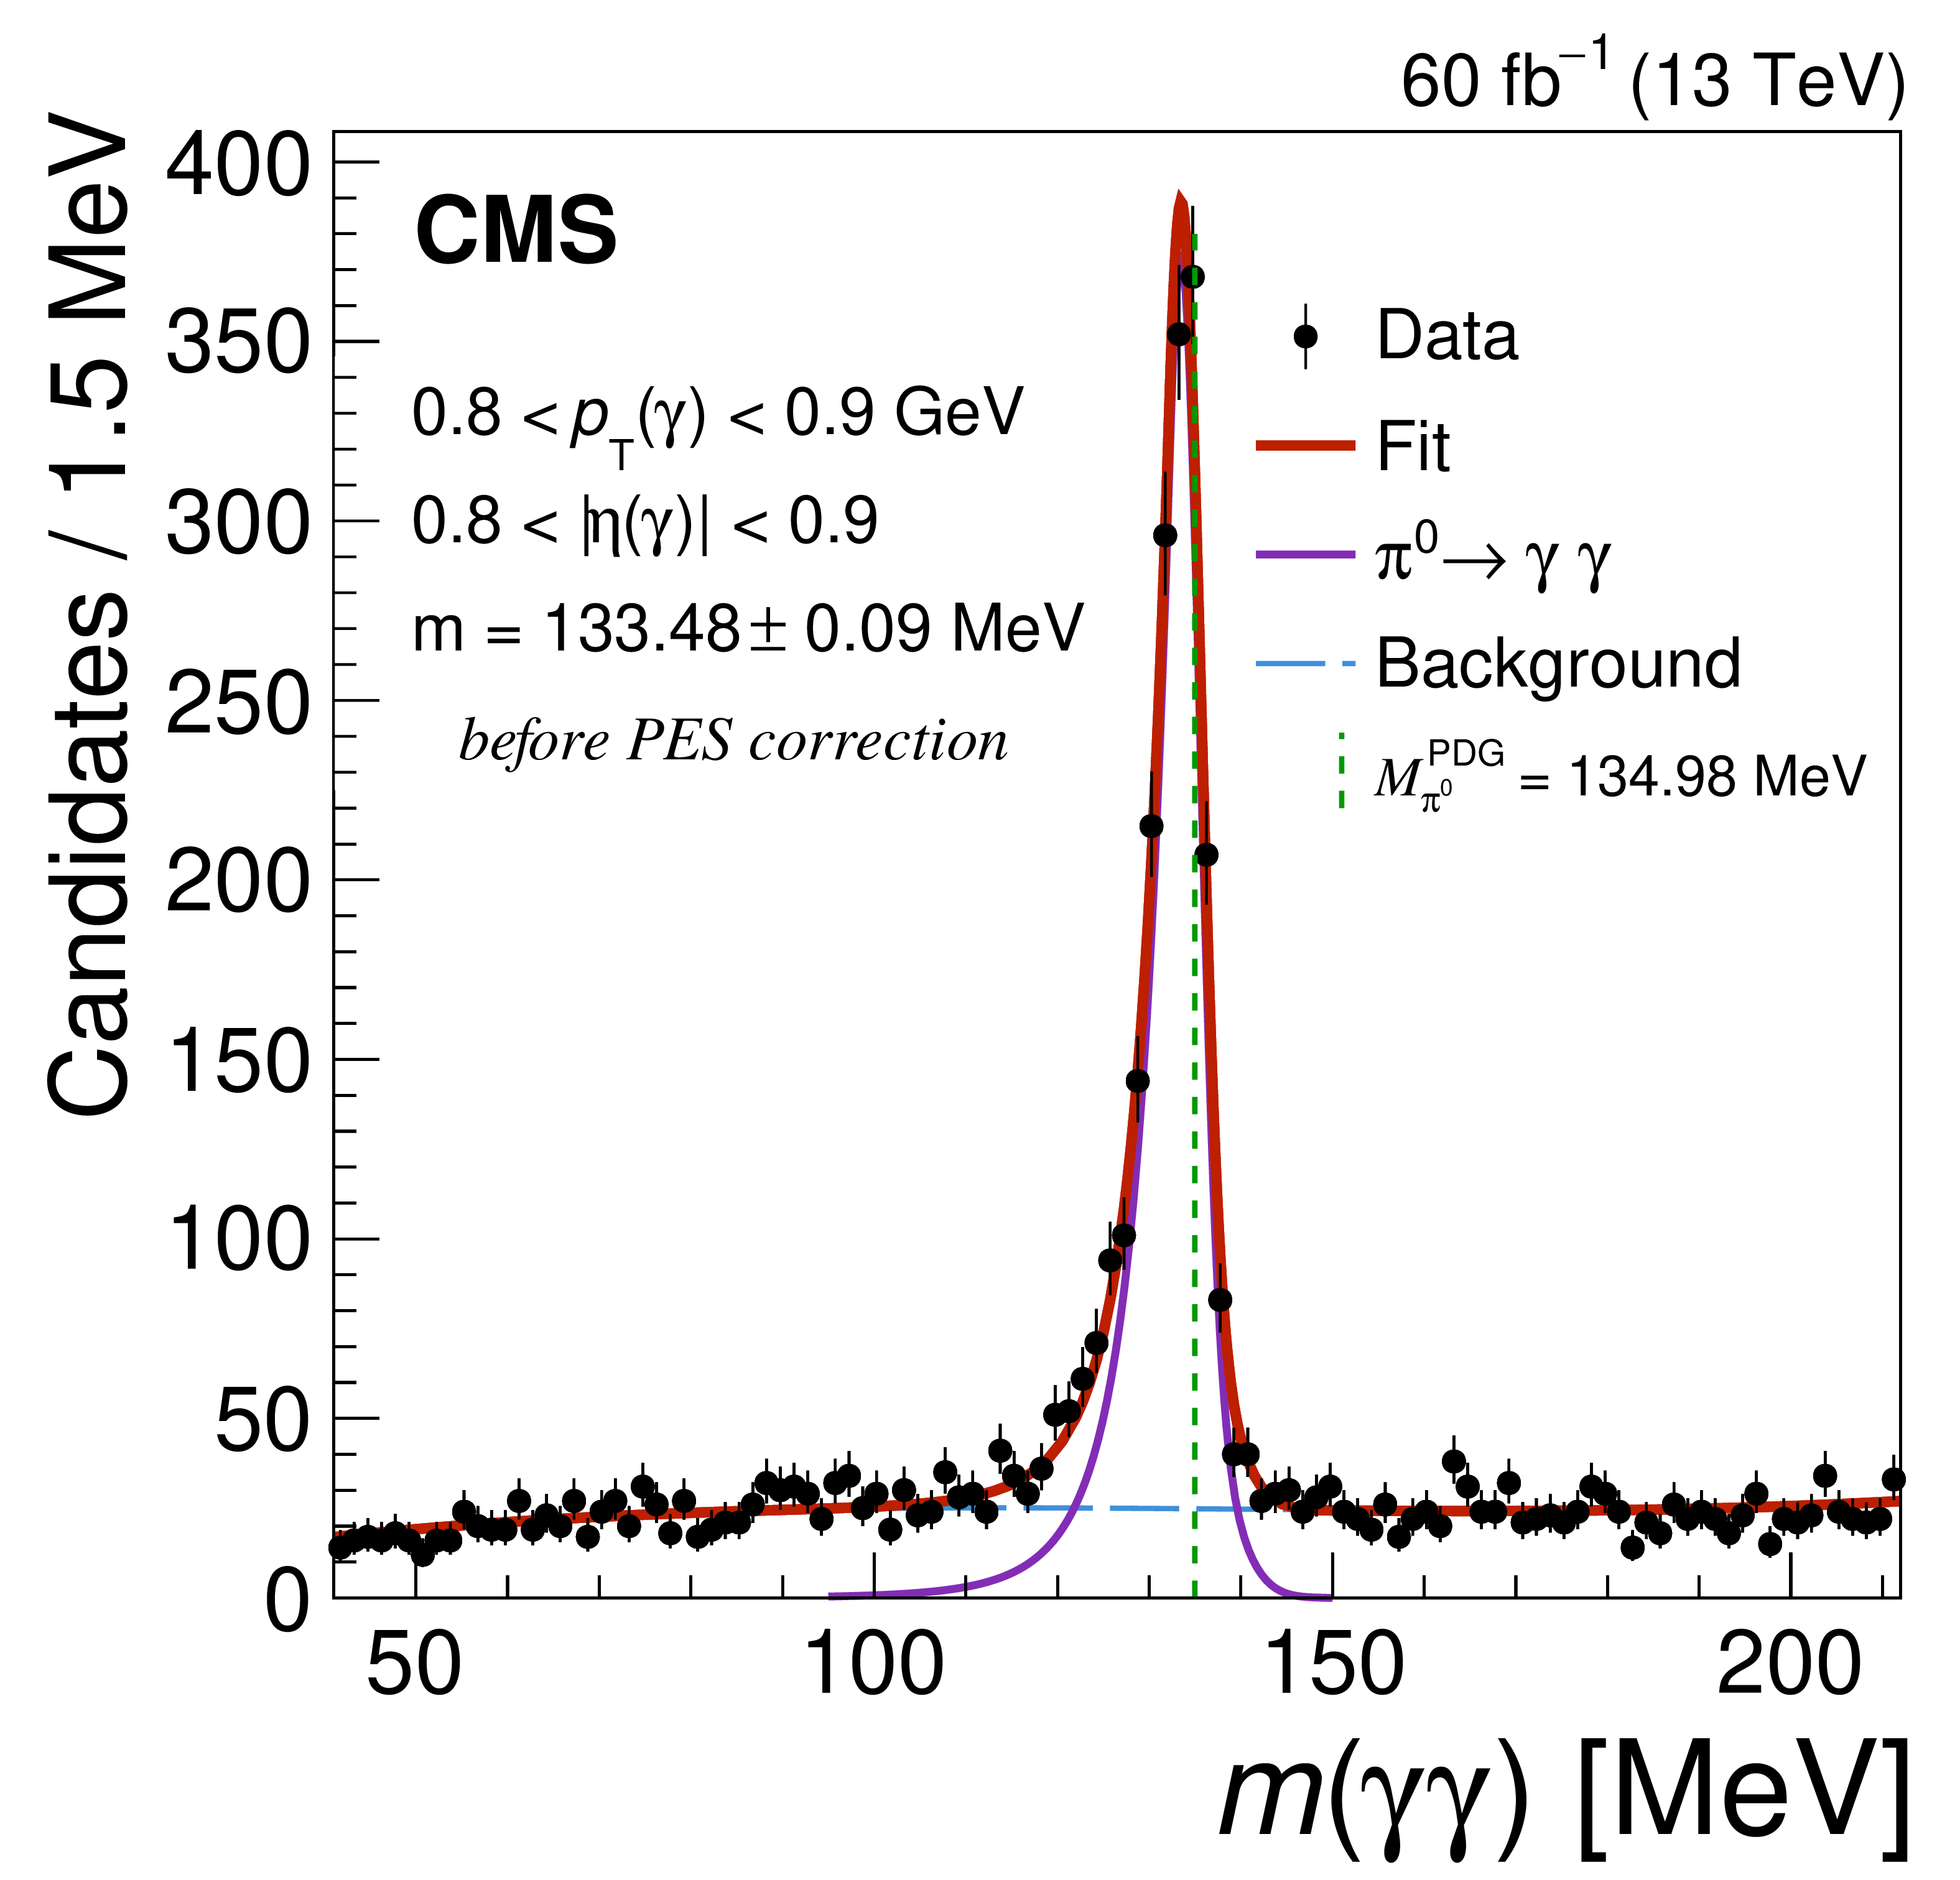
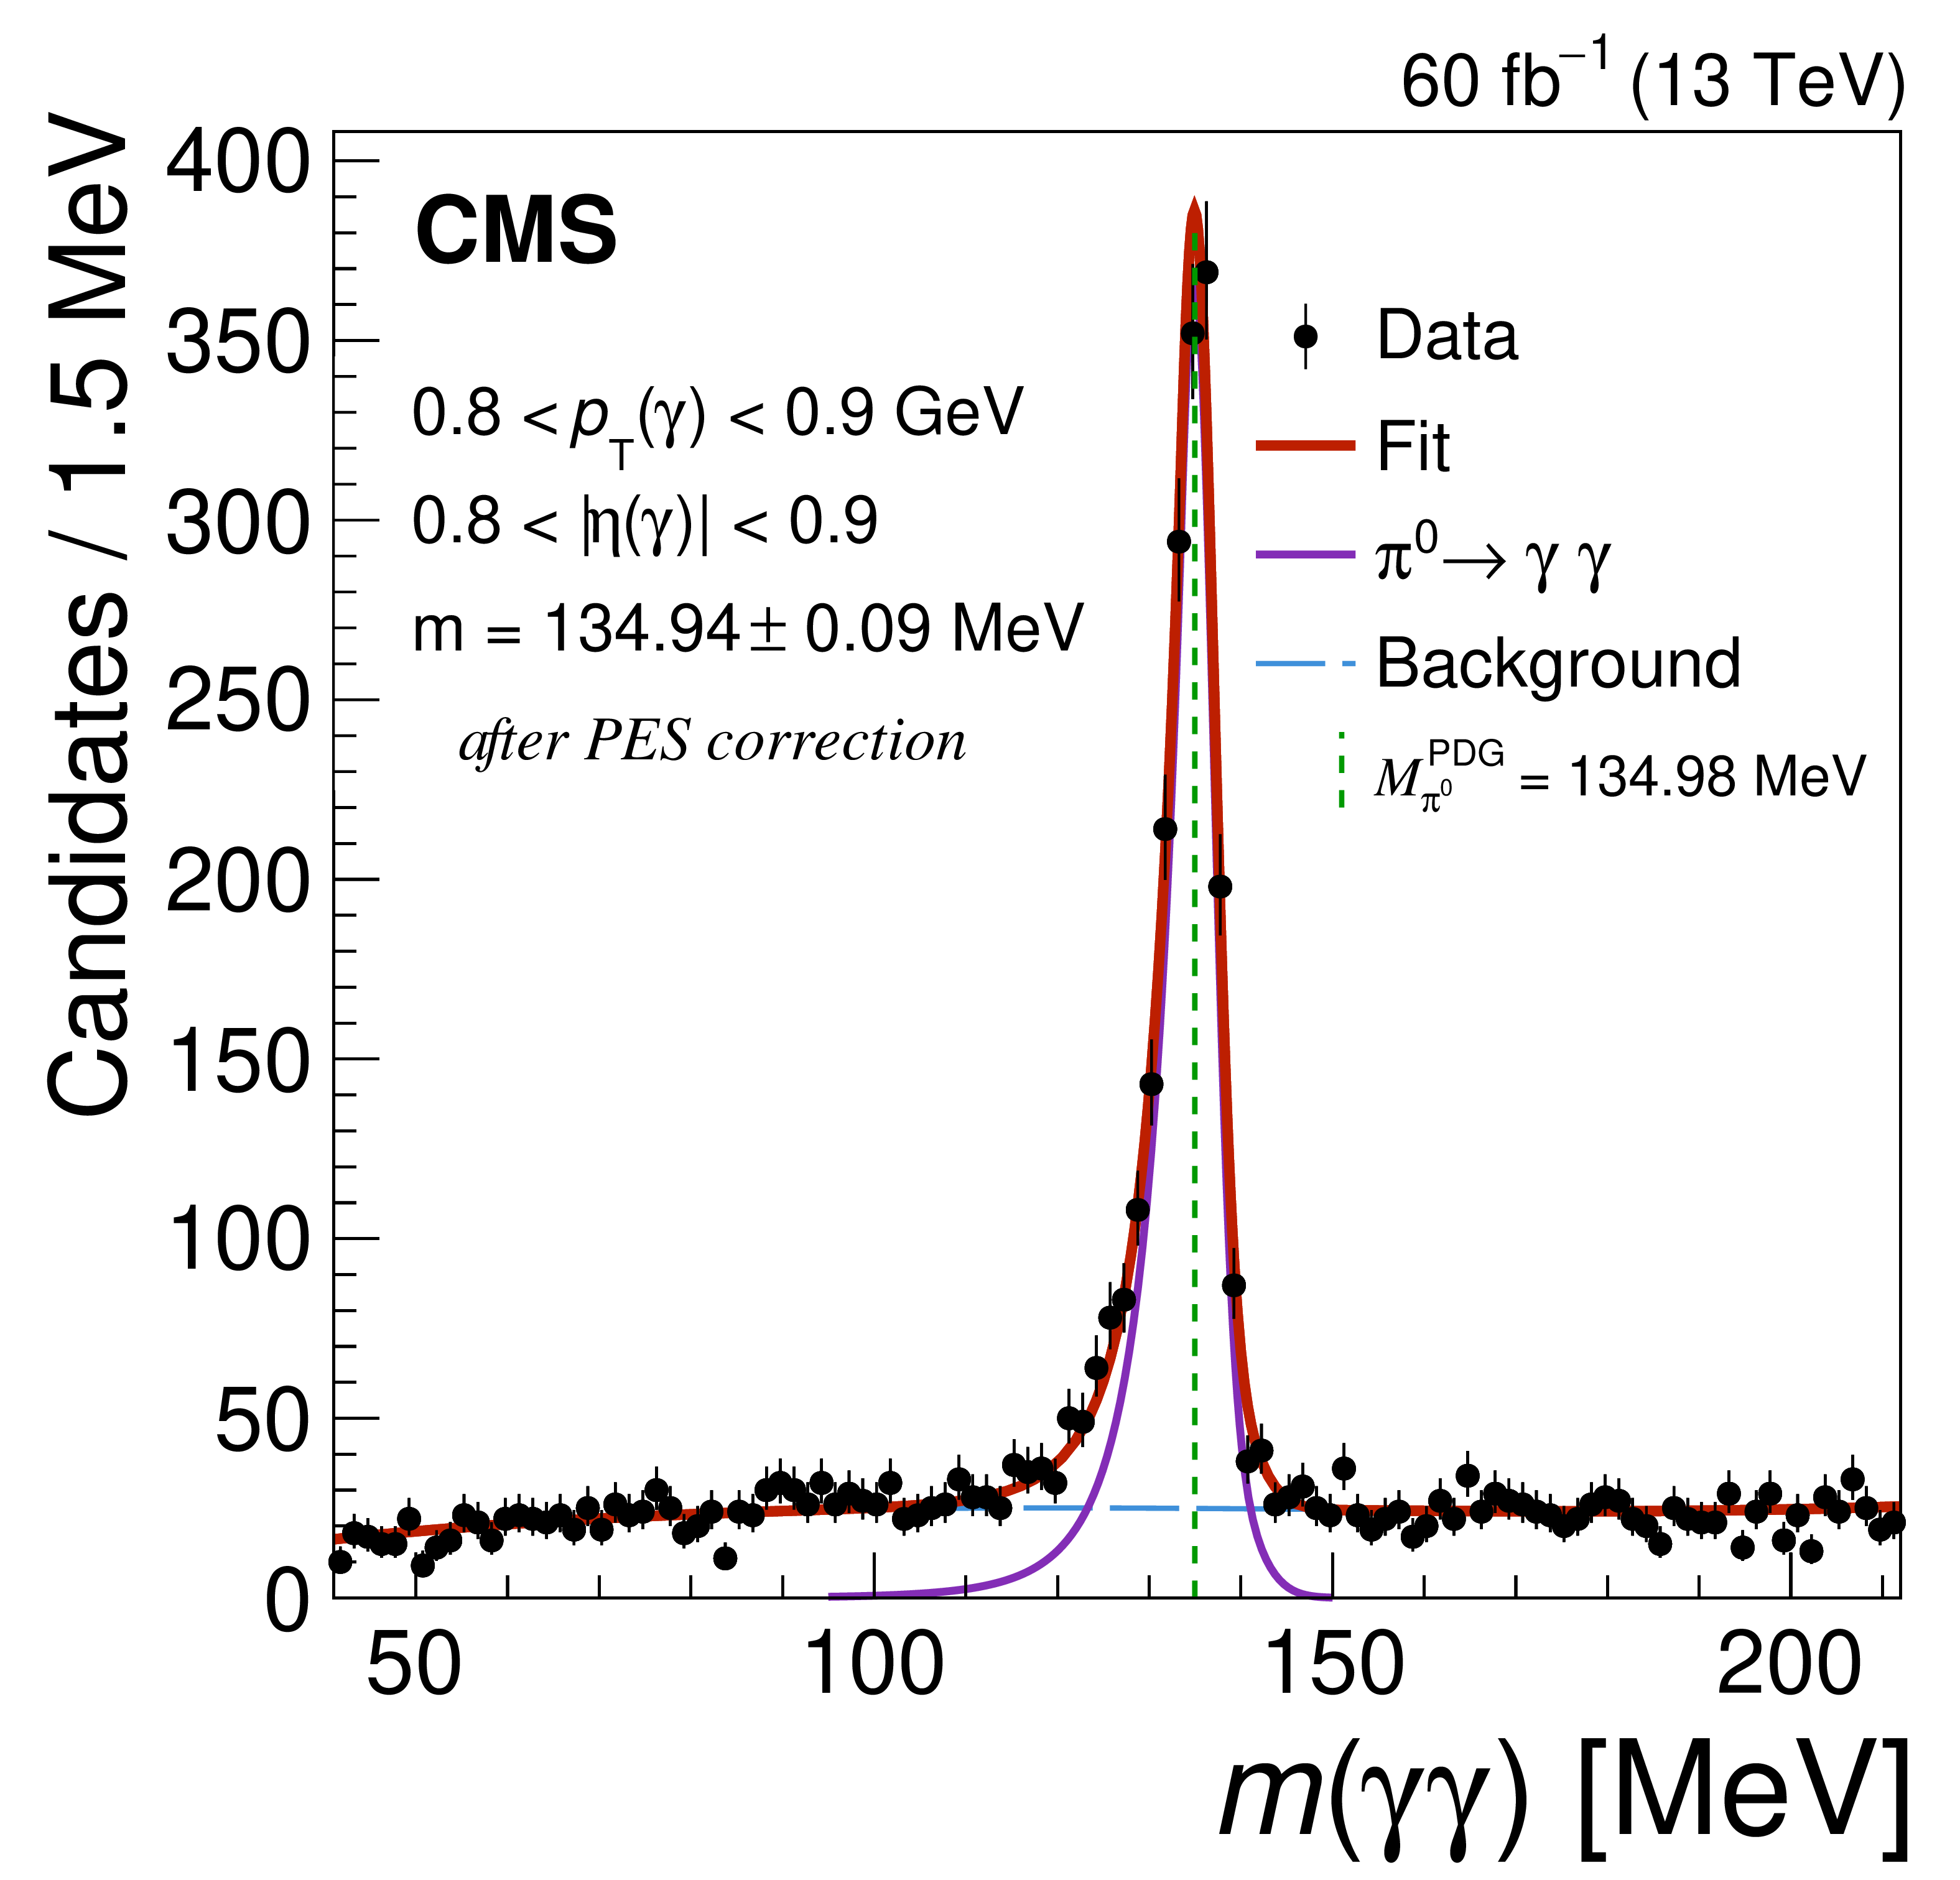
The measured distributions of the diphoton invariant mass near the $ \pi^{0} $ mass with the fit results overlaid, before (left) and after (right) the PES correction, in the kinematic range 0.8 $ < p_{\mathrm{T}}(\gamma) < 0.9\,\text{Ge\hspace{-.08em}V} $, 0.8 $ < |\eta(\gamma)| < $ 0.9. The green vertical line shows the world-average value of the $ \pi^{0} $ mass of 134.98 MeV [28]. |
png pdf |
Figure A1-a:
The measured distributions of the diphoton invariant mass near the $ \pi^{0} $ mass with the fit results overlaid, before (left) and after (right) the PES correction, in the kinematic range 0.8 $ < p_{\mathrm{T}}(\gamma) < 0.9\,\text{Ge\hspace{-.08em}V} $, 0.8 $ < |\eta(\gamma)| < $ 0.9. The green vertical line shows the world-average value of the $ \pi^{0} $ mass of 134.98 MeV [28]. |
png pdf |
Figure A1-b:
The measured distributions of the diphoton invariant mass near the $ \pi^{0} $ mass with the fit results overlaid, before (left) and after (right) the PES correction, in the kinematic range 0.8 $ < p_{\mathrm{T}}(\gamma) < 0.9\,\text{Ge\hspace{-.08em}V} $, 0.8 $ < |\eta(\gamma)| < $ 0.9. The green vertical line shows the world-average value of the $ \pi^{0} $ mass of 134.98 MeV [28]. |
png pdf |
Figure A2:
The measured distributions (filled circles) of the $ {\mathrm{B}^{+}}\gamma $ (upper), $ {\mathrm{B}^0}\gamma $ (lower left), and $ \mathrm{B}_{s}^{0}\gamma $ (lower right) invariant mass corresponding to the most forward one or two $ |\eta(\gamma)| $ regions, together with the simultaneous fit projections (thick red lines). The error bars represent statistical uncertainties in data. |
png pdf |
Figure A2-a:
The measured distributions (filled circles) of the $ {\mathrm{B}^{+}}\gamma $ (upper), $ {\mathrm{B}^0}\gamma $ (lower left), and $ \mathrm{B}_{s}^{0}\gamma $ (lower right) invariant mass corresponding to the most forward one or two $ |\eta(\gamma)| $ regions, together with the simultaneous fit projections (thick red lines). The error bars represent statistical uncertainties in data. |
png pdf |
Figure A2-b:
The measured distributions (filled circles) of the $ {\mathrm{B}^{+}}\gamma $ (upper), $ {\mathrm{B}^0}\gamma $ (lower left), and $ \mathrm{B}_{s}^{0}\gamma $ (lower right) invariant mass corresponding to the most forward one or two $ |\eta(\gamma)| $ regions, together with the simultaneous fit projections (thick red lines). The error bars represent statistical uncertainties in data. |
png pdf |
Figure A2-c:
The measured distributions (filled circles) of the $ {\mathrm{B}^{+}}\gamma $ (upper), $ {\mathrm{B}^0}\gamma $ (lower left), and $ \mathrm{B}_{s}^{0}\gamma $ (lower right) invariant mass corresponding to the most forward one or two $ |\eta(\gamma)| $ regions, together with the simultaneous fit projections (thick red lines). The error bars represent statistical uncertainties in data. |
png pdf |
Figure A2-d:
The measured distributions (filled circles) of the $ {\mathrm{B}^{+}}\gamma $ (upper), $ {\mathrm{B}^0}\gamma $ (lower left), and $ \mathrm{B}_{s}^{0}\gamma $ (lower right) invariant mass corresponding to the most forward one or two $ |\eta(\gamma)| $ regions, together with the simultaneous fit projections (thick red lines). The error bars represent statistical uncertainties in data. |
| Tables | |
png pdf |
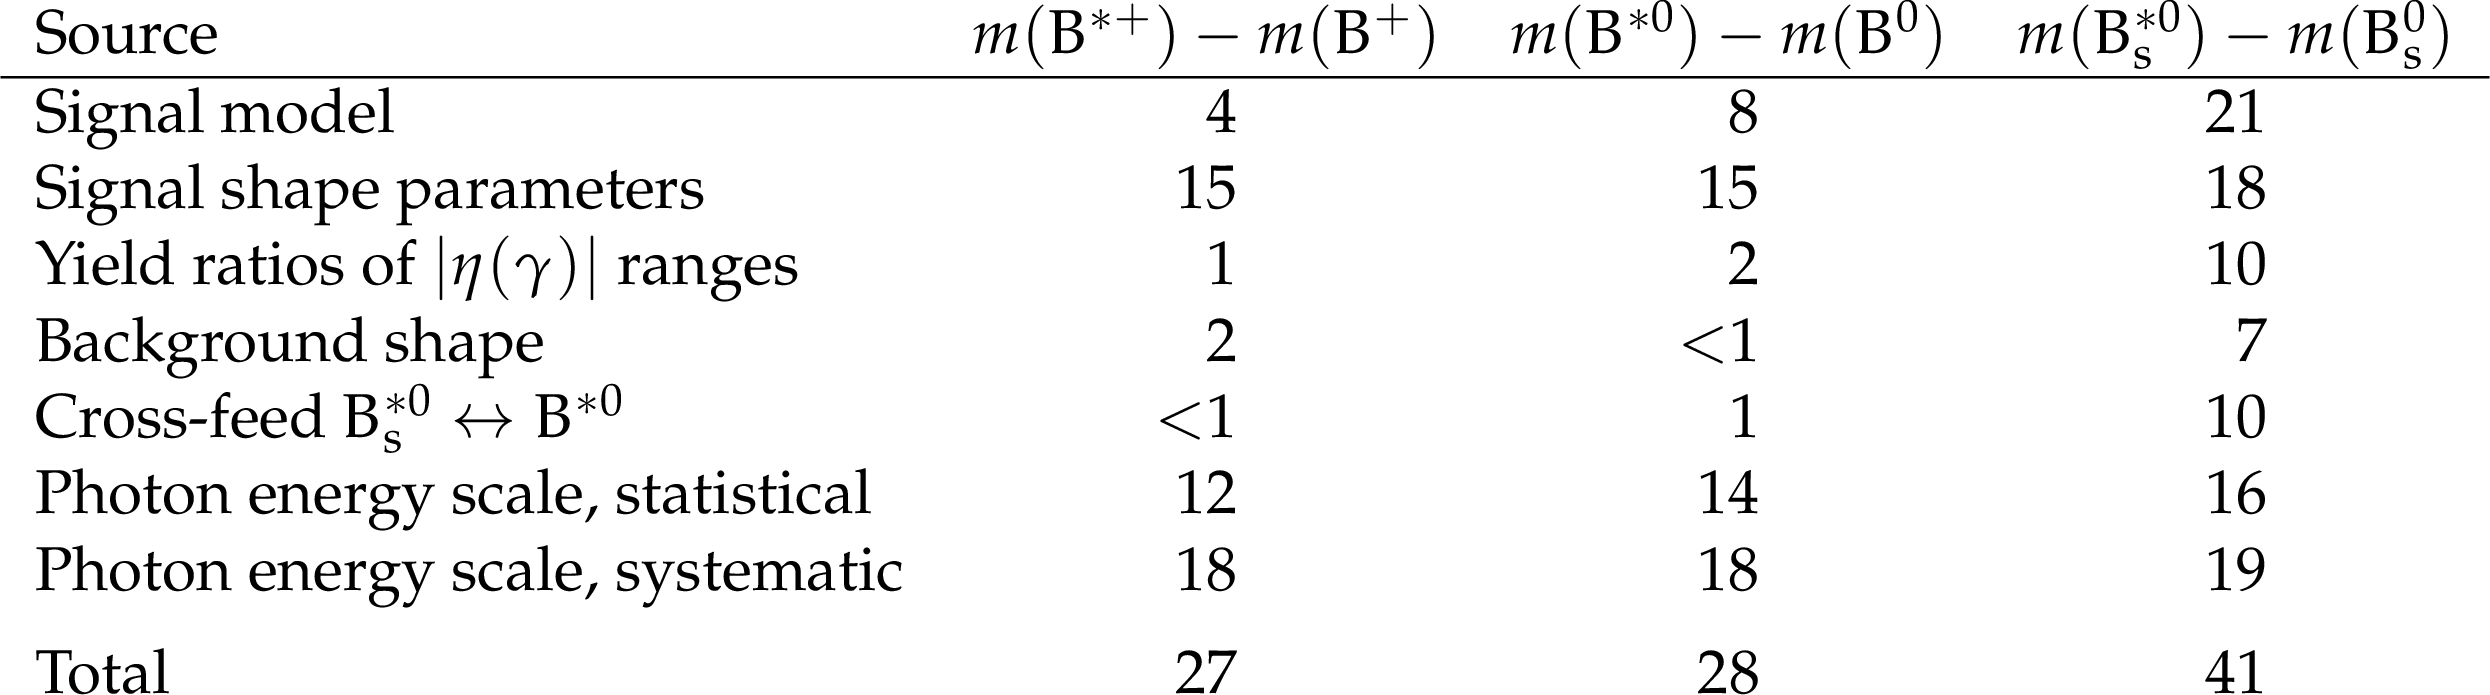
Table 1:
Systematic uncertainties in the measured mass differences, in keV. |
png pdf |
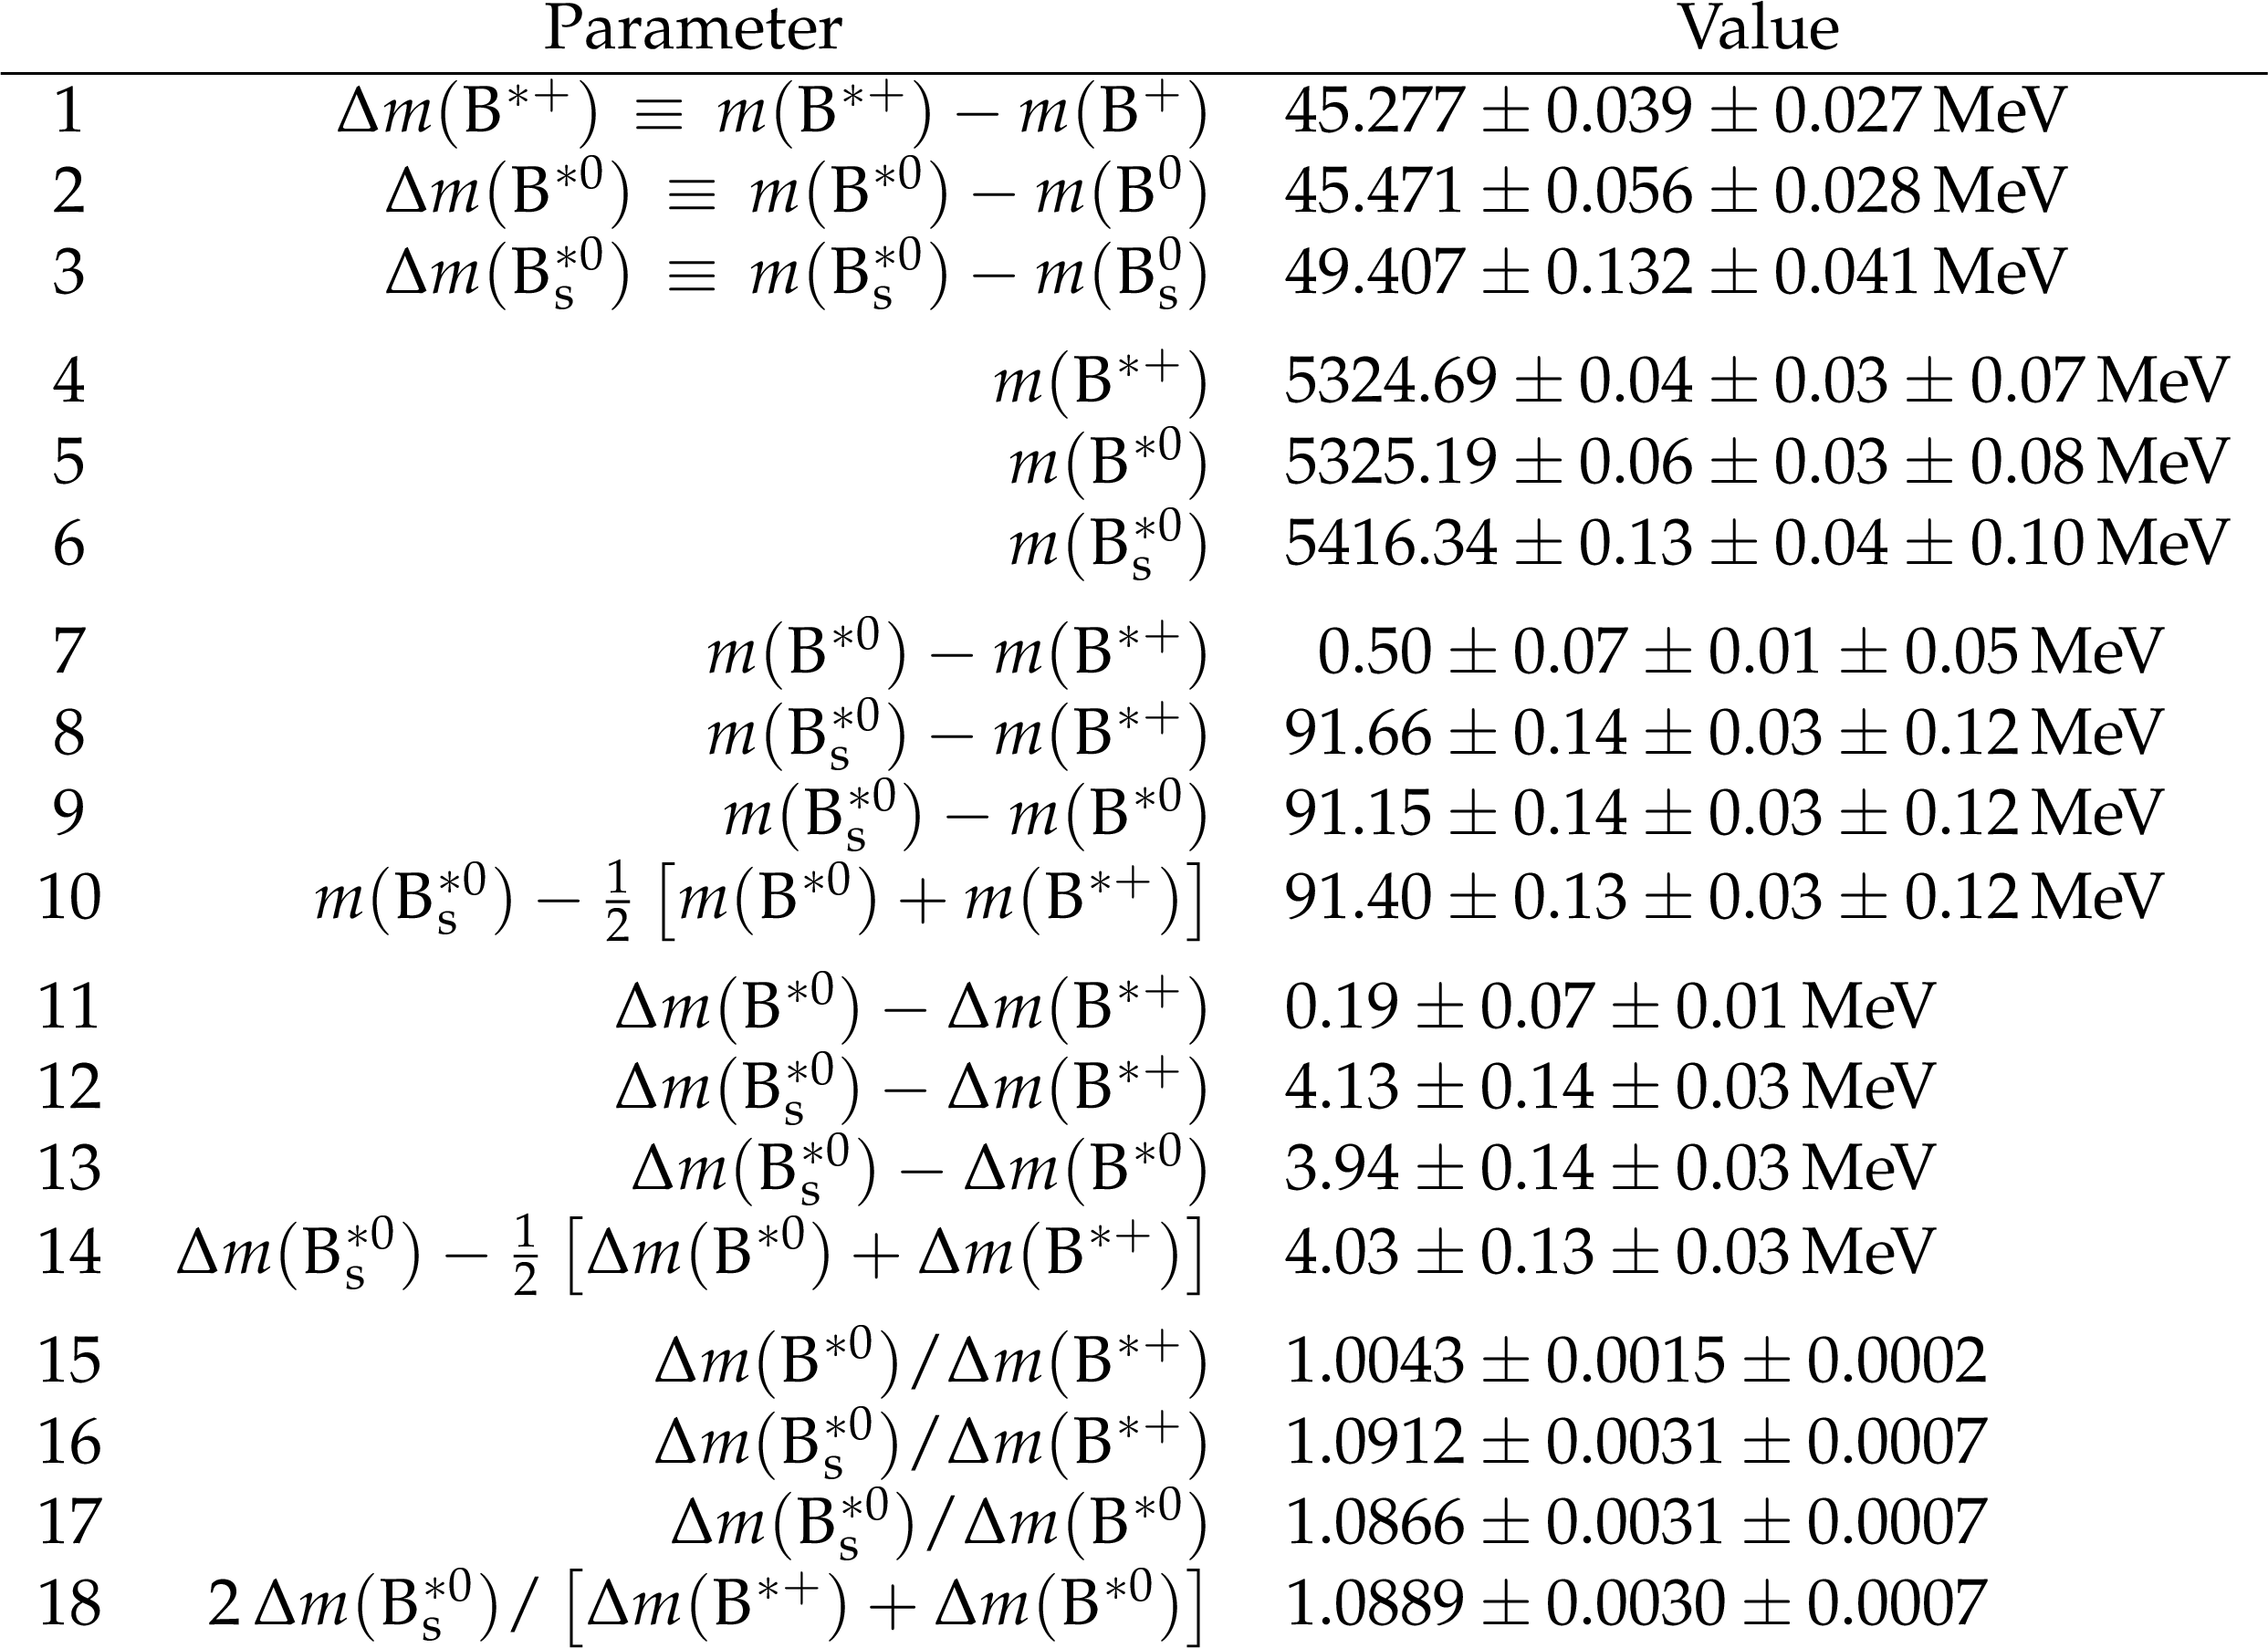
Table 2:
Results of the measurement. The first uncertainties are statistical, the second are systematic, and the third, where present, are related to the masses or mass differences of the ground states taken from Ref. [28]. |
png pdf |
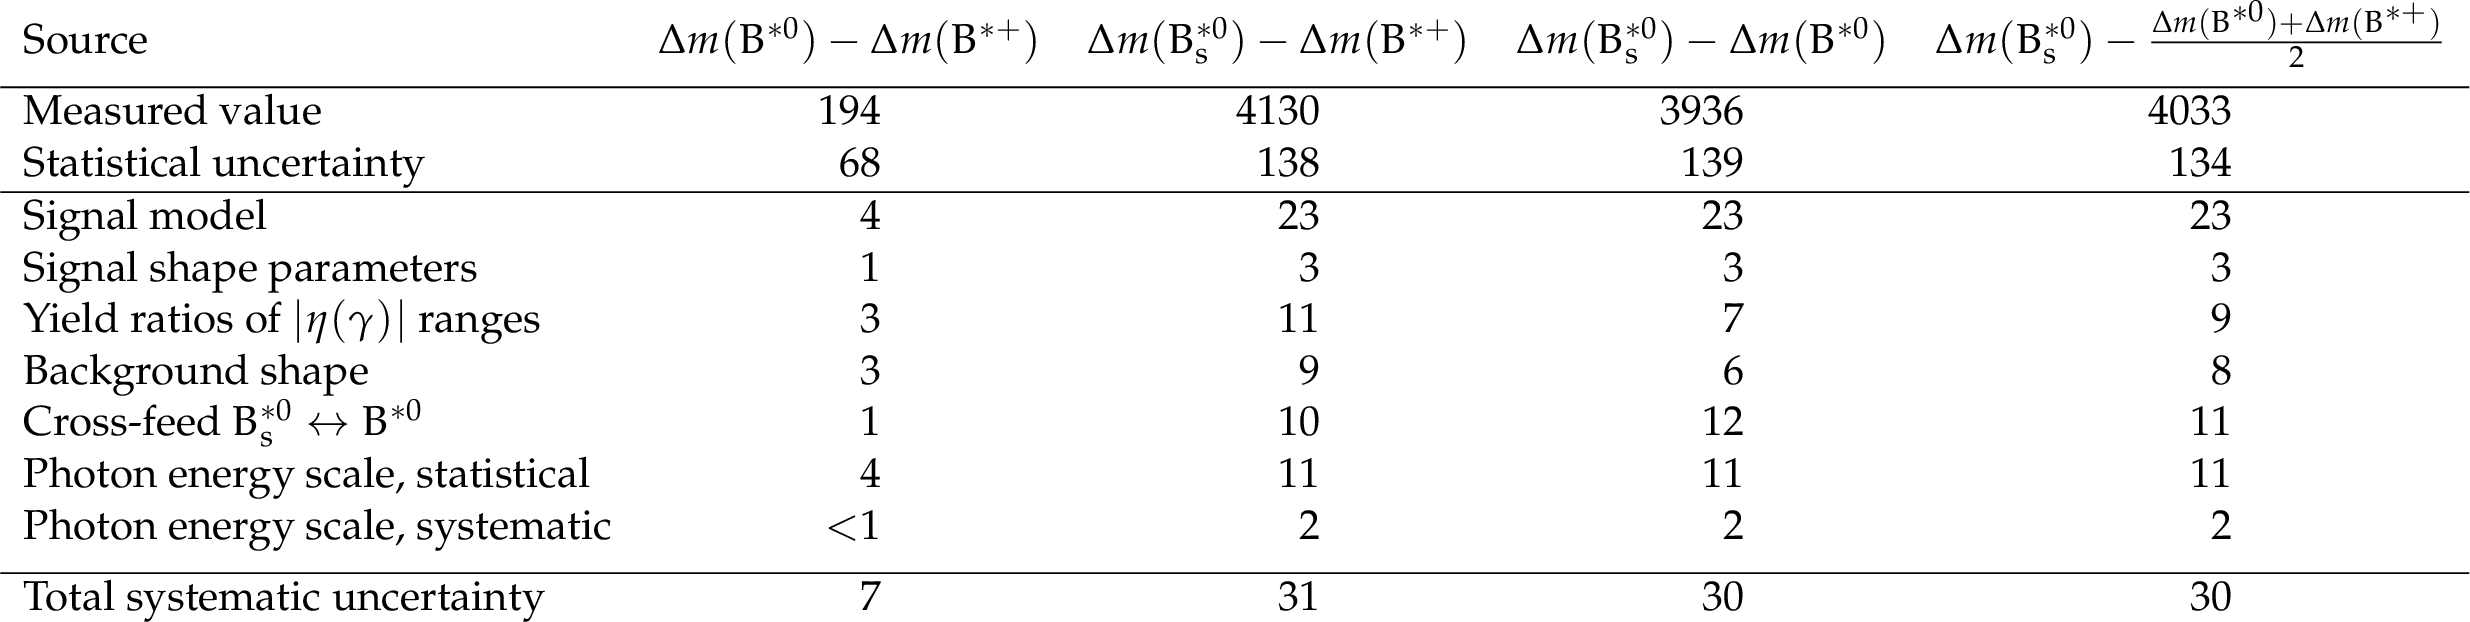
Table A1:
Values, statistical, and systematic uncertainties, in keV, of the measured differences of the three mass differences. |
png pdf |
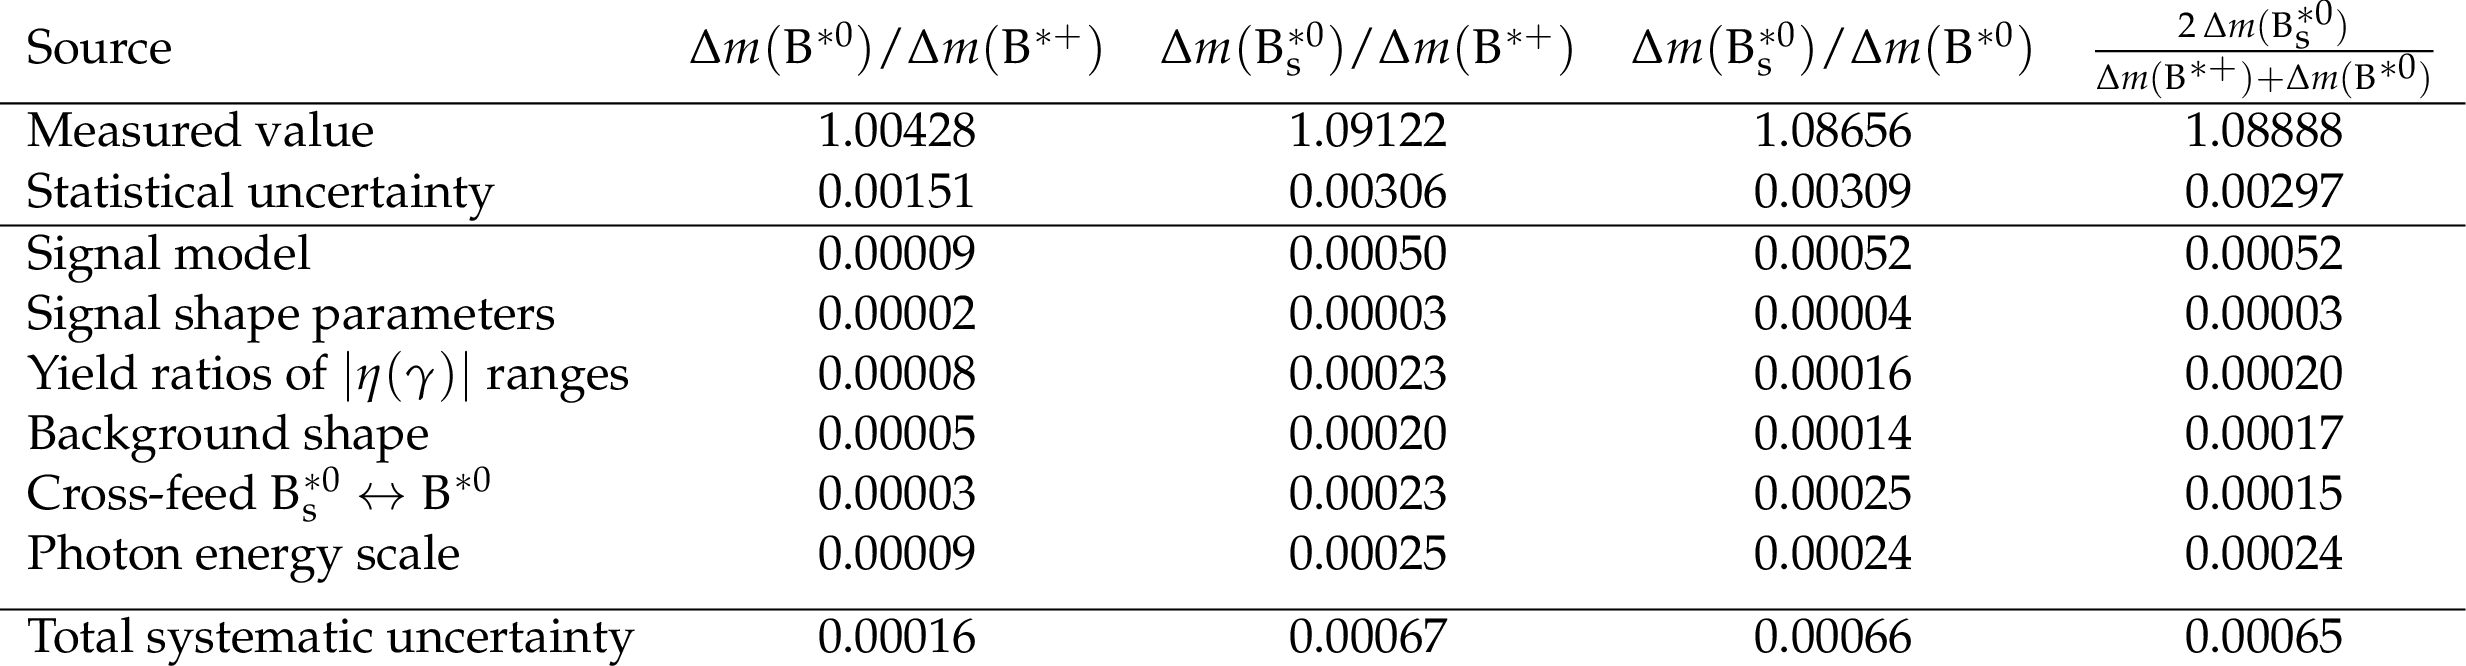
Table A2:
Values, statistical, and systematic uncertainties of the measured ratios of the three mass differences. |
| Summary |
| In summary, three vector $ {\mathrm{B}} $ meson states, $ \mathrm{B}^{*+} $, $ \mathrm{B}^{*0} $, and $ \mathrm{B}_{s}^{*0} $, have been fully reconstructed in exclusive final states for the first time by detecting low-energy photons through their conversion to $ \mathrm{e}^+\mathrm{e}^- $ pairs in the beam pipe and detector material. The data sample of $ \sqrt{s}= $ 13 TeV proton-proton collisions was collected by the CMS experiment and corresponds to an integrated luminosity of 140 fb$ ^{-1} $. The measurements benefit from a new photon energy scale calibration method that uses $ \pi^{0}\to\gamma\gamma $ decays in which both photons convert to $ \mathrm{e}^+\mathrm{e}^- $ pairs. The masses of the three vector states are measured with respect to the corresponding ground states to be $ m(\mathrm{B}^{*+})-m({\mathrm{B}^{+}}) = $ 45.277 $ \pm $ 0.039 $ \pm $ 0.027 MeV, $ m(\mathrm{B}^{*0})-m({\mathrm{B}^0}) = $ 45.471 $ \pm $ 0.056 $ \pm $ 0.028 MeV, and $ m(\mathrm{B}_{s}^{*0})-m(\mathrm{B}_{s}^{0}) = $ 49.407 $ \pm $ 0.132 $ \pm $ 0.041 MeV, where the first uncertainties are statistical and the second are systematic. A number of difference and ratio measurements between the reported masses and mass differences are also provided, where, due to cancellations in the computations of these quantities, both experimental and theoretical uncertainties are lower. These results are either the first measurement or an order of magnitude more precise than previous measurements. The new measurements are more precise than the available theoretical predictions and provide an important input to our understanding of heavy-quark systems. |
| References | ||||
| 1 | L3 Collaboration | B* production in Z decays at LEP | PLB 345 (1995) 589 | |
| 2 | ALEPH Collaboration | Production of excited beauty states in Z decays | Z. Phys. C 69 (1996) 393 | |
| 3 | DELPHI Collaboration | B* production in Z decays | Z. Phys. C 68 (1995) 353 | |
| 4 | OPAL Collaboration | B* production in Z$ ^0 $ decays | Z. Phys. C 74 (1997) 413 | |
| 5 | LHCb Collaboration | First observation of the decay $ B_{s2}^*(5840)^0 \to B^{*+} K^- $ and studies of excited $ B^0_s $ mesons | PRL 110 (2013) 151803 | 1211.5994 |
| 6 | CMS Collaboration | Studies of $ {\mathrm {B}} ^{*}_{\mathrm {s}2}(5840)^0 $ and $ {\mathrm {B}} _{{\mathrm {s}}1}(5830)^0 $ mesons including the observation of the $ {\mathrm {B}} ^{*}_{\mathrm {s}2}(5840)^0 \rightarrow {\mathrm {B}} ^0 \mathrm {K} ^0_{\mathrm {S}} $ decay in proton-proton collisions at $ \sqrt{s}= $ 8 TeV | EPJC 78 (2018) 939 | CMS-BPH-16-003 1809.03578 |
| 7 | CLEO Collaboration | First measurements of the exclusive decays of the $ \Upsilon{\textrm{(5S)}} $ to B meson final states and improved $ {\mathrm{B}}^*_\mathrm{s} $ mass measurement | PRL 96 (2006) 152001 | hep-ex/0601044 |
| 8 | Belle Collaboration | Measurement of the decay $ \mathrm{B}_{s}^{0} \to \mathrm{D}_{s}^{-} \pi^{+} $ and evidence for $ \mathrm{B}_{s}^{0}\to\mathrm{D}_{s}^{\pm}\mathrm{K}^{\mp} $ in $ \mathrm{e}^+\mathrm{e}^- $ annihilation at $ \sqrt{s} \approx $ 10.87 GeV | PRL 102 (2009) 021801 | 0809.2526 |
| 9 | J. L. Rosner and M. B. Wise | Meson masses from SU(3) and heavy quark symmetry | PRD 47 (1993) 343 | |
| 10 | J. L. Goity and C. P. Jayalath | Strong and electromagnetic mass splittings in heavy mesons | PLB 650 (2007) 22 | hep-ph/0701245 |
| 11 | M. Karliner and J. L. Rosner | Status of isospin splittings in mesons and baryons | PRD 100 (2019) 073006 | 1906.07799 |
| 12 | CMS Collaboration | Precision luminosity measurement in proton-proton collisions at $ \sqrt{s} = $ 13 TeV in 2015 and 2016 at CMS | EPJC 81 (2021) 800 | CMS-LUM-17-003 2104.01927 |
| 13 | CMS Collaboration | CMS luminosity measurement for the 2017 data-taking period at $ \sqrt{s} = $ 13 TeV | CMS Physics Analysis Summary, 2018 CMS-PAS-LUM-17-004 |
CMS-PAS-LUM-17-004 |
| 14 | CMS Collaboration | CMS luminosity measurement for the 2018 data-taking period at $ \sqrt{s} = $ 13 TeV | CMS Physics Analysis Summary, 2019 CMS-PAS-LUM-18-002 |
CMS-PAS-LUM-18-002 |
| 15 | CMS Collaboration | HEPData record for this analysis | link | |
| 16 | CMS Collaboration | The CMS experiment at the CERN LHC | JINST 3 (2008) S08004 | |
| 17 | CMS Collaboration | Development of the CMS detector for the CERN LHC Run 3 | JINST 19 (2024) P05064 | CMS-PRF-21-001 2309.05466 |
| 18 | CMS Collaboration | The CMS trigger system | JINST 12 (2017) P01020 | CMS-TRG-12-001 1609.02366 |
| 19 | CMS Collaboration | Performance of the CMS Level-1 trigger in proton-proton collisions at $ \sqrt{s} = $ 13 TeV | JINST 15 (2020) P10017 | CMS-TRG-17-001 2006.10165 |
| 20 | CMS Collaboration | Performance of the CMS high-level trigger during LHC Run 2 | JINST 19 (2024) P11021 | CMS-TRG-19-001 2410.17038 |
| 21 | CMS Collaboration | Electron and photon reconstruction and identification with the CMS experiment at the CERN LHC | JINST 16 (2021) P05014 | CMS-EGM-17-001 2012.06888 |
| 22 | CMS Collaboration | Performance of the CMS muon detector and muon reconstruction with proton-proton collisions at $ \sqrt{s}= $ 13 TeV | JINST 13 (2018) P06015 | CMS-MUO-16-001 1804.04528 |
| 23 | CMS Collaboration | Description and performance of track and primary-vertex reconstruction with the CMS tracker | JINST 9 (2014) P10009 | CMS-TRK-11-001 1405.6569 |
| 24 | CMS Collaboration | Particle-flow reconstruction and global event description with the CMS detector | JINST 12 (2017) P10003 | CMS-PRF-14-001 1706.04965 |
| 25 | CMS Collaboration | Strategies and performance of the CMS silicon tracker alignment during LHC Run 2 | NIM A 1037 (2022) 166795 | CMS-TRK-20-001 2111.08757 |
| 26 | CMS Tracker Group Collaboration | The CMS phase-1 pixel detector upgrade | JINST 16 (2021) P02027 | 2012.14304 |
| 27 | CMS Collaboration | Performance of CMS muon reconstruction in $ \mathrm{pp} $ collision events at $ \sqrt{s} = $ 7 TeV | JINST 7 (2012) P10002 | CMS-MUO-10-004 1206.4071 |
| 28 | Particle Data Group , S. Navas et al. | Review of particle physics | PRD 110 (2024) 030001 | |
| 29 | CMS Collaboration | Measurement of the production cross section ratio $ \sigma( \chi_{b2}(1\text{P})) / \sigma( \chi_{b1}(1\text{P})) $ in pp collisions at $ \sqrt{s} = $ 8 TeV | PLB 743 (2015) 383 | CMS-BPH-13-005 1409.5761 |
| 30 | CMS Collaboration | Study of excited $ \Lambda_\mathrm{b}^0 $ states decaying to $ \Lambda_\mathrm{b}^0\pi^+\pi^- $ in proton-proton collisions at $ \sqrt{s}= $ 13 TeV | PLB 803 (2020) 135345 | CMS-BPH-19-003 2001.06533 |
| 31 | CMS Collaboration | Observation of a new excited beauty strange baryon decaying to $ \Xi^-_\mathrm{b} \pi^+ \pi^- $ | PRL 126 (2021) 252003 | CMS-BPH-20-004 2102.04524 |
| 32 | CMS Collaboration | Observation of the $ \Xi_\mathrm{b}^-\to\psi\mathrm{(2S)}\Xi^- $ decay and studies of the $ \Xi_\mathrm{b}(5945)^0 $ baryon in proton-proton collisions at $ \sqrt{s}= $ 13 TeV | PRD 110 (2024) 012002 | CMS-BPH-23-002 2402.17738 |
| 33 | CMS Collaboration | Observation of the $ \chi_\mathrm{b1} $(3P) and $ \chi_\mathrm{b2} $(3P) and measurement of their masses | PRL 121 (2018) 092002 | CMS-BPH-17-008 1805.11192 |
| 34 | CMS Collaboration | Supplemental Material for the fit projections in extra rapidity ranges and systematic uncertainties in the differences and ratios of the mass differences | at [URL will be inserted by publisher] | |
| 35 | T. Sjöstrand et al. | An introduction to PYTHIA 8.2 | Comput. Phys. Commun. 191 (2015) 159 | 1410.3012 |
| 36 | CMS Collaboration | Extraction and validation of a new set of CMS PYTHIA8 tunes from underlying-event measurements | EPJC 80 (2020) 4 | CMS-GEN-17-001 1903.12179 |
| 37 | D. J. Lange | The EvtGen particle decay simulation package | NIM A 462 (2001) 152 | |
| 38 | E. Barberio, B. van Eijk, and Z. Was | PHOTOS: A universal Monte Carlo for QED radiative corrections in decays | Comput. Phys. Commun. 66 (1991) 115 | |
| 39 | E. Barberio and Z. Was | PHOTOS: A universal Monte Carlo for QED radiative corrections. version 2.0 | Comput. Phys. Commun. 79 (1994) 291 | |
| 40 | GEANT4 Collaboration | GEANT 4---a simulation toolkit | NIM A 506 (2003) 250 | |
| 41 | M. J. Oreglia | A study of the reactions $ \psi^\prime \to \gamma \gamma \psi $ | PhD thesis, Stanford University, 1980 link |
|
| 42 | Belle Collaboration | A detailed test of the CsI(Tl) calorimeter for BELLE with photon beams of energy between 20 MeV and 5.4 GeV | NIM A 441 (2000) 401 | |
| 43 | F. Bernardoni et al. | B-meson spectroscopy in HQET at order 1/m | PRD 92 (2015) 054509 | 1505.03360 |
| 44 | R. J. Dowdall, C. T. H. Davies, T. C. Hammant, and R. R. Horgan | Precise heavy-light meson masses and hyperfine splittings from lattice QCD including charm quarks in the sea | PRD 86 (2012) 094510 | 1207.5149 |
| 45 | Hadron Spectrum Collaboration | Highly excited $ B $, $ B_s $ and $ B_c $ meson spectroscopy from lattice QCD | JHEP 01 (2025) 123 | 2408.02126 |
|
|
Compact Muon Solenoid LHC, CERN |
|

|

|

|

|

|