

Compact Muon Solenoid
LHC, CERN
| CMS-TOP-23-001 ; CERN-EP-2024-137 | ||
| Observation of quantum entanglement in top quark pair production in proton-proton collisions at $ \sqrt{s}= $ 13 TeV | ||
| CMS Collaboration | ||
| 6 June 2024 | ||
| Rep. Prog. Phys. 87 (2024) 117801 | ||
| Abstract: Entanglement is an intrinsic property of quantum mechanics and is predicted to be exhibited in the particles produced at the Large Hadron Collider. A measurement of the extent of entanglement in top quark-antiquark ($ \mathrm{t} \bar{\mathrm{t}} $) events produced in proton-proton collisions at a center-of-mass energy of 13 TeV is performed with the data recorded by the CMS experiment at the CERN LHC in 2016, and corresponding to an integrated luminosity of 36.3 fb$ ^{-1} $. The events are selected based on the presence of two leptons with opposite charges and high transverse momentum. An entanglement-sensitive observable $ D $ is derived from the top quark spin-dependent parts of the $ \mathrm{t} \bar{\mathrm{t}} $ production density matrix and measured in the region of the $ \mathrm{t} \bar{\mathrm{t}} $ production threshold. Values of $ D {<} -$1/3 are evidence of entanglement and $ D $ is observed (expected) to be $-$0.480$ ^{+0.026}_{-0.029} $ ($-$0.467$ ^{+0.026}_{-0.029} $) at the parton level. With an observed significance of 5.1 standard deviations with respect to the non-entangled hypothesis, this provides observation of quantum mechanical entanglement within $ \mathrm{t} \bar{\mathrm{t}} $ pairs in this phase space. This measurement provides a new probe of quantum mechanics at the highest energies ever produced. | ||
| Links: e-print arXiv:2406.03976 [hep-ex] (PDF) ; CDS record ; inSPIRE record ; HepData record ; CADI line (restricted) ; | ||
| Figures | |
png pdf |
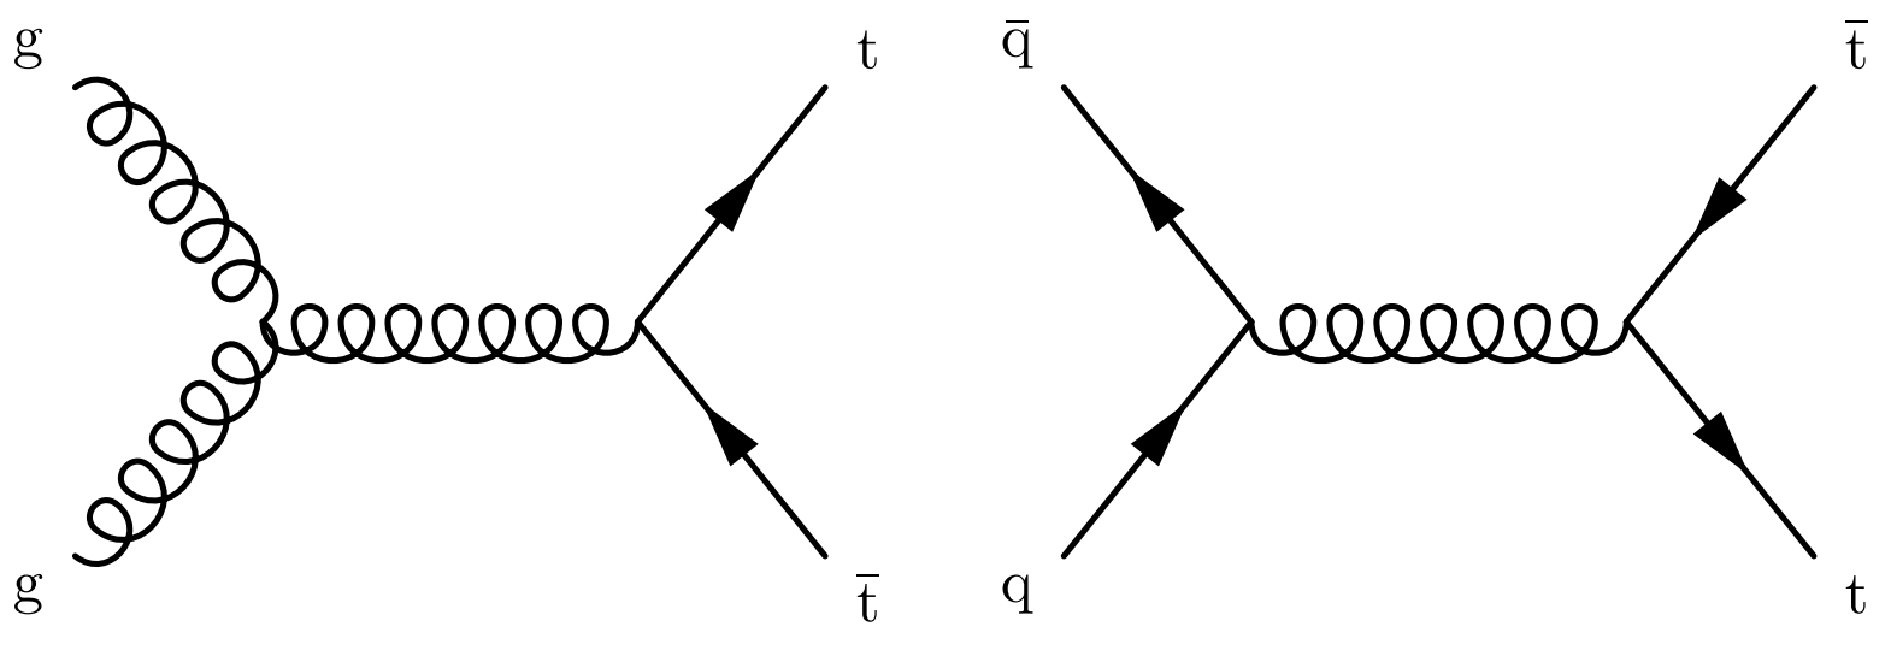
Figure 1:
Representative leading order QCD Feynman diagrams for the $ \mathrm{t} \bar{\mathrm{t}} $ production through $ \mathrm{g}\mathrm{g} $ fusion (left) and quark-antiquark annihilation (right). |
png pdf |
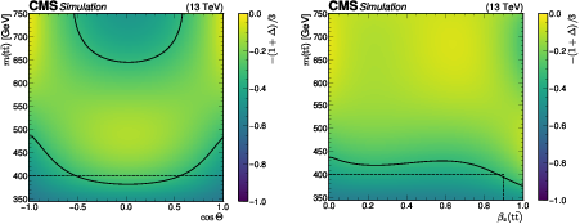
Figure 2:
Predicted values of $ -(1+\Delta)/ $ 3 obtained from $ \mathrm{t} \bar{\mathrm{t}} $ MC simulation, without accounting for detector effects, are shown on the left as a function of $ m({\mathrm{t}\bar{\mathrm{t}}} ) $ and the cosine of the top quark scattering angle $ \Theta $. The value of $ -(1+\Delta)/ $ 3 also determined by a $ \mathrm{t} \bar{\mathrm{t}} $ MC simulation as a function of $ m({\mathrm{t}\bar{\mathrm{t}}} ) $ and $ \beta_z({\mathrm{t}\bar{\mathrm{t}}} ) $ is shown on the right. In both figures the black solid lines represent the $ D=-1/ $ 3 boundary for entanglement, while the black dashed line indicates the selected phase space in this analysis. The minimum value on the $ z $ axis of-1 corresponds to the boundary $ \mathrm{tr}[C]= $ 3, a maximally entangled state. Top quarks with no spin correlations correspond to a value of $ D= $ 0 and $ \Delta=- $ 1 ($ C=\mathbf{0} $). |
png pdf |
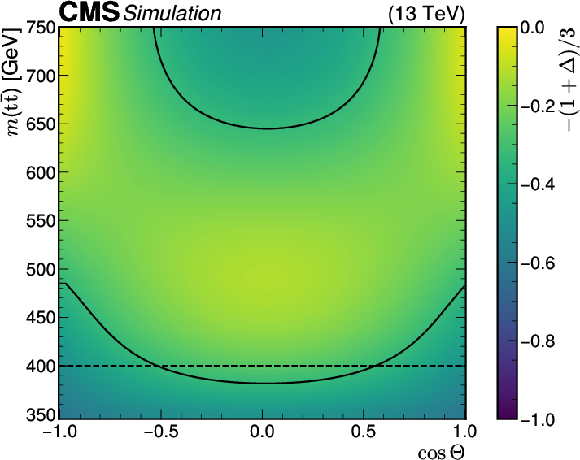
Figure 2-a:
Predicted values of $ -(1+\Delta)/ $ 3 obtained from $ \mathrm{t} \bar{\mathrm{t}} $ MC simulation, without accounting for detector effects, are shown on the left as a function of $ m({\mathrm{t}\bar{\mathrm{t}}} ) $ and the cosine of the top quark scattering angle $ \Theta $. The value of $ -(1+\Delta)/ $ 3 also determined by a $ \mathrm{t} \bar{\mathrm{t}} $ MC simulation as a function of $ m({\mathrm{t}\bar{\mathrm{t}}} ) $ and $ \beta_z({\mathrm{t}\bar{\mathrm{t}}} ) $ is shown on the right. In both figures the black solid lines represent the $ D=-1/ $ 3 boundary for entanglement, while the black dashed line indicates the selected phase space in this analysis. The minimum value on the $ z $ axis of-1 corresponds to the boundary $ \mathrm{tr}[C]= $ 3, a maximally entangled state. Top quarks with no spin correlations correspond to a value of $ D= $ 0 and $ \Delta=- $ 1 ($ C=\mathbf{0} $). |
png pdf |
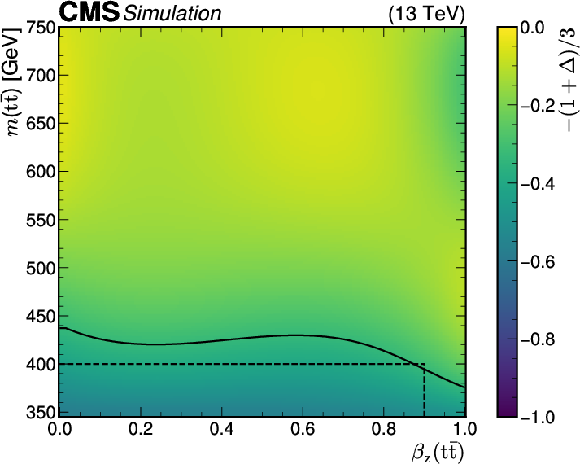
Figure 2-b:
Predicted values of $ -(1+\Delta)/ $ 3 obtained from $ \mathrm{t} \bar{\mathrm{t}} $ MC simulation, without accounting for detector effects, are shown on the left as a function of $ m({\mathrm{t}\bar{\mathrm{t}}} ) $ and the cosine of the top quark scattering angle $ \Theta $. The value of $ -(1+\Delta)/ $ 3 also determined by a $ \mathrm{t} \bar{\mathrm{t}} $ MC simulation as a function of $ m({\mathrm{t}\bar{\mathrm{t}}} ) $ and $ \beta_z({\mathrm{t}\bar{\mathrm{t}}} ) $ is shown on the right. In both figures the black solid lines represent the $ D=-1/ $ 3 boundary for entanglement, while the black dashed line indicates the selected phase space in this analysis. The minimum value on the $ z $ axis of-1 corresponds to the boundary $ \mathrm{tr}[C]= $ 3, a maximally entangled state. Top quarks with no spin correlations correspond to a value of $ D= $ 0 and $ \Delta=- $ 1 ($ C=\mathbf{0} $). |

png pdf |
Figure 3:
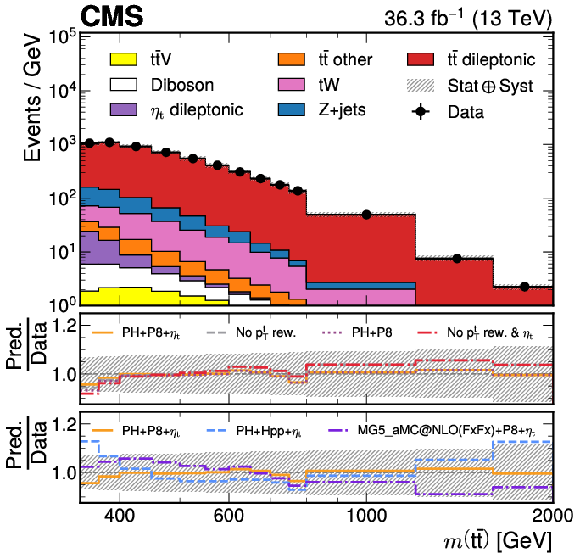
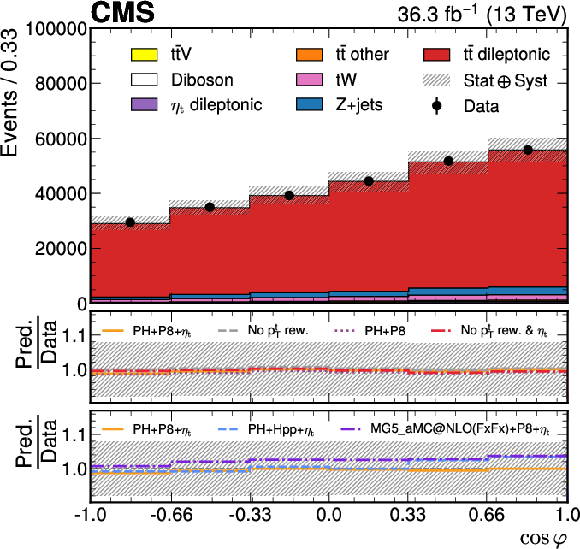
Reconstruction-level $ m({\mathrm{t}\bar{\mathrm{t}}} ) $ (upper left), $ p_{\mathrm{T}}(\mathrm{t}/\bar{\mathrm{t}}) $ (upper right), and $ \cos\varphi $ (lower) distributions of the combined signal model (POWHEGv2$+$PYTHIA-8${+}\eta$t, labeled PH$+$P8${+}\eta$t) in the full phase space comparing the modeling of the data by MC simulation when not including $\eta$t contributions (purple dotted line in the upper panel under each plot), or no $ p_{\mathrm{T}}(\mathrm{t}/\bar{\mathrm{t}}) $ reweighting is applied (gray dashed line in the upper panel), or neither of those (red dashed-dotted line in upper panel). The lower panel under each plot compares the data to POWHEGv2$+$HERWIG++ (blue dashed line, labeled PH$+$HPP${+}\eta$t), to MG5_MC@NLO-FxFx$+$PYTHIA-8 (purple dashed-dotted line), and finally to the nominal MC including $\eta$t contributions and $ p_{\mathrm{T}}(\mathrm{t}/\bar{\mathrm{t}}) $ reweighting (orange solid line, labeled PH$+$P8${+}\eta$t). The hashed uncertainty bands correspond to the pre-fit systematic uncertainties and includes the statistical uncertainty of the data as well. The label ``$ p_{\mathrm{T}} $ rew.'' in the legend refers to the $ p_{\mathrm{T}} $ reweighting procedure (detailed in Section 7) used to reweight the $ \mathrm{t} \bar{\mathrm{t}} $ sample to NNLO in QCD. |
png pdf |
Figure 3-a:
Reconstruction-level $ m({\mathrm{t}\bar{\mathrm{t}}} ) $ (upper left), $ p_{\mathrm{T}}(\mathrm{t}/\bar{\mathrm{t}}) $ (upper right), and $ \cos\varphi $ (lower) distributions of the combined signal model (POWHEGv2$+$PYTHIA-8${+}\eta$t, labeled PH$+$P8${+}\eta$t) in the full phase space comparing the modeling of the data by MC simulation when not including $\eta$t contributions (purple dotted line in the upper panel under each plot), or no $ p_{\mathrm{T}}(\mathrm{t}/\bar{\mathrm{t}}) $ reweighting is applied (gray dashed line in the upper panel), or neither of those (red dashed-dotted line in upper panel). The lower panel under each plot compares the data to POWHEGv2$+$HERWIG++ (blue dashed line, labeled PH$+$HPP${+}\eta$t), to MG5_MC@NLO-FxFx$+$PYTHIA-8 (purple dashed-dotted line), and finally to the nominal MC including $\eta$t contributions and $ p_{\mathrm{T}}(\mathrm{t}/\bar{\mathrm{t}}) $ reweighting (orange solid line, labeled PH$+$P8${+}\eta$t). The hashed uncertainty bands correspond to the pre-fit systematic uncertainties and includes the statistical uncertainty of the data as well. The label ``$ p_{\mathrm{T}} $ rew.'' in the legend refers to the $ p_{\mathrm{T}} $ reweighting procedure (detailed in Section 7) used to reweight the $ \mathrm{t} \bar{\mathrm{t}} $ sample to NNLO in QCD. |

png pdf |
Figure 3-b:
Reconstruction-level $ m({\mathrm{t}\bar{\mathrm{t}}} ) $ (upper left), $ p_{\mathrm{T}}(\mathrm{t}/\bar{\mathrm{t}}) $ (upper right), and $ \cos\varphi $ (lower) distributions of the combined signal model (POWHEGv2$+$PYTHIA-8${+}\eta$t, labeled PH$+$P8${+}\eta$t) in the full phase space comparing the modeling of the data by MC simulation when not including $\eta$t contributions (purple dotted line in the upper panel under each plot), or no $ p_{\mathrm{T}}(\mathrm{t}/\bar{\mathrm{t}}) $ reweighting is applied (gray dashed line in the upper panel), or neither of those (red dashed-dotted line in upper panel). The lower panel under each plot compares the data to POWHEGv2$+$HERWIG++ (blue dashed line, labeled PH$+$HPP${+}\eta$t), to MG5_MC@NLO-FxFx$+$PYTHIA-8 (purple dashed-dotted line), and finally to the nominal MC including $\eta$t contributions and $ p_{\mathrm{T}}(\mathrm{t}/\bar{\mathrm{t}}) $ reweighting (orange solid line, labeled PH$+$P8${+}\eta$t). The hashed uncertainty bands correspond to the pre-fit systematic uncertainties and includes the statistical uncertainty of the data as well. The label ``$ p_{\mathrm{T}} $ rew.'' in the legend refers to the $ p_{\mathrm{T}} $ reweighting procedure (detailed in Section 7) used to reweight the $ \mathrm{t} \bar{\mathrm{t}} $ sample to NNLO in QCD. |
png pdf |
Figure 3-c:
Reconstruction-level $ m({\mathrm{t}\bar{\mathrm{t}}} ) $ (upper left), $ p_{\mathrm{T}}(\mathrm{t}/\bar{\mathrm{t}}) $ (upper right), and $ \cos\varphi $ (lower) distributions of the combined signal model (POWHEGv2$+$PYTHIA-8${+}\eta$t, labeled PH$+$P8${+}\eta$t) in the full phase space comparing the modeling of the data by MC simulation when not including $\eta$t contributions (purple dotted line in the upper panel under each plot), or no $ p_{\mathrm{T}}(\mathrm{t}/\bar{\mathrm{t}}) $ reweighting is applied (gray dashed line in the upper panel), or neither of those (red dashed-dotted line in upper panel). The lower panel under each plot compares the data to POWHEGv2$+$HERWIG++ (blue dashed line, labeled PH$+$HPP${+}\eta$t), to MG5_MC@NLO-FxFx$+$PYTHIA-8 (purple dashed-dotted line), and finally to the nominal MC including $\eta$t contributions and $ p_{\mathrm{T}}(\mathrm{t}/\bar{\mathrm{t}}) $ reweighting (orange solid line, labeled PH$+$P8${+}\eta$t). The hashed uncertainty bands correspond to the pre-fit systematic uncertainties and includes the statistical uncertainty of the data as well. The label ``$ p_{\mathrm{T}} $ rew.'' in the legend refers to the $ p_{\mathrm{T}} $ reweighting procedure (detailed in Section 7) used to reweight the $ \mathrm{t} \bar{\mathrm{t}} $ sample to NNLO in QCD. |
png pdf |
Figure 4:
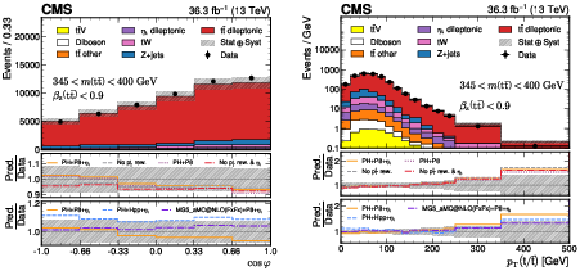
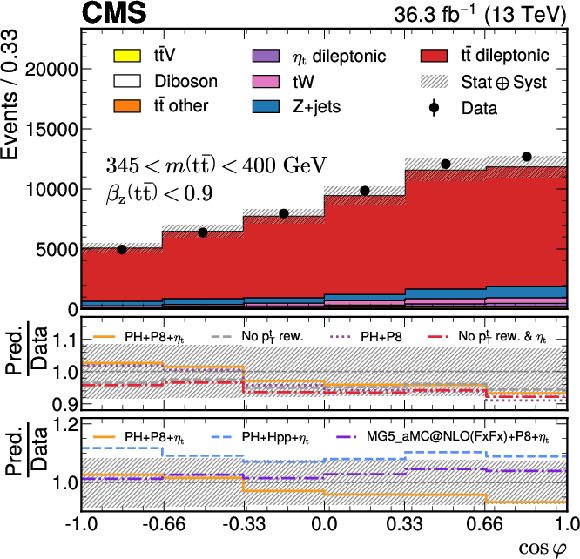
Reconstruction-level distributions of $ \cos\varphi $ (left) and $ p_{\mathrm{T}}(\mathrm{t}/\bar{\mathrm{t}}) $ (right) requiring 345 $ < m({\mathrm{t}\bar{\mathrm{t}}} ) < $ 400 GeV and $ \beta_z({\mathrm{t}\bar{\mathrm{t}}} ) < $ 0.9. The lower panels on each figure show the same model comparison done in Fig. 3. The hashed uncertainty bands correspond to the pre-fit systematic uncertainties and includes the statistical uncertainty of the data as well. The label ``$ p_{\mathrm{T}} $ rew.'' in the legend refers to the $ p_{\mathrm{T}} $ reweighting procedure (detailed in Section 7) used to reweight the $ \mathrm{t} \bar{\mathrm{t}} $ sample to NNLO in QCD. |
png pdf |
Figure 4-a:
Reconstruction-level distributions of $ \cos\varphi $ (left) and $ p_{\mathrm{T}}(\mathrm{t}/\bar{\mathrm{t}}) $ (right) requiring 345 $ < m({\mathrm{t}\bar{\mathrm{t}}} ) < $ 400 GeV and $ \beta_z({\mathrm{t}\bar{\mathrm{t}}} ) < $ 0.9. The lower panels on each figure show the same model comparison done in Fig. 3. The hashed uncertainty bands correspond to the pre-fit systematic uncertainties and includes the statistical uncertainty of the data as well. The label ``$ p_{\mathrm{T}} $ rew.'' in the legend refers to the $ p_{\mathrm{T}} $ reweighting procedure (detailed in Section 7) used to reweight the $ \mathrm{t} \bar{\mathrm{t}} $ sample to NNLO in QCD. |
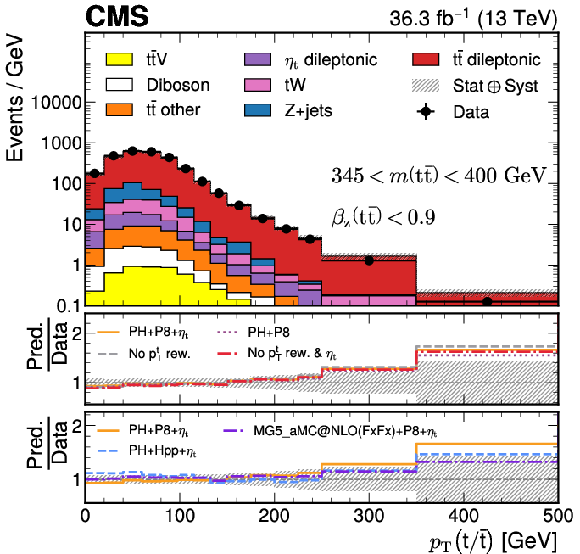
png pdf |
Figure 4-b:
Reconstruction-level distributions of $ \cos\varphi $ (left) and $ p_{\mathrm{T}}(\mathrm{t}/\bar{\mathrm{t}}) $ (right) requiring 345 $ < m({\mathrm{t}\bar{\mathrm{t}}} ) < $ 400 GeV and $ \beta_z({\mathrm{t}\bar{\mathrm{t}}} ) < $ 0.9. The lower panels on each figure show the same model comparison done in Fig. 3. The hashed uncertainty bands correspond to the pre-fit systematic uncertainties and includes the statistical uncertainty of the data as well. The label ``$ p_{\mathrm{T}} $ rew.'' in the legend refers to the $ p_{\mathrm{T}} $ reweighting procedure (detailed in Section 7) used to reweight the $ \mathrm{t} \bar{\mathrm{t}} $ sample to NNLO in QCD. |
png pdf |
Figure 5:
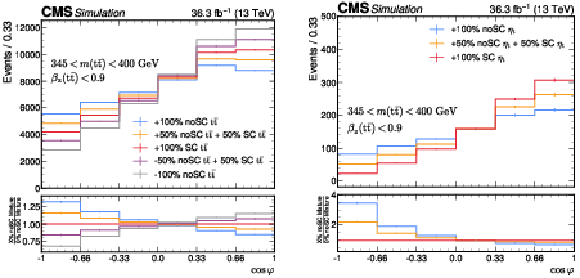
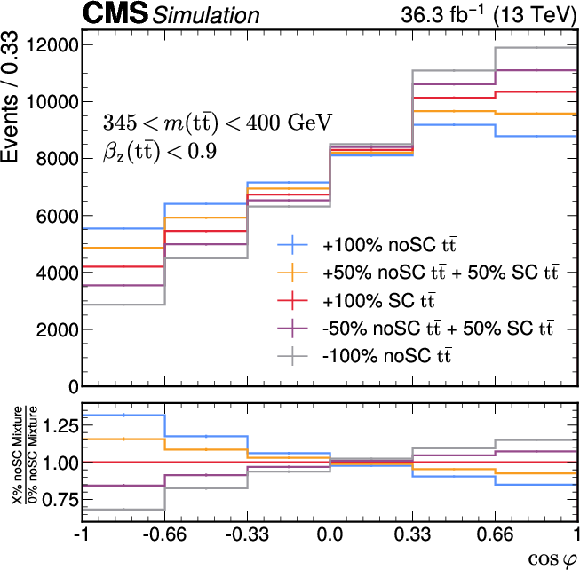
Reconstruction-level distribution of the combined $ {\mathrm{t}\bar{\mathrm{t}}} {+} {\eta}$t signal model in mixtures of the noSC combined signal sample. Template variations as a function of $ \cos\varphi $ requiring an $ m({\mathrm{t}\bar{\mathrm{t}}} ) $ of 345 $ < m({\mathrm{t}\bar{\mathrm{t}}} ) < $ 400 GeV and $ \beta_z({\mathrm{t}\bar{\mathrm{t}}} ) < $ 0.9 are shown. The $ \mathrm{t} \bar{\mathrm{t}} $ noSC and SC mixtures ranging from $ -100% $ to $ +100% $ noSC are shown on the left. The $\eta$t noSC and SC mixtures ranging from zero noSC to $ +100% $ noSC are shown on the right. |
png pdf |
Figure 5-a:
Reconstruction-level distribution of the combined $ {\mathrm{t}\bar{\mathrm{t}}} {+} {\eta}$t signal model in mixtures of the noSC combined signal sample. Template variations as a function of $ \cos\varphi $ requiring an $ m({\mathrm{t}\bar{\mathrm{t}}} ) $ of 345 $ < m({\mathrm{t}\bar{\mathrm{t}}} ) < $ 400 GeV and $ \beta_z({\mathrm{t}\bar{\mathrm{t}}} ) < $ 0.9 are shown. The $ \mathrm{t} \bar{\mathrm{t}} $ noSC and SC mixtures ranging from $ -100% $ to $ +100% $ noSC are shown on the left. The $\eta$t noSC and SC mixtures ranging from zero noSC to $ +100% $ noSC are shown on the right. |

png pdf |
Figure 5-b:
Reconstruction-level distribution of the combined $ {\mathrm{t}\bar{\mathrm{t}}} {+} {\eta}$t signal model in mixtures of the noSC combined signal sample. Template variations as a function of $ \cos\varphi $ requiring an $ m({\mathrm{t}\bar{\mathrm{t}}} ) $ of 345 $ < m({\mathrm{t}\bar{\mathrm{t}}} ) < $ 400 GeV and $ \beta_z({\mathrm{t}\bar{\mathrm{t}}} ) < $ 0.9 are shown. The $ \mathrm{t} \bar{\mathrm{t}} $ noSC and SC mixtures ranging from $ -100% $ to $ +100% $ noSC are shown on the left. The $\eta$t noSC and SC mixtures ranging from zero noSC to $ +100% $ noSC are shown on the right. |
png pdf |
Figure 6:
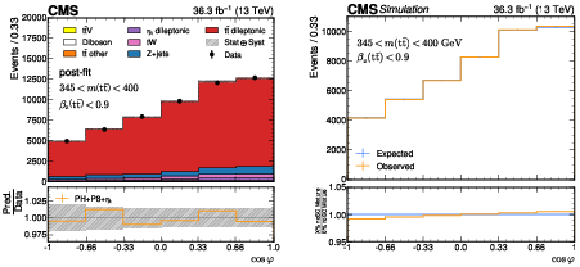
The post-fit detector-level distribution of $ \cos\varphi $ requiring 345 $ < m({\mathrm{t}\bar{\mathrm{t}}} ) < $ 400 GeV, $ \beta_z({\mathrm{t}\bar{\mathrm{t}}} ) < $ 0.9, and including $\eta$t in the fit, is shown on the left. The hashed band corresponds to the post-fit uncertainty and includes the statistical uncertainty of the data added in quadrature. The nominal combined signal model, POWHEGv2$+$PYTHIA-8${+}\eta$t, is labeled as PH$+$P8${+}\eta$t. The fitted noSC and SC mixture template for the combined signal model in the $ \cos\varphi $ distribution is shown on the right. |

png pdf |
Figure 6-a:
The post-fit detector-level distribution of $ \cos\varphi $ requiring 345 $ < m({\mathrm{t}\bar{\mathrm{t}}} ) < $ 400 GeV, $ \beta_z({\mathrm{t}\bar{\mathrm{t}}} ) < $ 0.9, and including $\eta$t in the fit, is shown on the left. The hashed band corresponds to the post-fit uncertainty and includes the statistical uncertainty of the data added in quadrature. The nominal combined signal model, POWHEGv2$+$PYTHIA-8${+}\eta$t, is labeled as PH$+$P8${+}\eta$t. The fitted noSC and SC mixture template for the combined signal model in the $ \cos\varphi $ distribution is shown on the right. |

png pdf |
Figure 6-b:
The post-fit detector-level distribution of $ \cos\varphi $ requiring 345 $ < m({\mathrm{t}\bar{\mathrm{t}}} ) < $ 400 GeV, $ \beta_z({\mathrm{t}\bar{\mathrm{t}}} ) < $ 0.9, and including $\eta$t in the fit, is shown on the left. The hashed band corresponds to the post-fit uncertainty and includes the statistical uncertainty of the data added in quadrature. The nominal combined signal model, POWHEGv2$+$PYTHIA-8${+}\eta$t, is labeled as PH$+$P8${+}\eta$t. The fitted noSC and SC mixture template for the combined signal model in the $ \cos\varphi $ distribution is shown on the right. |
png pdf |
Figure 7:
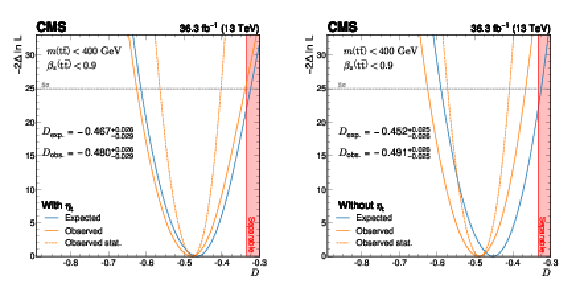
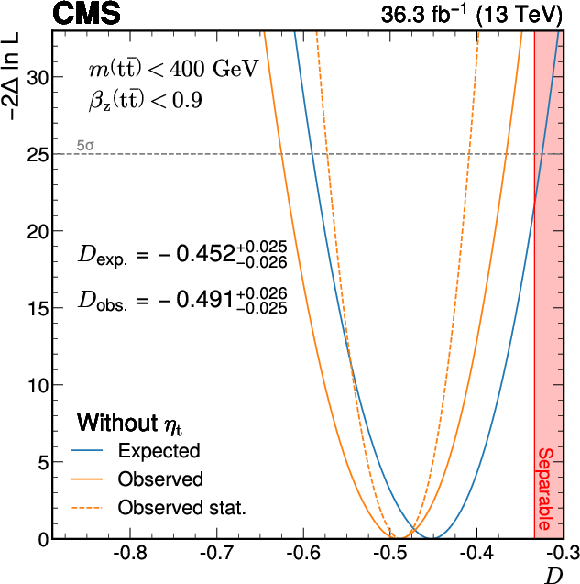
Result of the scan of the quantity $ -2\Delta\ln L $ from a profile likelihood fit as a function of the parameter of interest $ D $, when including (left) or excluding (right) the $\eta$t contribution. Both results are at parton level and the relevant phase space is indicated in the figures itself. The region where the $ \mathrm{t} \bar{\mathrm{t}} $ pairs become separable and not entangled ($ D > -1/ $ 3) is indicated by the shaded area. |

png pdf |
Figure 7-a:
Result of the scan of the quantity $ -2\Delta\ln L $ from a profile likelihood fit as a function of the parameter of interest $ D $, when including (left) or excluding (right) the $\eta$t contribution. Both results are at parton level and the relevant phase space is indicated in the figures itself. The region where the $ \mathrm{t} \bar{\mathrm{t}} $ pairs become separable and not entangled ($ D > -1/ $ 3) is indicated by the shaded area. |
png pdf |
Figure 7-b:
Result of the scan of the quantity $ -2\Delta\ln L $ from a profile likelihood fit as a function of the parameter of interest $ D $, when including (left) or excluding (right) the $\eta$t contribution. Both results are at parton level and the relevant phase space is indicated in the figures itself. The region where the $ \mathrm{t} \bar{\mathrm{t}} $ pairs become separable and not entangled ($ D > -1/ $ 3) is indicated by the shaded area. |

png pdf |
Figure 9:
Summary of the measurement of the entanglement proxy $ D $ in data (black filled or open point) compared with MC predictions including (solid line) or not including (dashed line) contributions from the $\eta$t state. The legend denotes MC predictions without the $\eta$t state with a slash through $\eta$t. Inner error bars represent the statistical uncertainty, while the outer error bars represent the total uncertainty for data. The statistical uncertainty in the MC predictions is denoted by the light shaded region and the total uncertainty, including scale and PDF uncertainties, is represented by the darker shaded region. The boundary for entanglement is indicated by the shaded region at $ D=-1/ $ 3. |
| Tables | |

png pdf |
Table 1:
The expected number of events from signal and background contributions after event selection, compared with the number observed in data. The `` $ \mathrm{t} \bar{\mathrm{t}} $ other'' category includes mis-identified semileptonic and fully hadronic decays, and hadronic decays of tau leptons of the $ \mathrm{t} \bar{\mathrm{t}} $ pairs. The uncertainties include only the MC statistical uncertainties. The ``Only $\eta$t '' contribution is not added to the total MC prediction since it is included in the combined ($ {\mathrm{t}\bar{\mathrm{t}}} {+} {\eta}$t) signal contribution. |
png pdf |
Table 2:
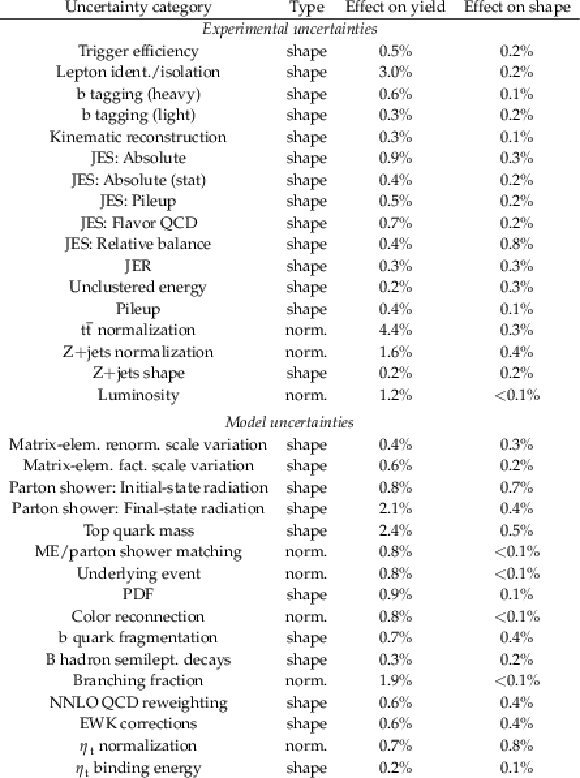
An overview of the systematic uncertainties and their impact on the yields and shape of the $ \cos\varphi $ distribution. The uncertainties are categorized by their type where ``norm.'' refers to normalization uncertainties modeled with a log-normal prior and ``shape'' refers to shape uncertainties. The impact on the yields and shape of the $ \cos\varphi $ distribution is given in percent where the difference in the shape of the $ \cos\varphi $ distribution is determined from the forward-backward asymmetry. The JES systematics are split as in Ref. [70] with the addition of ``JES: Relative Balance'' accounting for the difference in modeling of missing transverse momentum. |

png pdf |
Table 3:
The number of predicted and observed events in the selected phase space, before the fit to the data (pre-fit) and with their best fit normalizations (post-fit). The uncertainties in the pre-fit and post-fit yields reflect total uncertanties but do not include correlations. The ``Only $\eta$t '' contribution is not added to the total MC prediction since it is included in the combined signal contribution. |
| Summary |
| Entanglement is an intrinsic property of quantum mechanics and its measurement utilizes elementary particles to test quantum mechanics. Recently, the ATLAS Collaboration reported the first observation of entanglement in the top quark-antiquark ($ \mathrm{t} \bar{\mathrm{t}} $) system [21] wih a result indicating slight deviation from MC simulation. The measurement of the entanglement of $ \mathrm{t} \bar{\mathrm{t}} $ pairs performed with CMS data exploits the spin correlation variable $ D $, which at the $ \mathrm{t} \bar{\mathrm{t}} $ production threshold, and in absence of BSM contributions, provides access to the full spin correlation information. This result contrasts with the ATLAS Collaboration's findings in several key ways. We directly measure entanglement at the parton level, whereas ATLAS reports their observable at the particle level. Additionally, our analysis is the first to consider non-relativistic bound-state effects in the production threshold by including the ground state of toponium, $\eta$t, which were not included in the ATLAS result. Unlike ATLAS, the CMS result is derived from a binned likelihood fit to extract the entanglement proxy, rather than using a calibration curve. The $ D $ variable represents an entanglement proxy, where less than $ -1/ $ 3 signals the presence of entanglement. This proxy is measured using events containing two oppositely charged electrons or muons produced in pp collisions at a center-of-mass energy of 13 TeV. The modeling of the data is improved when including the additional predicted contribution of the ground state of toponium, $\eta$t, and is utilized in a combined signal model of $ {\mathrm{t}\bar{\mathrm{t}}} {+} {\eta}$t in the measurement. The extent to which $ \mathrm{t} \bar{\mathrm{t}} $ pairs are entangled is measured by means of a binned profile likelihood fit of the parameter of interest $ D $ directly from the distribution of $ \cos\varphi $, where $ \varphi $ is the angle between the two charged decay leptons in their respective parent top quark rest frames. In the most sensitive kinematic phase space of the relative velocity between the lab and $ \mathrm{t} \bar{\mathrm{t}} $ reference frames $ \beta_z({\mathrm{t}\bar{\mathrm{t}}} ) < $ 0.9, and of the invariant mass of the top quark pair 345 $ < m({\mathrm{t}\bar{\mathrm{t}}} ) < $ 400 GeV, the fit of the $ \cos\varphi $ distribution yields an observed value of $ D=-$0.480$^{+0.026}_{-0.029} $ and an expected value of $ D=-$0.467$ ^{+0.026}_{-0.029} $ including the predicted $\eta$t state. This result has an observed (expected) significance of 5.1 (4.7) $ \sigma $, corresponding to the observation of top quark entanglement. The measured value of $ D $ is in good agreement with the MC modeling in this phase space when including the expected $\eta$t bound state contribution. |
| References | ||||
| 1 | S. J. Freedman and J. F. Clauser | Experimental test of local hidden-variable theories | PRL 28 (1972) 938 | |
| 2 | A. Aspect, J. Dalibard, and G. Roger | Experimental test of Bell's inequalities using time-varying analyzers | PRL 49 (1982) 1804 | |
| 3 | A. Vaziri, G. Weihs, and A. Zeilinger | Experimental two-photon, three-dimensional entanglement for quantum communication | PRL 89 (2002) 240401 | |
| 4 | A. Aspect, P. Grangier, and G. Roger | Experimental realization of Einstein-Podolsky-Rosen-Bohm gedankenexperiment: A new violation of Bell's inequalities | PRL 49 (1982) 91 | |
| 5 | B. Hensen et al. | Loophole-free Bell inequality violation using electron spins separated by 1.3 kilometres | Nature 526 (2015) 682 | 1508.05949 |
| 6 | M. Giustina et al. | Significant-loophole-free test of Bell's theorem with entangled photons | PRL 115 (2015) 250401 | 1511.03190 |
| 7 | W. Pfaff et al. | Demonstration of entanglement-by-measurement of solid-state qubits | Nature Phys. 9 (2012) 29 | |
| 8 | J. S. Bell | On the Einstein-Podolsky-Rosen paradox | Phys. Phys. Fiz. 1 (1964) 195 | |
| 9 | M. A. Rowe et al. | Experimental violation of a Bell's inequality with efficient detection | Nature 409 (2001) 791 | |
| 10 | M. Ansmann et al. | Violation of Bell's inequality in Josephson phase qubits | Nature 461 (2009) 504 | |
| 11 | A. Einstein, B. Podolsky, and N. Rosen | Can quantum-mechanical description of physical reality be considered complete? | PR 47 (1935) 777 | |
| 12 | A. J. Barr, P. Caban, and J. Rembieli \'n ski | Bell-type inequalities for systems of relativistic vector bosons | Quantum 7 (2023) 1070 | 2204.11063 |
| 13 | A. J. Barr | Testing Bell inequalities in Higgs boson decays | PLB 825 (2022) 136866 | 2106.01377 |
| 14 | J. A. Aguilar-Saavedra | Laboratory-frame tests of quantum entanglement in $ {\mathrm{H}\to\mathrm{W}\mathrm{W}} $ | PRD 107 (2023) 076016 | 2209.14033 |
| 15 | J. A. Aguilar-Saavedra, A. Bernal, J. A. Casas, and J. M. Moreno | Testing entanglement and Bell inequalities in $ {\mathrm{H}\to\mathrm{Z}\mathrm{Z}} $ | PRD 107 (2023) 016012 | 2209.13441 |
| 16 | M. M. Altakach et al. | Quantum information and $ {CP} $ measurement in $ {\mathrm{H}\to\tau^{+}\tau^{-}} $ at future lepton colliders | PRD 107 (2023) 093002 | 2211.10513 |
| 17 | K. Cheng, T. Han, and M. Low | Optimizing fictitious states for Bell inequality violation in bipartite qubit systems | 2311.09166 | |
| 18 | T. Han, M. Low, and T. A. Wu | Quantum entanglement and Bell inequality violation in semi-leptonic top decays | 2310.17696 | |
| 19 | Z. Dong, D. Gon ç alves, K. Kong, and A. Navarro | When the machine chimes the Bell: Entanglement and Bell inequalities with boosted $ \mathrm{t} \overline{\mathrm{t}} $ | 2305.07075 | |
| 20 | M. Varma and O. K. Baker | Quantum entanglement in top quark pair production | Nucl. Phys. A 1042 (2024) 122795 | 2306.07788 |
| 21 | A. J. Barr et al. | Quantum entanglement and Bell inequality violation at colliders | Prog. Part. Nucl. Phys. 139 (2024) 104134 | 2402.07972 |
| 22 | M. Fabbrichesi, R. Floreanini, E. Gabrielli, and L. Marzola | Bell inequalities and quantum entanglement in weak gauge boson production at the LHC and future colliders | EPJC 83 (2023) 823 | 2302.00683 |
| 23 | K. Cheng, T. Han, and M. Low | Optimizing entanglement and Bell inequality violation in top anti-top events | 2407.01672 | |
| 24 | S. A. Abel, M. Dittmar, and H. Dreiner | Testing locality at colliders via Bell's inequality? | PLB 280 (1992) 304 | |
| 25 | M. Fabbrichesi, R. Floreanini, E. Gabrielli, and L. Marzola | Bell inequality is violated \\ in $ {\mathrm{B}^0} {\rightarrow} \mathrm{J}/\psi $\HepParticleResonanceFull$ \mathrm{K} $\ast8920 decays | PRD 109 (2024) L031104 | 2305.04982 |
| 26 | ATLAS Collaboration | Observation of quantum entanglement in top-quark pairs using the ATLAS detector | Submitted to Nature, 2023 | 2311.07288 |
| 27 | Y. Afik and J. R. M. de Nova | Entanglement and quantum tomography with top quarks at the LHC | Eur. Phys. J. Plus 136 (2021) 907 | 2003.02280 |
| 28 | M. Fabbrichesi, R. Floreanini, and G. Panizzo | Testing Bell inequalities at the LHC with top-quark pairs | PRL 127 (2021) 161801 | 2102.11883 |
| 29 | C. Severi, C. Degli Esposti Boschi, F. Maltoni, and M. Sioli | Quantum tops at the LHC: from entanglement to Bell inequalities | EPJC 82 (2022) 285 | 2110.10112 |
| 30 | R. Iengo | Sommerfeld enhancement: general results from field theory diagrams | JHEP 05 (2009) 024 | |
| 31 | R. Mammen Abraham and D. Gon ç alves | Boosting new physics searches in $ {{\mathrm{t}\overline{\mathrm{t}}} \mathrm{Z}} $ and $ {\mathrm{t}\mathrm{Z}\mathrm{j}} $ production with angular moments | EPJC 83 (2023) 965 | 2208.05986 |
| 32 | D. Gon ç alves, J. H. Kim, K. Kong, and Y. Wu | Direct Higgs-top $ {CP} $-phase measurement with $ {{\mathrm{t}\overline{\mathrm{t}}} \mathrm{h}} $ at the 14 TeV LHC and 100 TeV FCC | JHEP 01 (2022) 158 | 2108.01083 |
| 33 | R. Aoude, E. Madge, F. Maltoni, and L. Mantani | Quantum SMEFT tomography: Top quark pair production at the LHC | PRD 106 (2022) 055007 | 2203.05619 |
| 34 | H. Baer et al. | Top squarks from the landscape at high luminosity LHC | PRD 108 (2023) 075027 | 2307.08067 |
| 35 | C. Severi and E. Vryonidou | Quantum entanglement and top spin correlations in SMEFT at higher orders | JHEP 01 (2023) 148 | 2210.09330 |
| 36 | M. Fabbrichesi, R. Floreanini, and E. Gabrielli | Constraining new physics in entangled two-qubit systems: top-quark, tau-lepton and photon pairs | EPJC 83 (2023) 162 | 2208.11723 |
| 37 | F. Maltoni, C. Severi, S. Tentori, and E. Vryonidou | Quantum detection of new physics in top-quark pair production at the LHC | JHEP 03 (2024) 099 | 2401.08751 |
| 38 | F. Maltoni, C. Severi, S. Tentori, and E. Vryonidou | Quantum tops at circular lepton colliders | 2404.08049 | |
| 39 | Particle Data Group , R. L. Workman et al. | Review of particle physics | Prog. Theor. Exp. Phys. 2022 (2022) 083C01 | |
| 40 | G. Mahlon and S. J. Parke | Spin correlation effects in top quark pair production at the LHC | PRD 81 (2010) 074024 | 1001.3422 |
| 41 | CMS Collaboration | Measurement of the top quark polarization and $ \mathrm{t} \overline{\mathrm{t}} $ spin correlations using dilepton final states in proton-proton collisions at $ \sqrt{s}= $ 13 TeV | PRD 100 (2019) 072002 | CMS-TOP-18-006 1907.03729 |
| 42 | M. Czakon and A. Mitov | top++: a program for the calculation of the top-pair cross-section at hadron colliders | Comput. Phys. Commun. 185 (2014) 2930 | 1112.5675 |
| 43 | M. Czakon and A. Mitov | NNLO corrections to top-pair production at hadron colliders: the all-fermionic scattering channels | JHEP 12 (2012) 054 | 1207.0236 |
| 44 | M. Czakon and A. Mitov | NNLO corrections to top pair production at hadron colliders: the quark-gluon reaction | JHEP 01 (2013) 080 | 1210.6832 |
| 45 | M. Czakon, P. Fiedler, and A. Mitov | Total top-quark pair-production cross section at hadron colliders through $ \mathcal{O}({\alpha_\mathrm{S}}^4) $ | PRL 110 (2013) 252004 | 1303.6254 |
| 46 | B. Fuks, K. Hagiwara, K. Ma, and Y.-J. Zheng | Signatures of toponium formation in LHC run 2 data | PRD 104 (2021) 034023 | 2102.11281 |
| 47 | N. Brambilla, A. Pineda, J. Soto, and A. Vairo | Potential NRQCD: an effective theory for heavy quarkonium | NPB 566 (2000) 275 | hep-ph/9907240 |
| 48 | CMS Collaboration | Differential cross section measurements for the production of top quark pairs and of additional jets using dilepton events from $ {\mathrm{p}\mathrm{p}} $ collisions at $ \sqrt{s}= $ 13 TeV | Submitted to JHEP, 2024 | CMS-TOP-20-006 2402.08486 |
| 49 | CMS Collaboration | Measurements of $ \mathrm{t} \overline{\mathrm{t}} $ differential cross sections in proton-proton collisions at $ \sqrt{s}= $ 13 TeV using events containing two leptons | JHEP 02 (2019) 149 | CMS-TOP-17-014 1811.06625 |
| 50 | CMS Collaboration | Measurement of differential cross sections for top quark pair production using the lepton+jets final state in proton-proton collisions at 13 TeV | PRD 95 (2017) 092001 | CMS-TOP-16-008 1610.04191 |
| 51 | ATLAS Collaboration | Measurements of $ \mathrm{t} \overline{\mathrm{t}} $ differential cross-sections of highly boosted top quarks decaying to all-hadronic final states in $ {\mathrm{p}\mathrm{p}} $ collisions at $ \sqrt{s}= $ 13 TeV using the ATLAS detector | PRD 98 (2018) 012003 | 1801.02052 |
| 52 | ATLAS Collaboration | Measurement of the $ \mathrm{t} \overline{\mathrm{t}} $ production cross-section in the lepton+jets channel at $ \sqrt{s}= $ 13 TeV with the ATLAS experiment | PLB 810 (2020) 135797 | 2006.13076 |
| 53 | Y. Kiyo et al. | Top-quark pair production near threshold at LHC | EPJC 60 (2009) 375 | 0812.0919 |
| 54 | W.-L. Ju et al. | Top quark pair production near threshold: single/double distributions and mass determination | JHEP 06 (2020) 158 | 2004.03088 |
| 55 | Y. Sumino and H. Yokoya | Bound-state effects on kinematical distributions of top quarks at hadron colliders | JHEP 09 (2010) 034 | 1007.0075 |
| 56 | V. S. Fadin, V. A. Khoze, and T. Sjöstrand | On the threshold behaviour of heavy top production | Z. Phys. C 48 (1990) 613 | |
| 57 | M. Beneke et al. | Next-to-leading power endpoint factorization and resummation for off-diagonal `gluon' thrust | JHEP 07 (2022) 144 | 2205.04479 |
| 58 | G. Mahlon and S. J. Parke | Angular correlations in top quark pair production and decay at hadron colliders | PRD 53 (1996) 4886 | hep-ph/9512264 |
| 59 | W. Bernreuther, D. Heisler, and Z.-G. Si | A set of top quark spin correlation and polarization observables for the LHC: Standard model predictions and new physics contributions | JHEP 12 (2015) 026 | 1508.05271 |
| 60 | A. Brandenburg, Z. G. Si, and P. Uwer | QCD-corrected spin analysing power of jets in decays of polarized top quarks | PLB 539 (2002) 235 | hep-ph/0205023 |
| 61 | CDF Collaboration | Measurement of $ \mathrm{t} \overline{\mathrm{t}} $ spin correlation in $ {\mathrm{p}\overline{\mathrm{p}}} $ collisions using the CDF II detector at the Tevatron | PRD 83 (2011) 031104 | 1012.3093 |
| 62 | A. Peres | Separability criterion for density matrices | PRL 77 (1996) 1413 | quant-ph/9604005 |
| 63 | M. Horodecki, P. Horodecki, and R. Horodecki | On the necessary and sufficient conditions for separability of mixed quantum states | Phys. Lett. A 223 (1996) 1 | quant-ph/9605038 |
| 64 | M. Baumgart and B. Tweedie | A new twist on top quark spin correlations | JHEP 03 (2013) 117 | 1212.4888 |
| 65 | R. Horodecki, P. Horodecki, and M. Horodecki | Violating Bell inequality by mixed spin-1/2 states: necessary and sufficient condition | Phys. Lett. A 200 (1995) 340 | |
| 66 | J. A. Aguilar-Saavedra and J. A. Casas | Improved tests of entanglement and Bell inequalities with LHC tops | EPJC 82 (2022) 666 | 2205.00542 |
| 67 | CMS Collaboration | Projection of the top quark spin correlation measurement and search for top squark pair production at the HL-LHC | CMS Physics Analysis Summary, 2022 CMS-PAS-FTR-18-034 |
CMS-PAS-FTR-18-034 |
| 68 | CMS Collaboration | The CMS statistical analysis and combination tool: combine | Submitted to Comput. Softw. Big Sci, 2024 | CMS-CAT-23-001 2404.06614 |
| 69 | W. Verkerke and D. Kirkby | The RooFit toolkit for data modeling | in Proc. 13th International Conference on Computing in High Energy and Nuclear Physics (CHEP ): La Jolla CA, 2003 [eConf C0303241 MOLT007] |
physics/0306116 |
| 70 | L. Moneta et al. | The RooStats project | in Proc. 13th International Workshop on Advanced Computing and Analysis Techniques in Physics Research (ACAT ): Jaipur, India, 2010 [PoS (ACAT) 057] |
1009.1003 |
| 71 | CMS Collaboration | The CMS trigger system | JINST 12 (2017) P01020 | CMS-TRG-12-001 1609.02366 |
| 72 | CMS Collaboration | The CMS experiment at the CERN LHC | JINST 3 (2008) S08004 | |
| 73 | CMS Collaboration | Development of the CMS detector for the CERN LHC Run 3 | JINST 19 (2024) P05064 | CMS-PRF-21-001 2309.05466 |
| 74 | CMS Collaboration | Particle-flow reconstruction and global event description with the CMS detector | JINST 12 (2017) P10003 | CMS-PRF-14-001 1706.04965 |
| 75 | M. Cacciari, G. P. Salam, and G. Soyez | The anti-$ k_{\mathrm{T}} $ jet clustering algorithm | JHEP 04 (2008) 063 | 0802.1189 |
| 76 | M. Cacciari, G. P. Salam, and G. Soyez | FASTJET user manual | EPJC 72 (2012) 1896 | 1111.6097 |
| 77 | CMS Collaboration | Pileup mitigation at CMS in 13 TeV data | JINST 15 (2020) P09018 | CMS-JME-18-001 2003.00503 |
| 78 | CMS Collaboration | Jet energy scale and resolution in the CMS experiment in $ {\mathrm{p}\mathrm{p}} $ collisions at 8 TeV | JINST 12 (2017) P02014 | CMS-JME-13-004 1607.03663 |
| 79 | CMS Collaboration | Performance of missing transverse momentum reconstruction in proton-proton collisions at $ \sqrt{s}= $ 13 TeV using the CMS detector | JINST 14 (2019) P07004 | CMS-JME-17-001 1903.06078 |
| 80 | CMS Collaboration | Performance of electron reconstruction and selection with the CMS detector in proton-proton collisions at $ \sqrt{s}= $ 8 TeV | JINST 10 (2015) P06005 | CMS-EGM-13-001 1502.02701 |
| 81 | CMS Collaboration | Electron and photon reconstruction and identification with the CMS experiment at the CERN LHC | JINST 16 (2021) P05014 | CMS-EGM-17-001 2012.06888 |
| 82 | CMS Collaboration | ECAL 2016 refined calibration and \mboxRun 2 summary plots | CMS Detector Performance Note CMS-DP-2020-021, 2020 CDS |
|
| 83 | CMS Collaboration | Performance of the CMS muon detector and muon reconstruction with proton-proton collisions at $ \sqrt{s}= $ 13 TeV | JINST 13 (2018) P06015 | CMS-MUO-16-001 1804.04528 |
| 84 | S. Frixione, G. Ridolfi, and P. Nason | A positive-weight next-to-leading-order Monte Carlo for heavy flavour hadroproduction | JHEP 09 (2007) 126 | 0707.3088 |
| 85 | P. Nason | A new method for combining NLO QCD with shower Monte Carlo algorithms | JHEP 11 (2004) 040 | hep-ph/0409146 |
| 86 | S. Frixione, P. Nason, and C. Oleari | Matching NLO QCD computations with parton shower simulations: the POWHEG method | JHEP 11 (2007) 070 | 0709.2092 |
| 87 | S. Alioli, P. Nason, C. Oleari, and E. Re | A general framework for implementing NLO calculations in shower Monte Carlo programs: the POWHEG box | JHEP 06 (2010) 043 | 1002.2581 |
| 88 | J. Alwall et al. | The automated computation of tree-level and next-to-leading order differential cross sections, and their matching to parton shower simulations | JHEP 07 (2014) 079 | 1405.0301 |
| 89 | P. Artoisenet, R. Frederix, O. Mattelaer, and R. Rietkerk | Automatic spin-entangled decays of heavy resonances in Monte Carlo simulations | JHEP 03 (2013) 015 | 1212.3460 |
| 90 | R. Frederix and S. Frixione | Merging meets matching in MC@NLO | JHEP 12 (2012) 061 | 1209.6215 |
| 91 | NNPDF Collaboration | Parton distributions for the LHC run II | JHEP 04 (2015) 040 | 1410.8849 |
| 92 | M. Czakon, D. Heymes, and A. Mitov | fastNLO tables for NNLO top-quark pair differential distributions | 1704.08551 | |
| 93 | M. Czakon, D. Heymes, and A. Mitov | High-precision differential predictions for top-quark pairs at the LHC | PRL 116 (2016) 082003 | 1511.00549 |
| 94 | M. Czakon, D. Heymes, and A. Mitov | Dynamical scales for multi-TeV top-pair production at the LHC | JHEP 04 (2017) 071 | 1606.03350 |
| 95 | CMS Collaboration | Measurement of the top quark Yukawa coupling from $ \mathrm{t} \overline{\mathrm{t}} $ kinematic distributions in the dilepton final state in proton-proton collisions at $ \sqrt{s}= $ 13 TeV | PRD 102 (2020) 092013 | CMS-TOP-19-008 2009.07123 |
| 96 | T. Sjöstrand et al. | An introduction to PYTHIA8.2 | Comput. Phys. Commun. 191 (2015) 159 | 1410.3012 |
| 97 | CMS Collaboration | Investigations of the impact of the parton shower tuning in PYTHIA8 in the modelling of $ \mathrm{t} \overline{\mathrm{t}} $ at $ \sqrt{s}= $ 8 and 13 TeV | CMS Physics Analysis Summary, 2016 CMS-PAS-TOP-16-021 |
CMS-PAS-TOP-16-021 |
| 98 | CMS Collaboration | Event generator tunes obtained from underlying event and multiparton scattering measurements | EPJC 76 (2016) 155 | CMS-GEN-14-001 1512.00815 |
| 99 | M. Bähr et al. | HERWIG++ physics and manual | EPJC 58 (2008) 639 | 0803.0883 |
| 100 | S. Gieseke, C. Röhr, and A. Siodmok | Colour reconnections in HERWIG++ | EPJC 72 (2012) 2225 | 1206.0041 |
| 101 | GEANT4 Collaboration | GEANT 4--a simulation toolkit | NIM A 506 (2003) 250 | |
| 102 | CMS Collaboration | Identification of heavy-flavour jets with the CMS detector in $ {\mathrm{p}\mathrm{p}} $ collisions at 13 TeV | JINST 13 (2018) P05011 | CMS-BTV-16-002 1712.07158 |
| 103 | CMS Collaboration | Measurement of the $ \mathrm{t} \overline{\mathrm{t}} $ production cross section in the dilepton channel in $ {\mathrm{p}\mathrm{p}} $ collisions at $ \sqrt{s}= $ 7 TeV | JHEP 11 (2012) 067 | CMS-TOP-11-005 1208.2671 |
| 104 | CMS Collaboration | Measurement of the differential cross section for top quark pair production in $ {\mathrm{p}\mathrm{p}} $ collisions at $ \sqrt{s} = $ 8 TeV | EPJC 75 (2015) 542 | CMS-TOP-12-028 1505.04480 |
| 105 | CMS Collaboration | Measurement of the top quark pair production cross section in proton-proton collisions at $ \sqrt{s}= $ 13 TeV | PRL 116 (2016) 052002 | CMS-TOP-15-003 1510.05302 |
| 106 | CMS Collaboration | Measurement of the Drell-Yan cross section in $ {\mathrm{p}\mathrm{p}} $ collisions at $ \sqrt{s}= $ 7 TeV | JHEP 10 (2011) 007 | CMS-EWK-10-007 1108.0566 |
| 107 | CMS Collaboration | Measurement of the inelastic proton-proton cross section at $ \sqrt{s}= $ 13 TeV | JHEP 07 (2018) 161 | CMS-FSQ-15-005 1802.02613 |
| 108 | CMS Collaboration | Precision luminosity measurement in proton-proton collisions at $ \sqrt{s}= $ 13 TeV in 2015 and 2016 at CMS | EPJC 81 (2021) 800 | CMS-LUM-17-003 2104.01927 |
| 109 | CMS Collaboration | Extraction and validation of a new set of CMS PYTHIA8 tunes from underlying-event measurements | EPJC 80 (2020) 4 | CMS-GEN-17-001 1903.12179 |
| 110 | J. R. Christiansen and P. Z. Skands | String formation beyond leading colour | JHEP 08 (2015) 003 | 1505.01681 |
| 111 | S. Argyropoulos and T. Sjöstrand | Effects of color reconnection on $ \mathrm{t} \overline{\mathrm{t}} $ final states at the LHC | JHEP 11 (2014) 043 | 1407.6653 |
| 112 | M. G. Bowler | $ {e^+e^-} $ production of heavy quarks in the string model | Z. Phys. C 11 (1981) 169 | |
| 113 | B. Andersson, G. Gustafson, G. Ingelman, and T. Sjöstrand | Parton fragmentation and string dynamics | Physics Reports 97 (1983) 31 | |
| 114 | CMS Collaboration | Measurement of the shape of the b quark fragmentation function using charmed mesons produced inside b jets from $ \mathrm{t} \overline{\mathrm{t}} $ pair decays | CMS Physics Analysis Summary, 2021 CMS-PAS-TOP-18-012 |
CMS-PAS-TOP-18-012 |
| 115 | CMS Collaboration | Review of top quark mass measurements in CMS | Submitted to Phys. Rept., 2024 | CMS-TOP-23-003 2403.01313 |
| 116 | A. Martin | Toponium physics | in Quarks, Leptons, and Their Constituents, A. Zichichi, ed., Springer, 1988 link |
|
| 117 | CMS Collaboration | HEPData record for this analysis | link | |

|
Compact Muon Solenoid LHC, CERN |

|

|

|

|

|

|