

Compact Muon Solenoid
LHC, CERN
| CMS-PAS-TOP-22-004 ATLAS-CONF-2026-001 | ||
| Combination of ATLAS and CMS measurements of the azimuthal spin correlation variable in dilepton $ \mathrm{t\bar{t}} $ events at $ \sqrt{s} = $ 13 TeV | ||
| CMS Collaboration | ||
| 2026-01-15 | ||
| Abstract: This document presents a combination of measurements sensitive to $ \mathrm{t\bar{t}} $ spin correlations. Measurements were performed by ATLAS and CMS in the dilepton channel, using 36 fb$ ^{-1} $ of 13 TeV proton-proton data. The observable studied is the azimuthal opening angle in the laboratory frame between the two leptons in the final state: $ \Delta\phi_{\ell\ell} $. The differential distribution of $ \Delta\phi_{\ell\ell} $ has been unfolded to parton level, which removes all detector effects in the individual measurements. Comparisons are made to Monte Carlo predictions based on next-to-leading-order QCD calculations, focusing on the common POWHEG+PYTHIA 8 simulation developed by the two experiments. This model shows a shape difference between the measurement and the prediction. Higher perturbative precision is provided by fixed-order predictions at next-to-next-to-leading order in the strong coupling constant, or at next-to-leading order including weak corrections. These predictions show better agreement with the combined $ \Delta\phi_{\ell\ell} $ measurement. | ||
| Links: CDS record (PDF) ; CADI line (restricted) ; | ||
| Figures | |
png pdf |
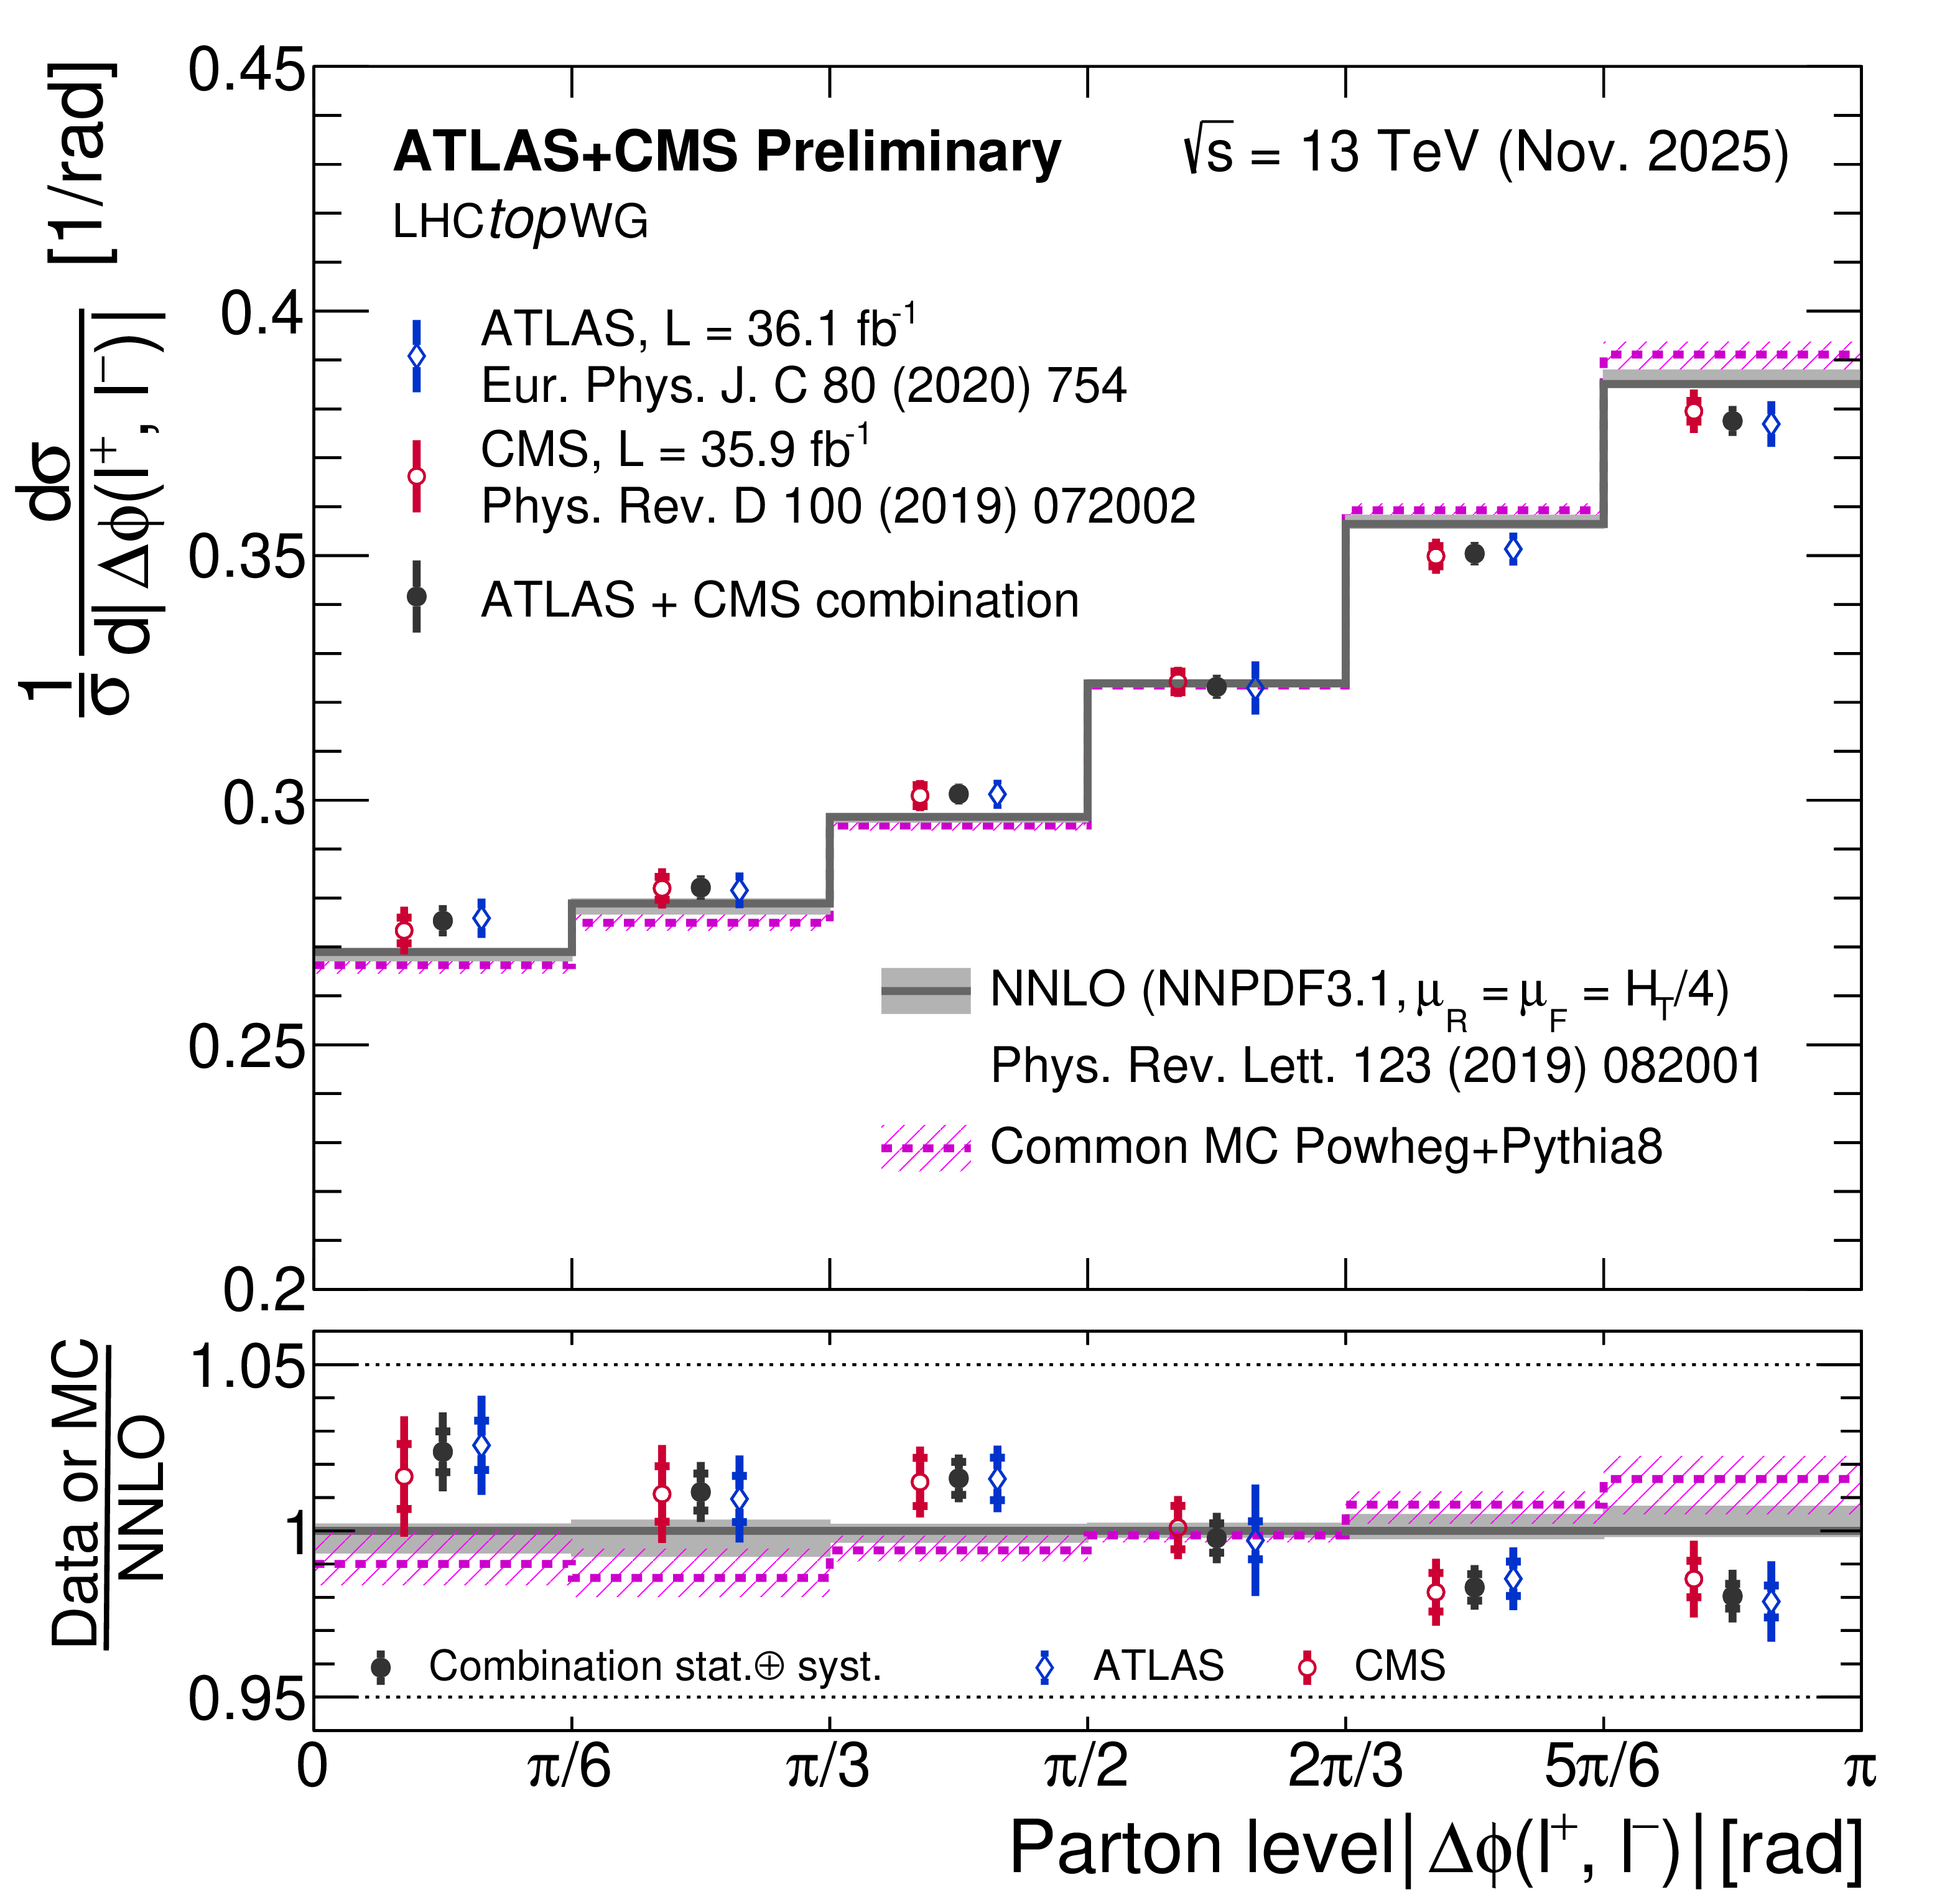
Figure 1:
Results of the ATLAS and CMS $ \Delta\phi_{\ell\ell} $ combination. The combined distribution is shown together with the original measurements by the ATLAS and CMS experiments, the POWHEG+PYTHIA8 Common MC prediction [50] and the NNLO QCD prediction from Ref. [29]. The grey shaded area indicates the scale uncertainty in the NNLO prediction and the hatched area corresponds to the combined scale and statistical uncertainties on the MC prediction. The lower panel of the figure shows the ratio of all measurements and predictions with respect to the NNLO prediction. The data are shown with open circles for ATLAS, open diamonds for CMS and closed circles for the combined measurement. The top panel shows the total uncertainties on the data, while the bottom panel shows the contribution of the statistical uncertainty within the total uncertainty. |
png pdf |
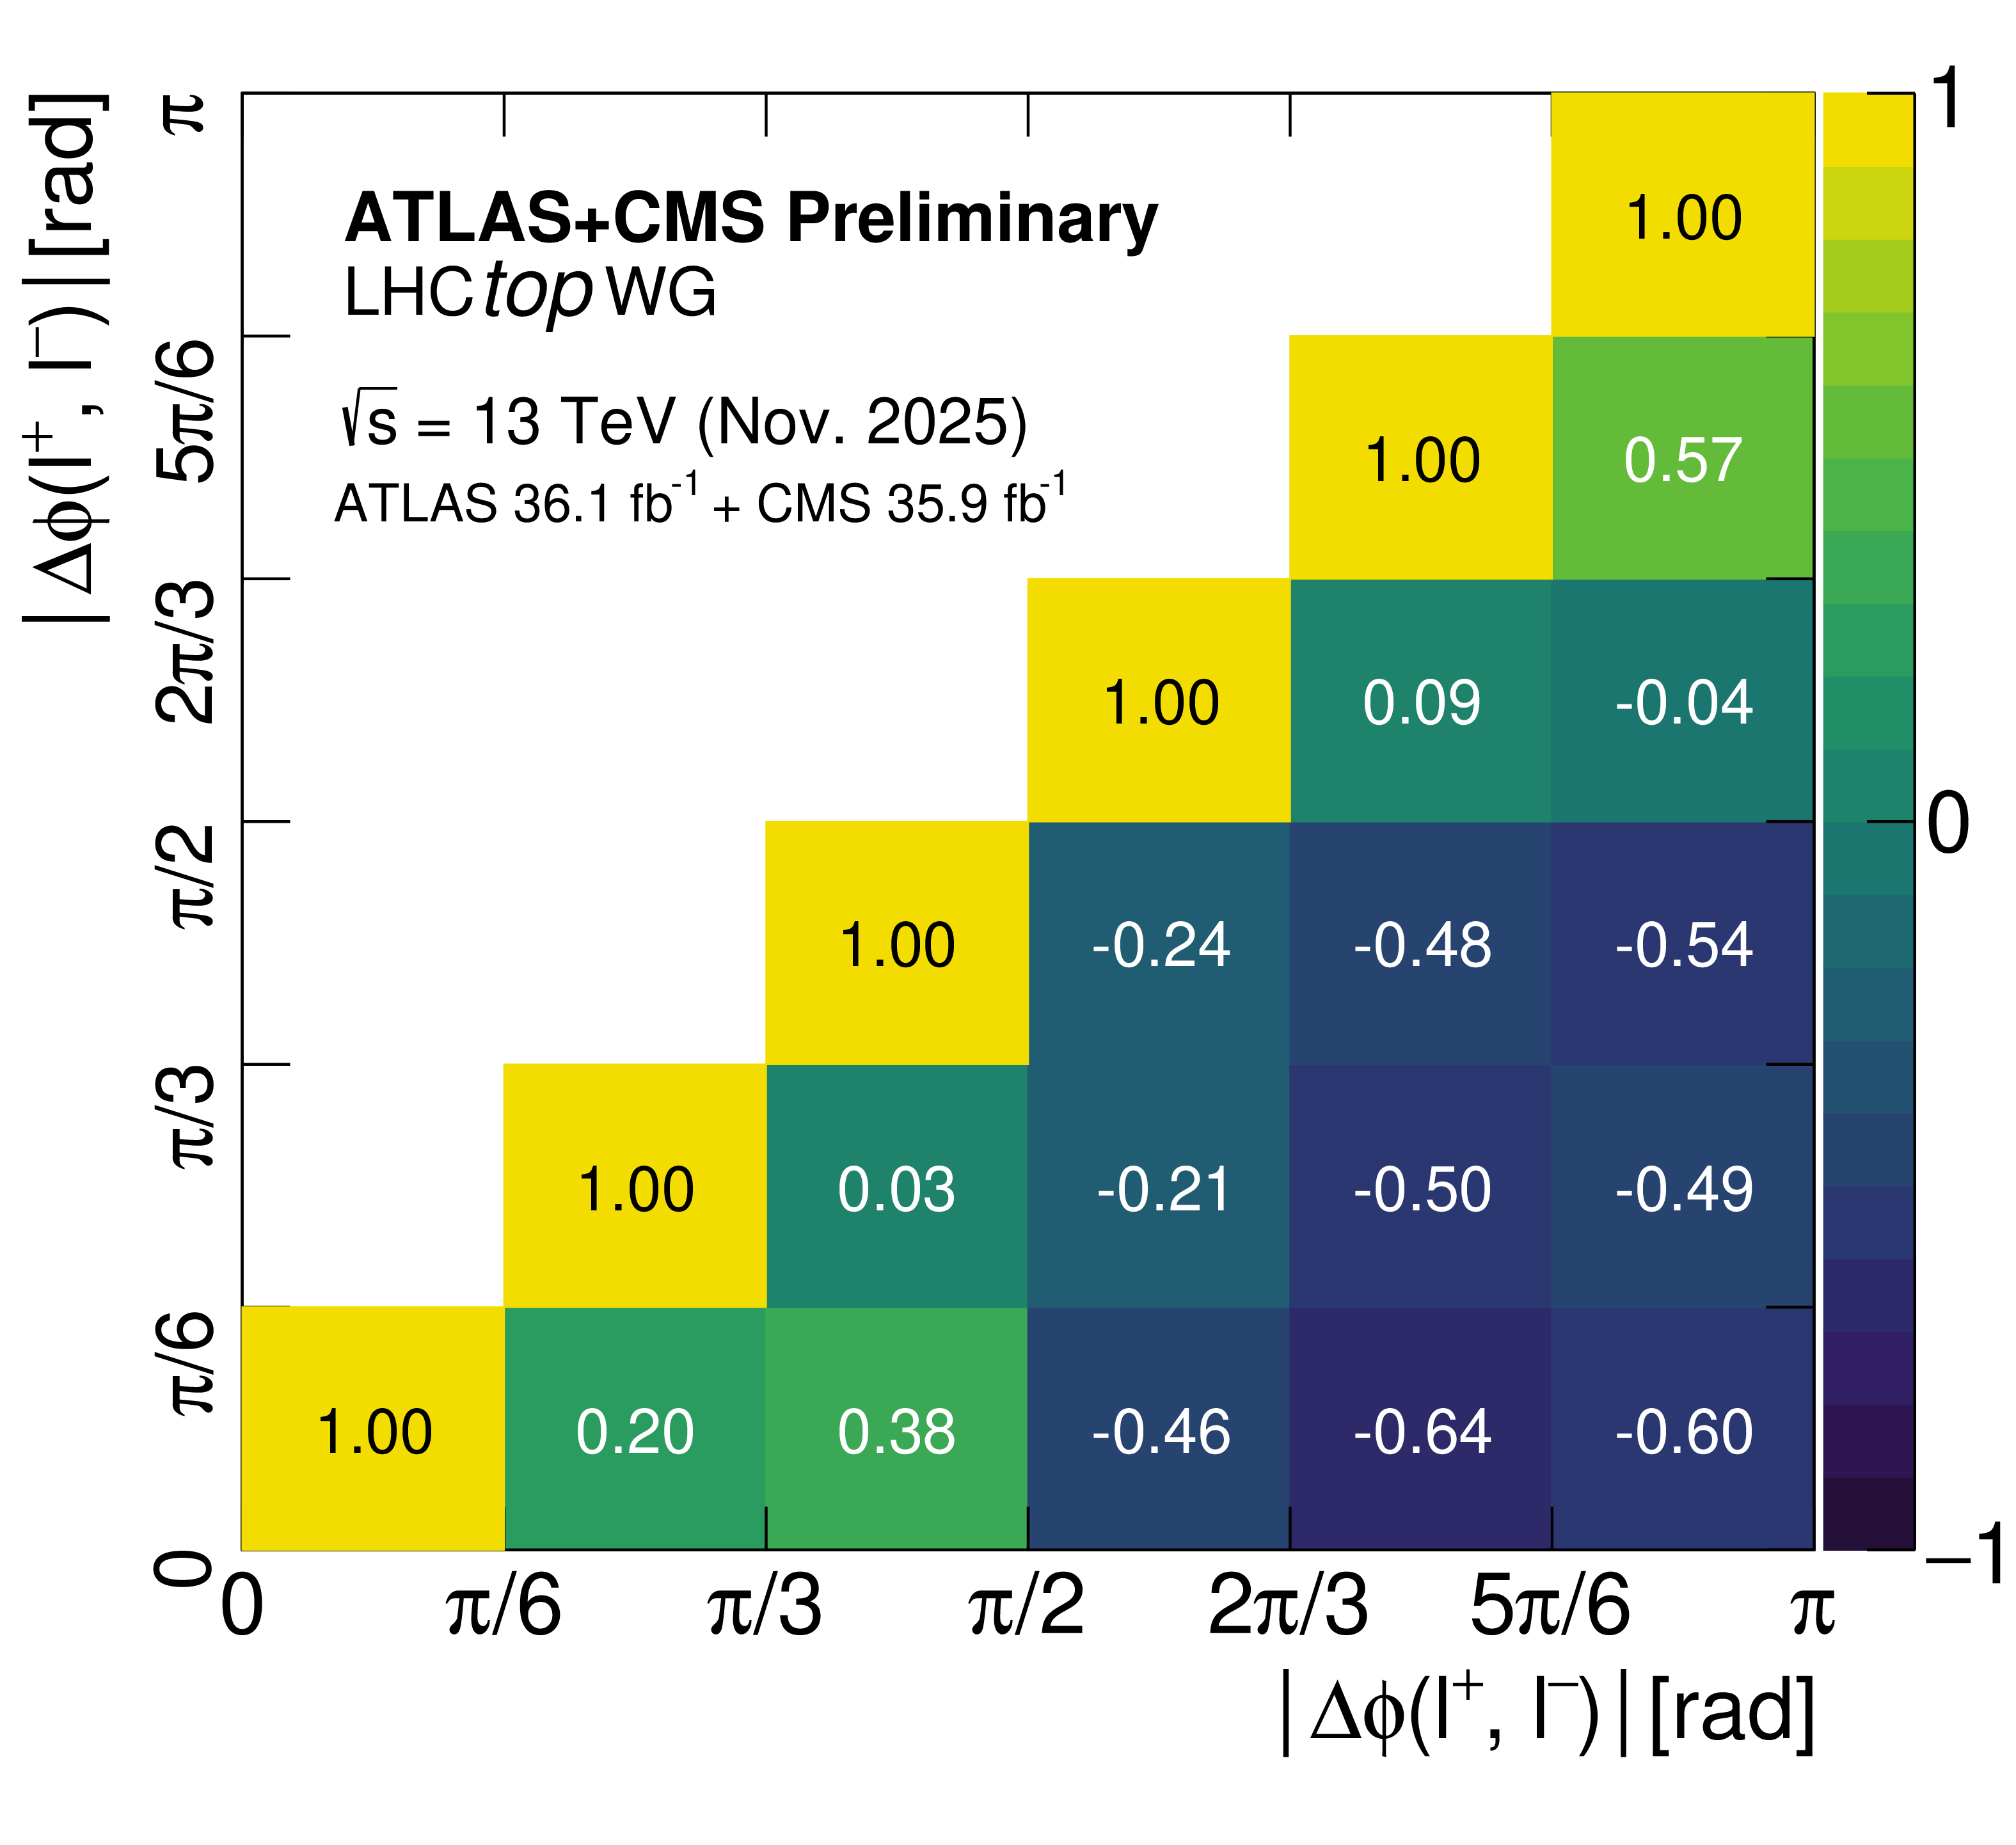
Figure 2:
Correlation matrix of the bins of the combined ATLAS and CMS $ \Delta\phi_{\ell\ell} $ distribution. |
png pdf |
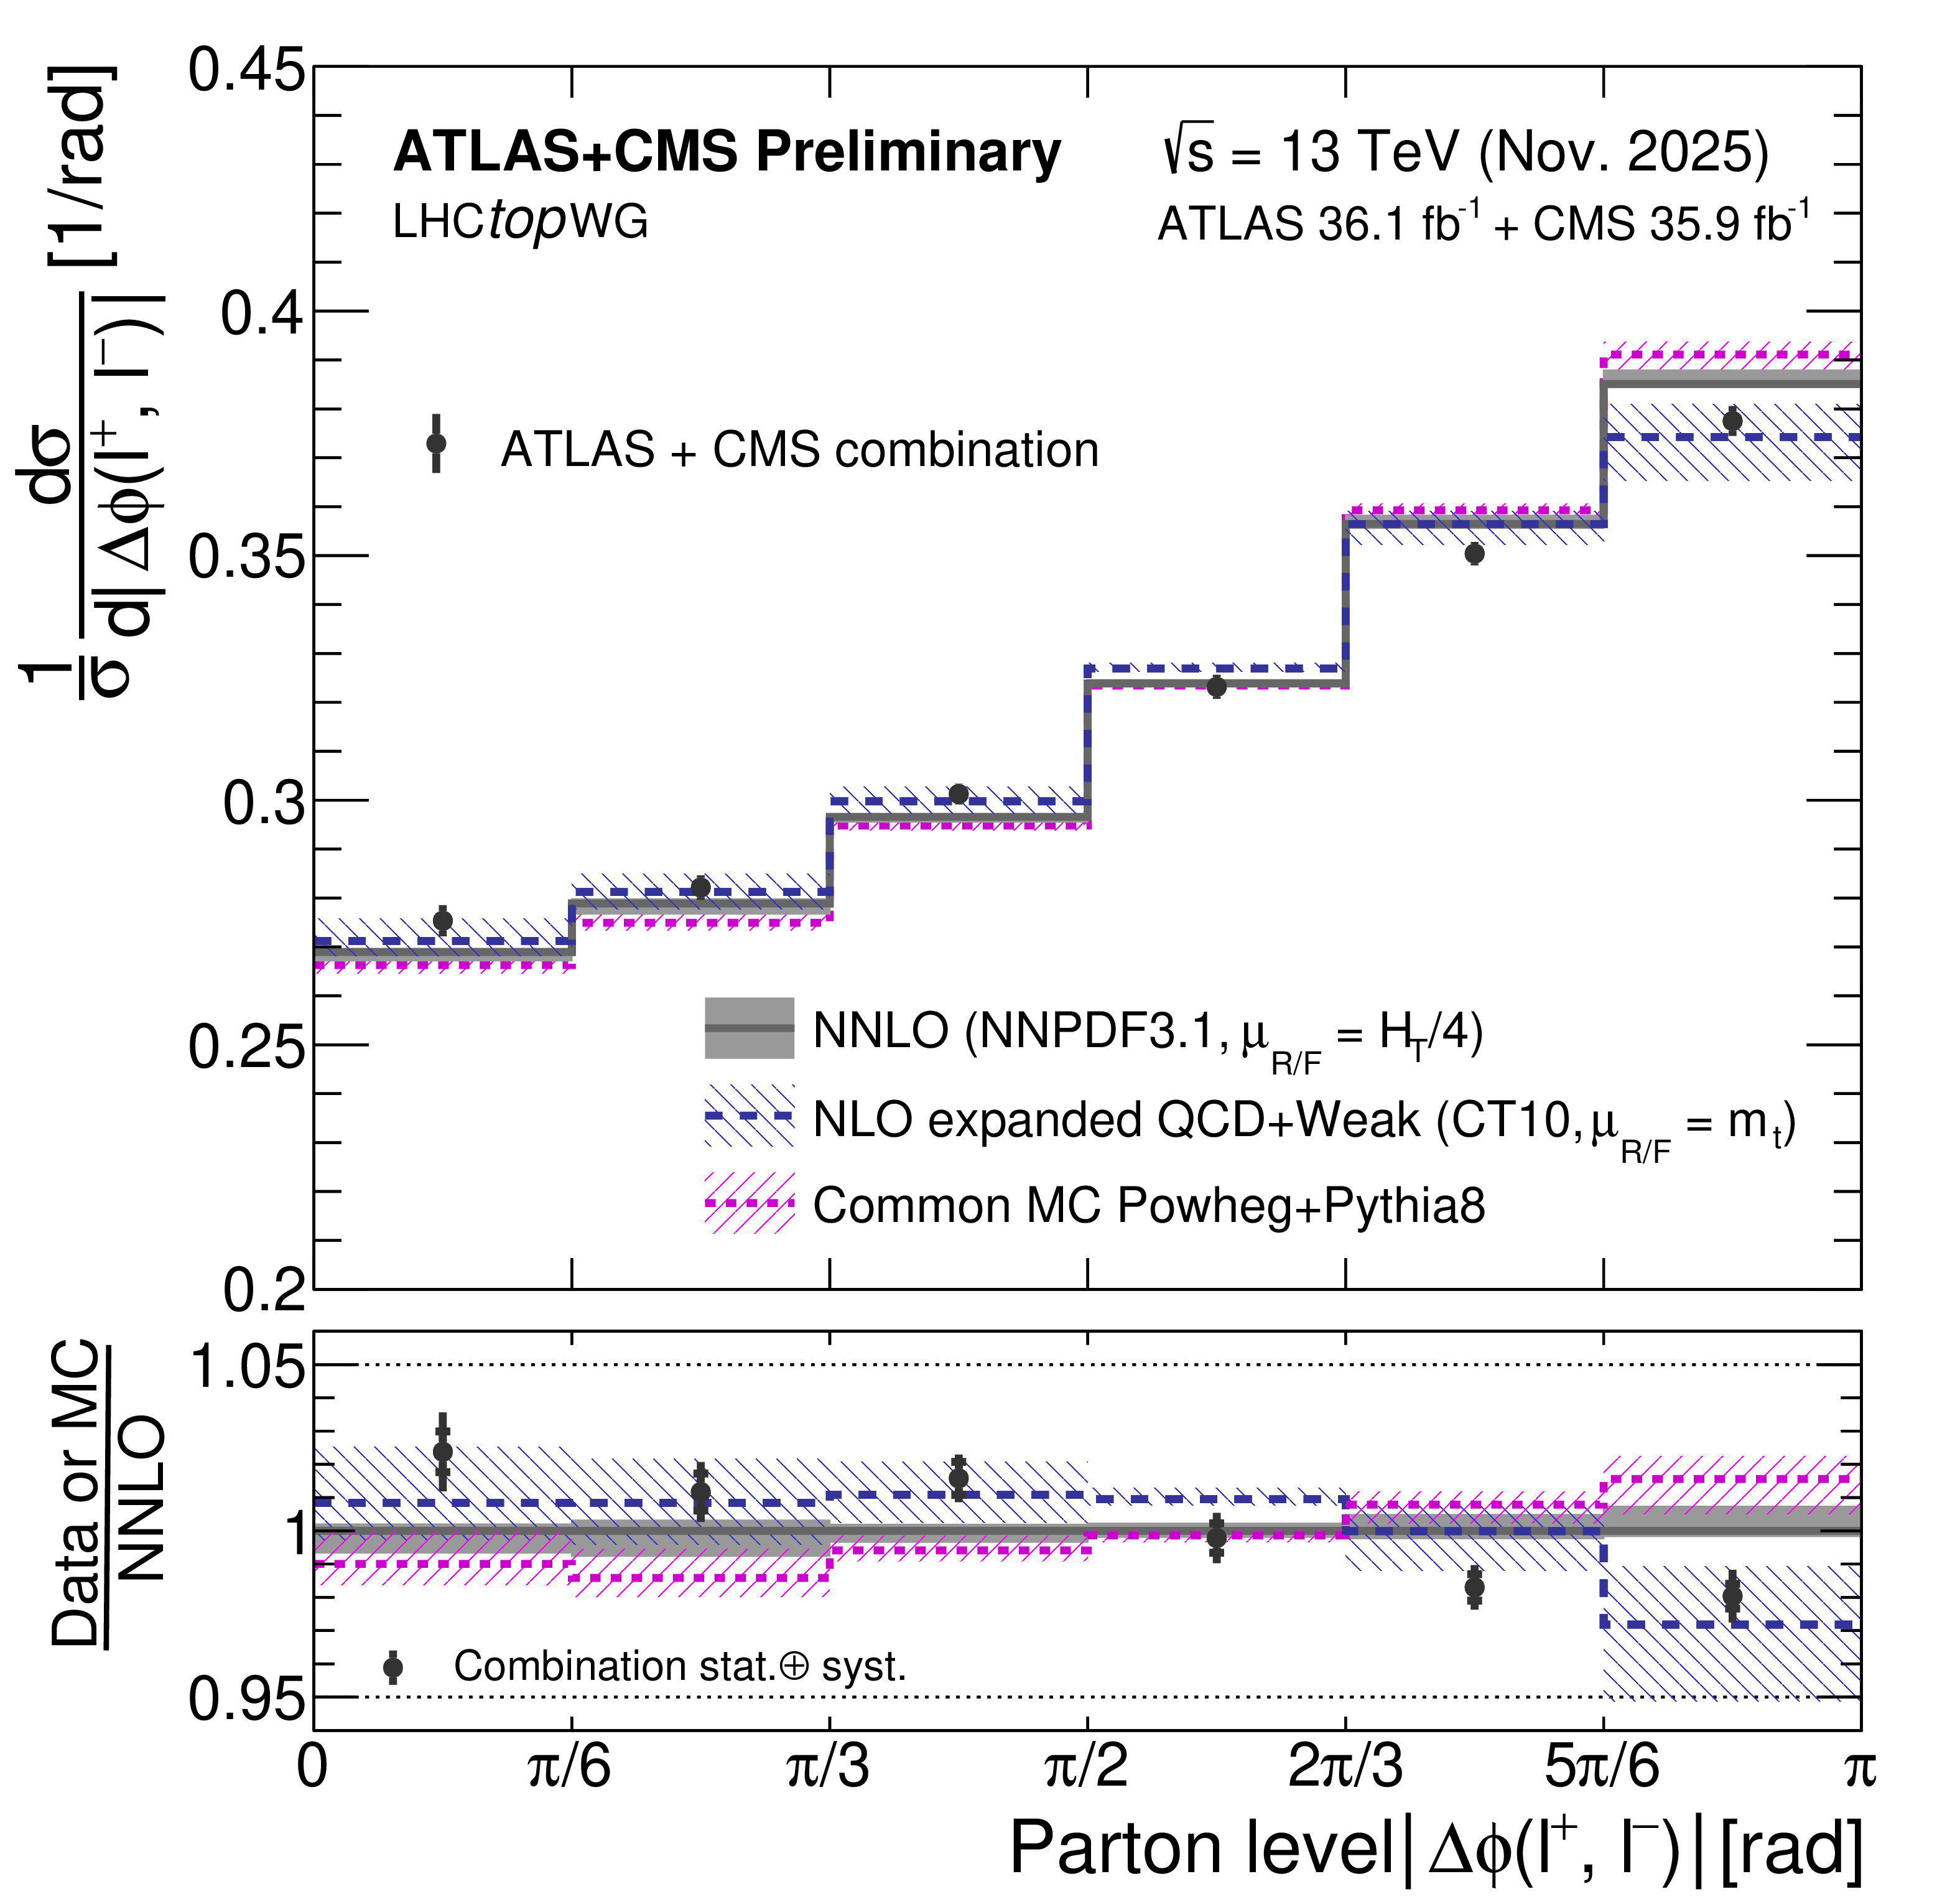
Figure 3:
Results of the ATLAS and CMS $ \Delta\phi_{\ell\ell} $ combination, shown together with the POWHEG+PYTHIA8 Common MC prediction [50], the NNLO QCD prediction from Ref. [29] and the expanded NLO QCD+Weak prediction from Refs. [30,31,19]. The grey shaded area indicates the scale uncertainty in the NNLO prediction and the hatched areas correspond to the combined scale and statistical uncertainties in the MC and NLO predictions. The lower panel of the figure shows the ratio of the measurements and predictions with respect to the NNLO prediction. The data are shown with closed circles for the combined measurement. The top panel shows the total uncertainties on the data, while the bottom panel shows the contribution of the statistical uncertainty within the total uncertainty. |
png pdf |
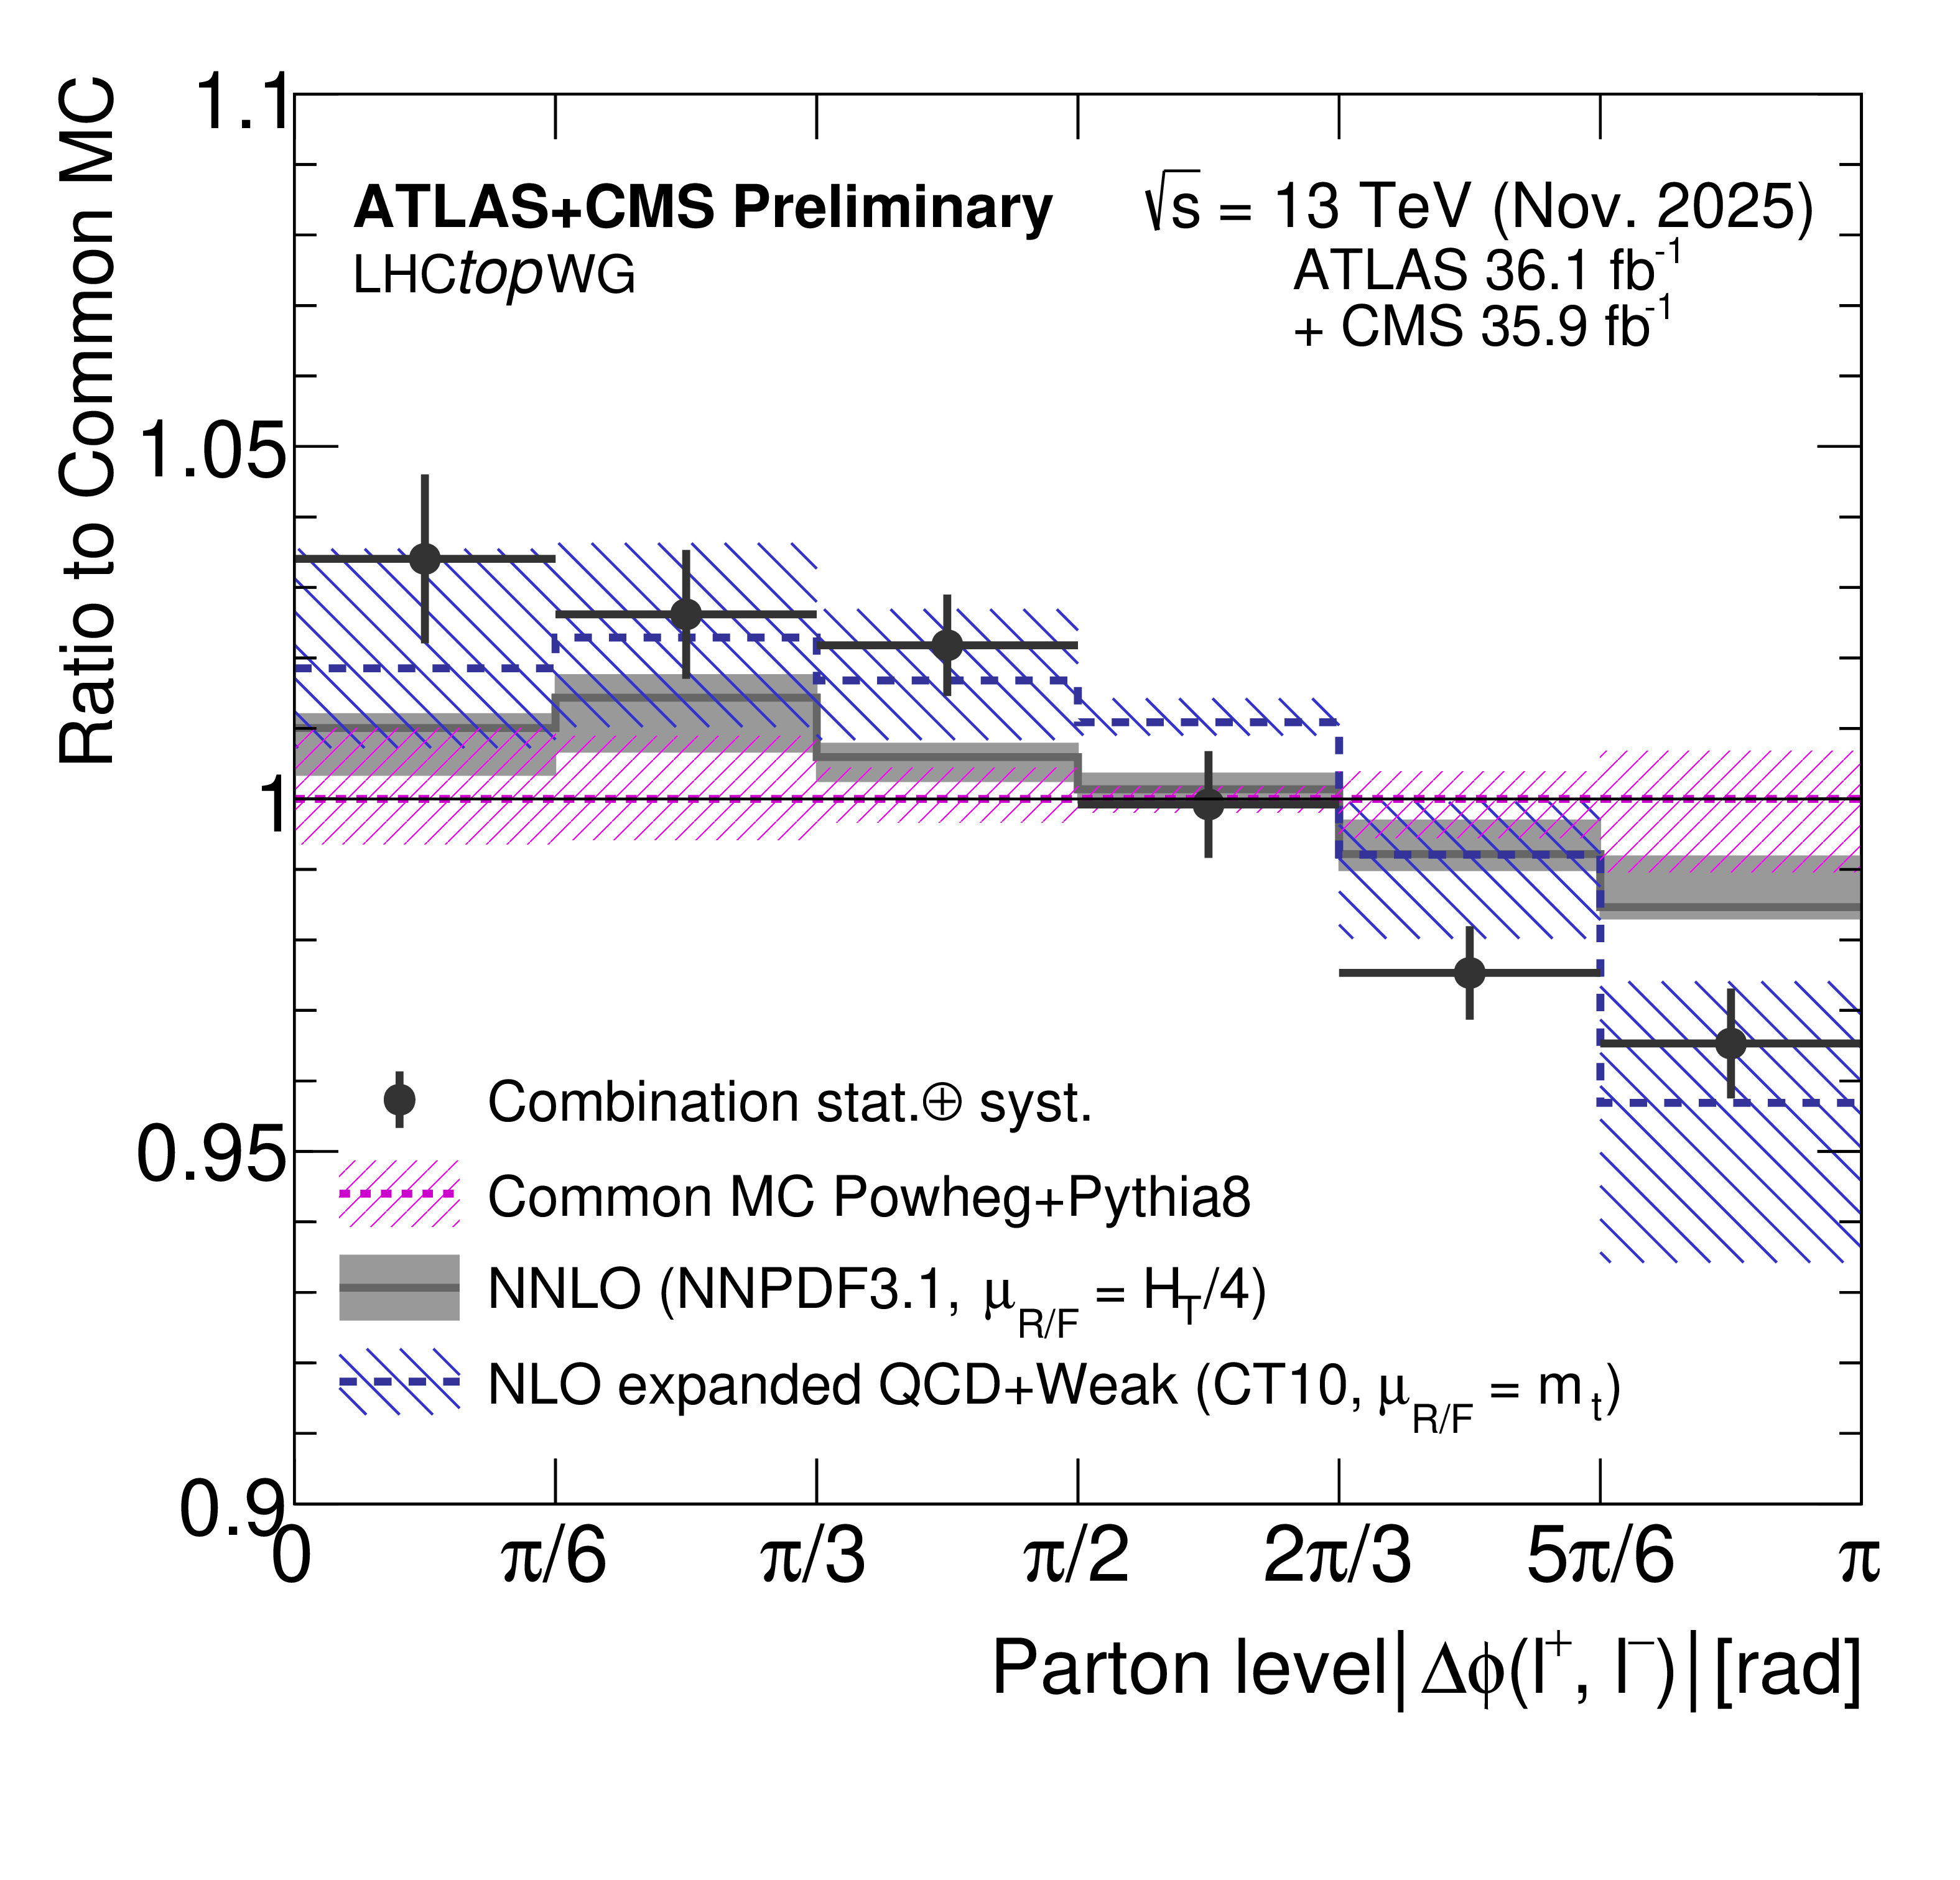
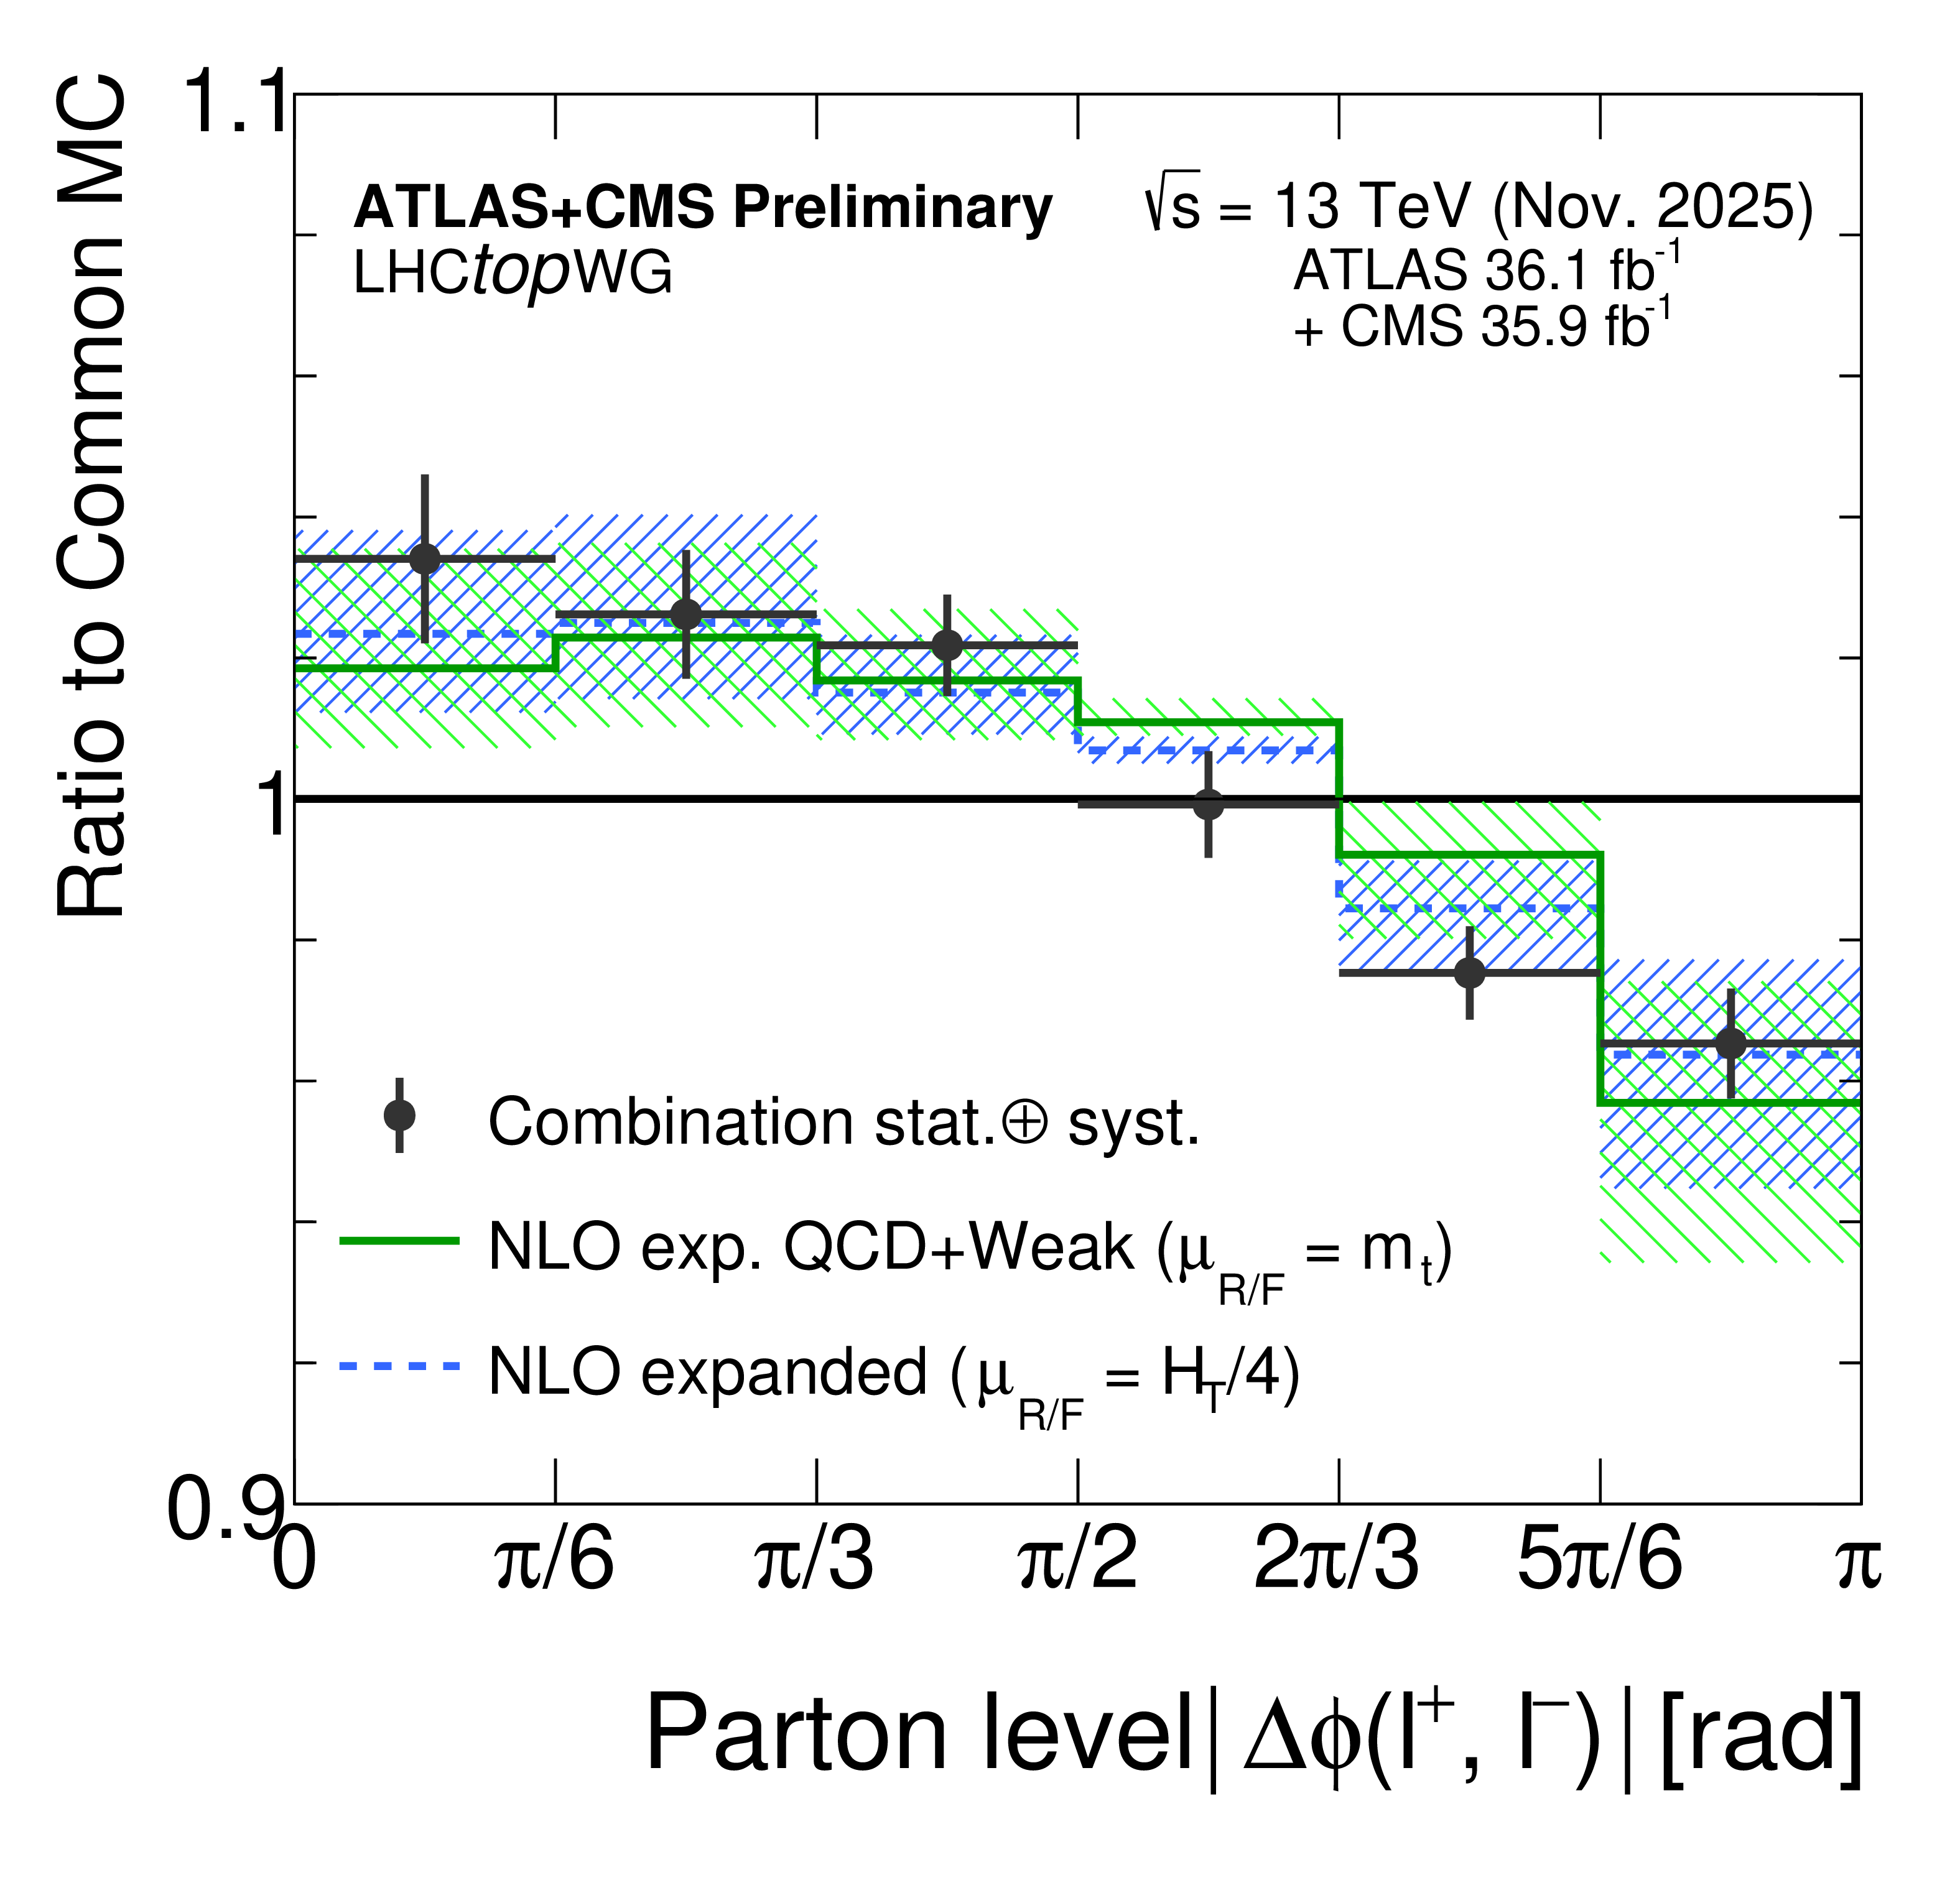
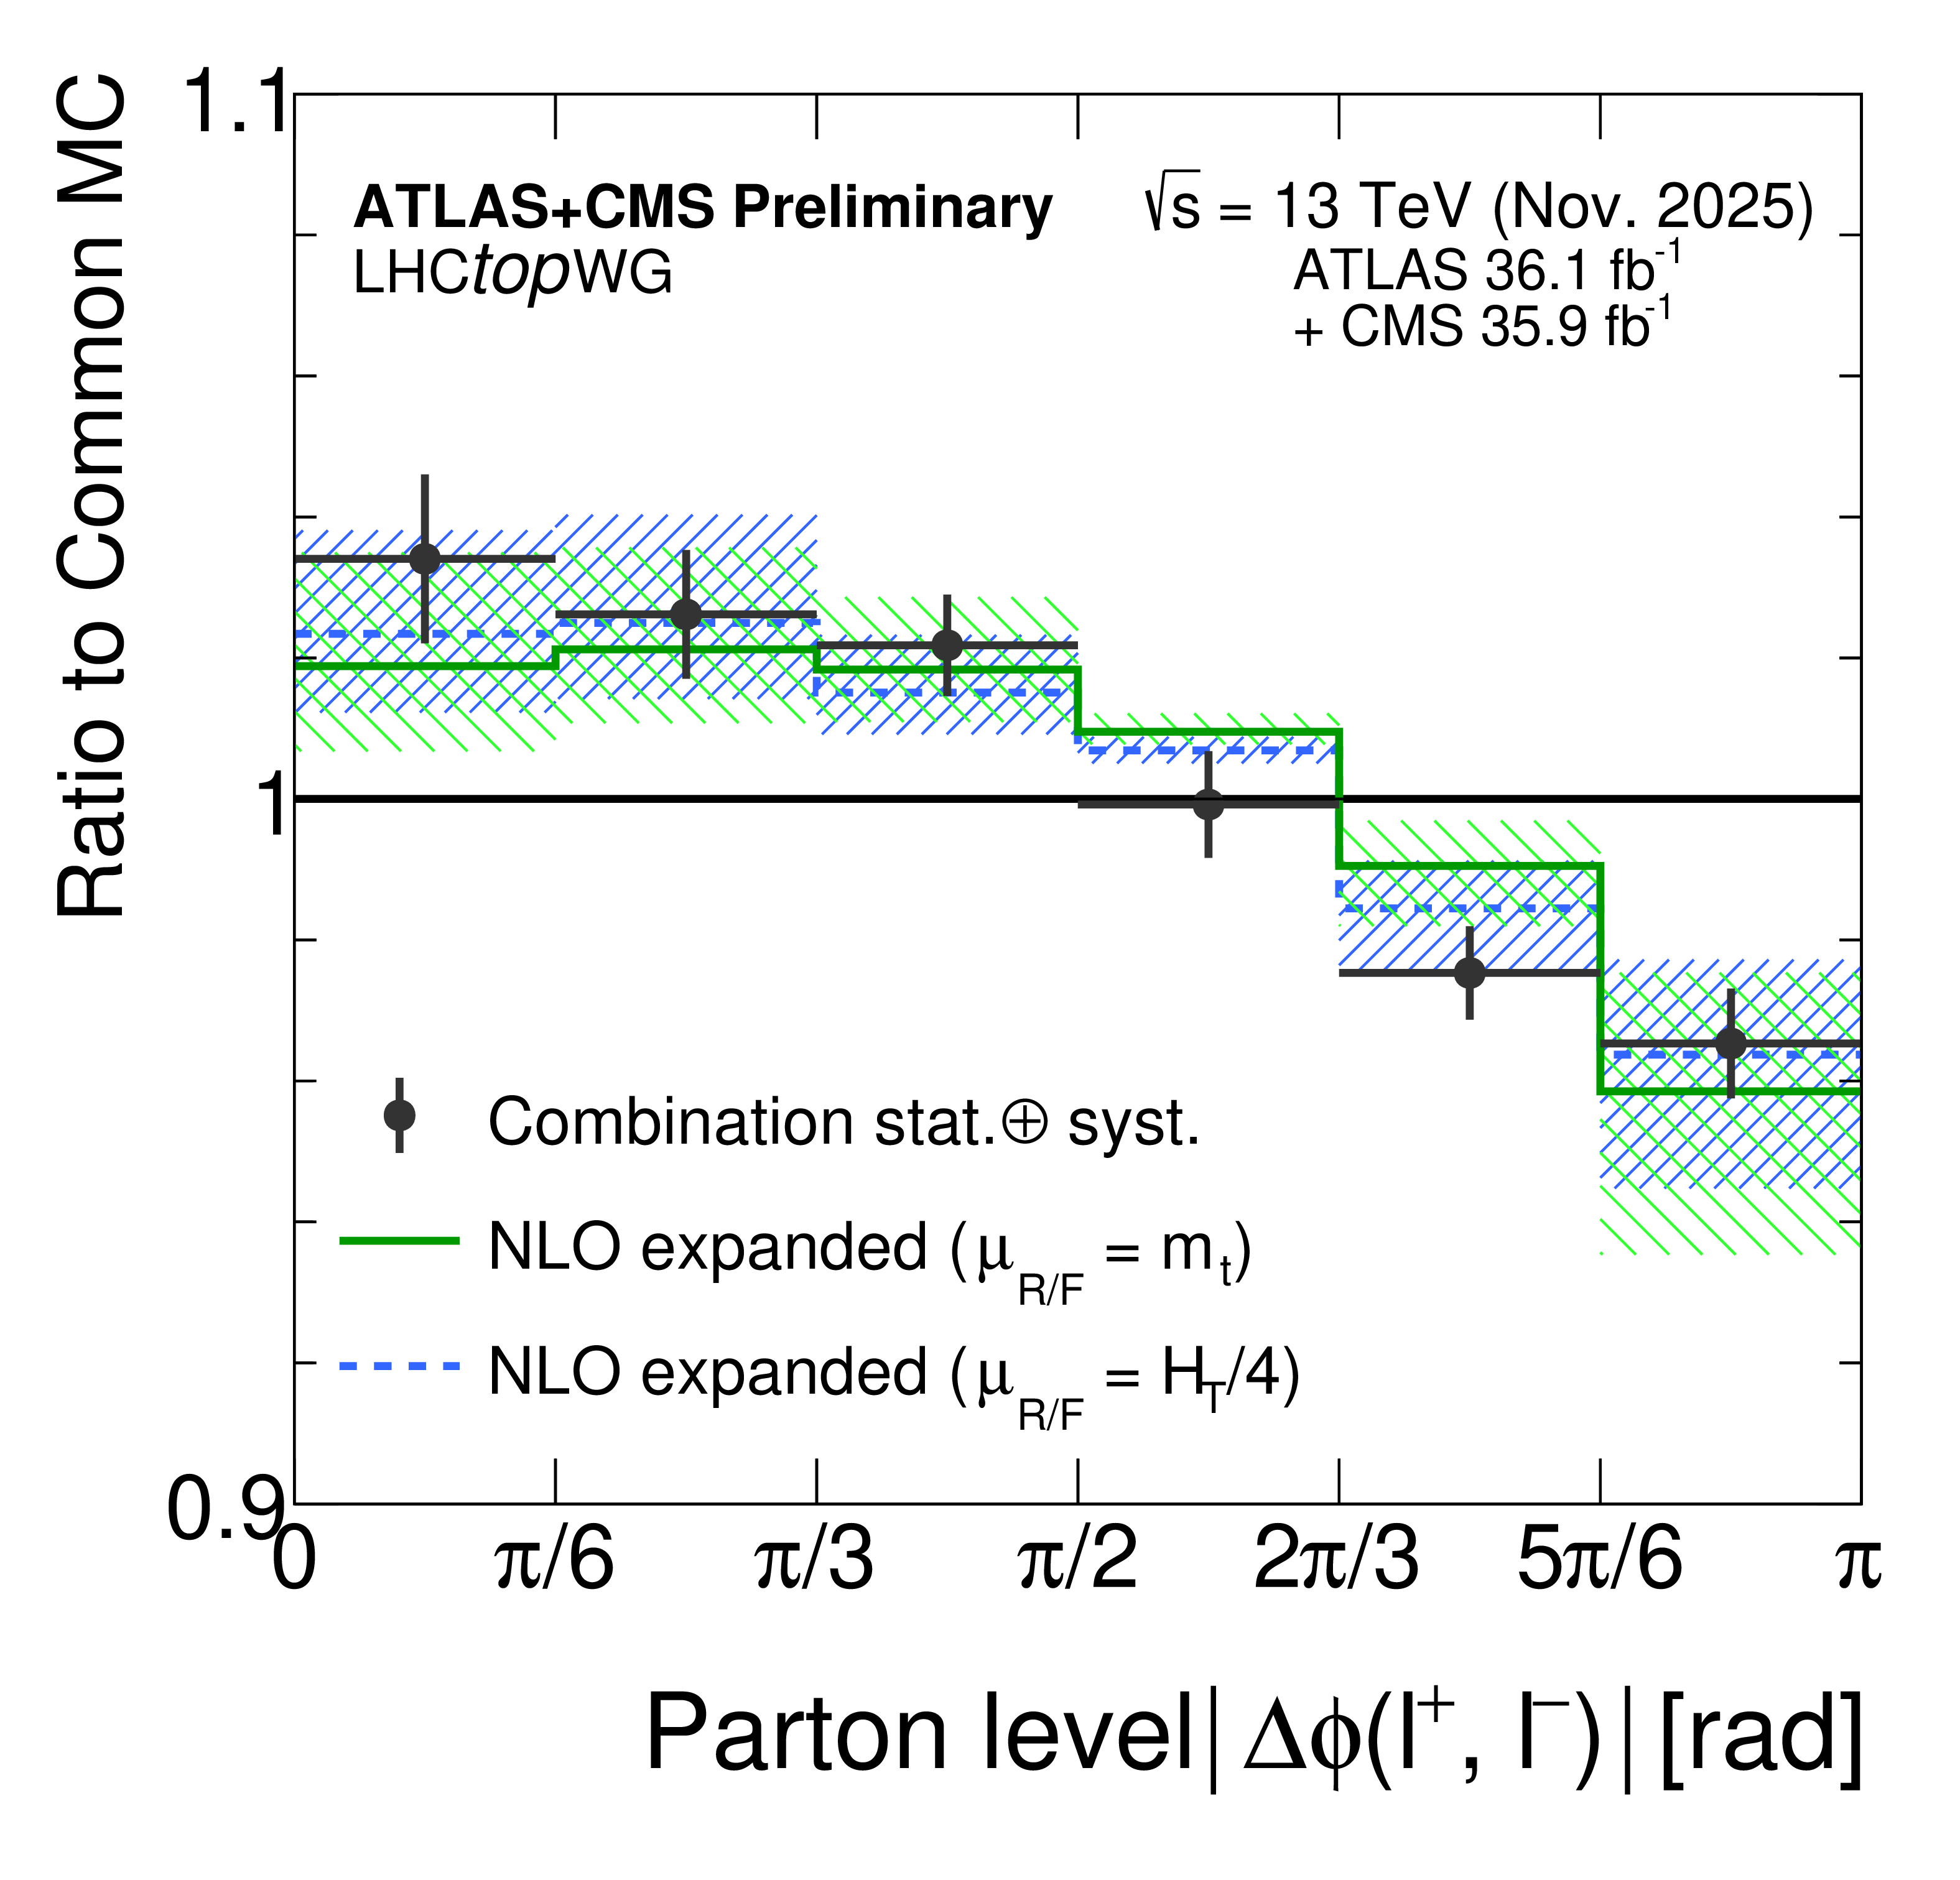
Figure 4:
Comparison of the Common MC POWHEG+PYTHIA8 sample [50], the NNLO QCD prediction [29] and the expanded NLO QCD+Weak prediction [30,31,19] to the combined ATLAS and CMS data. The ratio is calculated relative to the Common MC prediction. |
png pdf |
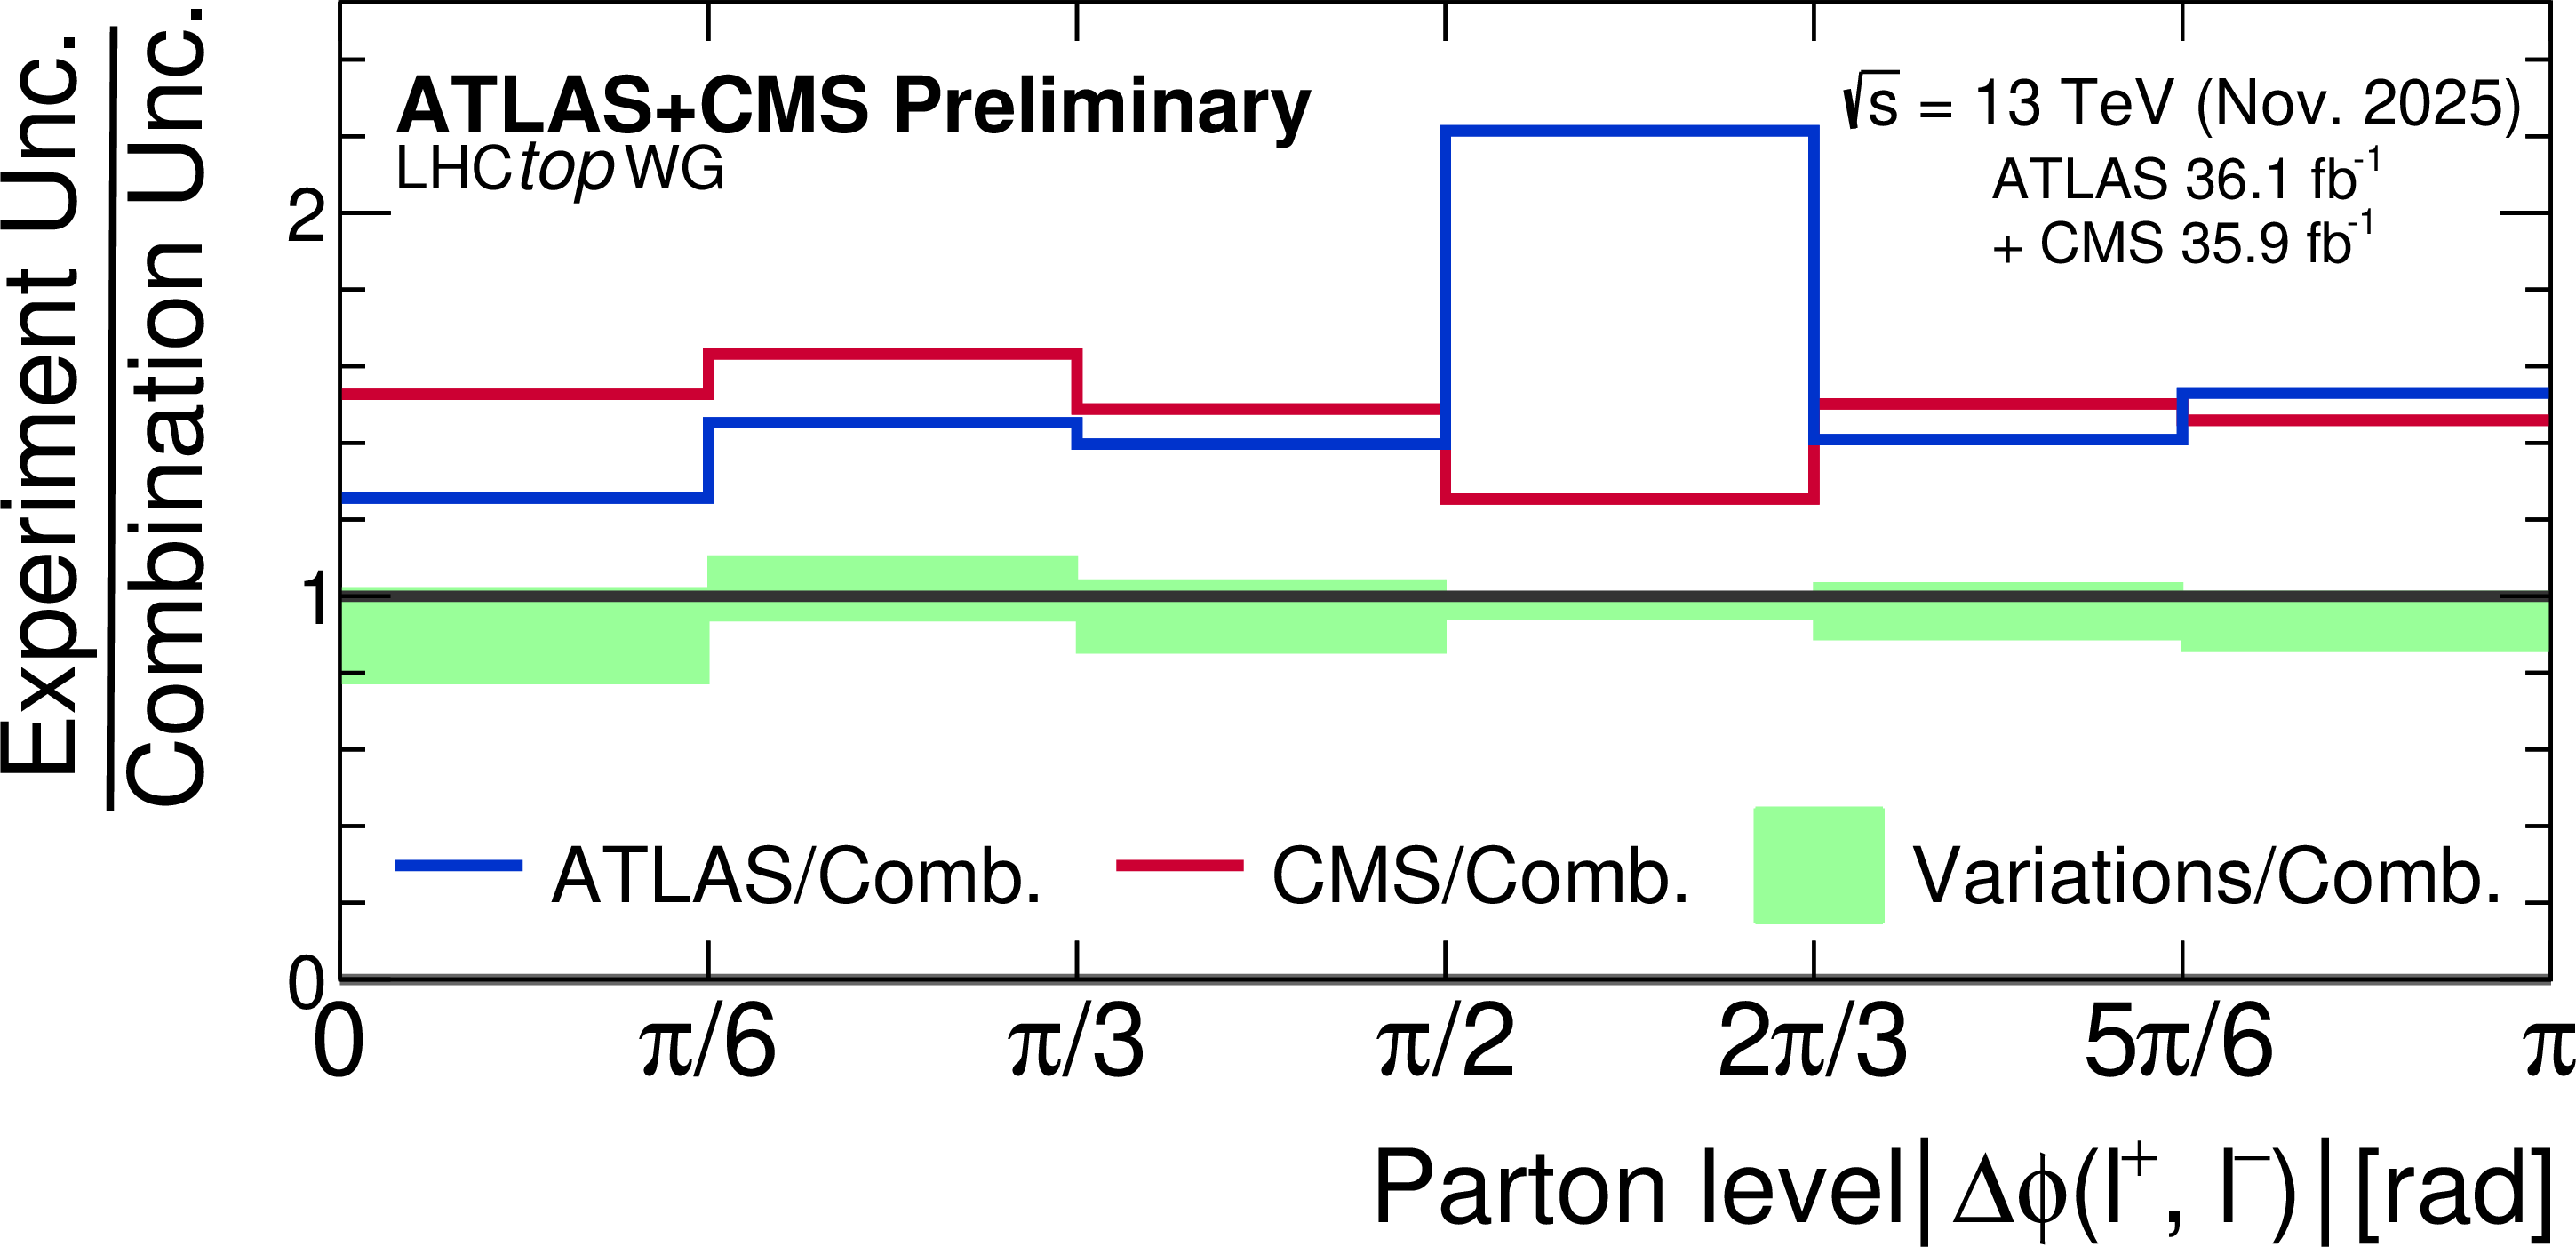
Figure 5:
Comparison of the uncertainties of the individual ATLAS or CMS measurements to those on the combined measurement. The green band corresponds to the variation in the combined uncertainty for a range of different correlation assumptions. |
png pdf |
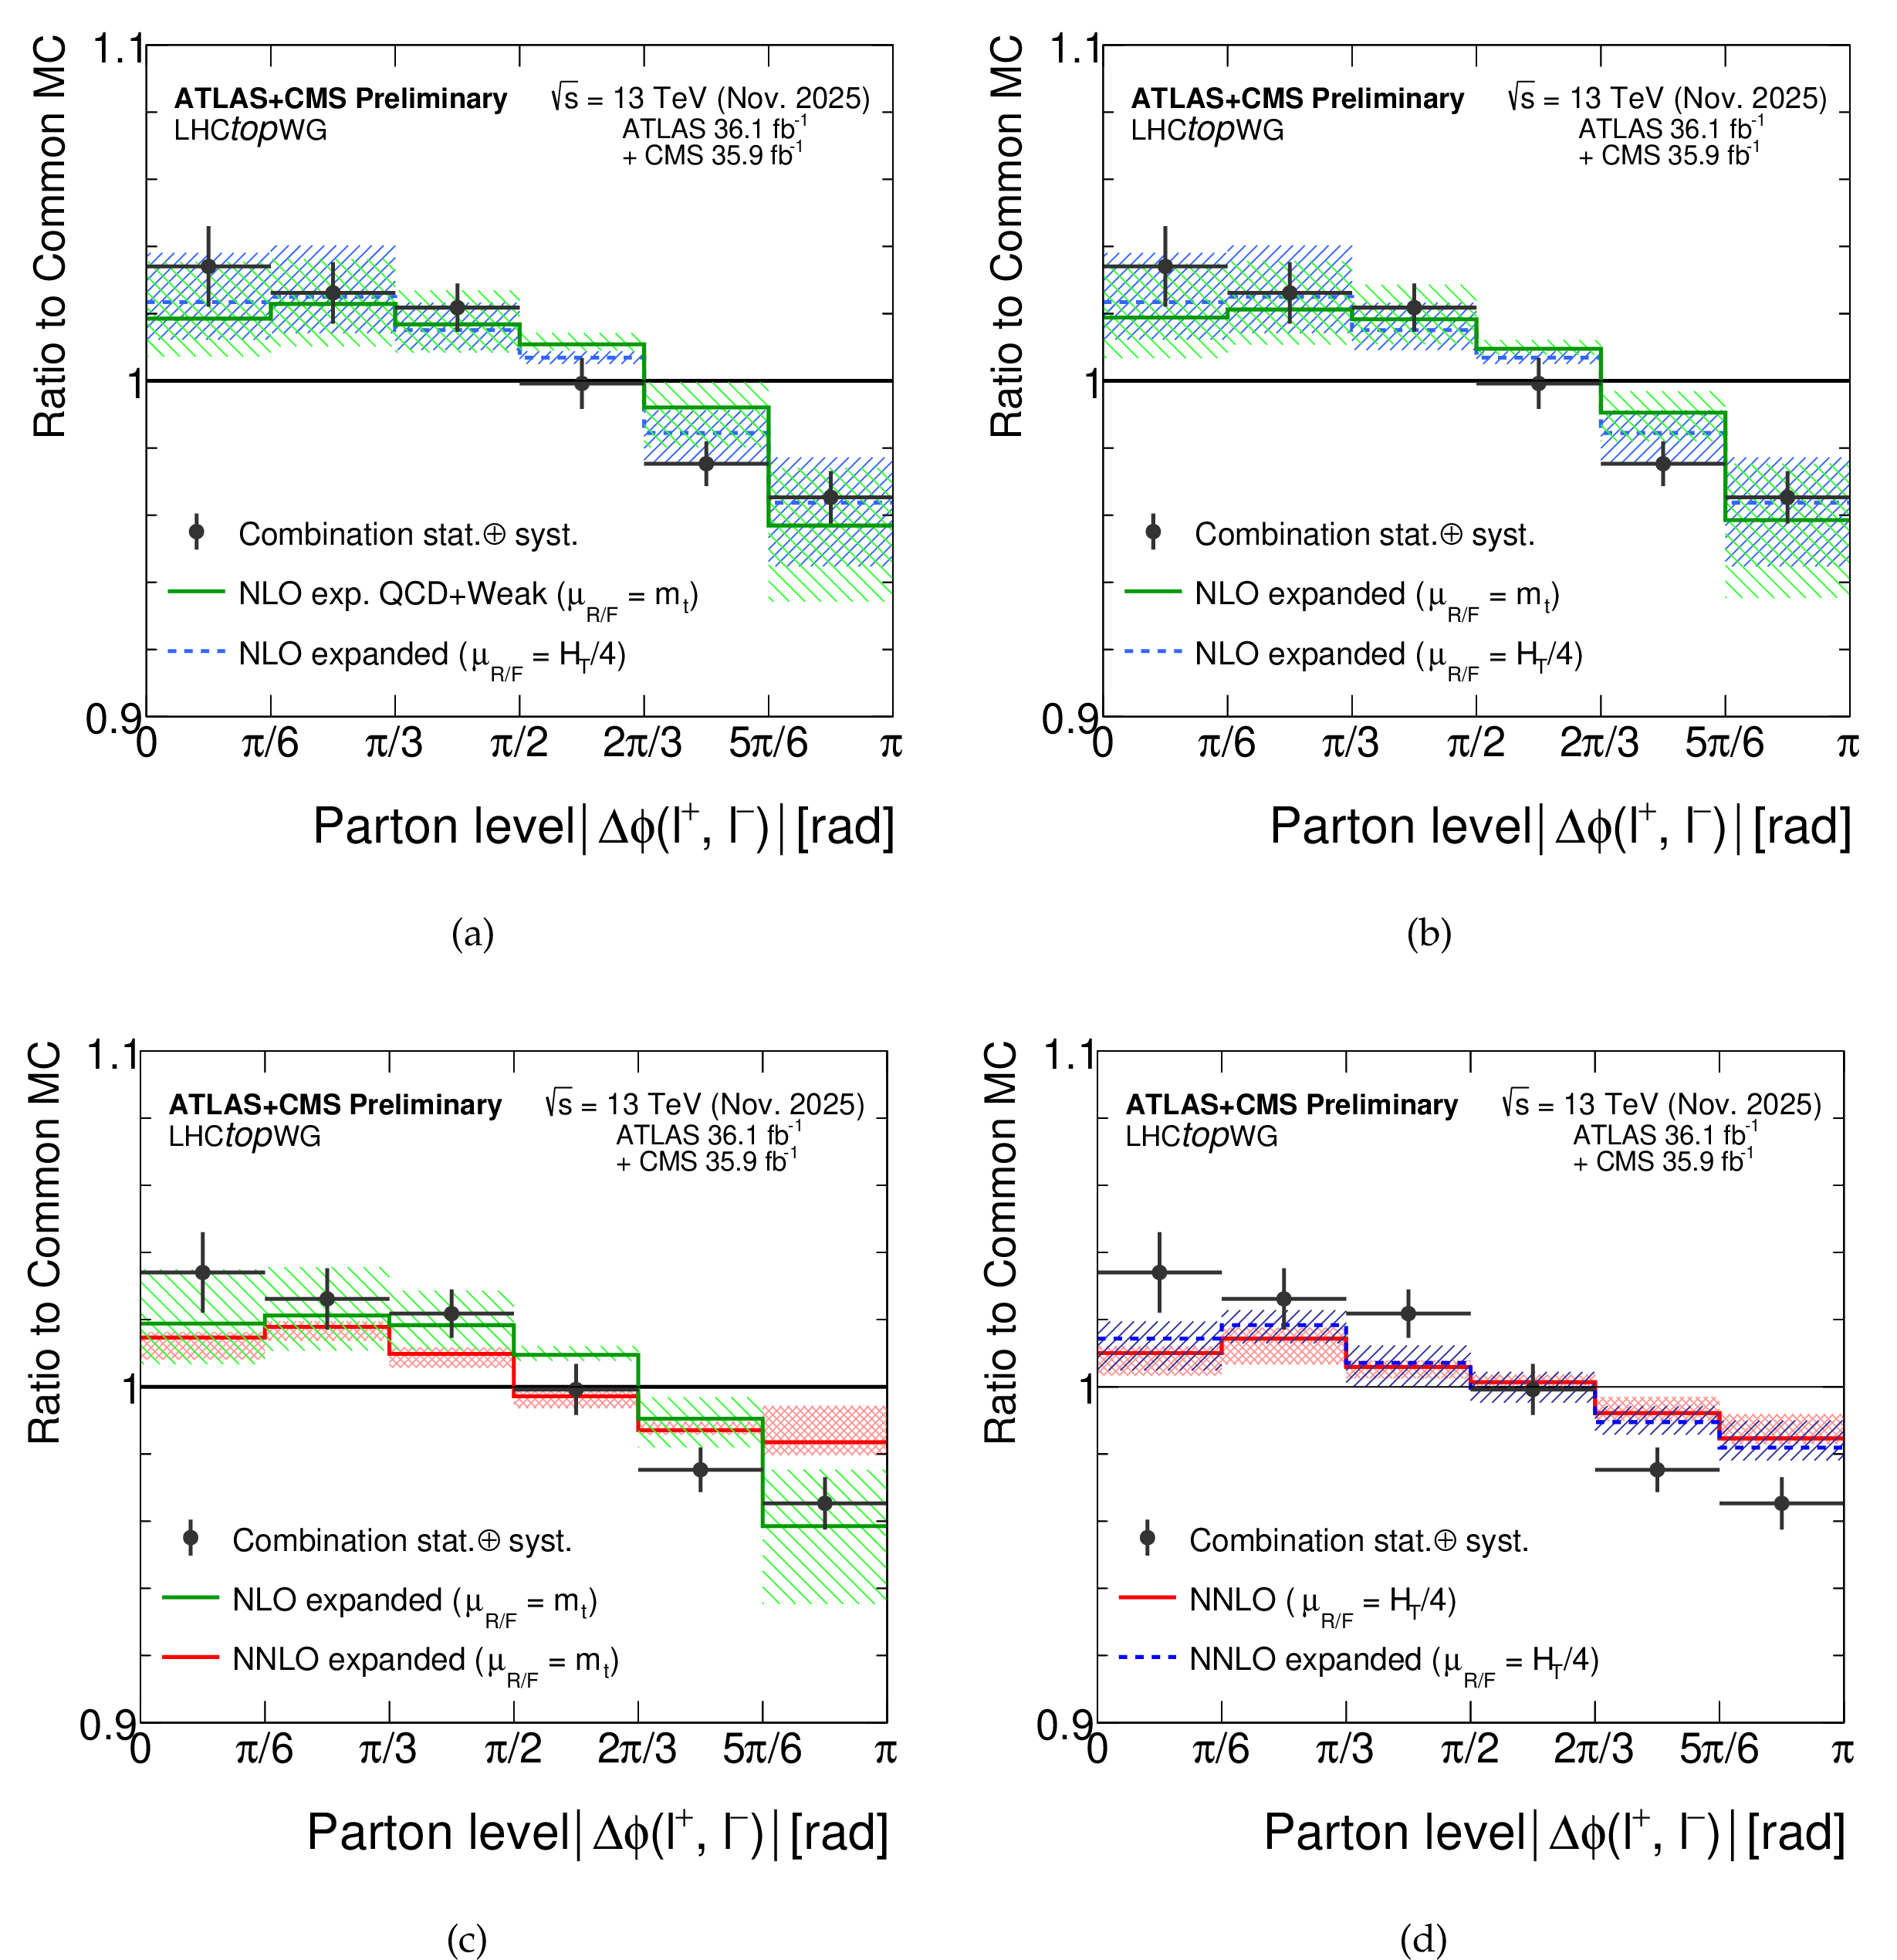
Figure 6:
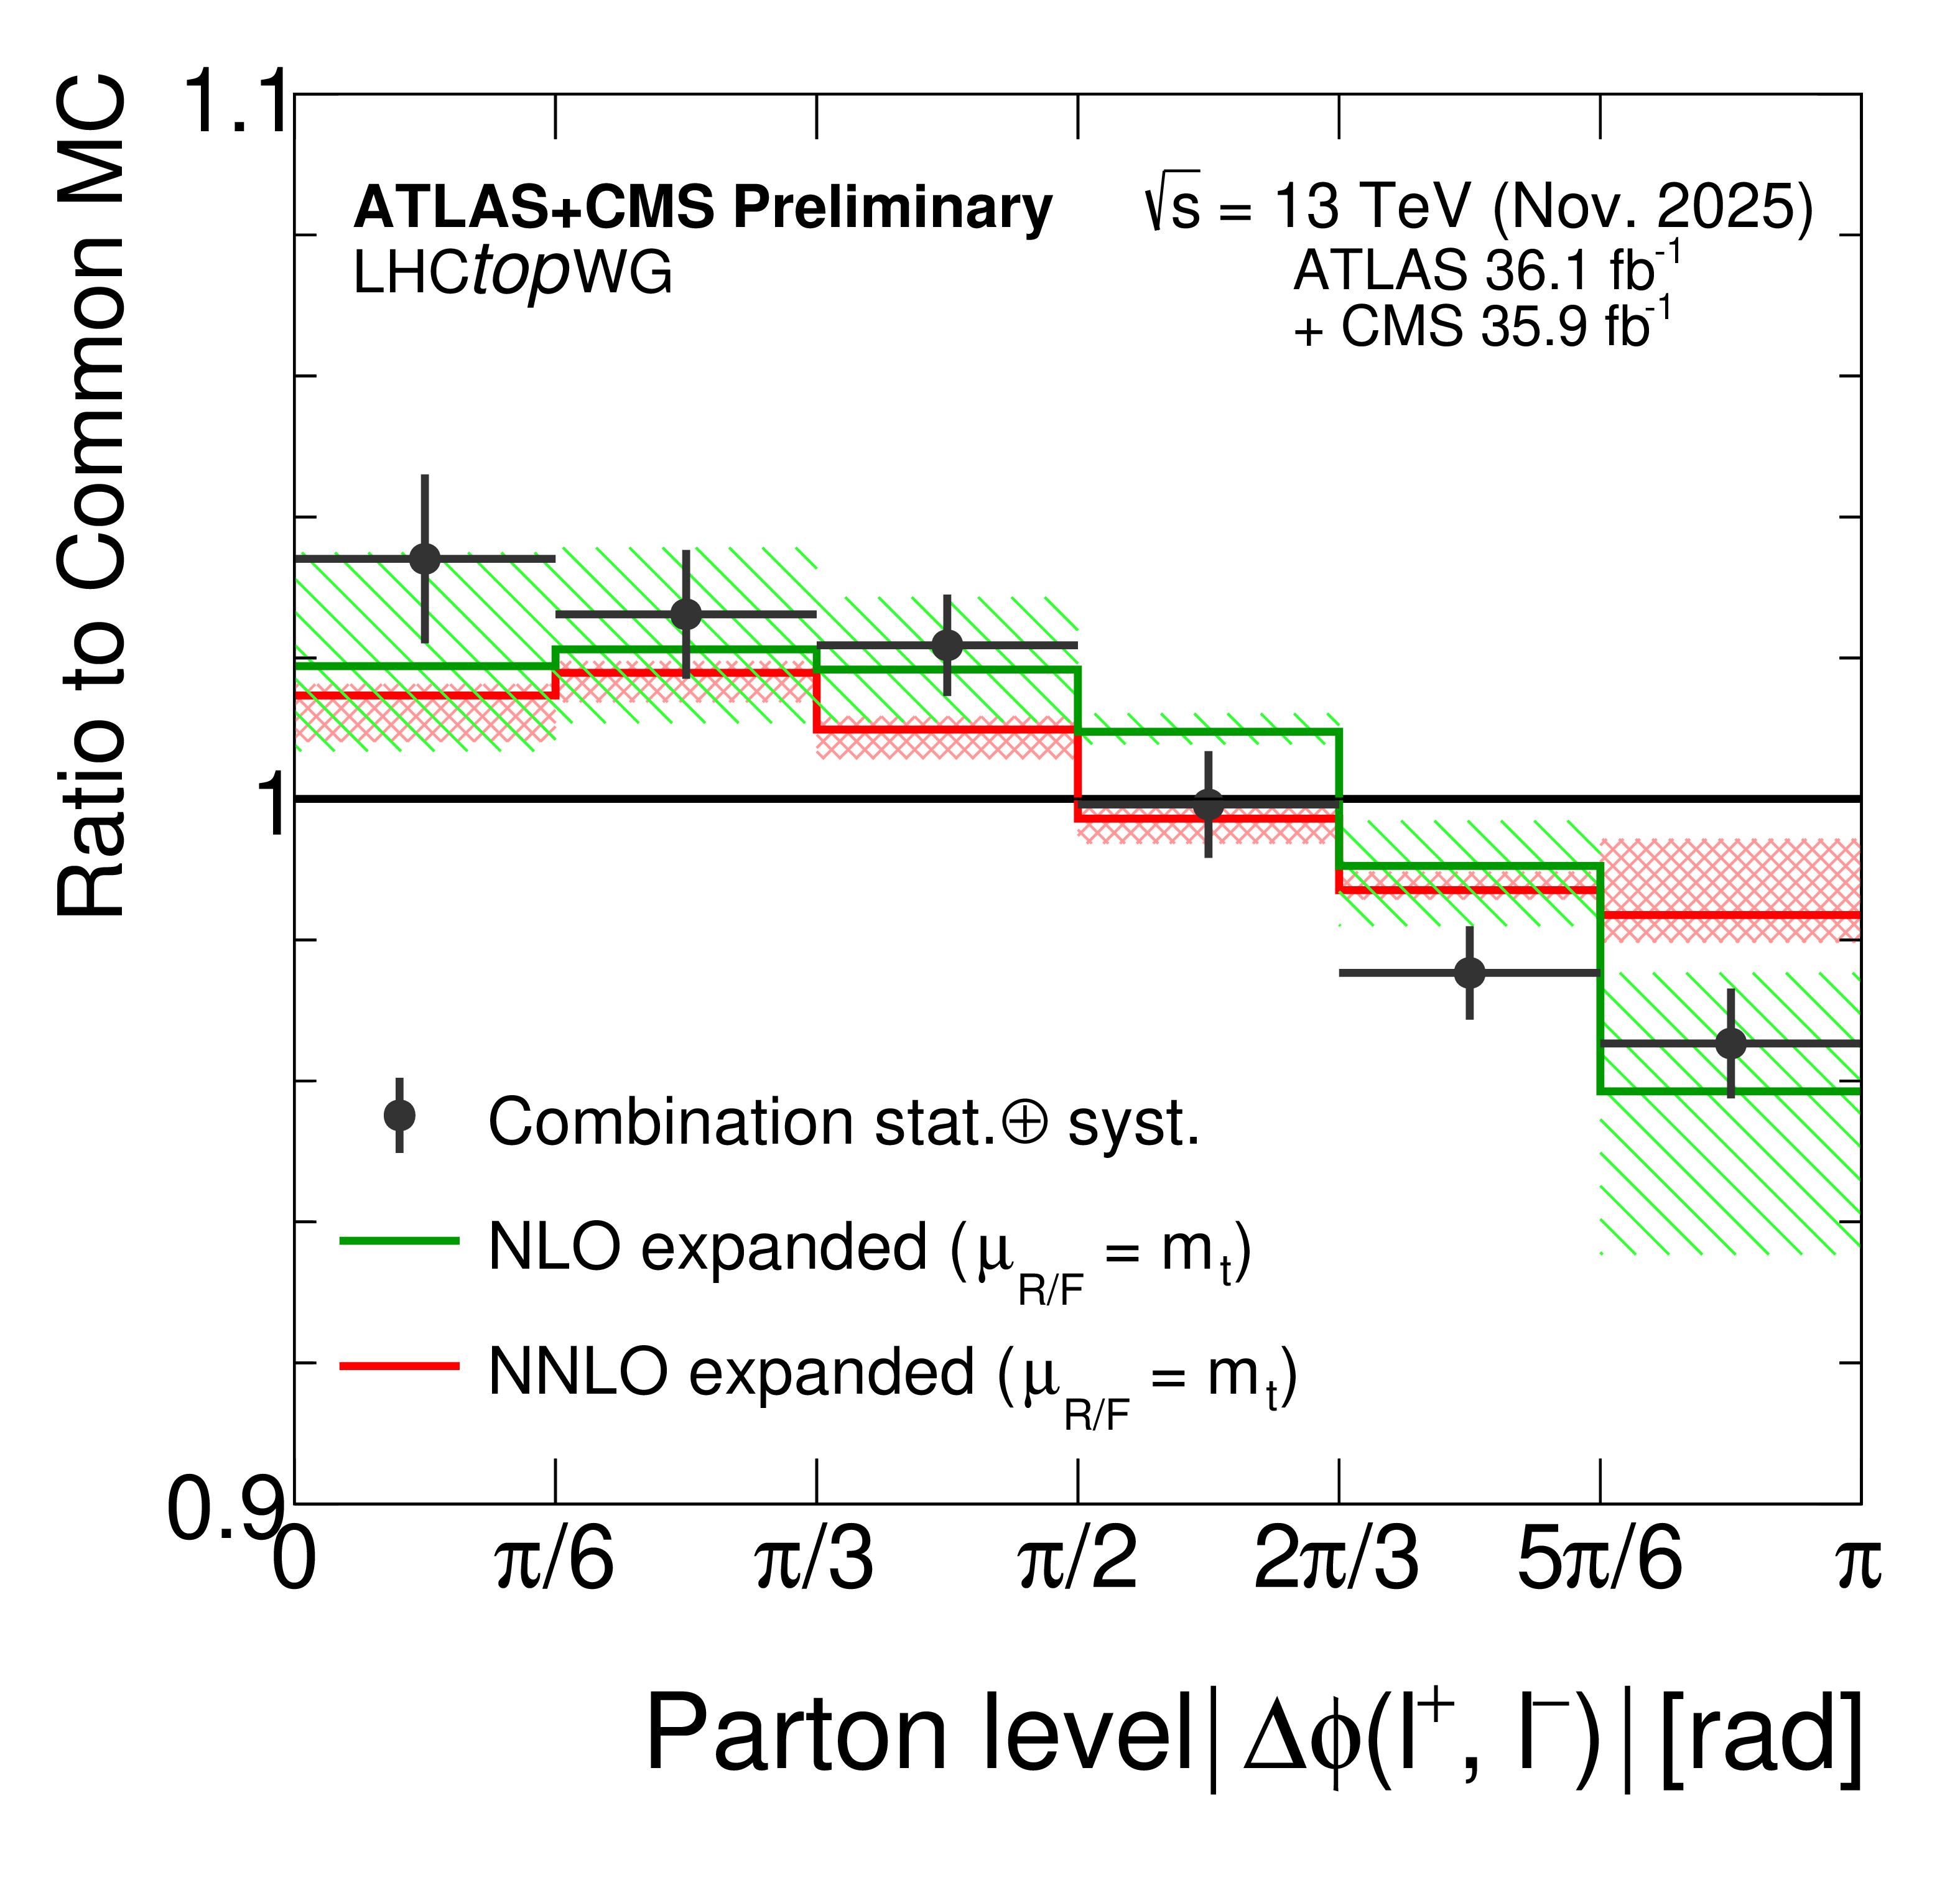
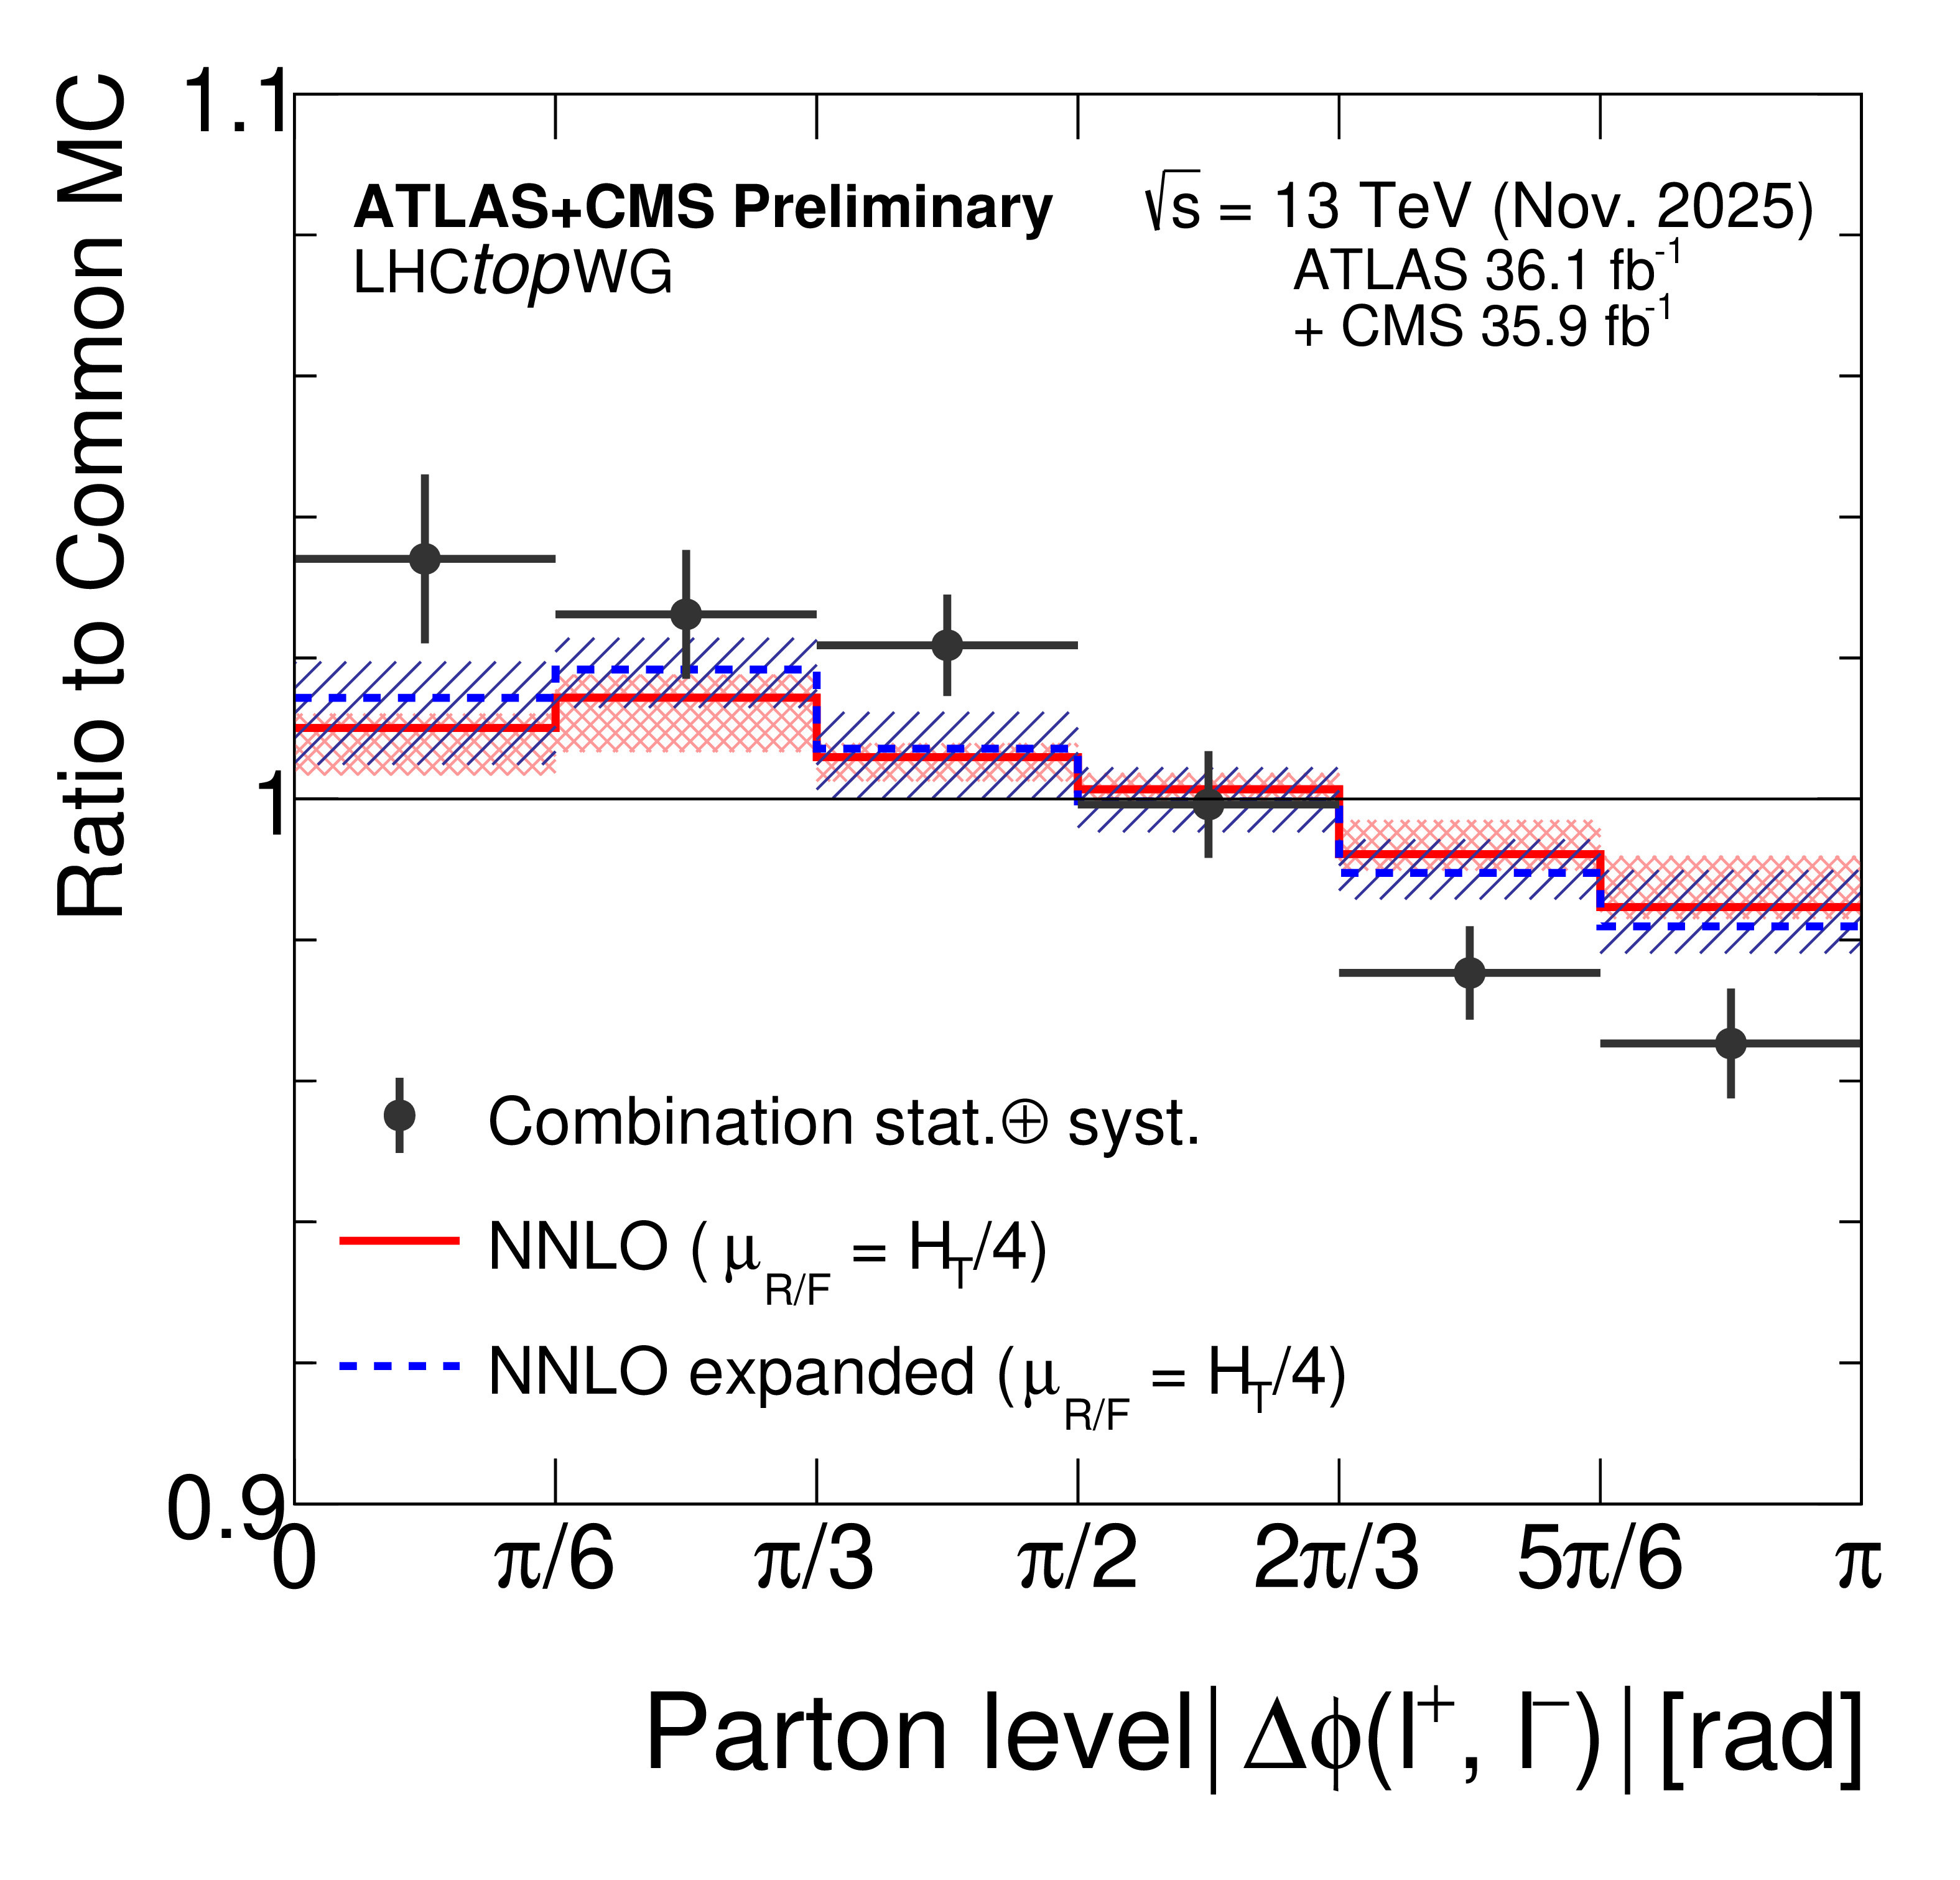
Comparison of the Common MC POWHEG+PYTHIA8 sample [50], the expanded NLO QCD+Weak prediction [30,31,19] and several versions of the fixed-order NLO and NNLO QCD predictions [29] to the combined ATLAS and CMS data. The ratio is calculated relative to the Common MC prediction. The renormalisation $ \mu_{\textrm{R}} $ and factorisation $ \mu_{\textrm{F}} $ scales are shown in parentheses. The $ \mu_{\textrm{R/F}}=m_t $ predictions in (b) and (c) are interpolated from 10 bins to 6 bins. |
png pdf |
Figure 6-a:
Comparison of the Common MC POWHEG+PYTHIA8 sample [50], the expanded NLO QCD+Weak prediction [30,31,19] and several versions of the fixed-order NLO and NNLO QCD predictions [29] to the combined ATLAS and CMS data. The ratio is calculated relative to the Common MC prediction. The renormalisation $ \mu_{\textrm{R}} $ and factorisation $ \mu_{\textrm{F}} $ scales are shown in parentheses. The $ \mu_{\textrm{R/F}}=m_t $ predictions in (b) and (c) are interpolated from 10 bins to 6 bins. |
png pdf |
Figure 6-b:
Comparison of the Common MC POWHEG+PYTHIA8 sample [50], the expanded NLO QCD+Weak prediction [30,31,19] and several versions of the fixed-order NLO and NNLO QCD predictions [29] to the combined ATLAS and CMS data. The ratio is calculated relative to the Common MC prediction. The renormalisation $ \mu_{\textrm{R}} $ and factorisation $ \mu_{\textrm{F}} $ scales are shown in parentheses. The $ \mu_{\textrm{R/F}}=m_t $ predictions in (b) and (c) are interpolated from 10 bins to 6 bins. |
png pdf |
Figure 6-c:
Comparison of the Common MC POWHEG+PYTHIA8 sample [50], the expanded NLO QCD+Weak prediction [30,31,19] and several versions of the fixed-order NLO and NNLO QCD predictions [29] to the combined ATLAS and CMS data. The ratio is calculated relative to the Common MC prediction. The renormalisation $ \mu_{\textrm{R}} $ and factorisation $ \mu_{\textrm{F}} $ scales are shown in parentheses. The $ \mu_{\textrm{R/F}}=m_t $ predictions in (b) and (c) are interpolated from 10 bins to 6 bins. |
png pdf |
Figure 6-d:
Comparison of the Common MC POWHEG+PYTHIA8 sample [50], the expanded NLO QCD+Weak prediction [30,31,19] and several versions of the fixed-order NLO and NNLO QCD predictions [29] to the combined ATLAS and CMS data. The ratio is calculated relative to the Common MC prediction. The renormalisation $ \mu_{\textrm{R}} $ and factorisation $ \mu_{\textrm{F}} $ scales are shown in parentheses. The $ \mu_{\textrm{R/F}}=m_t $ predictions in (b) and (c) are interpolated from 10 bins to 6 bins. |
| Tables | |
png pdf |
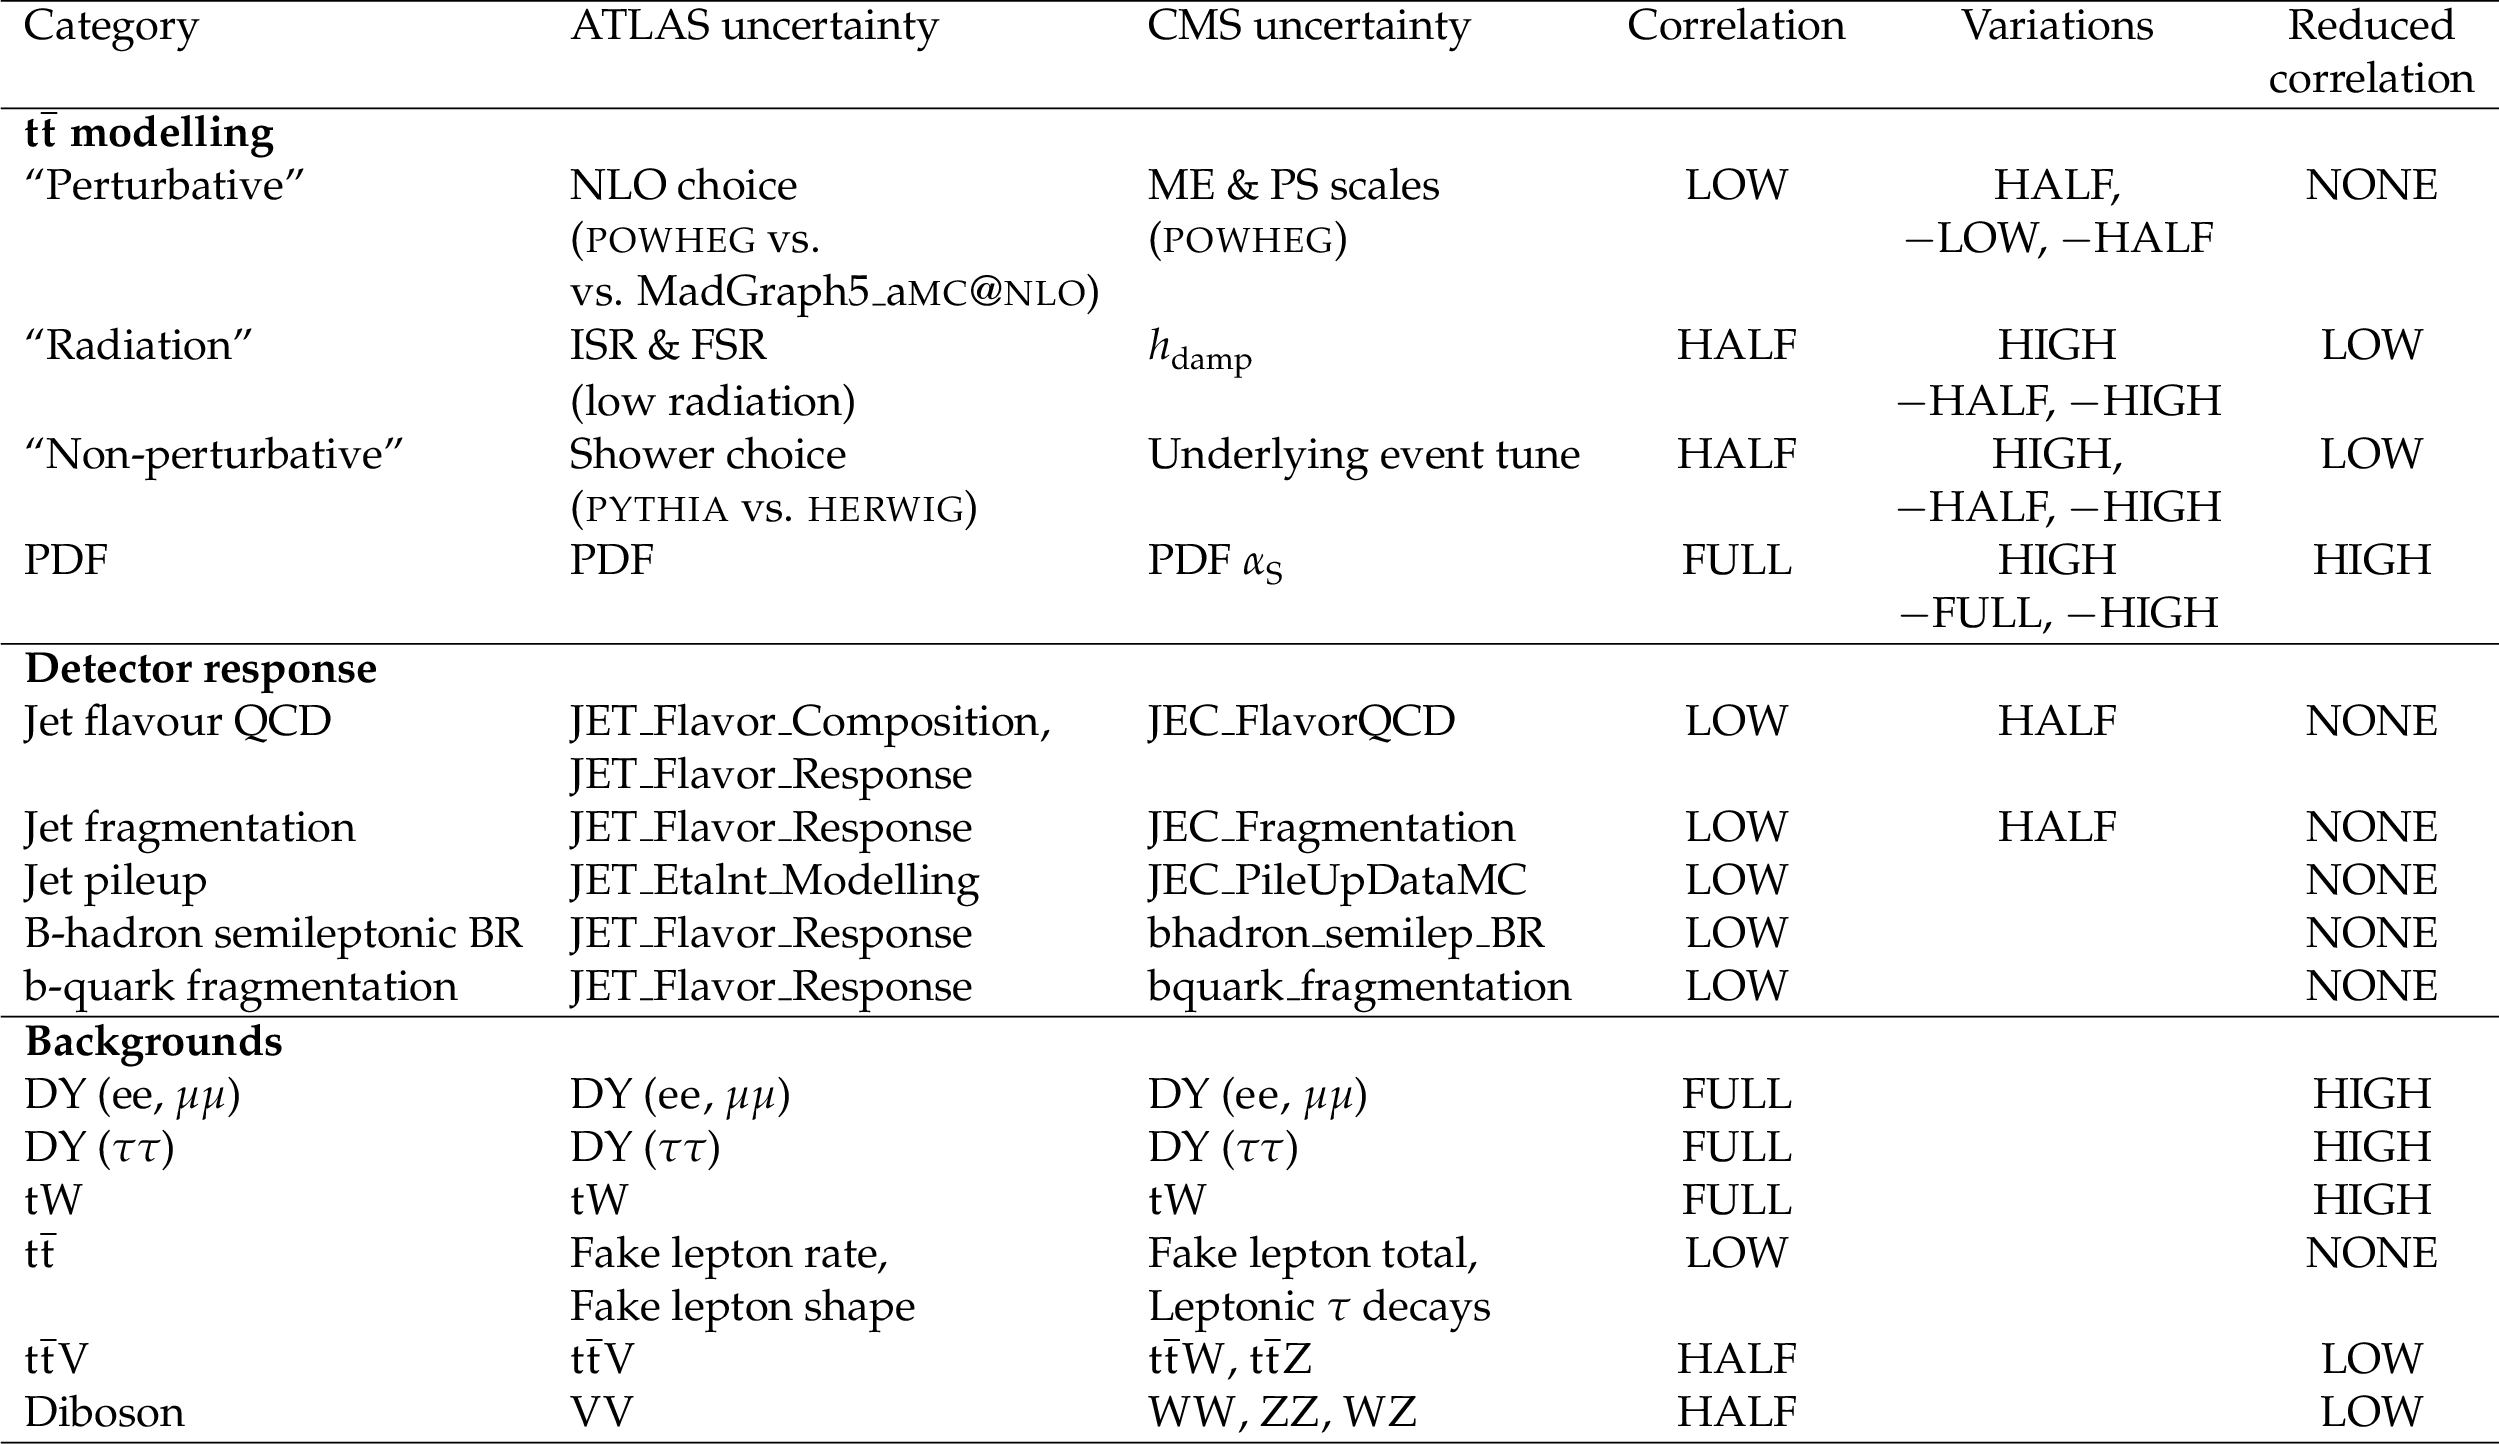
Table 1:
Assumed correlations between the ATLAS and CMS systematic uncertainties. Full details of the uncertainties are given in Refs. [none-none-none,none-none-none-none]. Any uncertainties not included in the table are considered to be uncorrelated. The ``Variations'' column indicates the range of variations considered for the modelling and jet uncertainties, while the ``Reduced correlation'' column shows the assumptions made when each correlation is reduced by one step (typically 25%). The exact names of the jet-related uncertainties are listed, for completeness. |
png pdf |
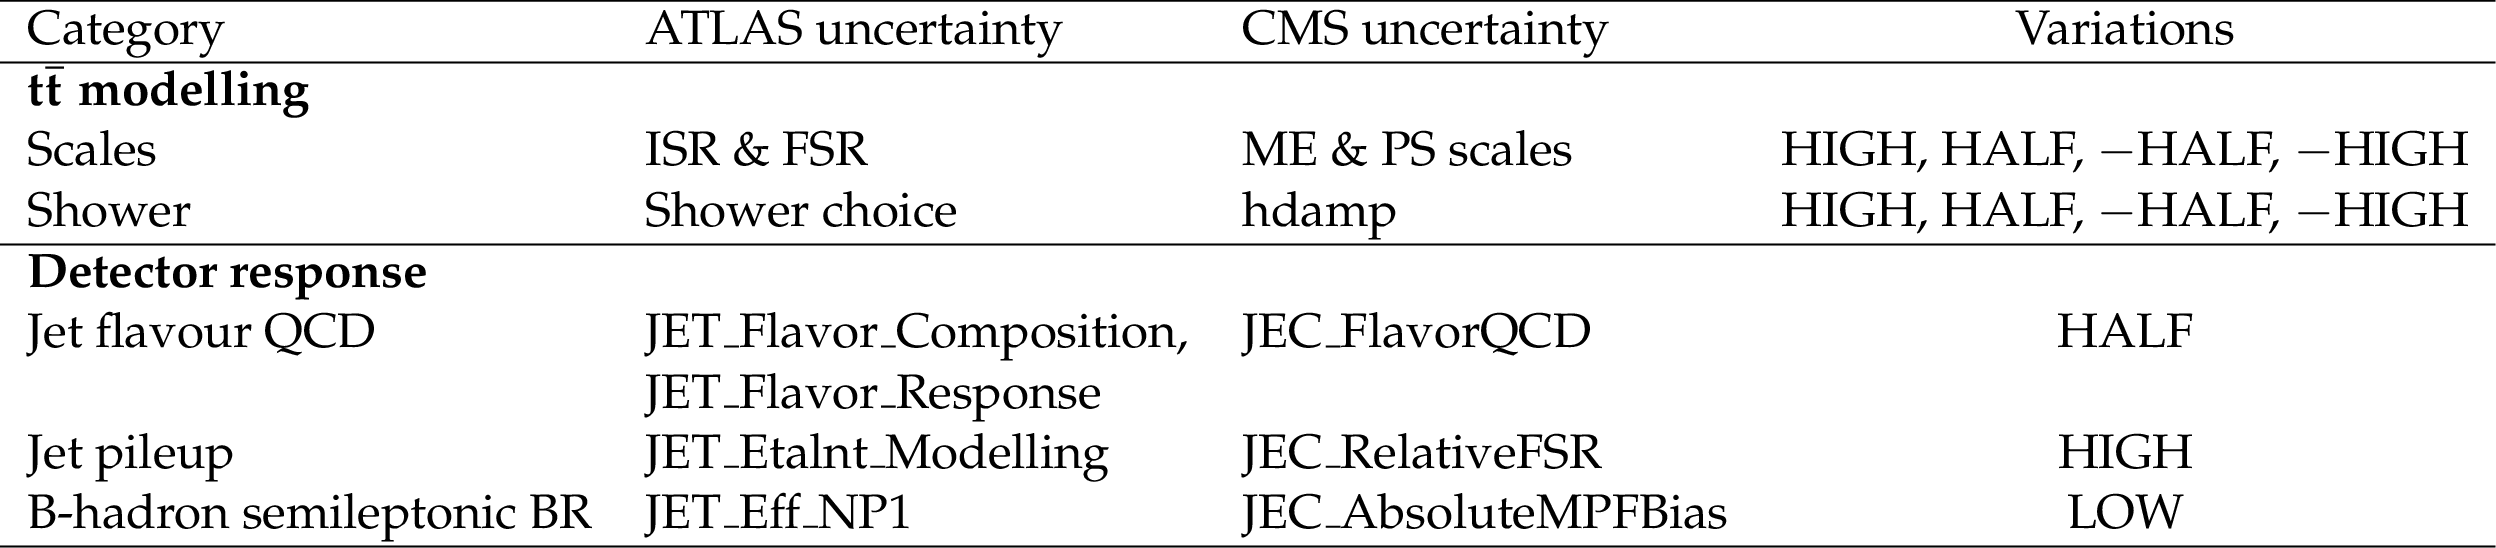
Table 2:
Assumed correlations between alternative combinations of the ATLAS and CMS systematic uncertainties. Full details of the uncertainties are given in Refs. [none-none-none,none-none-none-none]. The ``Variations'' column indicates the range of variations considered for the modelling and jet uncertainties. The exact names of the jet-related uncertainties are listed, for completeness. |
png pdf |
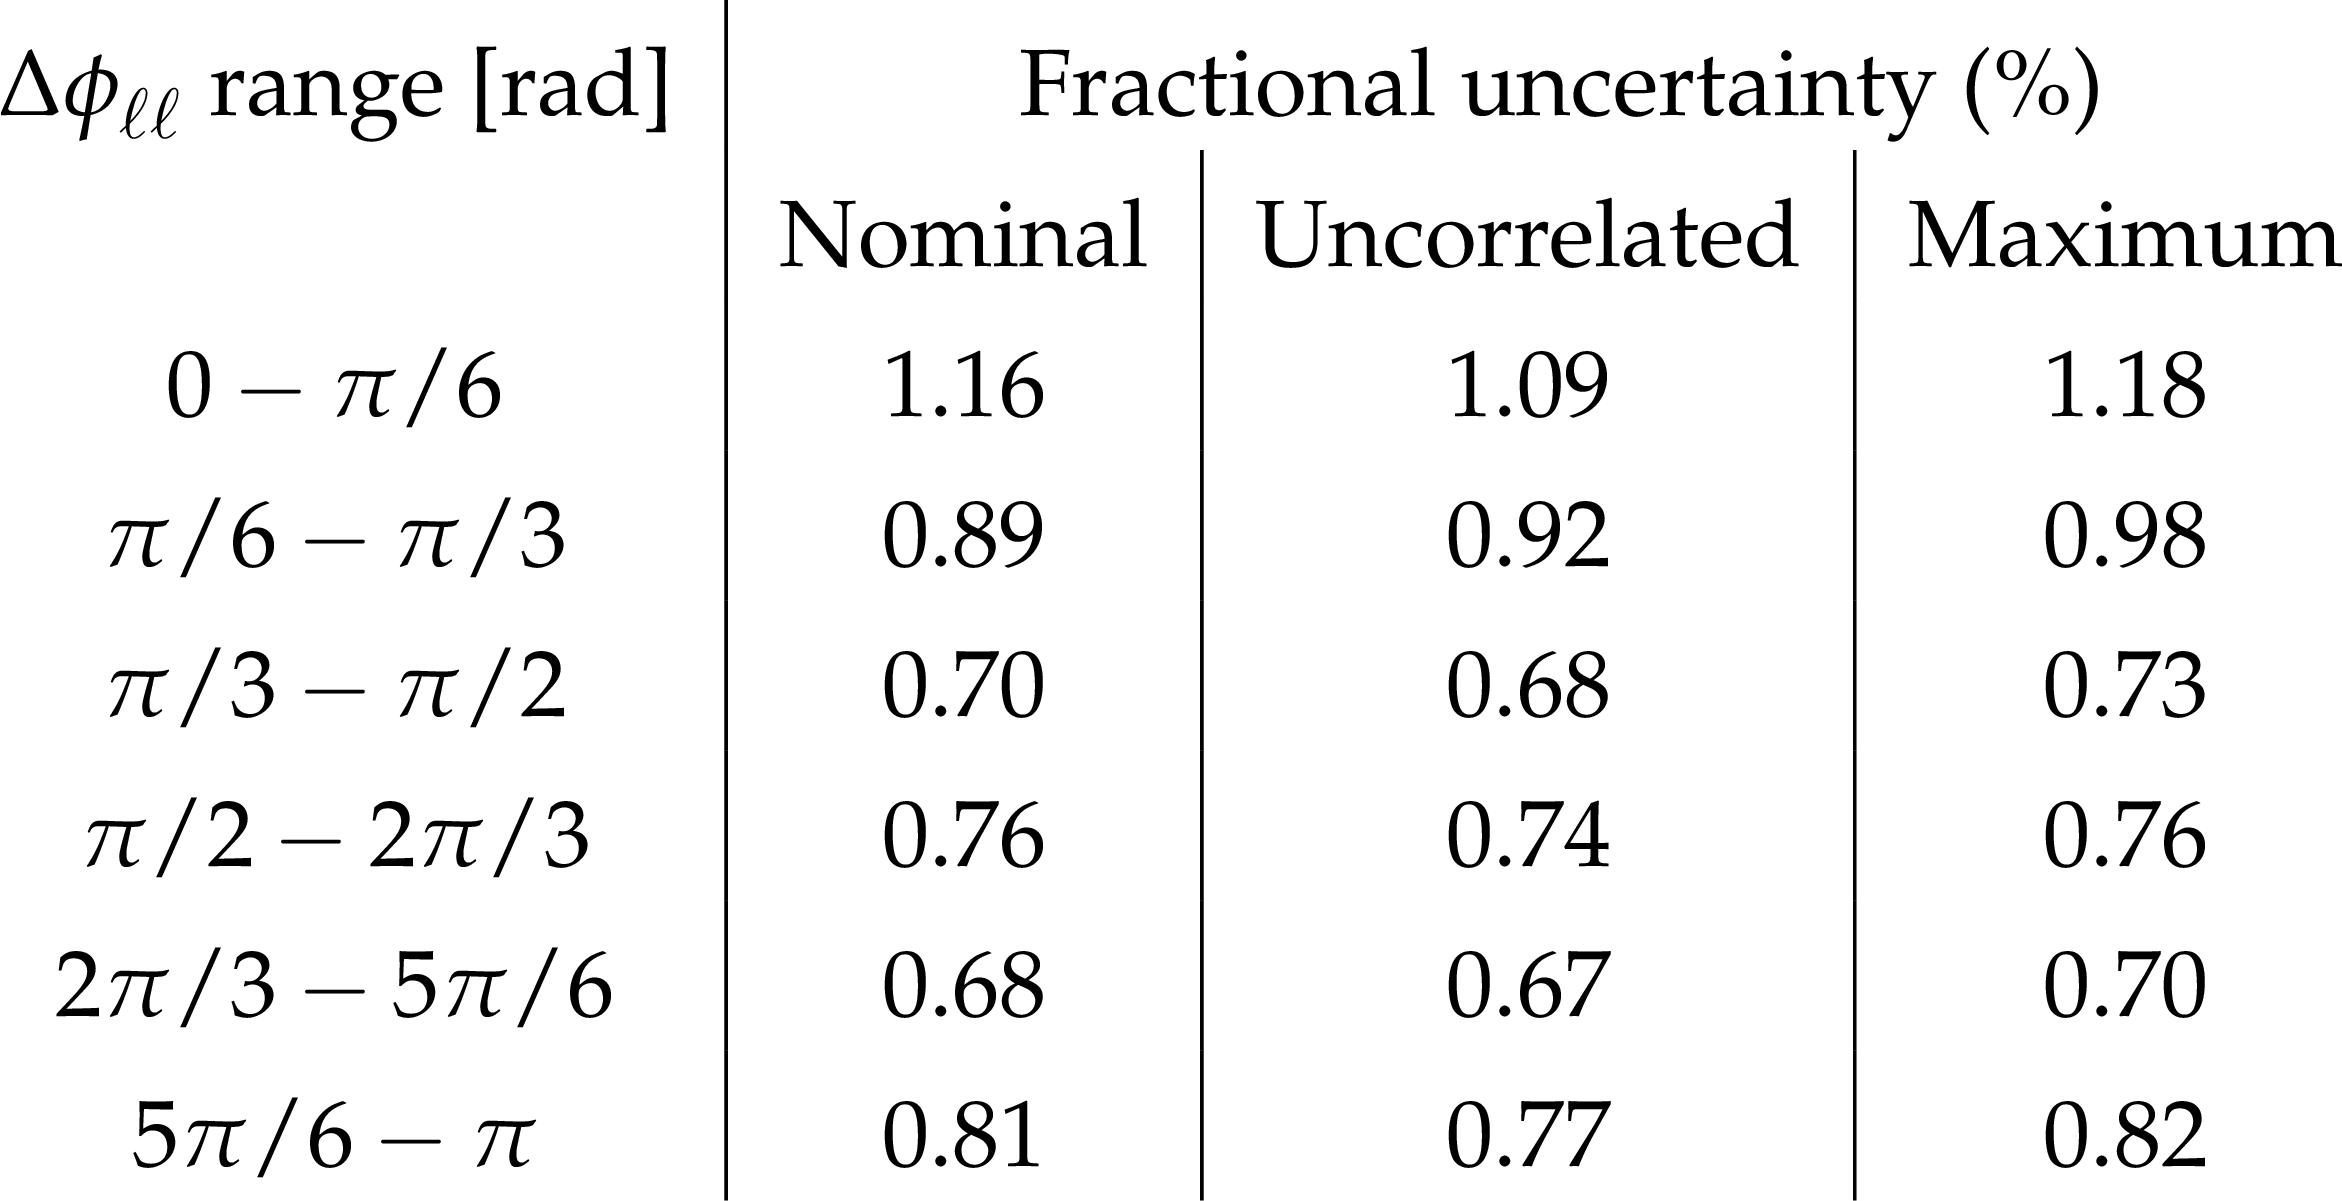
Table 3:
Fractional uncertainties (statistical and systematic) on the normalised differential cross-section as a function of $ \Delta\phi_{\ell\ell} $ from the ATLAS and CMS combination. The uncertainties are compared between the nominal correlation assumptions, the case where all uncertainties are treated as uncorrelated between ATLAS and CMS, and the maximum uncertainty from alternative correlation assumptions considered in Tables 1 and 2, respectively. |
png pdf |
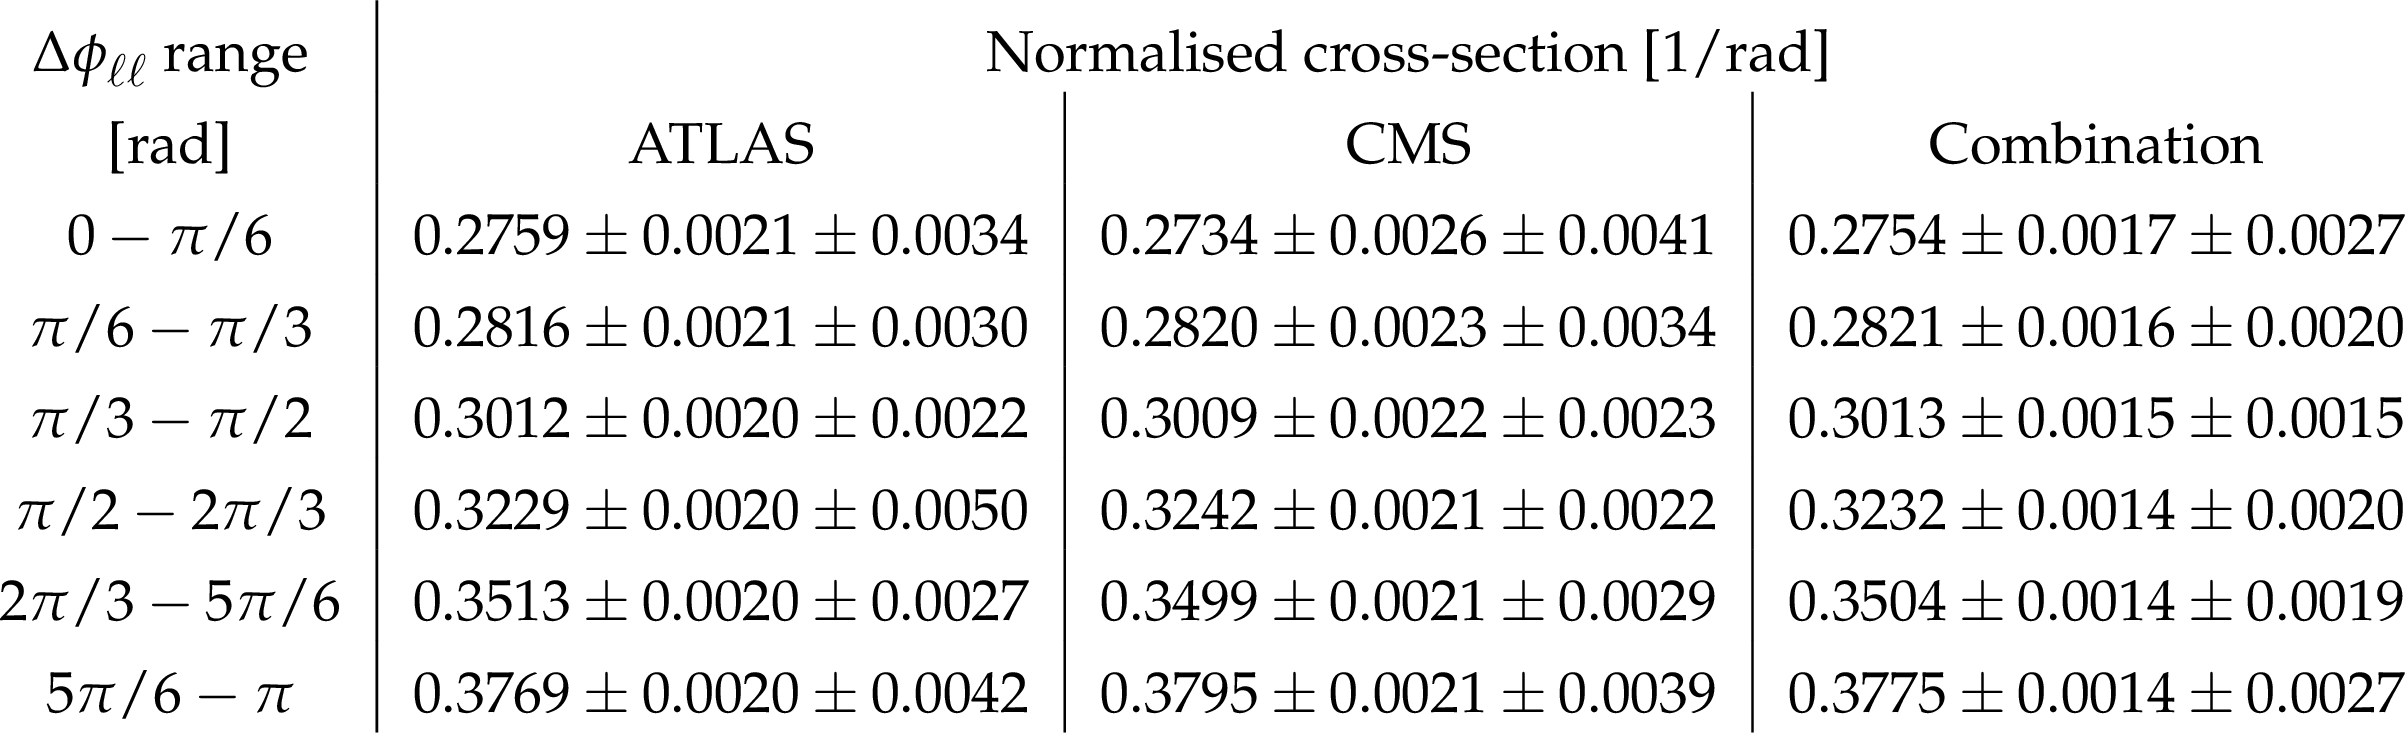
Table 4:
Normalised differential cross-section as a function of $ \Delta\phi_{\ell\ell} $ from ATLAS and CMS individually, and for their combination. The two uncertainties in each measurement are the statistical and systematic uncertainty contributions, respectively. The statistical uncertainty includes both the data statistical uncertainty and the contribution from MC statistics. |

png pdf |
Table 5:
$ \chi^2 $ values per degree of freedom (DOF) and $ \chi^2 $ probabilities for compatibility between data and predictions, using the full covariance matrix for the ATLAS and CMS combined dataset. The `Measurement' uncertainties refer to those derived from the $\textit{Convino}$ combination, while the `Total' uncertainty also includes statistical and scale uncertainties in the theoretical predictions. The QCD scales ($ \mu_{\textrm{R}}, \mu_{\textrm{F}} $) used in the fixed-order predictions and in the POWHEG ME are also listed. |
| Summary |
| A combination of the normalised $ \Delta\phi_{\ell\ell} $ distributions measured by the ATLAS and CMS experiments has been performed, and is presented in this note. The uncertainties in the combined distributions are reduced compared to the original measurements. The data are compared to predictions from the POWHEG matrix element generator, interfaced to the PYTHIA8 parton shower, focusing on a common MC sample developed by the two experiments. The common NLO MC prediction is in tension with the combined data, showing clear differences in shape. The discrepancy remains when a $ \chi^2 $ compatibility value is evaluated from the full covariance of the measurements, even when theoretical uncertainties estimated from MC scale variations are taken into account, leading to a $ \chi^2 $ probability of 2% for the MC\@. In contrast, the fixed-order theoretical predictions including higher-order corrections agree better with the data, with $ \chi^2 $ probabilities of 17% for NNLO QCD and 55% for NLO QCD+Weak predictions. |
| References | ||||
| 1 | CDF Collaboration | Measurement of $ t\bar{t} $ Spin Correlation in $ p\bar{p} $ Collisions Using the CDF II Detector at the Tevatron | PRD 83 (2011) 031104 | 1012.3093 |
| 2 | D0 Collaboration | Measurement of spin correlation in $ t\bar{t} $ production using a matrix element approach | PRL 107 (2011) 032001 | 1104.5194 |
| 3 | D0 Collaboration | Measurement of spin correlation in $ t\bar{t} $ production using dilepton final states | PLB 702 (2011) 16 | 1103.1871 |
| 4 | D0 Collaboration | Evidence for spin correlation in $ t\bar{t} $ production | PRL 108 (2012) 032004 | 1110.4194 |
| 5 | ATLAS Collaboration | Observation of Spin Correlation in $t\bar{t}$ Events from $pp$ Collisions at $\sqrt{s}=7$ TeV Using the ATLAS Detector | PRL 108 (2012) 212001 | 1203.4081 |
| 6 | CMS Collaboration | Measurements of $t\bar{t}$ spin correlations and top-quark polarization using dilepton final states in $pp$ collisions at $\sqrt{s} = 7 $ TeV | PRL 112 (2014) 182001 | CMS-TOP-13-003 1311.3924 |
| 7 | ATLAS Collaboration | Measurement of Spin Correlation in Top--Antitop Quark Events and Search for Top Squark Pair Production in $pp$ Collisions at $\sqrt{s} = 8 $ TeV Using the ATLAS Detector | PRL 114 (2015) 142001 | 1412.4742 |
| 8 | ATLAS Collaboration | Measurements of spin correlation in top--antitop quark events from proton--proton collisions at $\sqrt{s} = 7 $ TeV using the ATLAS detector | PRD 90 (2014) 112016 | 1407.4314 |
| 9 | ATLAS Collaboration | Measurement of the correlation between the polar angles of leptons from top quark decays in the helicity basis at $\sqrt{s} = 7 $ TeV using the ATLAS detector | PRD 93 (2016) 012002 | 1510.07478 |
| 10 | CMS Collaboration | Measurement of spin correlations in $t\bar{t}$ production using the matrix element method in the muon+jets final state in $pp$ collisions at $\sqrt{s} = 8 $ TeV | PLB 758 (2016) 321 | CMS-TOP-13-015 1511.06170 |
| 11 | D0 Collaboration | Measurement of Spin Correlation between Top and Antitop Quarks Produced in $ p\bar{p} $ Collisions at $ \sqrt{s} = $ 1.96 TeV | PLB 757 (2016) 199 | 1512.08818 |
| 12 | ATLAS Collaboration | Measurements of top quark spin observables in $t\bar{t}$ events using dilepton final states in $\sqrt{s} = 8 $ TeV $pp$ collisions with the ATLAS detector | JHEP 03 (2017) 113 | 1612.07004 |
| 13 | CMS Collaboration | Measurements of $t\bar{t}$ spin correlations and top quark polarization using dilepton final states in $pp$ collisions at $\sqrt{s} = 8 $ TeV | PRD 93 (2016) 052007 | CMS-TOP-14-023 1601.01107 |
| 14 | ATLAS Collaboration | Observation of quantum entanglement with top quarks at the ATLAS detector | Nature 633 (2024) 542 | 2311.07288 |
| 15 | CMS Collaboration | Observation of quantum entanglement in top quark pair production in proton--proton collisions at $\sqrt{s} = 13 $ TeV | Rept. Prog. Phys. 87 (2024) 117801 | CMS-TOP-23-001 2406.03976 |
| 16 | CMS Collaboration | Measurements of polarization and spin correlation and observation of entanglement in top quark pairs using lepton+jets events from proton--proton collisions at $\sqrt{s} = 13 $ TeV | PRD 110 (2024) 112016 | CMS-TOP-23-007 2409.11067 |
| 17 | CMS Collaboration | Observation of a pseudoscalar excess at the top quark pair production threshold | CMS-TOP-24-007 2503.22382 |
|
| 18 | ATLAS Collaboration | Observation of a cross-section enhancement near the $t\bar{t}$ production threshold in $\sqrt{s} = 13 $ TeV $pp$ collisions with the ATLAS detector | ATLAS-CONF-2025-008 CDS |
|
| 19 | W. Bernreuther, D. Heisler, and Z.-G. Si | A set of top quark spin correlation and polarization observables for the LHC: Standard Model predictions and new physics contributions | JHEP 12 (2015) 026 | 1508.05271 |
| 20 | G. Mahlon and S. J. Parke | Spin Correlation Effects in Top Quark Pair Production at the LHC | PRD 81 (2010) 074024 | 1001.3422 |
| 21 | M. Baumgart and B. Tweedie | A New Twist on Top Quark Spin Correlations | JHEP 03 (2013) 117 | 1212.4888 |
| 22 | ATLAS Collaboration | Measurements of top-quark pair spin correlations in the $e\mu$ channel at $\sqrt{s} = 13 $ TeV using $pp$ collisions in the ATLAS detector | EPJC 80 (2020) 754 | 1903.07570 |
| 23 | CMS Collaboration | Measurement of the top quark polarization and $t\bar{t}$ spin correlations using dilepton final states in proton--proton collisions at $\sqrt{s} = 13 $ TeV | PRD 100 (2019) 072002 | CMS-TOP-18-006 1907.03729 |
| 24 | ATLAS Collaboration | The ATLAS Experiment at the CERN Large Hadron Collider | JINST 3 (2008) S08003 | |
| 25 | CMS Collaboration | The CMS Experiment at the CERN LHC | JINST 3 (2008) S08004 | |
| 26 | ATLAS Collaboration | Measurements of $b$-jet tagging efficiency with the ATLAS detector using $t\bar{t}$ events at $\sqrt{s} = 13 $ TeV | JHEP 08 (2018) 089 | 1805.01845 |
| 27 | G. D'Agostini | A Multidimensional unfolding method based on Bayes' theorem | NIM A 362 (1995) 487 | |
| 28 | T. Adye | Unfolding algorithms and tests using RooUnfold | in Proceedings, Workshop on Statistical Issues Related to Discovery Claims in Search Experiments and Unfolding PHYSTAT 201 (2011) 313 |
1105.1160 |
| 29 | A. Behring et al. | Higher order corrections to spin correlations in top quark pair production at the LHC | PRL 123 (2019) 082001 | 1901.05407 |
| 30 | W. Bernreuther and Z.-G. Si | Distributions and correlations for top quark pair production and decay at the Tevatron and LHC. | Nucl. Phys. B837 90--121, 2010 | 1003.3926 |
| 31 | W. Bernreuther and Z.-G. Si | Top quark spin correlations and polarization at the LHC: standard model predictions and effects of anomalous top chromo moments | PLB 725 (2013) 115 | 1305.2066 |
| 32 | CMS Collaboration | Identification of heavy-flavour jets with the CMS detector in $pp$ collisions at \(13 \textTeV\) | JINST 13 (2018) P05011 | CMS-BTV-16-002 1712.07158 |
| 33 | CMS Collaboration | Measurement of the differential cross section for top quark pair production in $pp$ collisions at $\sqrt{s} = 8 $ TeV | EPJC 75 (2015) 542 | CMS-TOP-12-028 1505.04480 |
| 34 | CMS Collaboration | Measurements of $t\bar{t}$ differential cross sections in proton--proton collisions at $\sqrt{s} = 13 $ TeV using events containing two leptons | JHEP 02 (2019) 149 | CMS-TOP-17-014 1811.06625 |
| 35 | CMS Collaboration | Measurement of the top quark pair production cross section in proton--proton collisions at $\sqrt{s} = 13 $ TeV | PRL 116 (2016) 052002 | CMS-TOP-15-003 1510.05302 |
| 36 | S. Schmitt | TUnfold, an algorithm for correcting migration effects in high energy physics | JINST 7 (2012) T10003 | 1205.6201 |
| 37 | S. Frixione, G. Ridolfi, and P. Nason | A positive-weight next-to-leading-order Monte Carlo for heavy flavour hadroproduction | JHEP 09 (2007) 126 | 0707.3088 |
| 38 | S. Alioli, P. Nason, C. Oleari, and E. Re | A general framework for implementing NLO calculations in shower Monte Carlo programs: the POWHEG BOX | JHEP 06 (2010) 043 | 1002.2581 |
| 39 | P. Nason | A new method for combining NLO QCD with shower Monte Carlo algorithms | JHEP 11 (2004) 040 | hep-ph/0409146 |
| 40 | S. Frixione, P. Nason, and C. Oleari | Matching NLO QCD computations with parton shower simulations: the POWHEG method | JHEP 11 (2007) 070 | 0709.2092 |
| 41 | J. Alwall et al. | The automated computation of tree-level and next-to-leading order differential cross sections, and their matching to parton shower simulations | JHEP 07 (2014) 079 | 1405.0301 |
| 42 | NNPDF Collaboration , R. D. Ball et al. | Parton distributions with LHC data | NPB 867 (2013) 244 | 1207.1303 |
| 43 | NNPDF Collaboration , R. D. Ball et al. | Parton distributions for the LHC run II | JHEP 04 (2015) 040 | 1410.8849 |
| 44 | J. Bellm et al. | Herwig 7.0/Herwig++ 3.0 release note | EPJC 76 (2016) 196 | 1512.01178 |
| 45 | ATLAS Collaboration | Simulation of top-quark production for the ATLAS experiment at $\sqrt{s} = 13 $ TeV | ATL-PHYS-PUB-2016-004 CDS |
|
| 46 | J. Butterworth et al. | PDF4LHC recommendations for LHC Run II | JPG 43 (2016) 023001 | 1510.03865 |
| 47 | NNPDF Collaboration | Unbiased global determination of parton distributions and their uncertainties at NNLO and at LO | NPB 855 (2012) 153 | 1107.2652 |
| 48 | J. Kieseler | A method and tool for combining differential or inclusive measurements obtained with simultaneously constrained uncertainties | EPJC 77 (2017) 792 | 1706.01681 |
| 49 | ATLAS and CMS Collaborations | Combination of inclusive top-quark pair production cross-section measurements using ATLAS and CMS data at $\sqrt{s} = 7$ and $8$ TeV | JHEP 07 (2023) 213 | 2205.13830 |
| 50 | ATLAS and CMS Collaborations | Improved Common $t\bar{t}$ Monte-Carlo settings for ATLAS and CMS | ATL-PHYS-PUB-2023-016, CMS-NOTE-2023-004 CDS |
|
| 51 | ATLAS Collaboration | Measurement of the $t\bar{t}$ production cross-section and lepton differential distributions in $e\mu$ dilepton events from $pp$ collisions at $\sqrt{s} = 13 $ TeV with the ATLAS detector | EPJC 80 (2020) 528 | 1910.08819 |
| 52 | ATLAS Collaboration | Inclusive and differential cross-sections for dilepton $t\bar{t}$ production measured in $\sqrt{s} = 13 $ TeV $pp$ collisions with the ATLAS detector | JHEP 07 (2023) 141 | 2303.15340 |
| 53 | ATLAS Collaboration | Precise measurement of the $ t\bar{t} $ production cross-section and lepton differential distributions in $ e\mu $ dilepton events from $ \sqrt{s}= $ 13 TeV $ pp $ collisions with the ATLAS detector | 2509.15066 | |
|
|
Compact Muon Solenoid LHC, CERN |
|

|

|

|

|

|