

Compact Muon Solenoid
LHC, CERN
| CMS-TOP-14-023 ; CERN-PH-EP-2015-333 | ||
| Measurements of $\mathrm{ t \bar{t} }$ spin correlations and top quark polarization using dilepton final states in pp collisions at $ \sqrt{s} = $ 8 TeV | ||
| CMS Collaboration | ||
| 6 January 2016 | ||
| Phys. Rev. D 93 (2016) 052007 | ||
| Abstract: Measurements of the top quark-antiquark ($\mathrm{ t \bar{t} }$) spin correlations and the top quark polarization are presented for $\mathrm{ t \bar{t} }$ pairs produced in pp collisions at $ \sqrt{s} = $ 8 TeV. The data correspond to an integrated luminosity of 19.5 fb$^{-1}$ collected with the CMS detector at the LHC. The measurements are performed using events with two oppositely charged leptons (electrons or muons) and two or more jets, where at least one of the jets is identified as originating from a bottom quark. The spin correlations and polarization are measured from the angular distributions of the two selected leptons, both inclusively and differentially, with respect to the invariant mass, rapidity, and transverse momentum of the $\mathrm{ t \bar{t} }$ system. The measurements are unfolded to the parton level and found to be in agreement with predictions of the standard model. A search for new physics in the form of anomalous top quark chromo moments is performed. No evidence of new physics is observed, and exclusion limits on the real part of the chromo-magnetic dipole moment and the imaginary part of the chromo-electric dipole moment are evaluated. | ||
| Links: e-print arXiv:1601.01107 [hep-ex] (PDF) ; CDS record ; inSPIRE record ; HepData record ; CADI line (restricted) ; | ||
| Figures | |
png pdf |
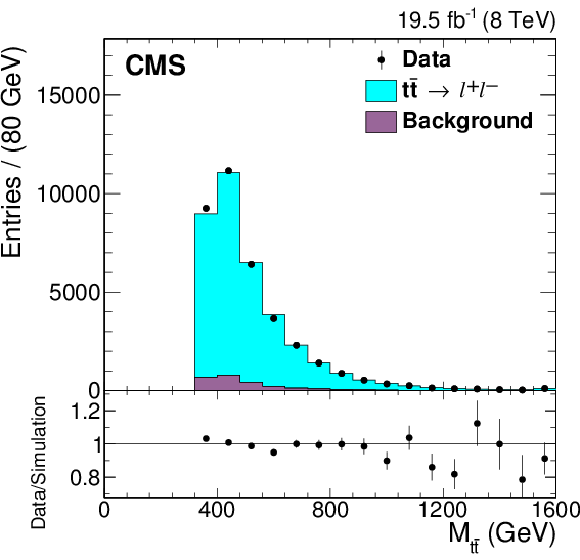
Figure 1-a:
Reconstructed $M_{ {\mathrm{ t \bar{t} } } }$, $y_{ {\mathrm{ t \bar{t} } } }$, and $ {{p_{\mathrm {T}}}^{ {\mathrm{ t \bar{t} } } }} $ distributions from data (points) and simulation (histogram), with the expected signal ($ { {\mathrm{ t \bar{t} } } \to \ell ^{+}\ell ^{-}} $) and background distributions shown separately. All three dilepton flavor combinations are included. The simulated signal yield is normalized to that of the background-subtracted data. The last bins of the $M_{ {\mathrm{ t \bar{t} } } }$ and $ {{p_{\mathrm {T}}}^{ {\mathrm{ t \bar{t} } } }} $ distributions include overflow events. The vertical bars on the data points represent the statistical uncertainties. The lower panels show the ratio of the numbers of events from data and simulation. |
png pdf |
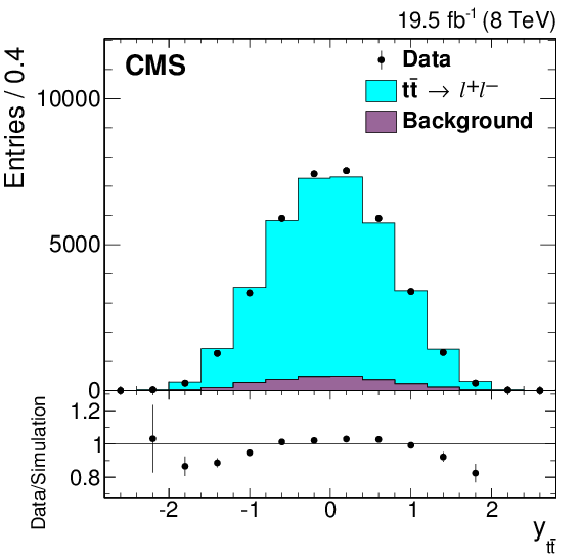
Figure 1-b:
Reconstructed $M_{ {\mathrm{ t \bar{t} } } }$, $y_{ {\mathrm{ t \bar{t} } } }$, and $ {{p_{\mathrm {T}}}^{ {\mathrm{ t \bar{t} } } }} $ distributions from data (points) and simulation (histogram), with the expected signal ($ { {\mathrm{ t \bar{t} } } \to \ell ^{+}\ell ^{-}} $) and background distributions shown separately. All three dilepton flavor combinations are included. The simulated signal yield is normalized to that of the background-subtracted data. The last bins of the $M_{ {\mathrm{ t \bar{t} } } }$ and $ {{p_{\mathrm {T}}}^{ {\mathrm{ t \bar{t} } } }} $ distributions include overflow events. The vertical bars on the data points represent the statistical uncertainties. The lower panels show the ratio of the numbers of events from data and simulation. |
png pdf |
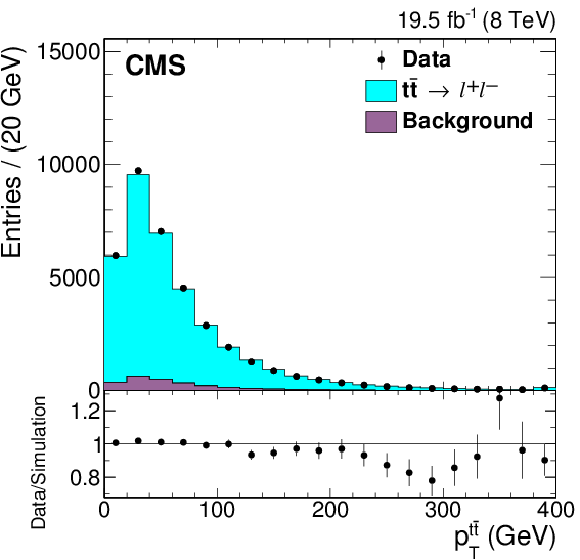
Figure 1-c:
Reconstructed $M_{ {\mathrm{ t \bar{t} } } }$, $y_{ {\mathrm{ t \bar{t} } } }$, and $ {{p_{\mathrm {T}}}^{ {\mathrm{ t \bar{t} } } }} $ distributions from data (points) and simulation (histogram), with the expected signal ($ { {\mathrm{ t \bar{t} } } \to \ell ^{+}\ell ^{-}} $) and background distributions shown separately. All three dilepton flavor combinations are included. The simulated signal yield is normalized to that of the background-subtracted data. The last bins of the $M_{ {\mathrm{ t \bar{t} } } }$ and $ {{p_{\mathrm {T}}}^{ {\mathrm{ t \bar{t} } } }} $ distributions include overflow events. The vertical bars on the data points represent the statistical uncertainties. The lower panels show the ratio of the numbers of events from data and simulation. |
png pdf |
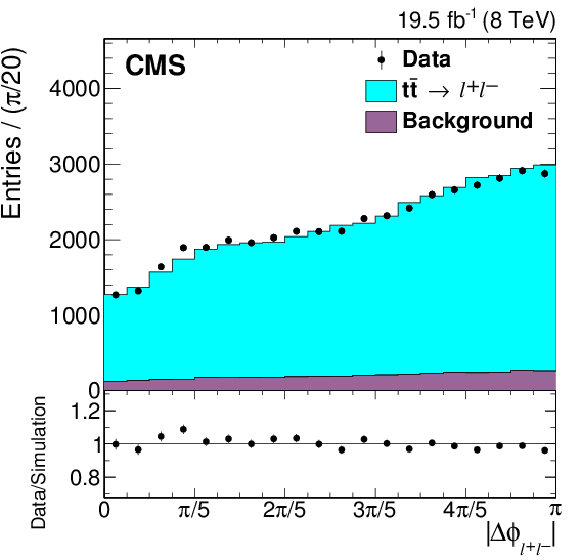
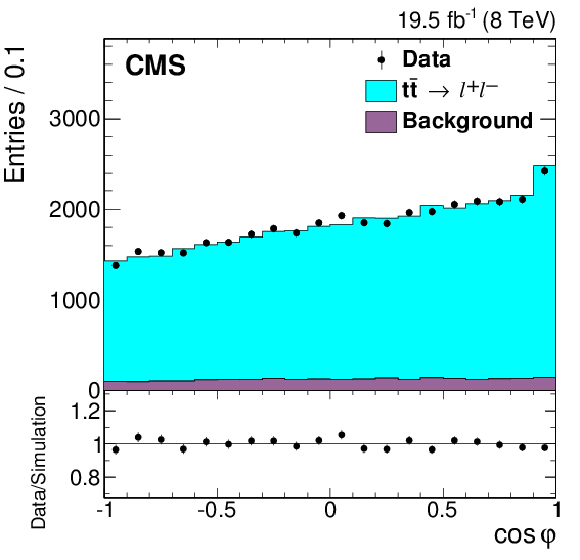
Figure 2-a:
Reconstructed angular distributions from data (points) and simulation (histogram), with the expected signal ($ { {\mathrm{ t \bar{t} } } \to \ell ^{+}\ell ^{-}} $) and background distributions shown separately. All three dilepton flavor combinations are included. The simulated signal yield is normalized to that of the background-subtracted data. The vertical bars on the data points represent the statistical uncertainties. The lower panels show the ratio of the numbers of events from data and simulation. |
png pdf |
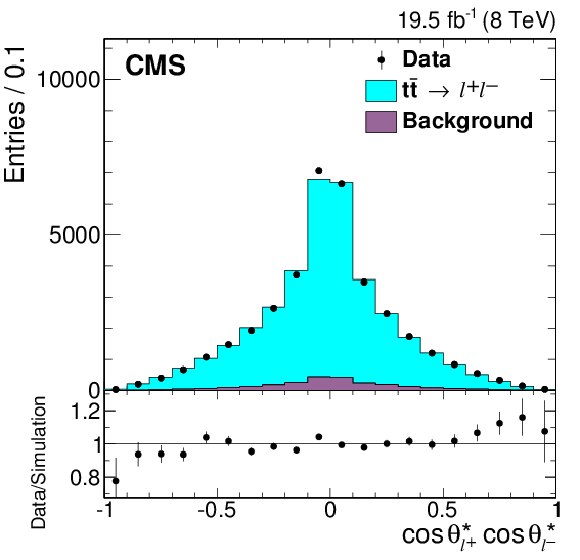
Figure 2-b:
Reconstructed angular distributions from data (points) and simulation (histogram), with the expected signal ($ { {\mathrm{ t \bar{t} } } \to \ell ^{+}\ell ^{-}} $) and background distributions shown separately. All three dilepton flavor combinations are included. The simulated signal yield is normalized to that of the background-subtracted data. The vertical bars on the data points represent the statistical uncertainties. The lower panels show the ratio of the numbers of events from data and simulation. |
png pdf |
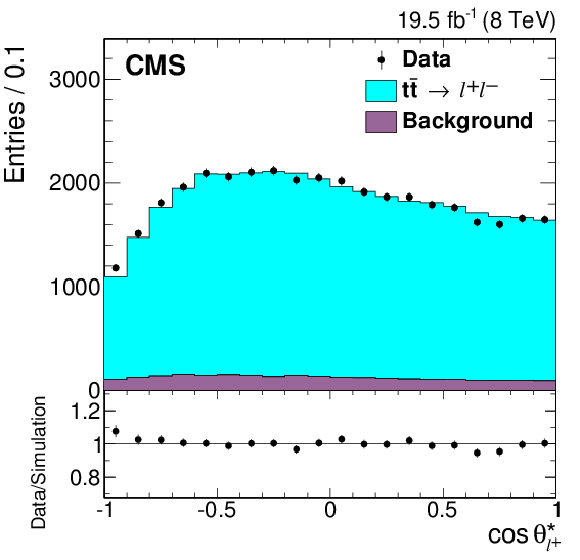
Figure 2-c:
Reconstructed angular distributions from data (points) and simulation (histogram), with the expected signal ($ { {\mathrm{ t \bar{t} } } \to \ell ^{+}\ell ^{-}} $) and background distributions shown separately. All three dilepton flavor combinations are included. The simulated signal yield is normalized to that of the background-subtracted data. The vertical bars on the data points represent the statistical uncertainties. The lower panels show the ratio of the numbers of events from data and simulation. |
png pdf |
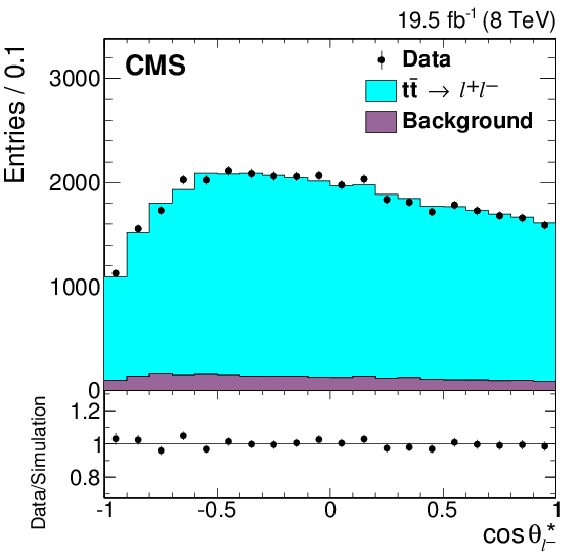
Figure 2-d:
Reconstructed angular distributions from data (points) and simulation (histogram), with the expected signal ($ { {\mathrm{ t \bar{t} } } \to \ell ^{+}\ell ^{-}} $) and background distributions shown separately. All three dilepton flavor combinations are included. The simulated signal yield is normalized to that of the background-subtracted data. The vertical bars on the data points represent the statistical uncertainties. The lower panels show the ratio of the numbers of events from data and simulation. |
png pdf |
Figure 2-e:
Reconstructed angular distributions from data (points) and simulation (histogram), with the expected signal ($ { {\mathrm{ t \bar{t} } } \to \ell ^{+}\ell ^{-}} $) and background distributions shown separately. All three dilepton flavor combinations are included. The simulated signal yield is normalized to that of the background-subtracted data. The vertical bars on the data points represent the statistical uncertainties. The lower panels show the ratio of the numbers of events from data and simulation. |
png pdf |
Figure 3-a:
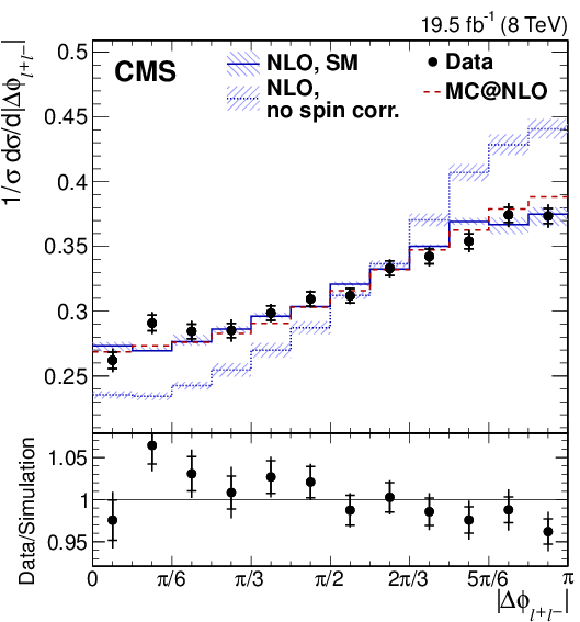
Normalized differential cross section as a function of $ {| \Delta \phi _{\ell ^+\ell ^-} | }$, $\cos\varphi $, $\cos\theta ^{\star }_{\ell ^+} \cos\theta ^{\star }_{\ell ^-}$, and $\cos\theta ^{\star }_\ell $ from data (points); parton-level predictions from mc@nlo (dashed histograms); and theoretical predictions at NLO [63,4] with (SM) and without (no spin corr.) spin correlations (solid and dotted histograms, respectively). For the $\cos\theta ^{\star }_\ell $ distribution, CP conservation is assumed in the combination of the $\cos\theta ^{\star }_{\ell ^\pm }$ measurements from positively and negatively charged leptons. The ratio of the data to the mc@nlo prediction is shown in the lower panels. The inner and outer vertical bars on the data points represent the statistical and total uncertainties, respectively. The hatched bands represent variations of $\mu _\mathrm {R}$ and $\mu _\mathrm {F}$ simultaneously up and down by a factor of 2. |
png pdf |
Figure 3-b:
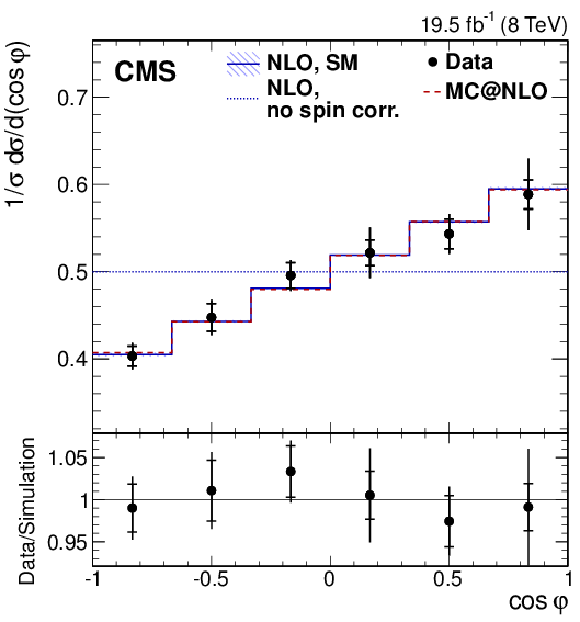
Normalized differential cross section as a function of $ {| \Delta \phi _{\ell ^+\ell ^-} | }$, $\cos\varphi $, $\cos\theta ^{\star }_{\ell ^+} \cos\theta ^{\star }_{\ell ^-}$, and $\cos\theta ^{\star }_\ell $ from data (points); parton-level predictions from mc@nlo (dashed histograms); and theoretical predictions at NLO [63,4] with (SM) and without (no spin corr.) spin correlations (solid and dotted histograms, respectively). For the $\cos\theta ^{\star }_\ell $ distribution, CP conservation is assumed in the combination of the $\cos\theta ^{\star }_{\ell ^\pm }$ measurements from positively and negatively charged leptons. The ratio of the data to the mc@nlo prediction is shown in the lower panels. The inner and outer vertical bars on the data points represent the statistical and total uncertainties, respectively. The hatched bands represent variations of $\mu _\mathrm {R}$ and $\mu _\mathrm {F}$ simultaneously up and down by a factor of 2. |
png pdf |
Figure 3-c:
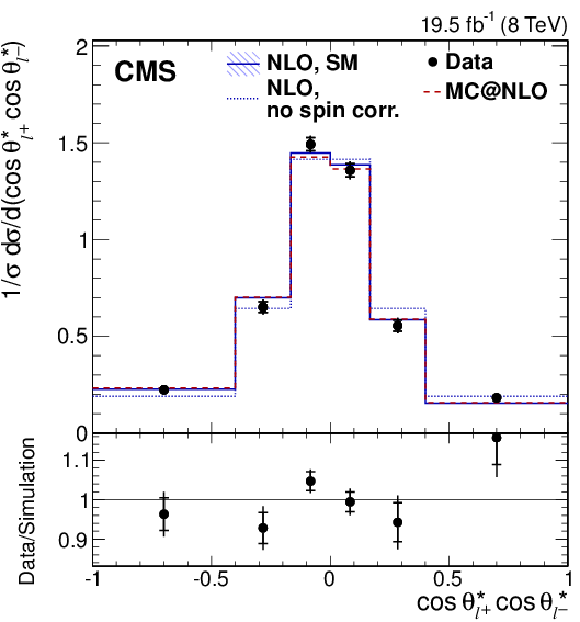
Normalized differential cross section as a function of $ {| \Delta \phi _{\ell ^+\ell ^-} | }$, $\cos\varphi $, $\cos\theta ^{\star }_{\ell ^+} \cos\theta ^{\star }_{\ell ^-}$, and $\cos\theta ^{\star }_\ell $ from data (points); parton-level predictions from mc@nlo (dashed histograms); and theoretical predictions at NLO [63,4] with (SM) and without (no spin corr.) spin correlations (solid and dotted histograms, respectively). For the $\cos\theta ^{\star }_\ell $ distribution, CP conservation is assumed in the combination of the $\cos\theta ^{\star }_{\ell ^\pm }$ measurements from positively and negatively charged leptons. The ratio of the data to the mc@nlo prediction is shown in the lower panels. The inner and outer vertical bars on the data points represent the statistical and total uncertainties, respectively. The hatched bands represent variations of $\mu _\mathrm {R}$ and $\mu _\mathrm {F}$ simultaneously up and down by a factor of 2. |
png pdf |
Figure 3-d:
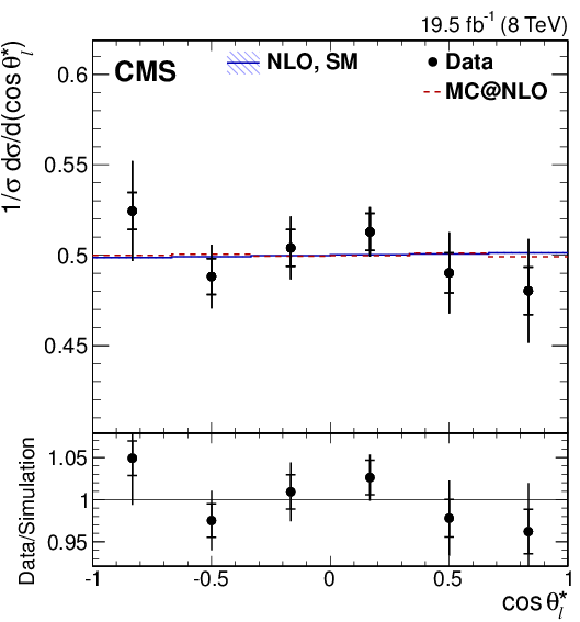
Normalized differential cross section as a function of $ {| \Delta \phi _{\ell ^+\ell ^-} | }$, $\cos\varphi $, $\cos\theta ^{\star }_{\ell ^+} \cos\theta ^{\star }_{\ell ^-}$, and $\cos\theta ^{\star }_\ell $ from data (points); parton-level predictions from mc@nlo (dashed histograms); and theoretical predictions at NLO [63,4] with (SM) and without (no spin corr.) spin correlations (solid and dotted histograms, respectively). For the $\cos\theta ^{\star }_\ell $ distribution, CP conservation is assumed in the combination of the $\cos\theta ^{\star }_{\ell ^\pm }$ measurements from positively and negatively charged leptons. The ratio of the data to the mc@nlo prediction is shown in the lower panels. The inner and outer vertical bars on the data points represent the statistical and total uncertainties, respectively. The hatched bands represent variations of $\mu _\mathrm {R}$ and $\mu _\mathrm {F}$ simultaneously up and down by a factor of 2. |
png pdf |
Figure 4-a:
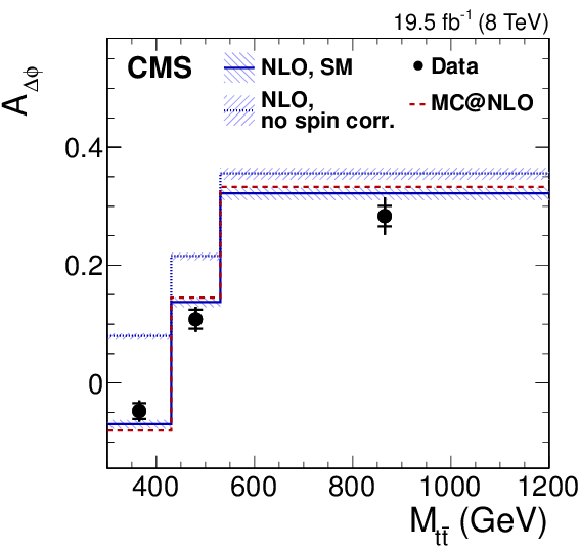
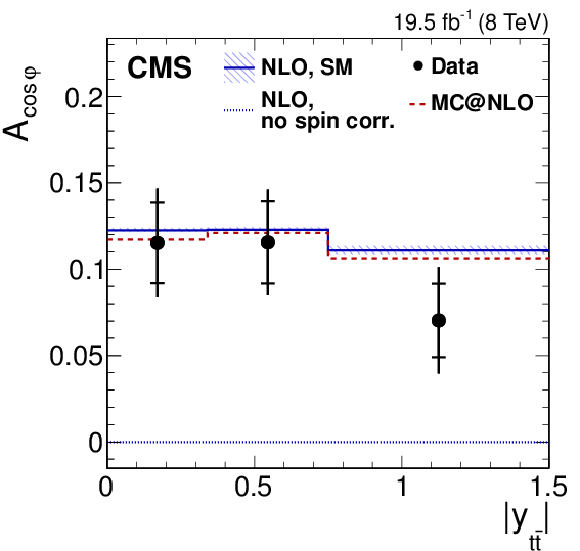
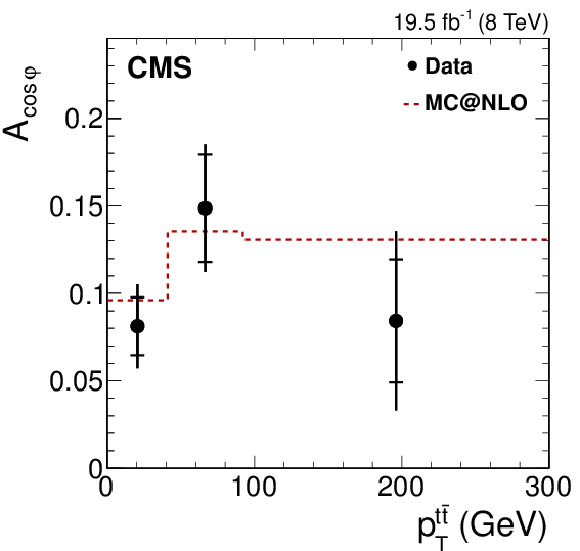
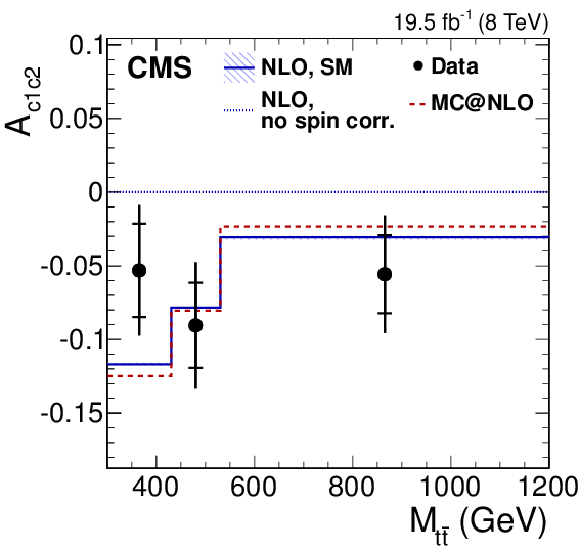
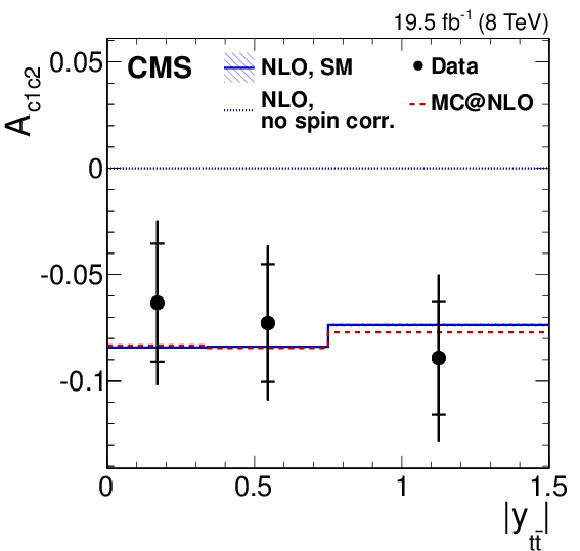
Dependence of the four asymmetry variables from data (points) on $M_{ {\mathrm{ t \bar{t} } } }$ (a), $ {| y_{ {\mathrm{ t \bar{t} } } } | }$ (middle), and $ {{p_{\mathrm {T}}}^{ {\mathrm{ t \bar{t} } } }} $ (b), obtained from the unfolded double-differential distributions; parton-level predictions from mc@nlo (dashed histograms); and theoretical predictions at NLO [63,4] with (SM) and without (no spin corr.) spin correlations (solid and dotted histograms, respectively). The inner and outer vertical bars on the data points represent the statistical and total uncertainties, respectively. The hatched bands represent variations of $\mu _\mathrm {R}$ and $\mu _\mathrm {F}$ simultaneously up and down by a factor of 2. The last bin of each plot includes overflow events. |
png pdf |
Figure 4-b:
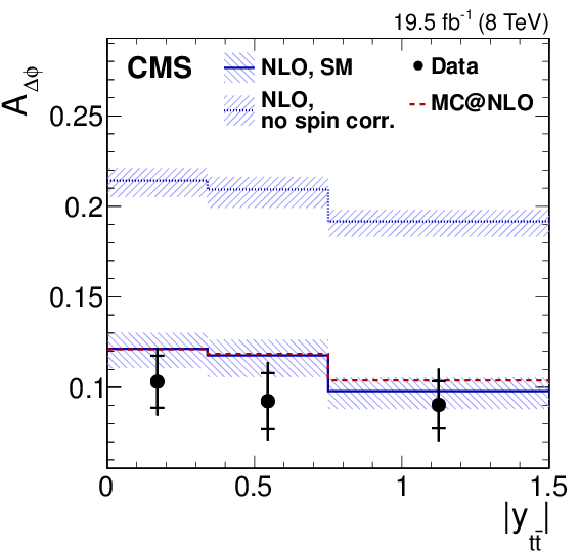
Dependence of the four asymmetry variables from data (points) on $M_{ {\mathrm{ t \bar{t} } } }$ (a), $ {| y_{ {\mathrm{ t \bar{t} } } } | }$ (middle), and $ {{p_{\mathrm {T}}}^{ {\mathrm{ t \bar{t} } } }} $ (b), obtained from the unfolded double-differential distributions; parton-level predictions from mc@nlo (dashed histograms); and theoretical predictions at NLO [63,4] with (SM) and without (no spin corr.) spin correlations (solid and dotted histograms, respectively). The inner and outer vertical bars on the data points represent the statistical and total uncertainties, respectively. The hatched bands represent variations of $\mu _\mathrm {R}$ and $\mu _\mathrm {F}$ simultaneously up and down by a factor of 2. The last bin of each plot includes overflow events. |
png pdf |
Figure 4-c:
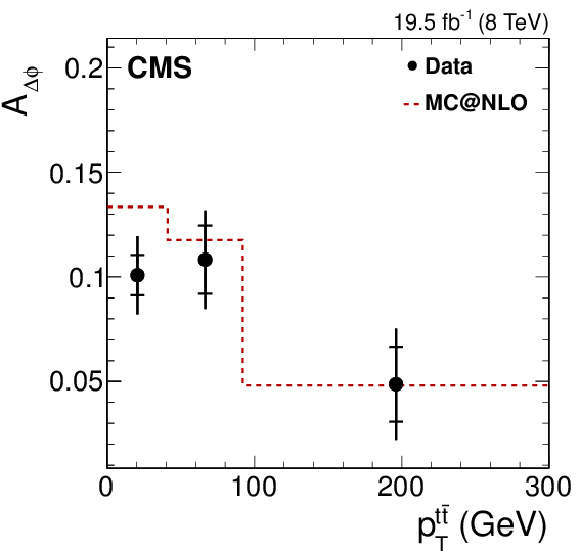
Dependence of the four asymmetry variables from data (points) on $M_{ {\mathrm{ t \bar{t} } } }$ (a), $ {| y_{ {\mathrm{ t \bar{t} } } } | }$ (middle), and $ {{p_{\mathrm {T}}}^{ {\mathrm{ t \bar{t} } } }} $ (b), obtained from the unfolded double-differential distributions; parton-level predictions from mc@nlo (dashed histograms); and theoretical predictions at NLO [63,4] with (SM) and without (no spin corr.) spin correlations (solid and dotted histograms, respectively). The inner and outer vertical bars on the data points represent the statistical and total uncertainties, respectively. The hatched bands represent variations of $\mu _\mathrm {R}$ and $\mu _\mathrm {F}$ simultaneously up and down by a factor of 2. The last bin of each plot includes overflow events. |
png pdf |
Figure 4-d:
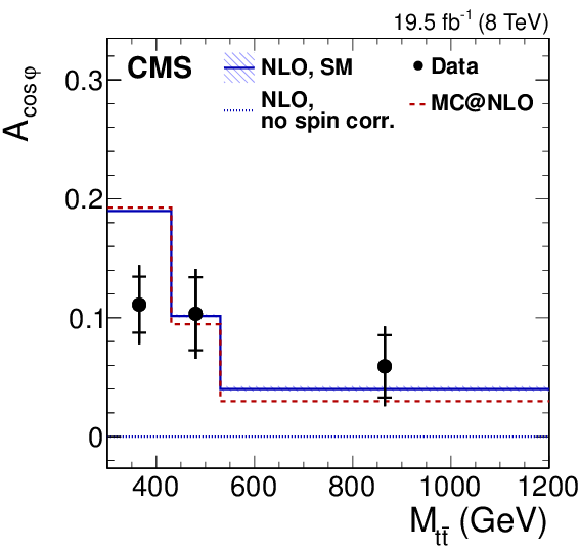
Dependence of the four asymmetry variables from data (points) on $M_{ {\mathrm{ t \bar{t} } } }$ (a), $ {| y_{ {\mathrm{ t \bar{t} } } } | }$ (middle), and $ {{p_{\mathrm {T}}}^{ {\mathrm{ t \bar{t} } } }} $ (b), obtained from the unfolded double-differential distributions; parton-level predictions from mc@nlo (dashed histograms); and theoretical predictions at NLO [63,4] with (SM) and without (no spin corr.) spin correlations (solid and dotted histograms, respectively). The inner and outer vertical bars on the data points represent the statistical and total uncertainties, respectively. The hatched bands represent variations of $\mu _\mathrm {R}$ and $\mu _\mathrm {F}$ simultaneously up and down by a factor of 2. The last bin of each plot includes overflow events. |
png pdf |
Figure 4-e:
Dependence of the four asymmetry variables from data (points) on $M_{ {\mathrm{ t \bar{t} } } }$ (a), $ {| y_{ {\mathrm{ t \bar{t} } } } | }$ (middle), and $ {{p_{\mathrm {T}}}^{ {\mathrm{ t \bar{t} } } }} $ (b), obtained from the unfolded double-differential distributions; parton-level predictions from mc@nlo (dashed histograms); and theoretical predictions at NLO [63,4] with (SM) and without (no spin corr.) spin correlations (solid and dotted histograms, respectively). The inner and outer vertical bars on the data points represent the statistical and total uncertainties, respectively. The hatched bands represent variations of $\mu _\mathrm {R}$ and $\mu _\mathrm {F}$ simultaneously up and down by a factor of 2. The last bin of each plot includes overflow events. |
png pdf |
Figure 4-f:
Dependence of the four asymmetry variables from data (points) on $M_{ {\mathrm{ t \bar{t} } } }$ (a), $ {| y_{ {\mathrm{ t \bar{t} } } } | }$ (middle), and $ {{p_{\mathrm {T}}}^{ {\mathrm{ t \bar{t} } } }} $ (b), obtained from the unfolded double-differential distributions; parton-level predictions from mc@nlo (dashed histograms); and theoretical predictions at NLO [63,4] with (SM) and without (no spin corr.) spin correlations (solid and dotted histograms, respectively). The inner and outer vertical bars on the data points represent the statistical and total uncertainties, respectively. The hatched bands represent variations of $\mu _\mathrm {R}$ and $\mu _\mathrm {F}$ simultaneously up and down by a factor of 2. The last bin of each plot includes overflow events. |
png pdf |
Figure 4-g:
Dependence of the four asymmetry variables from data (points) on $M_{ {\mathrm{ t \bar{t} } } }$ (a), $ {| y_{ {\mathrm{ t \bar{t} } } } | }$ (middle), and $ {{p_{\mathrm {T}}}^{ {\mathrm{ t \bar{t} } } }} $ (b), obtained from the unfolded double-differential distributions; parton-level predictions from mc@nlo (dashed histograms); and theoretical predictions at NLO [63,4] with (SM) and without (no spin corr.) spin correlations (solid and dotted histograms, respectively). The inner and outer vertical bars on the data points represent the statistical and total uncertainties, respectively. The hatched bands represent variations of $\mu _\mathrm {R}$ and $\mu _\mathrm {F}$ simultaneously up and down by a factor of 2. The last bin of each plot includes overflow events. |
png pdf |
Figure 4-h:
Dependence of the four asymmetry variables from data (points) on $M_{ {\mathrm{ t \bar{t} } } }$ (a), $ {| y_{ {\mathrm{ t \bar{t} } } } | }$ (middle), and $ {{p_{\mathrm {T}}}^{ {\mathrm{ t \bar{t} } } }} $ (b), obtained from the unfolded double-differential distributions; parton-level predictions from mc@nlo (dashed histograms); and theoretical predictions at NLO [63,4] with (SM) and without (no spin corr.) spin correlations (solid and dotted histograms, respectively). The inner and outer vertical bars on the data points represent the statistical and total uncertainties, respectively. The hatched bands represent variations of $\mu _\mathrm {R}$ and $\mu _\mathrm {F}$ simultaneously up and down by a factor of 2. The last bin of each plot includes overflow events. |
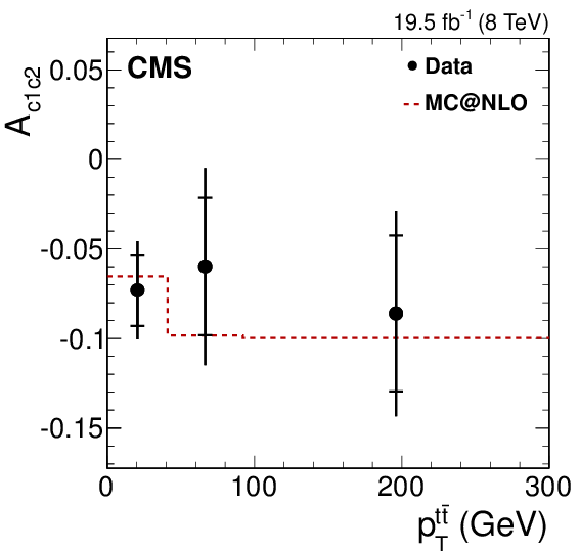
png pdf |
Figure 4-i:
Dependence of the four asymmetry variables from data (points) on $M_{ {\mathrm{ t \bar{t} } } }$ (a), $ {| y_{ {\mathrm{ t \bar{t} } } } | }$ (middle), and $ {{p_{\mathrm {T}}}^{ {\mathrm{ t \bar{t} } } }} $ (b), obtained from the unfolded double-differential distributions; parton-level predictions from mc@nlo (dashed histograms); and theoretical predictions at NLO [63,4] with (SM) and without (no spin corr.) spin correlations (solid and dotted histograms, respectively). The inner and outer vertical bars on the data points represent the statistical and total uncertainties, respectively. The hatched bands represent variations of $\mu _\mathrm {R}$ and $\mu _\mathrm {F}$ simultaneously up and down by a factor of 2. The last bin of each plot includes overflow events. |
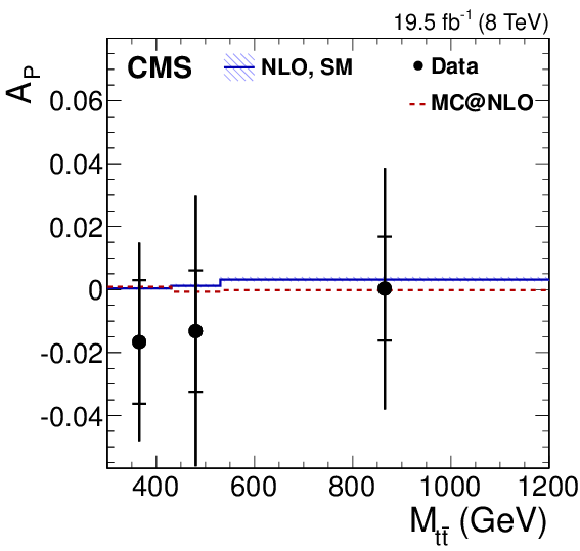
png pdf |
Figure 4-j:
Dependence of the four asymmetry variables from data (points) on $M_{ {\mathrm{ t \bar{t} } } }$ (a), $ {| y_{ {\mathrm{ t \bar{t} } } } | }$ (middle), and $ {{p_{\mathrm {T}}}^{ {\mathrm{ t \bar{t} } } }} $ (b), obtained from the unfolded double-differential distributions; parton-level predictions from mc@nlo (dashed histograms); and theoretical predictions at NLO [63,4] with (SM) and without (no spin corr.) spin correlations (solid and dotted histograms, respectively). The inner and outer vertical bars on the data points represent the statistical and total uncertainties, respectively. The hatched bands represent variations of $\mu _\mathrm {R}$ and $\mu _\mathrm {F}$ simultaneously up and down by a factor of 2. The last bin of each plot includes overflow events. |
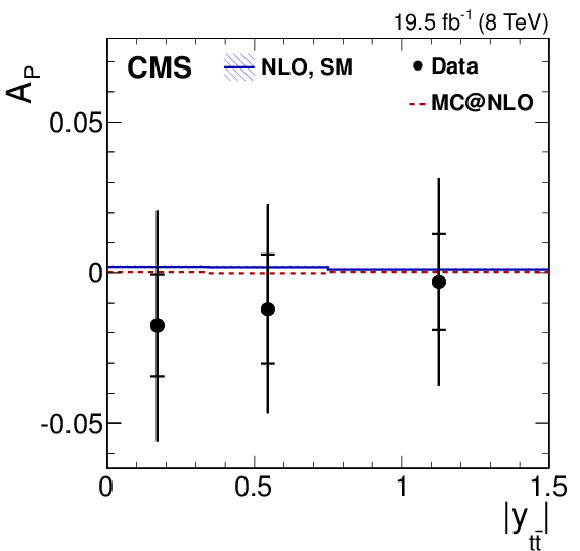
png pdf |
Figure 4-k:
Dependence of the four asymmetry variables from data (points) on $M_{ {\mathrm{ t \bar{t} } } }$ (a), $ {| y_{ {\mathrm{ t \bar{t} } } } | }$ (middle), and $ {{p_{\mathrm {T}}}^{ {\mathrm{ t \bar{t} } } }} $ (b), obtained from the unfolded double-differential distributions; parton-level predictions from mc@nlo (dashed histograms); and theoretical predictions at NLO [63,4] with (SM) and without (no spin corr.) spin correlations (solid and dotted histograms, respectively). The inner and outer vertical bars on the data points represent the statistical and total uncertainties, respectively. The hatched bands represent variations of $\mu _\mathrm {R}$ and $\mu _\mathrm {F}$ simultaneously up and down by a factor of 2. The last bin of each plot includes overflow events. |
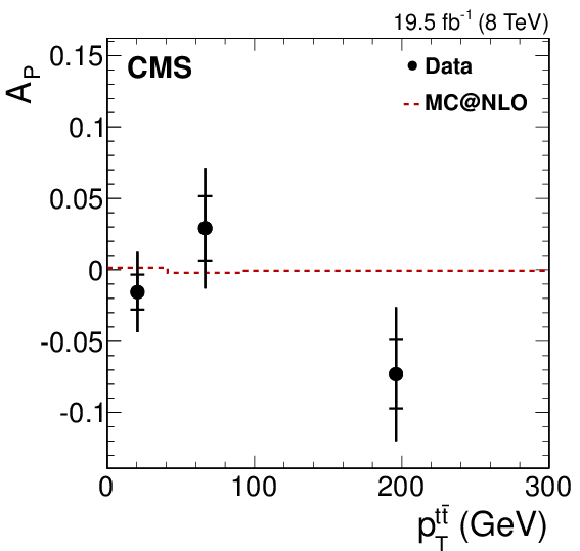
png pdf |
Figure 4-l:
Dependence of the four asymmetry variables from data (points) on $M_{ {\mathrm{ t \bar{t} } } }$ (a), $ {| y_{ {\mathrm{ t \bar{t} } } } | }$ (middle), and $ {{p_{\mathrm {T}}}^{ {\mathrm{ t \bar{t} } } }} $ (b), obtained from the unfolded double-differential distributions; parton-level predictions from mc@nlo (dashed histograms); and theoretical predictions at NLO [63,4] with (SM) and without (no spin corr.) spin correlations (solid and dotted histograms, respectively). The inner and outer vertical bars on the data points represent the statistical and total uncertainties, respectively. The hatched bands represent variations of $\mu _\mathrm {R}$ and $\mu _\mathrm {F}$ simultaneously up and down by a factor of 2. The last bin of each plot includes overflow events. |
png pdf |
Figure 5-a:
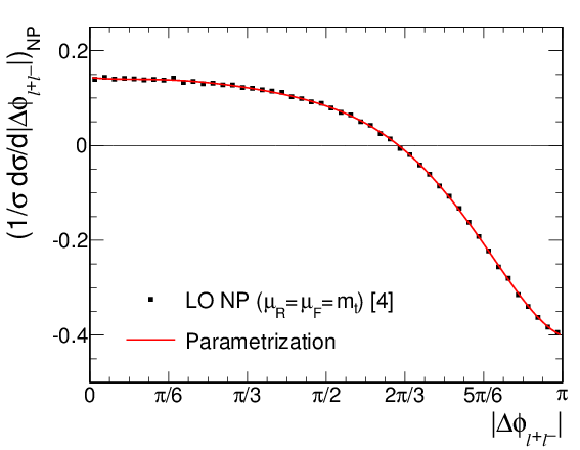
a : theoretical prediction from Ref. [4] (points) and polynomial parametrization (line) for the contribution from new physics with a nonzero CMDM to the normalized differential cross section $(1/\sigma )( {\mathrm {d}}\sigma / {\mathrm {d}} {| \Delta \phi _{\ell ^+\ell ^-} | })$, for $\mathrm{Re} (\hat{\mu }_{\mathrm{ t } }) \ll 1$. b : normalized differential cross section from data (points). The solid line corresponds to the result of the fit to the form given in Eq.(3), and the dashed lines show the parametrized SM NLO predictions for $\mu _\mathrm {R}$ and $\mu _\mathrm {F}$ equal to $m_{\mathrm{ t } }$, $2m_{\mathrm{ t } }$, and $m_{\mathrm{ t } }/2$. The vertical bars on the data points represent the total uncertainties. |
png pdf |
Figure 5-b:
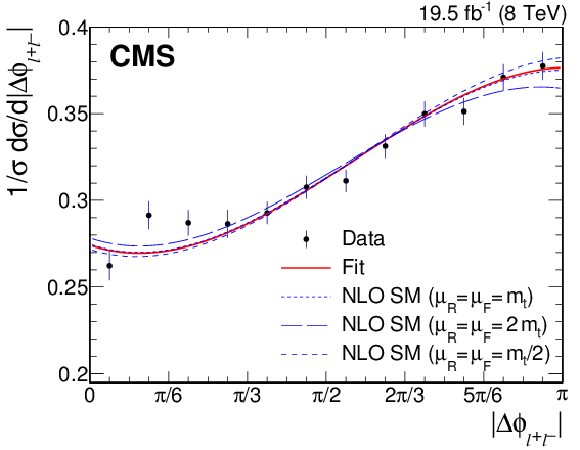
a : theoretical prediction from Ref. [4] (points) and polynomial parametrization (line) for the contribution from new physics with a nonzero CMDM to the normalized differential cross section $(1/\sigma )( {\mathrm {d}}\sigma / {\mathrm {d}} {| \Delta \phi _{\ell ^+\ell ^-} | })$, for $\mathrm{Re} (\hat{\mu }_{\mathrm{ t } }) \ll 1$. b : normalized differential cross section from data (points). The solid line corresponds to the result of the fit to the form given in Eq.(3), and the dashed lines show the parametrized SM NLO predictions for $\mu _\mathrm {R}$ and $\mu _\mathrm {F}$ equal to $m_{\mathrm{ t } }$, $2m_{\mathrm{ t } }$, and $m_{\mathrm{ t } }/2$. The vertical bars on the data points represent the total uncertainties. |
| Tables | |
png pdf |
Table 1:
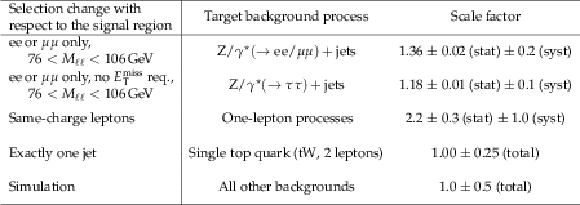
Descriptions of the various control regions, their intended background process, and the scale factors derived from them, including either the statistical and systematic uncertainties or the total uncertainty. The last row gives the scale factor used for all the remaining backgrounds, whose contributions are estimated from simulation alone. |
png pdf |
Table 2:
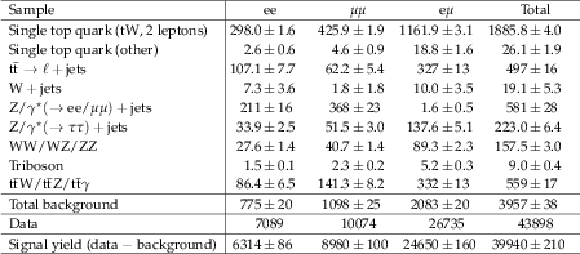
Predicted background and observed event yields, with their statistical uncertainties, after applying the event selection criteria and normalization described in the text. |

png pdf |
Table 3:
Values of the uncorrected inclusive asymmetry variables from simulation and data, prior to background subtraction. The uncertainties shown are statistical. |
png pdf |
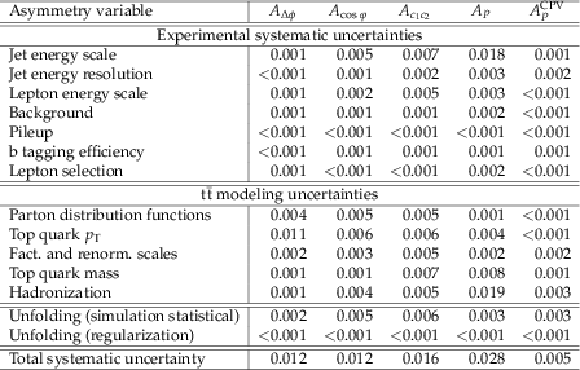
Table 4:
Sources and values of the systematic uncertainties in the inclusive asymmetry variables. |

png pdf |
Table 5:
Inclusive asymmetry measurements obtained from the angular distributions unfolded to the parton level, and the parton-level predictions from the mc@nlo simulation and from NLO calculations with (SM) and without (no spin corr.) spin correlations [63,4]. For the data, the first uncertainty is statistical and the second is systematic. For the mc@nlo results and NLO calculations, the uncertainties are statistical and theoretical, respectively. |

png pdf |
Table 6:
Values of $f_{\mathrm {SM}}$, the strength of the measured spin correlations relative to the SM prediction, derived from the numbers in Table {tab:ResultsUnfolded}. The last row shows an additional measurement of $f_{\mathrm {SM}}$ made from the projection in $ {| \Delta \phi _{\ell ^+\ell ^-} | }$ of the normalized double-differential cross section as a function of $ {| \Delta \phi _{\ell ^+\ell ^-} | }$ and $M_{ {\mathrm{ t \bar{t} } } }$. The uncertainties shown are statistical, systematic, and theoretical, respectively. The total uncertainty in each result, found by adding the individual uncertainties in quadrature, is shown in the last column. |
| Summary |
|
Measurements of the $\mathrm{ t \bar{t} }$ spin correlations and the top quark polarization have been presented in the $\mathrm{ t \bar{t} }$ dilepton final states (${\mathrm{ e }^-\mathrm{ e }^+} $, ${\mathrm{ e }^\pm \mu^\mp} $, and ${\mu^+ \mu^-} $), using angular distributions unfolded to the parton level and as a function of the $\mathrm{ t \bar{t} } $-system variables $M_{\mathrm{ t \bar{t} }}$, $\abs{y_{\mathrm{ t \bar{t} }}}$, and ${{p_{\mathrm{T}}}^{\mathrm{ t \bar{t} }}} $. The data sample corresponds to an integrated luminosity of 19.5 fb$^{-1}$ from pp collisions at $\sqrt{s}= $ 8 TeV, collected by the CMS experiment at the LHC. For the spin correlation coefficients, we measure $C_{\mathrm{hel}} =$ 0.278 $\pm$ 0.084 and $D =$ 0.205 $\pm$ 0.031. The measurements sensitive to spin correlations are translated into determinations of $f_{\mathrm{SM}}$, the strength of the spin correlations relative to the SM prediction. The most precise result comes from the measurement of $A_{\Delta\phi} =$ 0.095 $\pm$ 0.006 (stat) $\pm$ 0.007 (syst), yielding $f_{\mathrm{SM}} =$ 1.12$^{+\:0.12}_{-\:0.15}$. The SM (CP-conserving) top quark polarization is measured to be $P = -0.022 \pm 0.058 $, while the CP-violating component is found to be $P^{\mathrm{CPV}} = 0.000 \pm 0.016 $. All measurements are in agreement with the SM expectations, and help constrain theories of physics beyond the SM. The measured top quark spin observables are compared to theoretical predictions in order to search for hypothetical top quark anomalous couplings. No evidence of new physics is observed, and exclusion limits on the real part of the chromo-magnetic dipole moment $\mathrm{Re} ({\mu}_{\mathrm{t}})$ and the imaginary part of the chromo-electric dipole moment $\mathrm{Im} ({d}_{\mathrm{t}})$ are evaluated. Values outside the intervals $-0.053<\mathrm{Re} ({\mu}_{\mathrm{t}})< $ 0.026 and $-0.068< \mathrm{Im} ({d}_{\mathrm{t}}) < $ 0.067 are excluded at the 95% confidence level, the first such measurements to date. |
| References | ||||
| 1 | CMS Collaboration | Measurement of the top quark mass using proton-proton data at $ \sqrt{s} $ = 7 and 8$ TeV $ | Submitted to PRD | CMS-TOP-14-022 1509.04044 |
| 2 | D0 Collaboration | Improved determination of the width of the top quark | PRD 85 (2012) 091104 | 1201.4156 |
| 3 | G. Mahlon and S. J. Parke | Spin correlation effects in top quark pair production at the LHC | PRD 81 (2010) 074024 | 1001.3422 |
| 4 | W. Bernreuther and Z.-G. Si | Top quark spin correlations and polarization at the LHC: standard model predictions and effects of anomalous top chromo moments | PLB 725 (2013) 115, , [Erratum: \DOI10.1016/j.physletb.2015.03.035] | 1305.2066 |
| 5 | D. Krohn, T. Liu, J. Shelton, and L.-T. Wang | A polarized view of the top asymmetry | PRD 84 (2011) 074034 | 1105.3743 |
| 6 | S. Fajfer, J. F. Kamenik, and B. Melic | Discerning new physics in $ \mathrm{ t \bar{t} } $ production using top spin observables at hadron colliders | JHEP 08 (2012) 114 | 1205.0264 |
| 7 | J. A. Aguilar-Saavedra and M. Perez-Victoria | $ \mathrm{ t \bar{t} } $ charge asymmetry, family and friends | J. Phys.: Conf. Ser. 447 (2013) 012015 | 1302.6618 |
| 8 | A. Brandenburg, Z.-G. Si, and P. Uwer | QCD-corrected spin analysing power of jets in decays of polarized top quarks | PLB 539 (2002) 235 | hep-ph/0205023 |
| 9 | CDF Collaboration | Measurement of $ \mathrm{ t \bar{t} } $ spin correlation in $ \ppbar $ collisions using the CDF II detector at the Tevatron | PRD 83 (2011) 031104 | 1012.3093 |
| 10 | D0 Collaboration | Evidence for spin correlation in $ \mathrm{ t \bar{t} } $ production | PRL 108 (2012) 032004 | 1110.4194 |
| 11 | D0 Collaboration | Measurement of spin correlation in $ \mathrm{ t \bar{t} } $ production using a matrix element approach | PRL 107 (2011) 032001 | 1104.5194 |
| 12 | D0 Collaboration | Measurement of leptonic asymmetries and top-quark polarization in $ \mathrm{ t \bar{t} } $ production | PRD 87 (2013) 011103 | 1207.0364 |
| 13 | ATLAS Collaboration | Measurement of top quark polarization in top-antitop events from proton-proton collisions at $ \sqrt{s} = $ 7 TeV using the ATLAS detector | PRL 111 (2013) 232002 | 1307.6511 |
| 14 | ATLAS Collaboration | Measurement of spin correlation in top-antitop quark events and search for top squark pair production in pp collisions at $ \sqrt{s} = $ 8 TeV using the ATLAS detector | PRL 114 (2015) 142001 | 1412.4742 |
| 15 | CMS Collaboration | Measurements of $ \mathrm{ t \bar{t} } $ spin correlations and top-quark polarization using dilepton final states in $ \pp $ collisions at $ \sqrt{s} = $ 7 TeV | PRL 112 (2014) 182001 | CMS-TOP-13-003 1311.3924 |
| 16 | CMS Collaboration | The CMS experiment at the CERN LHC | JINST 3 (2008) S08004 | CMS-00-001 |
| 17 | CMS Collaboration | Particle-flow event reconstruction in CMS and performance for jets, taus, and $ E_{\mathrm{T}}^{\text{miss}} $ | CDS | |
| 18 | CMS Collaboration | Commissioning of the particle-flow event with the first LHC collisions recorded in the CMS detector | CDS | |
| 19 | CMS Collaboration | Performance of electron reconstruction and selection with the CMS detector in proton-proton collisions at $ \sqrt{s} = $ 8 TeV | JINST 10 (2015) P06005 | CMS-EGM-13-001 1502.02701 |
| 20 | CMS Collaboration | Performance of CMS muon reconstruction in $ \pp $ collision events at $ \sqrt{s} = $ 7 TeV | JINST 7 (2012) P10002 | CMS-MUO-10-004 1206.4071 |
| 21 | CMS Collaboration | Description and performance of track and primary-vertex reconstruction with the CMS tracker | JINST 9 (2014) P10009 | CMS-TRK-11-001 1405.6569 |
| 22 | CMS Collaboration | Search for top-squark pair production in the single-lepton final state in pp collisions at $ \sqrt{s} = $ 8 TeV | EPJC 73 (2013) 2677 | CMS-SUS-13-011 1308.1586 |
| 23 | M. Cacciari, G. P. Salam, and G. Soyez | The anti-$ k_t $ jet clustering algorithm | JHEP 04 (2008) 063 | 0802.1189 |
| 24 | M. Cacciari, G. P. Salam, and G. Soyez | FastJet user manual | EPJC 72 (2012) 1896 | 1111.6097 |
| 25 | M. Cacciari and G. P. Salam | Pileup subtraction using jet areas | PLB 659 (2008) 119 | 0707.1378 |
| 26 | CMS Collaboration | Identification of $ \mathrm{ b }-quark $ jets with the CMS experiment | JINST 8 (2013) P04013 | CMS-BTV-12-001 1211.4462 |
| 27 | S. Frixione and B. R. Webber | Matching NLO QCD computations and parton shower simulations | JHEP 06 (2002) 029 | hep-ph/0204244 |
| 28 | S. Frixione, P. Nason, and B. R. Webber | Matching NLO QCD and parton showers in heavy flavor production | JHEP 08 (2003) 007 | hep-ph/0305252 |
| 29 | J. Pumplin et al. | New generation of parton distributions with uncertainties from global QCD analysis | JHEP 07 (2002) 012 | hep-ph/0201195 |
| 30 | G. Corcella et al. | $ \HERWIG $ 6: an event generator for hadron emission reactions with interfering gluons (including supersymmetric processes) | JHEP 01 (2001) 010 | hep-ph/0011363 |
| 31 | J. Alwall et al. | $ \MADGRAPH $ 5: going beyond | JHEP 06 (2011) 128 | 1106.0522 |
| 32 | J. Alwall et al. | The automated computation of tree-level and next-to-leading order differential cross sections, and their matching to parton shower simulations | JHEP 07 (2014) 079 | 1405.0301 |
| 33 | J. M. Campbell and R. K. Ellis | MCFM for the Tevatron and the LHC | NPPS 205-206 (2010) 10 | 1007.3492 |
| 34 | J. M. Campbell, R. K. Ellis, and C. Williams | Vector boson pair production at the LHC | JHEP 07 (2011) 018 | 1105.0020 |
| 35 | R. Frederix et al. | Four-lepton production at hadron colliders: aMC@NLO predictions with theoretical uncertainties | JHEP 02 (2012) 099 | 1110.4738 |
| 36 | J. M. Campbell and R. K. Ellis | $ \mathrm{ t \bar{t} }\mathrm{ W }^{\pm} $ production and decay at NLO | JHEP 07 (2012) 052 | 1204.5678 |
| 37 | M. V. Garzelli, A. Kardos, C. G. Papadopoulos, and Z. Trocsanyi | $ \mathrm{ t \bar{t} }\mathrm{ W }^{\pm} $ and $ \mathrm{ t \bar{t} }{\rm Z} $ hadroproduction at NLO accuracy in QCD with Parton Shower and Hadronization Effects | JHEP 11 (2012) 056 | 1208.2665 |
| 38 | R. Gavin, Y. Li, F. Petriello, and S. Quackenbush | $ \mathrm{ W } $ Physics at the LHC with FEWZ 2.1 | CPC 184 (2013) 208 | 1201.5896 |
| 39 | P. Nason | A new method for combining NLO QCD with shower Monte Carlo algorithms | JHEP 11 (2004) 040 | hep-ph/0409146 |
| 40 | S. Frixione, P. Nason, and C. Oleari | Matching NLO QCD computations with parton shower simulations: the $ \POWHEG $ method | JHEP 11 (2007) 070 | 0709.2092 |
| 41 | S. Alioli, P. Nason, C. Oleari, and E. Re | NLO single-top production matched with shower in $ \POWHEG: $ $ s $- and $ t $-channel contributions | JHEP 09 (2009) 111, , [Erratum: \DOI10.1007/JHEP02(2010)011] | 0907.4076 |
| 42 | S. Alioli, P. Nason, C. Oleari, and E. Re | A general framework for implementing NLO calculations in shower Monte Carlo programs: the $ \POWHEG $ BOX | JHEP 06 (2010) 043 | 1002.2581 |
| 43 | E. Re | Single-top $ \mathrm{ t }\mathrm{ W } $-channel production matched with parton showers using the $ \POWHEG $ method | EPJC 71 (2011) 1547 | 1009.2450 |
| 44 | N. Kidonakis | Next-to-next-to-leading-order collinear and soft gluon corrections for $ t $-channel single top quark production | PRD 83 (2011) 091503 | 1103.2792 |
| 45 | N. Kidonakis | NNLL resummation for $ s $-channel single top quark production | PRD 81 (2010) 054028 | 1001.5034 |
| 46 | N. Kidonakis | Two-loop soft anomalous dimensions for single top quark associated production with a $ \mathrm{ W }m $ or $ \mathrm{ H }^- $ | PRD 82 (2010) 054018 | 1005.4451 |
| 47 | T. Sj\"ostrand, S. Mrenna, and P. Skands | $ \PYTHIA $ 6.4 physics and manual | JHEP 05 (2006) 026 | 0706.2334 |
| 48 | \GEANTfour Collaboration | $ \GEANTfour--a $ simulation toolkit | NIMA 506 (2003) 250 | |
| 49 | CMS Collaboration | Observation of the associated production of a single top quark and a $ \mathrm{ W }~boson $ in $ \pp $ collisions at $ \sqrt{s} = $ 8 TeV | PRL 112 (2014) 231802 | CMS-TOP-12-040 1401.2942 |
| 50 | CMS Collaboration | Measurement of the sum of $ \mathrm{ W }\mathrm{ W } $ and $ \mathrm{ W }\mathrm{ Z } $ production with $ \mathrm{ W } $+dijet events in $ \pp $ collisions at $ \sqrt{s} = $ 7 TeV | EPJC 73 (2013) 2283 | CMS-SMP-12-015 1210.7544 |
| 51 | CMS Collaboration | Measurement of $ \mathrm{ W }\mathrm{ Z } $ and $ \mathrm{ Z }\mathrm{ Z } $ production in $ \pp $ collisions at $ \sqrt{s} = $ 8 TeV in final states with $ \mathrm{ b } $-tagged jets | EPJC 74 (2014) 2973 | CMS-SMP-13-011 1403.3047 |
| 52 | CMS Collaboration | Observation of top quark pairs produced in association with a vector boson in $ \pp $ collisions at $ \sqrt{s} = $ 8 TeV | JHEP 01 (2016) 096 | CMS-TOP-14-021 1510.01131 |
| 53 | CMS Collaboration | Measurement of the $ \mathrm{ t \bar{t} } $ production cross section and the top quark mass in the dilepton channel in $ \pp $ collisions at $ \sqrt{s} = $ 7 TeV | JHEP 07 (2011) 049 | CMS-TOP-11-002 1105.5661 |
| 54 | R. H. Dalitz and G. R. Goldstein | Analysis of top-antitop production and dilepton decay events and the top quark mass | PLB 287 (1992) 225 | |
| 55 | B. A. Betchart, R. Demina, and A. Harel | Analytic solutions for neutrino momenta in decay of top quarks | NIMA 736 (2014) 169 | 1305.1878 |
| 56 | S. Schmitt | TUnfold, an algorithm for correcting migration effects in high energy physics | JINST 7 (2012) T10003 | 1205.6201 |
| 57 | CMS Collaboration | Determination of jet energy calibration and transverse momentum resolution in CMS | JINST 6 (2011) P11002 | CMS-JME-10-011 1107.4277 |
| 58 | CMS Collaboration | Energy calibration and resolution of the CMS electromagnetic calorimeter in $ \pp $ collisions at $ \sqrt{s} = $ 7 TeV | JINST 8 (2013) P09009 | CMS-EGM-11-001 1306.2016 |
| 59 | S. Alekhin et al. | The PDF4LHC Working Group interim report | 1101.0536 | |
| 60 | M. Botje et al. | The PDF4LHC Working Group interim recommendations | 1101.0538 | |
| 61 | CMS Collaboration | Measurement of differential top-quark pair production cross sections in $ \pp $ collisions at $ \sqrt{s} = $ 7 TeV | EPJC 73 (2013) 2339 | CMS-TOP-11-013 1211.2220 |
| 62 | CMS Collaboration | Measurement of the differential cross section for top quark pair production in $ \pp $ collisions at $ \sqrt{s} = $ 8 TeV | EPJC 75 (2015) 542 | CMS-TOP-12-028 1505.04480 |
| 63 | W. Bernreuther and Z.-G. Si | Distributions and correlations for top quark pair production and decay at the Tevatron and LHC | Nucl. Phys. B 837 (2010) 90 | 1003.3926 |

|
Compact Muon Solenoid LHC, CERN |

|

|

|

|

|

|