

Compact Muon Solenoid
LHC, CERN
| CMS-PAS-SUS-23-006 | ||
| Search for Z' bosons decaying into charginos in final states with two oppositely charged leptons and missing transverse momentum | ||
| CMS Collaboration | ||
| 10 April 2025 | ||
| Abstract: A search for massive leptophobic Z' bosons decaying into a pair of charginos at the CERN LHC with the CMS detector is presented. The final state consists of two oppositely charged leptons and missing transverse momentum. The analysis is based on proton-proton collision data collected at a center-of-mass energy of 13 TeV, corresponding to an integrated luminosity of 138 fb$ ^{-1} $. A parametrized neural network is employed for signal extraction. The data are found to be consistent with the standard model, and upper limits are set on the Z' boson production cross section versus Z' and chargino masses. The analysis is sensitive to Z' boson masses up to about 3.5 TeV, assuming a 100% branching fraction to charginos. | ||
| Links: CDS record (PDF) ; CADI line (restricted) ; | ||
| Figures | |
png pdf |
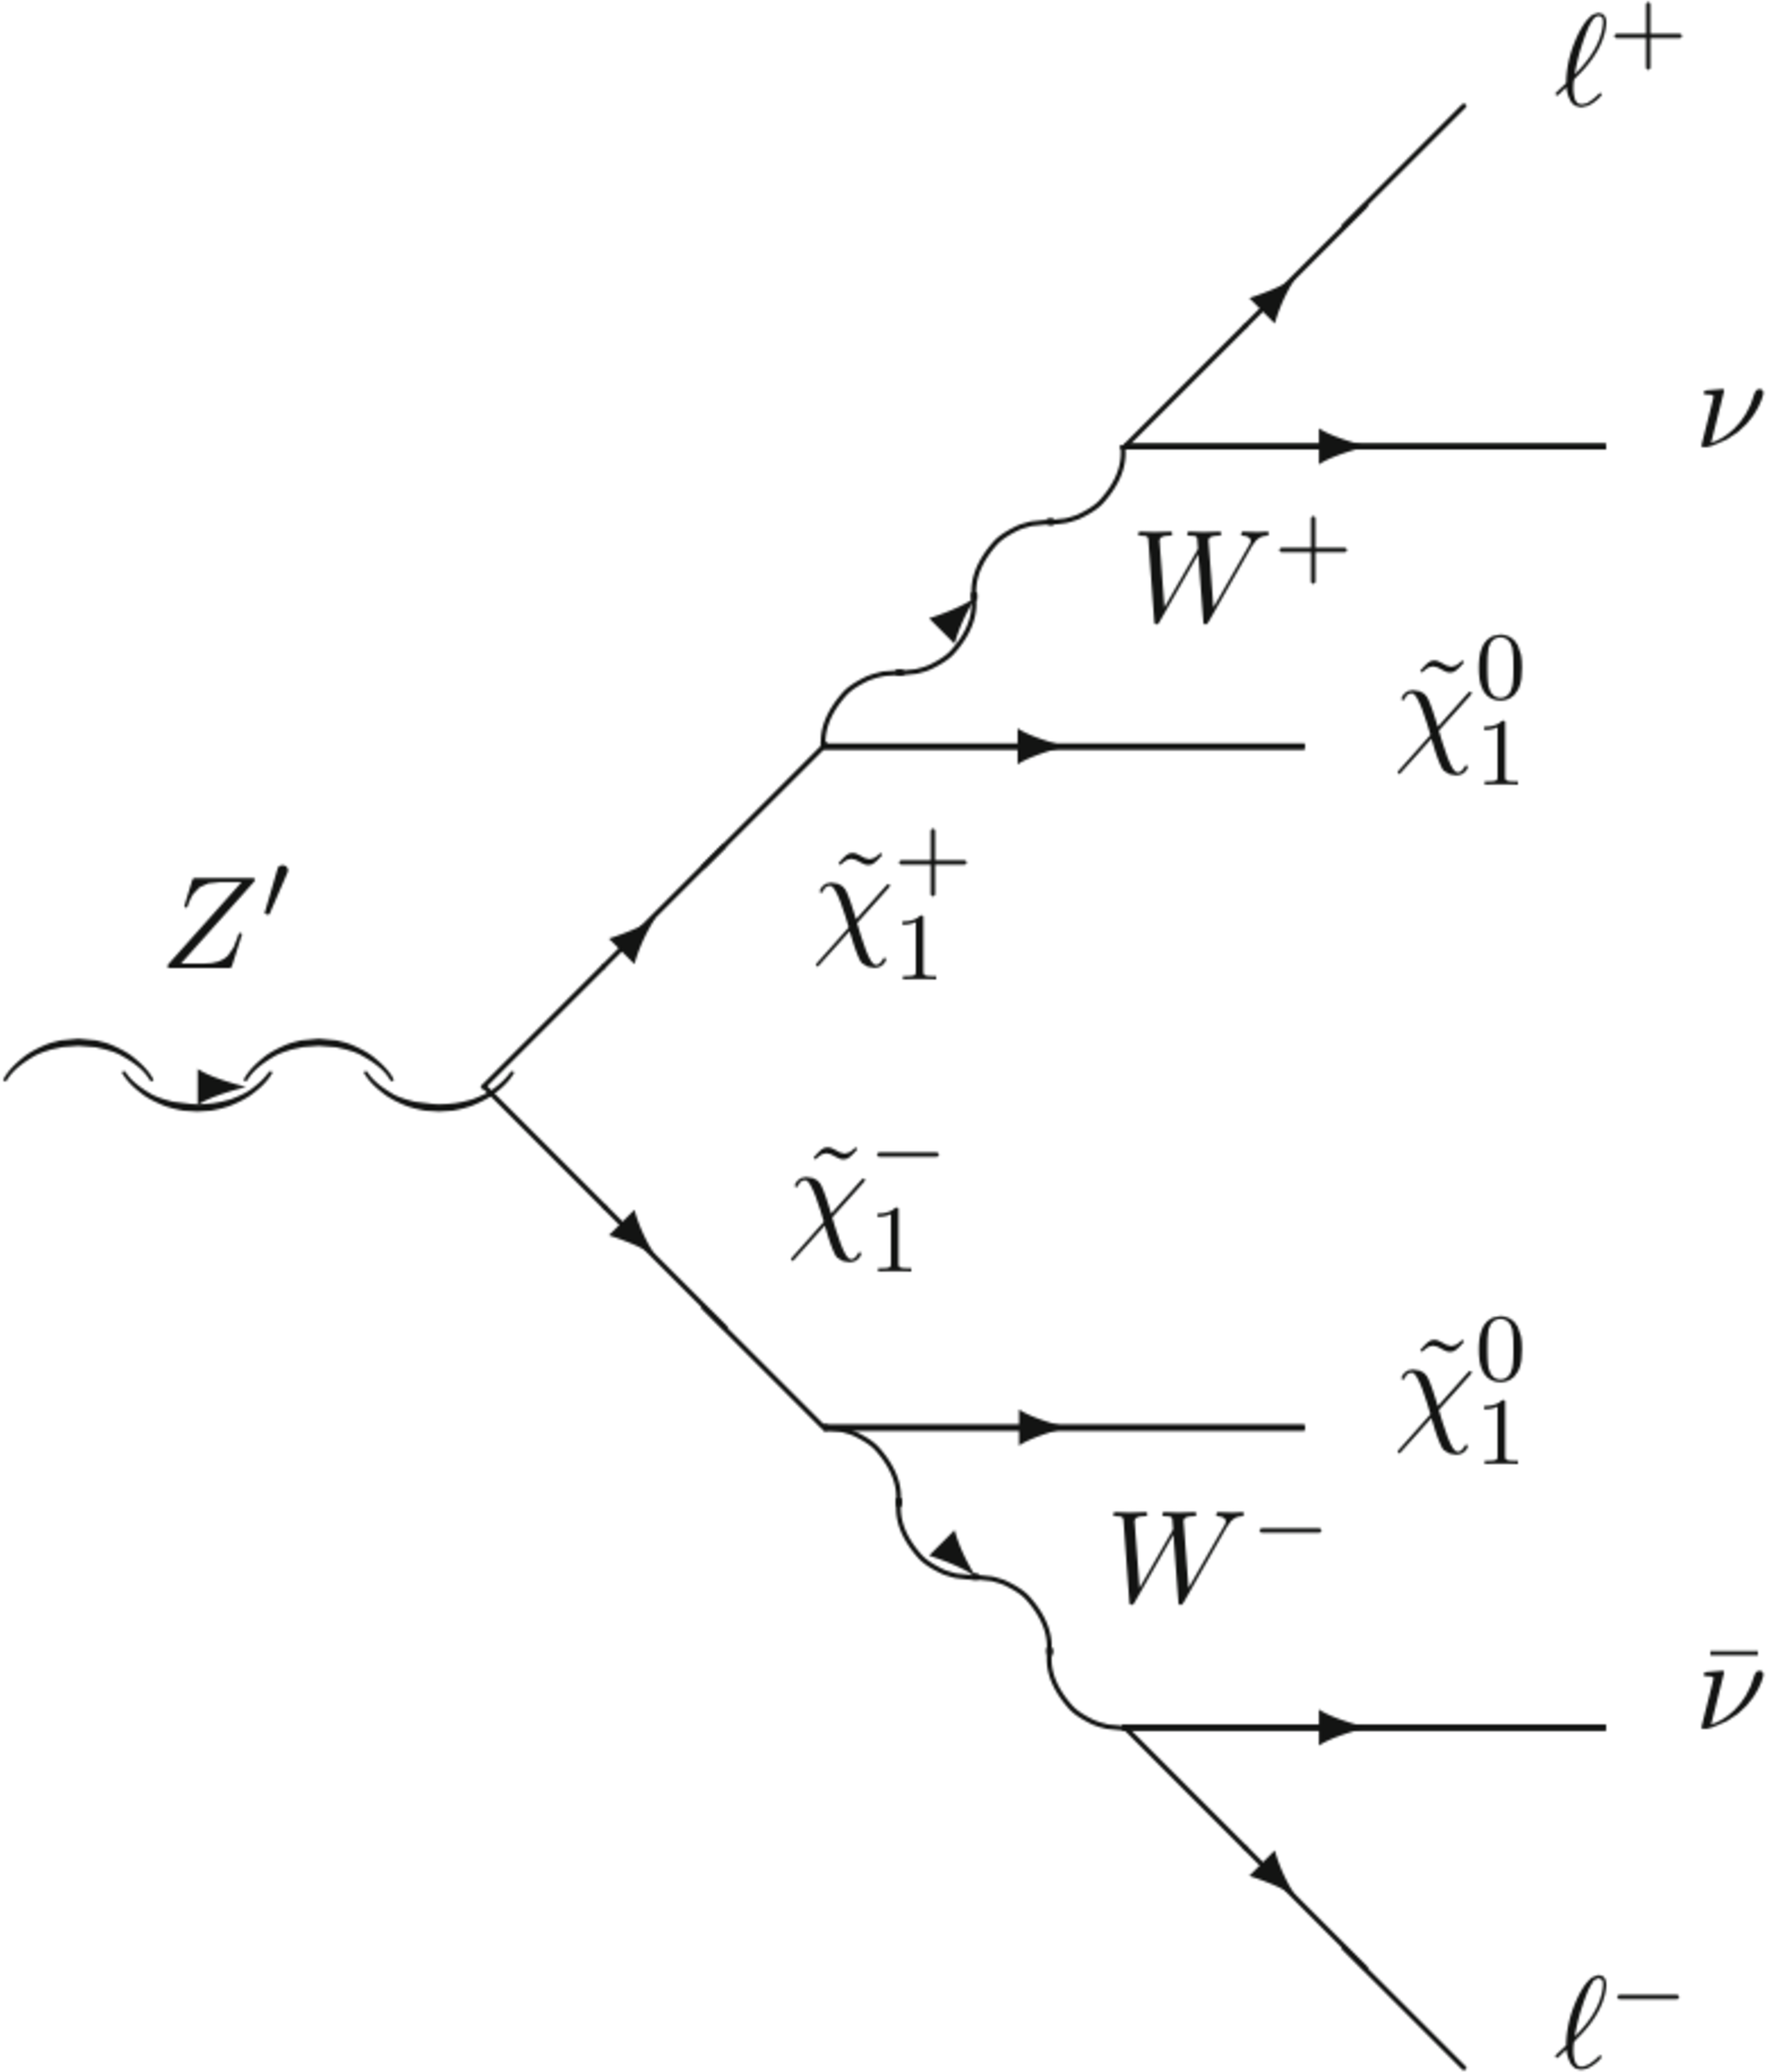
Figure 1:
A simplified diagram showing the signal process in this analysis: a leptophobic $ \mathrm{Z}^{'} $ boson decaying into two charginos, each subsequently decaying into a lepton and a neutralino. |
png pdf |
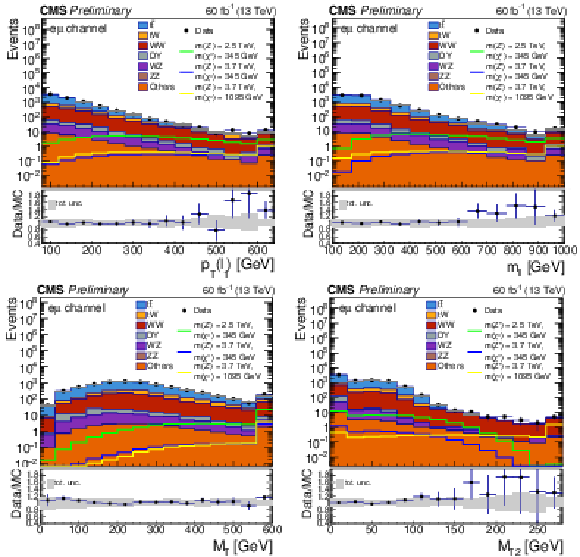
Figure 2:
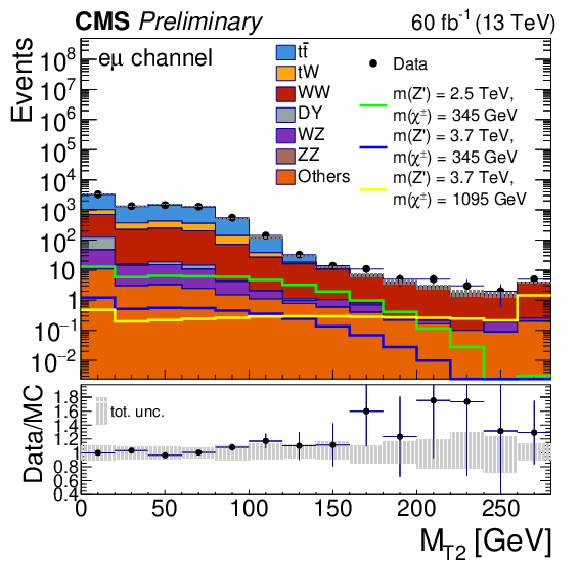
A few important kinematical variables are shown for the data set from the $ \mathrm{e}^\pm\mu^\mp $ channel using 2018 data. Leading lepton $ p_{\mathrm{T}} $ (top left), dilepton invariant mass (top right), transverse mass (bottom left) and stransverse mass (bottom right) distributions are shown. Several benchmark signal distributions are superimposed (colored lines), demonstrating good separation power between background and signal. The bottom panel of each plot displays the data-to-MC ratio (before fitting with systematics, i.e., prefit), along with the corresponding total uncertainty band (gray), which includes all systematic and statistical uncertainties except for normalization factor uncertainty of certain background processes. |
png pdf |
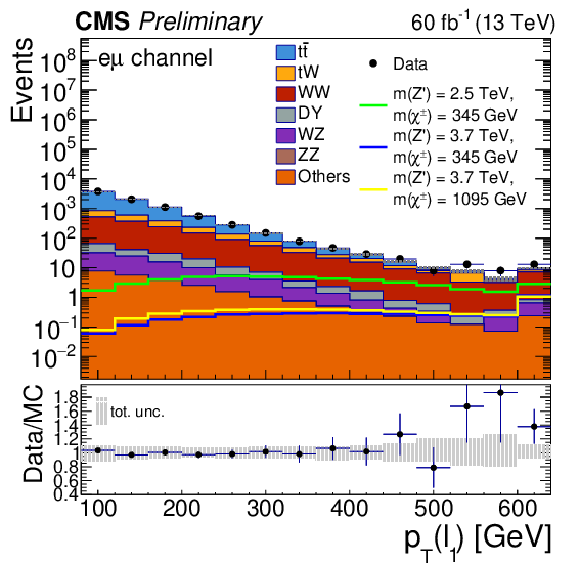
Figure 2-a:
A few important kinematical variables are shown for the data set from the $ \mathrm{e}^\pm\mu^\mp $ channel using 2018 data. Leading lepton $ p_{\mathrm{T}} $ (top left), dilepton invariant mass (top right), transverse mass (bottom left) and stransverse mass (bottom right) distributions are shown. Several benchmark signal distributions are superimposed (colored lines), demonstrating good separation power between background and signal. The bottom panel of each plot displays the data-to-MC ratio (before fitting with systematics, i.e., prefit), along with the corresponding total uncertainty band (gray), which includes all systematic and statistical uncertainties except for normalization factor uncertainty of certain background processes. |

png pdf |
Figure 2-b:
A few important kinematical variables are shown for the data set from the $ \mathrm{e}^\pm\mu^\mp $ channel using 2018 data. Leading lepton $ p_{\mathrm{T}} $ (top left), dilepton invariant mass (top right), transverse mass (bottom left) and stransverse mass (bottom right) distributions are shown. Several benchmark signal distributions are superimposed (colored lines), demonstrating good separation power between background and signal. The bottom panel of each plot displays the data-to-MC ratio (before fitting with systematics, i.e., prefit), along with the corresponding total uncertainty band (gray), which includes all systematic and statistical uncertainties except for normalization factor uncertainty of certain background processes. |
png pdf |
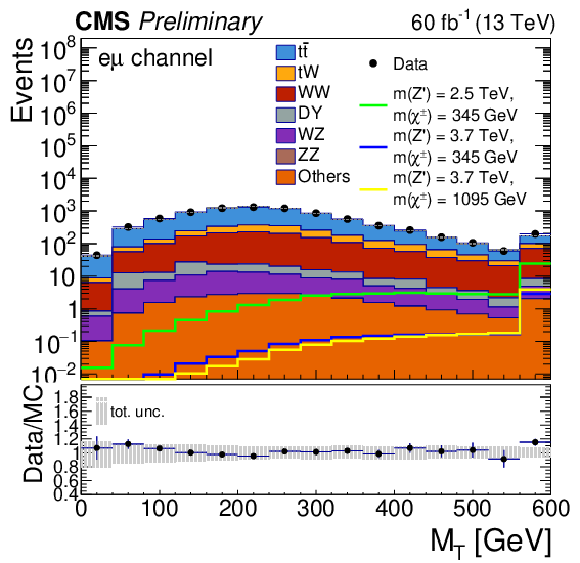
Figure 2-c:
A few important kinematical variables are shown for the data set from the $ \mathrm{e}^\pm\mu^\mp $ channel using 2018 data. Leading lepton $ p_{\mathrm{T}} $ (top left), dilepton invariant mass (top right), transverse mass (bottom left) and stransverse mass (bottom right) distributions are shown. Several benchmark signal distributions are superimposed (colored lines), demonstrating good separation power between background and signal. The bottom panel of each plot displays the data-to-MC ratio (before fitting with systematics, i.e., prefit), along with the corresponding total uncertainty band (gray), which includes all systematic and statistical uncertainties except for normalization factor uncertainty of certain background processes. |
png pdf |
Figure 2-d:
A few important kinematical variables are shown for the data set from the $ \mathrm{e}^\pm\mu^\mp $ channel using 2018 data. Leading lepton $ p_{\mathrm{T}} $ (top left), dilepton invariant mass (top right), transverse mass (bottom left) and stransverse mass (bottom right) distributions are shown. Several benchmark signal distributions are superimposed (colored lines), demonstrating good separation power between background and signal. The bottom panel of each plot displays the data-to-MC ratio (before fitting with systematics, i.e., prefit), along with the corresponding total uncertainty band (gray), which includes all systematic and statistical uncertainties except for normalization factor uncertainty of certain background processes. |

png pdf |
Figure 3:
Asimov significance as a function of $ m_{\mathrm{Z}^{'}}$, where the significances were obtained using the PNN model (dot markers with solid lines) and an NN model trained on a specific signal point ($ m_{\mathrm{Z}^{'}}= $ 2500 GeV and $ m_{\tilde{\chi}_{1}^{+}}= $ 345 GeV) (triangle markers with dashed lines). The blue (PNN) and orange (NN) curves correspond to $ m_{\tilde{\chi}_{1}^{+}}= $ 345 GeV, while the green (PNN) and red (NN) curves correspond to $ m_{\tilde{\chi}_{1}^{+}}= $ 845 GeV. The significance values coincide at $ m_{\mathrm{Z}^{'}}= $ 2.5 TeV and $ m_{\tilde{\chi}_{1}^{+}}= $ 345 GeV (blue and orange), and the PNN significance progressively exceeds that of the dedicated NN as the mass points deviate further from this reference point. For this plot, MC simulations in the $ e\mu $ channel with 2017 luminosity were used. |
png pdf |
Figure 4:
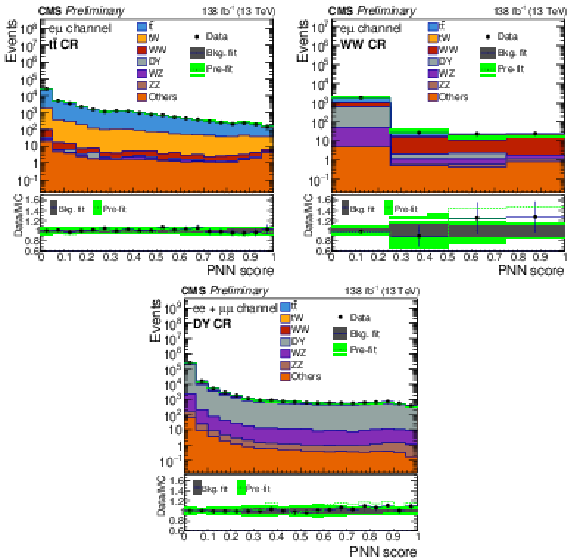
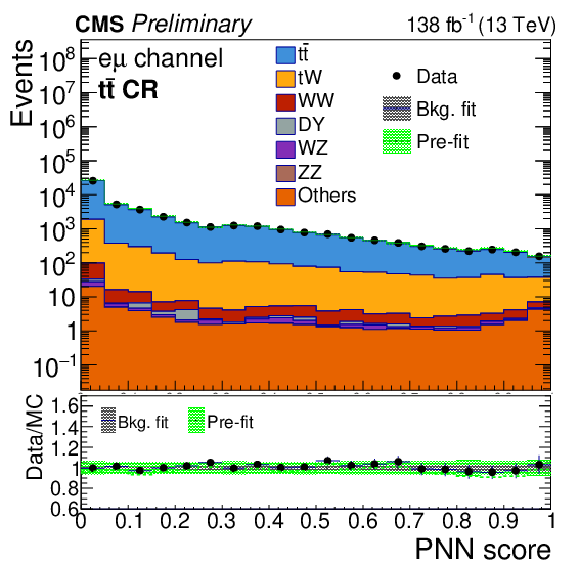
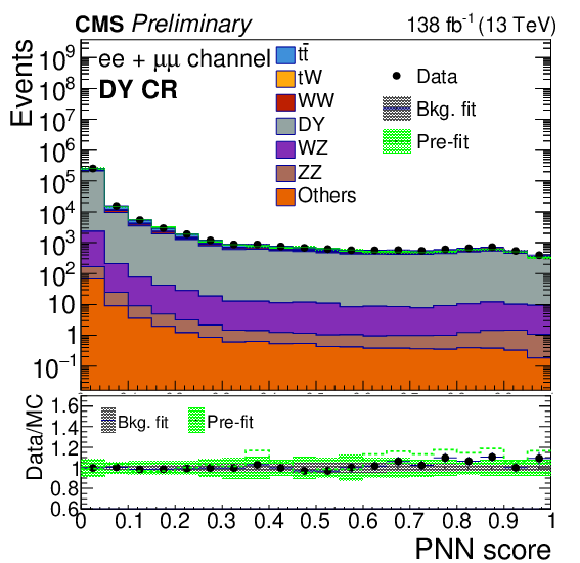
DNN score distributions in control regions (for which selections are defined in Table 3 for the main background processes $ \mathrm{t} \overline{\mathrm{t}} $ for the $ \mathrm{e}^\pm\mu^\mp $ channel (top left), WW for the $ \mathrm{e}^\pm\mu^\mp $ channel (top right), and DY for the $ \mathrm{e}^+\mathrm{e}^- $+$ \mu^+\mu^- $ channel (bottom). The bottom panel of each plot shows data-to-MC ratios with background-only fit MC, along with the corresponding uncertainty band (gray) and with prefit MC, along with the corresponding uncertainty band (green). |
png pdf |
Figure 4-a:
DNN score distributions in control regions (for which selections are defined in Table 3 for the main background processes $ \mathrm{t} \overline{\mathrm{t}} $ for the $ \mathrm{e}^\pm\mu^\mp $ channel (top left), WW for the $ \mathrm{e}^\pm\mu^\mp $ channel (top right), and DY for the $ \mathrm{e}^+\mathrm{e}^- $+$ \mu^+\mu^- $ channel (bottom). The bottom panel of each plot shows data-to-MC ratios with background-only fit MC, along with the corresponding uncertainty band (gray) and with prefit MC, along with the corresponding uncertainty band (green). |

png pdf |
Figure 4-b:
DNN score distributions in control regions (for which selections are defined in Table 3 for the main background processes $ \mathrm{t} \overline{\mathrm{t}} $ for the $ \mathrm{e}^\pm\mu^\mp $ channel (top left), WW for the $ \mathrm{e}^\pm\mu^\mp $ channel (top right), and DY for the $ \mathrm{e}^+\mathrm{e}^- $+$ \mu^+\mu^- $ channel (bottom). The bottom panel of each plot shows data-to-MC ratios with background-only fit MC, along with the corresponding uncertainty band (gray) and with prefit MC, along with the corresponding uncertainty band (green). |
png pdf |
Figure 4-c:
DNN score distributions in control regions (for which selections are defined in Table 3 for the main background processes $ \mathrm{t} \overline{\mathrm{t}} $ for the $ \mathrm{e}^\pm\mu^\mp $ channel (top left), WW for the $ \mathrm{e}^\pm\mu^\mp $ channel (top right), and DY for the $ \mathrm{e}^+\mathrm{e}^- $+$ \mu^+\mu^- $ channel (bottom). The bottom panel of each plot shows data-to-MC ratios with background-only fit MC, along with the corresponding uncertainty band (gray) and with prefit MC, along with the corresponding uncertainty band (green). |

png pdf |
Figure 5:
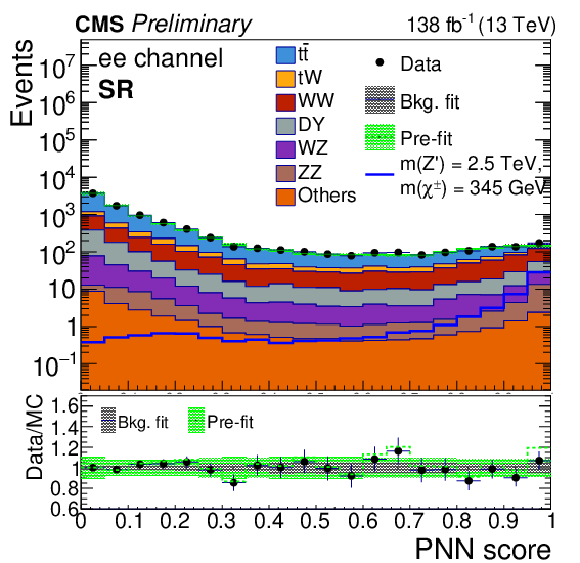
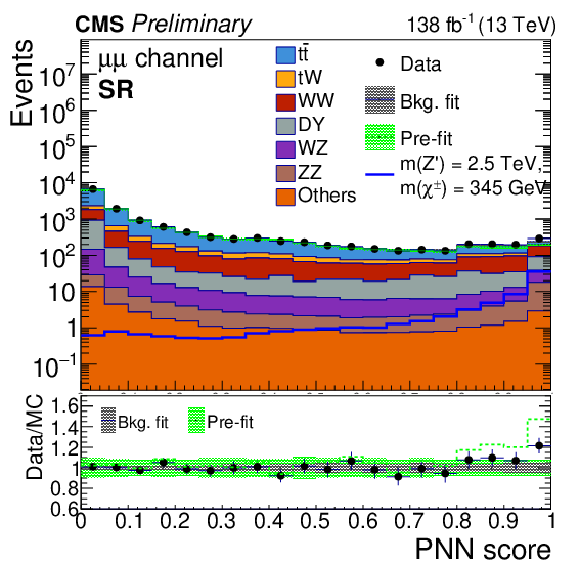
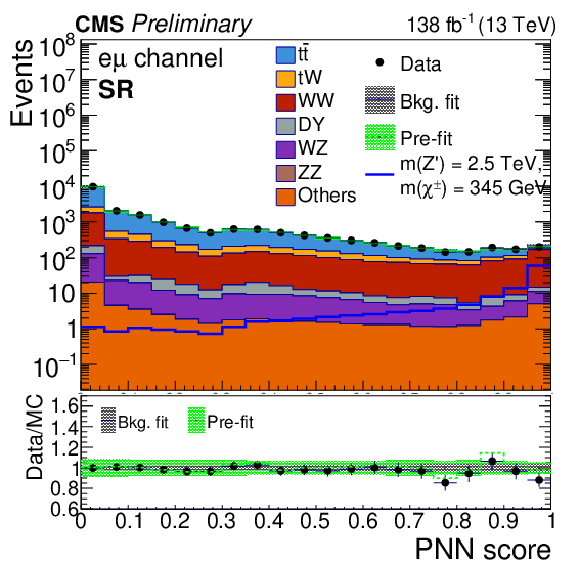
DNN score distributions obtained after the fit for the signal regions in the $ \mathrm{e}^+\mathrm{e}^- $ (top left), mm (top right), and $ \mathrm{e}^\pm \mu^\mp $ (bottom) channels. Signal distributions for a benchmark point with with $ m_{\mathrm{Z}^{'}}= $ 2500 GeV and $ m_{\tilde{\chi}_{1}^{+}}= $ 345 GeV are superimposed on the plots. The bottom panel of each plot shows data-to-MC ratios with background-only fit MC, along with the corresponding uncertainty band (gray) and with prefit MC, along with the corresponding uncertainty band (green). |
png pdf |
Figure 5-a:
DNN score distributions obtained after the fit for the signal regions in the $ \mathrm{e}^+\mathrm{e}^- $ (top left), mm (top right), and $ \mathrm{e}^\pm \mu^\mp $ (bottom) channels. Signal distributions for a benchmark point with with $ m_{\mathrm{Z}^{'}}= $ 2500 GeV and $ m_{\tilde{\chi}_{1}^{+}}= $ 345 GeV are superimposed on the plots. The bottom panel of each plot shows data-to-MC ratios with background-only fit MC, along with the corresponding uncertainty band (gray) and with prefit MC, along with the corresponding uncertainty band (green). |
png pdf |
Figure 5-b:
DNN score distributions obtained after the fit for the signal regions in the $ \mathrm{e}^+\mathrm{e}^- $ (top left), mm (top right), and $ \mathrm{e}^\pm \mu^\mp $ (bottom) channels. Signal distributions for a benchmark point with with $ m_{\mathrm{Z}^{'}}= $ 2500 GeV and $ m_{\tilde{\chi}_{1}^{+}}= $ 345 GeV are superimposed on the plots. The bottom panel of each plot shows data-to-MC ratios with background-only fit MC, along with the corresponding uncertainty band (gray) and with prefit MC, along with the corresponding uncertainty band (green). |
png pdf |
Figure 5-c:
DNN score distributions obtained after the fit for the signal regions in the $ \mathrm{e}^+\mathrm{e}^- $ (top left), mm (top right), and $ \mathrm{e}^\pm \mu^\mp $ (bottom) channels. Signal distributions for a benchmark point with with $ m_{\mathrm{Z}^{'}}= $ 2500 GeV and $ m_{\tilde{\chi}_{1}^{+}}= $ 345 GeV are superimposed on the plots. The bottom panel of each plot shows data-to-MC ratios with background-only fit MC, along with the corresponding uncertainty band (gray) and with prefit MC, along with the corresponding uncertainty band (green). |
png pdf |
Figure 6:
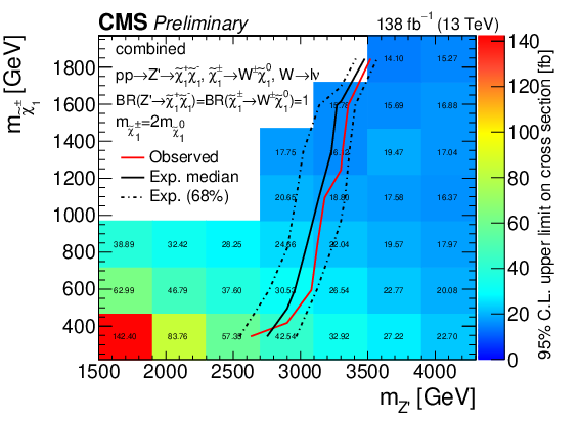
The expected upper limits at 95% CL on the $ \mathrm{p}\mathrm{p} \rightarrow \mathrm{Z}^{'} $ cross section, along with the exclusion lines for the observed and expected limits, are presented. The cross-section limits are shown in the plane of $ \mathrm{Z}^{'} $ boson and $ \tilde{\chi}_{1}^{\pm} $ masses, combining the $ \mathrm{e}^+\mathrm{e}^- $, mm, and $ \mathrm{e}^\pm \mu^\mp $ channels. The color grid shows median expected upper limits. The black solid line denotes the median exclusion and the black dashed lines denote 68% quantiles. The red solid line denotes exclusion line of observed data. The region to the left of the exclusion curves is excluded. |
png pdf |
Figure 7:
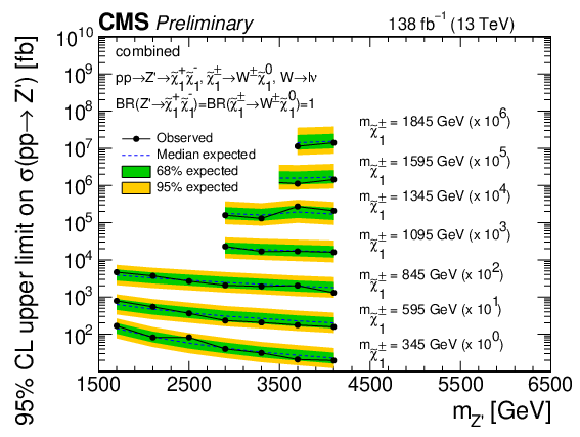
Observed and expected upper limits at 95% CL on the $ \mathrm{p}\mathrm{p} \rightarrow \mathrm{Z}^{'} $ cross section versus $ \mathrm{Z}^{'} $ boson mass for different values of $ \tilde{\chi}_{1}^{\pm} $ masses are presented for the combination of $ \mathrm{e}^+\mathrm{e}^- $, mm and $ \mathrm{e}^\pm \mu^\mp $ channels. Limits are scaled for the different values of the $ \tilde{\chi}_{1}^{\pm} $ mass. The black dot with solid line represent the observed upper limits, while the dashed lines with the green and yellow bands show the expected upper limits with 68% and 95% quantiles. |
| Tables | |

png pdf |
Table 1:
Summary of object definitions and selections. |
png pdf |
Table 2:
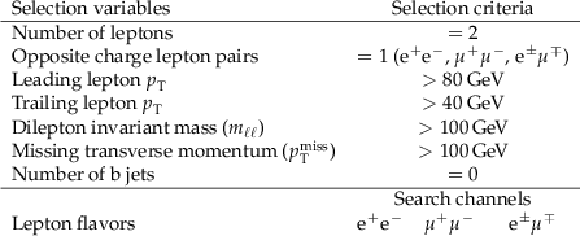
Signal event selection and search channels. |

png pdf |
Table 3:
Comparison of selection criteria for the signal, and control regions used in this analysis, following the requirement of two oppositely-charged leptons and $ p_{\mathrm{T}} $ thresholds. |

png pdf |
Table 4:
Normalization factors and their uncertainties for the $ \mathrm{t} \overline{\mathrm{t}} $, WW, and DY processes are listed in this table. |
| Summary |
| A search was conducted for a leptophobic $ \mathrm{Z}^{'} $ boson decaying into two charginos, which subsequently decay into W bosons and neutralinos. A data set of proton-proton collisions at a center-of-mass energy of 13 TeV, corresponding to an integrated luminosity of 138 fb$ ^{-1} $ was analyzed. This is the first search for this process using LHC data. An analysis was designed in the dilepton plus missing transverse momentum final state, in the $ \mathrm{e}^+\mathrm{e}^- $, mm, and $ \mathrm{e}^\pm \mu^\mp $ channels. A parametrized neural network was employed to enhance the signal sensitivity. The analysis was interpreted using simplified model spectra featuring the production and decay process of the leptophobic $ \mathrm{Z}^{'} $ boson derived from the U(1)' extension of the minimal supersymmetric standard model. Upper limits on the $ \mathrm{Z}^{'} $ boson production cross section have been presented in the $ \mathrm{Z}^{'} $ boson mass versus chargino mass plane, with $ m_{\tilde{\chi}_{1}^{\pm}} = 2m_{{\tilde{\chi}_{1}^{0}}} $. The analysis could exclude $ \mathrm{Z}^{'} $ boson masses up to about 3.5 TeV for the specific case of $ \mathrm{Z}^{'} $ boson decaying exclusively to charginos, and charginos exclusively decaying to W bosons and neutralinos. |
| References | ||||
| 1 | ATLAS Collaboration | Search for high-mass dilepton resonances using 139 fb$ ^{-1} $ of $ pp $ collision data collected at $ \sqrt{s}= $13 TeV with the ATLAS detector | PLB 796 (2019) 68 | 1903.06248 |
| 2 | CMS Collaboration | Search for resonant and nonresonant new phenomena in high-mass dilepton final states at $ \sqrt{s} $ = 13 TeV | JHEP 07 (2021) 208 | CMS-EXO-19-019 2103.02708 |
| 3 | CMS Collaboration | Search for high mass dijet resonances with a new background prediction method in proton-proton collisions at $ \sqrt{s} = $ 13 TeV | JHEP 05 (2020) 033 | CMS-EXO-19-012 1911.03947 |
| 4 | ATLAS Collaboration | Search for heavy diboson resonances in semileptonic final states in pp collisions at $ \sqrt{s}= $ 13 TeV with the ATLAS detector | EPJC 80 (2020) 1165 | 2004.14636 |
| 5 | J. Y. Araz, G. Corcella, M. Frank, and B. Fuks | Loopholes in Z$ ^\prime $ searches at the LHC: exploring supersymmetric and leptophobic scenarios | JHEP 02 (2018) 092 | 1711.06302 |
| 6 | M. Frank, Y. Hiçyilmaz, S. Moretti, and O. Özdal | Leptophobic Z$ ^\prime $ bosons in the secluded UMSSM | PRD 102 (2020) 115025 | 2005.08472 |
| 7 | M. Frank, Y. Hiçyilmaz, S. Moretti, and O. Özdal | E$ _{6} $ motivated UMSSM confronts experimental data | JHEP 05 (2020) 123 | 2004.01415 |
| 8 | ATLAS Collaboration | Search for direct pair production of sleptons and charginos decaying to two leptons and neutralinos with mass splittings near the W-boson mass in $ \sqrt{s} $ = 13 TeV pp collisions with the ATLAS detector | JHEP 06 (2023) 031 | 2209.13935 |
| 9 | CMS Collaboration | Combined search for electroweak production of winos, binos, higgsinos, and sleptons in proton-proton collisions at $ \sqrt{s}= $13 TeV | PRD 109 (2024) 112001 | CMS-SUS-21-008 2402.01888 |
| 10 | CMS Collaboration | The CMS experiment at the CERN LHC | JINST 3 (2008) S08004 | |
| 11 | CMS Collaboration | Development of the CMS detector for the CERN LHC Run 3 | JINST 19 (2024) P05064 | CMS-PRF-21-001 2309.05466 |
| 12 | CMS Collaboration | Performance of the CMS Level-1 trigger in proton-proton collisions at $ \sqrt{s} = $ 13 TeV | JINST 15 (2020) P10017 | CMS-TRG-17-001 2006.10165 |
| 13 | CMS Collaboration | The CMS trigger system | JINST 12 (2017) P01020 | CMS-TRG-12-001 1609.02366 |
| 14 | CMS Collaboration | Performance of the CMS high-level trigger during LHC run 2 | JINST 19 (2024) P11021 | CMS-TRG-19-001 2410.17038 |
| 15 | J. Alwall et al. | The automated computation of tree-level and next-to-leading order differential cross sections, and their matching to parton shower simulations | JHEP 07 (2014) 079 | 1405.0301 |
| 16 | NNPDF Collaboration | Parton distributions from high-precision collider data | EPJC 77 (2017) 663 | 1706.00428 |
| 17 | P. Nason | A new method for combining NLO QCD with shower Monte Carlo algorithms | JHEP 11 (2004) 040 | hep-ph/0409146 |
| 18 | S. Frixione, P. Nason, and C. Oleari | Matching NLO QCD computations with parton shower simulations: the POWHEG method | JHEP 11 (2007) 070 | 0709.2092 |
| 19 | S. Alioli, P. Nason, C. Oleari, and E. Re | A general framework for implementing NLO calculations in shower Monte Carlo programs: the POWHEG BOX | JHEP 06 (2010) 043 | 1002.2581 |
| 20 | S. Frixione, P. Nason, and G. Ridolfi | A positive-weight next-to-leading-order Monte Carlo for heavy flavour hadroproduction | JHEP 09 (2007) 126 | 0707.3088 |
| 21 | T. Sjöstrand et al. | An introduction to PYTHIA 8.2 | Comput. Phys. Commun. 191 (2015) 159 | 1410.3012 |
| 22 | J. Alwall et al. | Comparative study of various algorithms for the merging of parton showers and matrix elements in hadronic collisions | EPJC 53 (2008) 473 | 0706.2569 |
| 23 | R. Frederix and S. Frixione | Merging meets matching in MC@NLO | JHEP 12 (2012) 061 | 1209.6215 |
| 24 | CMS Collaboration | Extraction and validation of a new set of CMS PYTHIA8 tunes from underlying-event measurements | EPJC 80 (2020) 4 | CMS-GEN-17-001 1903.12179 |
| 25 | GEANT4 Collaboration | GEANT4---a simulation toolkit | NIM A 506 (2003) 250 | |
| 26 | CMS Collaboration | Particle-flow reconstruction and global event description with the CMS detector | JINST 12 (2017) P10003 | CMS-PRF-14-001 1706.04965 |
| 27 | CMS Collaboration | Electron and photon reconstruction and identification with the CMS experiment at the CERN LHC | JINST 16 (2021) P05014 | CMS-EGM-17-001 2012.06888 |
| 28 | CMS Collaboration | ECAL 2016 refined calibration and Run2 summary plots | CMS Detector Performance Summary CMS-DP-2020-021, 2020 CDS |
|
| 29 | CMS Collaboration | Performance of the CMS muon detector and muon reconstruction with proton-proton collisions at $ \sqrt{s}= $ 13 TeV | JINST 13 (2018) P06015 | CMS-MUO-16-001 1804.04528 |
| 30 | M. Cacciari, G. P. Salam, and G. Soyez | The anti-$ k_{\mathrm{T}} $ jet clustering algorithm | JHEP 04 (2008) 063 | 0802.1189 |
| 31 | M. Cacciari, G. P. Salam, and G. Soyez | FastJet user manual | EPJC 72 (2012) 1896 | 1111.6097 |
| 32 | CMS Collaboration | Pileup mitigation at CMS in 13 TeV data | JINST 15 (2020) P09018 | CMS-JME-18-001 2003.00503 |
| 33 | CMS Collaboration | Jet energy scale and resolution in the CMS experiment in pp collisions at 8 TeV | JINST 12 (2017) P02014 | CMS-JME-13-004 1607.03663 |
| 34 | CMS Collaboration | Identification of heavy-flavour jets with the CMS detector in pp collisions at 13 TeV | JINST 13 (2018) P05011 | CMS-BTV-16-002 1712.07158 |
| 35 | CMS Collaboration | Performance of missing transverse momentum reconstruction in proton-proton collisions at $ \sqrt{s} = $ 13 TeV using the CMS detector | JINST 14 (2019) P07004 | CMS-JME-17-001 1903.06078 |
| 36 | D. Bertolini, P. Harris, M. Low, and N. Tran | Pileup per particle identification | JHEP 10 (2014) 059 | 1407.6013 |
| 37 | CMS Collaboration | Performance of the CMS muon trigger system in proton-proton collisions at $ \sqrt{s} = $ 13 TeV | JINST 16 (2021) P07001 | CMS-MUO-19-001 2102.04790 |
| 38 | C. G. Lester and D. J. Summers | Measuring masses of semiinvisibly decaying particles pair produced at hadron colliders | PLB 463 (1999) 99 | hep-ph/9906349 |
| 39 | A. Barr, C. Lester, and P. Stephens | m(T2): The truth behind the glamour | JPG 29 (2003) 2343 | hep-ph/0304226 |
| 40 | M. Abadi et al. | TensorFlow: Large-scale machine learning on heterogeneous systems | link | 1605.08695 |
| 41 | F. Chollet et al. | Keras | https://keras.io | |
| 42 | P. Baldi et al. | Parameterized neural networks for high-energy physics | EPJC 76 (2016) 235 | 1601.07913 |
| 43 | NNPDF Collaboration | Parton distributions for the LHC Run II | JHEP 04 (2015) 040 | 1410.8849 |
| 44 | J. Butterworth et al. | PDF4LHC recommendations for LHC Run II | JPG 43 (2016) 023001 | 1510.03865 |
| 45 | M. Czakon et al. | Top-pair production at the LHC through NNLO QCD and NLO EW | JHEP 10 (2017) 186 | 1705.04105 |
| 46 | CMS Collaboration | Precision luminosity measurement in proton-proton collisions at $ \sqrt{s} = $ 13 TeV in 2015 and 2016 at CMS | EPJC 81 (2021) 800 | CMS-LUM-17-003 2104.01927 |
| 47 | CMS Collaboration | CMS luminosity measurement for the 2017 data-taking period at $ \sqrt{s} $ = 13 TeV | CMS Physics Analysis Summary, 2018 link |
CMS-PAS-LUM-17-004 |
| 48 | CMS Collaboration | CMS luminosity measurement for the 2018 data-taking period at $ \sqrt{s} $ = 13 TeV | CMS Physics Analysis Summary, 2019 link |
CMS-PAS-LUM-18-002 |
| 49 | CMS Collaboration | Jet energy scale and resolution in the CMS experiment in pp collisions at 8 TeV | JINST 12 (2017) P02014 | CMS-JME-13-004 1607.03663 |
| 50 | R. J. Barlow and C. Beeston | Fitting using finite monte carlo samples | Comput. Phys. Commun. 77 (1993) 219 | |
| 51 | G. Cowan, K. Cranmer, E. Gross, and O. Vitells | Asymptotic formulae for likelihood-based tests of new physics | EPJC 71 (2011) 1554 | 1007.1727 |
| 52 | T. Junk | Confidence level computation for combining searches with small statistics | NIM A 434 (1999) 435 | hep-ex/9902006 |
| 53 | A. L. Read | Presentation of search results: The $ \text{CL}_\text{s} $ technique | JPG 28 (2002) 2693 | |
| 54 | ATLAS, CMS, LHC Higgs Combination Group Collaboration | Procedure for the LHC Higgs boson search combination in Summer 2011 | ||
| 55 | CMS Collaboration | The CMS statistical analysis and combination tool: Combine | Submitted to Comput. Softw. Big Sci, 2024 | CMS-CAT-23-001 2404.06614 |
| 56 | W. Verkerke and D. P. Kirkby | The RooFit toolkit for data modeling | in Proceedings of the 13th International Conference for Computing in High-Energy and Nuclear Physics (CHEP03), 2003 link |
physics/0306116 |
| 57 | L. Moneta et al. | The roostats project | link | |

|
Compact Muon Solenoid LHC, CERN |

|

|

|

|

|

|