

Compact Muon Solenoid
LHC, CERN
 Visit us: CMS Public Website, CMS Physics ;
Contact us: CMS Publications Committee
Visit us: CMS Public Website, CMS Physics ;
Contact us: CMS Publications Committee
| CMS-PAS-SMP-25-010 | ||
| Measurement of normalized double-differential groomed and ungroomed jet mass cross sections in Z+jet events at $ \sqrt{s}= $ 13 TeV with the CMS detector | ||
| CMS Collaboration | ||
| 2026-07-31 | ||
| Abstract: Measurements of double-differential jet production cross sections are presented as a function of the transverse momentum $ p_\mathrm{T} $ and the dimensionless jet mass $ \rho $ of the leading jet in Z+jet events. The jets are clustered with the anti-$ k_\mathrm{T} $ algorithm with distance parameter $ R= $ 0.8. This measurement provides a sample enriched in quark-initiated jets, as the dominant production mechanisms are $ \mathrm{g q} \rightarrow \mathrm{Z q} $ and $ \mathrm{q \overline{q}} \rightarrow \mathrm{Z q} $. Comparing the ungroomed and groomed jets allows for separation of the perturbative evolution of the single-gluon emission approximation of the jet mass (accurate at leading logarithmic order), from non-perturbative effects such as hadronization and contamination from the underlying event, multiple parton interactions, and interactions between multiple protons in the same bunch crossing. This provides a precise benchmark for state-of-the-art theoretical calculations and tuning of simulation parameters. This analysis utilizes the dataset of proton-proton collisions at $ \sqrt{s}= $ 13 TeV recorded by the CMS detector from 2016 to 2018, corresponding to an integrated luminosity of 138 fb$ ^{-1} $. The results are unfolded to the generated particle level to correct for detector effects, and are compared with predictions from Monte Carlo event generators. | ||
| Links: CDS record (PDF) ; CADI line (restricted) ; | ||
| Figures | |
png pdf |
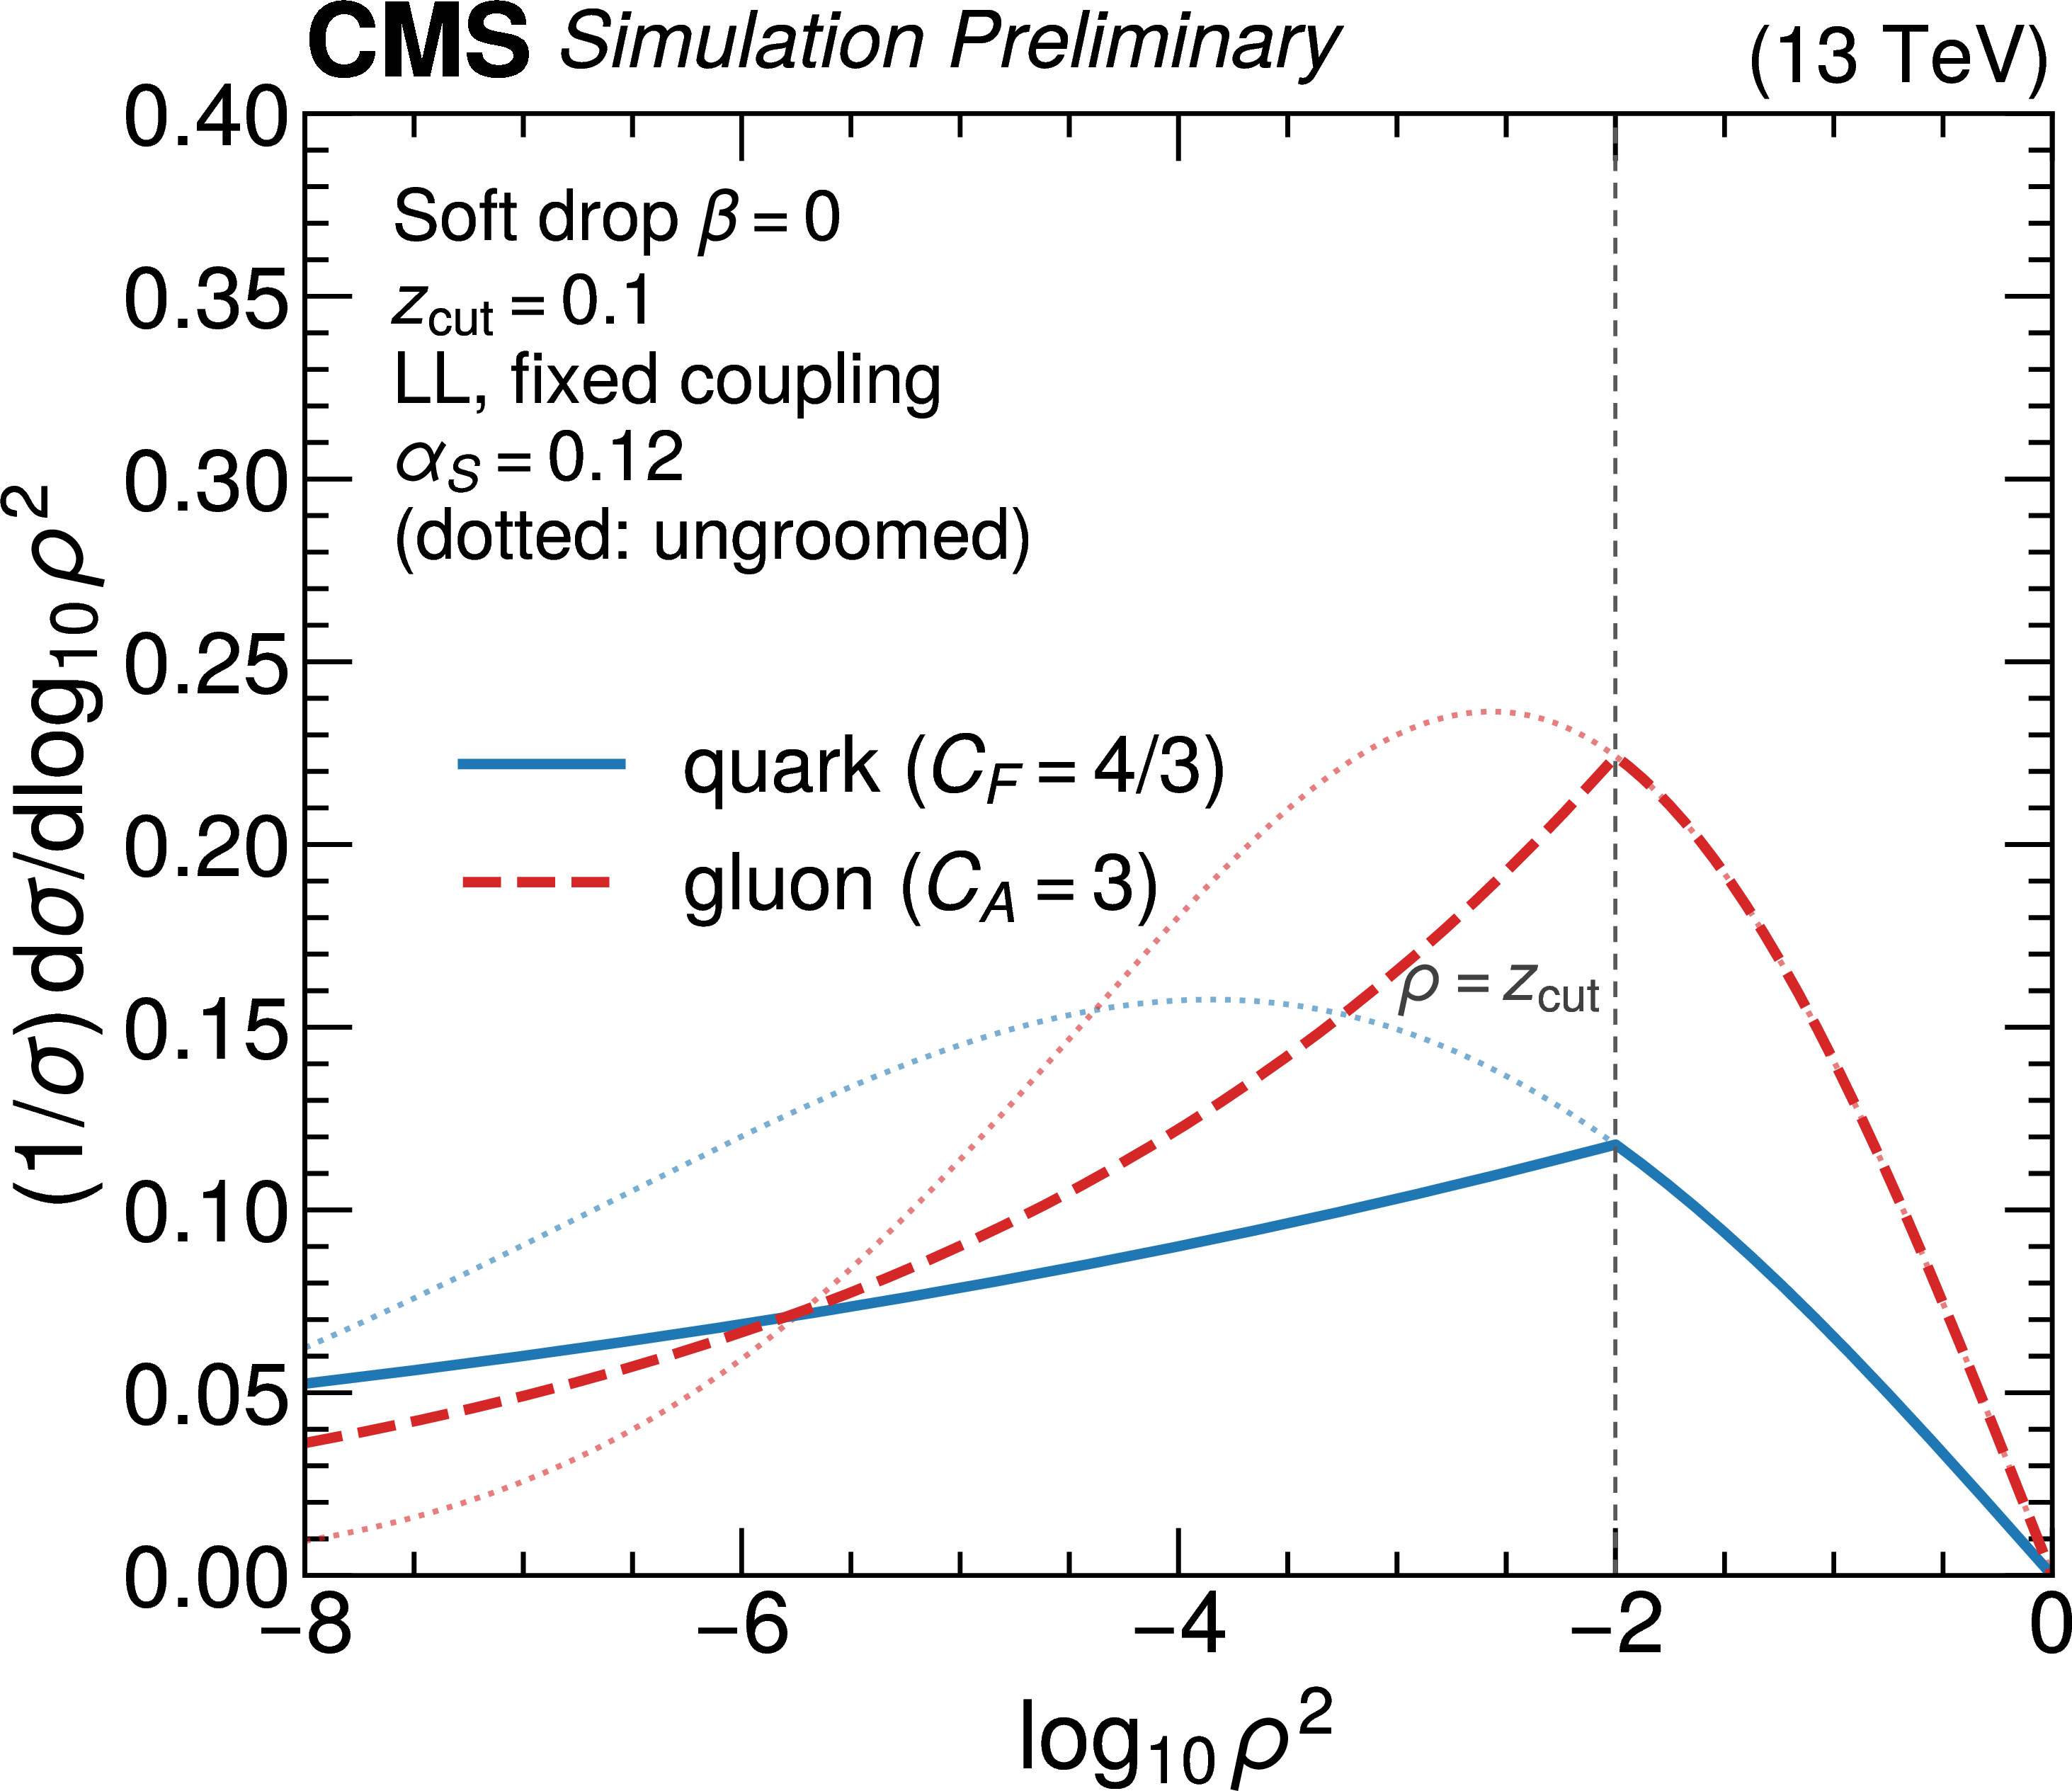
Figure 1:
Fixed-coupling, leading-logarithmic normalized jet mass distributions for quark- ($ C_i=C_F $) and gluon-initiated ($ C_i=C_A $) jets in blue and red lines, respectively, as a function of $ \log_{10}(\rho^{2}) $. The ungroomed jets are shown in dotted lines, while the distribution after the soft-drop grooming with $ \beta= $ 0 and $ z_{\text{cut}}= $ 0.1 are shown in solid (quark) and dashed (gluon) jets. The dashed vertical line marks the soft drop grooming transition at $ \rho=z_{\text{cut}} $. The larger color factor of the gluon shifts the ungroomed Sudakov peak to higher mass and raises the groomed plateau, whose height is proportional to $ \alpha_\mathrm{S} C_i $. |
png pdf |
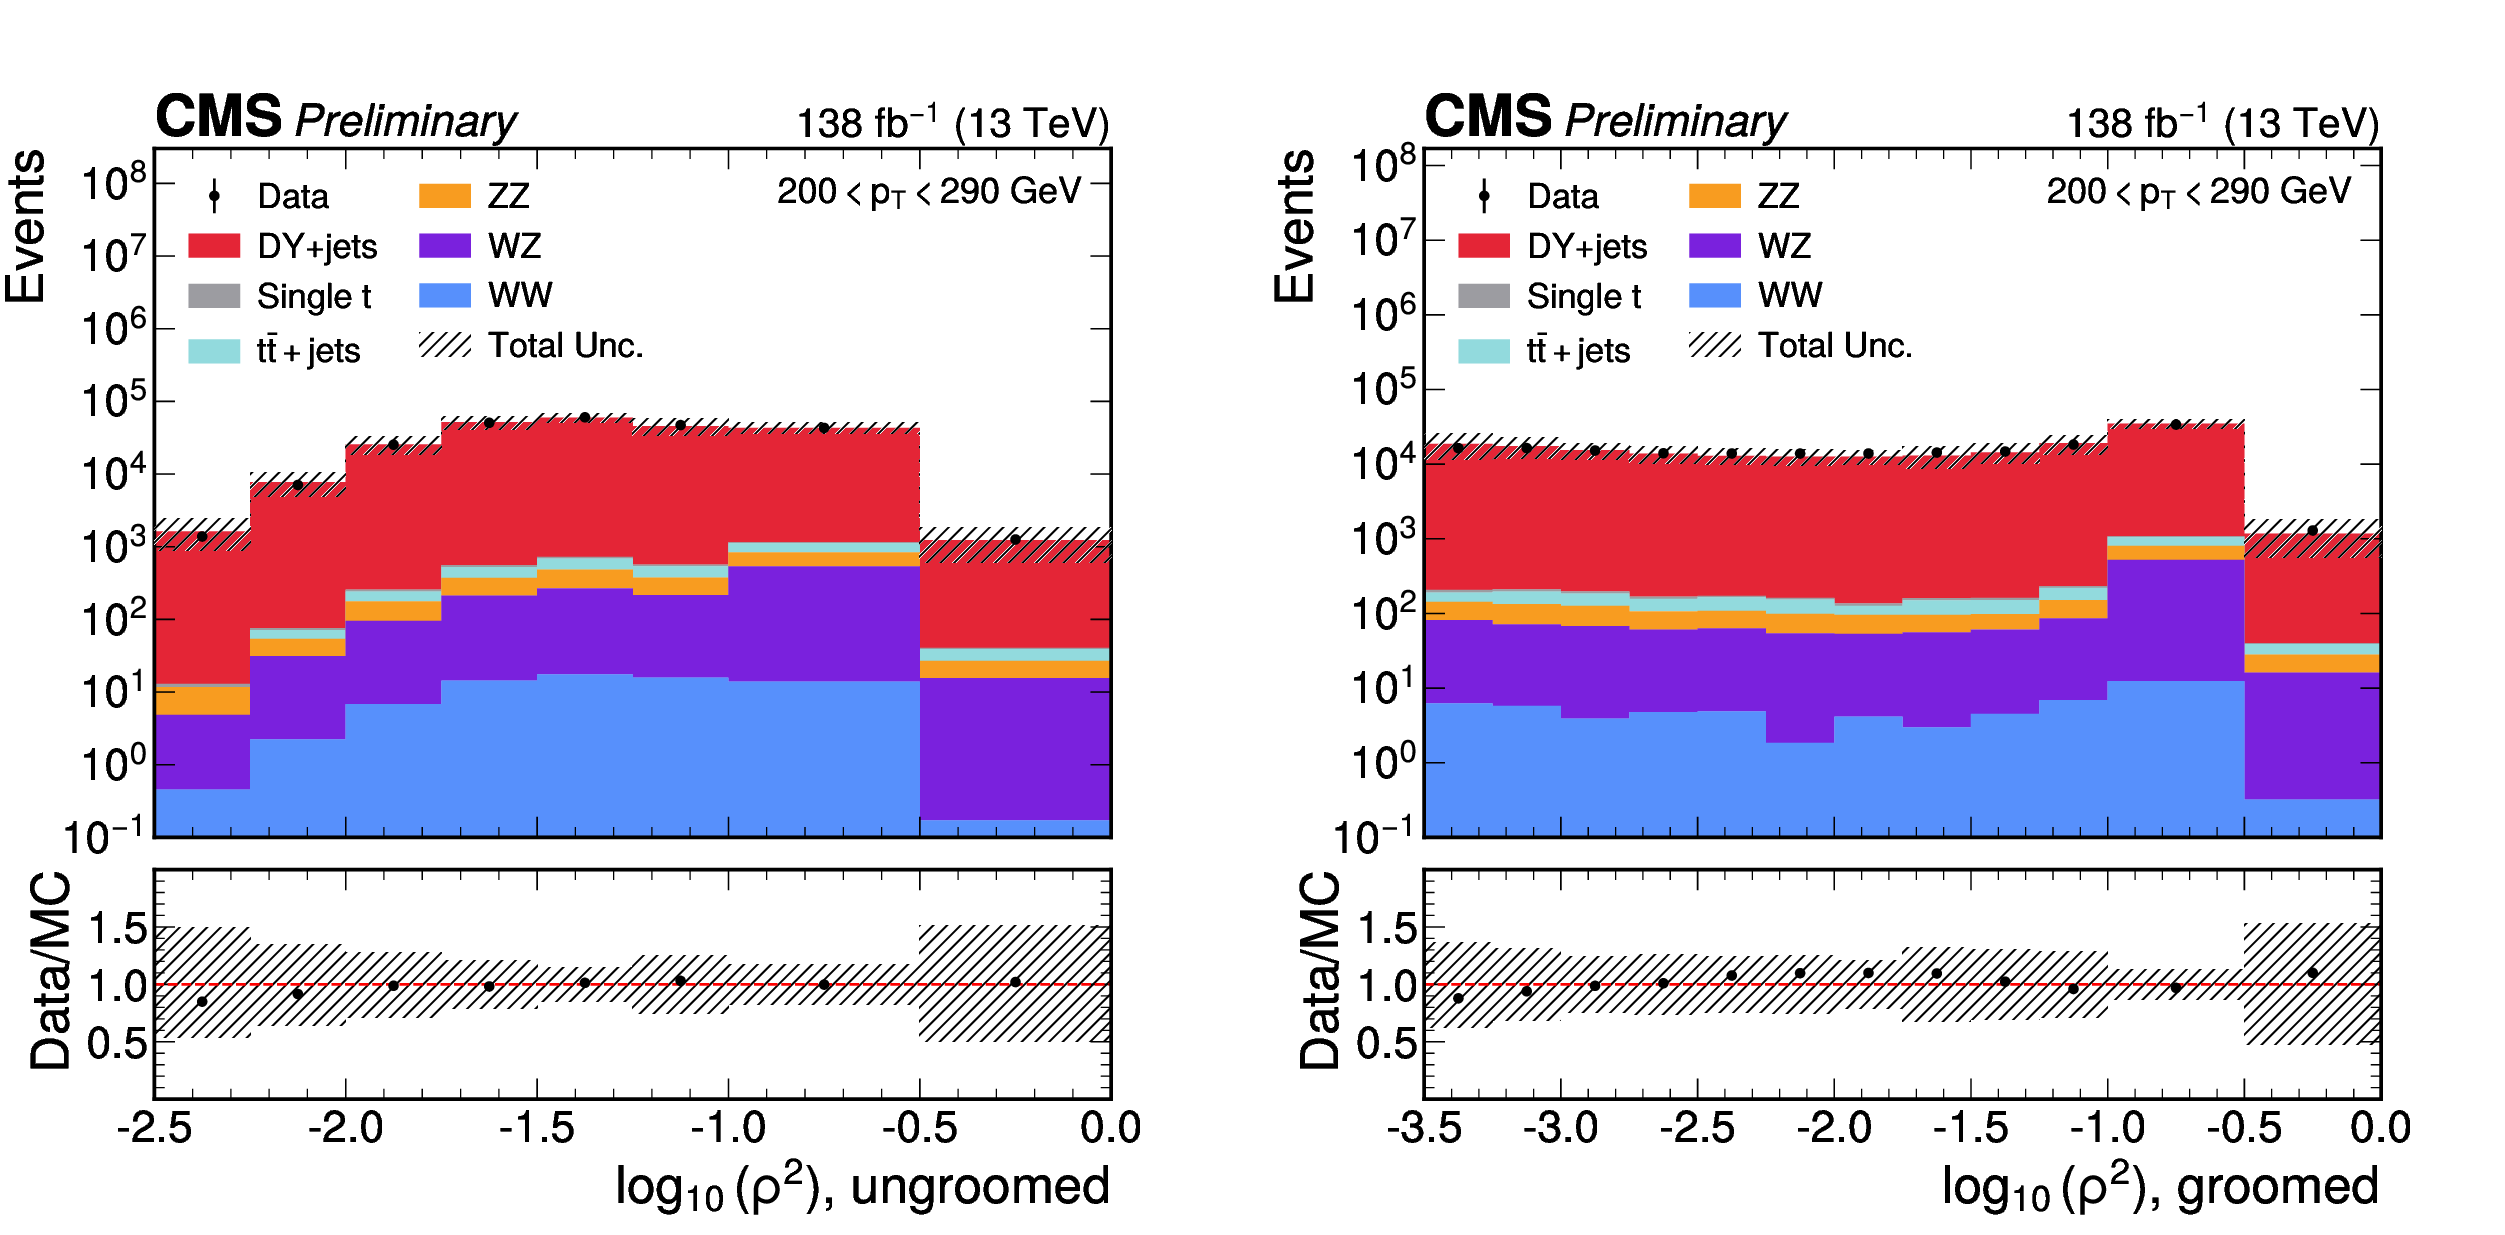
Figure 2:
Detector-level data and simulation distributions in the 200 $ < p_{\mathrm{T}} < $ 290 GeV bin for the ungroomed (left) and groomed (right) observables. The points show data, and the stacked histograms show the simulated Drell--Yan signal and the contributions from top quark, single top quark, and diboson backgrounds. The hatched bands show the total uncertainty in the simulation, i.e., the statistical and experimental systematic uncertainties added in quadrature. The lower panels show the ratios of the data to the simulation. |
png pdf |
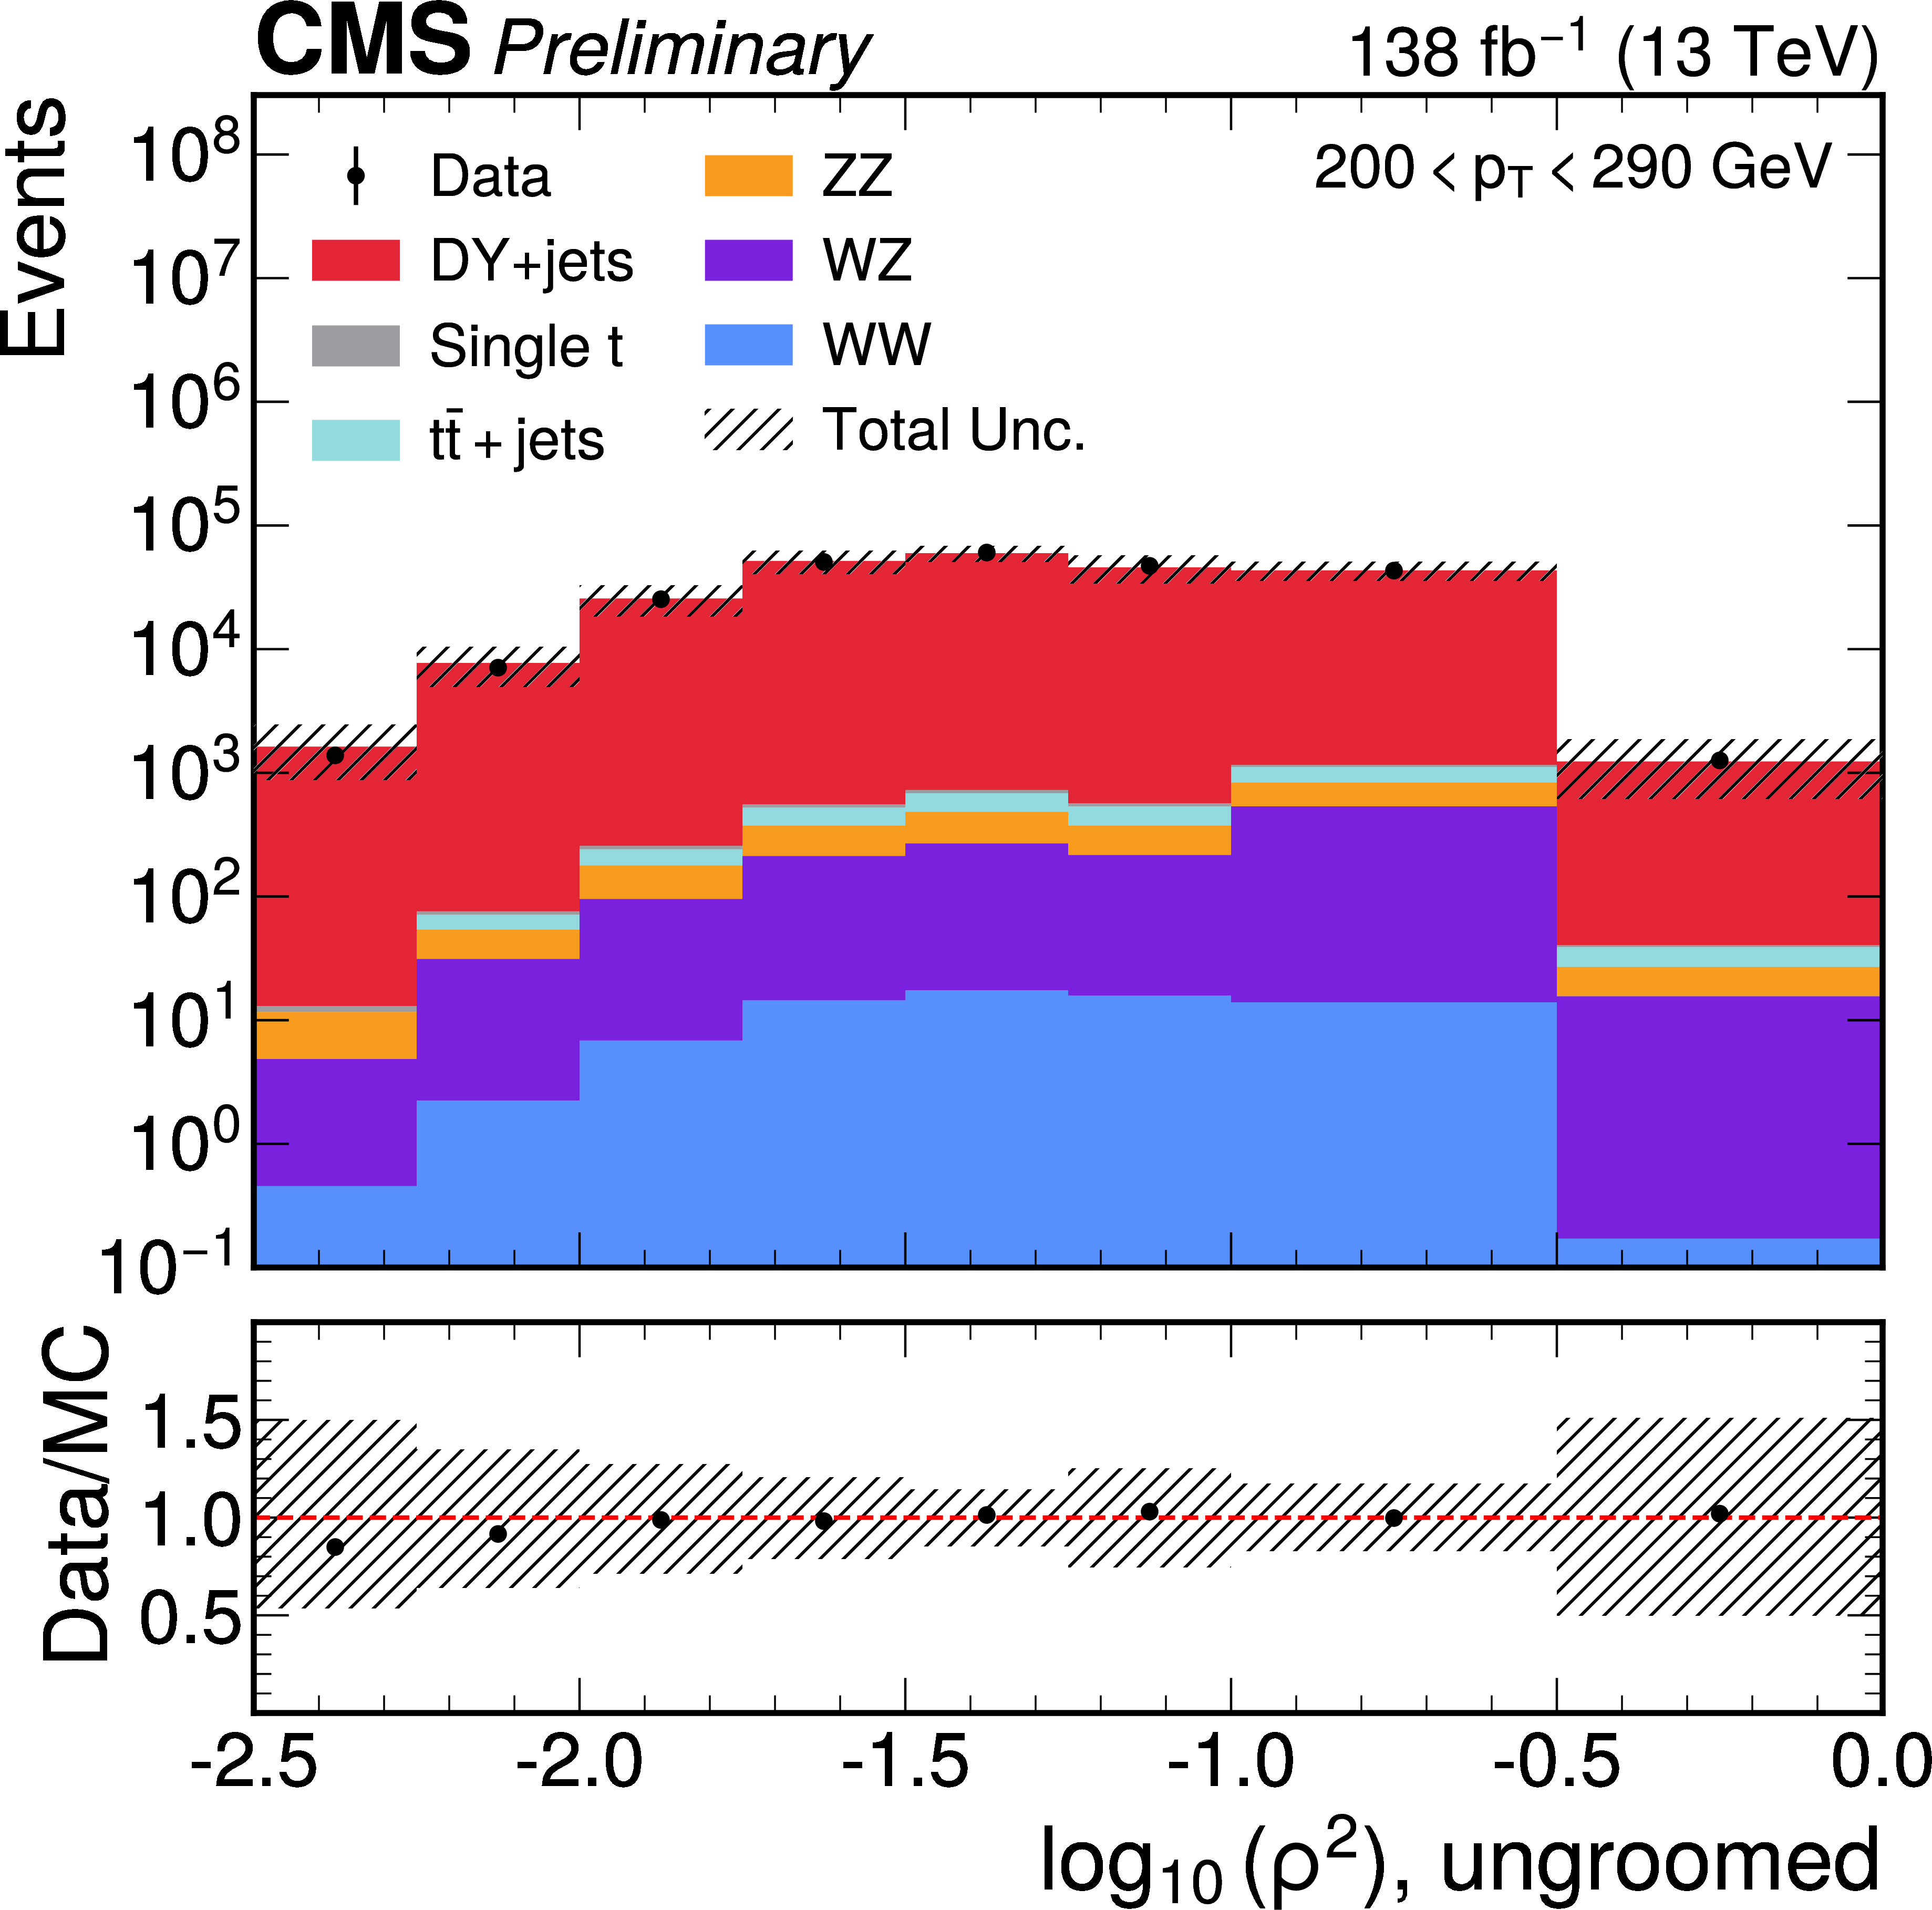
Figure 2-a:
Detector-level data and simulation distributions in the 200 $ < p_{\mathrm{T}} < $ 290 GeV bin for the ungroomed (left) and groomed (right) observables. The points show data, and the stacked histograms show the simulated Drell--Yan signal and the contributions from top quark, single top quark, and diboson backgrounds. The hatched bands show the total uncertainty in the simulation, i.e., the statistical and experimental systematic uncertainties added in quadrature. The lower panels show the ratios of the data to the simulation. |
png pdf |
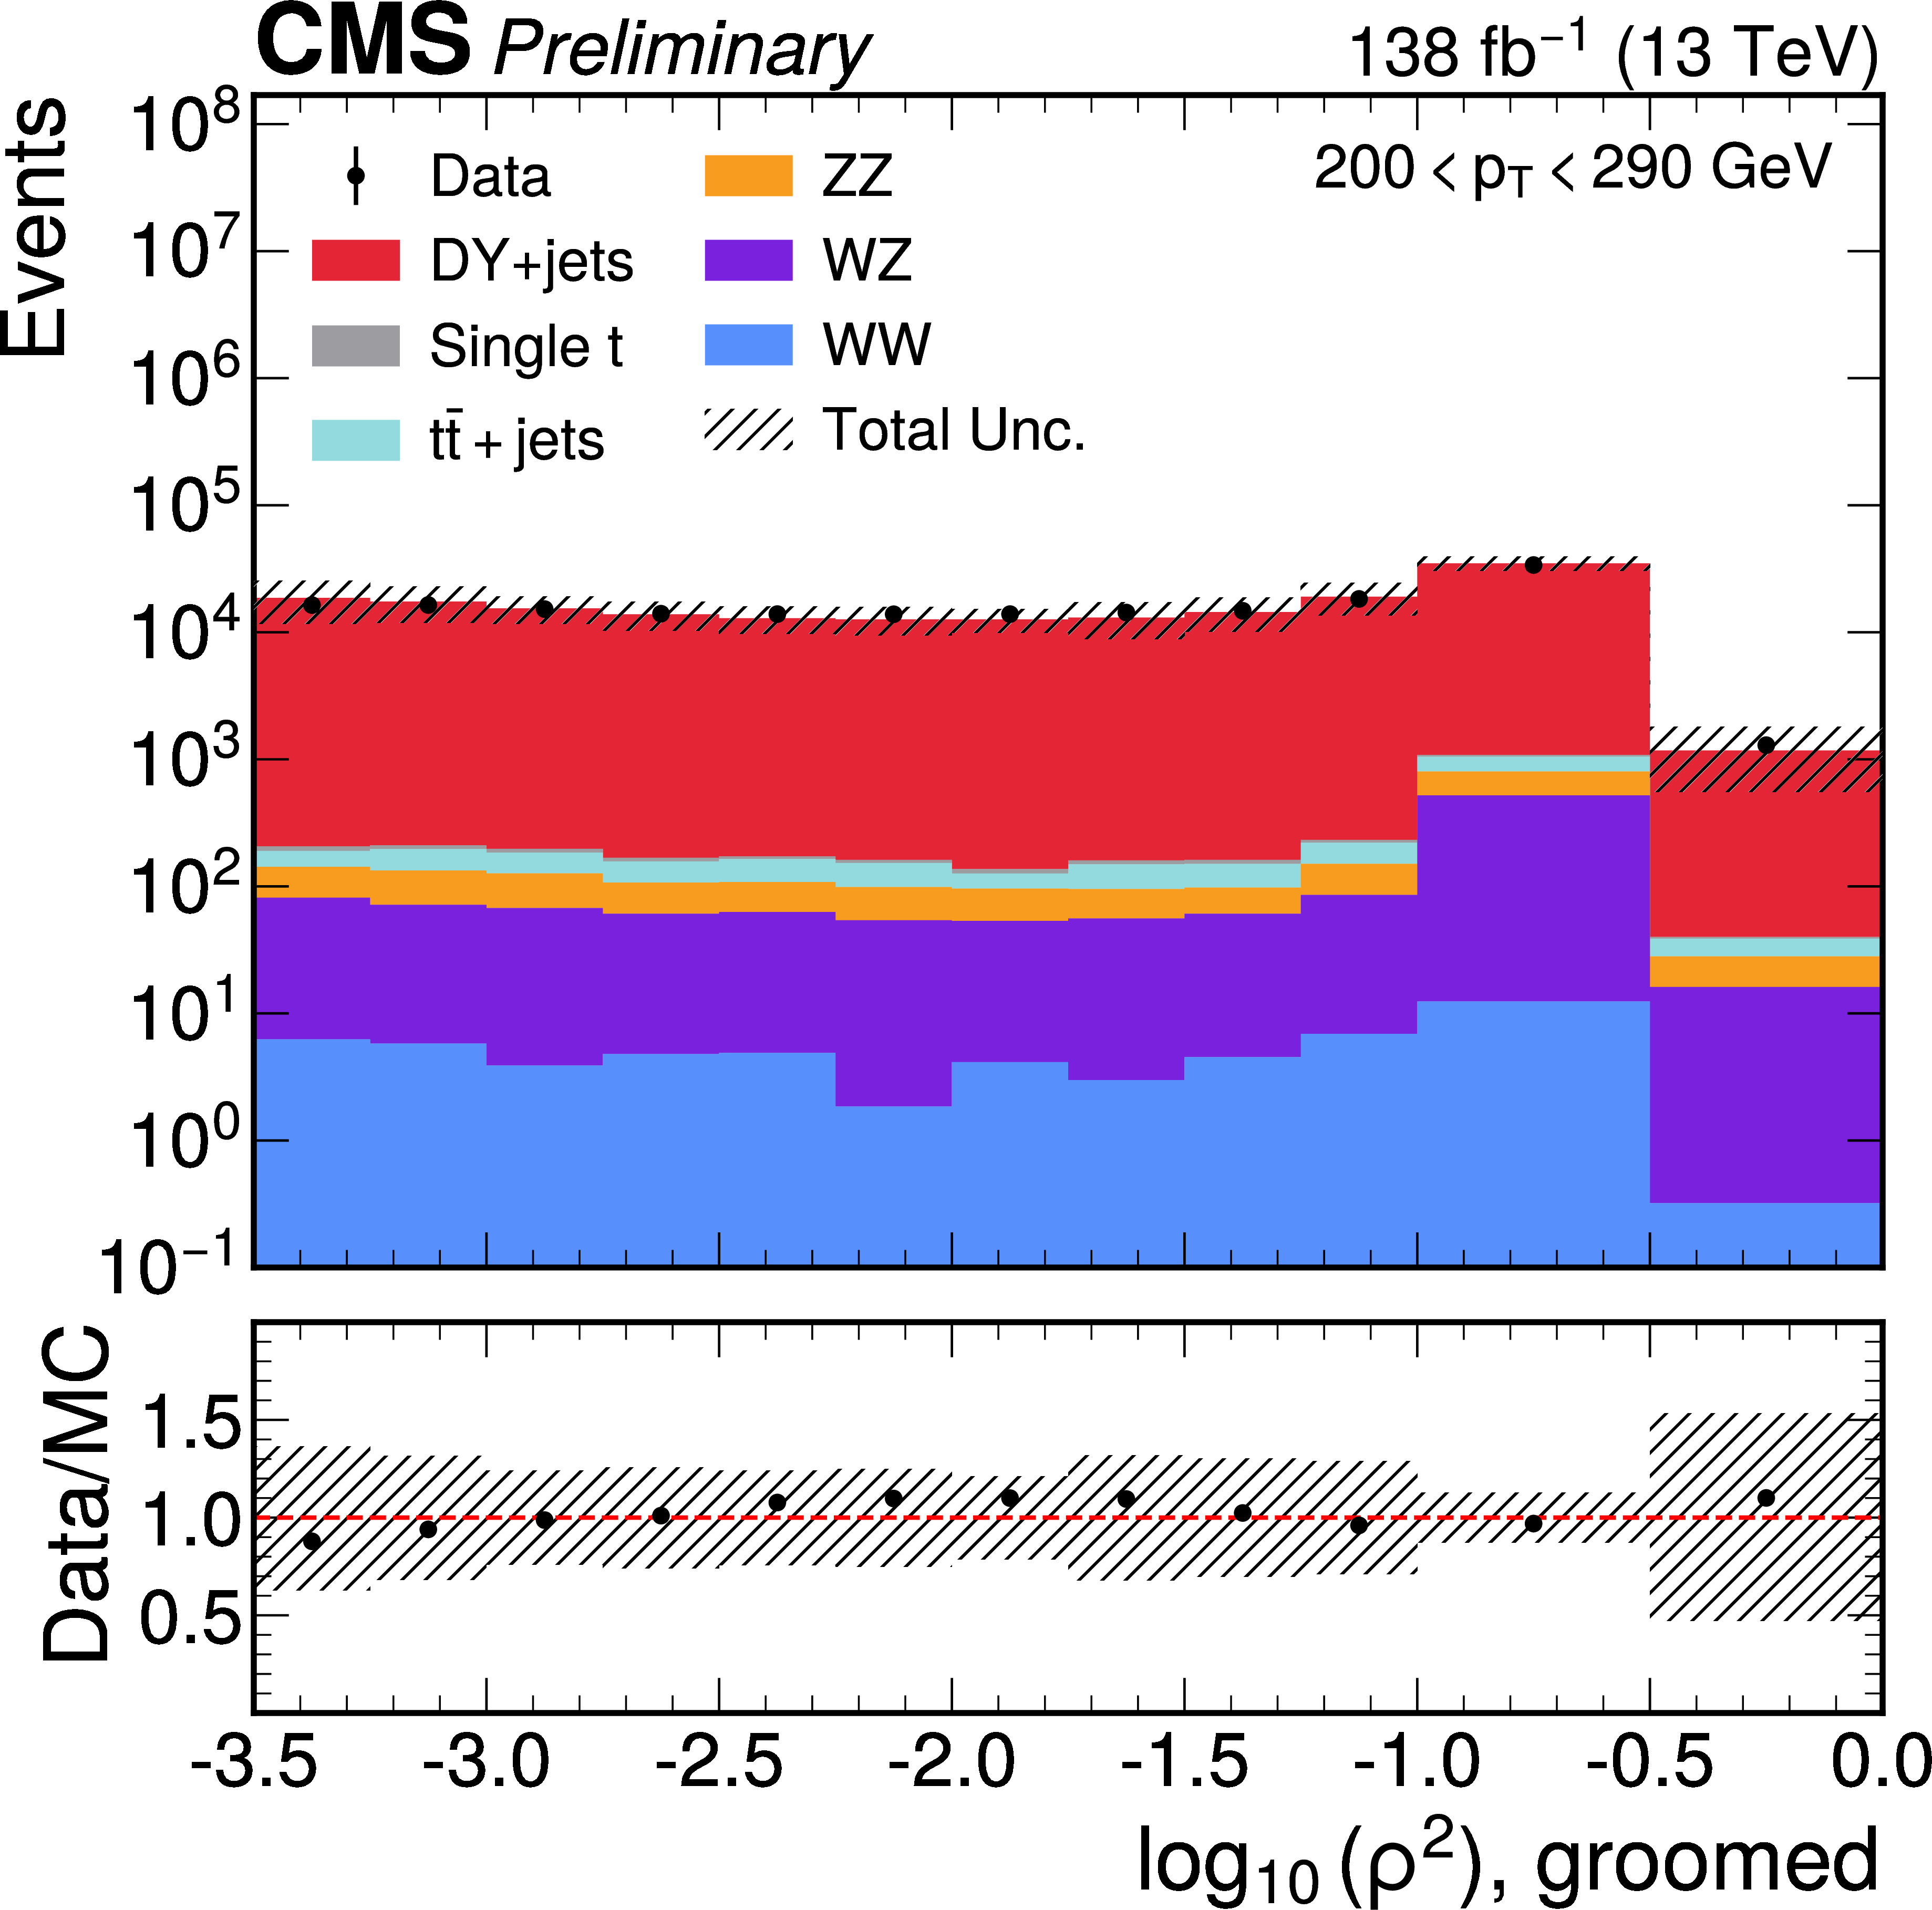
Figure 2-b:
Detector-level data and simulation distributions in the 200 $ < p_{\mathrm{T}} < $ 290 GeV bin for the ungroomed (left) and groomed (right) observables. The points show data, and the stacked histograms show the simulated Drell--Yan signal and the contributions from top quark, single top quark, and diboson backgrounds. The hatched bands show the total uncertainty in the simulation, i.e., the statistical and experimental systematic uncertainties added in quadrature. The lower panels show the ratios of the data to the simulation. |
png pdf |
Figure 3:
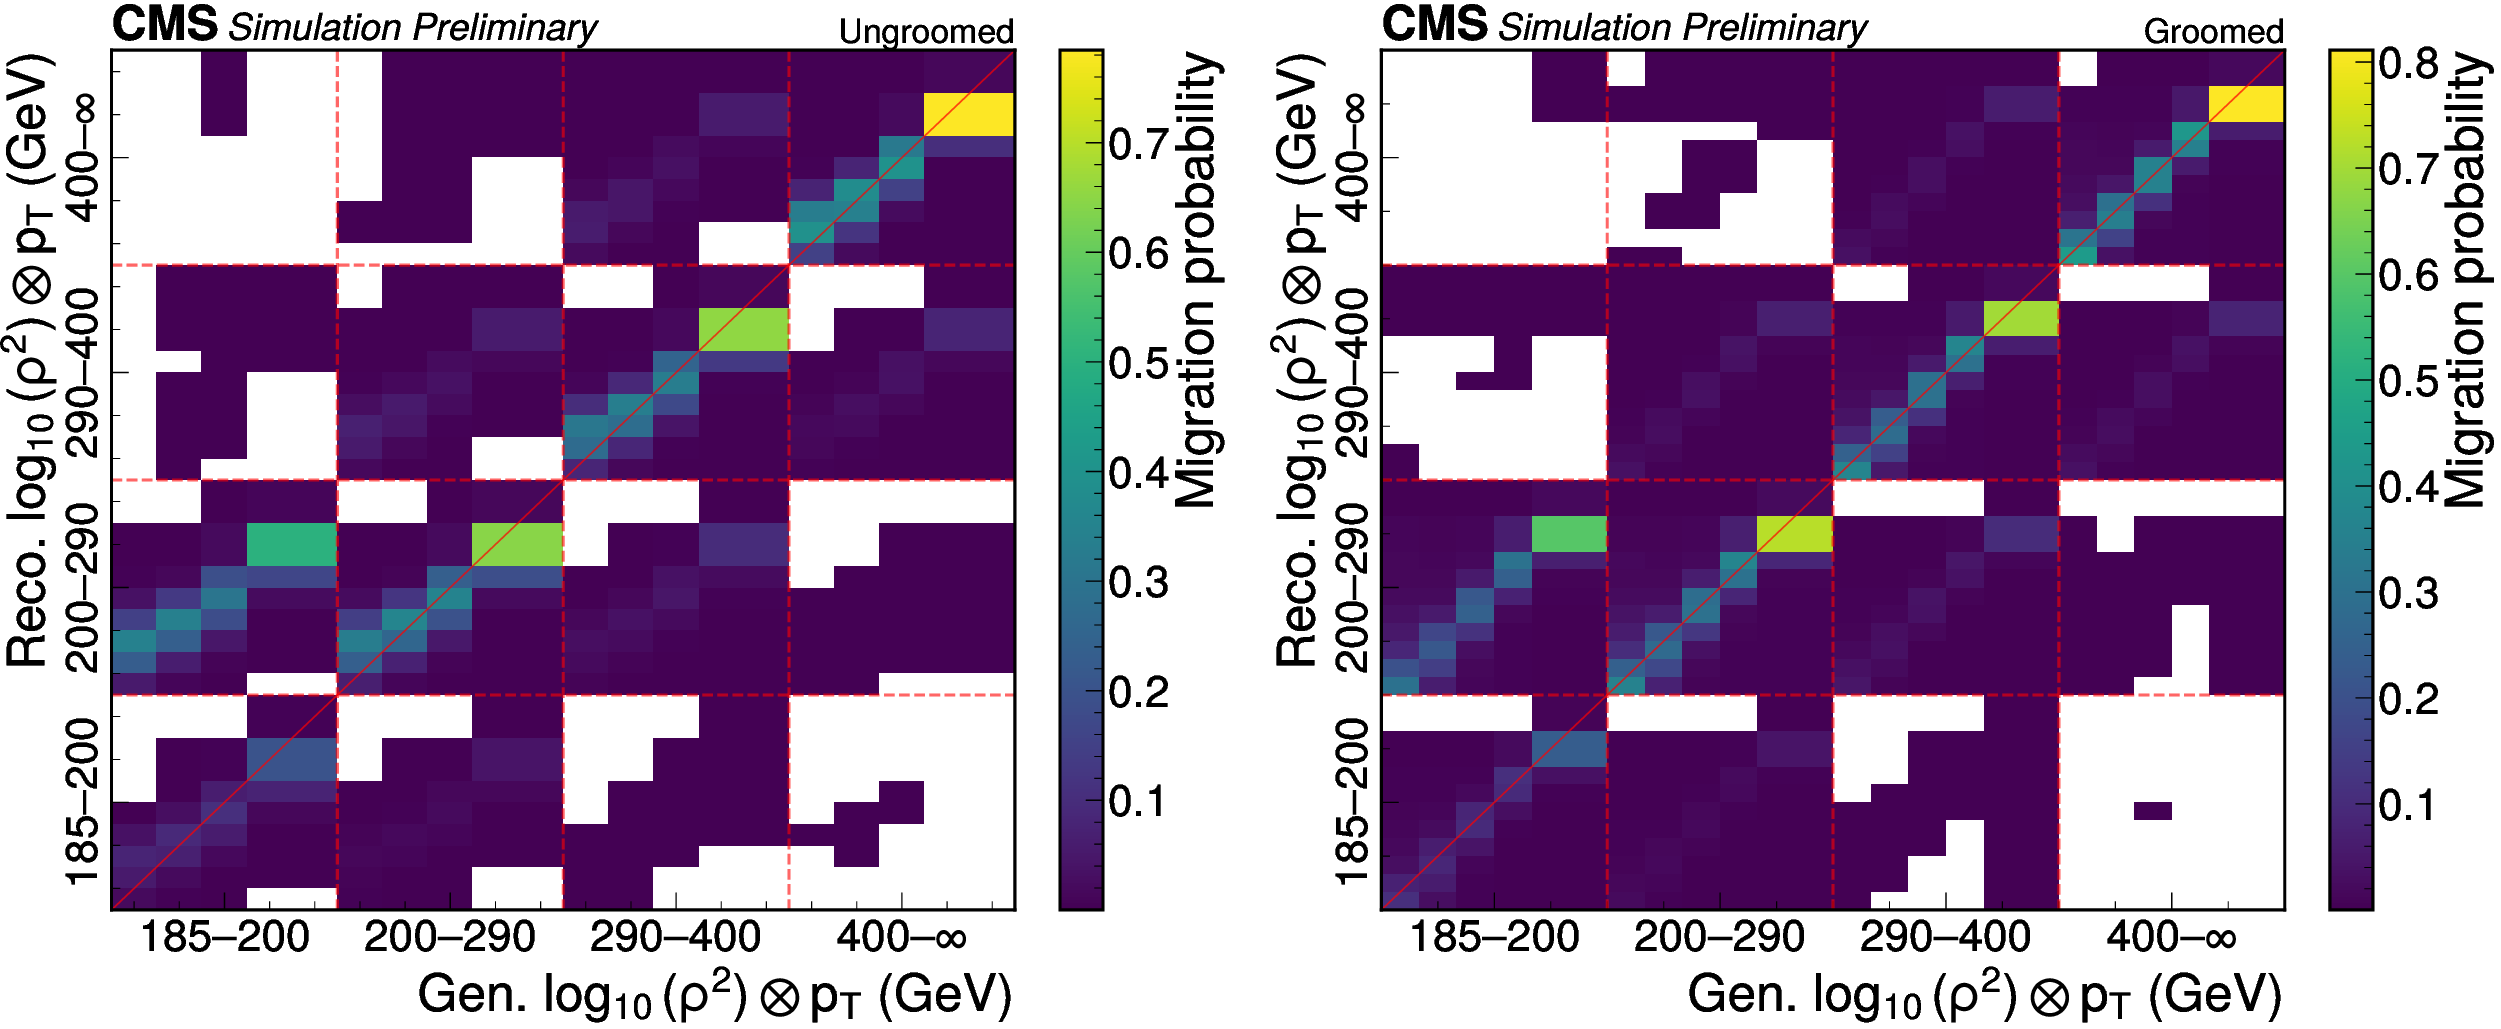
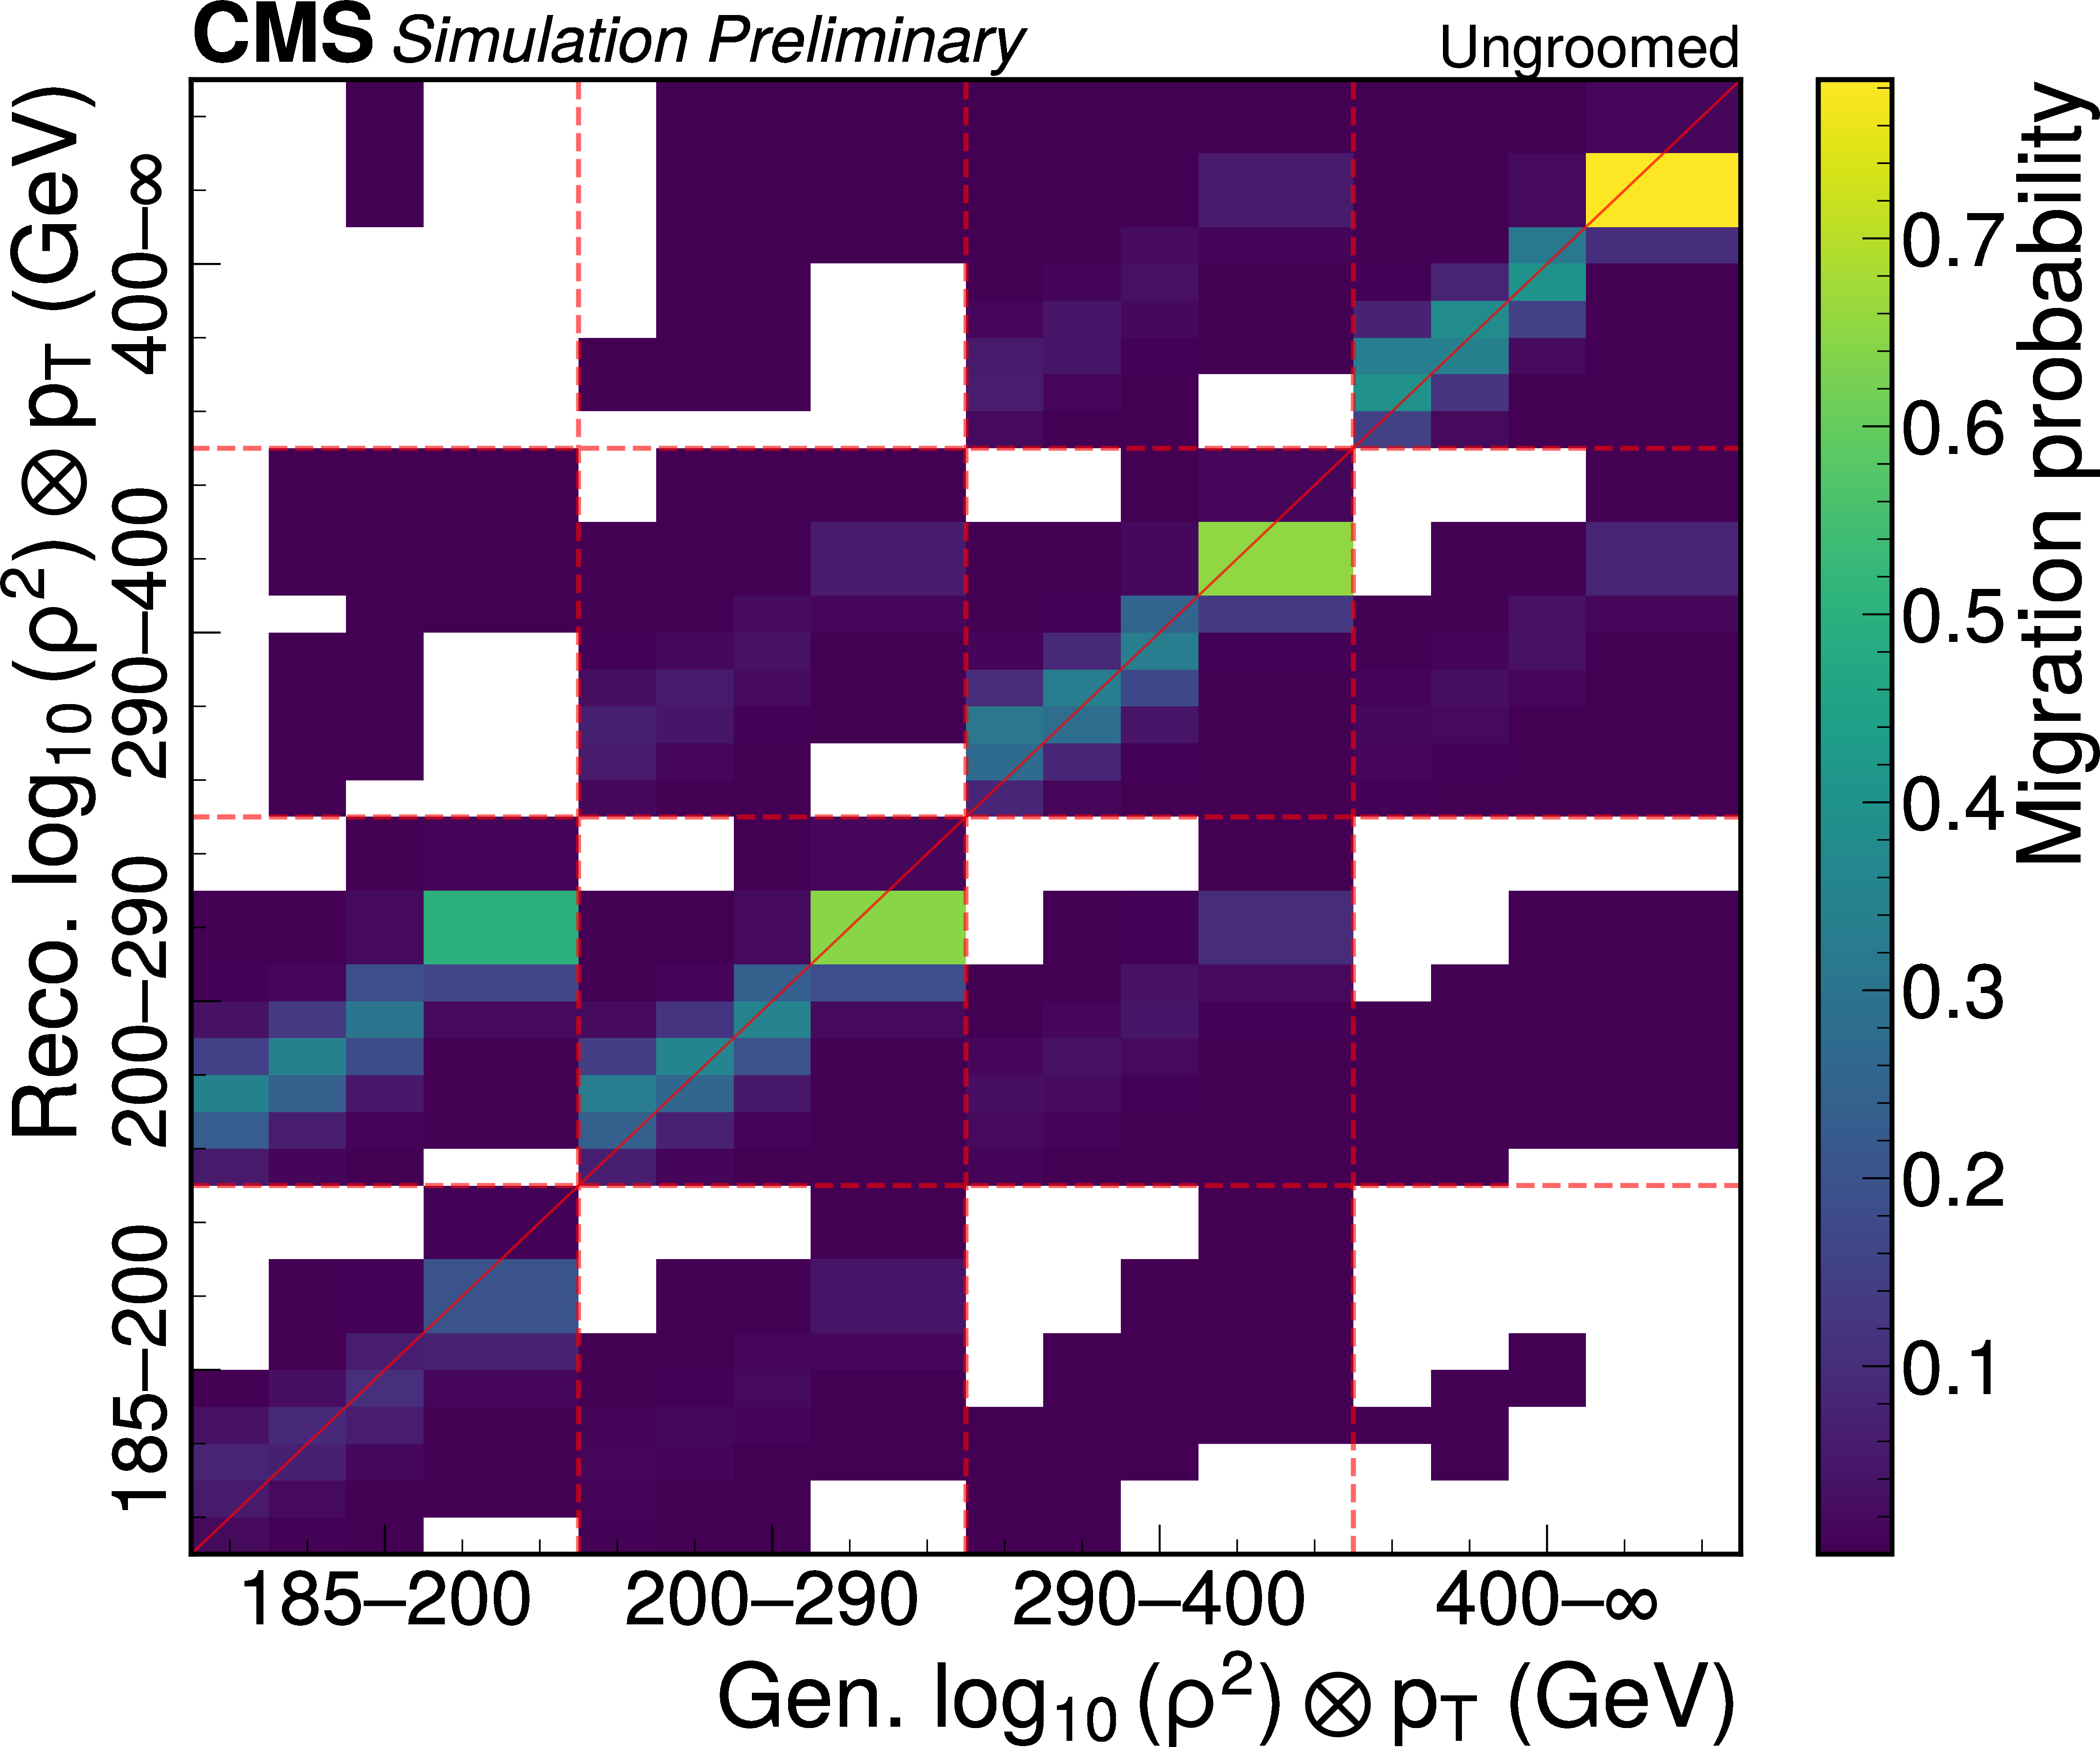
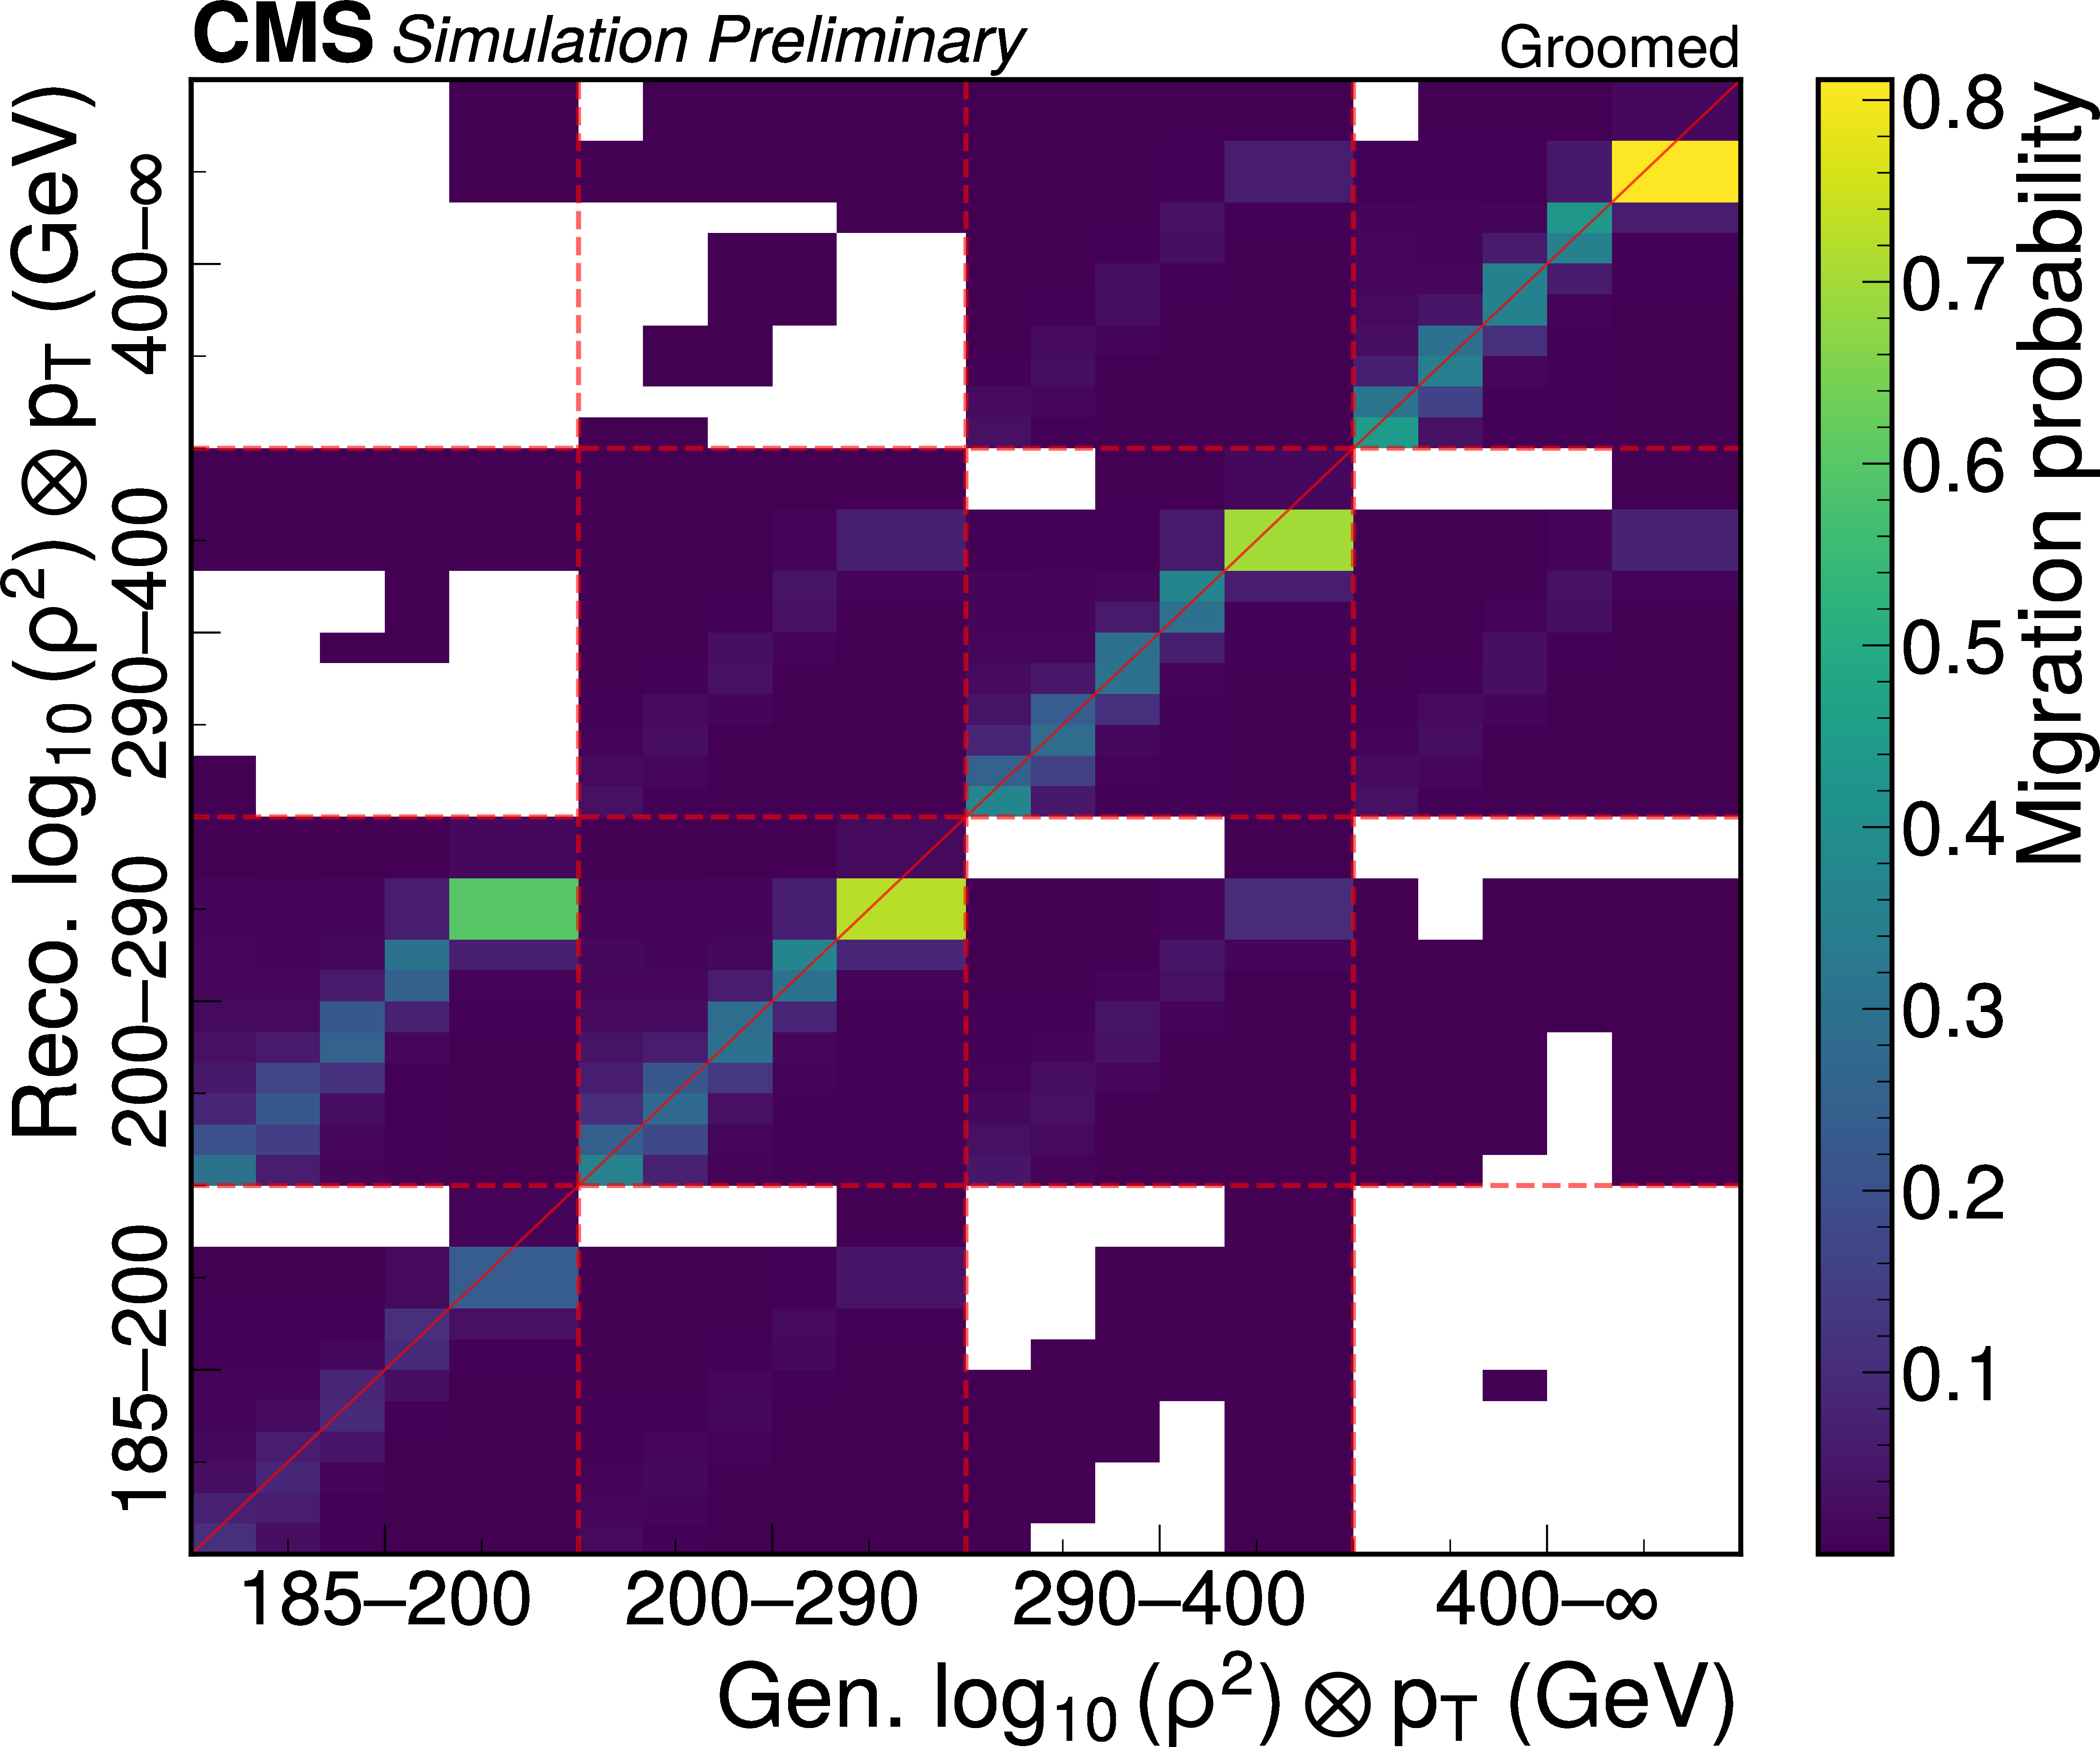
Detector response matrices for the ungroomed and groomed observables, shown on the left and right, respectively. The reconstructed and particle-level observable bins are grouped by jet $ p_{\mathrm{T}} $. The 185 $ < p_{\mathrm{T}} < $ 200 GeV blocks retain migrations across the analysis threshold. |
png pdf |
Figure 3-a:
Detector response matrices for the ungroomed and groomed observables, shown on the left and right, respectively. The reconstructed and particle-level observable bins are grouped by jet $ p_{\mathrm{T}} $. The 185 $ < p_{\mathrm{T}} < $ 200 GeV blocks retain migrations across the analysis threshold. |
png pdf |
Figure 3-b:
Detector response matrices for the ungroomed and groomed observables, shown on the left and right, respectively. The reconstructed and particle-level observable bins are grouped by jet $ p_{\mathrm{T}} $. The 185 $ < p_{\mathrm{T}} < $ 200 GeV blocks retain migrations across the analysis threshold. |
png pdf |
Figure 4:
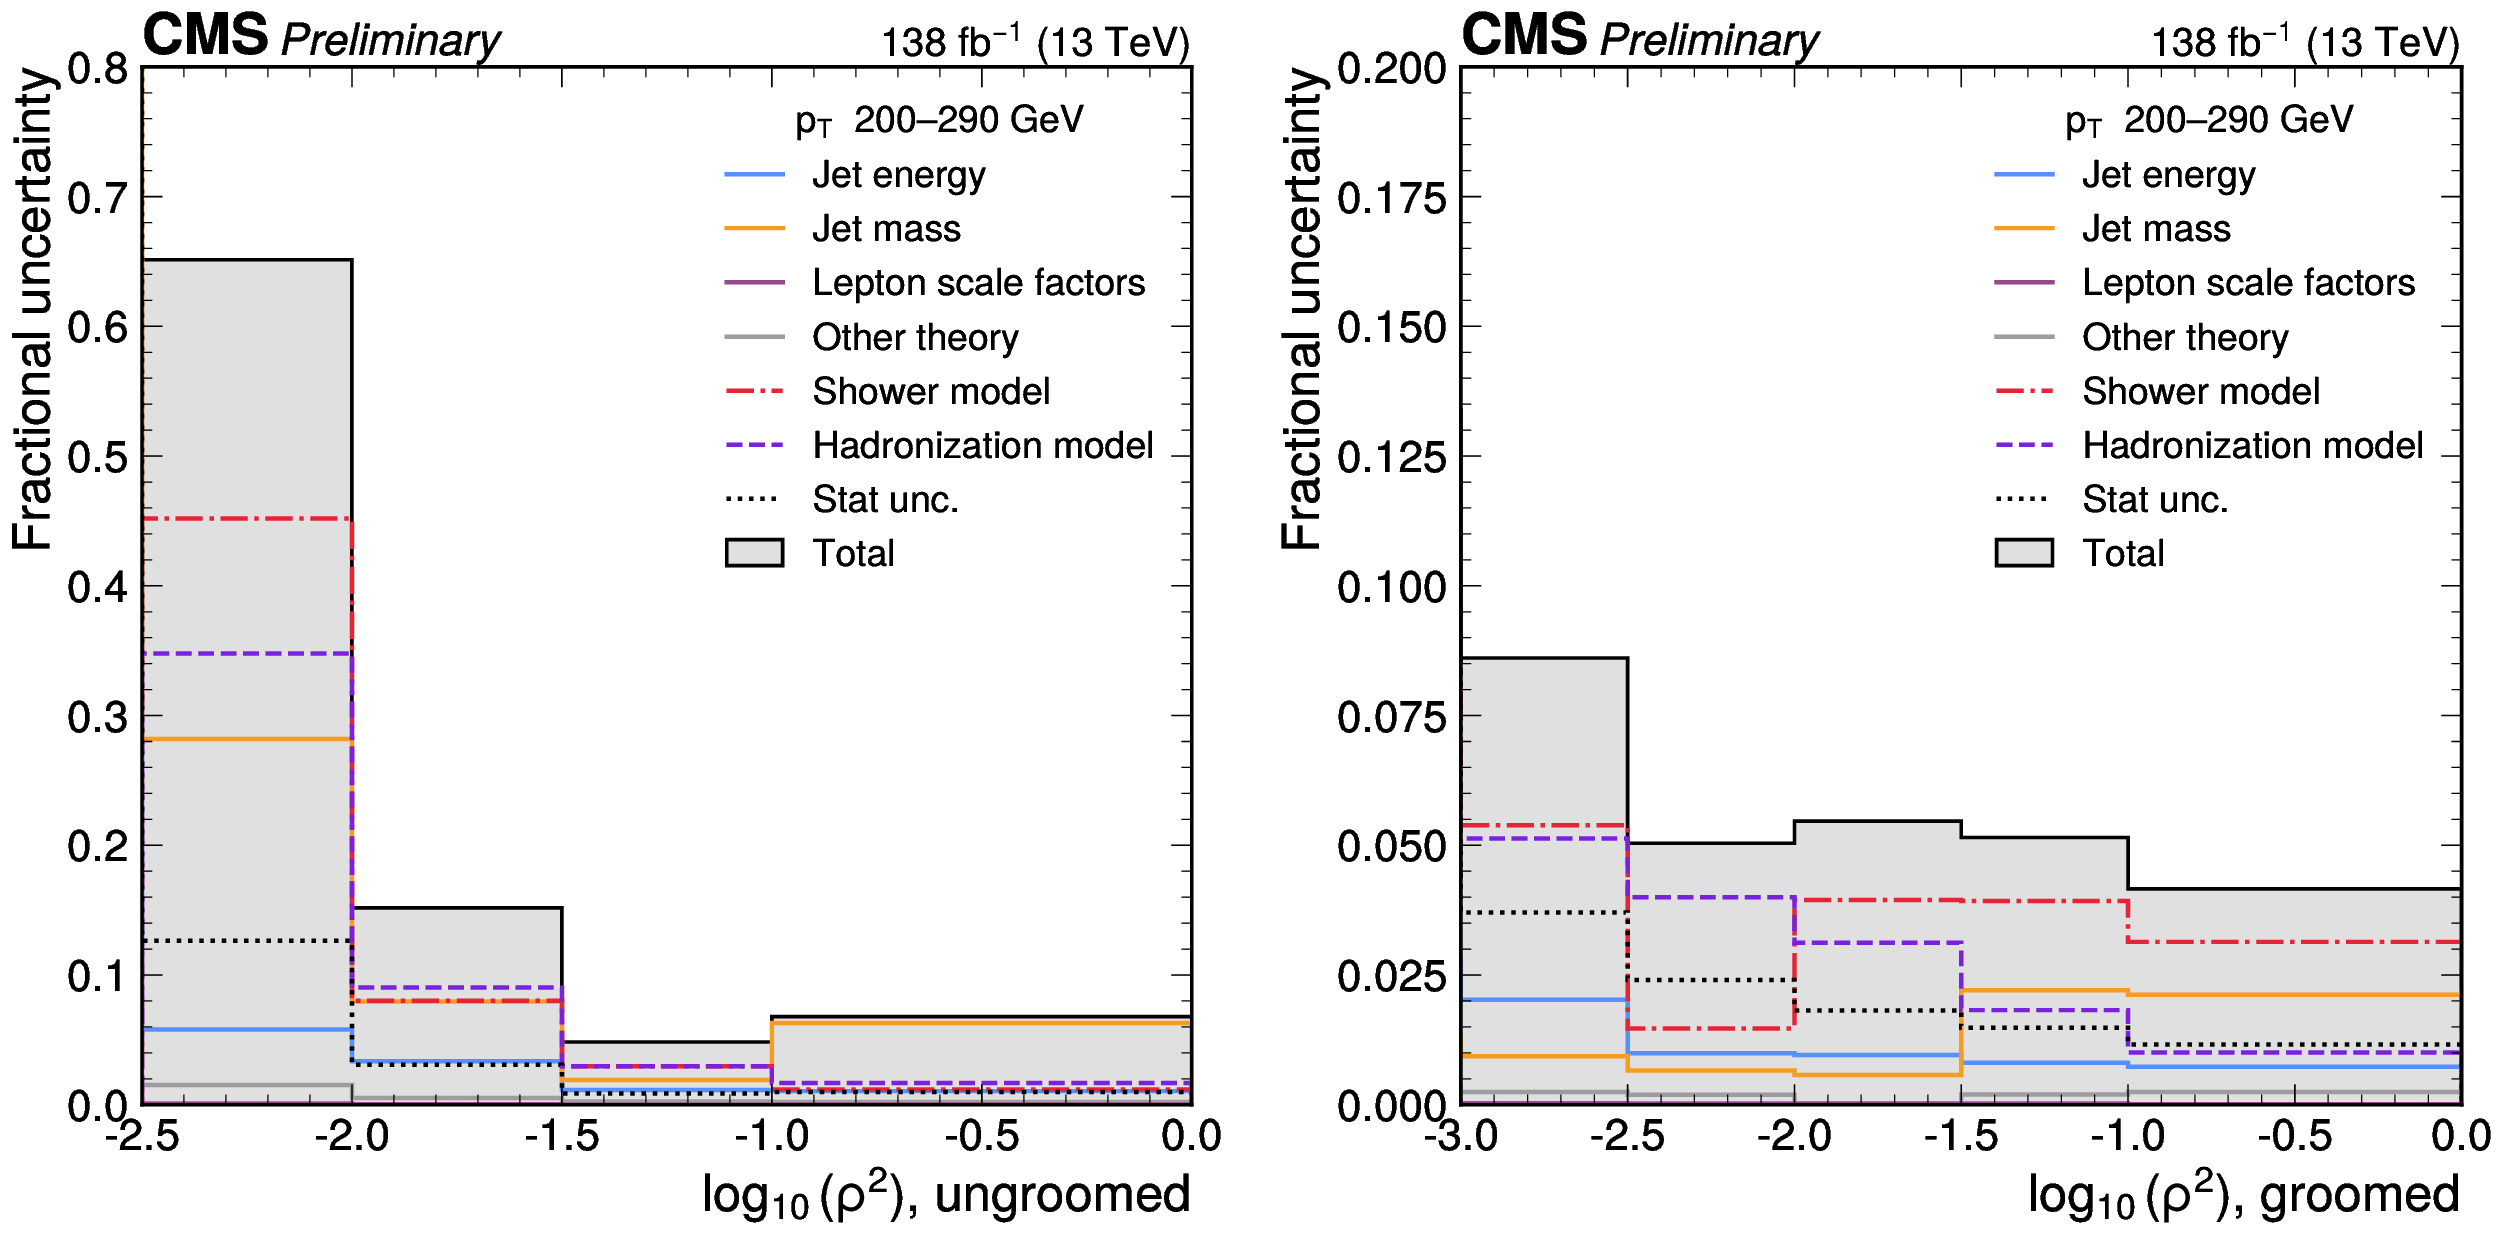
Grouped fractional uncertainties in the normalized unfolded ungroomed (left) and groomed (right) distributions for the 200 $ < p_{\mathrm{T}} < $ 290 GeV interval. The black line shows the total uncertainty. Where the total uncertainty exceeds the axis range, its value is given as a number in the corresponding bin. |
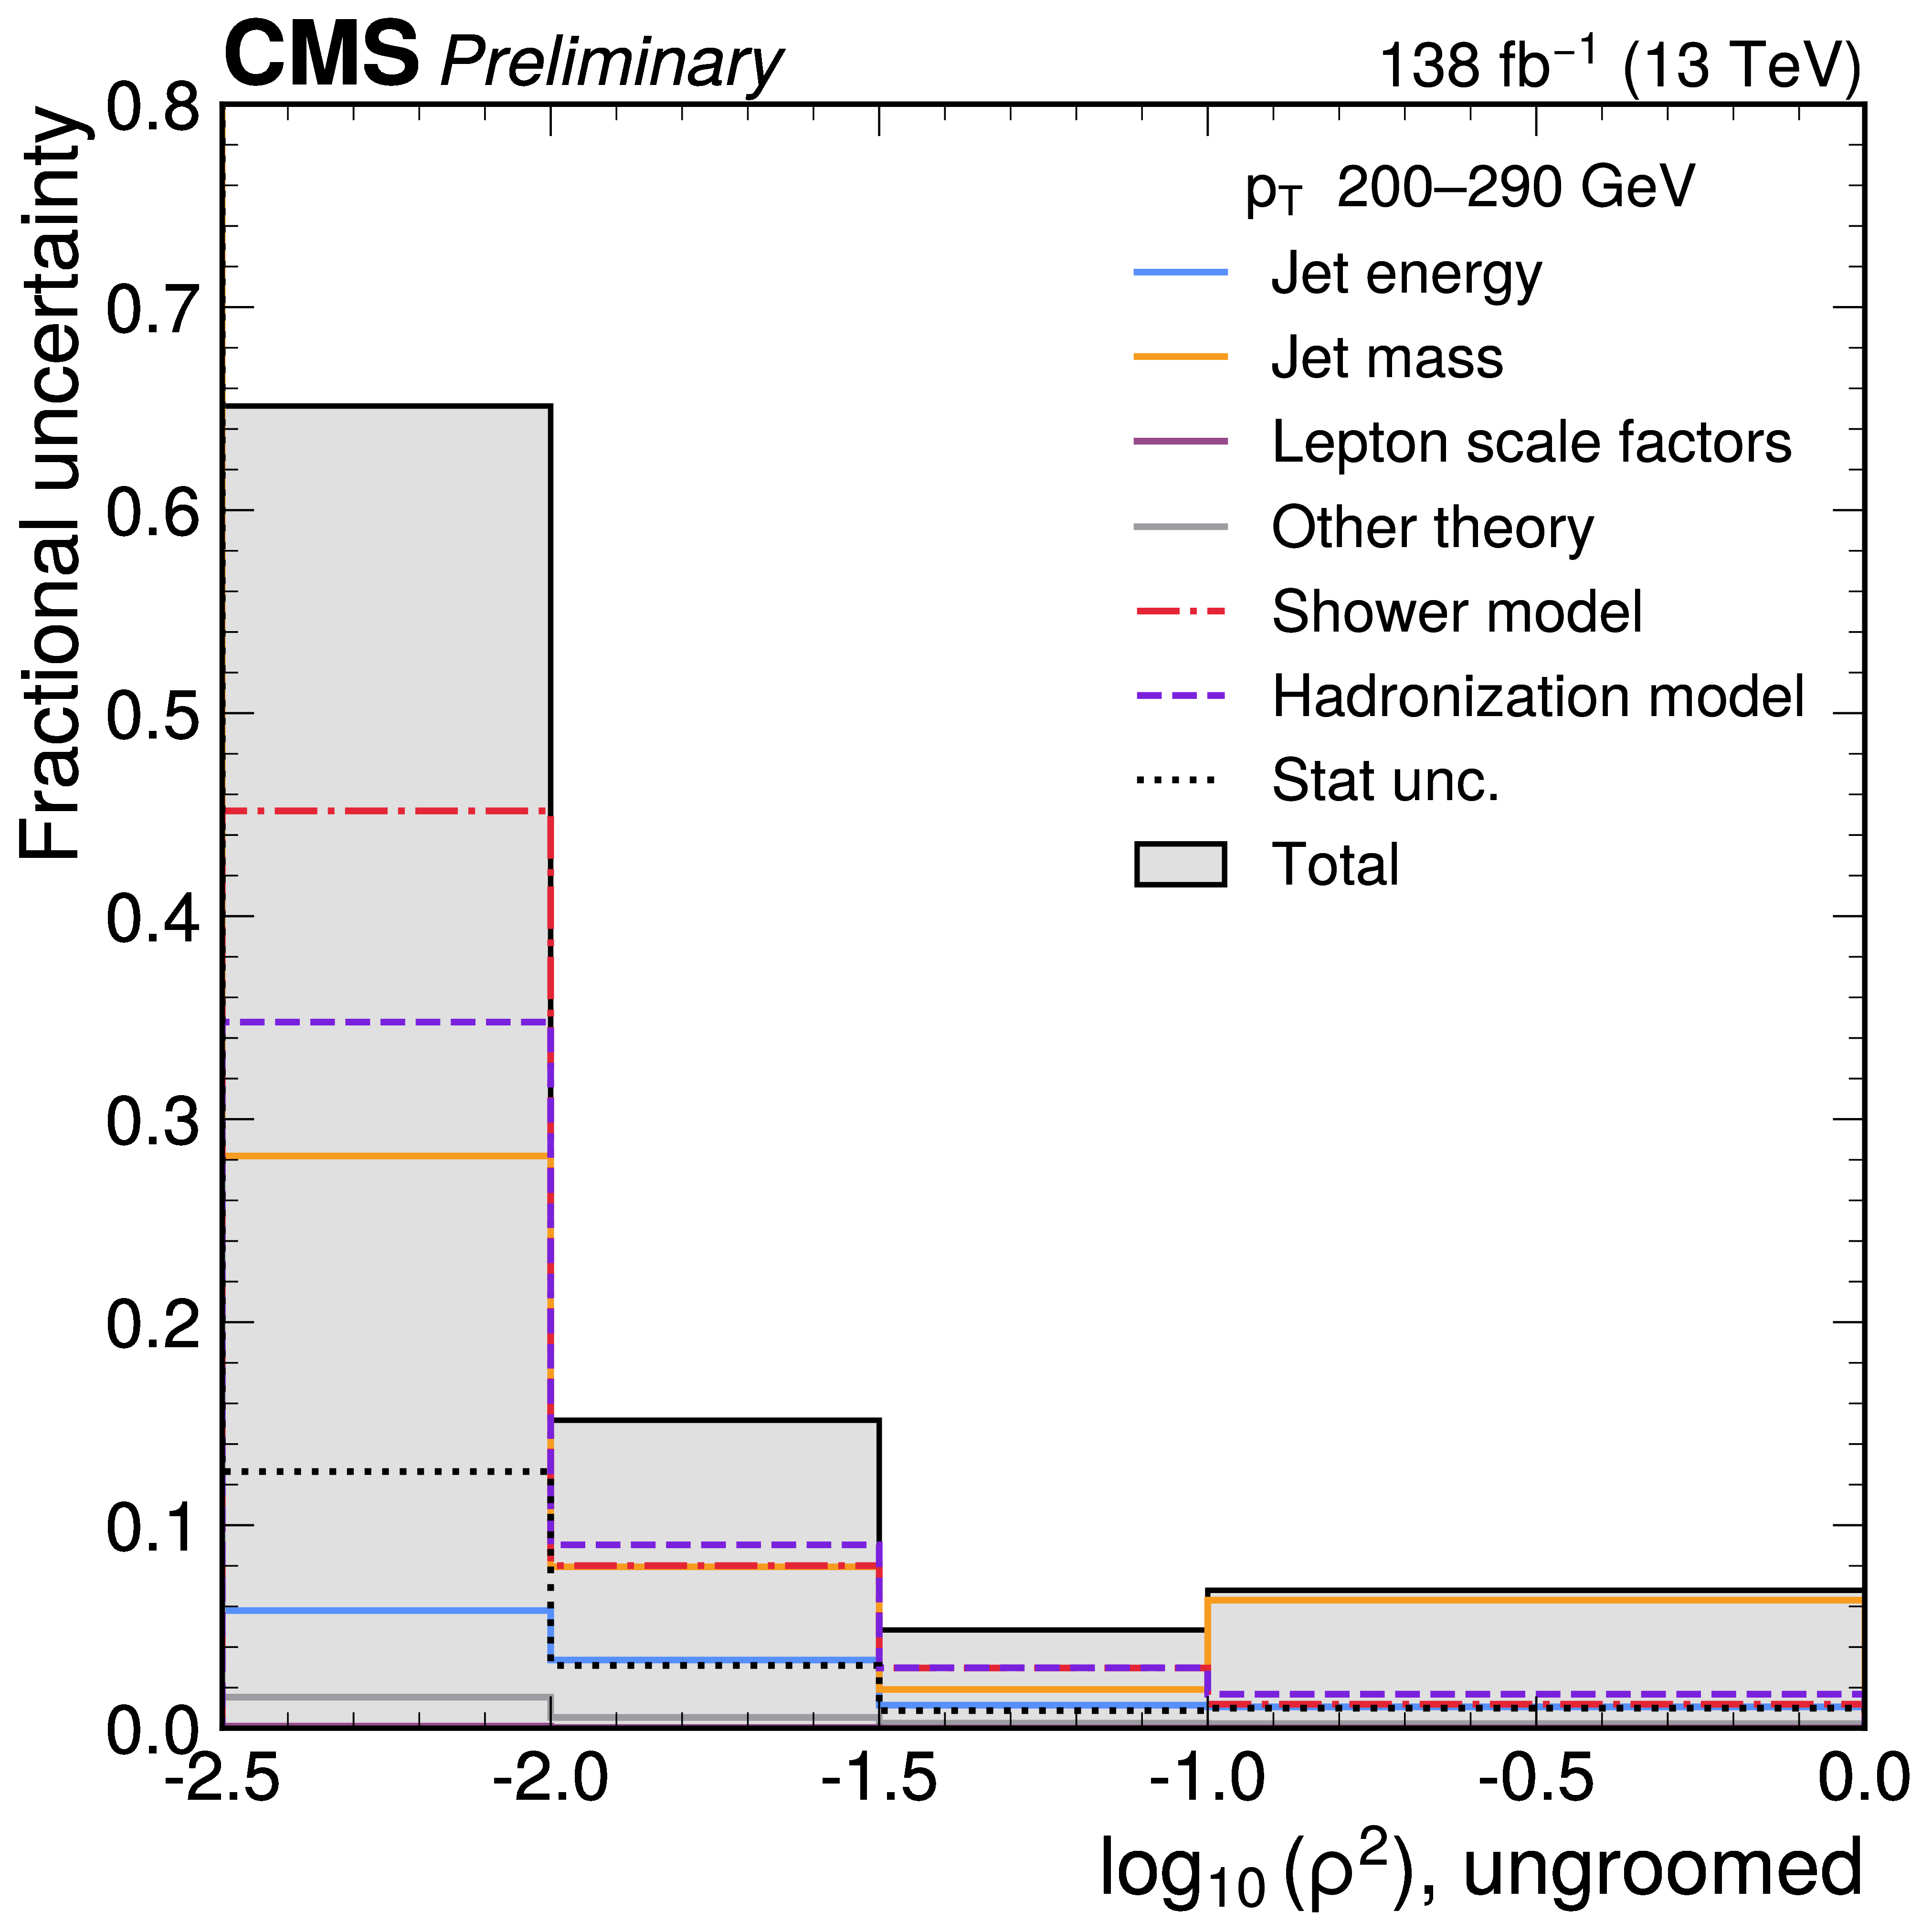
png pdf |
Figure 4-a:
Grouped fractional uncertainties in the normalized unfolded ungroomed (left) and groomed (right) distributions for the 200 $ < p_{\mathrm{T}} < $ 290 GeV interval. The black line shows the total uncertainty. Where the total uncertainty exceeds the axis range, its value is given as a number in the corresponding bin. |
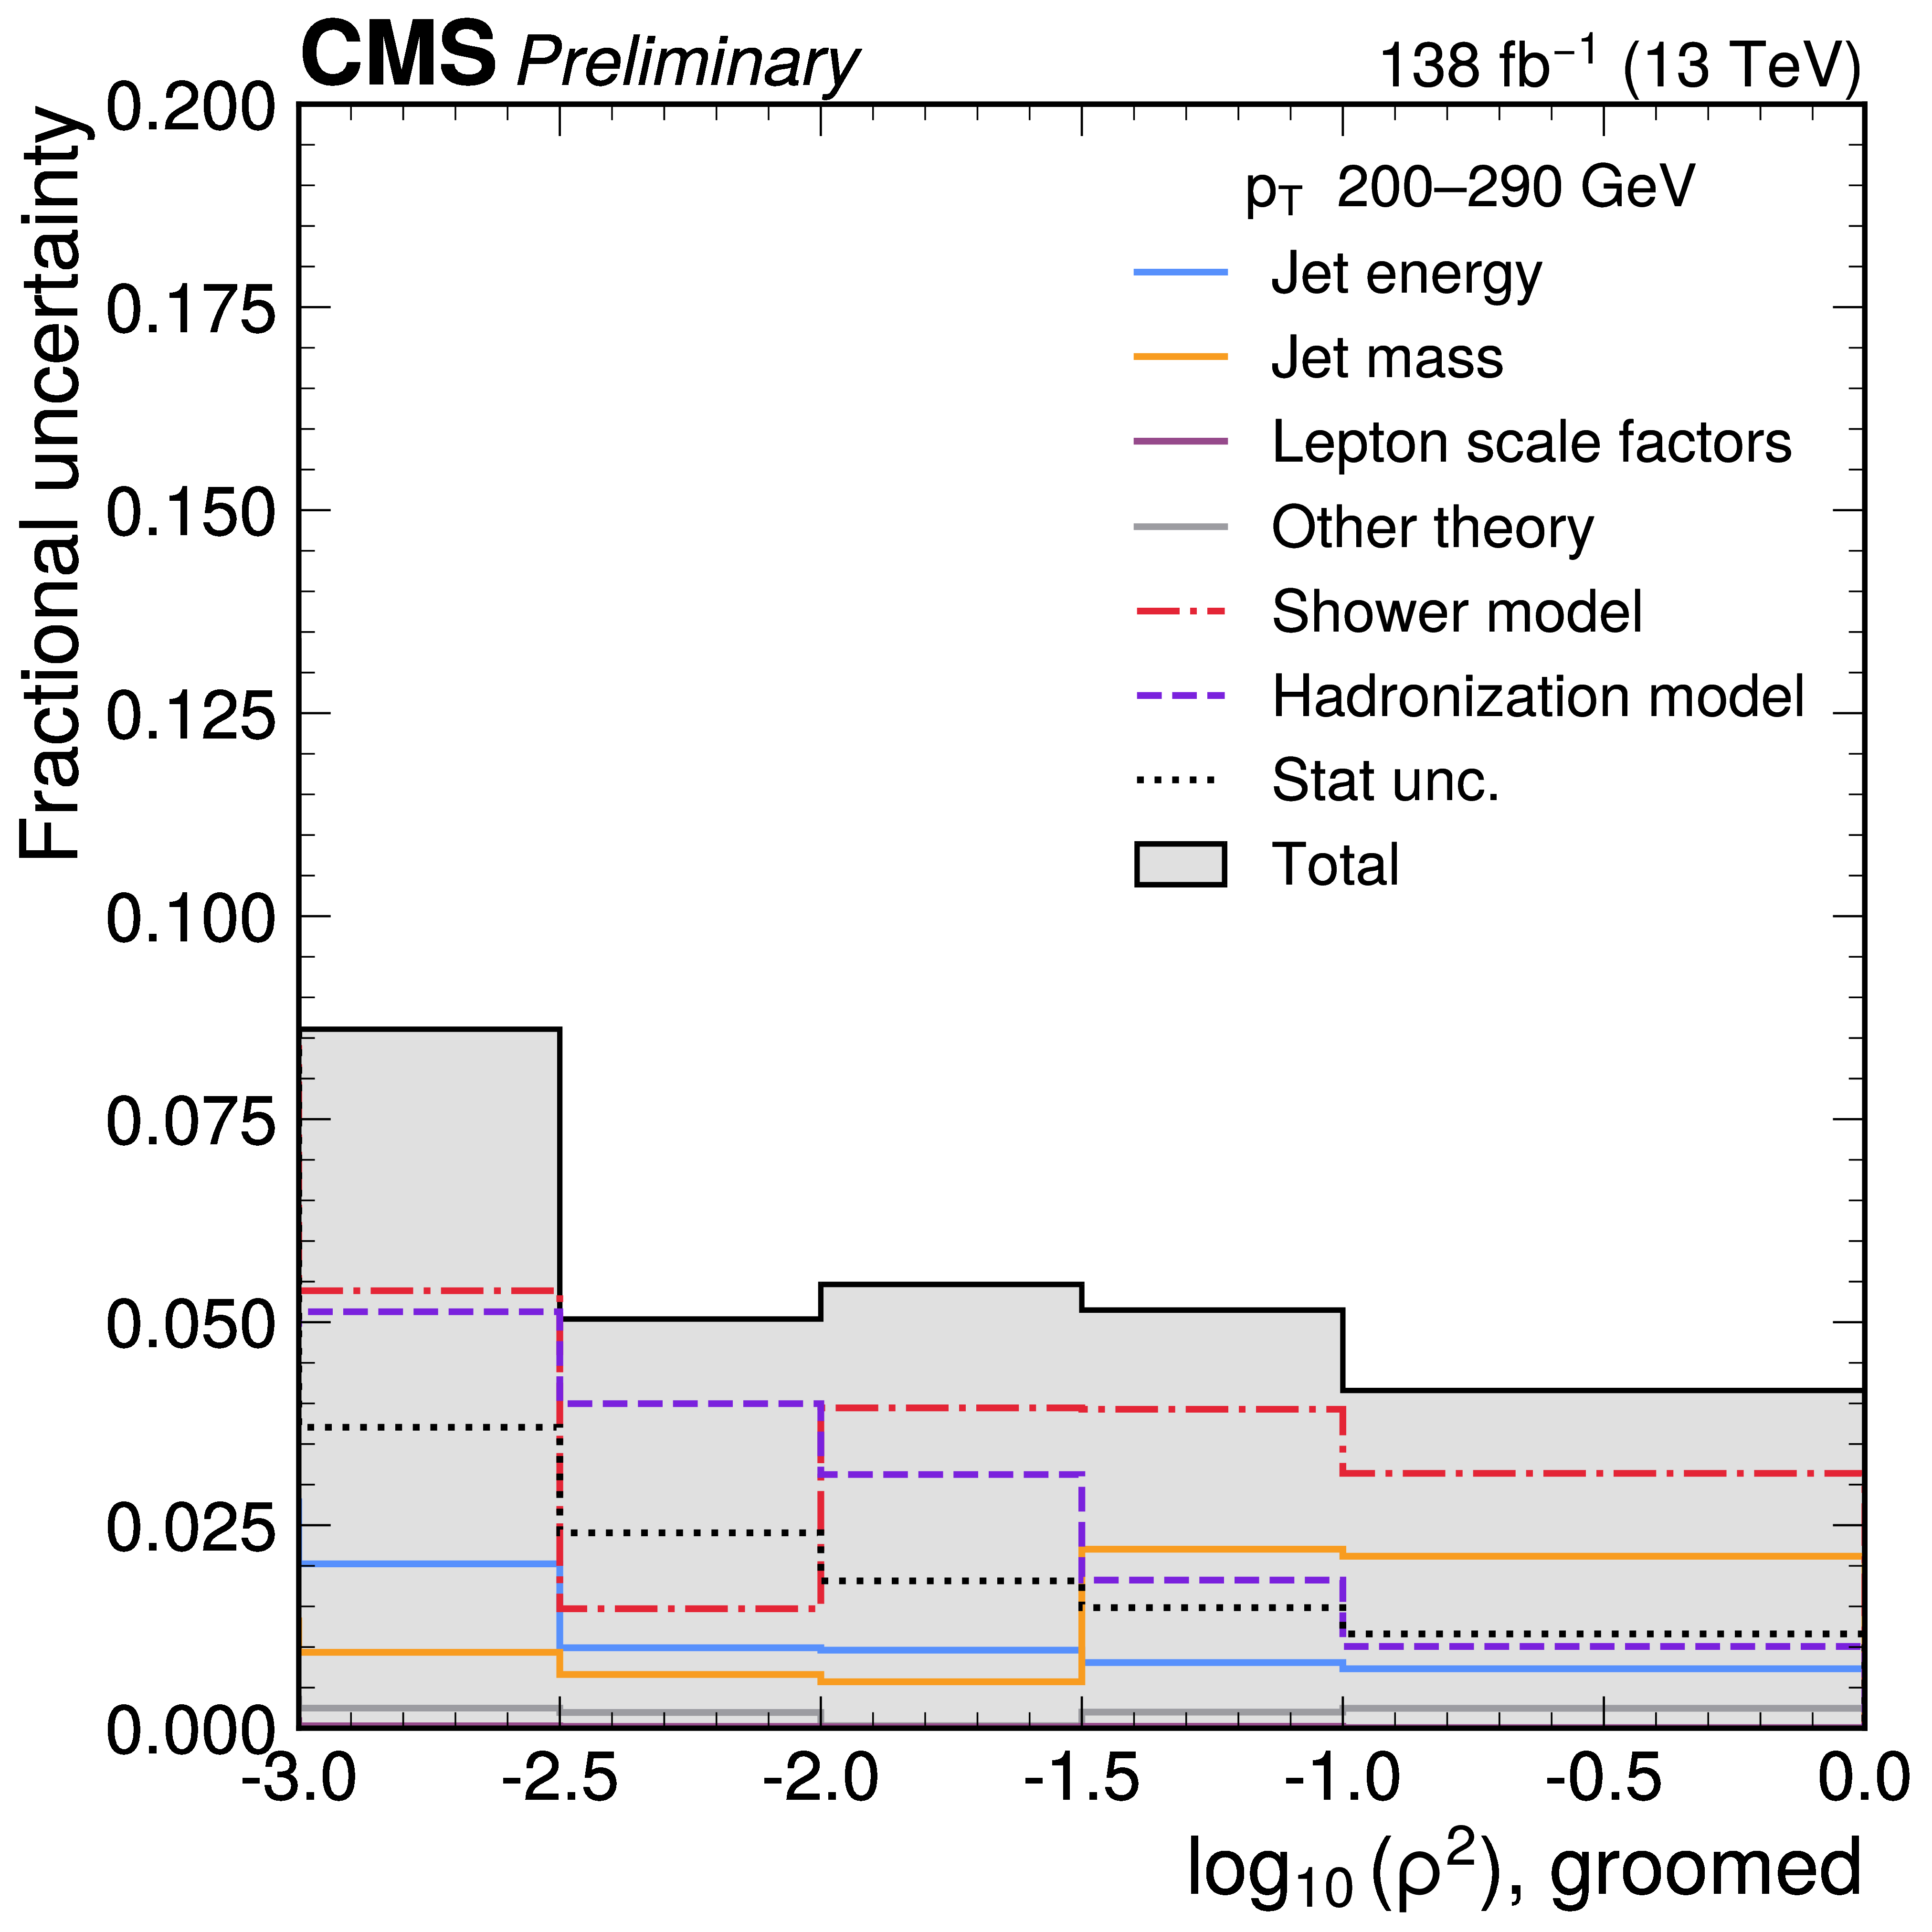
png pdf |
Figure 4-b:
Grouped fractional uncertainties in the normalized unfolded ungroomed (left) and groomed (right) distributions for the 200 $ < p_{\mathrm{T}} < $ 290 GeV interval. The black line shows the total uncertainty. Where the total uncertainty exceeds the axis range, its value is given as a number in the corresponding bin. |
png pdf |
Figure 5:
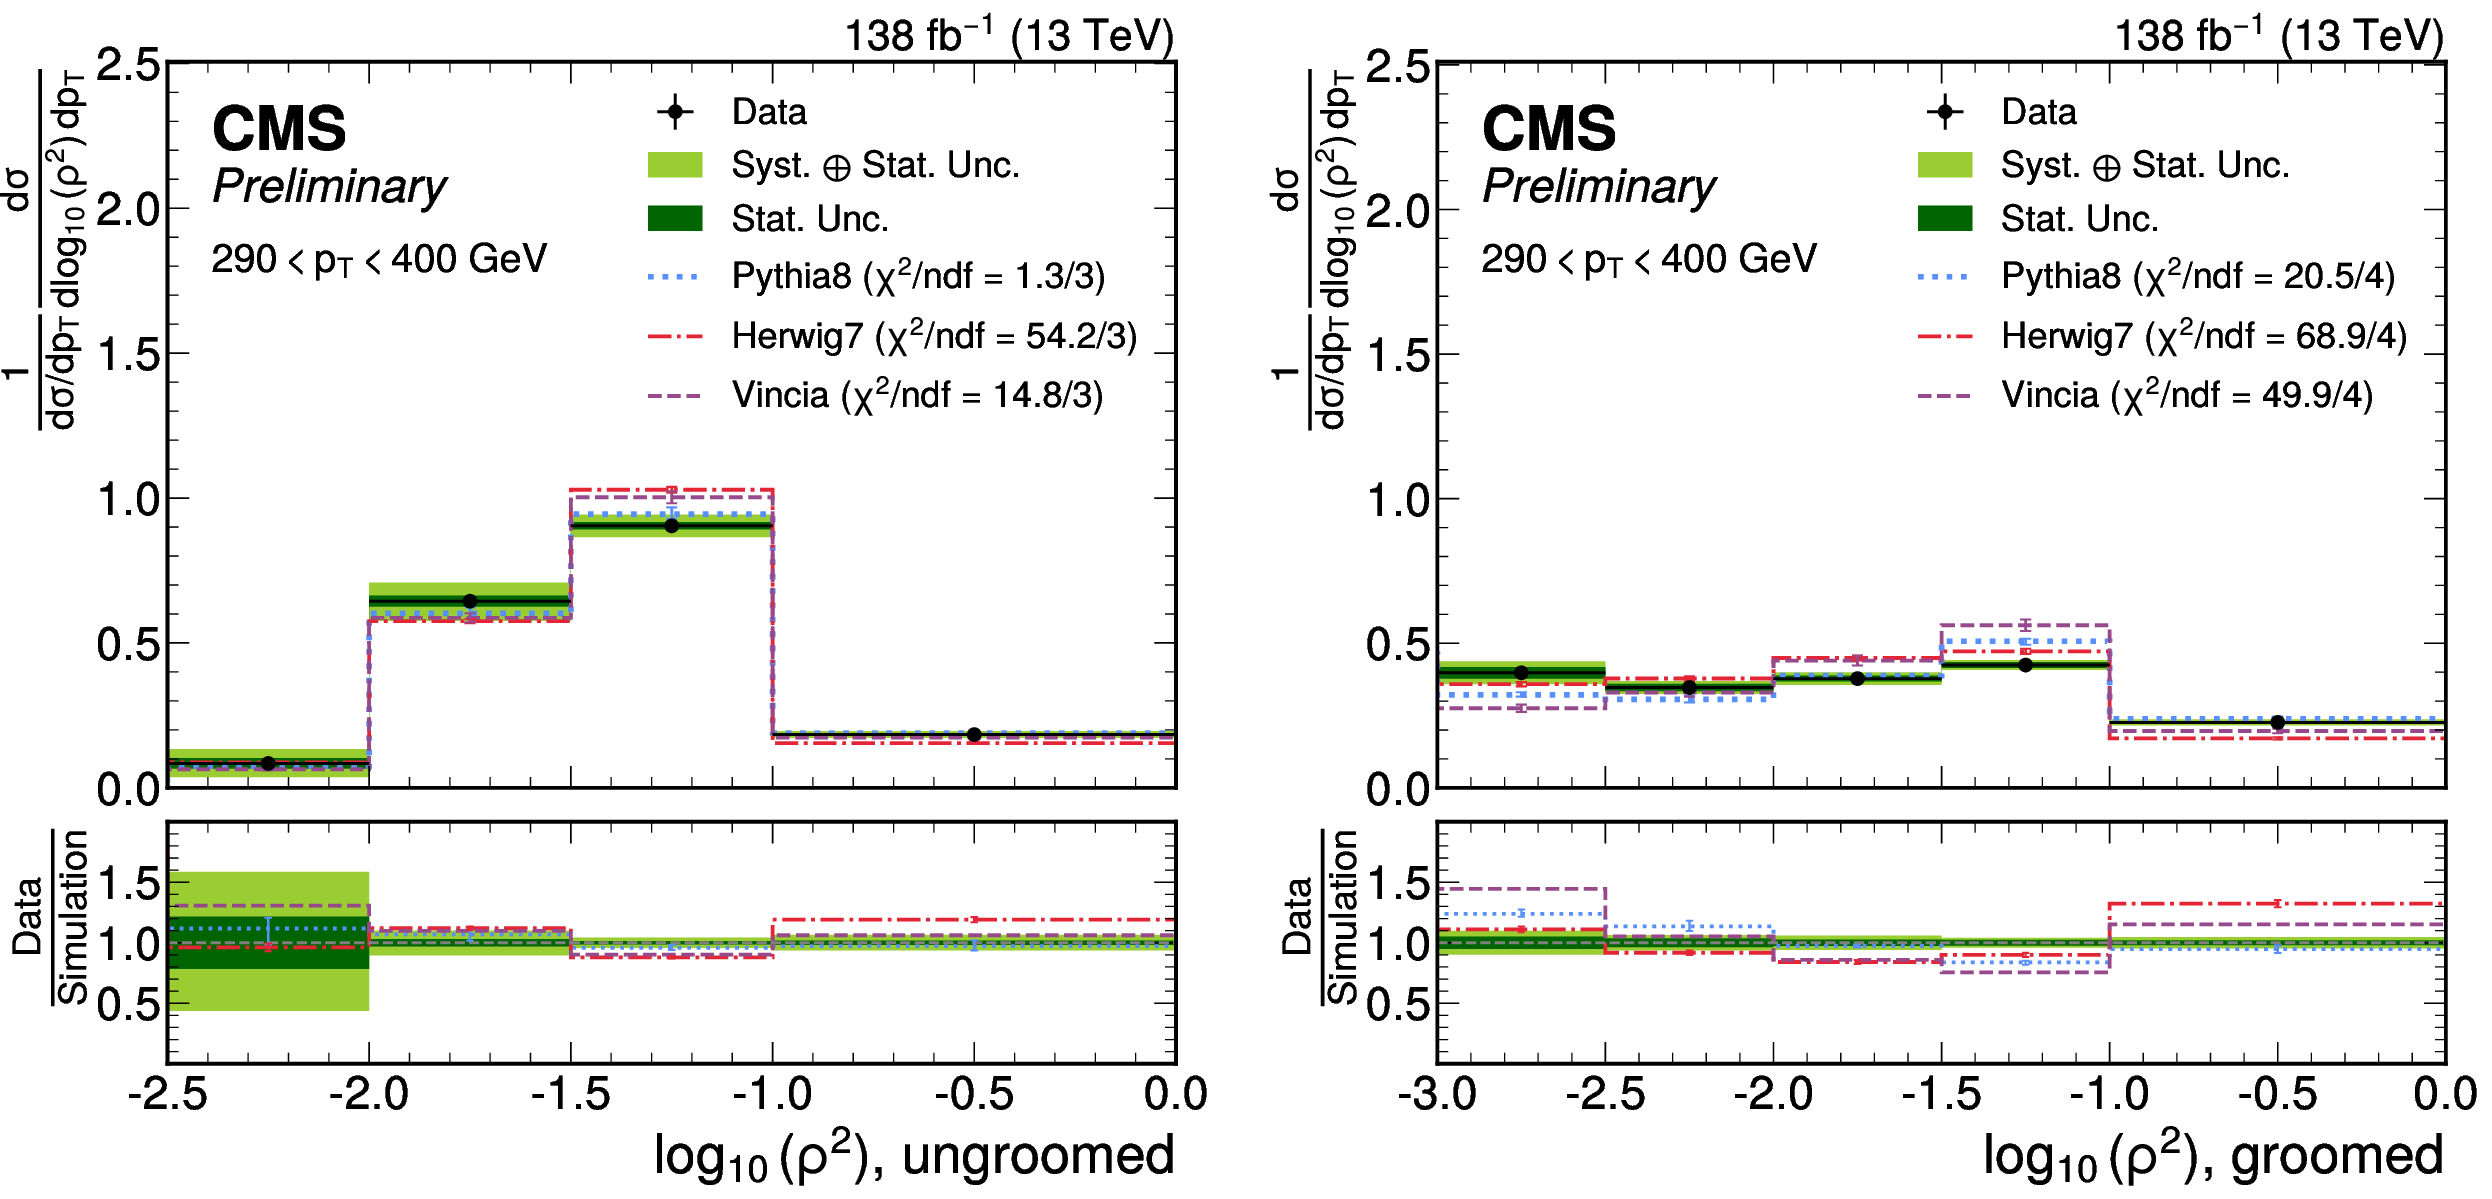
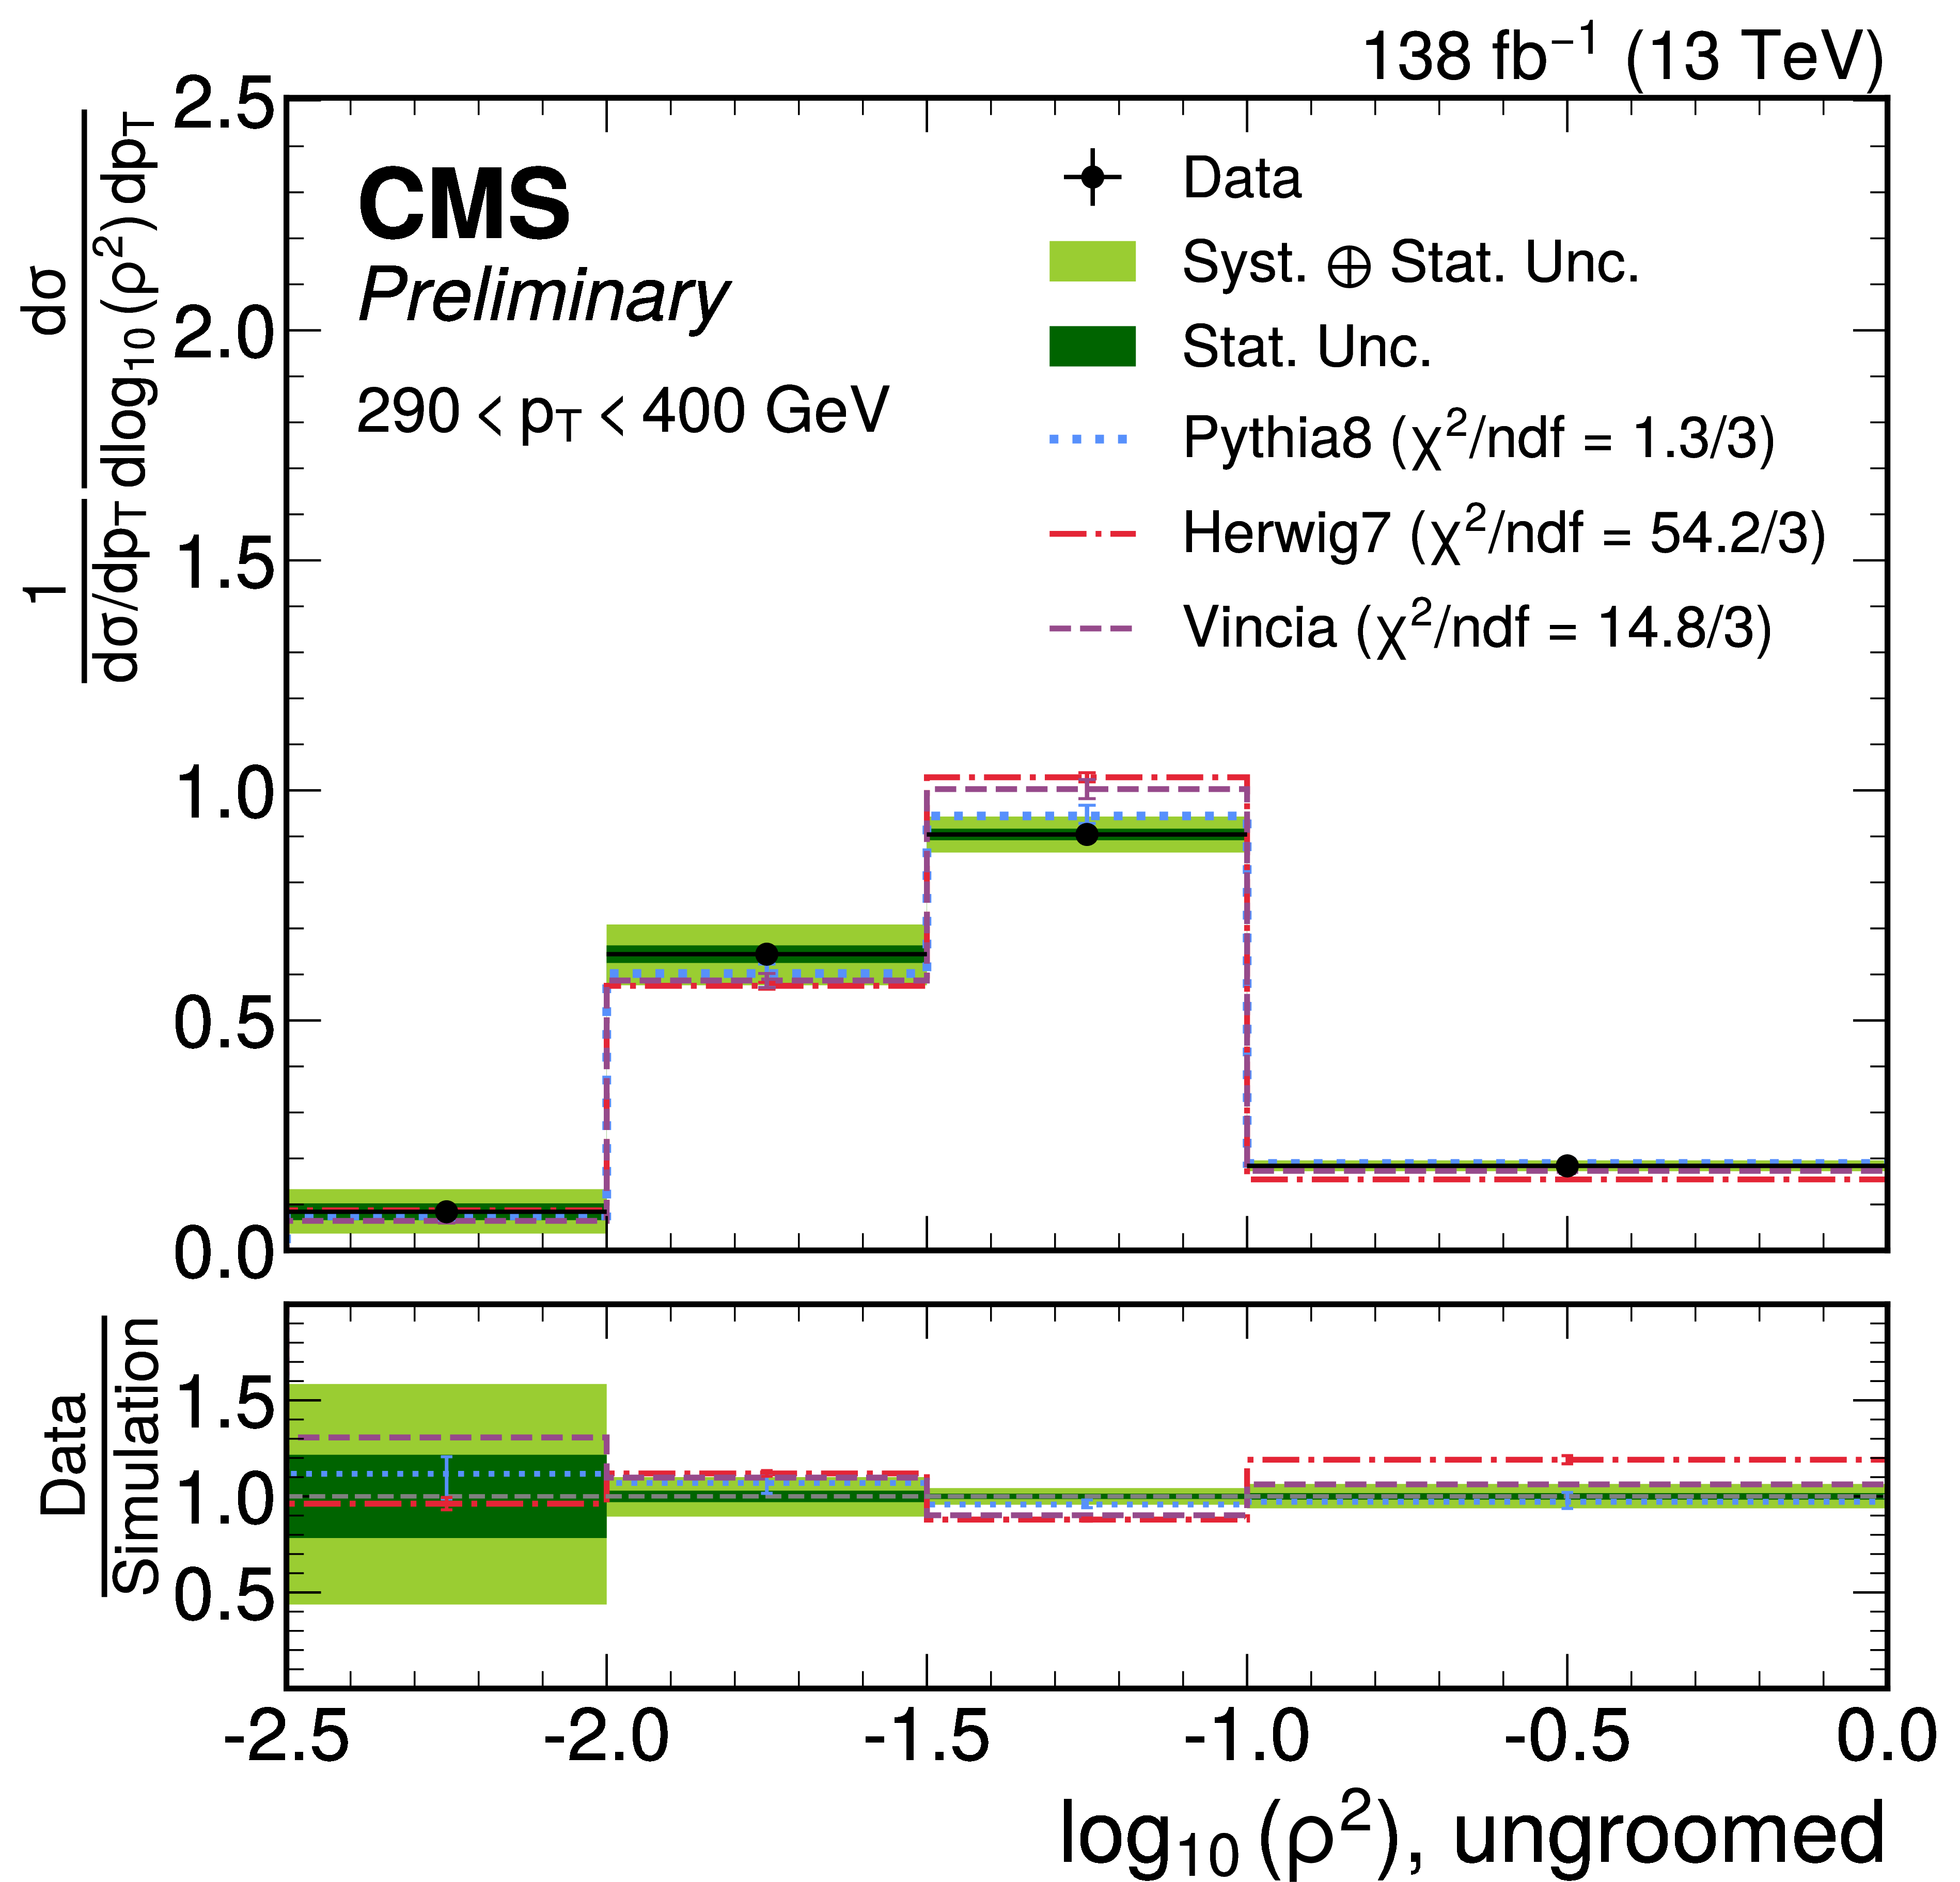
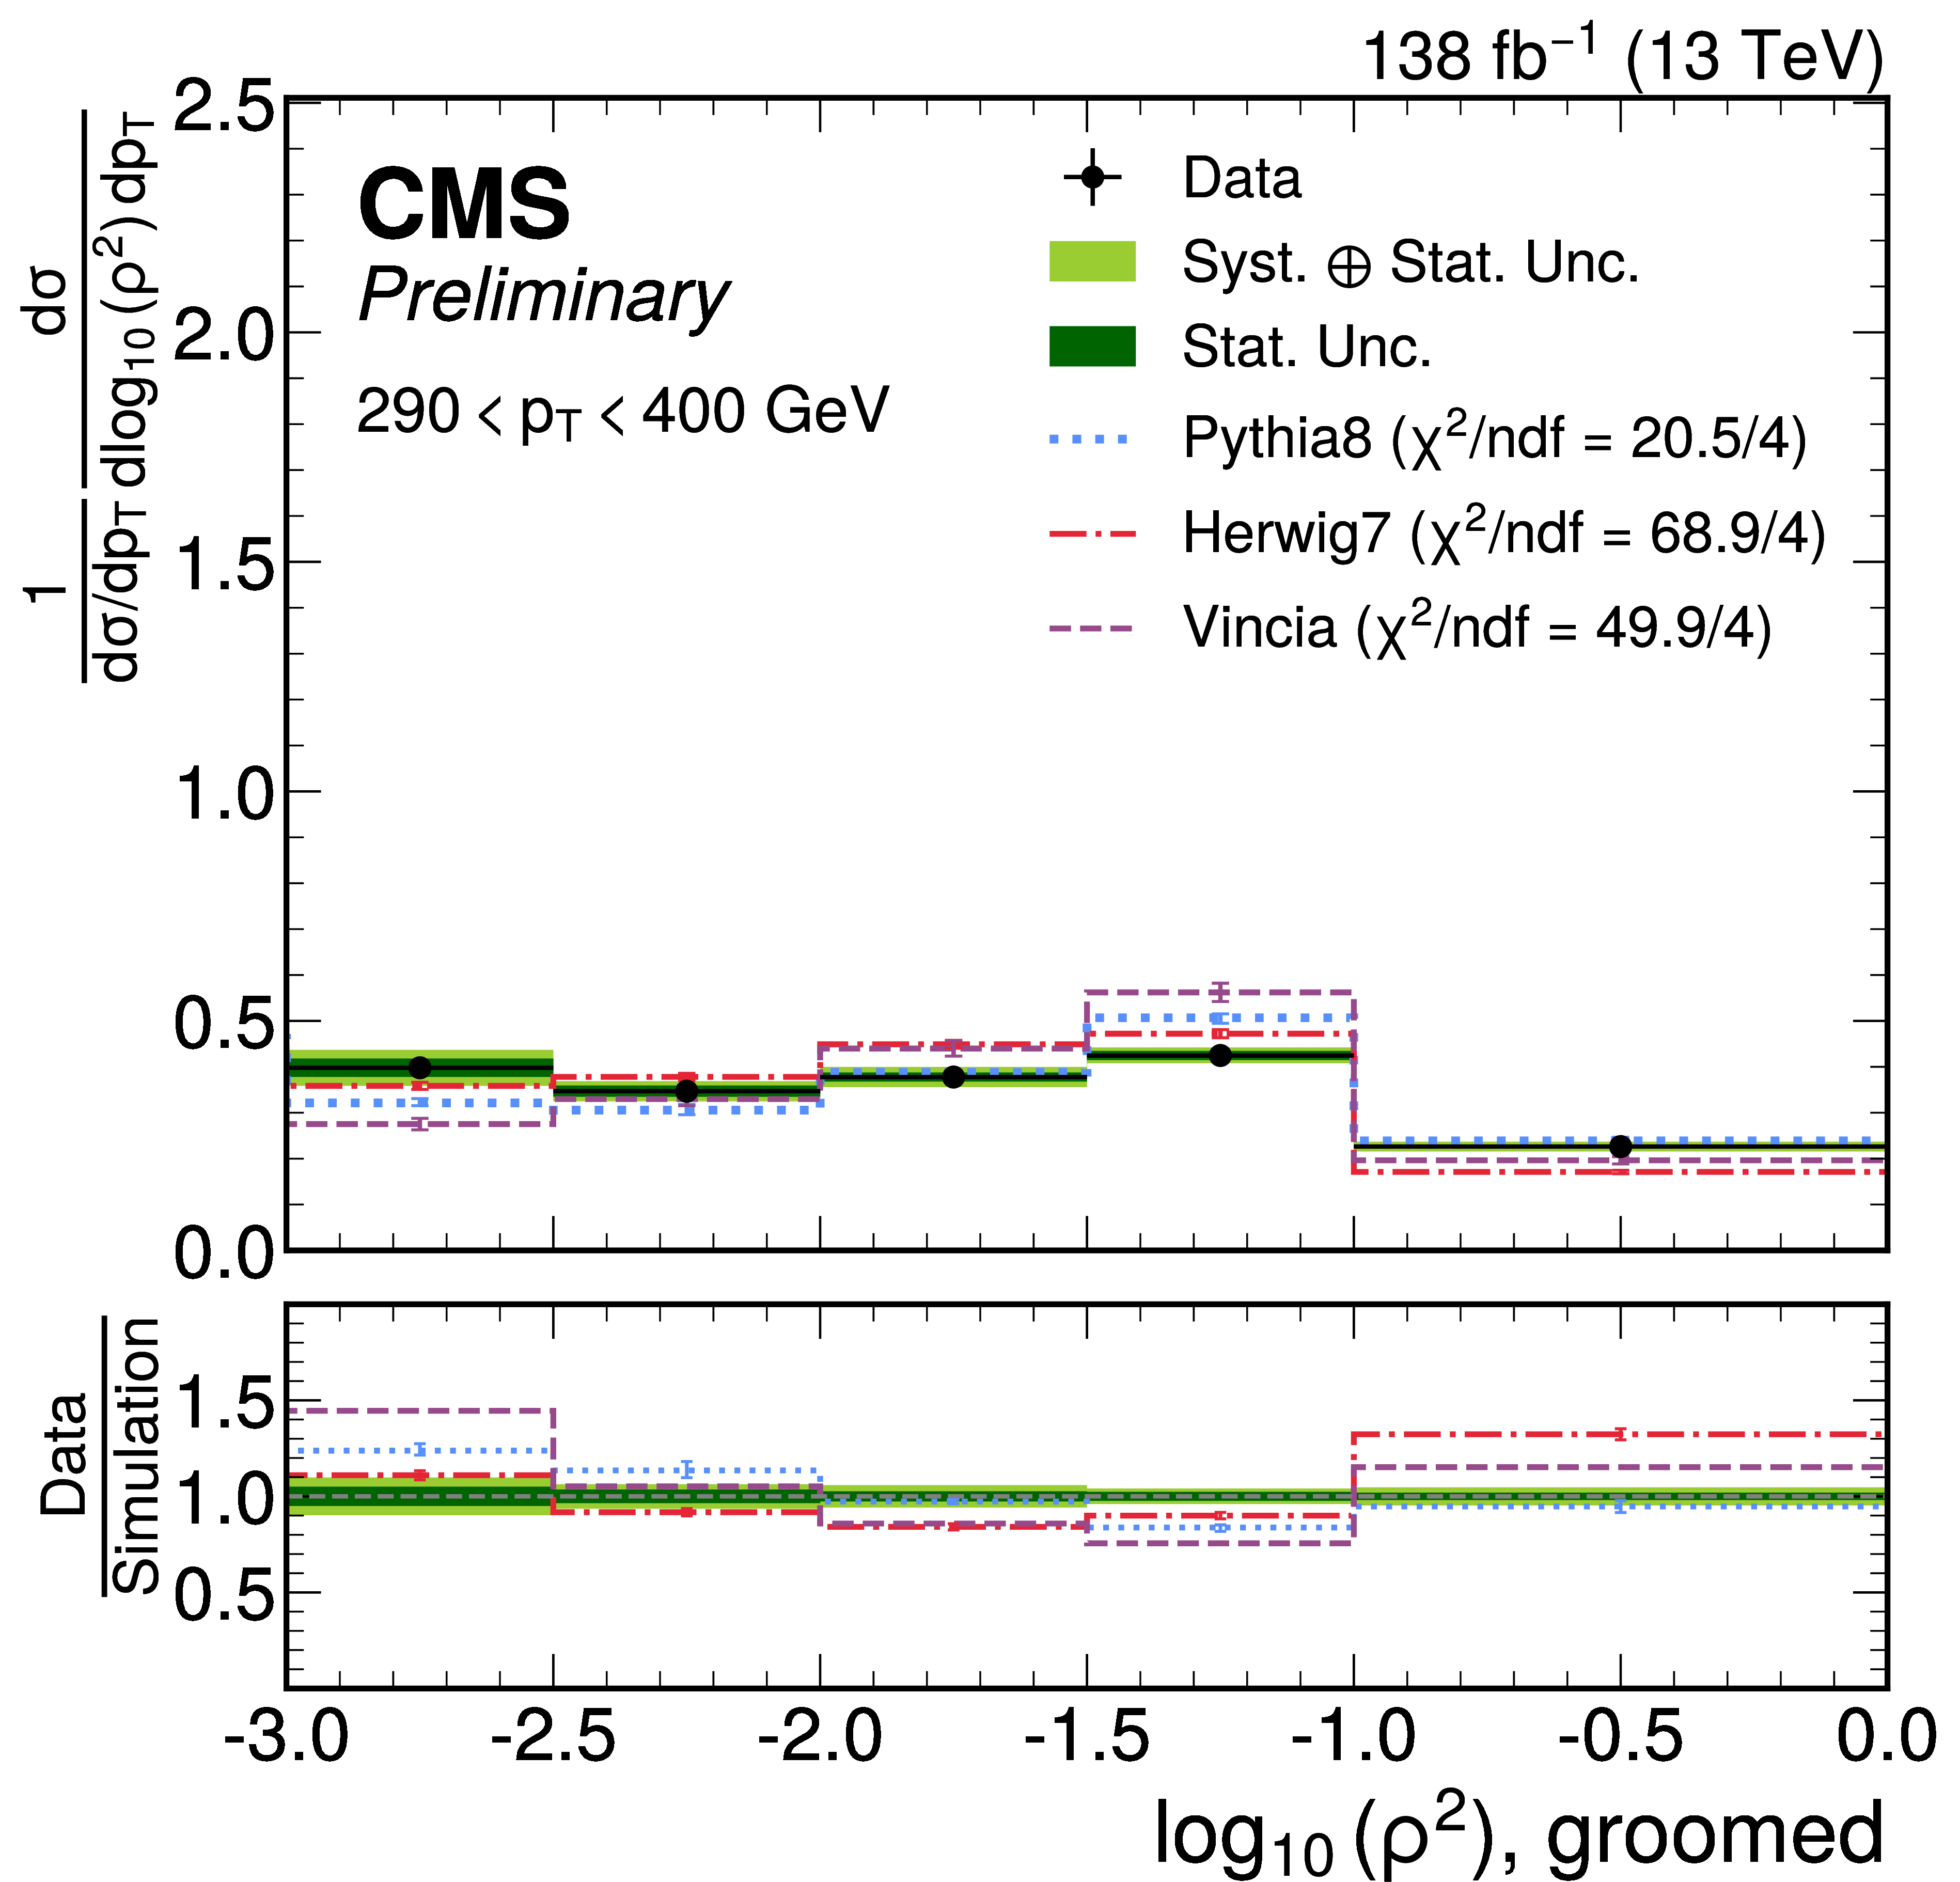
Comparison of the unfolded data with the PYTHIA8, HERWIG 7, and Vincia predictions in the 290 $ < p_{\mathrm{T}} < $ 400 GeV interval for the ungroomed (left) and groomed (right) observables. The black markers show the unfolded data. The dark and light green bands show the statistical and total uncertainties, respectively. The lower panels show the ratios of the unfolded data to the simulation predictions. The legends quote the $ \chi^{2} $ per degree of freedom of each prediction with respect to the unfolded data, computed from the total uncertainties. |
png pdf |
Figure 5-a:
Comparison of the unfolded data with the PYTHIA8, HERWIG 7, and Vincia predictions in the 290 $ < p_{\mathrm{T}} < $ 400 GeV interval for the ungroomed (left) and groomed (right) observables. The black markers show the unfolded data. The dark and light green bands show the statistical and total uncertainties, respectively. The lower panels show the ratios of the unfolded data to the simulation predictions. The legends quote the $ \chi^{2} $ per degree of freedom of each prediction with respect to the unfolded data, computed from the total uncertainties. |
png pdf |
Figure 5-b:
Comparison of the unfolded data with the PYTHIA8, HERWIG 7, and Vincia predictions in the 290 $ < p_{\mathrm{T}} < $ 400 GeV interval for the ungroomed (left) and groomed (right) observables. The black markers show the unfolded data. The dark and light green bands show the statistical and total uncertainties, respectively. The lower panels show the ratios of the unfolded data to the simulation predictions. The legends quote the $ \chi^{2} $ per degree of freedom of each prediction with respect to the unfolded data, computed from the total uncertainties. |
png pdf |
Figure 6:
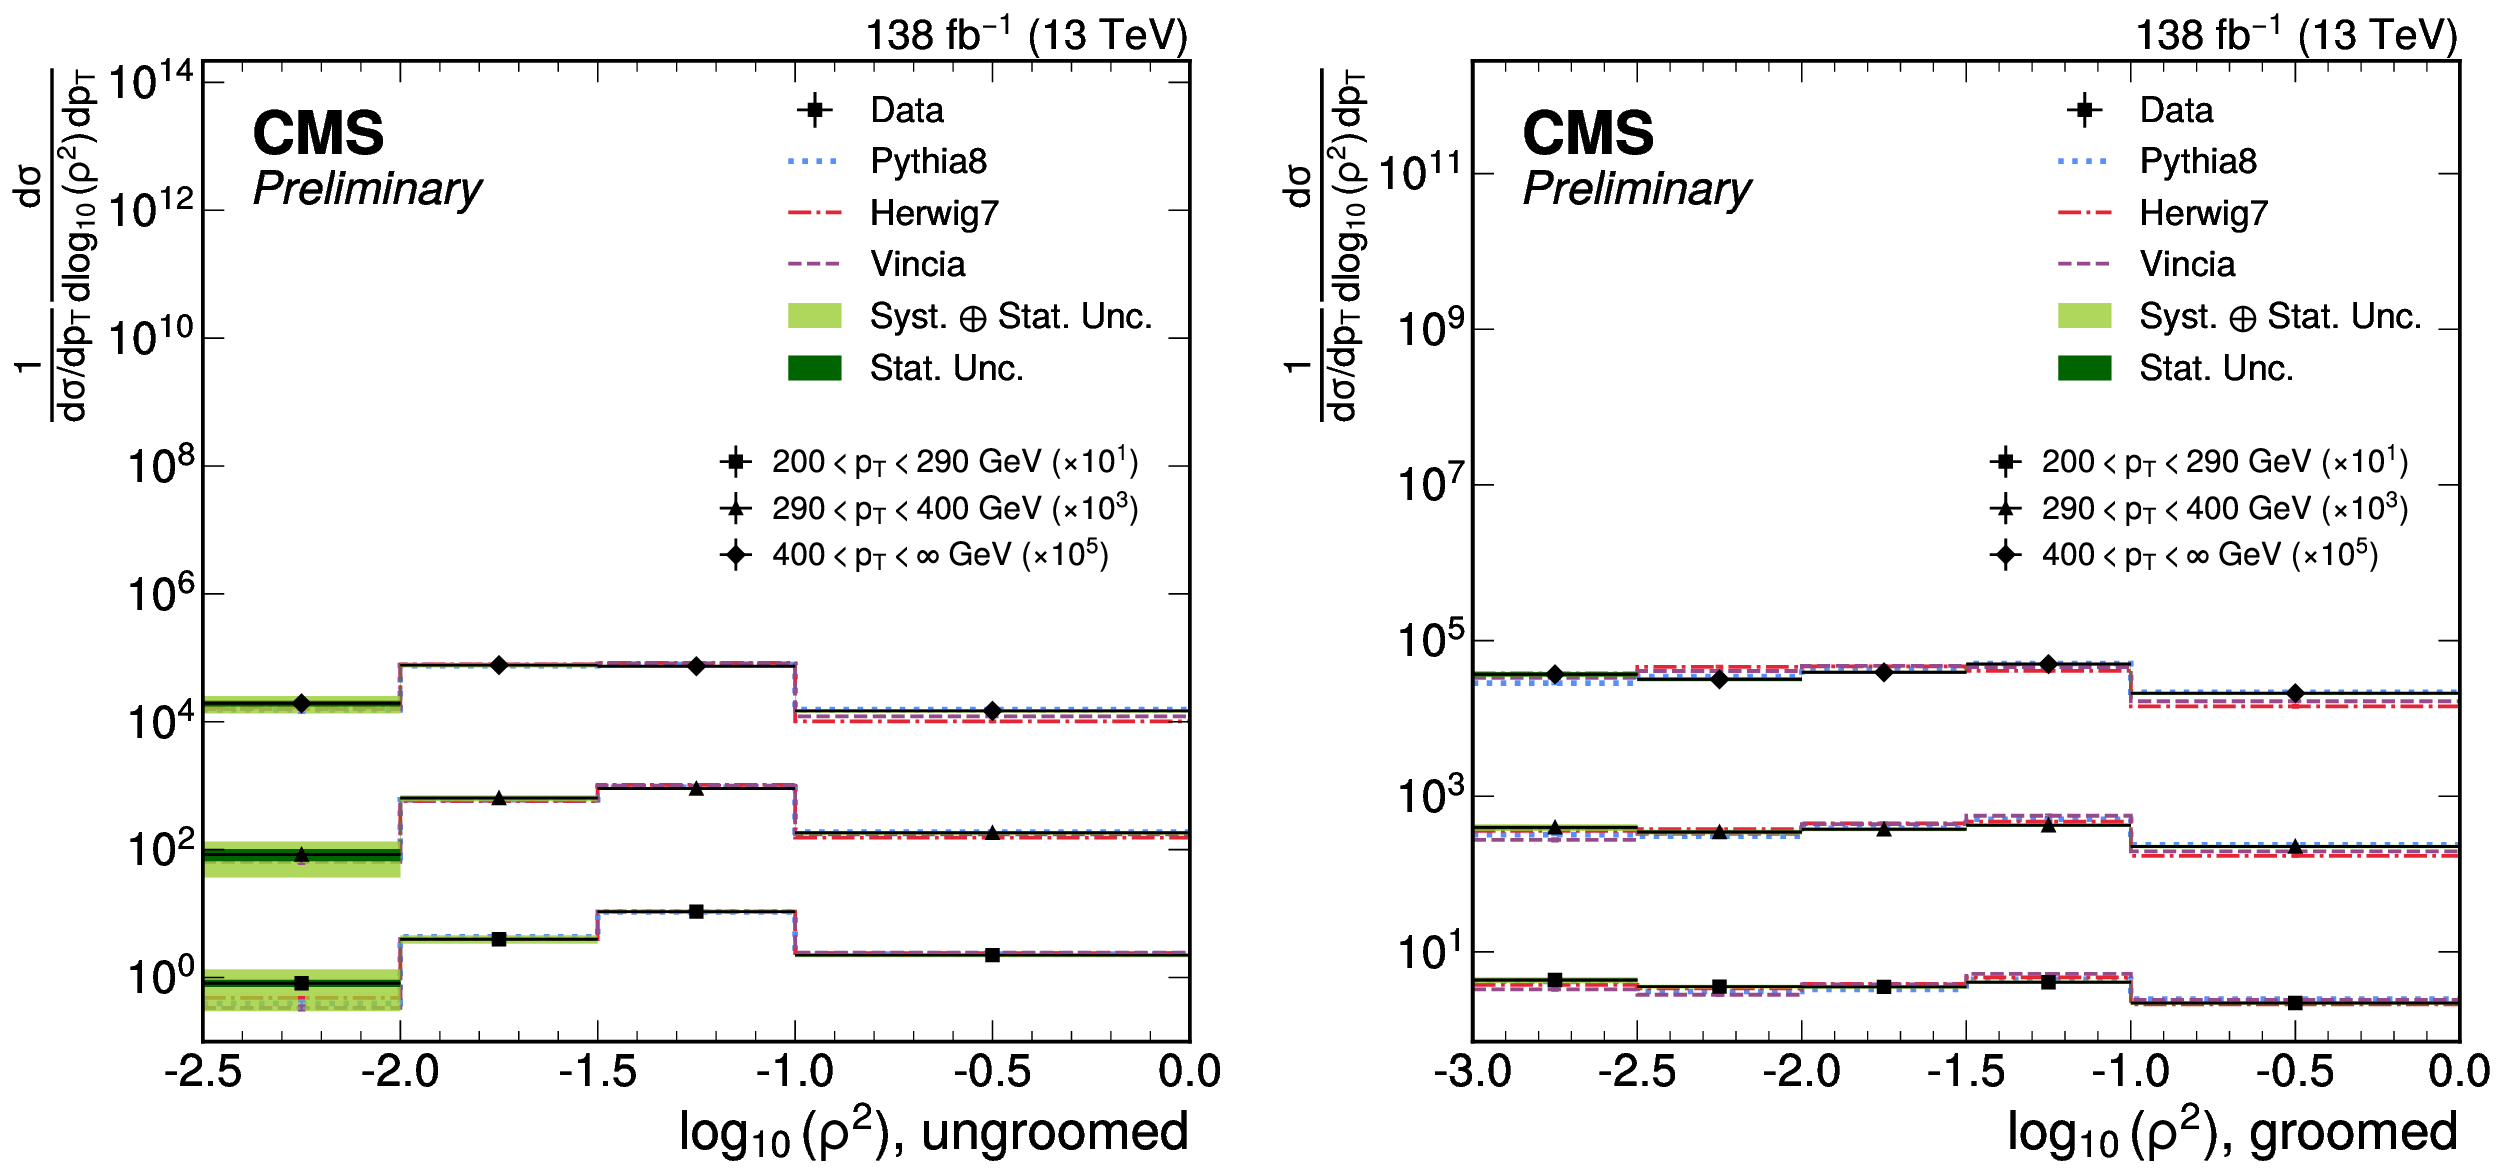
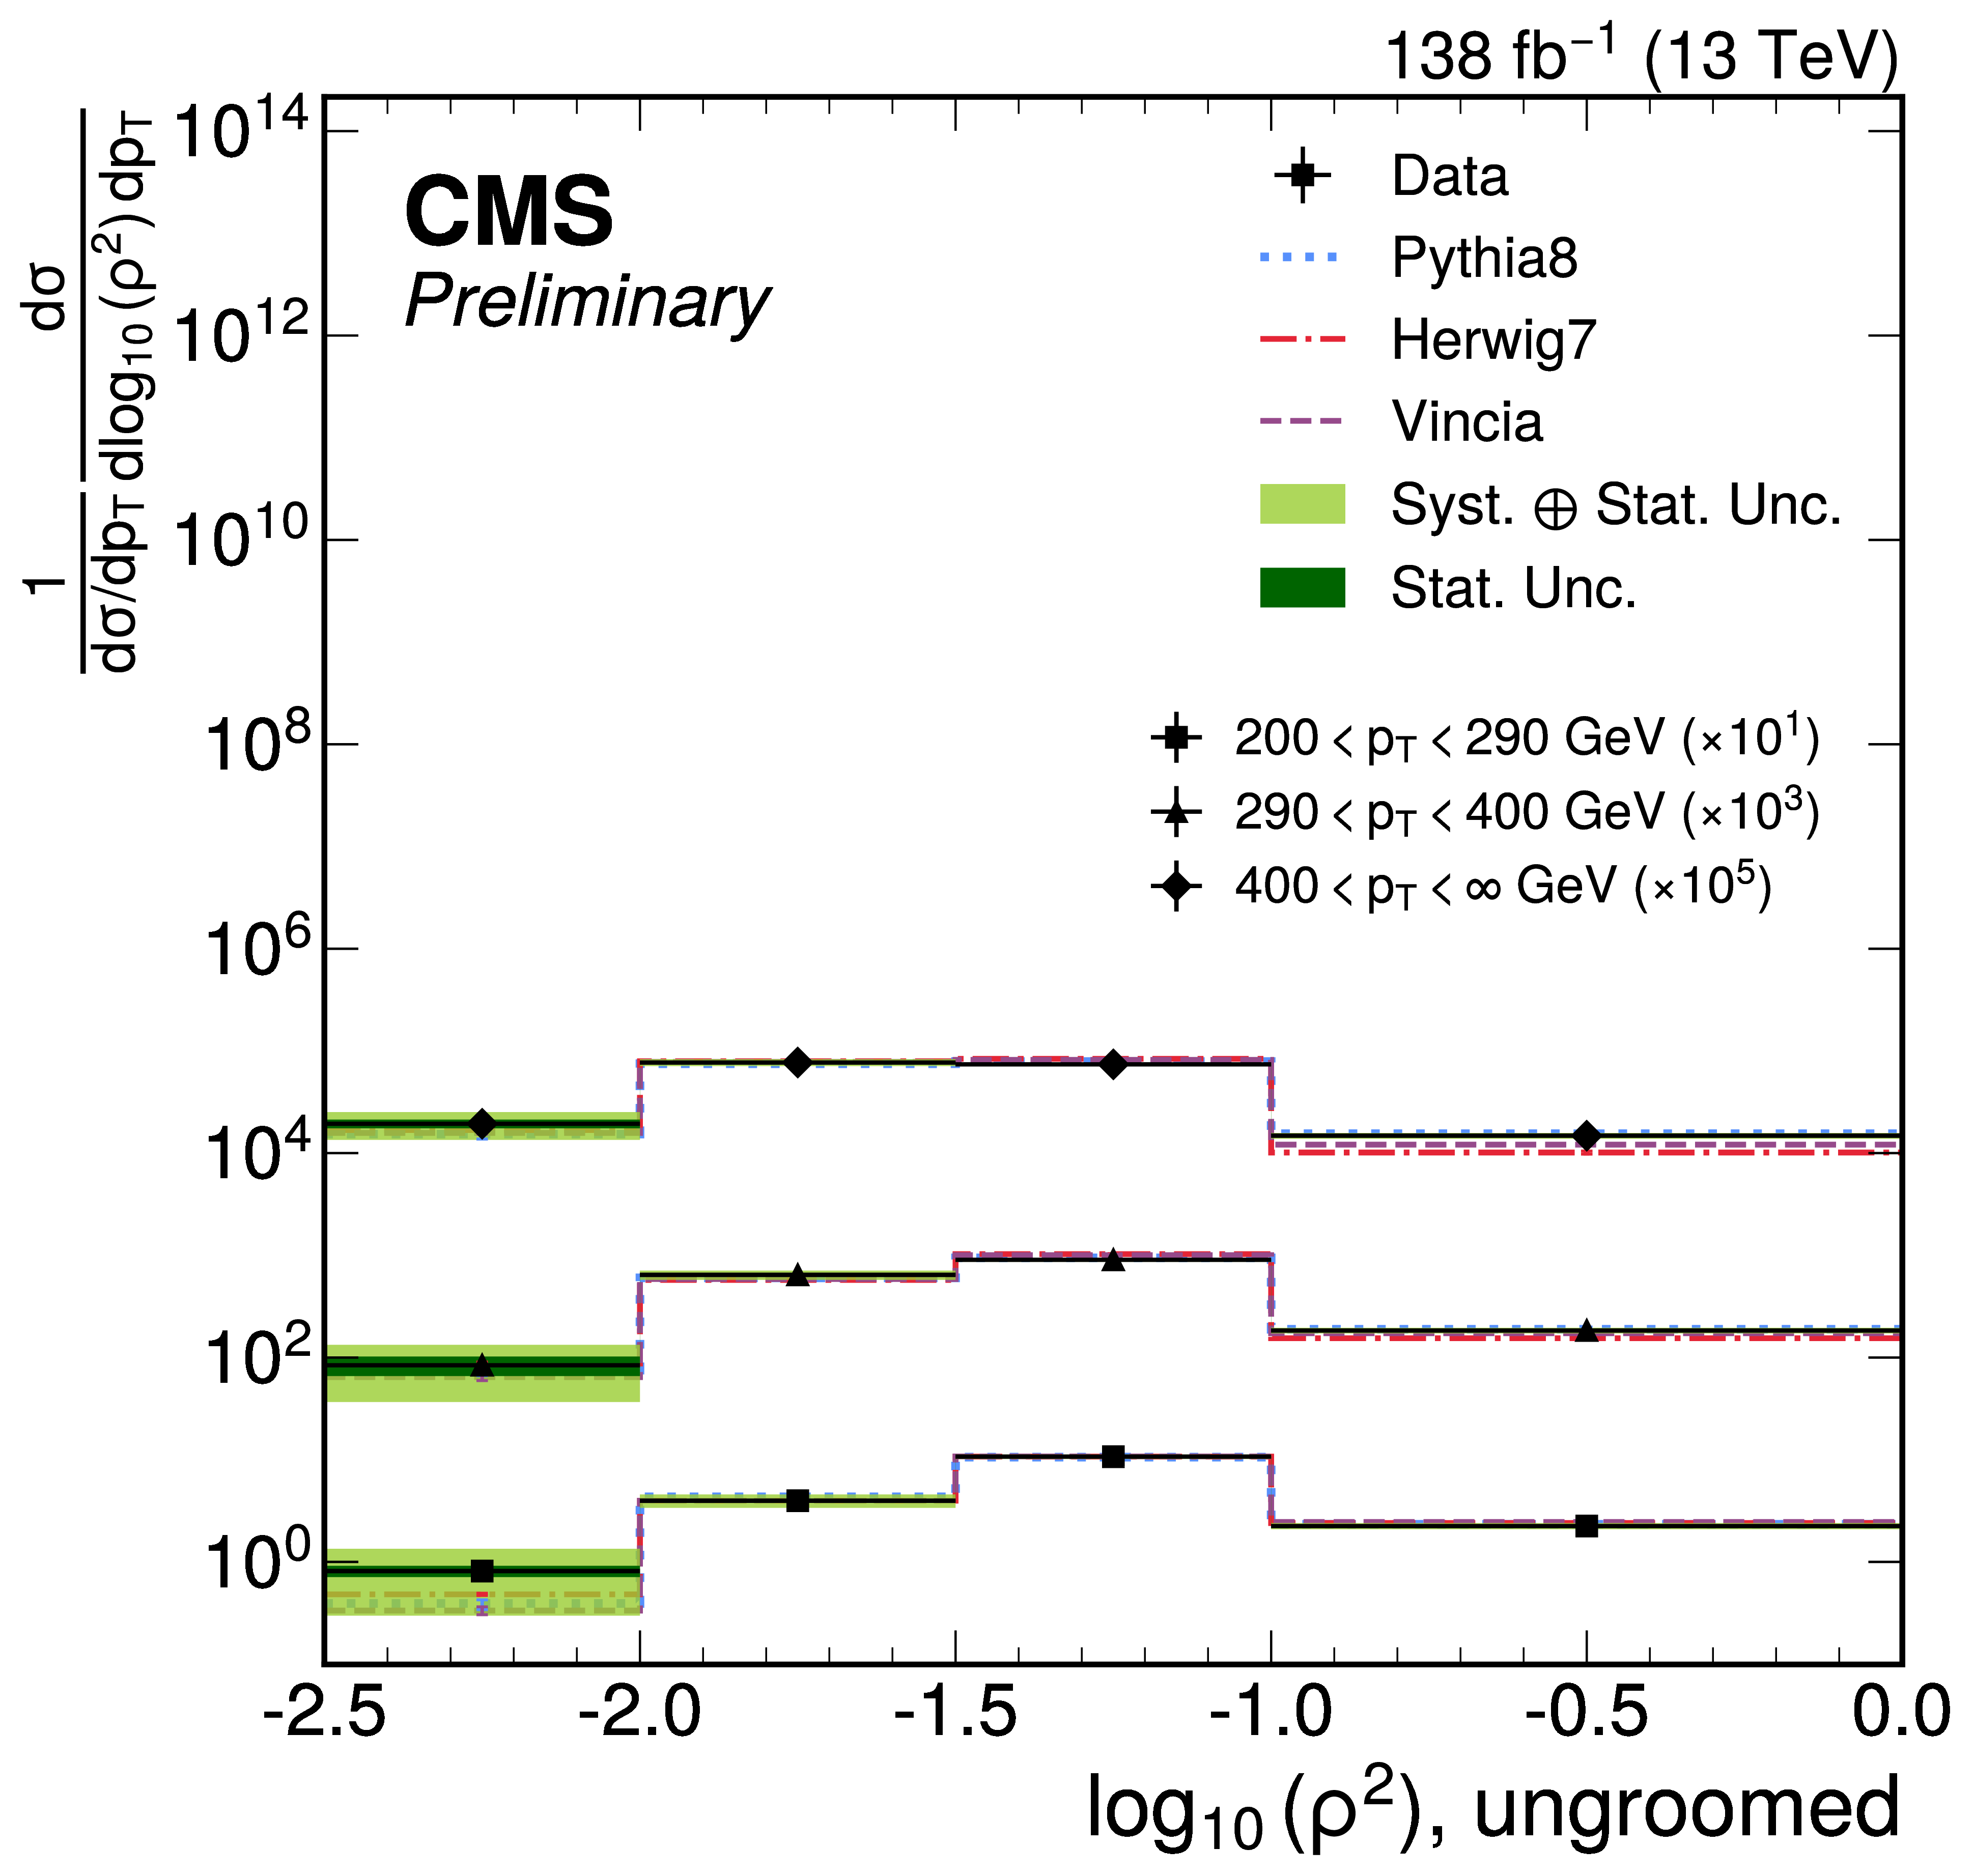
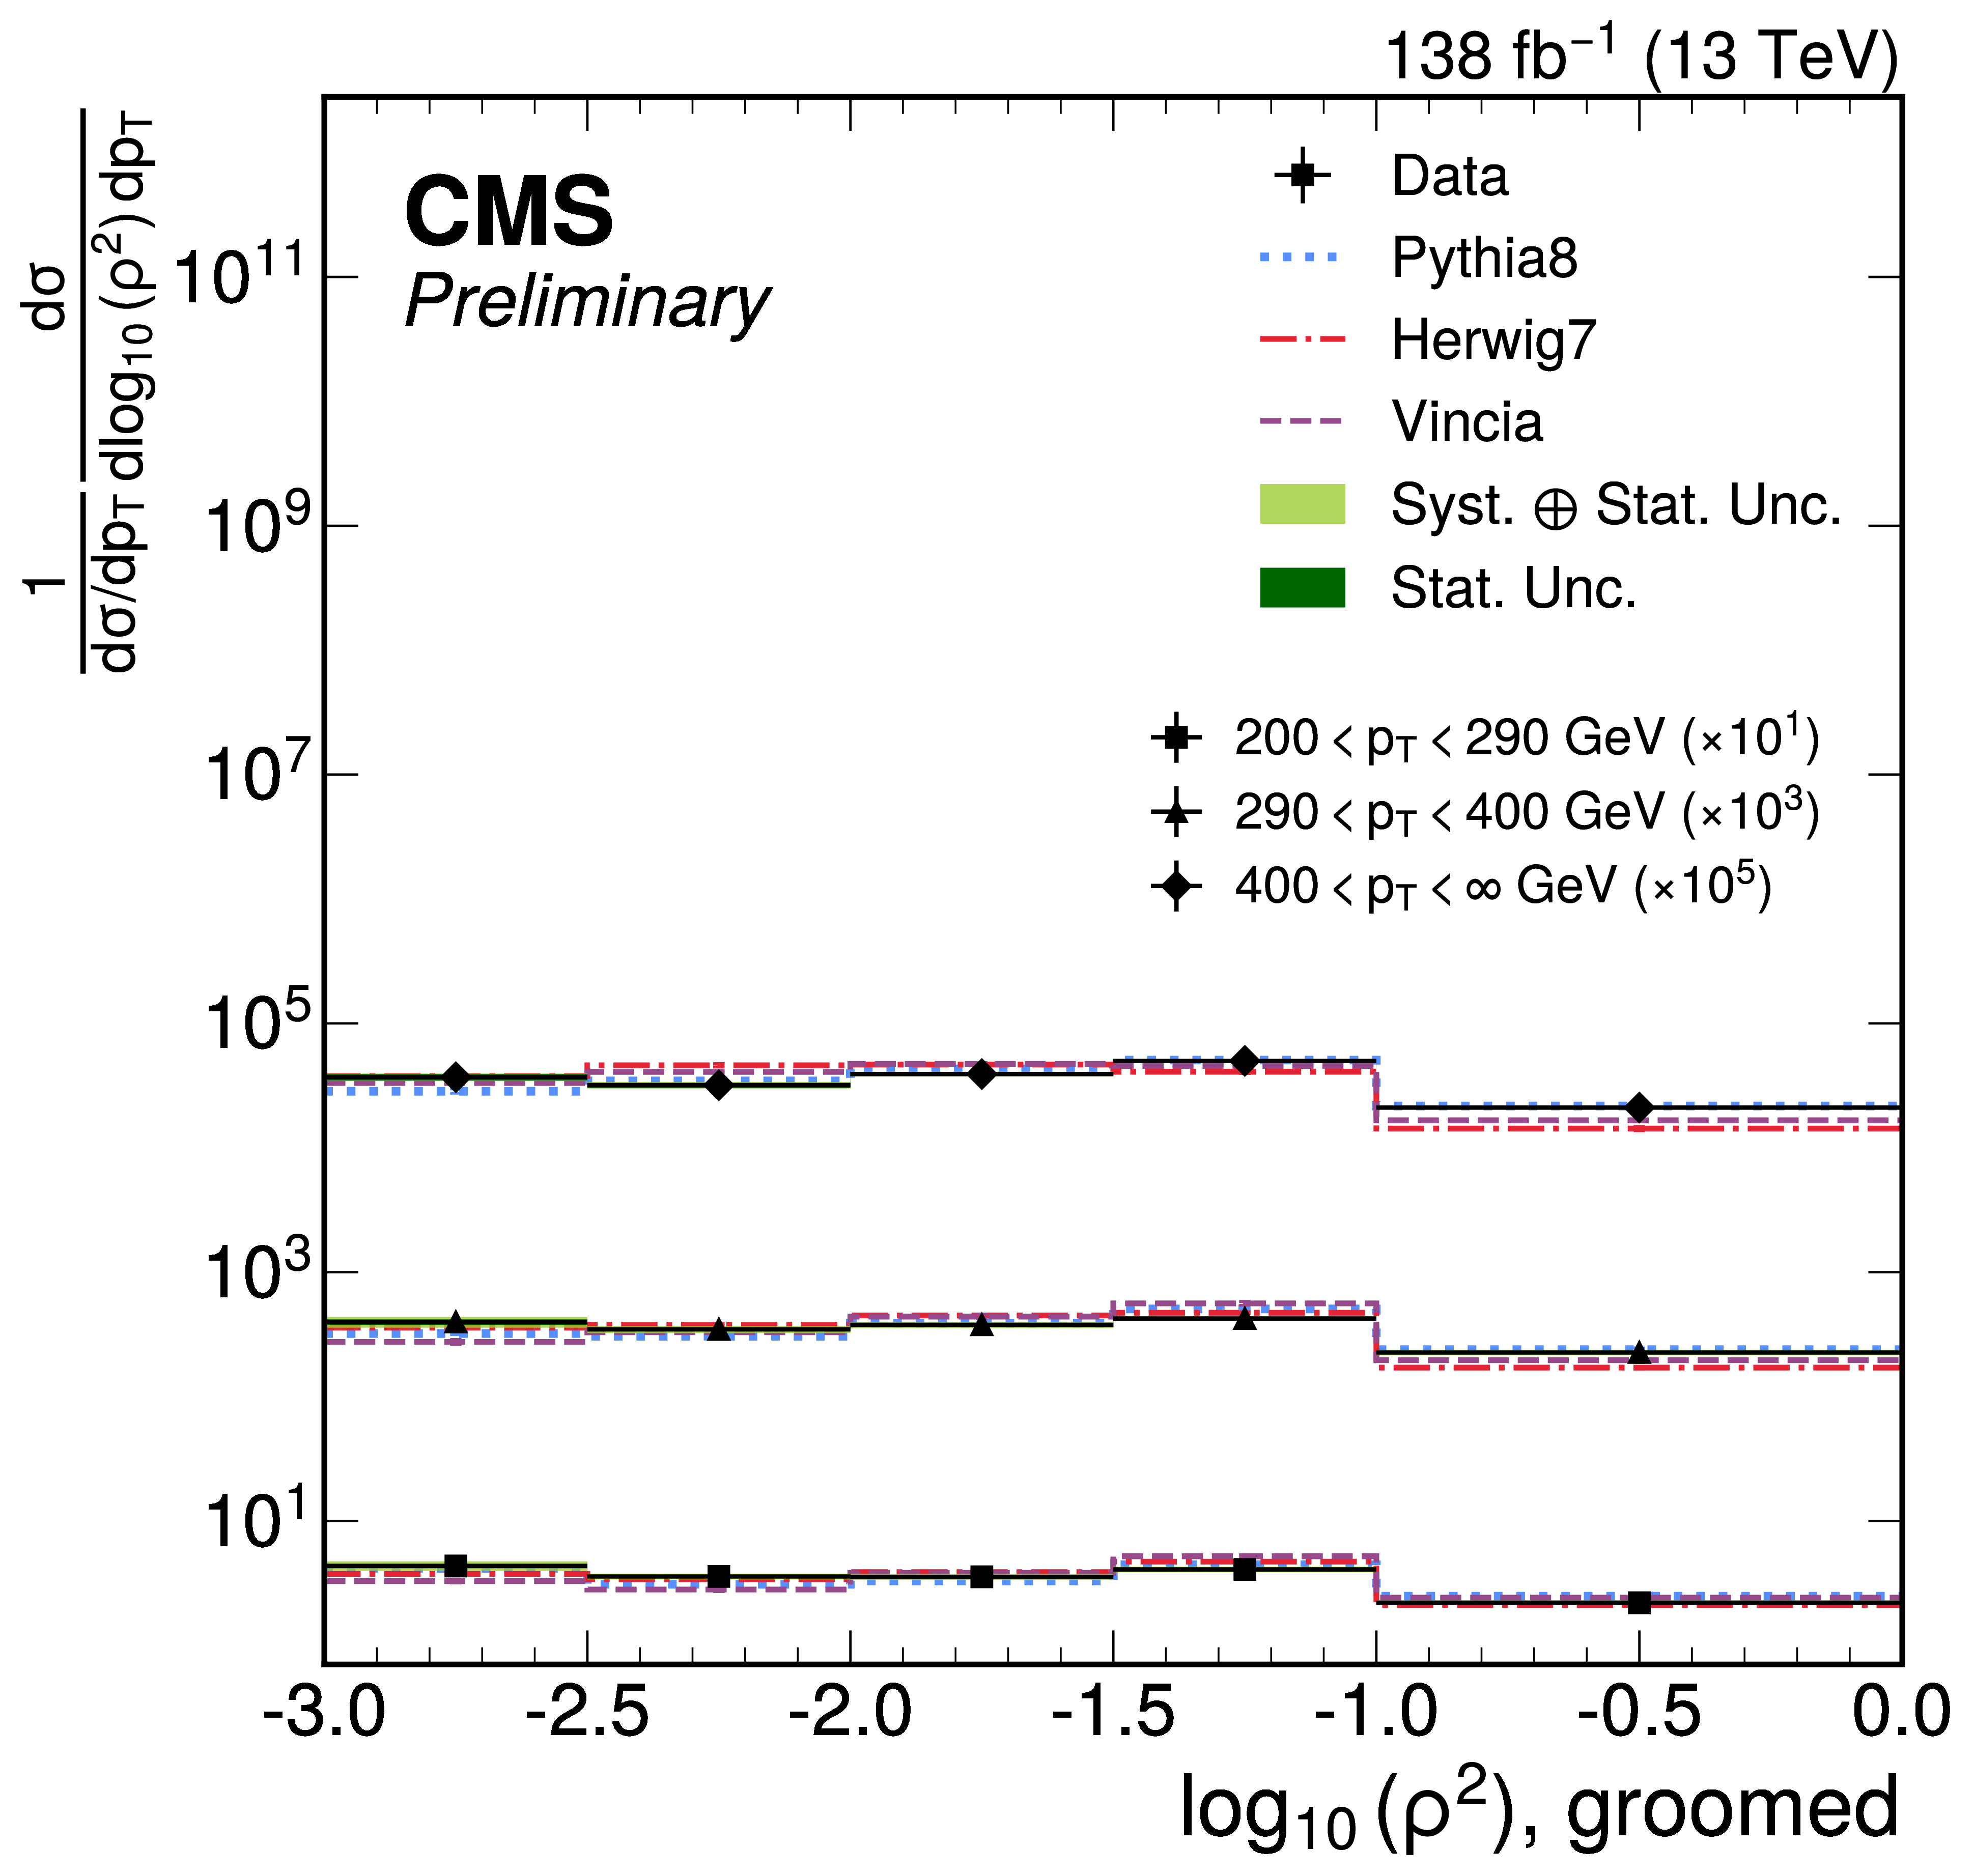
Unfolded normalized distributions for the ungroomed (left) and groomed (right) observables. The distributions in the three jet-$ p_{\mathrm{T}} $ intervals are multiplied by the factors indicated in the legends. |
png pdf |
Figure 6-a:
Unfolded normalized distributions for the ungroomed (left) and groomed (right) observables. The distributions in the three jet-$ p_{\mathrm{T}} $ intervals are multiplied by the factors indicated in the legends. |
png pdf |
Figure 6-b:
Unfolded normalized distributions for the ungroomed (left) and groomed (right) observables. The distributions in the three jet-$ p_{\mathrm{T}} $ intervals are multiplied by the factors indicated in the legends. |
png pdf |
Figure 7:
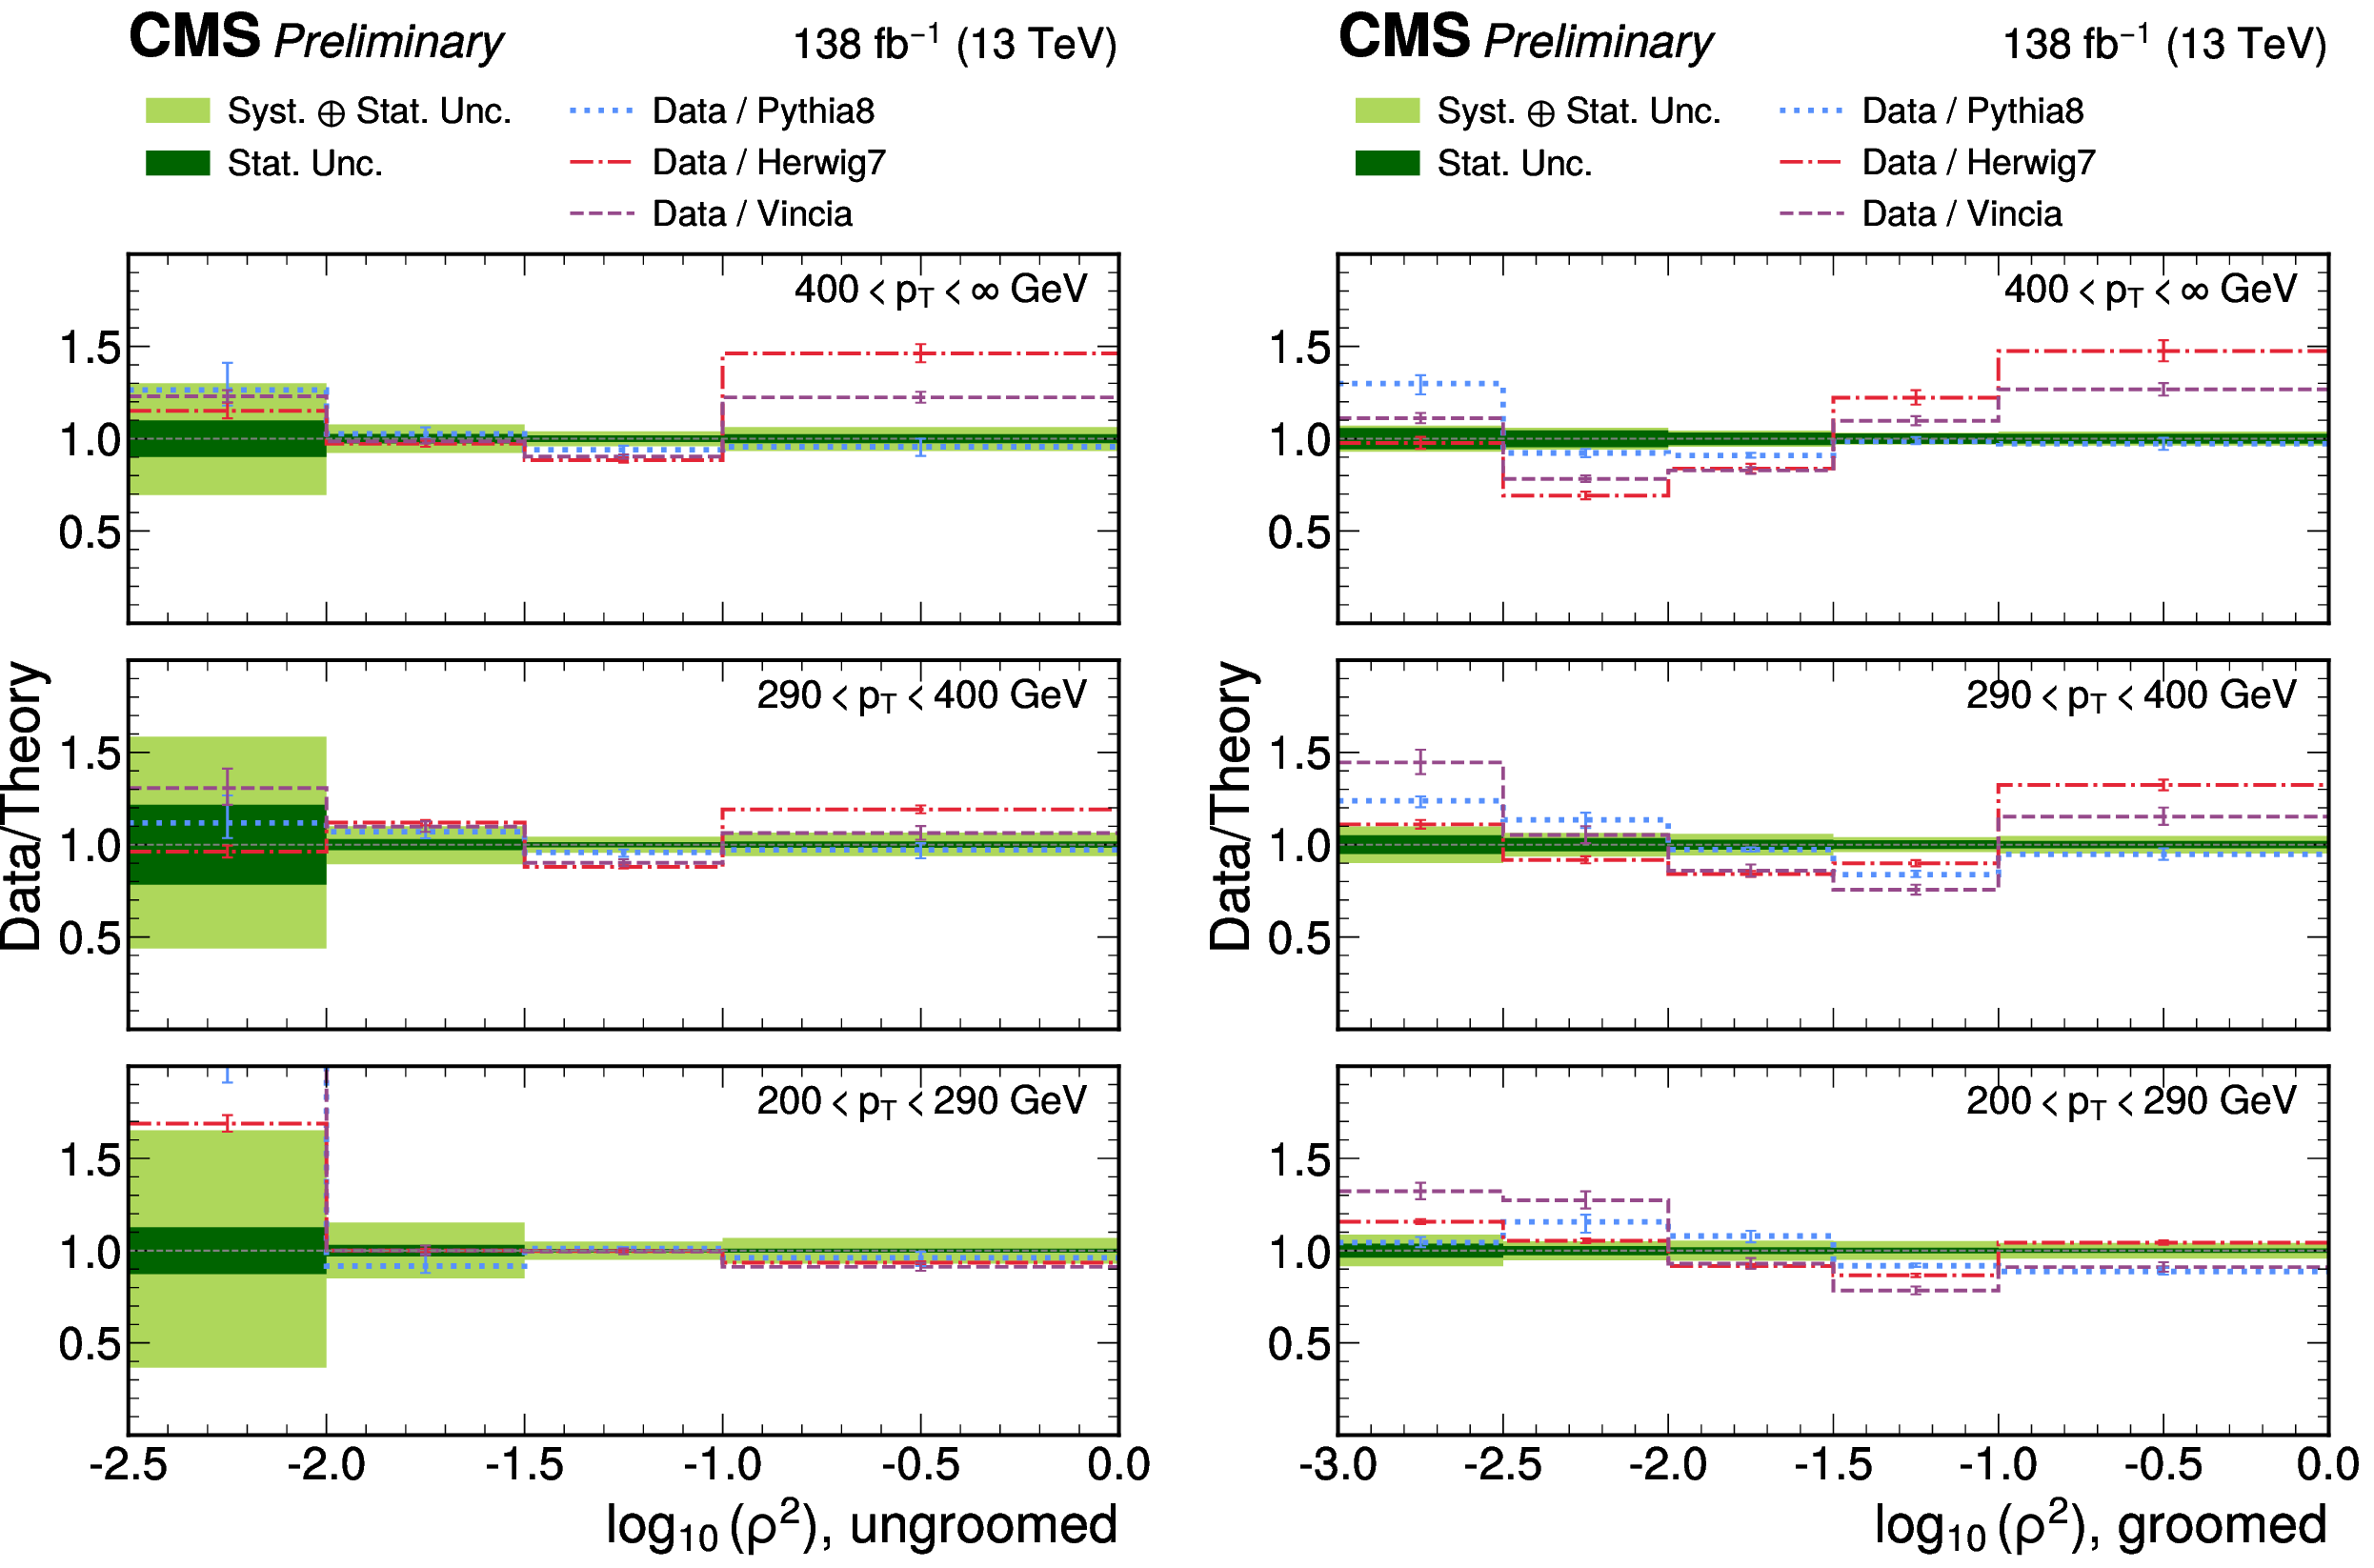
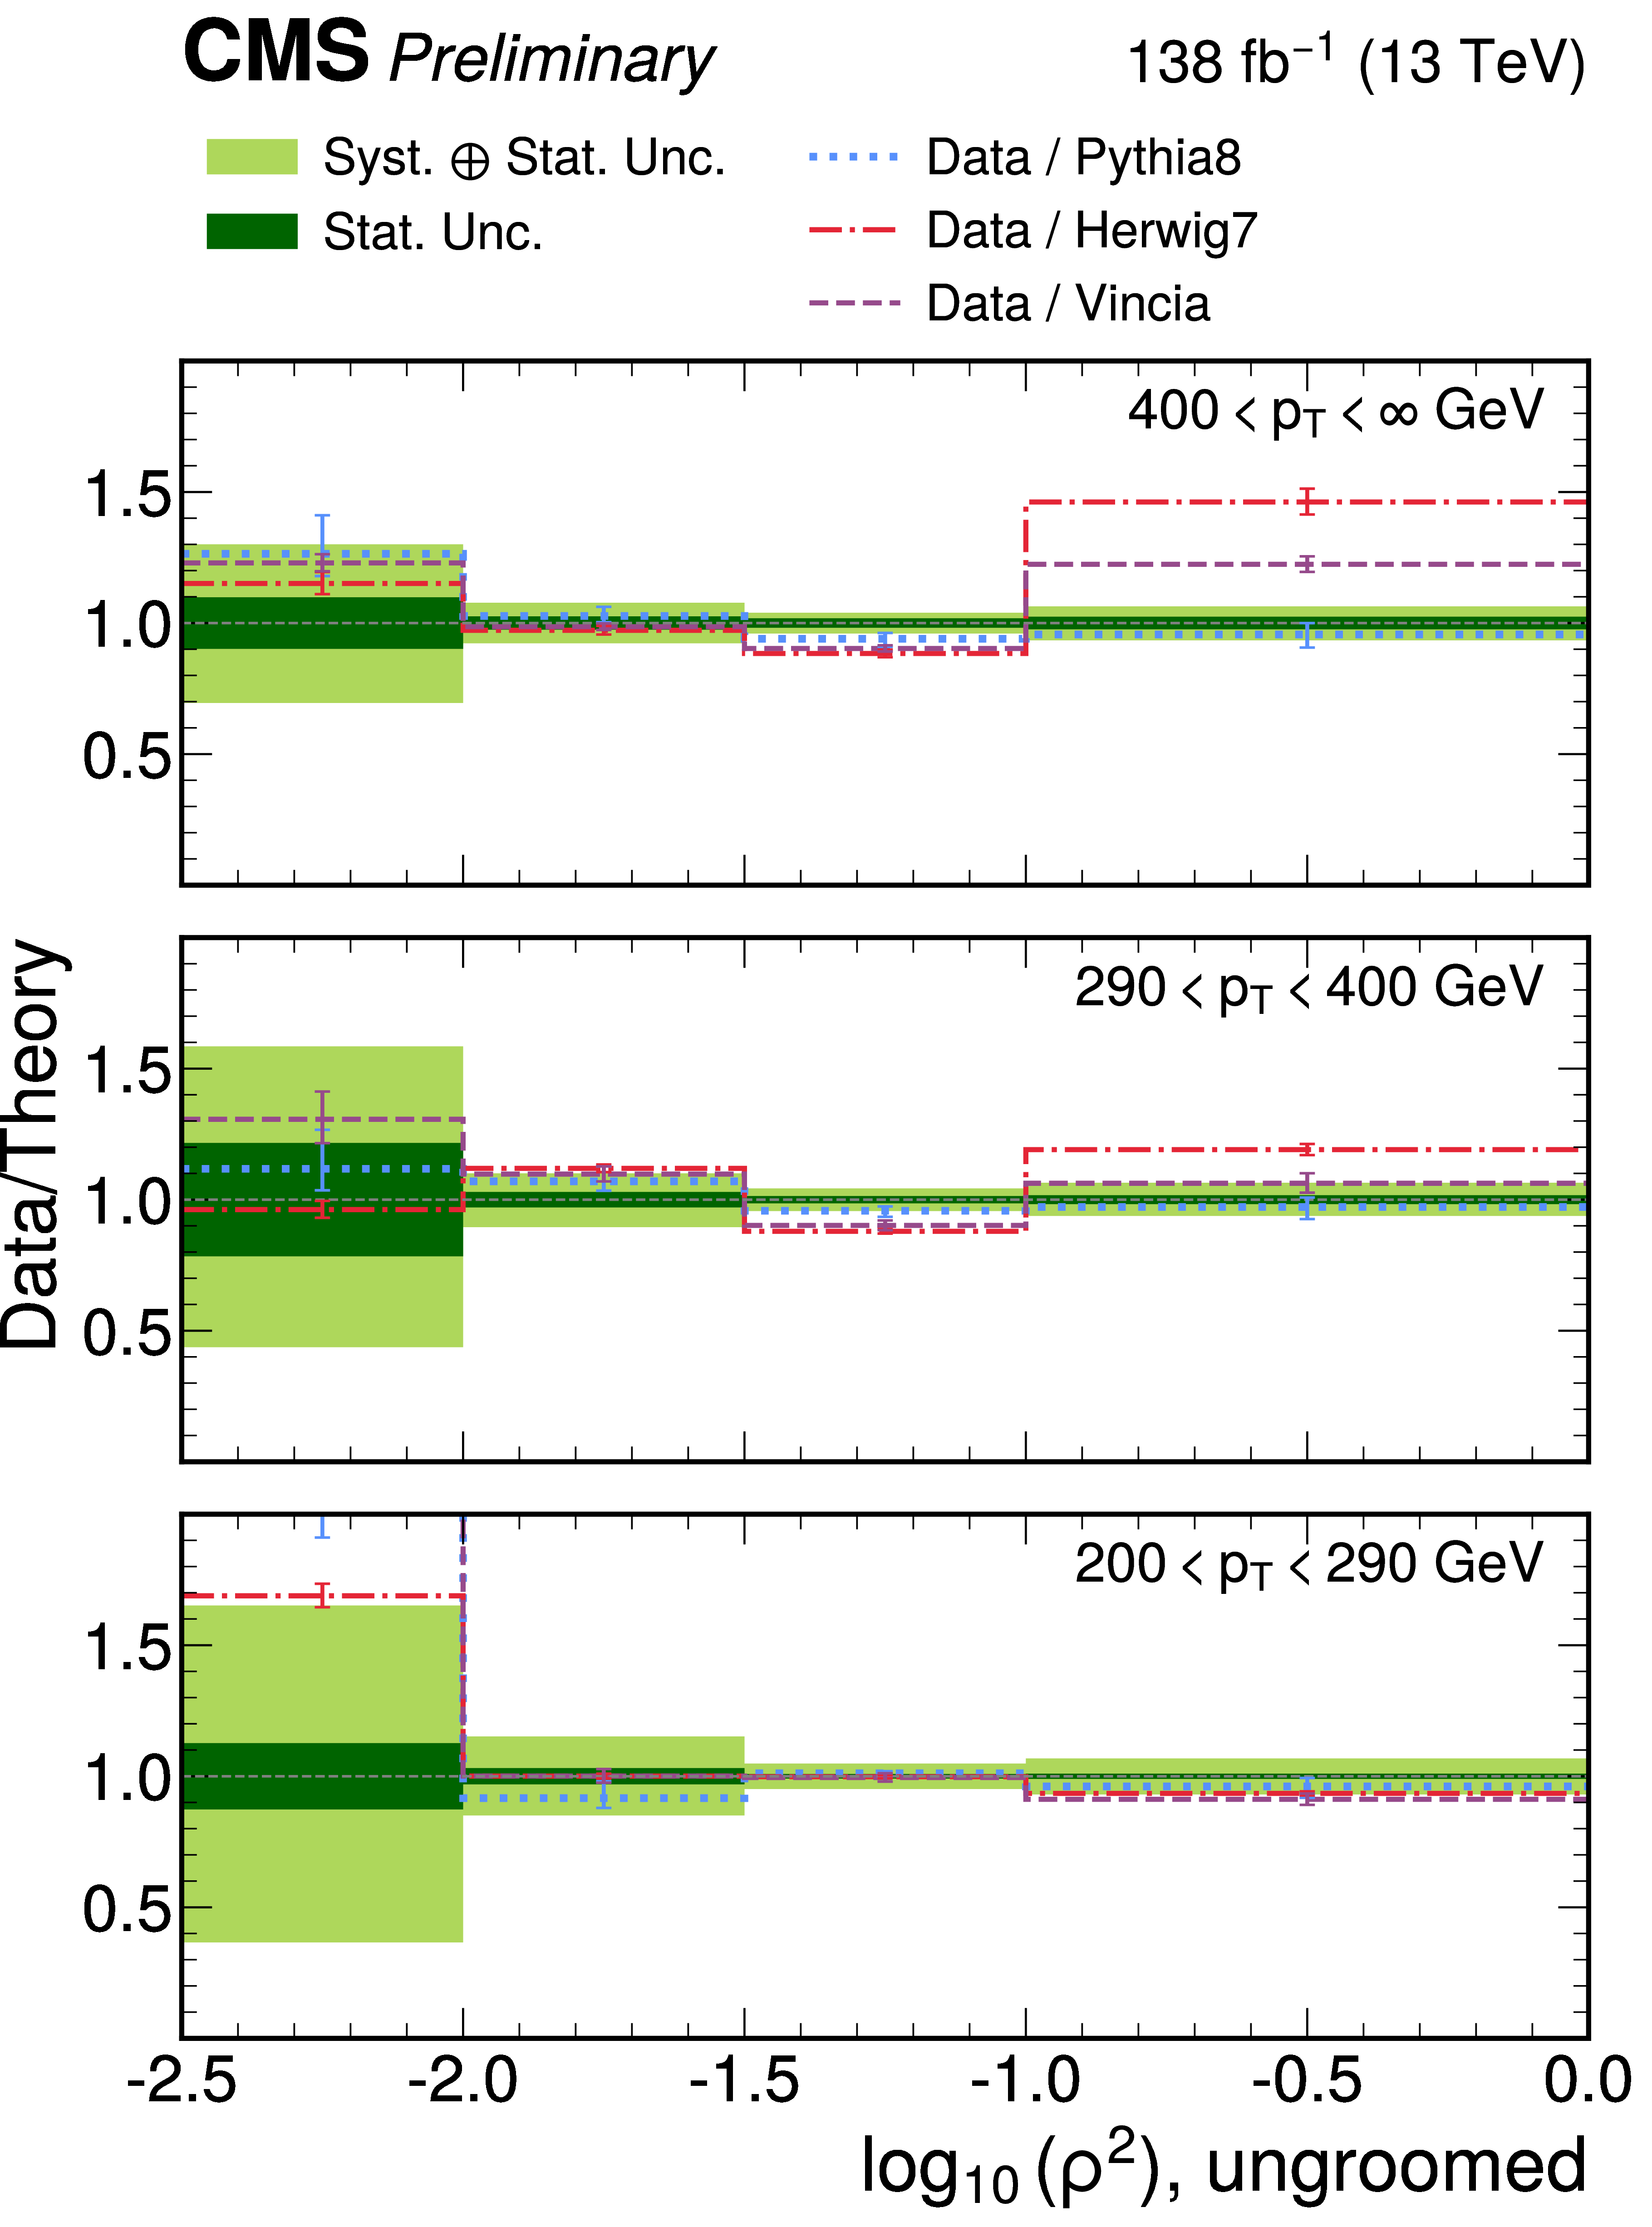
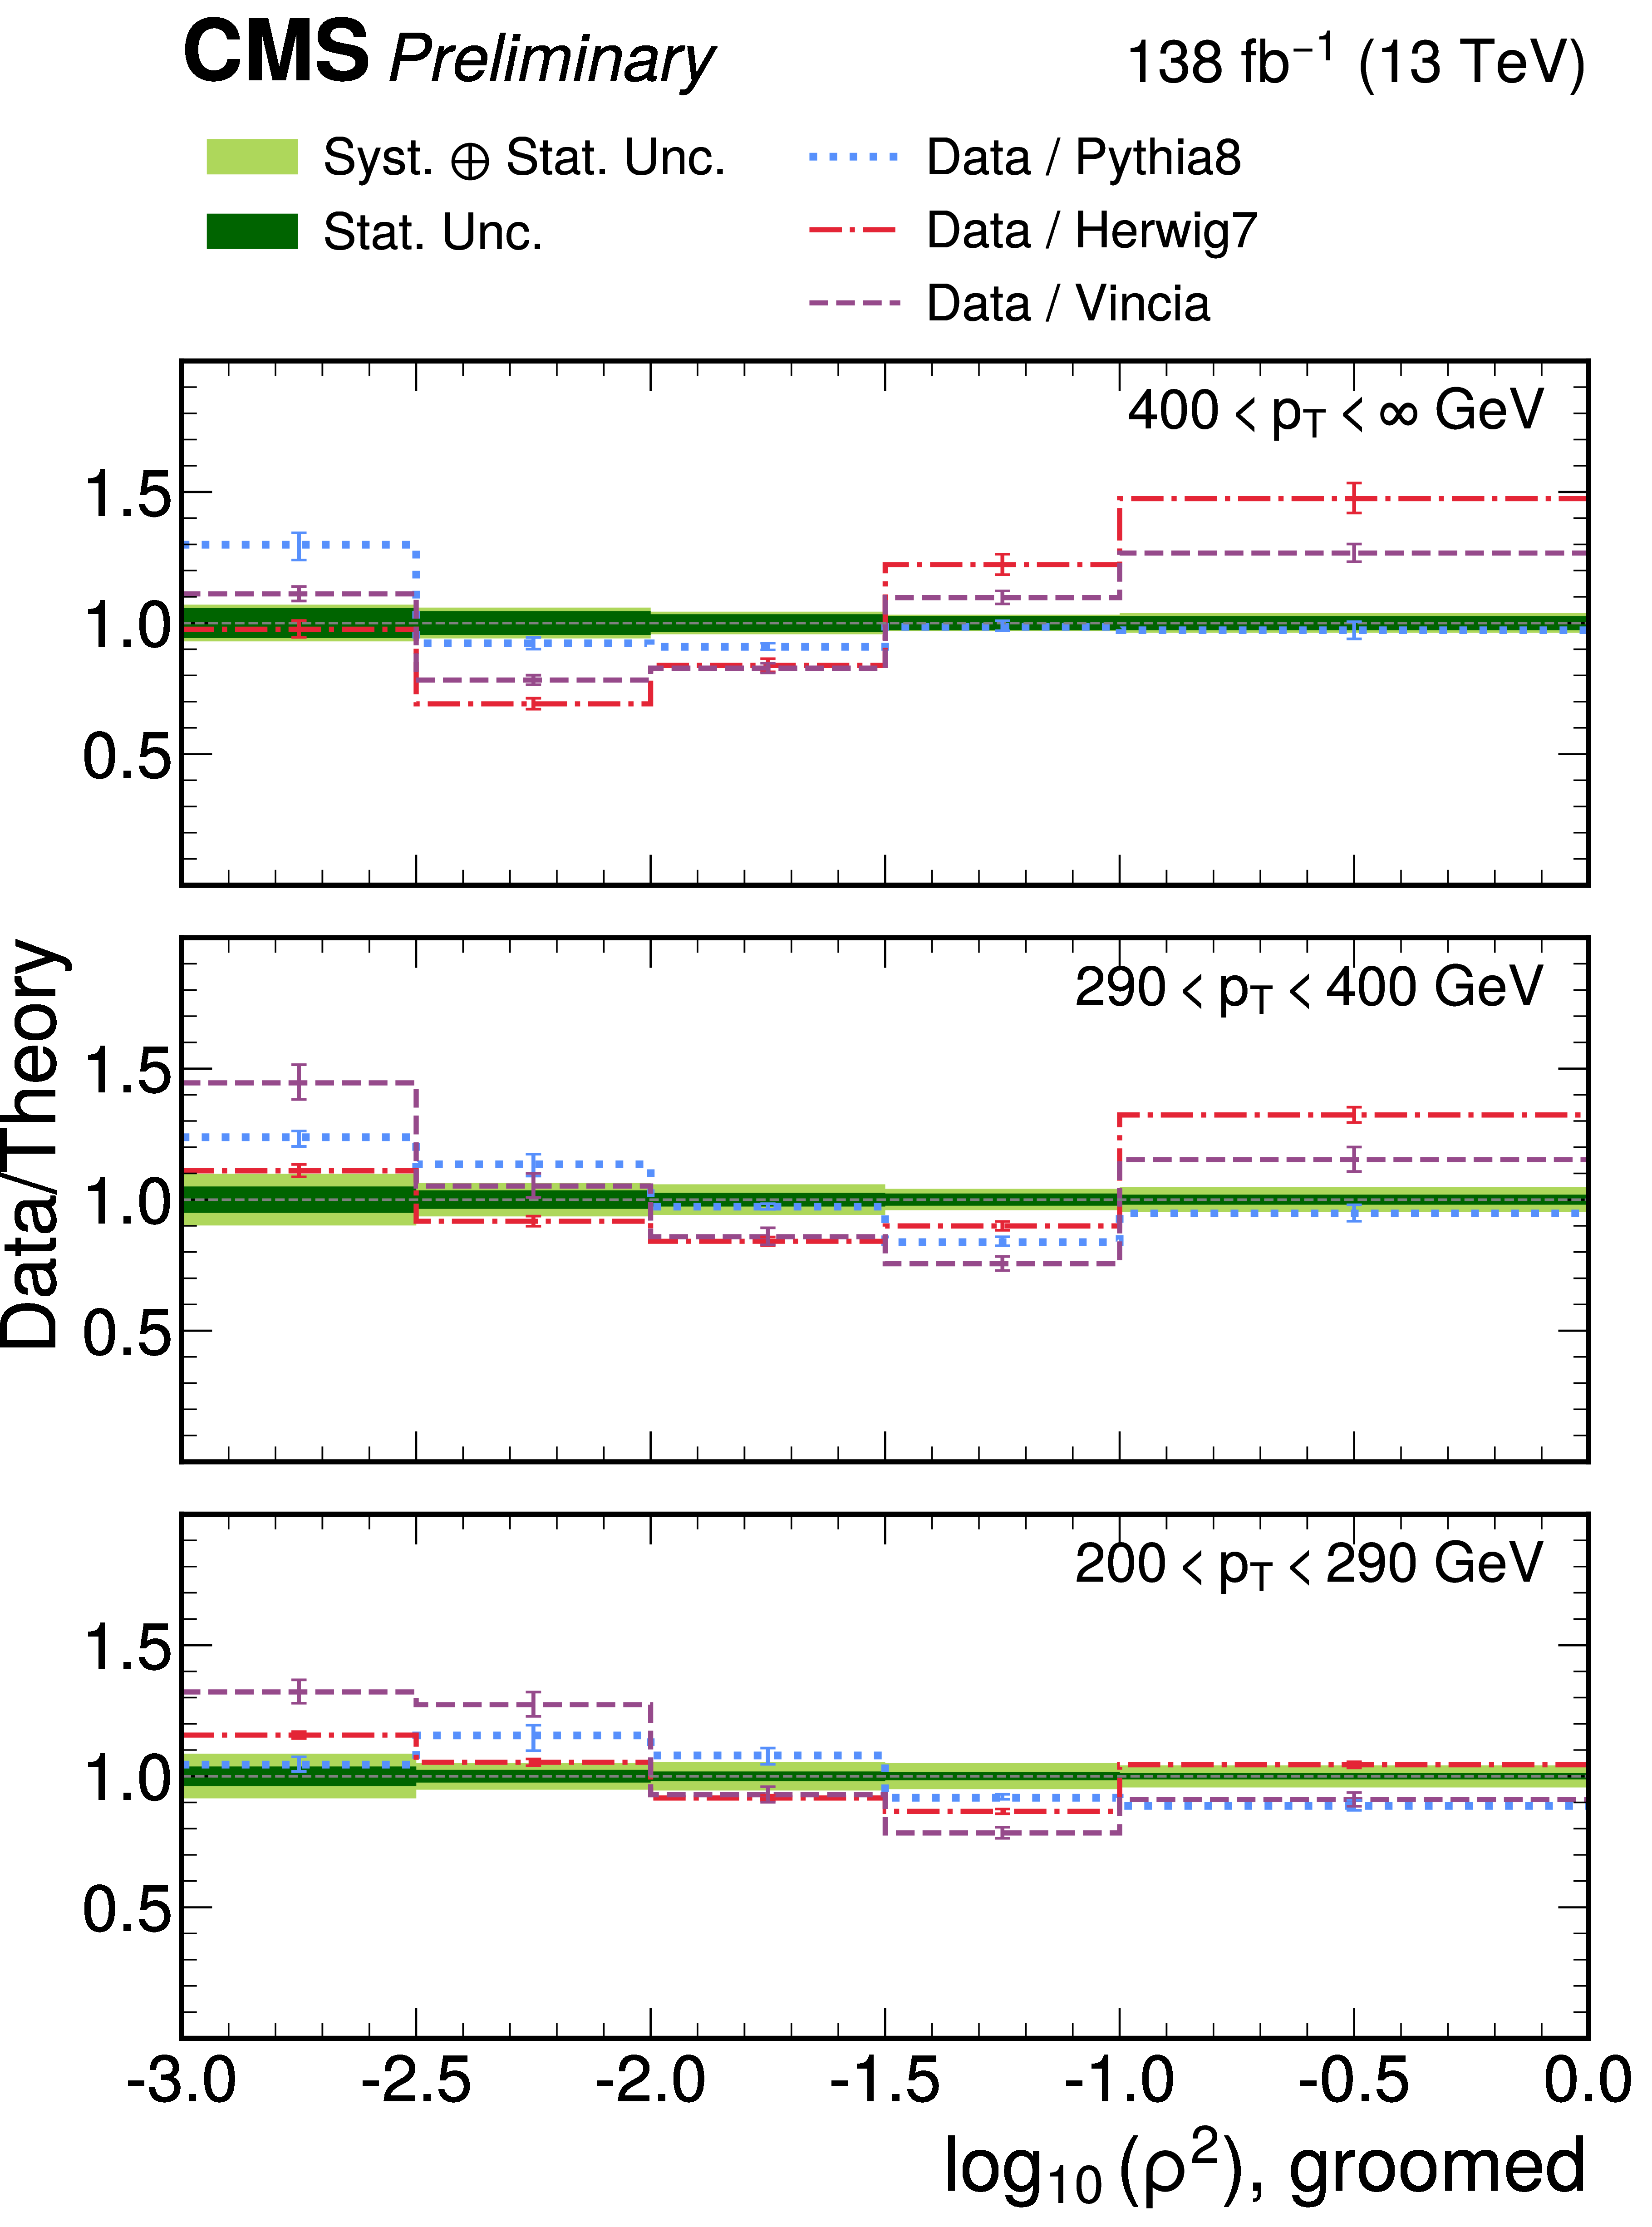
Ratios of the unfolded data to the PYTHIA8, HERWIG 7, and Vincia predictions for the ungroomed (left) and groomed (right) observables, shown separately for the three jet-$ p_{\mathrm{T}} $ intervals. The dark and light green bands around unity show the statistical and total uncertainties in the data, respectively, and the vertical bars show the statistical uncertainties of the predictions. |
png pdf |
Figure 7-a:
Ratios of the unfolded data to the PYTHIA8, HERWIG 7, and Vincia predictions for the ungroomed (left) and groomed (right) observables, shown separately for the three jet-$ p_{\mathrm{T}} $ intervals. The dark and light green bands around unity show the statistical and total uncertainties in the data, respectively, and the vertical bars show the statistical uncertainties of the predictions. |
png pdf |
Figure 7-b:
Ratios of the unfolded data to the PYTHIA8, HERWIG 7, and Vincia predictions for the ungroomed (left) and groomed (right) observables, shown separately for the three jet-$ p_{\mathrm{T}} $ intervals. The dark and light green bands around unity show the statistical and total uncertainties in the data, respectively, and the vertical bars show the statistical uncertainties of the predictions. |
| Summary |
| A measurement of double-differential groomed and ungroomed jet mass cross sections has been presented in $ \mathrm{Z}+\text{jet} $ events, using proton-proton collision data recorded by the CMS detector between 2016 and 2018 at a center-of-mass energy of 13 TeV, corresponding to an integrated luminosity of 138 fb$ ^{-1} $. The cross sections are measured as a function of the dimensionless jet mass $ \rho=m/(p_{\mathrm{T}} R) $ and the jet transverse momentum, and are unfolded to the particle level to correct for detector effects. The $ \mathrm{Z}+\text{jet} $ final state provides a sample enriched in quark-initiated jets. This is the first 13 TeV measurement of the jet mass in $ \mathrm{Z}+\text{jet} $ events. The unfolded distributions are well described by the PYTHIA8 prediction, whereas HERWIG 7 and Vincia show larger deviations, most visibly overestimating the peak and underestimating the high-mass region of the ungroomed distribution. The soft-drop grooming shifts the distribution to lower mass and removes the soft, wide-angle radiation, providing additional sensitivity to the parton-shower and hadronization modeling. These results provide a benchmark for the tuning of Monte Carlo event generators and for the understanding of the perturbative and nonperturbative QCD dynamics of jet formation. |
| References | ||||
| 1 | Y. L. Dokshitzer, V. A. Khoze, A. H. Mueller, and S. I. Troyan | Basics of perturbative QCD | Editions Frontieres, 1991 | |
| 2 | S. Marzani, G. Soyez, and M. Spannowsky | Looking inside jets: an introduction to jet substructure and boosted-object phenomenology | volume 958. Springer, 2019 link |
|
| 3 | M. Dasgupta, A. Fregoso, S. Marzani, and G. P. Salam | Towards an understanding of jet substructure | JHEP 09 (2013) 029 | 1307.0007 |
| 4 | P. Gras et al. | Systematics of quark/gluon tagging | JHEP 07 (2017) 091 | 1704.03878 |
| 5 | G. Sterman | Summation of large corrections to short-distance hadronic cross sections | NPB 281 (1987) 310 | |
| 6 | M. Dasgupta and G. P. Salam | Event shapes in electron-positron annihilation and deep inelastic scattering | JPG 30 (2004) R143 | hep-ph/0312283 |
| 7 | A. J. Larkoski, S. Marzani, G. Soyez, and J. Thaler | Soft drop | JHEP 05 (2014) 146 | 1402.2657 |
| 8 | S. D. Ellis, C. K. Vermilion, and J. R. Walsh | Recombination algorithms and jet substructure: pruning as a tool for heavy-particle searches | PRD 81 (2010) 094023 | 0912.0033 |
| 9 | D. Krohn, J. Thaler, and L.-T. Wang | Jet trimming | JHEP 02 (2010) 084 | 0912.1342 |
| 10 | CMS Collaboration | Measurements of the differential jet cross section as a function of the jet mass in dijet events from proton-proton collisions at $ \sqrt{s}= $ 13 TeV | JHEP 11 (2018) 113 | CMS-SMP-16-010 1807.05974 |
| 11 | CMS Collaboration | Measurement of the groomed jet mass in PbPb and pp collisions at $ \sqrt{s_{\mathrm{NN}}}= $ 5.02 TeV | JHEP 10 (2018) 161 | CMS-HIN-16-024 1805.05145 |
| 12 | CMS Collaboration | Studies of jet mass in dijet and W/Z+jet events | JHEP 05 (2013) 090 | CMS-SMP-12-019 1303.4811 |
| 13 | ATLAS Collaboration | Measurement of the soft-drop jet mass in pp collisions at $ \sqrt{s}= $ 13 TeV with the ATLAS detector | PRL 121 (2018) 092001 | 1711.08341 |
| 14 | CMS Collaboration | The CMS experiment at the CERN LHC | JINST 3 (2008) S08004 | |
| 15 | CMS Collaboration | Development of the CMS detector for the CERN LHC Run 3 | no. 05, P05064, 2024 JINST 19 (2024) |
CMS-PRF-21-001 2309.05466 |
| 16 | CMS Collaboration | Electron and photon reconstruction and identification with the CMS experiment at the CERN LHC | JINST 16 (2021) P05014 | CMS-EGM-17-001 2012.06888 |
| 17 | CMS Collaboration | Performance of the CMS muon detector and muon reconstruction with proton--proton collisions at $ \sqrt{s}= $ 13 TeV | JINST 13 (2018) P06015 | CMS-MUO-16-001 1804.04528 |
| 18 | CMS Collaboration | Description and performance of track and primary-vertex reconstruction with the CMS tracker | JINST 9 (2014) P10009 | CMS-TRK-11-001 1405.6569 |
| 19 | CMS Collaboration | Particle-flow reconstruction and global event description with the CMS detector | JINST 12 (2017) P10003 | CMS-PRF-14-001 1706.04965 |
| 20 | CMS Collaboration | Jet energy scale and resolution in the CMS experiment in pp collisions at 8 TeV | JINST 12 (2017) P02014 | CMS-JME-13-004 1607.03663 |
| 21 | CMS Collaboration | Performance of reconstruction and identification of $ \tau $ leptons decaying to hadrons and $ \nu_\tau $ in pp collisions at $ \sqrt{s}= $ 13 TeV | JINST 13 (2018) P10005 | CMS-TAU-16-003 1809.02816 |
| 22 | CMS Collaboration | Performance of missing transverse momentum reconstruction in proton-proton collisions at $ \sqrt{s} = $ 13 TeV using the CMS detector | JINST 14 (2019) P07004 | CMS-JME-17-001 1903.06078 |
| 23 | CMS Collaboration | Performance of the CMS level-1 trigger in proton-proton collisions at $ \sqrt{s} = $ 13 TeV | JINST 15 (2020) P10017 | CMS-TRG-17-001 2006.10165 |
| 24 | CMS Collaboration | The CMS trigger system | JINST 12 (2017) P01020 | CMS-TRG-12-001 1609.02366 |
| 25 | CMS Collaboration | Technical proposal for the Phase-II upgrade of the Compact Muon Solenoid | CMS Technical Proposal CERN-LHCC-2015-010, CMS-TDR-15-02, CERN, 2015 CDS |
|
| 26 | CMS Collaboration | Pileup mitigation at CMS in 13 TeV data | JINST 15 (2020) P09018 | CMS-JME-18-001 2003.00503 |
| 27 | D. Bertolini, P. Harris, M. Low, and N. Tran | Pileup per particle identification | JHEP 10 (2014) 059 | 1407.6013 |
| 28 | M. Cacciari, G. P. Salam, and G. Soyez | FastJet user manual | EPJC 72 (2012) 1896 | 1111.6097 |
| 29 | M. Cacciari, G. P. Salam, and G. Soyez | The anti-$ k_{\mathrm{T}} $ jet clustering algorithm | JHEP 04 (2008) 063 | 0802.1189 |
| 30 | Y. L. Dokshitzer, G. D. Leder, S. Moretti, and B. R. Webber | Better jet clustering algorithms | JHEP 08 (1997) 001 | hep-ph/9707323 |
| 31 | M. Wobisch and T. Wengler | Hadronization corrections to jet cross-sections in deep inelastic scattering | in \it Proceedings of the Workshop on Monte Carlo Generators for HERA Physics, Hamburg, Germany, 1998 link |
hep-ph/9907280 |
| 32 | CMS Collaboration | Precision luminosity measurement in proton-proton collisions at $ \sqrt{s}= $ 13 TeV in 2015 and 2016 at CMS | EPJC 81 (2021) 800 | CMS-LUM-17-003 2104.01927 |
| 33 | CMS Collaboration | CMS luminosity measurement for the 2017 data-taking period at $ \sqrt{s}= $ 13 TeV | CMS Physics Analysis Summary, CERN, 2018 CMS-PAS-LUM-17-004 |
CMS-PAS-LUM-17-004 |
| 34 | CMS Collaboration | CMS luminosity measurement for the 2018 data-taking period at $ \sqrt{s}= $ 13 TeV | CMS Physics Analysis Summary, CERN, 2019 CMS-PAS-LUM-18-002 |
CMS-PAS-LUM-18-002 |
| 35 | J. Alwall et al. | The automated computation of tree-level and next-to-leading order differential cross sections, and their matching to parton shower simulations | JHEP 07 (2014) 079 | 1405.0301 |
| 36 | M. L. Mangano, M. Moretti, F. Piccinini, and M. Treccani | Matching matrix elements and shower evolution for top-quark production in hadronic collisions | JHEP 01 (2007) 013 | hep-ph/0611129 |
| 37 | Alwall, J. and Hoeche, S. and Krauss, F. and Lavesson, N. and Loennblad, L. and Maltoni, F. and Mangano, M. L. and Moretti, M. and Papadopoulos, C. G. and Piccinini, F. and Schumann, S. and Treccani, M. and Winter, J. and Worek, M. | Comparative study of various algorithms for the merging of parton showers and matrix elements in hadronic collisions | EPJC 53 (2008) 473 | 0706.2569 |
| 38 | J. Bellm et al. | Herwig 7.0/Herwig++ 3.0 release note | EPJC 76 (2016) 196 | 1512.01178 |
| 39 | CMS Collaboration | Development and validation of HERWIG 7 tunes from CMS underlying-event measurements | EPJC 81 (2021) 312 | CMS-GEN-19-001 2011.03422 |
| 40 | N. Fischer, S. Prestel, M. Ritzmann, and P. Skands | Vincia for hadron colliders | EPJC 76 (2016) 589 | 1605.06142 |
| 41 | P. Nason | A new method for combining NLO QCD with shower Monte Carlo algorithms | JHEP 11 (2004) 040 | hep-ph/0409146 |
| 42 | S. Frixione, P. Nason, and C. Oleari | Matching NLO QCD computations with parton shower simulations: The POWHEG method | JHEP 11 (2007) 070 | 0709.2092 |
| 43 | S. Frixione, P. Nason, and G. Ridolfi | A positive-weight next-to-leading-order Monte Carlo for heavy flavour hadroproduction | JHEP 09 (2007) 126 | 0707.3088 |
| 44 | S. Alioli, P. Nason, C. Oleari, and E. Re | A general framework for implementing NLO calculations in shower Monte Carlo programs: The POWHEG BOX | JHEP 06 (2010) 043 | 1002.2581 |
| 45 | E. Re | Single-top $ {\mathrm{W}}{\mathrm{t}} $-channel production matched with parton showers using the POWHEG method | EPJC 71 (2011) 1547 | 1009.2450 |
| 46 | T. Sjöstrand et al. | An introduction to PYTHIA 8.2 | Comput. Phys. Commun. 191 (2015) 159 | 1410.3012 |
| 47 | CMS Collaboration | Extraction and validation of a new set of CMS PYTHIA8 tunes from underlying-event measurements | EPJC 80 (2020) 4 | CMS-GEN-17-001 1903.12179 |
| 48 | NNPDF Collaboration | Parton distributions from high-precision collider data | EPJC 77 (2017) 663 | 1706.00428 |
| 49 | GEANT4 Collaboration | GEANT 4 --- A simulation toolkit | NIM A 506 (2003) 250 | |
| 50 | CMS Collaboration | Measurement of the inelastic proton-proton cross section at $ \sqrt{s}= $ 13 TeV | JHEP 07 (2018) 161 | CMS-FSQ-15-005 1802.02613 |
| 51 | J. Gallicchio and M. D. Schwartz | Pure samples of quark and gluon jets at the LHC | JHEP 10 (2011) 103 | 1104.1175 |
| 52 | S. Schmitt | TUnfold, an algorithm for correcting migration effects in high energy physics | JINST 7 (2012) T10003 | 1205.6201 |
|
|
Compact Muon Solenoid LHC, CERN |

|

|

|

|

|

|