

Compact Muon Solenoid
LHC, CERN
| CMS-PAS-HIG-23-015 | ||
| Differential cross section measurement of $ \mathrm{t\bar{t}H} $ production in proton-proton collisions at $ \sqrt{s}= $ 13 TeV in CMS | ||
| CMS Collaboration | ||
| 5 December 2024 | ||
| Abstract: The production of a Higgs (H) boson in association with two top quarks ($ \mathrm{t\bar{t}H} $) in final states containing multiple electrons, muons, or hadronically decaying tau leptons is measured using proton-proton collisions recorded at a center-of-mass energy of 13 TeV with the CMS detector. The analyzed data correspond to an integrated luminosity of 138 fb$^{-1}$. The analysis aims at events that contain $ \mathrm{H \rightarrow WW} $ or $ \mathrm{H \rightarrow} \tau \tau $ decays and the top quarks decay into final states with leptons or hadrons. The signal sensitivity is maximized by partitioning the selected events depending on the lepton multiplicity into three exclusive event categories: 2$ \ell $ ``same sign'' + 0 hadronic tau leptons, 2$ \ell $ ``same sign'' + 1 hadronic tau lepton, and 3$ \ell $ ``same sign'' + 0 hadronic tau leptons, where $ \ell $ denotes charged light leptons (e, $ \mu $). Differential production rates are measured as a function of the H boson transverse momentum and of the mass of the $ \mathrm{t\bar{t}H} $ system and found to be compatible with predictions from the standard model of particle physics. This result is the first differential measurement of $ \mathrm{t\bar{t}H} $ production to date by the CMS Collaboration. | ||
| Links: CDS record (PDF) ; CADI line (restricted) ; | ||
| Figures | |

png pdf |
Figure 1:
Feynman diagrams at LO for $ \mathrm{t}\overline{\mathrm{t}}\mathrm{H} $ production. |
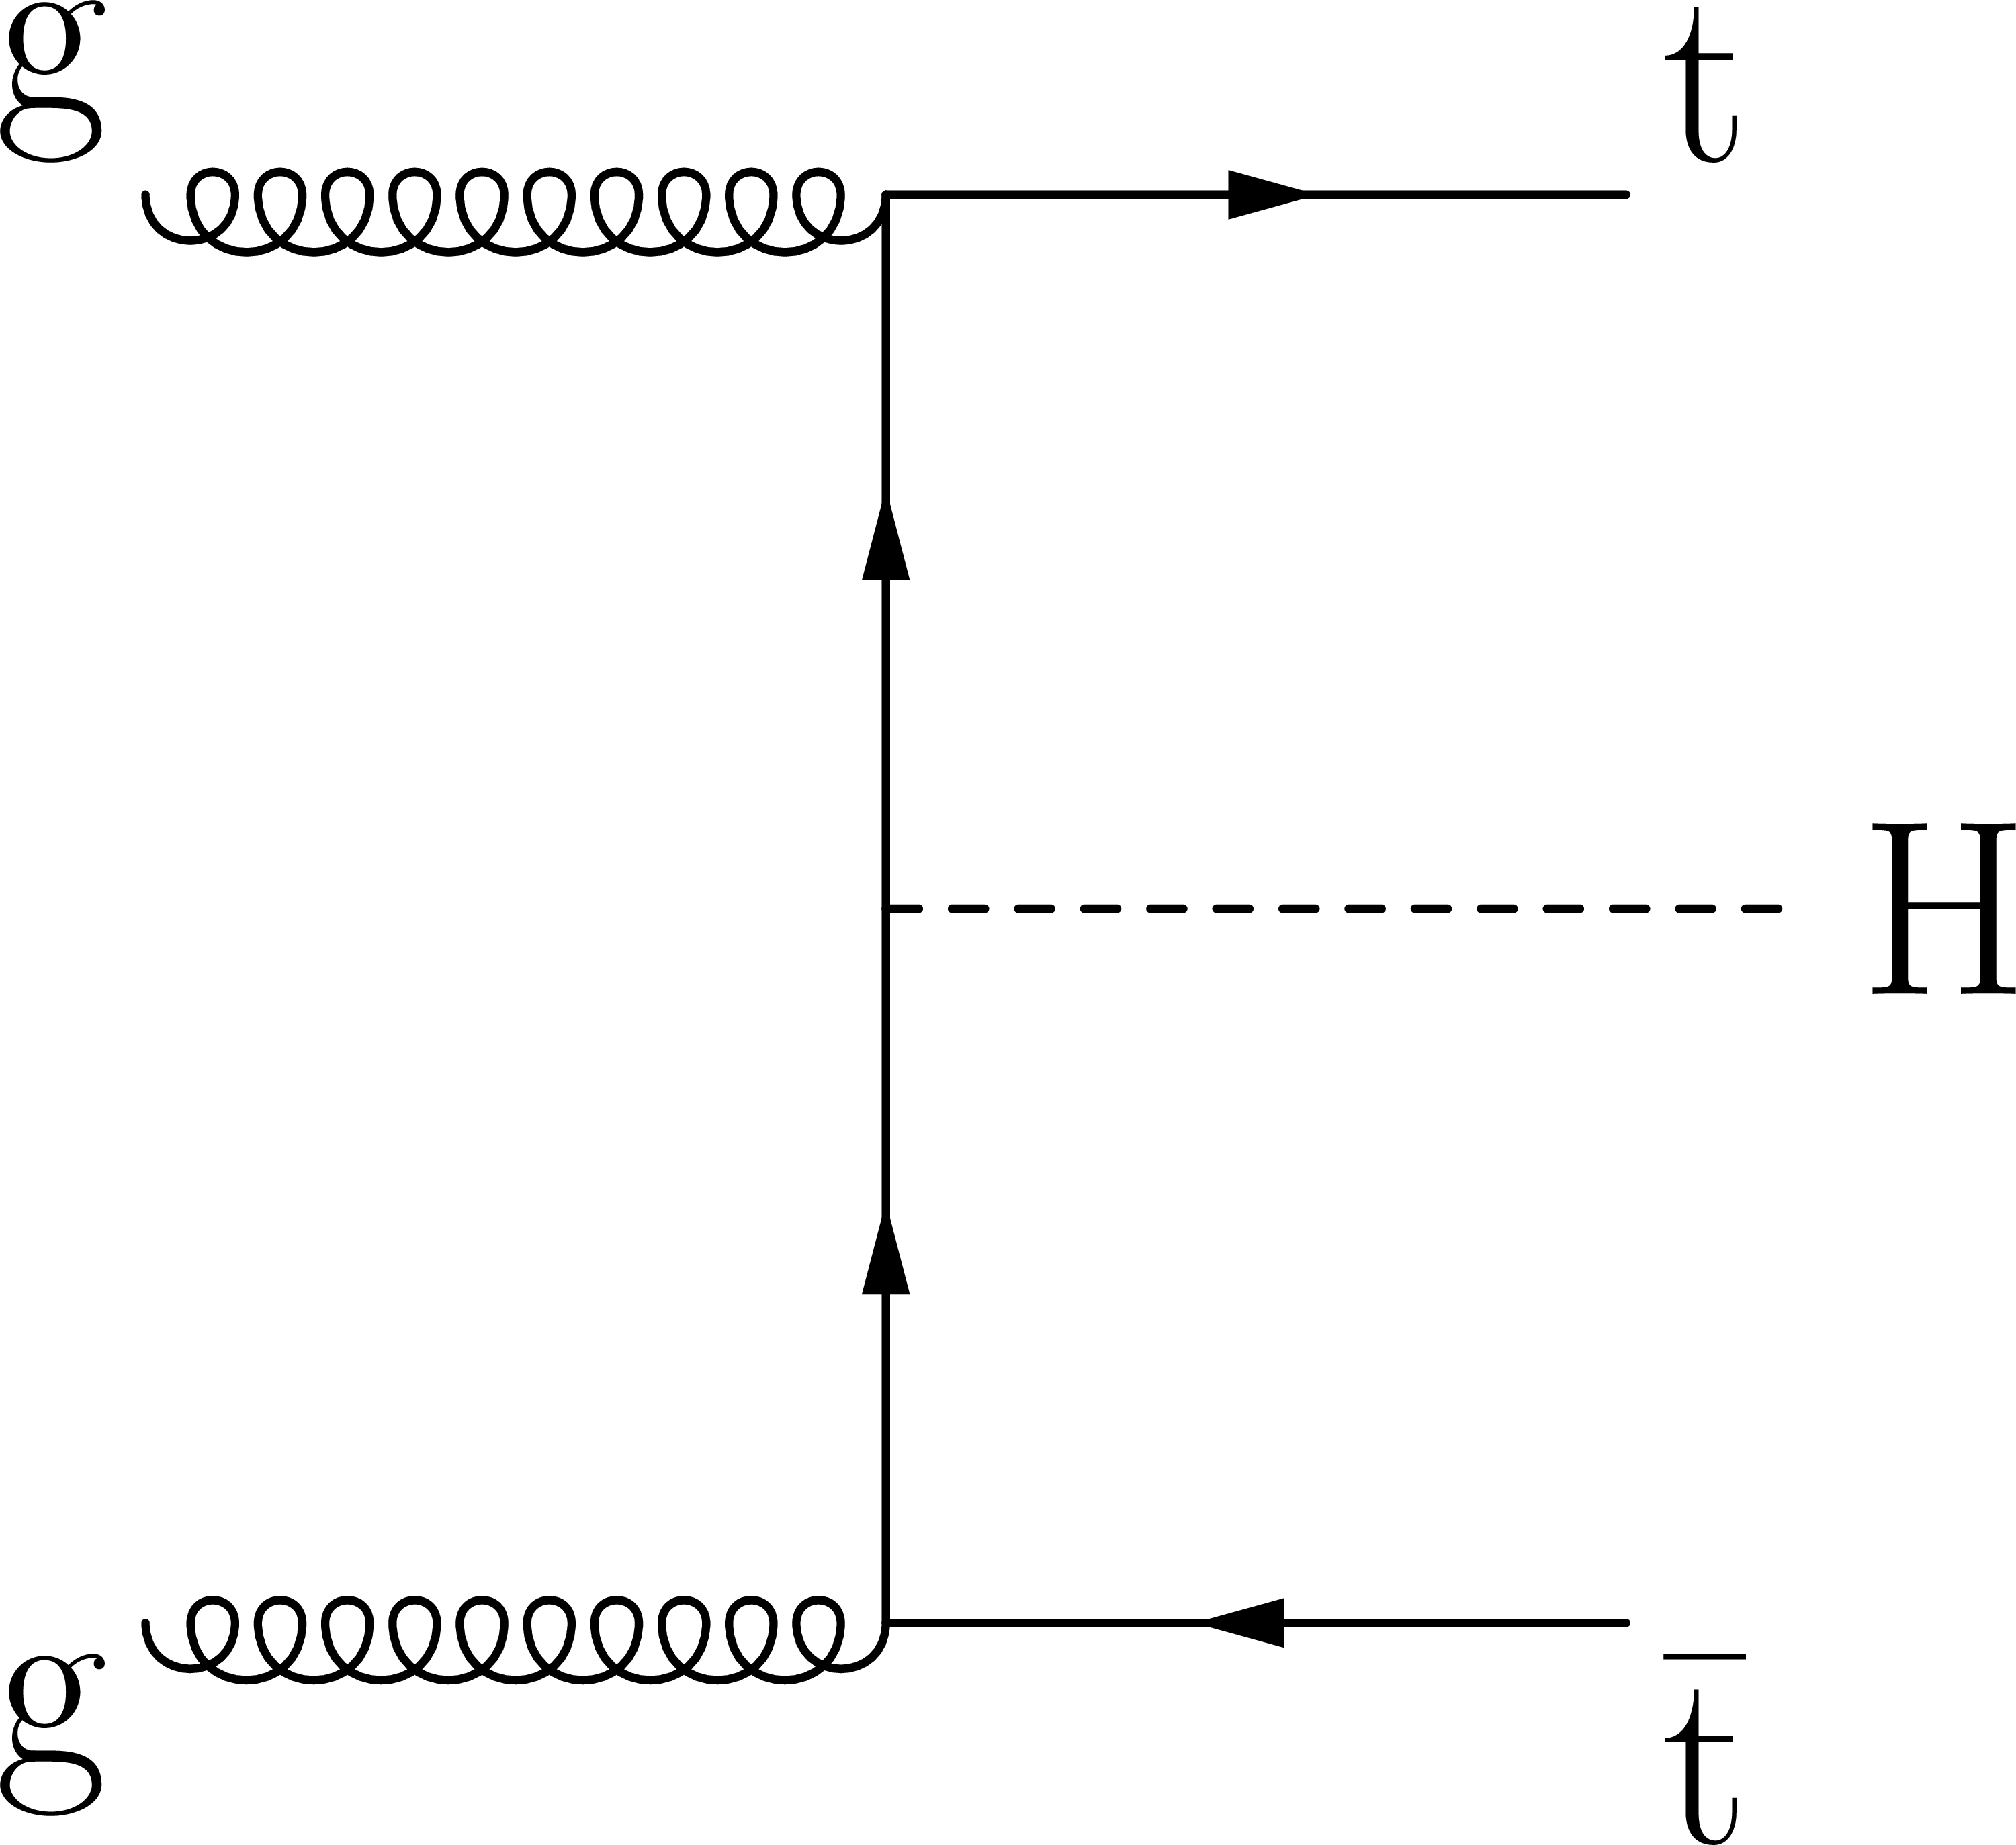
png pdf |
Figure 1-a:
Feynman diagrams at LO for $ \mathrm{t}\overline{\mathrm{t}}\mathrm{H} $ production. |

png pdf |
Figure 1-b:
Feynman diagrams at LO for $ \mathrm{t}\overline{\mathrm{t}}\mathrm{H} $ production. |

png pdf |
Figure 2:
Feynman diagrams at LO for $ \mathrm{t}\mathrm{H} $ production via the $ t $-channel ($ \mathrm{t}\mathrm{H}\mathrm{q} $ in upper left and upper right) and $ s $-channel (middle ) processes, and for associated production of a H boson with a single top quark and a W boson ($ \mathrm{t}\mathrm{H}\mathrm{W} $ in lower left and lower right). The $ \mathrm{t}\mathrm{H}\mathrm{q} $ and $ \mathrm{t}\mathrm{H}\mathrm{W} $ production processes are shown for the five-flavour scheme described in Section 3. |

png pdf |
Figure 2-a:
Feynman diagrams at LO for $ \mathrm{t}\mathrm{H} $ production via the $ t $-channel ($ \mathrm{t}\mathrm{H}\mathrm{q} $ in upper left and upper right) and $ s $-channel (middle ) processes, and for associated production of a H boson with a single top quark and a W boson ($ \mathrm{t}\mathrm{H}\mathrm{W} $ in lower left and lower right). The $ \mathrm{t}\mathrm{H}\mathrm{q} $ and $ \mathrm{t}\mathrm{H}\mathrm{W} $ production processes are shown for the five-flavour scheme described in Section 3. |

png pdf |
Figure 2-b:
Feynman diagrams at LO for $ \mathrm{t}\mathrm{H} $ production via the $ t $-channel ($ \mathrm{t}\mathrm{H}\mathrm{q} $ in upper left and upper right) and $ s $-channel (middle ) processes, and for associated production of a H boson with a single top quark and a W boson ($ \mathrm{t}\mathrm{H}\mathrm{W} $ in lower left and lower right). The $ \mathrm{t}\mathrm{H}\mathrm{q} $ and $ \mathrm{t}\mathrm{H}\mathrm{W} $ production processes are shown for the five-flavour scheme described in Section 3. |
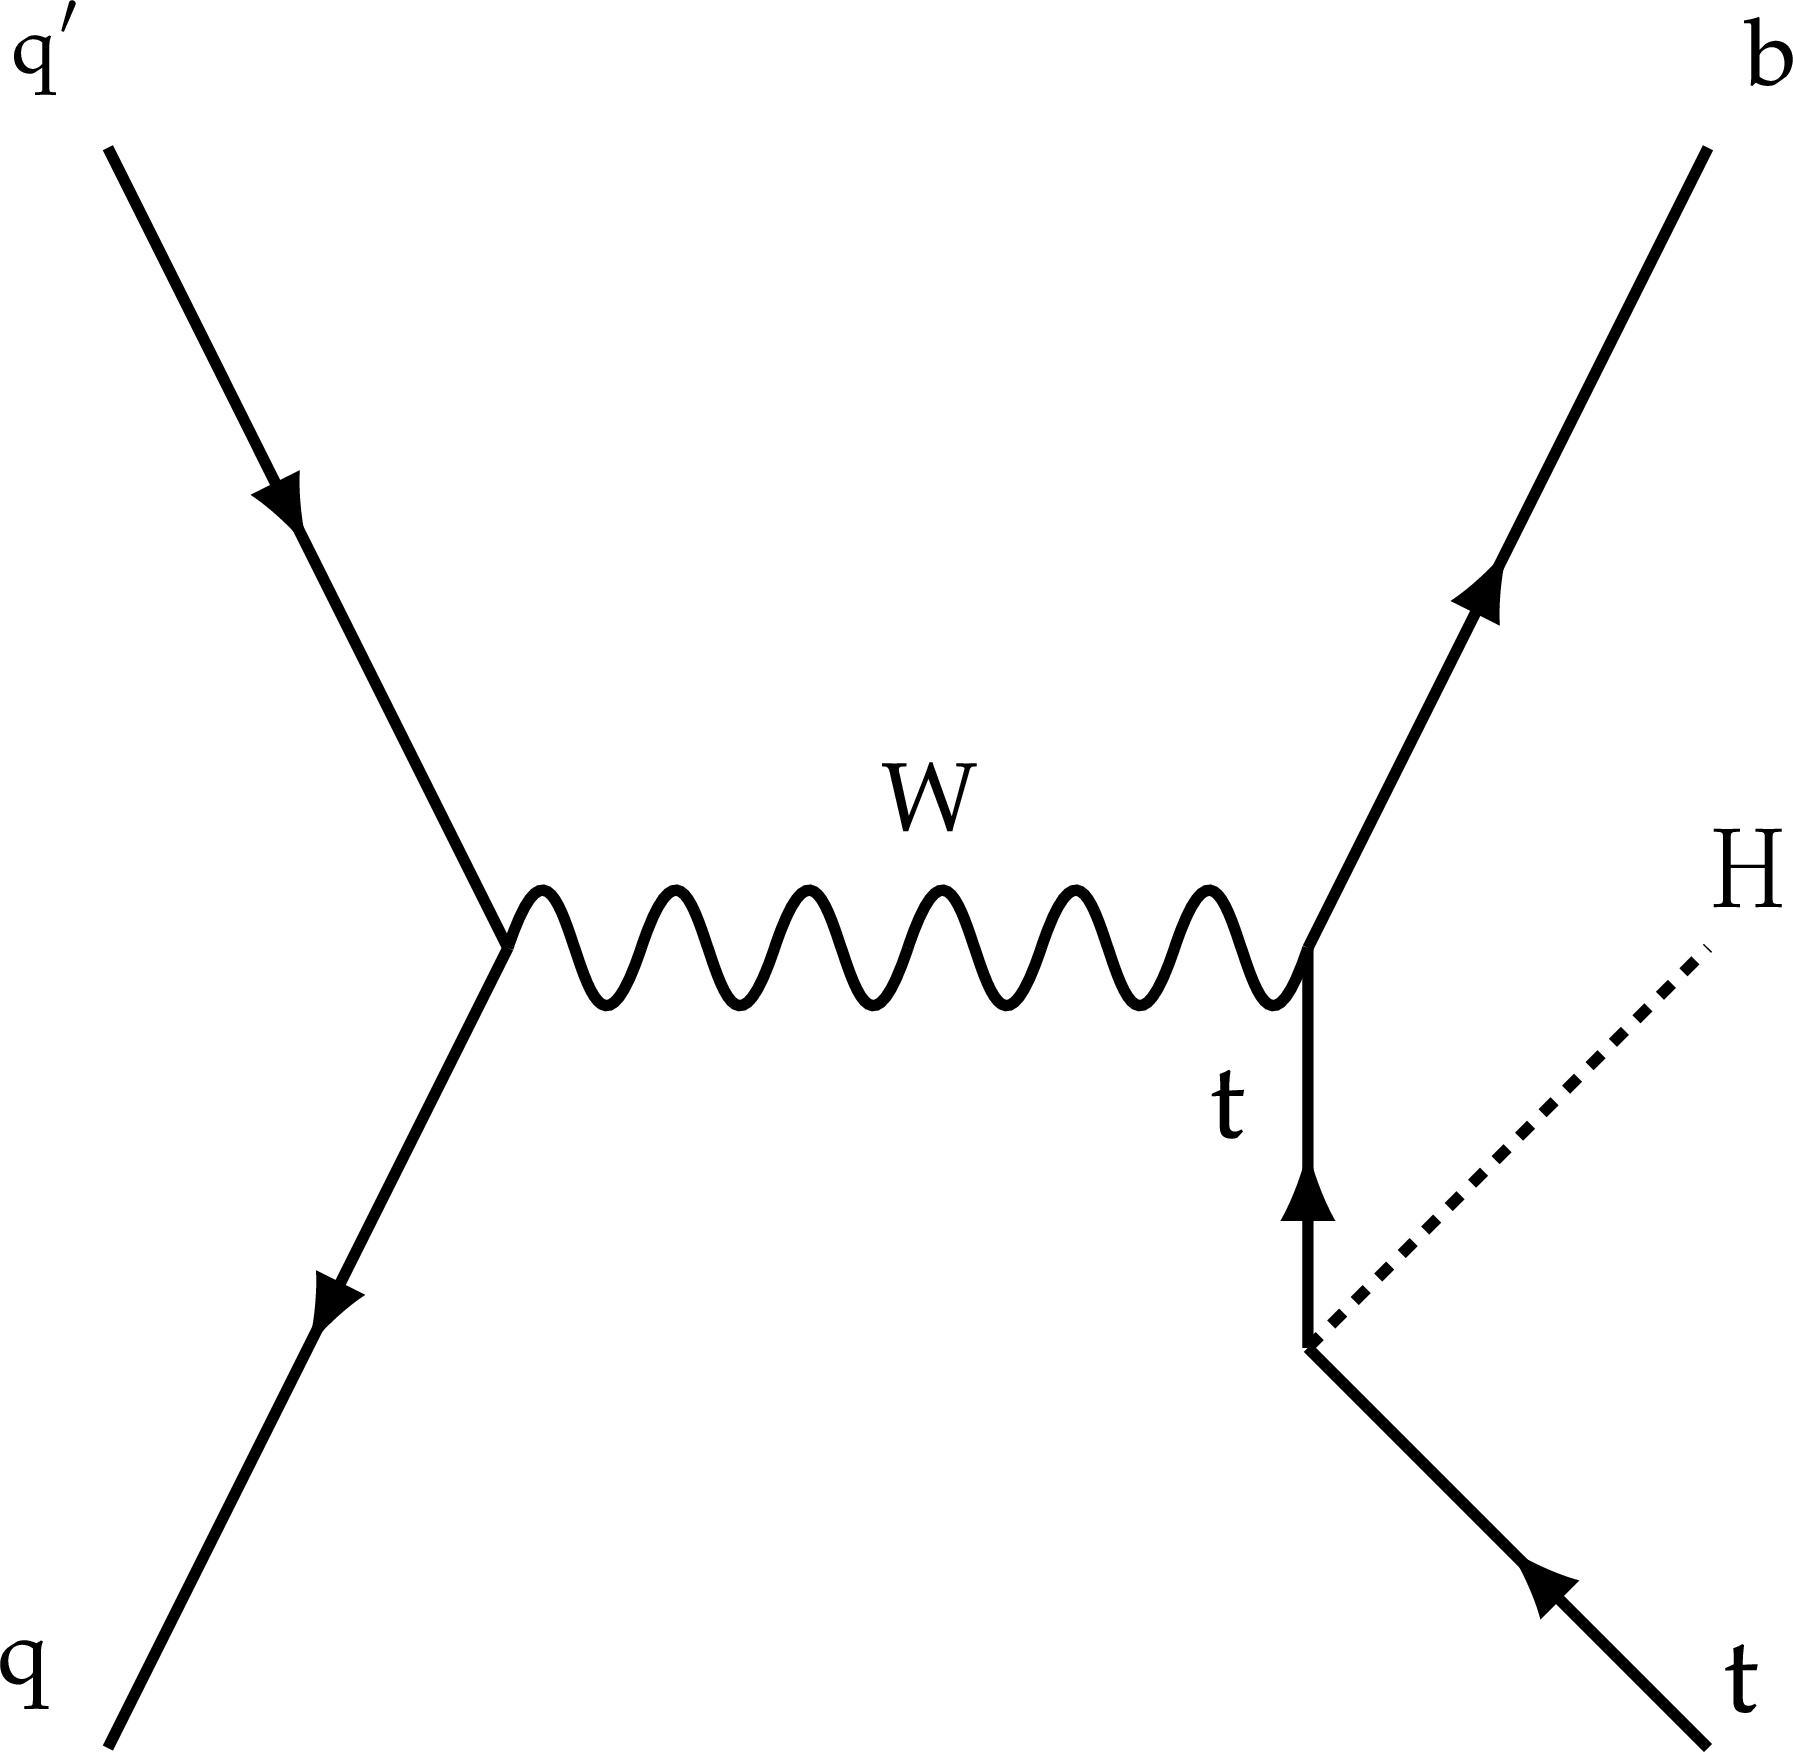
png pdf |
Figure 2-c:
Feynman diagrams at LO for $ \mathrm{t}\mathrm{H} $ production via the $ t $-channel ($ \mathrm{t}\mathrm{H}\mathrm{q} $ in upper left and upper right) and $ s $-channel (middle ) processes, and for associated production of a H boson with a single top quark and a W boson ($ \mathrm{t}\mathrm{H}\mathrm{W} $ in lower left and lower right). The $ \mathrm{t}\mathrm{H}\mathrm{q} $ and $ \mathrm{t}\mathrm{H}\mathrm{W} $ production processes are shown for the five-flavour scheme described in Section 3. |
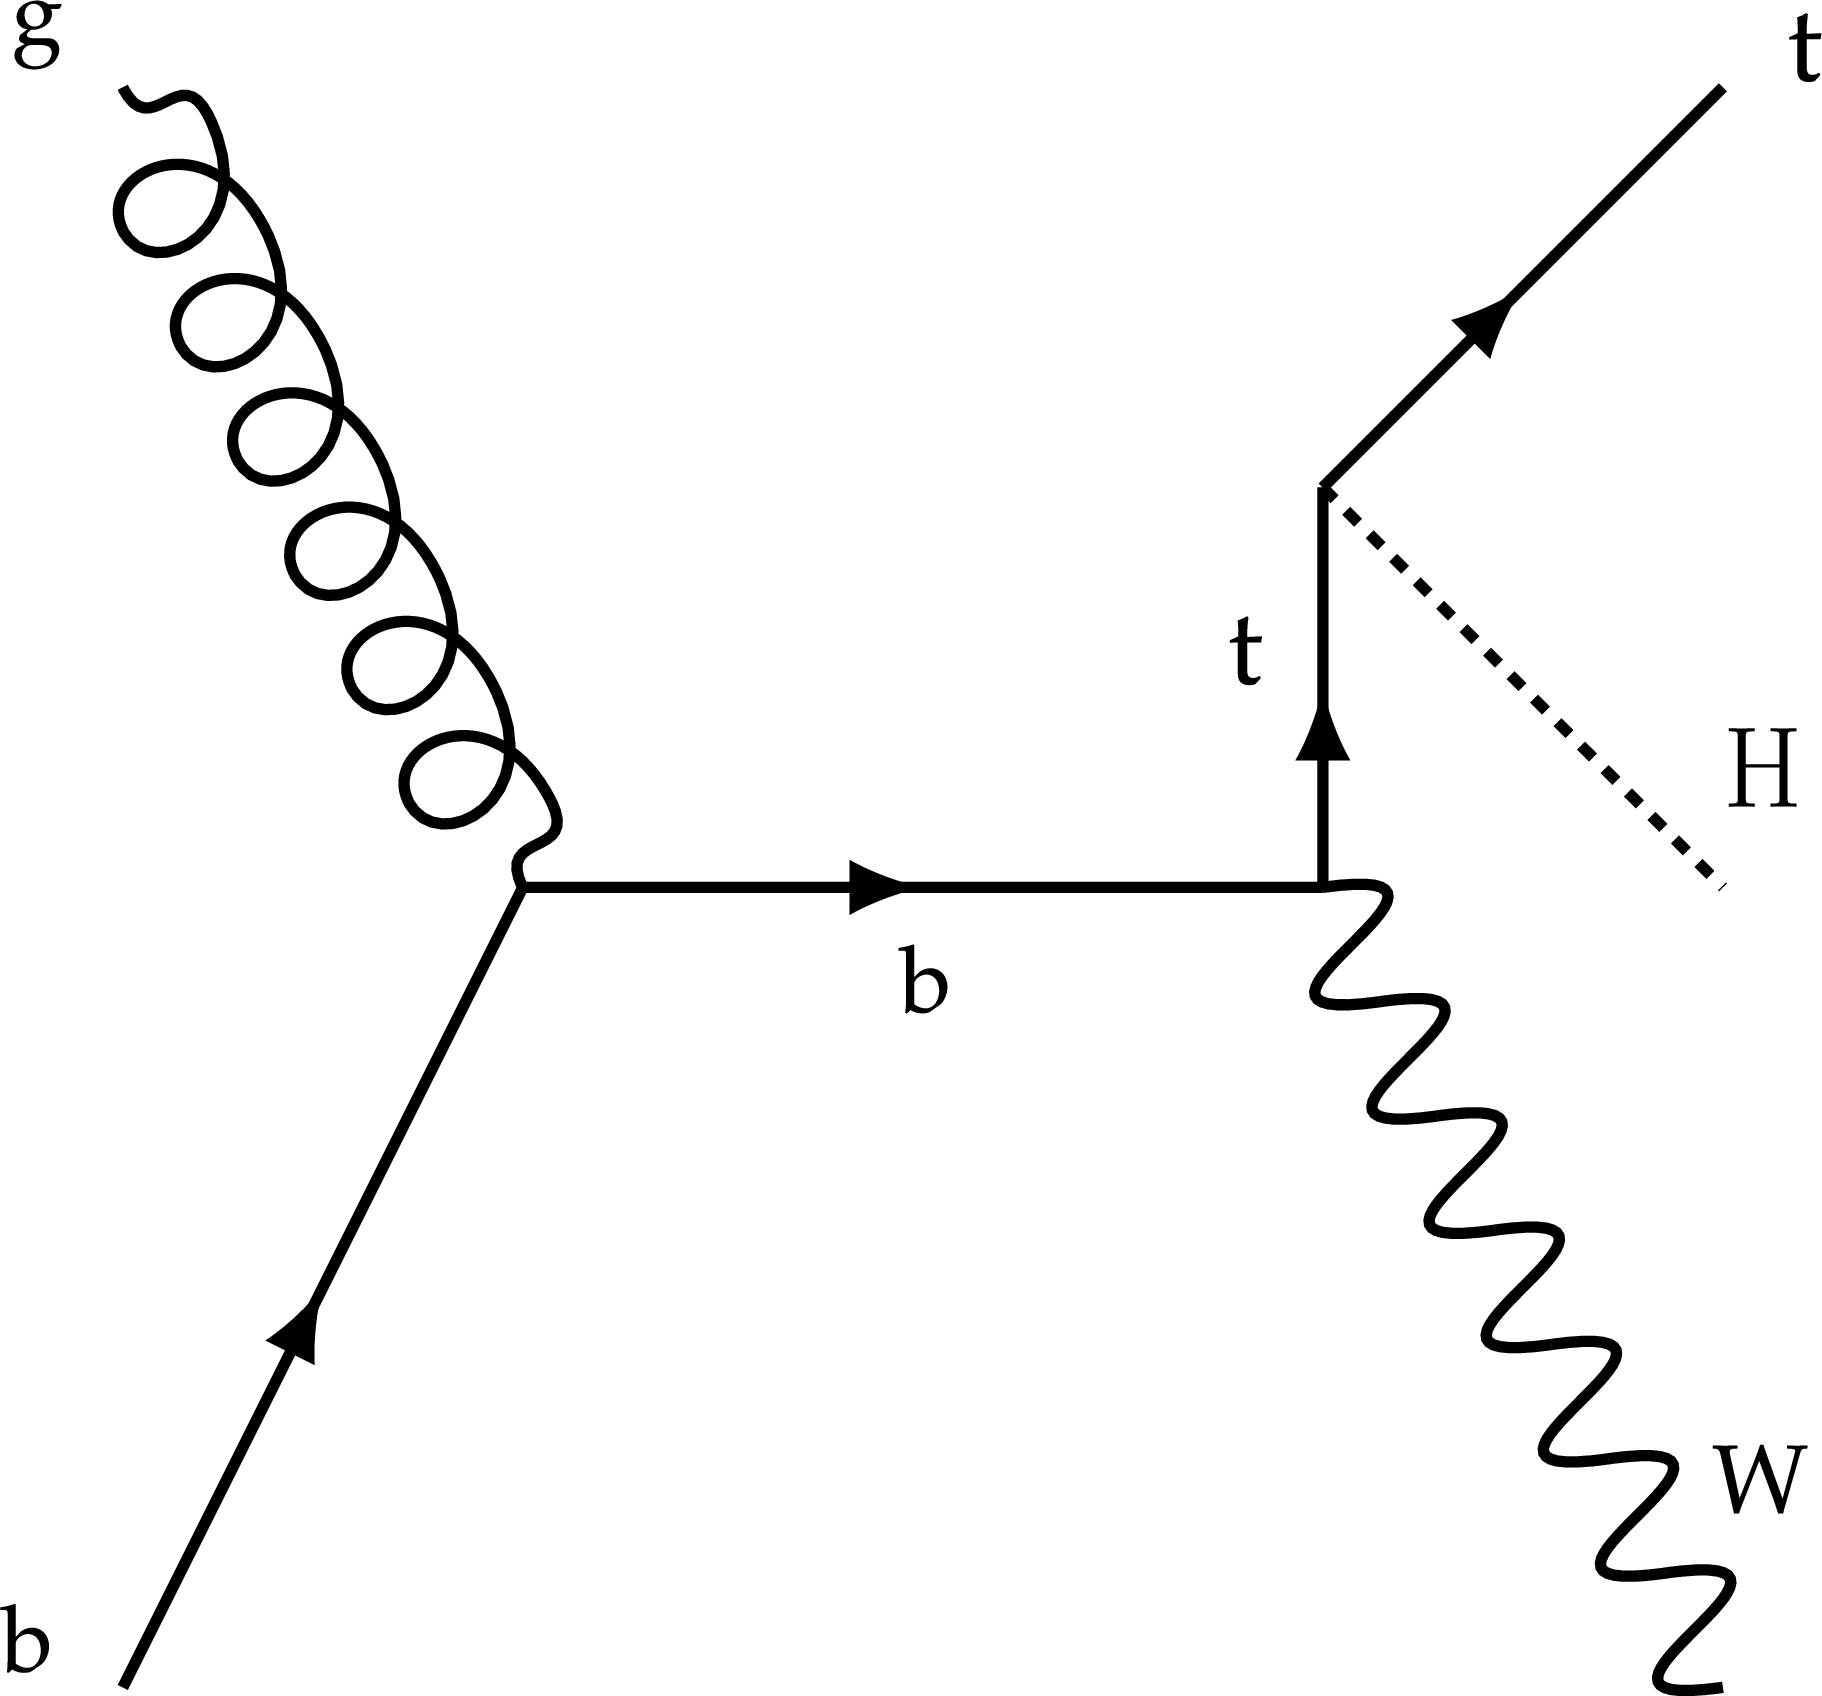
png pdf |
Figure 2-d:
Feynman diagrams at LO for $ \mathrm{t}\mathrm{H} $ production via the $ t $-channel ($ \mathrm{t}\mathrm{H}\mathrm{q} $ in upper left and upper right) and $ s $-channel (middle ) processes, and for associated production of a H boson with a single top quark and a W boson ($ \mathrm{t}\mathrm{H}\mathrm{W} $ in lower left and lower right). The $ \mathrm{t}\mathrm{H}\mathrm{q} $ and $ \mathrm{t}\mathrm{H}\mathrm{W} $ production processes are shown for the five-flavour scheme described in Section 3. |
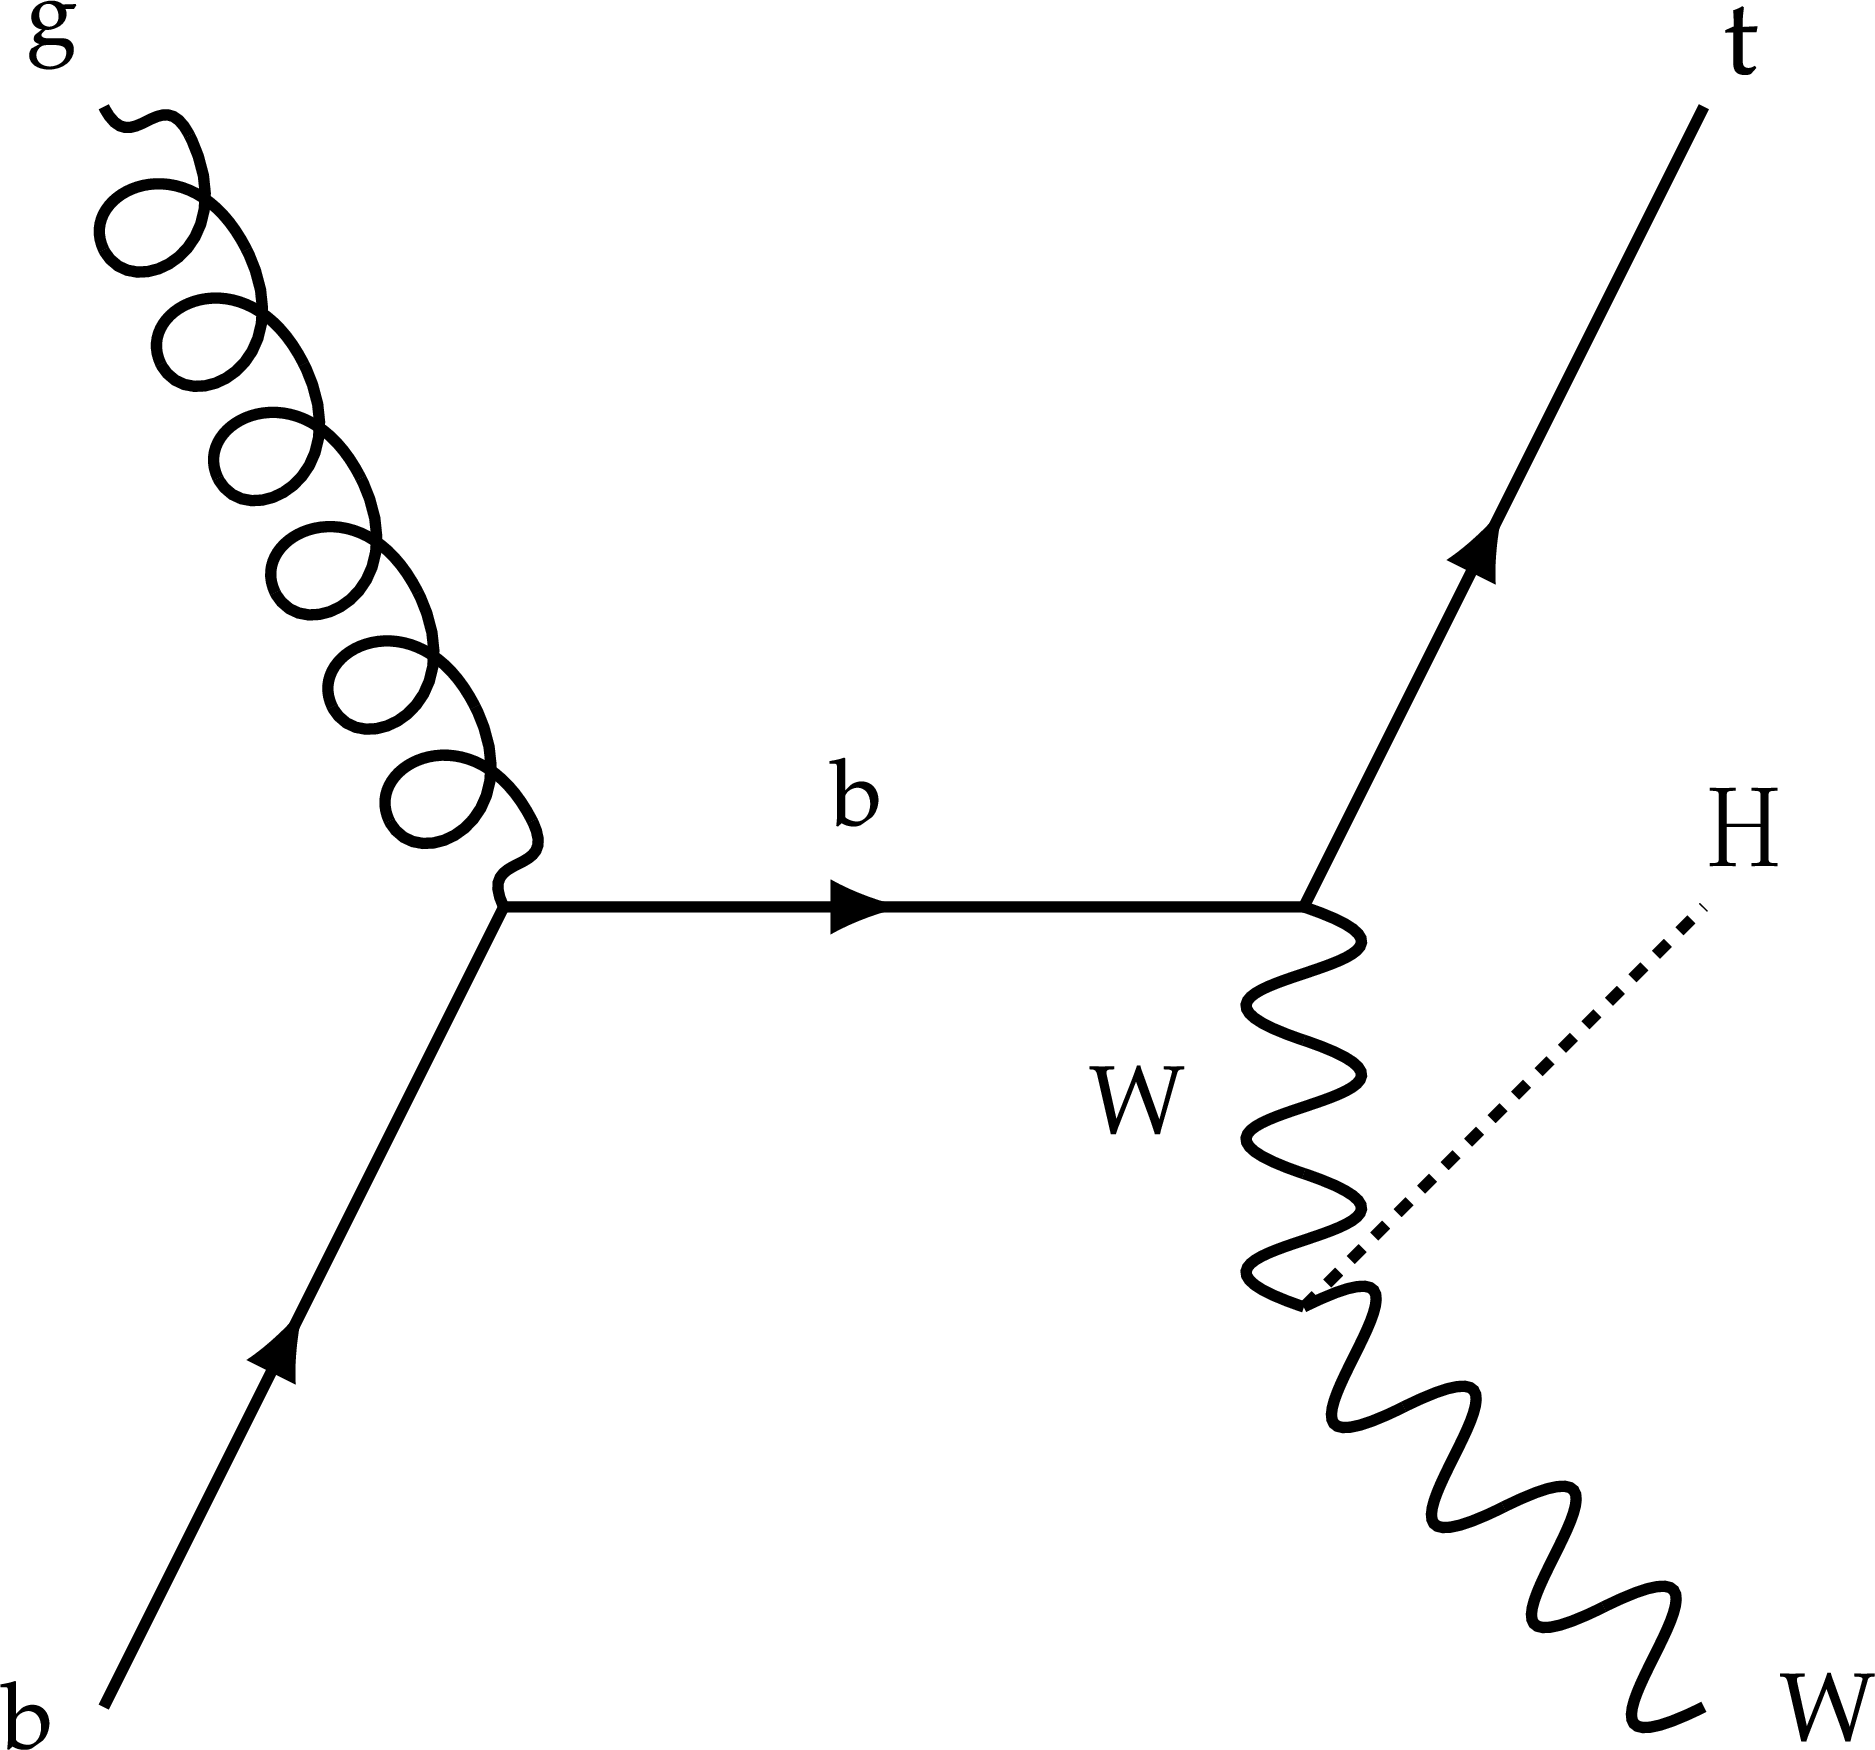
png pdf |
Figure 2-e:
Feynman diagrams at LO for $ \mathrm{t}\mathrm{H} $ production via the $ t $-channel ($ \mathrm{t}\mathrm{H}\mathrm{q} $ in upper left and upper right) and $ s $-channel (middle ) processes, and for associated production of a H boson with a single top quark and a W boson ($ \mathrm{t}\mathrm{H}\mathrm{W} $ in lower left and lower right). The $ \mathrm{t}\mathrm{H}\mathrm{q} $ and $ \mathrm{t}\mathrm{H}\mathrm{W} $ production processes are shown for the five-flavour scheme described in Section 3. |
png pdf |
Figure 3:
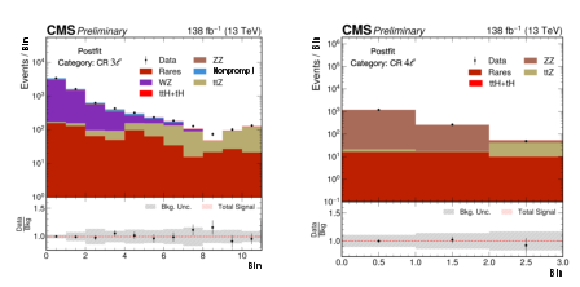
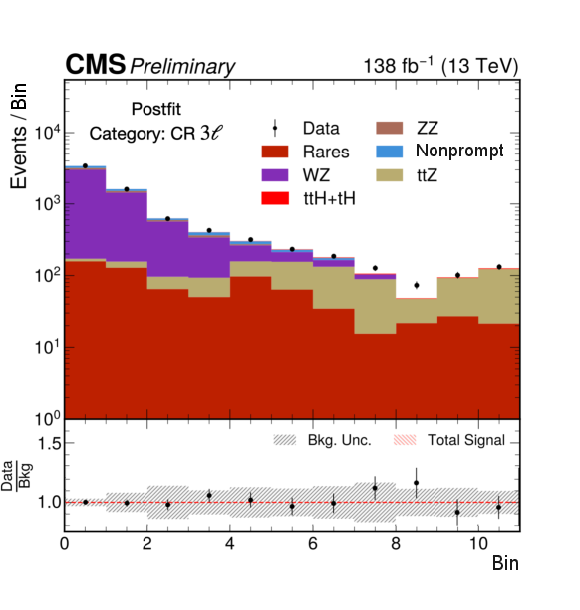
The distribution of the number of jets in the 3$ \ell $ and 4$ \ell $ CRs. In the 3$ \ell $ CR, bins one to four correspond to events without b jets, bins five to eight correspond to events with exactly one b jet, and bins nine to twelve correspond to events with more than one b jet. In the 4$ \ell $ CR, the first bin corresponds to events without jets, the second bin corresponds to events with more than zero jets and exactly one b jet, and the third bin corresponds to events with more than one jet and more than one b jet. The 3$ \ell $ CR is dominated by WZ background, while the 4$ \ell $ CR is dominated by ZZ. |
png pdf |
Figure 3-a:
The distribution of the number of jets in the 3$ \ell $ and 4$ \ell $ CRs. In the 3$ \ell $ CR, bins one to four correspond to events without b jets, bins five to eight correspond to events with exactly one b jet, and bins nine to twelve correspond to events with more than one b jet. In the 4$ \ell $ CR, the first bin corresponds to events without jets, the second bin corresponds to events with more than zero jets and exactly one b jet, and the third bin corresponds to events with more than one jet and more than one b jet. The 3$ \ell $ CR is dominated by WZ background, while the 4$ \ell $ CR is dominated by ZZ. |

png pdf |
Figure 3-b:
The distribution of the number of jets in the 3$ \ell $ and 4$ \ell $ CRs. In the 3$ \ell $ CR, bins one to four correspond to events without b jets, bins five to eight correspond to events with exactly one b jet, and bins nine to twelve correspond to events with more than one b jet. In the 4$ \ell $ CR, the first bin corresponds to events without jets, the second bin corresponds to events with more than zero jets and exactly one b jet, and the third bin corresponds to events with more than one jet and more than one b jet. The 3$ \ell $ CR is dominated by WZ background, while the 4$ \ell $ CR is dominated by ZZ. |
png pdf |
Figure 4:
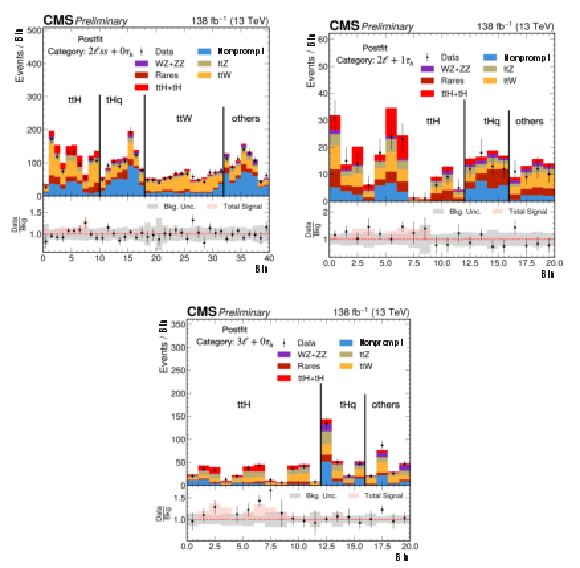
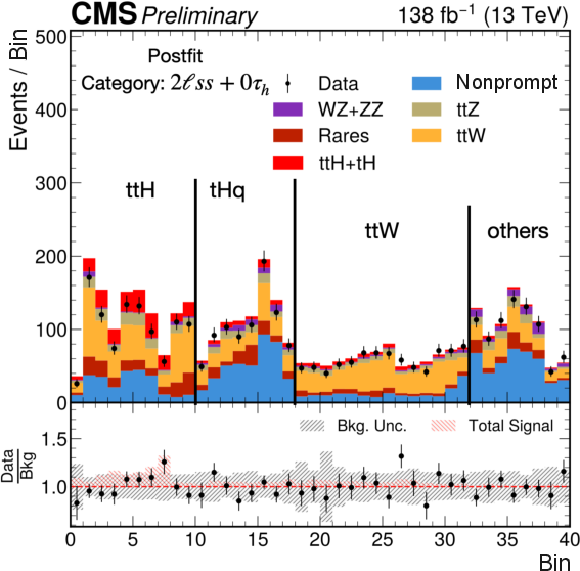
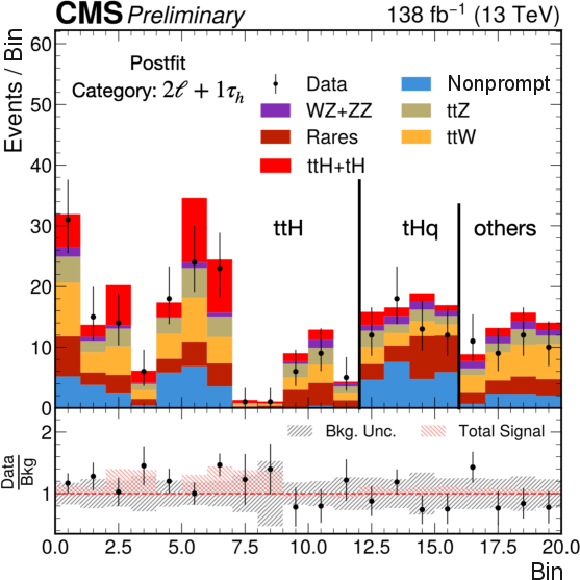
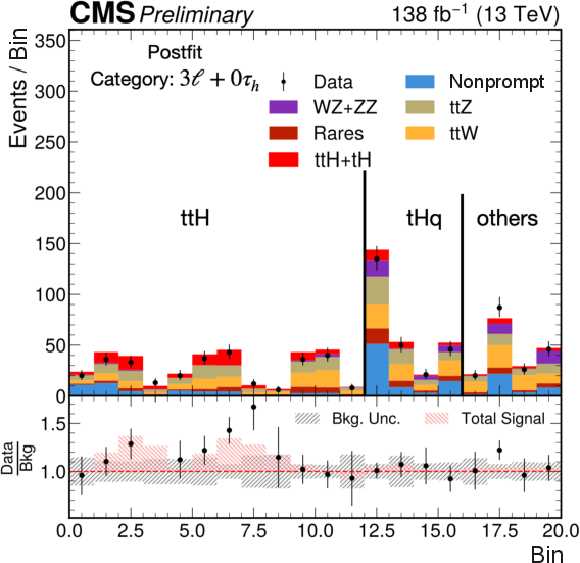
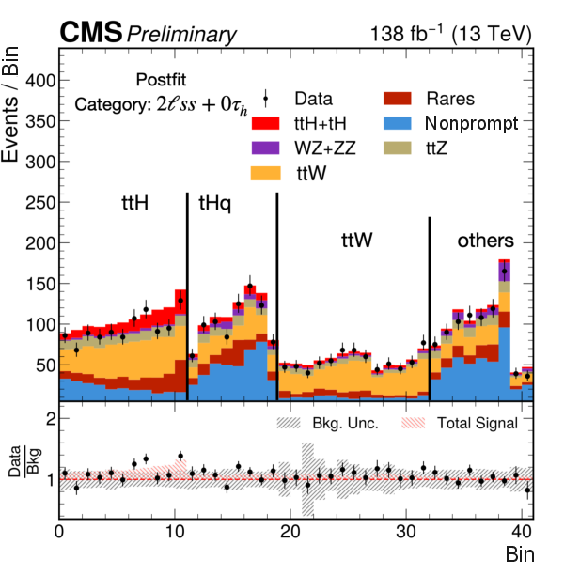
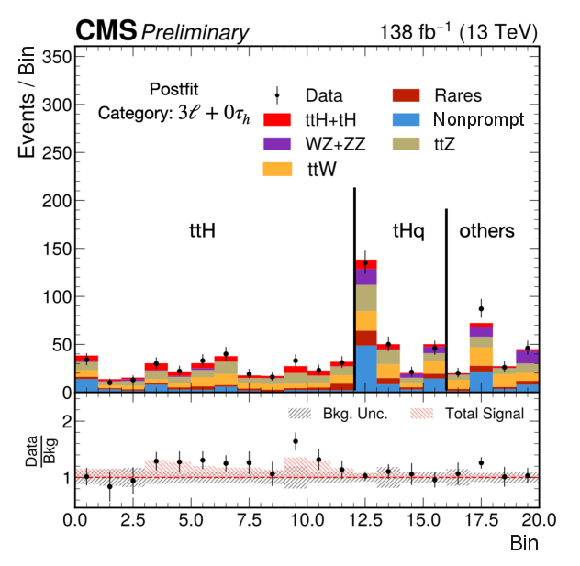
Postfit distributions of the DNN discriminant for 2 $ \ell ss + 0\tau_\mathrm{h} $ (upper left), 2 $ \ell ss + 1\tau_\mathrm{h} $ (upper right) and 3 $ \ell + 0\tau_\mathrm{h} $ (bottom) categories. All nodes of the DNN classifier are shown in the plots, $ \mathrm{t}\overline{\mathrm{t}}\mathrm{W} $ and $ \mathrm{t}\overline{\mathrm{t}}\mathrm{Z} $ are the most abundant backgrounds in the $ \mathrm{t}\overline{\mathrm{t}}\mathrm{H} $ node. |
png pdf |
Figure 4-a:
Postfit distributions of the DNN discriminant for 2 $ \ell ss + 0\tau_\mathrm{h} $ (upper left), 2 $ \ell ss + 1\tau_\mathrm{h} $ (upper right) and 3 $ \ell + 0\tau_\mathrm{h} $ (bottom) categories. All nodes of the DNN classifier are shown in the plots, $ \mathrm{t}\overline{\mathrm{t}}\mathrm{W} $ and $ \mathrm{t}\overline{\mathrm{t}}\mathrm{Z} $ are the most abundant backgrounds in the $ \mathrm{t}\overline{\mathrm{t}}\mathrm{H} $ node. |
png pdf |
Figure 4-b:
Postfit distributions of the DNN discriminant for 2 $ \ell ss + 0\tau_\mathrm{h} $ (upper left), 2 $ \ell ss + 1\tau_\mathrm{h} $ (upper right) and 3 $ \ell + 0\tau_\mathrm{h} $ (bottom) categories. All nodes of the DNN classifier are shown in the plots, $ \mathrm{t}\overline{\mathrm{t}}\mathrm{W} $ and $ \mathrm{t}\overline{\mathrm{t}}\mathrm{Z} $ are the most abundant backgrounds in the $ \mathrm{t}\overline{\mathrm{t}}\mathrm{H} $ node. |
png pdf |
Figure 4-c:
Postfit distributions of the DNN discriminant for 2 $ \ell ss + 0\tau_\mathrm{h} $ (upper left), 2 $ \ell ss + 1\tau_\mathrm{h} $ (upper right) and 3 $ \ell + 0\tau_\mathrm{h} $ (bottom) categories. All nodes of the DNN classifier are shown in the plots, $ \mathrm{t}\overline{\mathrm{t}}\mathrm{W} $ and $ \mathrm{t}\overline{\mathrm{t}}\mathrm{Z} $ are the most abundant backgrounds in the $ \mathrm{t}\overline{\mathrm{t}}\mathrm{H} $ node. |
png pdf |
Figure 5:
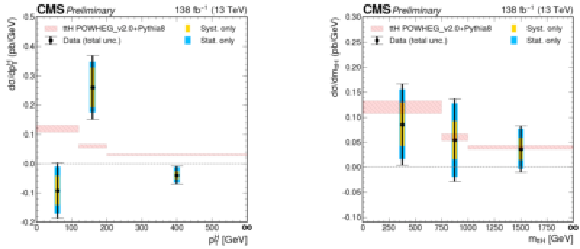
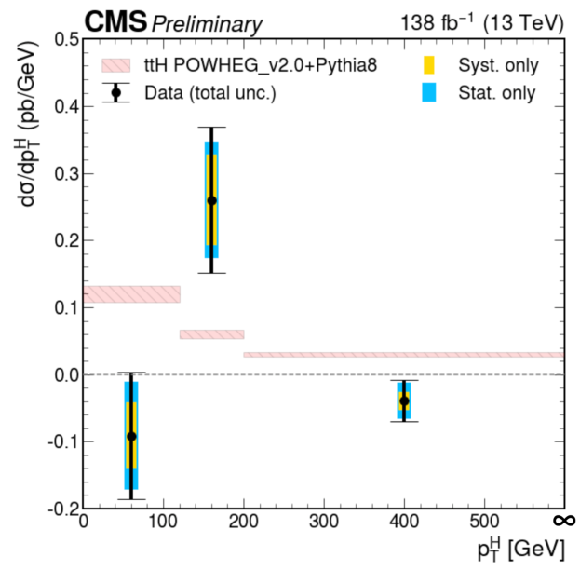
Measured differential cross section and uncertainties as a function of the $ p_{\mathrm{T}} $ (left) and $ m_{\mathrm{t}\overline{\mathrm{t}}\mathrm{H}} $ (right) relative to the SM. Yellow band represents the impact of the systematic uncertainties, while the azure band represents the impact of the systematic uncertainties, while the azure band represents the impacts of the statistical uncertainties. |
png pdf |
Figure 5-a:
Measured differential cross section and uncertainties as a function of the $ p_{\mathrm{T}} $ (left) and $ m_{\mathrm{t}\overline{\mathrm{t}}\mathrm{H}} $ (right) relative to the SM. Yellow band represents the impact of the systematic uncertainties, while the azure band represents the impact of the systematic uncertainties, while the azure band represents the impacts of the statistical uncertainties. |

png pdf |
Figure 5-b:
Measured differential cross section and uncertainties as a function of the $ p_{\mathrm{T}} $ (left) and $ m_{\mathrm{t}\overline{\mathrm{t}}\mathrm{H}} $ (right) relative to the SM. Yellow band represents the impact of the systematic uncertainties, while the azure band represents the impact of the systematic uncertainties, while the azure band represents the impacts of the statistical uncertainties. |

png pdf |
Figure 6:
Postfit distributions of the DNN discriminant for 2 $ \ell ss + 0\tau_\mathrm{h} $ (upper left), 2 $ \ell ss + 1\tau_\mathrm{h} $ (upper right) and 3 $ \ell + 0\tau_\mathrm{h} $ (bottom). All nodes of the DNN classifier are shown in the plots, $ \mathrm{t}\overline{\mathrm{t}}\mathrm{W} $ and $ \mathrm{t}\overline{\mathrm{t}}\mathrm{Z} $ are the most abundant backgrounds in the $ \mathrm{t}\overline{\mathrm{t}}\mathrm{H} $ node. |
png pdf |
Figure 6-a:
Postfit distributions of the DNN discriminant for 2 $ \ell ss + 0\tau_\mathrm{h} $ (upper left), 2 $ \ell ss + 1\tau_\mathrm{h} $ (upper right) and 3 $ \ell + 0\tau_\mathrm{h} $ (bottom). All nodes of the DNN classifier are shown in the plots, $ \mathrm{t}\overline{\mathrm{t}}\mathrm{W} $ and $ \mathrm{t}\overline{\mathrm{t}}\mathrm{Z} $ are the most abundant backgrounds in the $ \mathrm{t}\overline{\mathrm{t}}\mathrm{H} $ node. |

png pdf |
Figure 6-b:
Postfit distributions of the DNN discriminant for 2 $ \ell ss + 0\tau_\mathrm{h} $ (upper left), 2 $ \ell ss + 1\tau_\mathrm{h} $ (upper right) and 3 $ \ell + 0\tau_\mathrm{h} $ (bottom). All nodes of the DNN classifier are shown in the plots, $ \mathrm{t}\overline{\mathrm{t}}\mathrm{W} $ and $ \mathrm{t}\overline{\mathrm{t}}\mathrm{Z} $ are the most abundant backgrounds in the $ \mathrm{t}\overline{\mathrm{t}}\mathrm{H} $ node. |
png pdf |
Figure 6-c:
Postfit distributions of the DNN discriminant for 2 $ \ell ss + 0\tau_\mathrm{h} $ (upper left), 2 $ \ell ss + 1\tau_\mathrm{h} $ (upper right) and 3 $ \ell + 0\tau_\mathrm{h} $ (bottom). All nodes of the DNN classifier are shown in the plots, $ \mathrm{t}\overline{\mathrm{t}}\mathrm{W} $ and $ \mathrm{t}\overline{\mathrm{t}}\mathrm{Z} $ are the most abundant backgrounds in the $ \mathrm{t}\overline{\mathrm{t}}\mathrm{H} $ node. |
| Tables | |
png pdf |
Table 1:
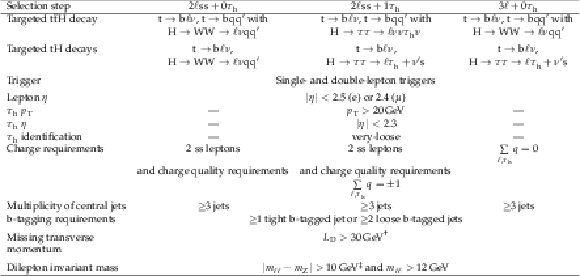
Event selections applied in the 2 $ \ell\mkern 1mu\mathrm{ss} + 0\tau_\mathrm{h} $, 2 $ \ell\mkern 1mu\mathrm{ss} + 1\tau_\mathrm{h} $, 3 $ \ell + 0\tau_\mathrm{h} $, and 3 $ \ell + 1\tau_\mathrm{h} $ channels. The $ p_{\mathrm{T}} $ thresholds applied to the lepton of highest, second-highest, and third-highest $ p_{\mathrm{T}} $ are separated by slashes. The symbol ``$ \text{---} $'' indicates that no requirement is applied. |
png pdf |
Table 2:
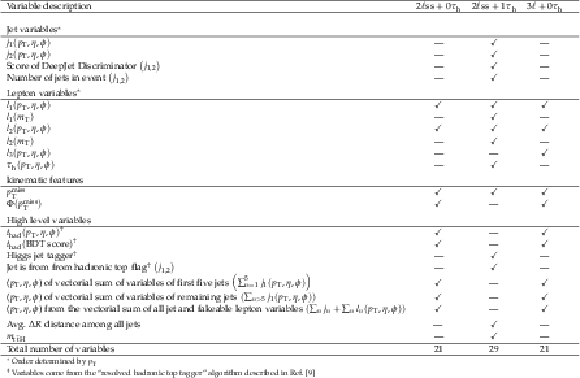
Input variables for the H boson $ p_{\mathrm{T}} $ DNN-based regression. A check mark (\checkmark) indicates the variable is used in a given channel, whereas a long dash ($ \text{---} $) indicates the variable is not used in that channel. The sum of the variables listed in the table corresponds to the sum of their four vectors. The list of variables has been optimized to ensure the best H boson $ p_{\mathrm{T}} $ regression per each final state. The most important variables for the classifier are the sum of the first five jets followed by the lepton variables. |
png pdf |
Table 3:
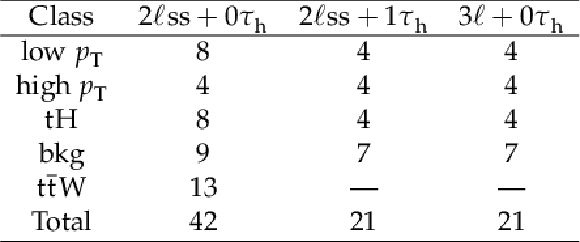
Binning for the H boson $ p_{\mathrm{T}} $ measurement for each channel. |
png pdf |
Table 4:
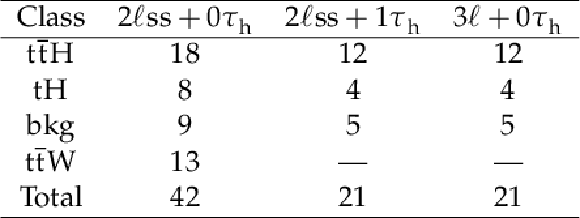
Binning for the $ m_{\mathrm{t}\overline{\mathrm{t}}\mathrm{H}} $ measurement for each channel. |
png pdf |
Table 5:
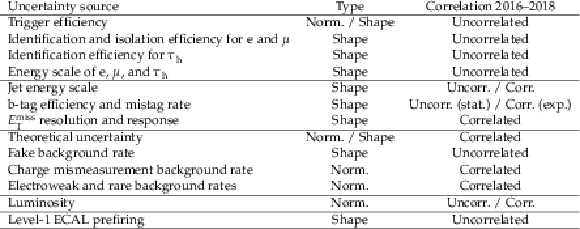
Summary of the main systematic uncertainty sources, their type, and the correlations across the three data-taking years. |
png pdf |
Table 6:
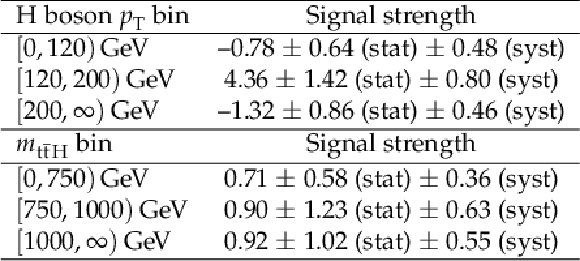
Measured signal strengths and corresponding uncertainties (68% CL) in different H boson $ p_{\mathrm{T}} $ bins and $ m_{\mathrm{t}\overline{\mathrm{t}}\mathrm{H}} $ bins. |
| Summary |
| The production of a Higgs boson in association with two top quarks ($ \mathrm{t}\overline{\mathrm{t}}\mathrm{H} $) is measured in final states containing multiple electrons, muons, or tau leptons decaying to hadrons and a neutrino, using proton-proton collisions recorded at a center-of-mass energy of 13 TeV by the CMS experiment. The analyzed data correspond to an integrated luminosity of 138 fb$ ^{-1} $. The analysis is optimised for events that contain $ \mathrm{H}\to\mathrm{W}\mathrm{W} $ or $ \mathrm{H}\to\tau\tau $ decays where each of the top quarks decays either semileptonically or exclusively to jets. The sensitivity to the signal process is maximized by including three signatures in the analysis, depending on the lepton multiplicity. The separation among the $ \mathrm{t}\overline{\mathrm{t}}\mathrm{H} $ signal and the background processes is enhanced through machine-learning techniques. Differential production rates are measured as a function of the Higgs boson transverse momentum and of the mass of the $ \mathrm{t}\overline{\mathrm{t}}\mathrm{H} $ system and found to be compatible with predictions from the standard model. This result is the first differential measurement of $ \mathrm{t}\overline{\mathrm{t}}\mathrm{H} $ production to date by the CMS Collaboration. |
| References | ||||
| 1 | ATLAS Collaboration | Observation of a new particle in the search for the Standard Model Higgs boson with the ATLAS detector at the LHC | PLB 716 (2012) 1 | 1207.7214 |
| 2 | CMS Collaboration | Observation of a new boson at a mass of 125 GeV with the CMS experiment at the LHC | PLB 716 (2012) 30 | CMS-HIG-12-028 1207.7235 |
| 3 | CMS Collaboration | A portrait of the Higgs boson by the CMS experiment ten years after the discovery | (July, ) 6068, 2022 Nature 60 (2022) 7 |
|
| 4 | CMS Collaboration | Precise determination of the mass of the Higgs boson and tests of compatibility of its couplings with the standard model predictions using proton collisions at 7 and 8 $ \,\text {TeV} $ | no.~5, 212, 2015 Eur. Phys. J. 75 (2015) |
CMS-HIG-14-009 1412.8662 |
| 5 | ATLAS, CDF, CMS and D0 Collaborations | First combination of Tevatron and LHC measurements of the top quark mass | \url https://arxiv.org/abs/1403.4427, 2014 link |
|
| 6 | B. A. Dobrescu and C. T. Hill | Electroweak symmetry breaking via top condensation seesaw | PRL 81 (1998) 2634 | hep-ph/9712319 |
| 7 | R. S. Chivukula, B. A. Dobrescu, H. Georgi, and C. T. Hill | Top Quark Seesaw Theory of Electroweak Symmetry Breaking | PR 59 (1999) 075003 | hep-ph/9809470 |
| 8 | D. Delepine, J. M. Gerard, and R. Gonzalez Felipe | Is the standard Higgs scalar elementary? | PL 372 (1996) 271 | hep-ph/9512339 |
| 9 | CMS Collaboration | Measurement of the Higgs boson production rate in association with top quarks in final states with electrons, muons, and hadronically decaying tau leptons at $ \sqrt{s} = $ 13 TeV | EPJC 81 (2021) 378 | CMS-HIG-19-008 2011.03652 |
| 10 | CMS Collaboration | Measurement of the $ \mathrm{t\bar{t}H} $ and tH production rates in the H $ \to \mathrm{b\bar{b}} $ decay channel using proton-proton collision data at $ \sqrt{s} $ = 13 TeV | \url https://arxiv.org/abs/2407.6, 2024 link |
|
| 11 | CMS Collaboration | Search for CP violation in ttH and tH production in multilepton channels in proton-proton collisions at 13 TeV | (July, ), 2023 Journal of High Energy Physics 202 (2023) 3 |
|
| 12 | CMS Collaboration | The CMS trigger system | JINST 12 (2017) P01020 | CMS-TRG-12-001 1609.02366 |
| 13 | CMS Collaboration | The CMS experiment at the CERN LHC | JINST 3 (2008) S08004 | |
| 14 | CMS Collaboration | Precision luminosity measurement in proton-proton collisions at $ \sqrt{s} = $ 13 TeV in 2015 and 2016 at CMS | EPJC 81 (2021) 800 | CMS-LUM-17-003 2104.01927 |
| 15 | CMS Collaboration | CMS luminosity measurement for the 2017 data-taking period at $ \sqrt{s} = $ 13 TeV | CMS Physics Analysis Summary, 2018 link |
CMS-PAS-LUM-17-004 |
| 16 | CMS Collaboration | CMS luminosity measurement for the 2018 data-taking period at $ \sqrt{s} = $ 13 TeV | CMS Physics Analysis Summary, 2019 link |
CMS-PAS-LUM-18-002 |
| 17 | P. Nason | A new method for combining NLO QCD with shower Monte Carlo algorithms | JHEP 11 (2004) 040 | hep-ph/0409146 |
| 18 | S. Frixione, P. Nason, and C. Oleari | Matching NLO QCD computations with parton shower simulations: the POWHEG method | JHEP 11 (2007) 070 | 0709.2092 |
| 19 | S. Alioli, P. Nason, C. Oleari, and E. Re | A general framework for implementing NLO calculations in shower Monte Carlo programs: the POWHEG \textscbox | JHEP 06 (2010) 043 | 1002.2581 |
| 20 | F. Maltoni, G. Ridolfi, and M. Ubiali | b-initiated processes at the LHC: a reappraisal | JHEP 07 (2012) 022 | 1203.6393 |
| 21 | F. Demartin, F. Maltoni, K. Mawatari, and M. Zaro | Higgs production in association with a single top quark at the LHC | EPJC 75 (2015) 267 | 1504.00611 |
| 22 | R. Frederix and I. Tsinikos | Subleading EW corrections and spin-correlation effects in $ t\bar{t}W $ multi-lepton signatures | EPJC 80 (2020) 803 | 2004.09552 |
| 23 | J. A. Dror, M. Farina, E. Salvioni, and J. Serra | Strong tW Scattering at the LHC | JHEP 01 (2016) 071 | 1511.03674 |
| 24 | L. Buonocore et al. | Precise Predictions for the Associated Production of a W Boson with a Top-Antitop Quark Pair at the LHC | no.~23, 23, 2023 PRL 131 (2023) |
2306.16311 |
| 25 | J. Alwall et al. | The automated computation of tree-level and next-to-leading order differential cross sections, and their matching to parton shower simulations | JHEP 07 (2014) 079 | 1405.0301 |
| 26 | J. Alwall et al. | Comparative study of various algorithms for the merging of parton showers and matrix elements in hadronic collisions | EPJC 53 (2008) 473 | 0706.2569 |
| 27 | P. Artoisenet, R. Frederix, O. Mattelaer, and R. Rietkerk | Automatic spin-entangled decays of heavy resonances in Monte Carlo simulations | JHEP 03 (2013) 015 | 1212.3460 |
| 28 | R. Frederix and S. Frixione | Merging meets matching in MC@NLO | JHEP 12 (2012) 061 | 1209.6215 |
| 29 | NNPDF Collaboration | Parton distributions for the LHC Run 2 | JHEP 04 (2015) 040 | 1410.8849 |
| 30 | T. Sjöstrand et al. | An introduction to PYTHIA 8.2 | Comput. Phys. Commun. 191 (2015) 159 | 1410.3012 |
| 31 | CMS Collaboration | Extraction and validation of a new set of CMS PYTHIA 8 tunes from underlying-event measurements | EPJC 80 (2020) 4 | CMS-GEN-17-001 1903.12179 |
| 32 | GEANT4 Collaboration | GEANT 4---a simulation toolkit | NIM A 506 (2003) 250 | |
| 33 | J. Allison et al. | Recent developments in GEANT 4 | NIM A 835 (2016) 186 | |
| 34 | CMS Collaboration | Measurements of inclusive W and Z cross sections in pp collisions at $ \sqrt{s} = $ 7 TeV | JHEP 01 (2011) 080 | CMS-EWK-10-002 1012.2466 |
| 35 | CMS Collaboration | Jet energy scale and resolution in the CMS experiment in pp collisions at 8 TeV | JINST 12 (2017) P02014 | CMS-JME-13-004 1607.03663 |
| 36 | CMS Collaboration | Identification of heavy-flavour jets with the CMS detector in pp collisions at 13 TeV | JINST 13 (2018) P05011 | CMS-BTV-16-002 1712.07158 |
| 37 | CMS Collaboration | Performance of reconstruction and identification of $ \tau $ leptons decaying to hadrons and $ \nu_{\tau} $ in pp collisions at $ \sqrt{s} = $ 13 TeV | JINST 13 (2018) P10005 | CMS-TAU-16-003 1809.02816 |
| 38 | CMS Collaboration | Performance of missing transverse momentum reconstruction in proton-proton collisions at $ \sqrt{s} = $ 13 TeV using the CMS detector | JINST 14 (2019) P07004 | CMS-JME-17-001 1903.06078 |
| 39 | CMS Collaboration | Particle-flow reconstruction and global event description with the CMS detector | JINST 12 (2017) P10003 | CMS-PRF-14-001 1706.04965 |
| 40 | CMS Collaboration | Performance of electron reconstruction and selection with the CMS detector in proton-proton collisions at $ \sqrt{s} = $ 8 TeV | JINST 10 (2015) P06005 | CMS-EGM-13-001 1502.02701 |
| 41 | CMS Collaboration | Performance of the CMS muon detector and muon reconstruction with proton-proton collisions at $ \sqrt{s}= $ 13 TeV | no.~06, P06015, 2018 JINST 13 (2018) |
CMS-MUO-16-001 1804.04528 |
| 42 | K. Rehermann and B. Tweedie | Efficient identification of boosted semileptonic top quarks at the LHC | JHEP 03 (2011) 059 | 1007.2221 |
| 43 | CMS Collaboration | Search for new physics in same-sign dilepton events in proton-proton collisions at $ \sqrt{s} = $ 13 TeV | EPJC 76 (2016) 439 | CMS-SUS-15-008 1605.03171 |
| 44 | CMS | Performance of the DeepTau algorithm for the discrimination of taus against jets, electrons, and muons | \href https://cds.cern.ch/record/2694158 Collaboration, , CMS Detector Performance Summary CMS-DP-2019-033, 2019 | |
| 45 | Y. Lecun | Generalization and network design strategies | \href http://yann.lecun.com/exdb/publis/pdf/lecun-89.pdf, Technical Report of the University of Toronto, CRG-TR-89-4 | |
| 46 | M. Cacciari, G. P. Salam, and G. Soyez | The anti-$ k_{\mathrm{T}} $ jet clustering algorithm | JHEP 04 (2008) 063 | 0802.1189 |
| 47 | M. Cacciari, G. P. Salam, and G. Soyez | The catchment area of jets | JHEP 04 (2008) 005 | 0802.1188 |
| 48 | CMS Collaboration | Jet algorithms performance in 13 TeV data | CMS Physics Analysis Summary, 2016 CMS-PAS-JME-16-003 |
CMS-PAS-JME-16-003 |
| 49 | CMS | CMS Phase 1 heavy flavour identification performance and developments | \href http://cds.cern.ch/record/2263802 Collaboration, , CMS Detector Performance Summary CMS-DP-2017-013, 2017 | |
| 50 | CMS Collaboration | Evidence for associated production of a Higgs boson with a top quark pair in final states with electrons, muons, and hadronically decaying $ \tau $ leptons at $ \sqrt{s} = $ 13 TeV | JHEP 08 (2018) 066 | CMS-HIG-17-018 1803.05485 |
| 51 | Particle Data Group , P. A. Zyla et al. | Review of particle physics | Prog. Theor. Exp. Phys. 2020 (2020) 083C01 | |
| 52 | CMS Collaboration | Measurements of properties of the Higgs boson decaying into the four-lepton final state in pp collisions at $ \sqrt{s} = $ 13 TeV | JHEP 11 (2017) 047 | CMS-HIG-16-041 1706.09936 |
| 53 | CMS Collaboration | Performance of missing transverse momentum reconstruction in proton-proton collisions at $ \sqrt{s} = $ 13 tev using the cms detector | (July, ) P07004, 2019 Journal of Instrumentation 1 (2019) 4 |
|
| 54 | CMS Collaboration | Search for physics beyond the standard model in top quark production with additional leptons in the context of effective field theory | (December, ), 2023 Journal of High Energy Physics 202 (2023) 3 |
|
| 55 | CMS Collaboration | Search for CP violation in $ \mathrm{t\bar{t}H} $ and tH production in multilepton channels in proton-proton collisions at $ \sqrt{s} $ = 13 TeV | JHEP 07 (2023) 092 | CMS-HIG-21-006 2208.02686 |
| 56 | T. Adye | Unfolding algorithms and applications | Journal of Physics:, 2011 Conference Series 368 (2011) 012029 |
|
| 57 | CMS Collaboration | The CMS statistical analysis and combination tool: Combine | Computing and Software for Big Science 8 (November, ), 2024 link |
|
| 58 | CMS | CMS luminosity measurements for the 2016 data-taking period | \href http://cds.cern.ch/record/2257069 Collaboration, , CMS Physics Analysis Summary, 2017 | CMS-PAS-LUM-17-001 |
| 59 | CMS | CMS luminosity measurement for the 2017 data-taking period at $ \sqrt{s} = $ 13 TeV | \href http://cds.cern.ch/record/262 Collaboration, , CMS Physics Analysis Summary, 1960 | CMS-PAS-LUM-17-004 |
| 60 | CMS | CMS luminosity measurement for the 2018 data-taking period at $ \sqrt{s} = $ 13 TeV | \href http://cds.cern.ch/record/2676164 Collaboration, , CMS Physics Analysis Summary, 2018 | CMS-PAS-LUM-18-002 |
| 61 | CMS Collaboration | Measurement of the inelastic proton-proton cross section at $ \sqrt{s}= $ 13 TeV | JHEP 07 (2018) 161 | CMS-FSQ-15-005 1802.02613 |
| 62 | D. de Florian et al. | Handbook of LHC Higgs cross sections: 4. Deciphering the nature of the Higgs sector | CERN Report CERN-2017-002-M, 2016 link |
1610.07922 |
| 63 | M. Cacciari et al. | The $ \mathrm{t}\overline{\mathrm{t}} $ cross-section at 1.8 TeV and 1.96 TeV: a study of the systematics due to parton densities and scale dependence | JHEP 04 (2004) 068 | hep-ph/0303085 |
| 64 | S. Catani, D. de Florian, M. Grazzini, and P. Nason | Soft gluon resummation for Higgs boson production at hadron colliders | JHEP 07 (2003) 028 | hep-ph/0306211 |
| 65 | R. Frederix et al. | Four-lepton production at hadron colliders: MadGraph-5\_aMC@NLO predictions with theoretical uncertainties | JHEP 02 (2012) 099 | 1110.4738 |
| 66 | J. Butterworth et al. | PDF4LHC recommendations for LHC Run 2 | JPG 43 (2016) 023001 | 1510.03865 |

|
Compact Muon Solenoid LHC, CERN |

|

|

|

|

|

|