

Compact Muon Solenoid
LHC, CERN
| CMS-PAS-EXO-23-003 | ||
| Search for soft unclustered energy patterns in association with a Z boson in proton-proton collisions at 13 TeV | ||
| CMS Collaboration | ||
| 27 March 2025 | ||
| Abstract: A search for soft unclustered energy patterns (SUEPs) produced in association with a Z boson is presented. The analysis is based on proton-proton collision data corresponding to an integrated luminosity of 138 fb$ ^{-1} $, collected between 2016 and 2018 with the CMS detector at $ \sqrt{s}= $ 13 TeV. Final states with two light leptons compatible with a Z boson decay and a high multiplicity of low-momentum tracks are explored for the first time. The results show no significant excess over the standard model expectation and are used to set upper limits on the cross section of the associated SUEP+Z production process. Model-agnostic results are provided for reinterpretation with other signal models. | ||
| Links: CDS record (PDF) ; Physics Briefing ; CADI line (restricted) ; | ||
| Figures | |
png pdf |
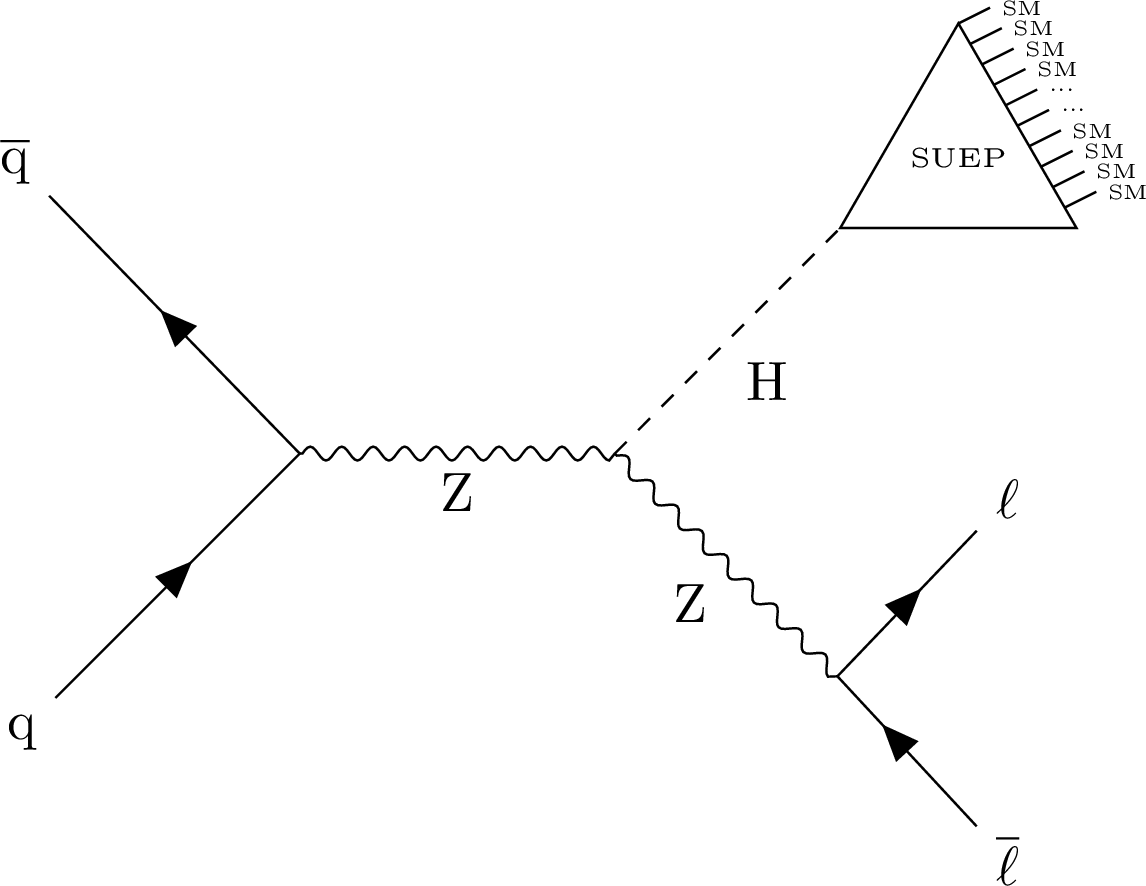
Figure 1:
A schematic Feynman diagram of the production of a SUEP shower in association with a leptonically decaying Z boson. The shaded triangle represents the dark shower that produces the SUEP final state. |
png pdf |
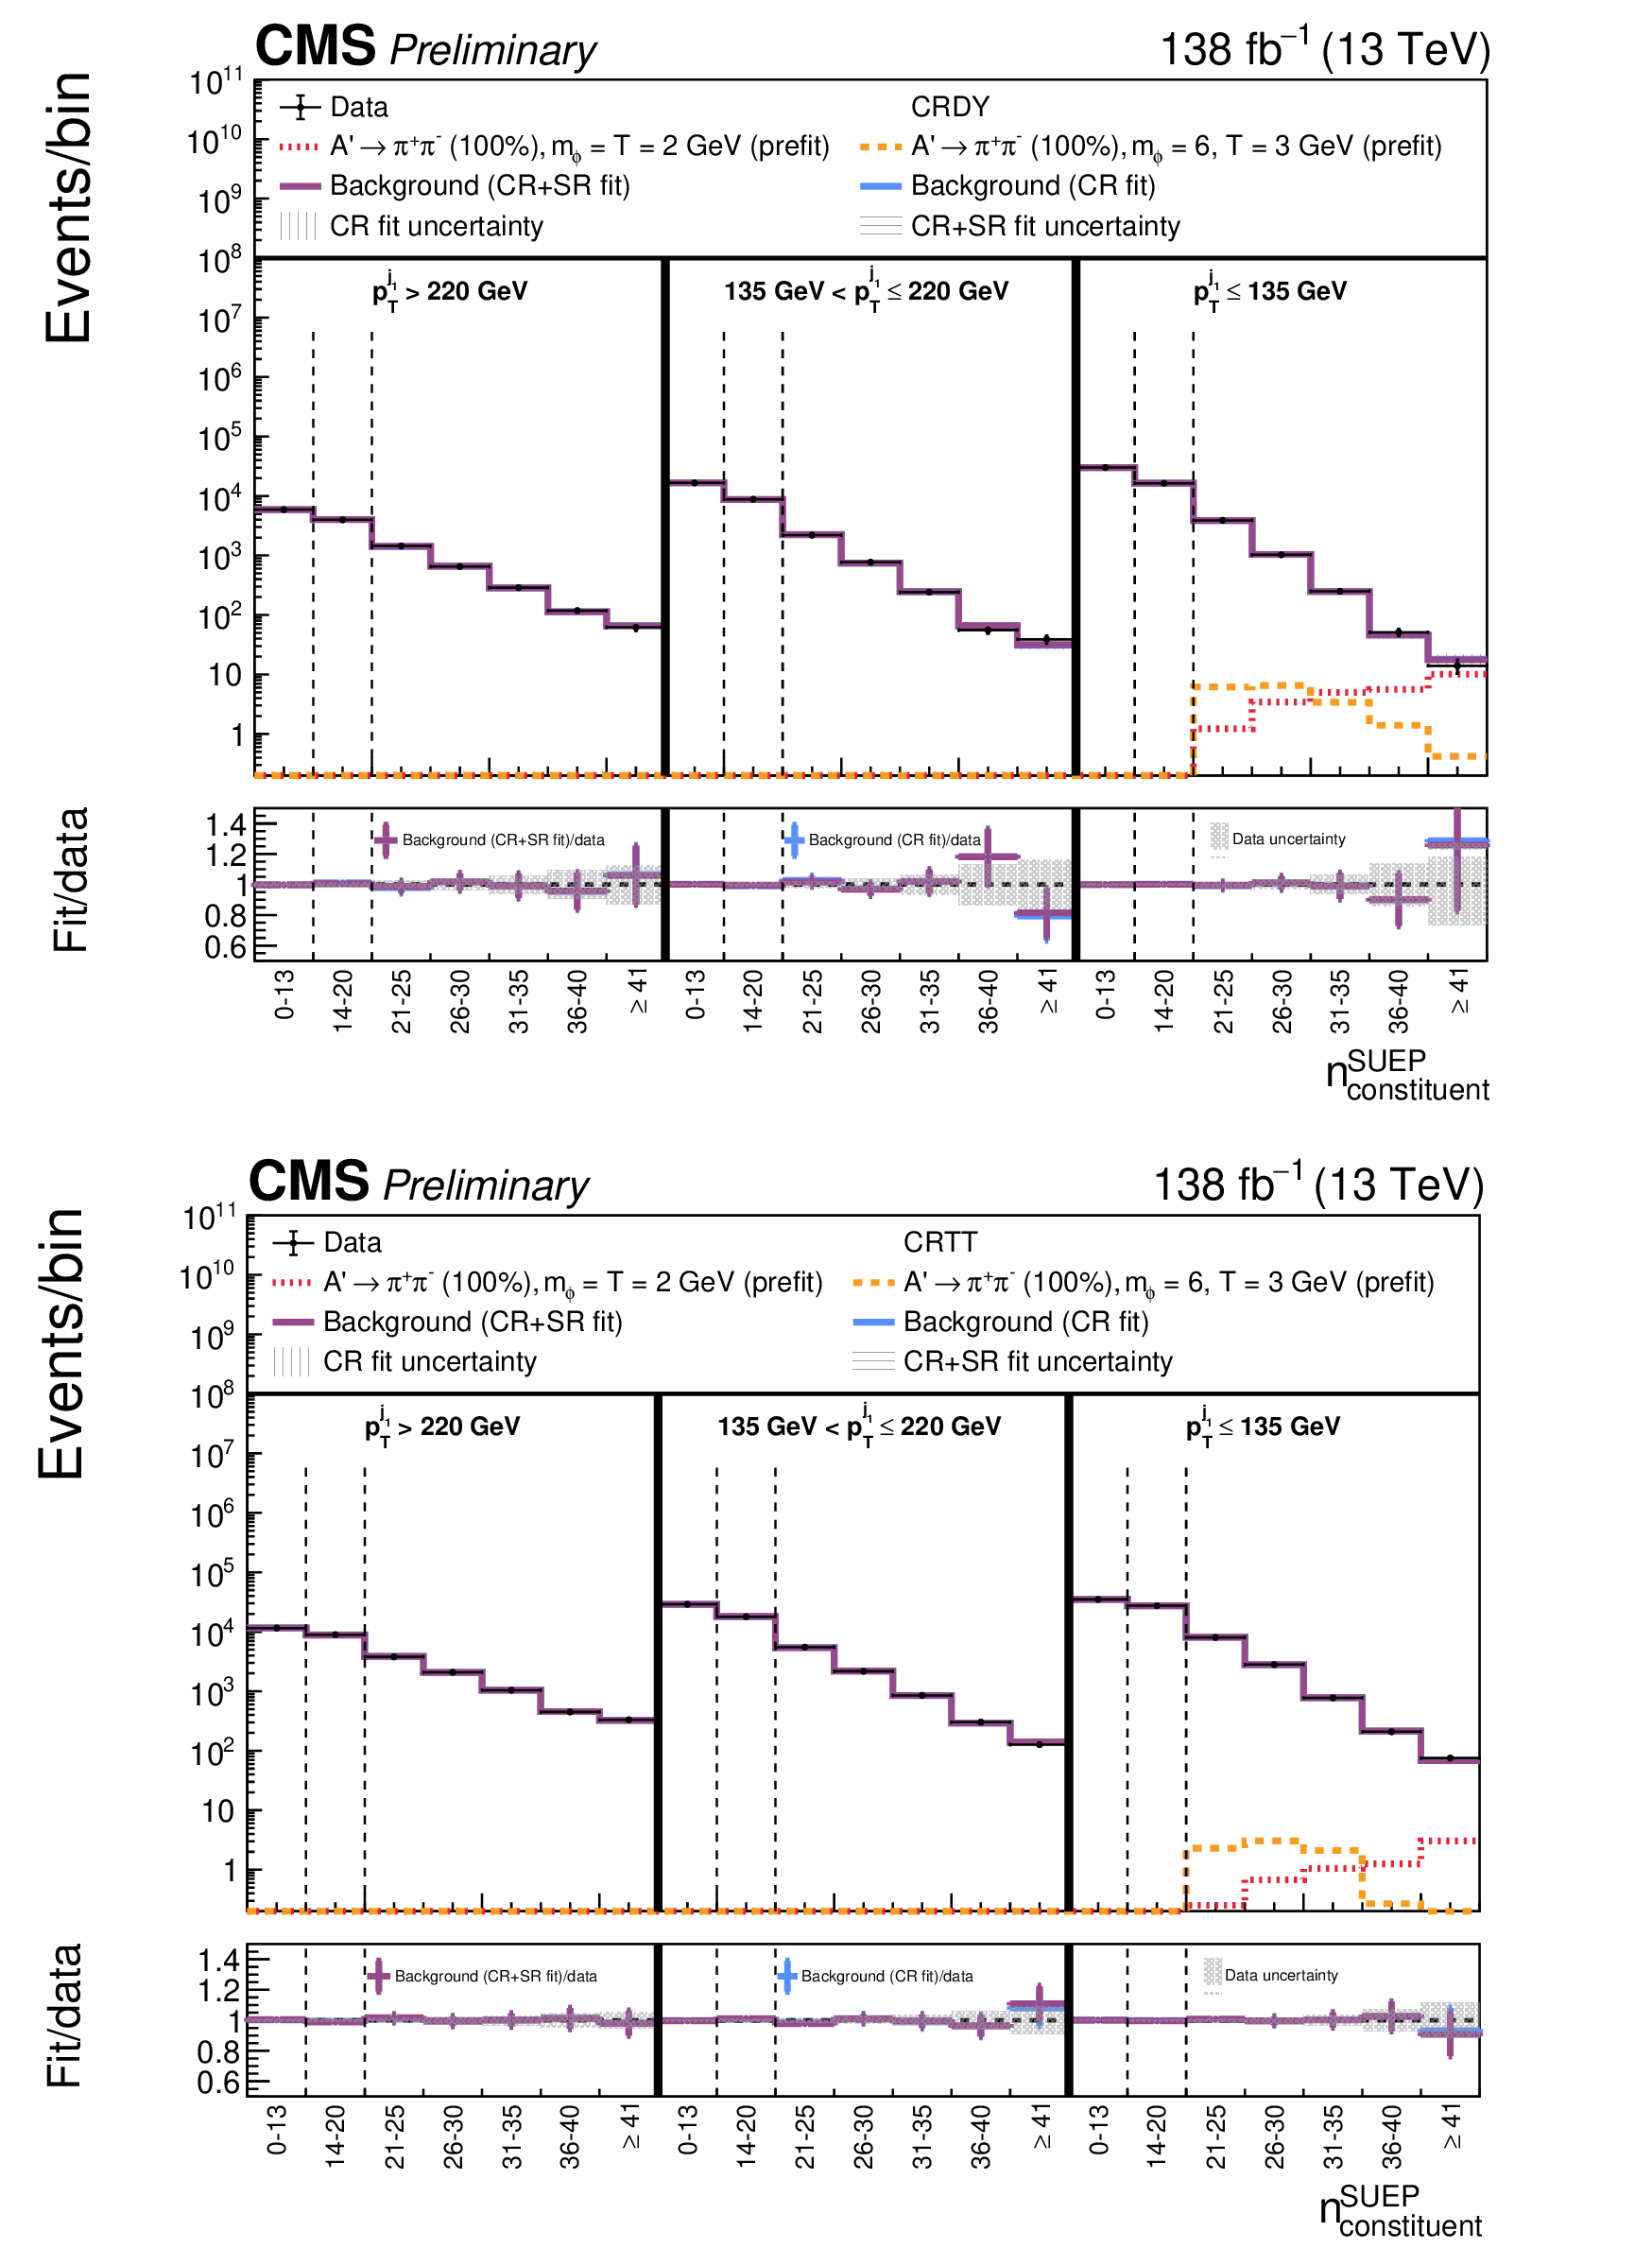
Figure 2:
Distributions of $ n_{\text{constituent}}^{\text{SUEP}} $ in the extended ABCD regions in CRDY (upper) and CRTT (lower), showing the observed data, the predictions from both the CR and CR+PR fits, and several prefit signal samples. The SER, region A, corresponds to the eight rightmost bins of the plot. Solid vertical lines separate regions with different $ p_{\mathrm{T}}^{\text{j}_{1}} $ values. Dotted vertical lines separate the different extended ABCD regions. The shaded vertical (horizontal) bands correspond to the overall uncertainty in the background estimation in the CR fit (CR+PR fit). In the lower panel, the shaded bands correspond to the statistical uncertainty in the data. In the PR (lower), the data are weighted by the ratio of delivered over collected luminosity. |
png pdf |
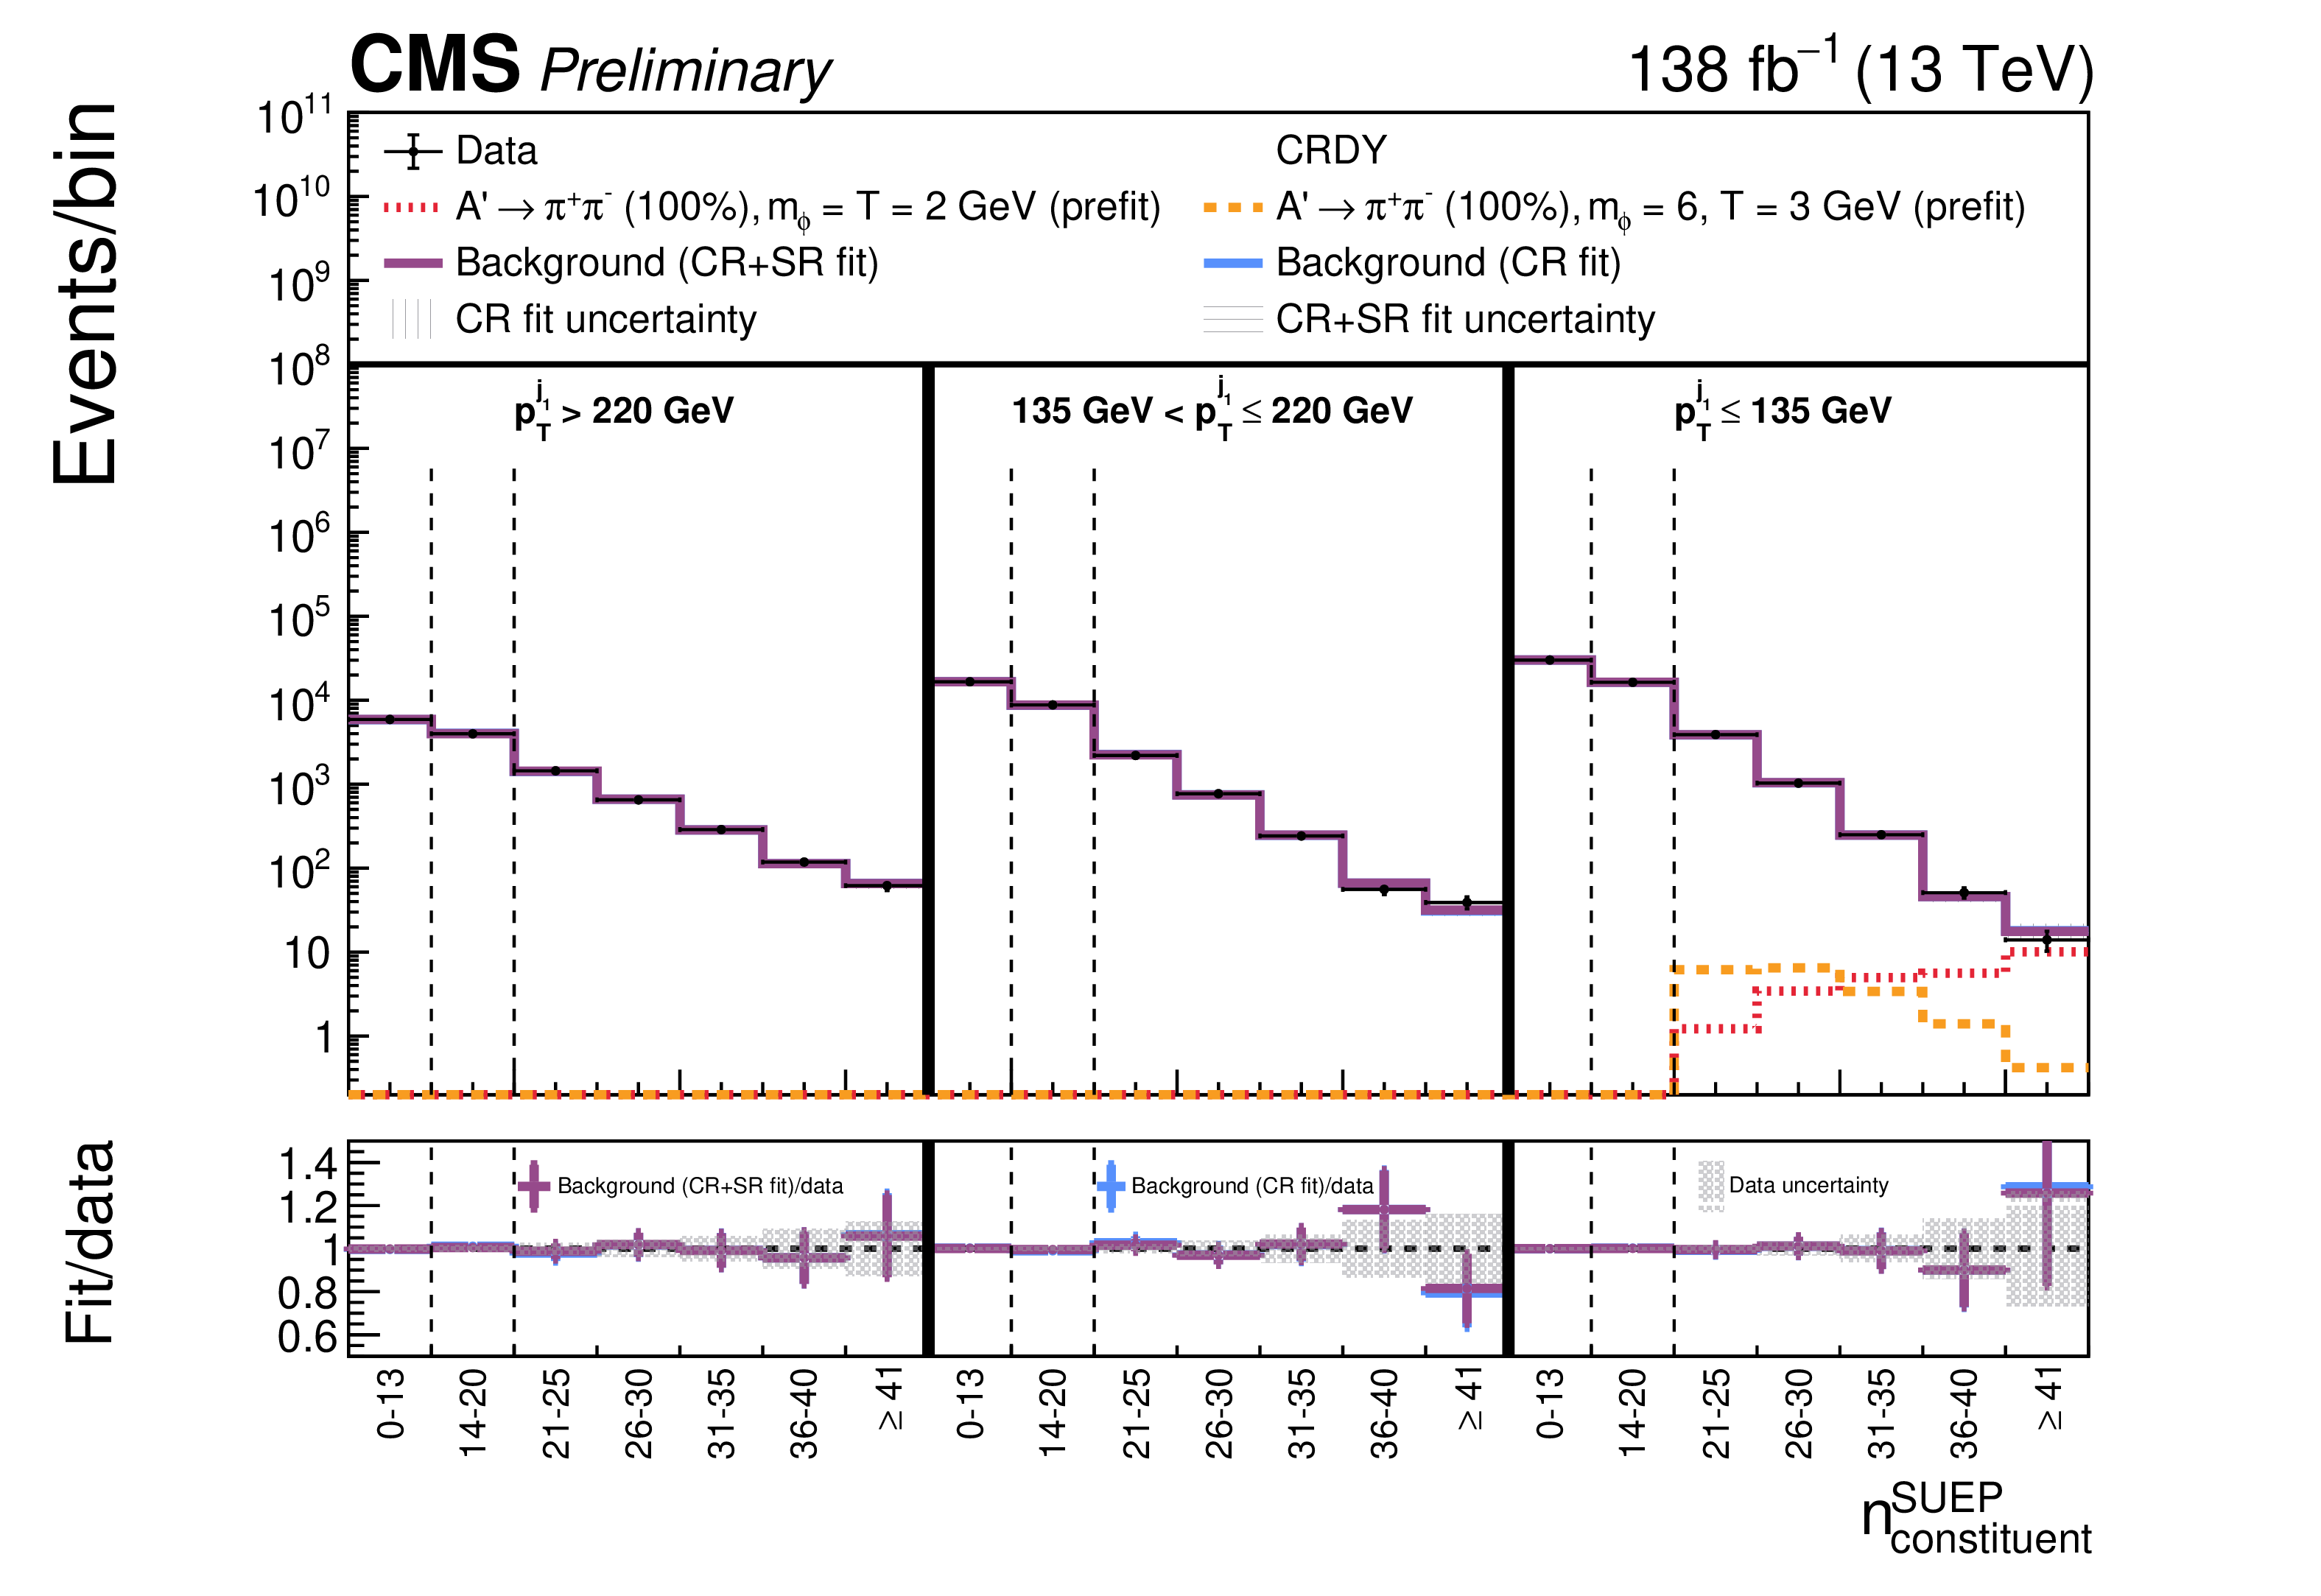
Figure 2-a:
Distributions of $ n_{\text{constituent}}^{\text{SUEP}} $ in the extended ABCD regions in CRDY (upper) and CRTT (lower), showing the observed data, the predictions from both the CR and CR+PR fits, and several prefit signal samples. The SER, region A, corresponds to the eight rightmost bins of the plot. Solid vertical lines separate regions with different $ p_{\mathrm{T}}^{\text{j}_{1}} $ values. Dotted vertical lines separate the different extended ABCD regions. The shaded vertical (horizontal) bands correspond to the overall uncertainty in the background estimation in the CR fit (CR+PR fit). In the lower panel, the shaded bands correspond to the statistical uncertainty in the data. In the PR (lower), the data are weighted by the ratio of delivered over collected luminosity. |
png pdf |
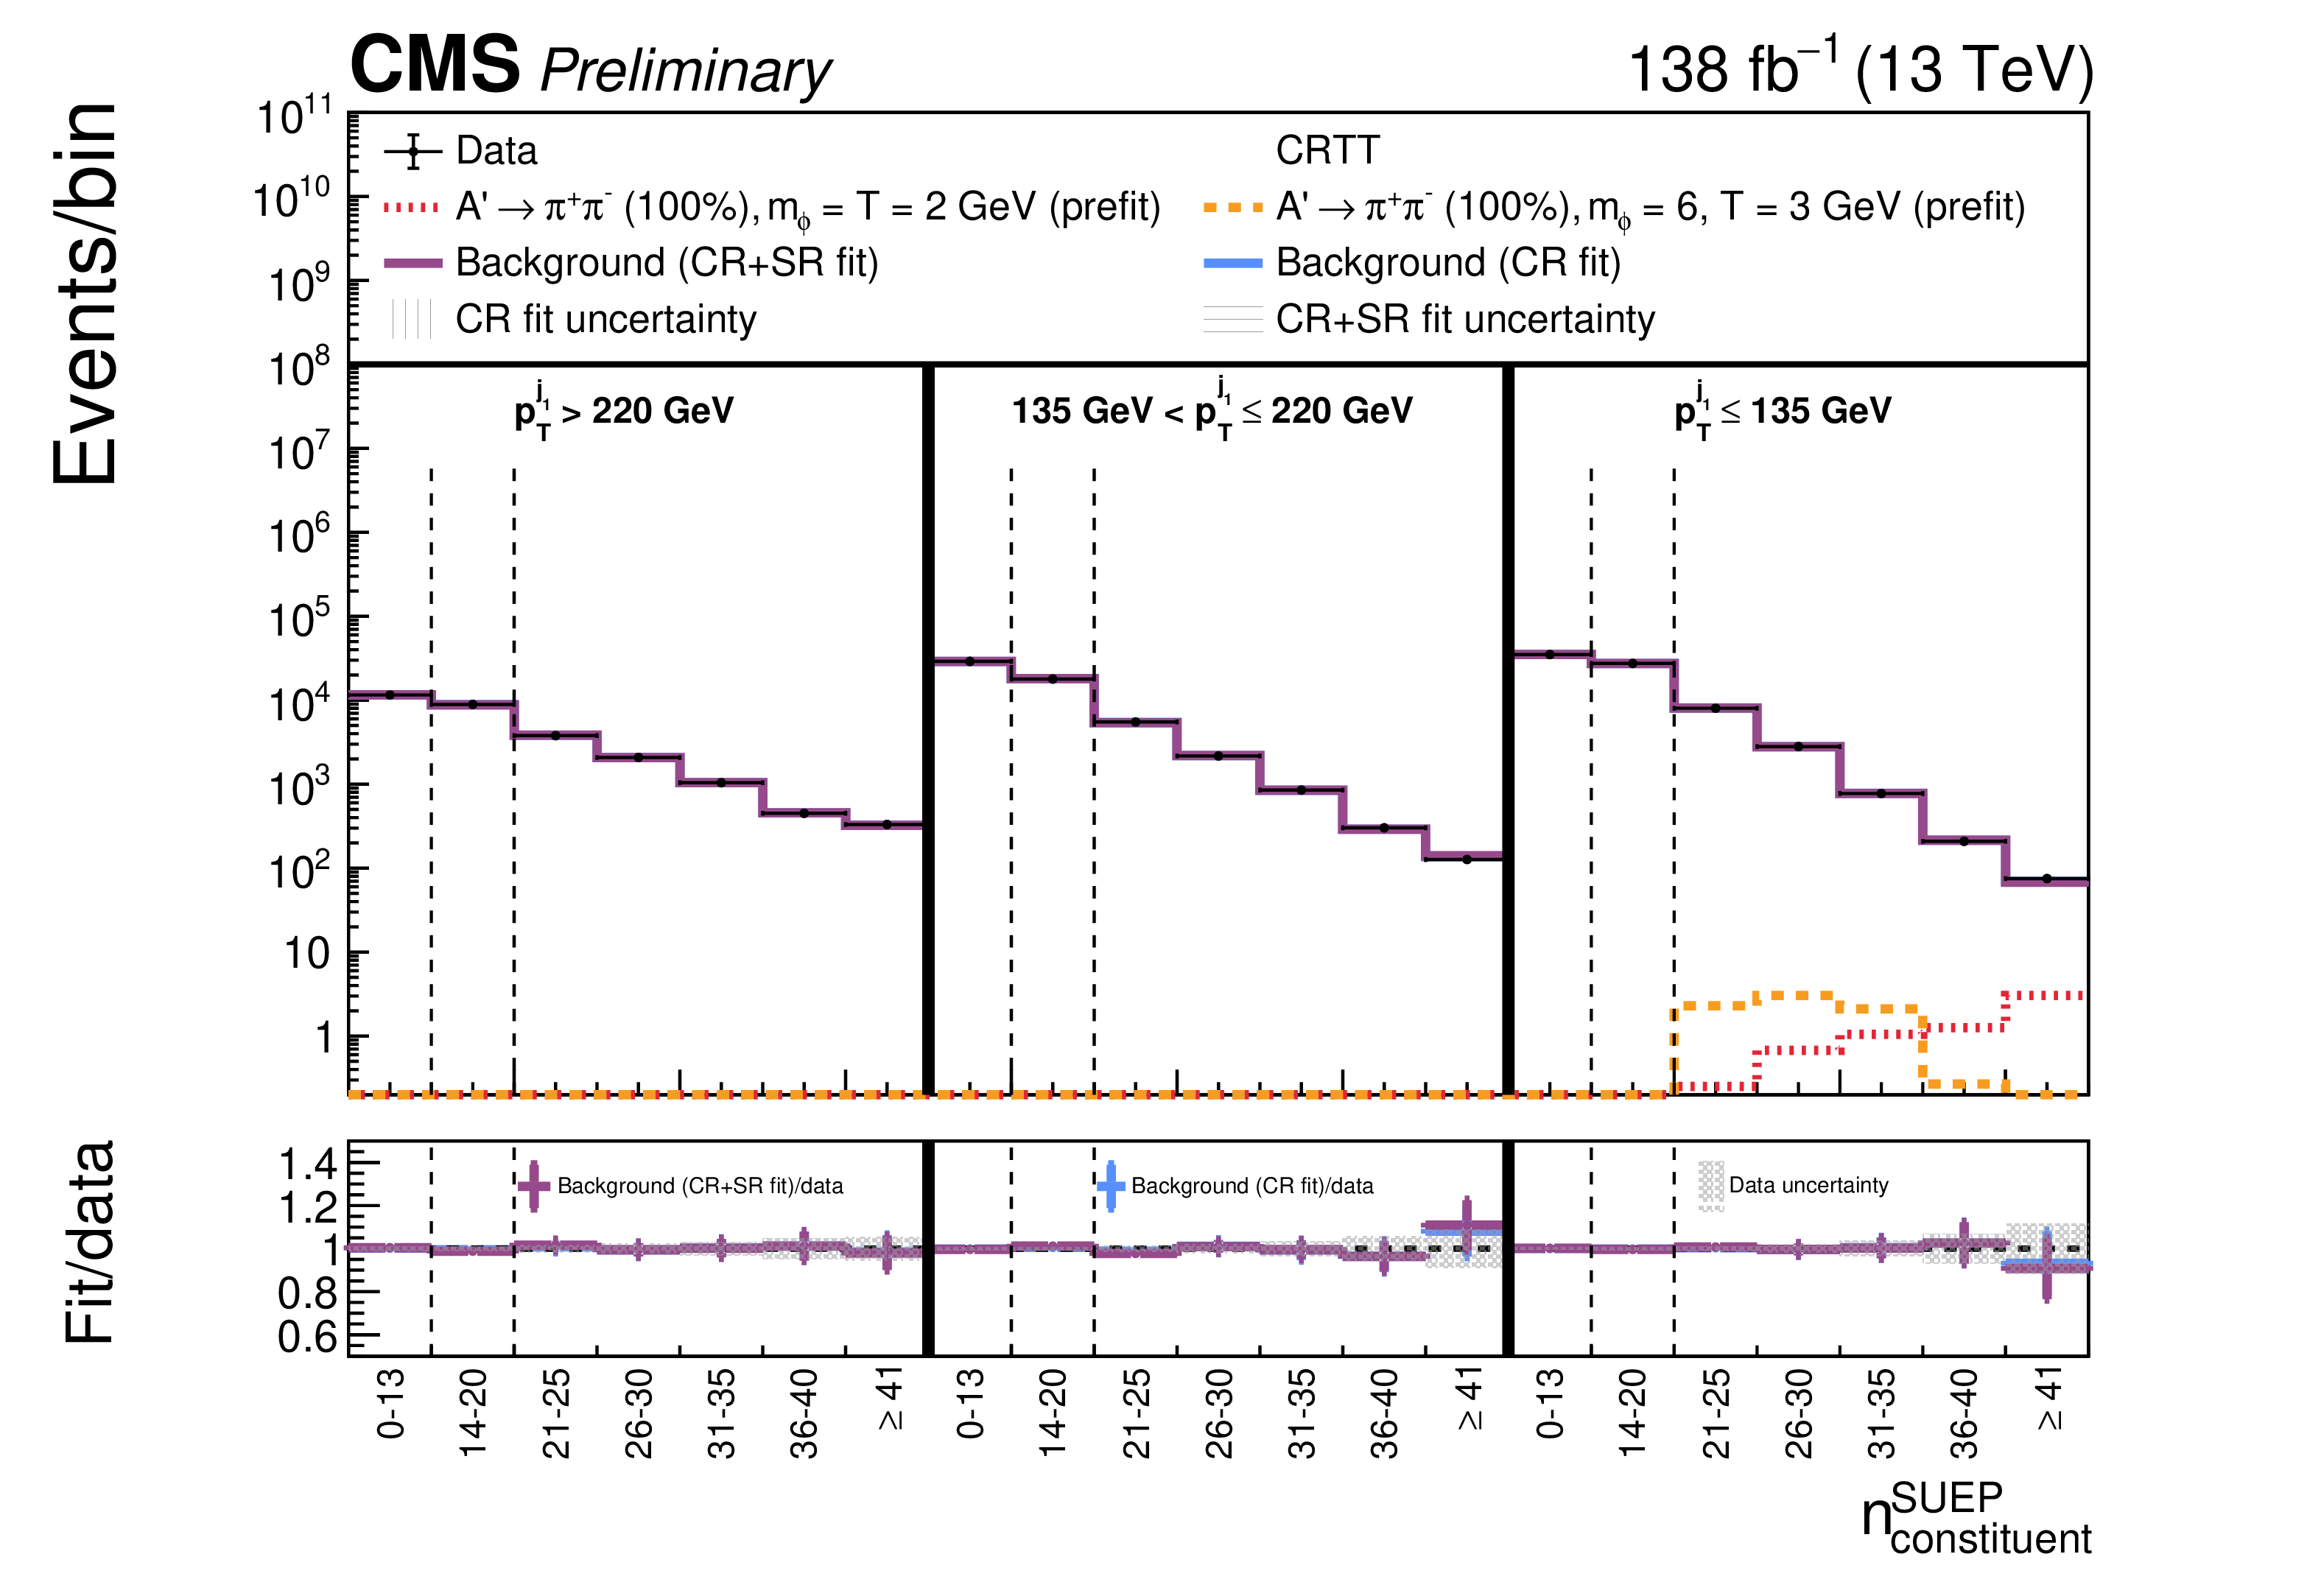
Figure 2-b:
Distributions of $ n_{\text{constituent}}^{\text{SUEP}} $ in the extended ABCD regions in CRDY (upper) and CRTT (lower), showing the observed data, the predictions from both the CR and CR+PR fits, and several prefit signal samples. The SER, region A, corresponds to the eight rightmost bins of the plot. Solid vertical lines separate regions with different $ p_{\mathrm{T}}^{\text{j}_{1}} $ values. Dotted vertical lines separate the different extended ABCD regions. The shaded vertical (horizontal) bands correspond to the overall uncertainty in the background estimation in the CR fit (CR+PR fit). In the lower panel, the shaded bands correspond to the statistical uncertainty in the data. In the PR (lower), the data are weighted by the ratio of delivered over collected luminosity. |
png pdf |
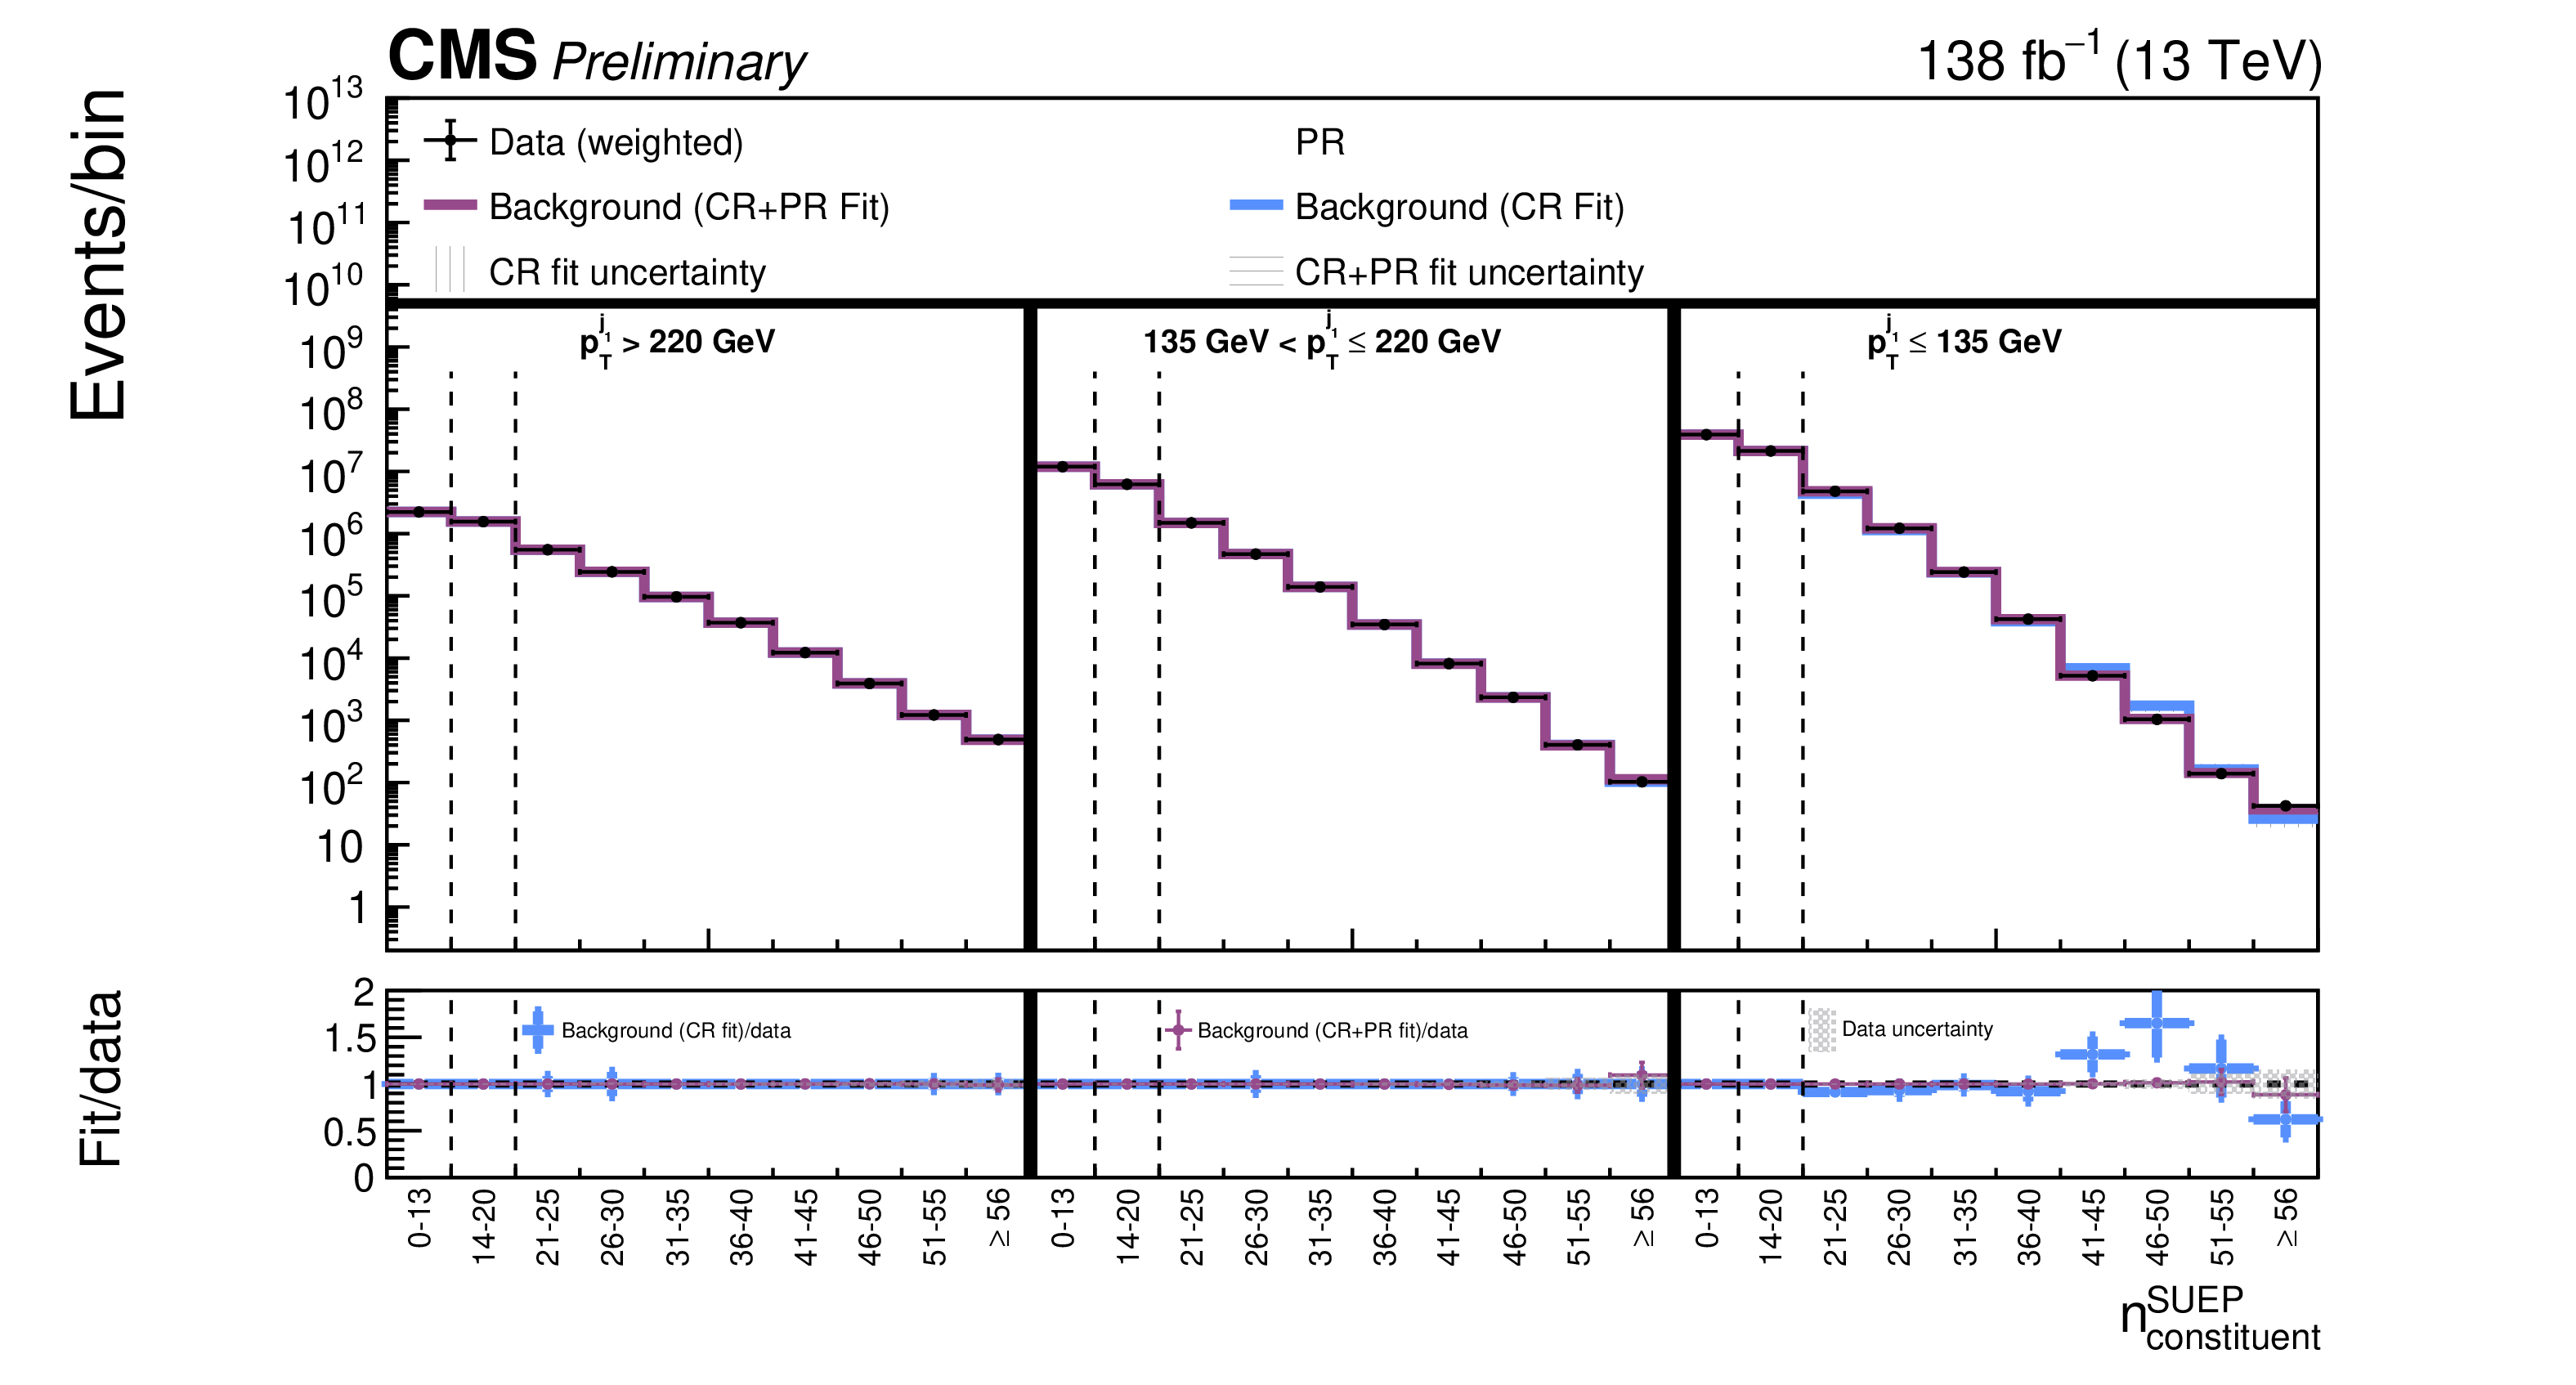
Figure 3:
Distributions of $ n_{\text{constituent}}^{\text{SUEP}} $ in the extended ABCD regions in the PR, showing the observed data, the predictions from both the CR and CR+PR fits, and several prefit signal samples. The SER, region A, corresponds to the eight rightmost bins of the plot. Solid vertical lines separate regions with different $ p_{\mathrm{T}}^{\text{j}_{1}} $ values. Dotted vertical lines separate the different extended ABCD regions. The shaded vertical (horizontal) bands correspond to the overall uncertainty in the background estimation in the CR fit (CR+PR fit). In the lower panel, the shaded bands correspond to the statistical uncertainty in the data. In the PR (lower), the data are weighted by the ratio of delivered over collected luminosity. |
png pdf |
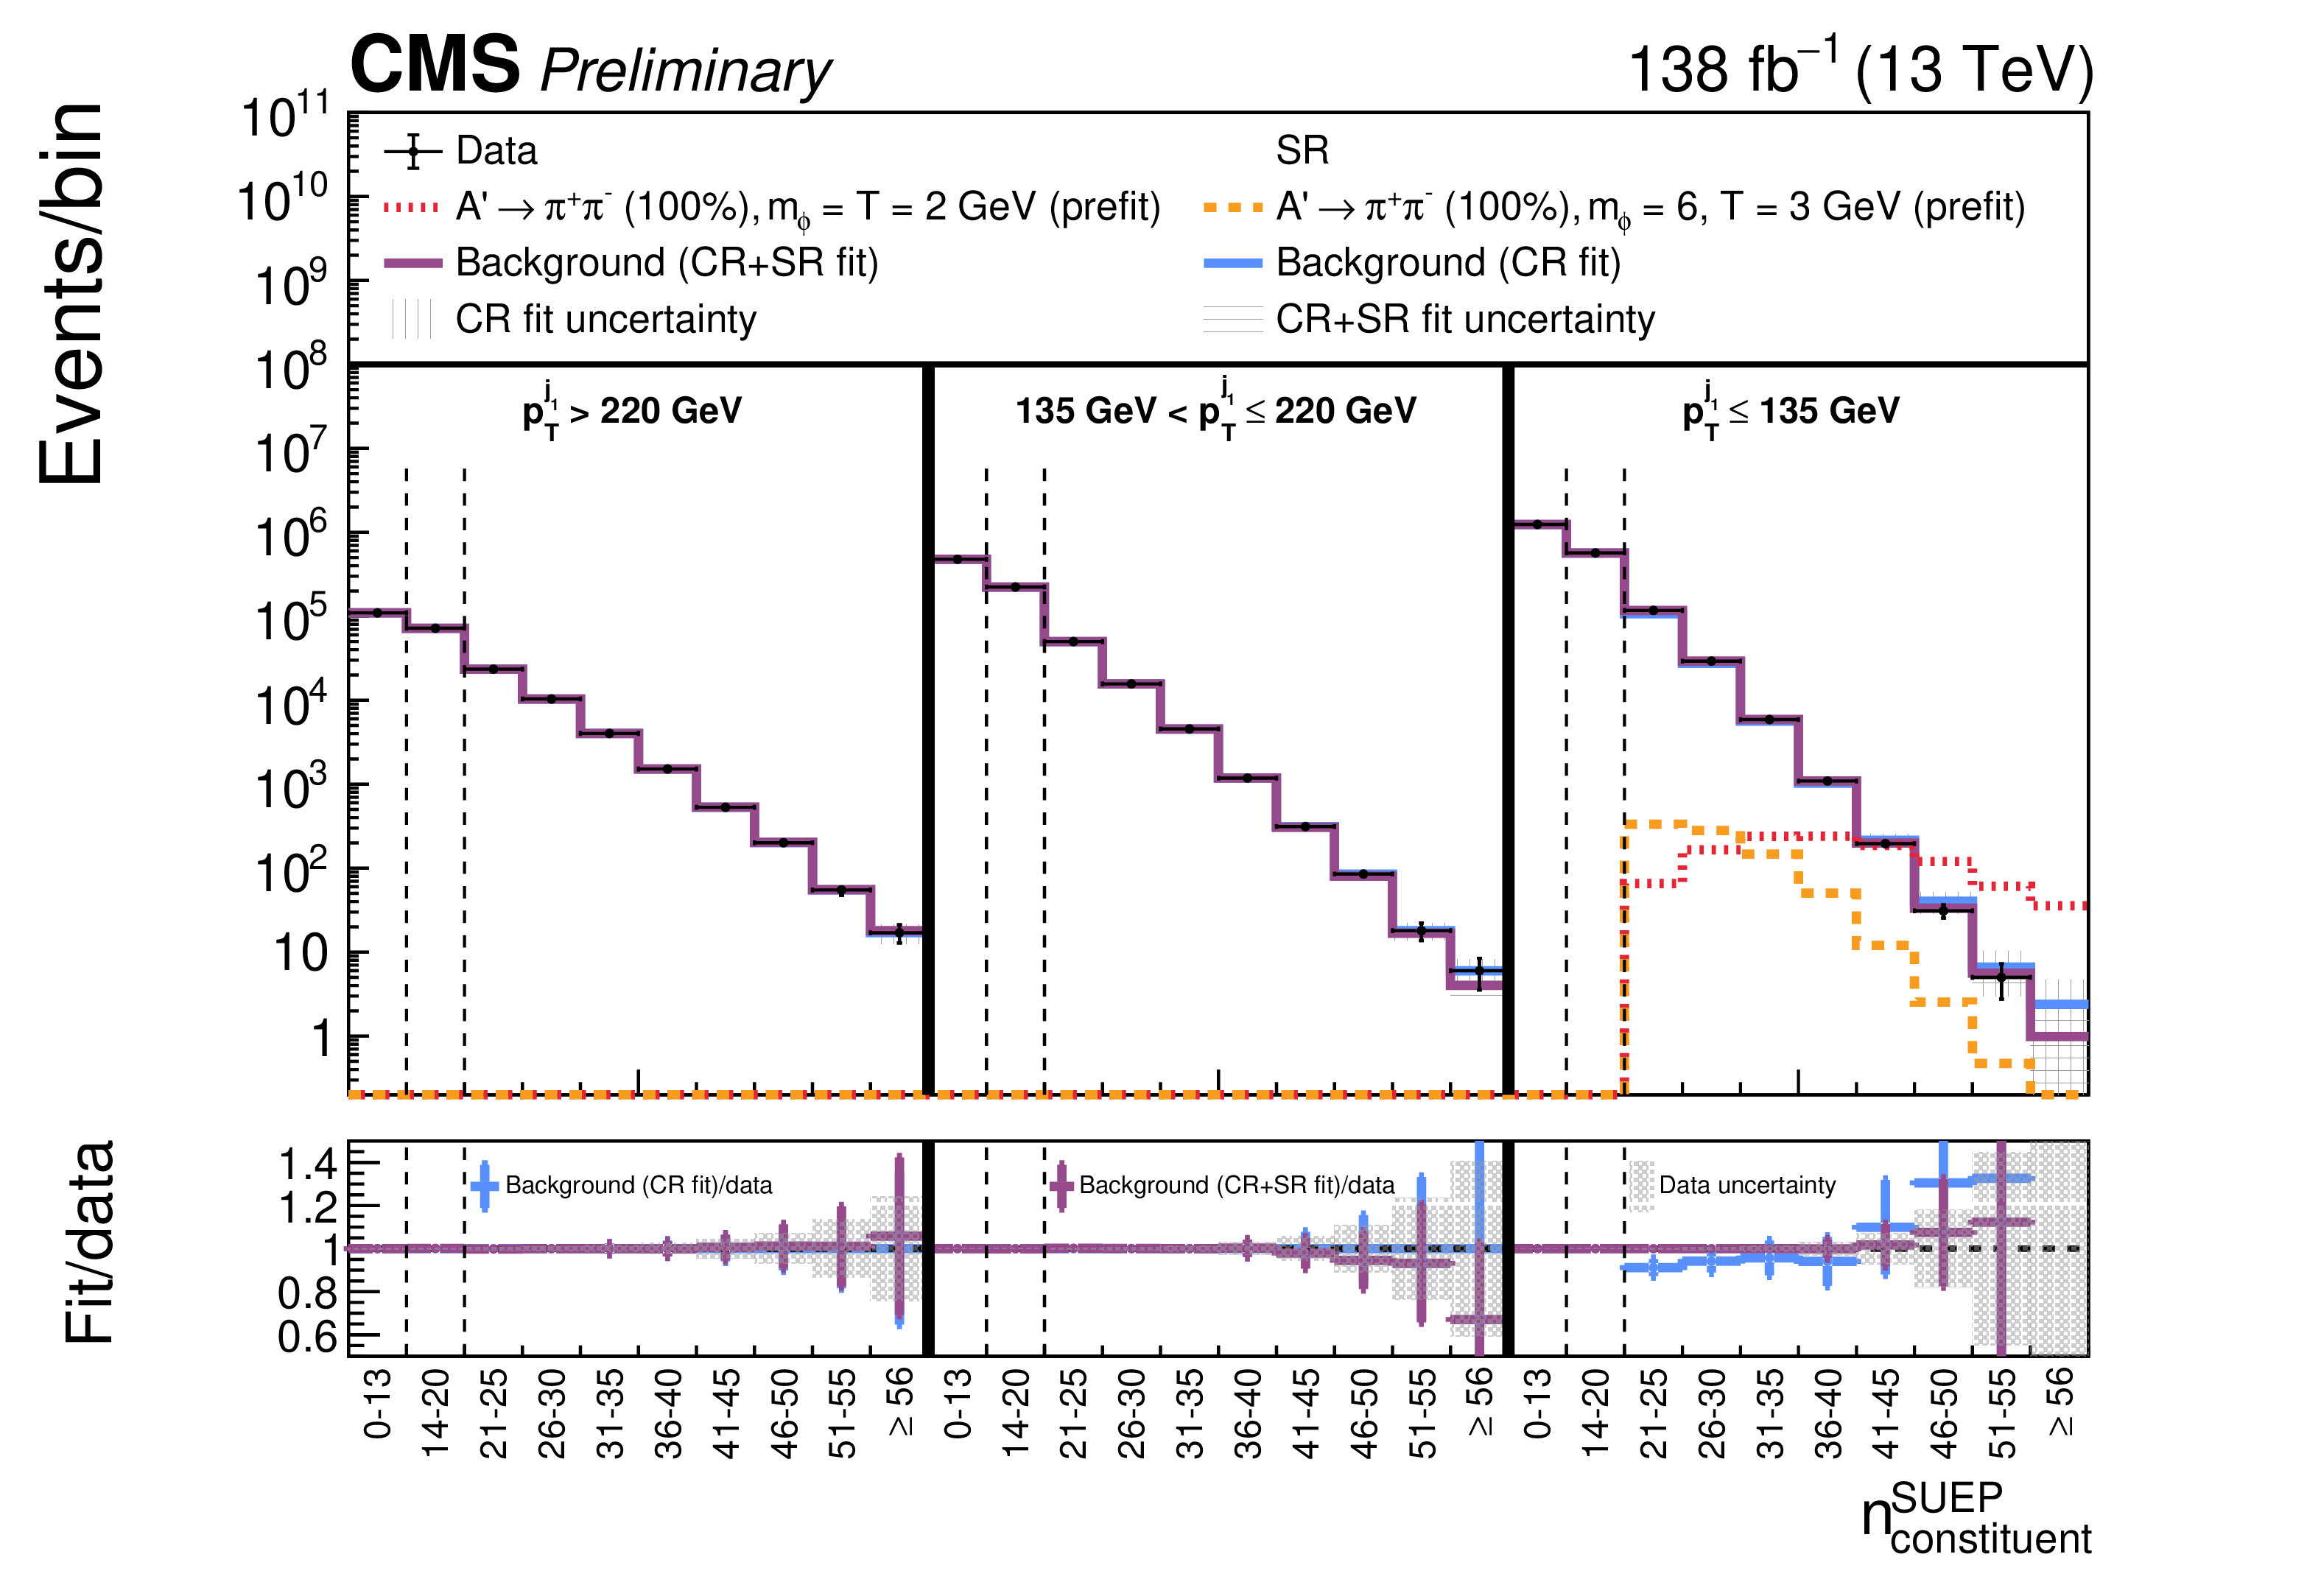
Figure 4:
Distributions of $ n_{\text{constituent}}^{\text{SUEP}} $ in the extended ABCD regions in the SR, showing the observed data, the predictions from both the CR and CR+SR fits, and several prefit signal models. The signal-enriched region A corresponds to the eight rightmost bins of the plot. Solid vertical lines separate regions with different $ p_{\mathrm{T}}^{\text{j}_{1}} $ values. Dotted vertical lines separate the different regions of the extended ABCD. The shaded vertical (horizontal) bands correspond to the overall uncertainty on the background estimation in the CR fit (CR+SR fit). In the lower panel, the shaded bands correspond to the statistical uncertainty in the data. |
png pdf |
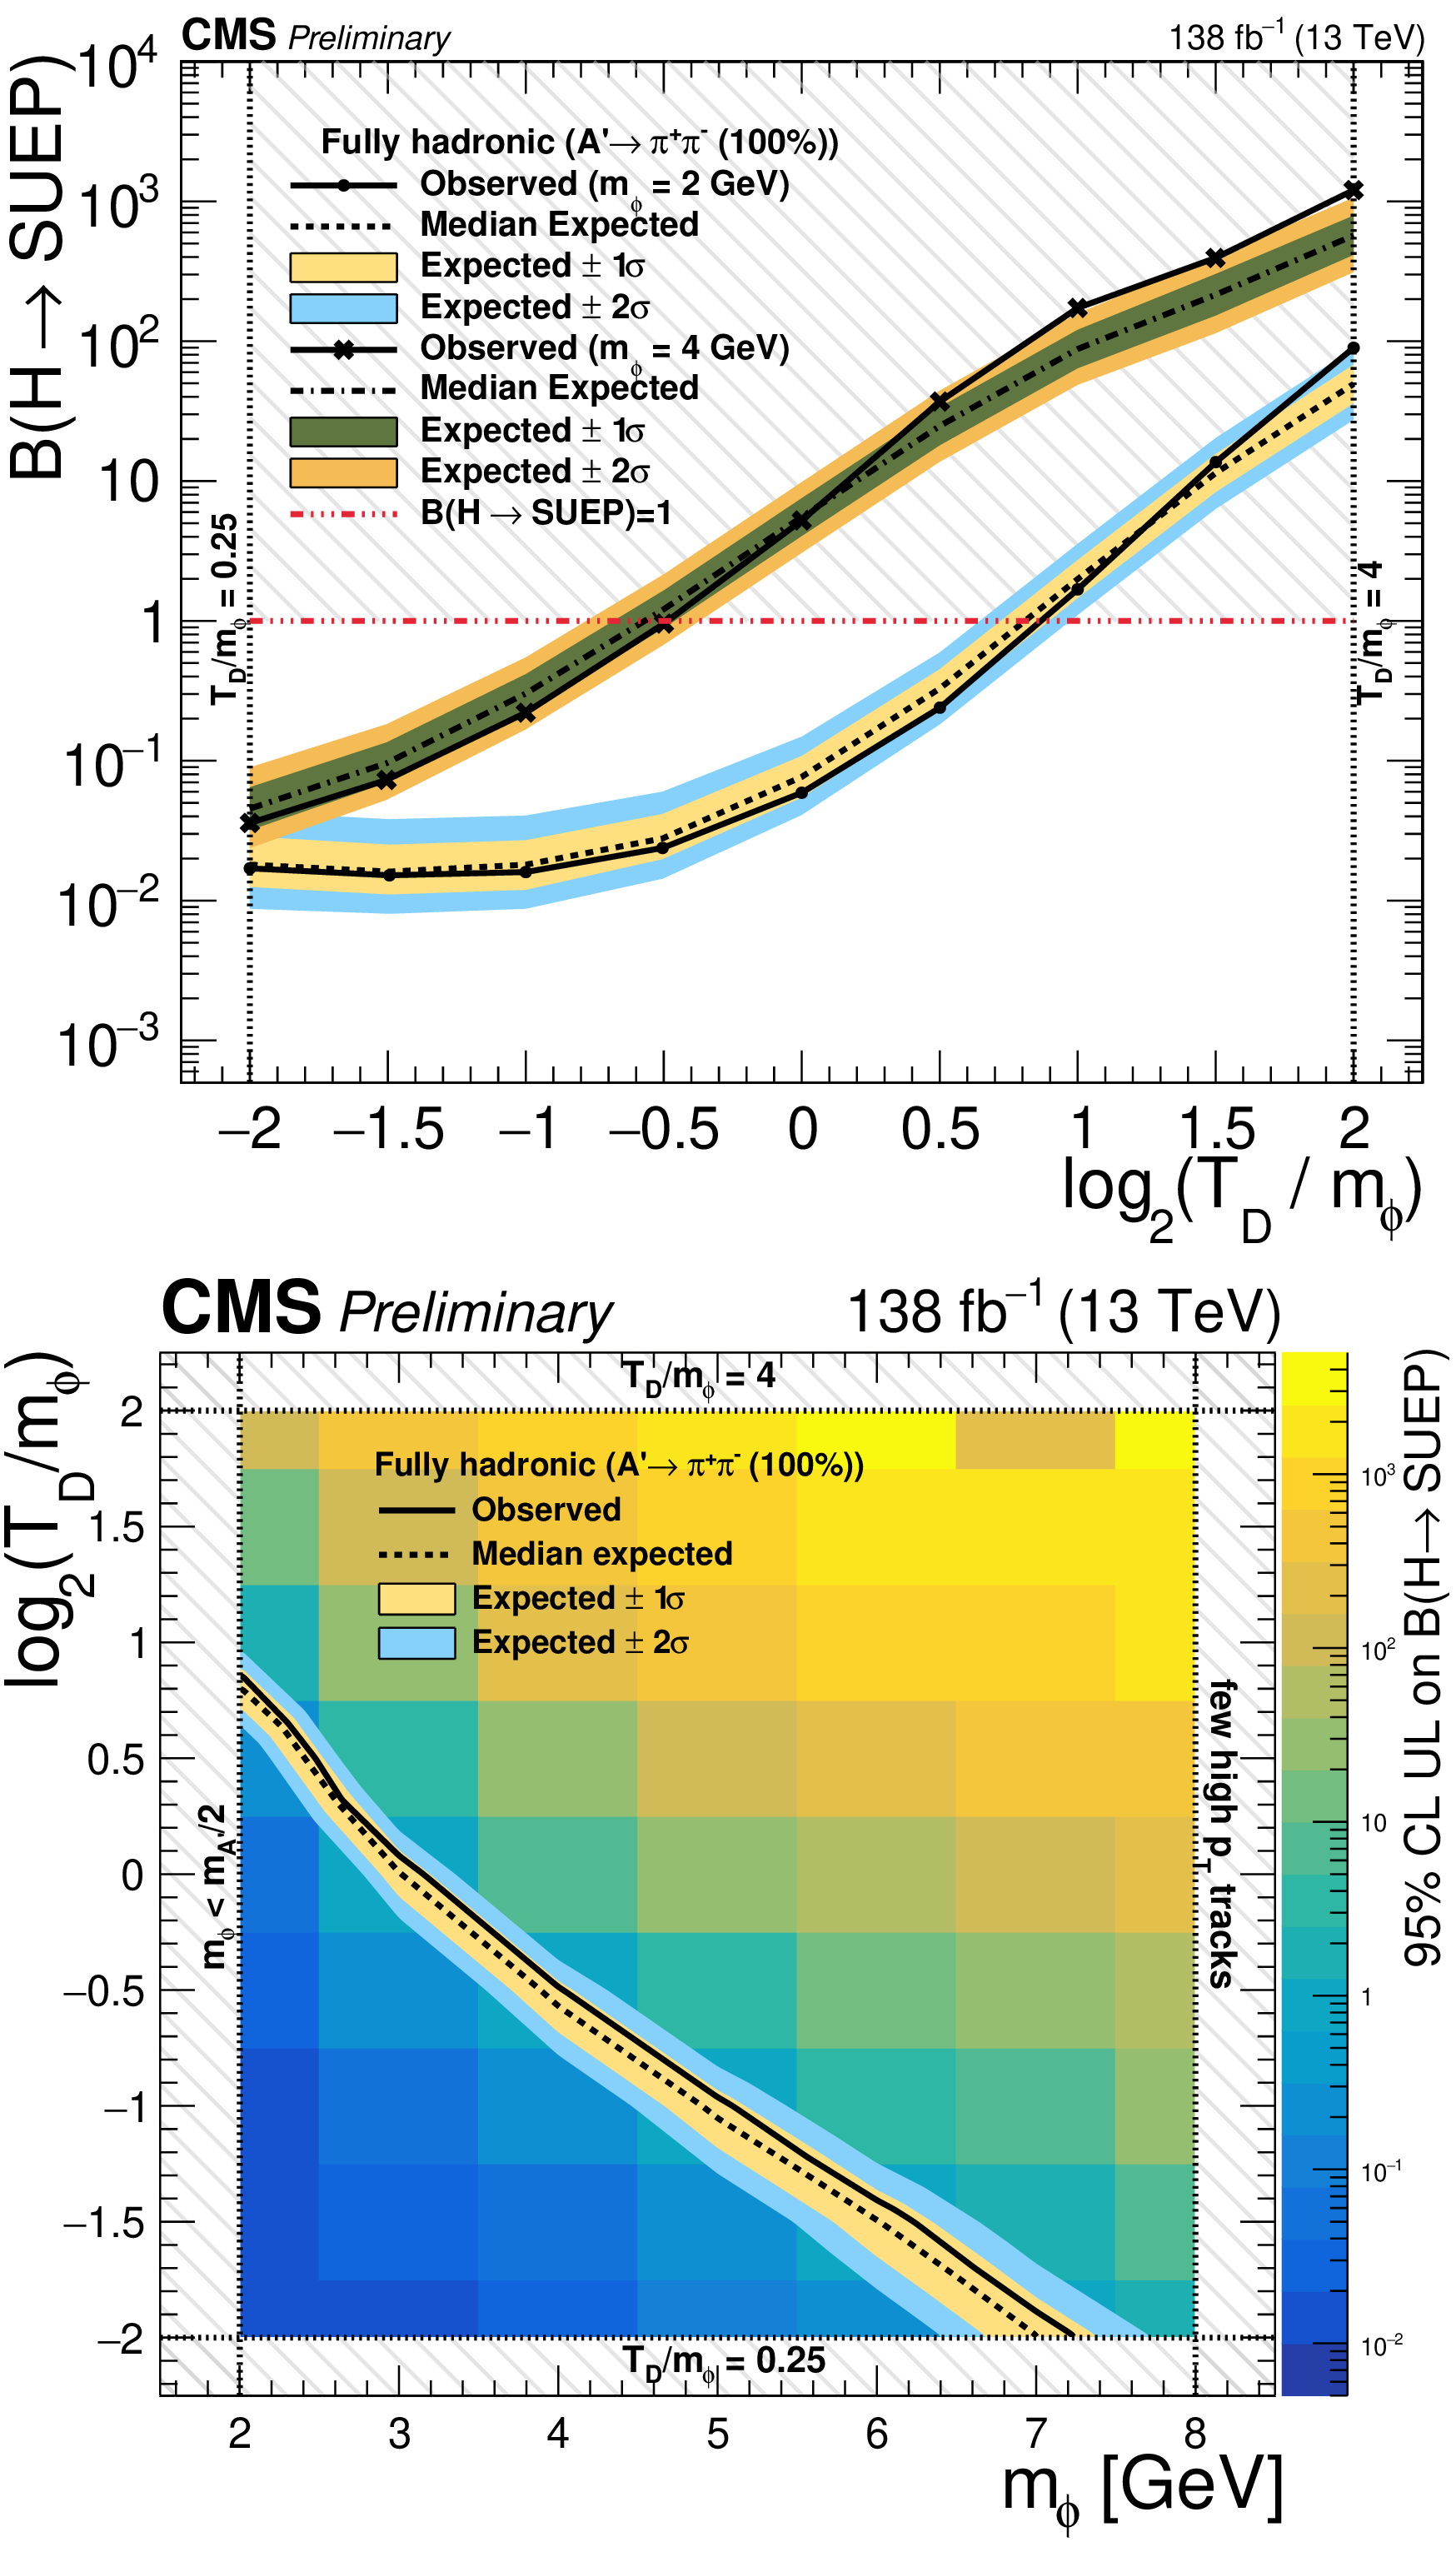
Figure 5:
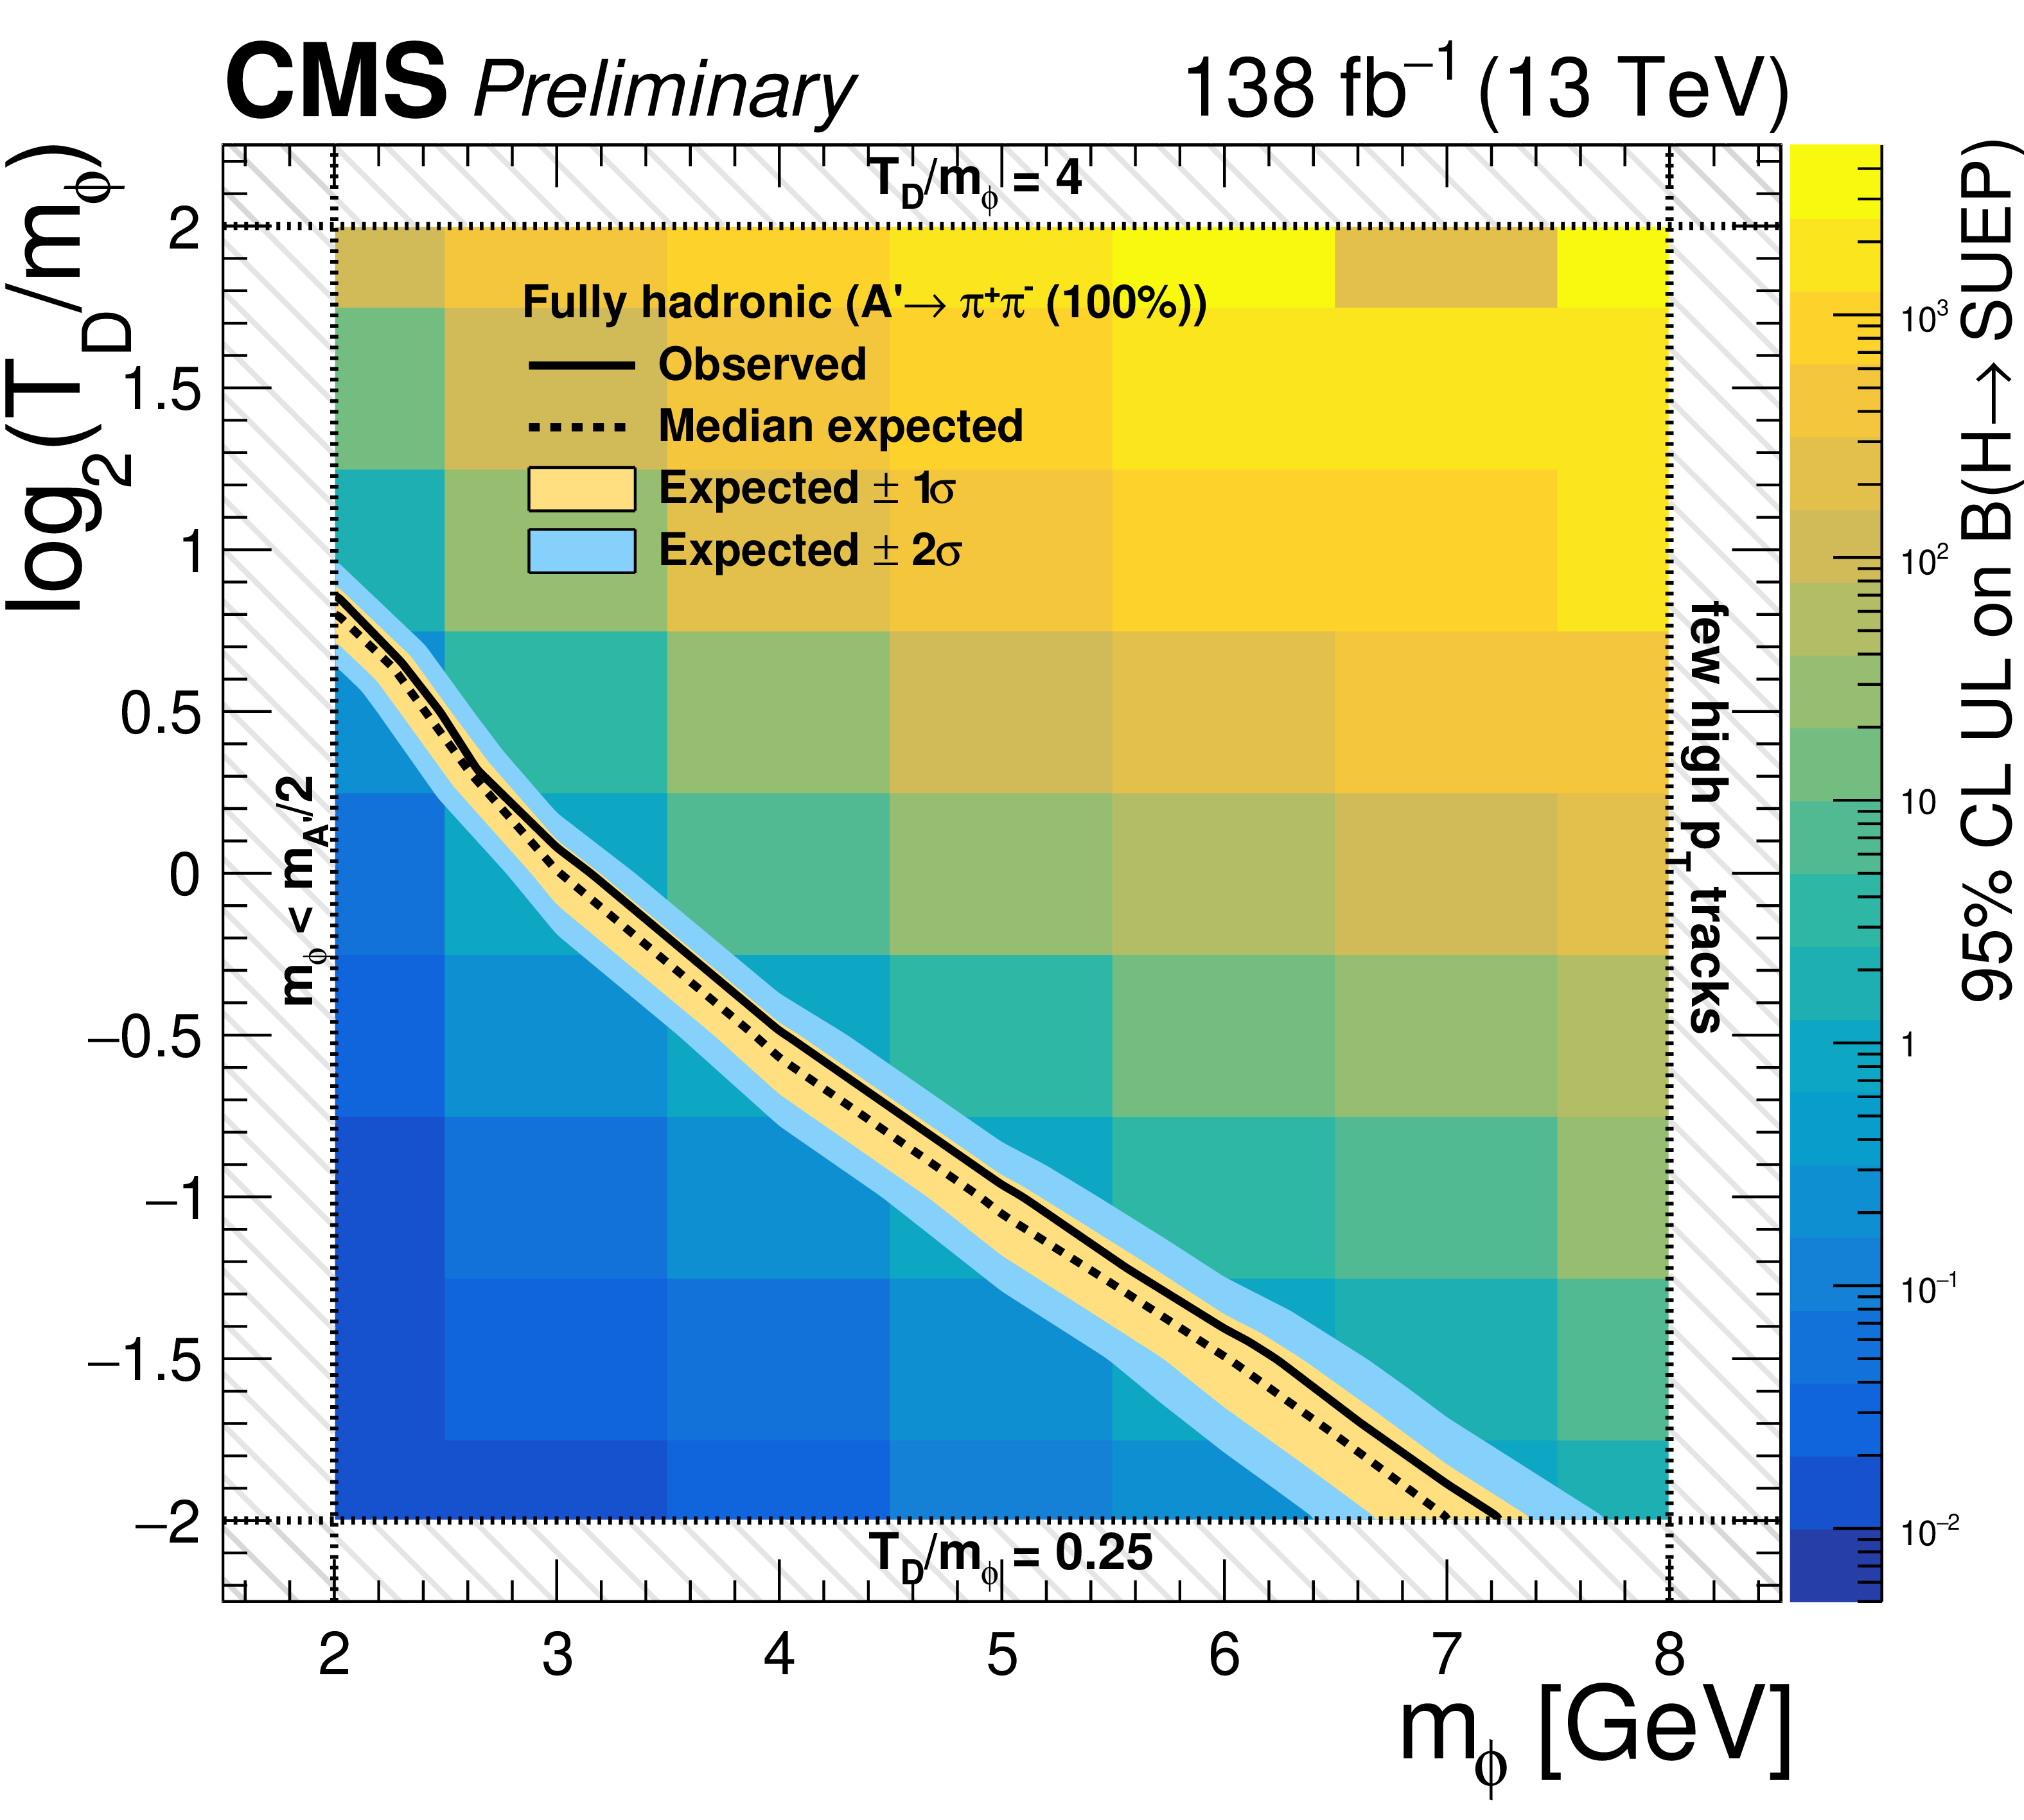
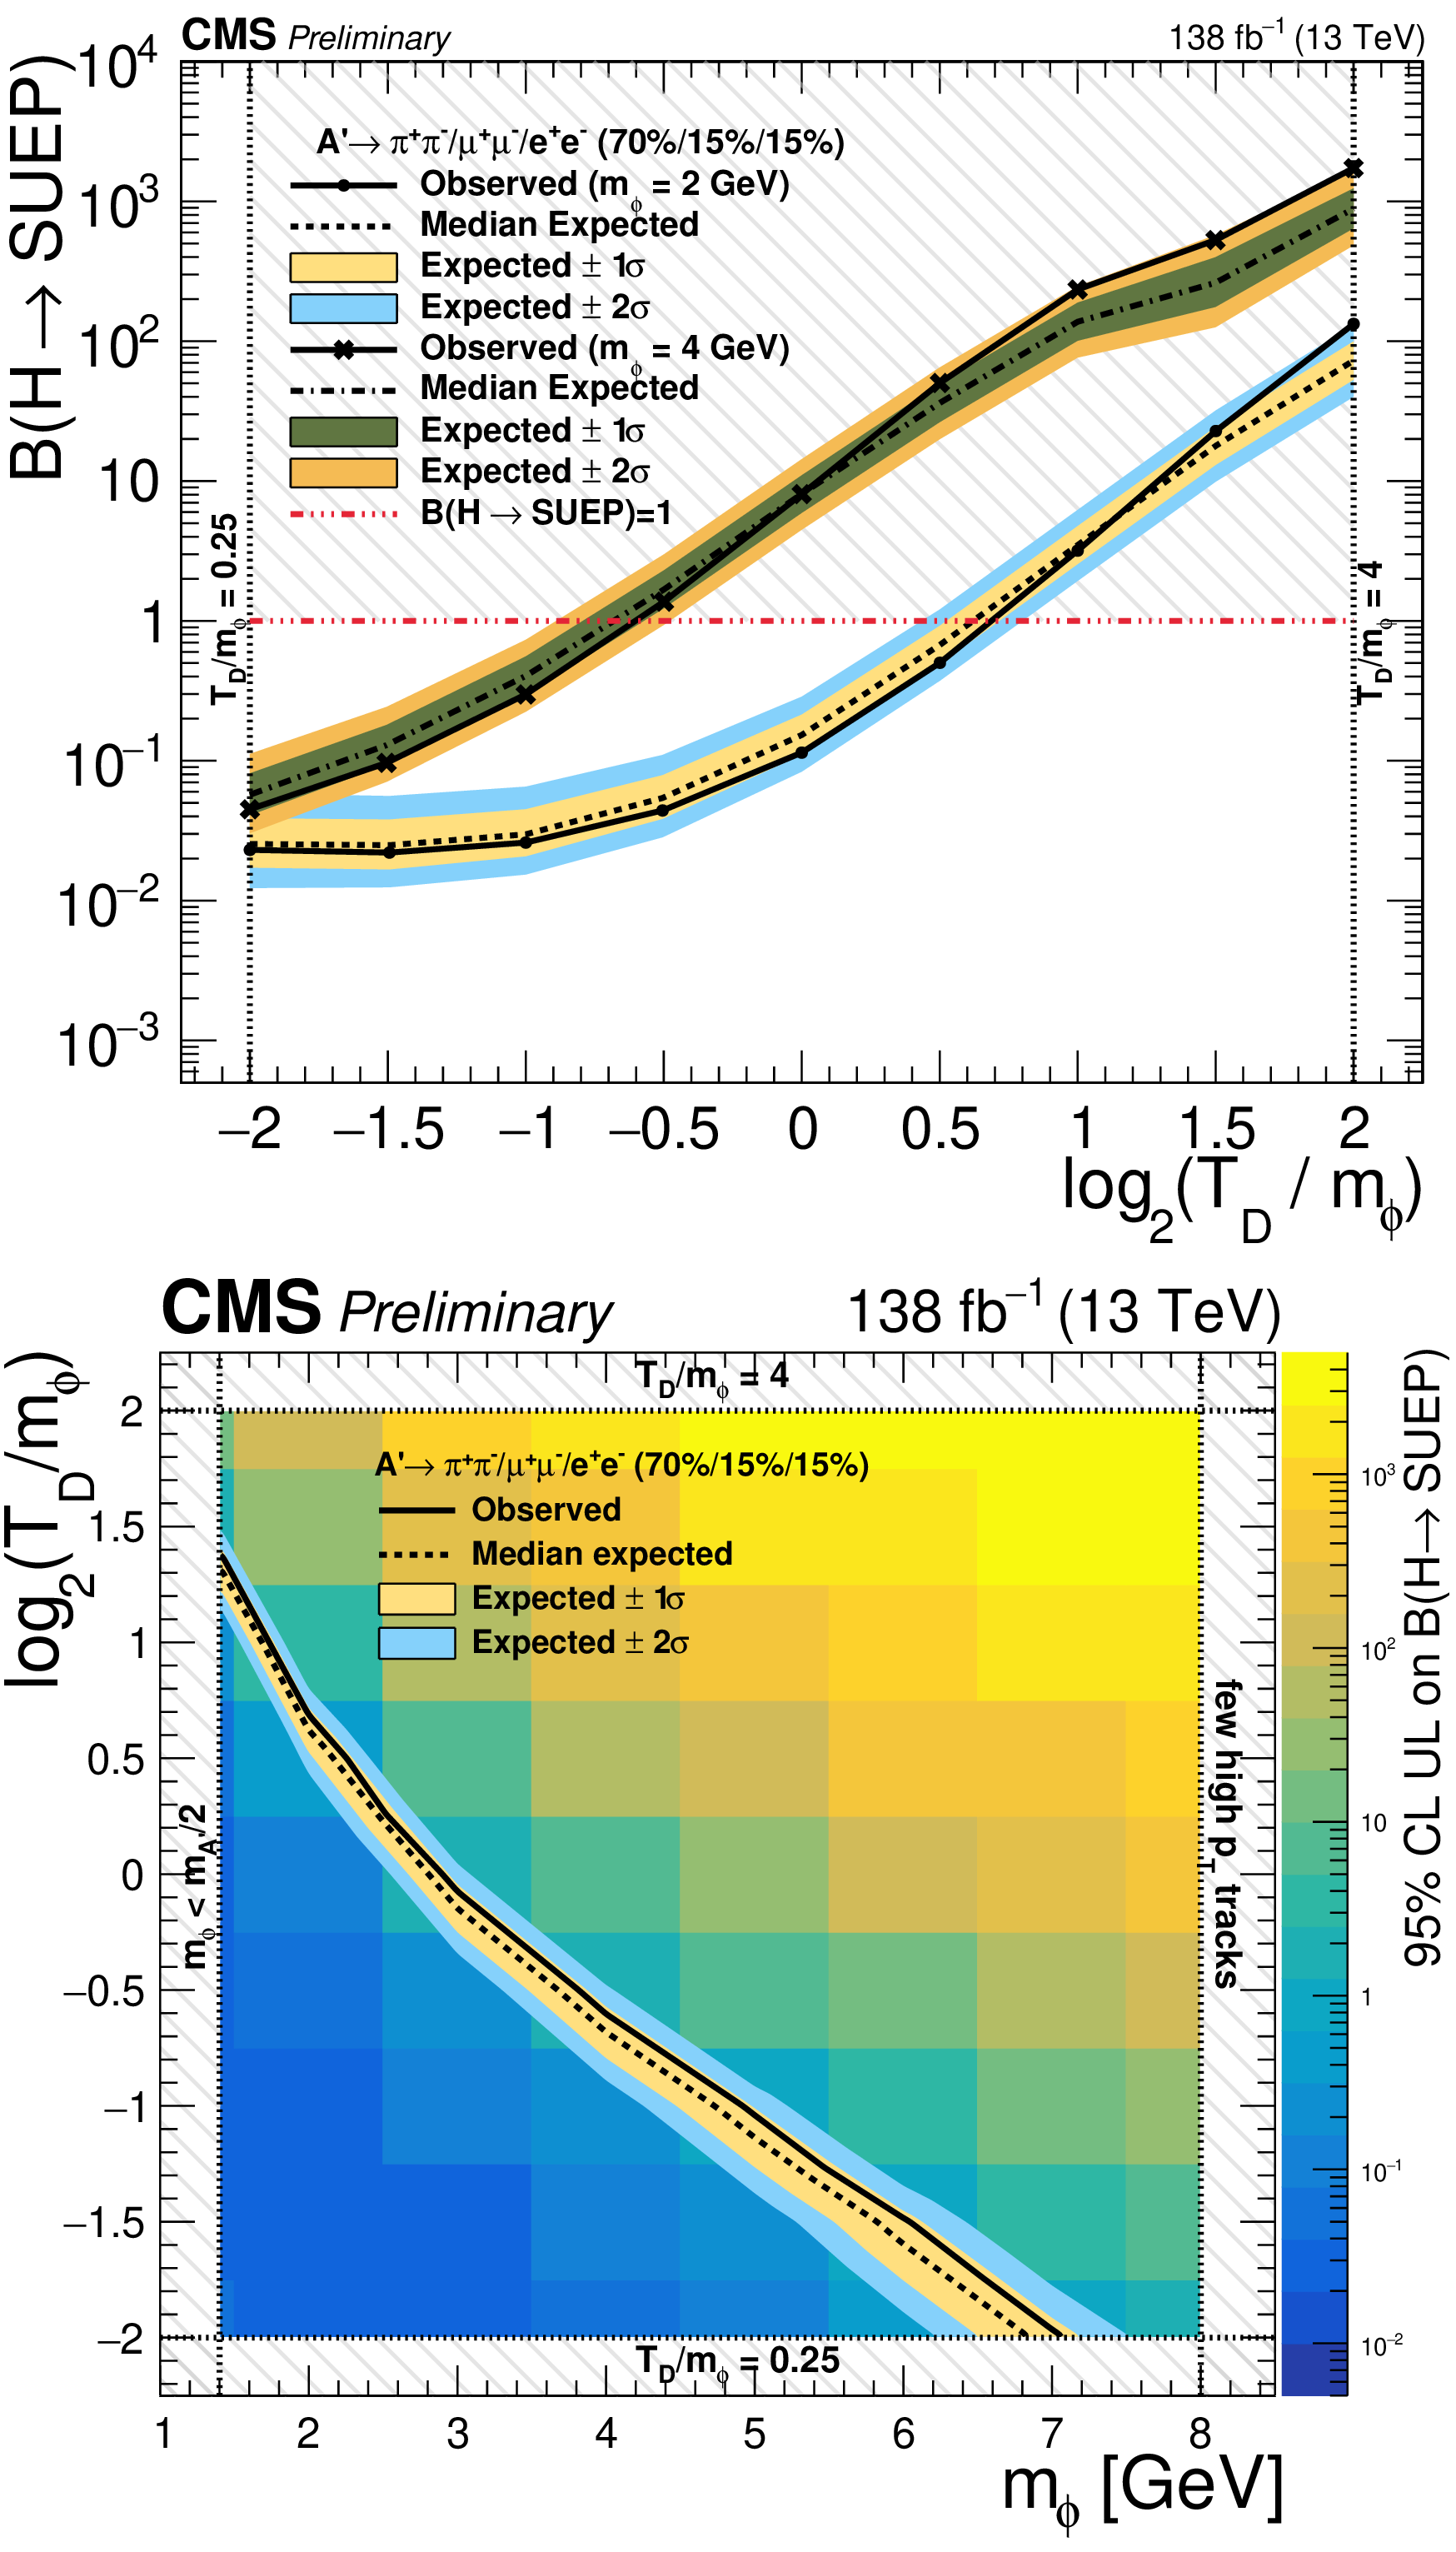
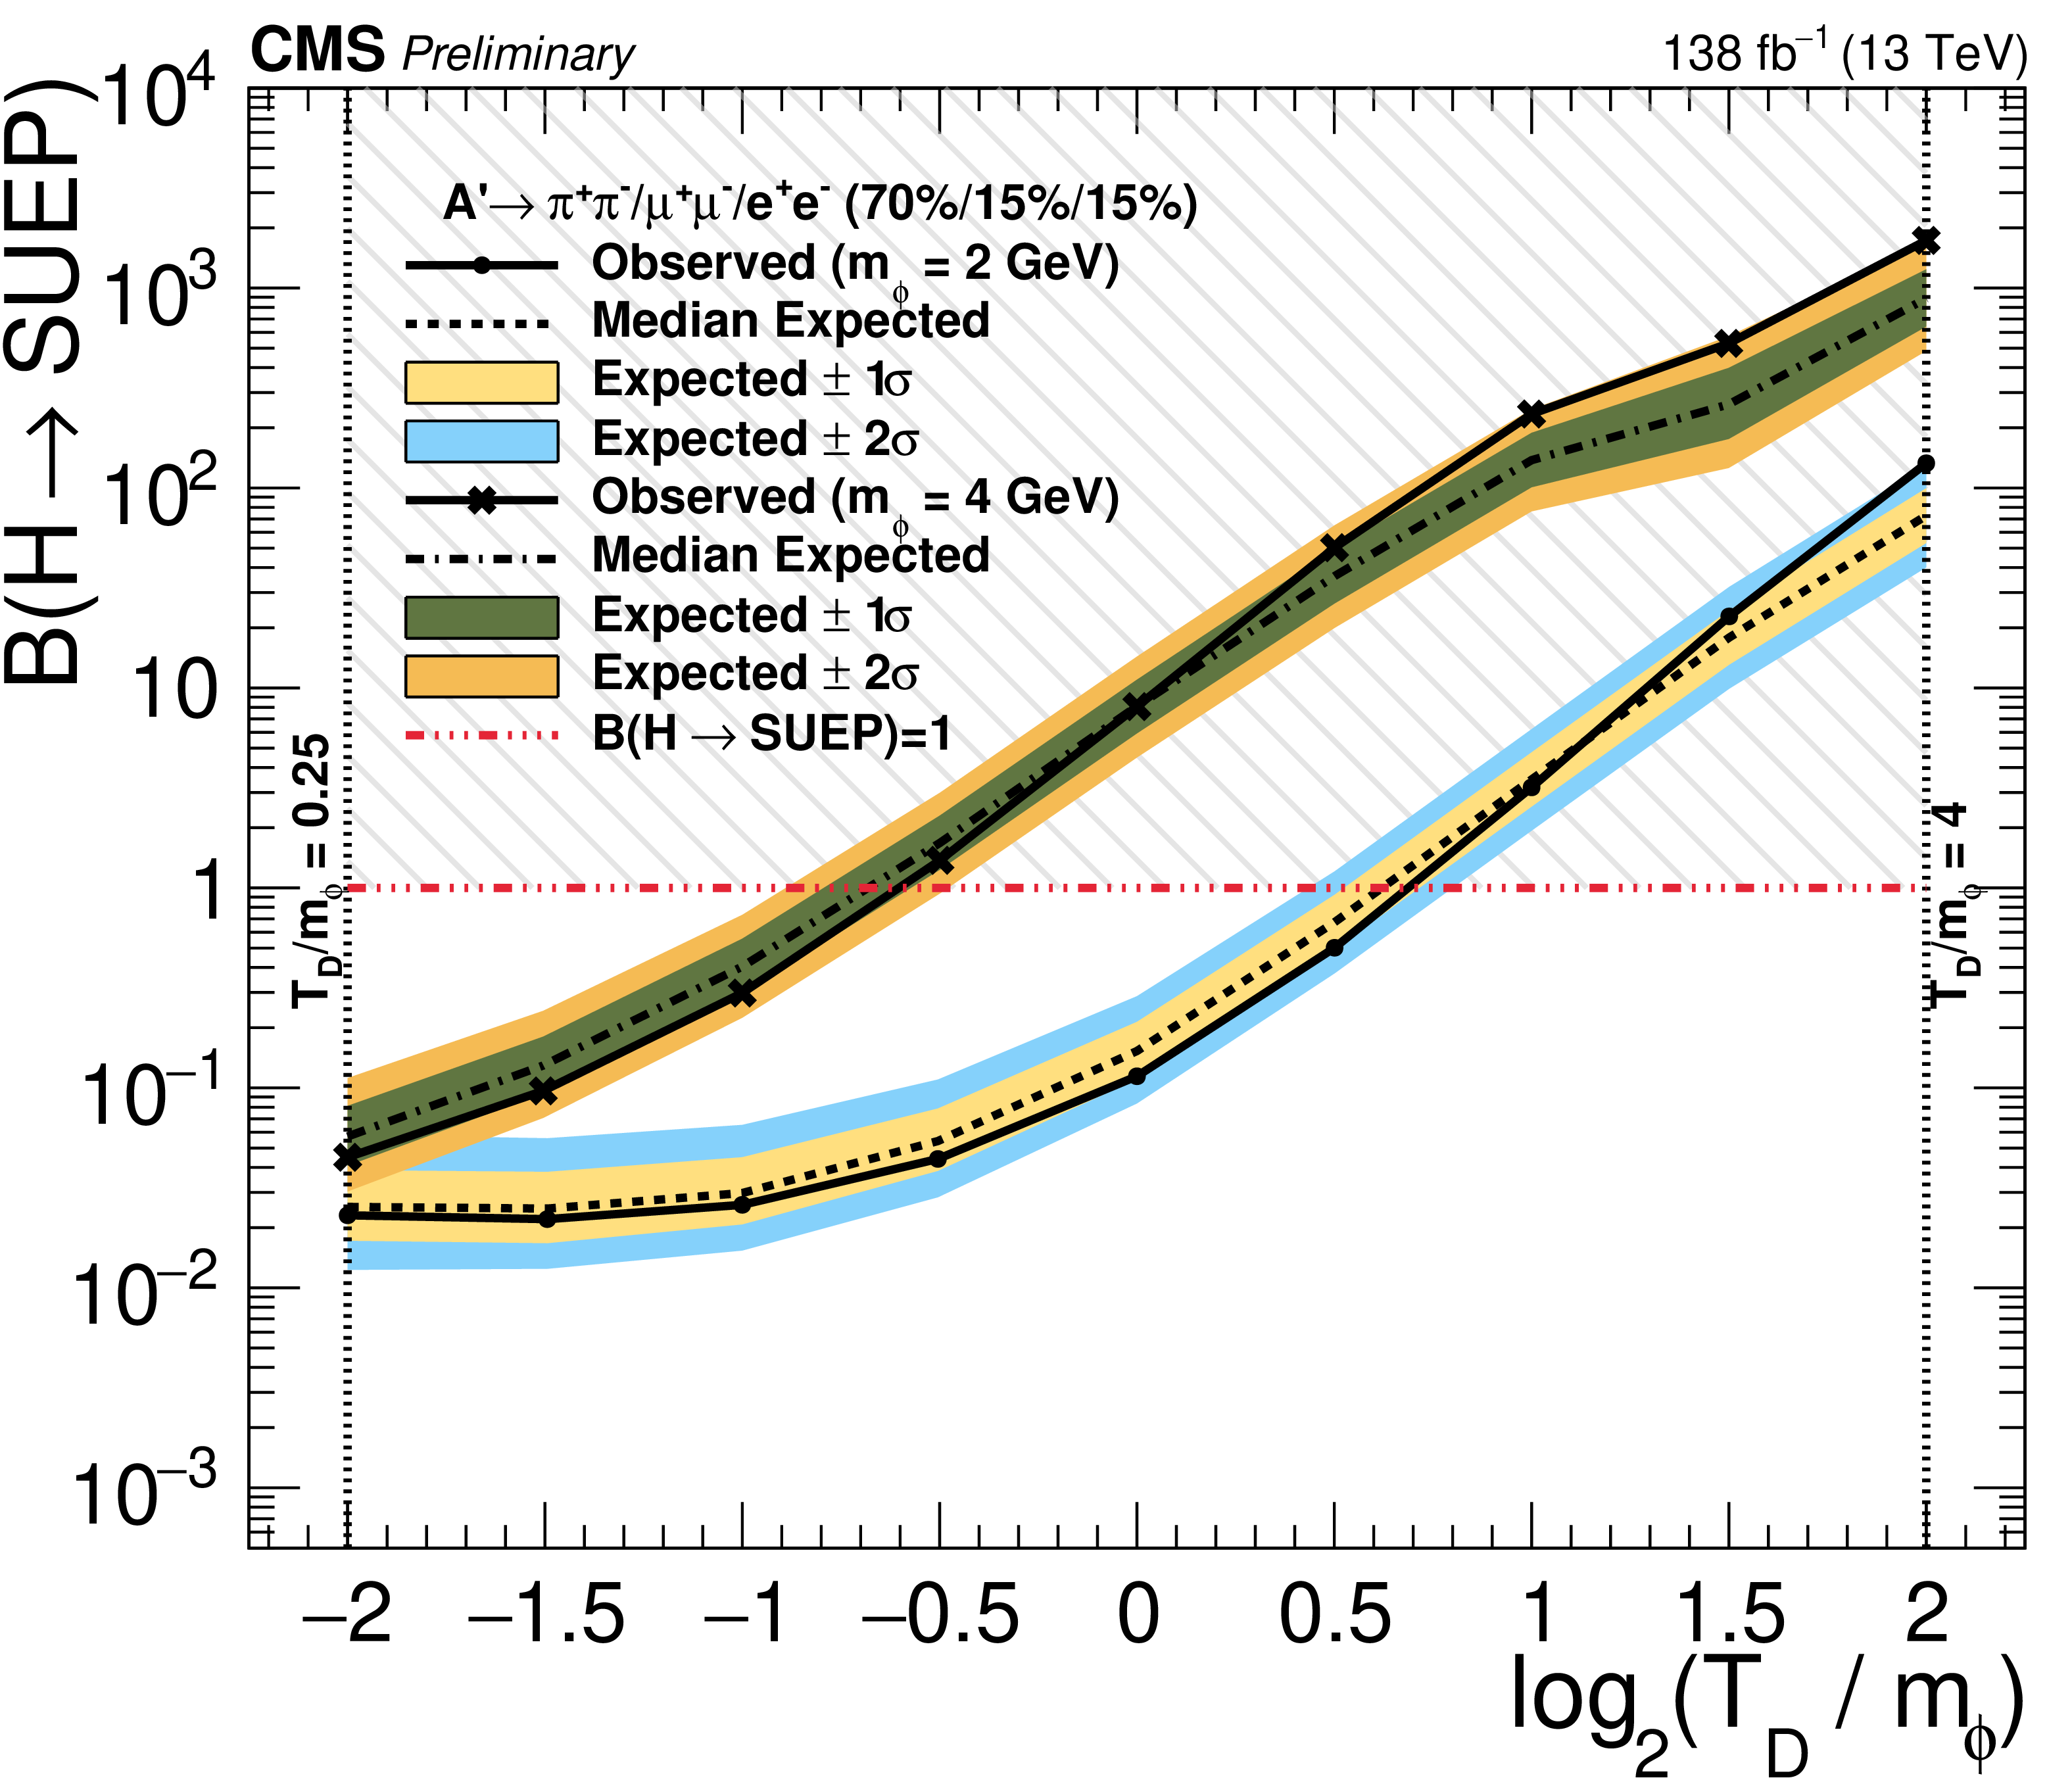
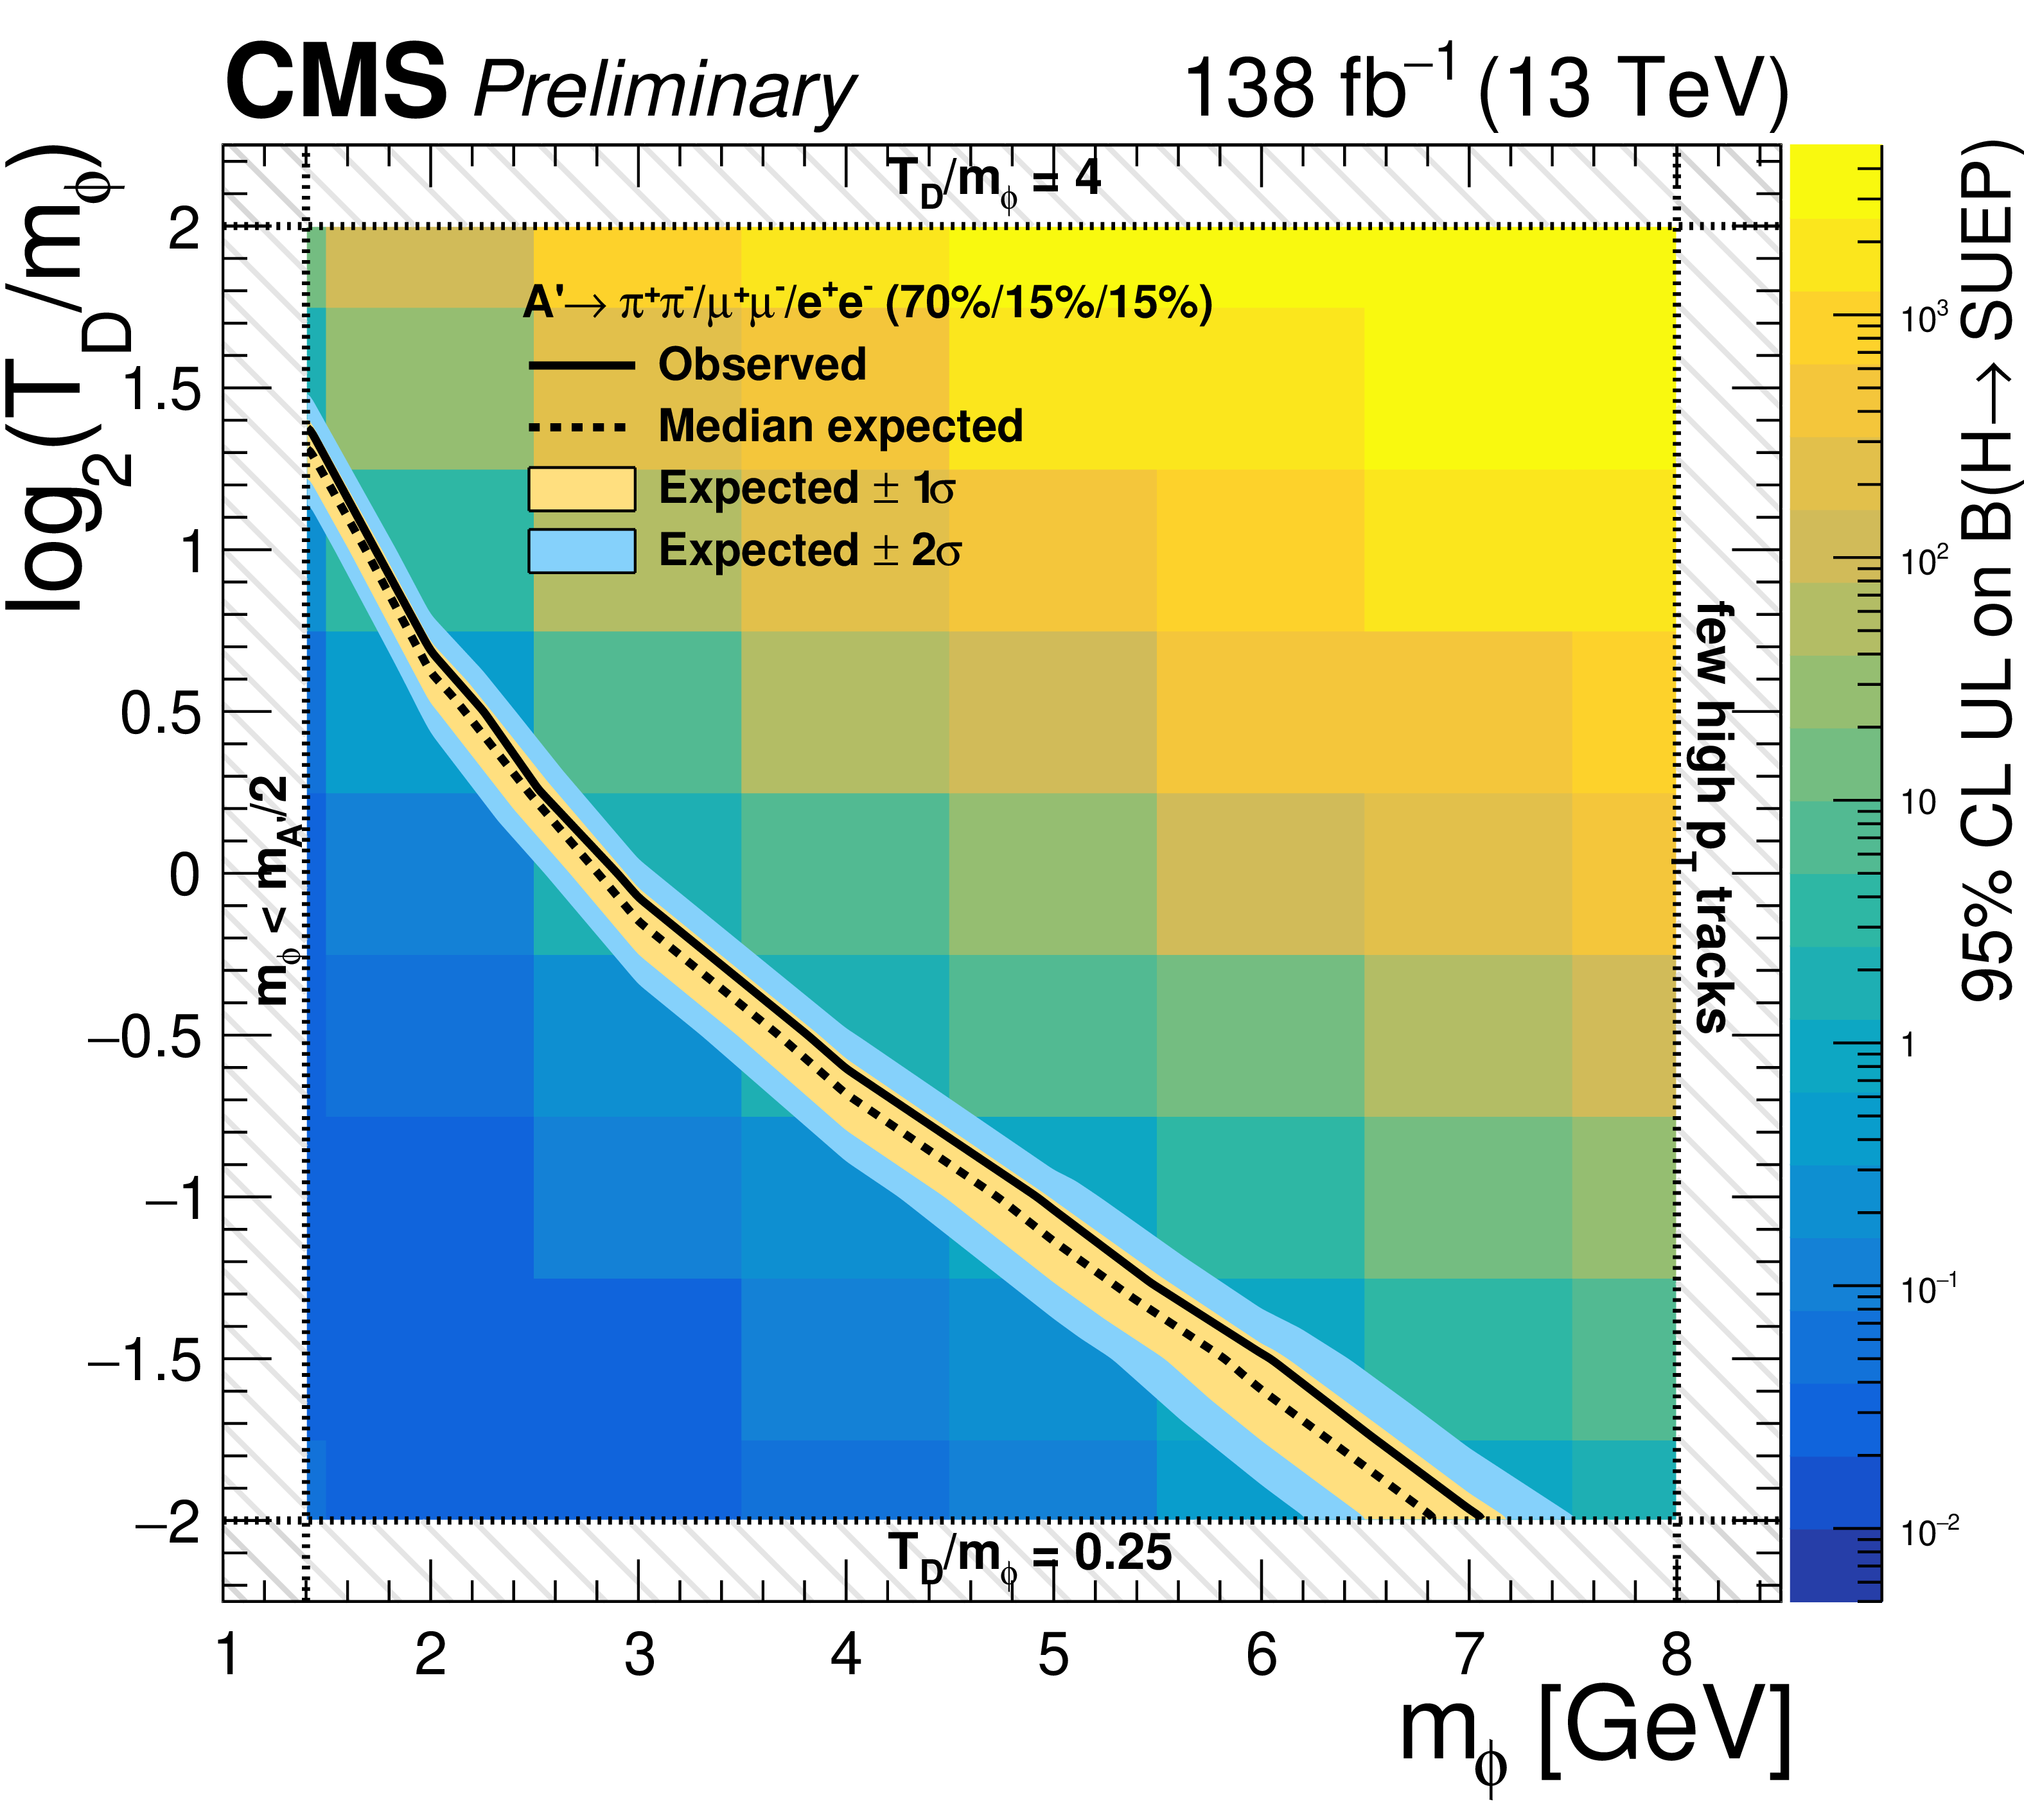
Upper: 95% CL upper limits on the product of the Higgs boson to SUEP branching fraction for several different signal models with fully hadronic A' decays and $ m_{\phi}= $ 2 or 4 GeV. The horizontal dotted line represents the predicted signal cross section for a Higgs boson mediator with 100% branching fraction to SUEP and SM Z boson decays to leptons. Lower: interpretation of the results for a Higgs boson mediator and fully hadronic SUEP decays. The background color map represents the observed upper limit for each signal model; the contour at which the observed (median expected) upper limit on the branching fraction equals unity is shown as a solid (dotted) black line. |
png pdf |
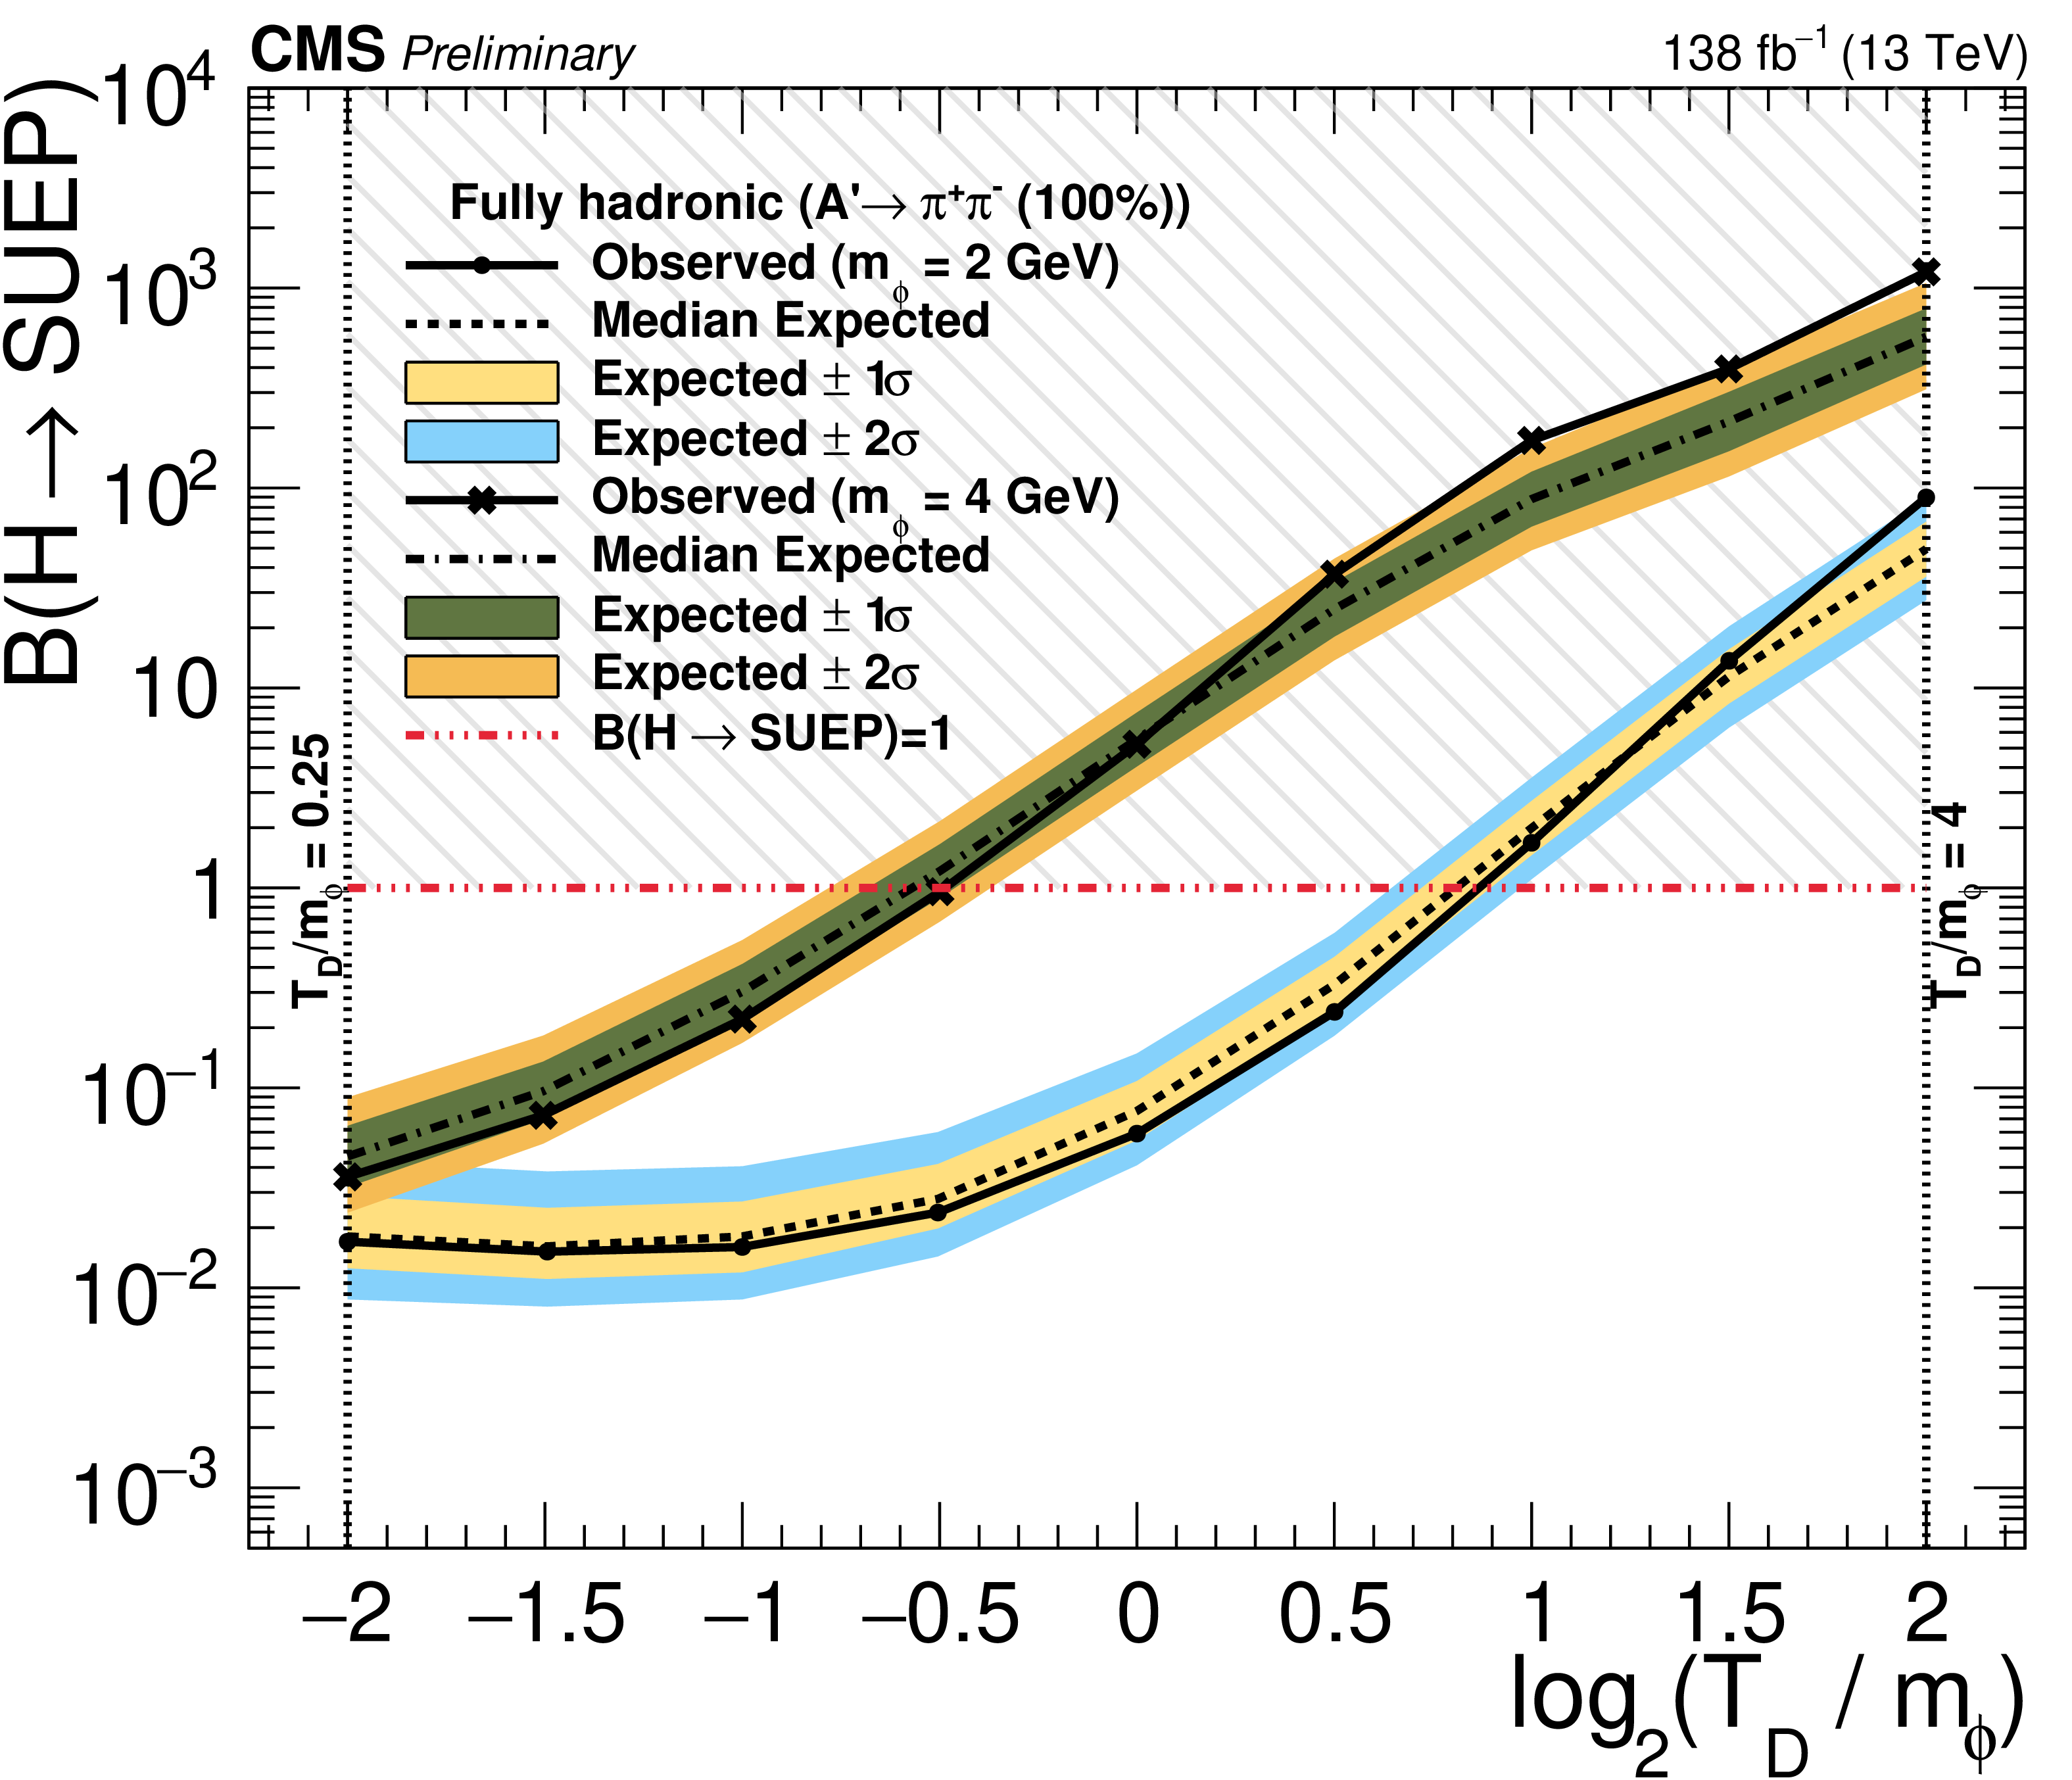
Figure 5-a:
Upper: 95% CL upper limits on the product of the Higgs boson to SUEP branching fraction for several different signal models with fully hadronic A' decays and $ m_{\phi}= $ 2 or 4 GeV. The horizontal dotted line represents the predicted signal cross section for a Higgs boson mediator with 100% branching fraction to SUEP and SM Z boson decays to leptons. Lower: interpretation of the results for a Higgs boson mediator and fully hadronic SUEP decays. The background color map represents the observed upper limit for each signal model; the contour at which the observed (median expected) upper limit on the branching fraction equals unity is shown as a solid (dotted) black line. |
png pdf |
Figure 5-b:
Upper: 95% CL upper limits on the product of the Higgs boson to SUEP branching fraction for several different signal models with fully hadronic A' decays and $ m_{\phi}= $ 2 or 4 GeV. The horizontal dotted line represents the predicted signal cross section for a Higgs boson mediator with 100% branching fraction to SUEP and SM Z boson decays to leptons. Lower: interpretation of the results for a Higgs boson mediator and fully hadronic SUEP decays. The background color map represents the observed upper limit for each signal model; the contour at which the observed (median expected) upper limit on the branching fraction equals unity is shown as a solid (dotted) black line. |
png pdf |
Figure 6:
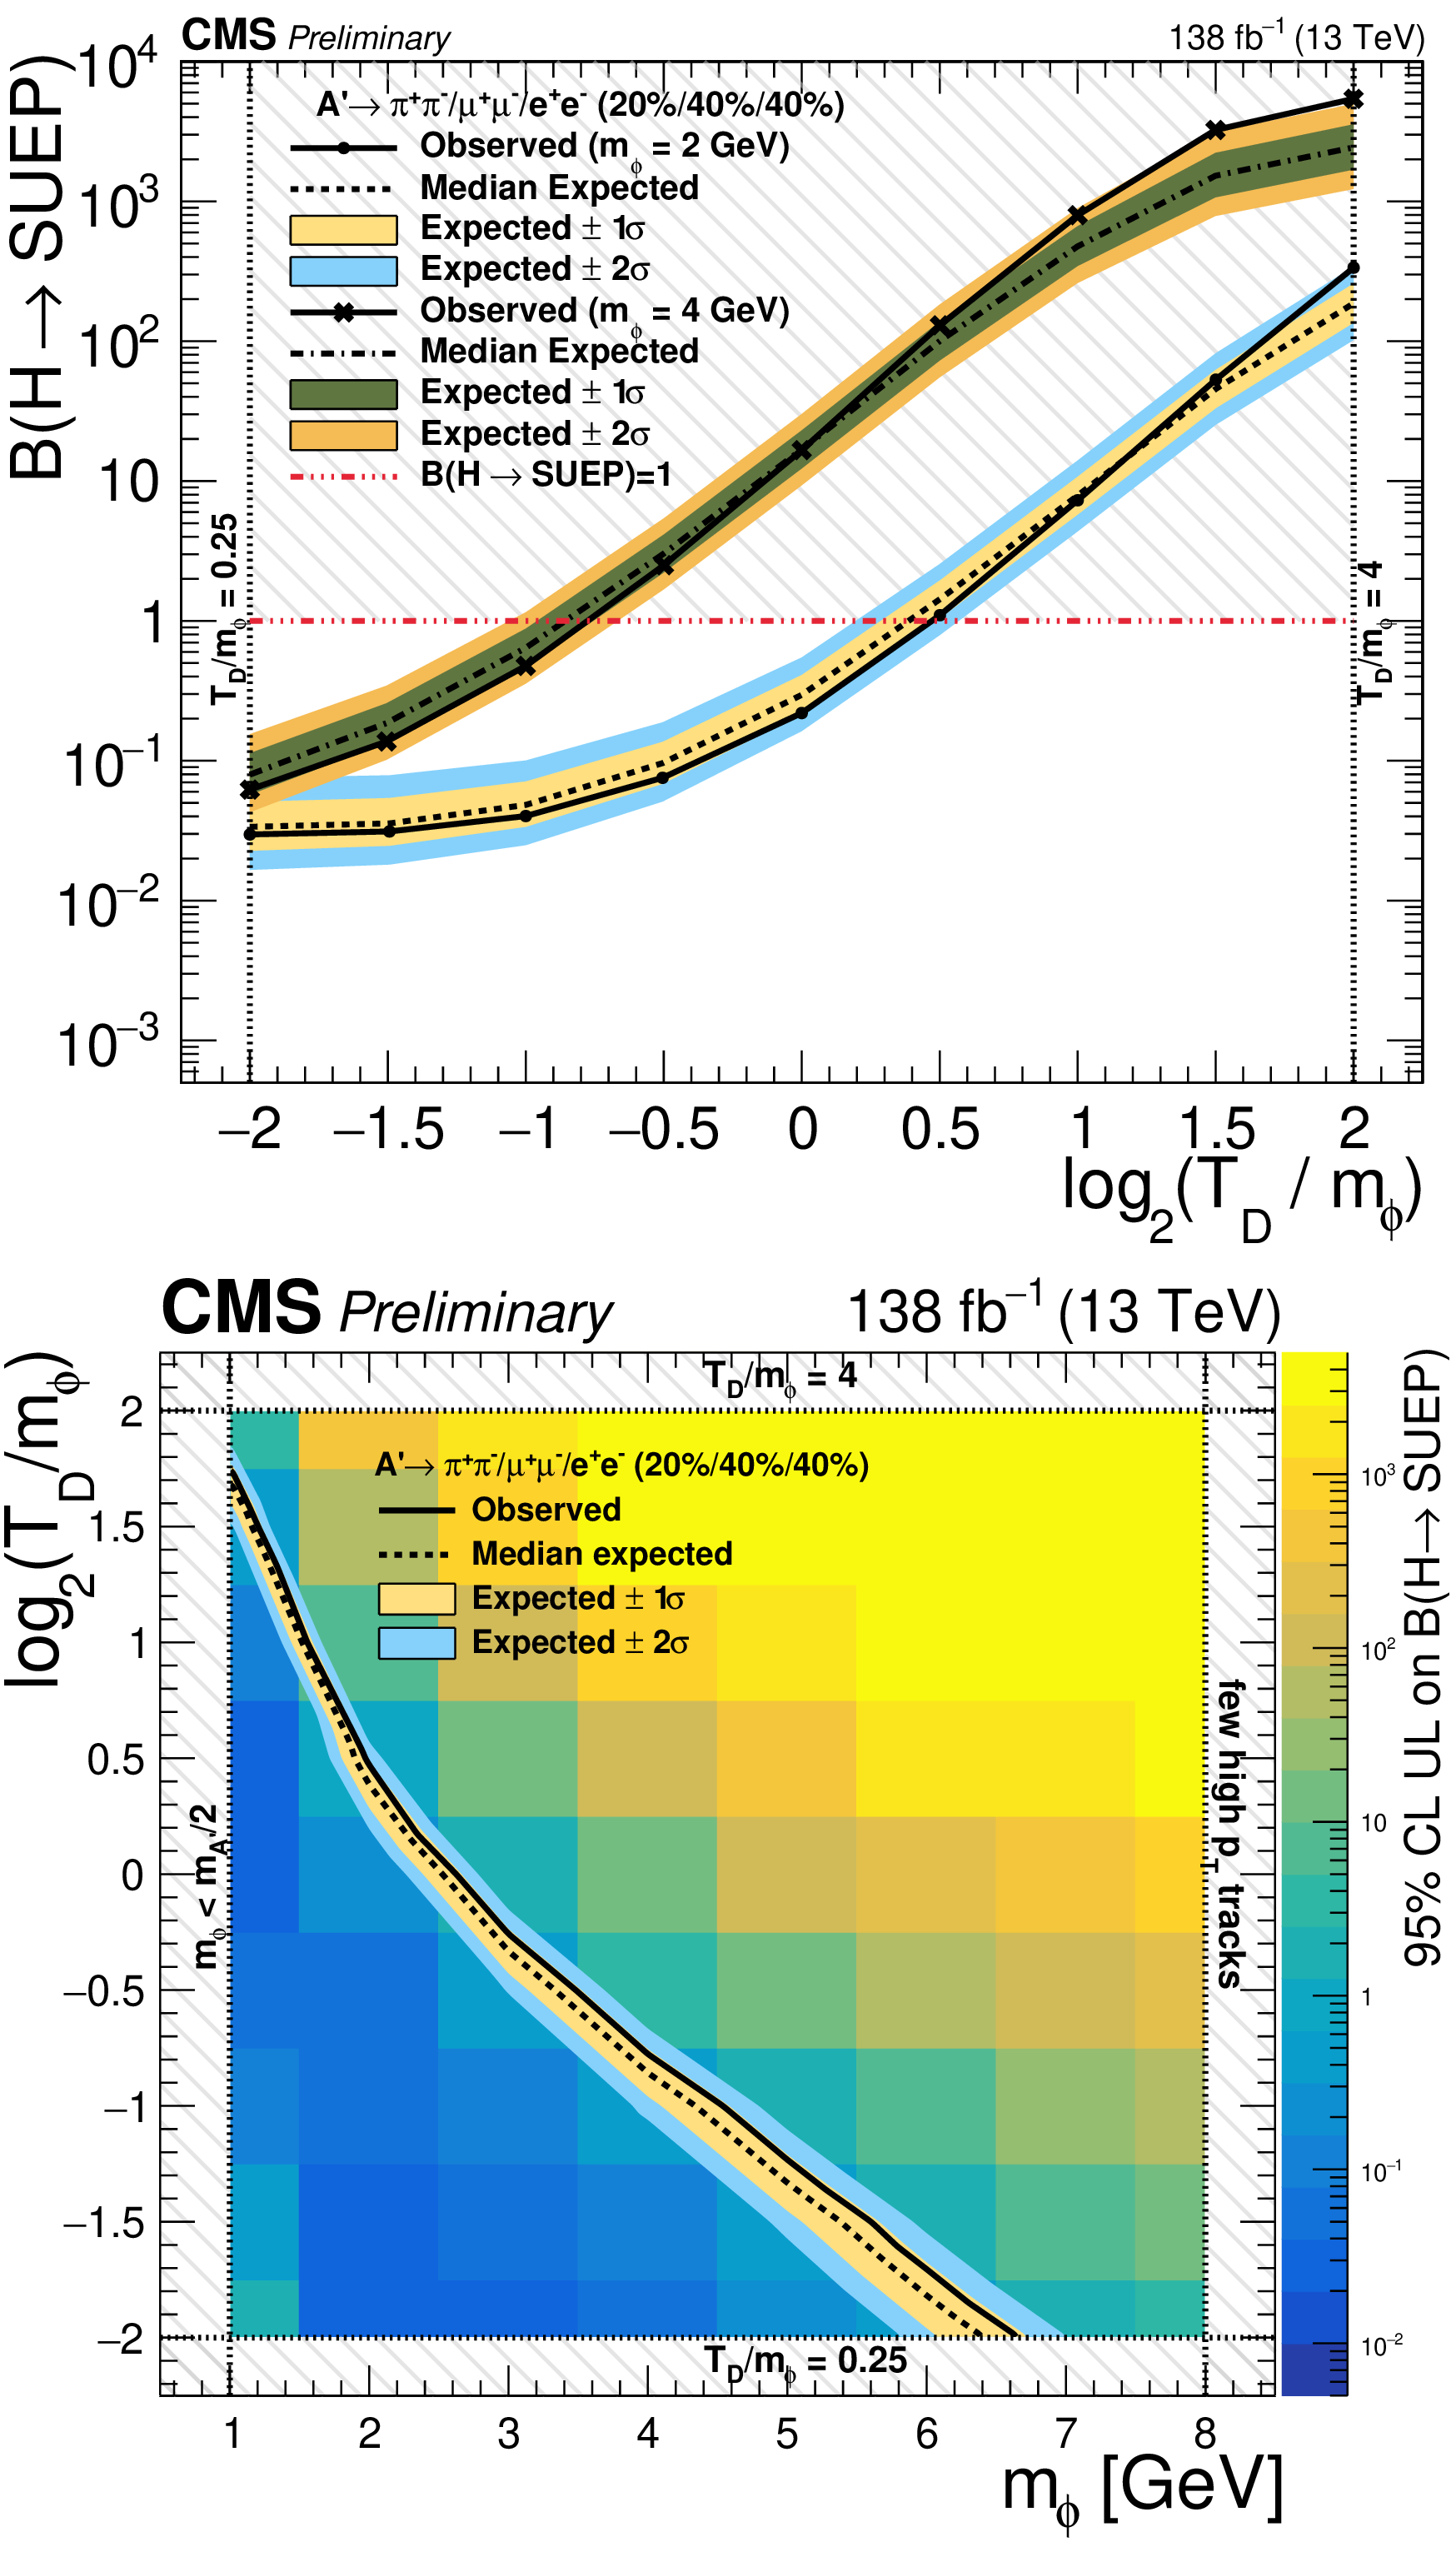
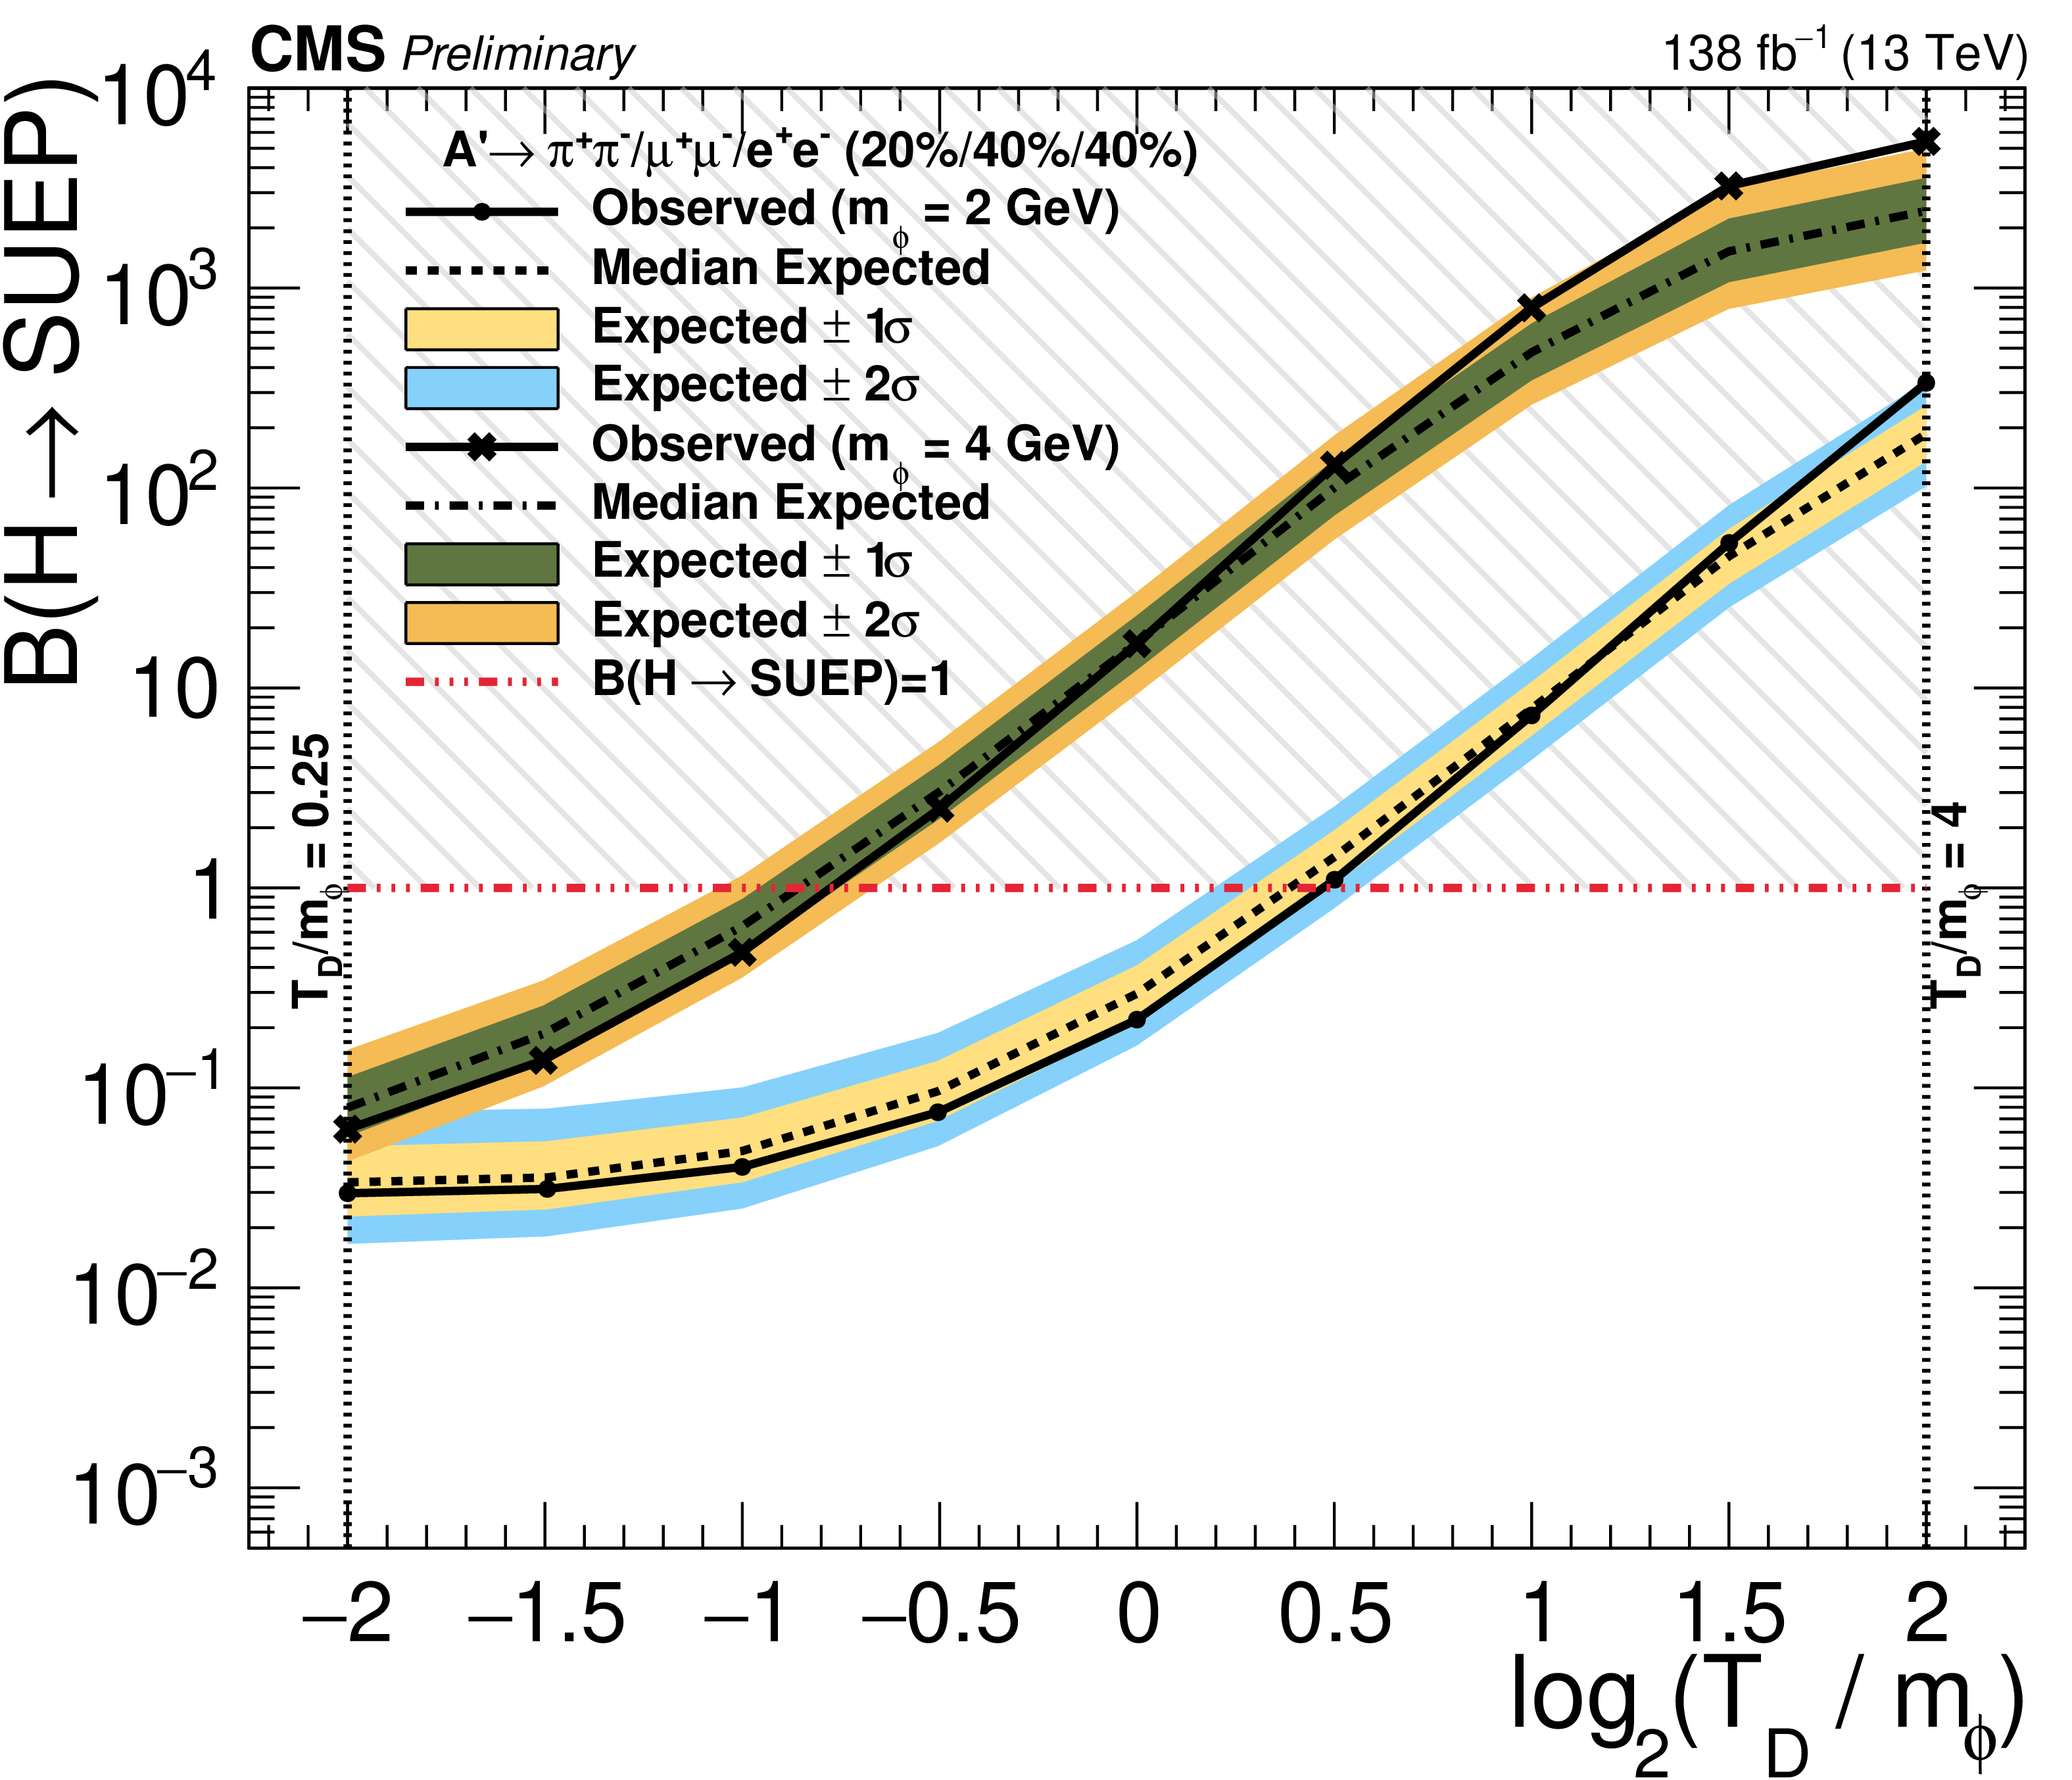
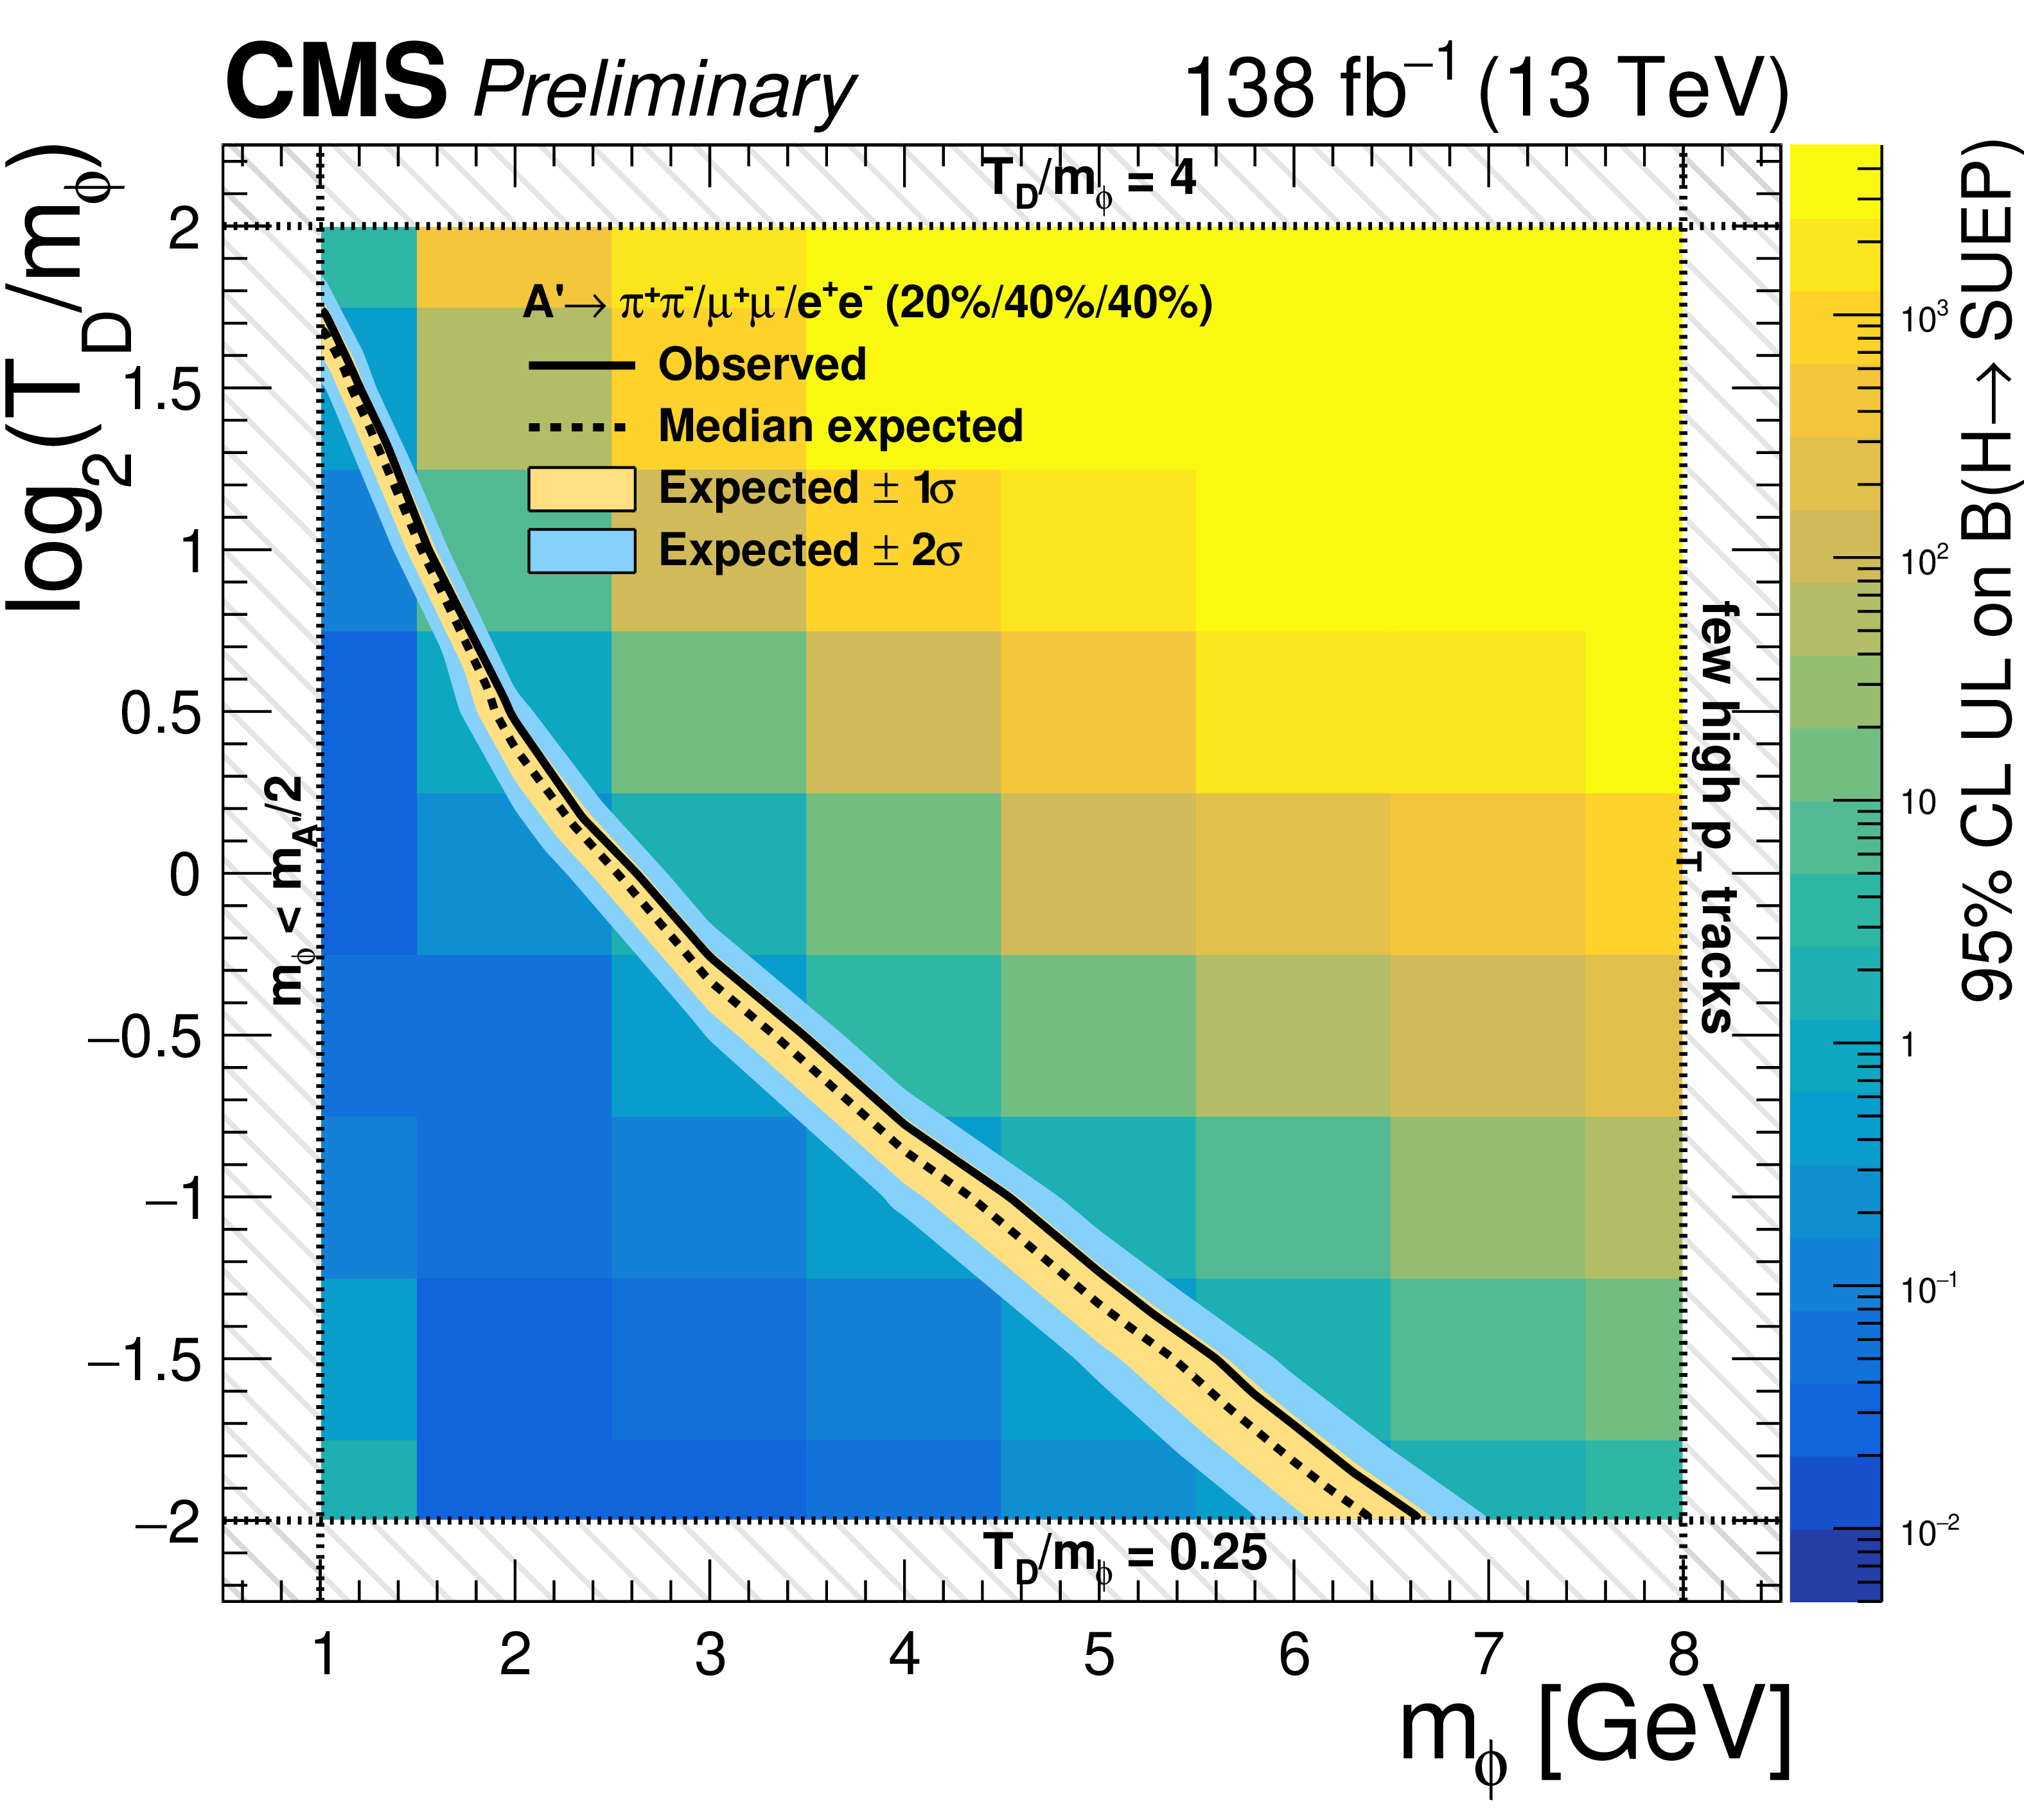
Upper: 95% CL upper limits on the product of the Higgs boson to SUEP branching fraction for several different signal models with dominantly leptonic A' decays and $ m_{\phi}= $ 2 or 4 GeV. The horizontal dotted line represents the predicted signal cross section for a Higgs boson mediator with 100% branching fraction to SUEP and SM Z boson decays to leptons. Lower: interpretation of the results for a Higgs boson mediator and fully hadronic SUEP decays. The background color map represents the observed upper limit for each signal model; the contour at which the observed (median expected) upper limit on the branching fraction equals unity is shown as a solid (dotted) black line. |
png pdf |
Figure 6-a:
Upper: 95% CL upper limits on the product of the Higgs boson to SUEP branching fraction for several different signal models with dominantly leptonic A' decays and $ m_{\phi}= $ 2 or 4 GeV. The horizontal dotted line represents the predicted signal cross section for a Higgs boson mediator with 100% branching fraction to SUEP and SM Z boson decays to leptons. Lower: interpretation of the results for a Higgs boson mediator and fully hadronic SUEP decays. The background color map represents the observed upper limit for each signal model; the contour at which the observed (median expected) upper limit on the branching fraction equals unity is shown as a solid (dotted) black line. |
png pdf |
Figure 6-b:
Upper: 95% CL upper limits on the product of the Higgs boson to SUEP branching fraction for several different signal models with dominantly leptonic A' decays and $ m_{\phi}= $ 2 or 4 GeV. The horizontal dotted line represents the predicted signal cross section for a Higgs boson mediator with 100% branching fraction to SUEP and SM Z boson decays to leptons. Lower: interpretation of the results for a Higgs boson mediator and fully hadronic SUEP decays. The background color map represents the observed upper limit for each signal model; the contour at which the observed (median expected) upper limit on the branching fraction equals unity is shown as a solid (dotted) black line. |
png pdf |
Figure 7:
Upper: 95% CL upper limits on the product of the Higgs boson to SUEP branching fraction for several different signal models with dominantly hadronic A' decays and $ m_{\phi}= $ 2 or 4 GeV. The horizontal dotted line represents the predicted signal cross section for a Higgs boson mediator with 100% branching fraction to SUEP and SM Z boson decays to leptons. Lower: interpretation of the results for a Higgs boson mediator and fully hadronic SUEP decays. The background color map represents the observed upper limit for each signal model; the contour at which the observed (median expected) upper limit on the branching fraction equals unity is shown as a solid (dotted) black line. |
png pdf |
Figure 7-a:
Upper: 95% CL upper limits on the product of the Higgs boson to SUEP branching fraction for several different signal models with dominantly hadronic A' decays and $ m_{\phi}= $ 2 or 4 GeV. The horizontal dotted line represents the predicted signal cross section for a Higgs boson mediator with 100% branching fraction to SUEP and SM Z boson decays to leptons. Lower: interpretation of the results for a Higgs boson mediator and fully hadronic SUEP decays. The background color map represents the observed upper limit for each signal model; the contour at which the observed (median expected) upper limit on the branching fraction equals unity is shown as a solid (dotted) black line. |
png pdf |
Figure 7-b:
Upper: 95% CL upper limits on the product of the Higgs boson to SUEP branching fraction for several different signal models with dominantly hadronic A' decays and $ m_{\phi}= $ 2 or 4 GeV. The horizontal dotted line represents the predicted signal cross section for a Higgs boson mediator with 100% branching fraction to SUEP and SM Z boson decays to leptons. Lower: interpretation of the results for a Higgs boson mediator and fully hadronic SUEP decays. The background color map represents the observed upper limit for each signal model; the contour at which the observed (median expected) upper limit on the branching fraction equals unity is shown as a solid (dotted) black line. |
png pdf |
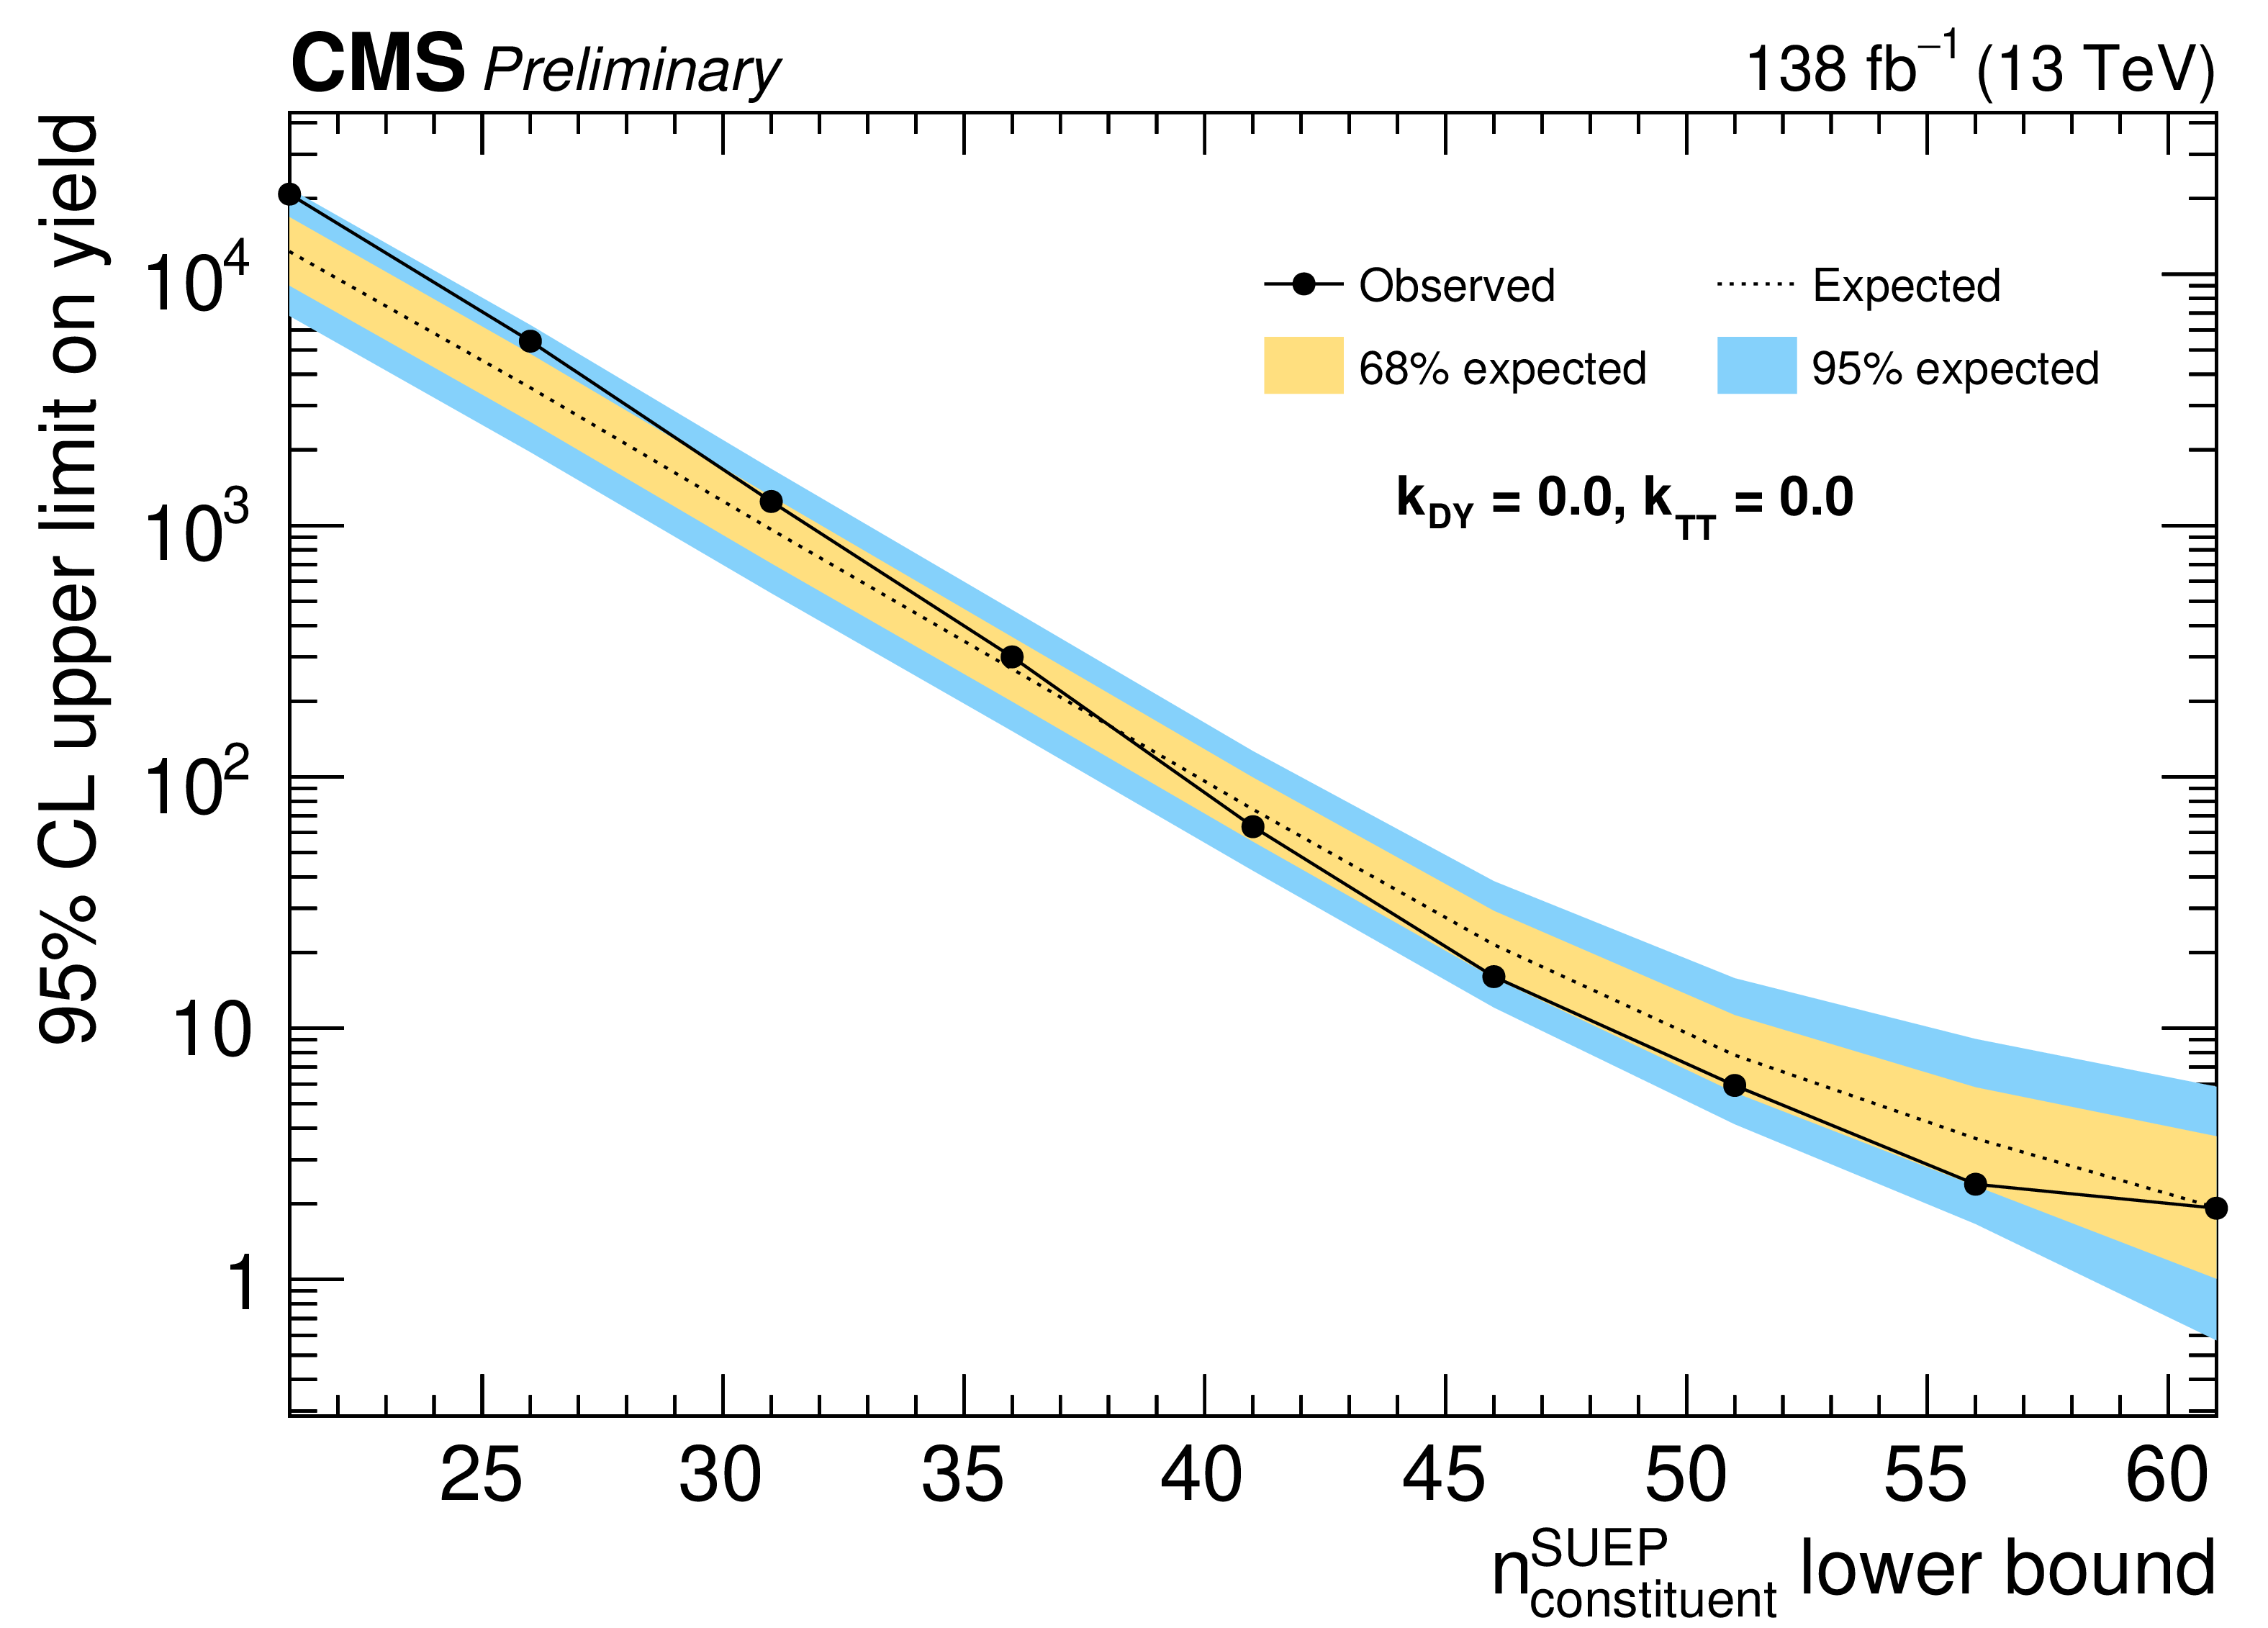
Figure 8:
95% CL upper limits on the signal yield from the model-agnostic fit, assuming no signal contamination in CRTT and CRDY, for different minimum $ n_{\text{constituent}}^{\text{SUEP}} $ values. |
| Tables | |
png pdf |
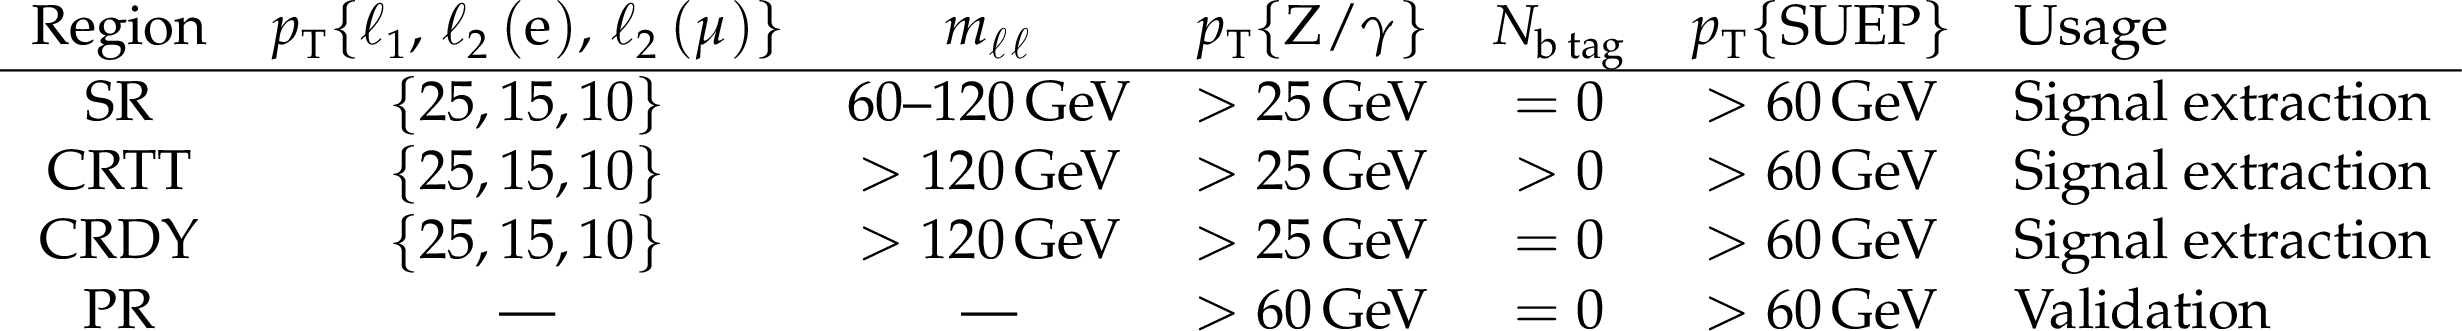
Table 1:
The requirements for the SR, the two CRs, and the PR, and their usage in this search. The symbol $ p_{\mathrm{T}}\{X\} $ denotes the transverse momentum of the reconstructed object $ X $; $ N_{\mathrm{b}\,\text{tag}} $ denotes the number of b tagged jets; $ \ell_1 $ and $ \ell_2 $ denote the leading and subleading lepton in each event; and $ m_{\ell\ell} $ denotes the invariant mass of the dilepton system. |
png pdf |
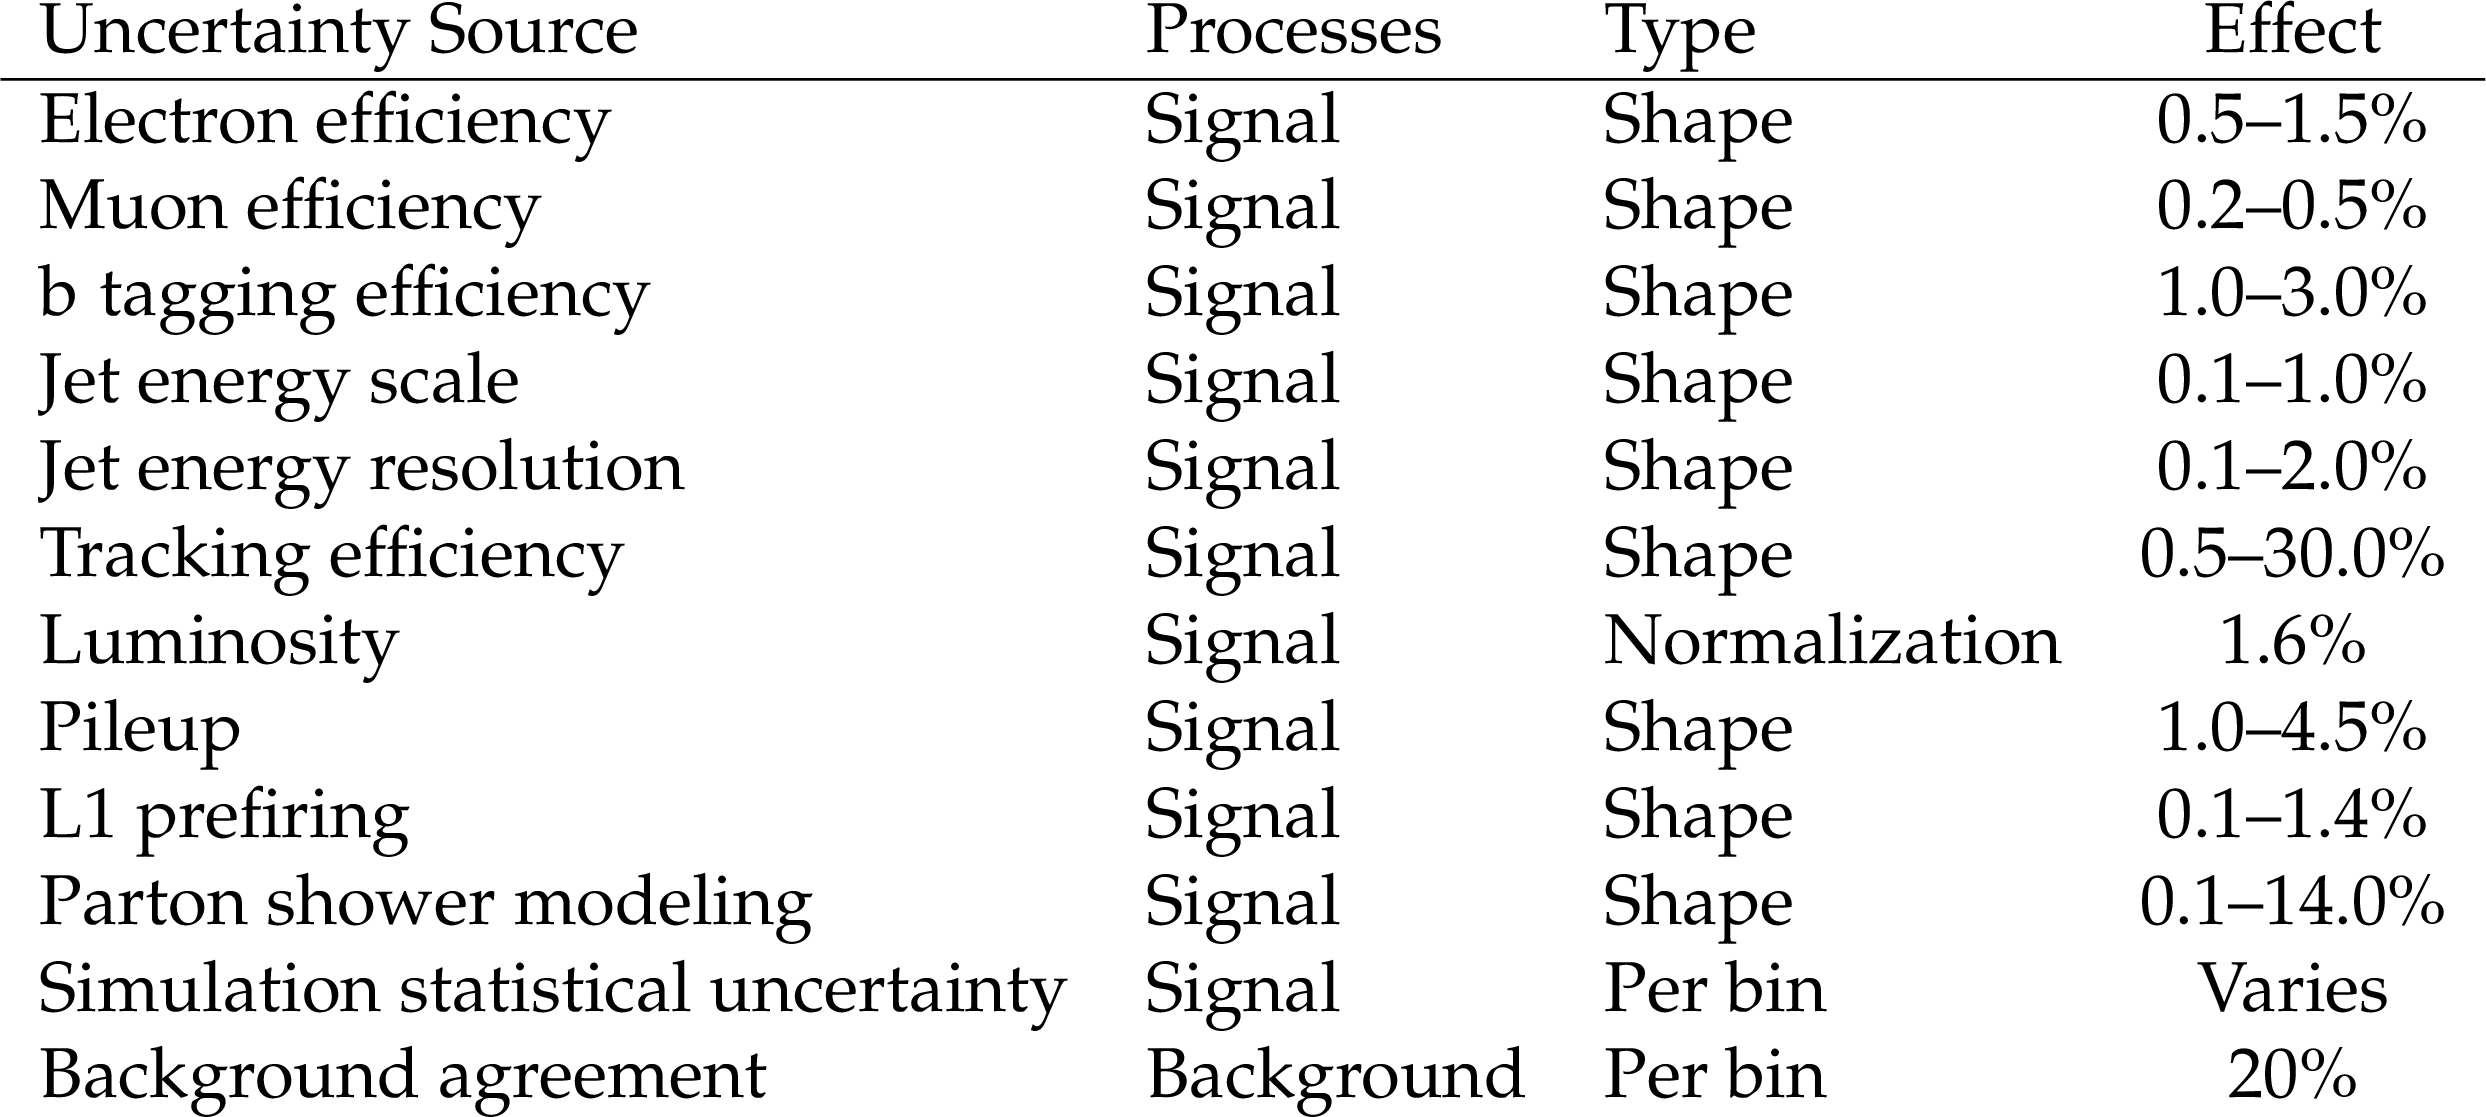
Table 2:
Summary of systematic uncertainties considered in this search, specifying for each: the process it effects; whether it is treated as a correlated uncertainty in the $ n_{\text{constituent}}^{\text{SUEP}} $ distribution, an uncorrelated uncertainty per $ n_{\text{constituent}}^{\text{SUEP}} $ bin, or a correlated uncertainty in the overall normalization; and its overall effect size. The overall effect is quantified as the minimum and maximum variation in the predicted yields of the associated process across all $ n_{\text{constituent}}^{\text{SUEP}} $ bins. The effect of the limited number of simulated signal events varies per model, depending strongly on the $ n_{\text{constituent}}^{\text{SUEP}} $ distribution. At the Higgs boson production cross section, the amount of signal events corresponds to an effective luminosity of 8000 fb$ ^{-1} $. |
| Summary |
| This note presents the first search for final states with a large-radius jet composed of low-momentum, isotropically distributed particles---a soft unclustered energy pattern or SUEP---and a Z boson. Events are selected at trigger level based on the presence of leptons arising from the leptonic decays of the Z boson. This strategy improves the sensitivity of the search to Higgs boson mediators by four (two) orders of magnitude in the signal cross section (branching fraction) compared to previous results [14]. No significant deviation from the standard model expectation is observed, and the most stringent limits to date are obtained for SUEP production in association with a vector boson. SUEP models with a Higgs boson mediator are excluded for low temperatures ($ T_{\text{D}} < $ 3 GeV) and low dark meson masses ($ m_{\phi} < $ 7 GeV). Additional model-agnostic limits on the signal yield are provided for the purpose of reinterpretation. |
| References | ||||
| 1 | M. J. Strassler and K. M. Zurek | Echoes of a hidden valley at hadron colliders | PLB 651 (2007) 374 | hep-ph/0604261 |
| 2 | P. Schwaller, D. Stolarski, and A. Weiler | Emerging jets | JHEP 05 (2015) 059 | 1502.05409 |
| 3 | T. Cohen, M. Lisanti, and H. K. Lou | Semivisible jets: Dark matter undercover at the LHC | PRL 115 (2015) 171804 | 1503.00009 |
| 4 | N. Daci et al. | Simplified SIMPs and the LHC | JHEP 11 (2015) 108 | 1503.05505 |
| 5 | CMS Collaboration | Search for new particles decaying to a jet and an emerging jet | JHEP 02 (2019) 179 | CMS-EXO-18-001 1810.10069 |
| 6 | CMS Collaboration | Search for resonant production of strongly coupled dark matter in proton-proton collisions at 13 TeV | JHEP 06 (2022) 156 | CMS-EXO-19-020 2112.11125 |
| 7 | ATLAS Collaboration | Search for non-resonant production of semi-visible jets using Run 2 data in ATLAS | PLB 848 (2024) 138324 | 2305.18037 |
| 8 | CMS Collaboration | Search for dark QCD with emerging jets in proton-proton collisions at $ \sqrt{s} $ = 13 TeV | JHEP 07 (2024) 142 | CMS-EXO-22-015 2403.01556 |
| 9 | CMS Collaboration | Dark sector searches with the CMS experiment | Accepted by Phys. Rept., 2024 | CMS-EXO-23-005 2405.13778 |
| 10 | J. Polchinski and M. J. Strassler | Deep inelastic scattering and gauge / string duality | JHEP 05 (2003) 012 | hep-th/0209211 |
| 11 | D. M. Hofman and J. Maldacena | Conformal collider physics: Energy and charge correlations | JHEP 05 (2008) 012 | 0803.1467 |
| 12 | M. J. Strassler | Why unparticle models with mass gaps are examples of hidden valleys | 0801.0629 | |
| 13 | S. Knapen, S. Pagan Griso, M. Papucci, and D. J. Robinson | Triggering soft bombs at the LHC | JHEP 08 (2017) 076 | 1612.00850 |
| 14 | CMS Collaboration | Search for soft unclustered energy patterns in proton-proton collisions at 13 TeV | PRL 133 (2024) 191902 | CMS-EXO-23-002 2403.05311 |
| 15 | M. Buschmann, J. Kopp, J. Liu, and P. A. N. Machado | Lepton jets from radiating dark matter | JHEP 07 (2015) 045 | 1505.07459 |
| 16 | M. Graham, C. Hearty, and M. Williams | Searches for dark photons at accelerators | Ann. Rev. Nucl. Part. Sci. 71 (2021) 37 | 2104.10280 |
| 17 | T. Sjöstrand et al. | An introduction to PYTHIA 8.2 | Comput. Phys. Commun. 191 (2015) 159 | 1410.3012 |
| 18 | J. Alwall et al. | The automated computation of tree-level and next-to-leading order differential cross sections, and their matching to parton shower simulations | JHEP 07 (2014) 079 | 1405.0301 |
| 19 | P. Nason | A new method for combining NLO QCD with shower Monte Carlo algorithms | JHEP 11 (2004) 040 | hep-ph/0409146 |
| 20 | S. Frixione, P. Nason, and C. Oleari | Matching NLO QCD computations with parton shower simulations: the POWHEG method | JHEP 11 (2007) 070 | 0709.2092 |
| 21 | S. Alioli, P. Nason, C. Oleari, and E. Re | A general framework for implementing NLO calculations in shower monte carlo programs: the POWHEG BOX | JHEP 06 (2010) 043 | 1002.2581 |
| 22 | S. Alioli, S.-O. Moch, and P. Uwer | Hadronic top-quark pair-production with one jet and parton showering | JHEP 01 (2012) 137 | 1110.5251 |
| 23 | P. Nason and G. Zanderighi | $ \mathrm{W}^+ \mathrm{W}^- $, WZ and ZZ production in the POWHEG -\textscbox-v2 | EPJC 74 (2014) 2702 | 1311.1365 |
| 24 | NNPDF Collaboration | Parton distributions from high-precision collider data | EPJC 77 (2017) 663 | 1706.00428 |
| 25 | CMS Collaboration | Extraction and validation of a new set of CMS PYTHIA8 tunes from underlying-event measurements | EPJC 80 (2020) 4 | CMS-GEN-17-001 1903.12179 |
| 26 | GEANT4 Collaboration | GEANT 4---a simulation toolkit | NIM A 506 (2003) 250 | |
| 27 | P. Ilten, Y. Soreq, M. Williams, and W. Xue | Serendipity in dark photon searches | JHEP 06 (2018) 004 | 1801.04847 |
| 28 | J. Barron et al. | Unsupervised hadronic SUEP at the LHC | JHEP 12 (2021) 129 | 2107.12379 |
| 29 | CMS Collaboration | The CMS experiment at the CERN LHC | JINST 3 (2008) S08004 | |
| 30 | CMS Collaboration | Performance of the CMS Level-1 trigger in proton-proton collisions at $ \sqrt{s} = $ 13 TeV | JINST 15 (2020) P10017 | CMS-TRG-17-001 2006.10165 |
| 31 | CMS Collaboration | The CMS trigger system | JINST 12 (2017) P01020 | CMS-TRG-12-001 1609.02366 |
| 32 | CMS Collaboration | Performance of the CMS high-level trigger during LHC run 2 | JINST 19 (2024) P11021 | CMS-TRG-19-001 2410.17038 |
| 33 | CMS Collaboration | Electron and photon reconstruction and identification with the CMS experiment at the CERN LHC | JINST 16 (2021) P05014 | CMS-EGM-17-001 2012.06888 |
| 34 | CMS Collaboration | Performance of the CMS muon detector and muon reconstruction with proton-proton collisions at $ \sqrt{s}= $ 13 TeV | JINST 13 (2018) P06015 | CMS-MUO-16-001 1804.04528 |
| 35 | CMS Collaboration | Description and performance of track and primary-vertex reconstruction with the CMS tracker | JINST 9 (2014) P10009 | CMS-TRK-11-001 1405.6569 |
| 36 | CMS Collaboration | Particle-flow reconstruction and global event description with the CMS detector | JINST 12 (2017) P10003 | CMS-PRF-14-001 1706.04965 |
| 37 | CMS Collaboration | Performance of reconstruction and identification of $ \tau $ leptons decaying to hadrons and $ \nu_\tau $ in pp collisions at $ \sqrt{s}= $ 13 TeV | JINST 13 (2018) P10005 | CMS-TAU-16-003 1809.02816 |
| 38 | CMS Collaboration | Jet energy scale and resolution in the CMS experiment in pp collisions at 8 TeV | JINST 12 (2017) P02014 | CMS-JME-13-004 1607.03663 |
| 39 | CMS Collaboration | Performance of missing transverse momentum reconstruction in proton-proton collisions at $ \sqrt{s} = $ 13 TeV using the CMS detector | JINST 14 (2019) P07004 | CMS-JME-17-001 1903.06078 |
| 40 | CMS Collaboration | Technical proposal for the Phase-II upgrade of the Compact Muon Solenoid | CMS Technical Proposal CERN-LHCC-2015-010, CMS-TDR-15-02, 2015 CDS |
|
| 41 | CMS Collaboration | Performance of electron reconstruction and selection with the CMS detector in proton-proton collisions at $ \sqrt{s} = $ 8 TeV | JINST 10 (2015) P06005 | CMS-EGM-13-001 1502.02701 |
| 42 | CMS Collaboration | Electron and photon reconstruction and identification with the CMS experiment at the CERN LHC | JINST 16 (2021) P05014 | CMS-EGM-17-001 2012.06888 |
| 43 | CMS Collaboration | Performance of the CMS muon detector and muon reconstruction with proton-proton collisions at $ \sqrt{s} = $ 13 TeV | JINST 13 (2018) P06015 | CMS-MUO-16-001 1804.04528 |
| 44 | M. Cacciari, G. P. Salam, and G. Soyez | The anti-$ k_{\mathrm{T}} $ jet clustering algorithm | JHEP 04 (2008) 063 | 0802.1189 |
| 45 | M. Cacciari, G. P. Salam, and G. Soyez | FastJet user manual | EPJC 72 (2012) 1896 | 1111.6097 |
| 46 | CMS Collaboration | Jet algorithms performance in 13 TeV data | CMS Physics Analysis Summary, 2017 CMS-PAS-JME-16-003 |
CMS-PAS-JME-16-003 |
| 47 | CMS Collaboration | Performance of the DeepJet b tagging algorithm using 41.9/fb of data from proton-proton collisions at 13 TeV with Phase 1 CMS detector | CMS Detector Performance Summary CMS-DP-2018-058, 2018 CDS |
|
| 48 | E. Bols et al. | Jet flavour classification using DeepJet | JINST 15 (2020) P12012 | 2008.10519 |
| 49 | D. Bertolini, P. Harris, M. Low, and N. Tran | Pileup per particle identification | JHEP 10 (2014) 059 | 1407.6013 |
| 50 | CMS Collaboration | The CMS trigger system | JINST 12 (2017) P01020 | CMS-TRG-12-001 1609.02366 |
| 51 | S. Choi and H. Oh | Improved extrapolation methods of data-driven background estimations in high energy physics | EPJC 81 (2021) 643 | 1906.10831 |
| 52 | CMS Collaboration | Tracking performances for charged pions with Run2 Legacy data | CMS Detector Performance Note CMS-DP-2022-012, 2022 CDS |
|
| 53 | CMS Collaboration | Measurement of the inelastic proton-proton cross section at $ \sqrt{s}= $ 13 TeV | JHEP 07 (2018) 161 | CMS-FSQ-15-005 1802.02613 |
| 54 | CMS Collaboration | Precision luminosity measurement in proton-proton collisions at $ \sqrt{s} = $ 13 TeV in 2015 and 2016 at CMS | EPJC 81 (2021) 800 | CMS-LUM-17-003 2104.01927 |
| 55 | CMS Collaboration | CMS luminosity measurement for the 2017 data-taking period at $ \sqrt{s} = $ 13 TeV | CMS Physics Analysis Summary CMS-PAS-LUM-17-004 |
CMS-PAS-LUM-17-004 |
| 56 | CMS Collaboration | CMS luminosity measurement for the 2018 data-taking period at $ \sqrt{s} = $ 13 TeV | CMS Physics Analysis Summary CMS-PAS-LUM-18-002 |
CMS-PAS-LUM-18-002 |
| 57 | T. Junk | Confidence level computation for combining searches with small statistics | Nucl. Instrum. Methods Phys. Res, 1999 Sect. A 434 (1999) 435 |
hep-ex/9902006 |
| 58 | A. L. Read | Presentation of search results: The $ \text{CL}_\text{s} $ technique | JPG 28 (2002) 2693 | |
|
|
Compact Muon Solenoid LHC, CERN |
|

|

|

|

|

|