

Compact Muon Solenoid
LHC, CERN
| CMS-PAS-BPH-23-003 | ||
| Measurement of differential branching fraction and angular observables of the $ \mathrm{B}_{s}^{0}\to \phi\mu^{+}\mu^{-} $ decay in proton-proton collisions at $ \sqrt{s}= $ 13 TeV | ||
| CMS Collaboration | ||
| 2026-03-24 | ||
| Abstract: The differential branching fraction of the decay $ \mathrm{B_{s}^{0}}\to\phi\mu^{+}\mu^{-} $ is measured in bins of the squared dimuon invariant mass ($ q^{2} $) using proton-proton collision data collected with the CMS detector at $ \sqrt{s}= $ 13 TeV at the LHC, corresponding to an integrated luminosity of 138 $ \mathrm{fb}^{-1} $. The charge-parity asymmetry and the fraction of longitudinal polarization are also determined as a function of $ q^{2} $ through an angular analysis. Both the branching fraction and angular observables are compared with various predictions based on the standard model. While the angular observables are found to be consistent with these predictions, the branching fraction measurement exhibits significant deviations with respect to theoretical calculations. | ||
| Links: CDS record (PDF) ; CADI line (restricted) ; | ||
| Figures | |
png pdf |
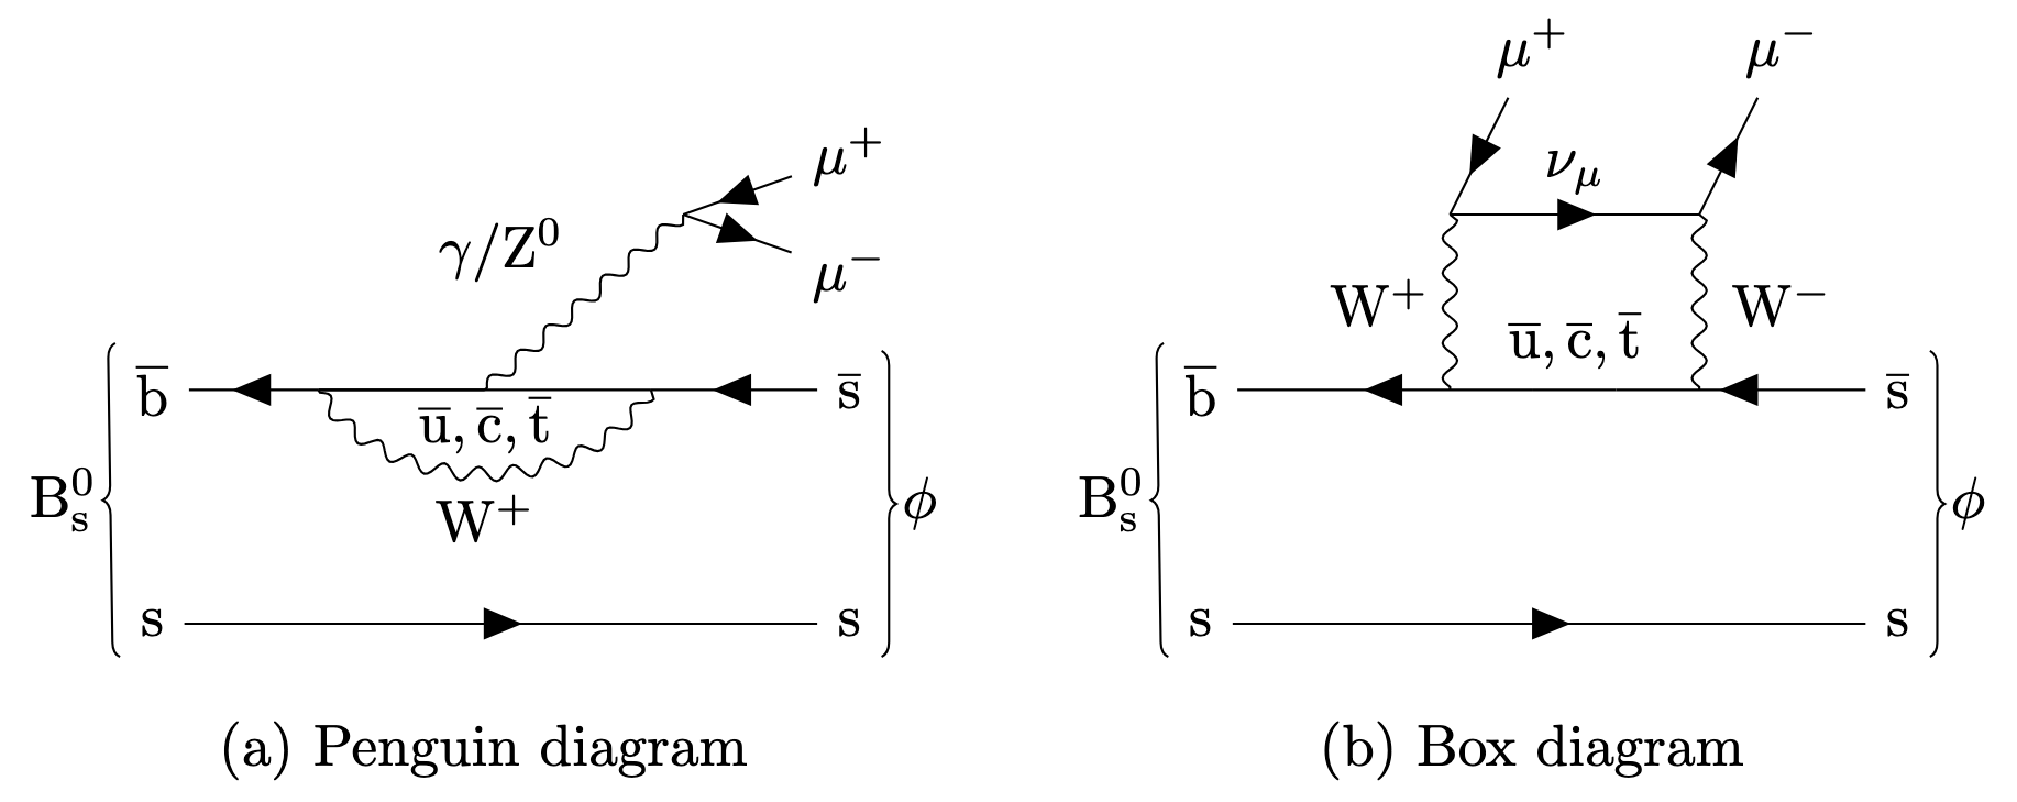
Figure 1:
SM Feynman diagrams for the $ \mathrm{B}_{s}^{0}\to \phi\mu^{+}\mu^{-} $ decay |
png pdf |
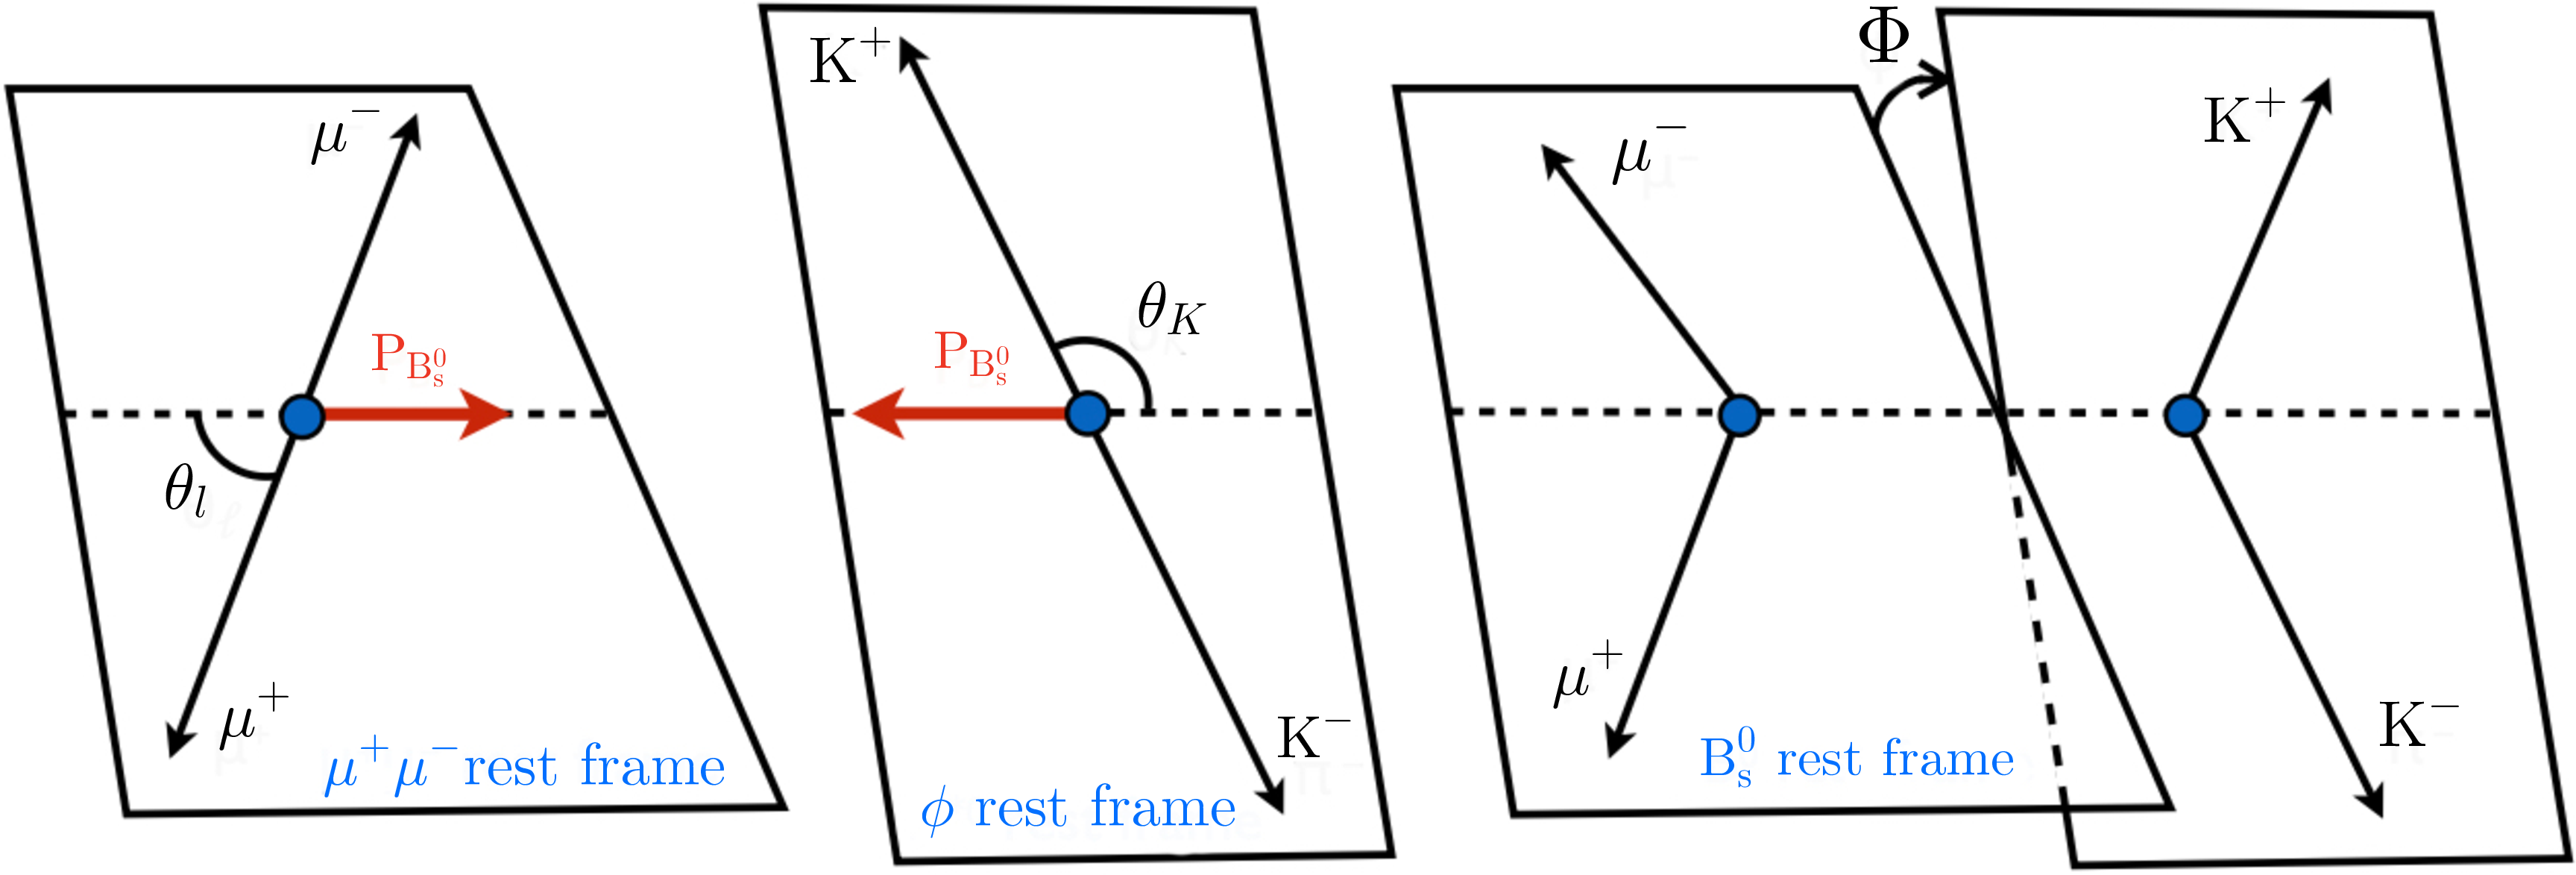
Figure 2:
Sketch showing the definition of the angles $ \theta_l $ (left), $ \theta_K $ (centre), $ \Phi $ (right). |
png pdf |
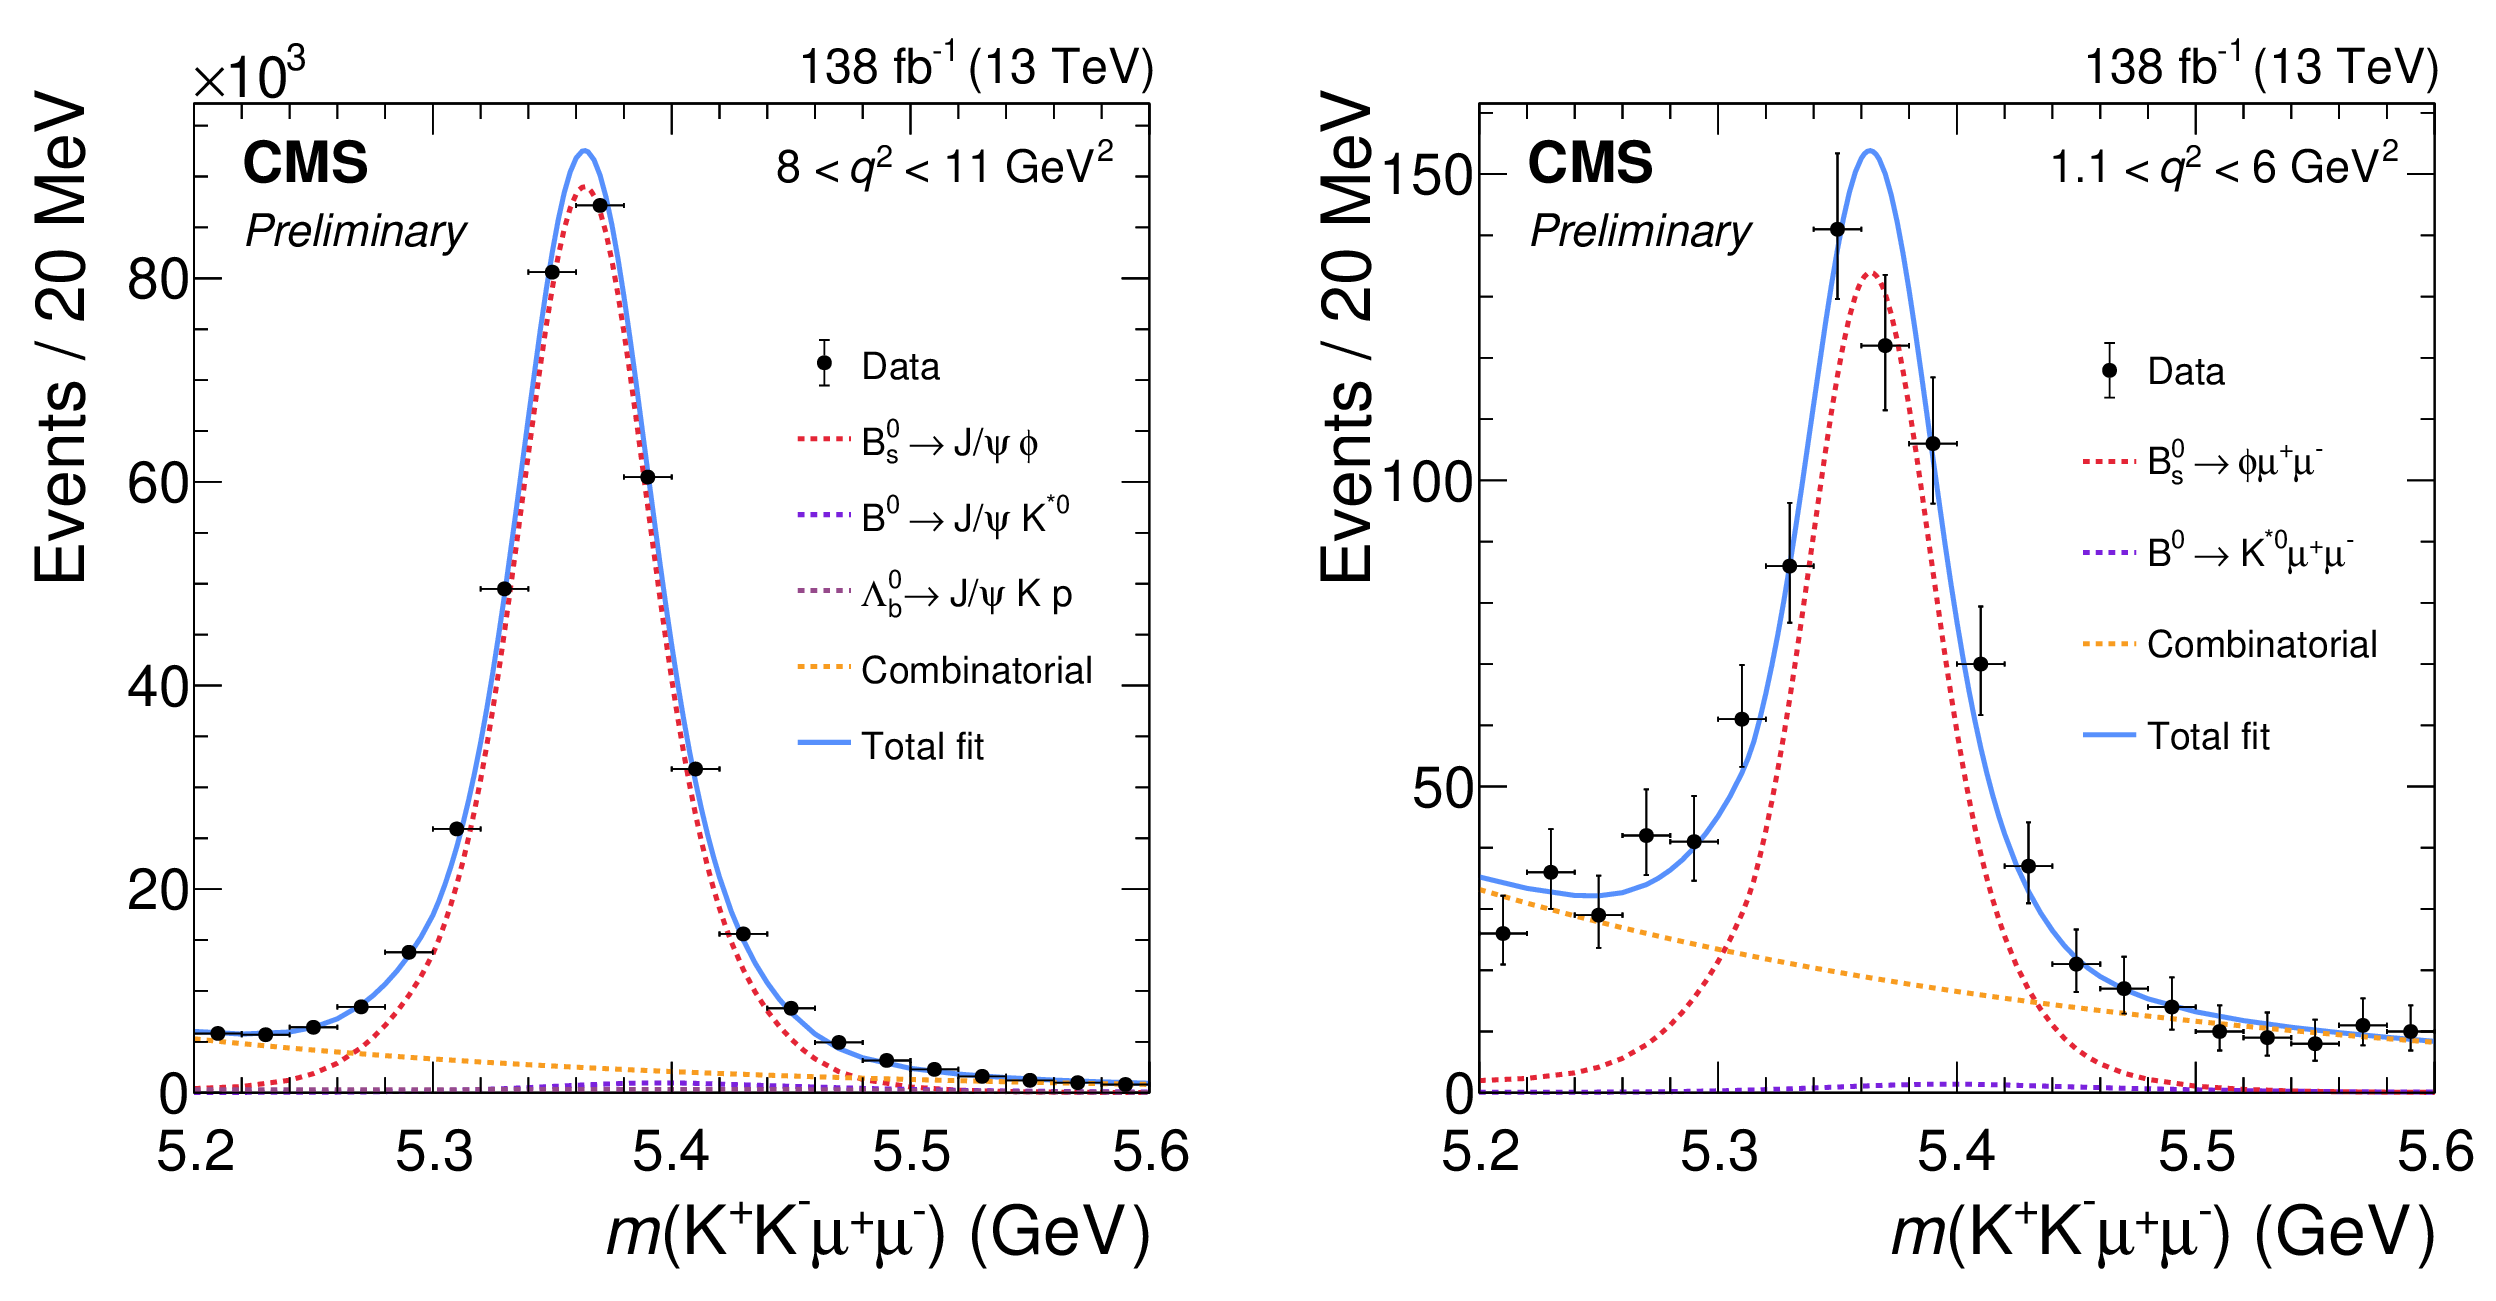
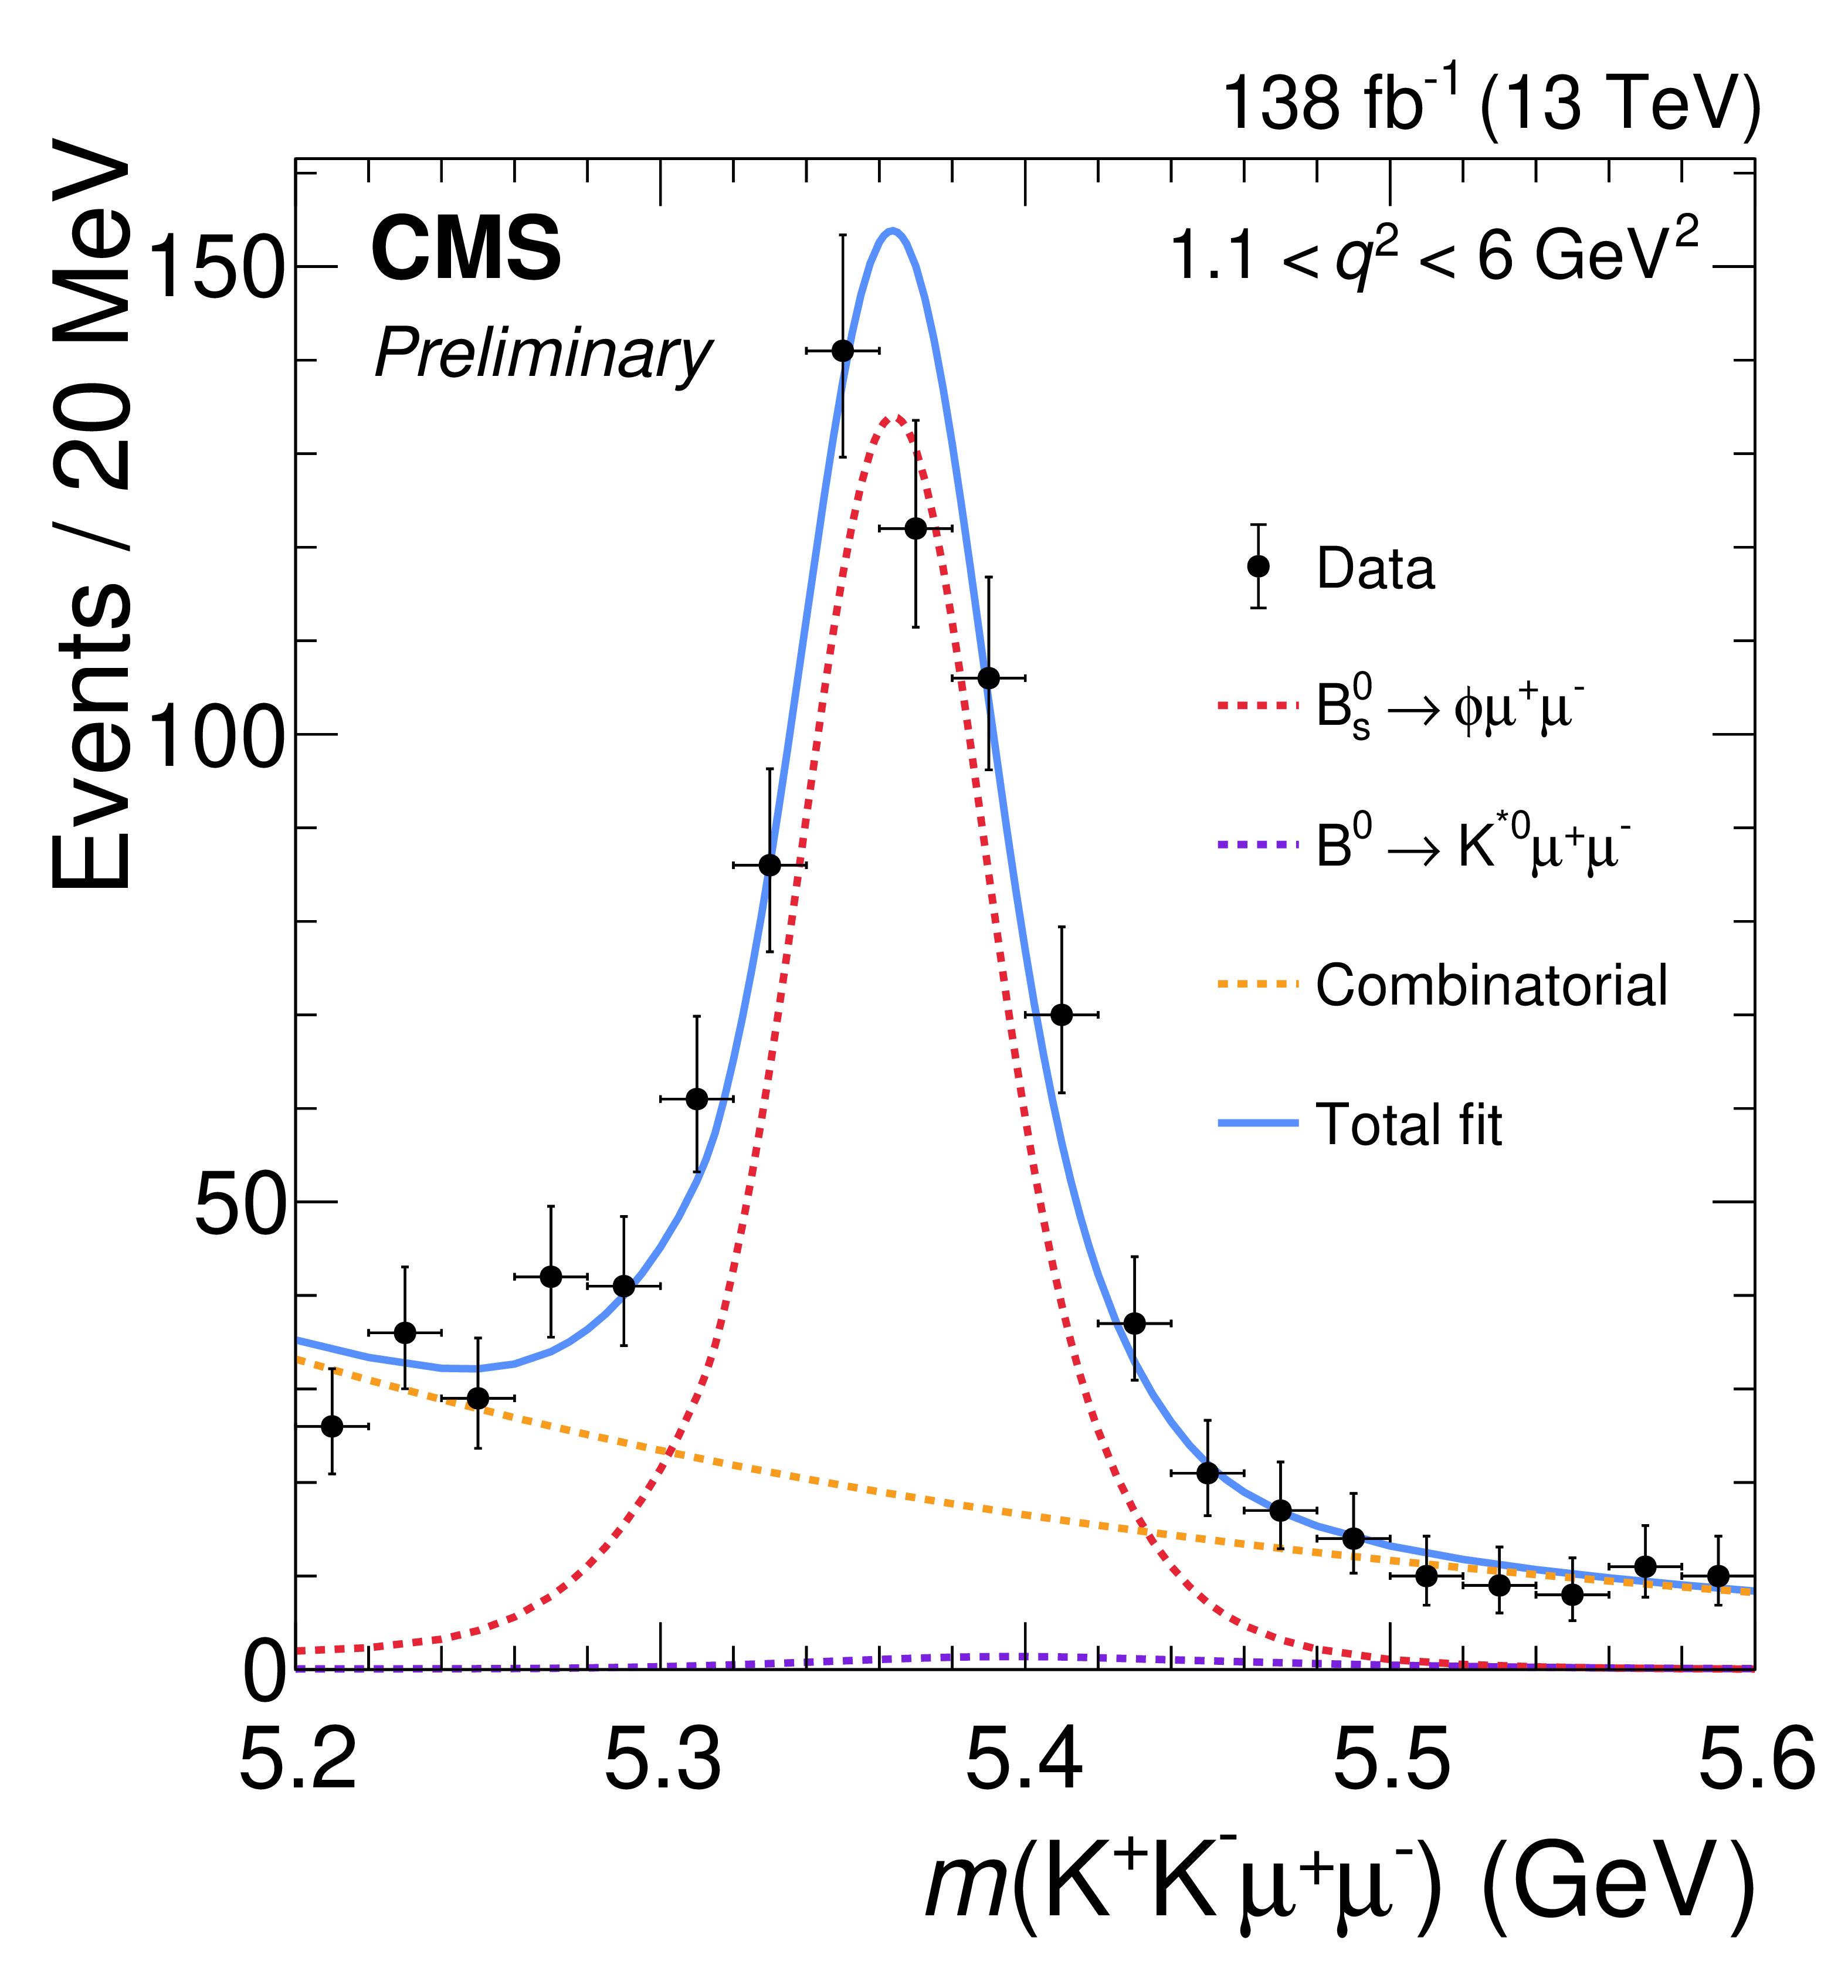
Figure 3:
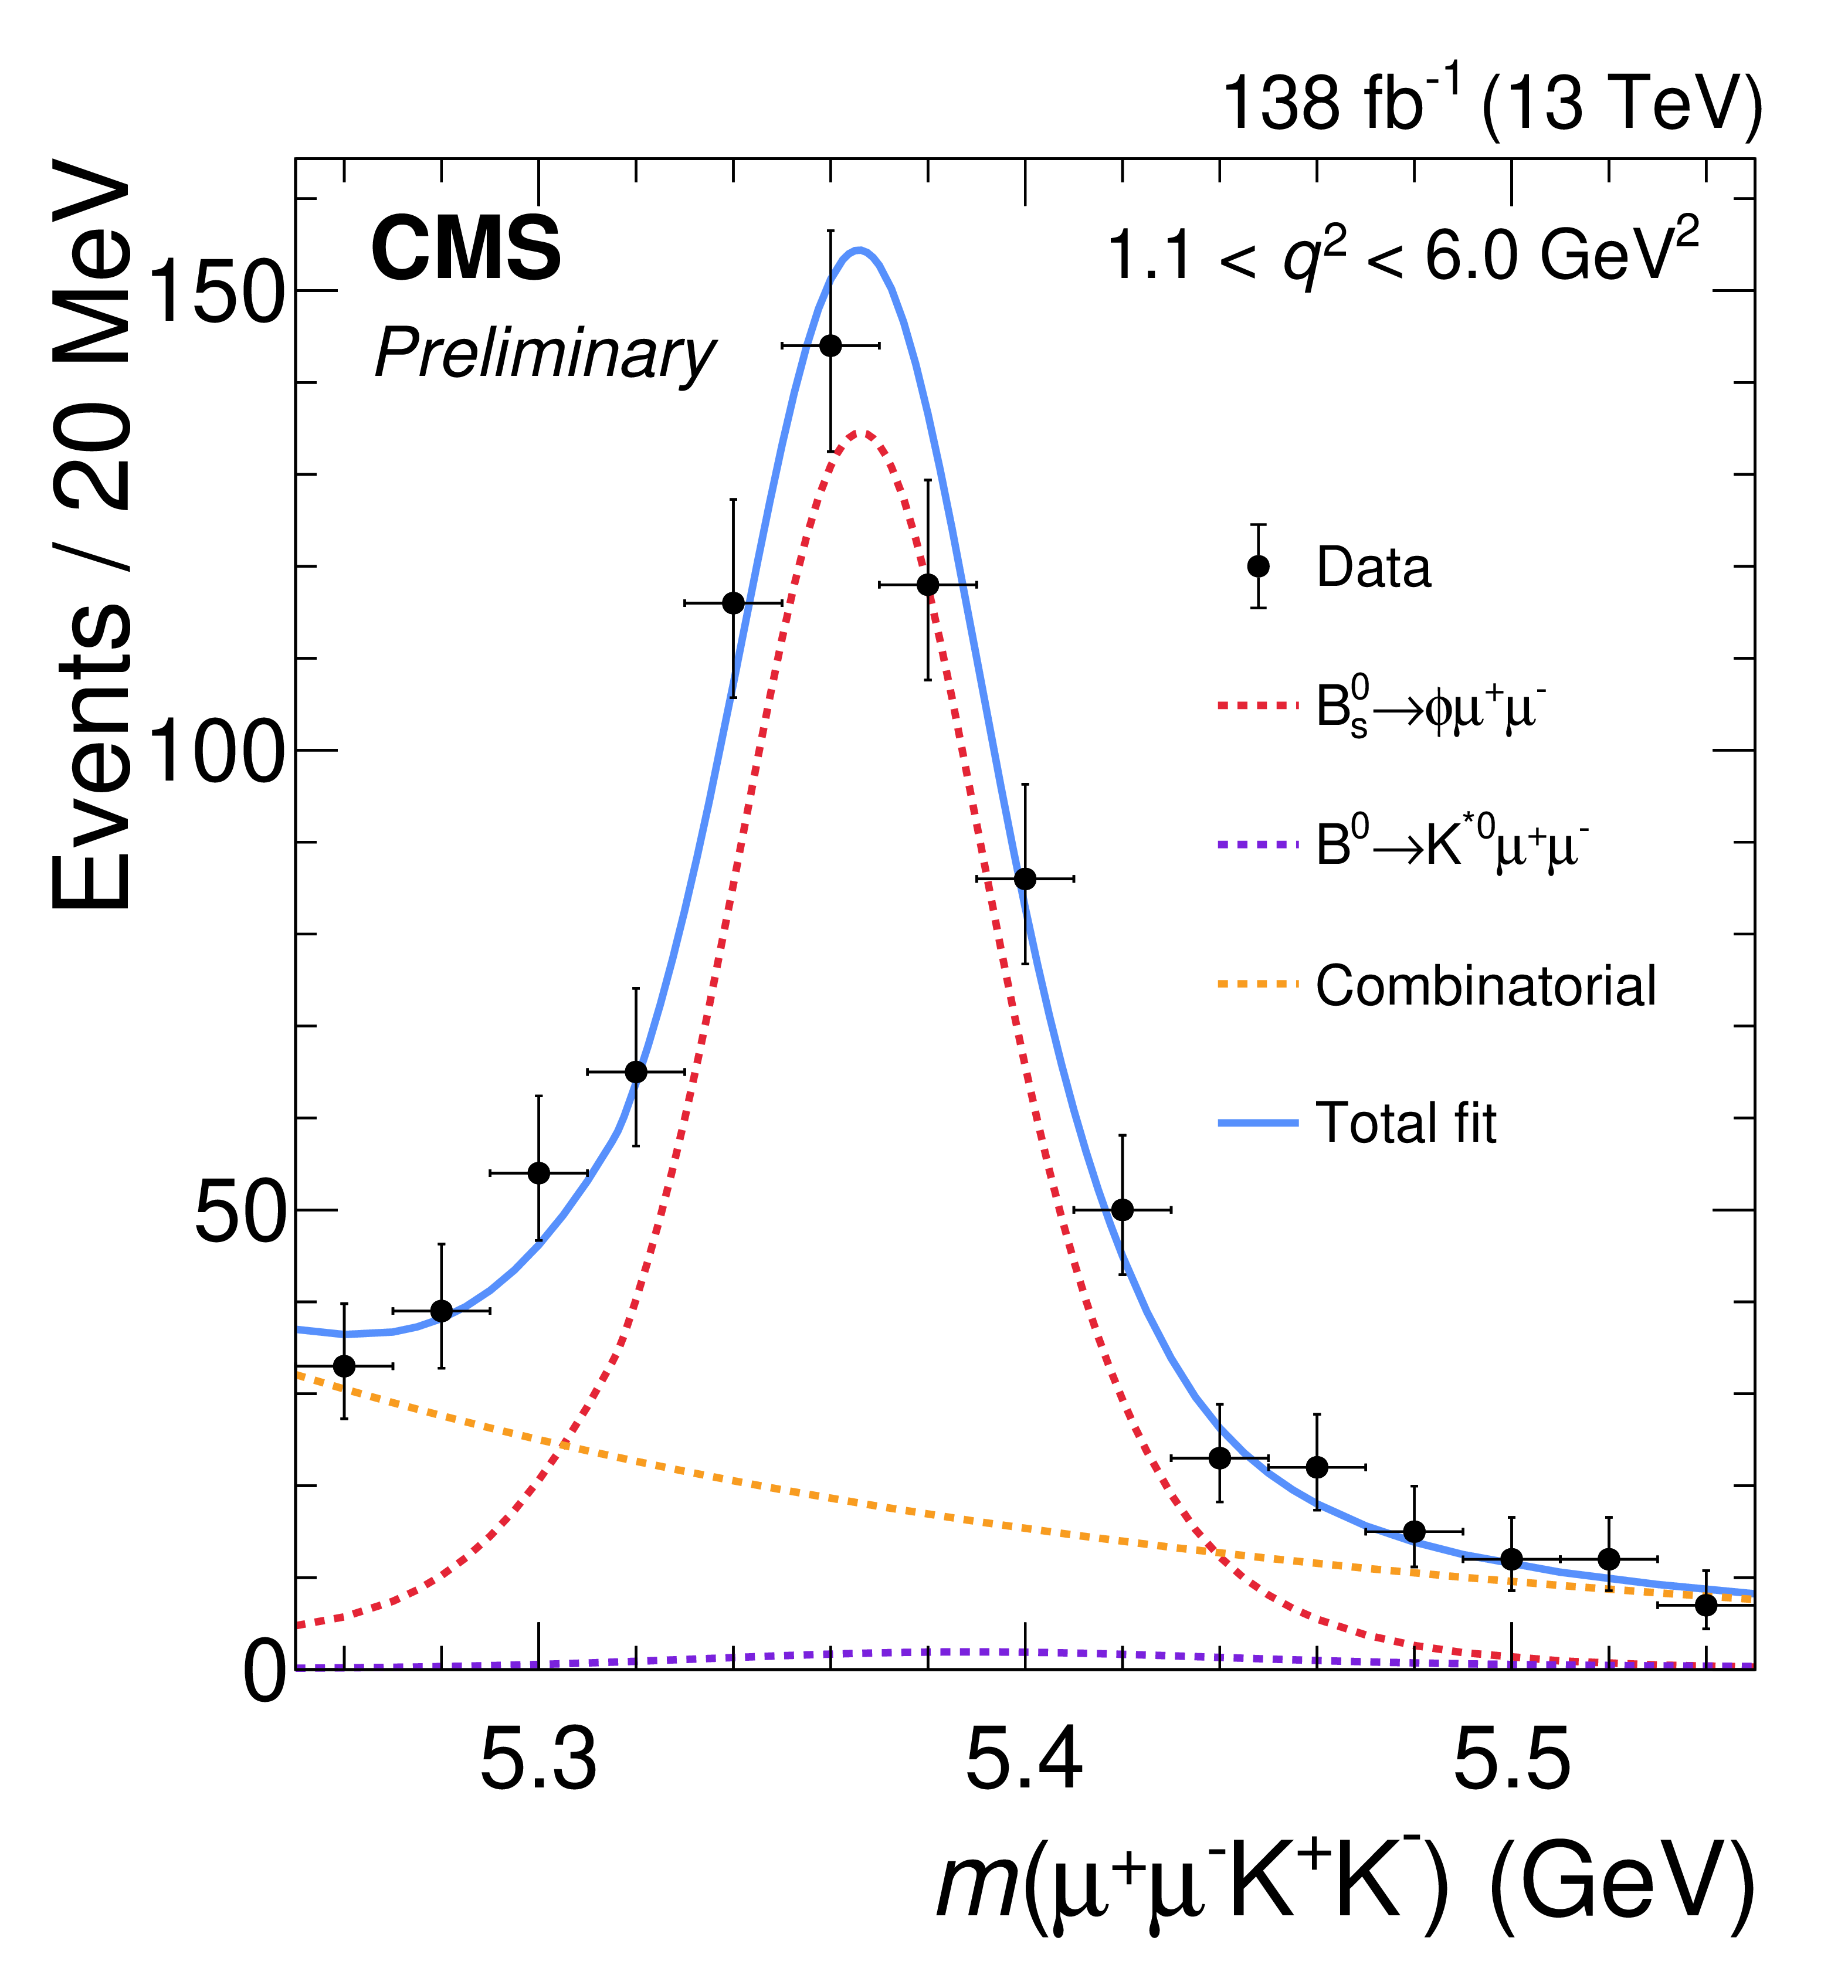
$ K^{+}K^{-}\mu^{+}\mu^{-} $ invariant mass distribution in the 8--11 $ \text{GeV}^2 $ (left) and 1.1--6 $ \text{GeV}^2 $ (right) $ q^{2} $ intervals. The results of the total fitted distributions (blue solid line) and their components are overlaid. |
png pdf |
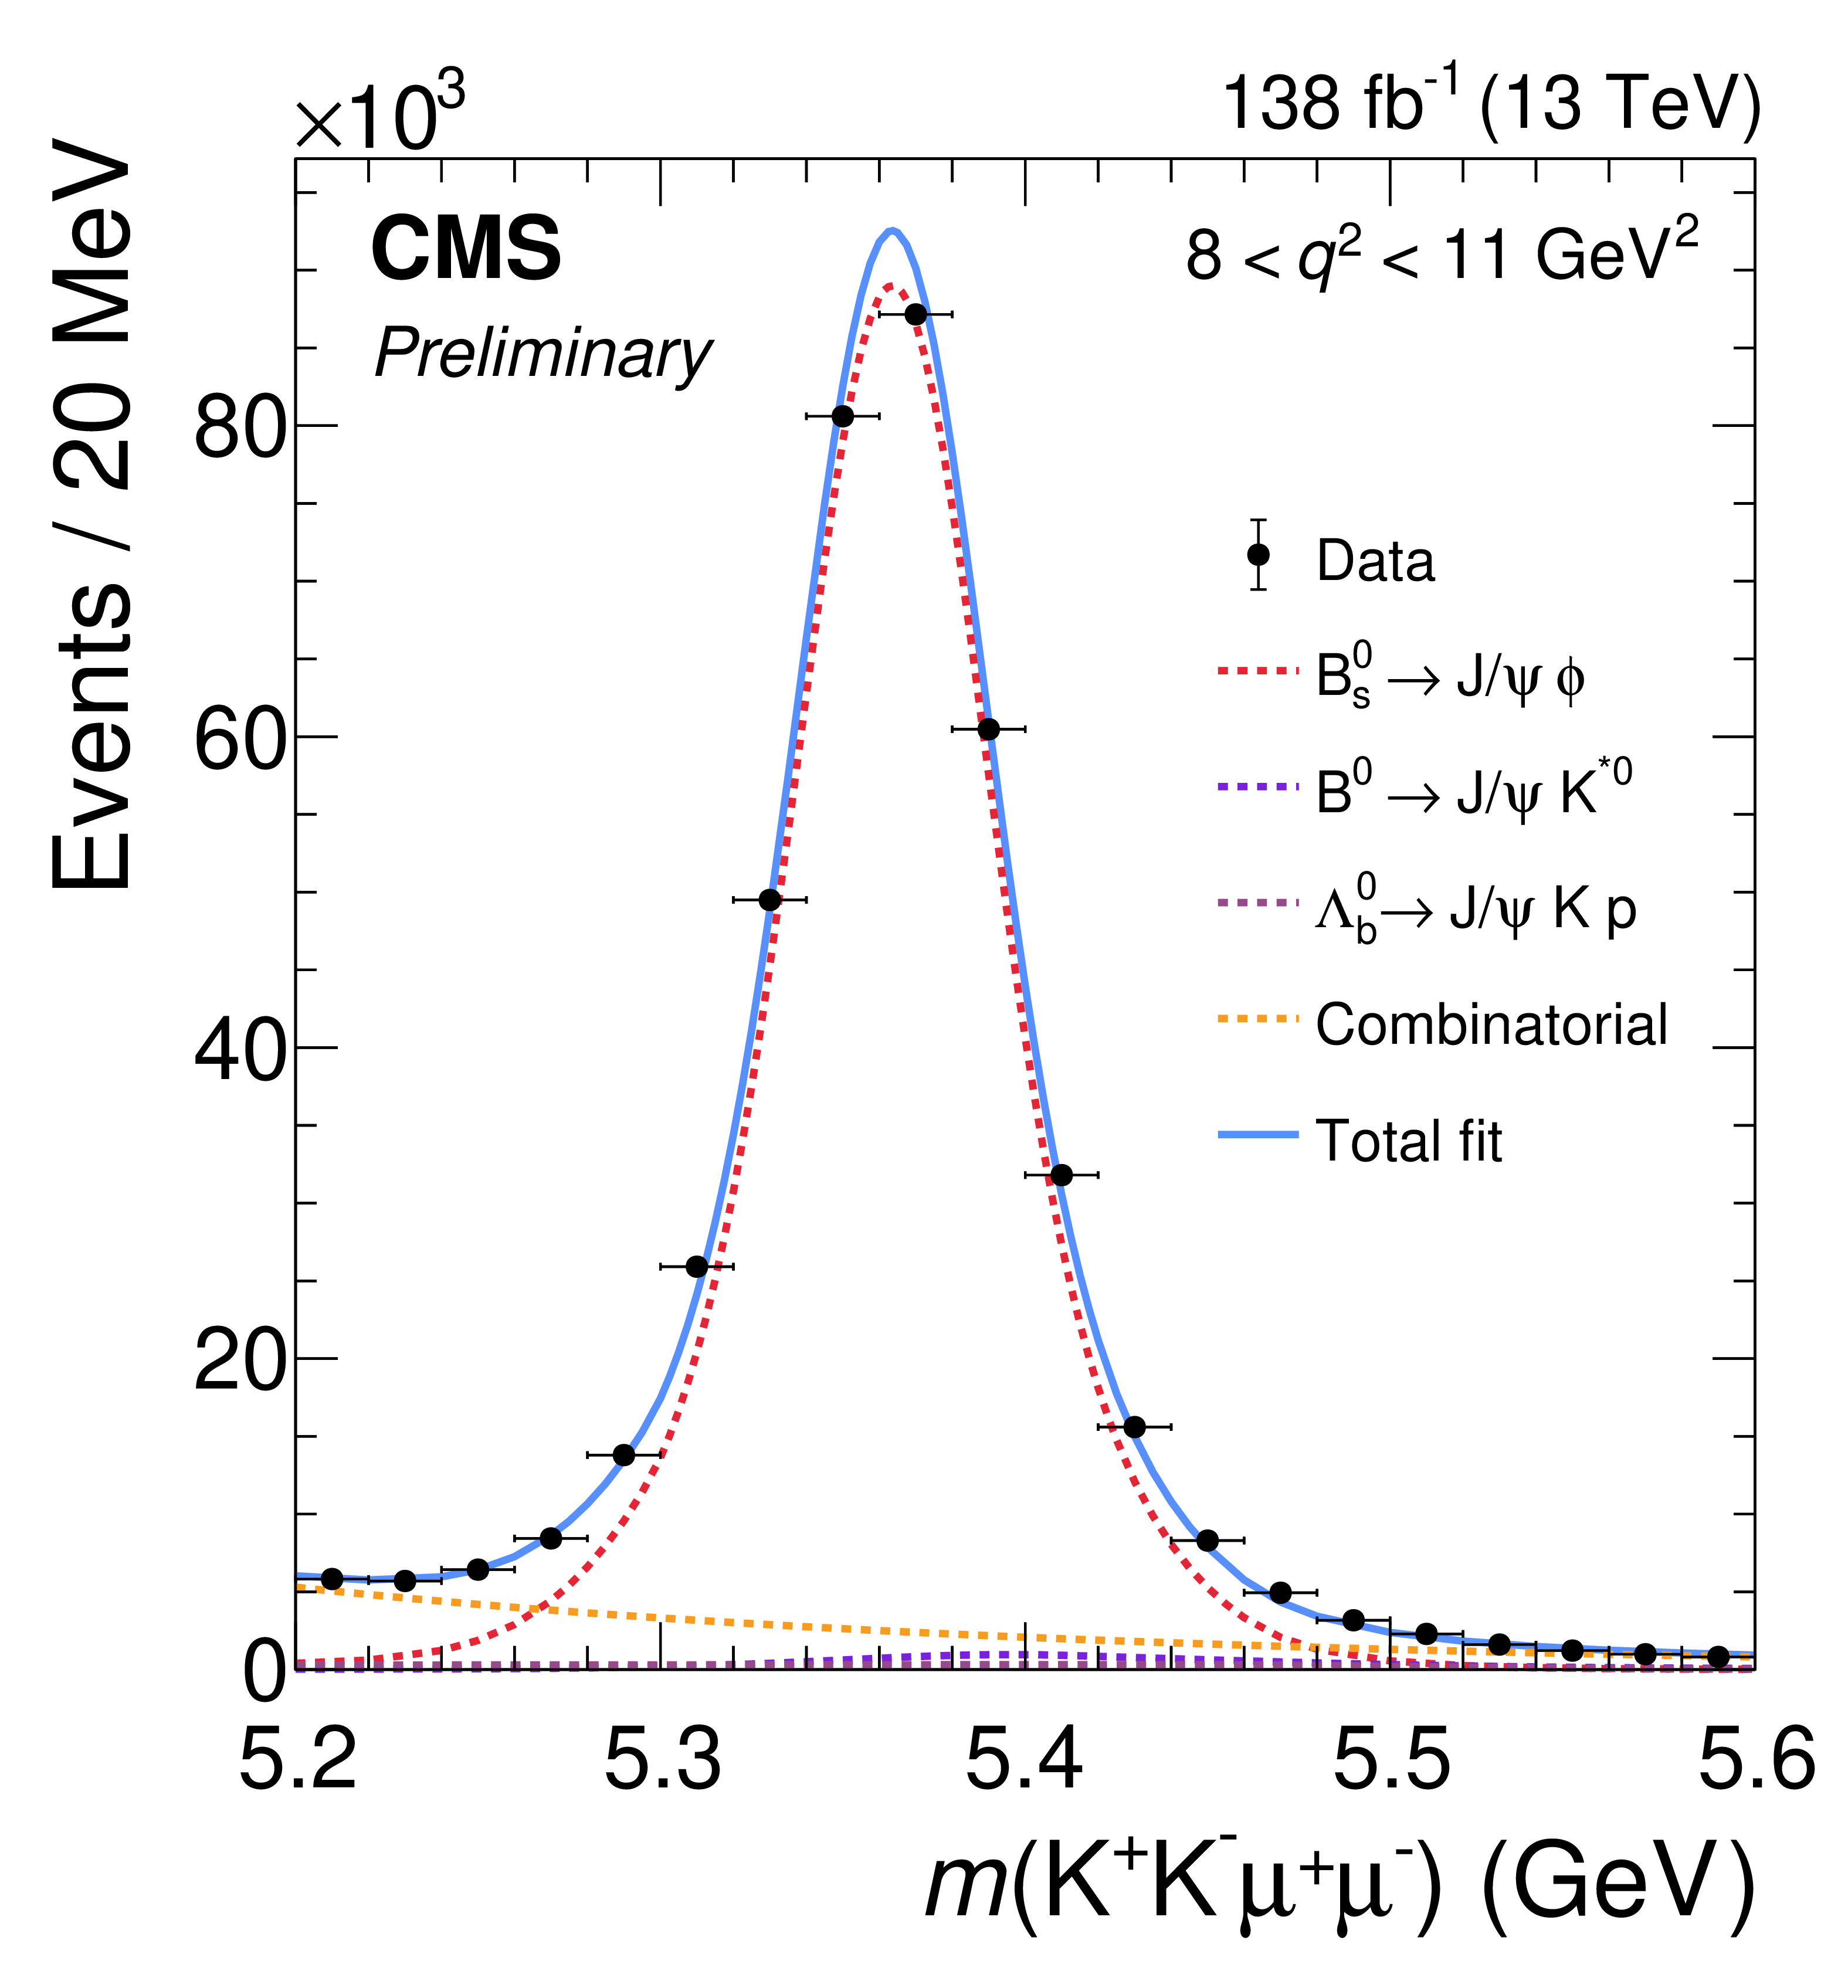
Figure 3-a:
$ K^{+}K^{-}\mu^{+}\mu^{-} $ invariant mass distribution in the 8--11 $ \text{GeV}^2 $ (left) and 1.1--6 $ \text{GeV}^2 $ (right) $ q^{2} $ intervals. The results of the total fitted distributions (blue solid line) and their components are overlaid. |

png pdf |
Figure 3-b:
$ K^{+}K^{-}\mu^{+}\mu^{-} $ invariant mass distribution in the 8--11 $ \text{GeV}^2 $ (left) and 1.1--6 $ \text{GeV}^2 $ (right) $ q^{2} $ intervals. The results of the total fitted distributions (blue solid line) and their components are overlaid. |
png pdf |
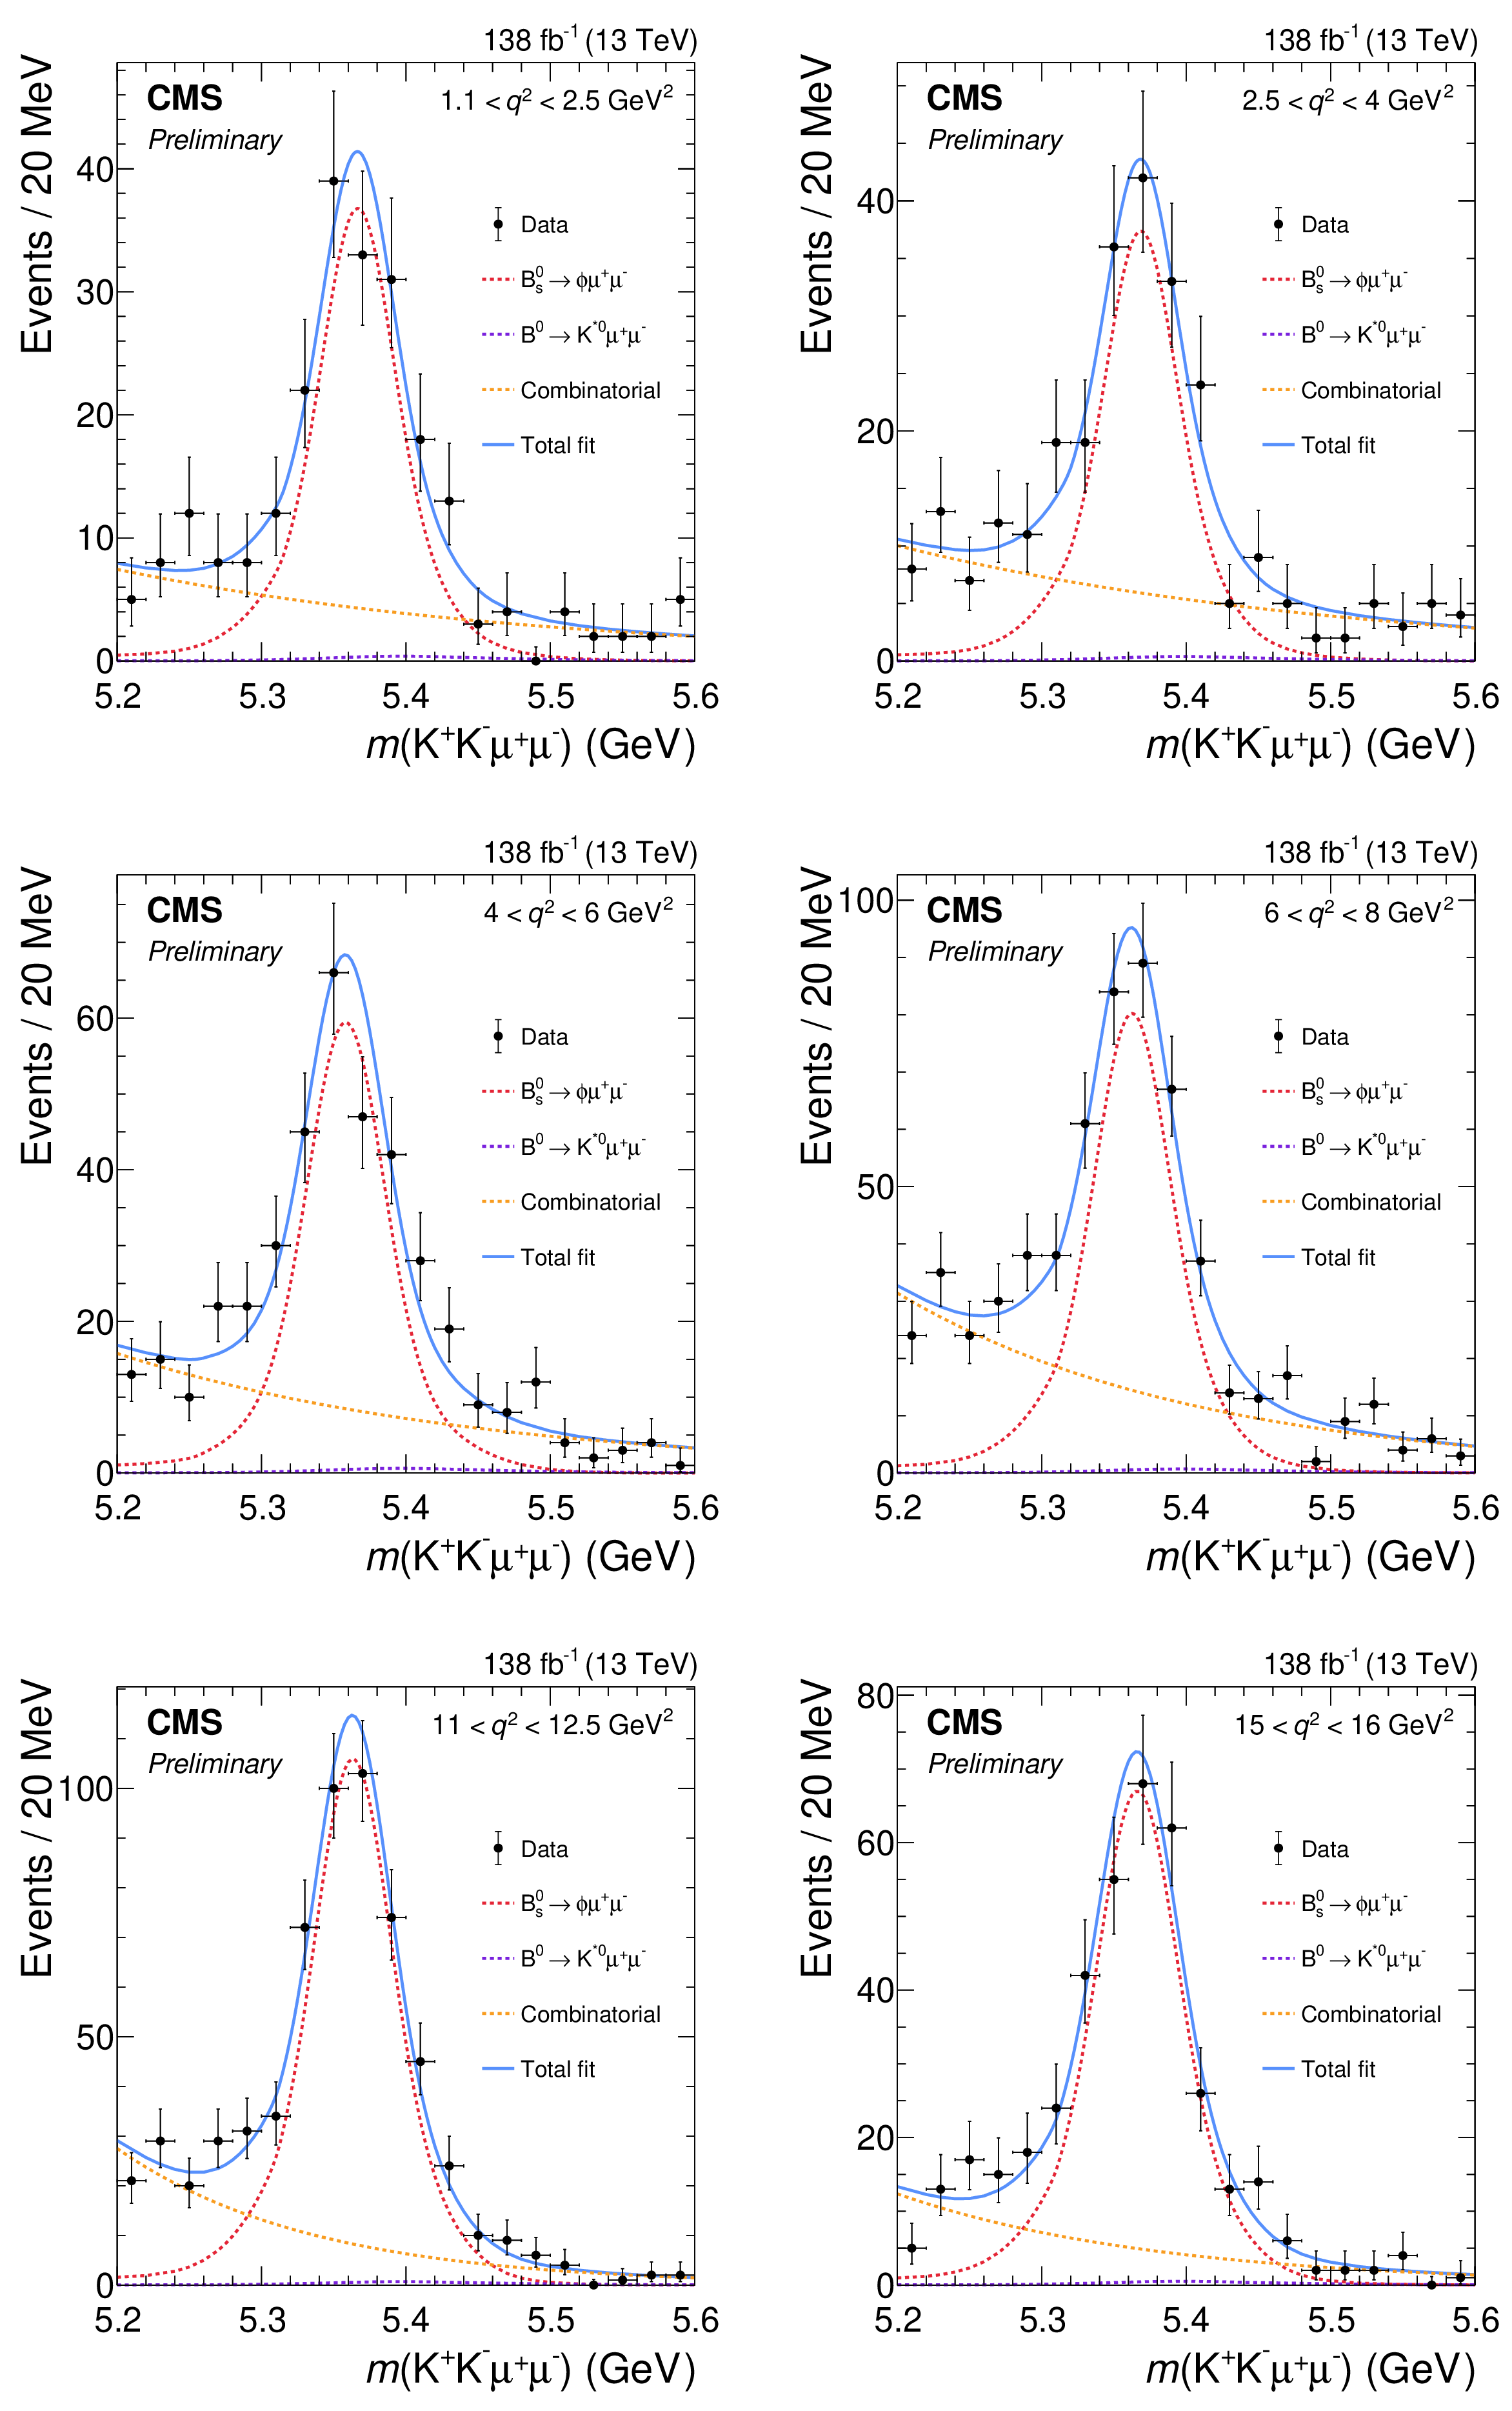
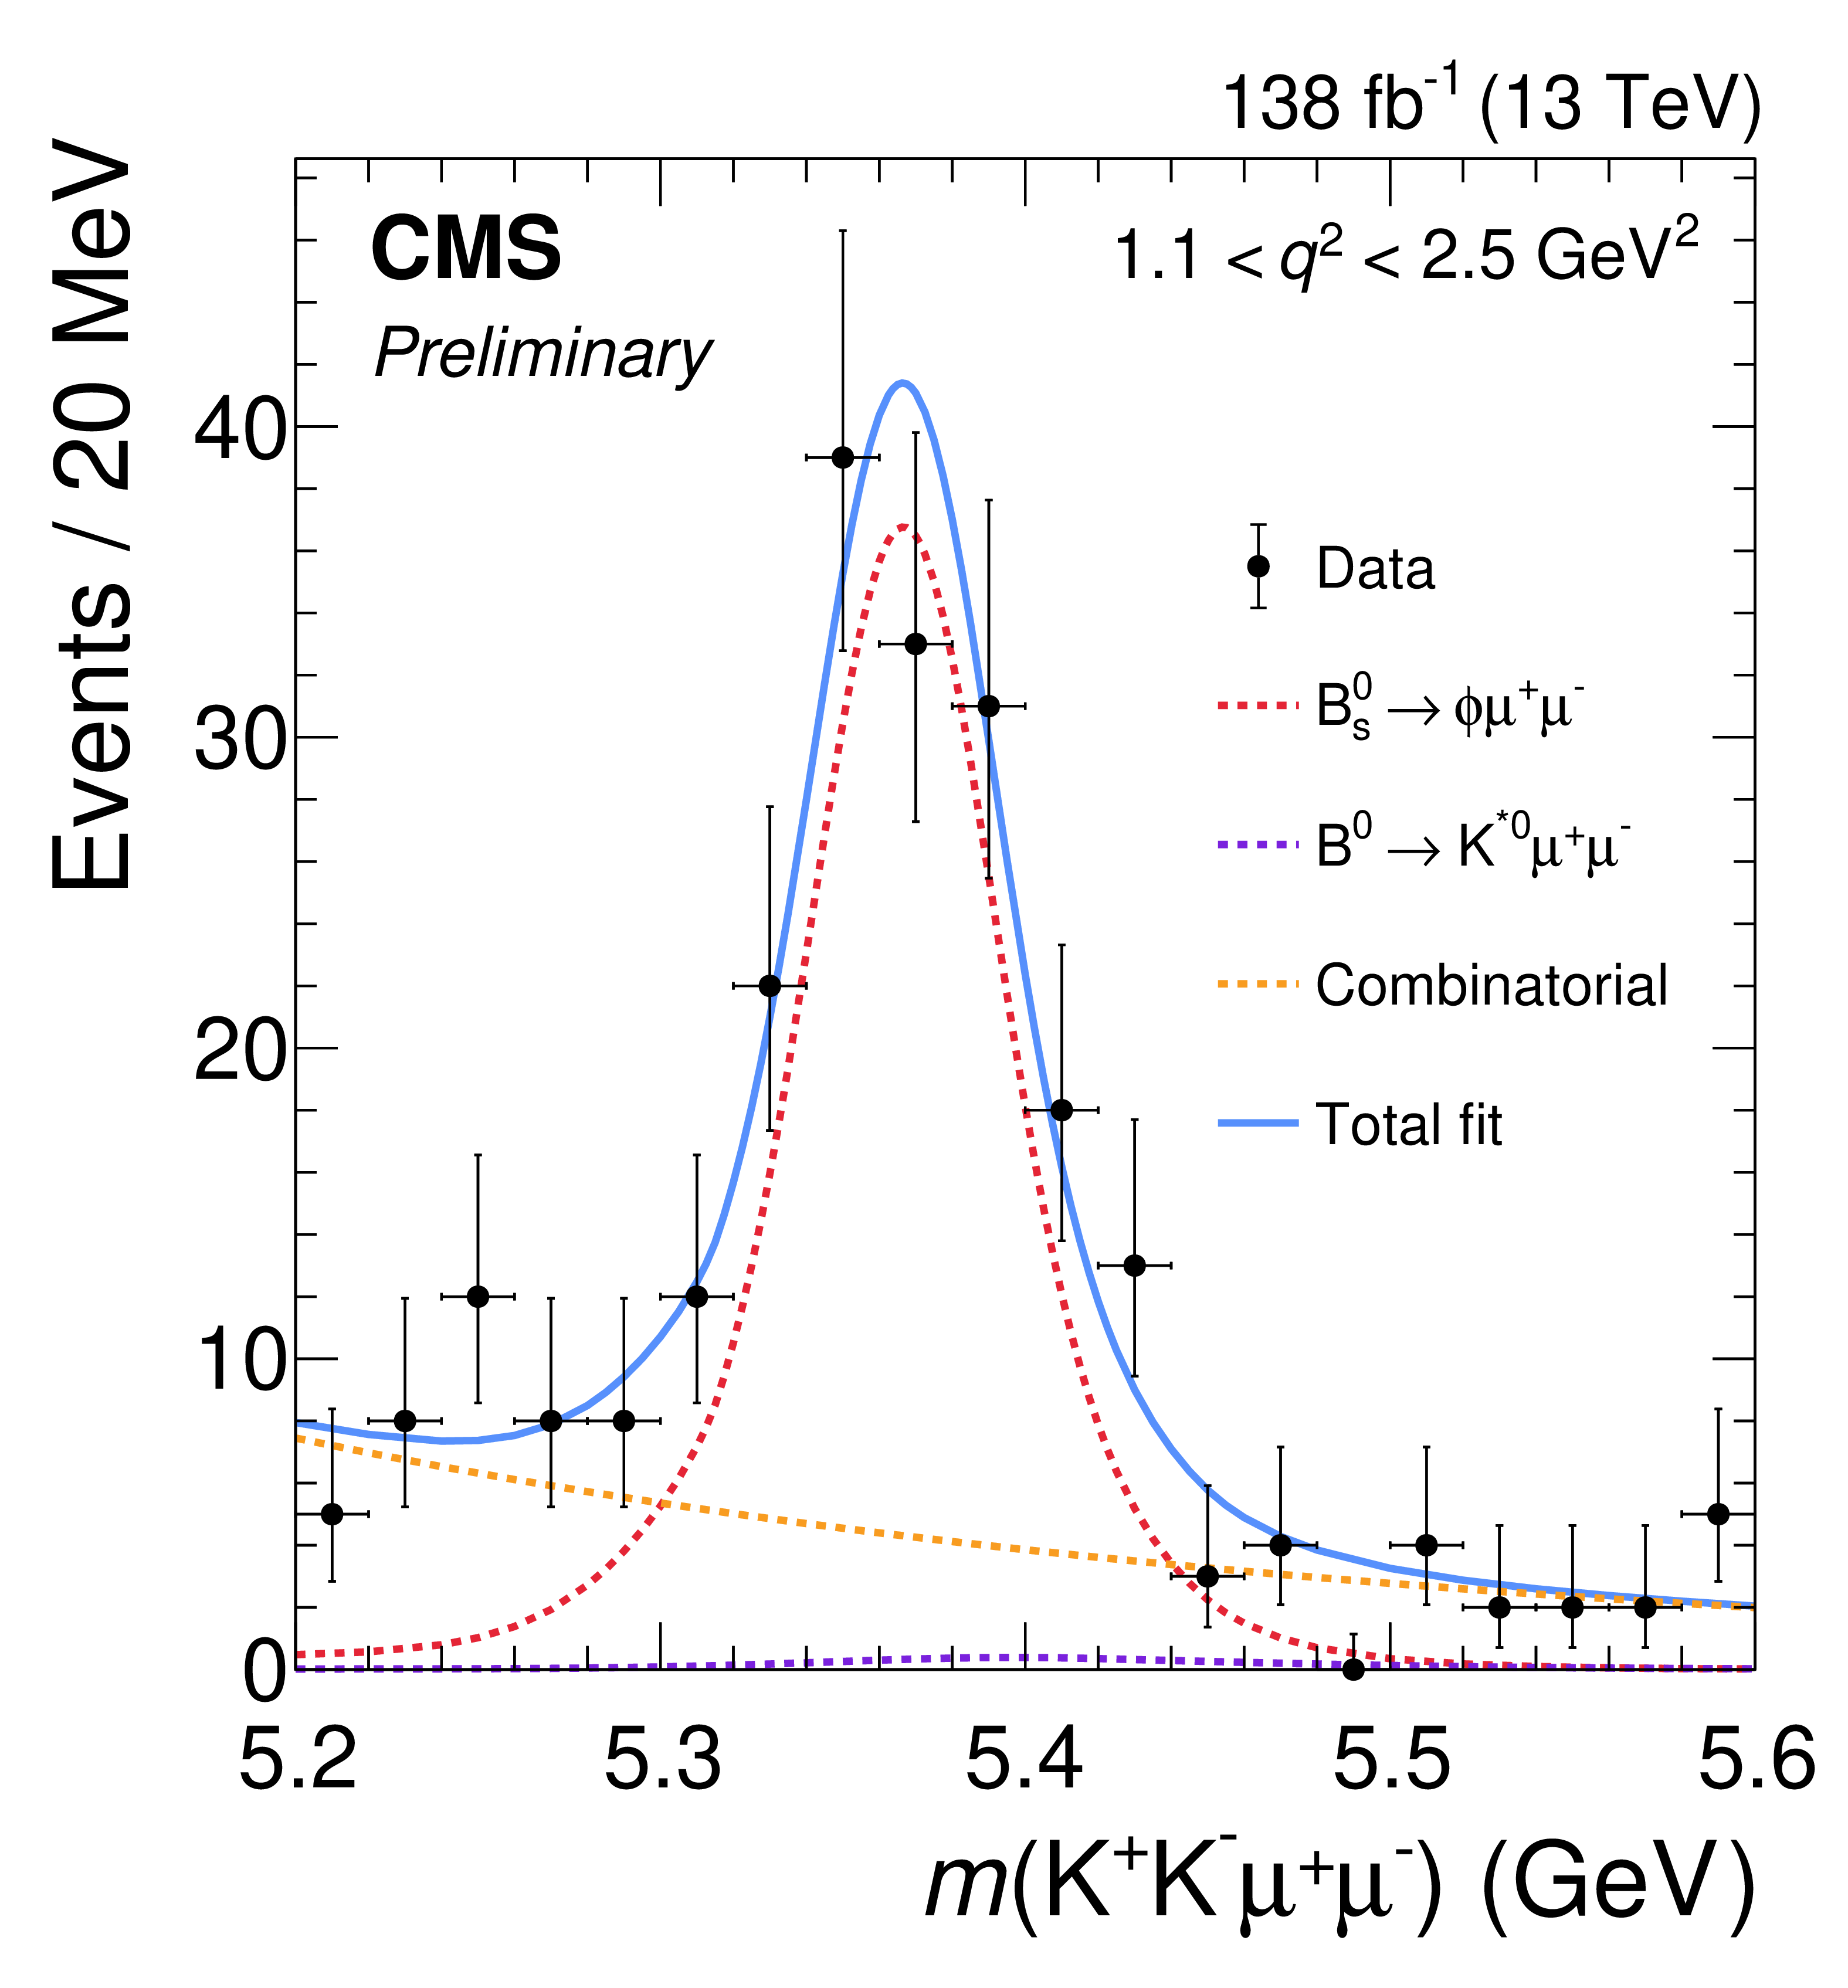
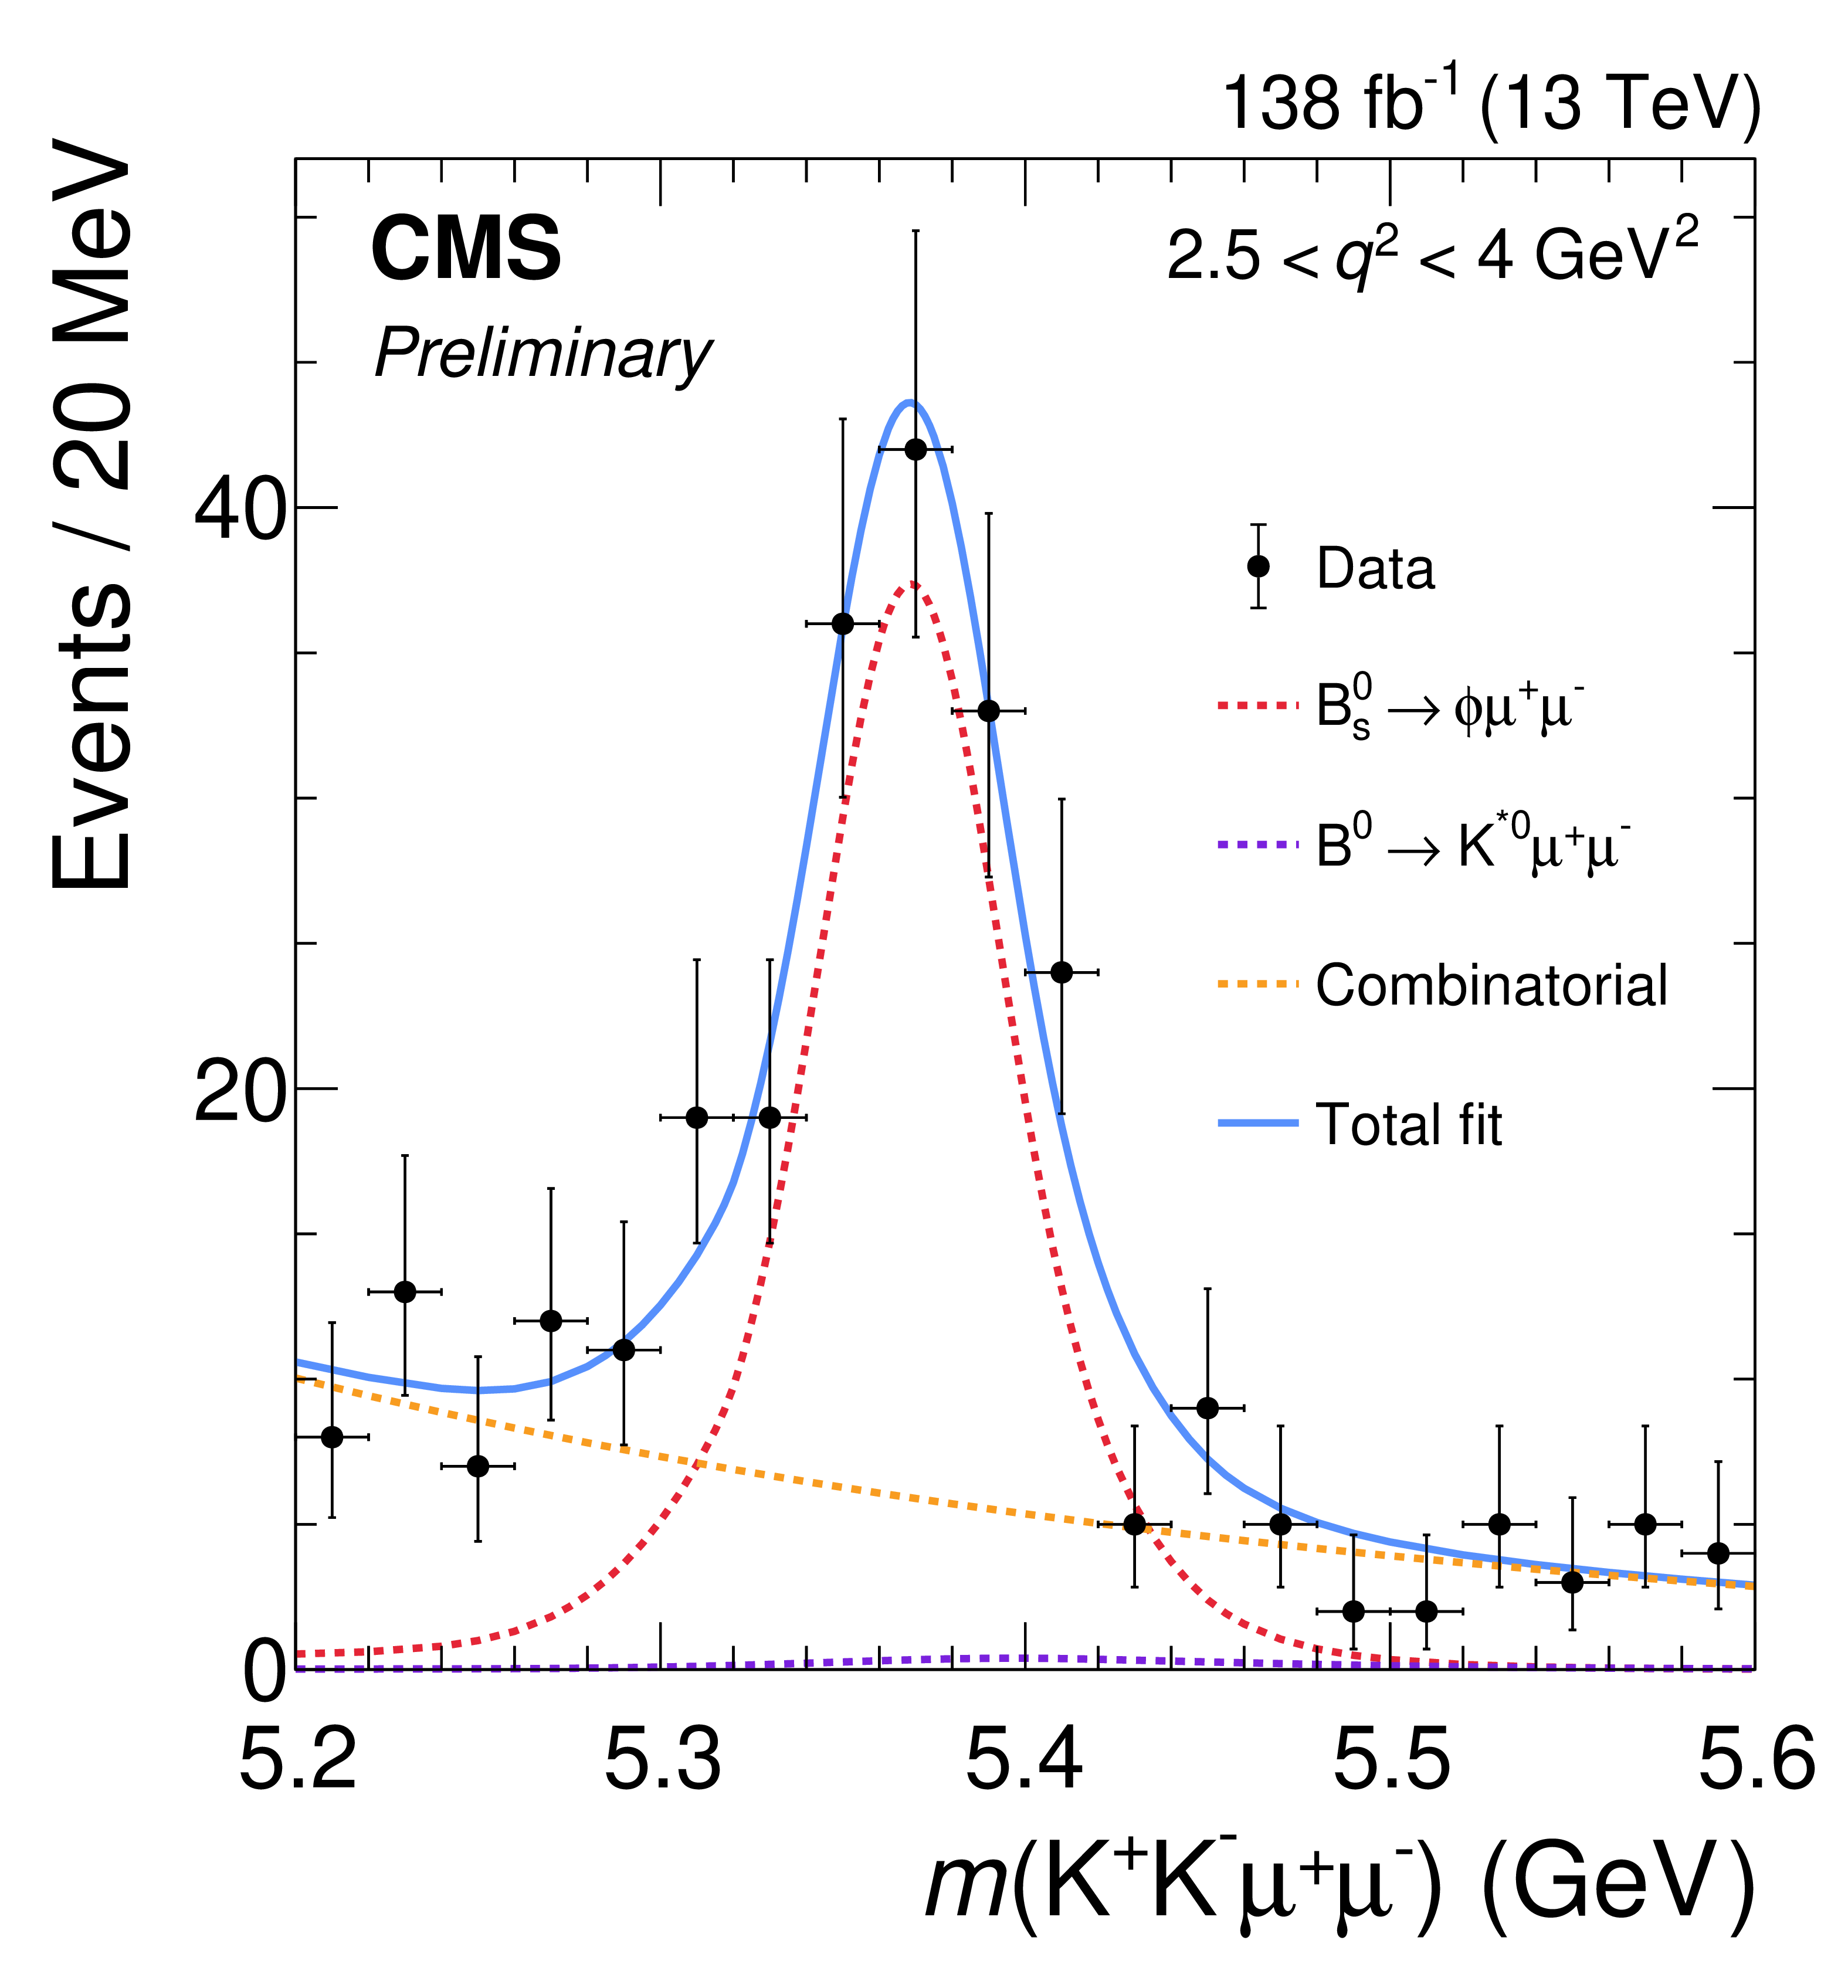
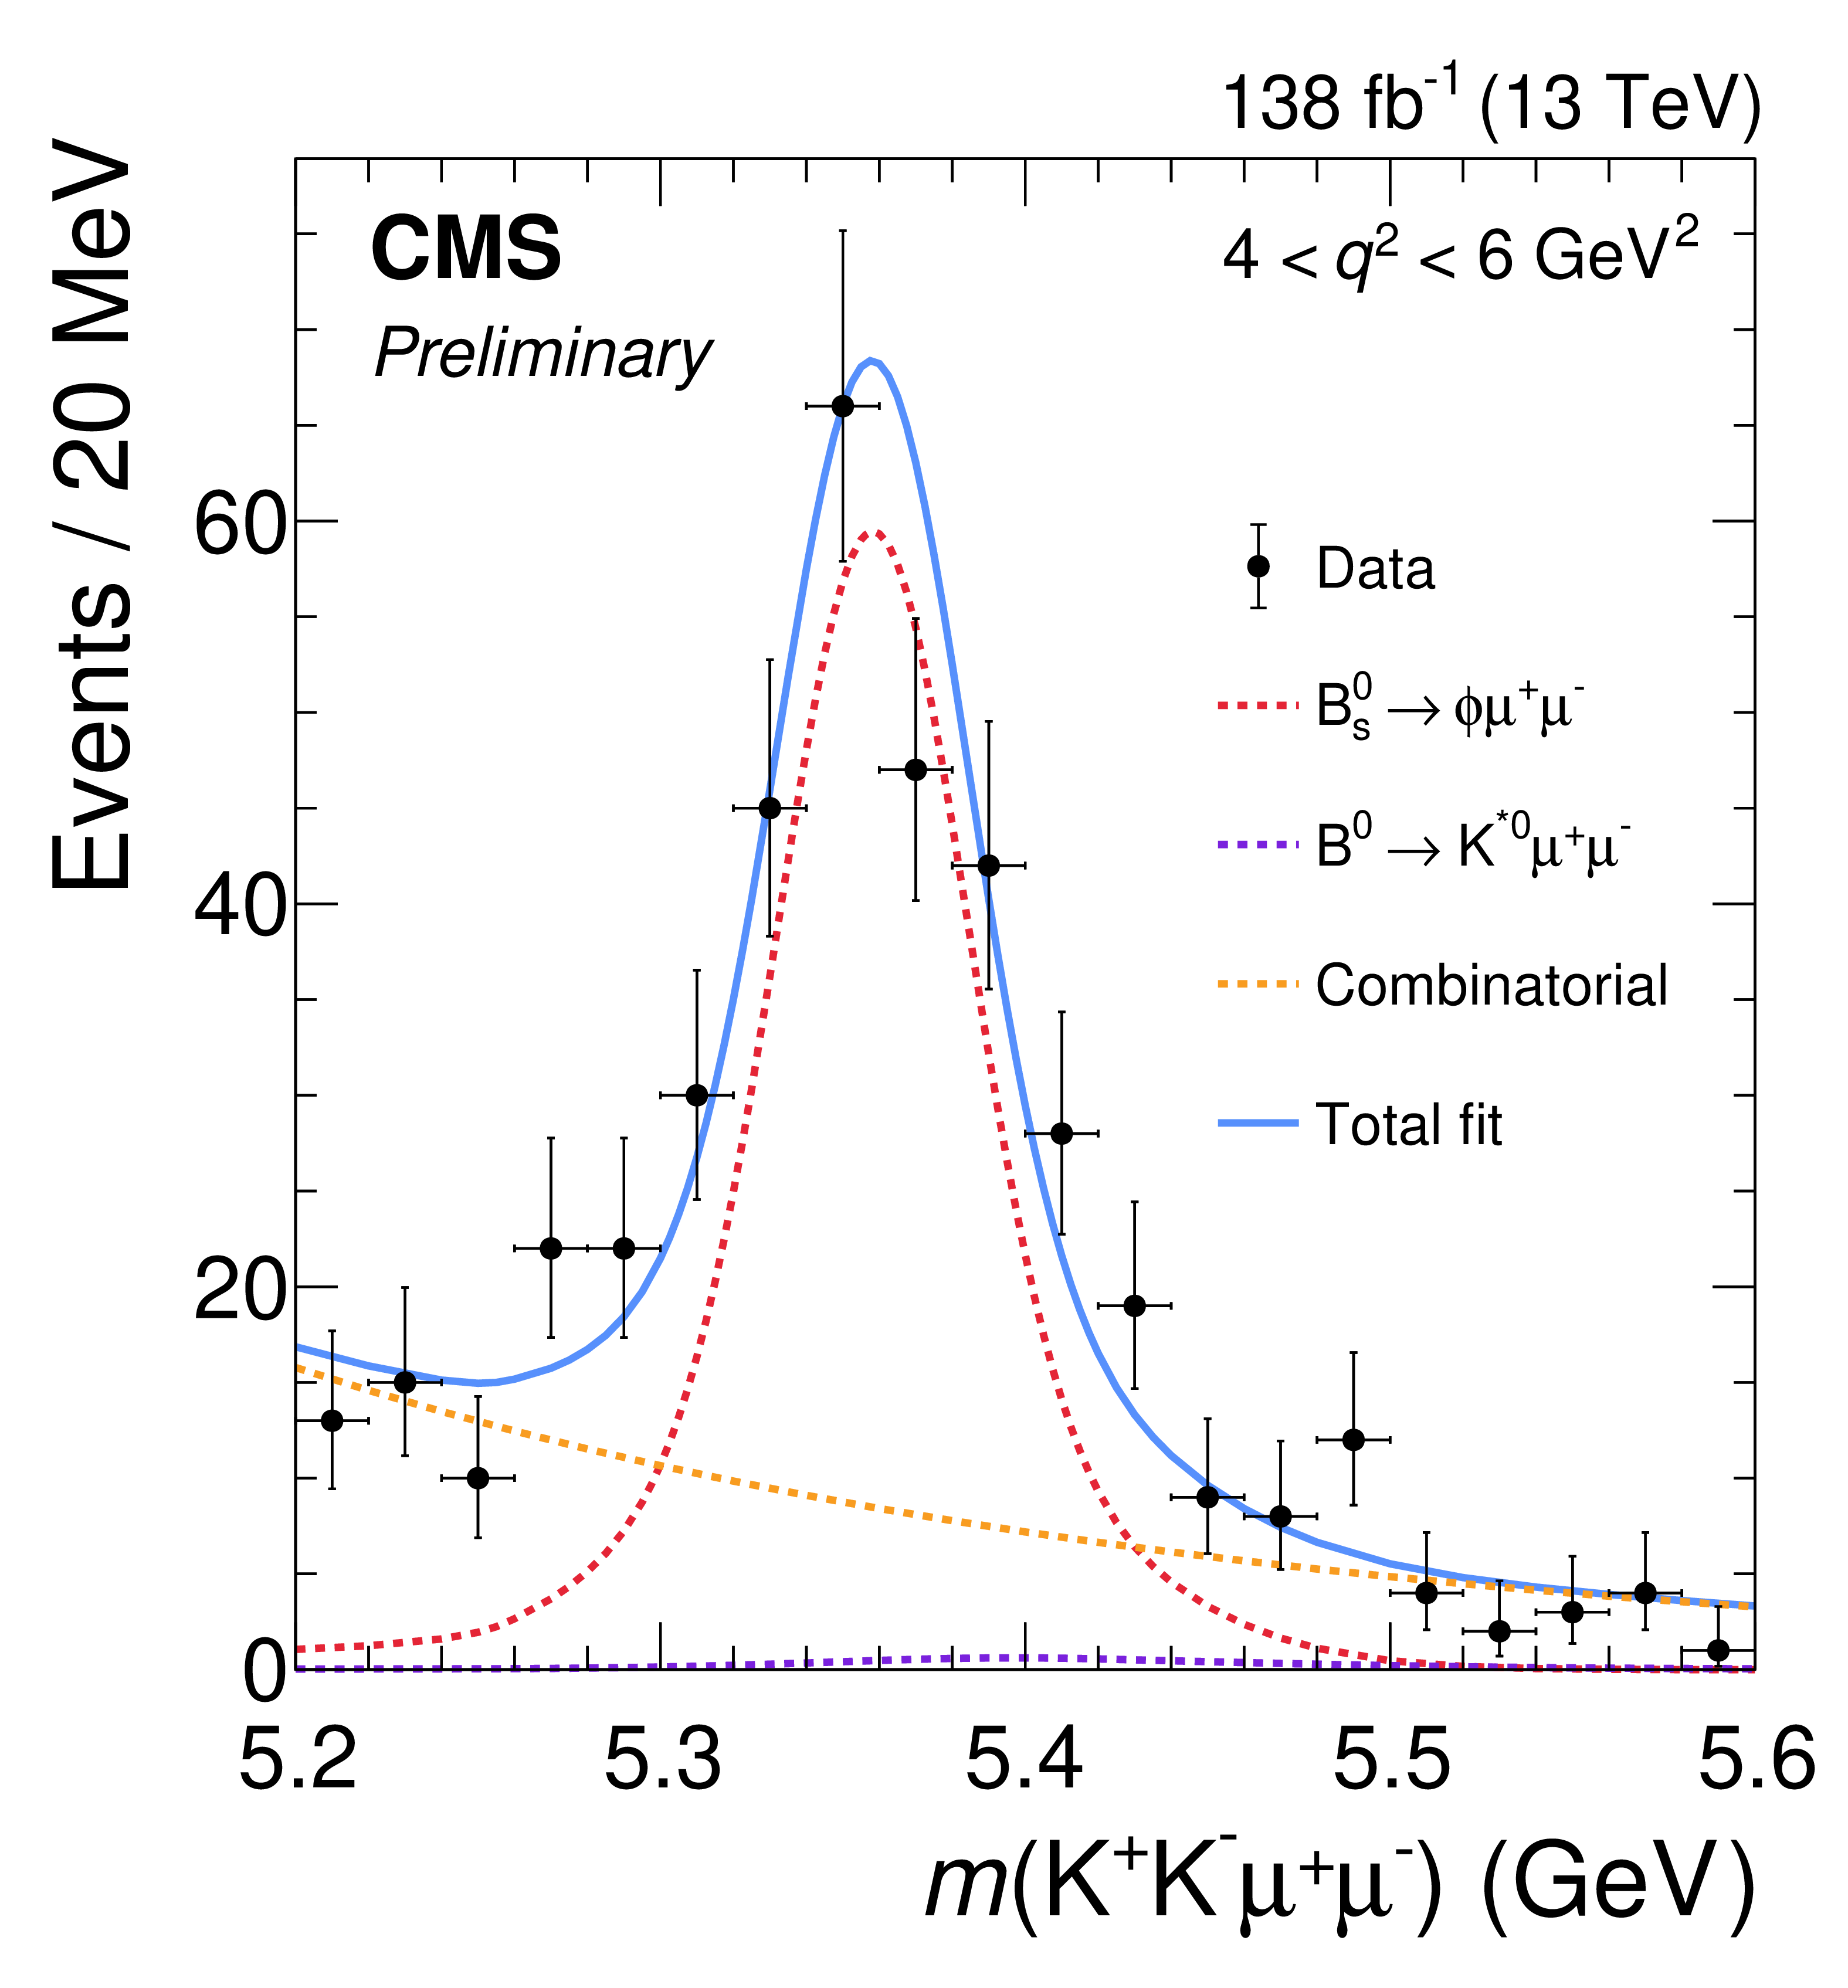
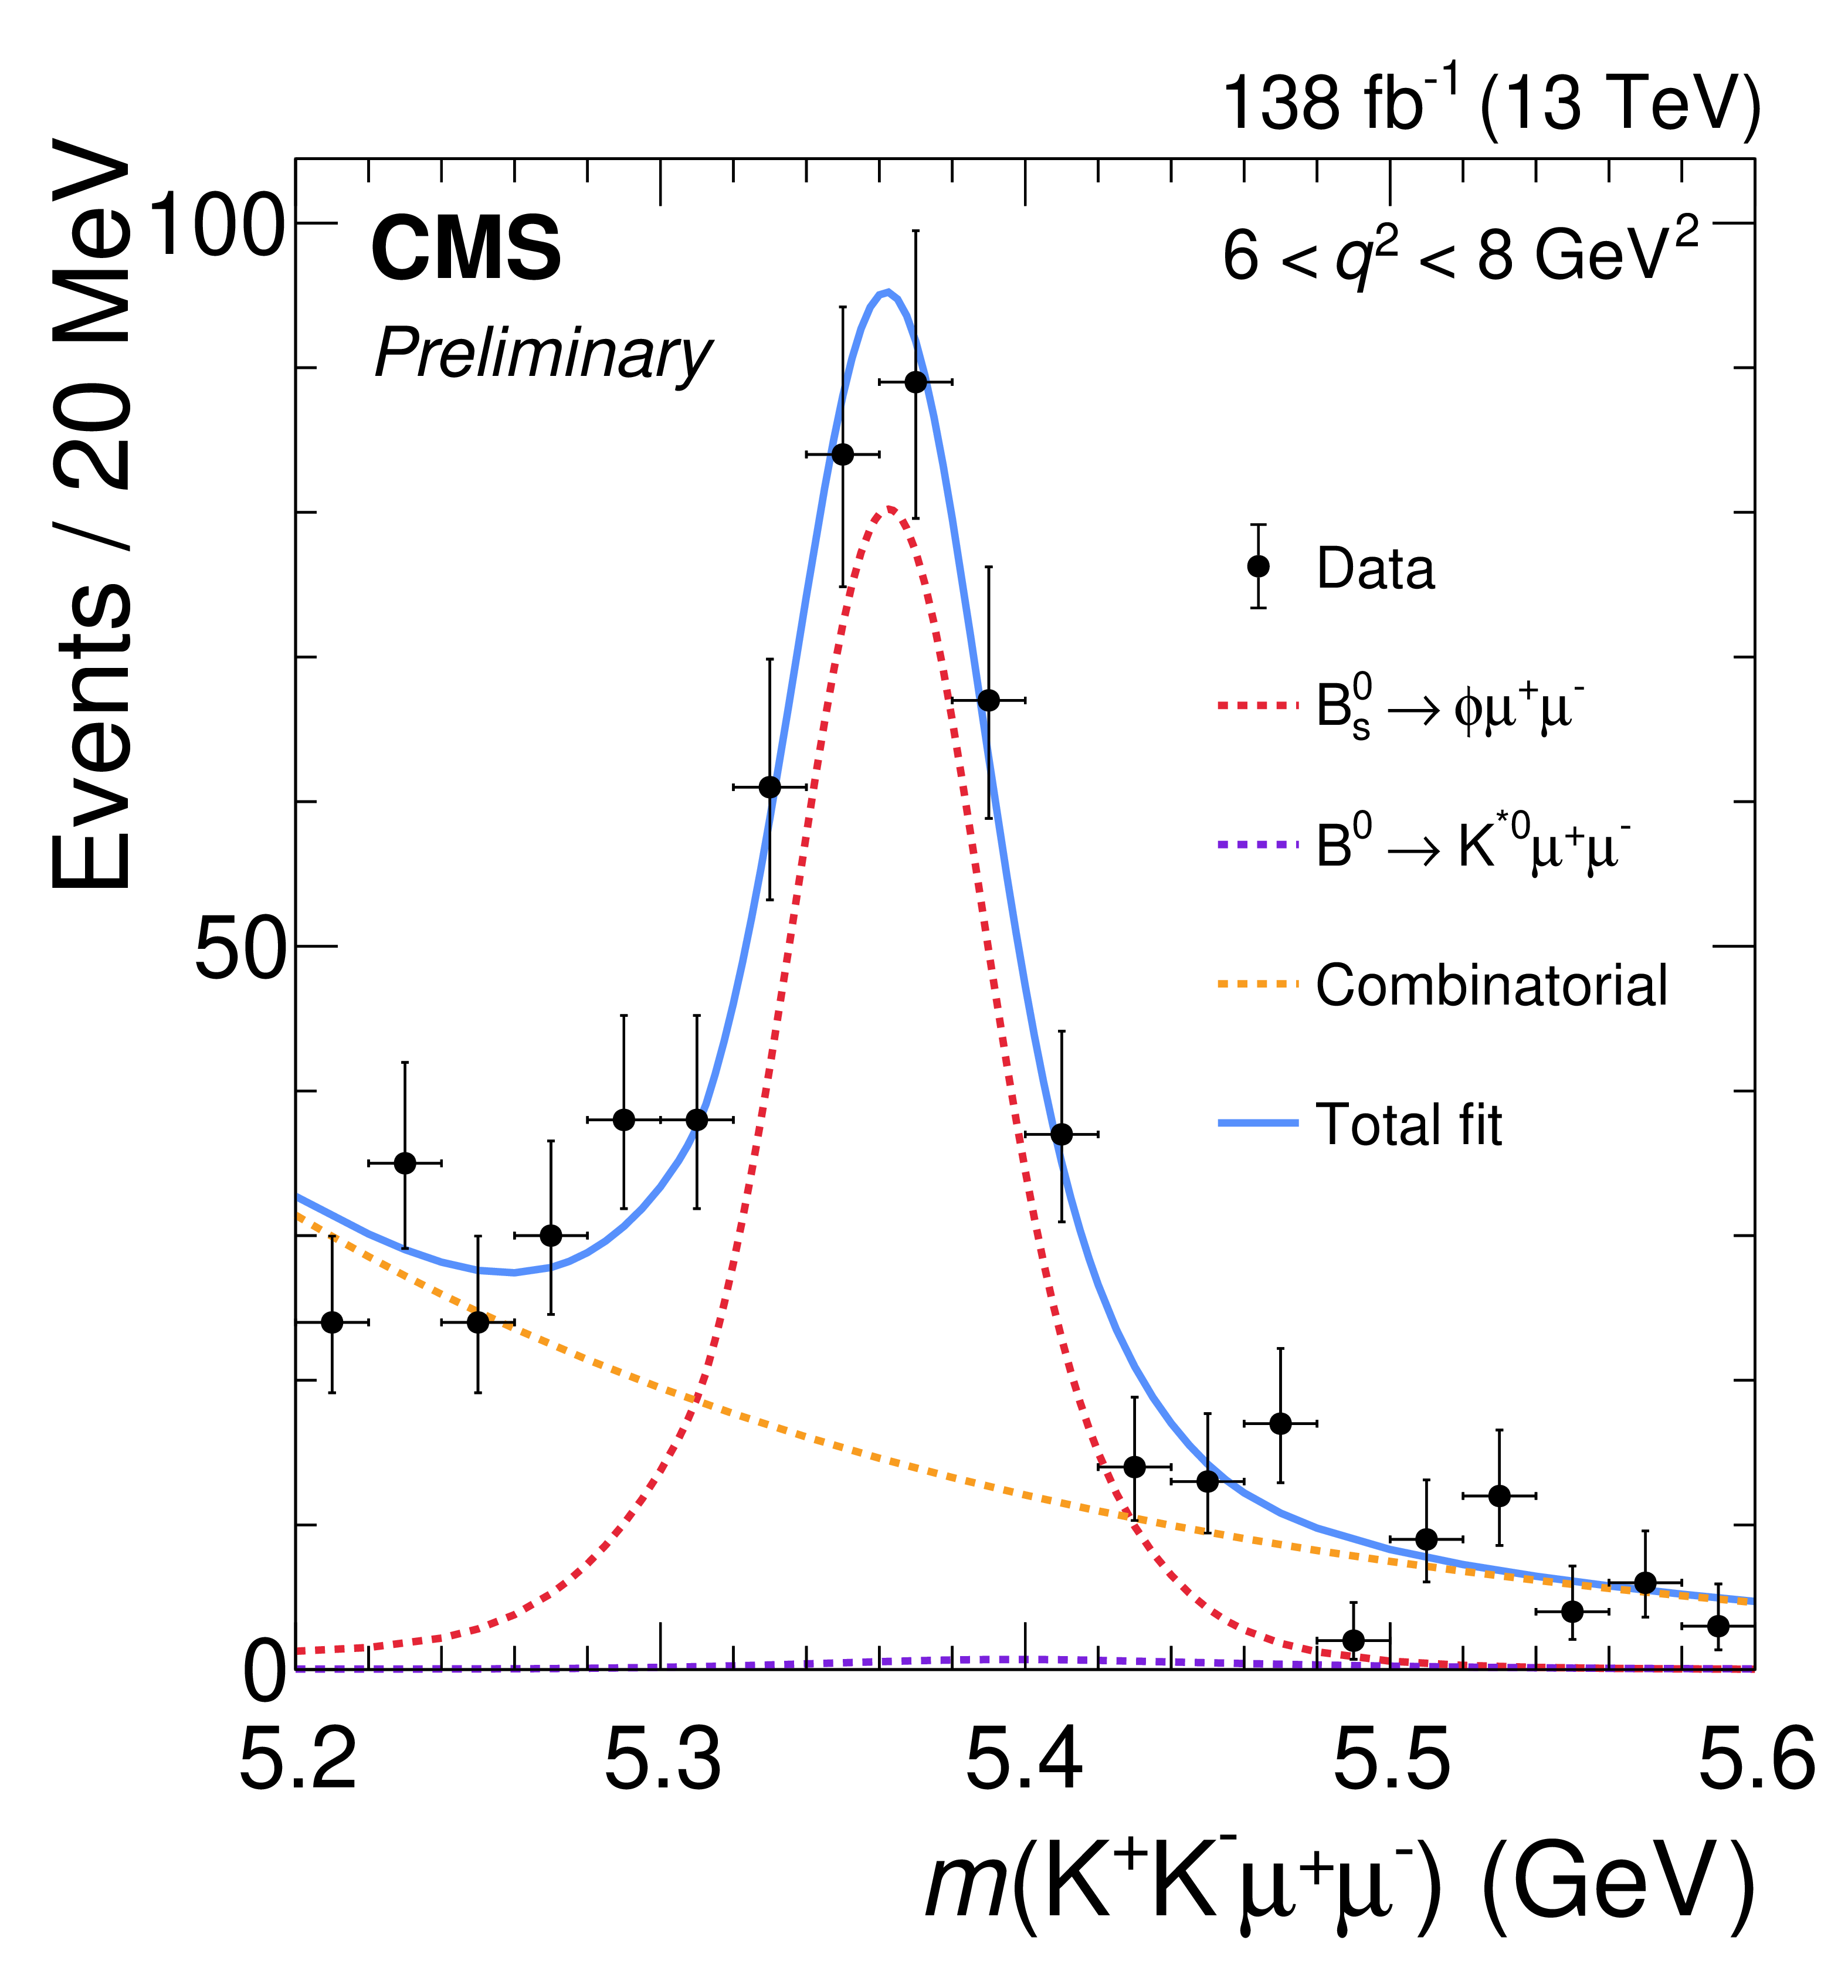
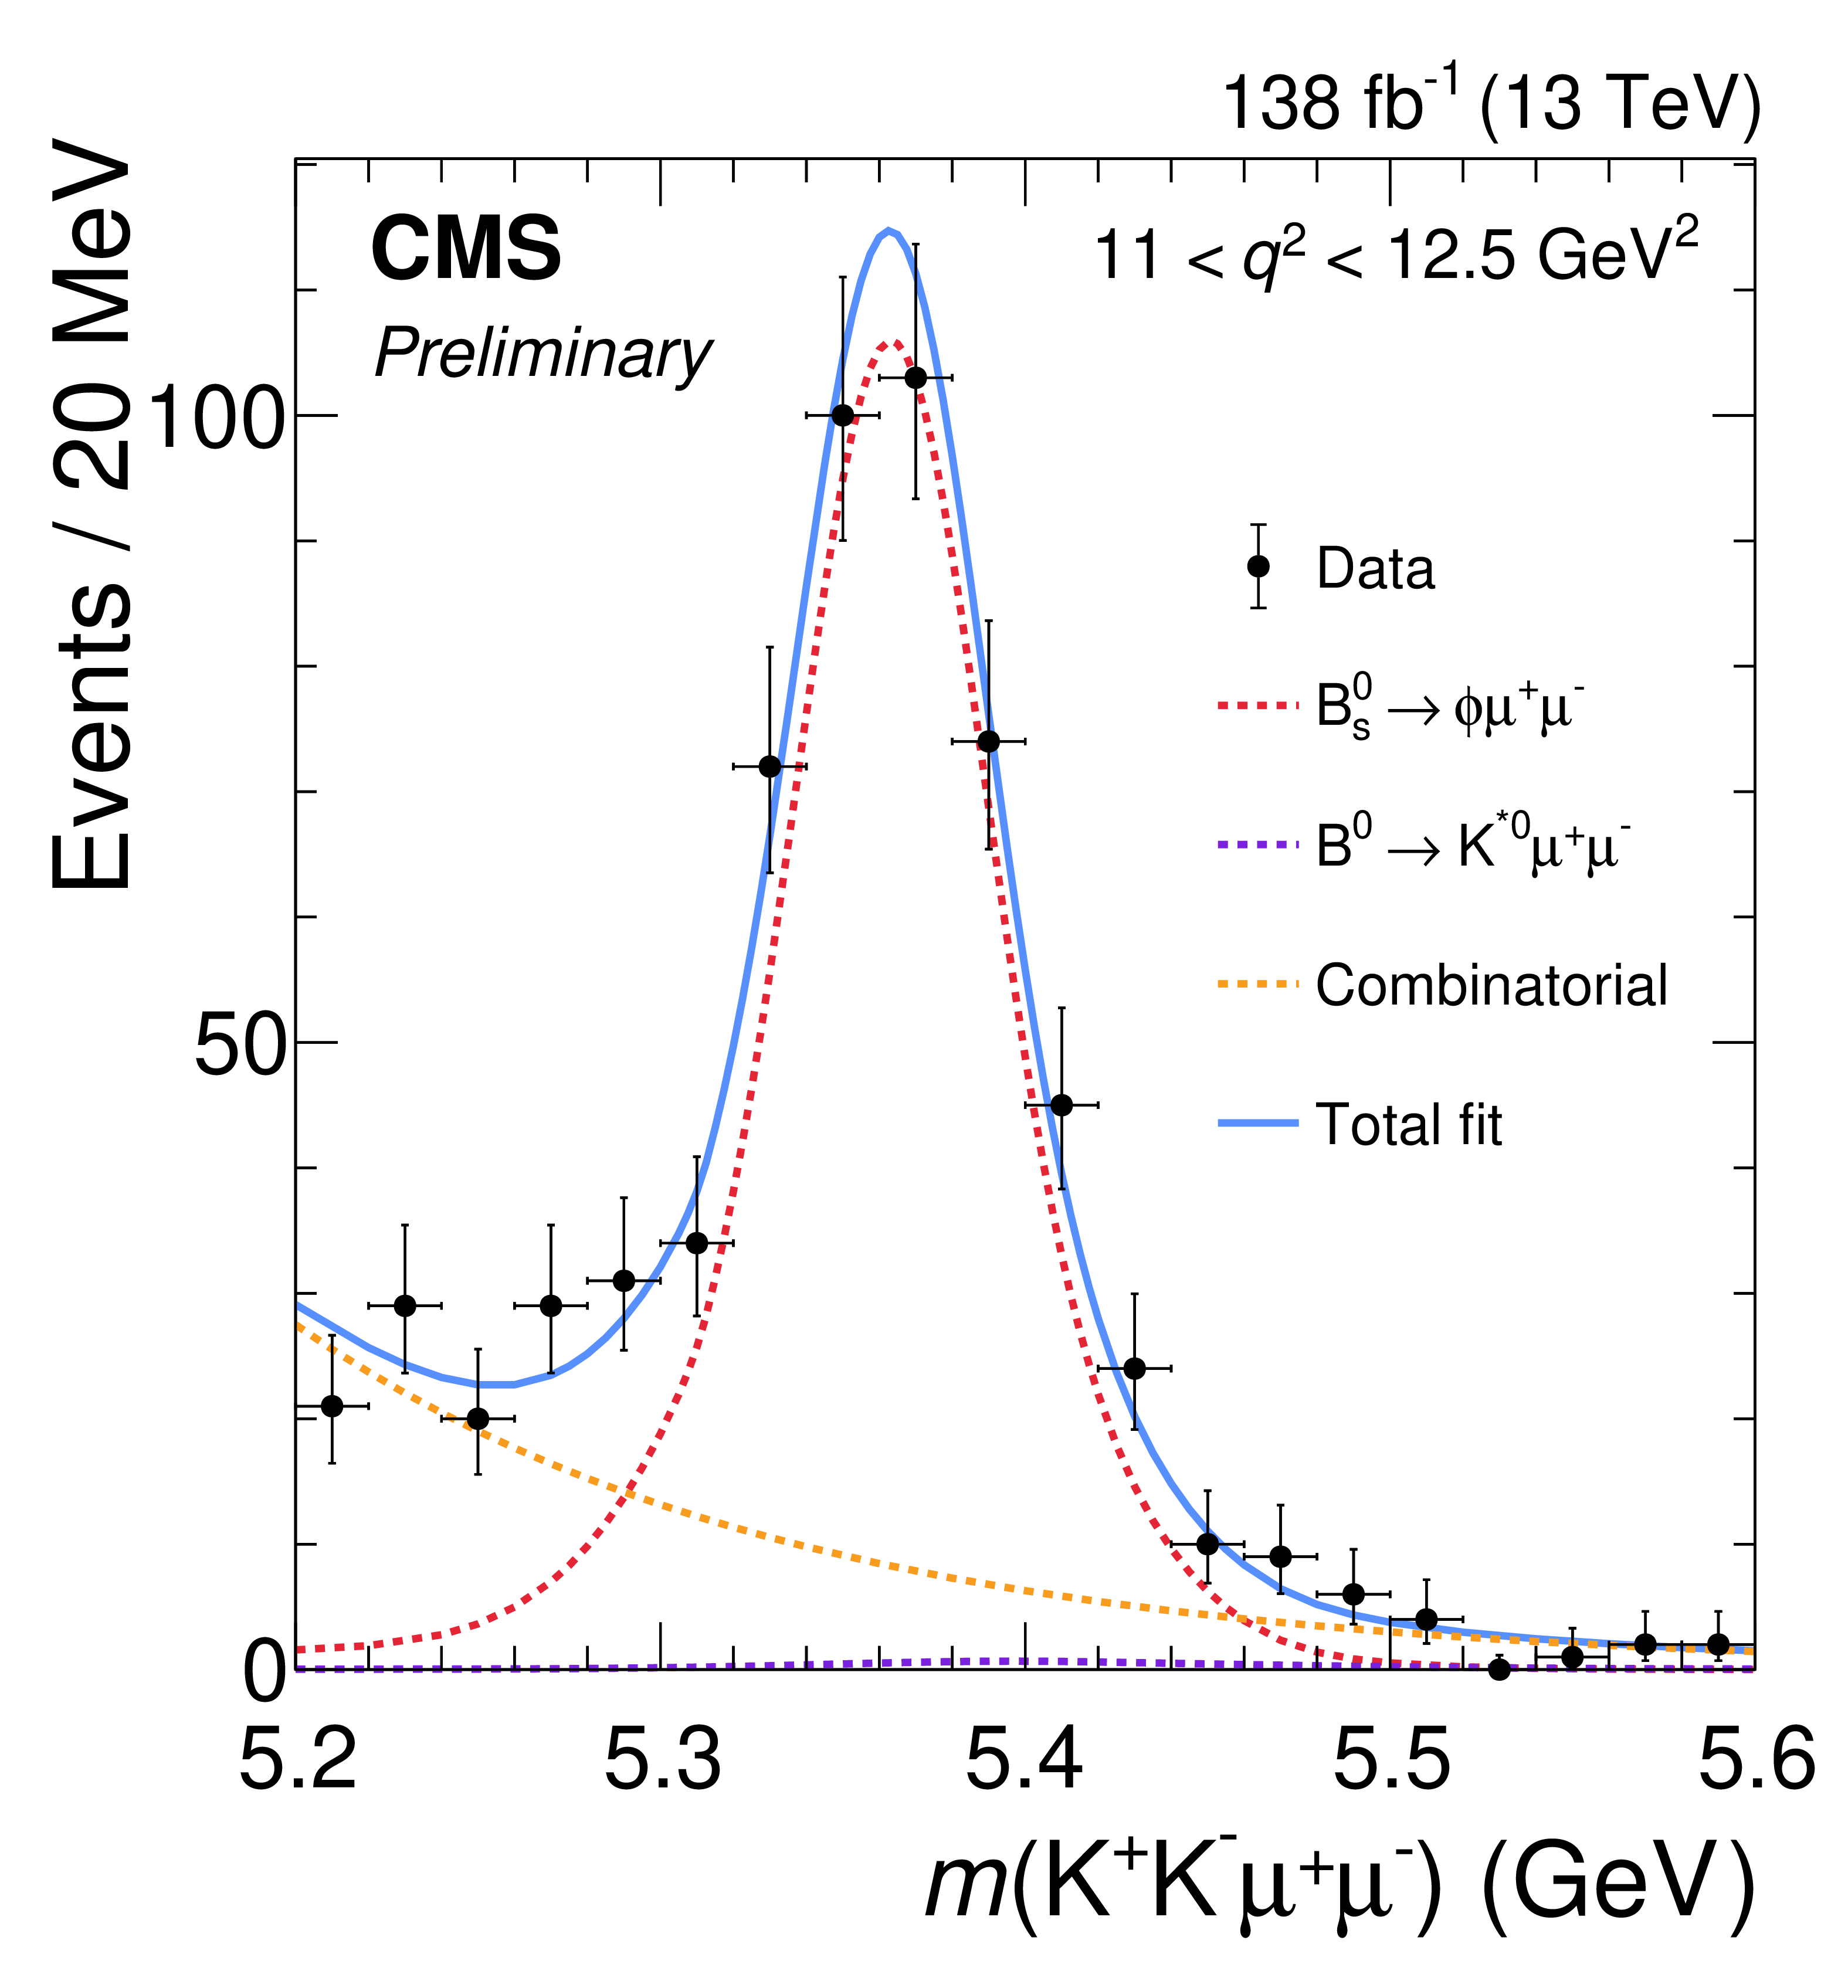
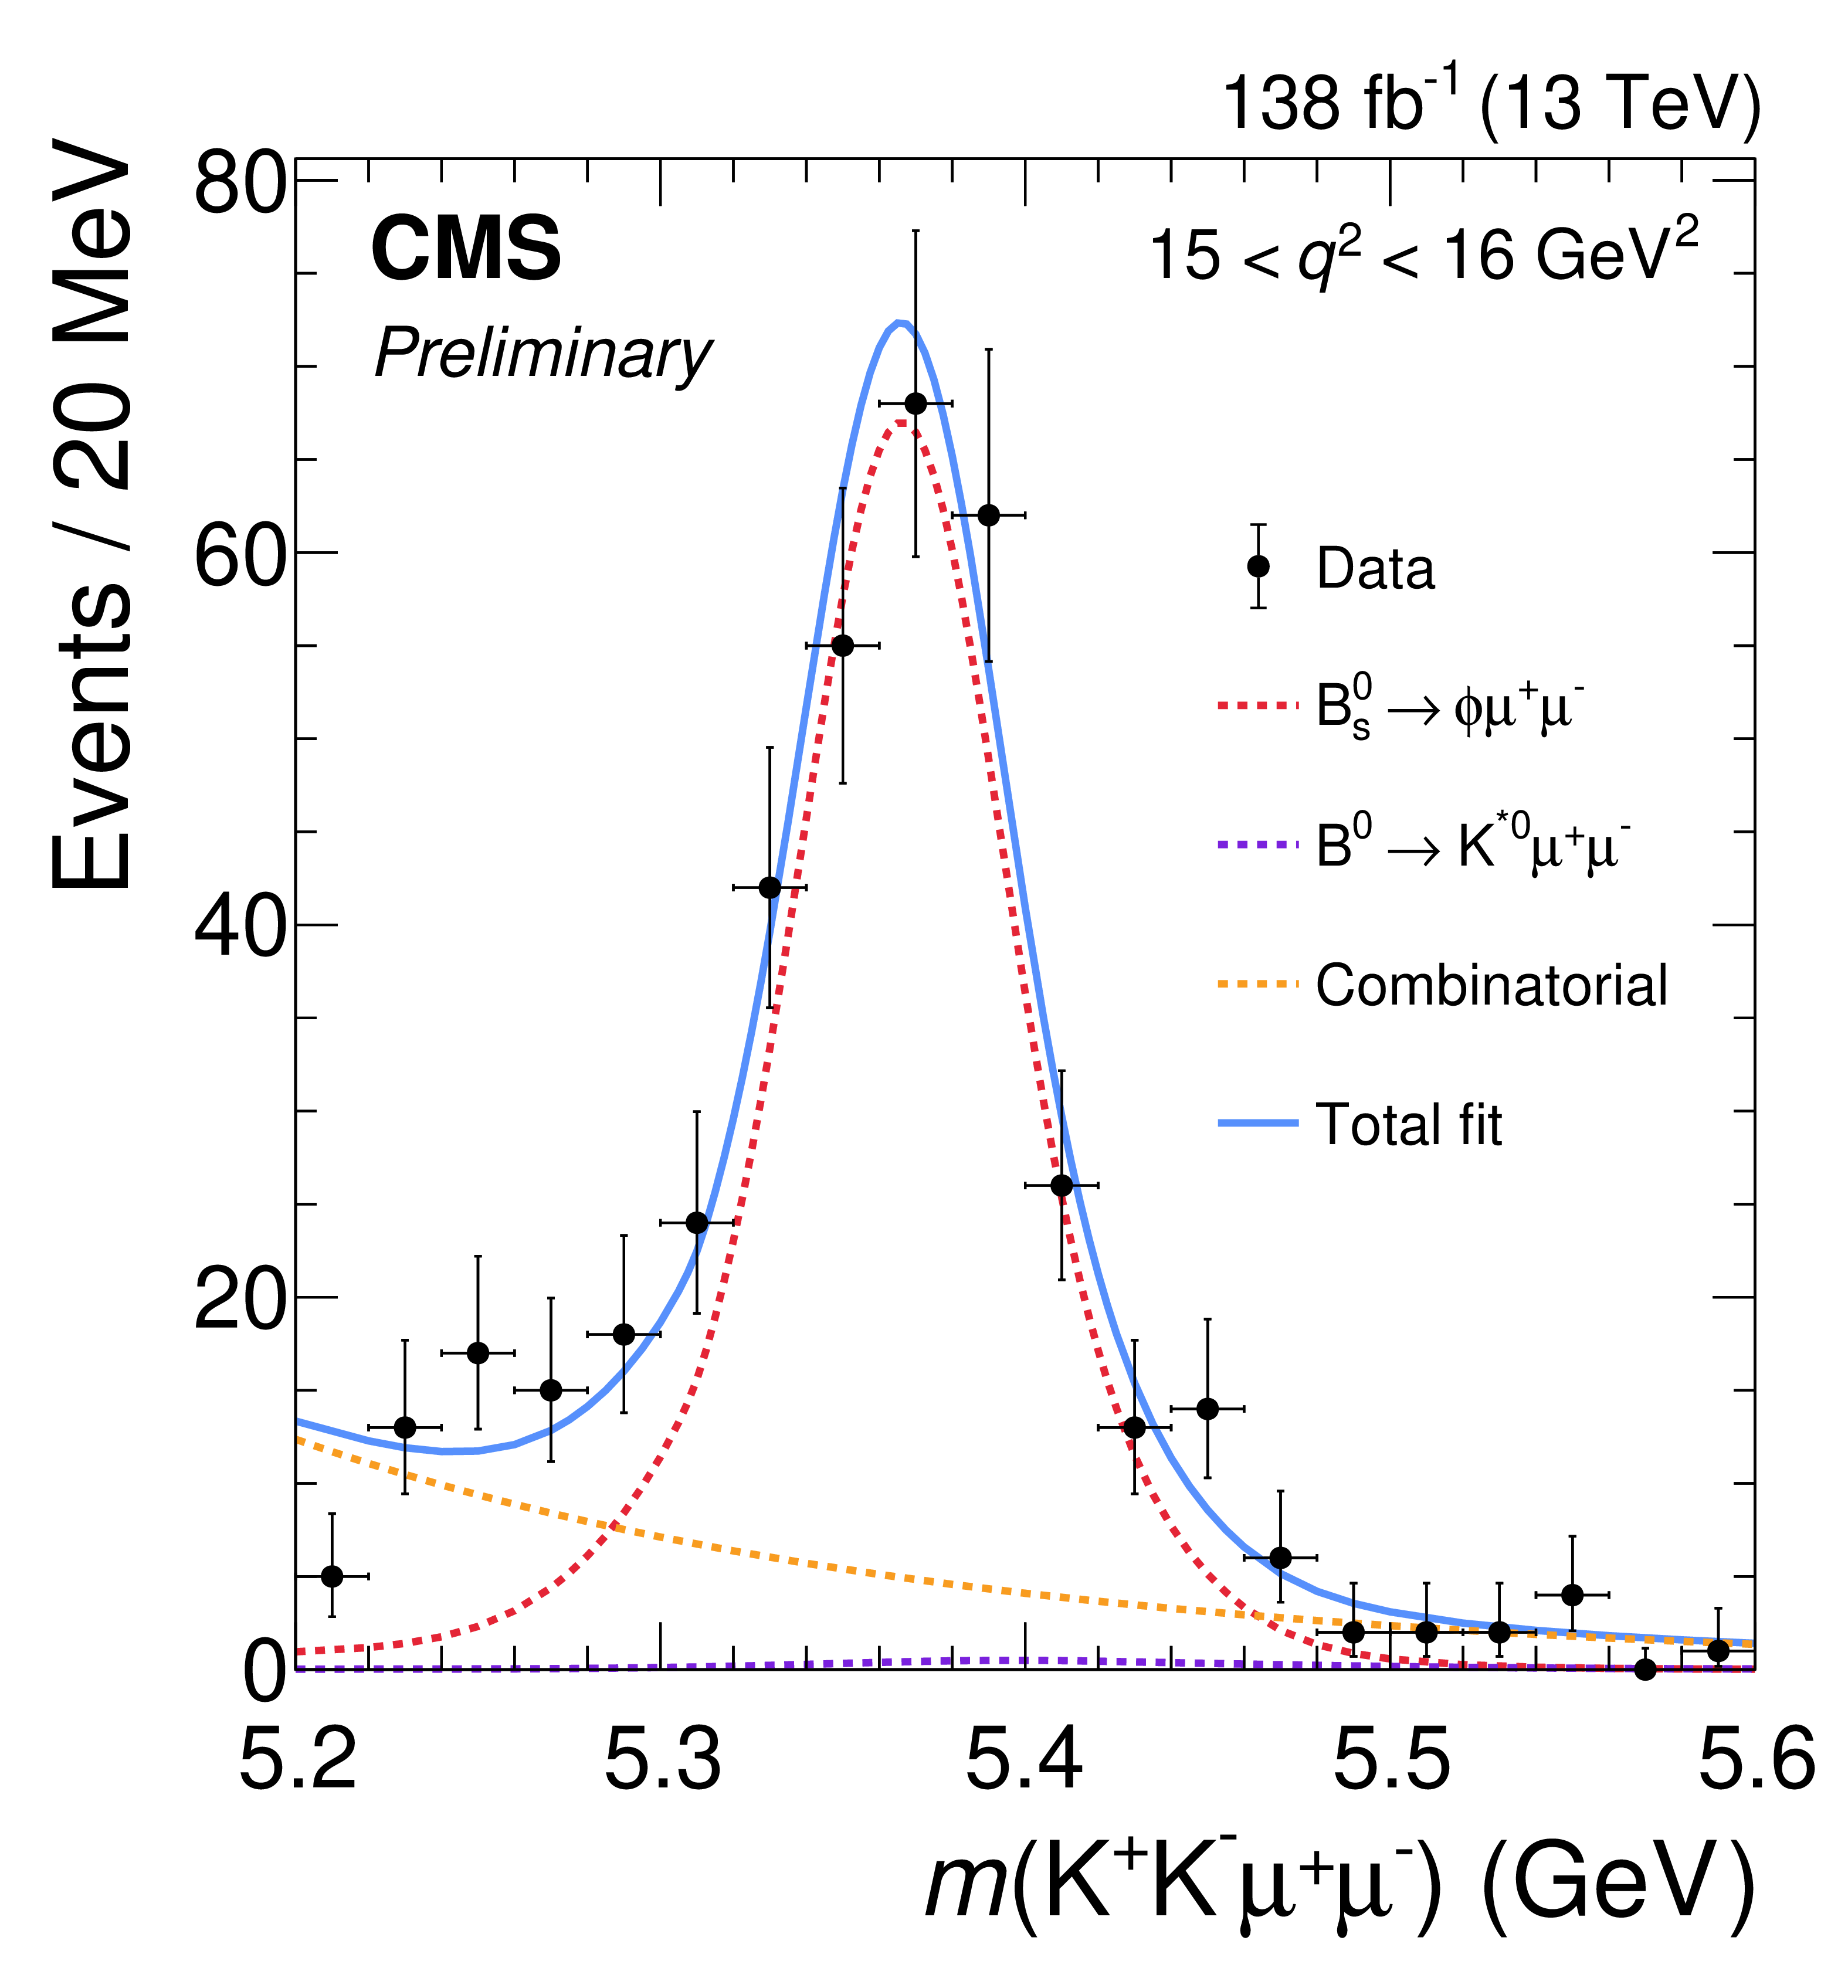
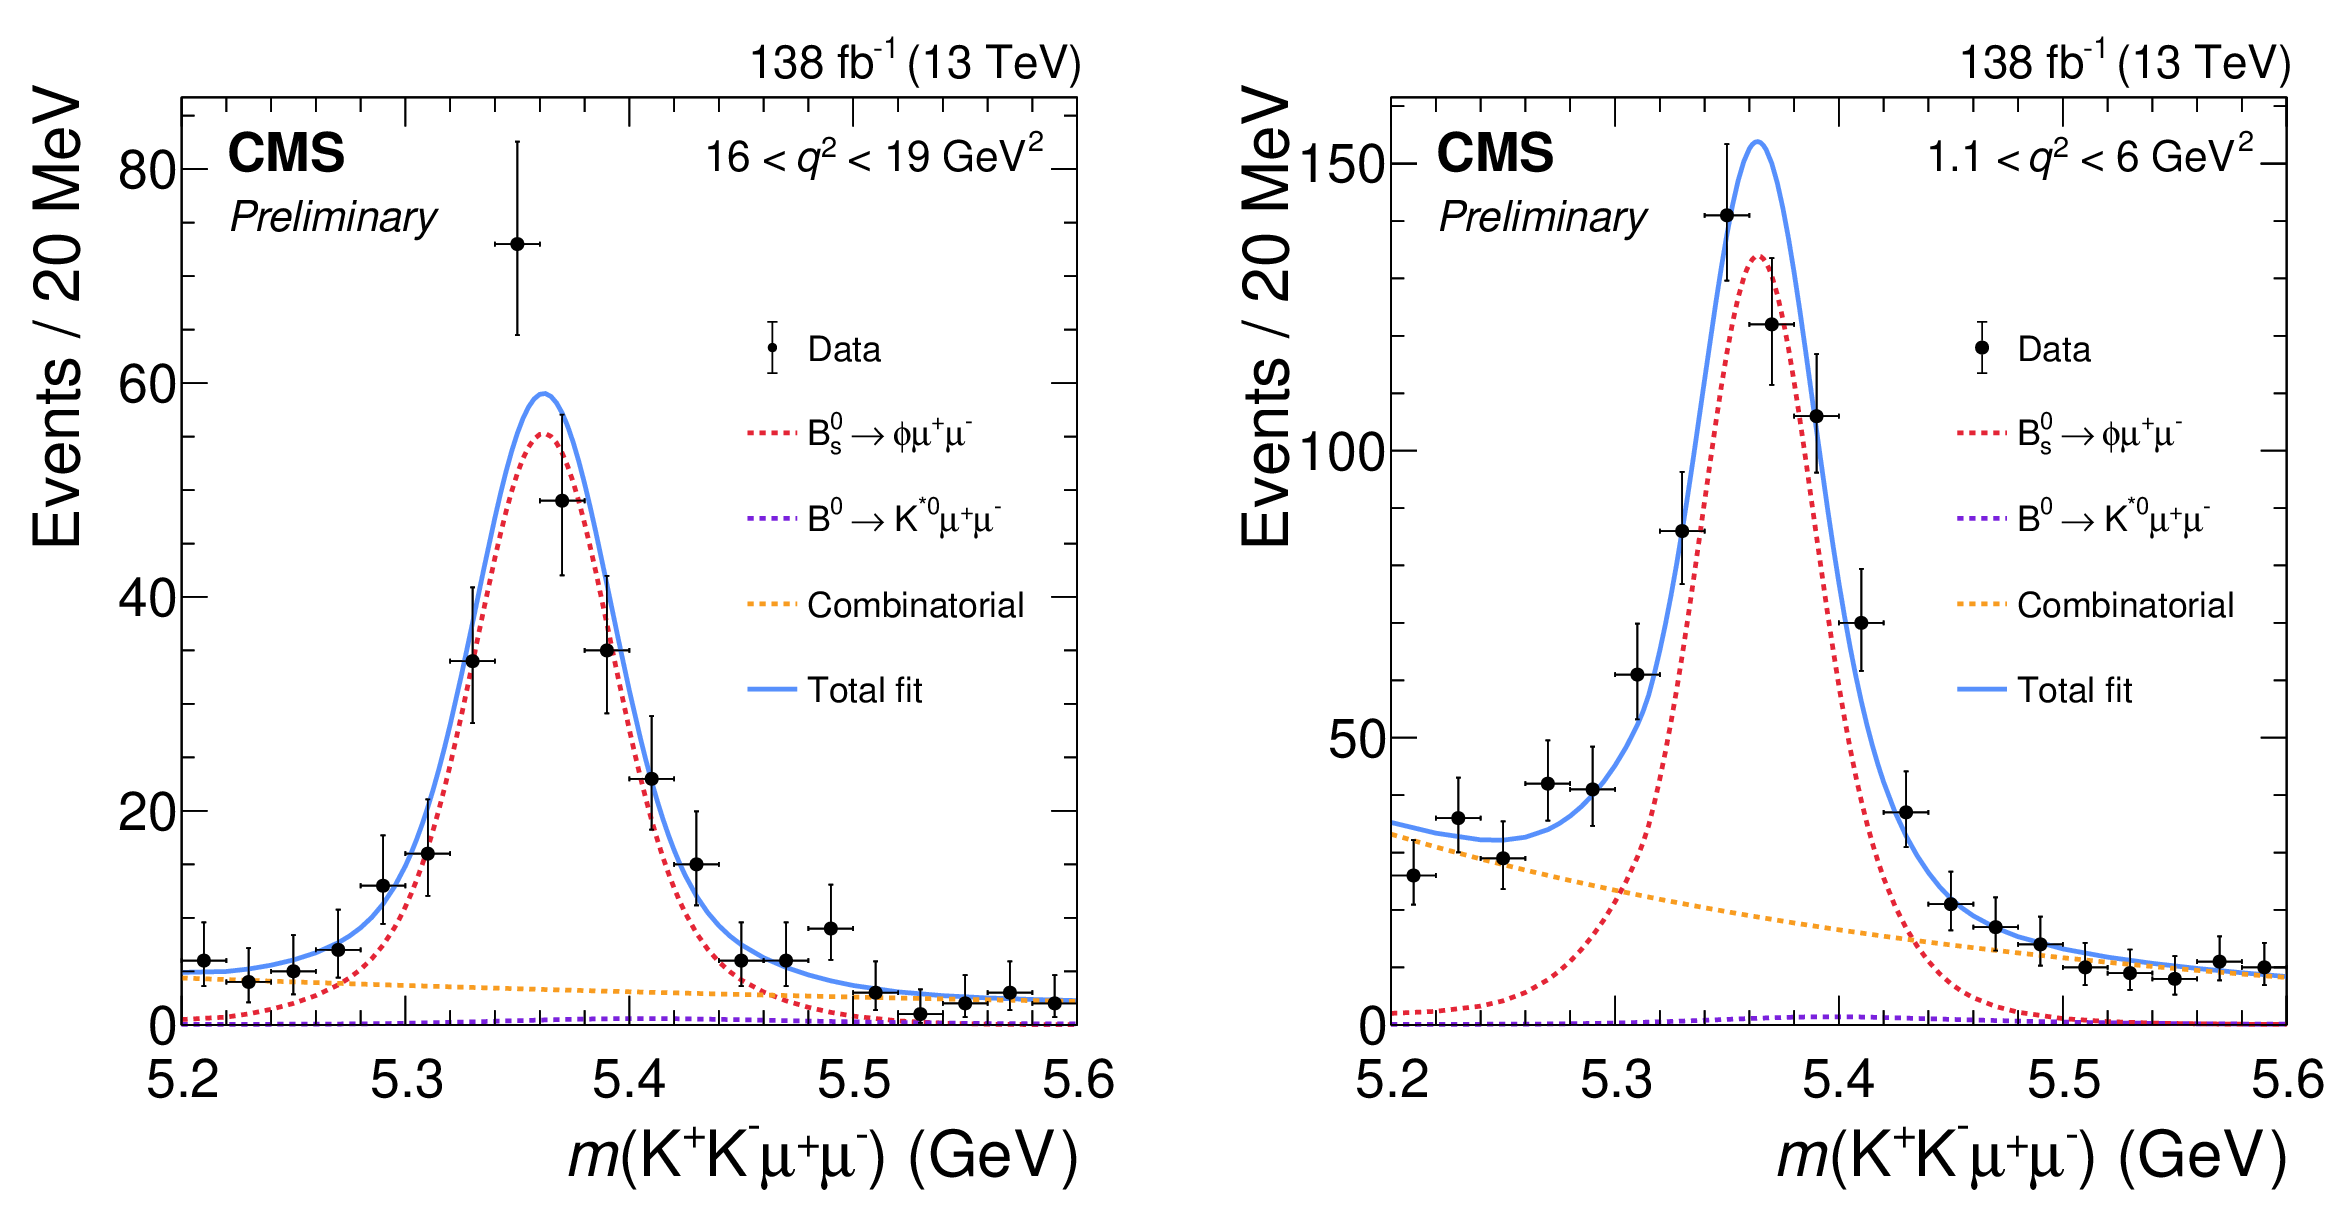
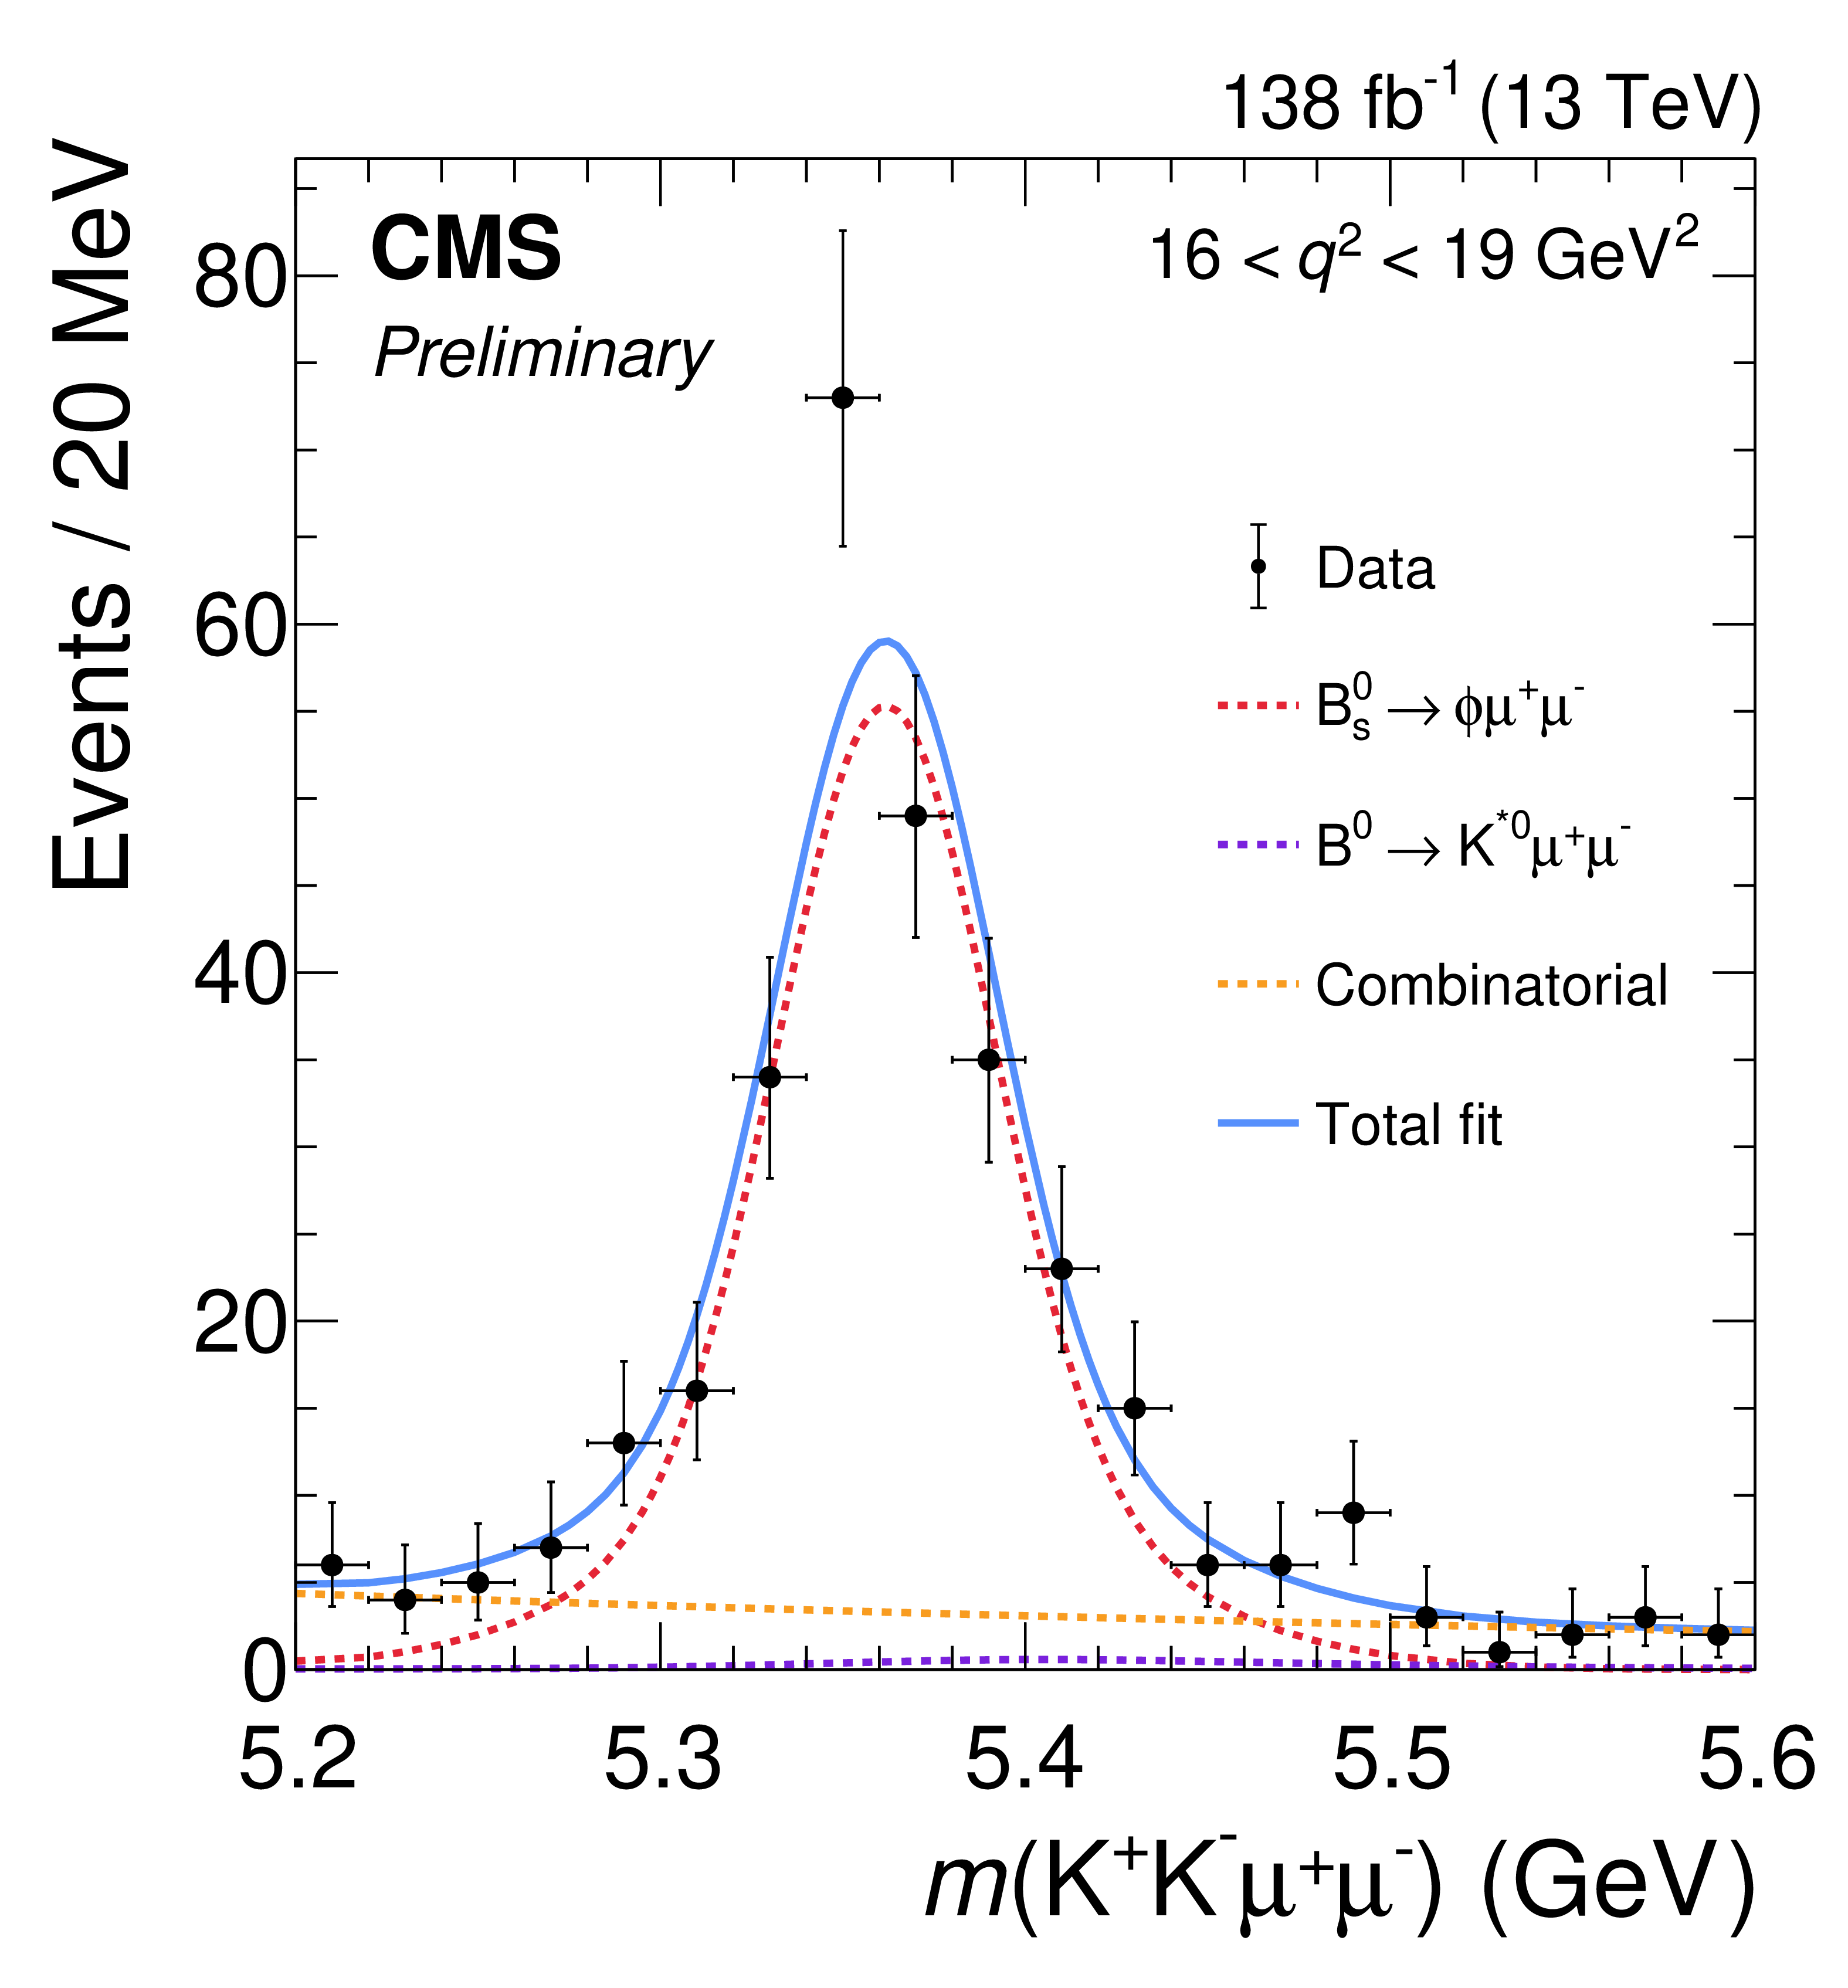
Figure 4:
$ K^{+}K^{-}\mu^{+}\mu^{-} $ invariant mass distributions in different $ q^{2} $ intervals. The results of the total fitted distributions (blue solid line) and their components are overlaid. |
png pdf |
Figure 4-a:
$ K^{+}K^{-}\mu^{+}\mu^{-} $ invariant mass distributions in different $ q^{2} $ intervals. The results of the total fitted distributions (blue solid line) and their components are overlaid. |
png pdf |
Figure 4-b:
$ K^{+}K^{-}\mu^{+}\mu^{-} $ invariant mass distributions in different $ q^{2} $ intervals. The results of the total fitted distributions (blue solid line) and their components are overlaid. |
png pdf |
Figure 4-c:
$ K^{+}K^{-}\mu^{+}\mu^{-} $ invariant mass distributions in different $ q^{2} $ intervals. The results of the total fitted distributions (blue solid line) and their components are overlaid. |
png pdf |
Figure 4-d:
$ K^{+}K^{-}\mu^{+}\mu^{-} $ invariant mass distributions in different $ q^{2} $ intervals. The results of the total fitted distributions (blue solid line) and their components are overlaid. |
png pdf |
Figure 4-e:
$ K^{+}K^{-}\mu^{+}\mu^{-} $ invariant mass distributions in different $ q^{2} $ intervals. The results of the total fitted distributions (blue solid line) and their components are overlaid. |
png pdf |
Figure 4-f:
$ K^{+}K^{-}\mu^{+}\mu^{-} $ invariant mass distributions in different $ q^{2} $ intervals. The results of the total fitted distributions (blue solid line) and their components are overlaid. |
png pdf |
Figure 5:
$ K^{+}K^{-}\mu^{+}\mu^{-} $ invariant mass distributions in different $ q^{2} $ intervals. The results of the total fitted distributions (blue solid line) and their components are overlaid. |
png pdf |
Figure 5-a:
$ K^{+}K^{-}\mu^{+}\mu^{-} $ invariant mass distributions in different $ q^{2} $ intervals. The results of the total fitted distributions (blue solid line) and their components are overlaid. |
png pdf |
Figure 5-b:
$ K^{+}K^{-}\mu^{+}\mu^{-} $ invariant mass distributions in different $ q^{2} $ intervals. The results of the total fitted distributions (blue solid line) and their components are overlaid. |
png pdf |
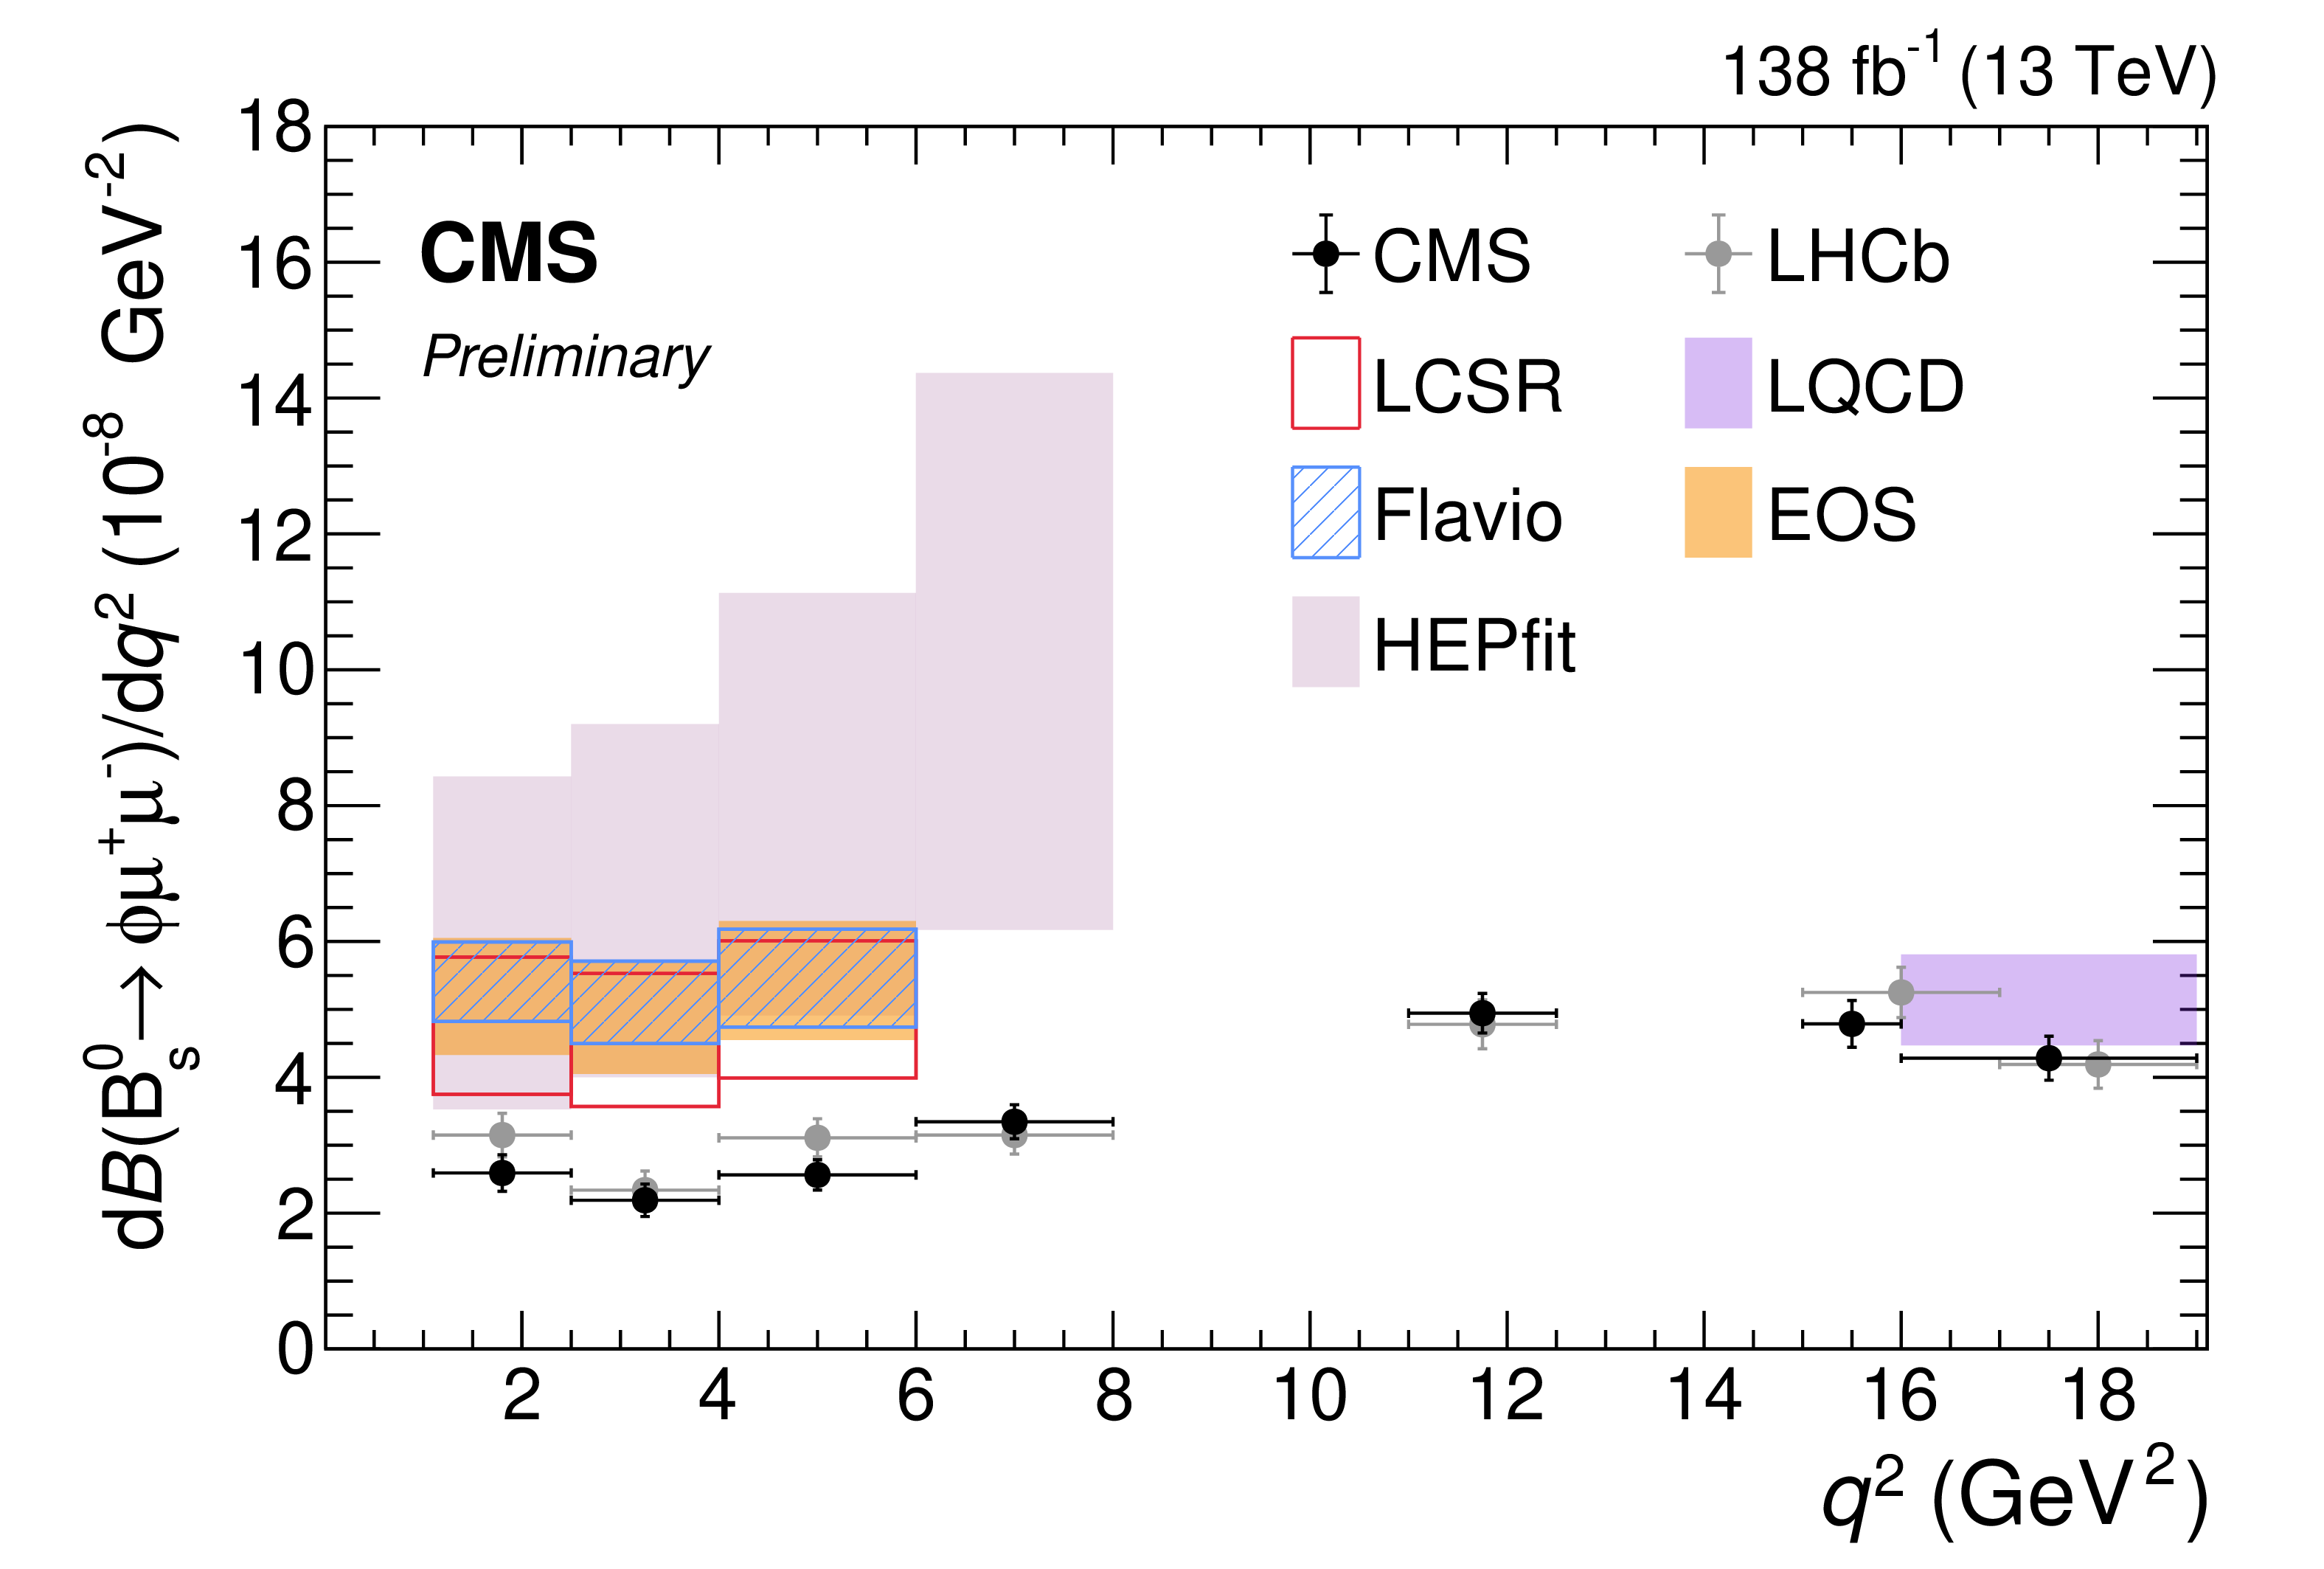
Figure 6:
Measurement of the differential $ \mathrm{B}_{s}^{0}\to \phi\mu^{+}\mu^{-} $ branching fraction as a function of $ q^{2} $. Predictions are shown, averaged in each bin, as obtained using LCSR [5,6] at low-$ q^{2} $ and LQCD calculations [7,8] at high-$ q^{2} $. Predictions from \textttflavio [30], \textttEOS [31,32], and \textttHEPfit [33] are also included. The LHCb results from Ref. [4] are also shown. |
png pdf |
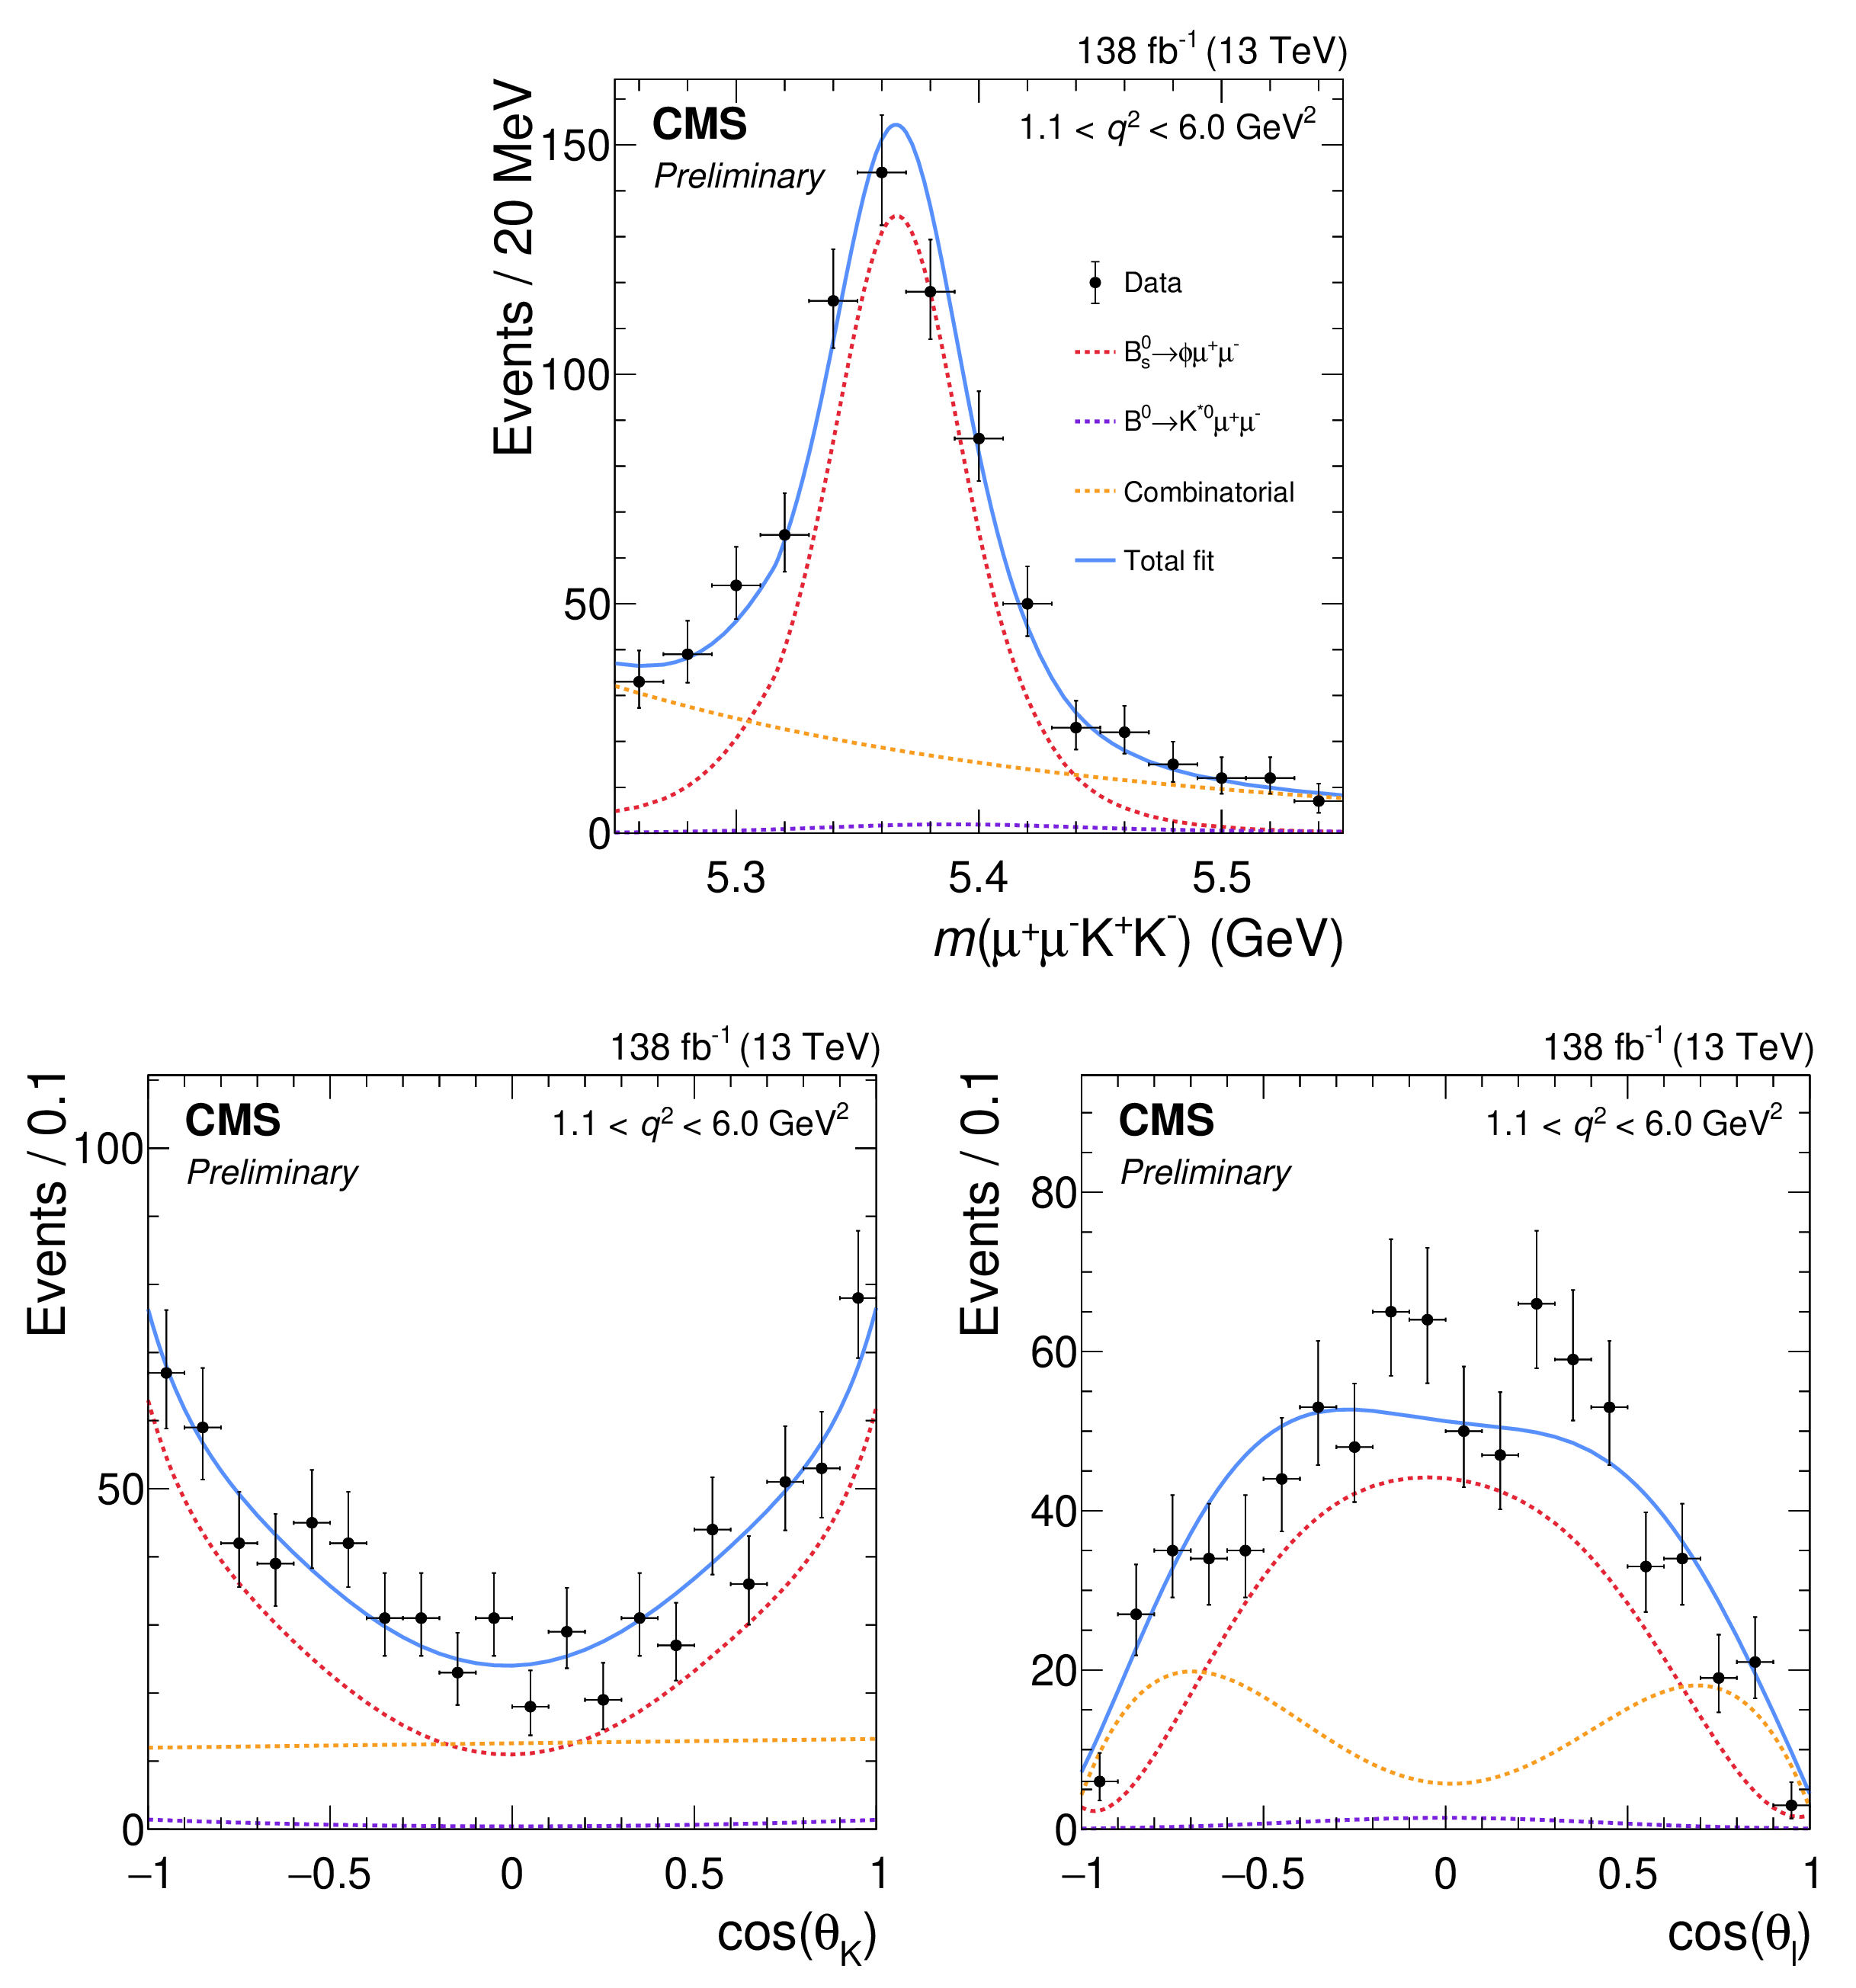
Figure 7:
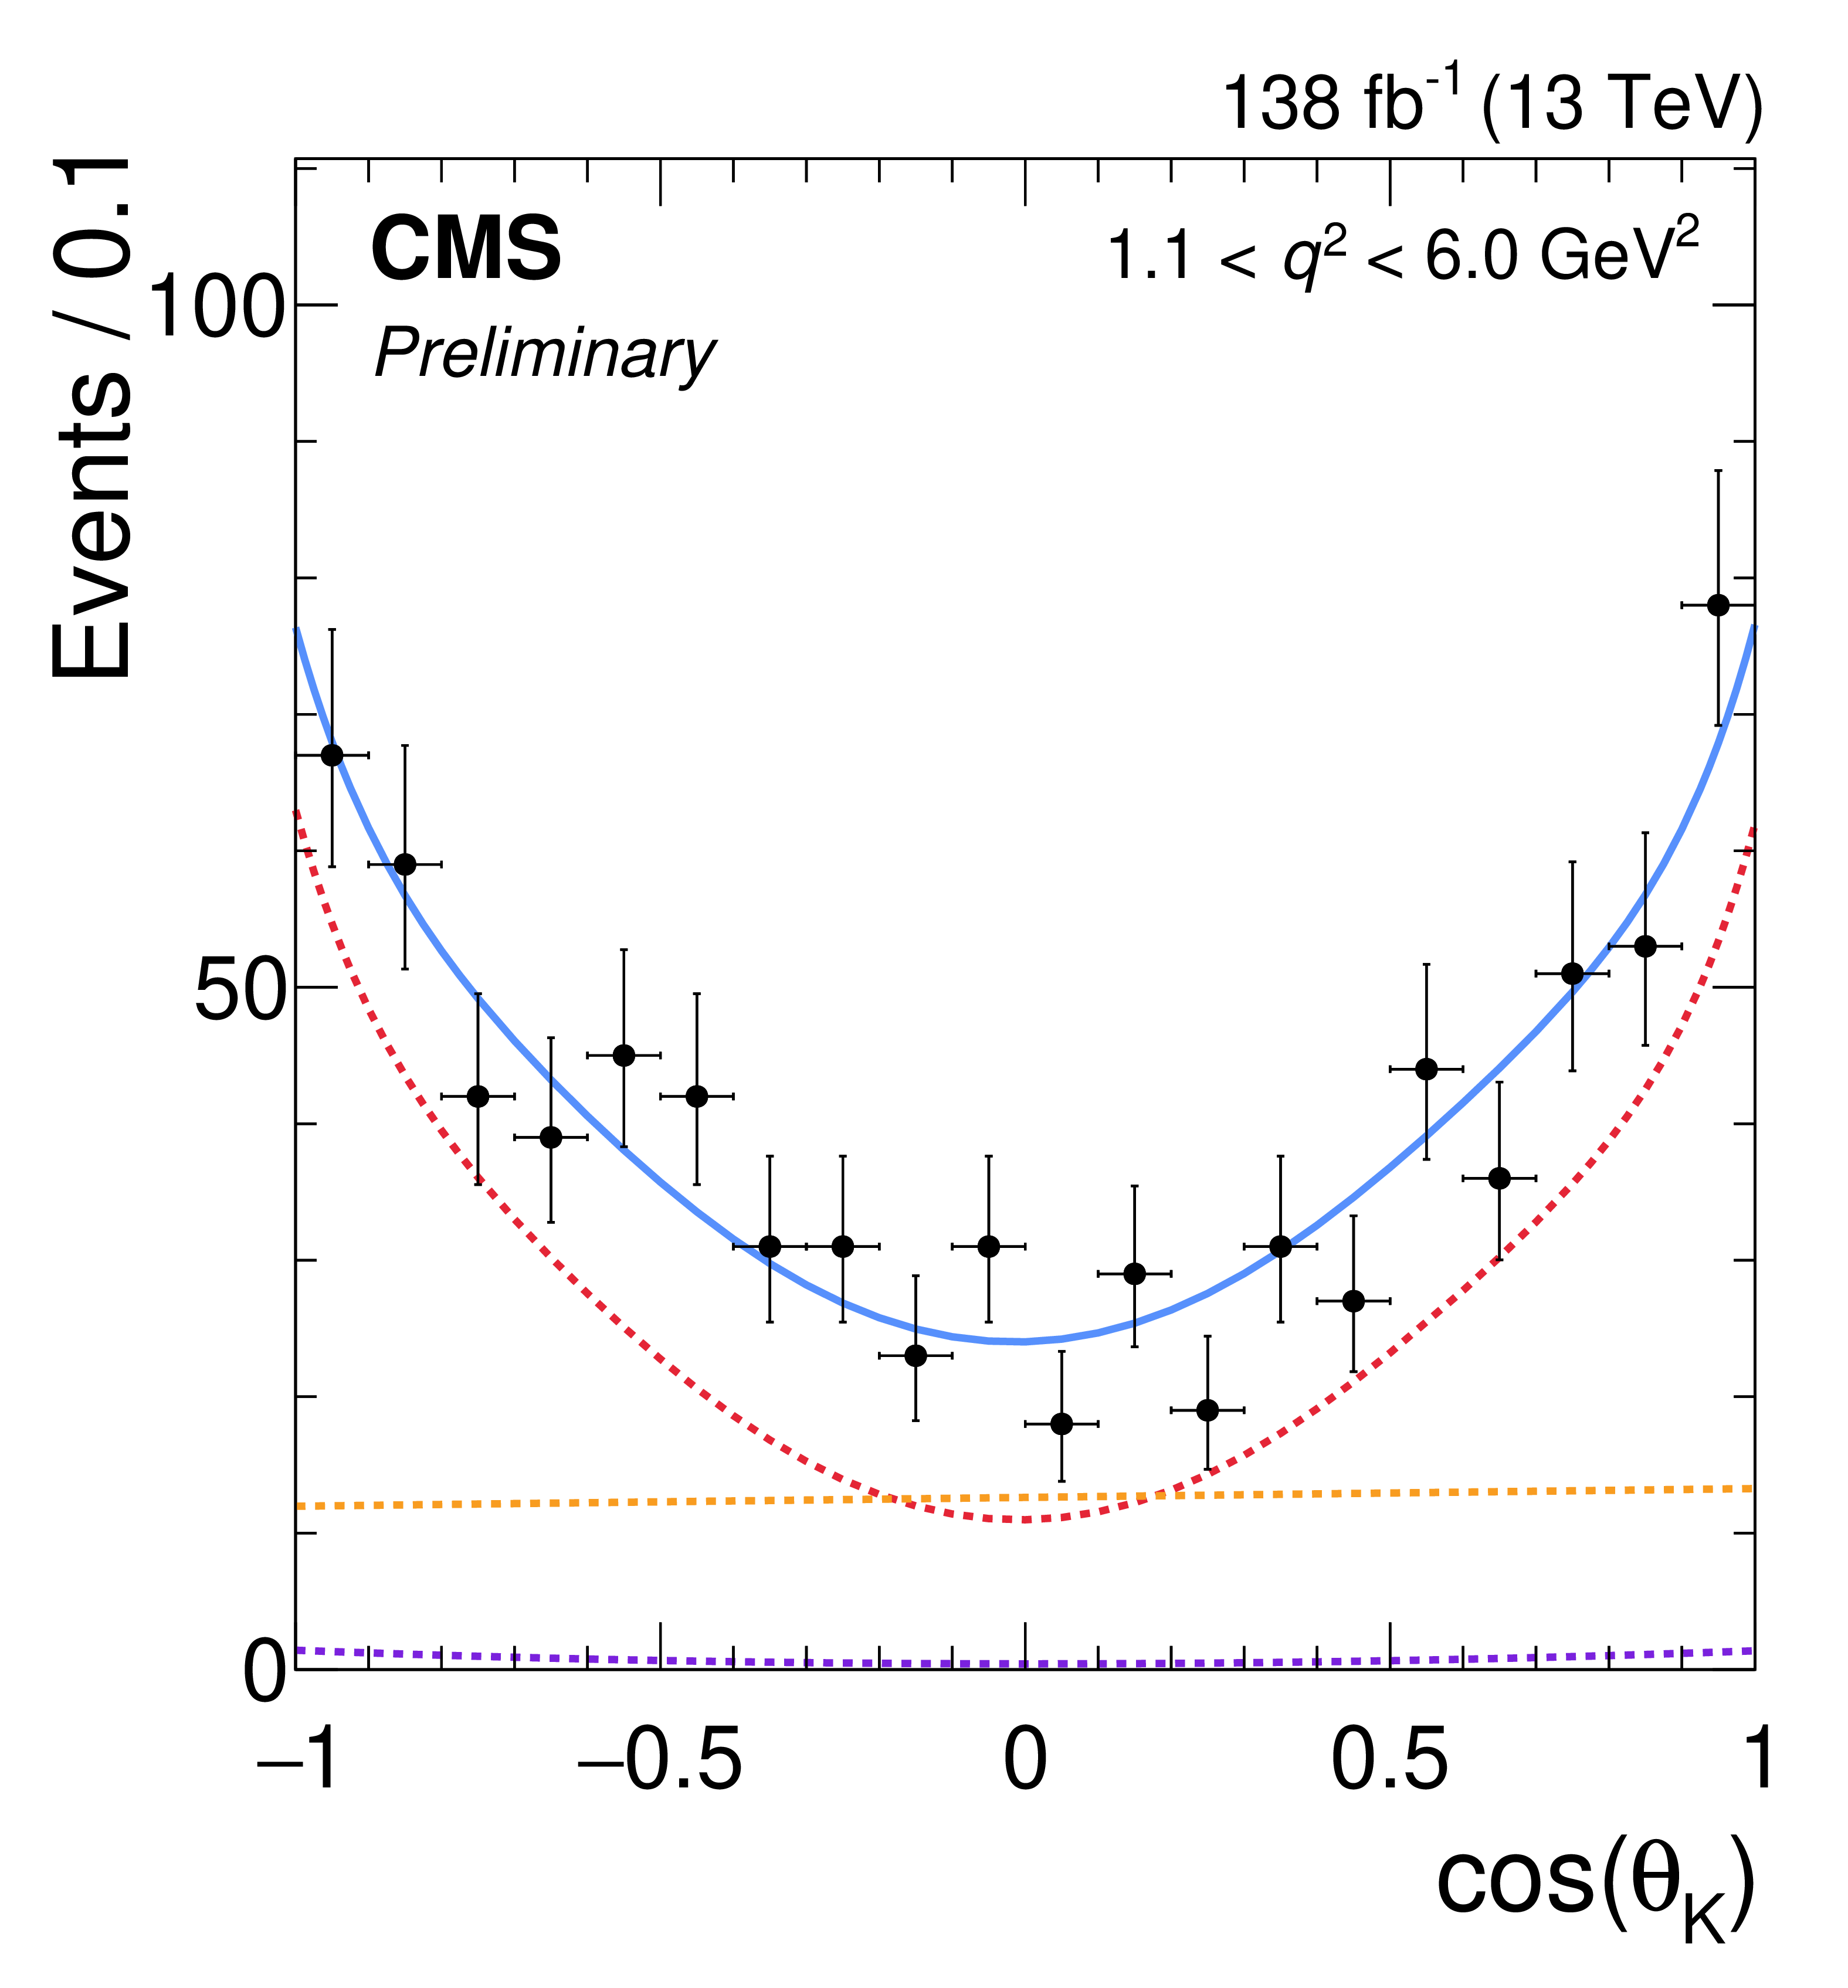
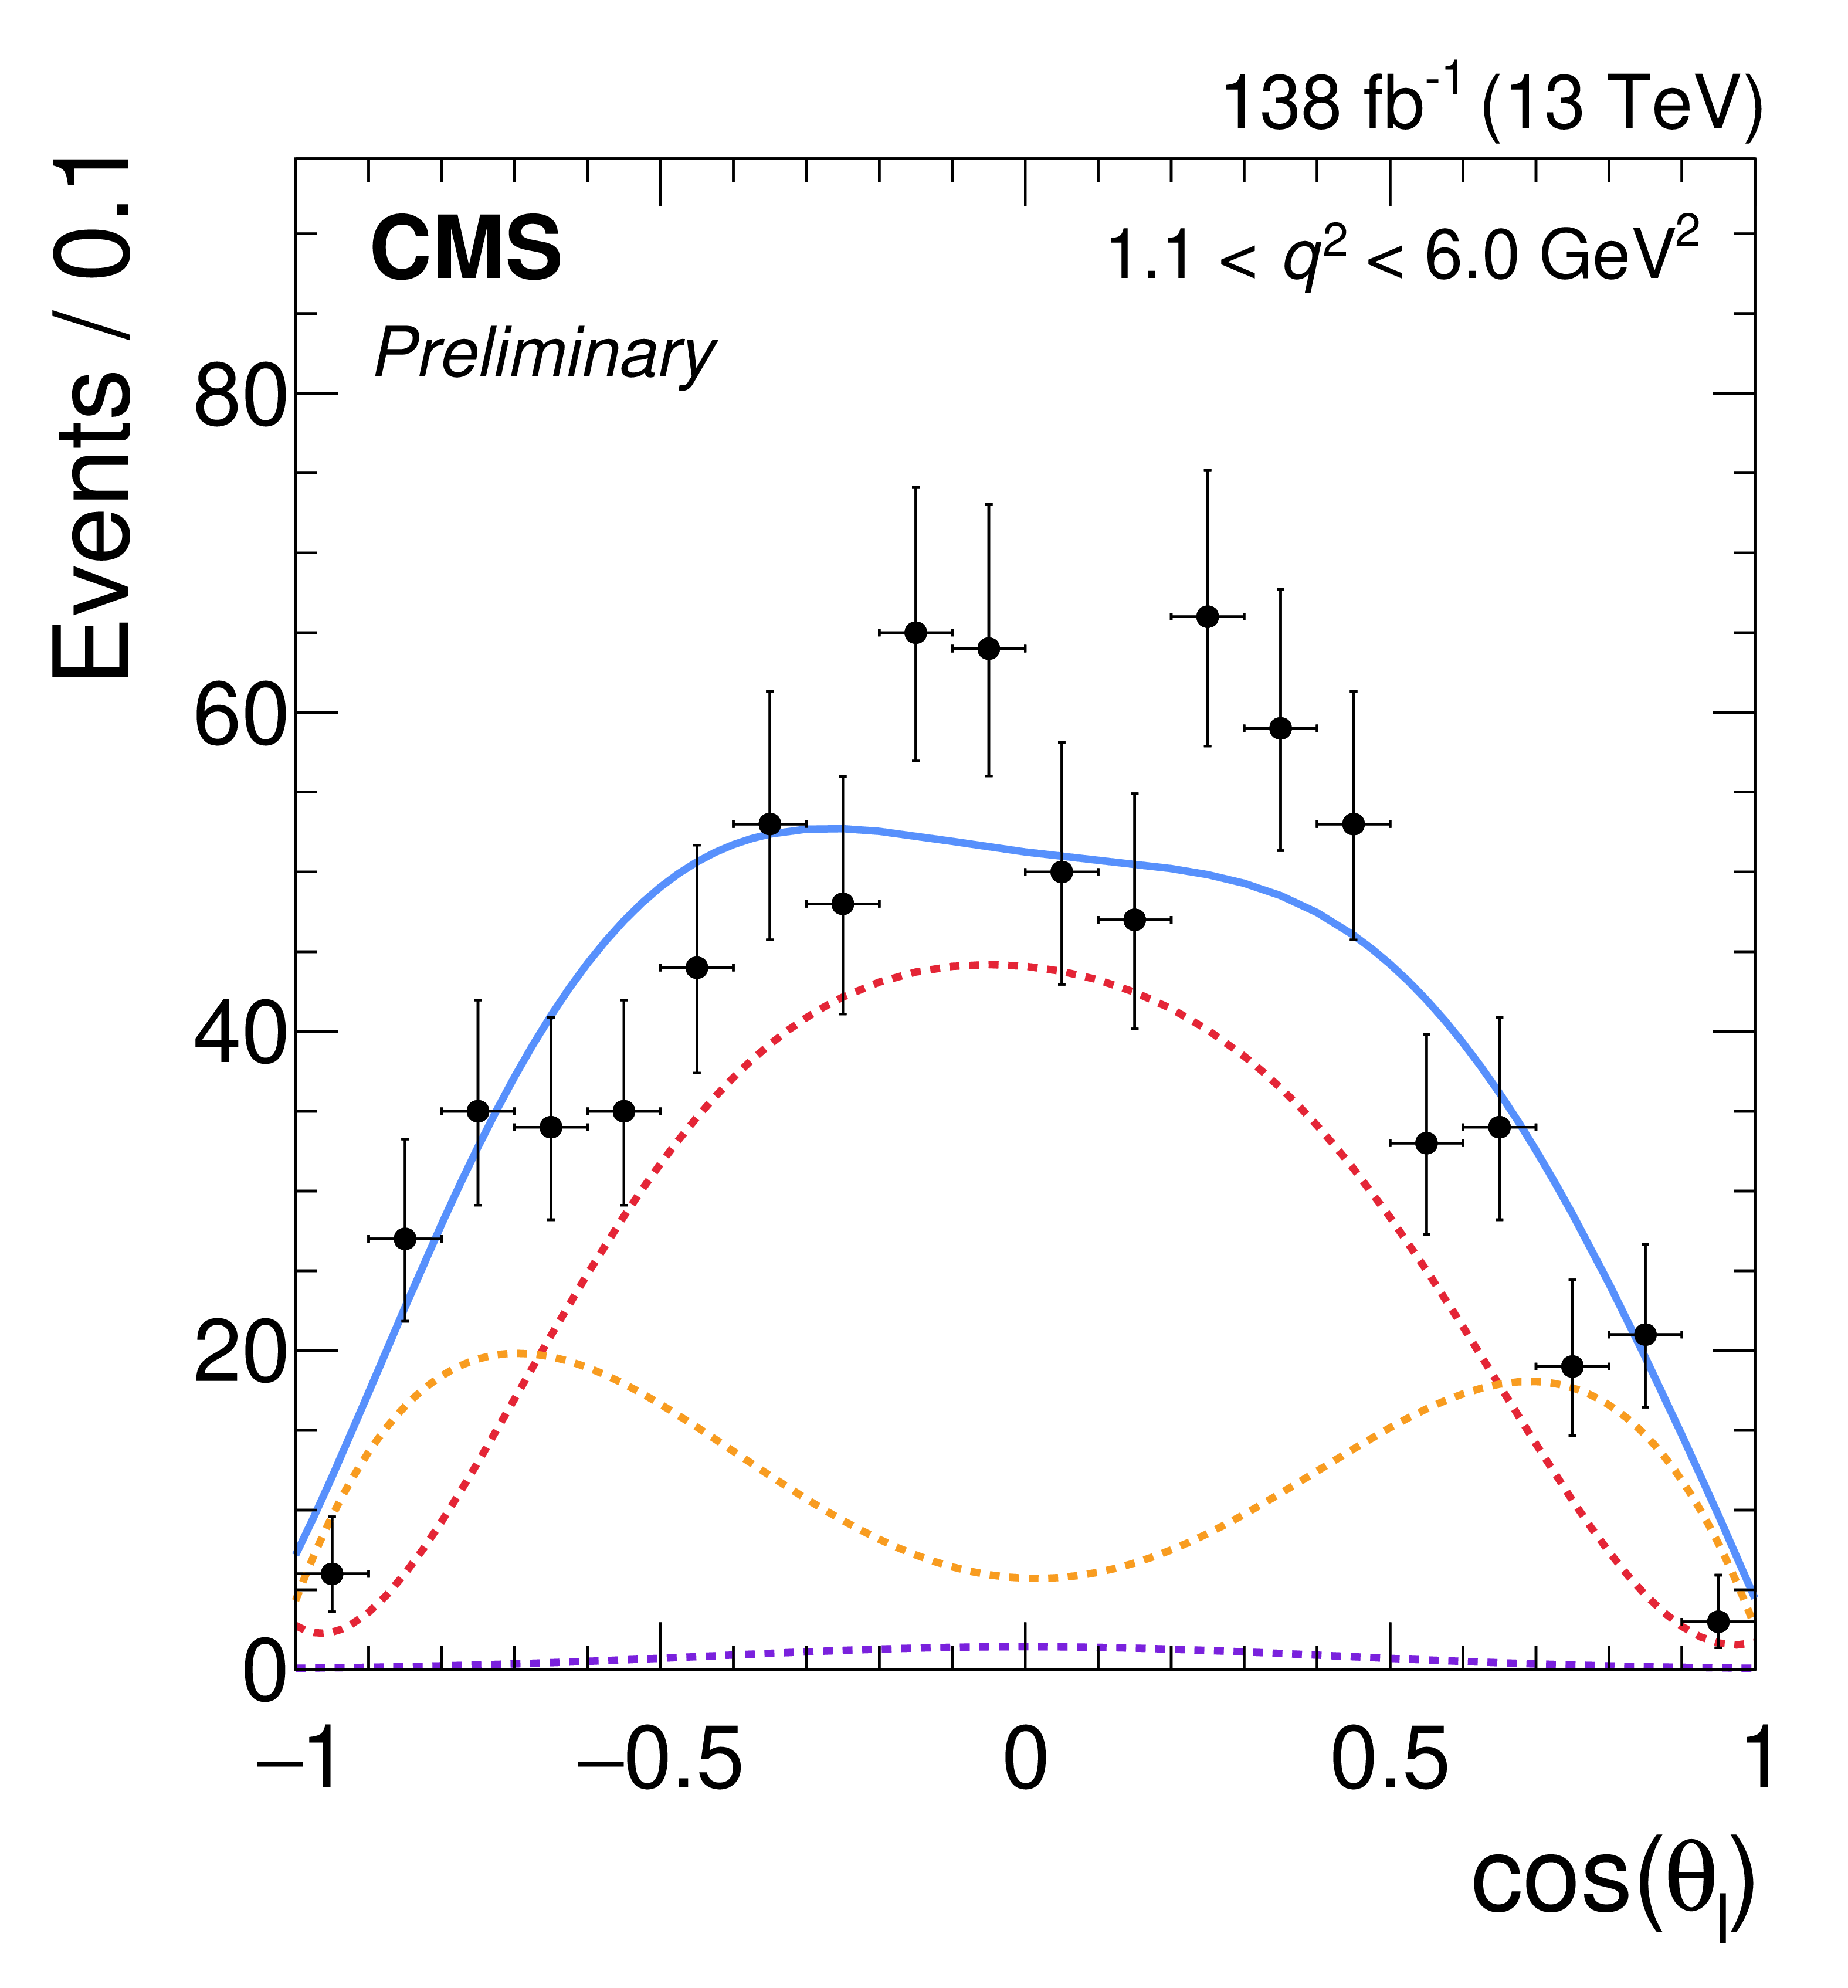
Mass and angular distributions for the $ q^{2} $ bin 1.1--6 $ \text{GeV}^2 $. The projections of the total fitted distribution (blue solid line) and its individual components are overlaid. The signal component is shown by the red dashed line, the combinatorial background by the orange dashed line, and the peaking background by the violet dashed line. |
png pdf |
Figure 7-a:
Mass and angular distributions for the $ q^{2} $ bin 1.1--6 $ \text{GeV}^2 $. The projections of the total fitted distribution (blue solid line) and its individual components are overlaid. The signal component is shown by the red dashed line, the combinatorial background by the orange dashed line, and the peaking background by the violet dashed line. |
png pdf |
Figure 7-b:
Mass and angular distributions for the $ q^{2} $ bin 1.1--6 $ \text{GeV}^2 $. The projections of the total fitted distribution (blue solid line) and its individual components are overlaid. The signal component is shown by the red dashed line, the combinatorial background by the orange dashed line, and the peaking background by the violet dashed line. |
png pdf |
Figure 7-c:
Mass and angular distributions for the $ q^{2} $ bin 1.1--6 $ \text{GeV}^2 $. The projections of the total fitted distribution (blue solid line) and its individual components are overlaid. The signal component is shown by the red dashed line, the combinatorial background by the orange dashed line, and the peaking background by the violet dashed line. |
png pdf |
Figure 8:
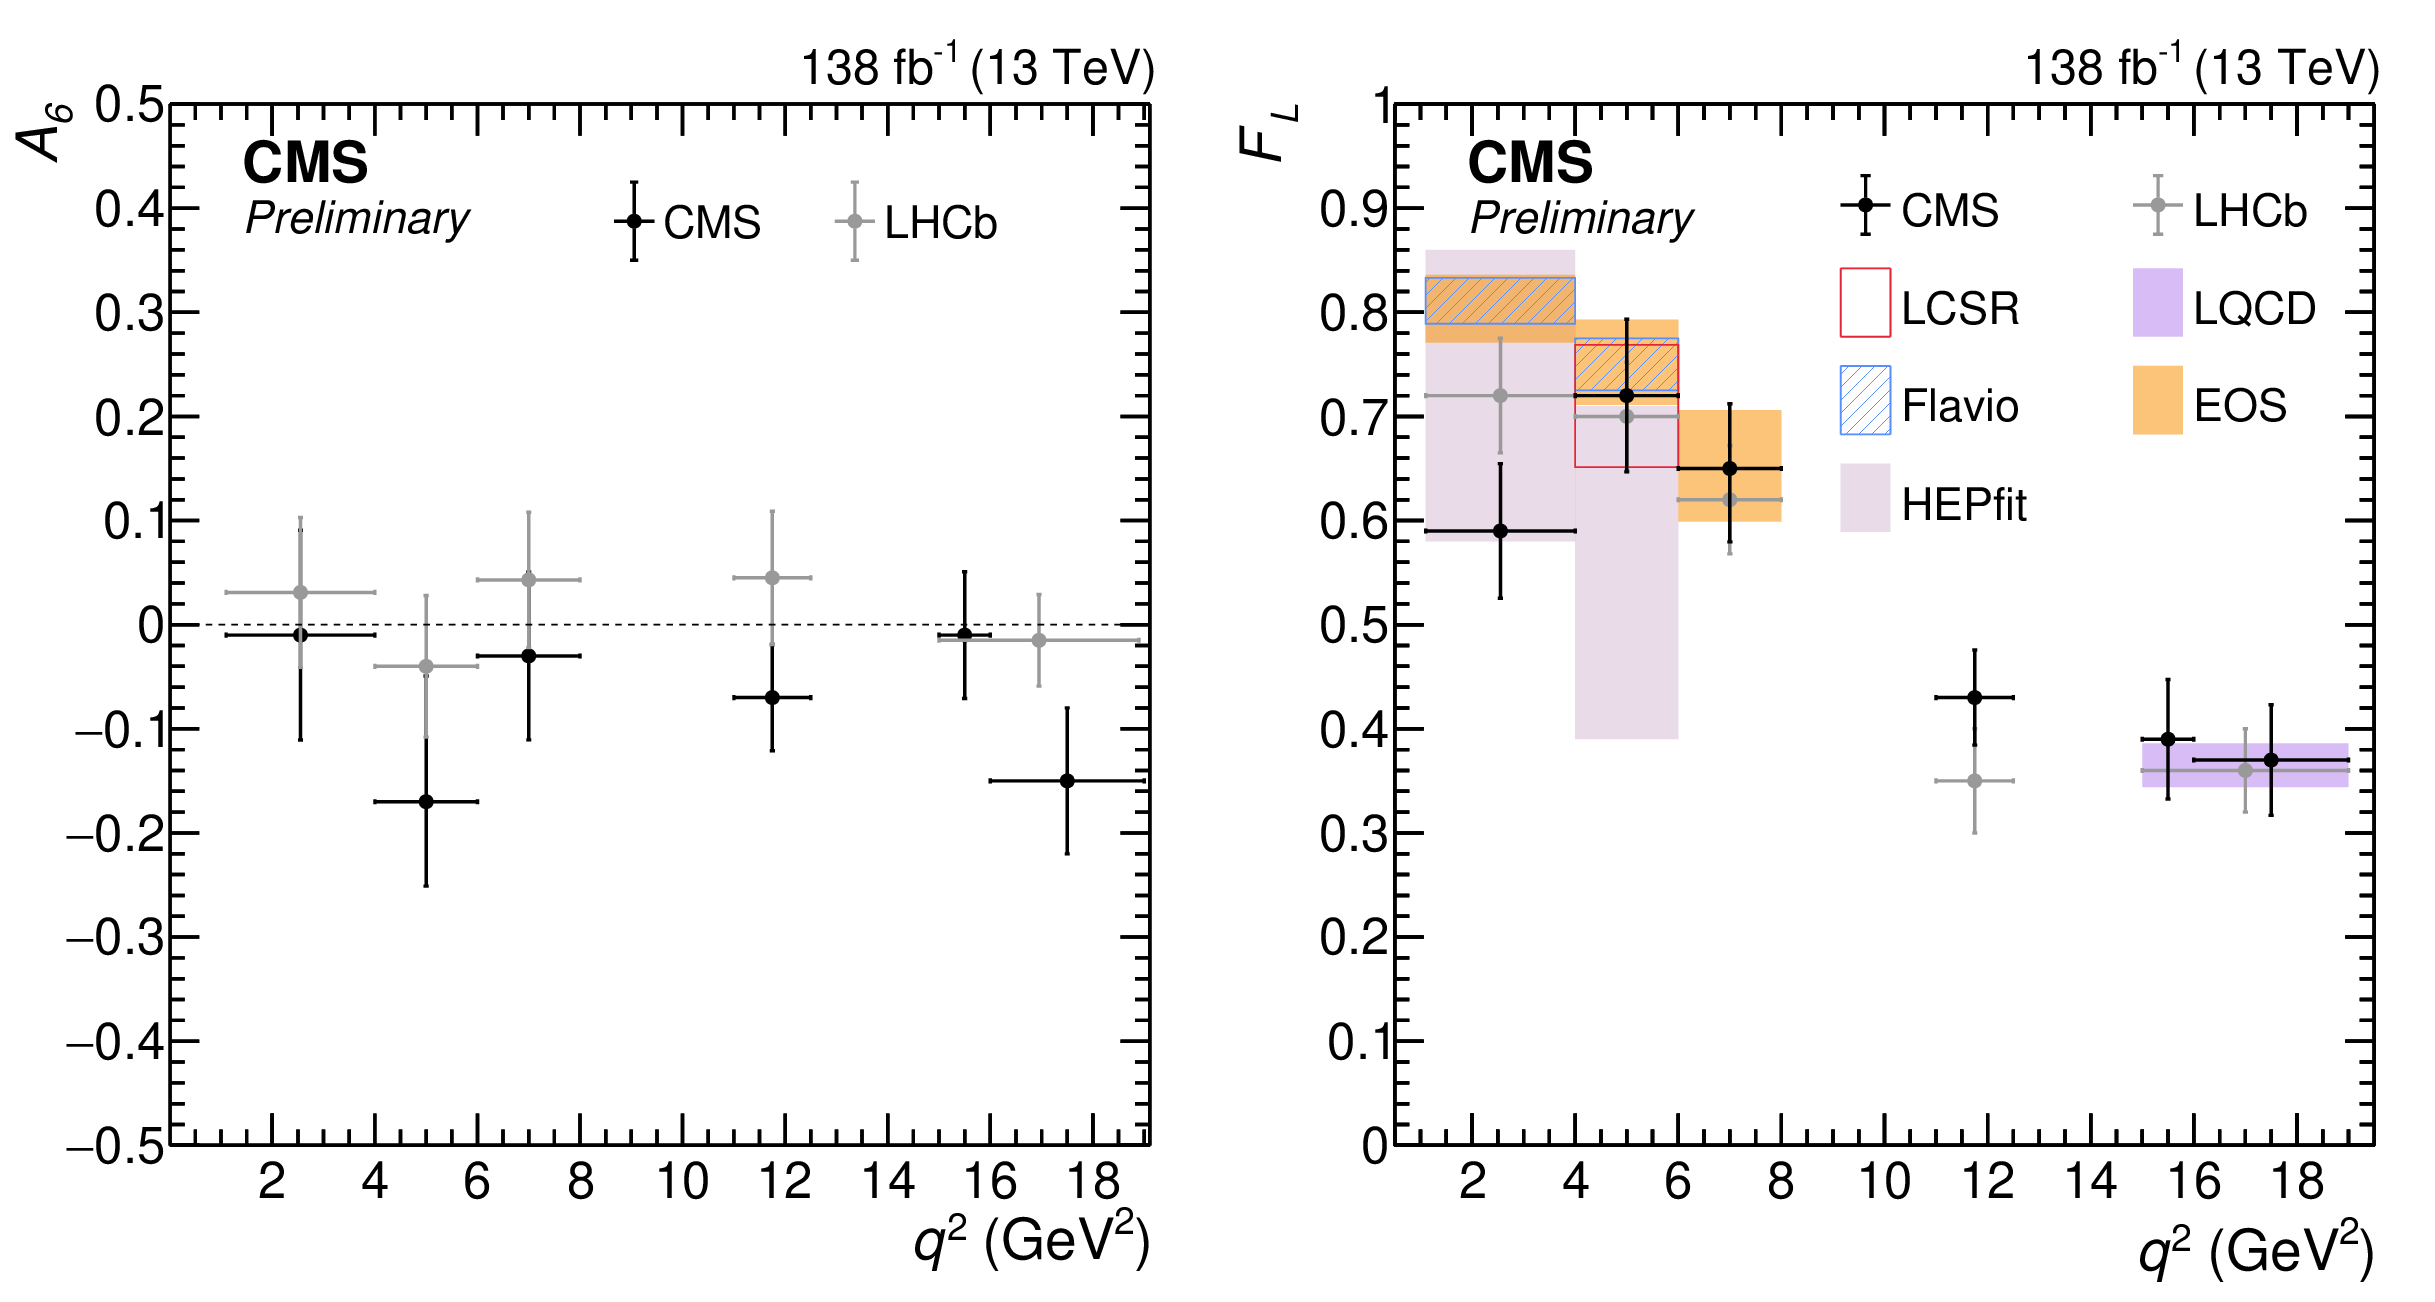
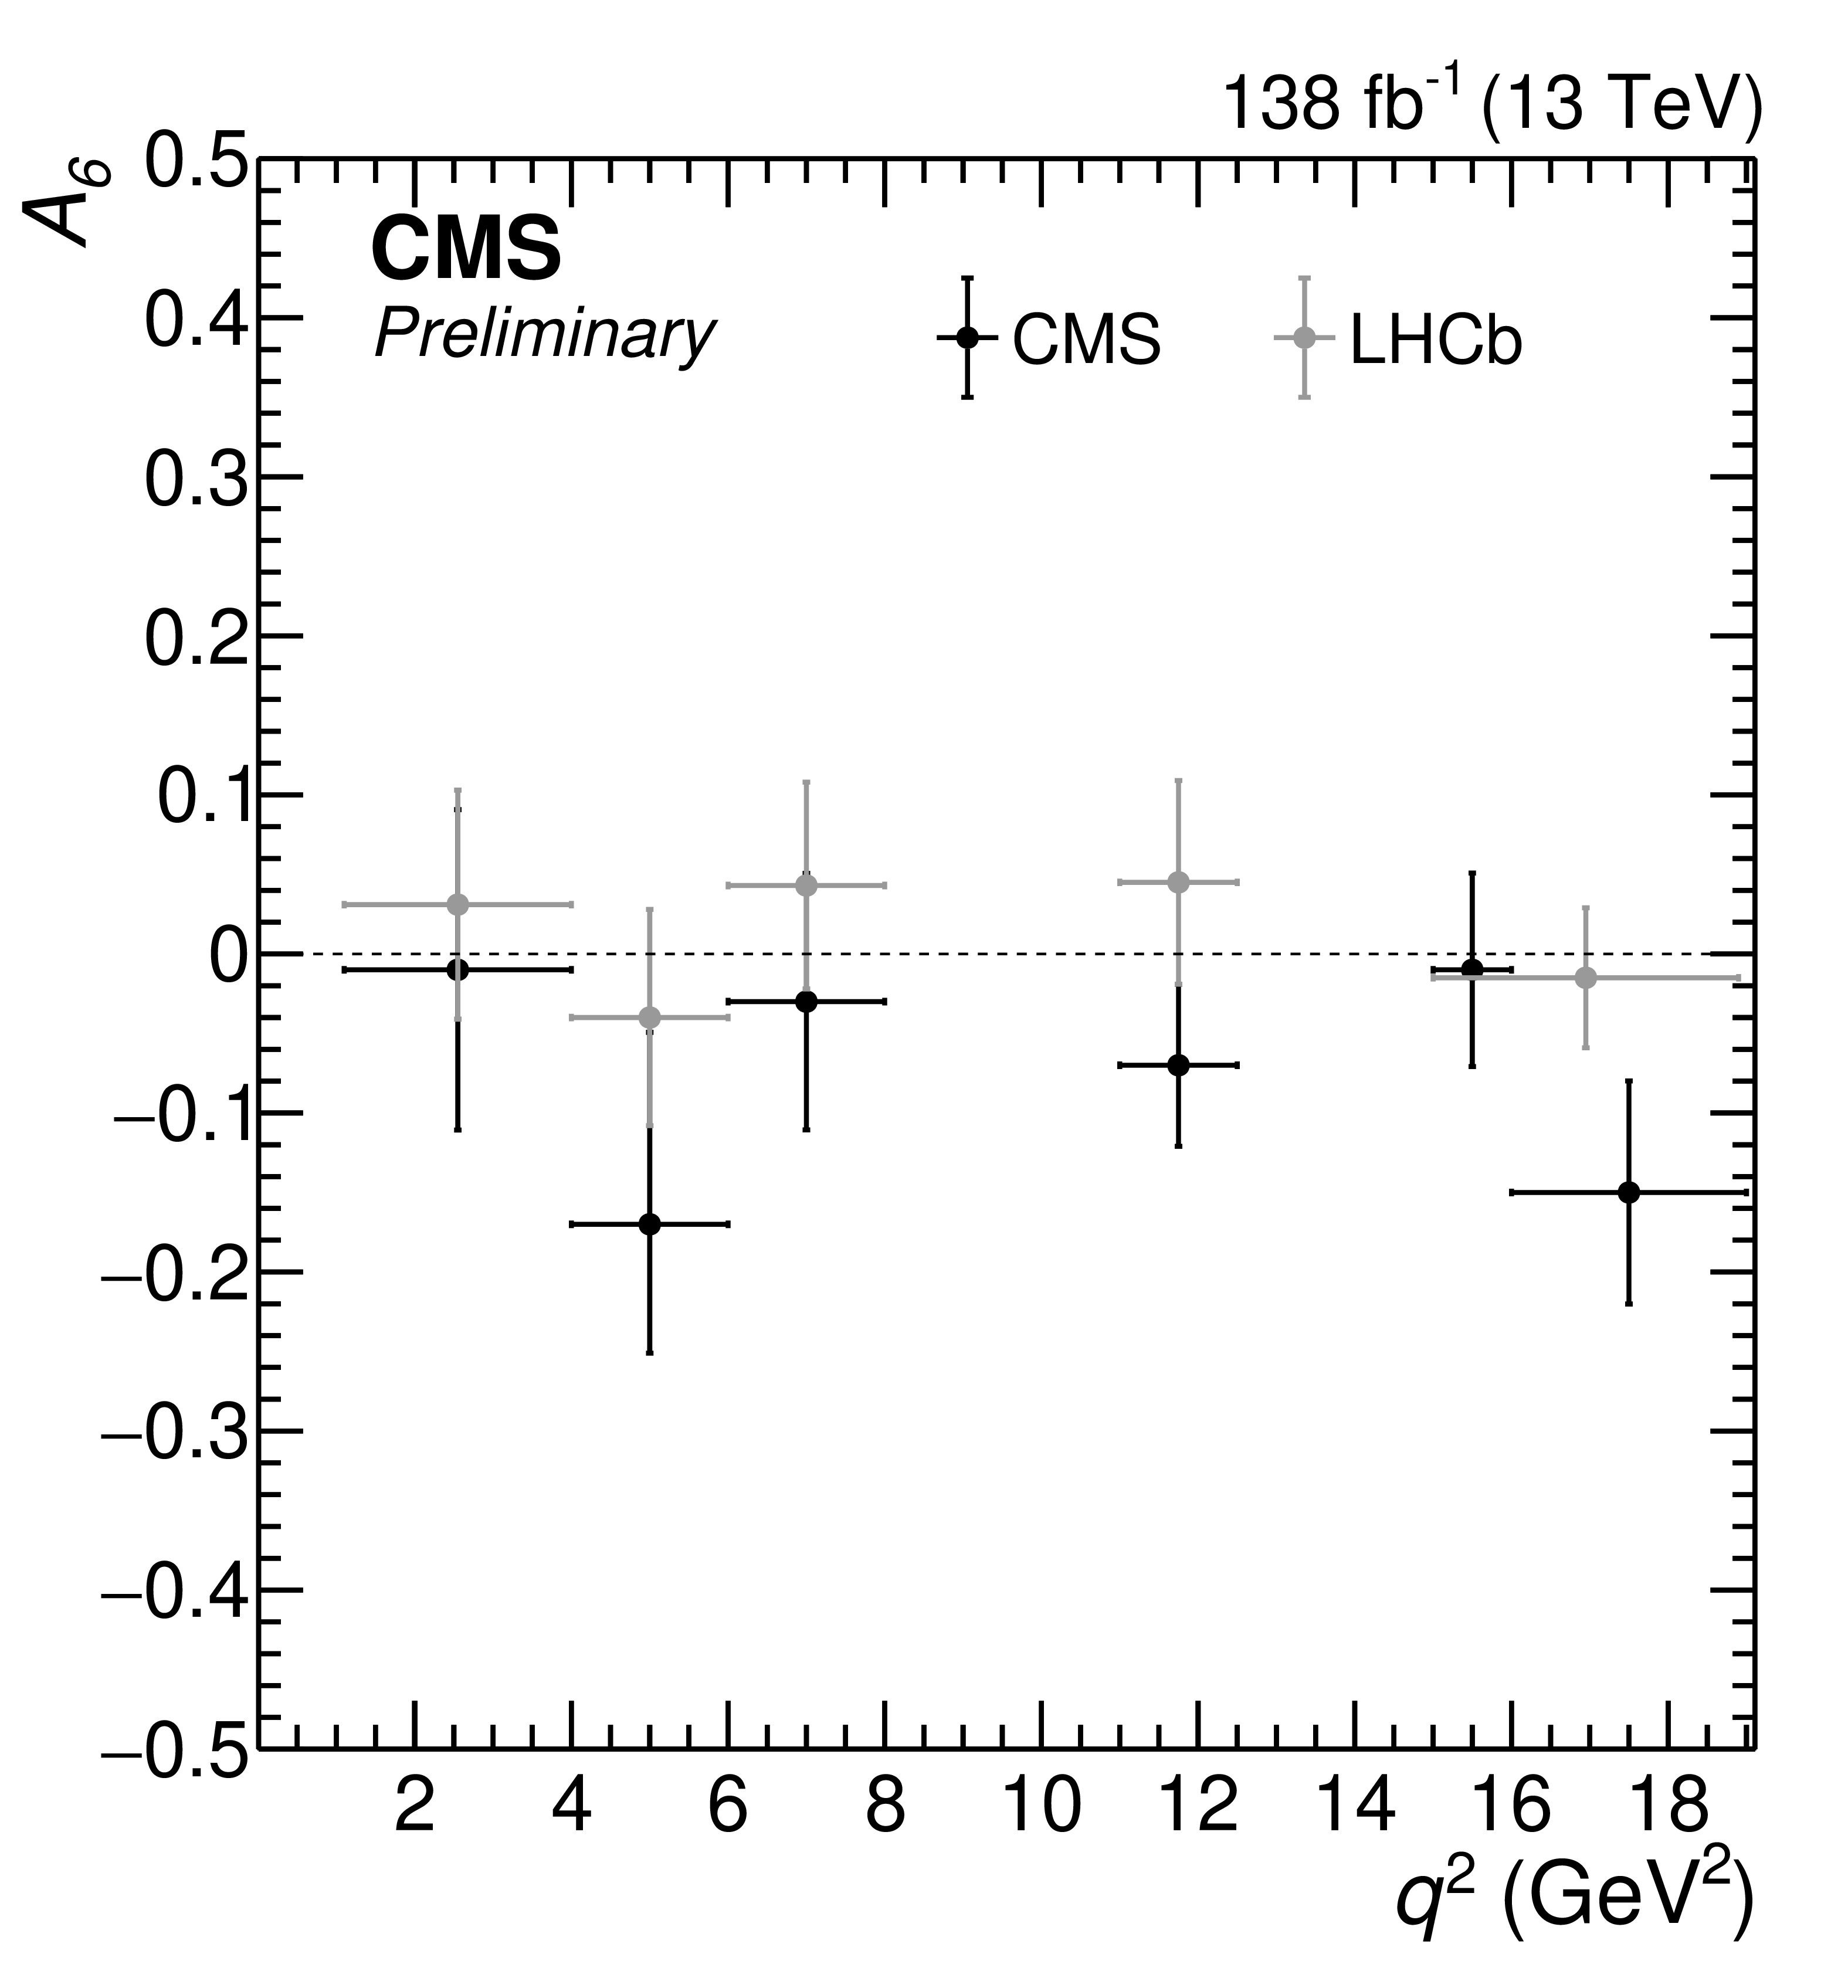
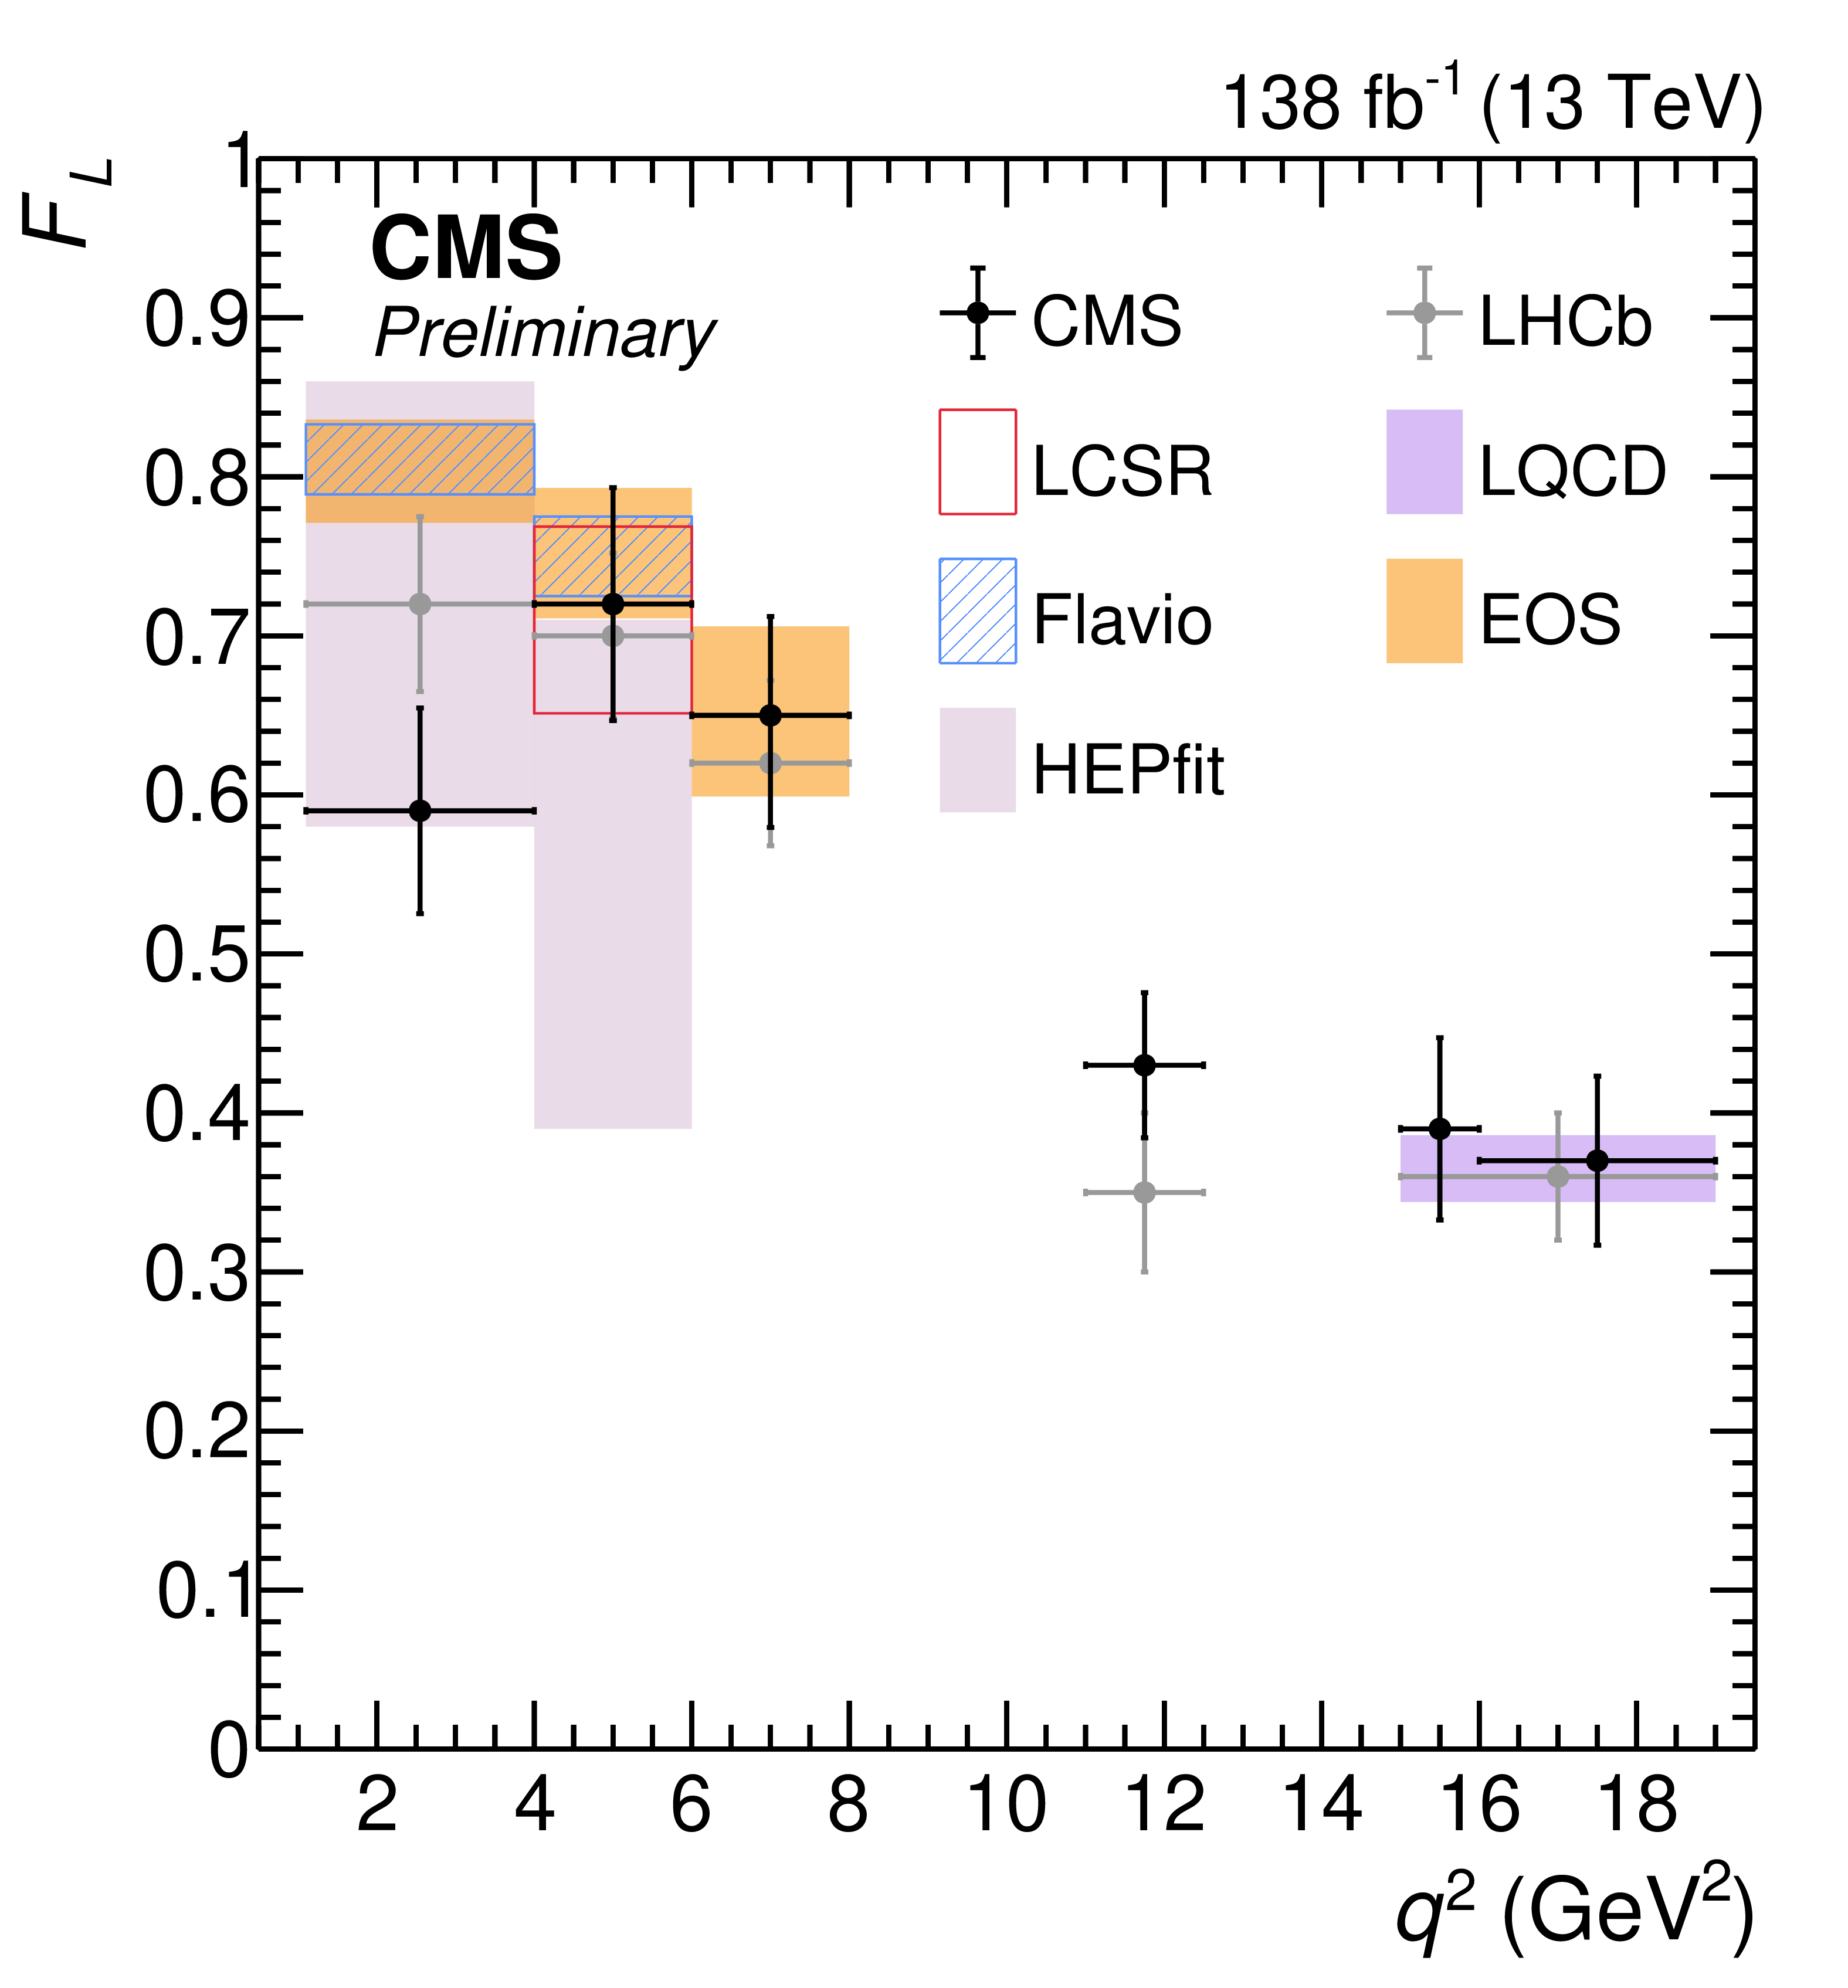
Measurement of the angular observables $ A_{6} $ and $ F_{\mathrm{L}} $ as functions of $ q^{2} $. Previous measurements from LHCb [3] are shown, together with theoretical predictions from LCSR calculations [5,6], LQCD calculations [7,8], and the frameworks \textttflavio [30], \textttEOS [31,32], and \textttHEPfit [33]. |
png pdf |
Figure 8-a:
Measurement of the angular observables $ A_{6} $ and $ F_{\mathrm{L}} $ as functions of $ q^{2} $. Previous measurements from LHCb [3] are shown, together with theoretical predictions from LCSR calculations [5,6], LQCD calculations [7,8], and the frameworks \textttflavio [30], \textttEOS [31,32], and \textttHEPfit [33]. |
png pdf |
Figure 8-b:
Measurement of the angular observables $ A_{6} $ and $ F_{\mathrm{L}} $ as functions of $ q^{2} $. Previous measurements from LHCb [3] are shown, together with theoretical predictions from LCSR calculations [5,6], LQCD calculations [7,8], and the frameworks \textttflavio [30], \textttEOS [31,32], and \textttHEPfit [33]. |
| Tables | |
png pdf |
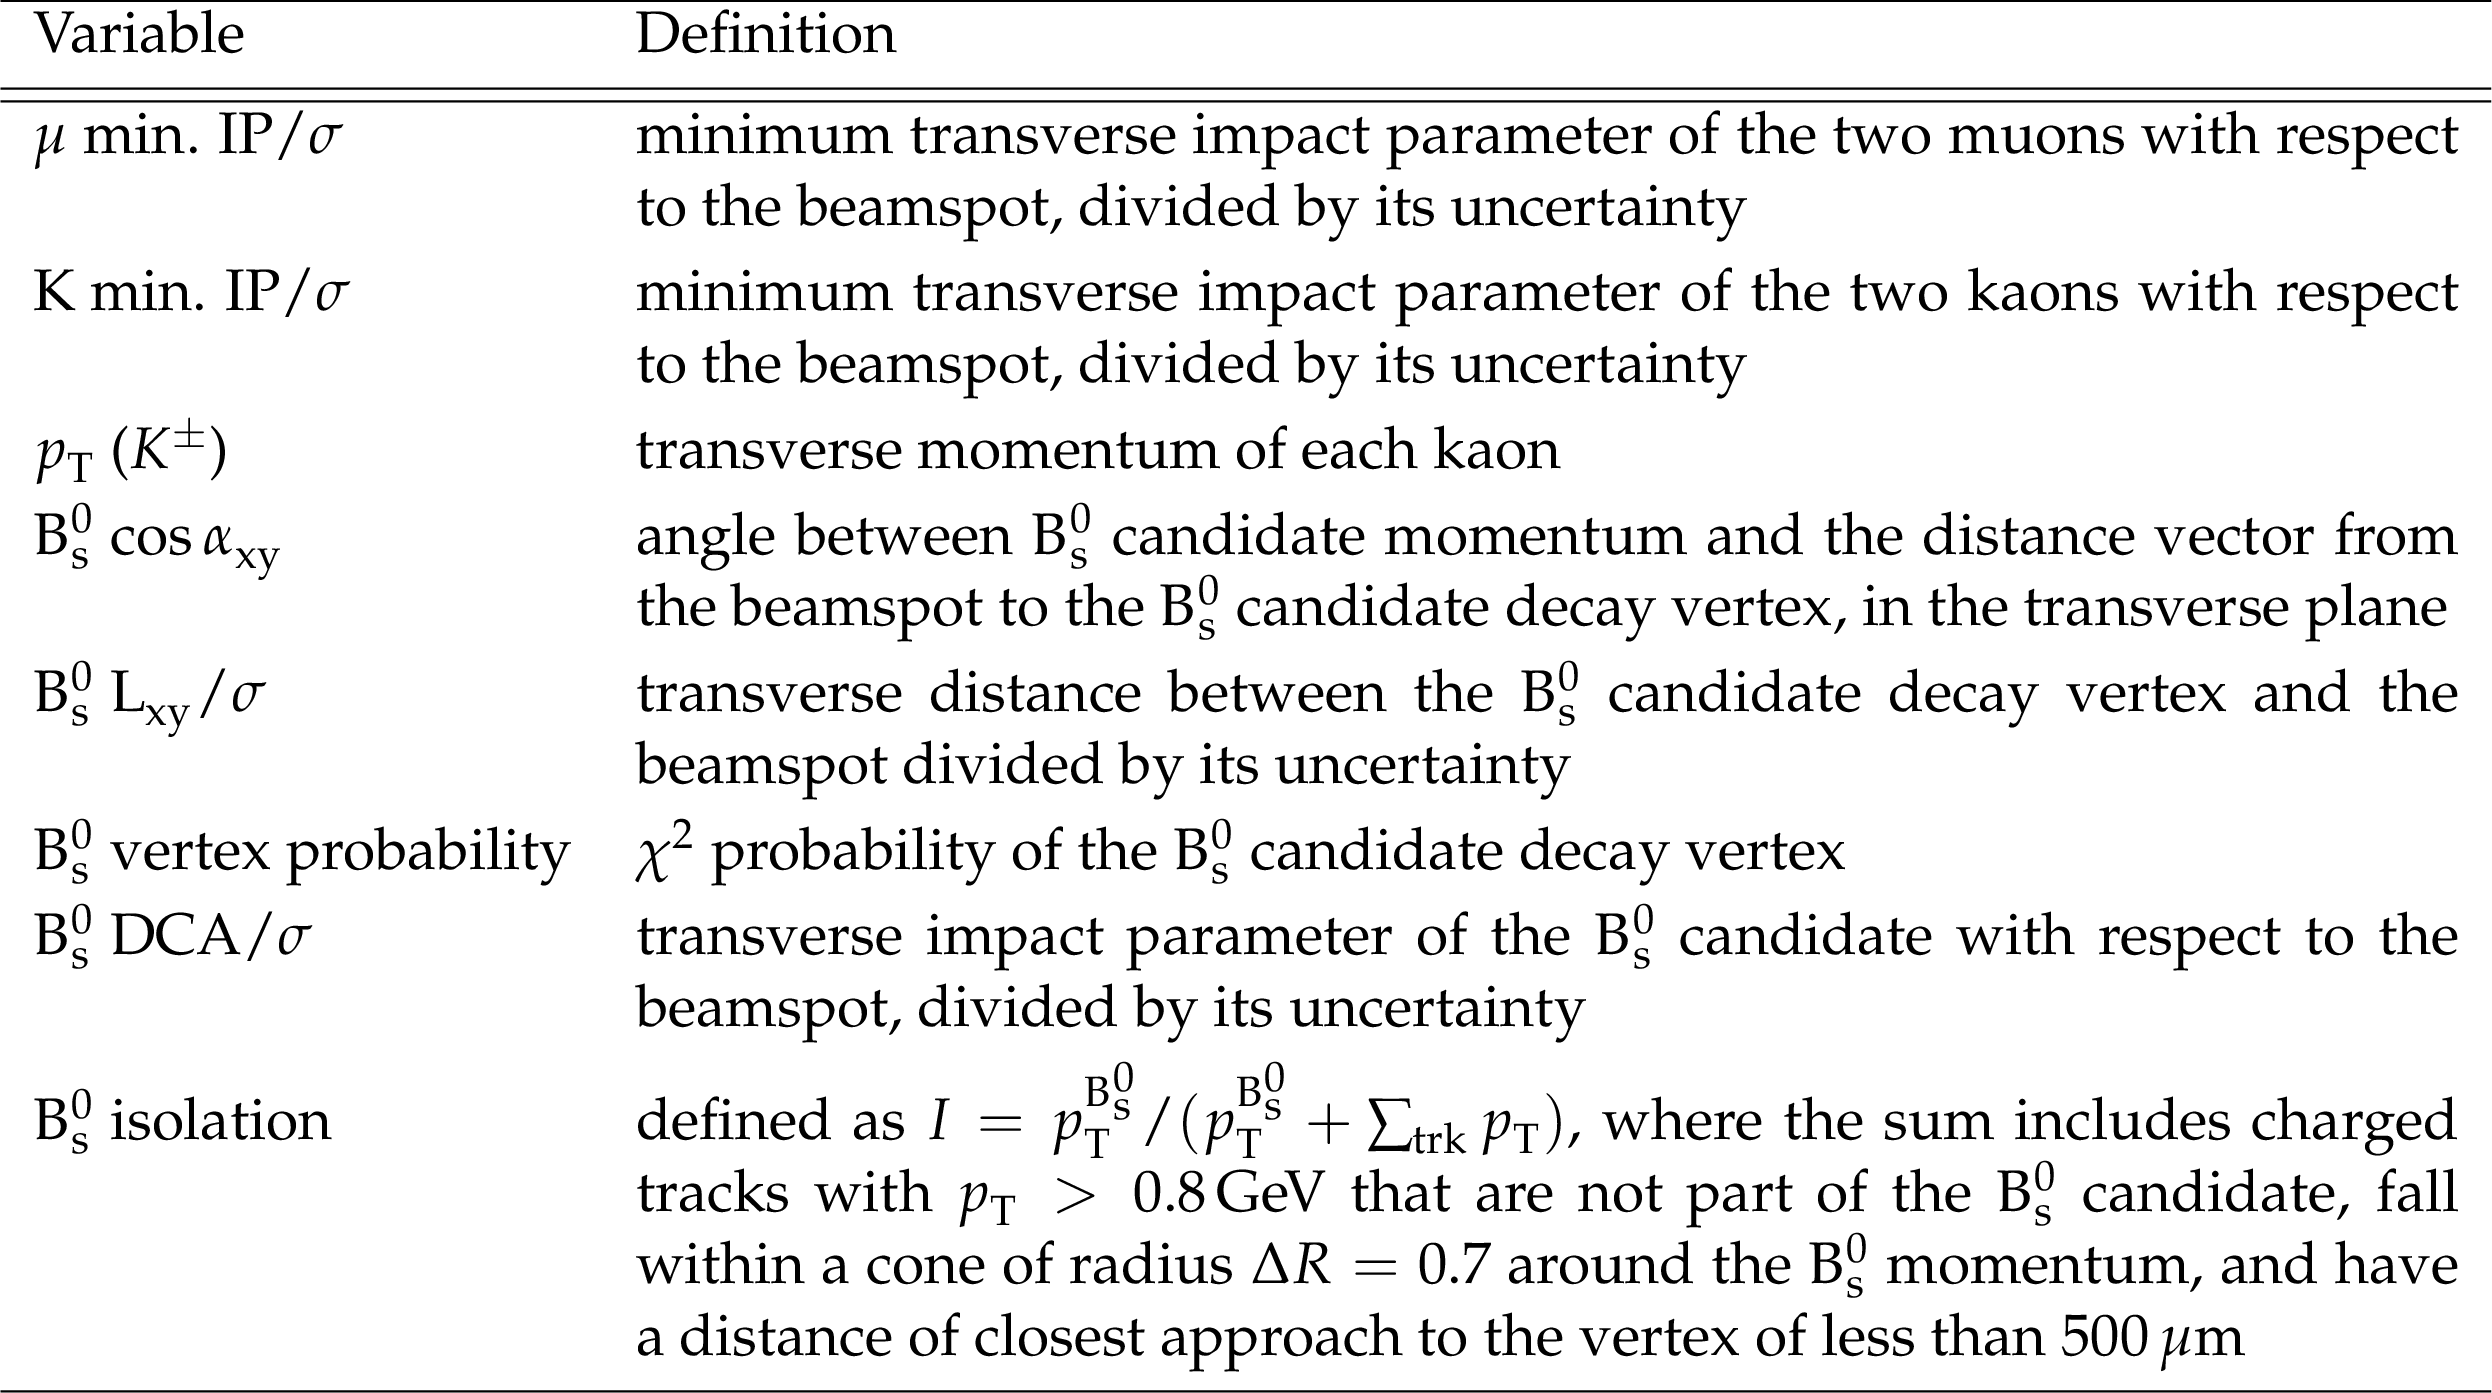
Table 1:
Description of the input variables used to train the BDT discriminator for combinatorial background suppression. |
png pdf |
Table 2:
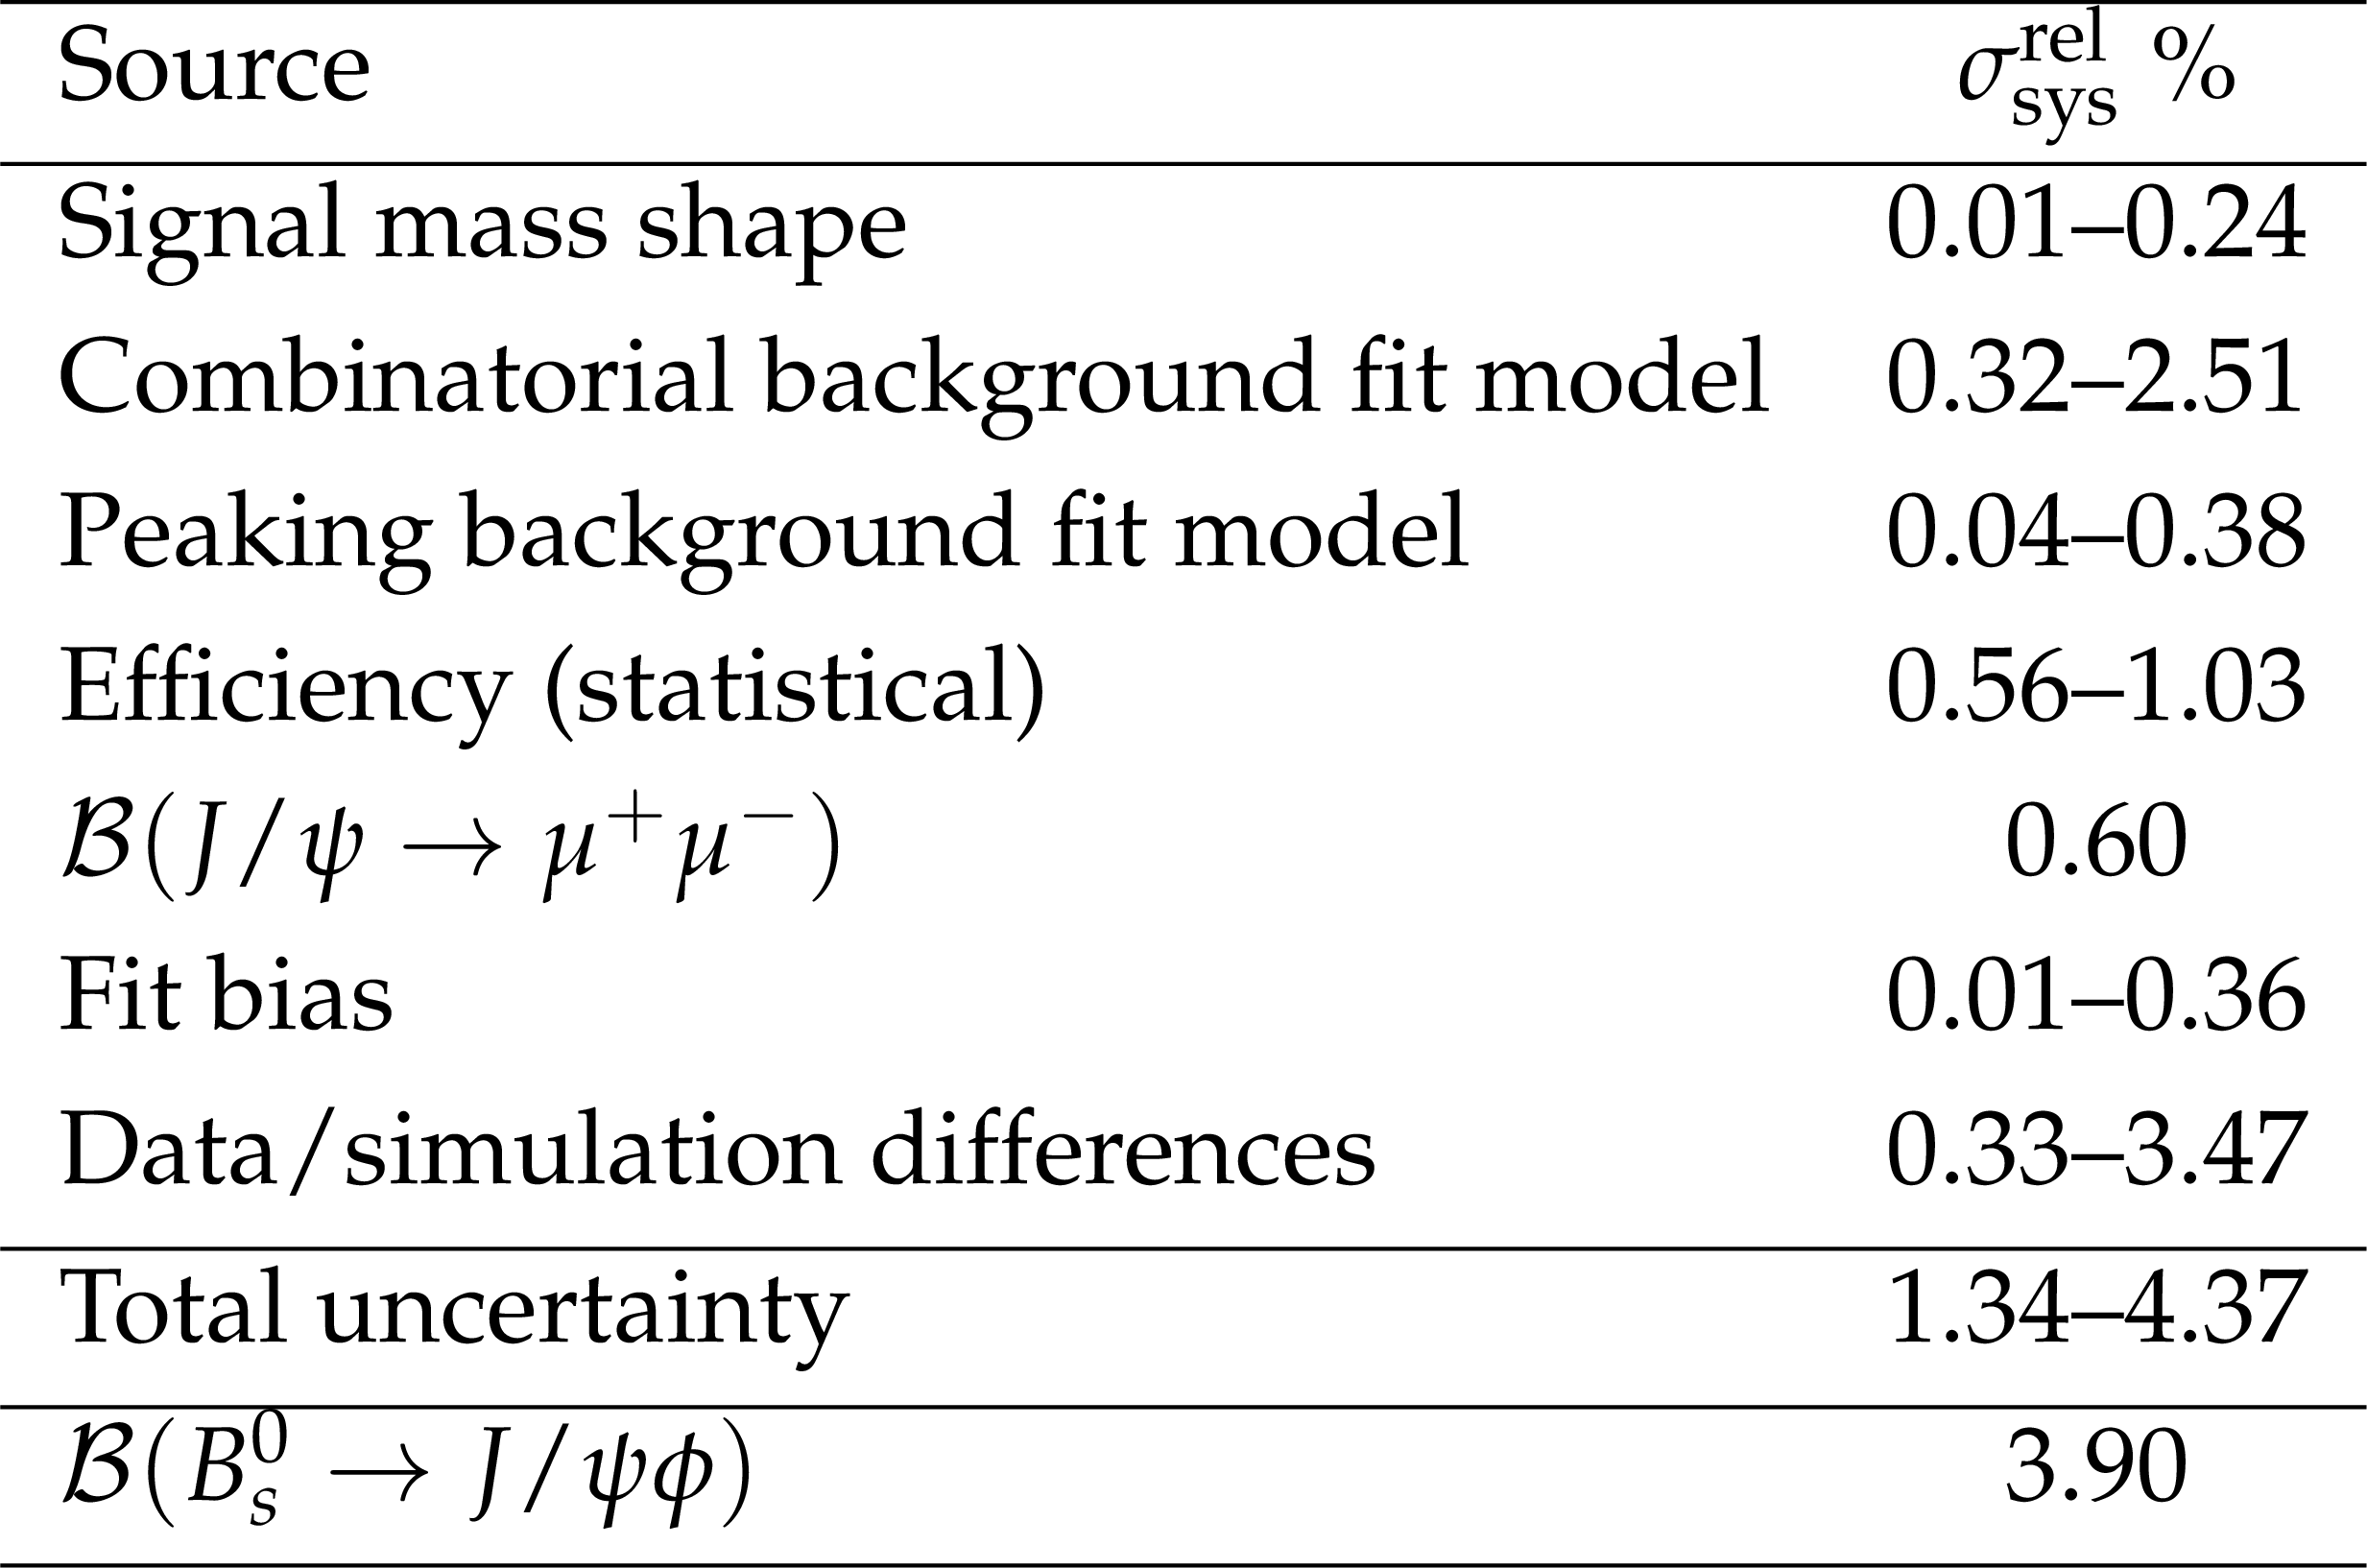
Summary of the sources of systematic uncertainty on $ d\mathcal{B}(\mathrm{B}_{s}^{0}\to \phi\mu^{+}\mu^{-})/dq^{2} $. The range indicates the minimum and maximum variations observed across the different $ q^{2} $ intervals. |
png pdf |
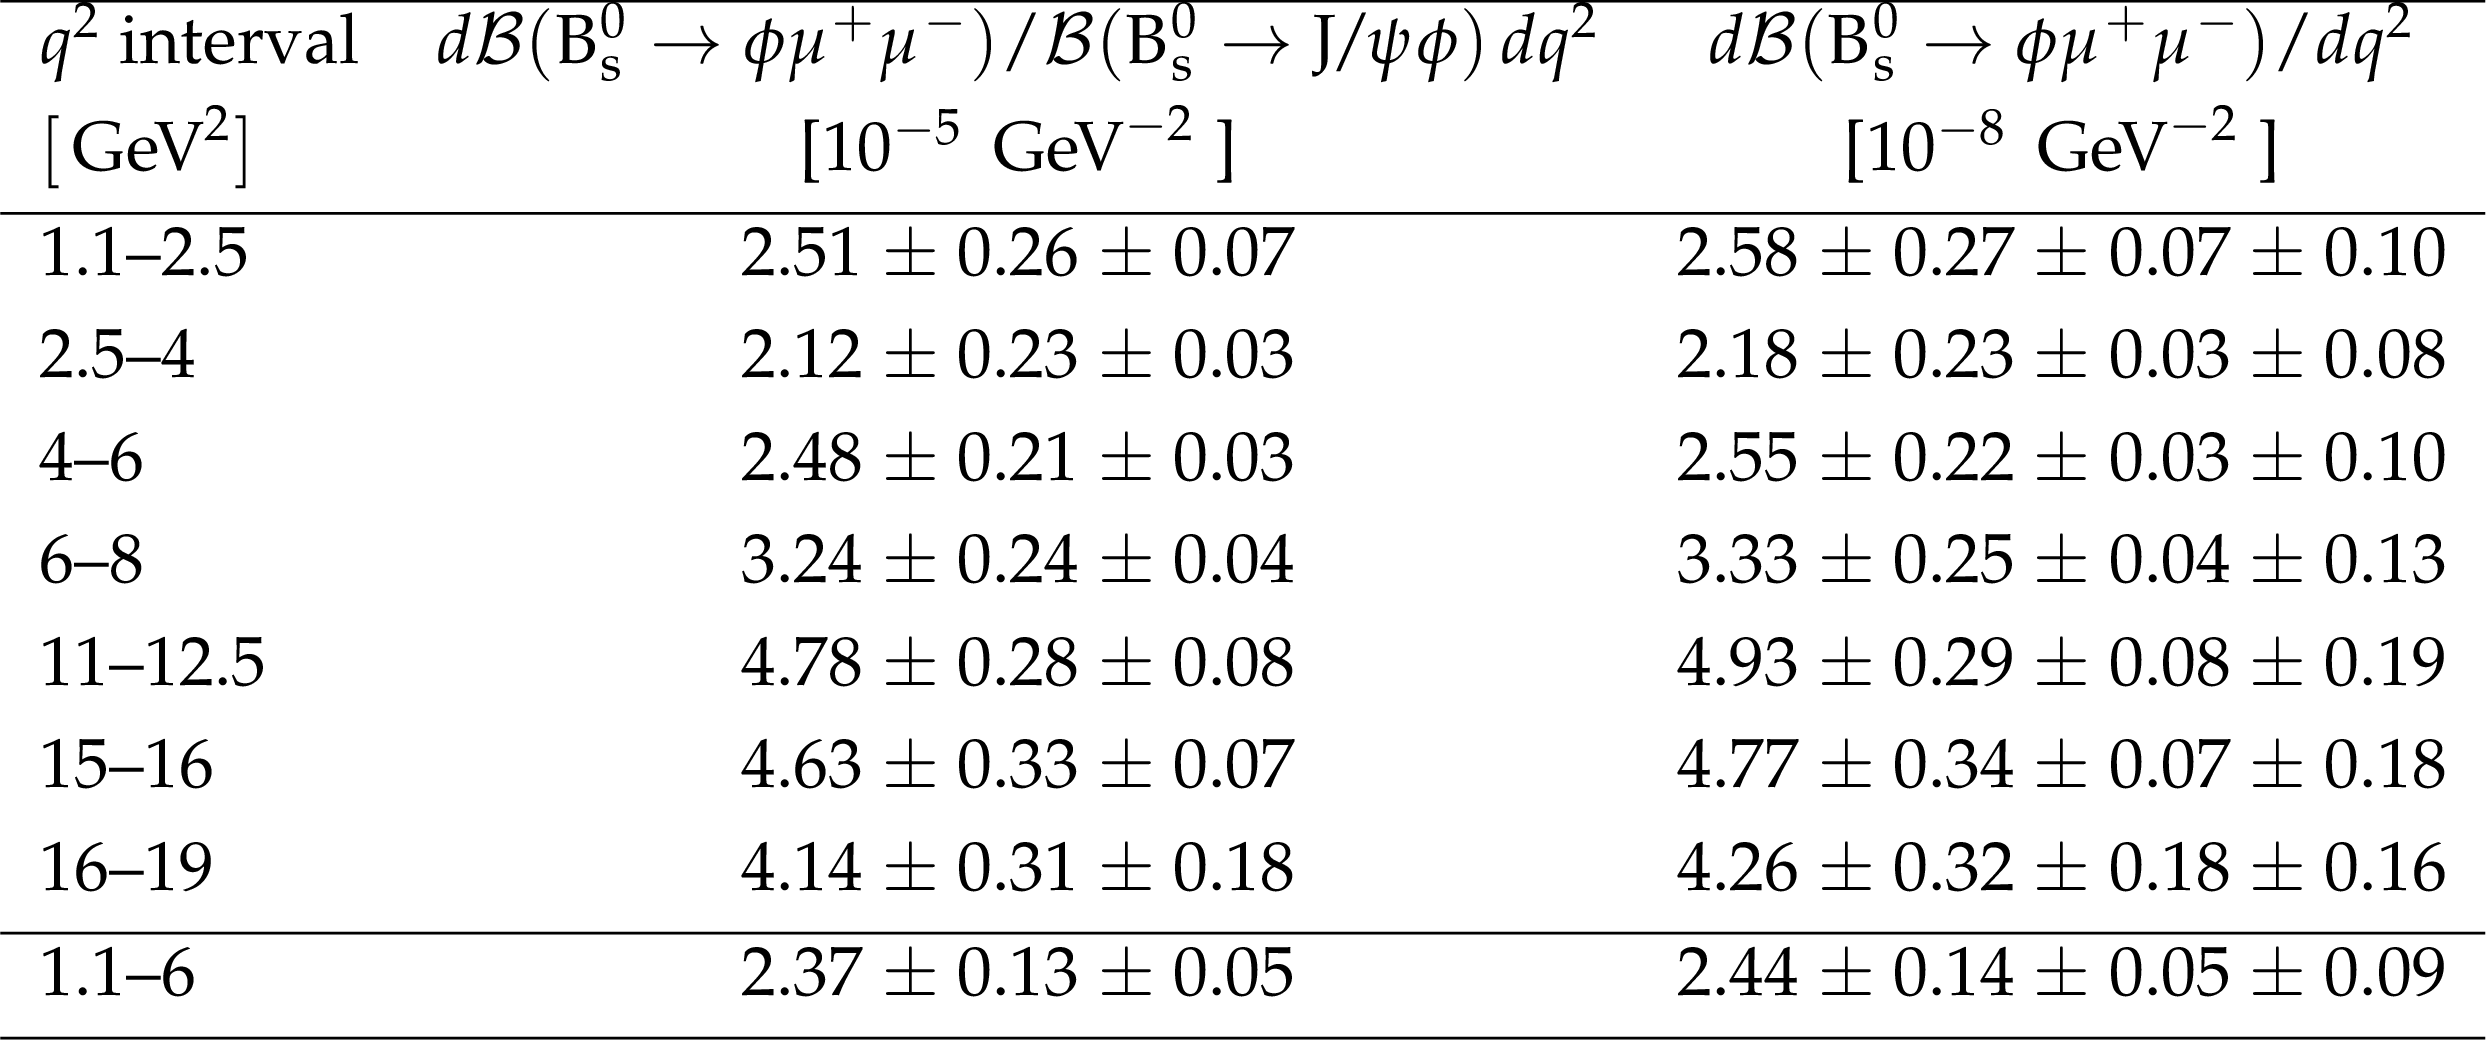
Table 3:
Differential branching fraction $ d\mathcal{B}(\mathrm{B}_{s}^{0}\to \phi\mu^{+}\mu^{-})/dq^{2} $ measurement, both relative to the normalization mode and absolute, in $ q^{2} $ intervals. The uncertainties are, in order, statistical, systematic, and due to the uncertainty on the branching fraction of the normalization mode. Results from $ q^{2} $: 16--19$ \text{GeV}^2 $ are from the 2016 data-taking period only (35.9 fb$ ^{-1} $). |
png pdf |
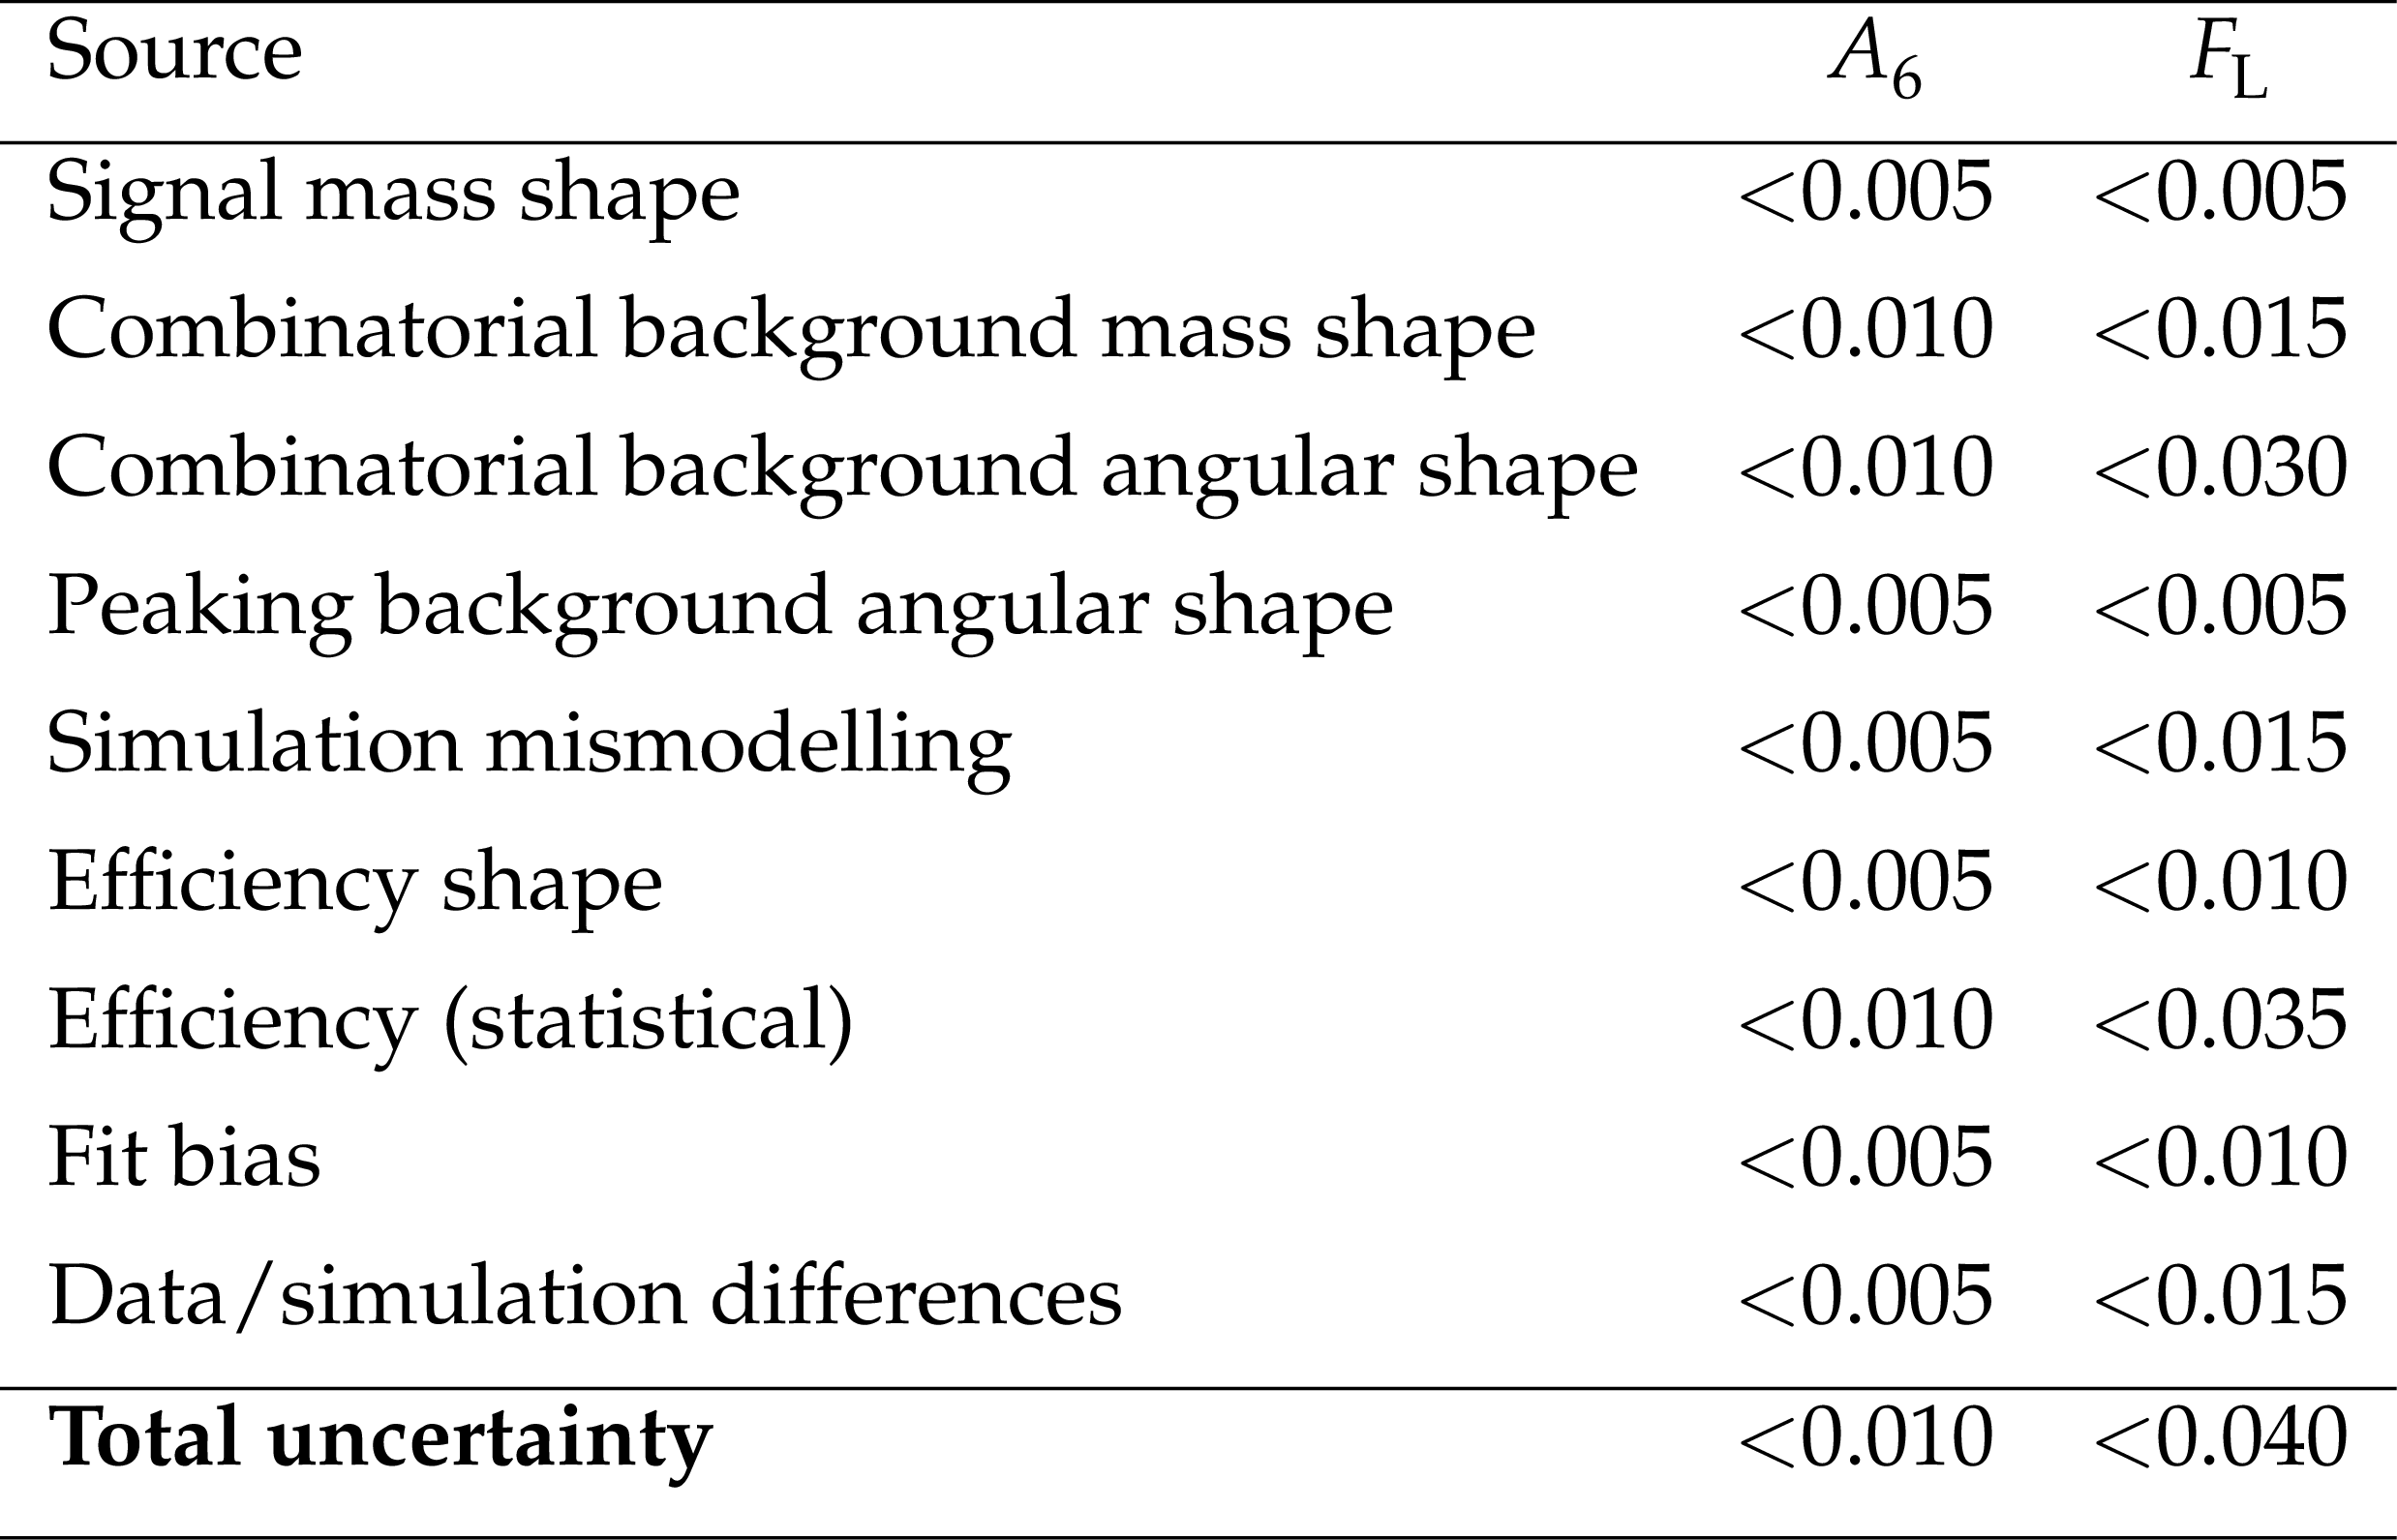
Table 4:
Sources of systematic uncertainty on $ A_{6} $ and $ F_{\mathrm{L}} $. The limit (rounded to the next multiple of 0.005) indicates the maximum variations in different $ q^{2} $ intervals. |
png pdf |
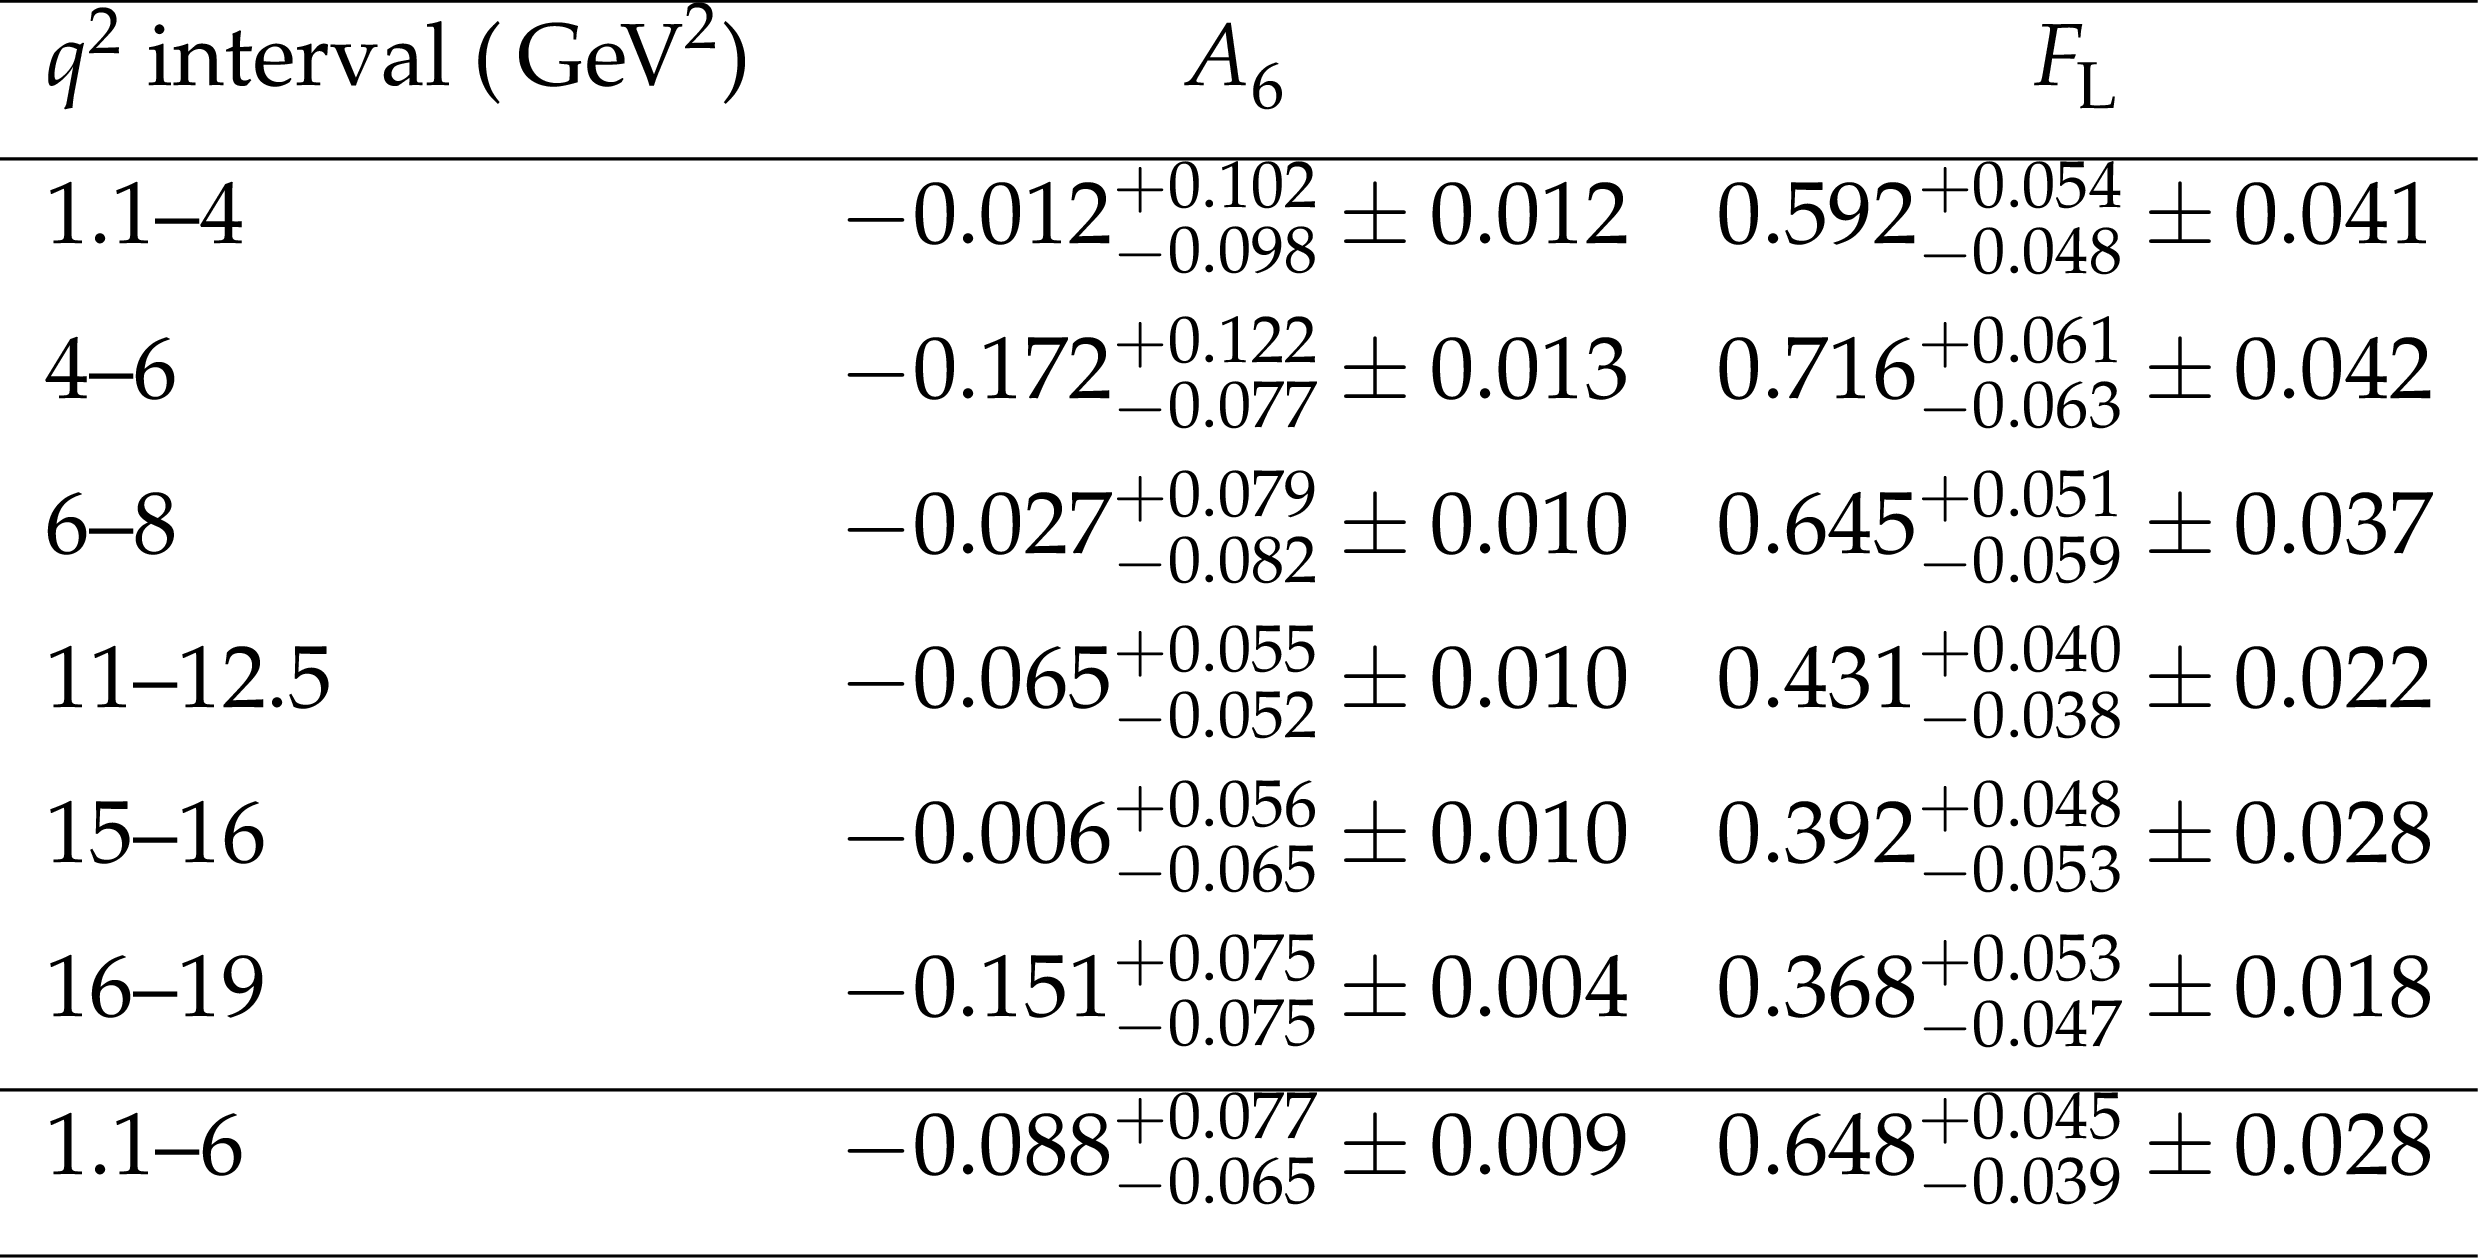
Table 5:
Measurement of the angular observables ($ A_{6} $, $ F_{\mathrm{L}} $) in each $ q^{2} $ bin. The first uncertainty is statistical from Feldman--Cousins method and the second is the total systematic uncertainty. |
| Summary |
| Differential branching fractions and angular observables of the rare decay $ \mathrm{B}_{s}^{0}\to \phi\mu^{+}\mu^{-} $ are measured using proton-proton collision data collected by the CMS detector at $ \sqrt{s} = $ 13 TeV, corresponding to an integrated luminosity of 138 fb$ ^{-1} $. The measurements are performed in intervals of the dimuon invariant mass squared, $ q^{2} $. In the $ q^{2} $ region 1.1--6 $ \text{GeV}^2 $, the differential branching fraction is measured to be $ ( $ 2.44 $ \pm $ 0.14 $ \pm $ 0.05 $ \pm $ 0.09 $) \times 10^{-8} $ $ \text{GeV}^{-2} $, where the uncertainties are statistical, systematic, and due to the normalization channel $ \mathrm{B}_{s}^{0}\to {\mathrm{J}/\psi} \phi $ branching fraction, respectively. In the same $ q^{2} $ region, the angular observables are measured to be $ F_{\mathrm{L}} = $ 0.648 $ ^{+0.045}_{-0.039} $ \pm 0.028 and $ A_{6} = - $ 0.088 $ ^{+0.077}_{-0.065} $ \pm 0.009, where the first uncertainty is statistical, obtained using the Feldman--Cousins method, and the second is systematic. The measured differential branching fraction in the low-$ q^{2} $ region is significantly lower than several standard model predictions, while the angular observables remain consistent with expectations. |
| References | ||||
| 1 | CDF Collaboration | Measurement of the forward-backward asymmetry in the $ B \to K^{(*)} \mu^+ \mu^- $ decay and first observation of the $ B^0_s \to \phi \mu^+ \mu^- $ decay | PRL 106 (2011) 161801 | 1101.1028 |
| 2 | LHCb Collaboration | Angular analysis and differential branching fraction of the decay $ B^0_s\to\phi\mu^+\mu^- $ | JHEP 09 (2015) 179 | 1506.08777 |
| 3 | LHCb Collaboration | Angular analysis of the rare decay $ B_s^0 \to \phi\mu^+\mu^- $ | JHEP 11 (2021) 043 | 2107.13428 |
| 4 | LHCb Collaboration | Branching fraction measurements of the rare $ B^0_s\rightarrow\phi\mu^+\mu^- $ and $ B^0_s\rightarrow f_2^\prime(1525)\mu^+\mu^- $ decays | PRL 127 (2021) 151801 | 2105.14007 |
| 5 | A. Bharucha, D. M. Straub, and R. Zwicky | $ B\to V\ell^+\ell^- $ in the Standard Model from light-cone sum rules | JHEP 08 (2016) 098 | 1503.05534 |
| 6 | W. Altmannshofer and D. M. Straub | New physics in $ b \to s $ transitions after LHC run 1 | EPJC 75 (2015) 382 | 1503.06199 |
| 7 | R. R. Horgan, Z. Liu, S. Meinel, and M. Wingate | Calculation of $ B^0 \to K^{*0} \mu^+ \mu^- $ and $ B_s^0 \to \phi \mu^+ \mu^- $ observables using form factors from lattice QCD | PRL 112 (2014) 212003 | 1310.3887 |
| 8 | R. R. Horgan, Z. Liu, S. Meinel, and M. Wingate | Rare $ B $ decays using lattice QCD form factors | PoS LATTICE 372, 2015 link |
1501.00367 |
| 9 | C. Bobeth, G. Hiller, and G. Piranishvili | CP Asymmetries in $ \bar{B} \to \bar{K}^* (\to \bar{K} \pi) \bar{\ell} \ell $ and Untagged $ \bar{B}_s $, $ B_s \to \phi (\to K^{+} K^-) \bar{\ell} \ell $ Decays at NLO | JHEP 07 (2008) 106 | 0805.2525 |
| 10 | Particle Data Group Collaboration | Review of Particle Physics | PRD 110 (2024) 030001 | |
| 11 | CMS Collaboration | The CMS experiment at the CERN LHC | JINST 3 (2008) S08004 | |
| 12 | CMS Collaboration | Performance of the CMS Level-1 trigger in proton-proton collisions at $ \sqrt{s} = $ 13 TeV | JINST 15 (2020) P10017 | CMS-TRG-17-001 2006.10165 |
| 13 | CMS Collaboration | The CMS trigger system | JINST 12 (2017) P01020 | CMS-TRG-12-001 1609.02366 |
| 14 | CMS Collaboration | Performance of the CMS high-level trigger during LHC Run 2 | JINST 19 (2024) P11021 | CMS-TRG-19-001 2410.17038 |
| 15 | CMS Collaboration | Electron and photon reconstruction and identification with the CMS experiment at the CERN LHC | JINST 16 (2021) P05014 | CMS-EGM-17-001 2012.06888 |
| 16 | CMS Collaboration | Performance of the CMS muon detector and muon reconstruction with proton-proton collisions at $ \sqrt{s}= $ 13 TeV | JINST 13 (2018) P06015 | CMS-MUO-16-001 1804.04528 |
| 17 | CMS Collaboration | Description and performance of track and primary-vertex reconstruction with the CMS tracker | JINST 9 (2014) P10009 | CMS-TRK-11-001 1405.6569 |
| 18 | T. Sjöstrand et al. | An introduction to PYTHIA 8.2 | Comput. Phys. Commun. 191 (2015) 159 | 1410.3012 |
| 19 | CMS Collaboration | Extraction and validation of a new set of CMS PYTHIA8 tunes from underlying-event measurements | EPJC 80 (2020) 4 | CMS-GEN-17-001 1903.12179 |
| 20 | D. J. Lange | The EvtGen particle decay simulation package | NIM A 462 (2001) 152 | |
| 21 | E. Barberio, B. van Eijk, and Z. Wcas | PHOTOS --- a universal Monte Carlo for QED radiative corrections in decays | Comput. Phys. Commun. 66 (1991) 115 | |
| 22 | E. Barberio and Z. W \c a s | PHOTOS -- a universal Monte Carlo for QED radiative corrections: version 2.0 | Comput. Phys. Commun. 79 (1994) 291 | |
| 23 | GEANT4 Collaboration | GEANT 4---a simulation toolkit | NIM A 506 (2003) 250 | |
| 24 | Y. Freund and R. E. Schapire | A decision-theoretic generalization of on-line learning and an application to boosting | Journal of Computer and System Sciences 55 (1997) 119 | |
| 25 | A. Blum, A. Kalai, and J. Langford | Beating the hold-out: Bounds for k-fold and progressive cross-validation | in the Ann. Conf. on Computational Learning Theory, COLT '99, 1999 Proc. 1 (1999) 203 |
|
| 26 | A. Hoecker et al. | TMVA: Toolkit for Multivariate Data Analysis | PoS ACAT 04 (2007) 0 | physics/0703039 |
| 27 | M. J. Oreglia | A study of the reactions $ \psi^\prime \to \gamma \gamma \psi $ | PhD thesis, Stanford University, SLAC Report SLAC-R-236, 1980 | |
| 28 | M. Pivk and F. R. L. Diberder | splot: A statistical tool to unfold data distributions | Nucl. Instrum. Meth. A555 356, 2005 | physics/0402083 |
| 29 | O. L. Davies | Biometrika Tables for Statisticians, Volume I | Journal of the Royal Statistical Society Series C 4 (1955) 72 | |
| 30 | D. M. Straub | flavio: a Python package for flavour and precision phenomenology in the Standard Model and beyond | 1810.08132 | |
| 31 | N. Gubernari, M. Reboud, D. van Dyk, and J. Virto | Improved theory predictions and global analysis of exclusive $ b\to s\mu^+\mu^- $ processes | JHEP 09 (2022) 133 | 2206.03797 |
| 32 | D. van Dyk et al. | EOS - A software for flavor physics phenomenology | 2111.15428 | |
| 33 | J. de Blas et al. | HEPfit: a code for the combination of indirect and direct constraints on high energy physics models | EPJC 80 (2020) 456 | 1910.14012 |
| 34 | S. Bodhisattva, M. Walker, and M. Woodroofe | On the Unified Method with Nuisance Parameters | Statist. Sinica 19 (2009) 301 | |
| 35 | T. M. Karbach | Feldman-Cousins confidence levels - toy MC method | link | 1109.0714 |
| 36 | CMS Collaboration | Angular analysis of the $ B^0\to K^*(892)^0\mu^+\mu^- $ decay in proton-proton collisions at $ \sqrt{s} = $ 13 TeV | PLB 864 (2025) 139406 | CMS-BPH-21-002 2411.11820 |
|
|
Compact Muon Solenoid LHC, CERN |
|

|

|

|

|

|