

Compact Muon Solenoid
LHC, CERN
| CMS-B2G-25-005 | ||
| Search for resonances in events with four top quarks decaying to two leptons and jets with the CMS experiment | ||
| CMS Collaboration | ||
| 2026-03-11 | ||
| Abstract: A search for a heavy resonance in four top quark events is presented, and interpreted in models featuring a new vector, scalar, or pseudoscalar boson which interacts exclusively with top quarks. Proton-proton collision data at centre-of-mass energies of 13.0 TeV and 13.6 TeV are analysed, corresponding to integrated luminosities of 138 fb$ ^{-1} $ and 35 fb$ ^{-1} $, respectively. Events with two leptons (electrons or muons) and jets are selected. The mass of the heavy resonance is reconstructed from a pair of jets that are formed using a variable-radius jet clustering algorithm. A machine learning approach is used to identify if these jets originate from top quarks that decay fully hadronically. The dominant background from misidentified jets is estimated from data as a function of the invariant dijet mass. Upper limits are set on the resonance production cross section for resonance masses between 500 GeV and 4 TeV and relative widths ranging from 4 to 50%. Resonances with 50% relative width are excluded at 95% confidence level up to masses of 850 GeV, with an expected exclusion limit of 1000 GeV. | ||
| Links: CDS record (PDF) ; CADI line (restricted) ; | ||
| Figures | |
png pdf |
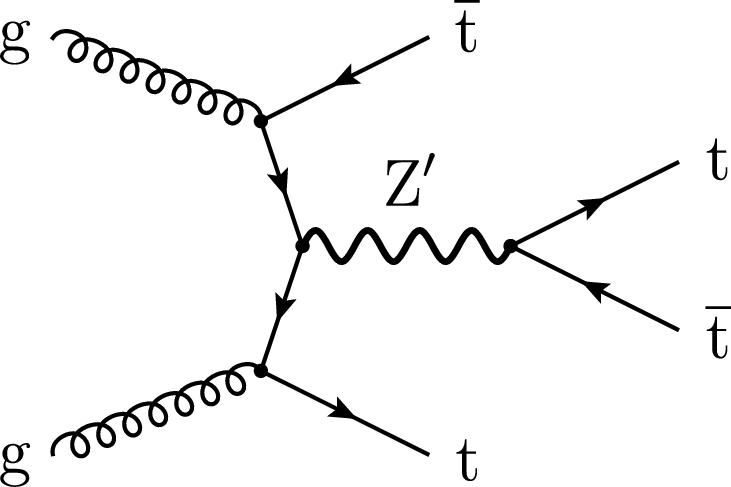
Figure 1:
A representative Feynman diagram of the main $ \mathrm{Z}^{'} $ production mode in $ \mathrm{p}\mathrm{p} $ collisions for the $ {\mathrm{t}\overline{\mathrm{t}}} \mathrm{Z}^{'} $ process, with the $ \mathrm{Z}^{'} $ decaying to a further $ \mathrm{t} \overline{\mathrm{t}} $ pair. |
png pdf |
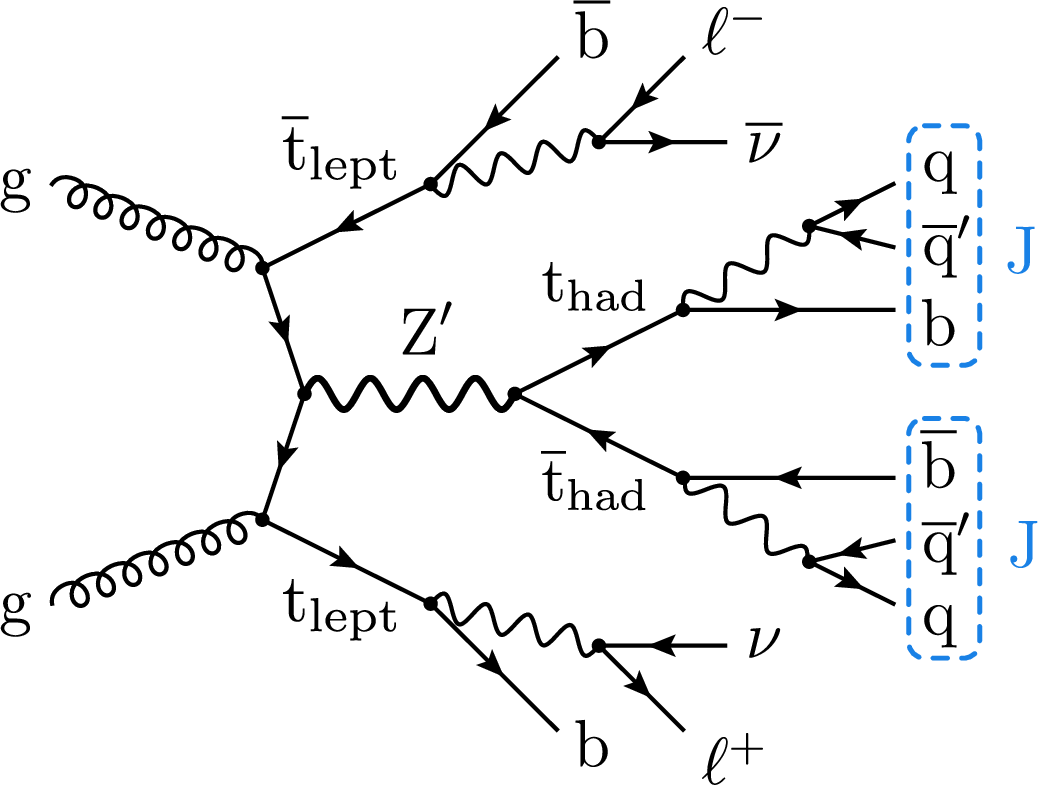
Figure 2:
The targeted signal signature of $ \mathrm{Z}^{'} $ boson production. It comprises two leptonically decaying top quarks ($ \mathrm{t}_{\textrm{lept}} $) and two hadronically decaying top quarks ($ \mathrm{t}_{\textrm{had}} $), where the latter two are reconstructed from $ \textrm{VR} $ jets using a variable-radius jet clustering algorithm. |
png pdf |
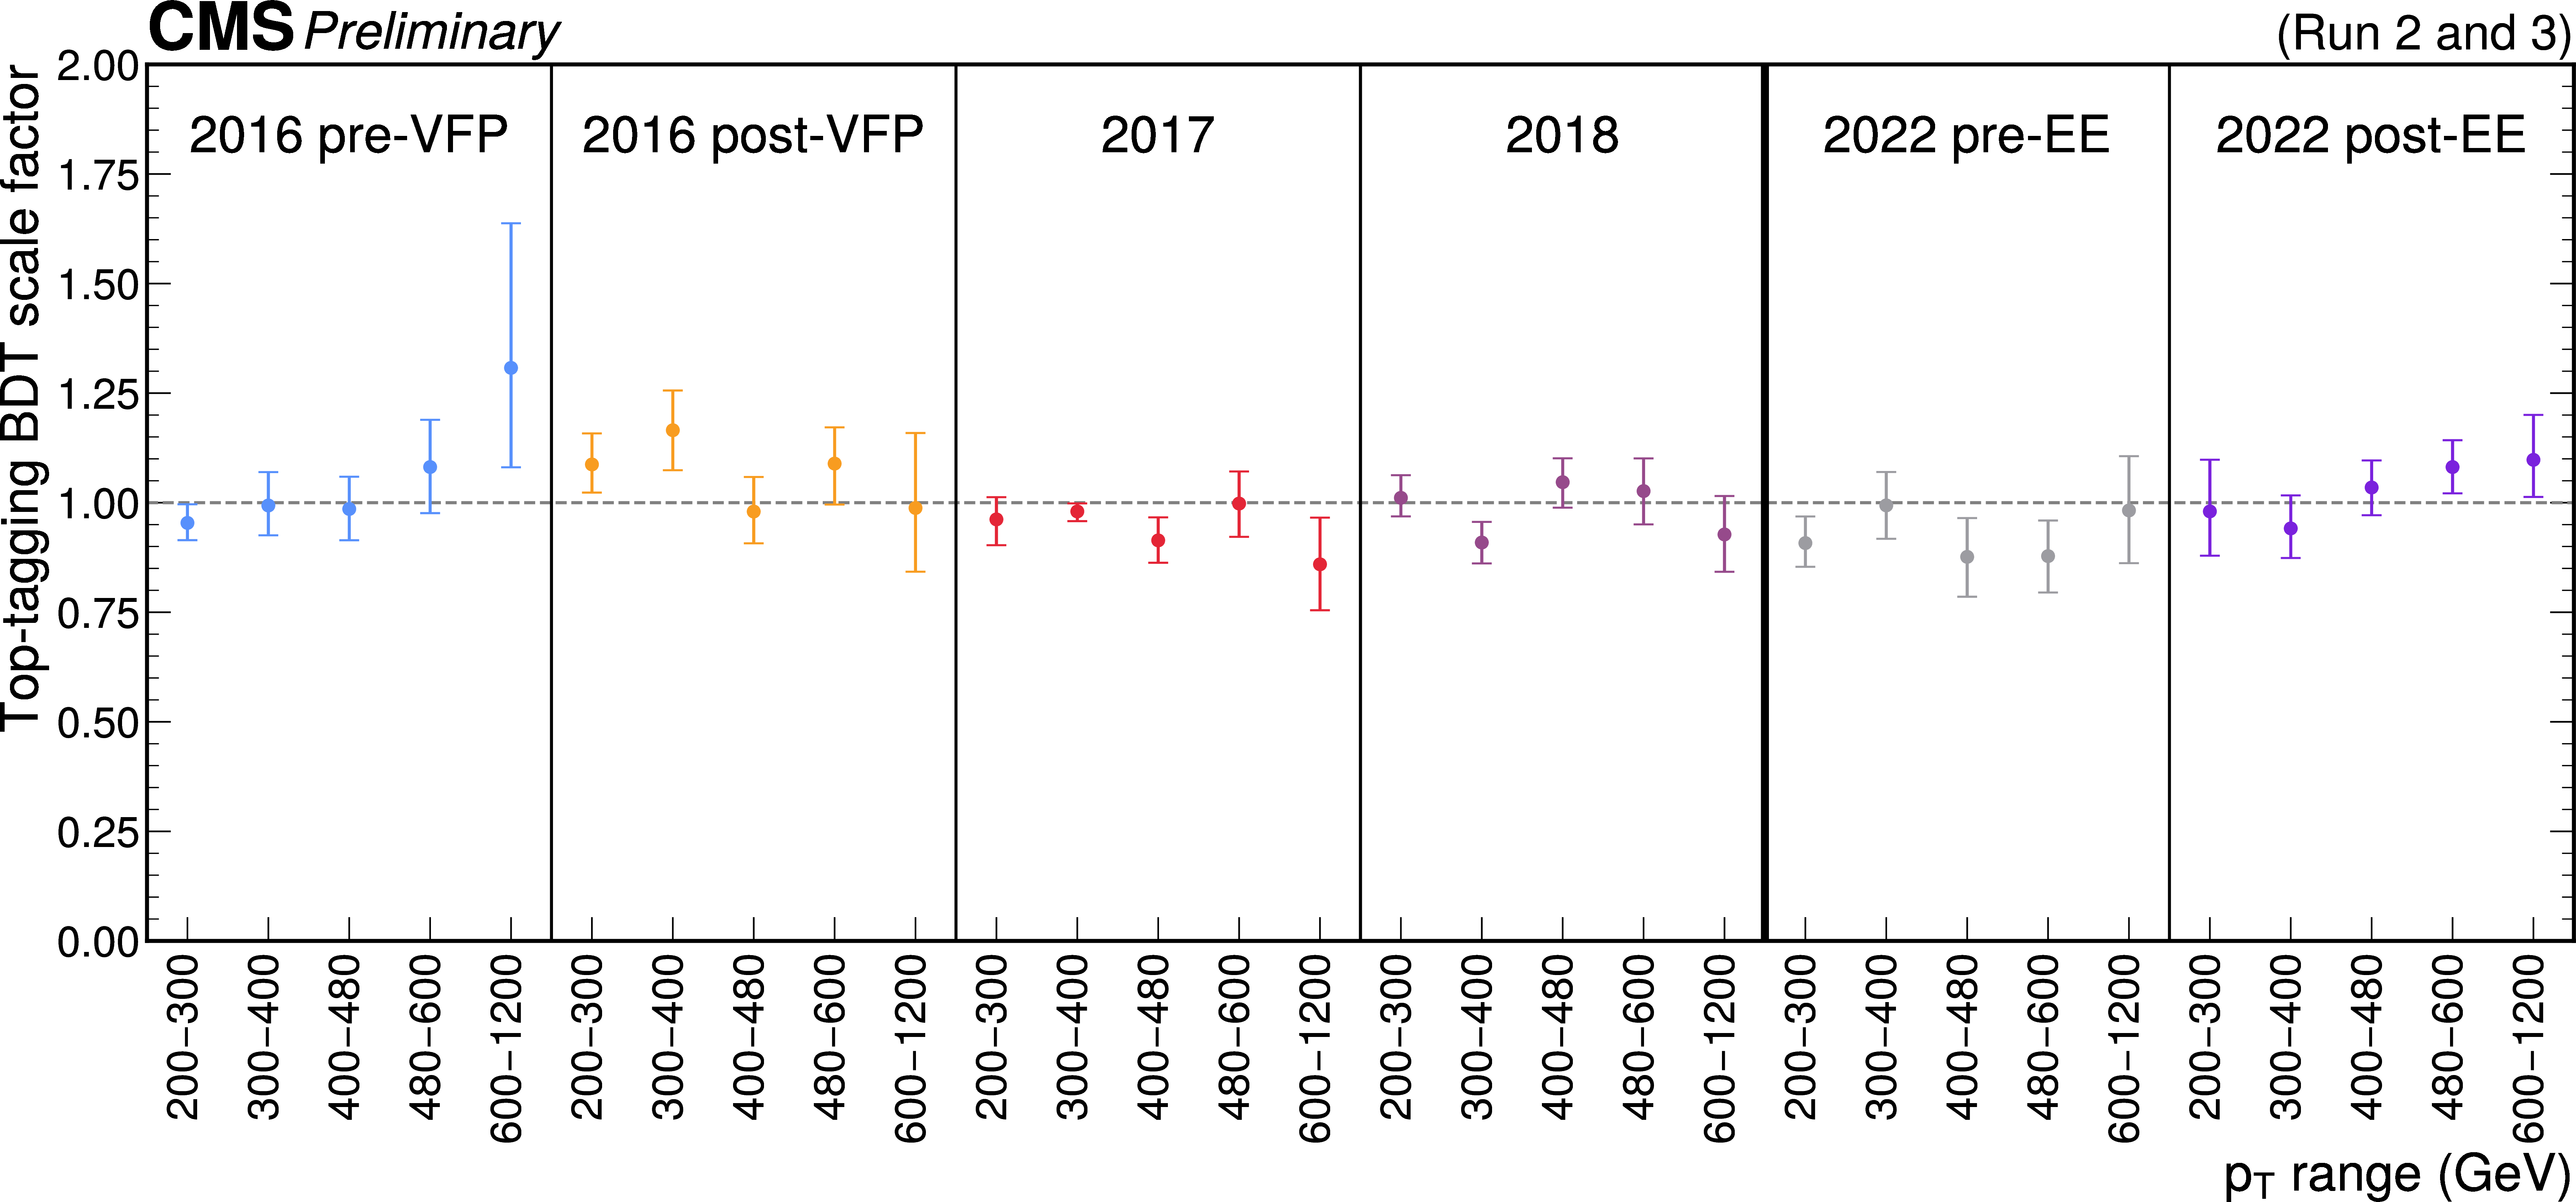
Figure 3:
Data-to-simulation scale factors for the BDT classifier to identify t jets in bins of $ \textrm{VR} $ jet $ p_{\mathrm{T}} $ for each data-taking period. |
png pdf |
Figure 4:
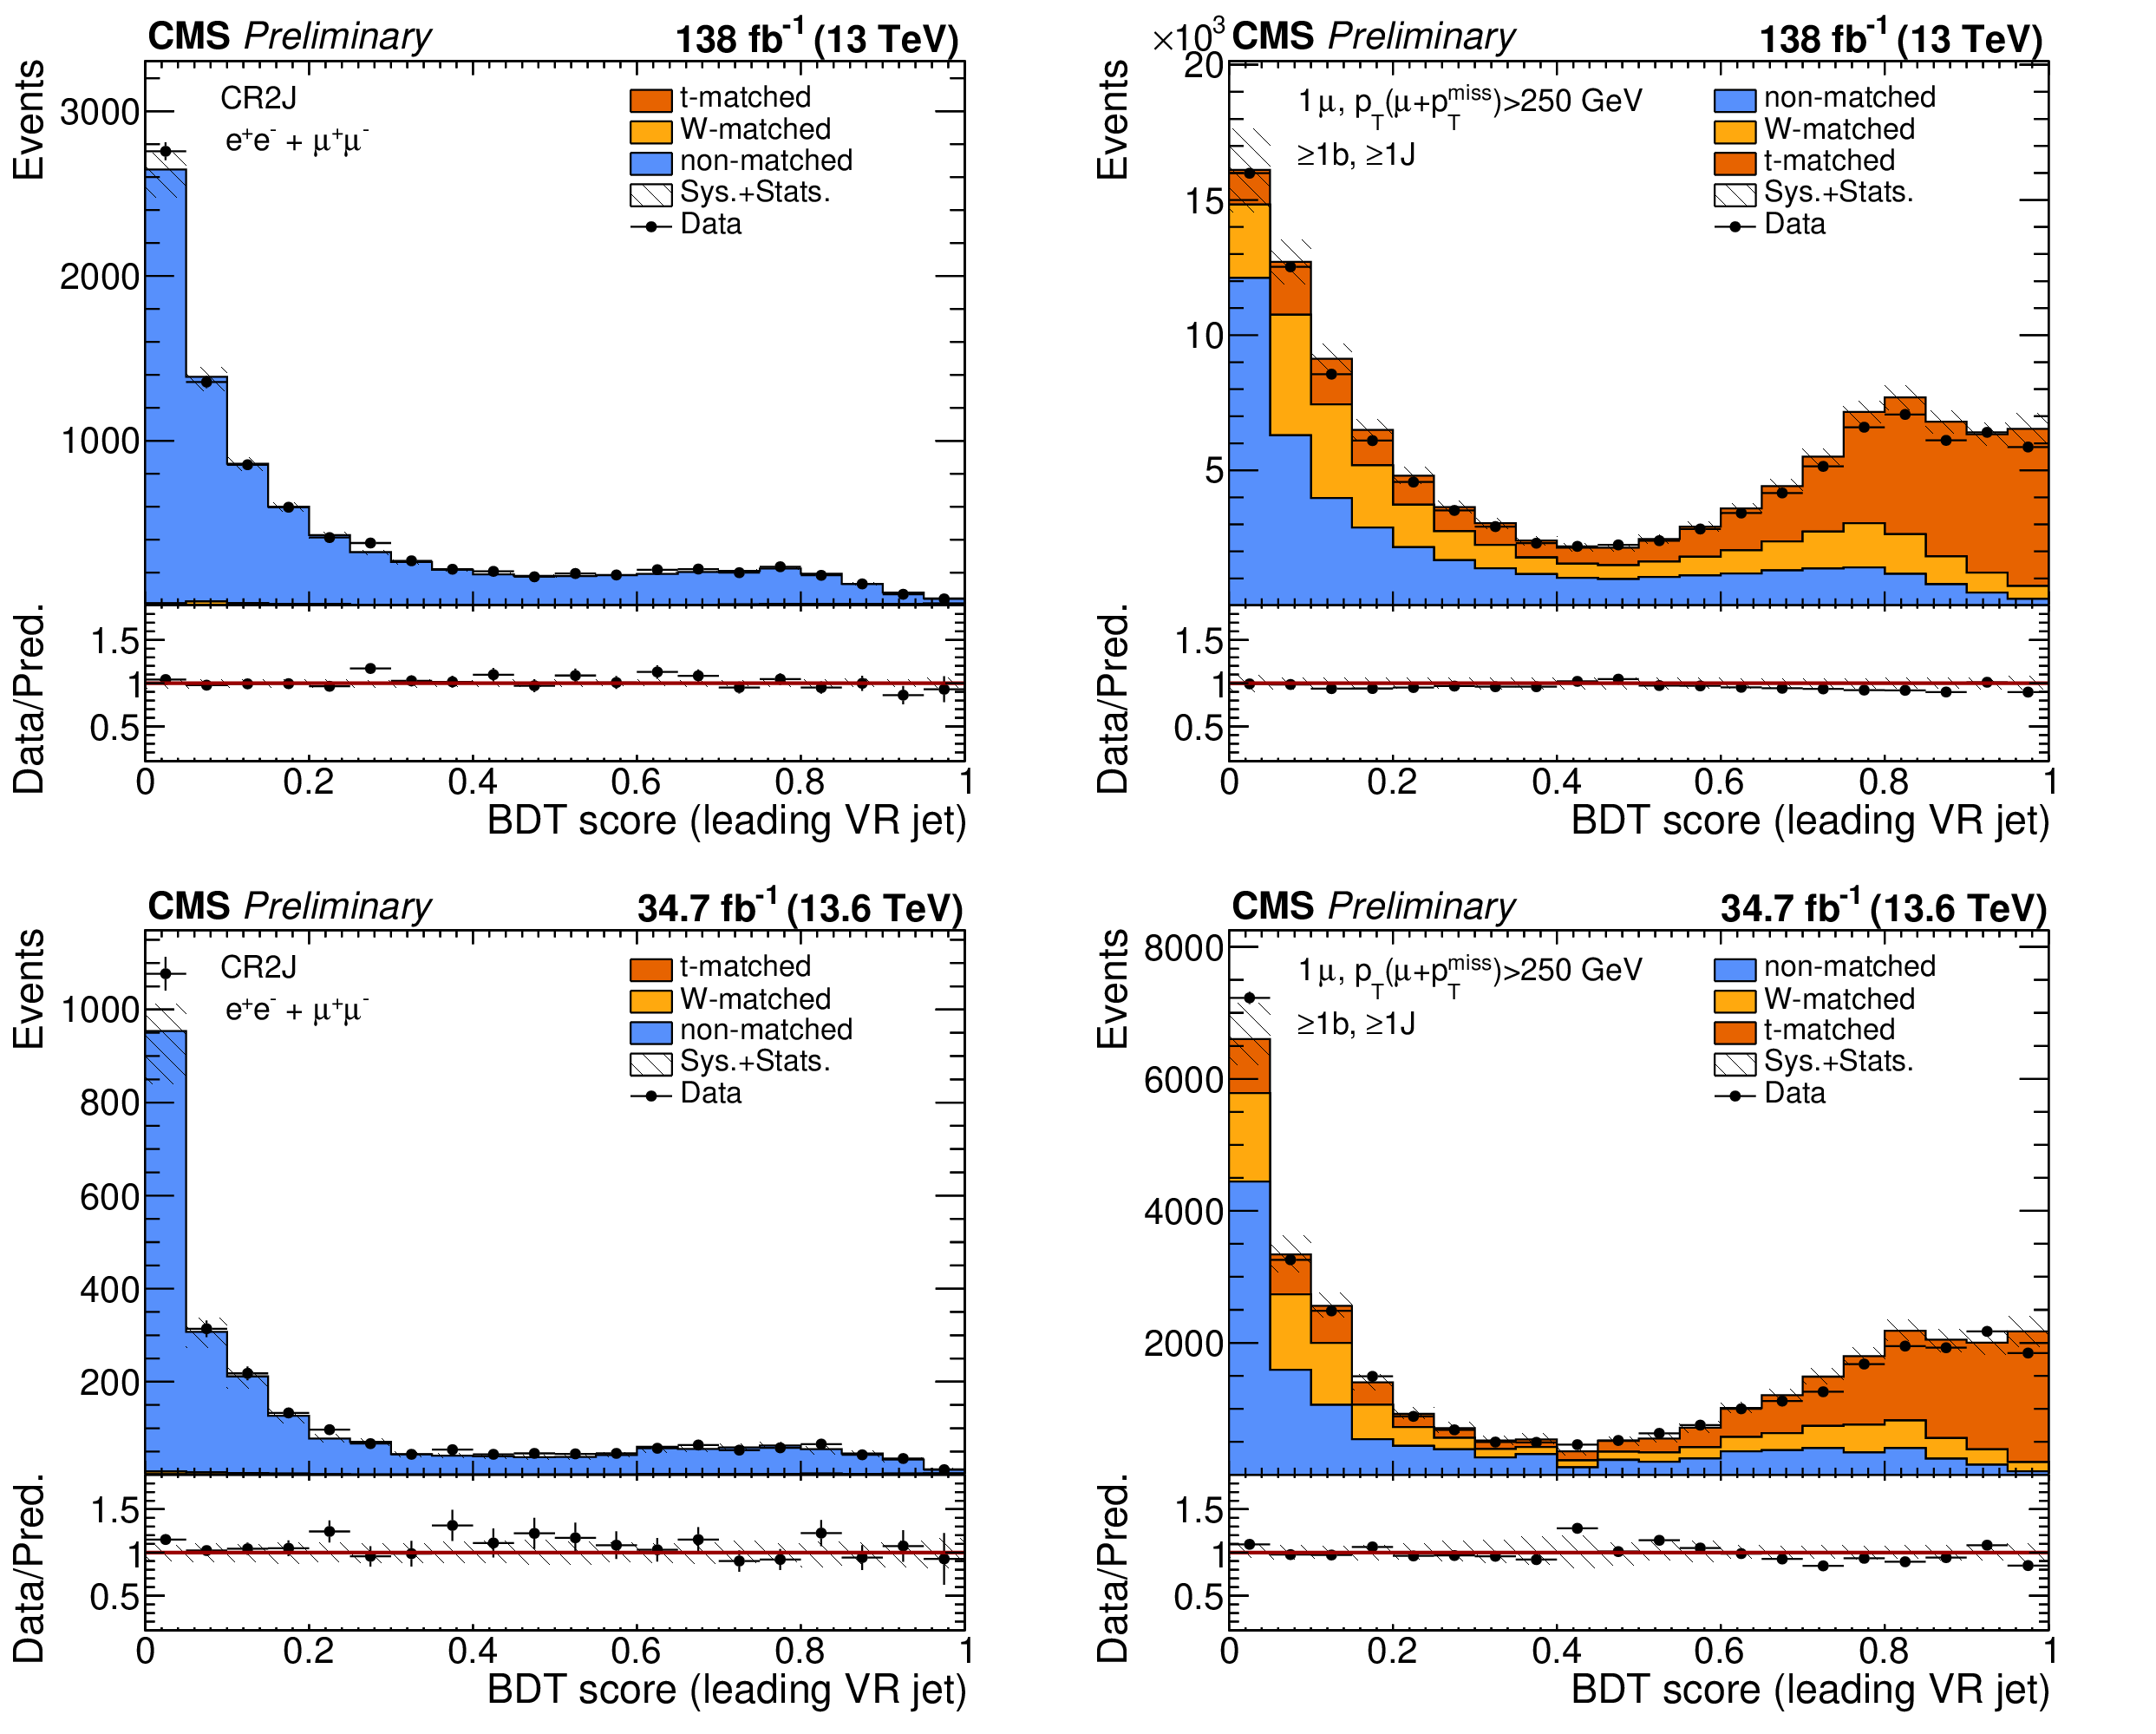
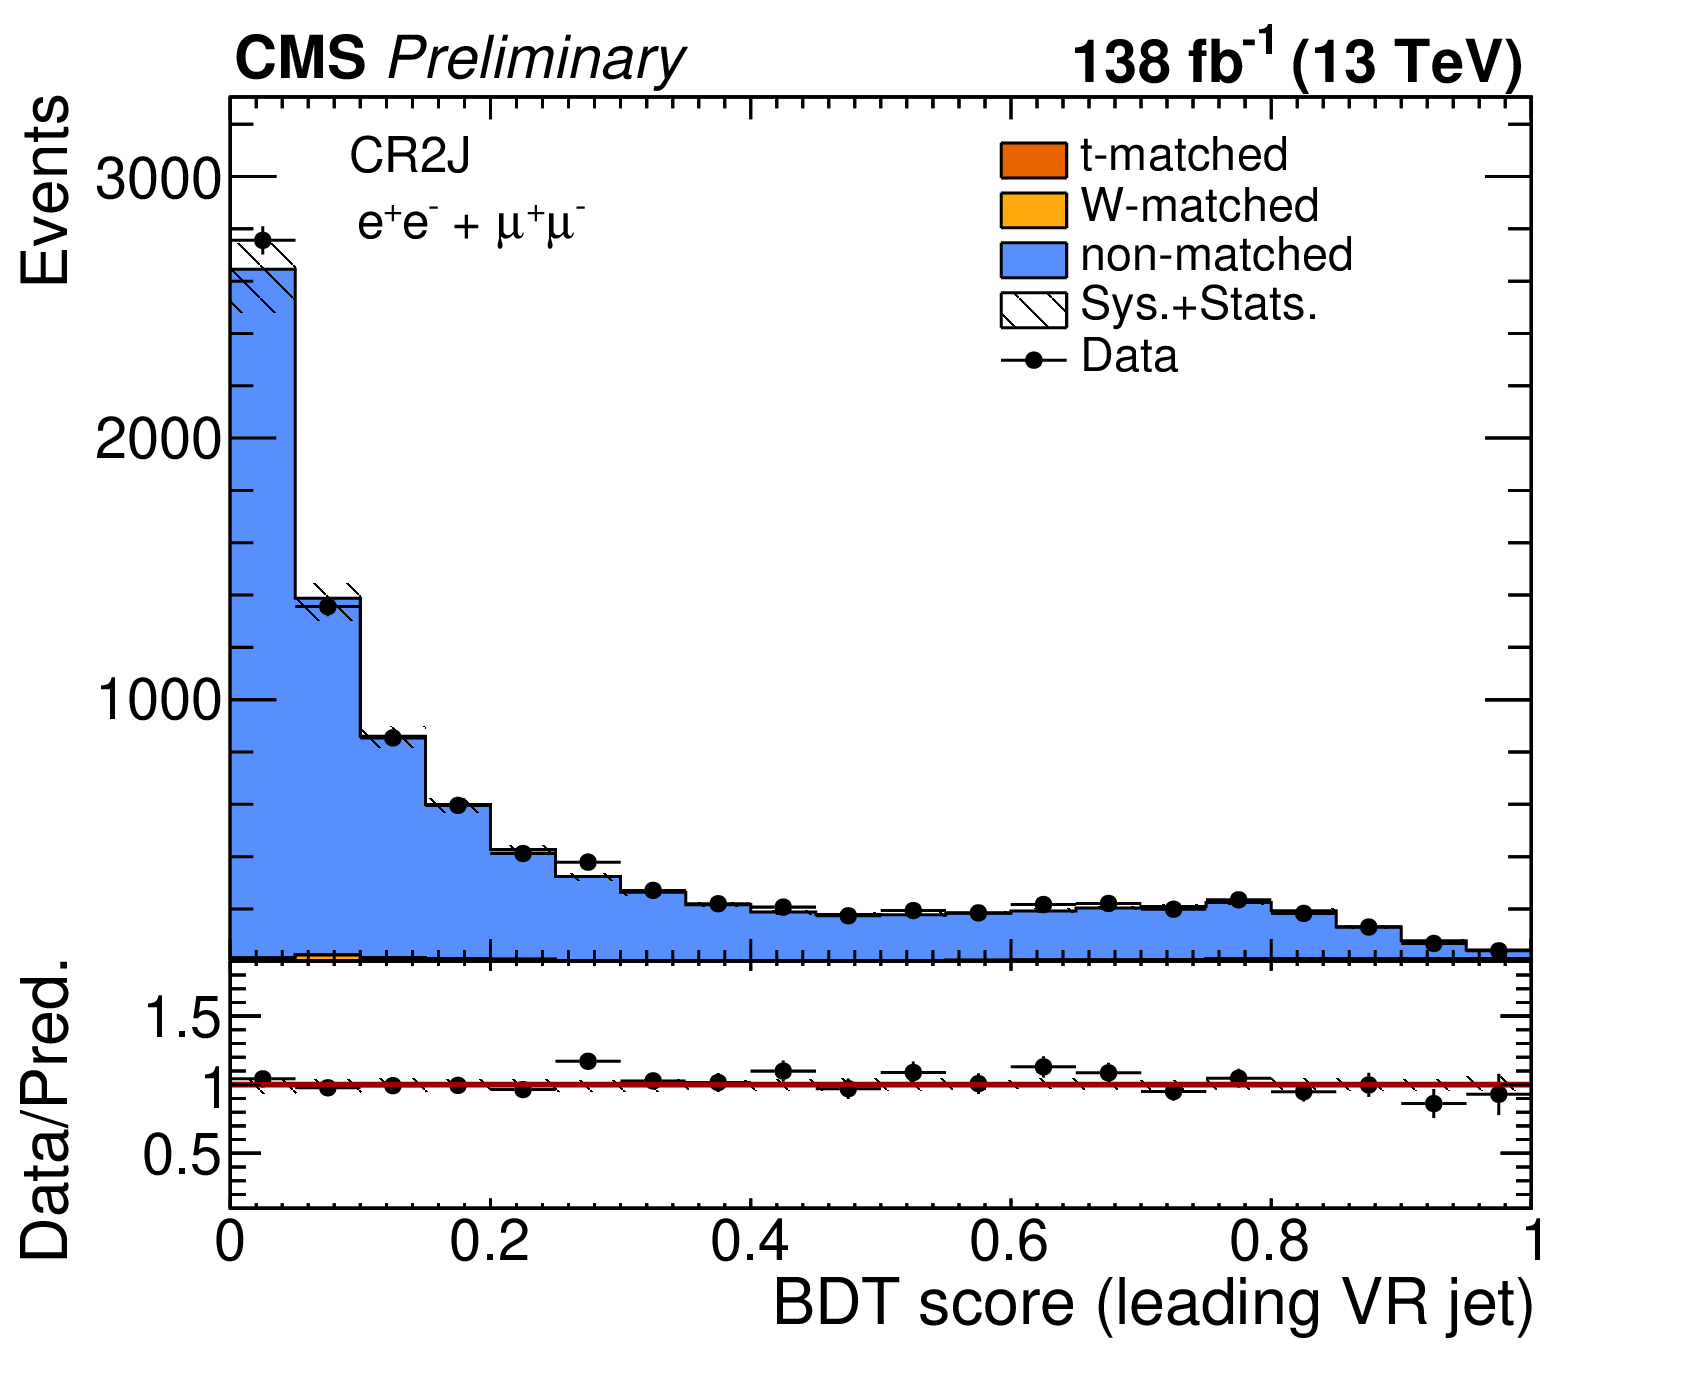
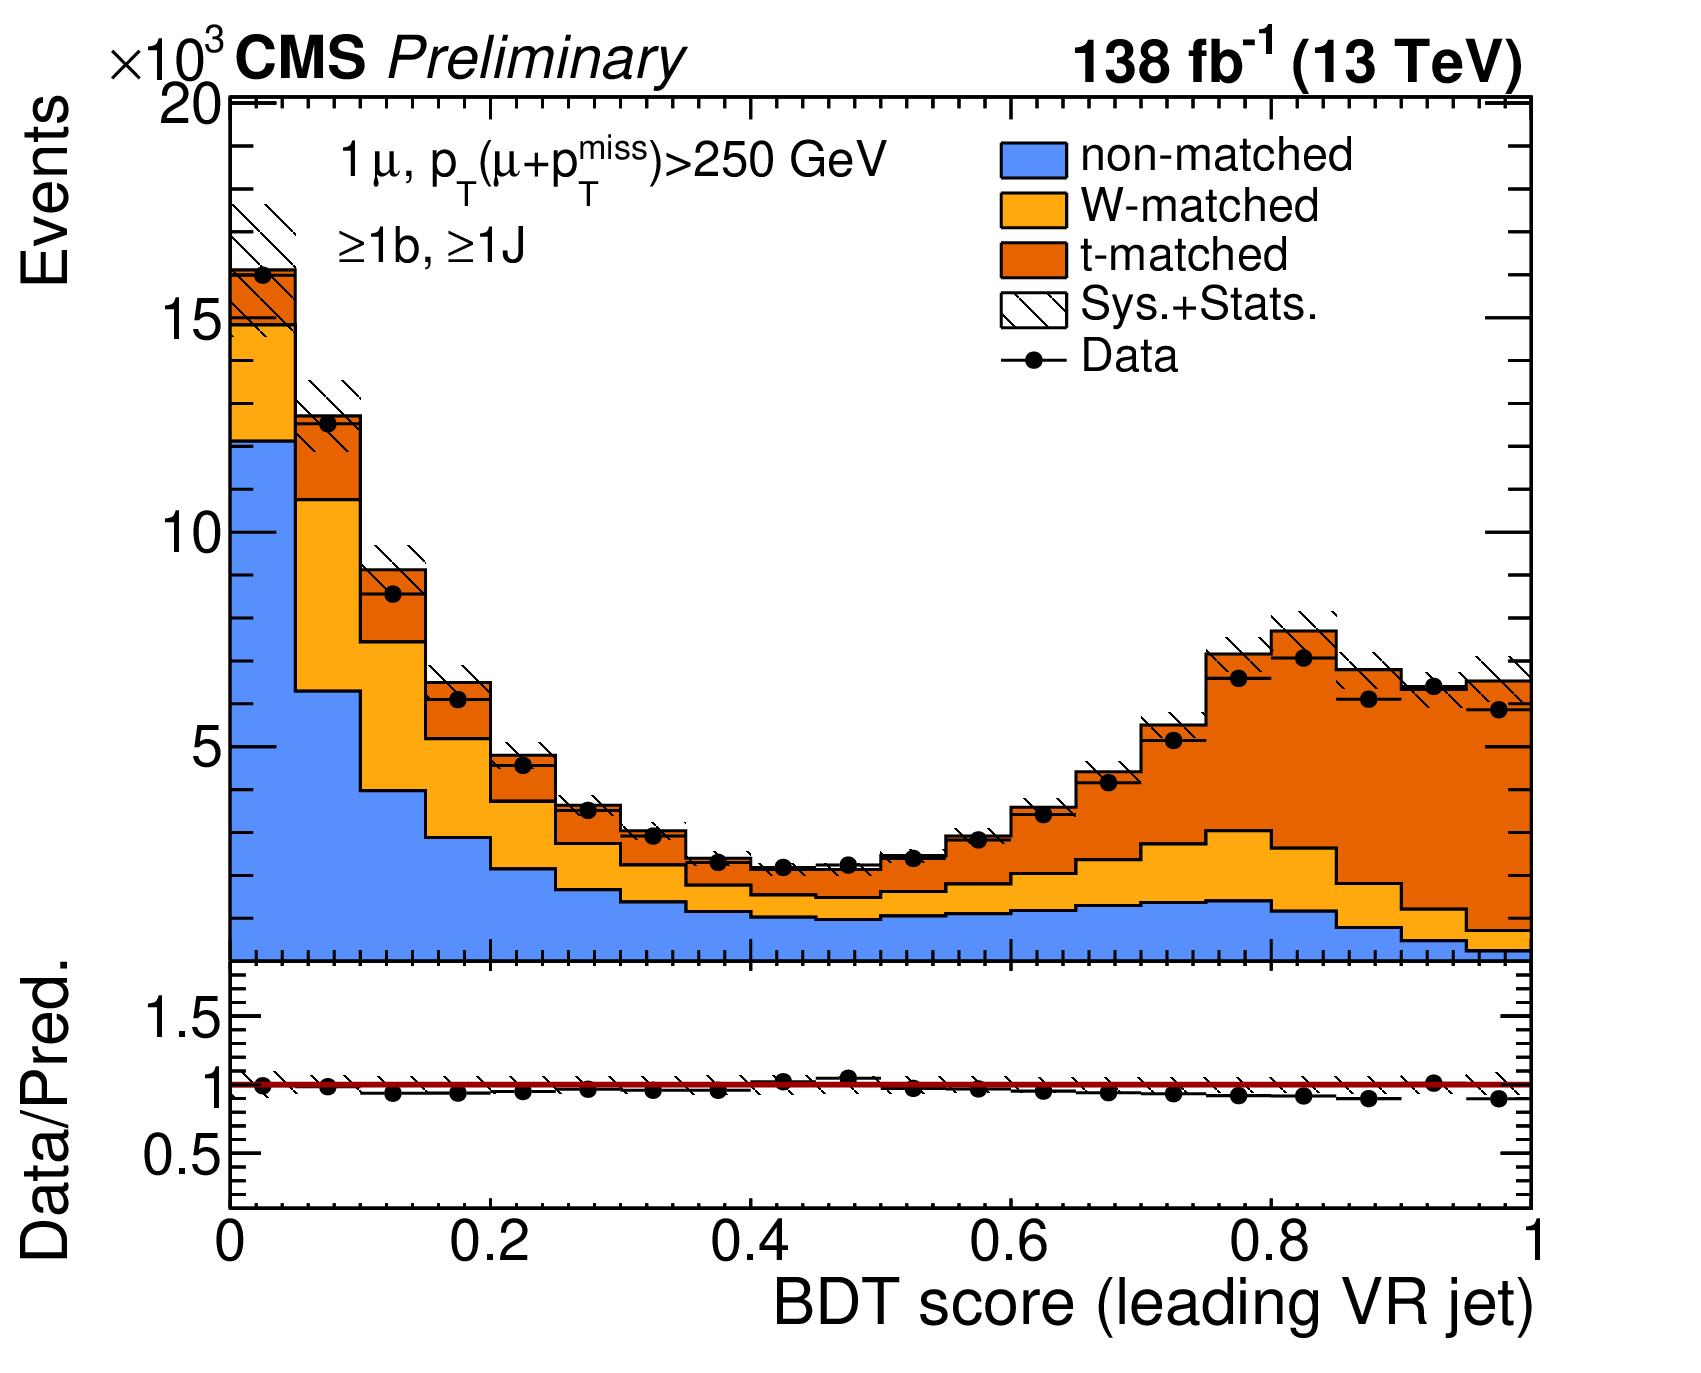
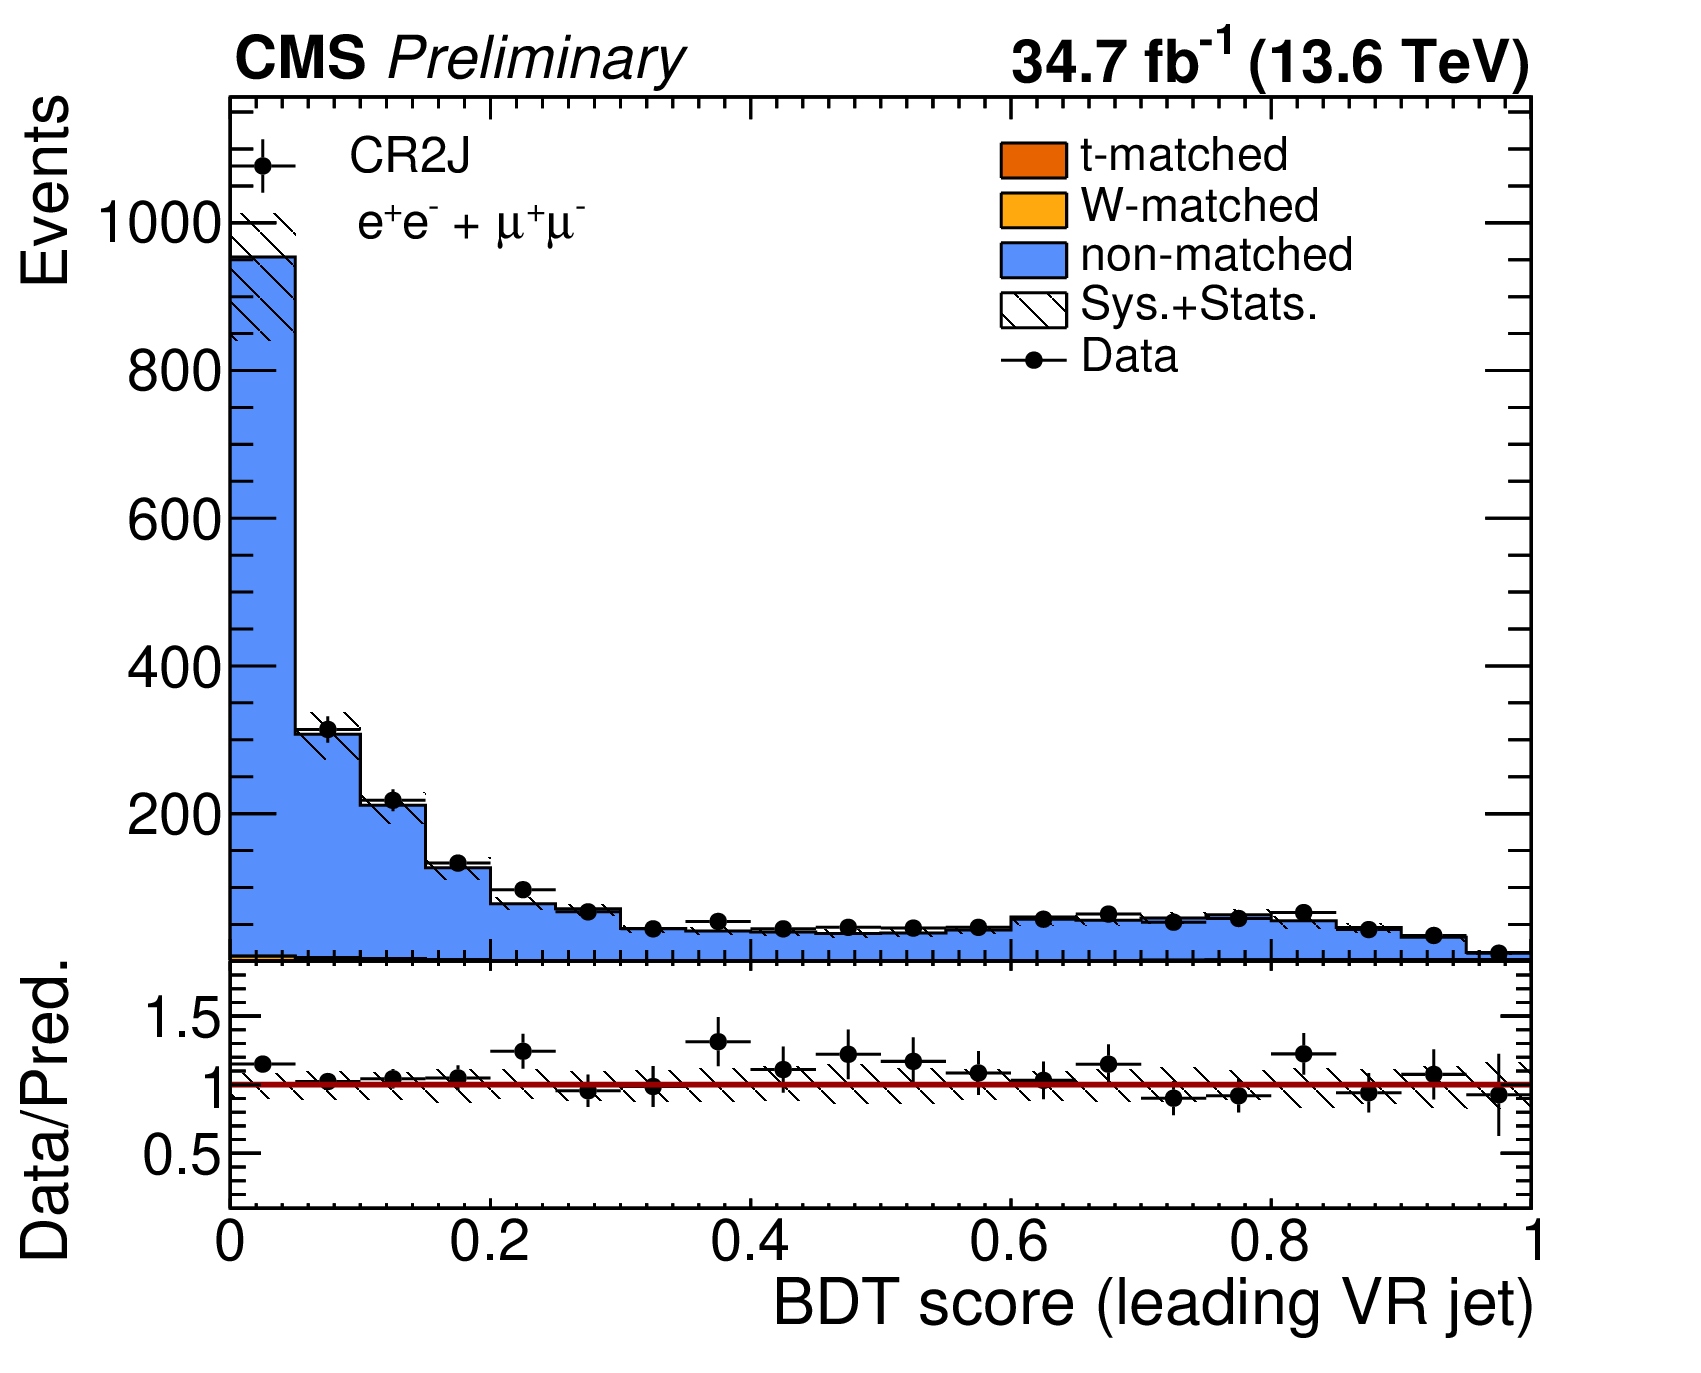
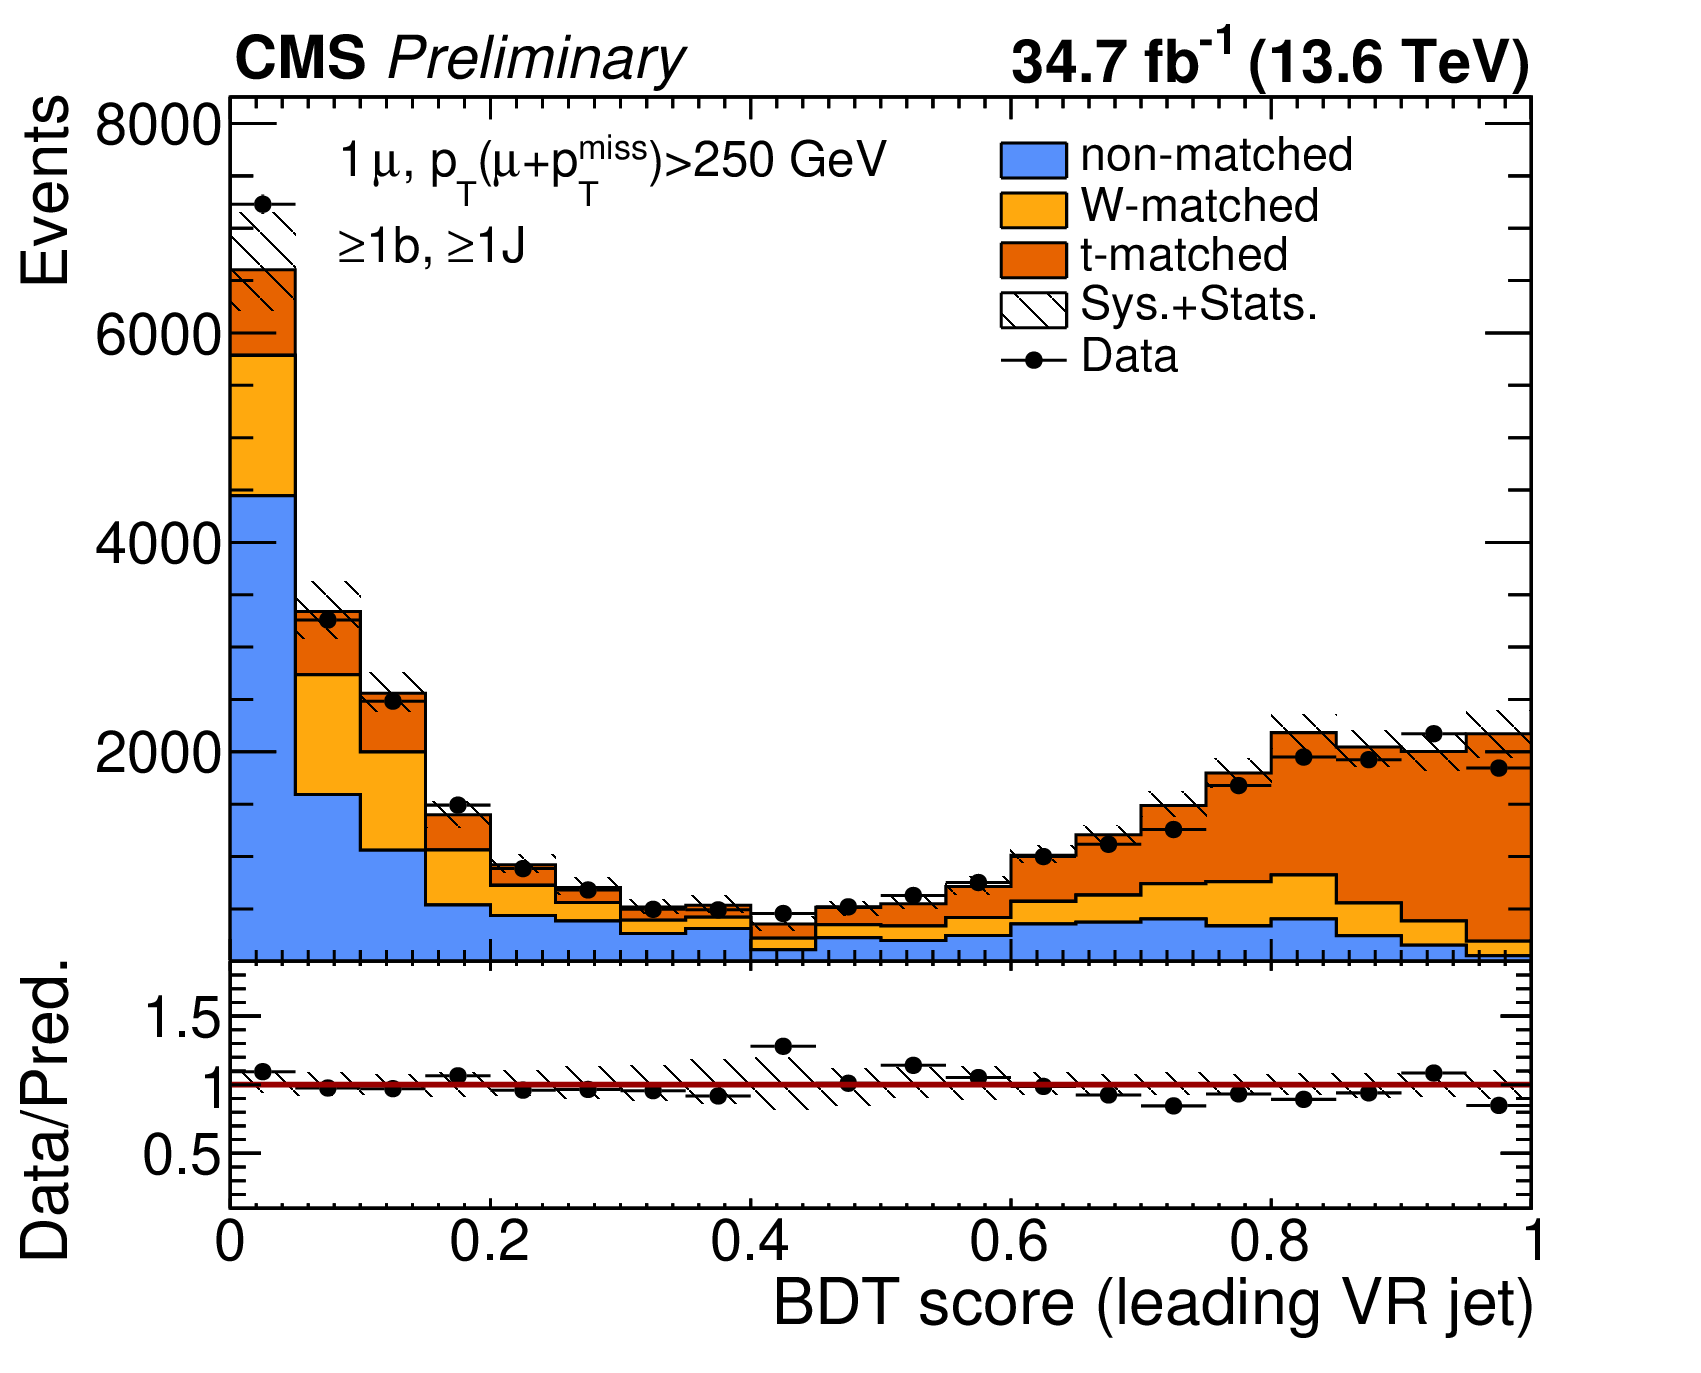
Distributions of the BDT classifier score in regions enriched in $ \mathrm{Z}/\gamma^{*} $+jets (left) and $ \mathrm{t} \overline{\mathrm{t}} $ (right) events for the 2016--2018 data-taking periods (upper row) and the 2022 data-taking period (lower row). |
png pdf |
Figure 4-a:
Distributions of the BDT classifier score in regions enriched in $ \mathrm{Z}/\gamma^{*} $+jets (left) and $ \mathrm{t} \overline{\mathrm{t}} $ (right) events for the 2016--2018 data-taking periods (upper row) and the 2022 data-taking period (lower row). |
png pdf |
Figure 4-b:
Distributions of the BDT classifier score in regions enriched in $ \mathrm{Z}/\gamma^{*} $+jets (left) and $ \mathrm{t} \overline{\mathrm{t}} $ (right) events for the 2016--2018 data-taking periods (upper row) and the 2022 data-taking period (lower row). |
png pdf |
Figure 4-c:
Distributions of the BDT classifier score in regions enriched in $ \mathrm{Z}/\gamma^{*} $+jets (left) and $ \mathrm{t} \overline{\mathrm{t}} $ (right) events for the 2016--2018 data-taking periods (upper row) and the 2022 data-taking period (lower row). |
png pdf |
Figure 4-d:
Distributions of the BDT classifier score in regions enriched in $ \mathrm{Z}/\gamma^{*} $+jets (left) and $ \mathrm{t} \overline{\mathrm{t}} $ (right) events for the 2016--2018 data-taking periods (upper row) and the 2022 data-taking period (lower row). |
png pdf |
Figure 5:
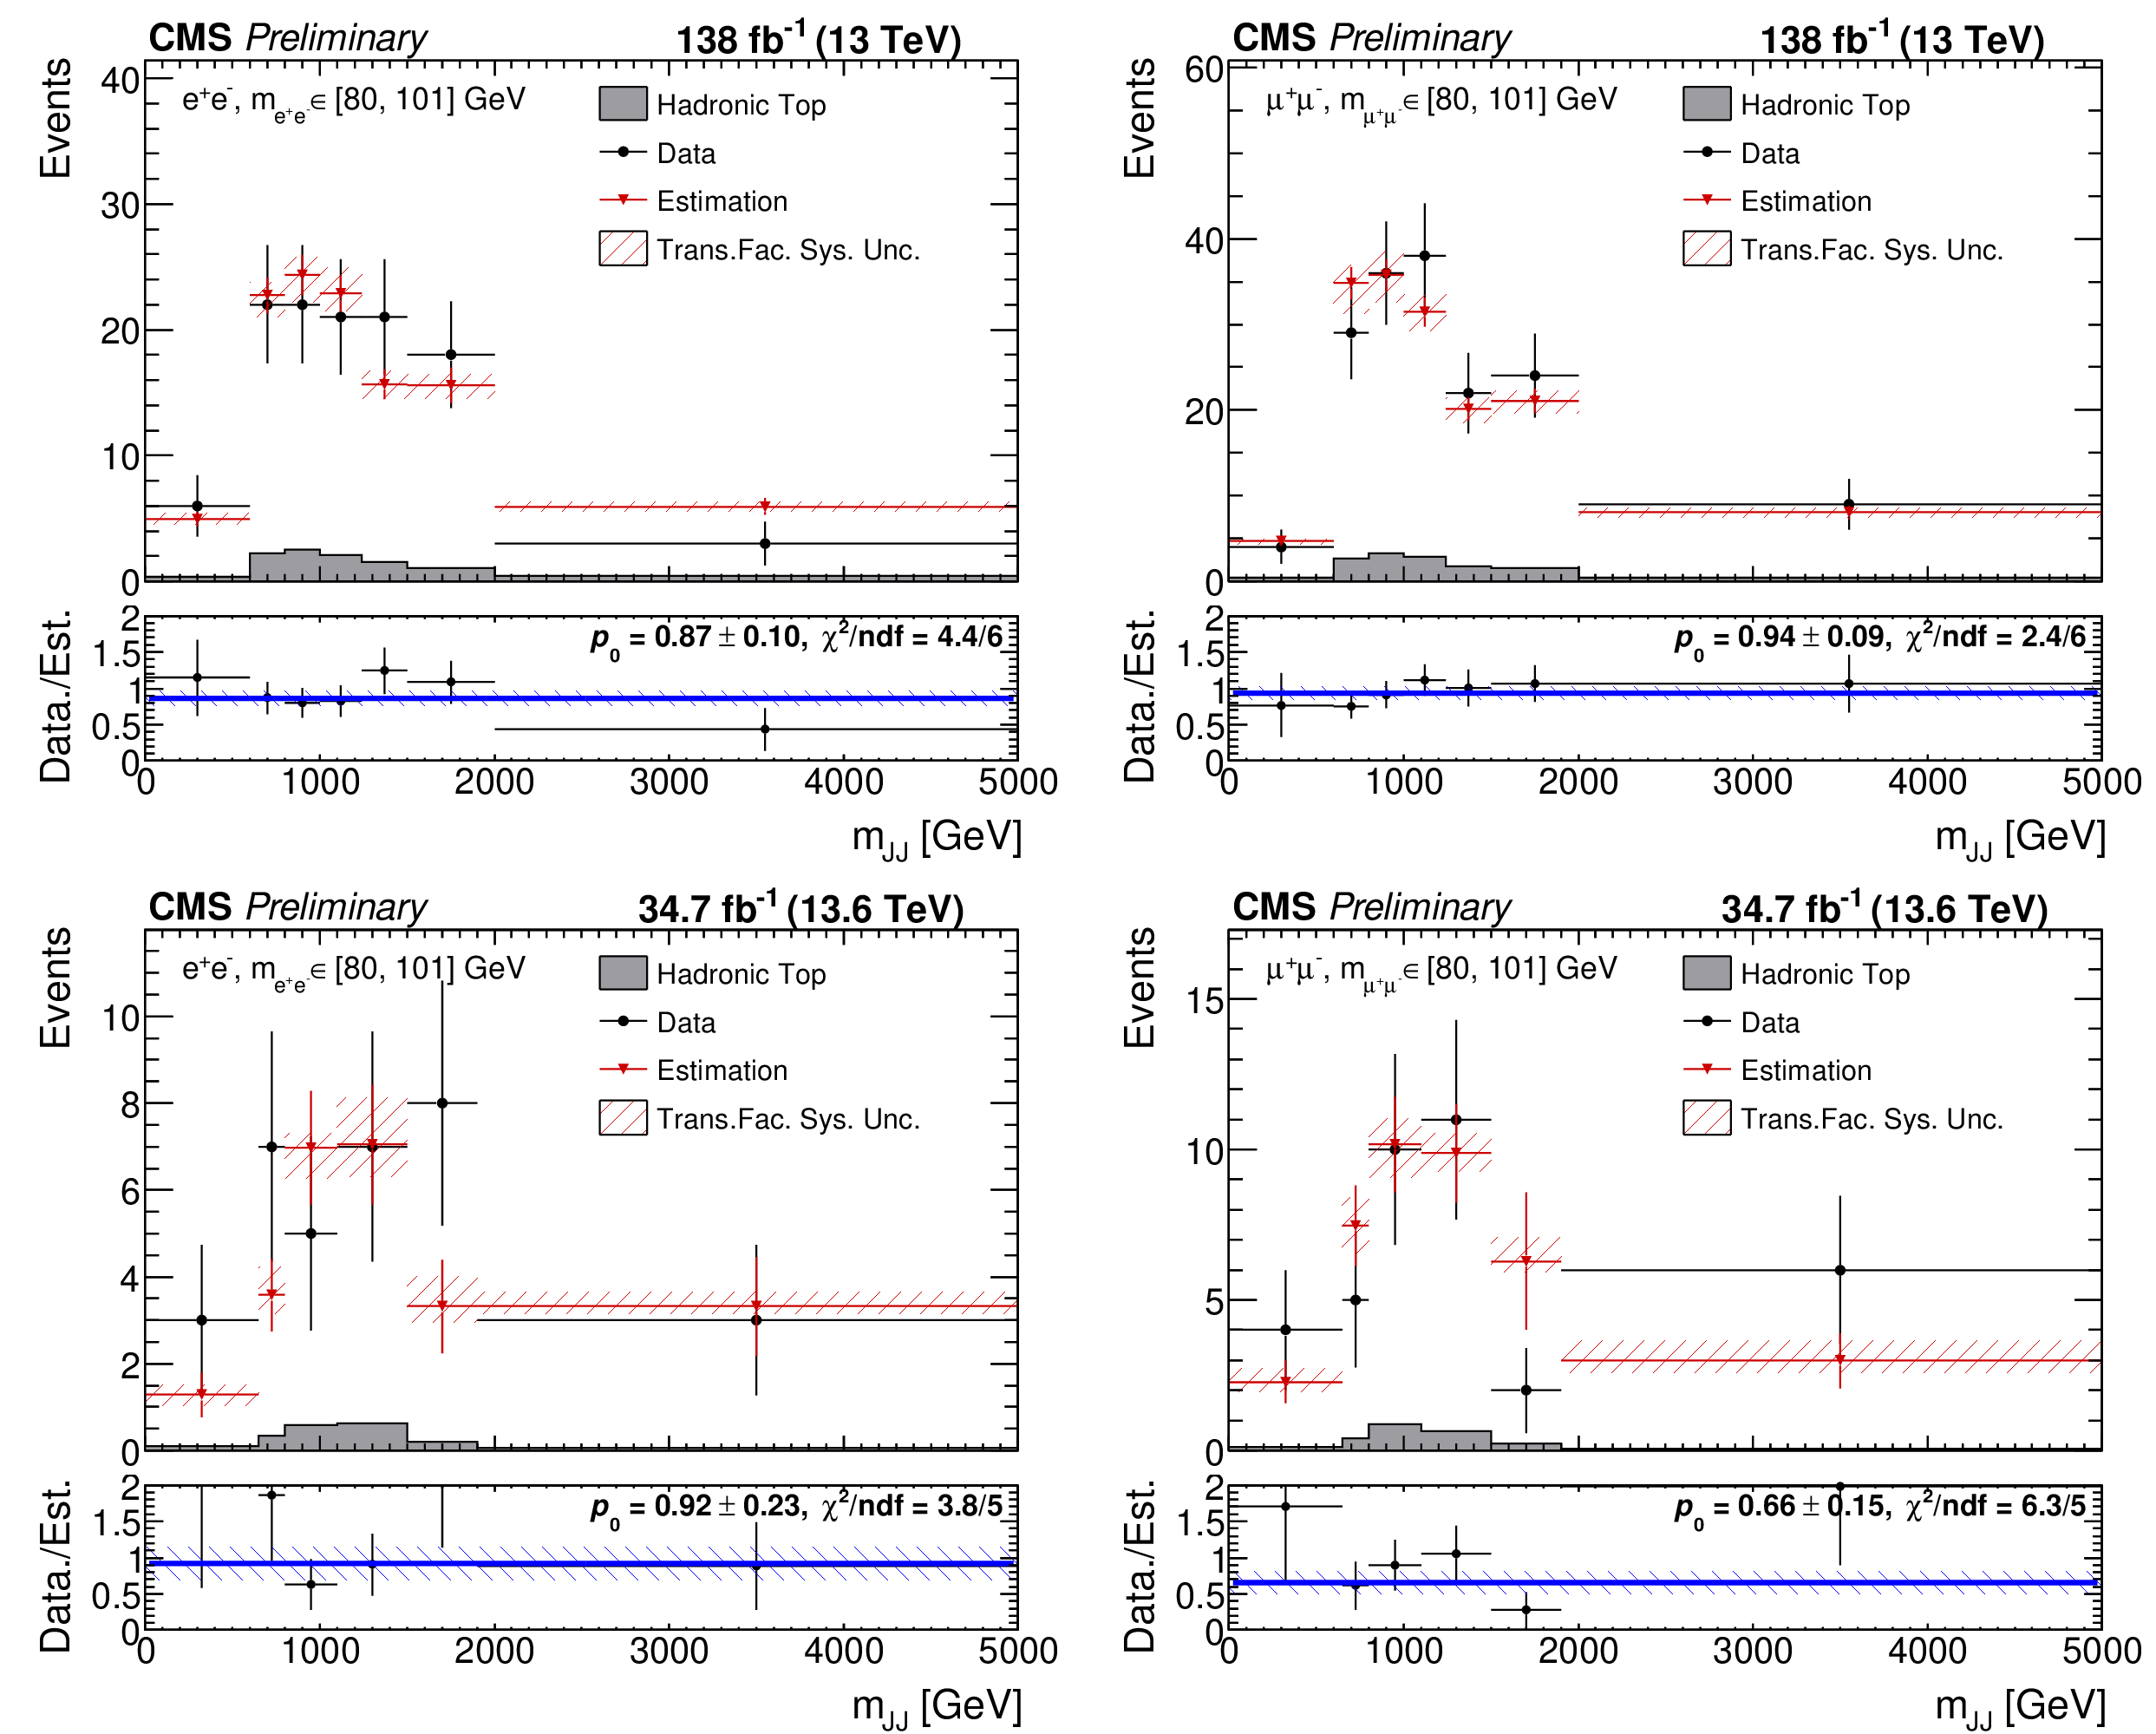
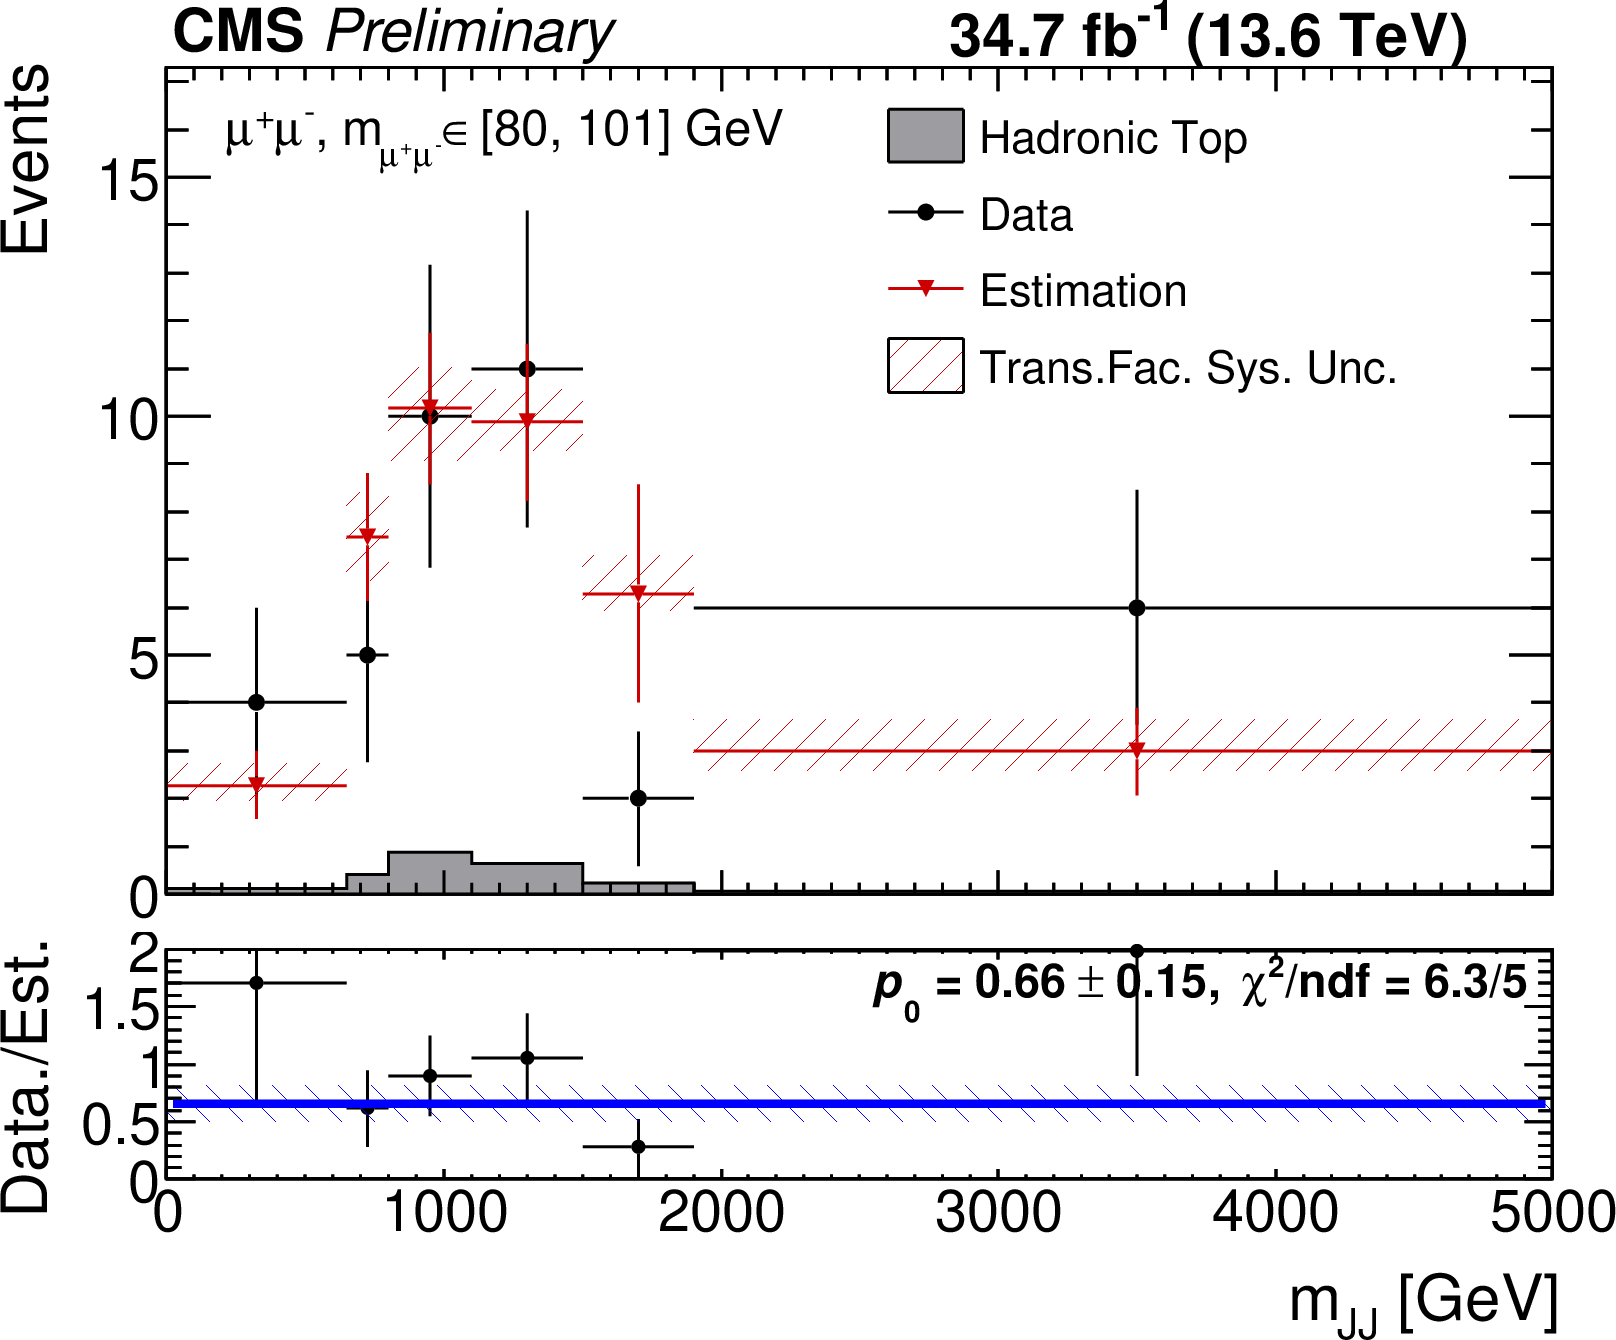
Distribution of the observed and estimated $ m_{\mathrm{JJ}} $ in CR2J2T for $ \mathrm{e}^{\pm} \mathrm{e}^{\mp} $ (left) and $ \mu^{\pm} \mu^{\mp}$ (right) events for the 2016--2018 data-taking periods (upper row) and the 2022 data-taking period (lower row). The horizontal lines (blue) in the ratio panels indicate the difference in total yield between data and the estimated background distributions, as determined from a fit to the ratio plot using a constant function. The $ \chi^2 $ value of the fit is also displayed. |
png pdf |
Figure 5-a:
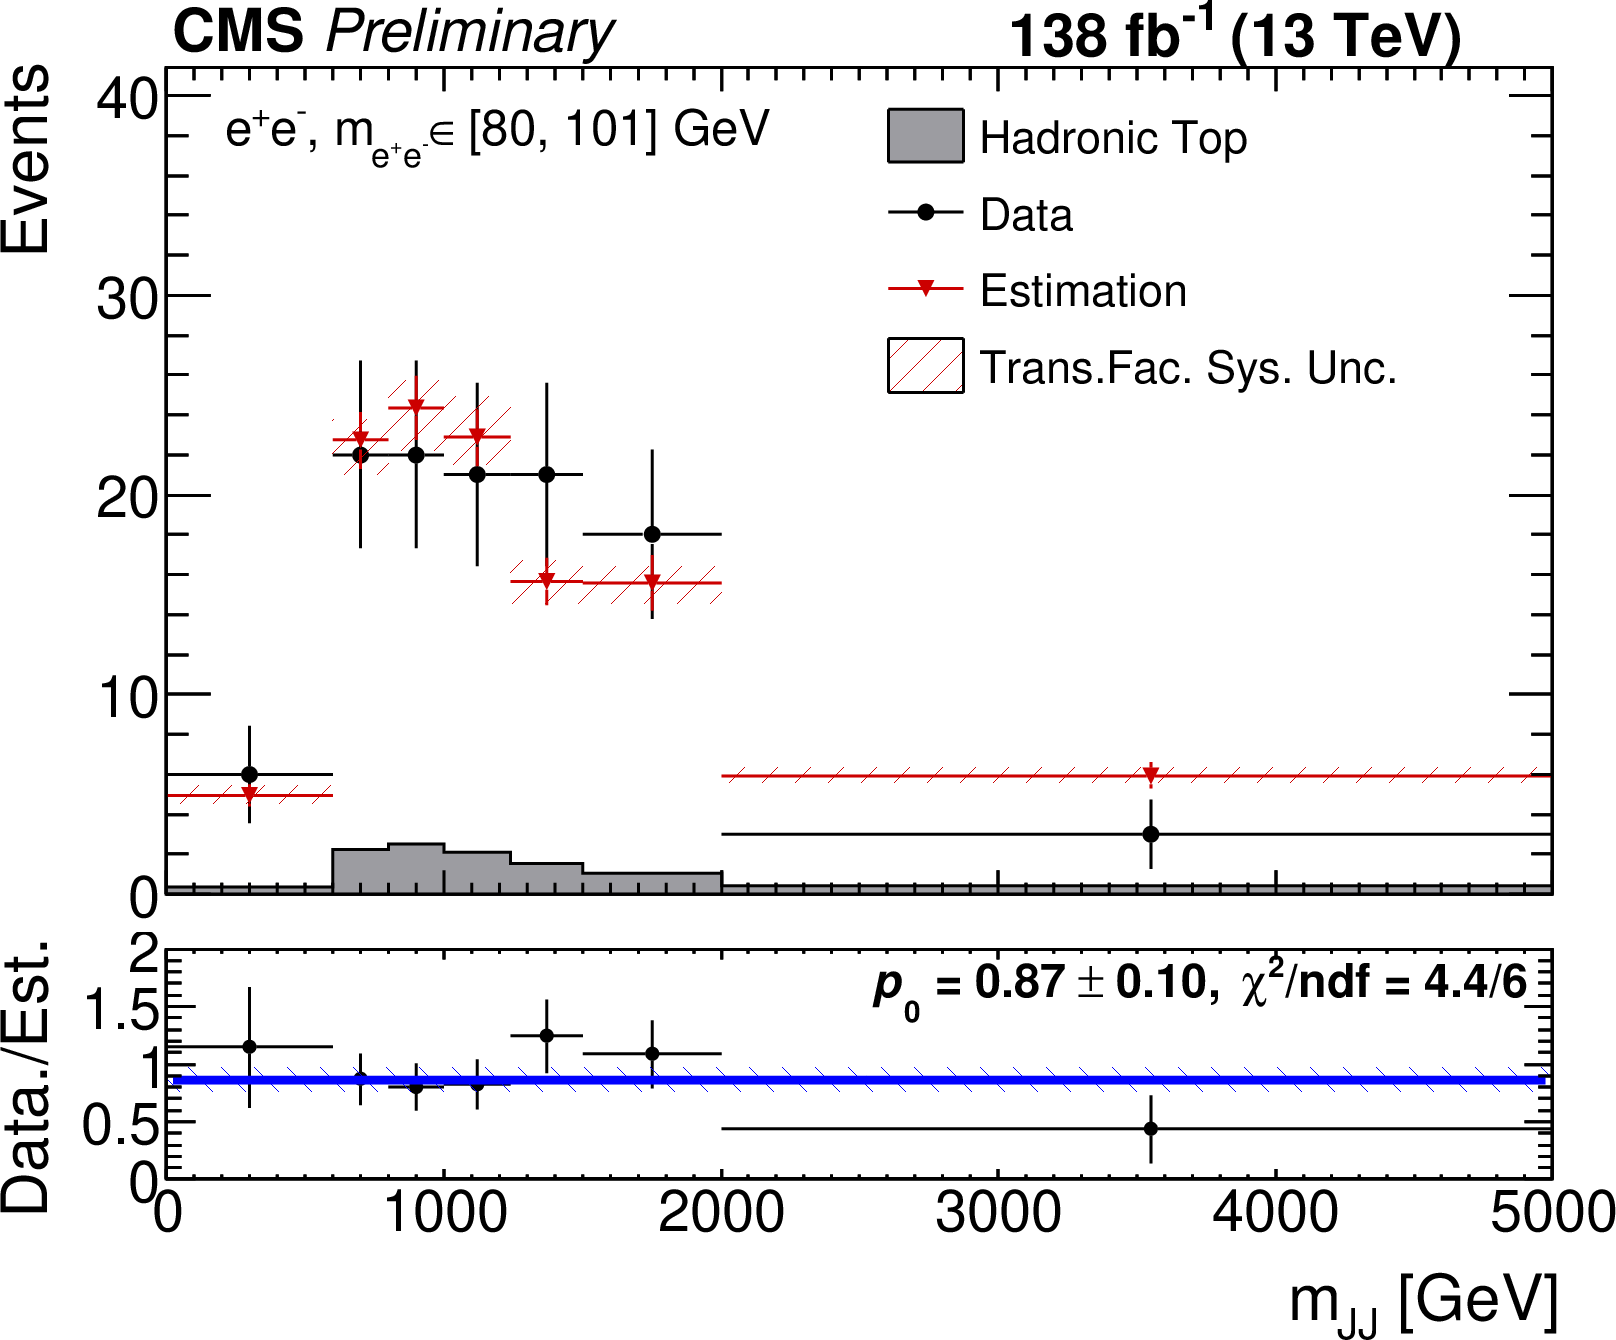
Distribution of the observed and estimated $ m_{\mathrm{JJ}} $ in CR2J2T for $ \mathrm{e}^{\pm} \mathrm{e}^{\mp} $ (left) and $ \mu^{\pm} \mu^{\mp}$ (right) events for the 2016--2018 data-taking periods (upper row) and the 2022 data-taking period (lower row). The horizontal lines (blue) in the ratio panels indicate the difference in total yield between data and the estimated background distributions, as determined from a fit to the ratio plot using a constant function. The $ \chi^2 $ value of the fit is also displayed. |
png pdf |
Figure 5-b:
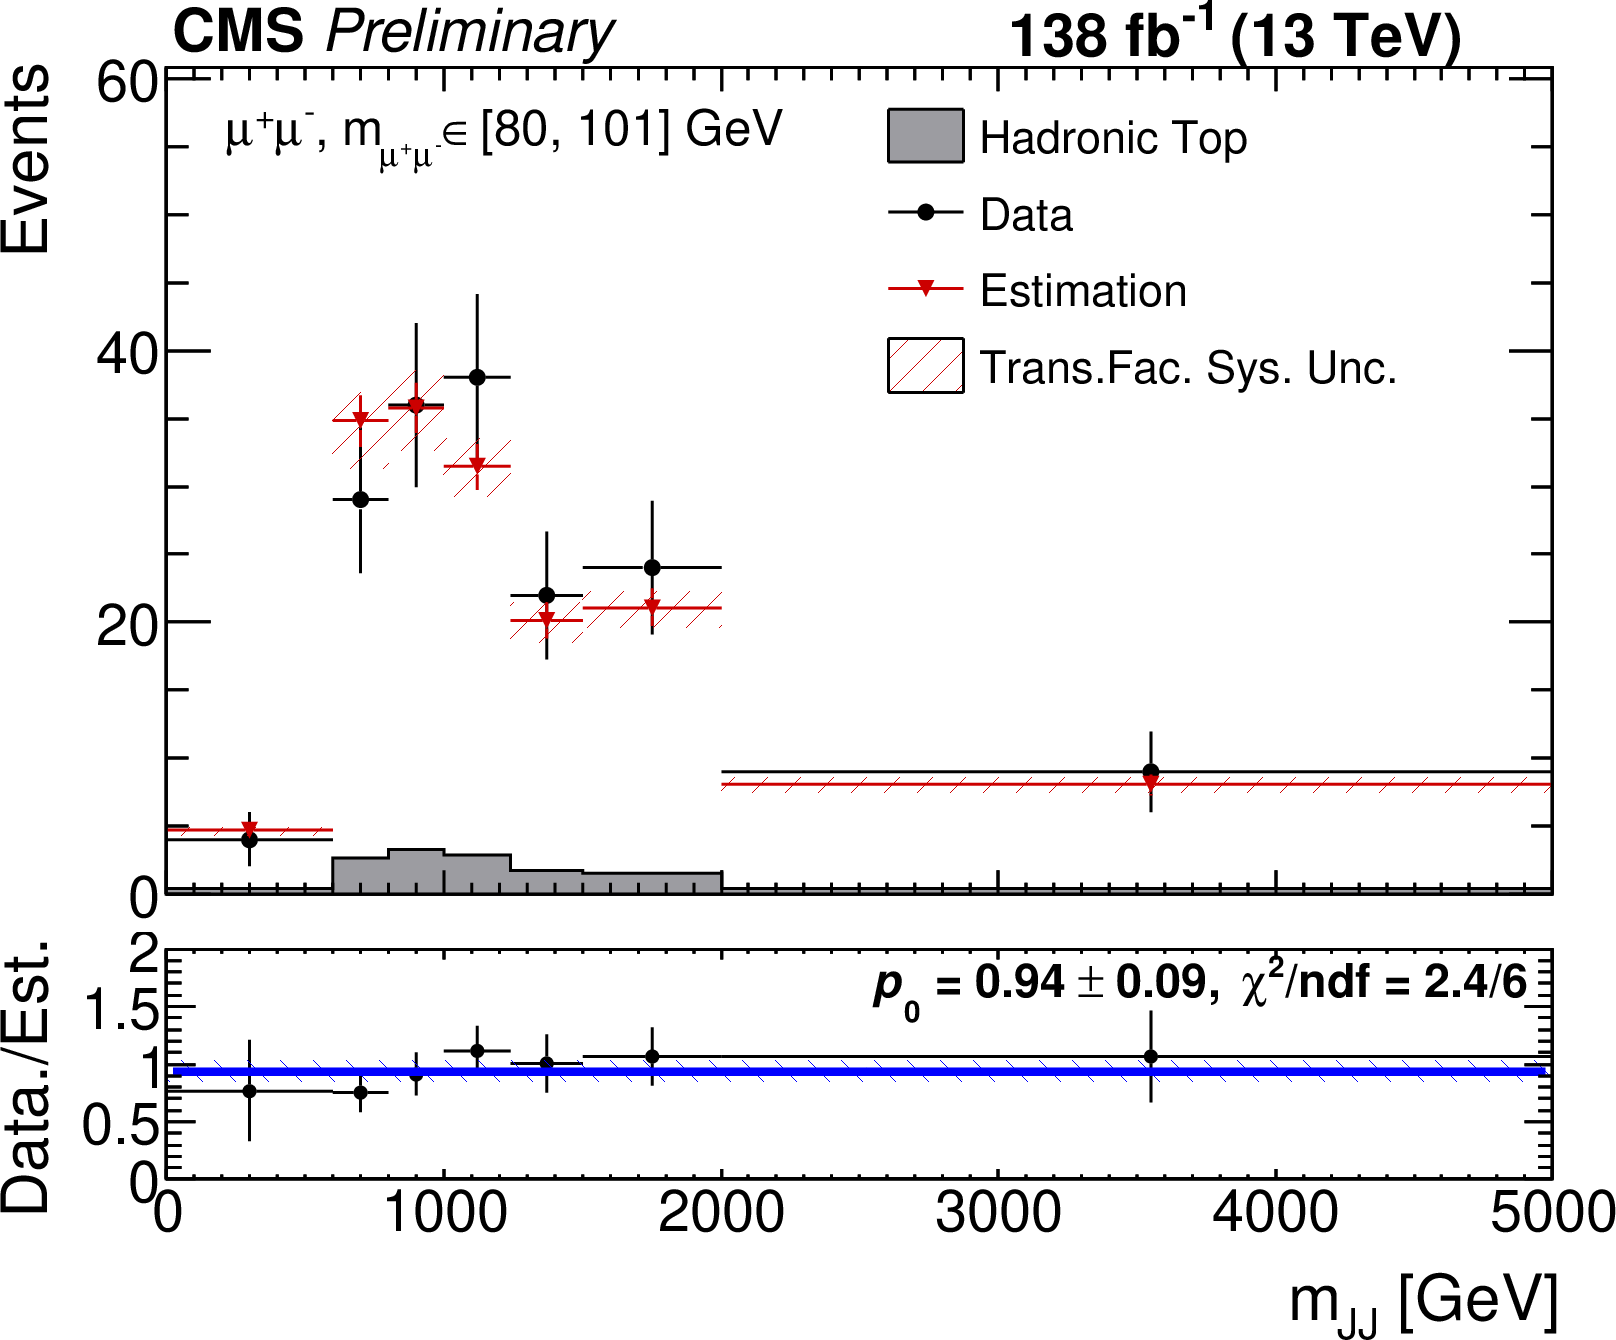
Distribution of the observed and estimated $ m_{\mathrm{JJ}} $ in CR2J2T for $ \mathrm{e}^{\pm} \mathrm{e}^{\mp} $ (left) and $ \mu^{\pm} \mu^{\mp}$ (right) events for the 2016--2018 data-taking periods (upper row) and the 2022 data-taking period (lower row). The horizontal lines (blue) in the ratio panels indicate the difference in total yield between data and the estimated background distributions, as determined from a fit to the ratio plot using a constant function. The $ \chi^2 $ value of the fit is also displayed. |
png pdf |
Figure 5-c:
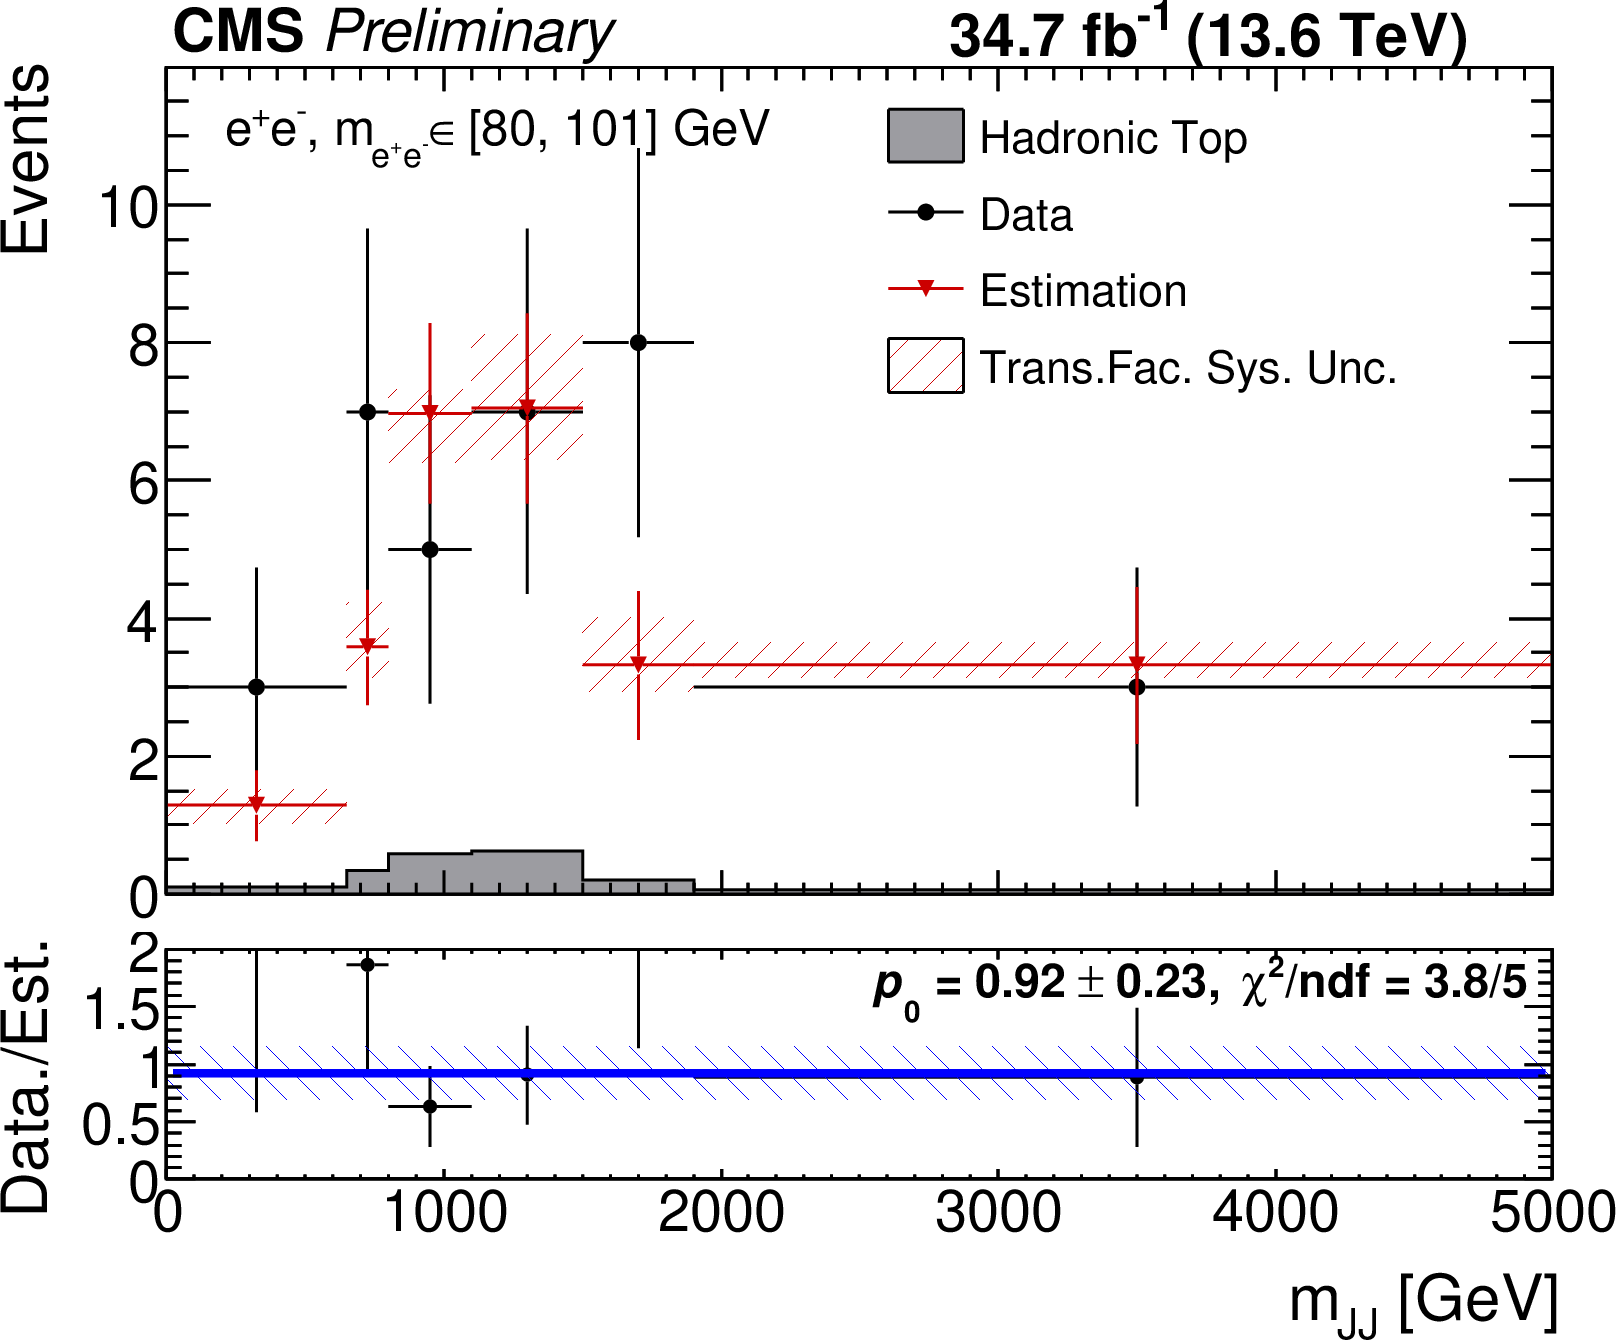
Distribution of the observed and estimated $ m_{\mathrm{JJ}} $ in CR2J2T for $ \mathrm{e}^{\pm} \mathrm{e}^{\mp} $ (left) and $ \mu^{\pm} \mu^{\mp}$ (right) events for the 2016--2018 data-taking periods (upper row) and the 2022 data-taking period (lower row). The horizontal lines (blue) in the ratio panels indicate the difference in total yield between data and the estimated background distributions, as determined from a fit to the ratio plot using a constant function. The $ \chi^2 $ value of the fit is also displayed. |
png pdf |
Figure 5-d:
Distribution of the observed and estimated $ m_{\mathrm{JJ}} $ in CR2J2T for $ \mathrm{e}^{\pm} \mathrm{e}^{\mp} $ (left) and $ \mu^{\pm} \mu^{\mp}$ (right) events for the 2016--2018 data-taking periods (upper row) and the 2022 data-taking period (lower row). The horizontal lines (blue) in the ratio panels indicate the difference in total yield between data and the estimated background distributions, as determined from a fit to the ratio plot using a constant function. The $ \chi^2 $ value of the fit is also displayed. |
png pdf |
Figure 6:
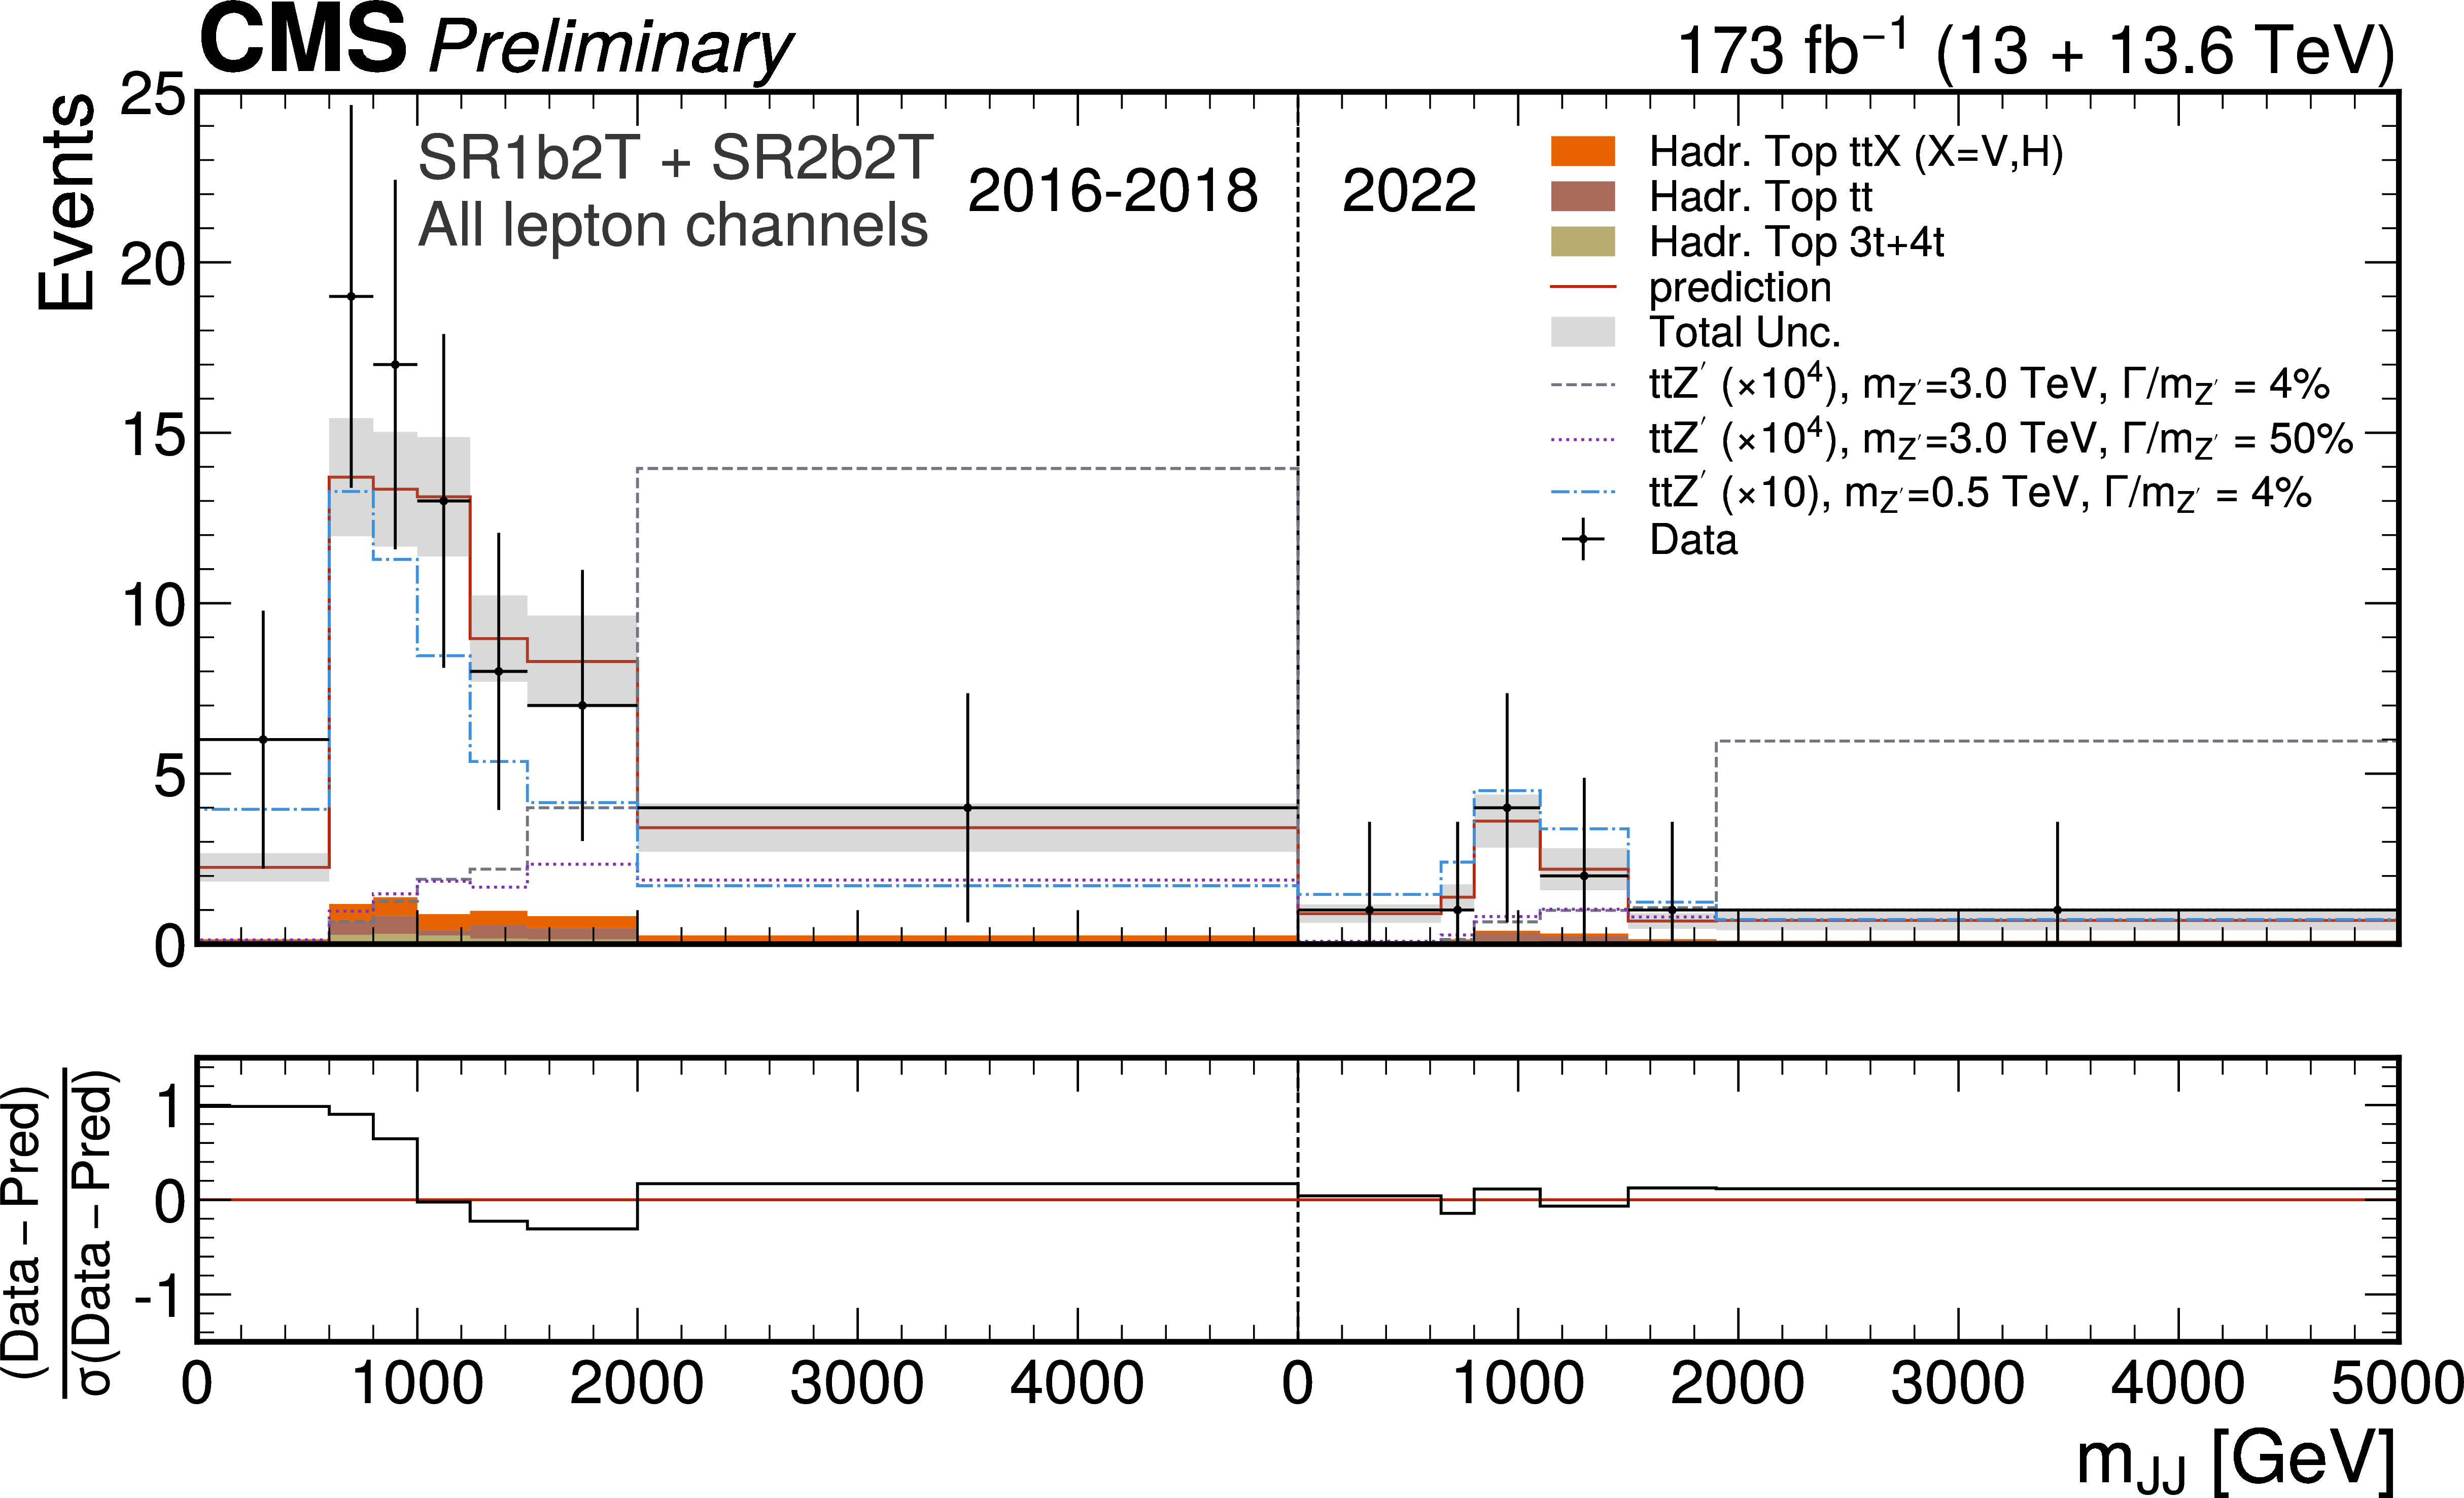
The post-fit distribution of $ m_{\mathrm{JJ}} $ for the background prediction (red line), including contributions estimated directly from simulation (filled bins) in the merged SR1b2T and SR2b2T for the 2016--2018 (left) and 2022 (right) data-taking periods. The $ \mathrm{Z}^{'} $ signal scenarios with $ m_{\mathrm{Z}^{'}}= $ 500 GeV and $ \Gamma_{\mathrm{Z}^{'}}/m_{\mathrm{Z}^{'}}=4% $, and $ m_{\mathrm{Z}^{'}}= $ 3000 GeV and $ \Gamma_{\mathrm{Z}^{'}}/m_{\mathrm{Z}^{'}}= $ 4 and 50%, are overlaid. The signal cross sections are scaled as indicated in the legends. |
png pdf |
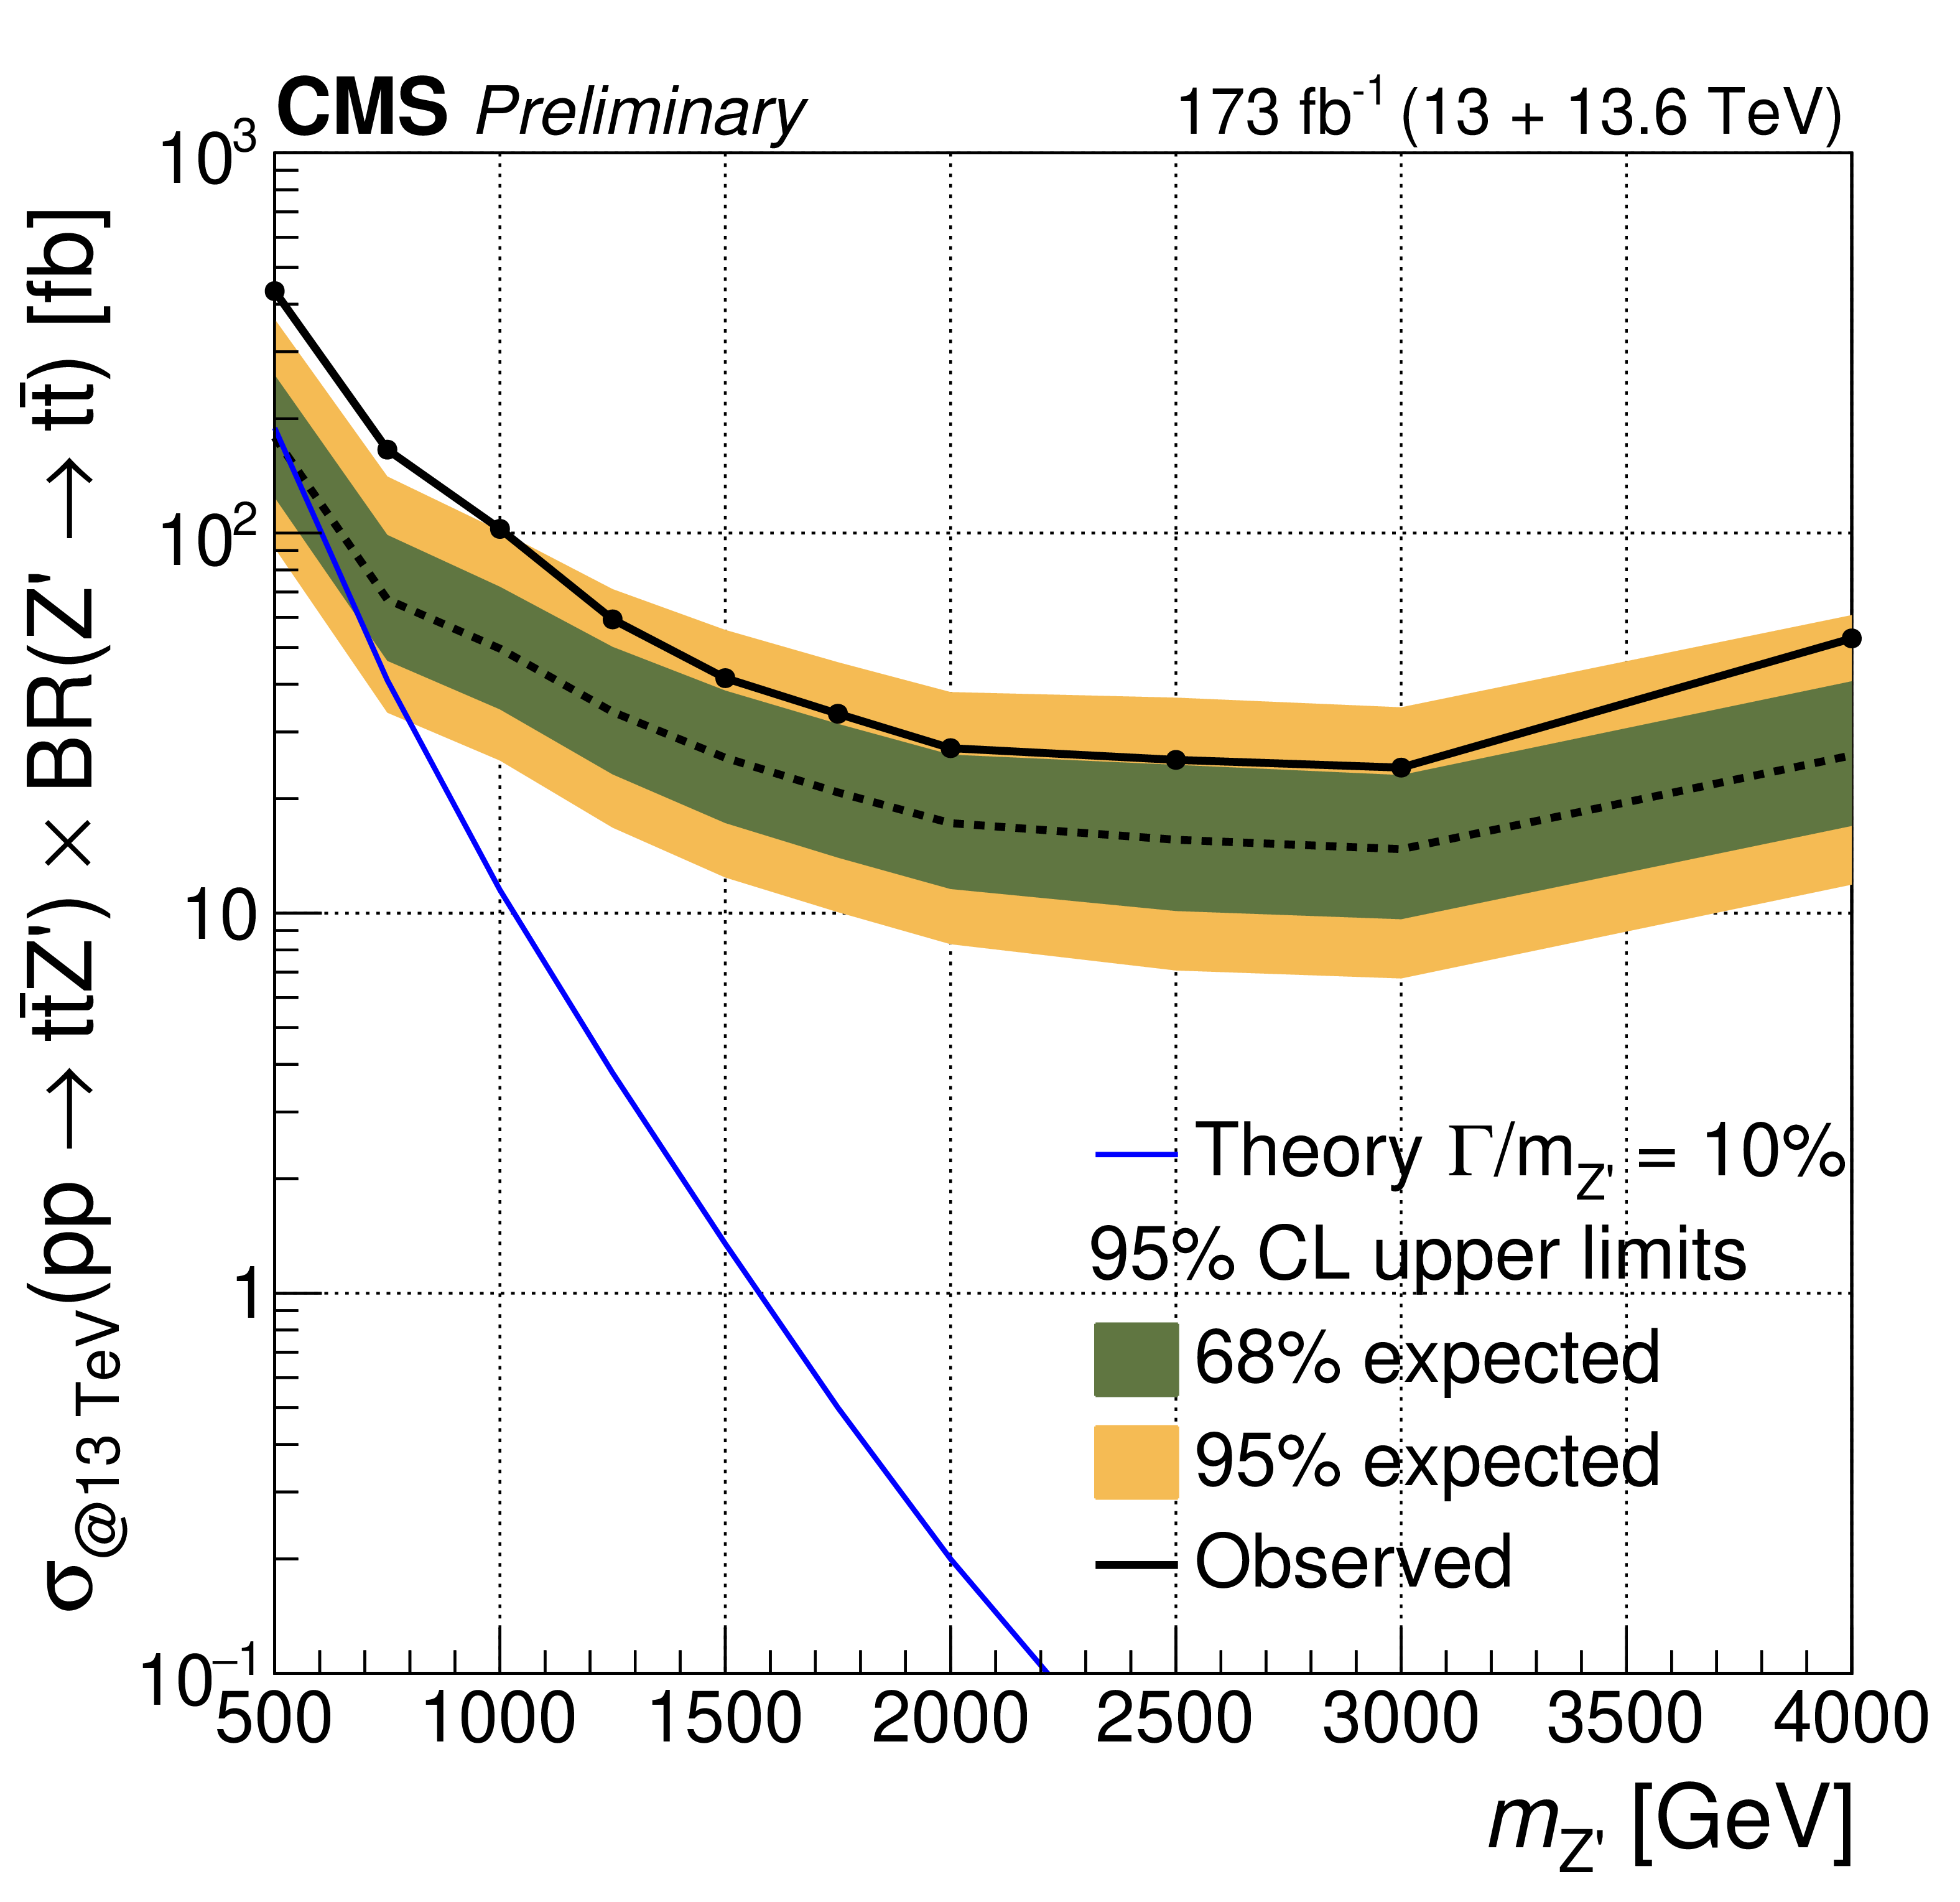
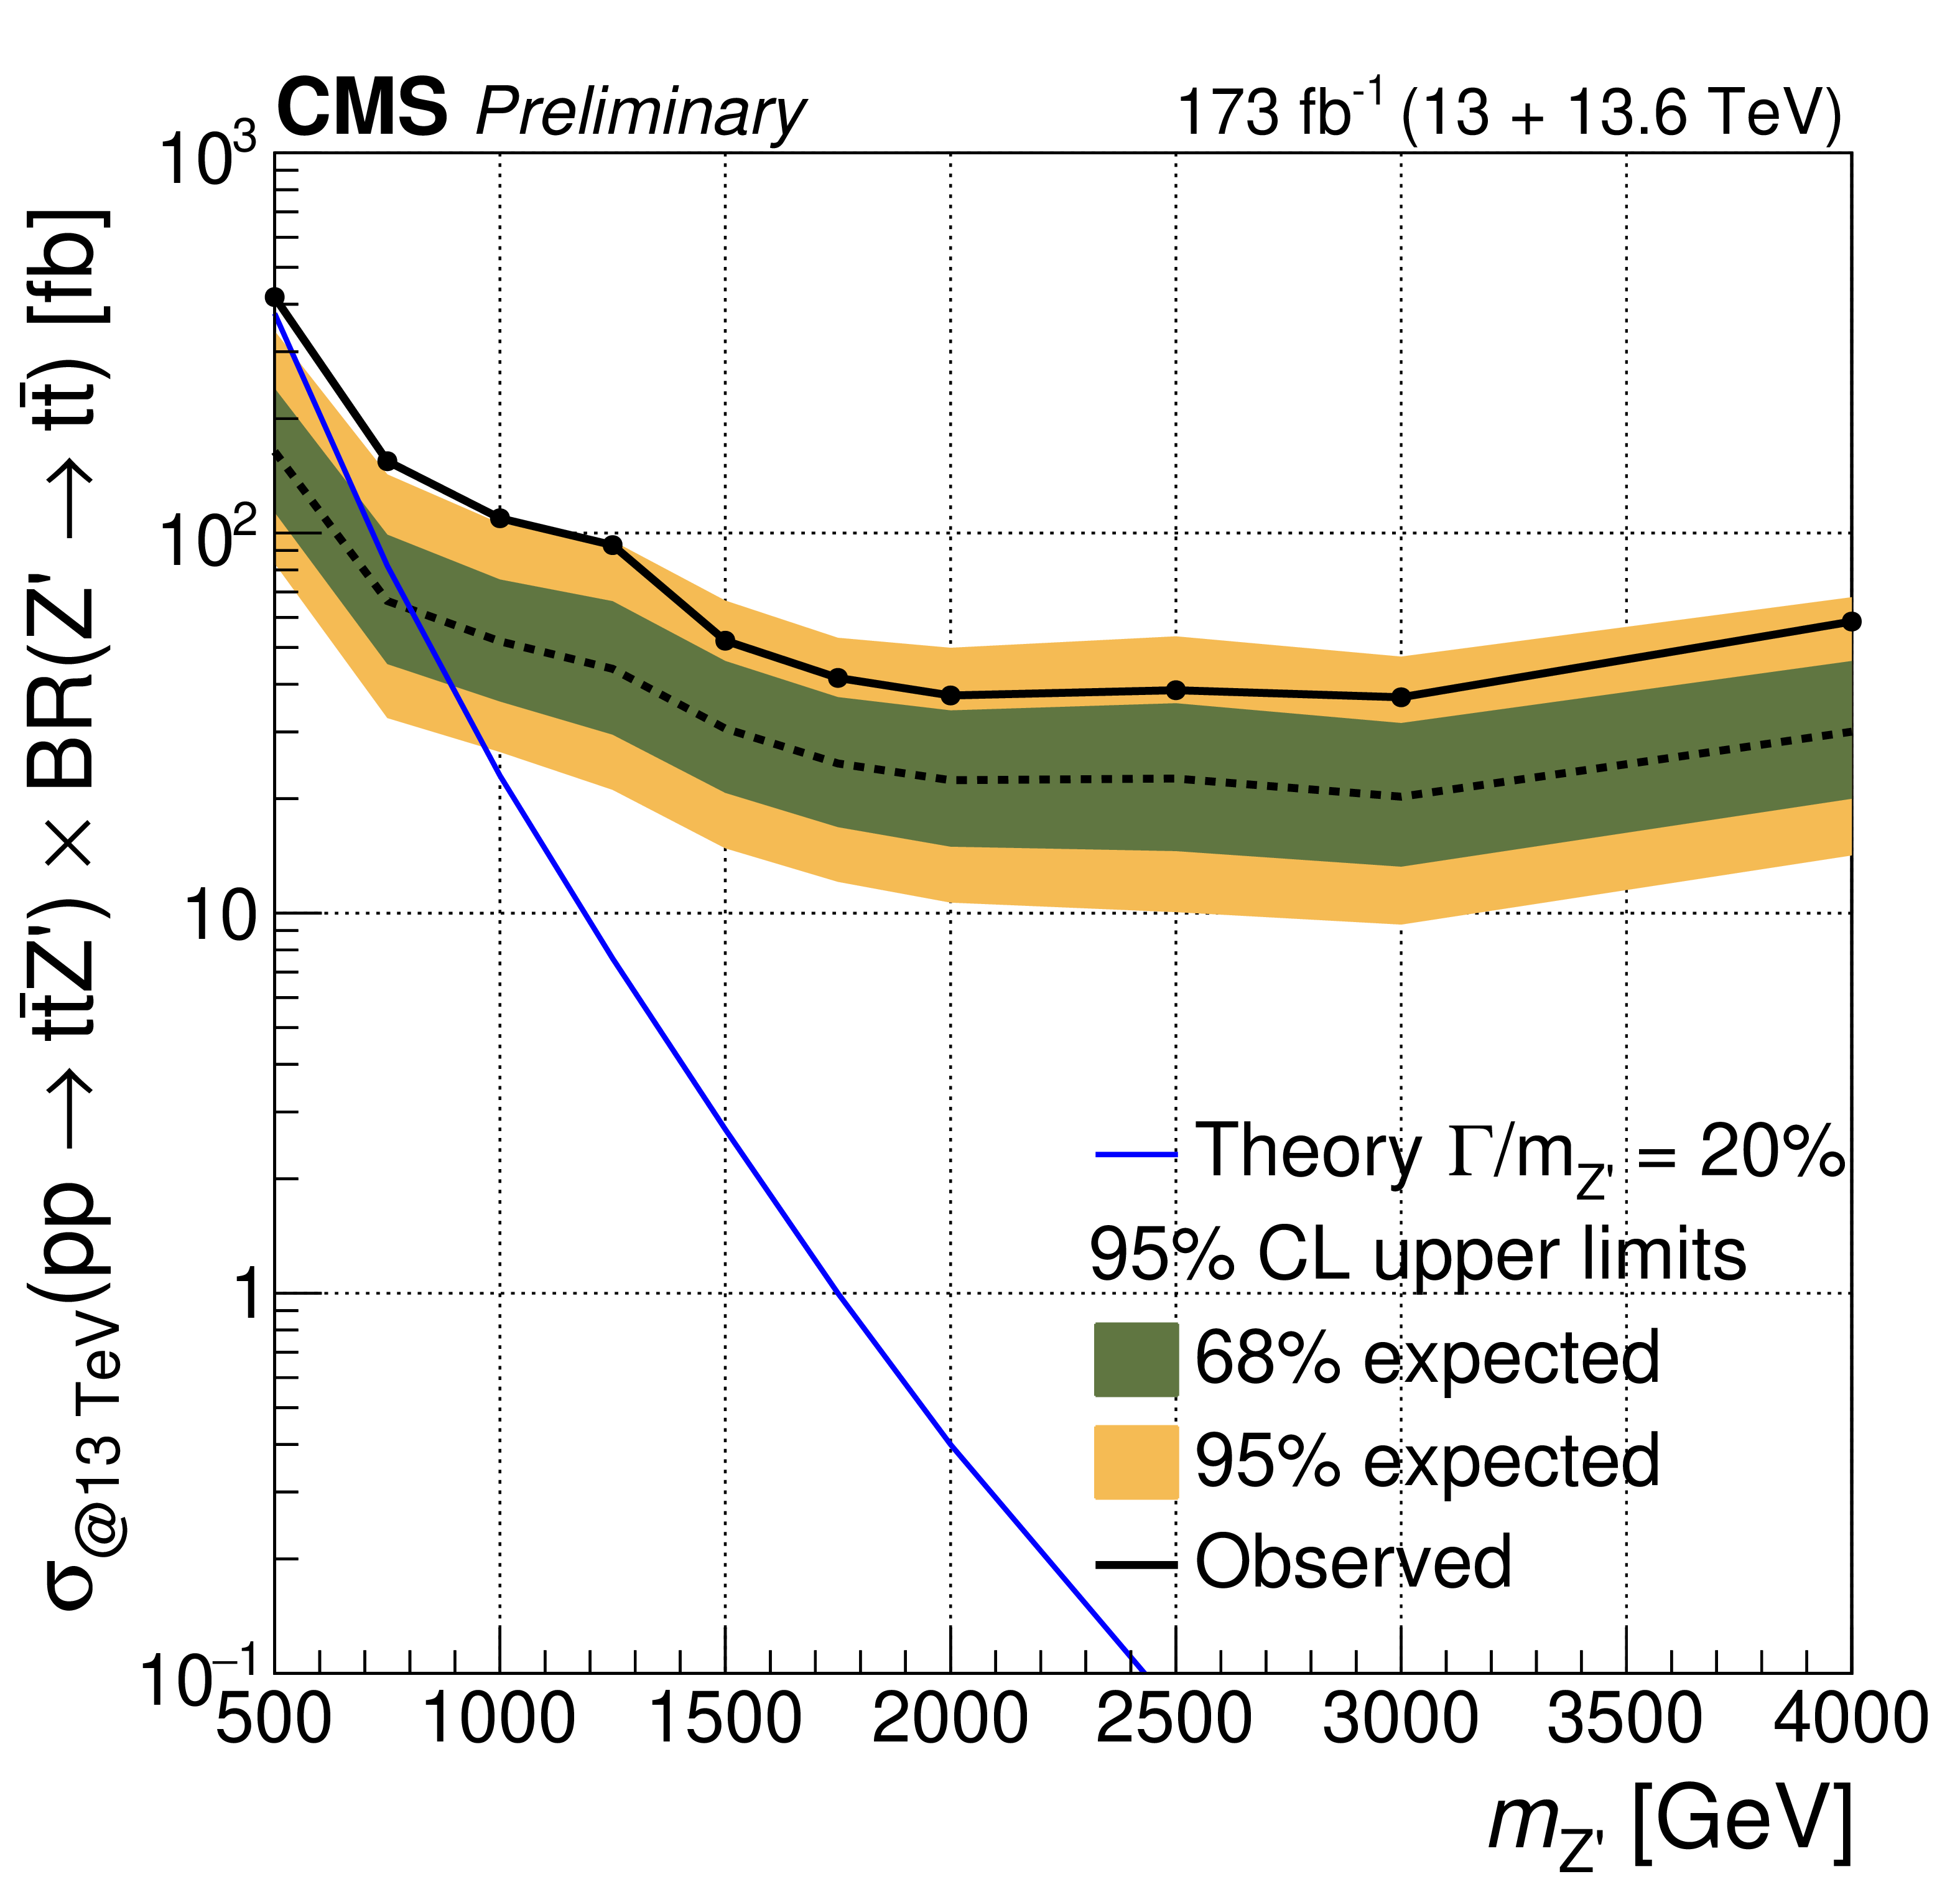
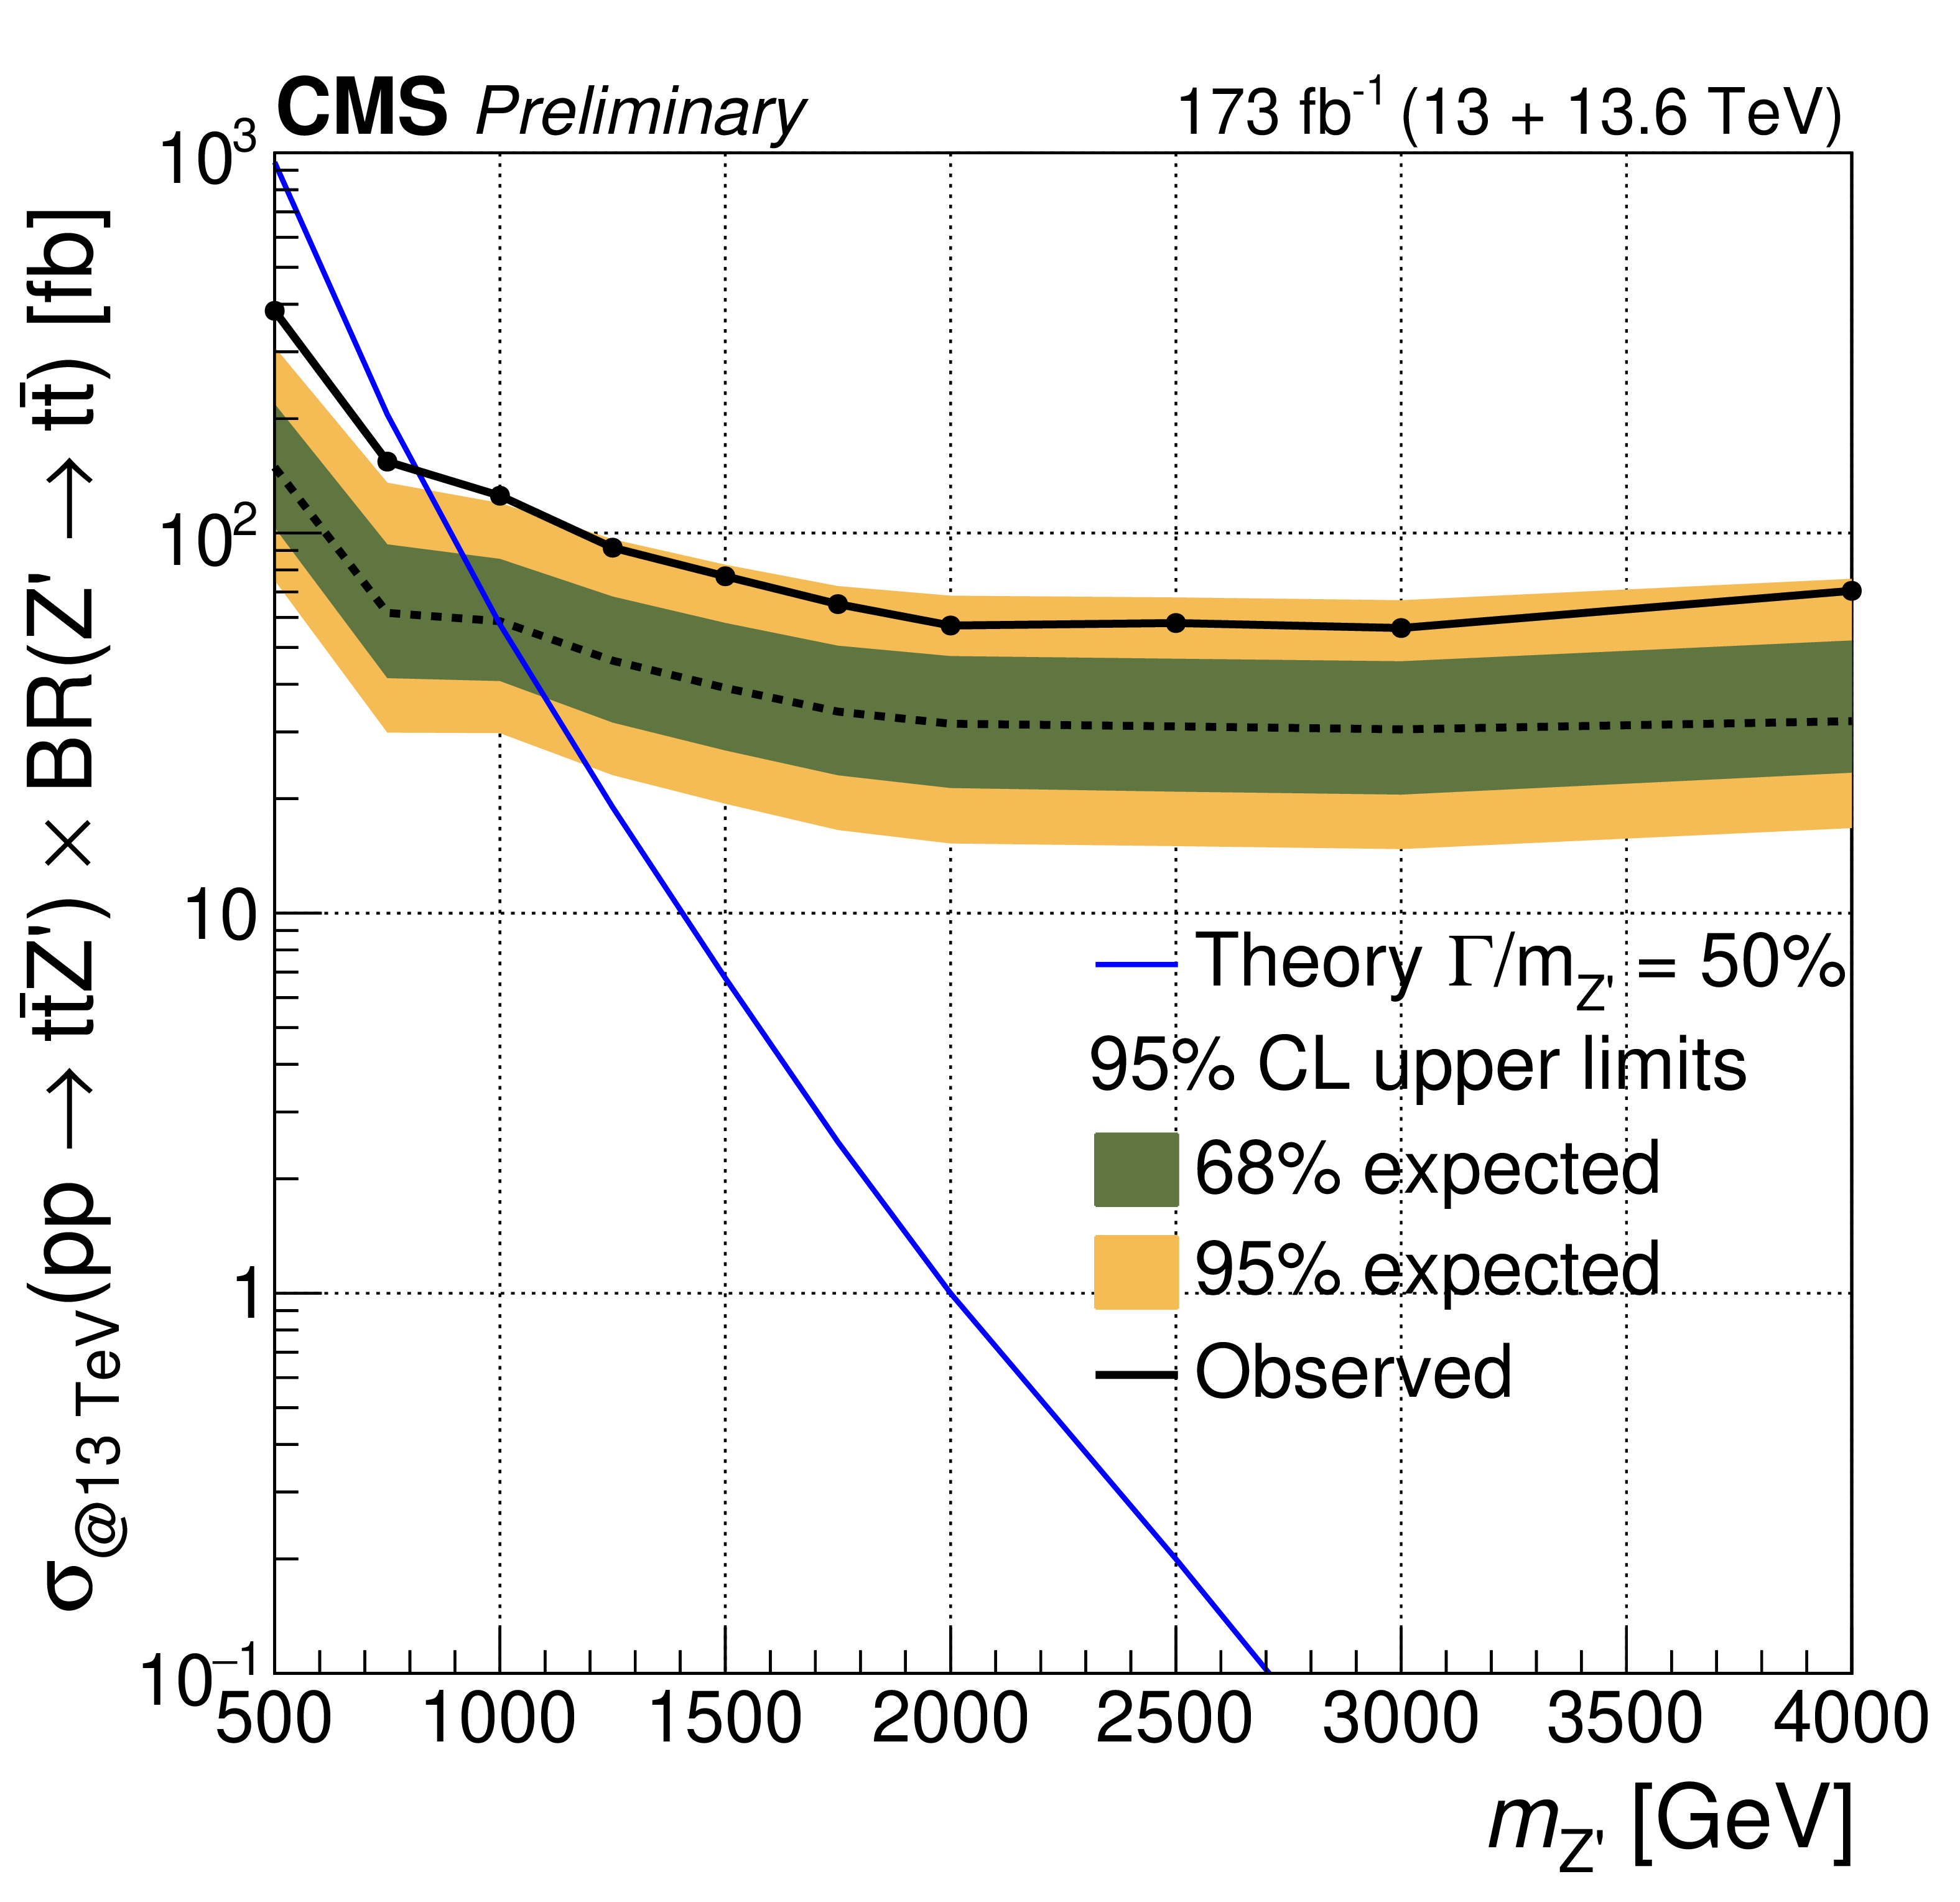
Figure 7:
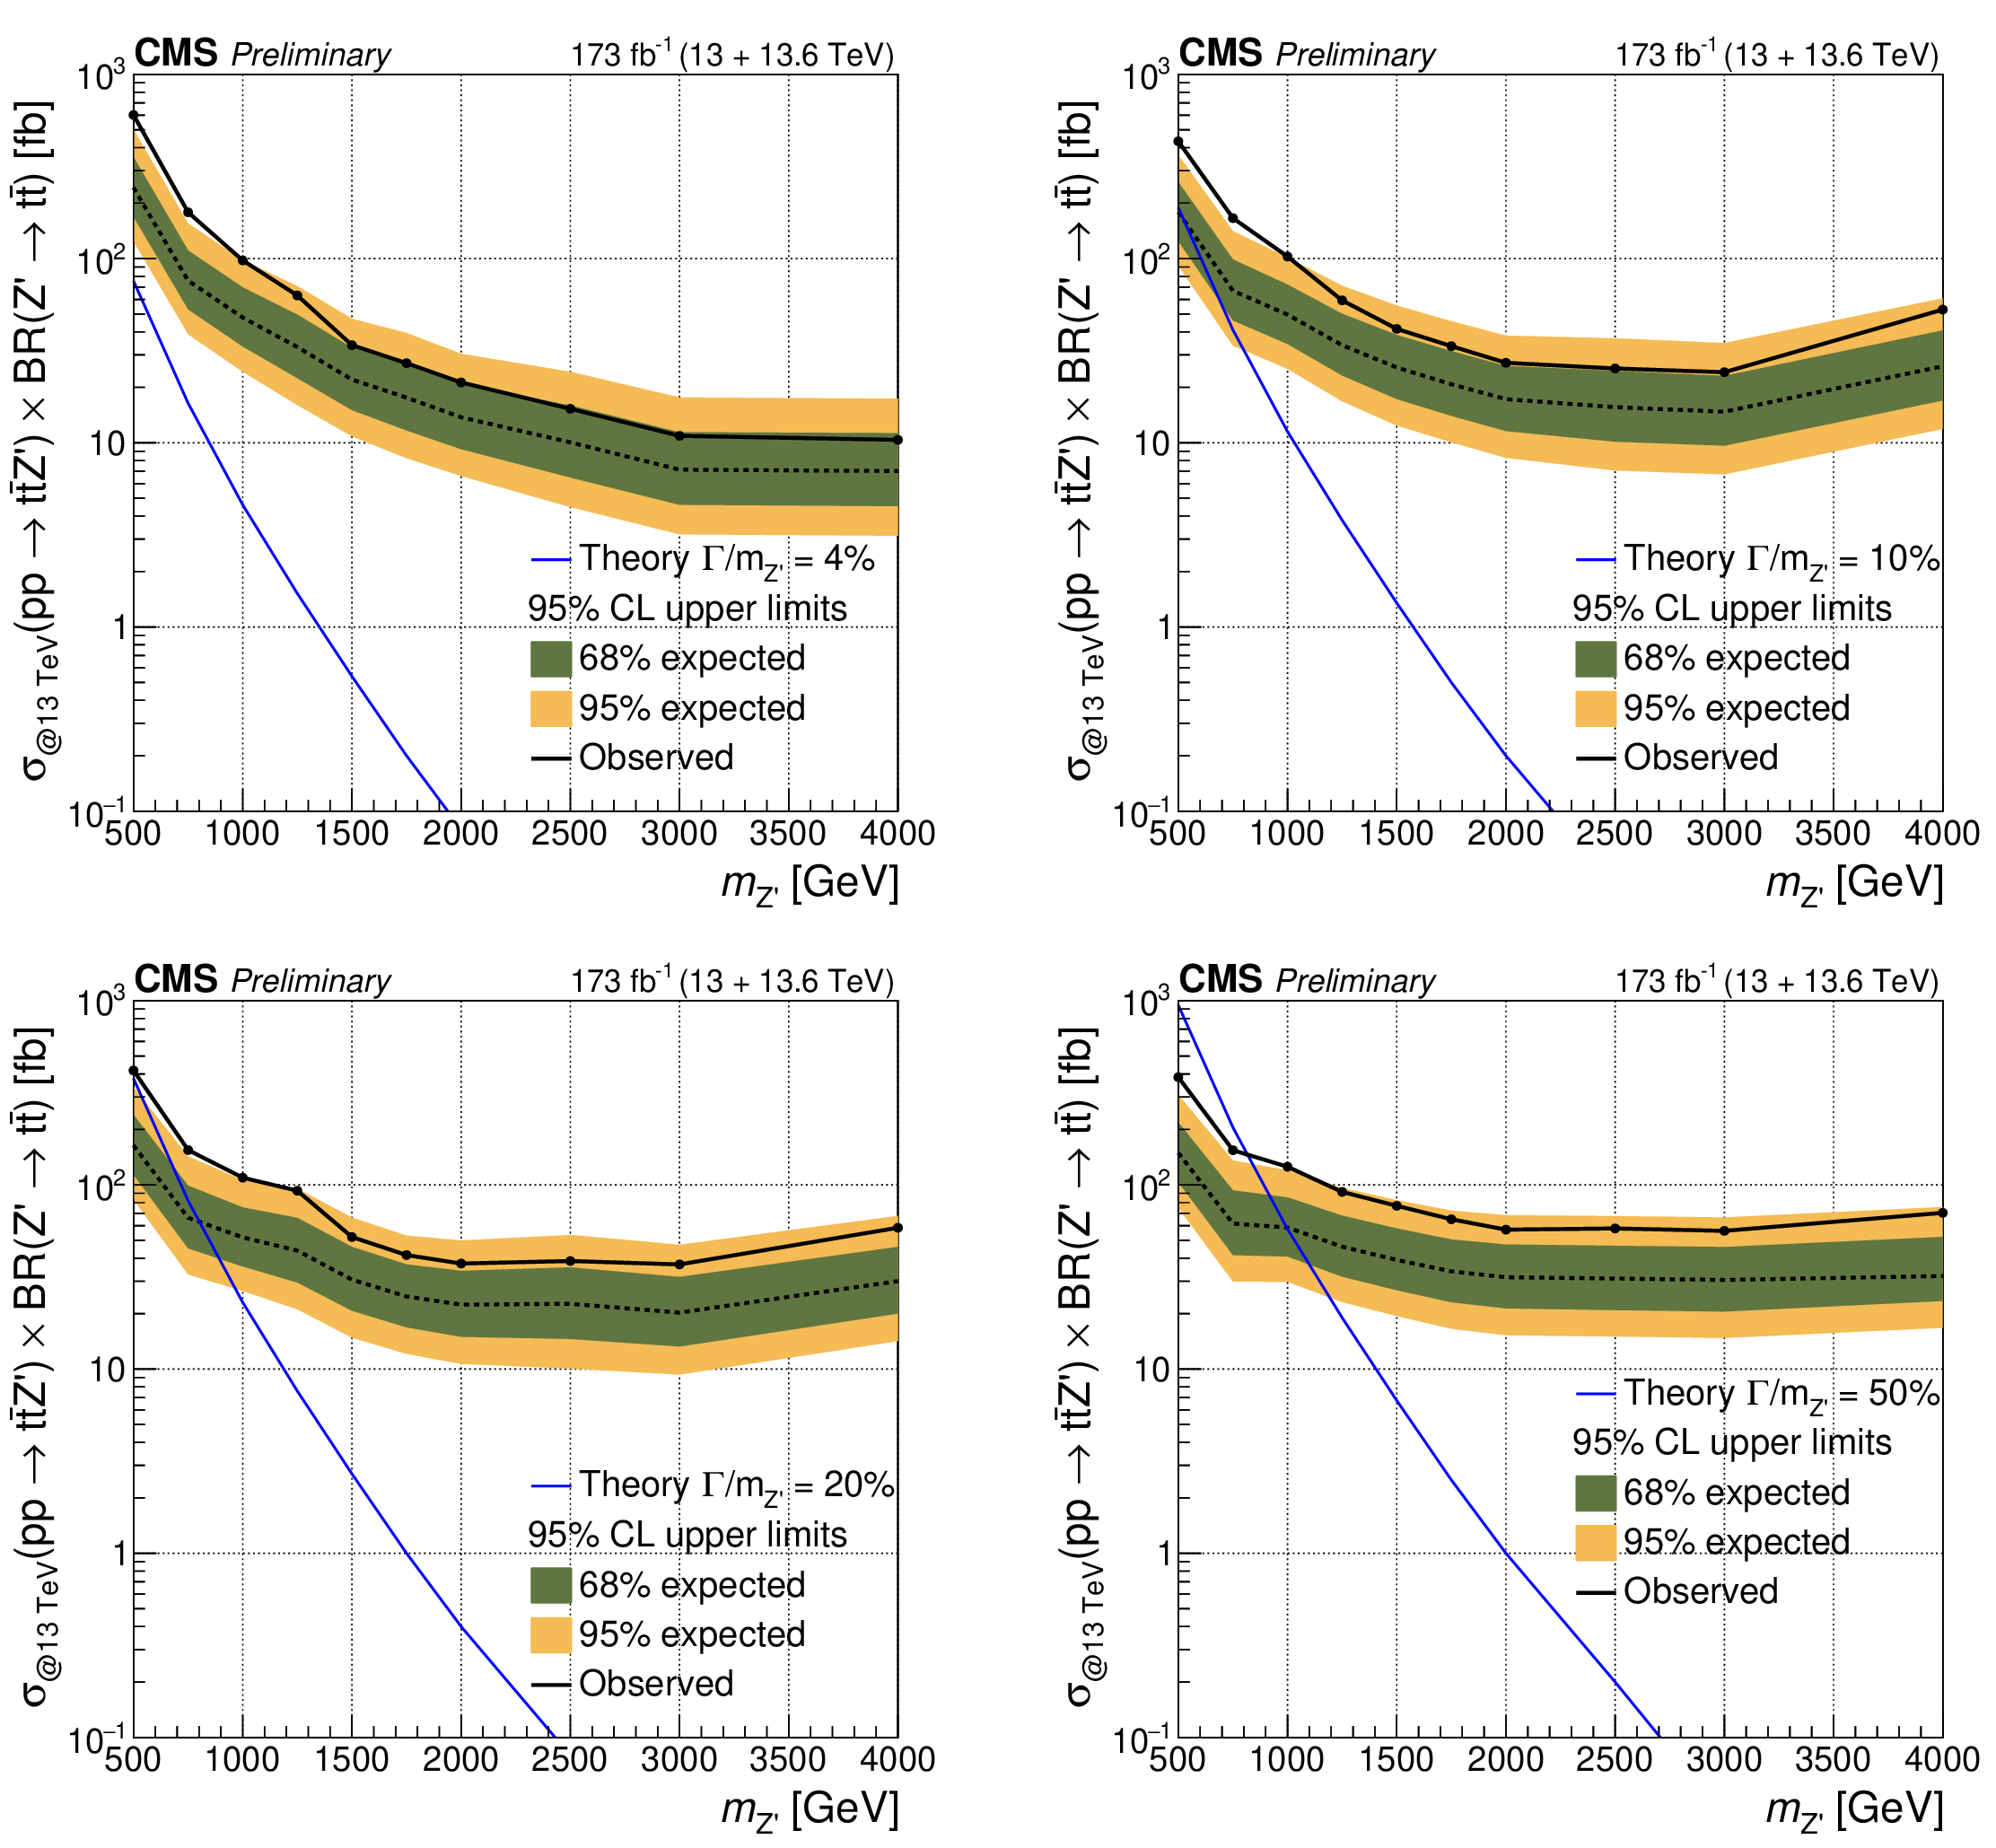
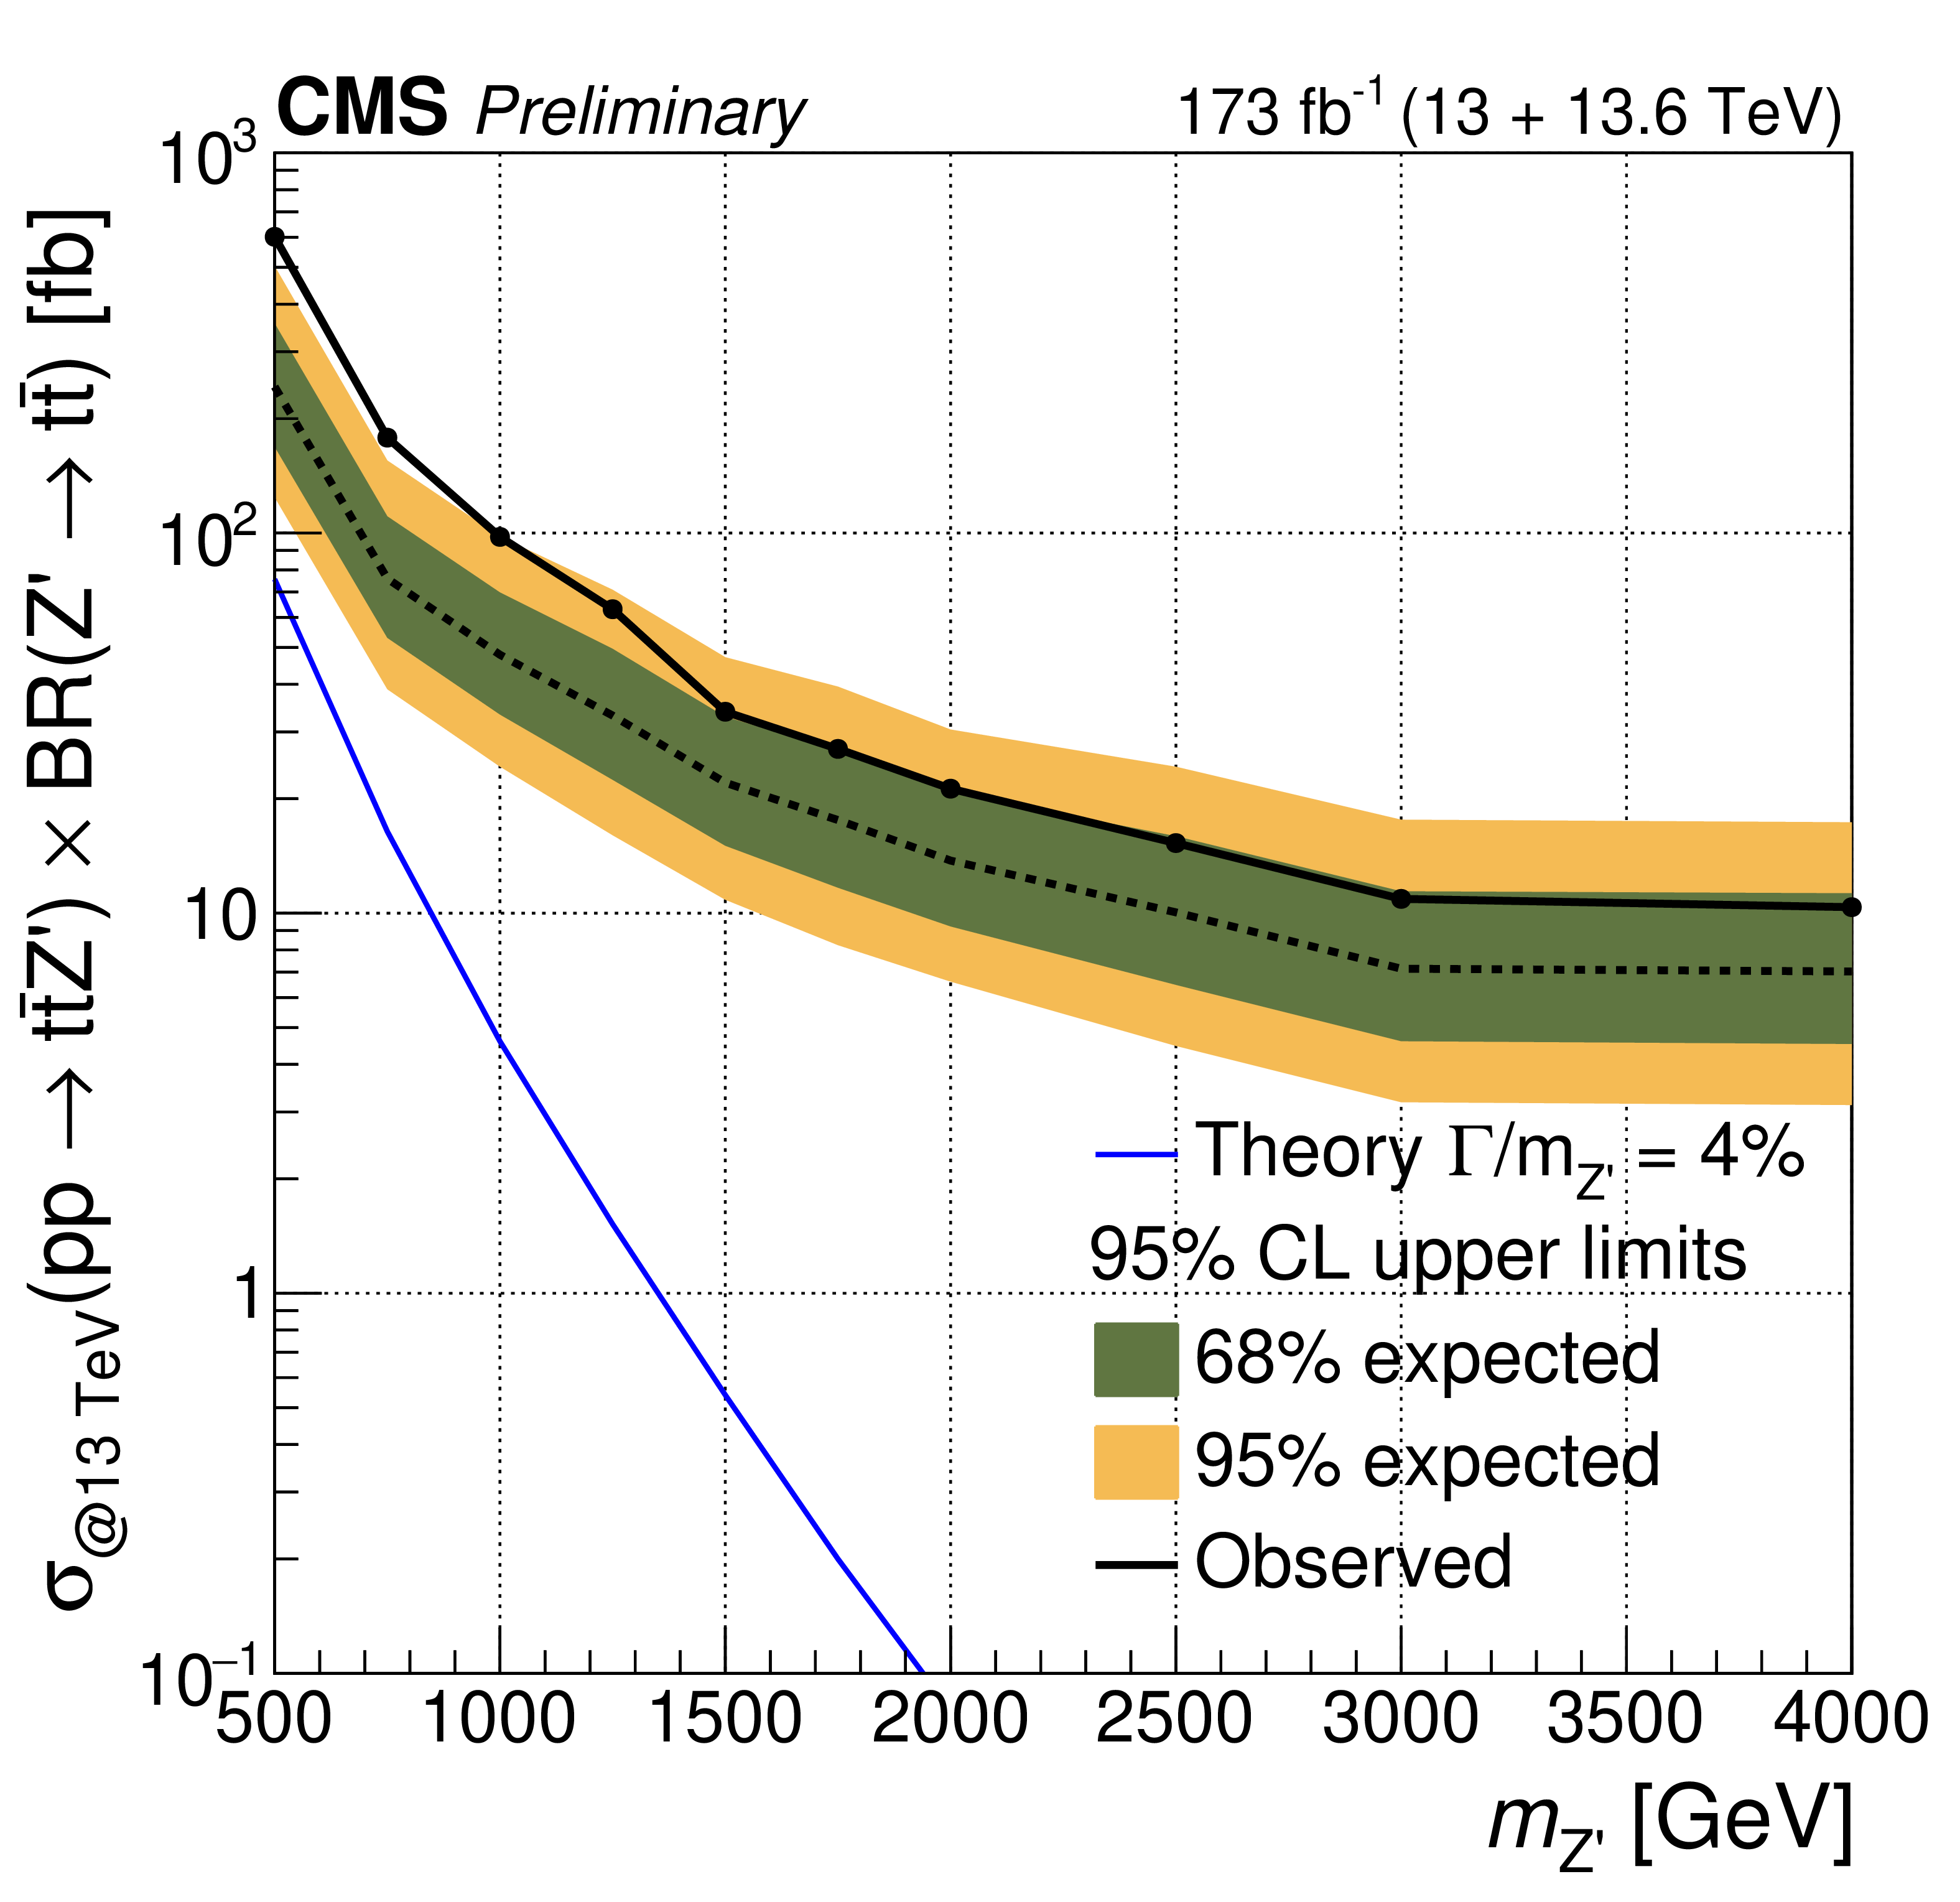
Expected and observed upper limits at 95% CL on the $ \mathrm{t} \overline{\mathrm{t}} $ $ \mathrm{Z}^{'} $ production cross section times branching fraction at 13 TeV as a function of $ m_{\mathrm{Z}^{'}} $ for various relative decay widths $ \Gamma_{\mathrm{Z}^{'}}/m_{\mathrm{Z}^{'}} $ as indicated in the legends. |
png pdf |
Figure 7-a:
Expected and observed upper limits at 95% CL on the $ \mathrm{t} \overline{\mathrm{t}} $ $ \mathrm{Z}^{'} $ production cross section times branching fraction at 13 TeV as a function of $ m_{\mathrm{Z}^{'}} $ for various relative decay widths $ \Gamma_{\mathrm{Z}^{'}}/m_{\mathrm{Z}^{'}} $ as indicated in the legends. |
png pdf |
Figure 7-b:
Expected and observed upper limits at 95% CL on the $ \mathrm{t} \overline{\mathrm{t}} $ $ \mathrm{Z}^{'} $ production cross section times branching fraction at 13 TeV as a function of $ m_{\mathrm{Z}^{'}} $ for various relative decay widths $ \Gamma_{\mathrm{Z}^{'}}/m_{\mathrm{Z}^{'}} $ as indicated in the legends. |
png pdf |
Figure 7-c:
Expected and observed upper limits at 95% CL on the $ \mathrm{t} \overline{\mathrm{t}} $ $ \mathrm{Z}^{'} $ production cross section times branching fraction at 13 TeV as a function of $ m_{\mathrm{Z}^{'}} $ for various relative decay widths $ \Gamma_{\mathrm{Z}^{'}}/m_{\mathrm{Z}^{'}} $ as indicated in the legends. |
png pdf |
Figure 7-d:
Expected and observed upper limits at 95% CL on the $ \mathrm{t} \overline{\mathrm{t}} $ $ \mathrm{Z}^{'} $ production cross section times branching fraction at 13 TeV as a function of $ m_{\mathrm{Z}^{'}} $ for various relative decay widths $ \Gamma_{\mathrm{Z}^{'}}/m_{\mathrm{Z}^{'}} $ as indicated in the legends. |
png pdf |
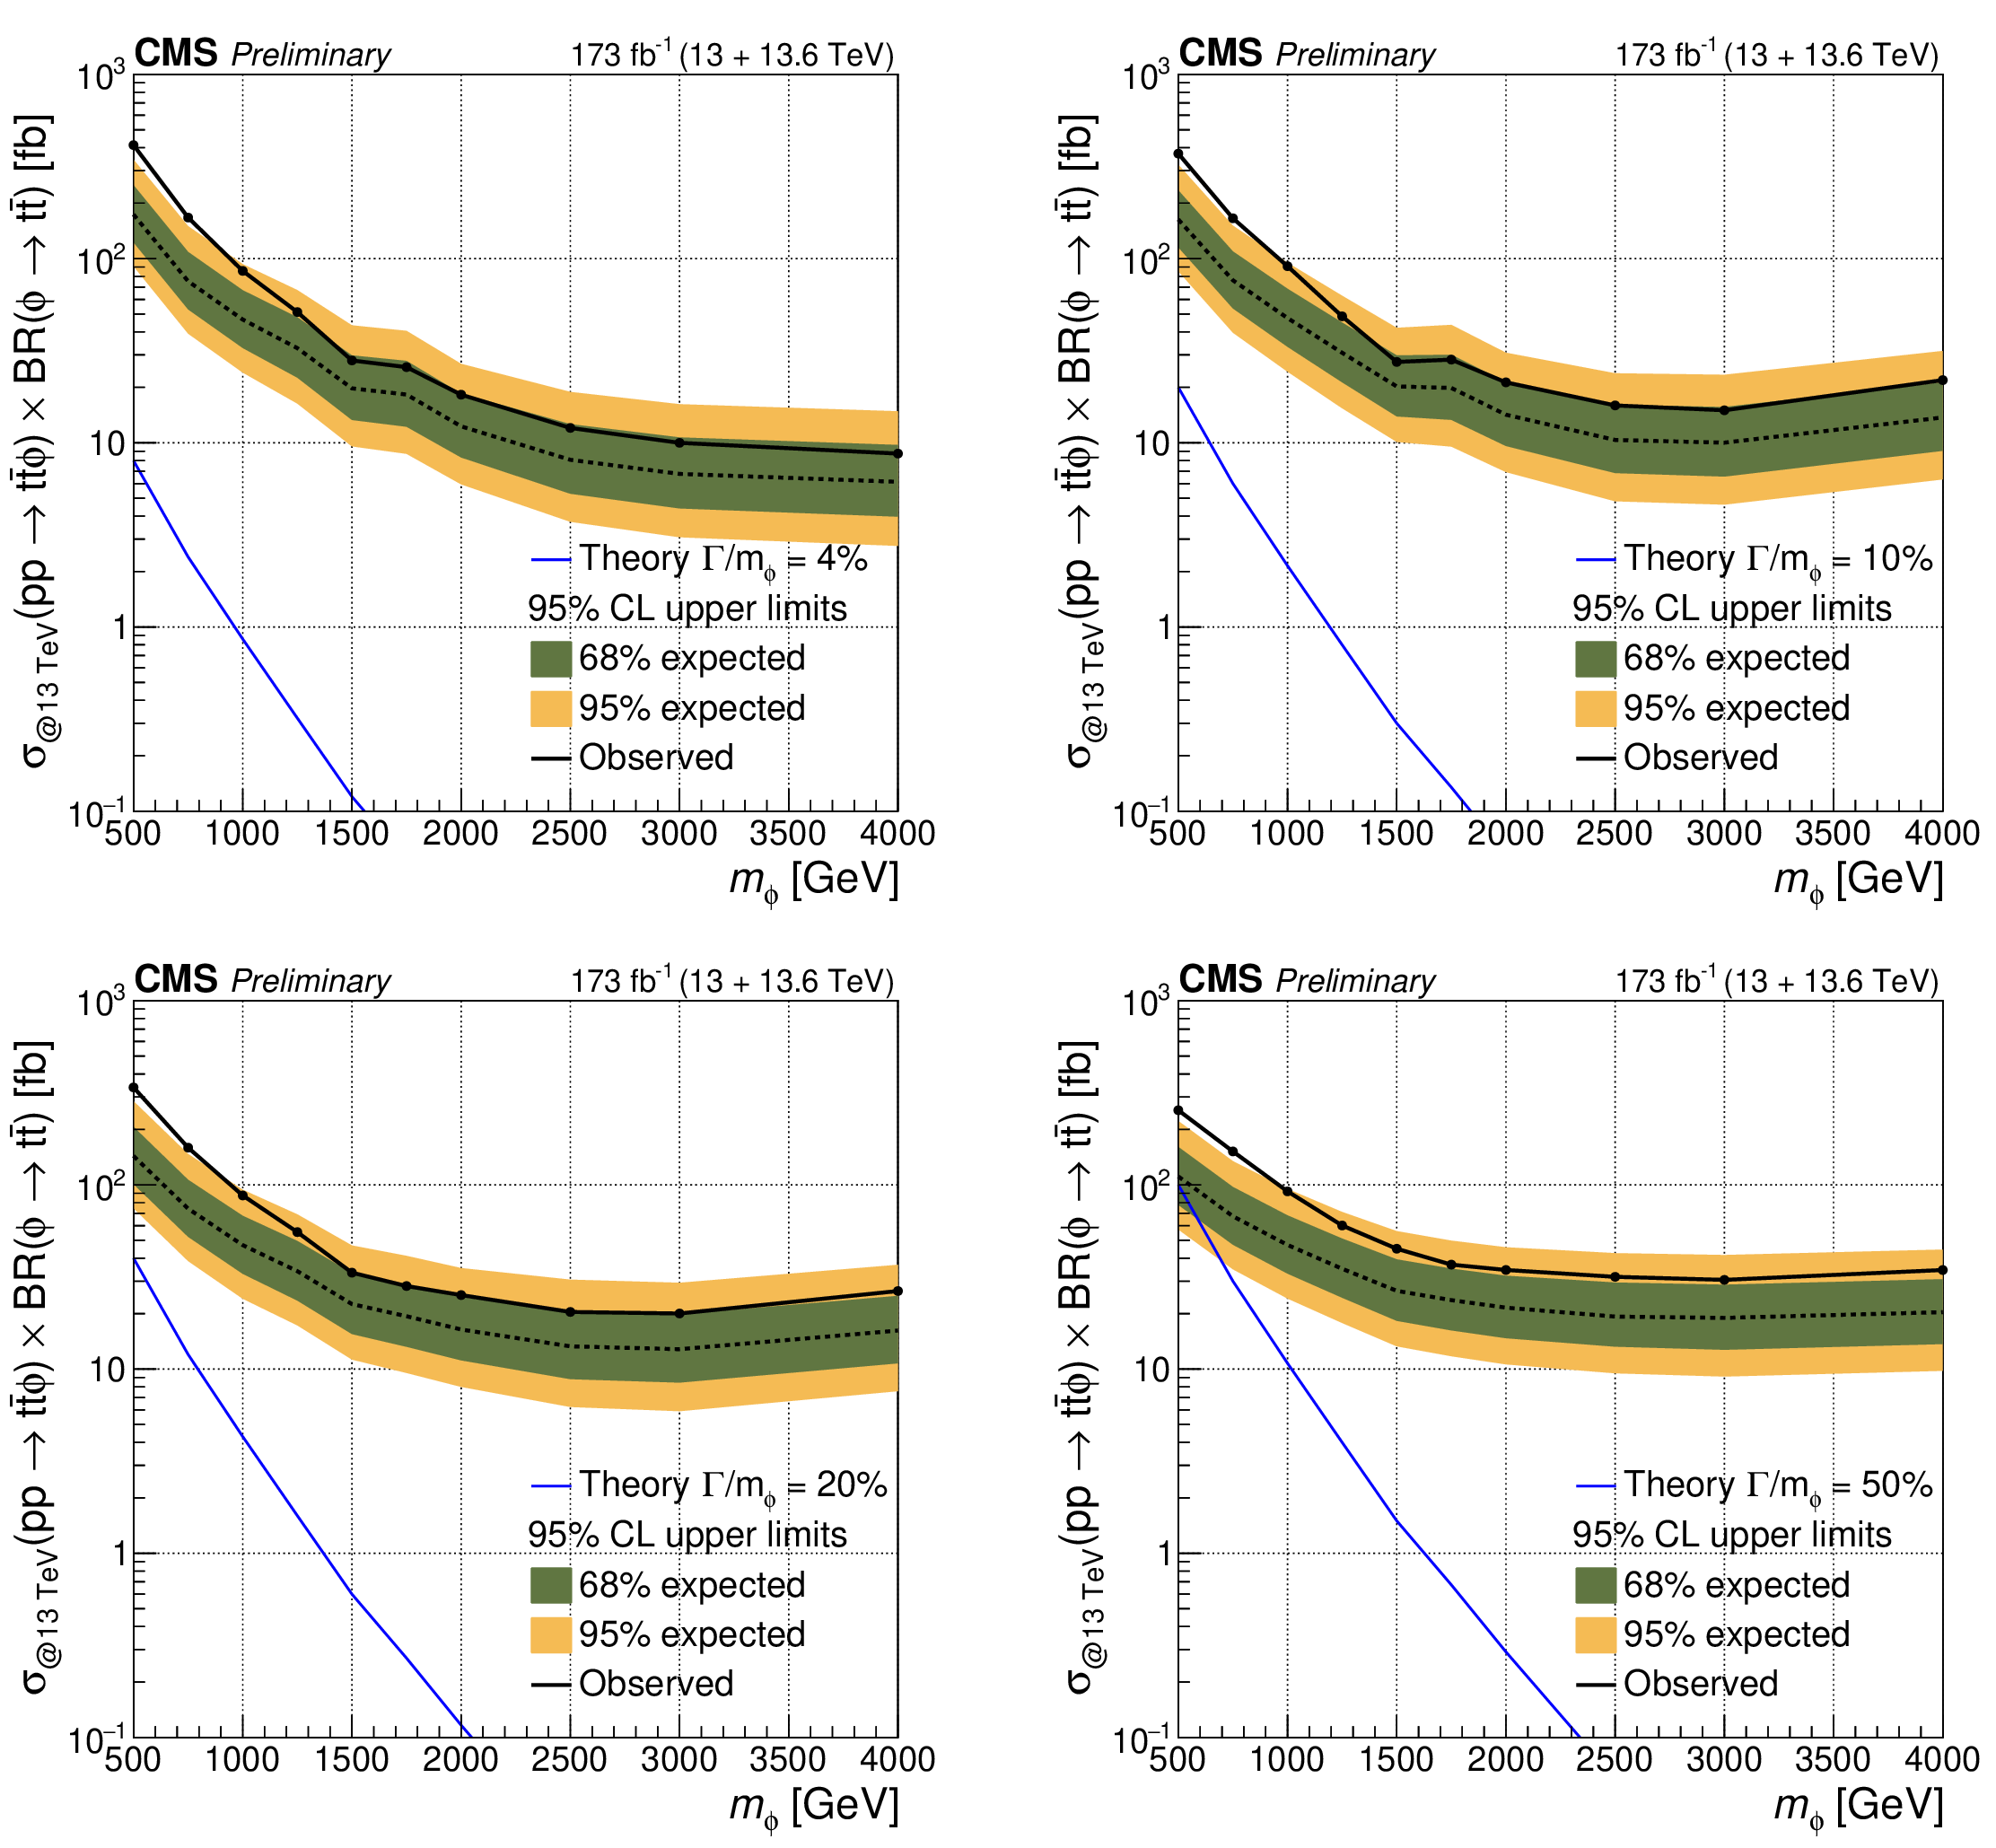
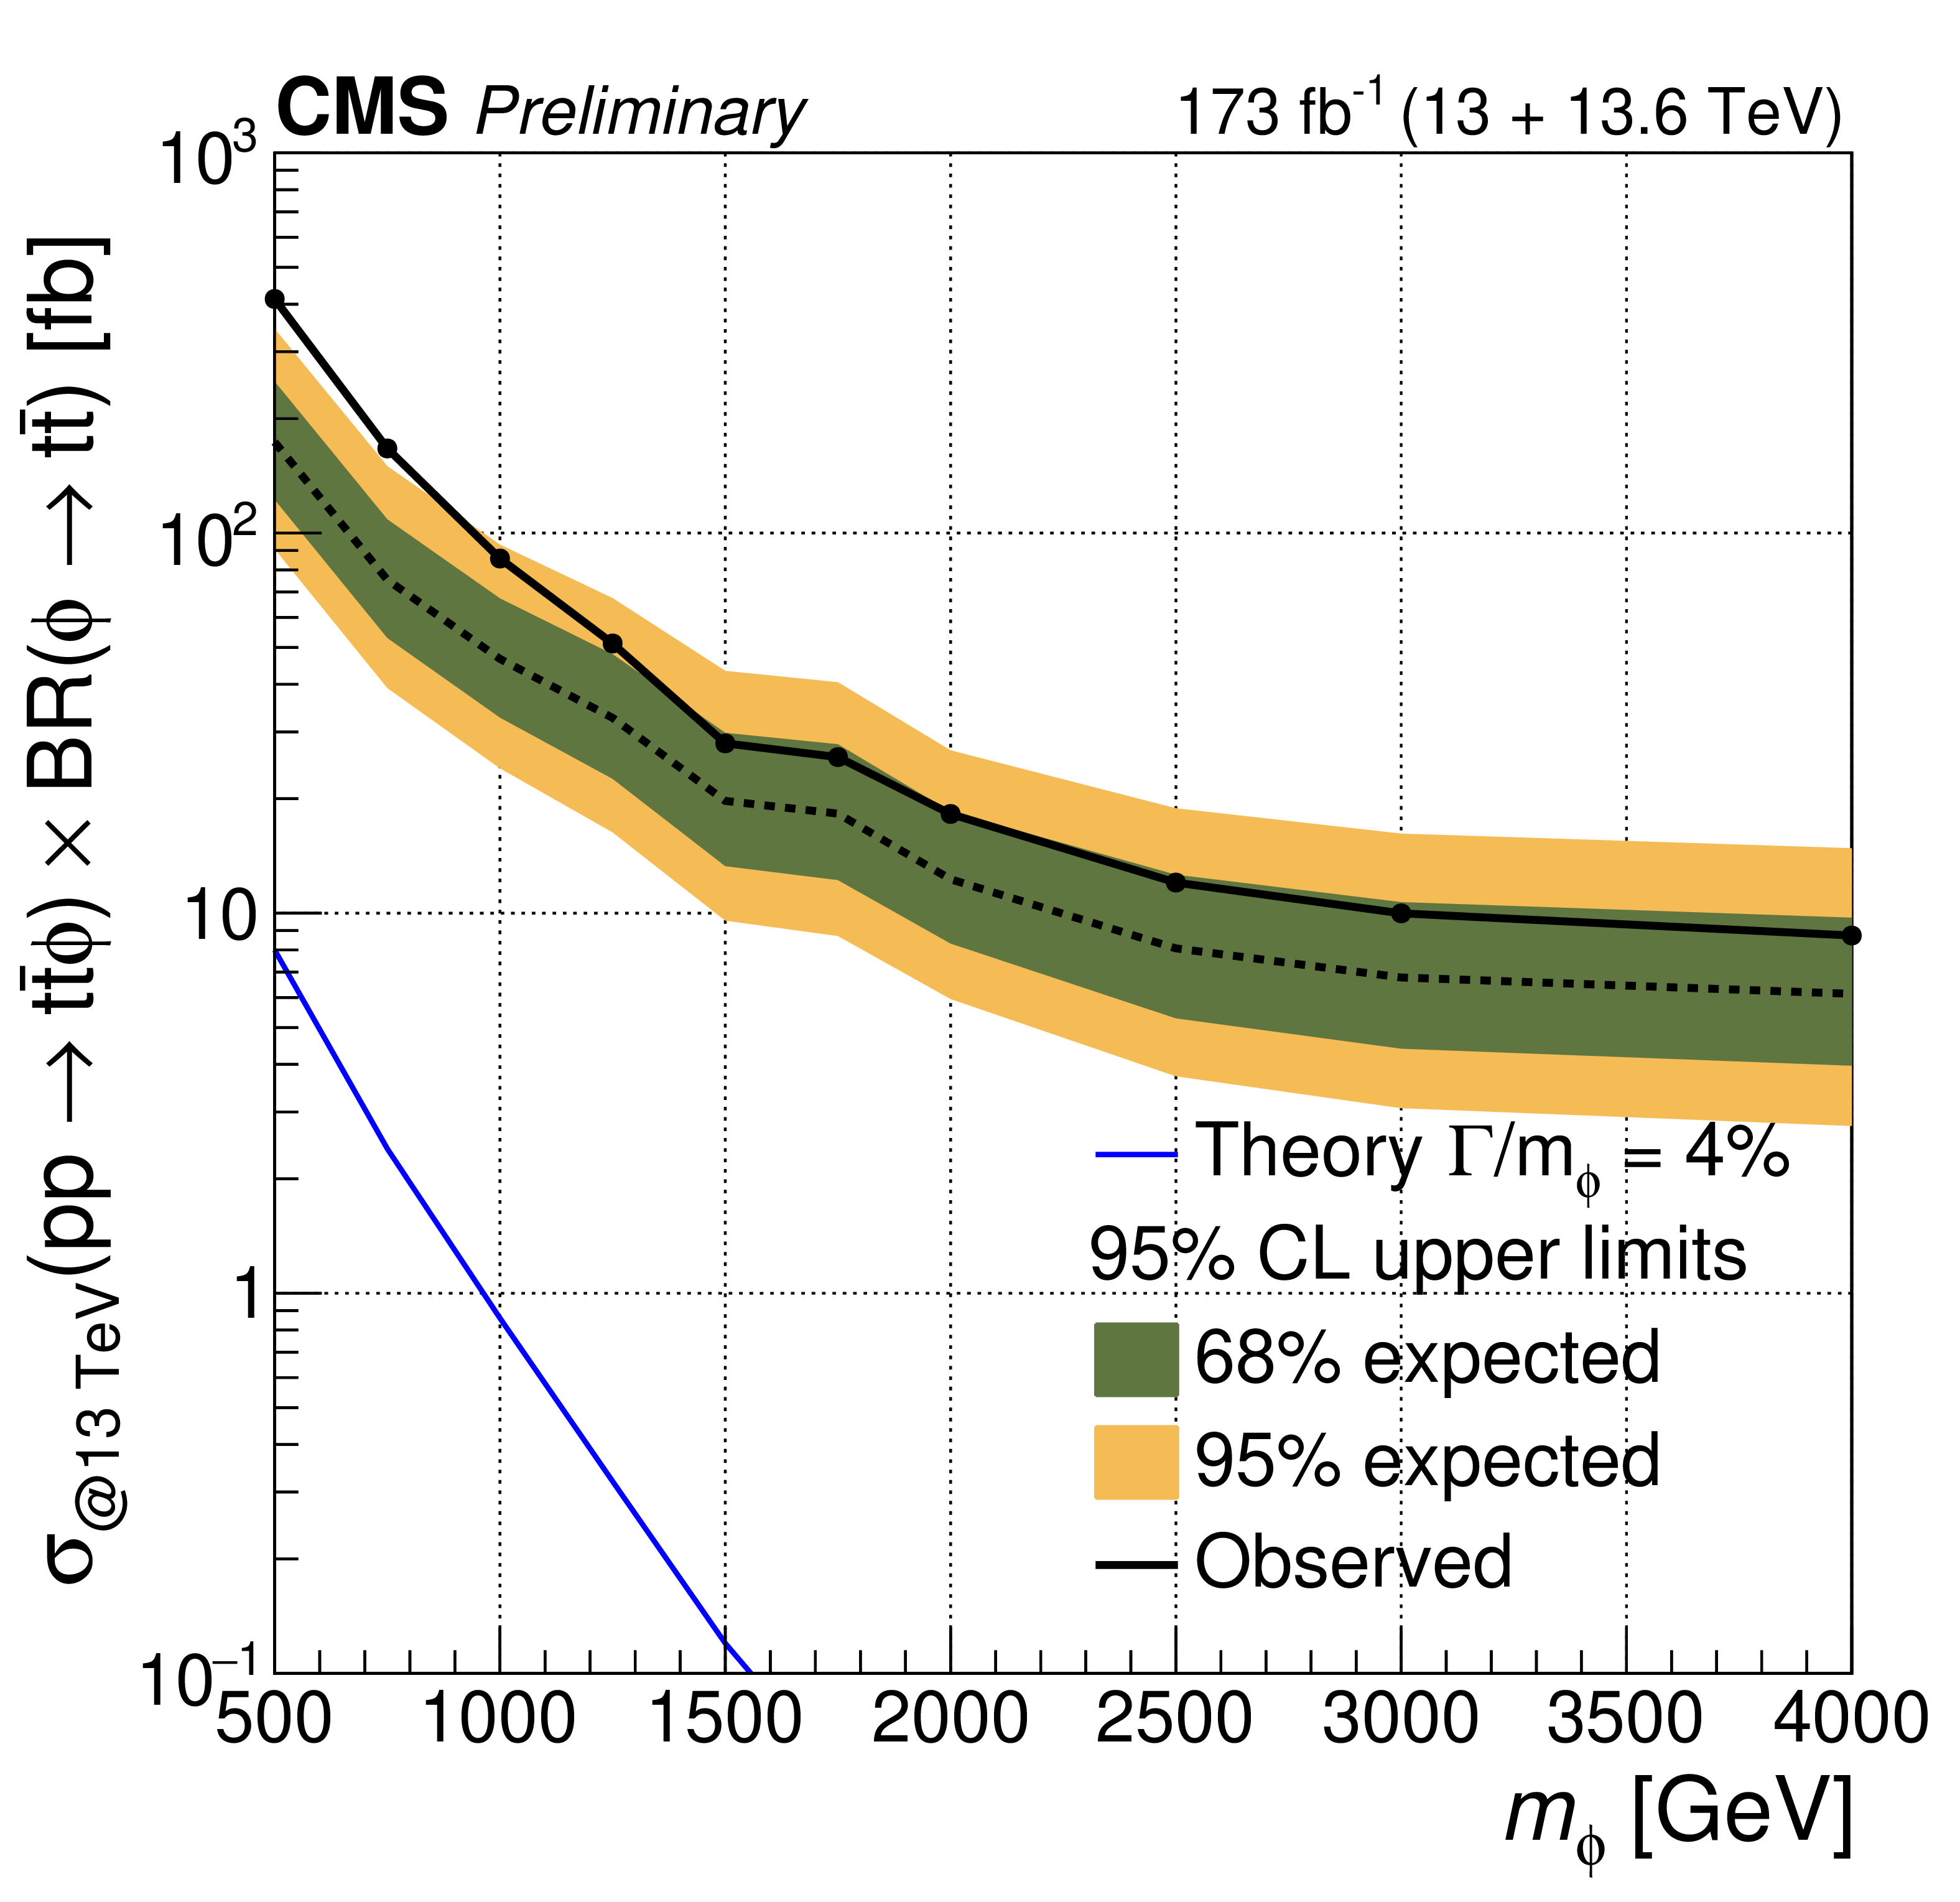
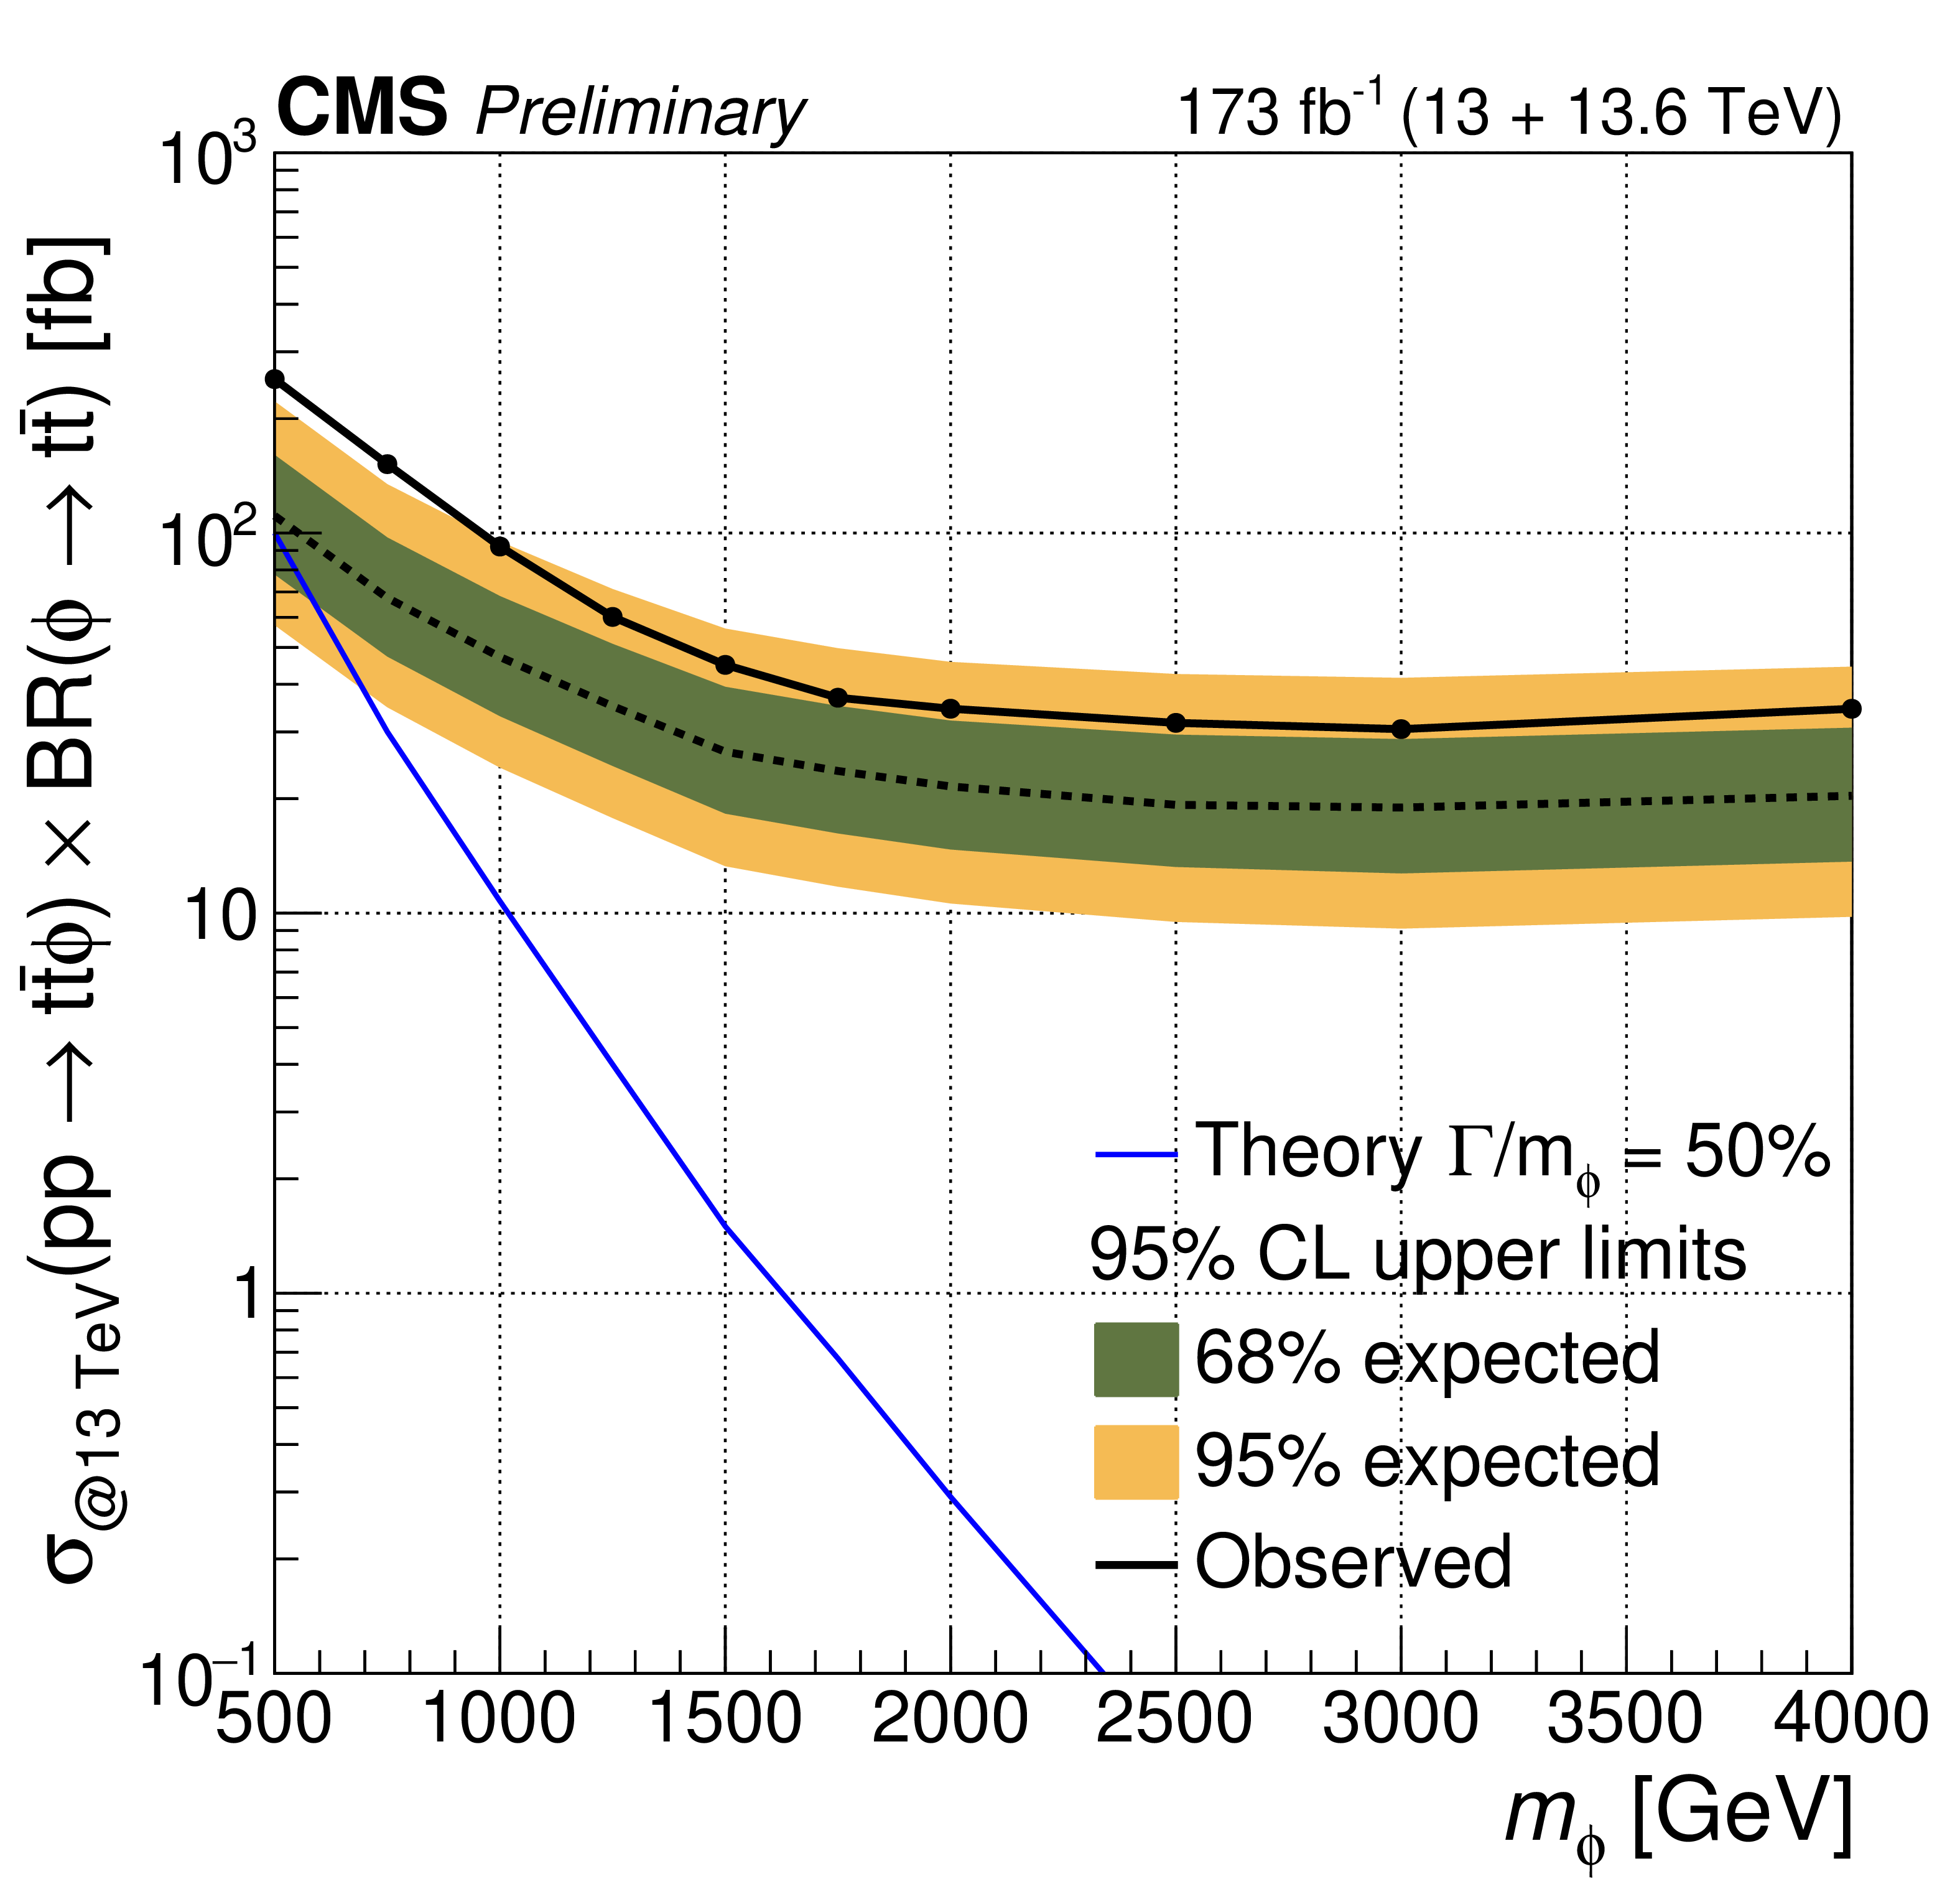
Figure 8:
Expected and observed upper limits at 95% CL on the $ {\mathrm{t}\overline{\mathrm{t}}} \phi $ production cross section times branching fraction at 13 TeV as a function of $ m_{\phi} $ for various relative decay widths $ \Gamma_{\phi}/m_{\phi} $ as indicated in the legends. |
png pdf |
Figure 8-a:
Expected and observed upper limits at 95% CL on the $ {\mathrm{t}\overline{\mathrm{t}}} \phi $ production cross section times branching fraction at 13 TeV as a function of $ m_{\phi} $ for various relative decay widths $ \Gamma_{\phi}/m_{\phi} $ as indicated in the legends. |

png pdf |
Figure 8-b:
Expected and observed upper limits at 95% CL on the $ {\mathrm{t}\overline{\mathrm{t}}} \phi $ production cross section times branching fraction at 13 TeV as a function of $ m_{\phi} $ for various relative decay widths $ \Gamma_{\phi}/m_{\phi} $ as indicated in the legends. |

png pdf |
Figure 8-c:
Expected and observed upper limits at 95% CL on the $ {\mathrm{t}\overline{\mathrm{t}}} \phi $ production cross section times branching fraction at 13 TeV as a function of $ m_{\phi} $ for various relative decay widths $ \Gamma_{\phi}/m_{\phi} $ as indicated in the legends. |
png pdf |
Figure 8-d:
Expected and observed upper limits at 95% CL on the $ {\mathrm{t}\overline{\mathrm{t}}} \phi $ production cross section times branching fraction at 13 TeV as a function of $ m_{\phi} $ for various relative decay widths $ \Gamma_{\phi}/m_{\phi} $ as indicated in the legends. |
png pdf |
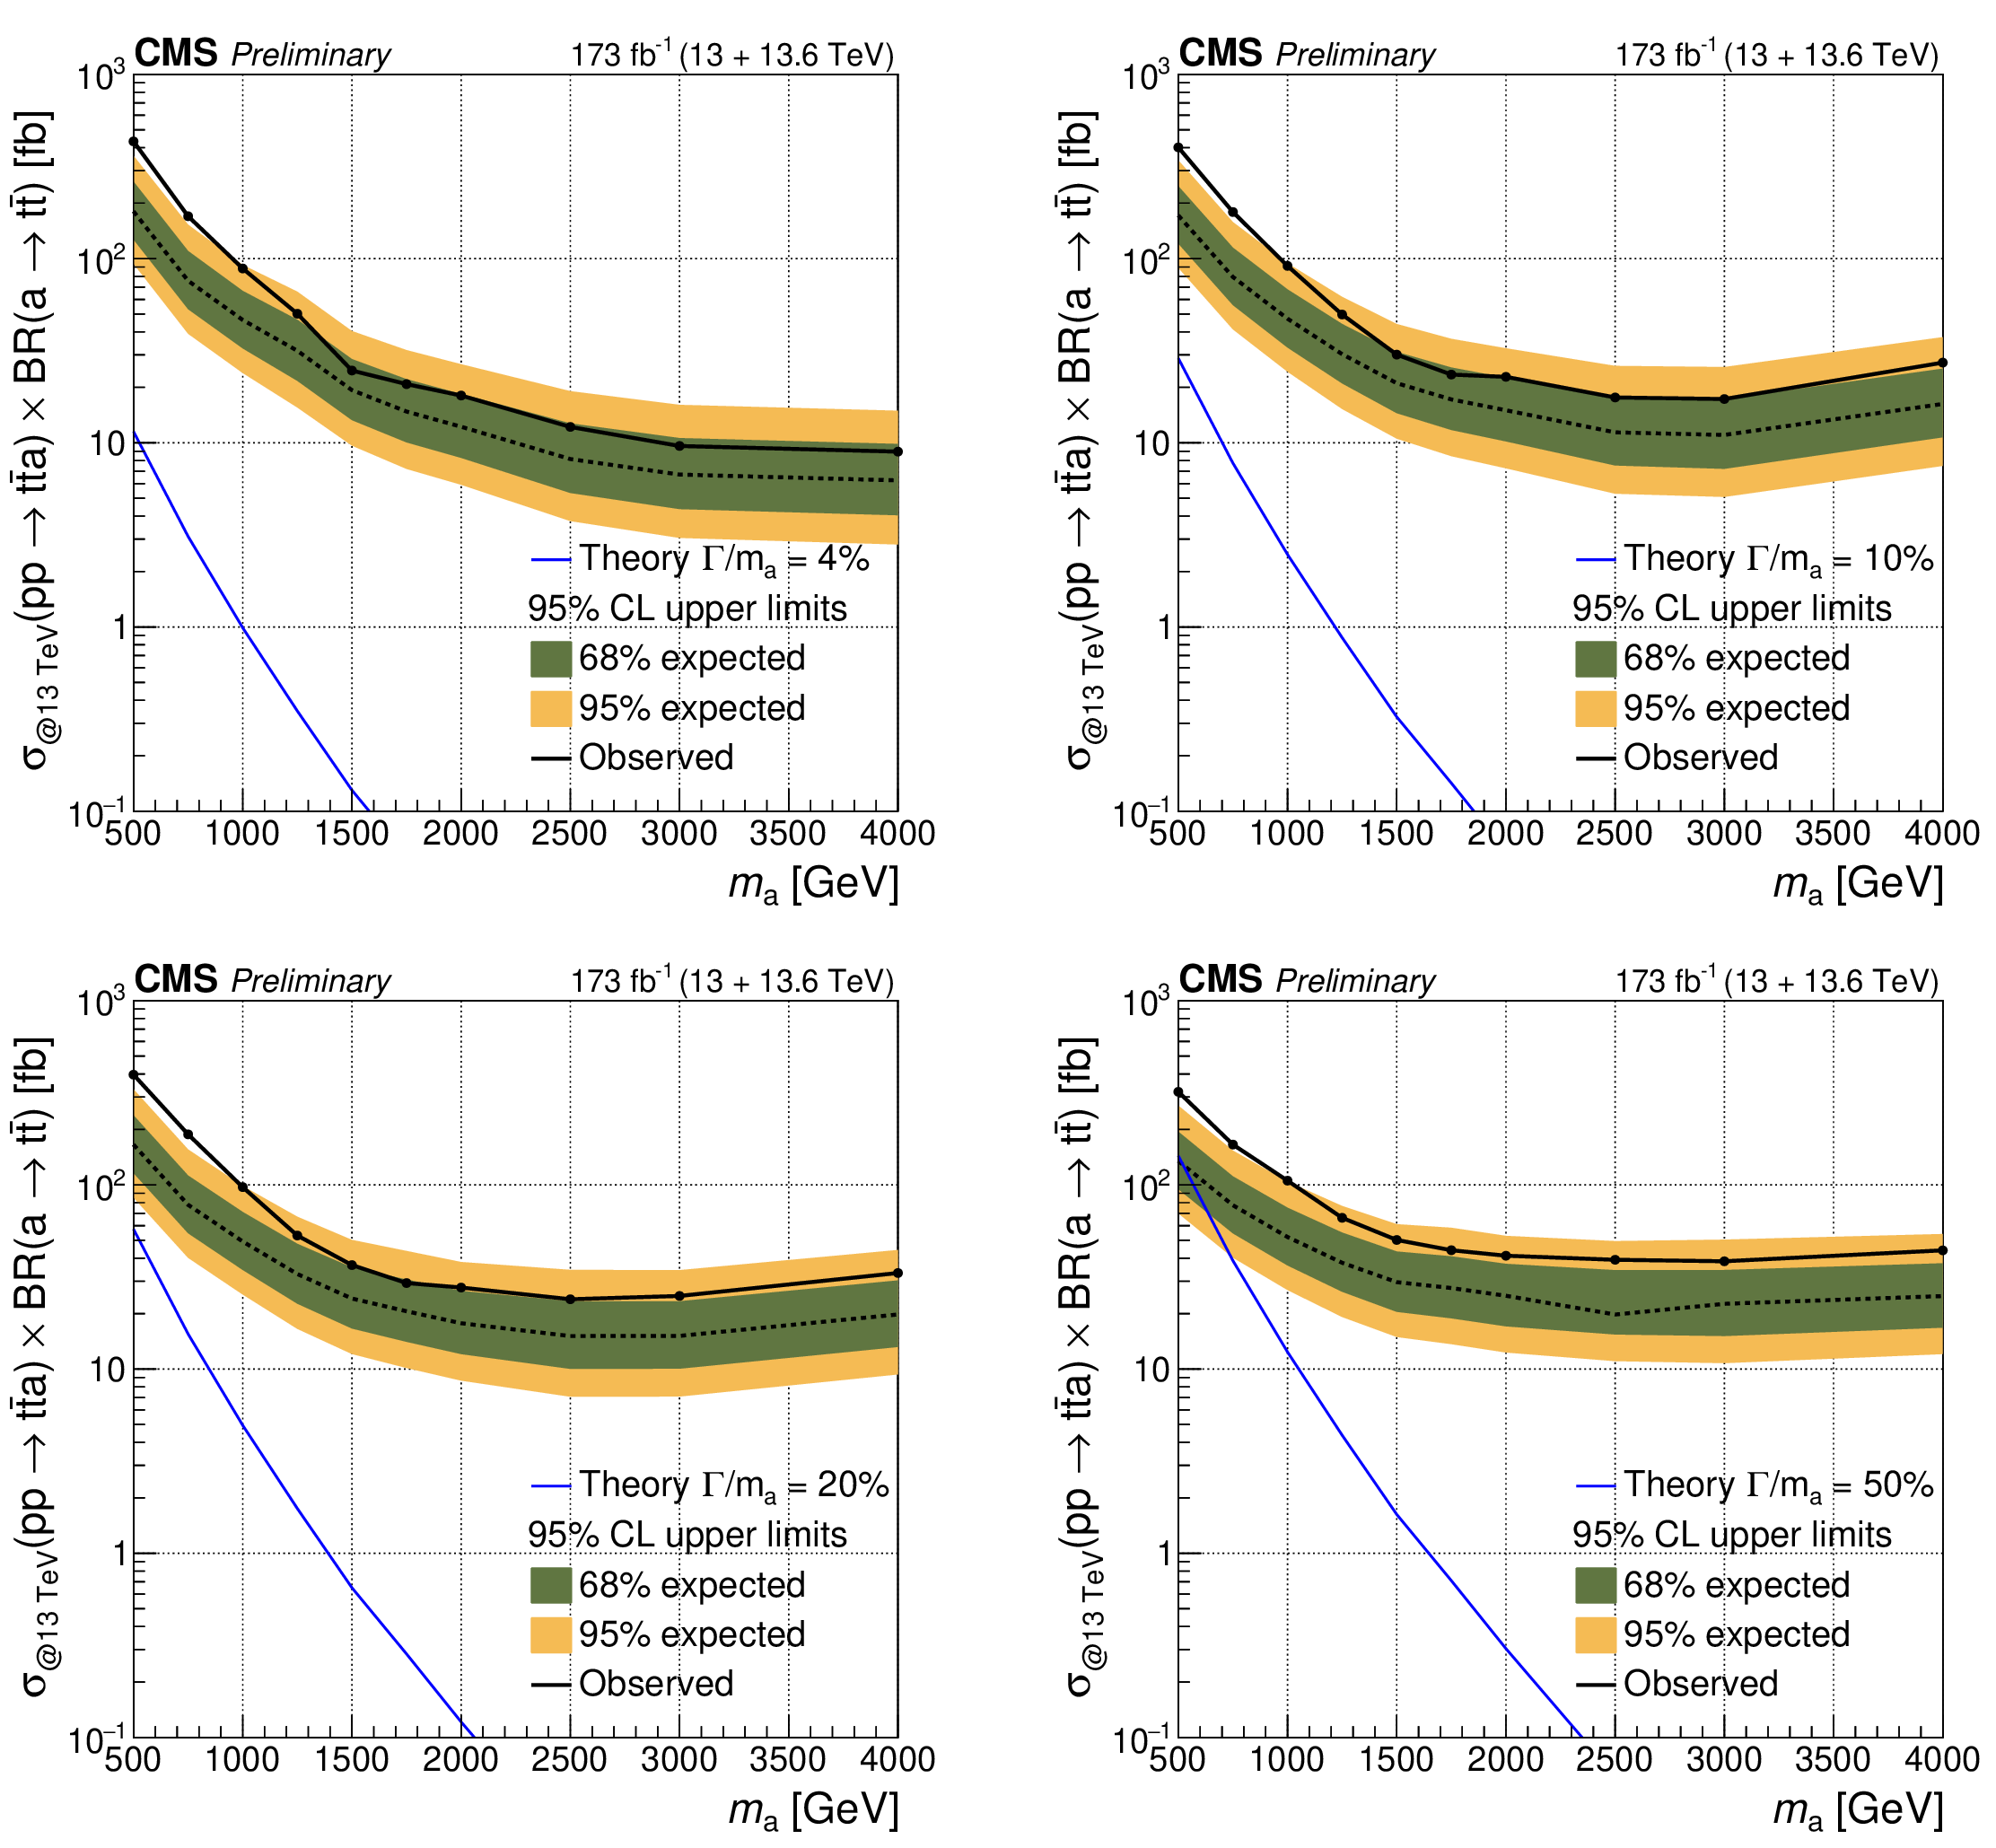
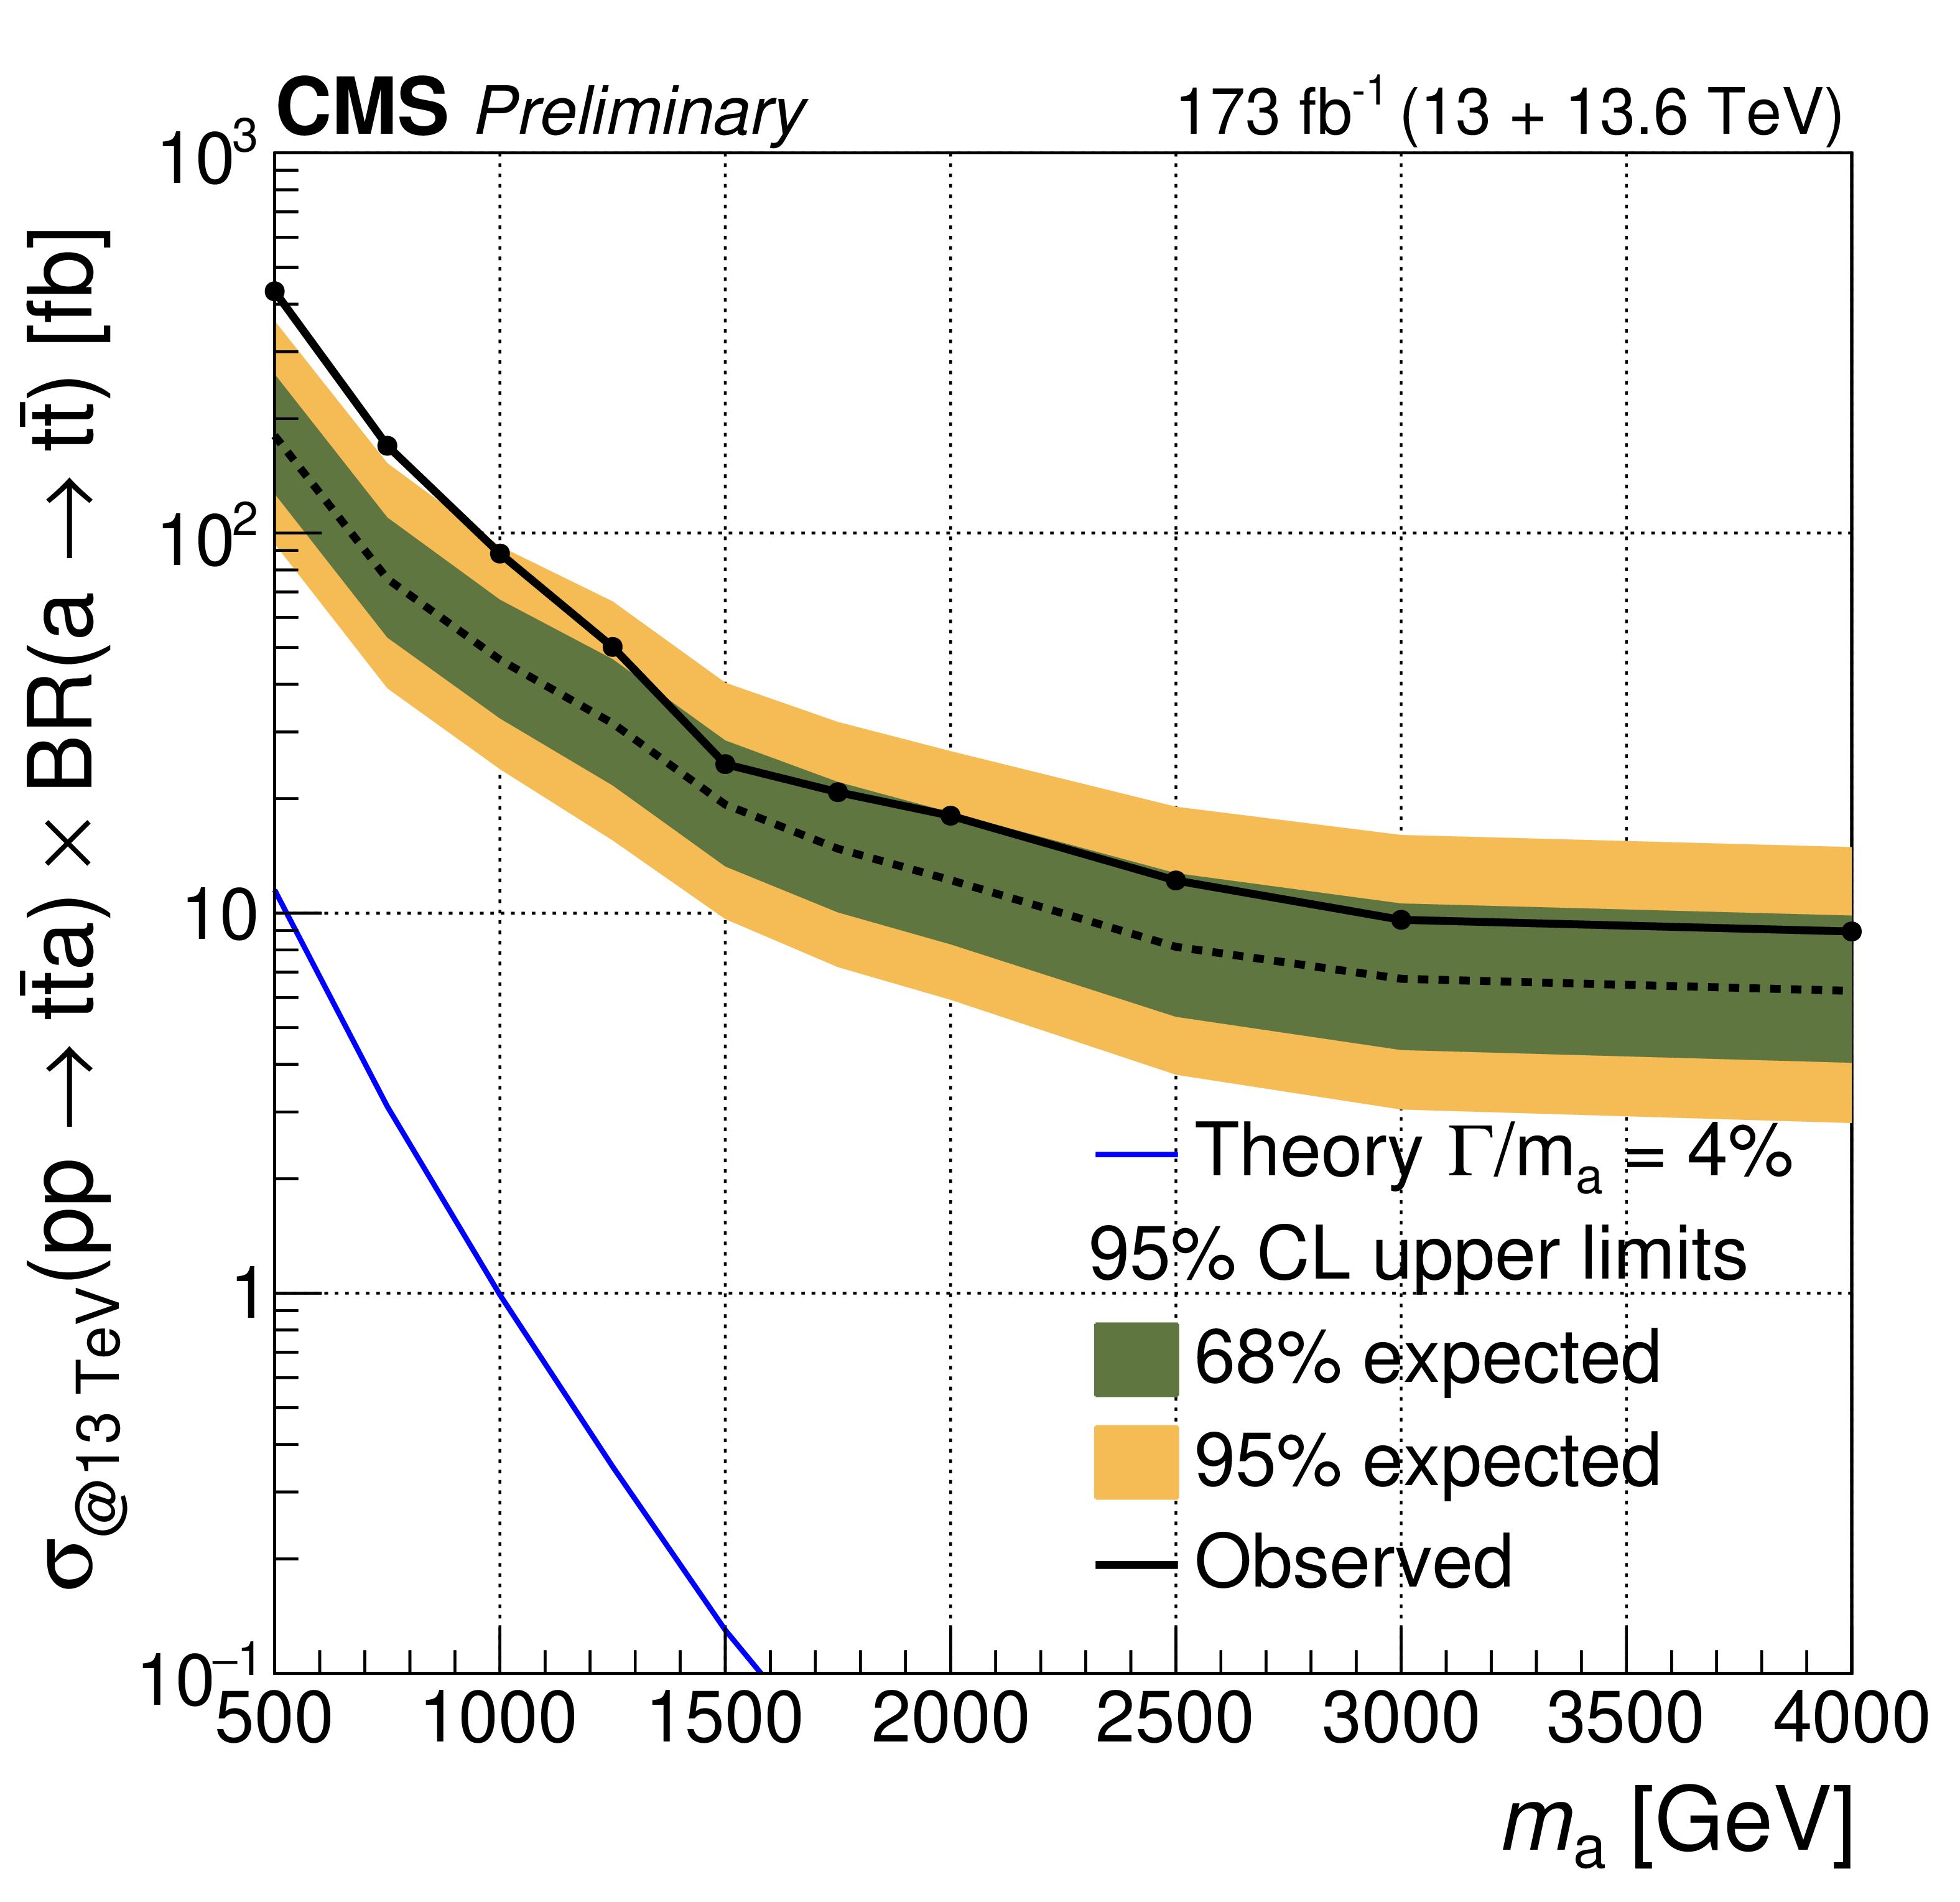
Figure 9:
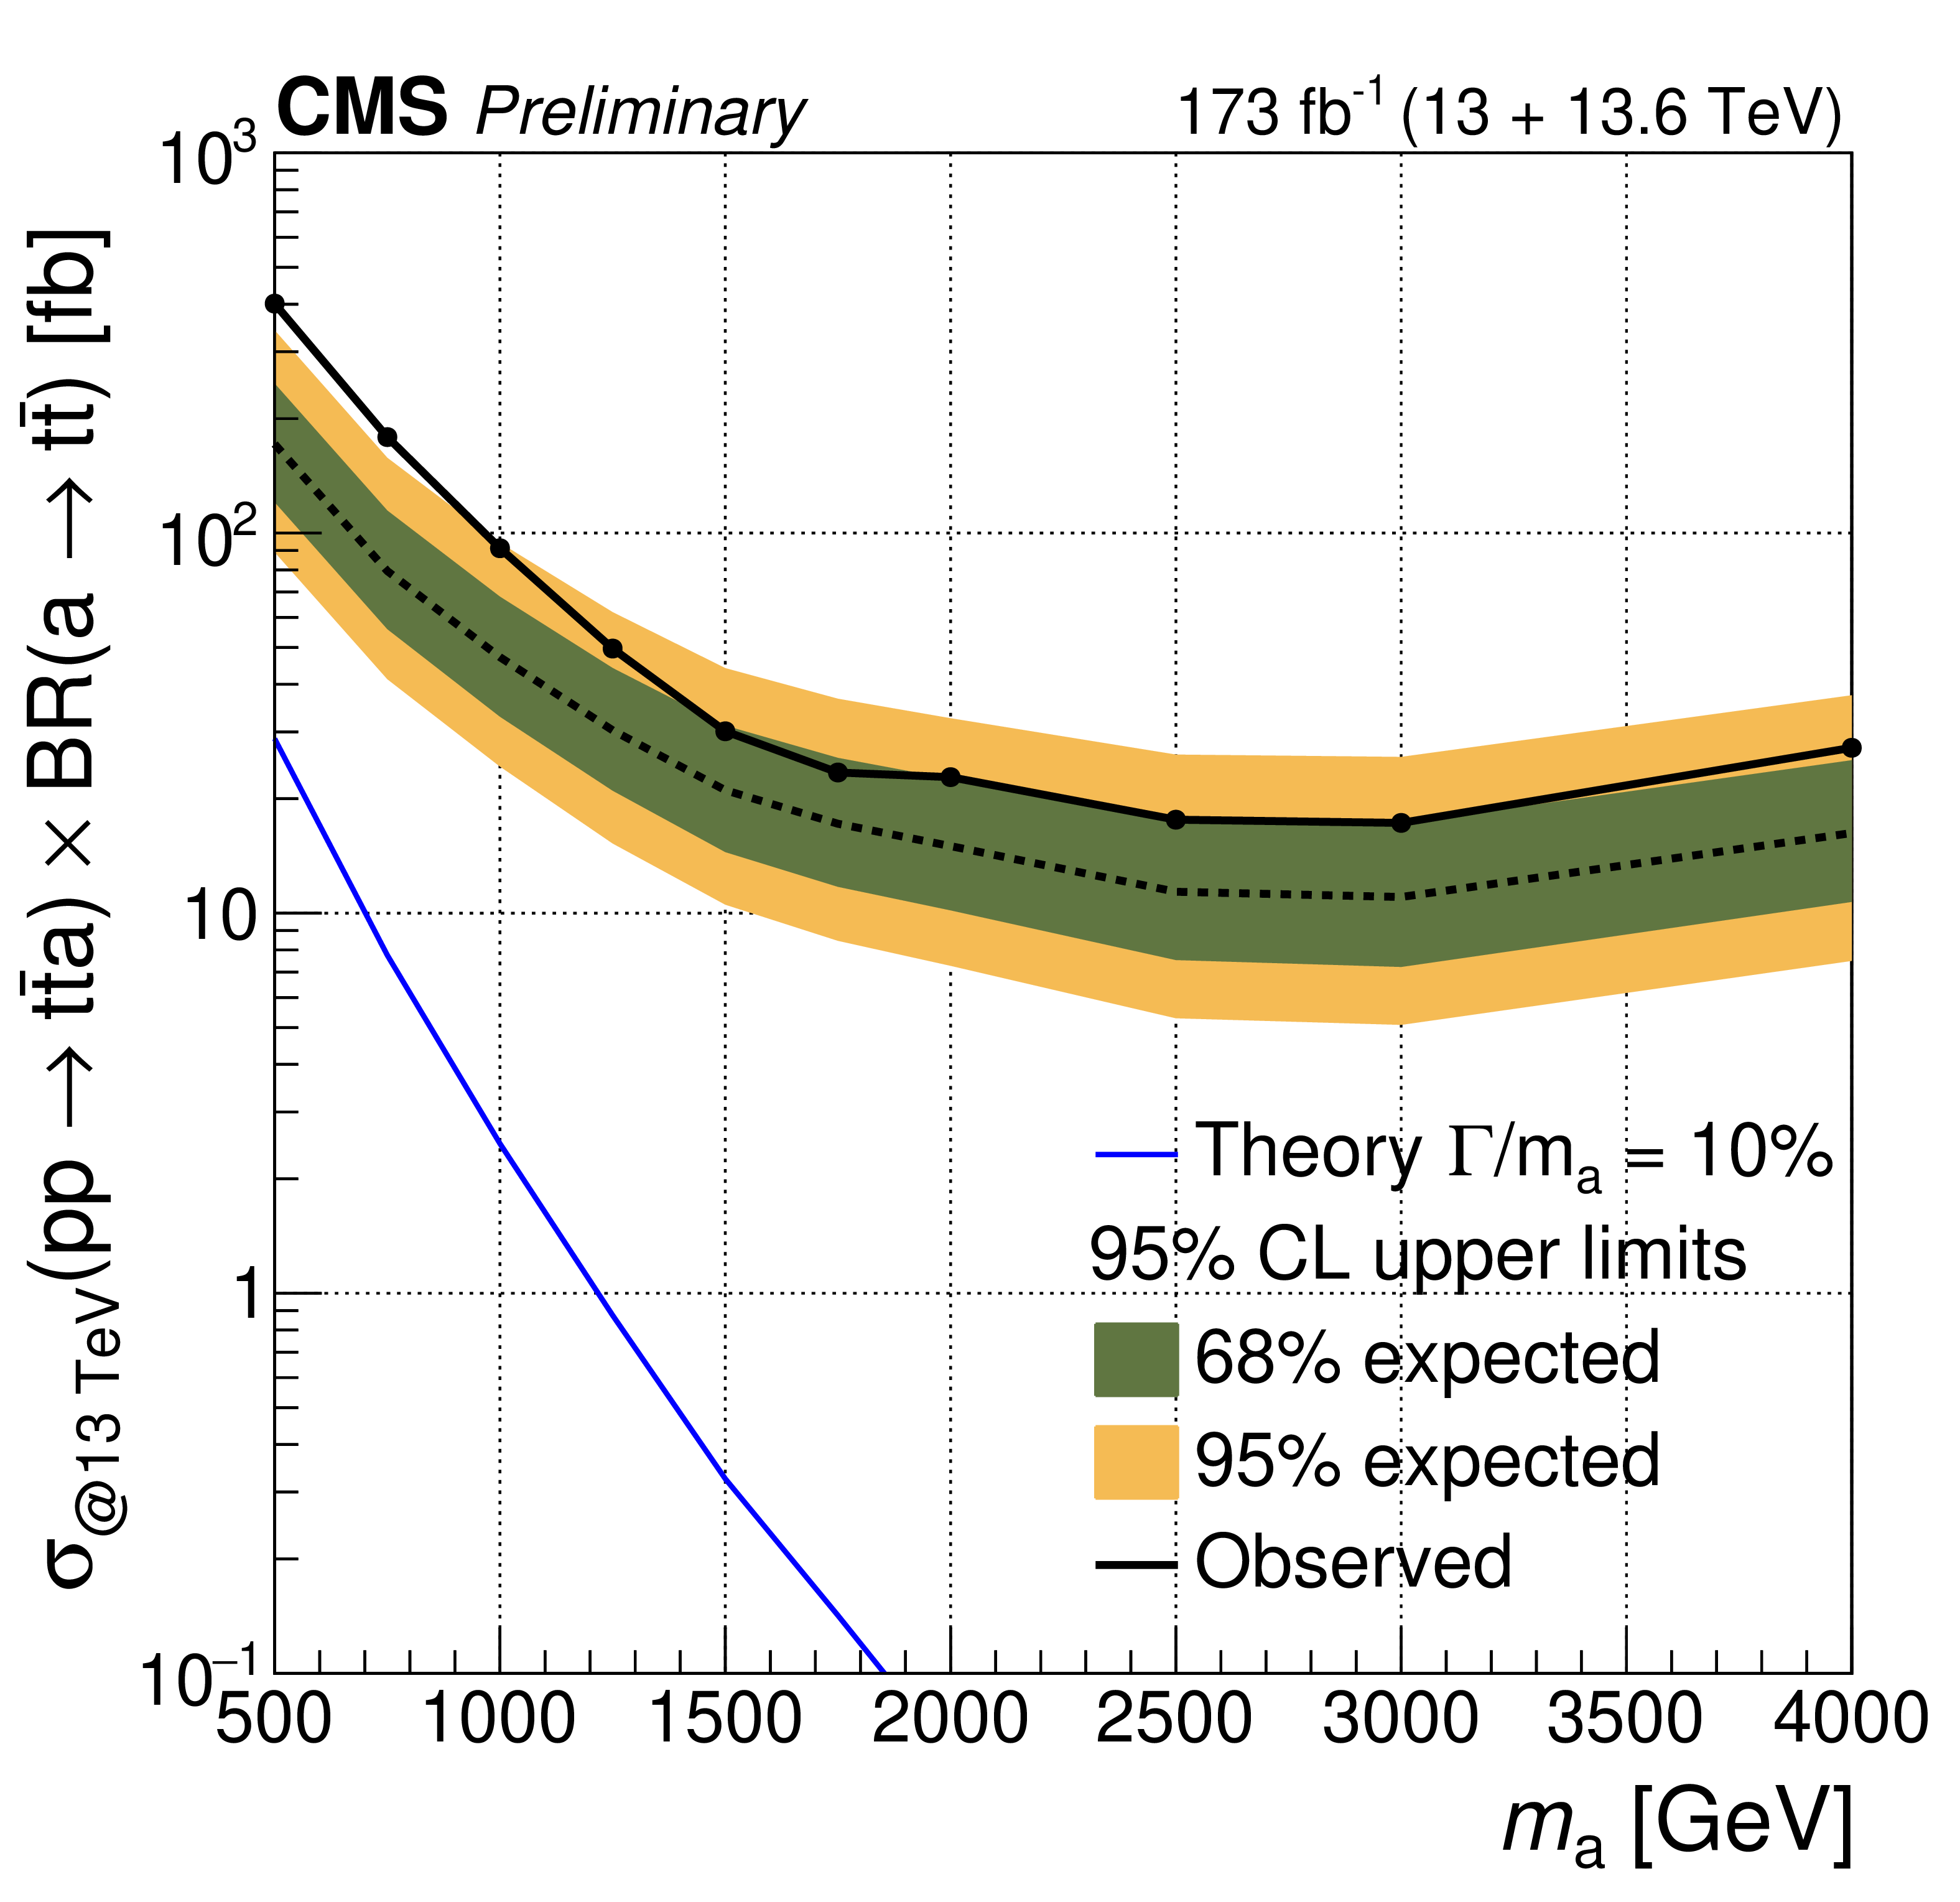
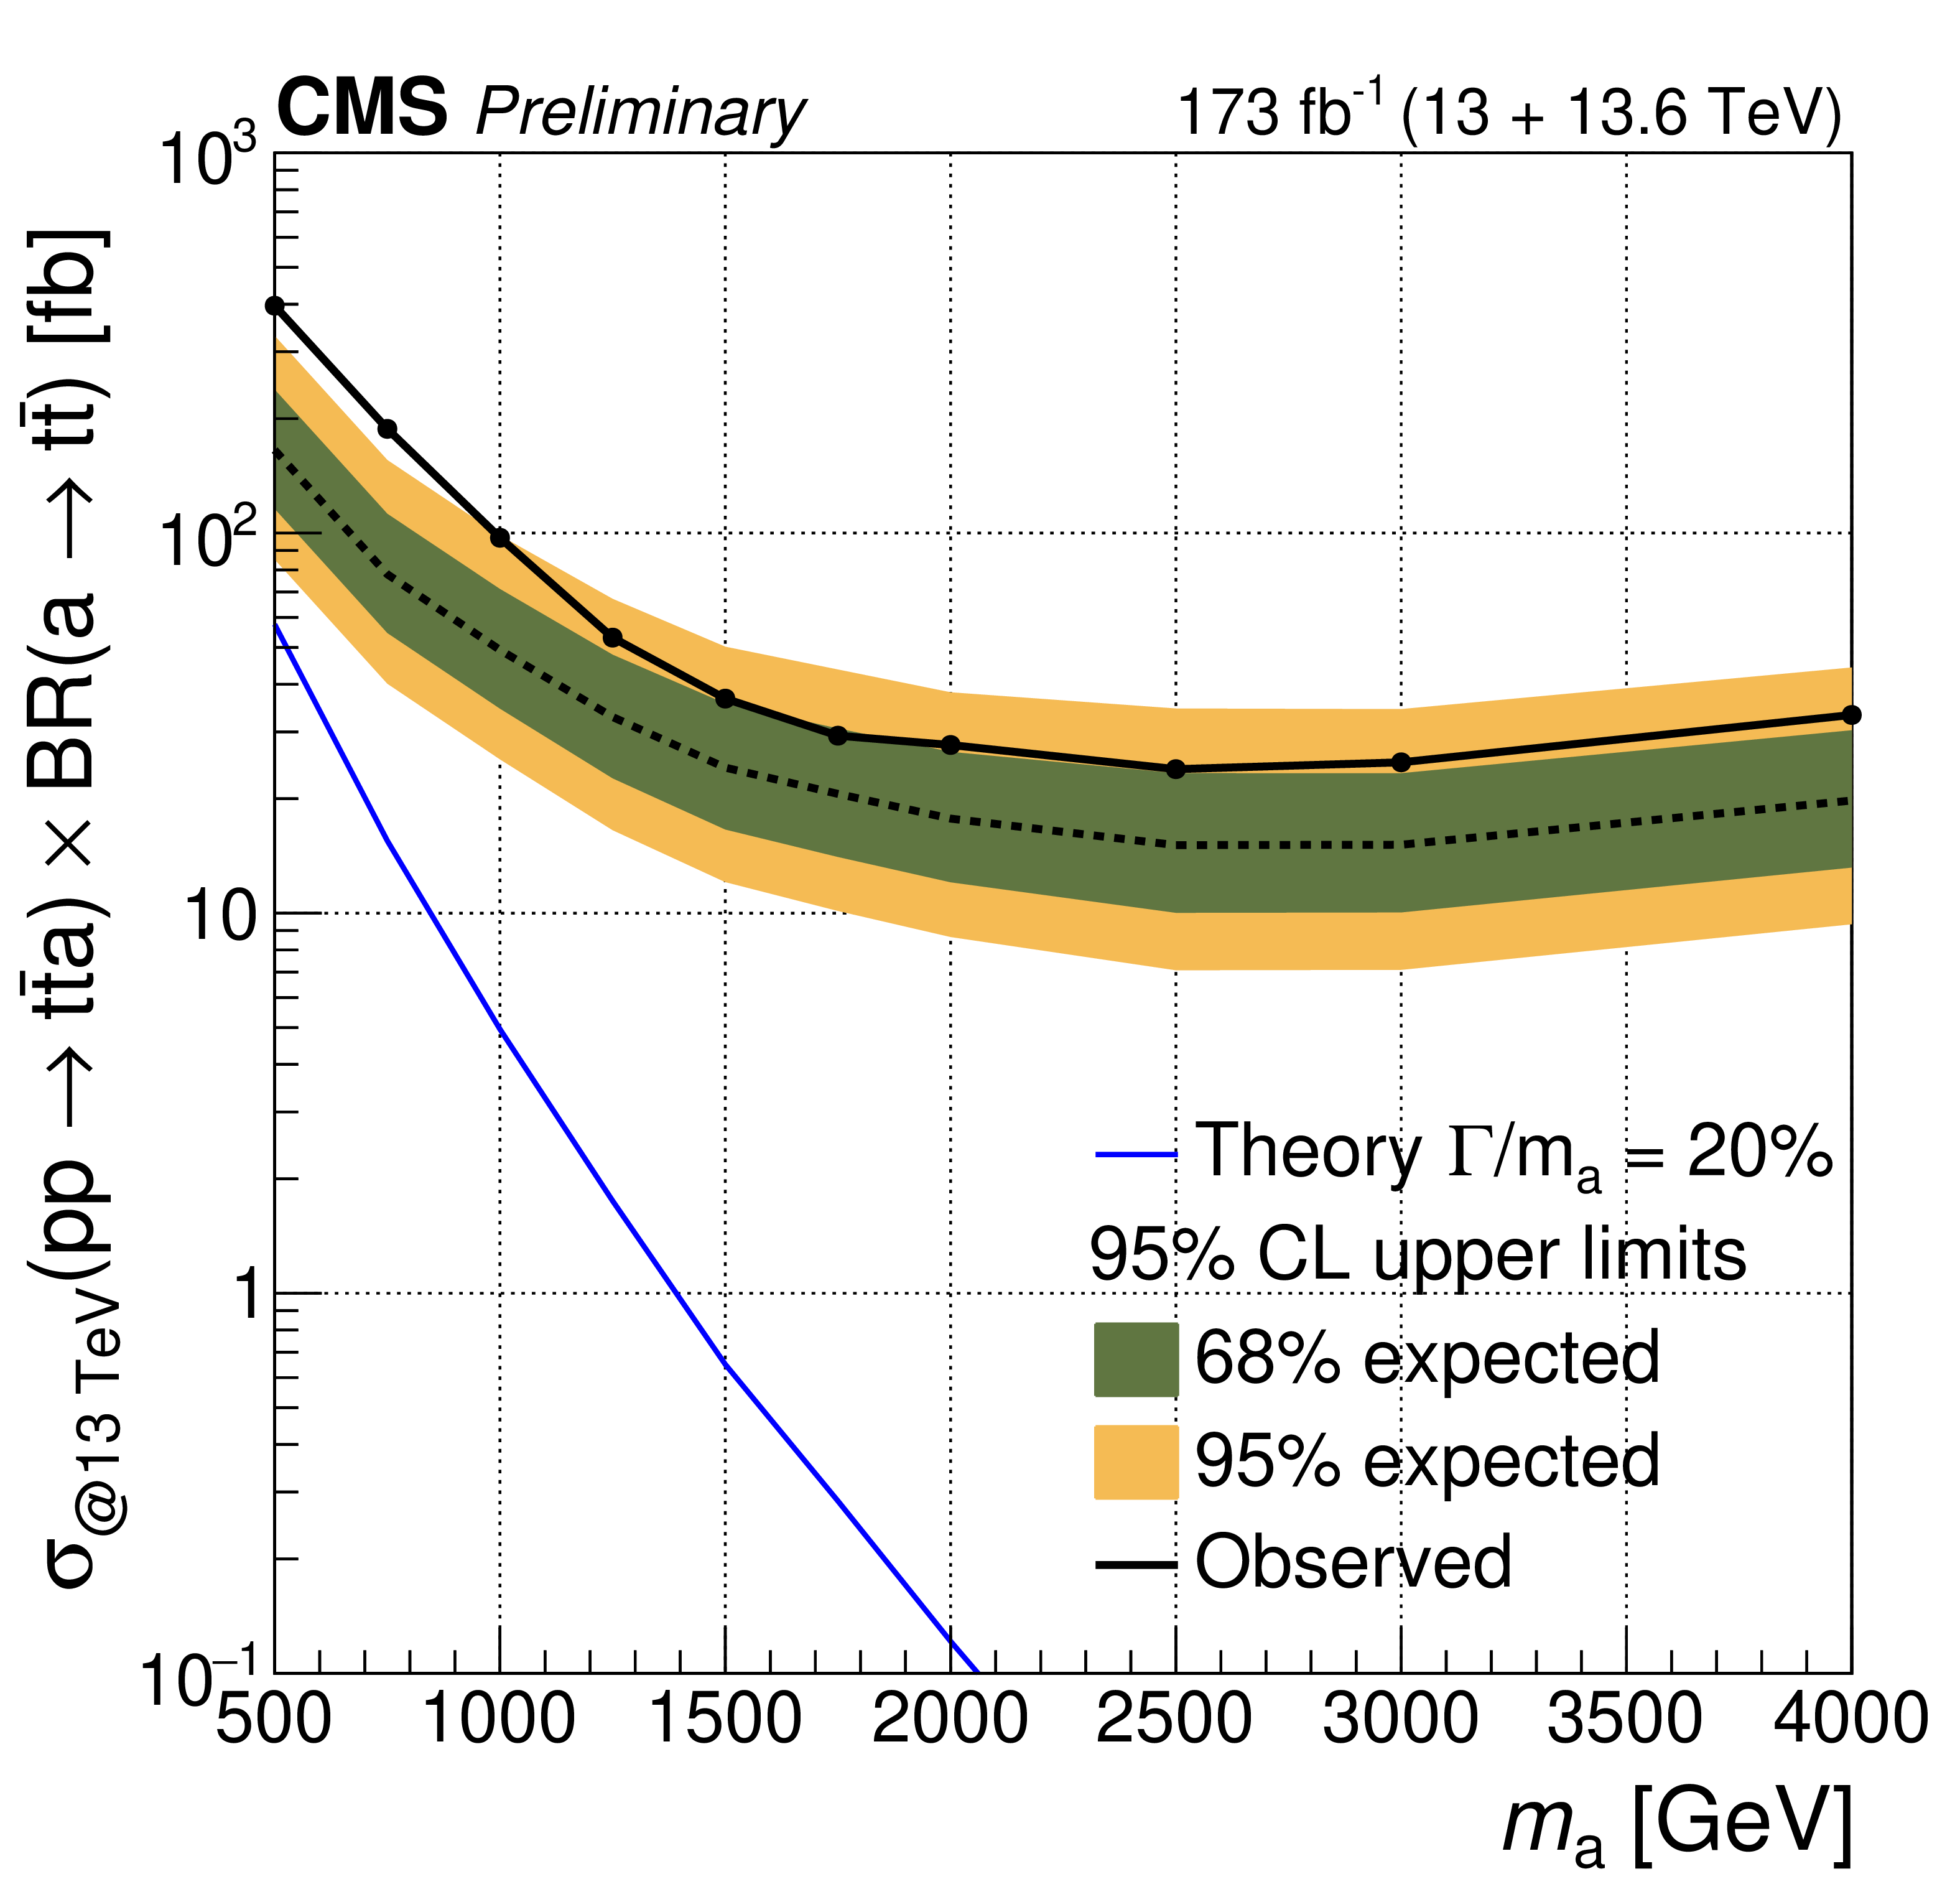
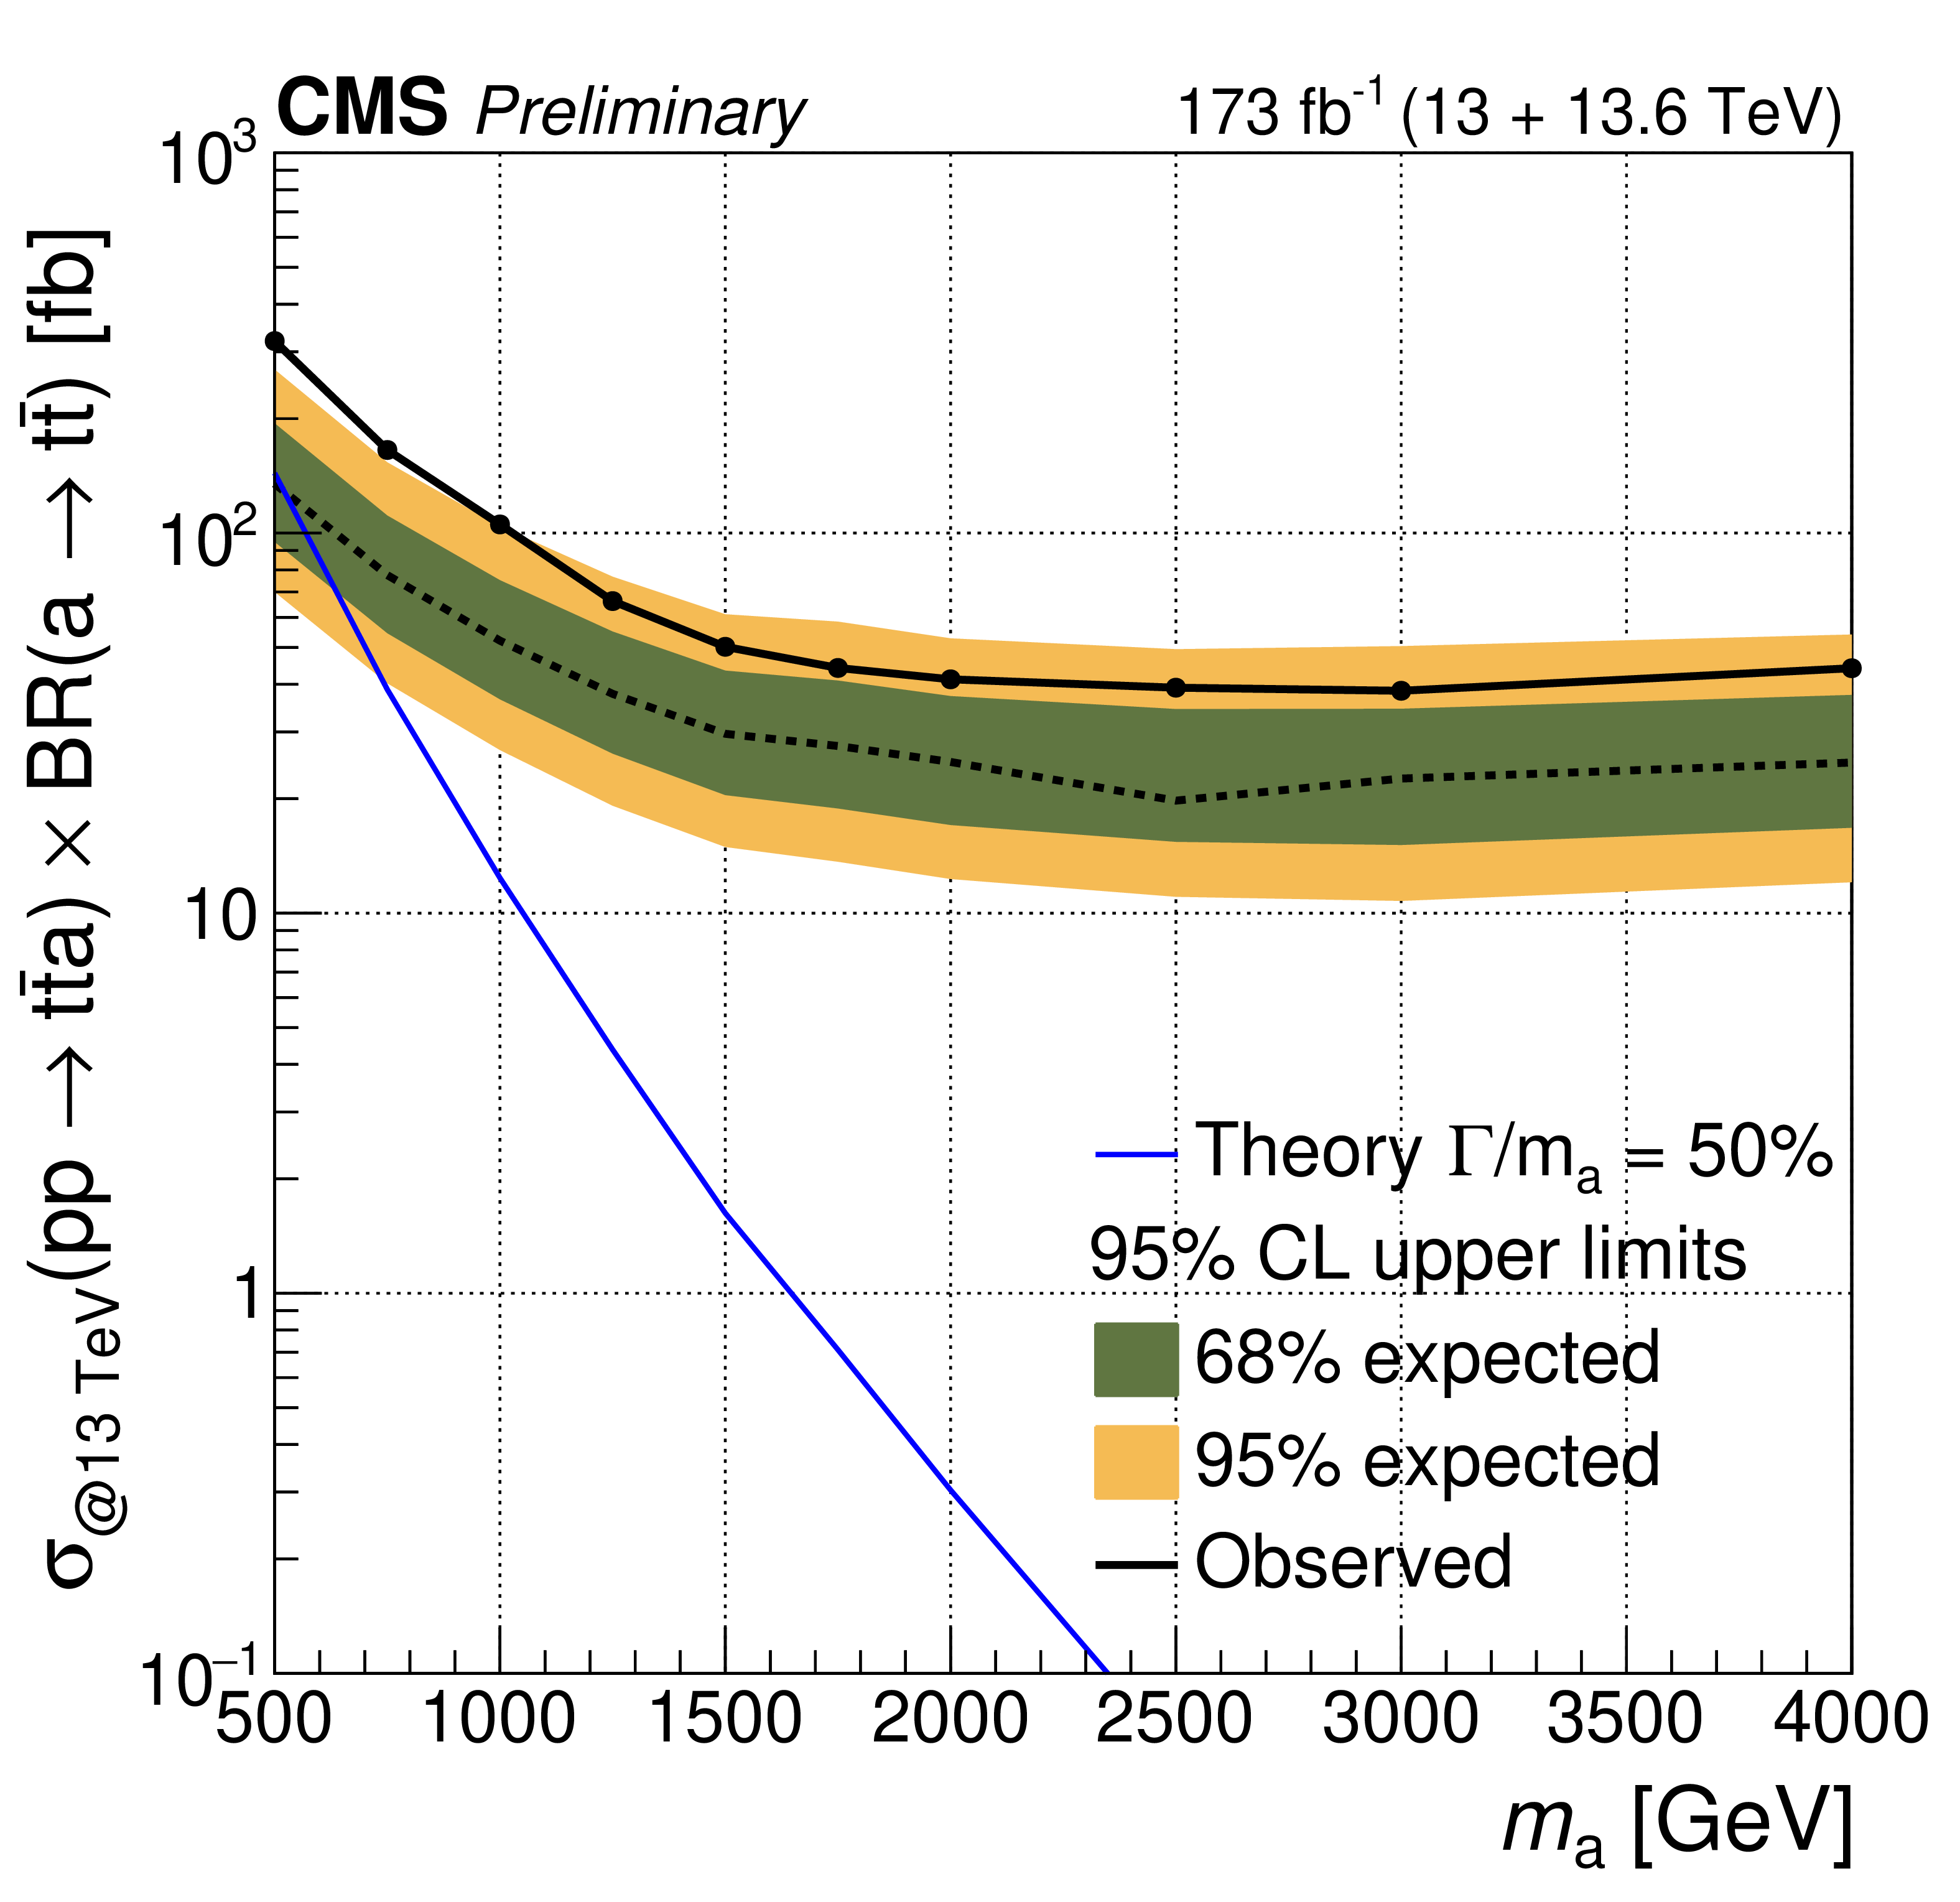
Expected and observed upper limits at 95% CL on the $ {\mathrm{t}\overline{\mathrm{t}}} {\mathrm{a}} $ production cross section times branching fraction at 13 TeV as a function of $ m_{{\mathrm{a}} } $ for various relative decay widths $ \Gamma_{{\mathrm{a}} }/m_{{\mathrm{a}} } $ as indicated in the legends. |
png pdf |
Figure 9-a:
Expected and observed upper limits at 95% CL on the $ {\mathrm{t}\overline{\mathrm{t}}} {\mathrm{a}} $ production cross section times branching fraction at 13 TeV as a function of $ m_{{\mathrm{a}} } $ for various relative decay widths $ \Gamma_{{\mathrm{a}} }/m_{{\mathrm{a}} } $ as indicated in the legends. |
png pdf |
Figure 9-b:
Expected and observed upper limits at 95% CL on the $ {\mathrm{t}\overline{\mathrm{t}}} {\mathrm{a}} $ production cross section times branching fraction at 13 TeV as a function of $ m_{{\mathrm{a}} } $ for various relative decay widths $ \Gamma_{{\mathrm{a}} }/m_{{\mathrm{a}} } $ as indicated in the legends. |
png pdf |
Figure 9-c:
Expected and observed upper limits at 95% CL on the $ {\mathrm{t}\overline{\mathrm{t}}} {\mathrm{a}} $ production cross section times branching fraction at 13 TeV as a function of $ m_{{\mathrm{a}} } $ for various relative decay widths $ \Gamma_{{\mathrm{a}} }/m_{{\mathrm{a}} } $ as indicated in the legends. |
png pdf |
Figure 9-d:
Expected and observed upper limits at 95% CL on the $ {\mathrm{t}\overline{\mathrm{t}}} {\mathrm{a}} $ production cross section times branching fraction at 13 TeV as a function of $ m_{{\mathrm{a}} } $ for various relative decay widths $ \Gamma_{{\mathrm{a}} }/m_{{\mathrm{a}} } $ as indicated in the legends. |
png pdf |
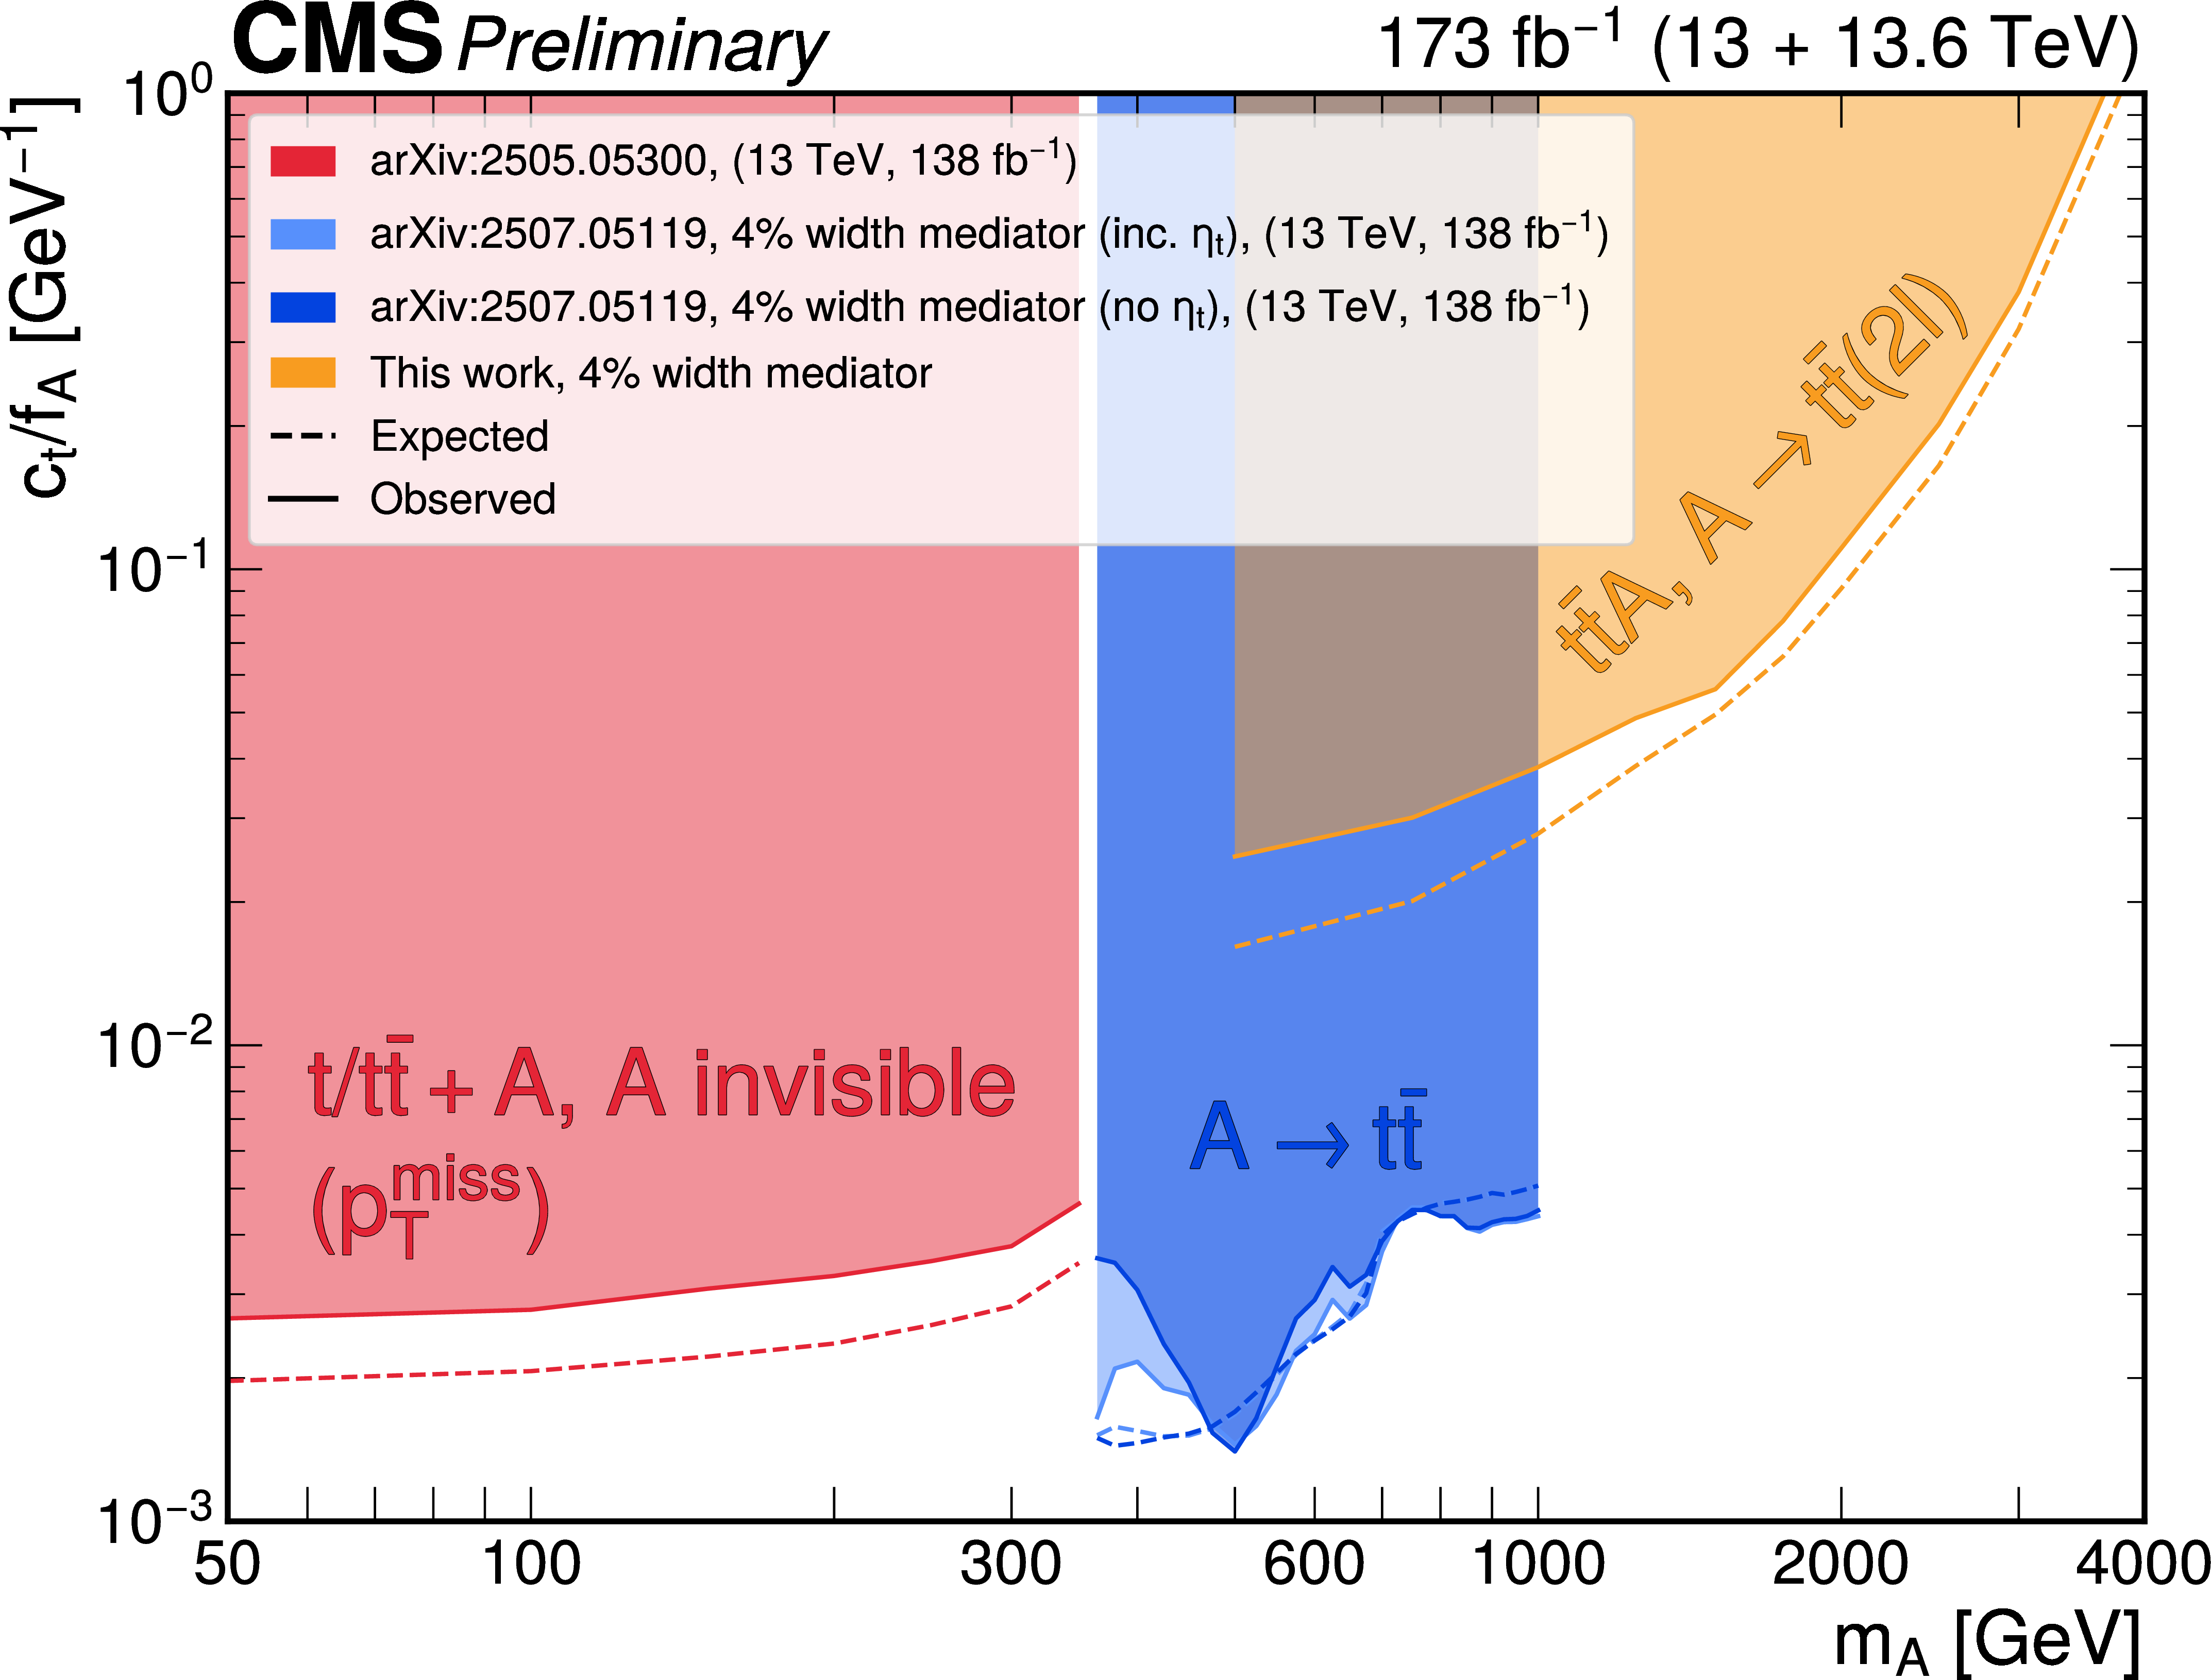
Figure 10:
Expected (dashed lines) and observed (solid lines, shaded areas) upper limits at 95% CL on ALP-top coupling divided by the decay constant, $ c_t/f_{\mathrm{A}} $, from different searches: red - t/ $ \mathrm{t} \overline{\mathrm{t}} $ +$ {\vec p}_{\mathrm{T}}^{\mkern3mu\text{miss}} $ limits from [23]; light blue - $ \mathrm{t} \overline{\mathrm{t}} $ resonance limits from [18] including a contribution from $ \eta_{t} $ in the background and, darker blue, the limits from the same search when not considering $ \eta_{t} $ in the background; orange - four top quark limits from this search. |
| Tables | |
png pdf |
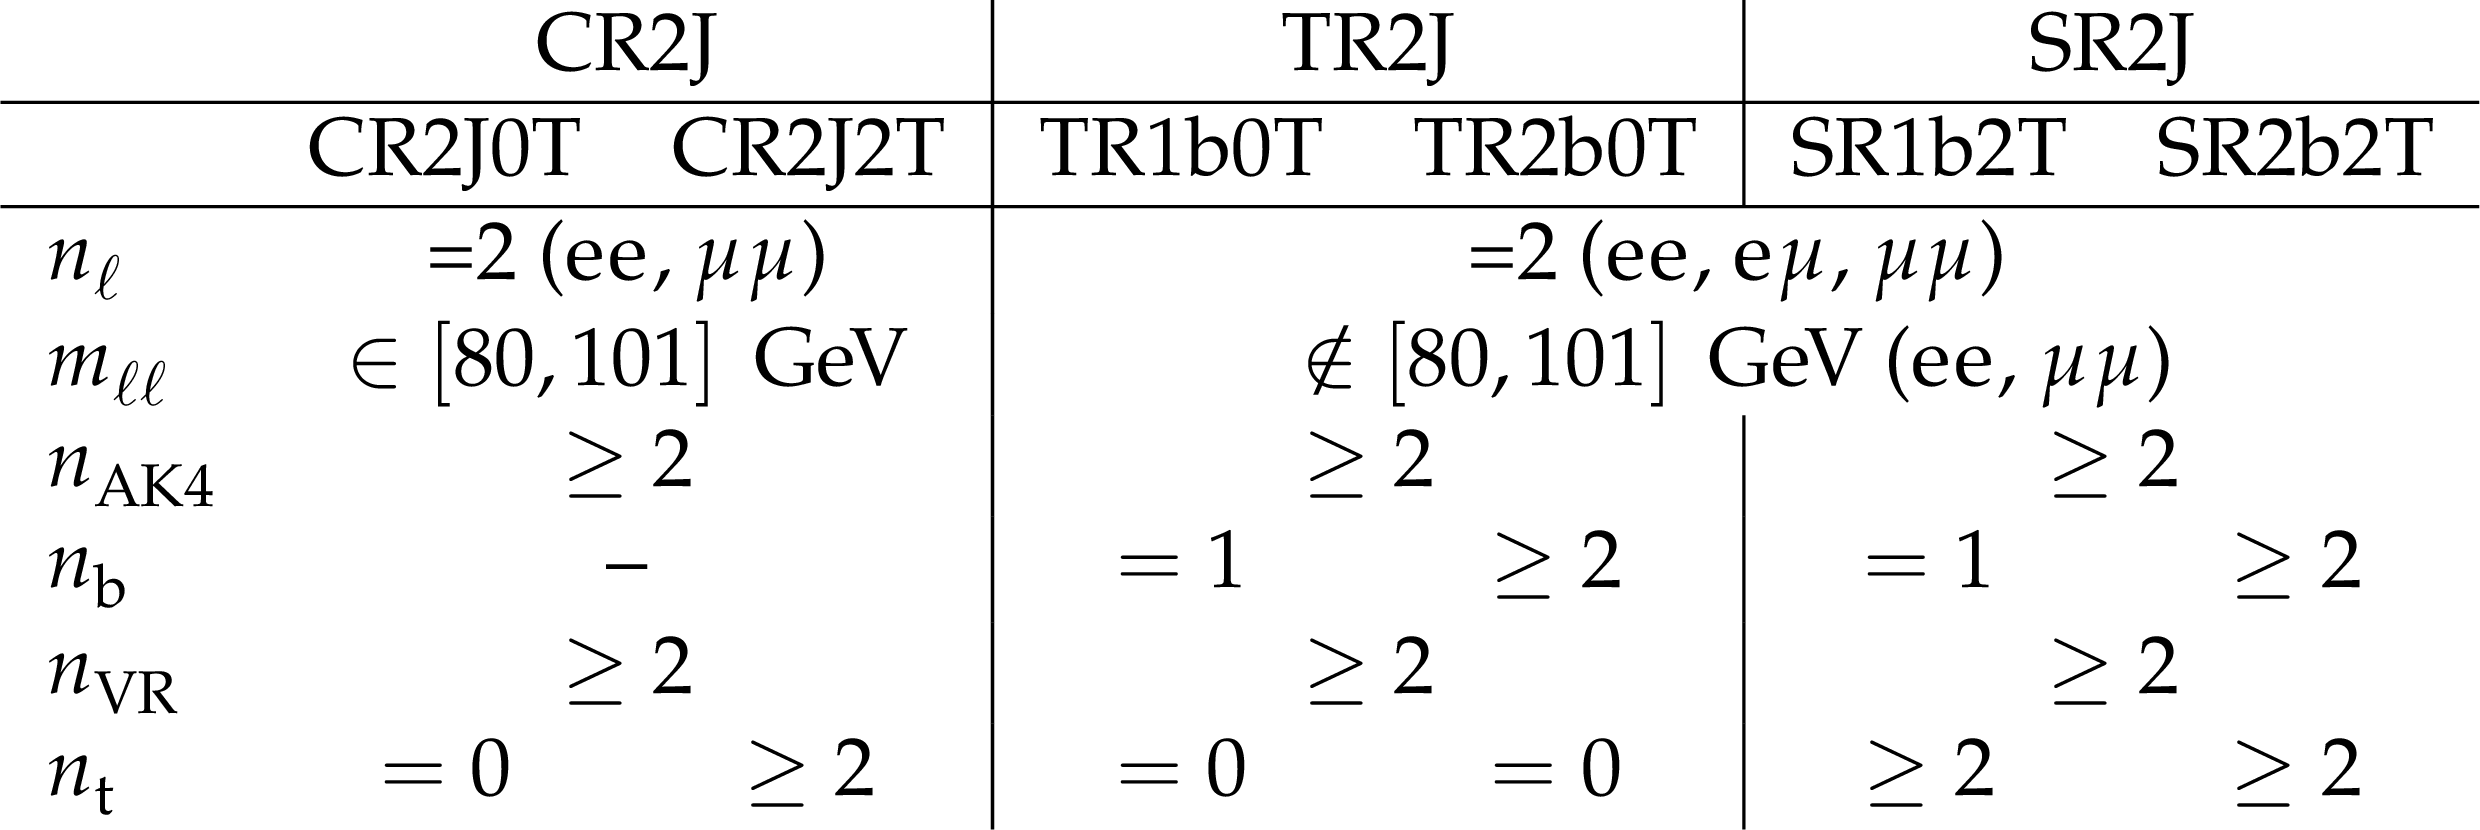
Table 1:
Selections for the control, transfer and signal regions used in this analysis. |
png pdf |
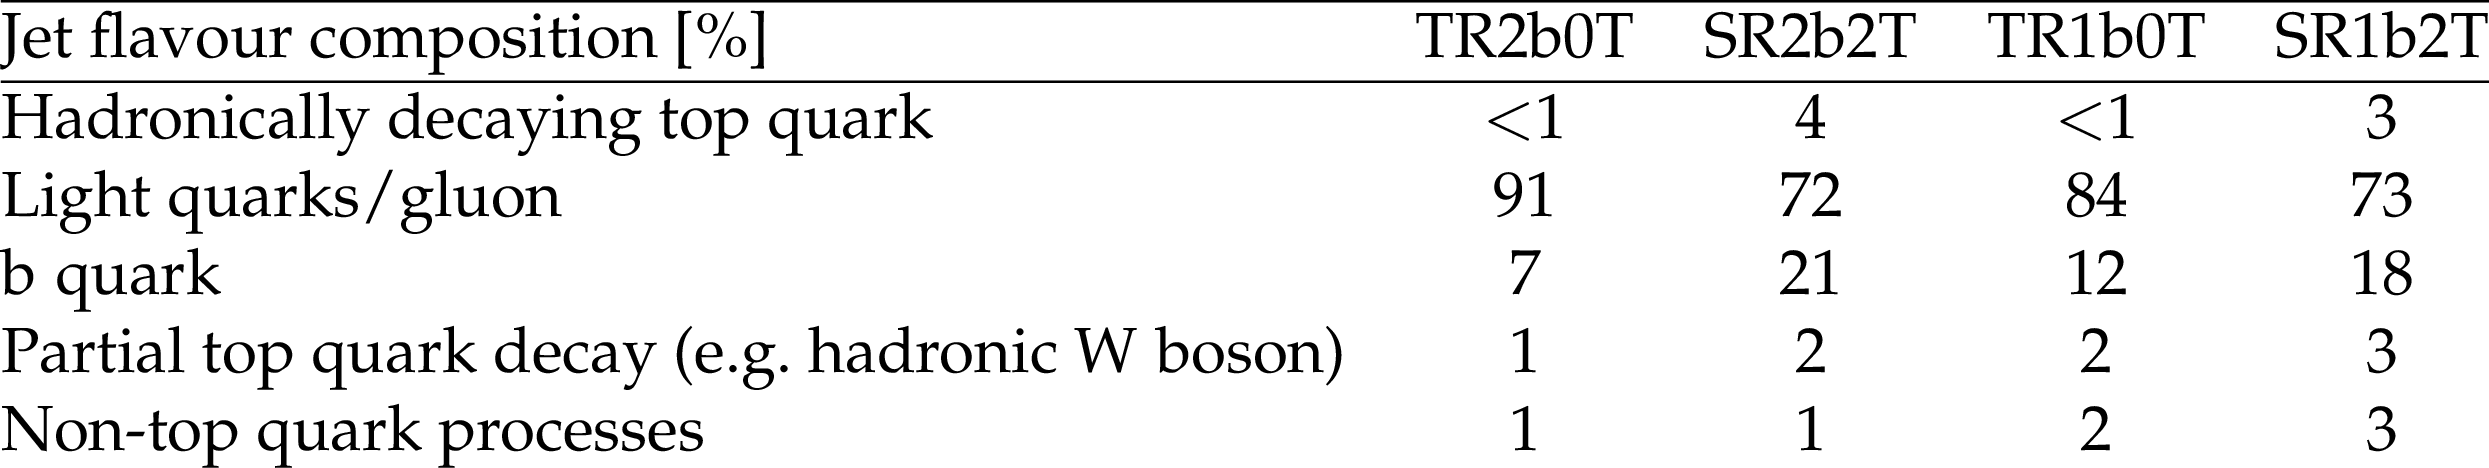
Table 2:
Background jet flavour composition (in %) in each signal or transfer region, as predicted by simulated samples. Jet flavours are determined by matching $ \textrm{VR} $ jets geometrically to generator-level particles, requiring the distance in the $ \eta-\phi $ plane to be less than $ R_\textrm{eff} $. |
| Summary |
| A search for a heavy resonance is presented, examining models where a new boson interacts exclusively with top quarks, resulting in events comprising four top quarks. Two proton-proton collision data sets are analysed corresponding to 138 fb$ ^{-1} $ and 35 fb$ ^{-1} $ for centre-of-mass energies of 13 and 13.6 TeV, respectively. The mass of the new boson is reconstructed from a pair of variable-radius jets with a boosted decision tree used for identification of hadronically decaying top quarks. The additional top quarks are assumed to decay each into a b quark, a lepton (electron or muon), and a neutrino, resulting in a signature with two leptons, two b quark jets, and two large-radius jets. Contributions from background processes are estimated using a data-driven approach. Exclusion limits on the production cross section are determined for boson masses between 500 GeV and 4 TeV and relative decay widths ranging between 4 and 50% of the mediator mass. The analysis is sensitive to scalar, pseudoscalar, or vector bosons decaying to $ \mathrm{t} \overline{\mathrm{t}} $, and further interpretations are provided in the context of extended Higgs sectors and models with axion-like particles. For the 50% width hypothesis, vector mediators with masses up to 850 GeV are excluded (1000 GeV expected). The largest deviation from the background hypothesis for the vector scenario has a local significance of 2.2 standard deviations, with similar results for the scalar and pseudoscalar mediators. The obtained upper limits are the first results from the CMS collaboration for this signature that incorporates a proton-proton collision data set at 13.6 TeV and the first dedicated search of this type in the two-lepton channel. |
| References | ||||
| 1 | ATLAS Collaboration | Observation of four-top-quark production in the multilepton final state with the ATLAS detector | EPJC 83 (2023) 496 | 2303.15061 |
| 2 | CMS Collaboration | Observation of four top quark production in proton-proton collisions at $ \sqrt{s}= $13 TeV | PLB 847 (2023) 138290 | CMS-TOP-22-013 2305.13439 |
| 3 | CMS Collaboration | Evidence for four-top quark production in proton-proton collisions at $ \sqrt{s}= $13 TeV | PLB 844 (2023) 138076 | CMS-TOP-21-005 2303.03864 |
| 4 | ATLAS Collaboration | Measurement of the $ \mathrm{t}\overline{\mathrm{t}}\mathrm{t}\overline{\mathrm{t}} $ production cross section in pp collisions at $ \sqrt{s} = $ 13 TeV with the ATLAS detector | JHEP 11 (2021) 118 | 2106.11683 |
| 5 | M. Cirelli, A. Strumia, and J. Zupan | Dark matter | 2406.01705 | |
| 6 | G. Bertone, D. Hooper, and J. Silk | Particle dark matter: Evidence, candidates and constraints | Phys. Rept. 405 (2005) 279 | hep-ph/0404175 |
| 7 | D. Clowe et al. | A direct empirical proof of the existence of dark matter | Astrophys. J. Lett. 648 (2006) L109 | astro-ph/0608407 |
| 8 | N. Greiner et al. | Model-independent production of a top-philic resonance at the LHC | JHEP 04 (2015) 029 | 1410.6099 |
| 9 | J. H. Kim, K. Kong, S. J. Lee, and G. Mohlabeng | Probing TeV scale top-philic resonances with boosted top-tagging at the high luminosity LHC | PRD 94 (2016) 035023 | 1604.07421 |
| 10 | G. C. Branco et al. | Theory and phenomenology of two-Higgs-doublet models | Phys. Rept. 516 (2012) 1 | 1106.0034 |
| 11 | T. D. Lee | A theory of spontaneous $ T $ violation | PRD 8 (1973) 1226 | |
| 12 | R. D. Peccei and H. R. Quinn | $ \mathrm{CP} $ conservation in the presence of pseudoparticles | PRL 38 (1977) 1440 | |
| 13 | R. D. Peccei and H. R. Quinn | Constraints imposed by $ \mathrm{CP} $ conservation in the presence of pseudoparticles | PRD 16 (1977) 1791 | |
| 14 | F. Wilczek | Problem of strong $ P $ and $ T $ invariance in the presence of instantons | PRL 40 (1978) 279 | |
| 15 | S. Blasi et al. | Top-philic ALP phenomenology at the LHC: The elusive mass-window | JHEP 06 (2024) 077 | 2311.16048 |
| 16 | ATLAS Collaboration | Search for $ \mathrm{t} \overline{\mathrm{t}} $ resonances in fully hadronic final states in pp collisions at $ \sqrt{s} = $ 13 tev with the ATLAS detector | JHEP 10 (2020) 061 | 2005.05138 |
| 17 | ATLAS Collaboration | Search for heavy neutral Higgs bosons decaying into a top quark pair in 140 fb$ ^{-1} $ of proton-proton collision data at $ \sqrt{s} = $ 13 TeV with the ATLAS detector | JHEP 08 (2024) 013 | 2404.18986 |
| 18 | CMS Collaboration | Search for heavy pseudoscalar and scalar bosons decaying to a top quark pair in proton-proton collisions at $ \sqrt{s} = 13 \textrm{TeV} $ | Rept. Prog. Phys. 88 (2025) 127801 | CMS-HIG-22-013 2507.05119 |
| 19 | CMS Collaboration | Search for new particles decaying into top quark-antiquark pairs in events with one lepton and jets in proton-proton collisions at 13 TeV | Physics Analysis Summary CMS-PAS-B2G-22-006, 2025 CDS |
|
| 20 | CMS Collaboration | Search for heavy resonances decaying to a top quark-antiquark pair in dilepton + jets final states | Physics Analysis Summary CMS-PAS-B2G-23-010, 2025 CDS |
|
| 21 | CMS Collaboration | Search for $ \mathrm{t}\overline{\mathrm{t}} $ resonances in the fully hadronic final state | Physics Analysis Summary CMS-PAS-B2G-24-003, 2025 CDS |
|
| 22 | F. Esser, M. Madigan, V. Sanz, and M. Ubiali | On the coupling of axion-like particles to the top quark | JHEP 09 (2023) 063 | 2303.17634 |
| 23 | CMS Collaboration | Search for dark matter produced in association with one or two top quarks in proton-proton collisions at $ \sqrt{\text{s}} = $ 13 TeV | JHEP 08 (2025) 085 | CMS-EXO-22-014 2505.05300 |
| 24 | ATLAS Collaboration | Search for top-philic heavy resonances in pp collisions at $ \sqrt{s}= $ 13 $ \text {TeV} $ with the ATLAS detector | EPJC 84 (2024) 157 | 2304.01678 |
| 25 | CMS Collaboration | Search for a heavy resonance produced in association with and decaying to a $ \mathrm{t}\overline{\mathrm{t}} $ pair in the single lepton final state in proton-proton collisions at $ \sqrt{s}= $ 13 TeV with the CMS detector | Physics Analysis Summary CMS-PAS-B2G-24-009, 2025 | |
| 26 | T. Lapsien, R. Kogler, and J. Haller | A new tagger for hadronically decaying heavy particles at the LHC | EPJC 76 (2016) 600 | 1606.04961 |
| 27 | CMS Collaboration | Identification of heavy, energetic, hadronically decaying particles using machine-learning techniques | JINST 15 (2020) P06005 | CMS-JME-18-002 2004.08262 |
| 28 | CMS Collaboration | The CMS experiment at the CERN LHC | JINST 3 (2008) S08004 | |
| 29 | CMS Collaboration | Development of the CMS detector for the CERN LHC Run 3 | JINST 19 (2024) P05064 | |
| 30 | CMS Collaboration | Particle-flow reconstruction and global event description with the CMS detector | JINST 12 (2017) P10003 | CMS-PRF-14-001 1706.04965 |
| 31 | M. Cacciari, G. P. Salam, and G. Soyez | The anti-$ k_{\mathrm{T}} $ jet clustering algorithm | JHEP 04 (2008) 063 | 0802.1189 |
| 32 | M. Cacciari, G. P. Salam, and G. Soyez | FastJet user manual | EPJC 72 (2012) 1896 | 1111.6097 |
| 33 | CMS Collaboration | Jet energy scale and resolution in the CMS experiment in $ \mathrm{p}\mathrm{p} $ collisions at 8 TeV | JINST 12 (2017) P02014 | CMS-JME-13-004 1607.03663 |
| 34 | CMS Collaboration | Pileup mitigation at CMS in 13 TeV data | JINST 15 (2020) P09018 | CMS-JME-18-001 2003.00503 |
| 35 | D. Bertolini, P. Harris, M. Low, and N. Tran | Pileup per particle identification | JHEP 10 (2014) 059 | 1407.6013 |
| 36 | CMS Collaboration | Jet algorithms performance in 13 TeV data | Physics Analysis Summary, 2017 | CMS-PAS-JME-16-003 |
| 37 | CMS Collaboration | Performance of missing transverse momentum reconstruction in proton-proton collisions at $ \sqrt{s} = $ 13 TeV using the CMS detector | JINST 14 (2019) P07004 | CMS-JME-17-001 1903.06078 |
| 38 | CMS Collaboration | Technical proposal for the Phase-II upgrade of the Compact Muon Solenoid | CMS Technical Proposal CERN-LHCC-2015-010, CMS-TDR-15-02, 2015 CDS |
|
| 39 | CMS Collaboration | Performance of the CMS Level-1 trigger in proton-proton collisions at $ \sqrt{s} = $ 13 TeV | JINST 15 (2020) P10017 | CMS-TRG-17-001 2006.10165 |
| 40 | CMS Collaboration | The CMS trigger system | JINST 12 (2017) P01020 | CMS-TRG-12-001 1609.02366 |
| 41 | CMS Collaboration | Electron and photon reconstruction and identification with the CMS experiment at the CERN LHC | JINST 16 (2021) P05014 | CMS-EGM-17-001 2012.06888 |
| 42 | CMS Collaboration | Performance of the CMS muon trigger system in proton-proton collisions at $ \sqrt{s} = $ 13 TeV | JINST 16 (2021) P07001 | CMS-MUO-19-001 2102.04790 |
| 43 | J. Alwall et al. | The automated computation of tree-level and next-to-leading order differential cross sections, and their matching to parton shower simulations | JHEP 07 (2014) 079 | 1405.0301 |
| 44 | P. Artoisenet et al. | A framework for Higgs characterisation | JHEP 11 (2013) 043 | 1306.6464 |
| 45 | P. Nason | A new method for combining NLO QCD with shower Monte Carlo algorithms | JHEP 11 (2004) 040 | hep-ph/0409146 |
| 46 | S. Frixione, P. Nason, and C. Oleari | Matching NLO QCD computations with parton shower simulations: The POWHEG method | JHEP 11 (2007) 070 | 0709.2092 |
| 47 | S. Alioli, P. Nason, C. Oleari, and E. Re | A general framework for implementing NLO calculations in shower Monte Carlo programs: The POWHEG BOX | JHEP 06 (2010) 043 | 1002.2581 |
| 48 | E. Re | Single-top $ \mathrm{W}\mathrm{t} $-channel production matched with parton showers using the POWHEG method | EPJC 71 (2011) 1547 | 1009.2450 |
| 49 | S. Frixione, P. Nason, and G. Ridolfi | A positive-weight next-to-leading-order Monte Carlo for heavy flavour hadroproduction | JHEP 09 (2007) 126 | 0707.3088 |
| 50 | H. B. Hartanto, B. Jager, L. Reina, and D. Wackeroth | Higgs boson production in association with top quarks in the POWHEG BOX | PRD 91 (2015) 094003 | 1501.04498 |
| 51 | J. Alwall et al. | Comparative study of various algorithms for the merging of parton showers and matrix elements in hadronic collisions | EPJC 53 (2008) 473 | 0706.2569 |
| 52 | J. Alwall, S. de Visscher, and F. Maltoni | QCD radiation in the production of heavy colored particles at the LHC | JHEP 02 (2009) 017 | 0810.5350 |
| 53 | M. Czakon and A. Mitov | Top++: A program for the calculation of the top-pair cross-section at hadron colliders | Comput. Phys. Commun. 185 (2014) 2930 | 1112.5675 |
| 54 | J. Campbell, T. Neumann, and Z. Sullivan | Single-top-quark production in the $ t $-channel at NNLO | JHEP 02 (2021) 040 | 2012.01574 |
| 55 | R. Frederix, D. Pagani, and M. Zaro | Large NLO corrections in $ \mathrm{t}\overline{\mathrm{t}}\mathrm{W}^{\pm} $ and $ \mathrm{t}\overline{\mathrm{t}}\mathrm{t}\overline{\mathrm{t}} $ hadroproduction from supposedly subleading EW contributions | JHEP 02 (2018) 031 | 1711.02116 |
| 56 | M. van Beekveld, A. Kulesza, and L. M. Valero | Threshold resummation for the production of four top quarks at the LHC | PRL 131 (2023) 211901 | 2212.03259 |
| 57 | NNPDF Collaboration | Parton distributions from high-precision collider data | EPJC 77 (2017) 663 | 1706.00428 |
| 58 | T. Sjöstrand et al. | An introduction to PYTHIA 8.2 | Comput. Phys. Commun. 191 (2015) 159 | 1410.3012 |
| 59 | CMS Collaboration | Extraction and validation of a new set of CMS PYTHIA8 tunes from underlying-event measurements | EPJC 80 (2020) 4 | CMS-GEN-17-001 1903.12179 |
| 60 | GEANT4 Collaboration | GEANT 4---a simulation toolkit | NIM A 506 (2003) 250 | |
| 61 | CMS Collaboration | Performance of the CMS muon detector and muon reconstruction with proton-proton collisions at $ \sqrt{s}= $ 13 TeV | JINST 13 (2018) P06015 | CMS-MUO-16-001 1804.04528 |
| 62 | CMS Collaboration | Performance of the pile up jet identification in CMS for Run 2 | CMS Performance Note CMS-DP-2020-020, 2020 CDS |
|
| 63 | E. Bols et al. | Jet flavour classification using DeepJet | JINST 15 (2020) P12012 | 2008.10519 |
| 64 | CMS Collaboration | Identification of heavy-flavour jets with the CMS detector in pp collisions at 13 TeV | JINST 13 (2018) P05011 | CMS-BTV-16-002 1712.07158 |
| 65 | S. Schätzel | Boosted top quarks and jet structure | EPJC 75 (2015) 415 | 1403.5176 |
| 66 | A. J. Larkoski, I. Moult, and B. Nachman | Jet substructure at the Large Hadron Collider: A review of recent advances in theory and machine learning | Phys. Rep. 841 (2020) 1 | 1709.04464 |
| 67 | R. Kogler et al. | Jet substructure at the Large Hadron Collider: Experimental review | Rev. Mod. Phys. 91 (2019) 045003 | 1803.06991 |
| 68 | R. Kogler | Advances in jet substructure at the LHC: Algorithms, measurements and searches for new physical phenomena | volume 284 of Springer Tracts Mod. Phys. Springer,, ISBN 978-3-030-72857-1, 978-3-030-72858-8, 2021 link |
|
| 69 | Y. L. Dokshitzer, G. D. Leder, S. Moretti, and B. R. Webber | Better jet clustering algorithms | JHEP 08 (1997) 001 | hep-ph/9707323 |
| 70 | M. Wobisch and T. Wengler | Hadronization corrections to jet cross-sections in deep inelastic scattering | in Workshop on Monte Carlo Generators for HERA Physics (Plenary Starting Meeting), 1998 | hep-ph/9907280 |
| 71 | M. Stoll | Vetoed jet clustering: The mass-jump algorithm | JHEP 04 (2015) 111 | 1410.4637 |
| 72 | J. Thaler and K. Van Tilburg | Identifying boosted objects with N-subjettiness | JHEP 03 (2011) 015 | 1011.2268 |
| 73 | CMS Collaboration | Measurement of the inelastic proton-proton cross section at $ \sqrt{s}= $ 13 TeV | JHEP 07 (2018) 161 | CMS-FSQ-15-005 1802.02613 |
| 74 | CMS Collaboration | Precision luminosity measurement in proton-proton collisions at $ \sqrt{s} = $ 13 TeV in 2015 and 2016 at CMS | EPJC 81 (2021) 800 | CMS-LUM-17-003 2104.01927 |
| 75 | CMS Collaboration | Precision luminosity measurement in proton-proton collisions at $ \sqrt{s} = $ 13 TeV with the CMS detector | Physics Analysis Summary, 2025 CMS-PAS-LUM-20-001 |
CMS-PAS-LUM-20-001 |
| 76 | CMS Collaboration | Luminosity measurement in proton-proton collisions at 13.6 TeV in 2022 at CMS | Physics Analysis Summary, 2024 CMS-PAS-LUM-22-001 |
CMS-PAS-LUM-22-001 |
| 77 | A. Kalogeropoulos and J. Alwall | The SysCalc code: A tool to derive theoretical systematic uncertainties | 1801.08401 | |
| 78 | J. Butterworth et al. | PDF4LHC recommendations for LHC Run II | JPG 43 (2016) 023001 | 1510.03865 |
| 79 | R. J. Barlow and C. Beeston | Fitting using finite Monte Carlo samples | Comput. Phys. Commun. 77 (1993) 219 | |
| 80 | ATLAS and CMS Collaborations, and LHC Higgs Combination Group | Procedure for the LHC Higgs boson search combination in summer 2011 | Technical Report CMS-NOTE-2011-005, ATL-PHYS-PUB-2011-11, 2011 | |
| 81 | T. Junk | Confidence level computation for combining searches with small statistics | Nucl. Instr. Meth. A 434 (1999) 435 | hep-ex/9902006 |
| 82 | A. L. Read | Presentation of search results: The $ \text{CL}_\text{s} $ technique | JPG 28 (2002) 2693 | |
| 83 | G. Cowan, K. Cranmer, E. Gross, and O. Vitells | Asymptotic formulae for likelihood-based tests of new physics | EPJC 71 (2011) 1554 | 1007.1727 |
| 84 | CMS Collaboration | The CMS statistical analysis and combination tool: Combine | Comput. Softw. Big Sci. 8 (2024) 19 | CMS-CAT-23-001 2404.06614 |
| 85 | A. Anuar et al. | ALP-ine quests at the LHC: Hunting axion-like particles via peaks and dips in $ \mathrm{t}\overline{\mathrm{t}} $ production | JHEP 12 (2024) 197 | 2404.19014 |
| 86 | Y. Kiyo et al. | Top-quark pair production near threshold at LHC | EPJC 60 (2009) 375 | 0812.0919 |
| 87 | B. Fuks, K. Hagiwara, K. Ma, and Y.-J. Zheng | Signatures of toponium formation in LHC run 2 data | PRD 104 (2021) 034023 | 2102.11281 |
|
|
Compact Muon Solenoid LHC, CERN |
|

|

|

|

|

|