

Compact Muon Solenoid
LHC, CERN
| CMS-PAS-B2G-24-003 | ||
| Search for $ \mathrm{t}\overline{\mathrm{t}} $ resonances in the fully hadronic final state | ||
| CMS Collaboration | ||
| 2 April 2025 | ||
| Abstract: A search for a heavy resonance decaying into a top quark-antiquark pair is presented, using 138 fb$ ^{-1} $ of proton-proton collision data collected at $ \sqrt{s}= $ 13 TeV with the Compact Muon Solenoid (CMS) detector. This analysis employs machine-learning-based techniques for top quark identification in the fully hadronic decay channel and achieves improved sensitivity compared to previous searches. The search is optimized for highly Lorentz-boosted top quark decays, where the hadronic decay products are reconstructed as a single merged jet. Upper limits are set on the production cross section of a leptophobic topcolor $ Z' $ resonance with widths of 1%, 10%, and 30% of the resonance mass. These widths are chosen to cover a range of theoretically motivated models, enabling reinterpretation of the results. The corresponding lower mass limits for these benchmark scenarios are 4.49, 5.52, and 6.85 TeV, respectively. Additionally, two specific models are considered: a Kaluza-Klein excitation of the gluon in the Randall-Sundrum model, excluded up to 5.0 TeV, and a dark matter model with a massive mediator coupling to top quarks, excluded up to 3.9 TeV. These results represent the most stringent limits in this channel to date, particularly in the high-mass regime starting from 3 TeV. | ||
| Links: CDS record (PDF) ; Physics Briefing ; CADI line (restricted) ; | ||
| Figures | |
png pdf |
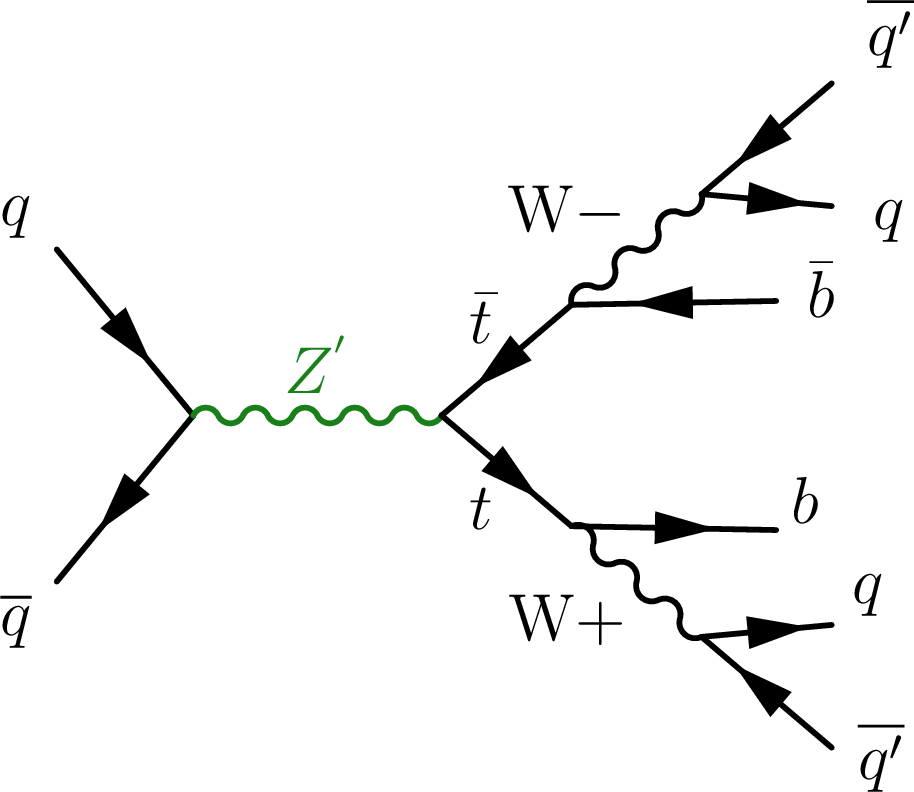
Figure 1:
Production of Z' particles decaying into a $ {\mathrm{t}\overline{\mathrm{t}}} $ pair, which subsequently decays hadronically. |
png pdf |
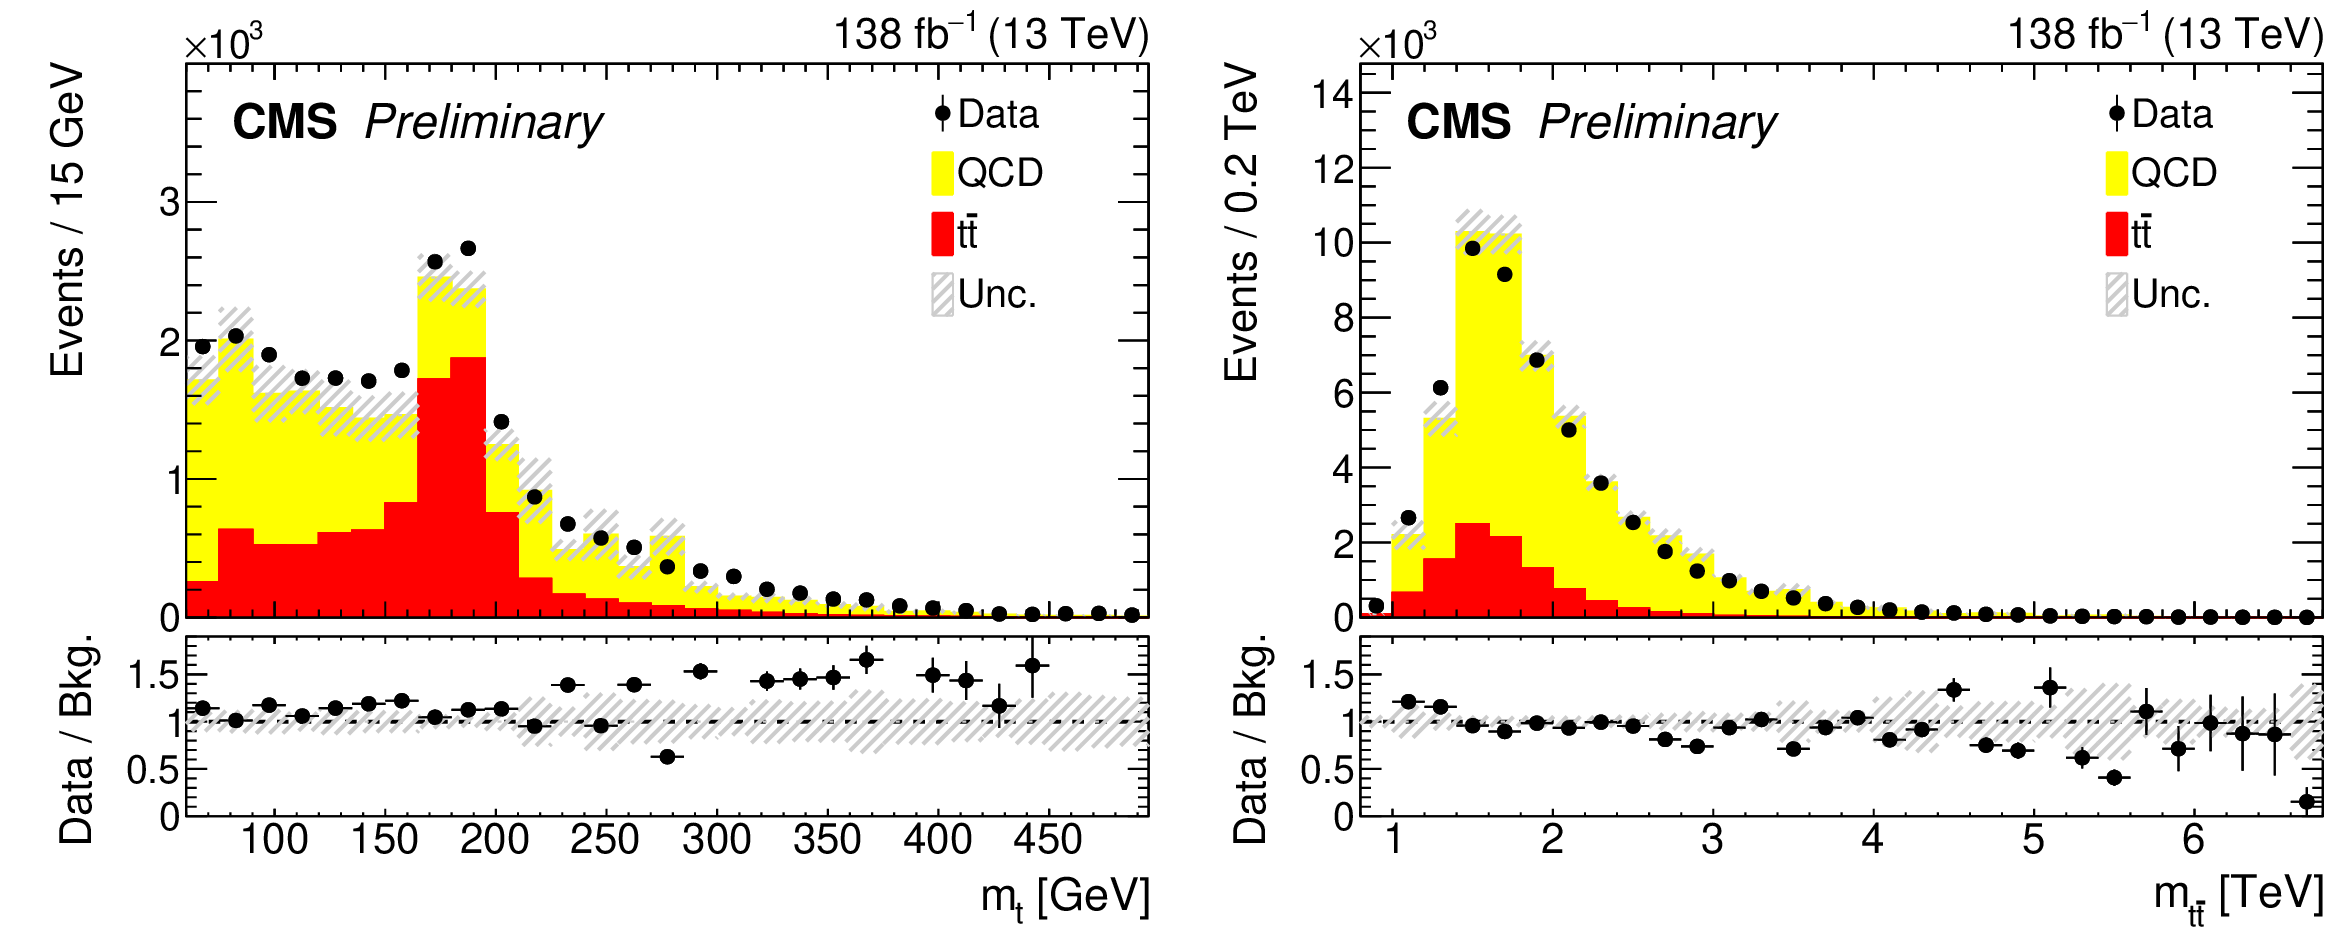
Figure 2:
Run 2 data-to-MC comparison of distributions for the top mass of the leading jet (left) and the reconstructed $ {\mathrm{t}\overline{\mathrm{t}}} $ mass (right) in the inclusive central and forward categories, where both jets pass the top-tagging SR requirement. |
png pdf |
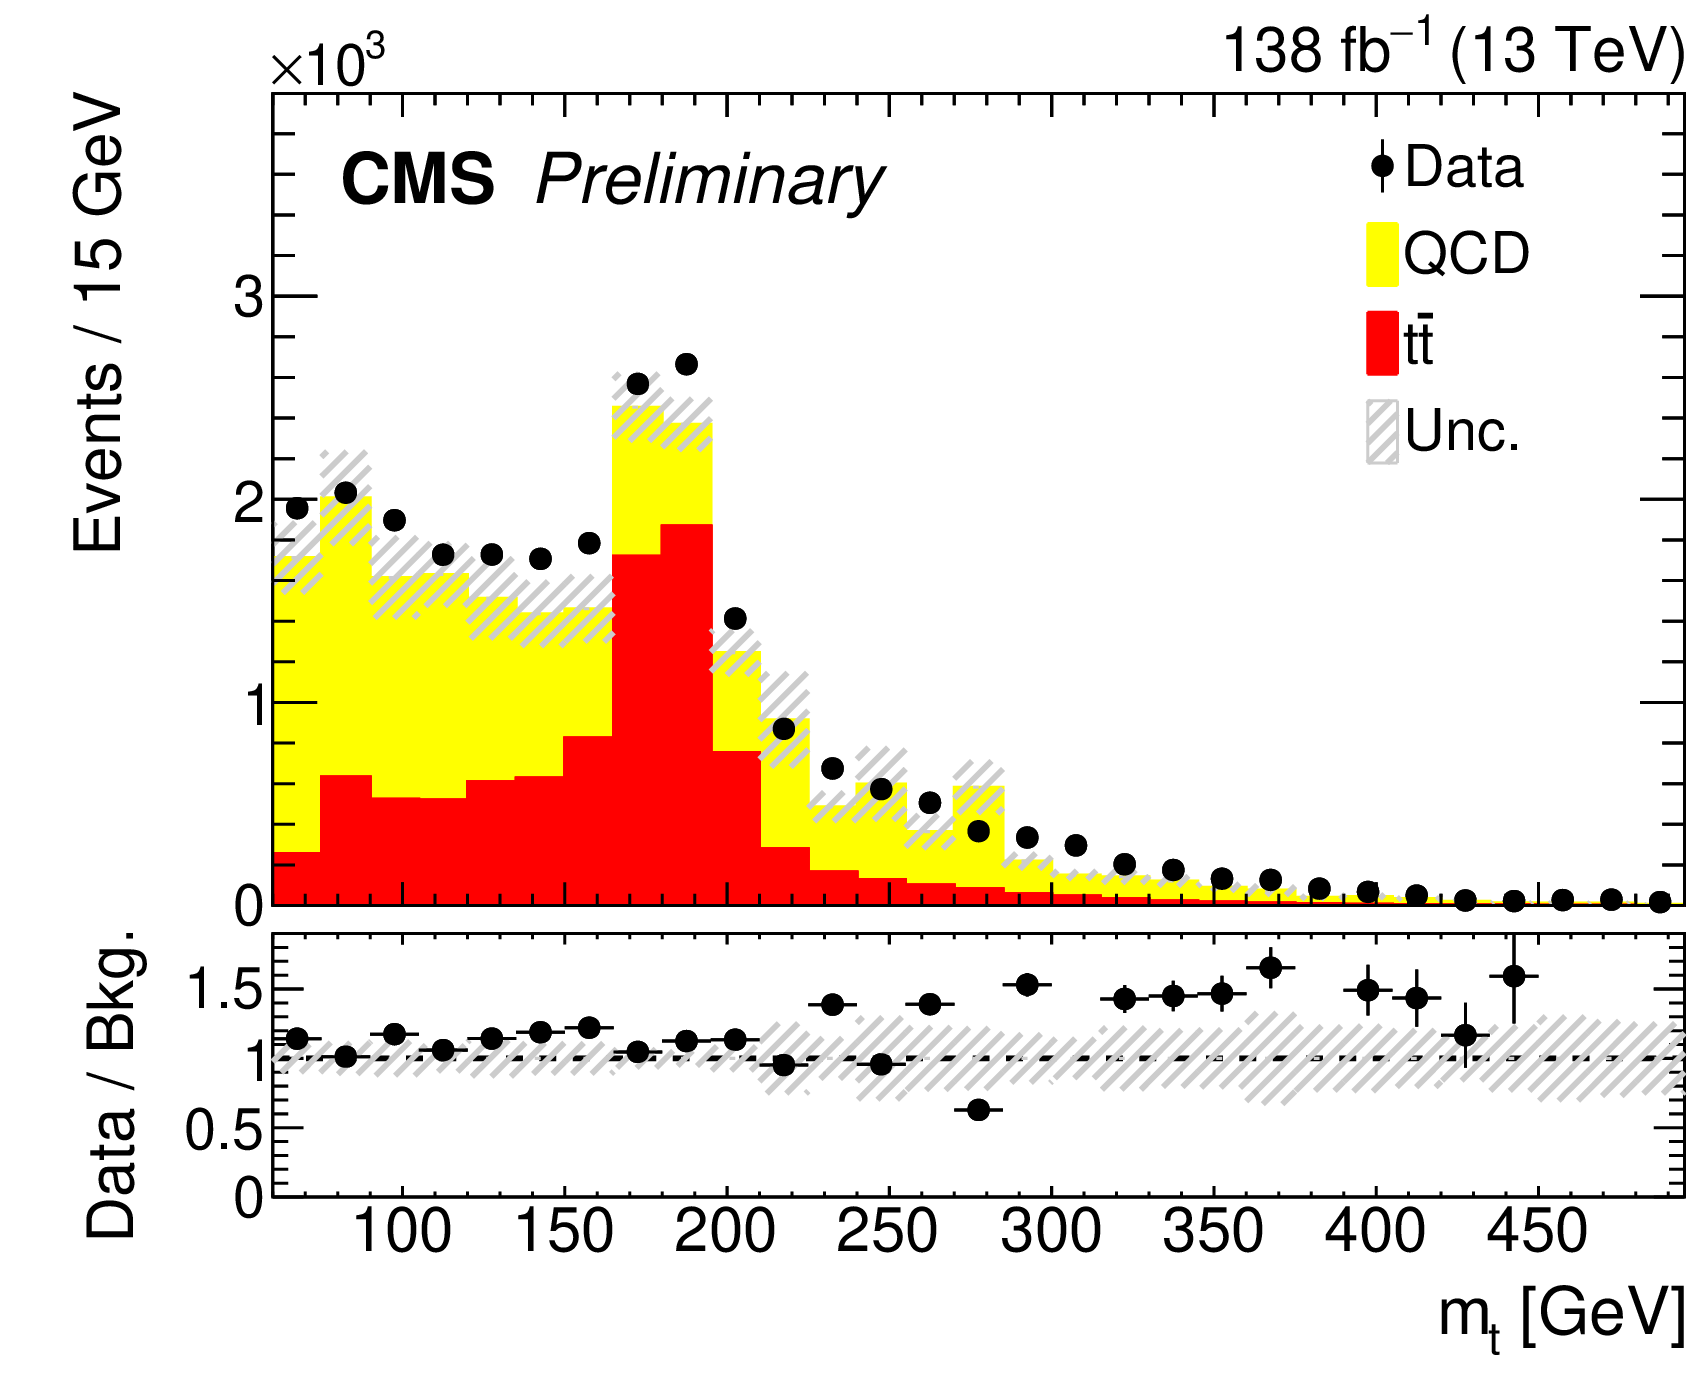
Figure 2-a:
Run 2 data-to-MC comparison of distributions for the top mass of the leading jet (left) and the reconstructed $ {\mathrm{t}\overline{\mathrm{t}}} $ mass (right) in the inclusive central and forward categories, where both jets pass the top-tagging SR requirement. |
png pdf |
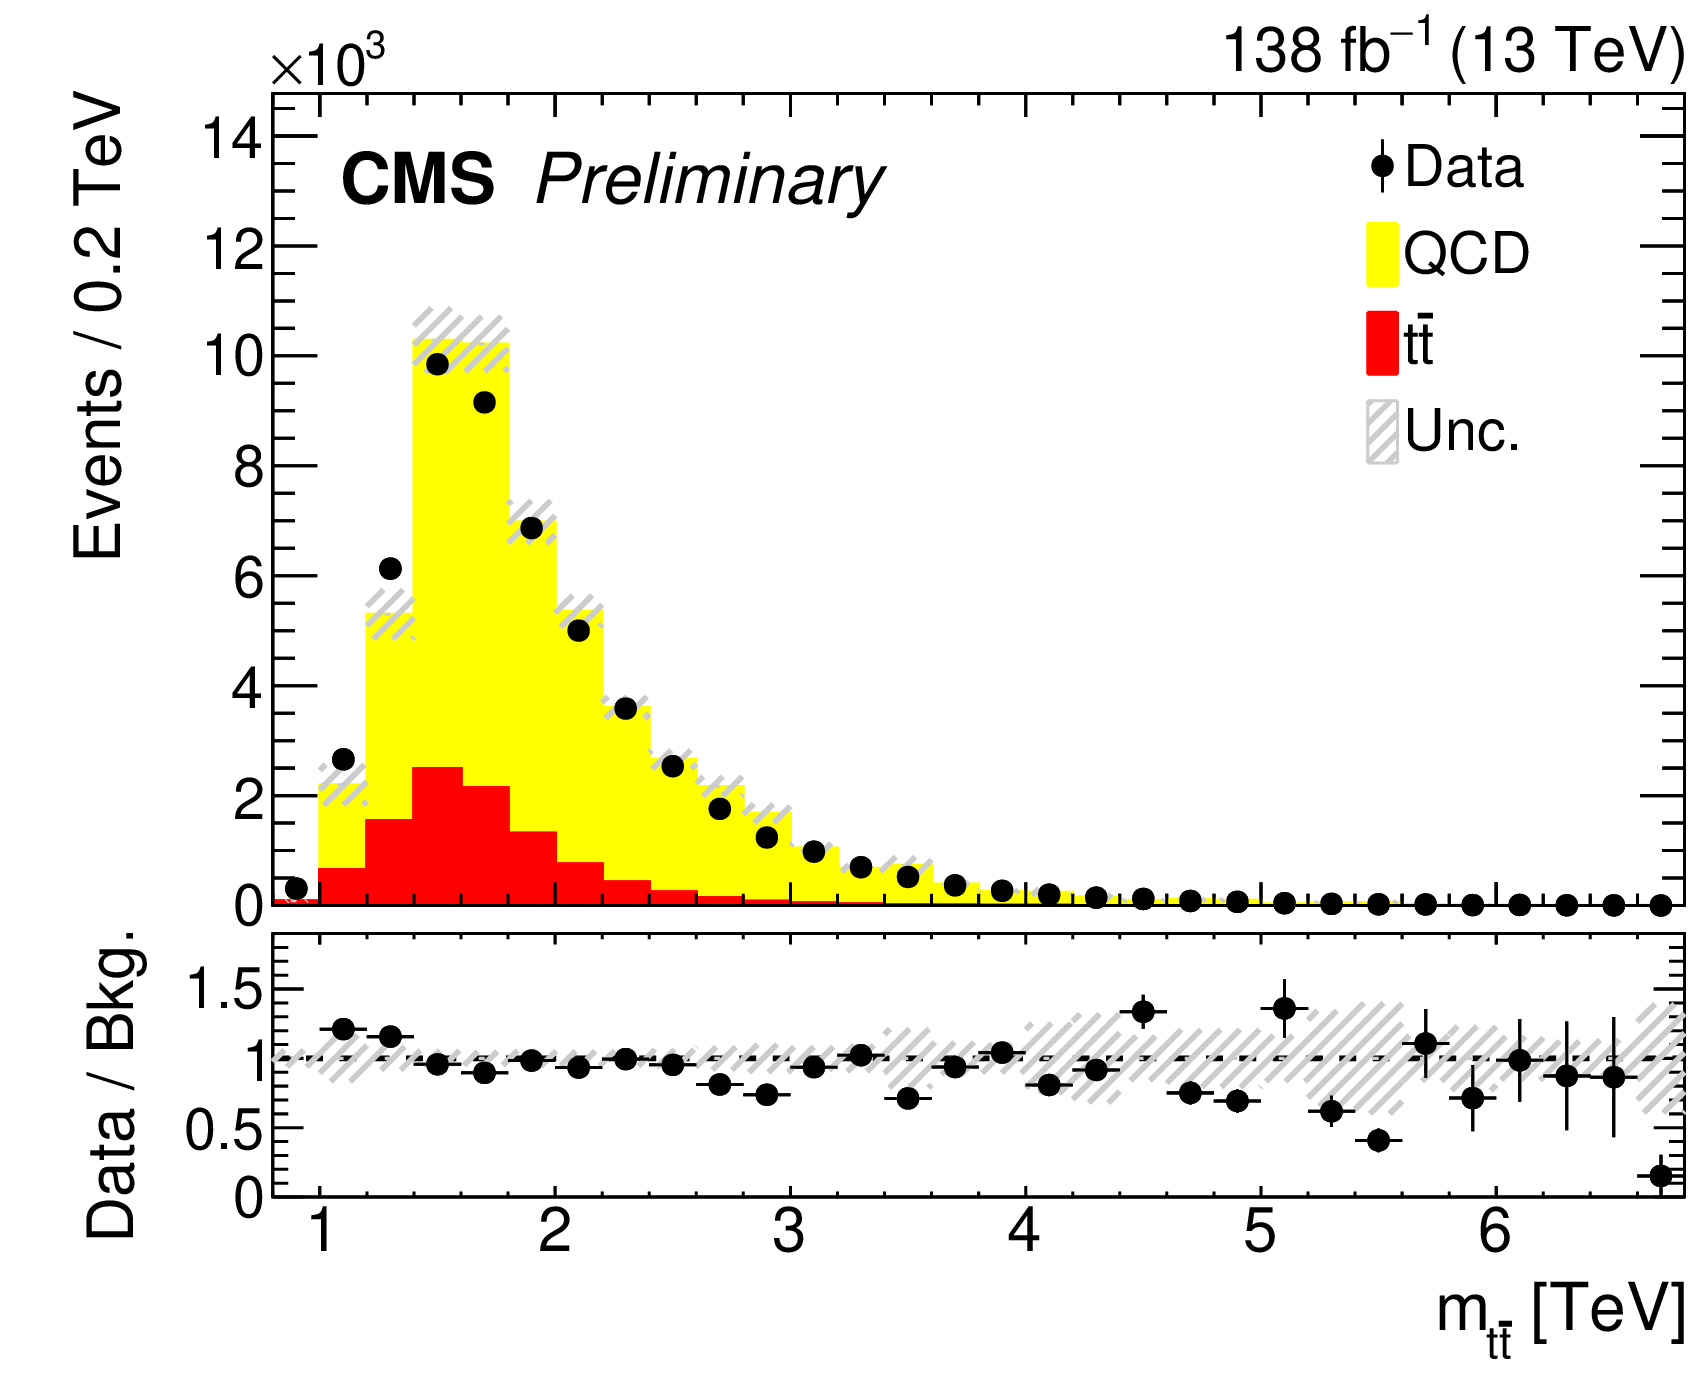
Figure 2-b:
Run 2 data-to-MC comparison of distributions for the top mass of the leading jet (left) and the reconstructed $ {\mathrm{t}\overline{\mathrm{t}}} $ mass (right) in the inclusive central and forward categories, where both jets pass the top-tagging SR requirement. |
png pdf |
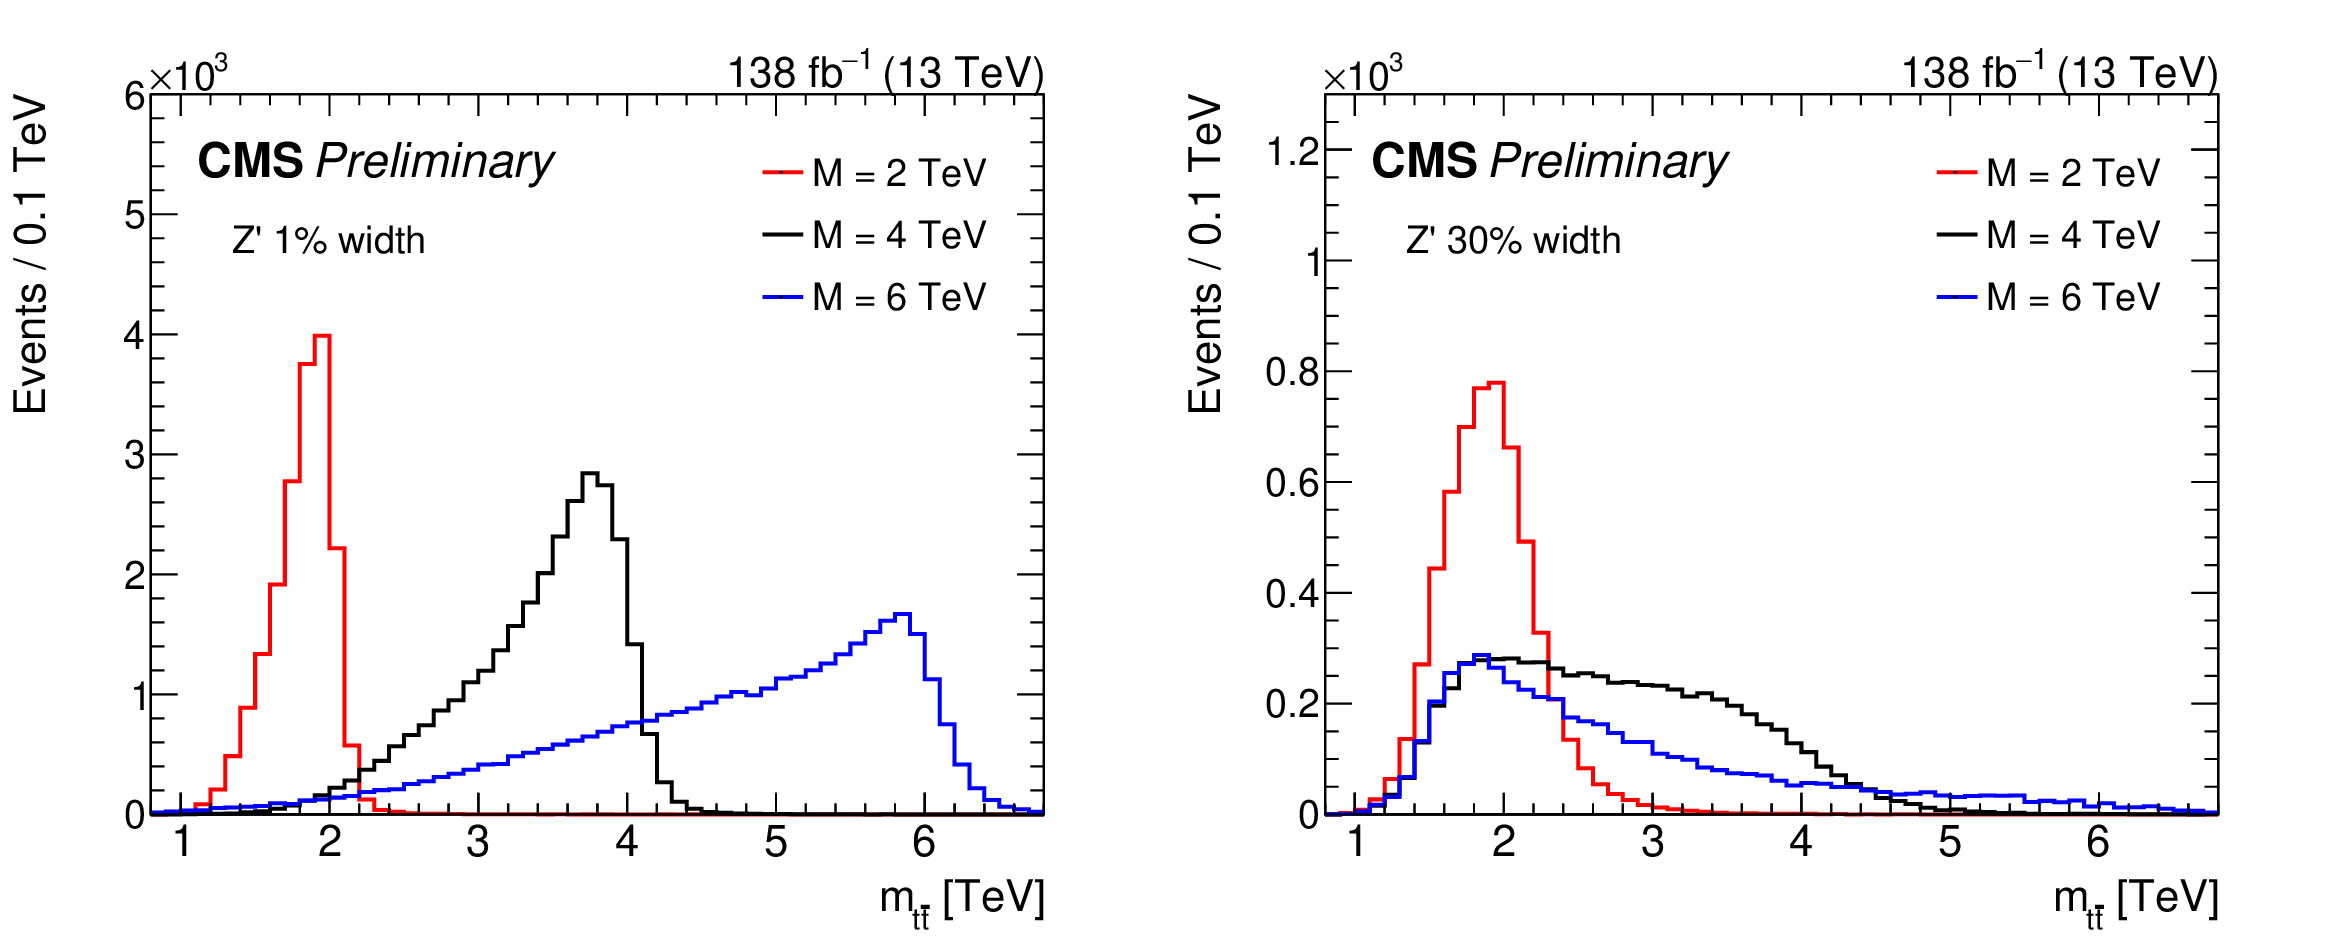
Figure 3:
Signal distributions for Z' with 1% and 30% widths shown in the left and right panels, respectively. Signal lines correspond to Z' masses of 2, 4, and 6 TeV where both jets pass the top-tagging SR requirement. Signal events are normalized to 1 pb. |
png pdf |
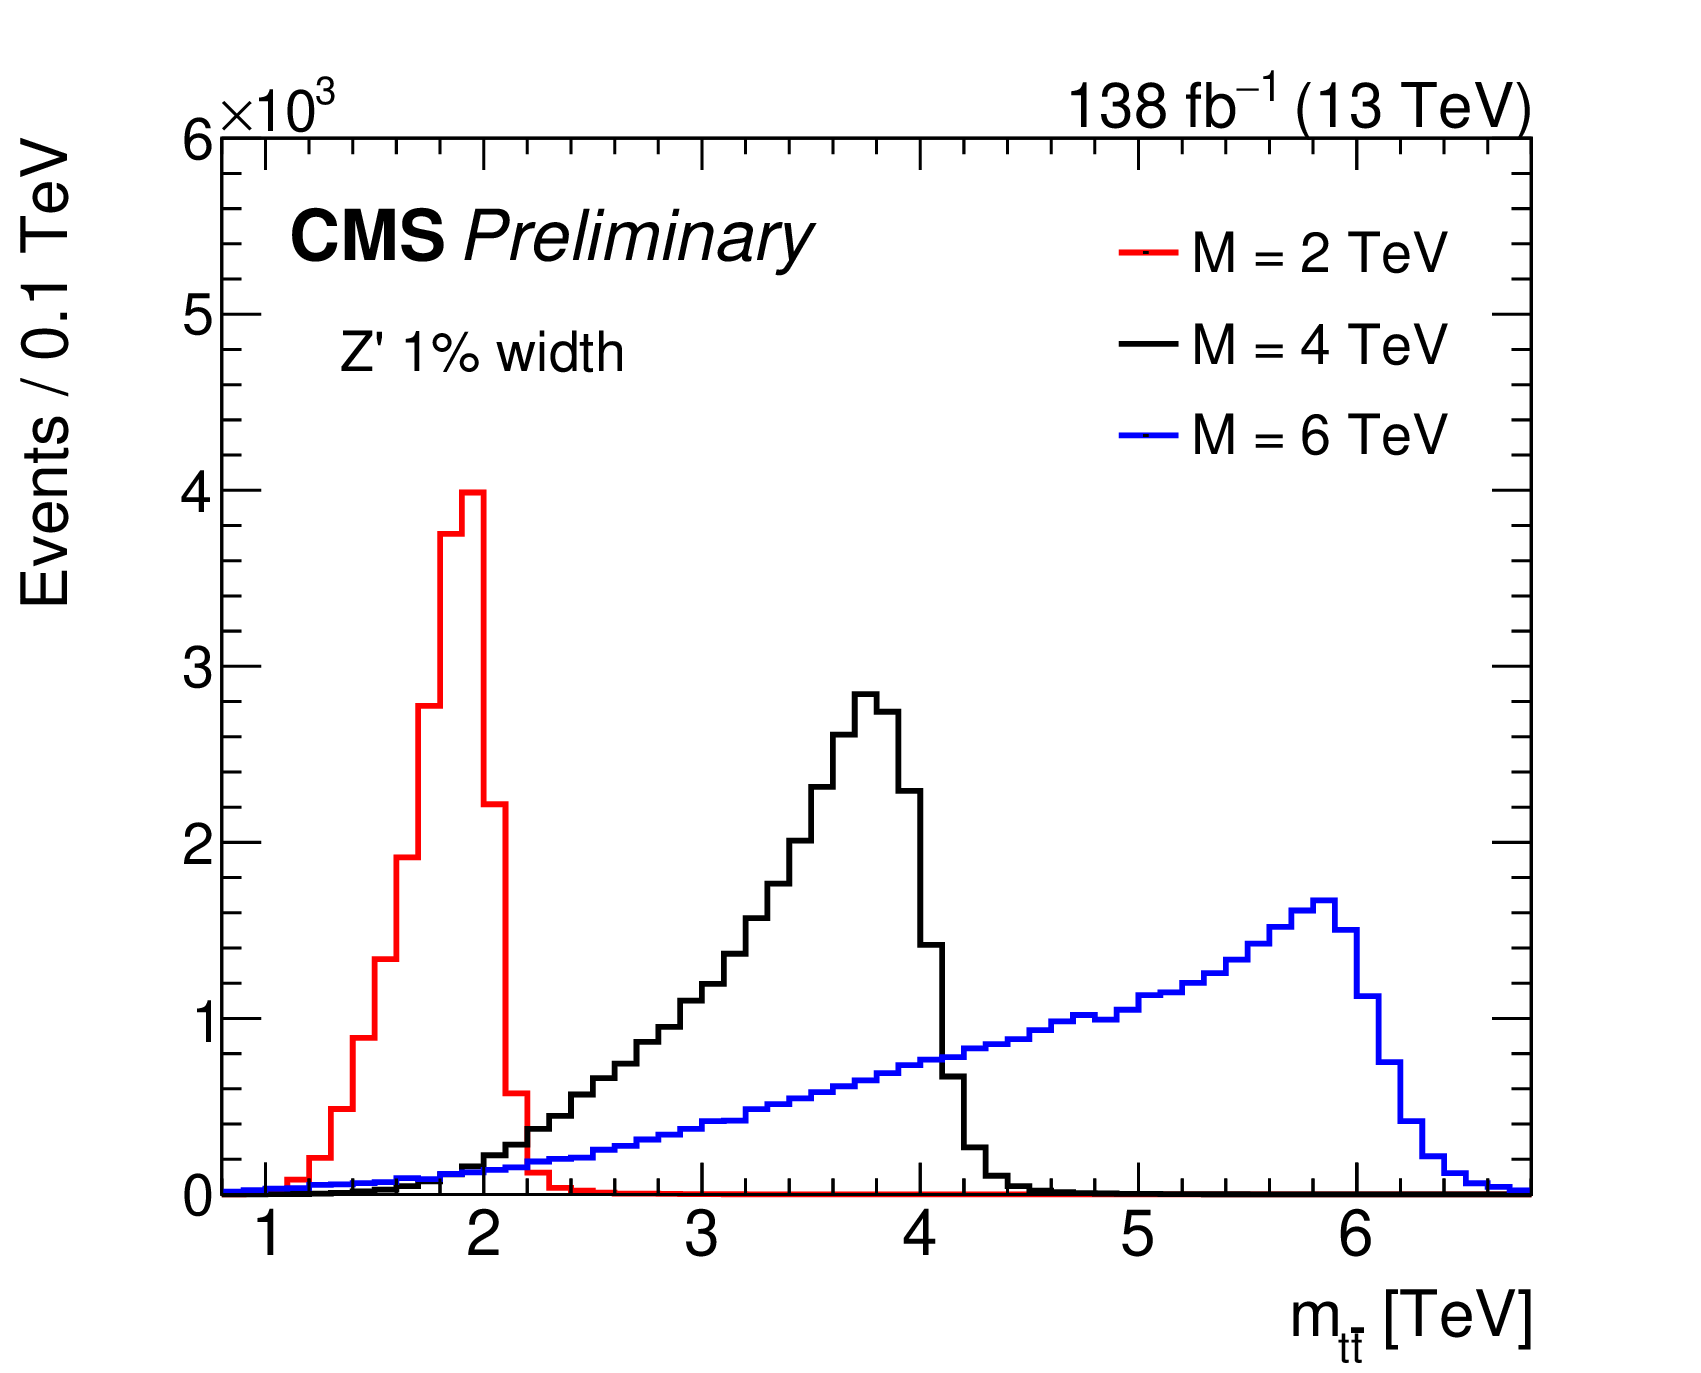
Figure 3-a:
Signal distributions for Z' with 1% and 30% widths shown in the left and right panels, respectively. Signal lines correspond to Z' masses of 2, 4, and 6 TeV where both jets pass the top-tagging SR requirement. Signal events are normalized to 1 pb. |
png pdf |
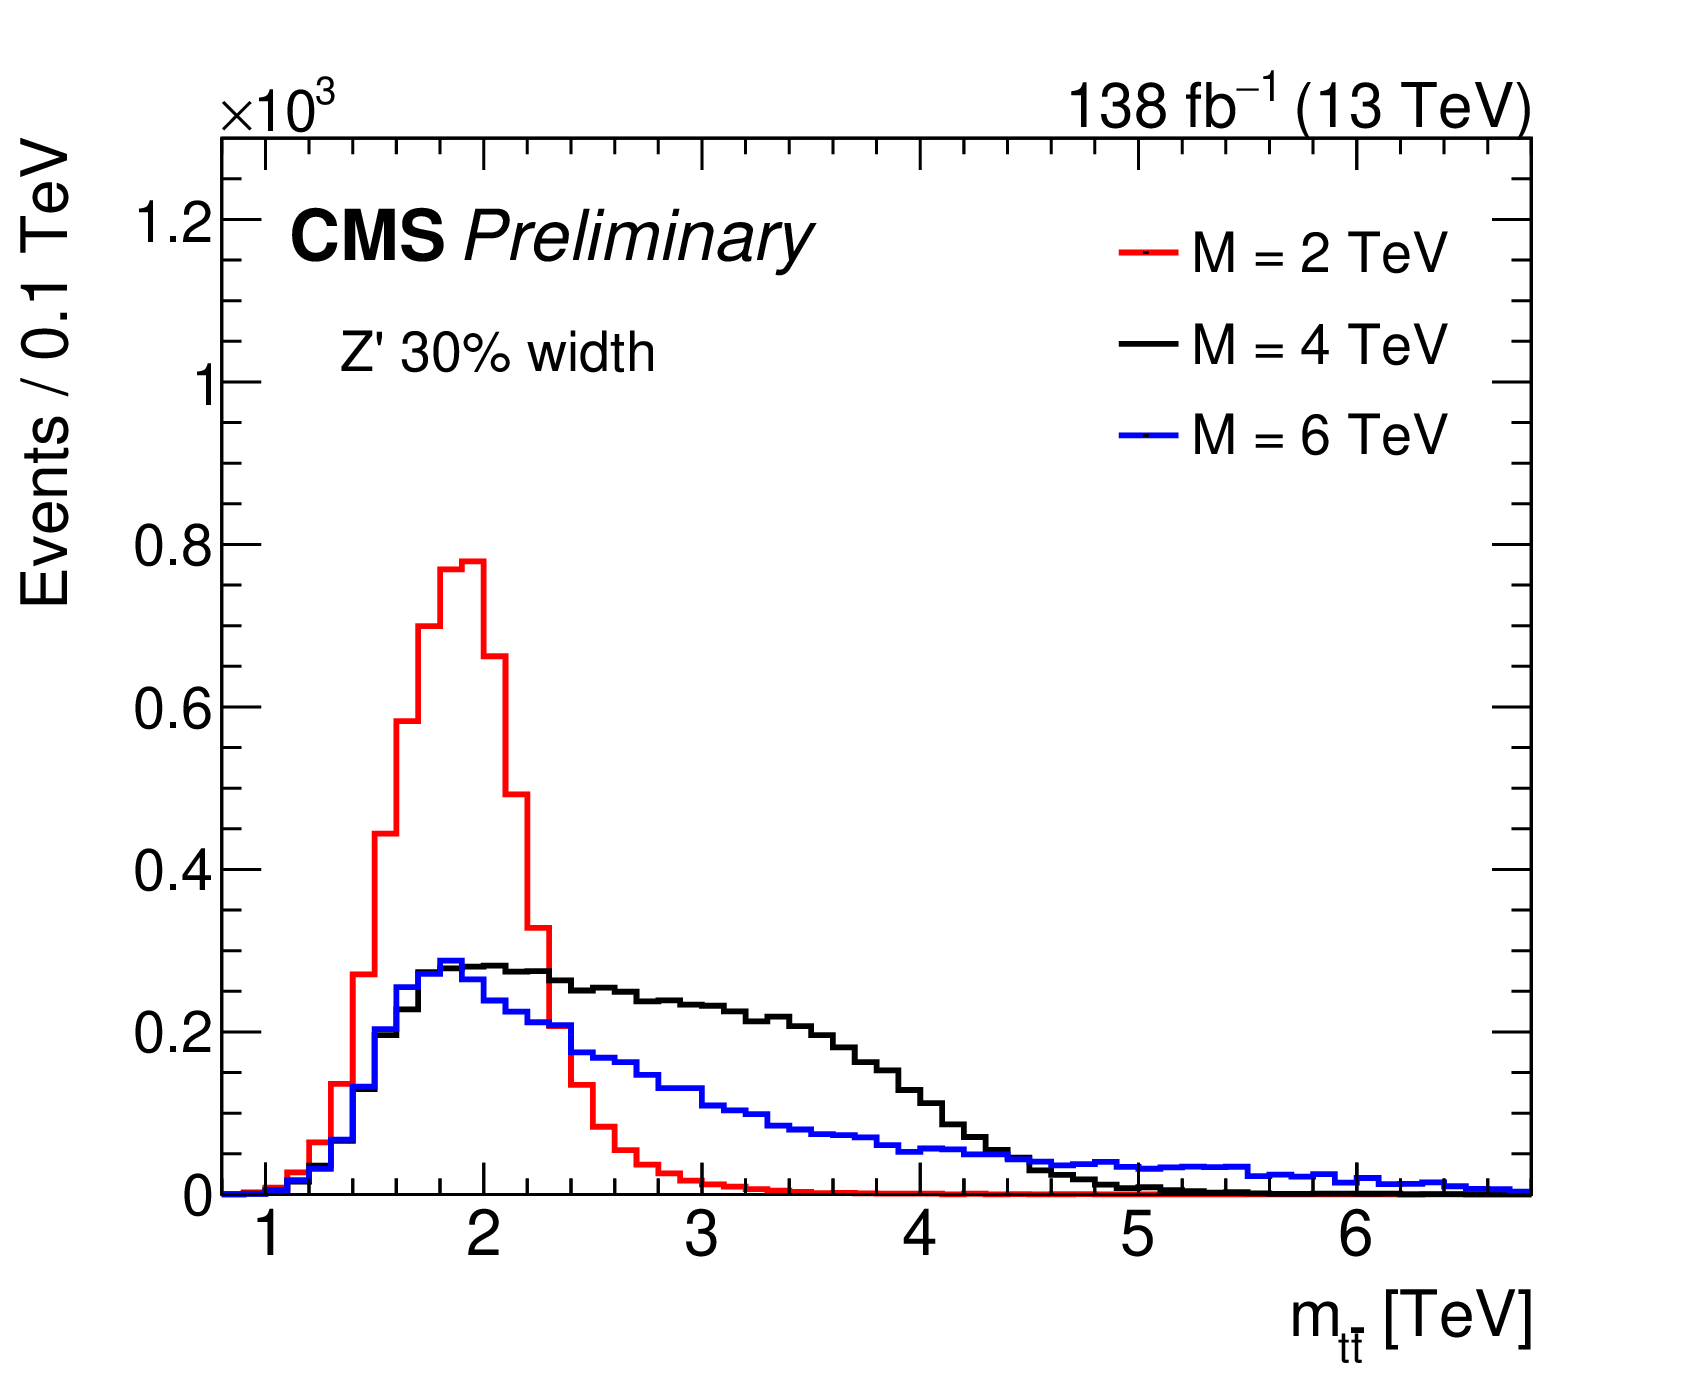
Figure 3-b:
Signal distributions for Z' with 1% and 30% widths shown in the left and right panels, respectively. Signal lines correspond to Z' masses of 2, 4, and 6 TeV where both jets pass the top-tagging SR requirement. Signal events are normalized to 1 pb. |
png pdf |
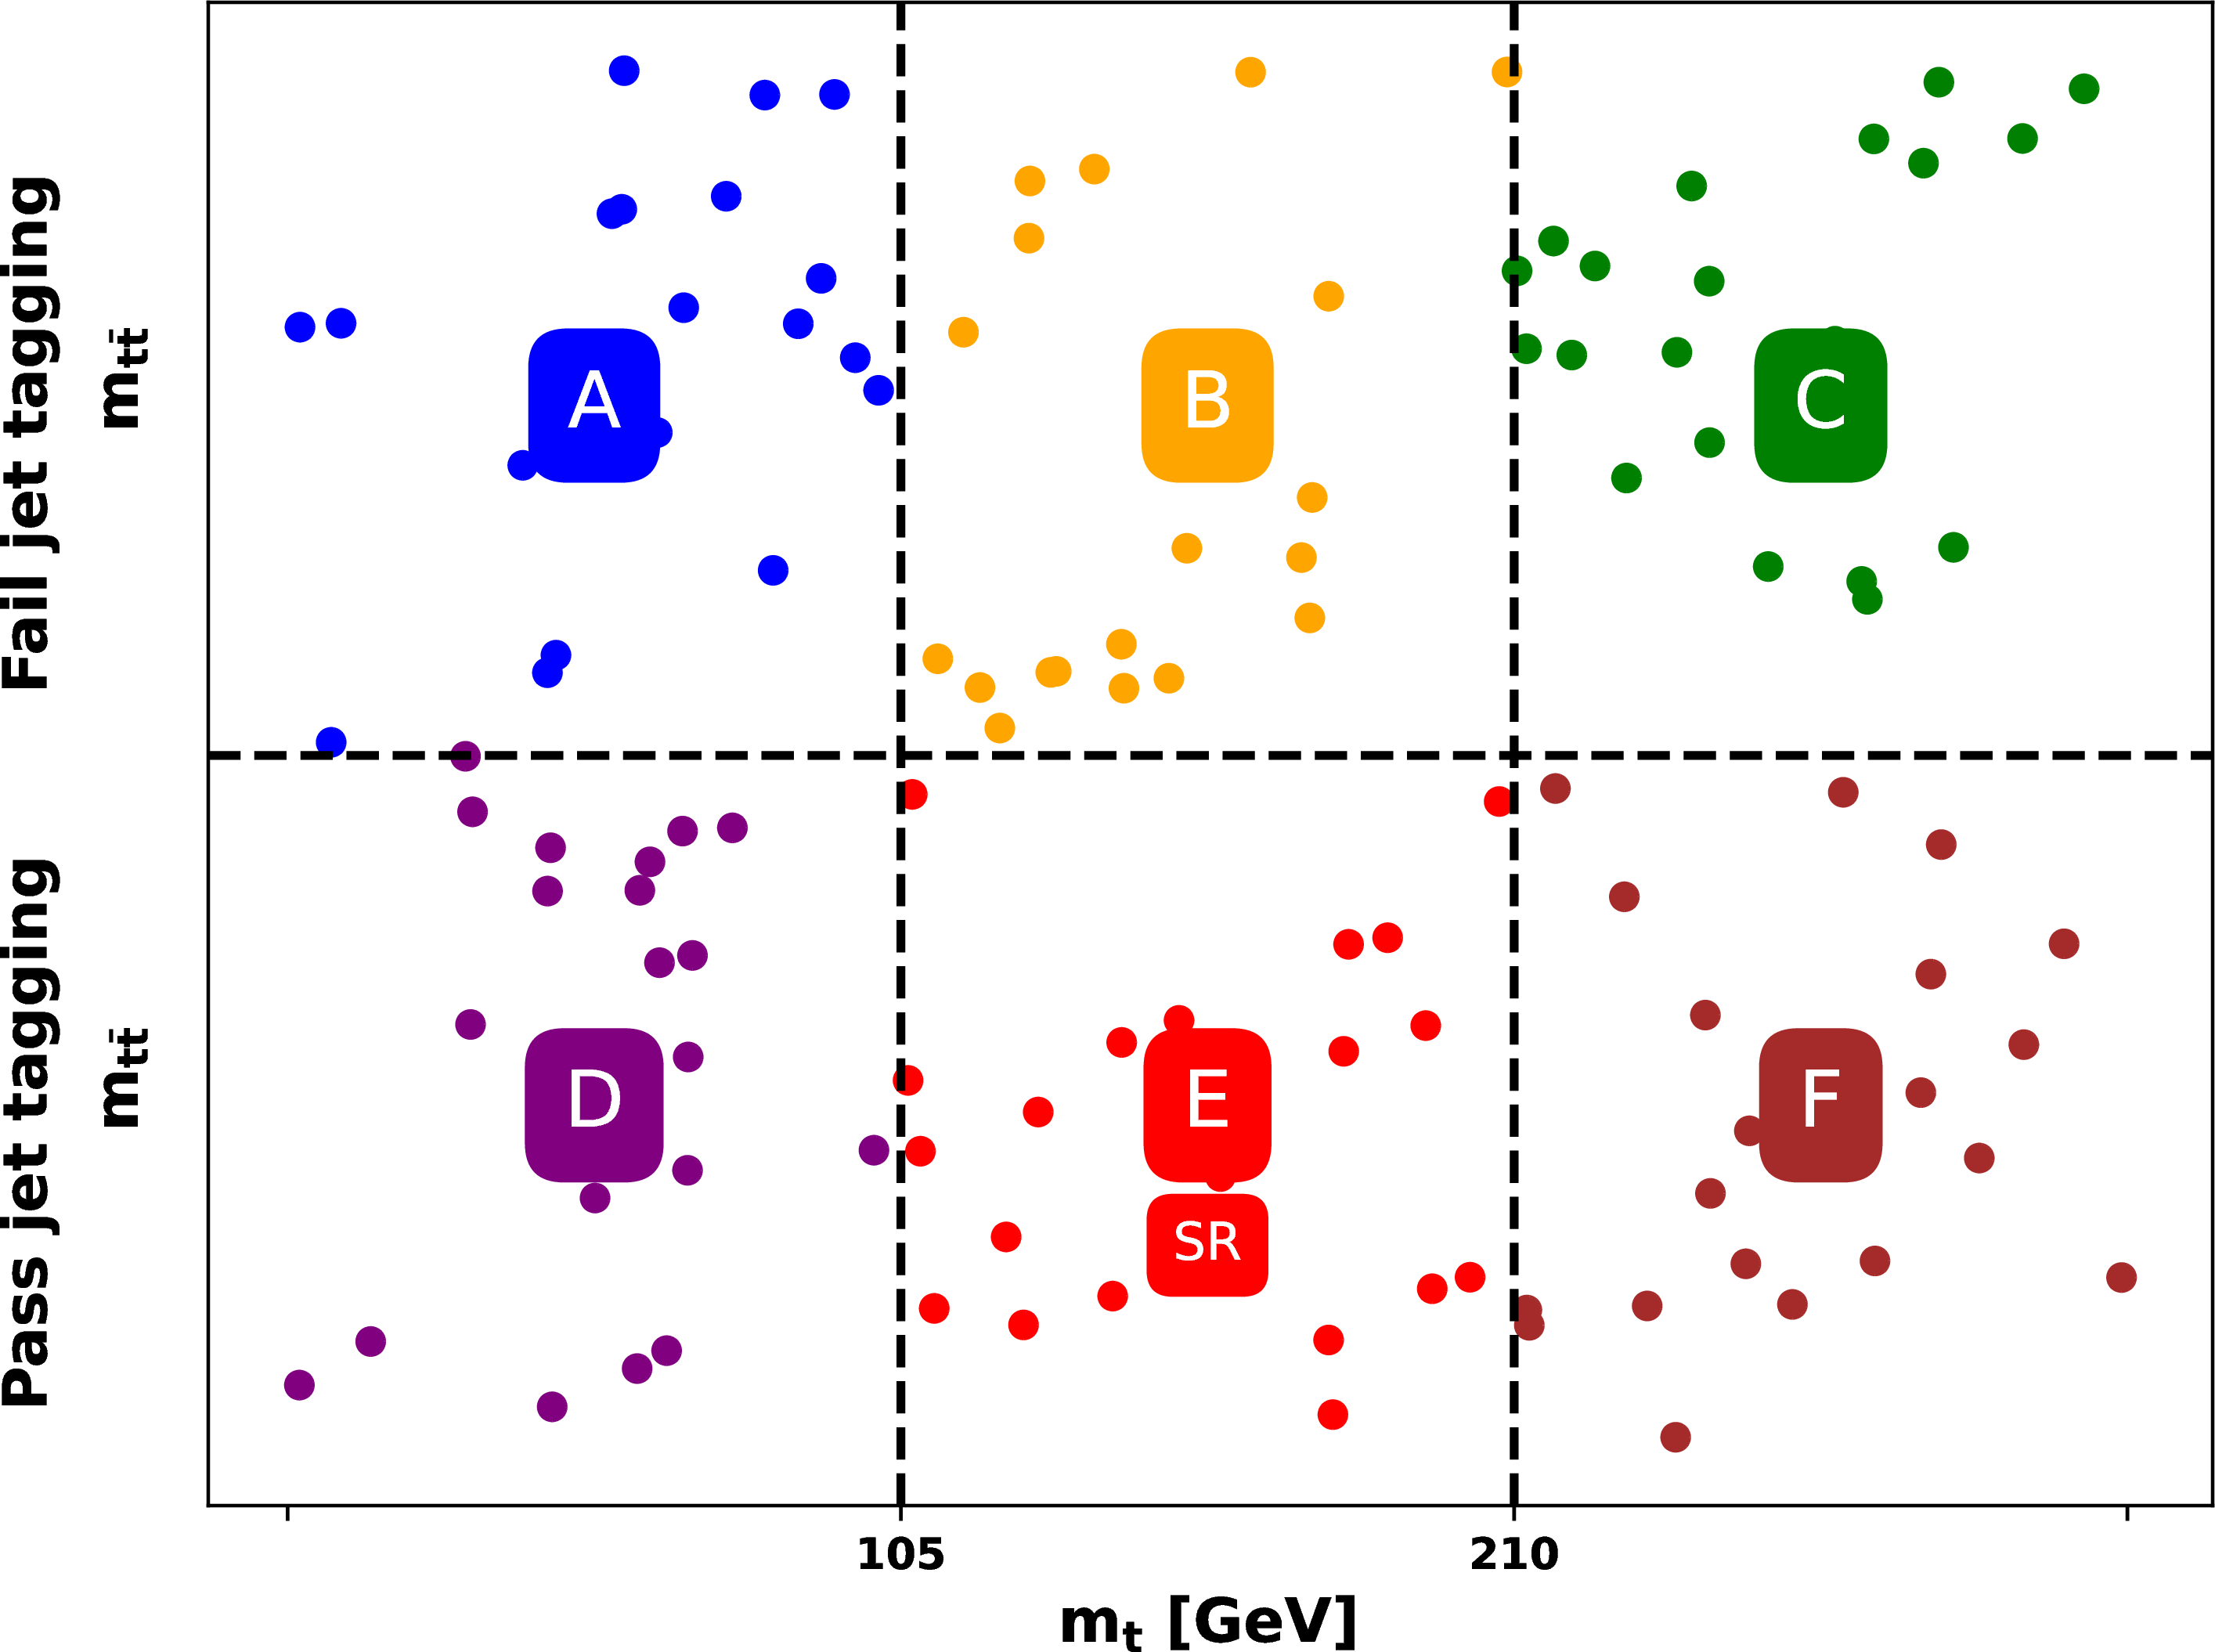
Figure 4:
Illustration of the background estimation method. The dataset is separated into regions that pass and fail the subleading jet t-tagging requirement, as well as regions in the leading jet mass $ m_\mathrm{t} $ above and below the top quark mass window. A two-dimensional polynomial fit is used to estimate the QCD background in Region E from Regions A, B, C, D, and F. |
png pdf |
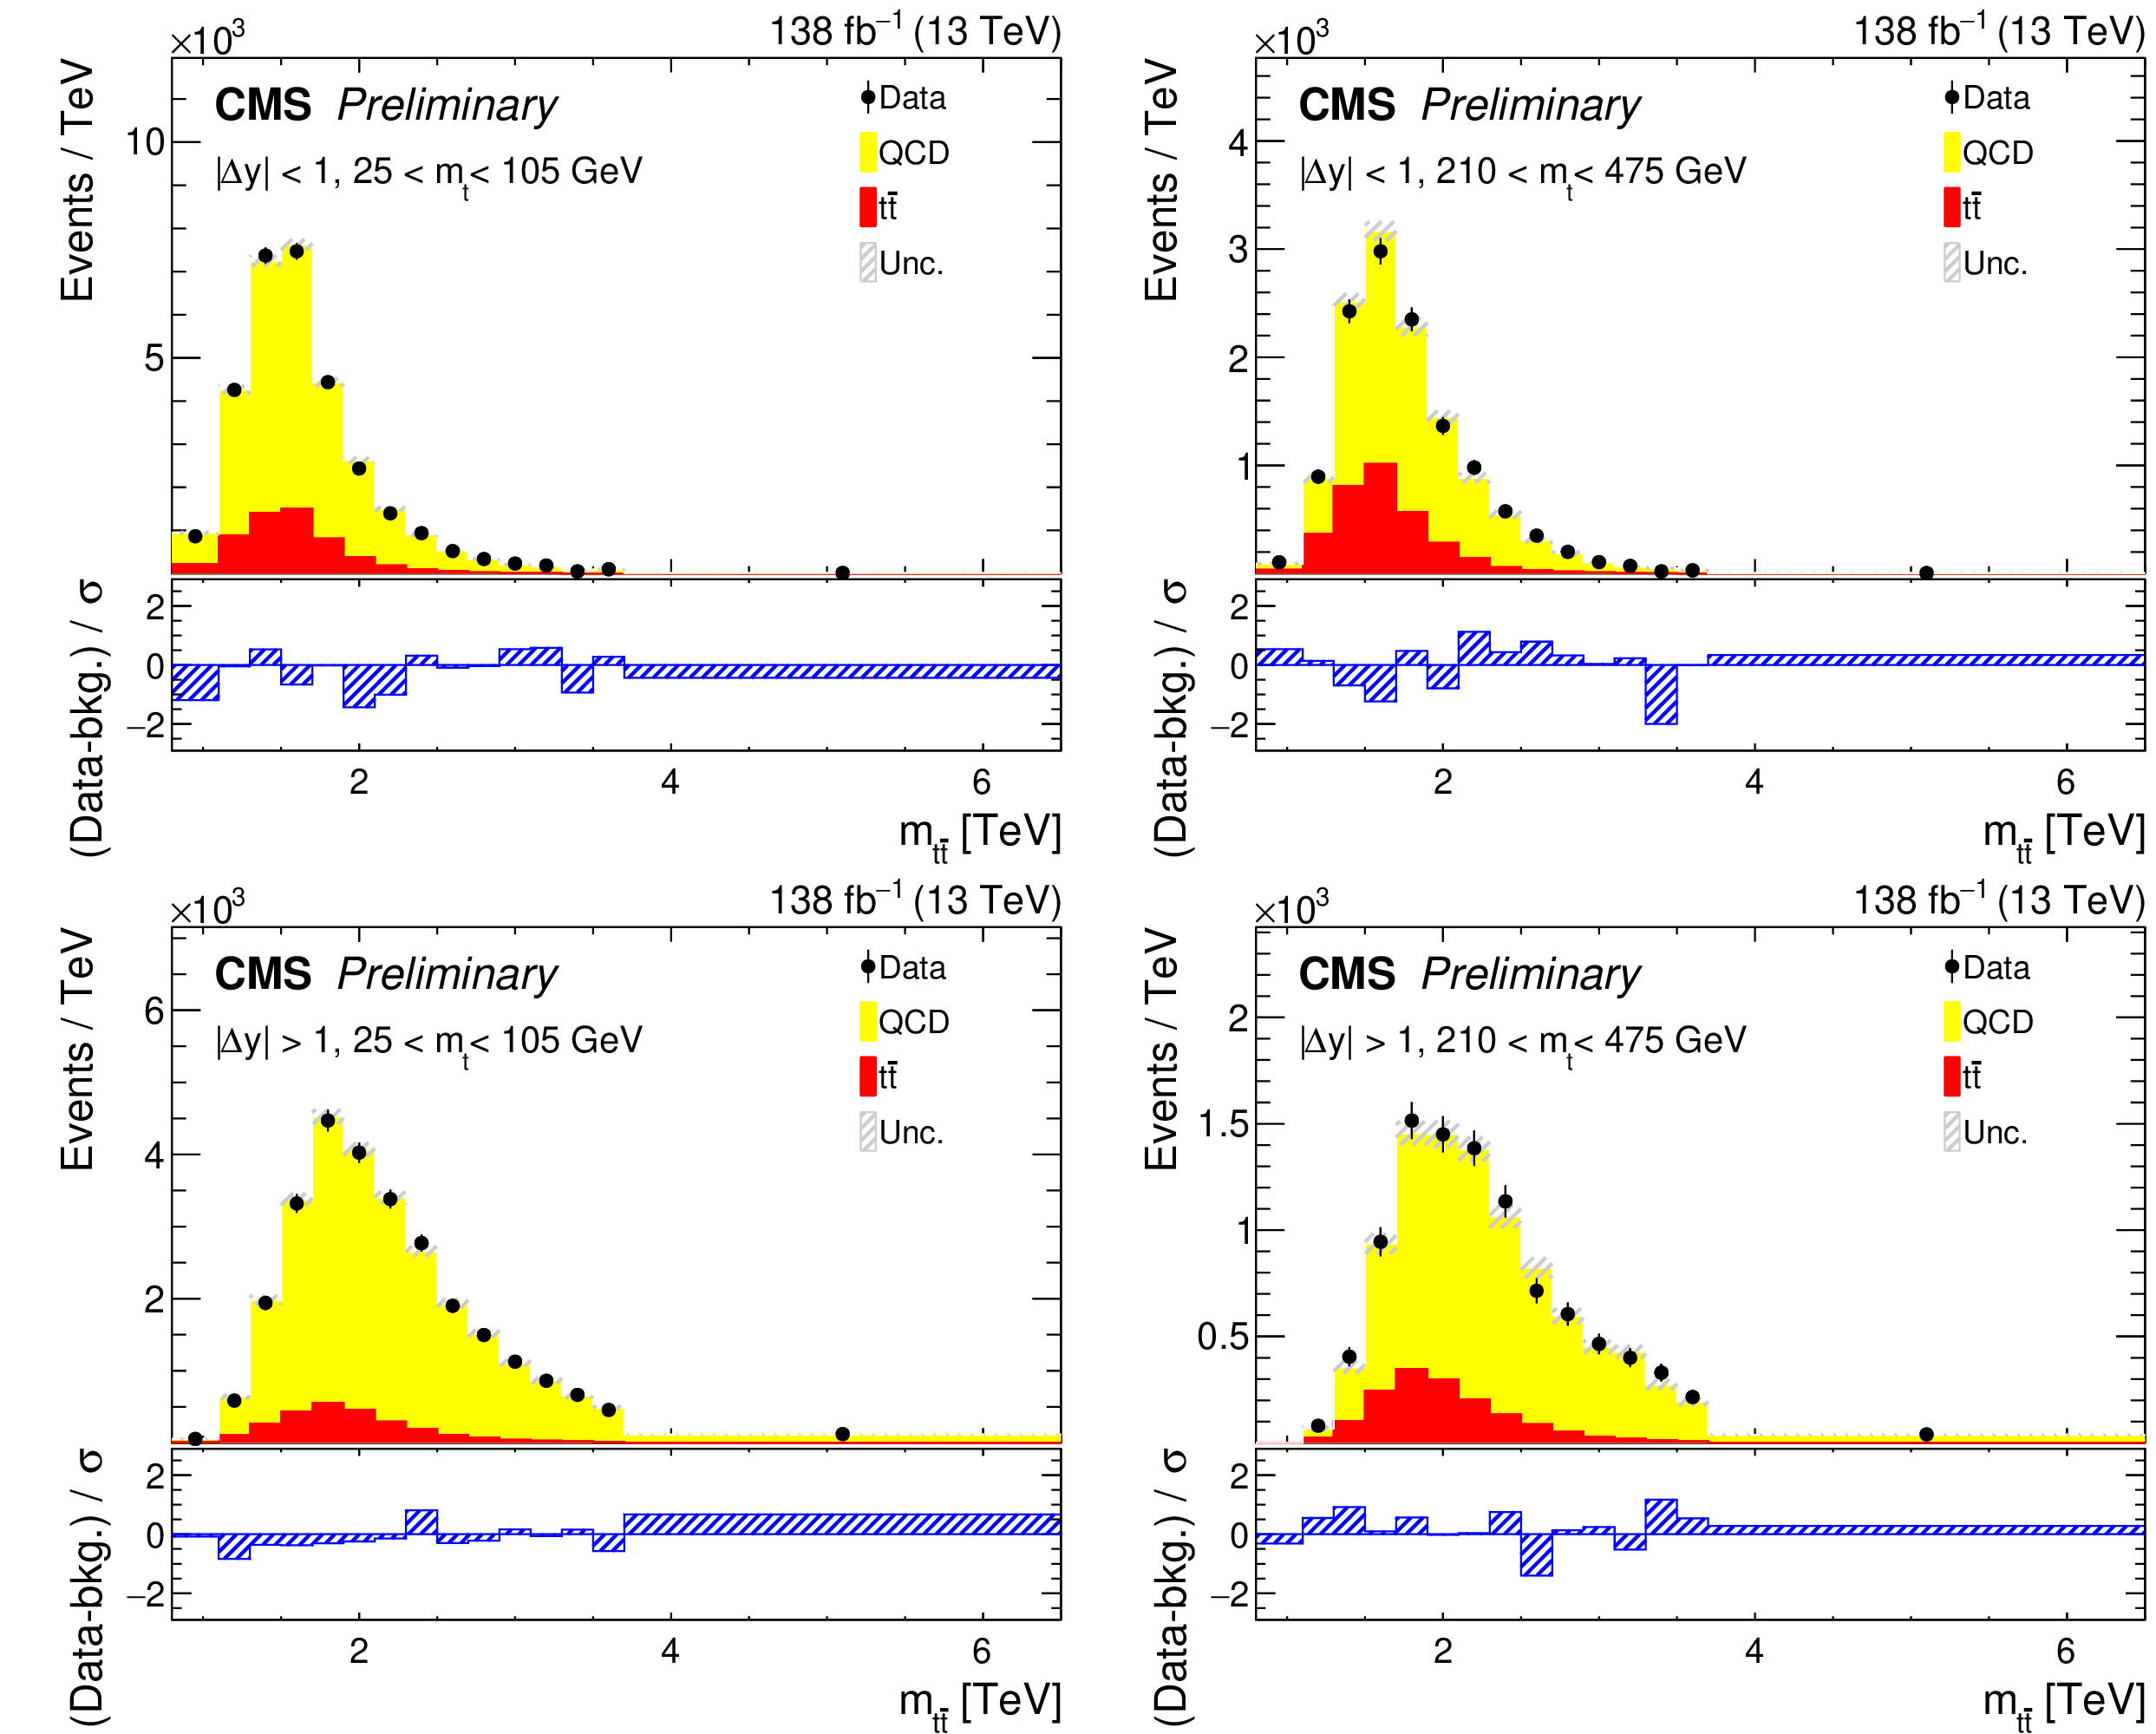
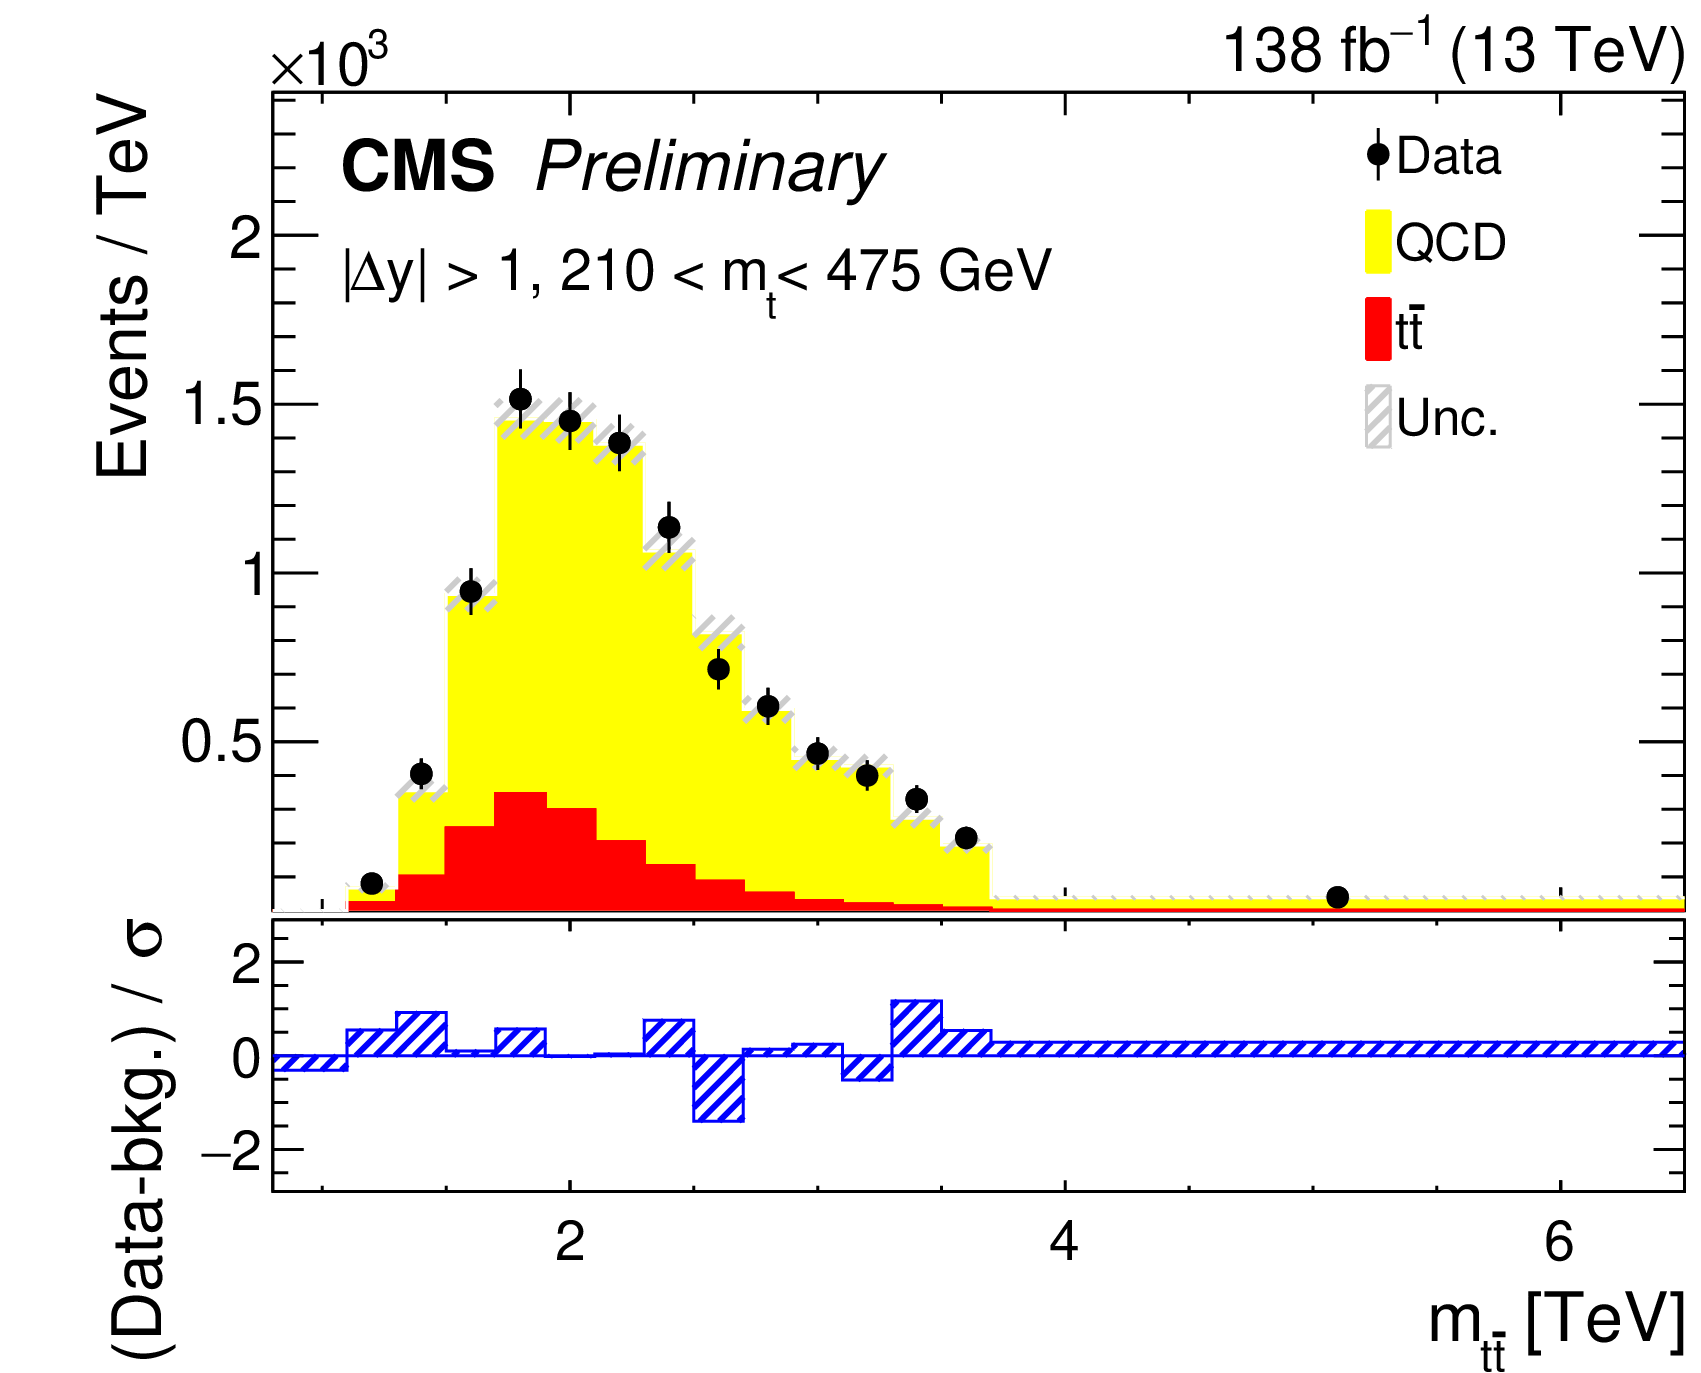
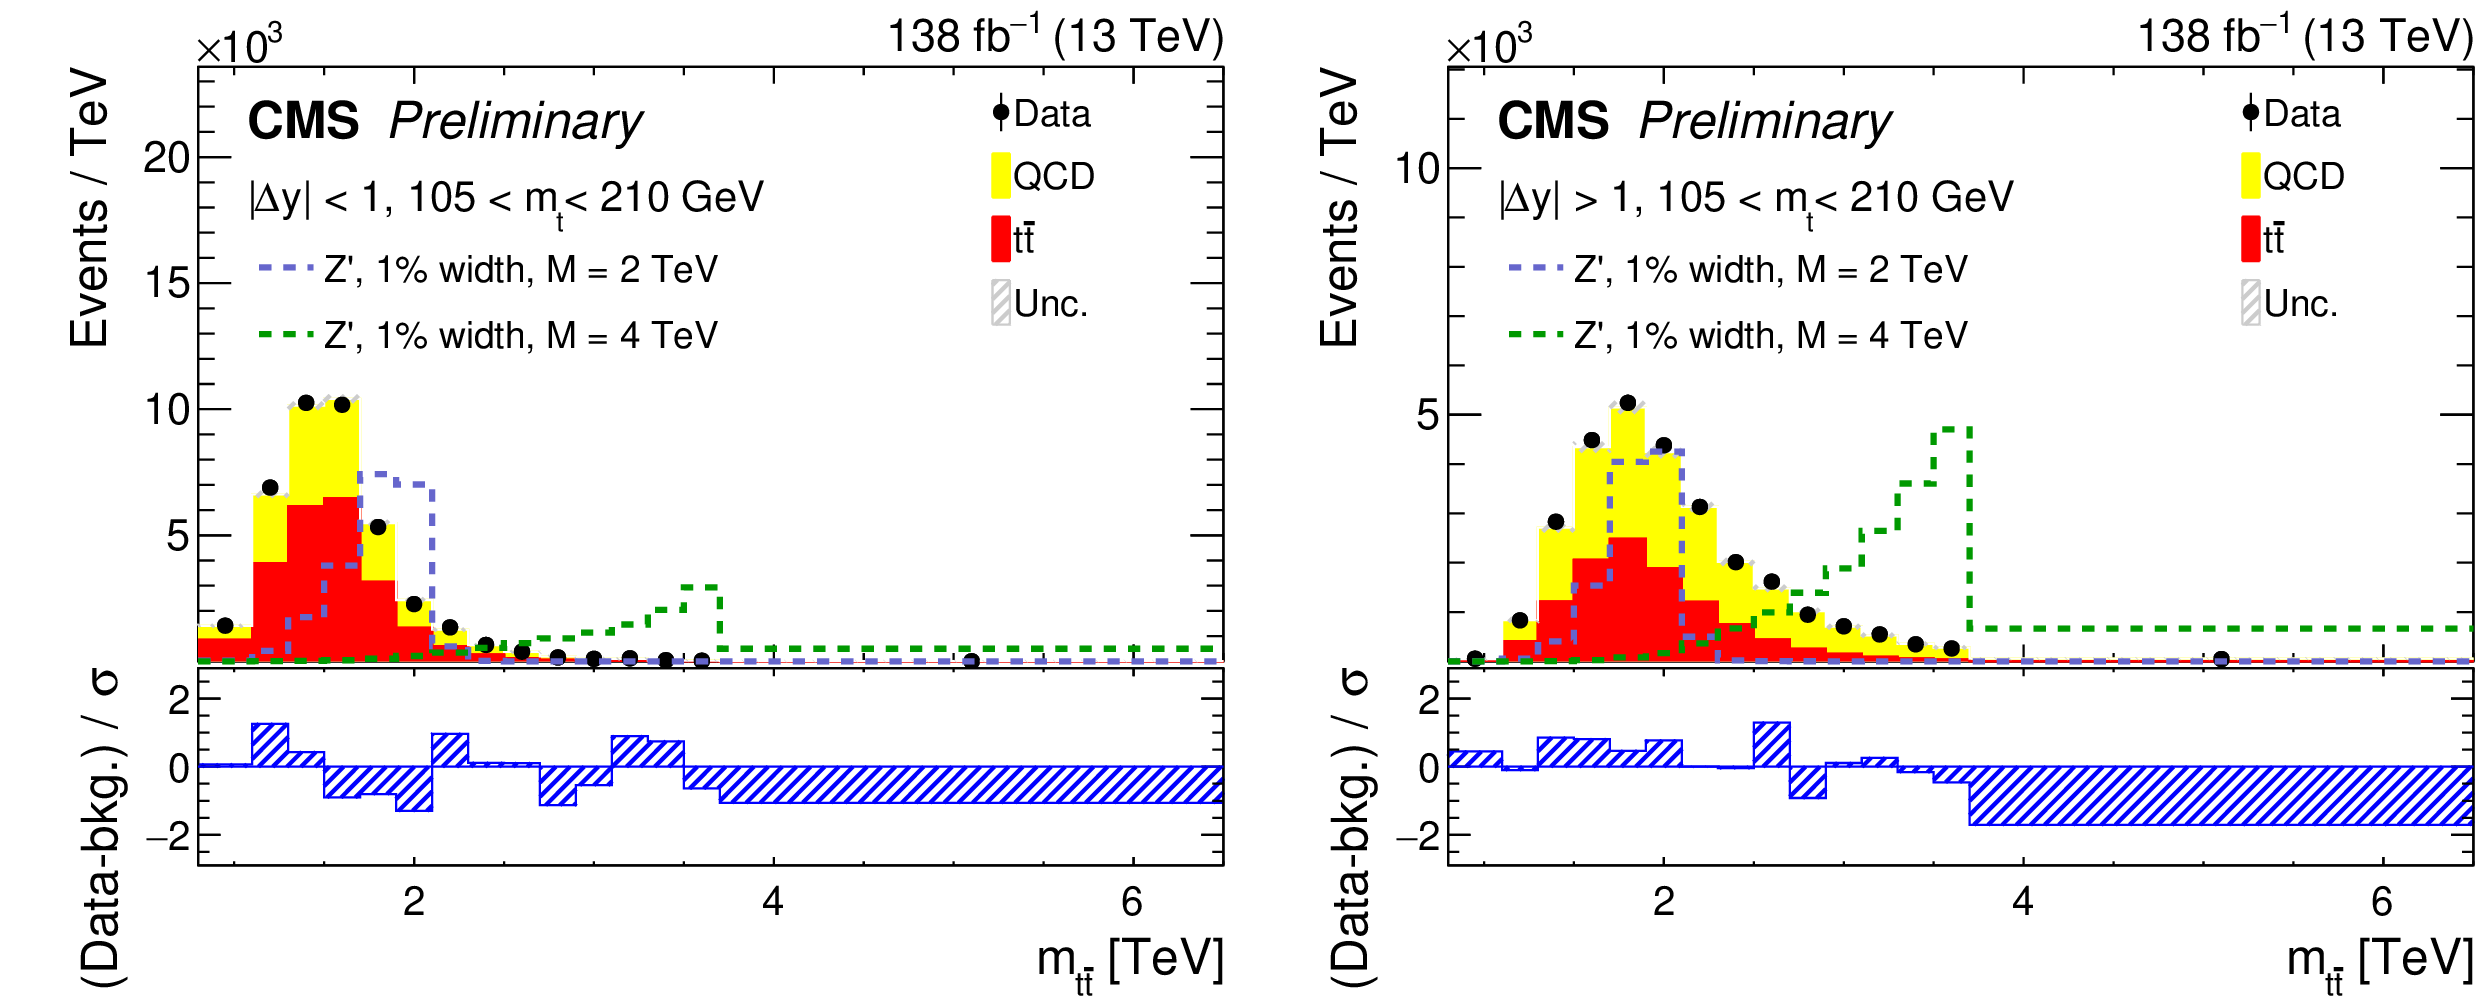
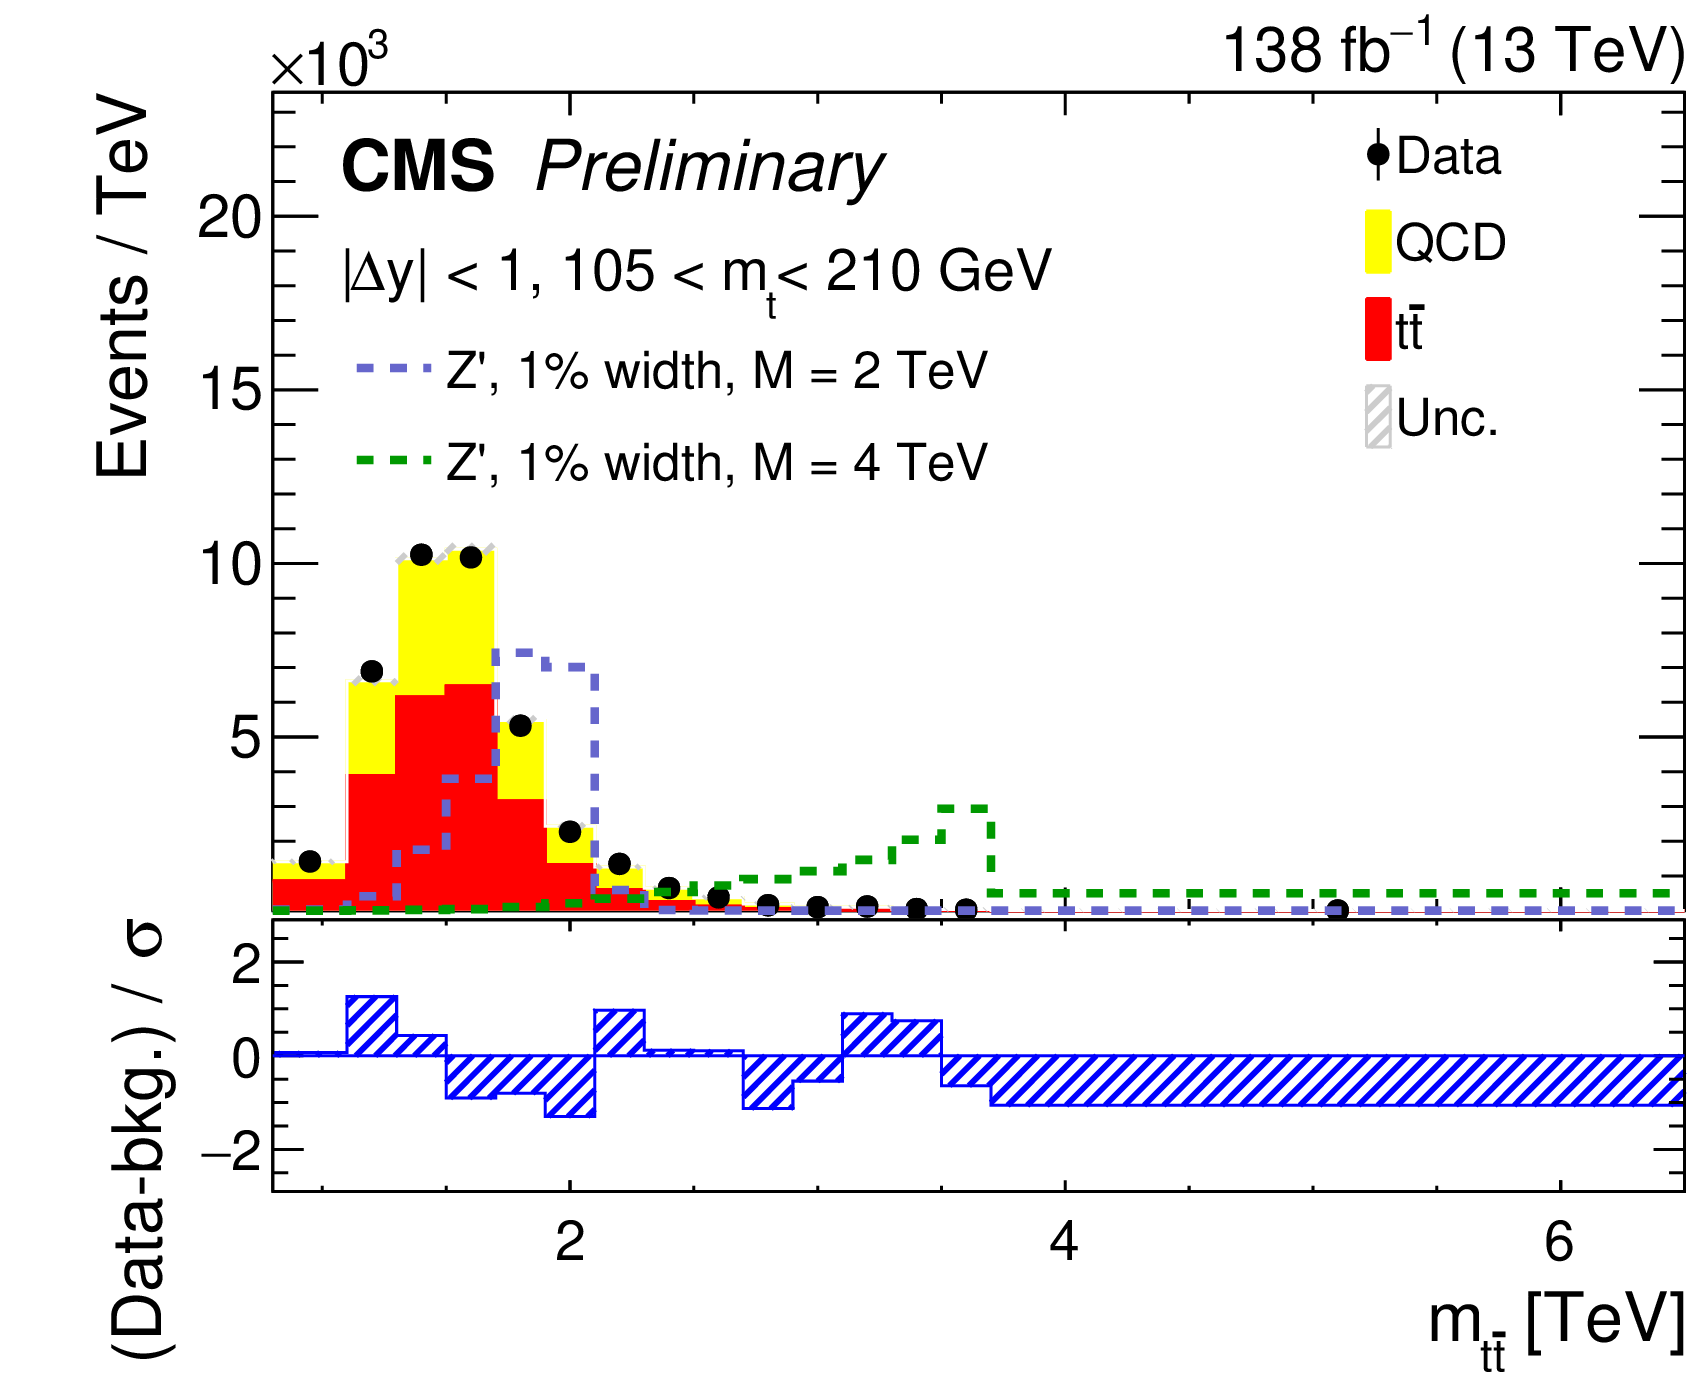
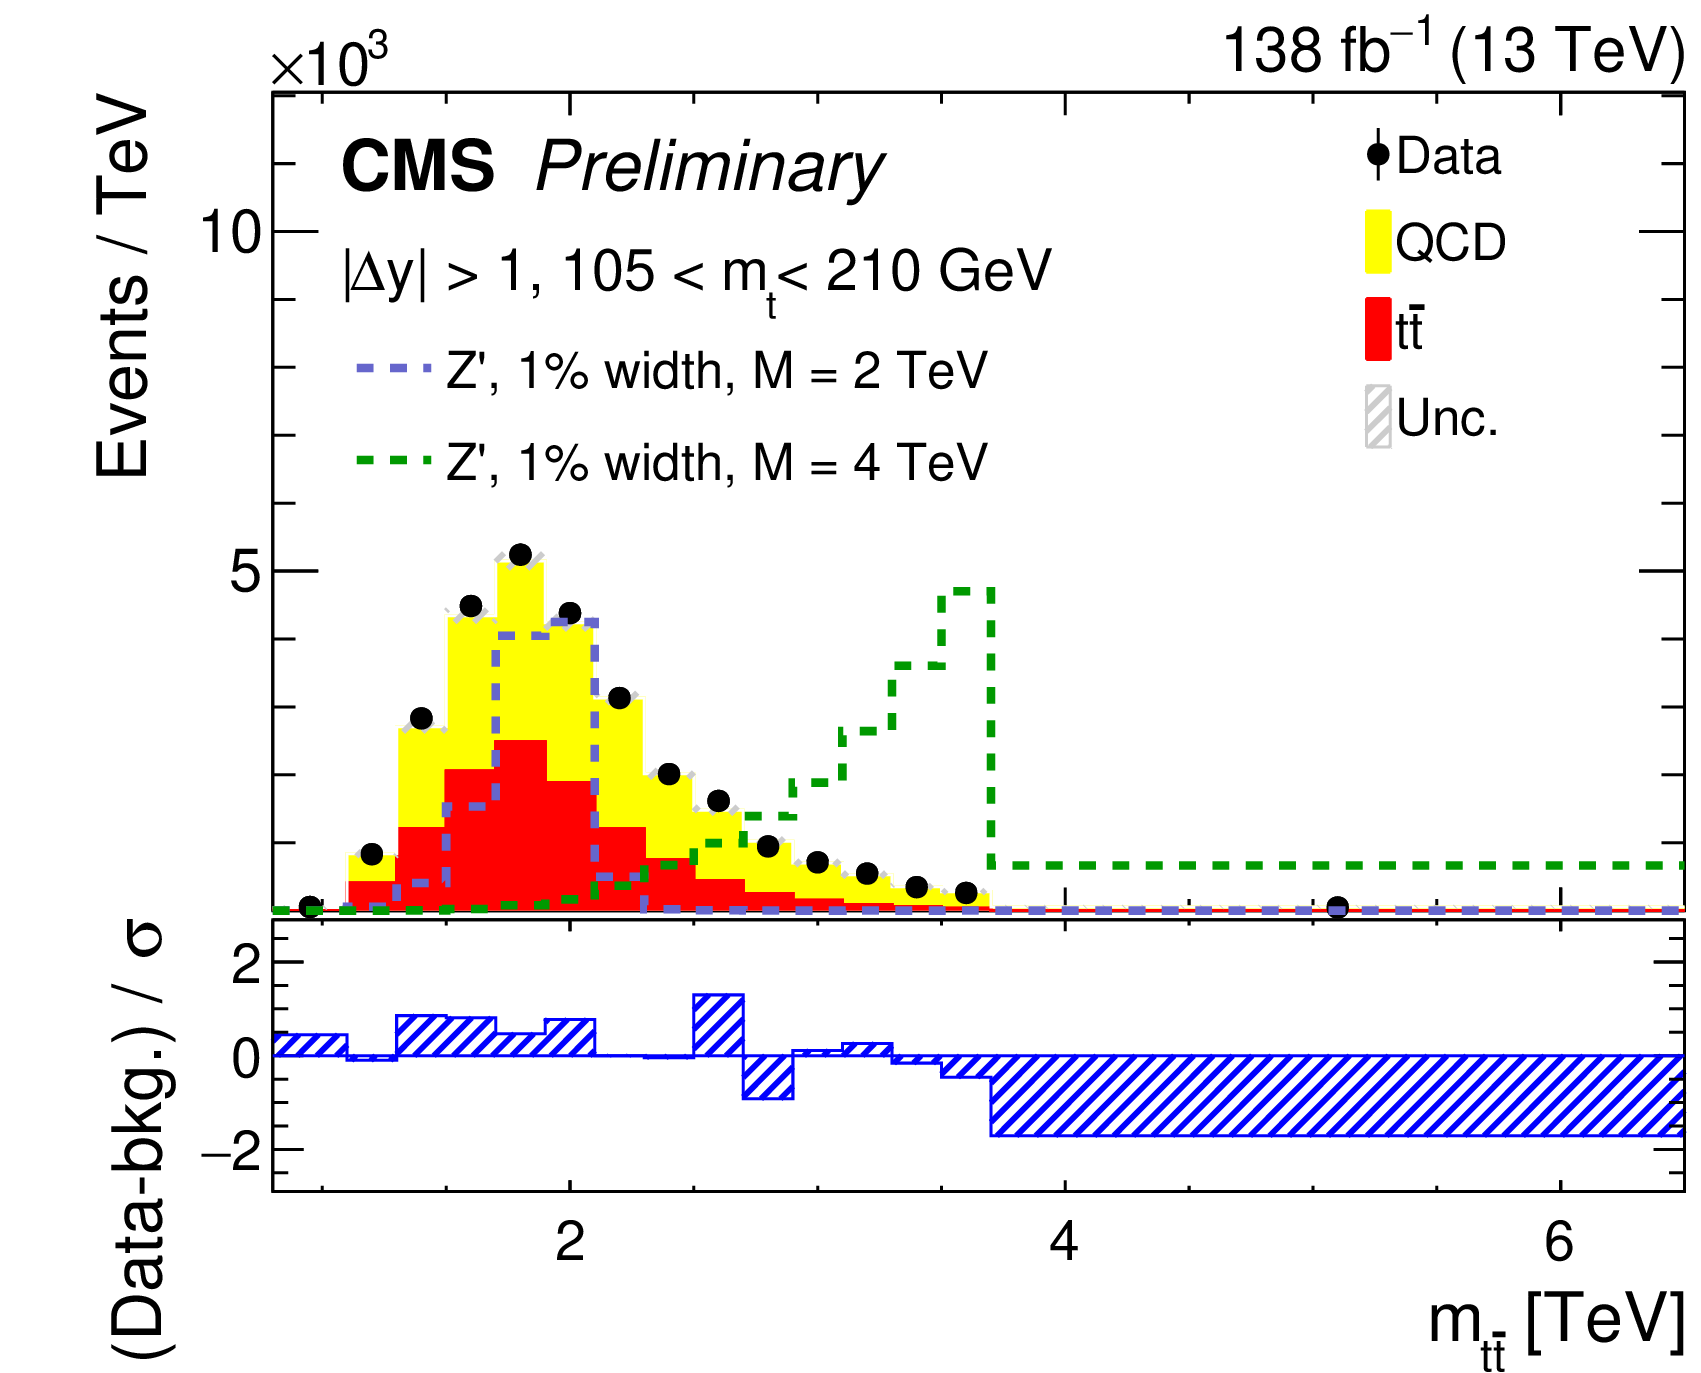
Figure 5:
Post-fit $ {\mathrm{t}\overline{\mathrm{t}}} $ mass distribution in the $ m_\mathrm{t} $ sidebands after QCD background estimation, using the combined Run 2 dataset. The top panel corresponds to the central category, while the bottom panel corresponds to the forward category. Distributions are shown for the low $ m_\mathrm{t} $ (left) and high $ m_\mathrm{t} $ (right) sidebands. The lower part of each distribution shows the pull, defined as (Data-Bkg)/$ \sigma $, where $ \sigma $ denotes the total uncertainty. |
png pdf |
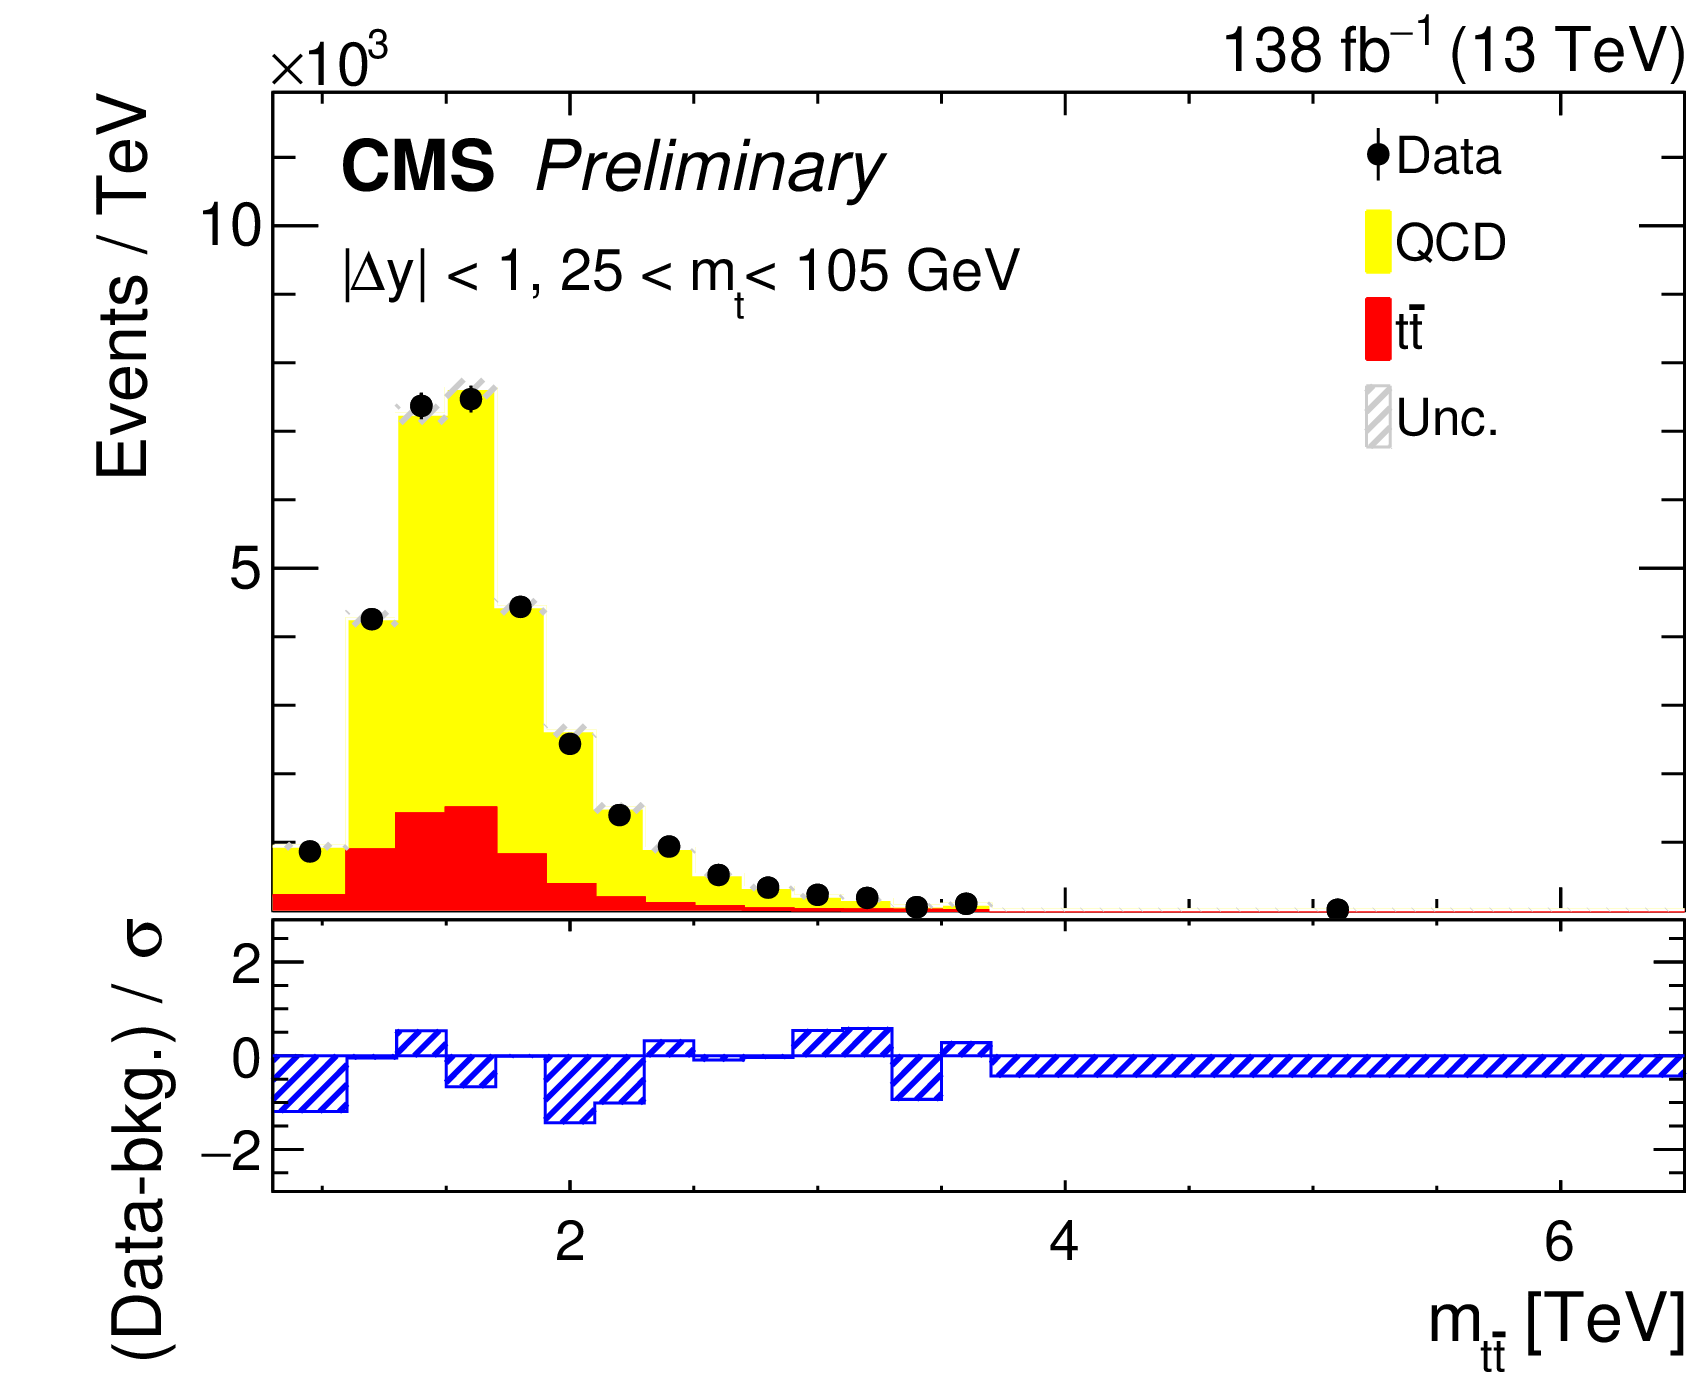
Figure 5-a:
Post-fit $ {\mathrm{t}\overline{\mathrm{t}}} $ mass distribution in the $ m_\mathrm{t} $ sidebands after QCD background estimation, using the combined Run 2 dataset. The top panel corresponds to the central category, while the bottom panel corresponds to the forward category. Distributions are shown for the low $ m_\mathrm{t} $ (left) and high $ m_\mathrm{t} $ (right) sidebands. The lower part of each distribution shows the pull, defined as (Data-Bkg)/$ \sigma $, where $ \sigma $ denotes the total uncertainty. |
png pdf |
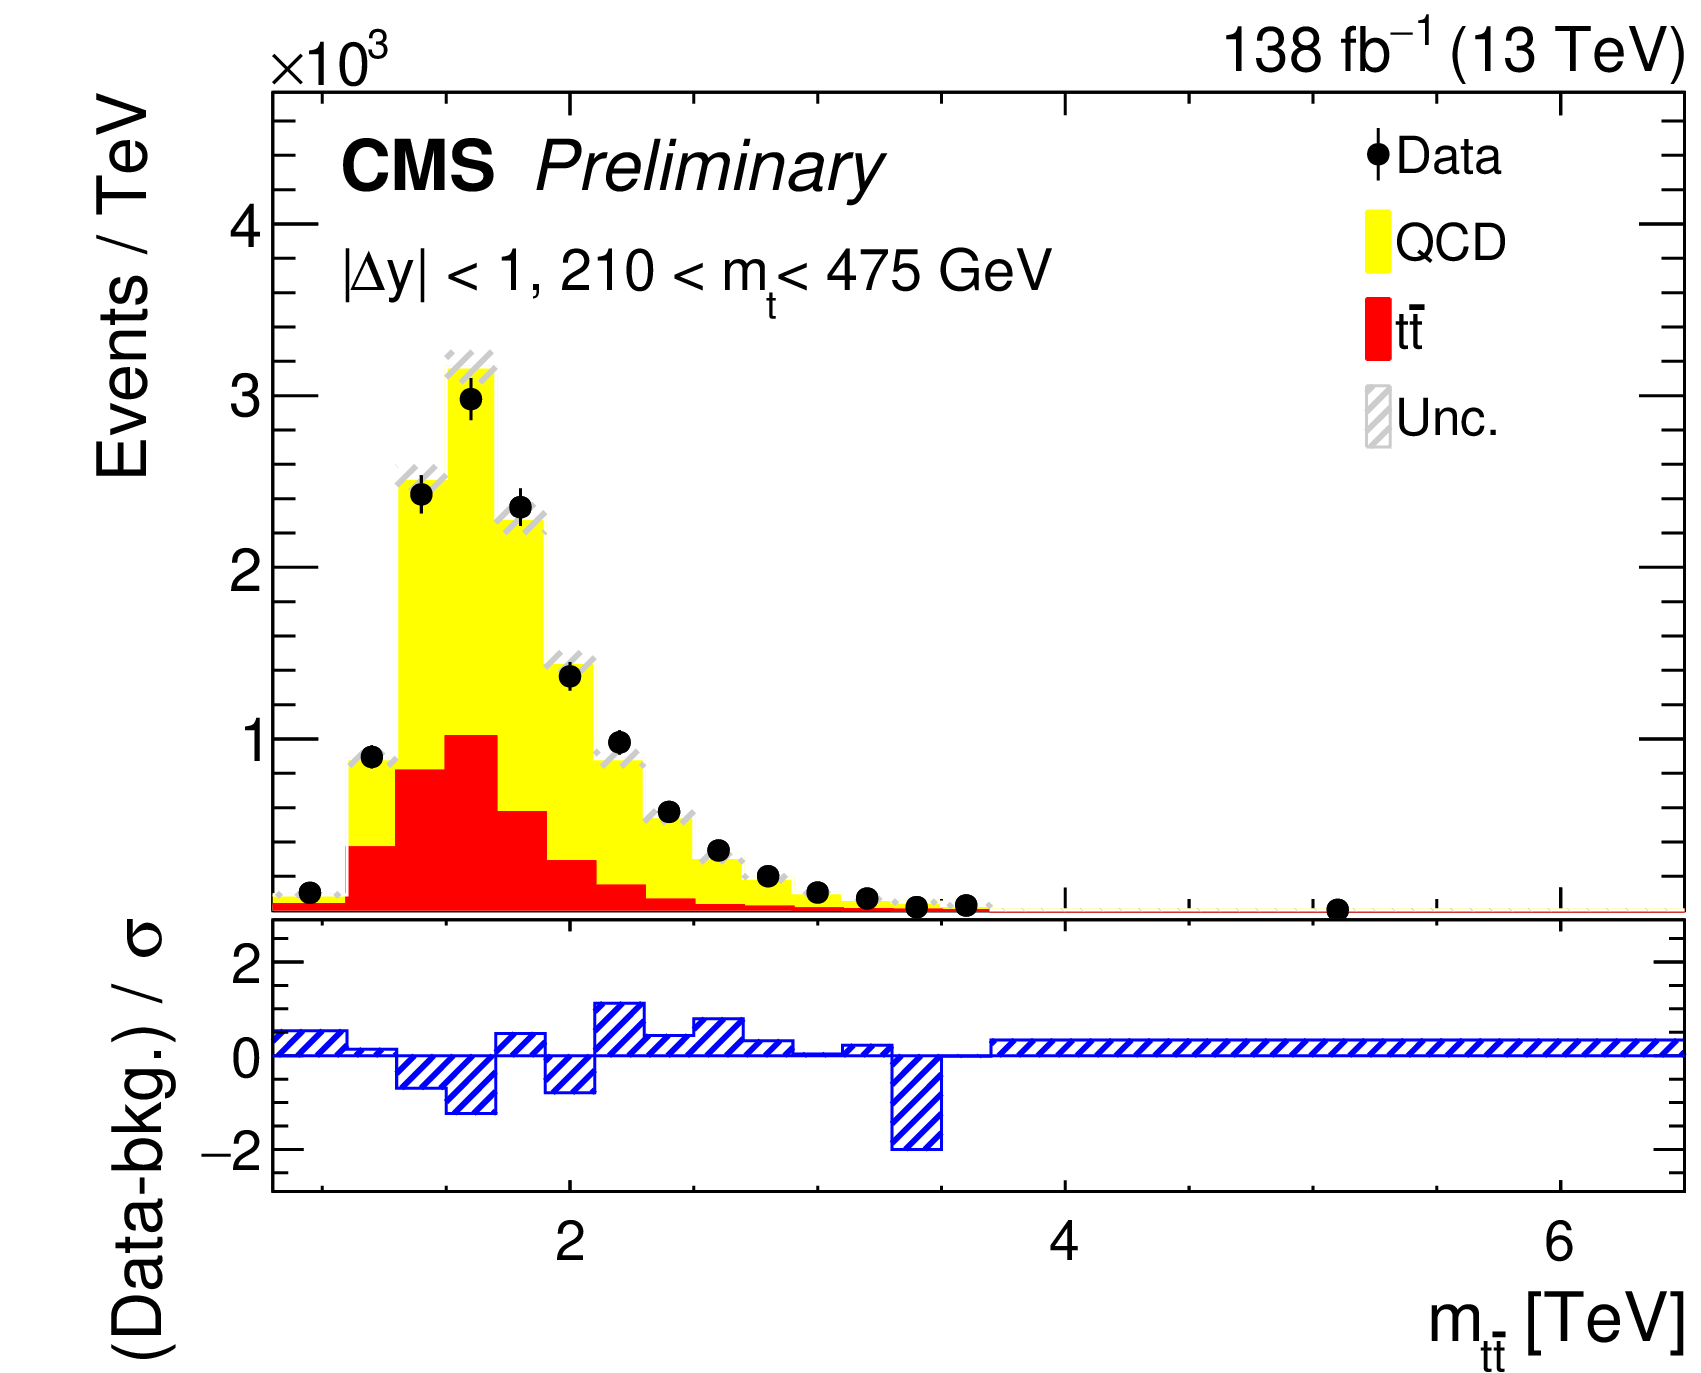
Figure 5-b:
Post-fit $ {\mathrm{t}\overline{\mathrm{t}}} $ mass distribution in the $ m_\mathrm{t} $ sidebands after QCD background estimation, using the combined Run 2 dataset. The top panel corresponds to the central category, while the bottom panel corresponds to the forward category. Distributions are shown for the low $ m_\mathrm{t} $ (left) and high $ m_\mathrm{t} $ (right) sidebands. The lower part of each distribution shows the pull, defined as (Data-Bkg)/$ \sigma $, where $ \sigma $ denotes the total uncertainty. |
png pdf |
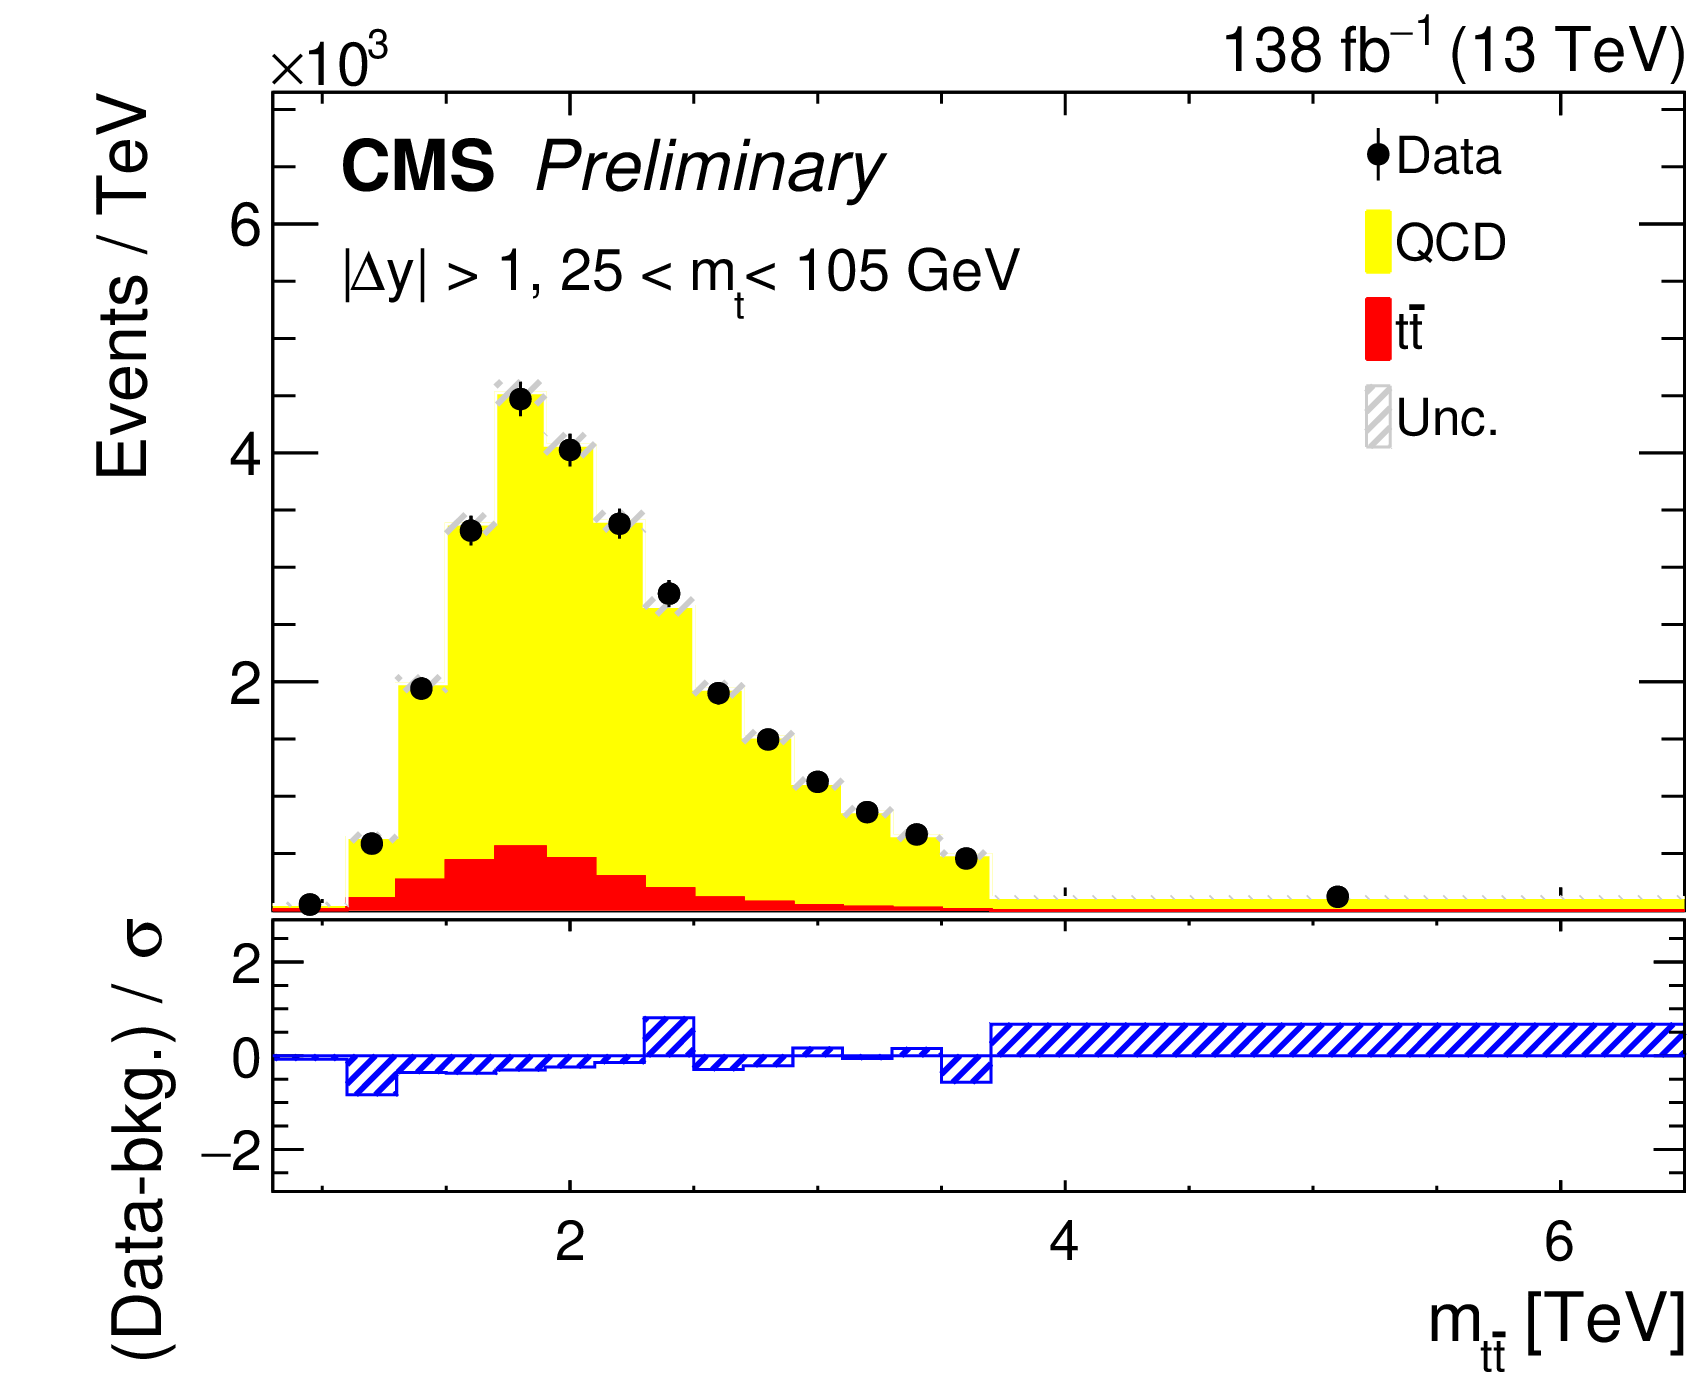
Figure 5-c:
Post-fit $ {\mathrm{t}\overline{\mathrm{t}}} $ mass distribution in the $ m_\mathrm{t} $ sidebands after QCD background estimation, using the combined Run 2 dataset. The top panel corresponds to the central category, while the bottom panel corresponds to the forward category. Distributions are shown for the low $ m_\mathrm{t} $ (left) and high $ m_\mathrm{t} $ (right) sidebands. The lower part of each distribution shows the pull, defined as (Data-Bkg)/$ \sigma $, where $ \sigma $ denotes the total uncertainty. |
png pdf |
Figure 5-d:
Post-fit $ {\mathrm{t}\overline{\mathrm{t}}} $ mass distribution in the $ m_\mathrm{t} $ sidebands after QCD background estimation, using the combined Run 2 dataset. The top panel corresponds to the central category, while the bottom panel corresponds to the forward category. Distributions are shown for the low $ m_\mathrm{t} $ (left) and high $ m_\mathrm{t} $ (right) sidebands. The lower part of each distribution shows the pull, defined as (Data-Bkg)/$ \sigma $, where $ \sigma $ denotes the total uncertainty. |
png pdf |
Figure 6:
Post-fit $ {\mathrm{t}\overline{\mathrm{t}}} $ mass distribution in the signal region after QCD background estimation, using the combined Run 2 dataset. The left panel corresponds to the central category, while the right panel corresponds to the forward category. The lower part of each distribution shows the pull, defined as (Data-Bkg)/$ \sigma $, where $ \sigma $ denotes the total uncertainty. Signal distributions are scaled to 0.5 pb for visualization purposes. |
png pdf |
Figure 6-a:
Post-fit $ {\mathrm{t}\overline{\mathrm{t}}} $ mass distribution in the signal region after QCD background estimation, using the combined Run 2 dataset. The left panel corresponds to the central category, while the right panel corresponds to the forward category. The lower part of each distribution shows the pull, defined as (Data-Bkg)/$ \sigma $, where $ \sigma $ denotes the total uncertainty. Signal distributions are scaled to 0.5 pb for visualization purposes. |
png pdf |
Figure 6-b:
Post-fit $ {\mathrm{t}\overline{\mathrm{t}}} $ mass distribution in the signal region after QCD background estimation, using the combined Run 2 dataset. The left panel corresponds to the central category, while the right panel corresponds to the forward category. The lower part of each distribution shows the pull, defined as (Data-Bkg)/$ \sigma $, where $ \sigma $ denotes the total uncertainty. Signal distributions are scaled to 0.5 pb for visualization purposes. |
png pdf |
Figure 7:
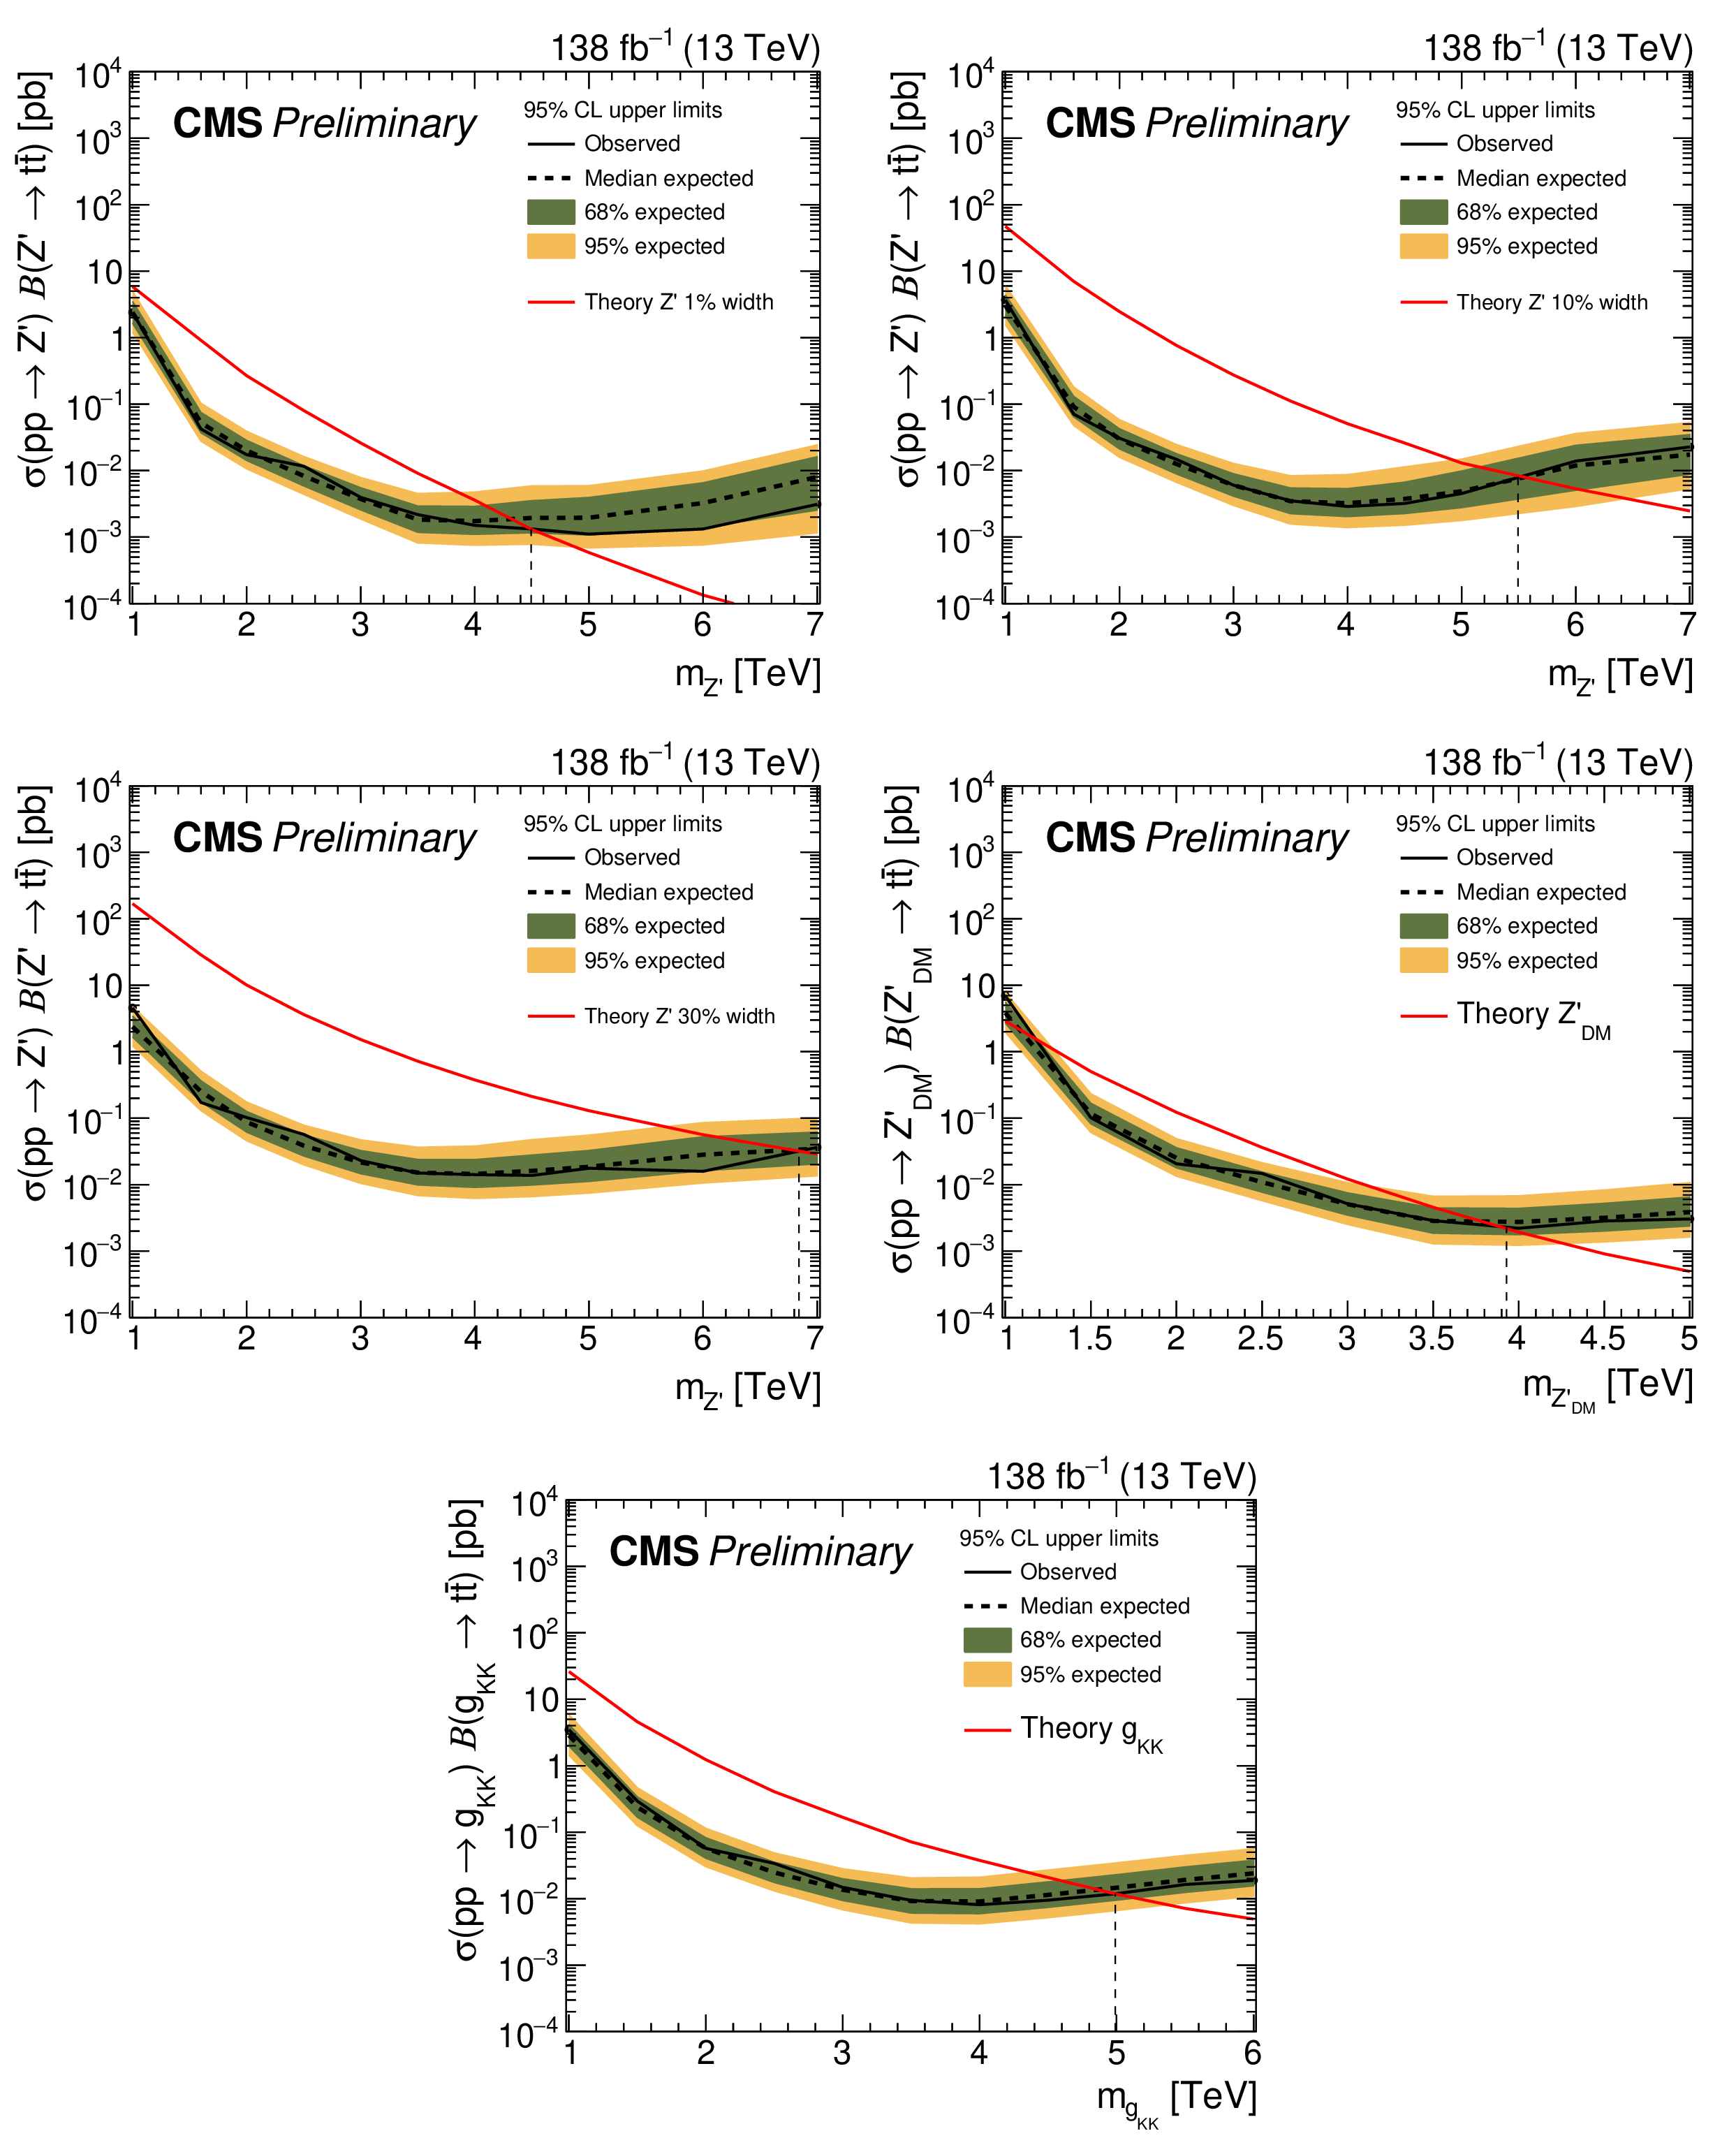
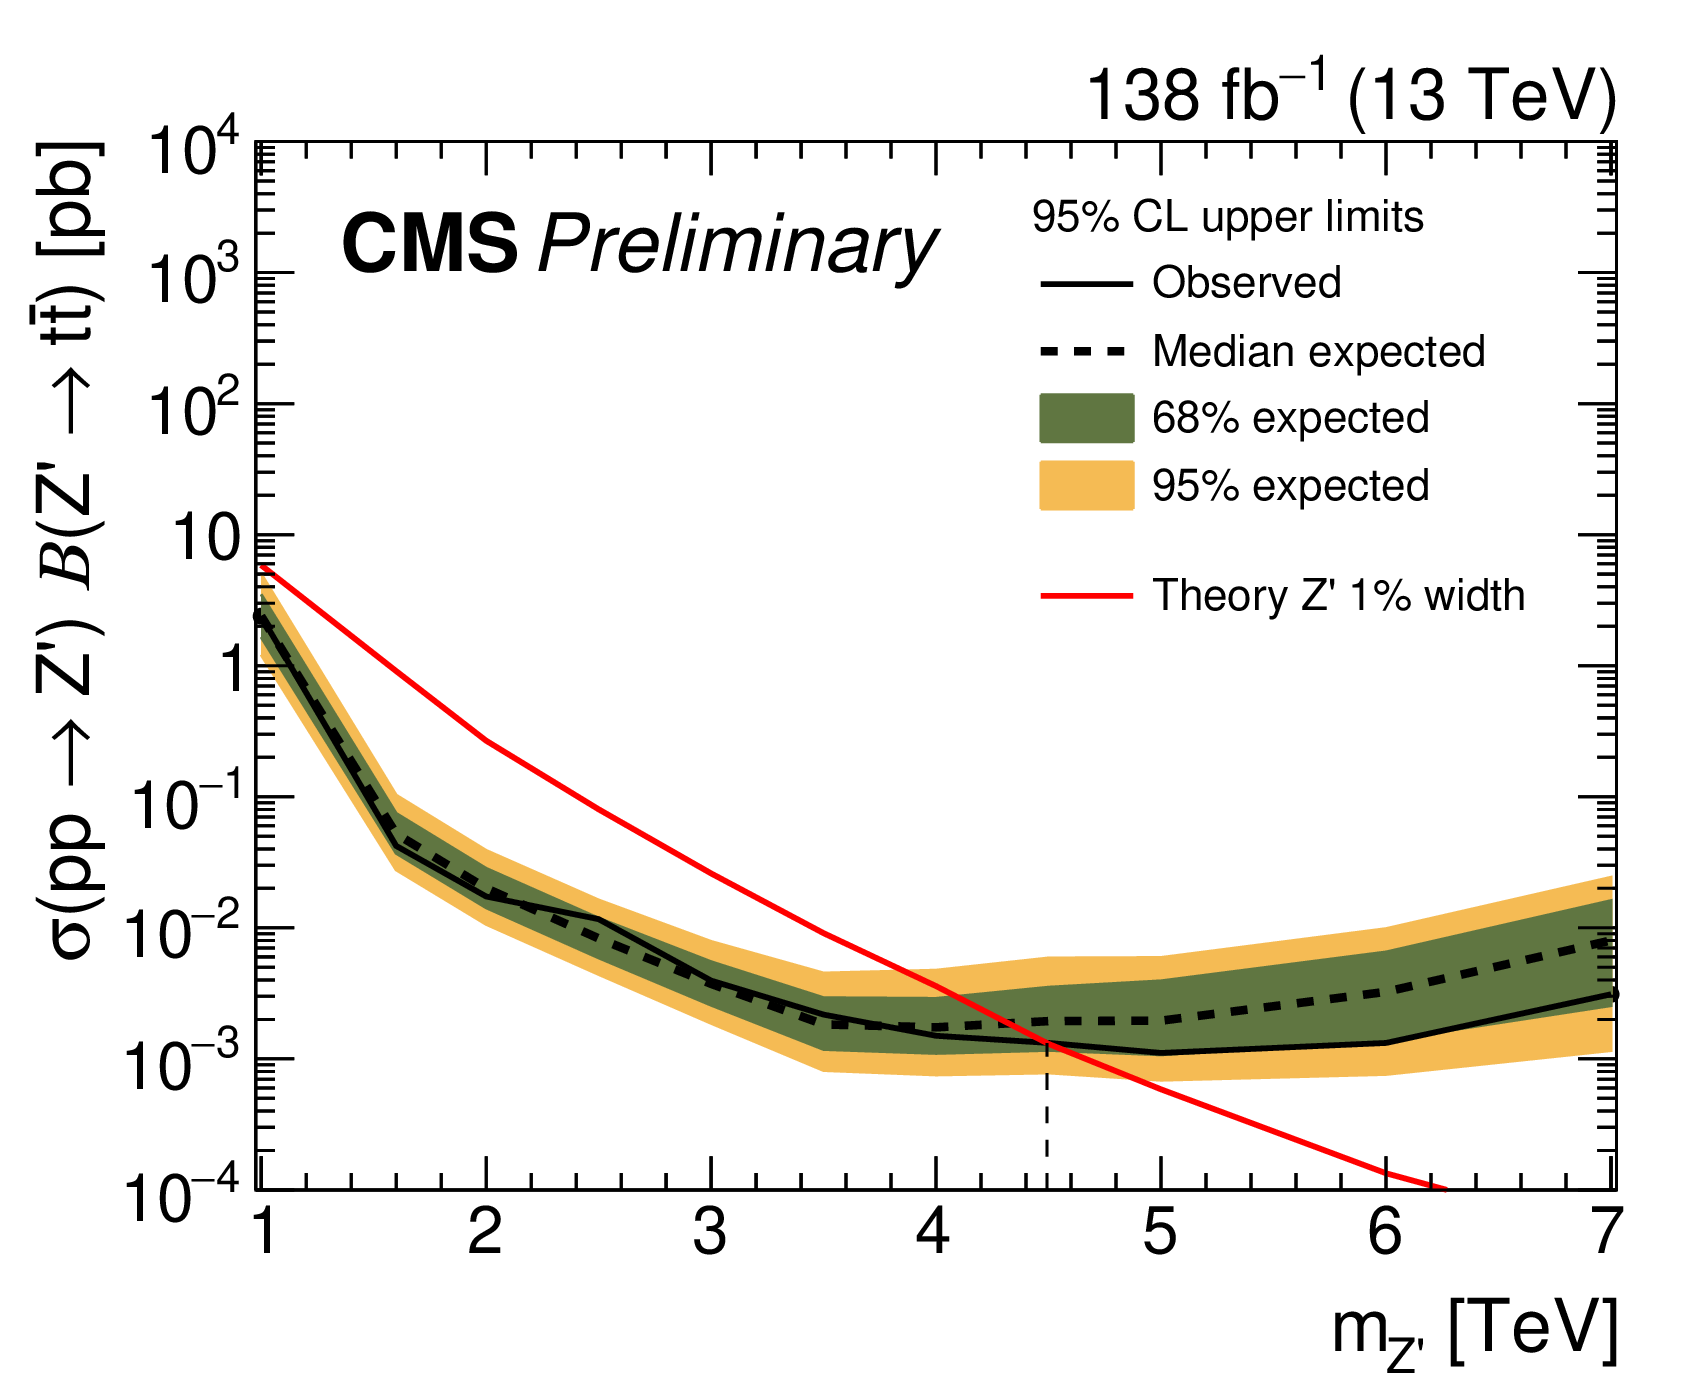
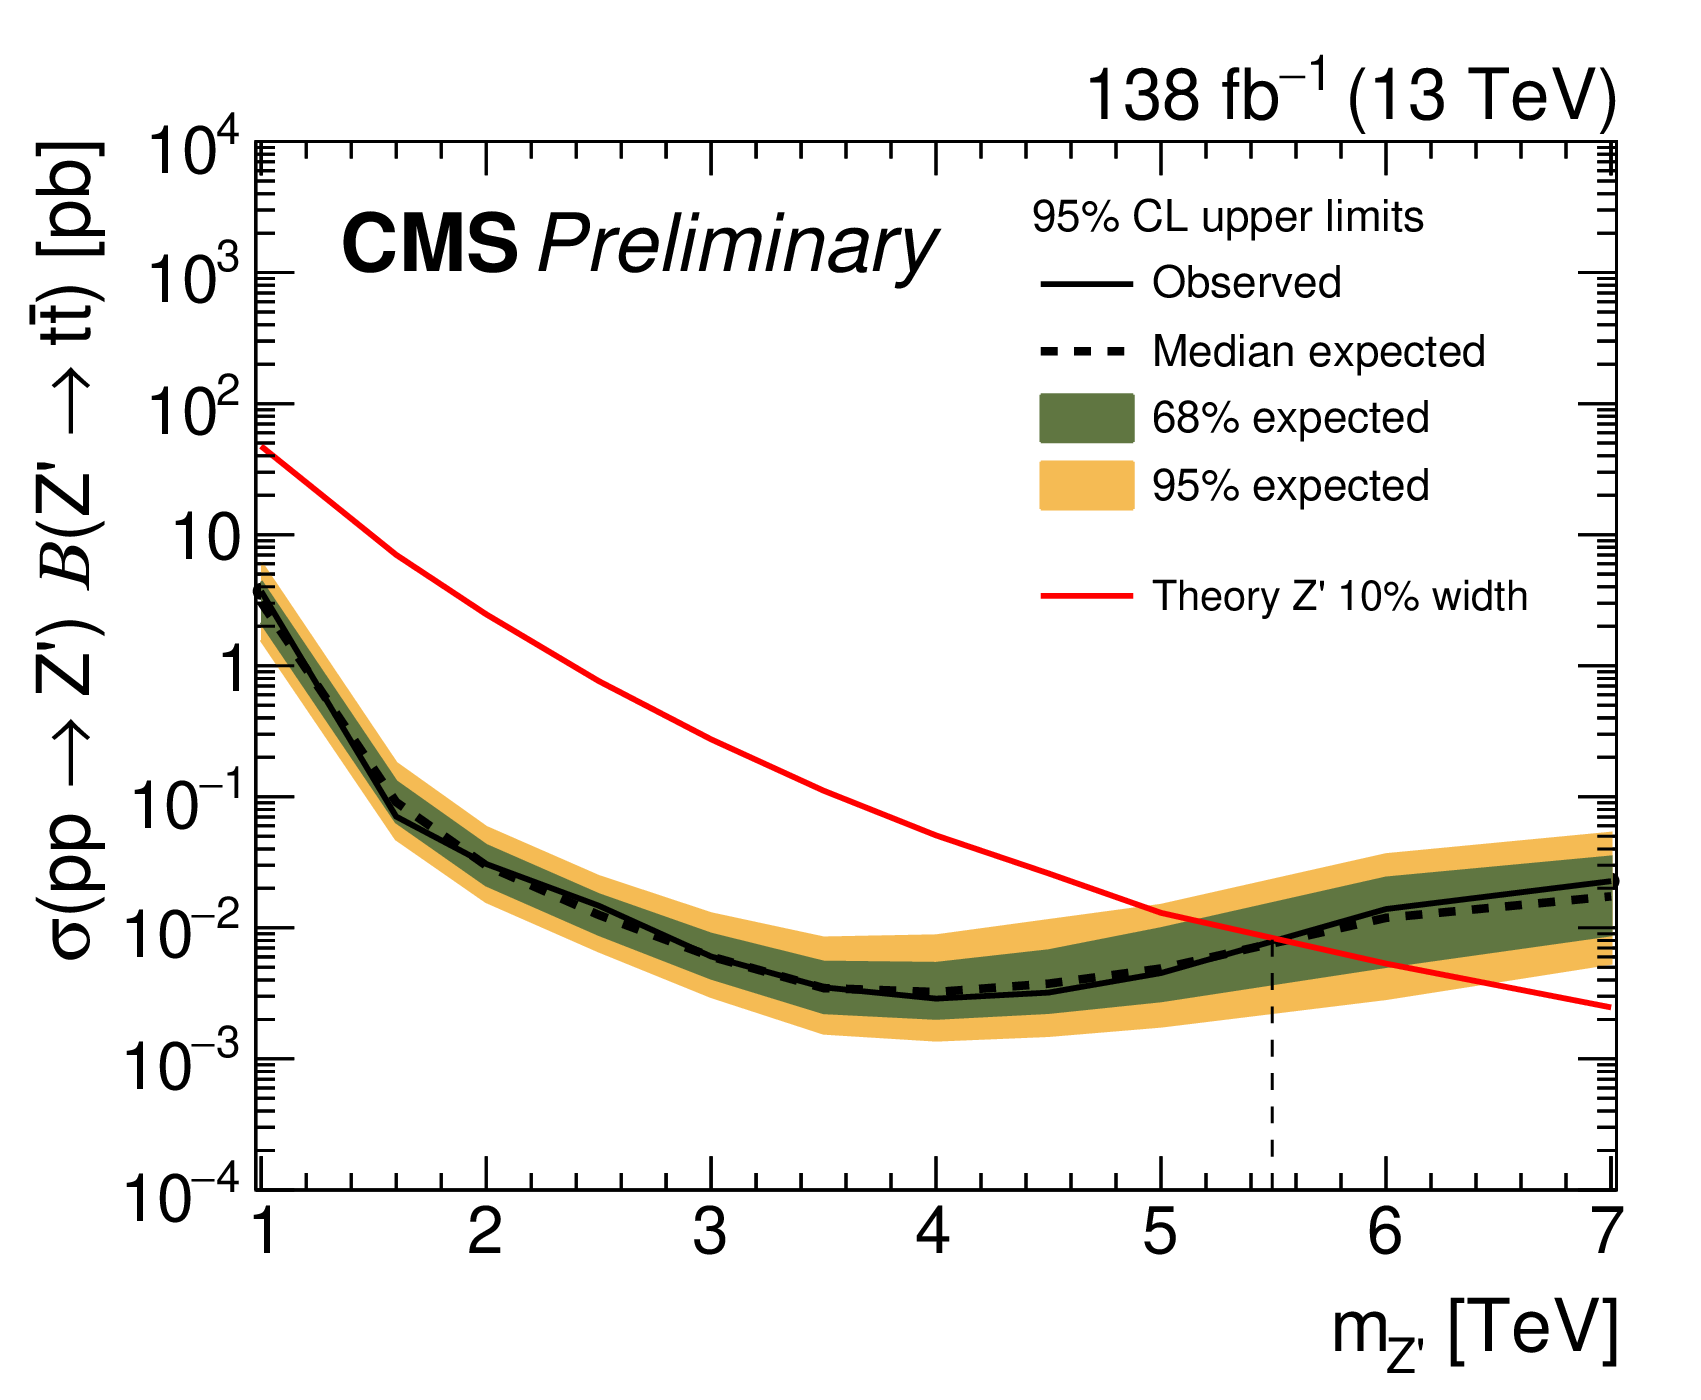
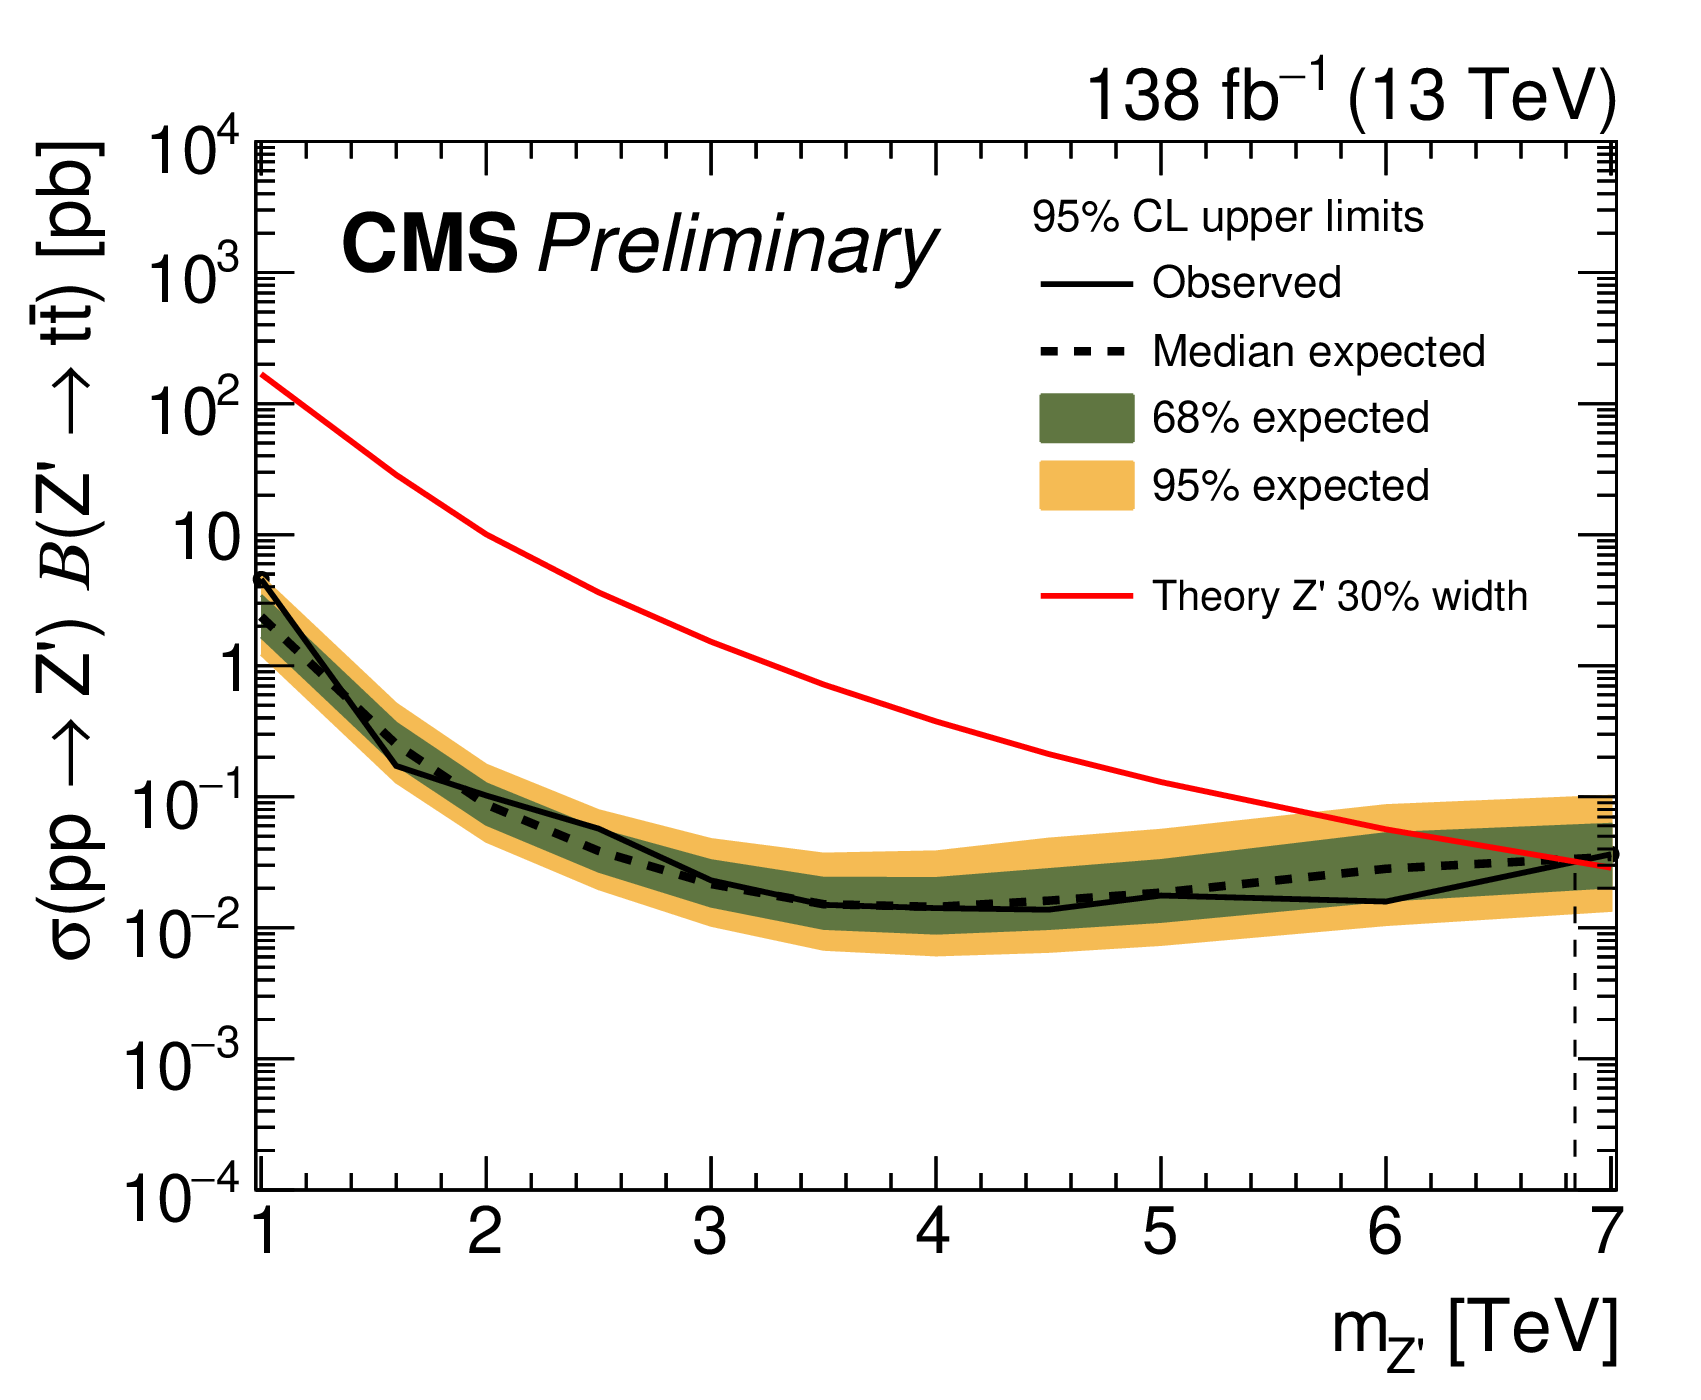
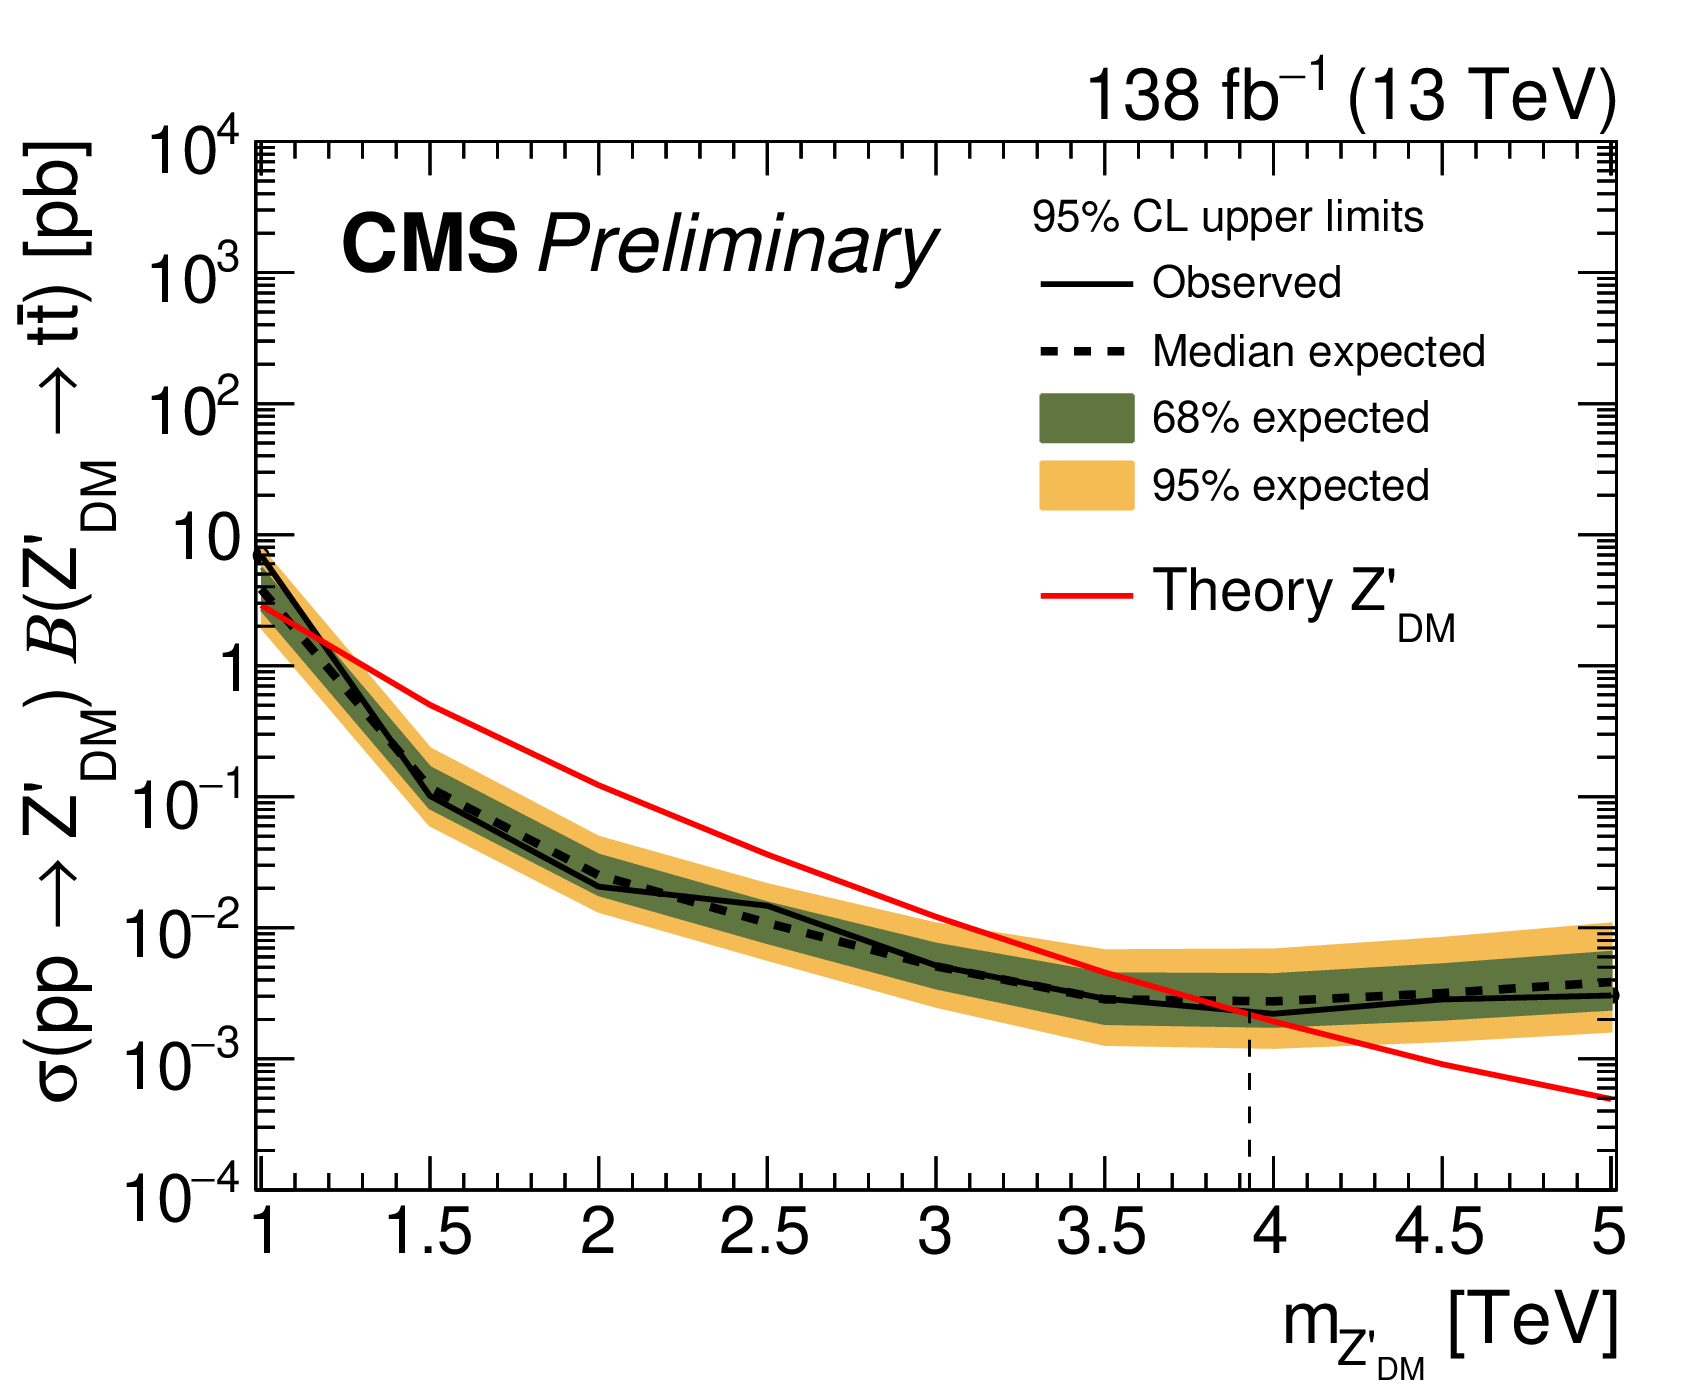
Expected and observed 95% CL upper limits on the cross section times branching ratio for five signal scenarios with three different width hypotheses: 1%, 10%, and 30%, as well as $ Z_{DM} $ and $ g_{KK} $, as a function of the new heavy particle mass. The five models considered are: a Z' boson with a width of 1% of its mass (upper left), a Z' boson with a width of 10% (upper right), a Z' boson with a width of 30% (lower left), $ Z_{DM} $ (lower right), and an RS KK gluon (bottom). The dashed black line represents the median expected limit, while the solid black line denotes the observed limit. The green (yellow) bands correspond to the one (two) sigma expected limit deviations. The solid red line shows the theoretical cross section expected for the signal process of interest. |
png pdf |
Figure 7-a:
Expected and observed 95% CL upper limits on the cross section times branching ratio for five signal scenarios with three different width hypotheses: 1%, 10%, and 30%, as well as $ Z_{DM} $ and $ g_{KK} $, as a function of the new heavy particle mass. The five models considered are: a Z' boson with a width of 1% of its mass (upper left), a Z' boson with a width of 10% (upper right), a Z' boson with a width of 30% (lower left), $ Z_{DM} $ (lower right), and an RS KK gluon (bottom). The dashed black line represents the median expected limit, while the solid black line denotes the observed limit. The green (yellow) bands correspond to the one (two) sigma expected limit deviations. The solid red line shows the theoretical cross section expected for the signal process of interest. |
png pdf |
Figure 7-b:
Expected and observed 95% CL upper limits on the cross section times branching ratio for five signal scenarios with three different width hypotheses: 1%, 10%, and 30%, as well as $ Z_{DM} $ and $ g_{KK} $, as a function of the new heavy particle mass. The five models considered are: a Z' boson with a width of 1% of its mass (upper left), a Z' boson with a width of 10% (upper right), a Z' boson with a width of 30% (lower left), $ Z_{DM} $ (lower right), and an RS KK gluon (bottom). The dashed black line represents the median expected limit, while the solid black line denotes the observed limit. The green (yellow) bands correspond to the one (two) sigma expected limit deviations. The solid red line shows the theoretical cross section expected for the signal process of interest. |
png pdf |
Figure 7-c:
Expected and observed 95% CL upper limits on the cross section times branching ratio for five signal scenarios with three different width hypotheses: 1%, 10%, and 30%, as well as $ Z_{DM} $ and $ g_{KK} $, as a function of the new heavy particle mass. The five models considered are: a Z' boson with a width of 1% of its mass (upper left), a Z' boson with a width of 10% (upper right), a Z' boson with a width of 30% (lower left), $ Z_{DM} $ (lower right), and an RS KK gluon (bottom). The dashed black line represents the median expected limit, while the solid black line denotes the observed limit. The green (yellow) bands correspond to the one (two) sigma expected limit deviations. The solid red line shows the theoretical cross section expected for the signal process of interest. |
png pdf |
Figure 7-d:
Expected and observed 95% CL upper limits on the cross section times branching ratio for five signal scenarios with three different width hypotheses: 1%, 10%, and 30%, as well as $ Z_{DM} $ and $ g_{KK} $, as a function of the new heavy particle mass. The five models considered are: a Z' boson with a width of 1% of its mass (upper left), a Z' boson with a width of 10% (upper right), a Z' boson with a width of 30% (lower left), $ Z_{DM} $ (lower right), and an RS KK gluon (bottom). The dashed black line represents the median expected limit, while the solid black line denotes the observed limit. The green (yellow) bands correspond to the one (two) sigma expected limit deviations. The solid red line shows the theoretical cross section expected for the signal process of interest. |

png pdf |
Figure 7-e:
Expected and observed 95% CL upper limits on the cross section times branching ratio for five signal scenarios with three different width hypotheses: 1%, 10%, and 30%, as well as $ Z_{DM} $ and $ g_{KK} $, as a function of the new heavy particle mass. The five models considered are: a Z' boson with a width of 1% of its mass (upper left), a Z' boson with a width of 10% (upper right), a Z' boson with a width of 30% (lower left), $ Z_{DM} $ (lower right), and an RS KK gluon (bottom). The dashed black line represents the median expected limit, while the solid black line denotes the observed limit. The green (yellow) bands correspond to the one (two) sigma expected limit deviations. The solid red line shows the theoretical cross section expected for the signal process of interest. |
| Tables | |
png pdf |
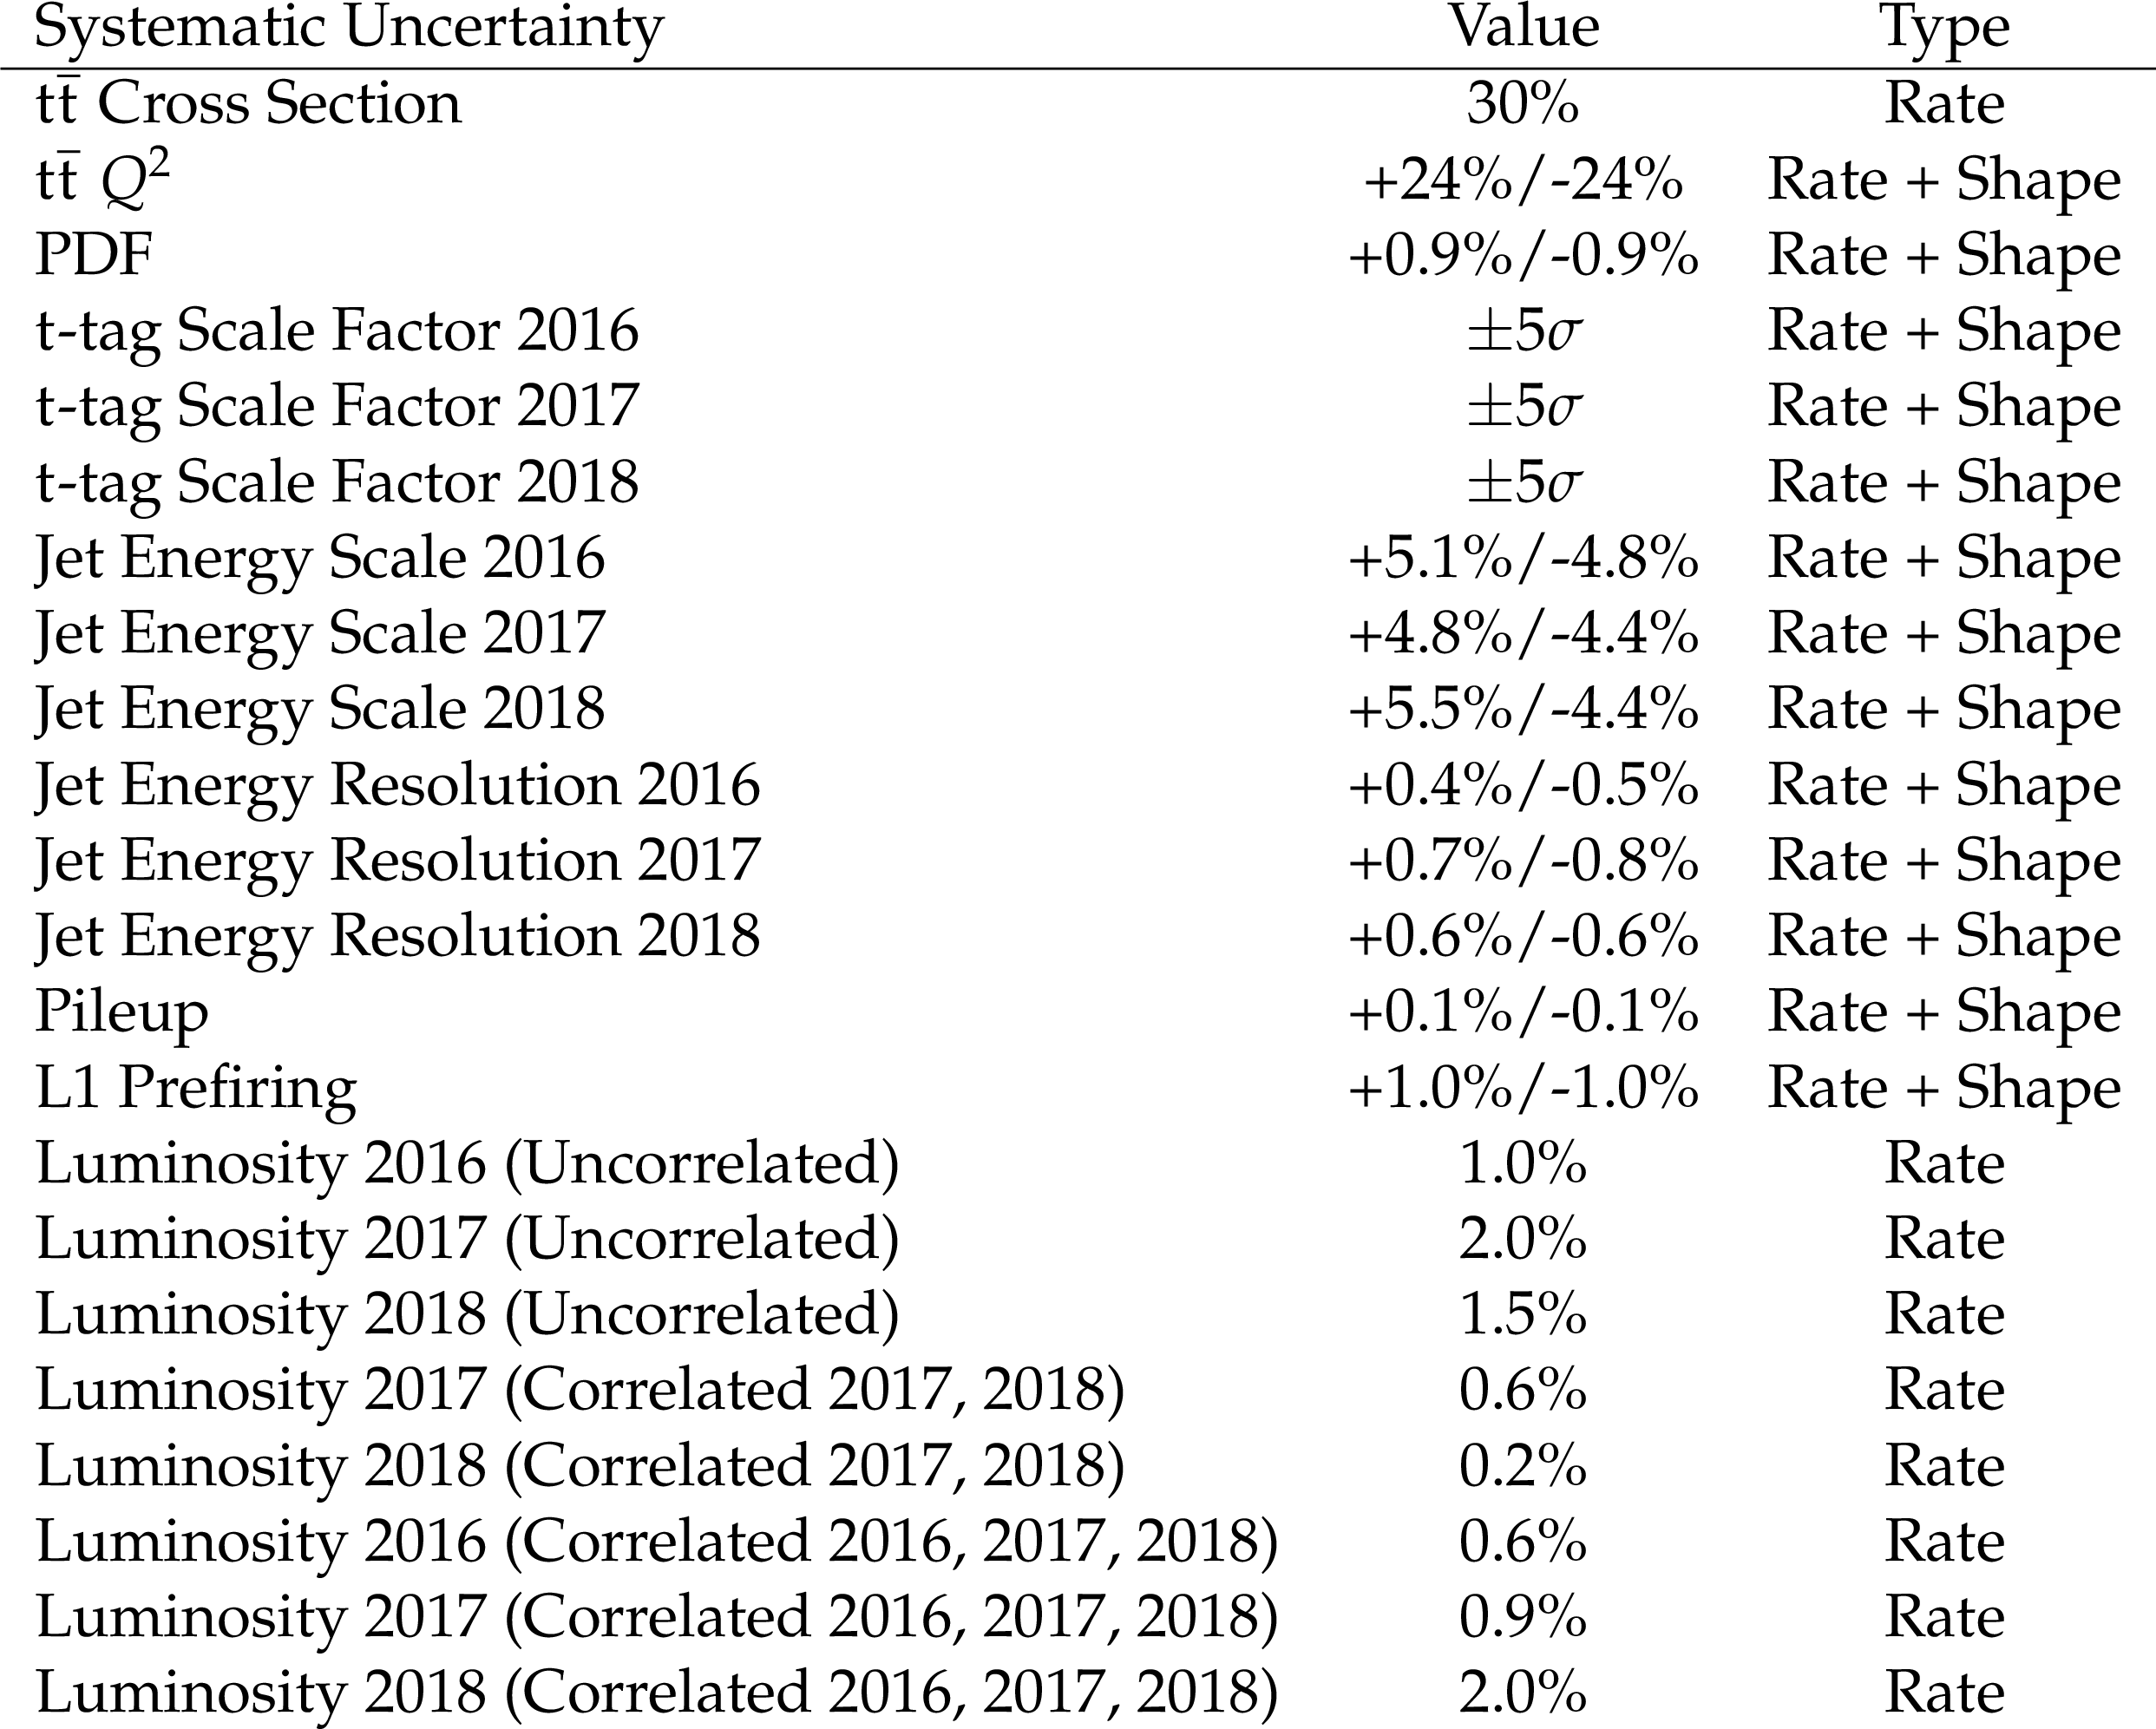
Table 1:
Summary of systematic uncertainty types for this analysis for SM $ \mathrm{t} \overline{\mathrm{t}} $. All uncertainties listed in the table are applied to the signal as well, except for the $ \mathrm{t} \overline{\mathrm{t}} $ cross section uncertainty, which is only relevant to the SM $ \mathrm{t} \overline{\mathrm{t}} $ background. The $ \mathrm{t} \overline{\mathrm{t}} $ cross section uncertainty is set to a large pre-fit value (30%) and extracted after the fit, and is conservatively separated from the $ Q^2 $ uncertainty. Scale factors for t-tagging are separated by year and $ p_{\mathrm{T}} $. Jet energy scale and resolution are separated by year, $ p_{\mathrm{T}} $, and $ \eta $. Luminosity uncertainties are correlated as indicated in the table. |
png pdf |
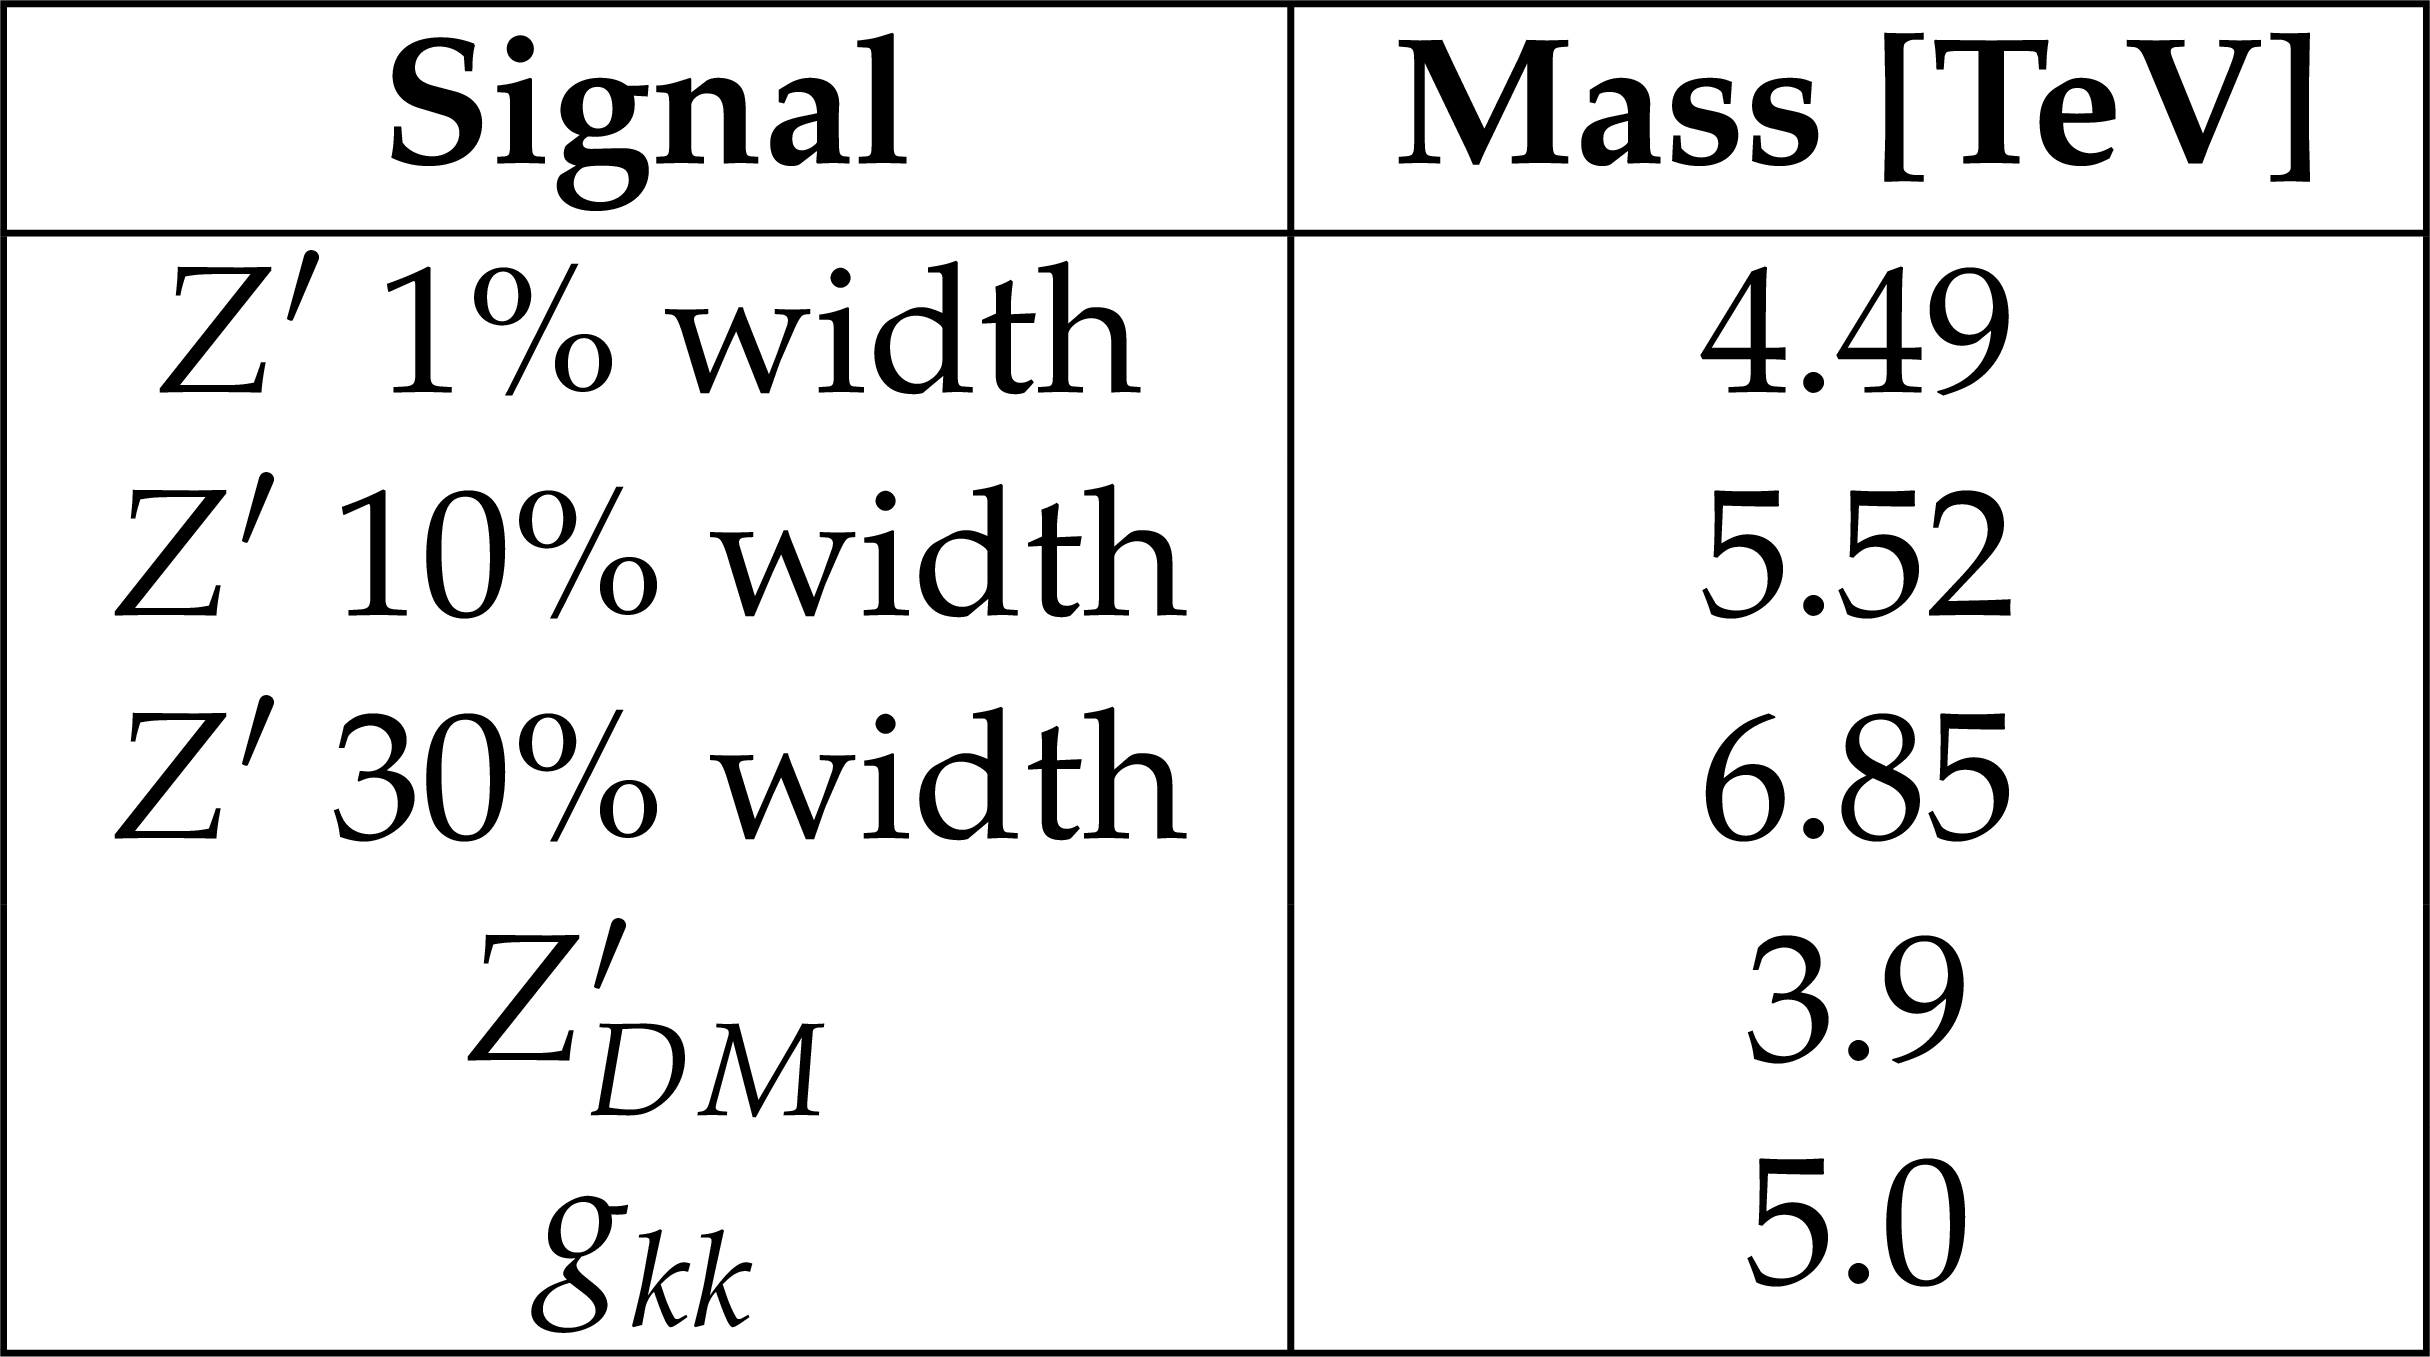
Table 2:
Observed Run 2 mass limits for a Z' boson with a width of 1%, 10% and 30% as well as $ Z_{DM} $ and RS KK gluon |
| Summary |
| A search has been presented for anomalous production of $ {\mathrm{t}\overline{\mathrm{t}}} $ events from resonant signals beyond the standard model. This analysis uses a data-driven background estimate for the QCD multijet background, as well as a simultaneous fit for the standard model $ {\mathrm{t}\overline{\mathrm{t}}} $ cross section and signal. A Kaluza-Klein gluon decaying to top quark pairs is excluded below 5 TeV; a $ Z' $ dark matter mediator is excluded below 3.9 TeV; and sequential standard model $ Z' $ bosons are excluded for 1%, 10%, and 30% relative widths below 4.49, 5.52, and 6.85 TeV, respectively. These constitute the most stringent limits in this channel to date, particularly in the high-mass regime above 3 TeV. |
| References | ||||
| 1 | CMS Collaboration | Observation of a new boson at a mass of 125 GeV with the CMS experiment at the LHC | PLB 716 (2012) 30 | CMS-HIG-12-028 1207.7235 |
| 2 | ATLAS Collaboration | Observation of a new particle in the search for the standard model Higgs boson with the ATLAS detector at the LHC | PLB 716 (2012) 1 | 1207.7214 |
| 3 | CMS Collaboration | Observation of a new boson with mass near 125 GeV in pp collisions at $ \sqrt{s} = $ 7 and 8 TeV | JHEP 06 (2013) 081 | CMS-HIG-12-036 1303.4571 |
| 4 | ATLAS Collaboration | Measurement of the Higgs boson mass from the $ H\rightarrow \gamma\gamma $ and $ H \rightarrow ZZ^{*} \rightarrow 4\ell $ channels with the ATLAS detector using 25 fb$ ^{-1} $ of pp collision data | PRD 90 (2014) 052004 | 1406.3827 |
| 5 | A. Hebecker | Naturalness, String Landscape and Multiverse: A Modern Introduction with Exercises | volume 979. 3, ISBN~978-3-030-65150-3, 978-3-030-65151-0, 2021 link |
|
| 6 | E. Witten | Cosmological Consequences of a Light Higgs Boson | NPB 177 (1981) 477 | |
| 7 | D. Clowe et al. | A direct empirical proof of the existence of dark matter | Astrophys. J. Lett. 648 (2006) L109 | astro-ph/0608407 |
| 8 | D. Hooper | Particle Dark Matter | in Theoretical Advanced Study Institute in Elementary Particle Physics: The Dawn of the LHC Era, 2010 link |
0901.4090 |
| 9 | J. L. Rosner | Prominent decay modes of a leptophobic $ Z^\prime $ | PLB 387 (1996) 113 | hep-ph/9607207 |
| 10 | K. Agashe et al. | LHC Signals for Warped Electroweak Charged Gauge Bosons | PRD 80 (2009) 075007 | 0810.1497 |
| 11 | M.Wassmer | Search for the production of Dark Matter in hadronic mono-top signatures with the CMS experiment | PhD thesis, Karlsruher Institut fur Technologie (KIT), 2021 link |
|
| 12 | ATLAS Collaboration | A search for $ t\bar{t} $ resonances in lepton+jets events with highly boosted top quarks collected in $ pp $ collisions at $ \sqrt{s} = $ 7 TeV with the ATLAS detector | JHEP 09 (2012) 041 | 1207.2409 |
| 13 | CMS Collaboration | Search for Resonant $ t\bar{t} $ Production in Lepton+Jets Events in $ pp $ Collisions at $ \sqrt{s}= $ 7 TeV | JHEP 12 (2012) 015 | CMS-TOP-12-017 1209.4397 |
| 14 | CMS Collaboration | Searches for New Physics using the $ t\bar{t} $ Invariant Mass Distribution in pp Collisions at $ \sqrt{s} $=8 TeV | PRL 111 (2013) 211804 | 1309.2030 |
| 15 | ATLAS Collaboration | Search for Heavy Higgs Bosons $ A/H $ Decaying to a Top Quark Pair in $ pp $ Collisions at $ \sqrt{s}=8\text{ }\text{ }\mathrm{TeV} $ with the ATLAS Detector | PRL 119 (2017) | 1707.06025 |
| 16 | ATLAS Collaboration | Search for $ t\overline{t} $ resonances in fully hadronic final states in $ pp $ collisions at $ \sqrt{s} $ = 13 TeV with the ATLAS detector | JHEP 10 (2020) 061 | 2005.05138 |
| 17 | CMS Collaboration | Search for $ \mathrm{t}\overline{\mathrm{t}} $ resonances in highly boosted lepton+jets and fully hadronic final states in proton-proton collisions at $ \sqrt{s}= $ 13 TeV | JHEP 07 (2017) 001 | 1704.03366 |
| 18 | CMS Collaboration | Search for resonant $ \mathrm{t}\overline{\mathrm{t}} $ production in proton-proton collisions at $ \sqrt{s}= $ 13 TeV | JHEP 04 (2019) 031 | 1810.05905 |
| 19 | CMS Collaboration | Identification of heavy, energetic, hadronically decaying particles using machine-learning techniques | JINST 15 (2020) P06005 | CMS-JME-18-002 2004.08262 |
| 20 | CMS Collaboration | Particle-flow reconstruction and global event description with the CMS detector | JINST 12 (2017) P10003 | CMS-PRF-14-001 1706.04965 |
| 21 | CMS Collaboration | Determination of Jet Energy Calibration and Transverse Momentum Resolution in CMS | JINST 6 (2011) P11002 | CMS-JME-10-011 1107.4277 |
| 22 | M. Cacciari, G. P. Salam, and G. Soyez | The anti-$ k_t $ jet clustering algorithm | JHEP 04 (2008) 063 | 0802.1189 |
| 23 | M. Cacciari, G. P. Salam, and G. Soyez | FastJet user manual | EPJC 72 (2012) 1896 | 1111.6097 |
| 24 | Y. L. Dokshitzer, G. D. Leder, S. Moretti, and B. R. Webber | Better jet clustering algorithms | JHEP 08 (1997) 001 | hep-ph/9707323 |
| 25 | M. Wobisch and T. Wengler | Hadronization corrections to jet cross-sections in deep inelastic scattering | in Workshop on Monte Carlo Generators for HERA Physics (Plenary Starting Meeting), 1998 | hep-ph/9907280 |
| 26 | A. J. Larkoski, S. Marzani, G. Soyez, and J. Thaler | Soft Drop | JHEP 05 (2014) 146 | 1402.2657 |
| 27 | M. Dasgupta, A. Fregoso, S. Marzani, and G. P. Salam | Towards an understanding of jet substructure | JHEP 09 (2013) 029 | 1307.0007 |
| 28 | CMS Collaboration | Precision luminosity measurement in proton-proton collisions at $ \sqrt{s} = $ 13 TeV in 2015 and 2016 at CMS | EPJC 81 (2021) 800 | CMS-LUM-17-003 2104.01927 |
| 29 | CMS Collaboration | CMS luminosity measurement for the 2017 data-taking period at $ \sqrt{s}= $ 13 TeV | CMS Physics Analysis Summary, 2018 CMS-PAS-LUM-17-004 |
CMS-PAS-LUM-17-004 |
| 30 | CMS Collaboration | CMS luminosity measurement for the 2018 data-taking period at $ \sqrt{s}= $ 13 TeV | CMS Physics Analysis Summary, 2019 CMS-PAS-LUM-18-002 |
CMS-PAS-LUM-18-002 |
| 31 | CMS Collaboration | The CMS trigger system | JINST 12 (2017) P01020 | CMS-TRG-12-001 1609.02366 |
| 32 | CMS Collaboration | Performance of the CMS high-level trigger during LHC Run 2 | JINST 19 (2024) P11021 | CMS-TRG-19-001 2410.17038 |
| 33 | T. Sjöstrand et al. | An introduction to PYTHIA 8.2 | Comput. Phys. Commun. 191 (2015) 159 | 1410.3012 |
| 34 | M. Rubin, G. P. Salam, and S. Sapeta | Giant QCD K-factors beyond NLO | JHEP 09 (2010) 084 | 1006.2144 |
| 35 | J. Alwall et al. | The automated computation of tree-level and next-to-leading order differential cross sections, and their matching to parton shower simulations | JHEP 07 (2014) 079 | 1405.0301 |
| 36 | P. Nason | A New method for combining NLO QCD with shower Monte Carlo algorithms | JHEP 11 (2004) 040 | hep-ph/0409146 |
| 37 | S. Frixione, P. Nason, and C. Oleari | Matching NLO QCD computations with Parton Shower simulations: the POWHEG method | JHEP 11 (2007) 070 | 0709.2092 |
| 38 | S. Alioli, P. Nason, C. Oleari, and E. Re | A general framework for implementing NLO calculations in shower Monte Carlo programs: the POWHEG BOX | JHEP 06 (2010) 043 | 1002.2581 |
| 39 | CMS Collaboration | Extraction and validation of a new set of CMS PYTHIA8 tunes from underlying-event measurements | EPJC 80 (2020) 4 | CMS-GEN-17-001 1903.12179 |
| 40 | M. L. Mangano, M. Moretti, F. Piccinini, and M. Treccani | Matching matrix elements and shower evolution for top-quark production in hadronic collisions | JHEP 01 (2007) 013 | hep-ph/0611129 |
| 41 | R. A. Fisher | On the interpretation of $ \chi^2 $ from contingency tables, and the calculation of p | J. Royal Stat. Soc. 85 (1922) 87 | |
| 42 | CMS Collaboration | Measurement of differential $ t \bar t $ production cross sections in the full kinematic range using lepton+jets events from proton-proton collisions at $ \sqrt {s} $ = 13\,\,TeV | PRD 104 (2021) 092013 | CMS-TOP-20-001 2108.02803 |
|
|
Compact Muon Solenoid LHC, CERN |
|

|

|

|

|

|