

Compact Muon Solenoid
LHC, CERN
| CMS-PAS-TOP-21-007 | ||
| Search for central exclusive production of top quark pairs in proton-proton collisions at $\sqrt{s} = $ 13 TeV with tagged protons | ||
| CMS Collaboration | ||
| March 2022 | ||
| Abstract: A search for the central exclusive production of top quark pairs ($\mathrm{t\bar{t}}$) is performed using proton-tagged events in proton-proton collisions at the LHC at a centre-of-mass energy of 13 TeV. The data correspond to an integrated luminosity of 29.4 fb$^{-1}$. The $\mathrm{t\bar{t}}$ decay products are reconstructed using the CMS central detector, while forward protons are detected with the CMS-TOTEM Precision Proton Spectrometer. An upper bound on the production cross section of 0.59\ pb is set at 95% confidence level. | ||
|
Links:
CDS record (PDF) ;
Physics Briefing ;
CADI line (restricted) ;
These preliminary results are superseded in this paper, Submitted to JHEP. The superseded preliminary plots can be found here. |
||
| Figures | |
png pdf |
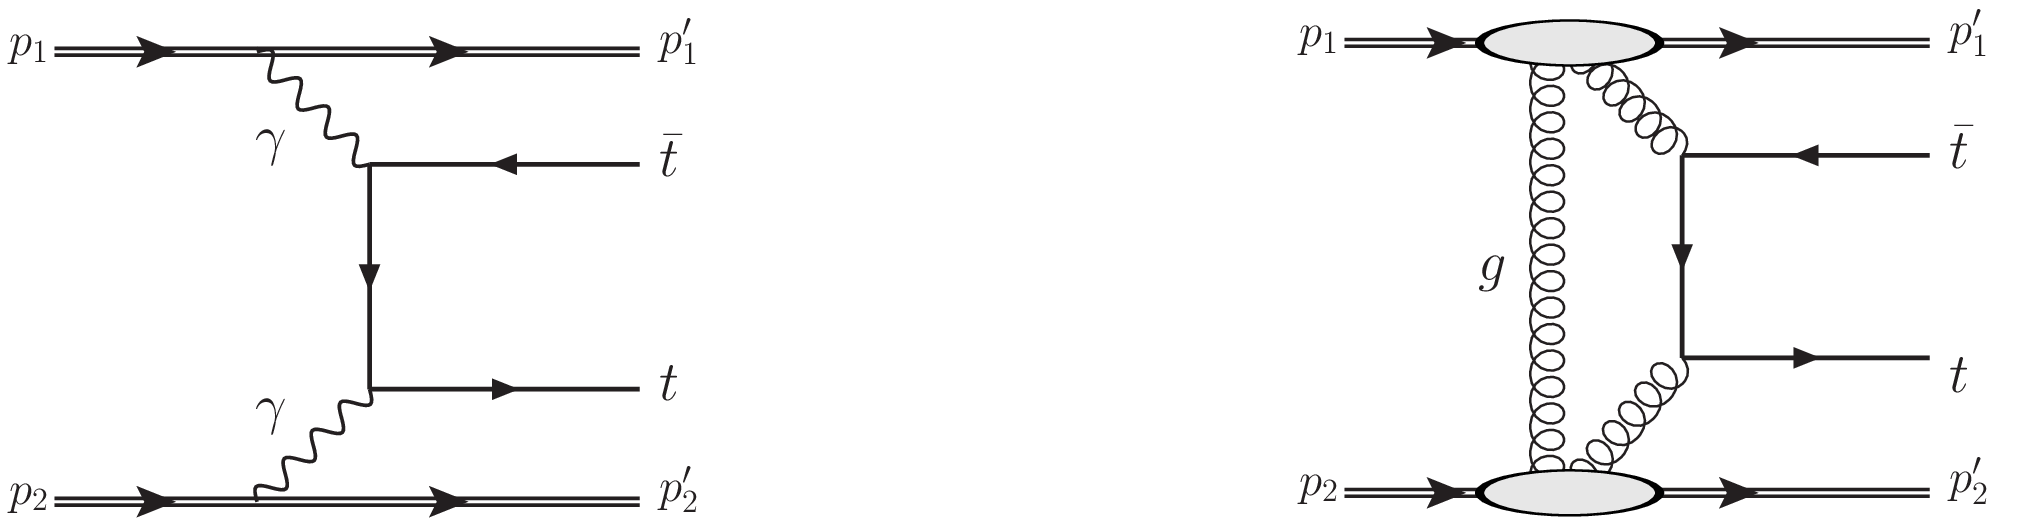
Figure 1:
Leading diagrams for ${\mathrm{t} {}\mathrm{\bar{t}}}$ central exclusive production, via $\gamma {}\gamma$ fusion (left) and pomeron exchange (right). |
png pdf |
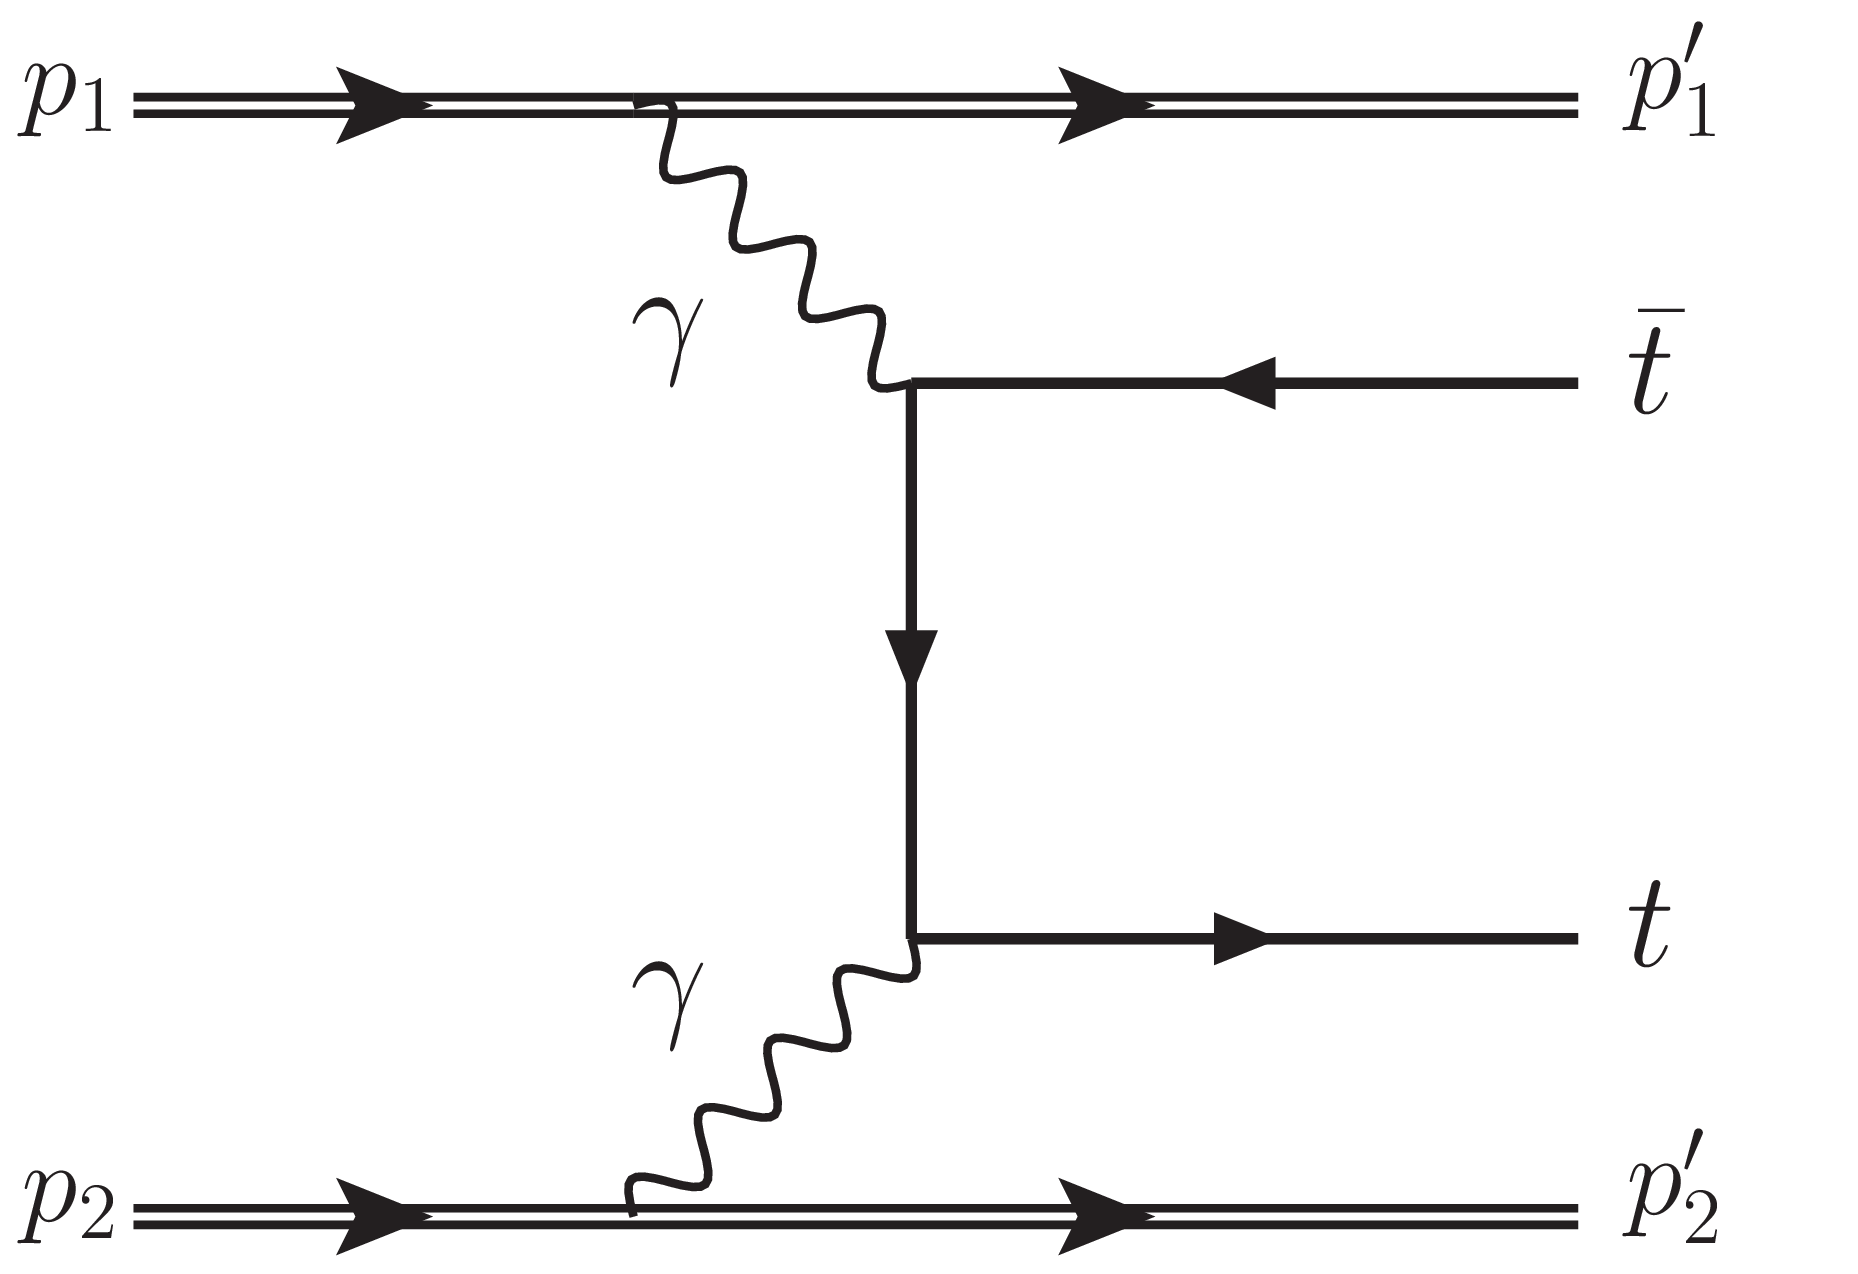
Figure 1-a:
Leading diagrams for ${\mathrm{t} {}\mathrm{\bar{t}}}$ central exclusive production, via $\gamma {}\gamma$ fusion (left) and pomeron exchange (right). |
png pdf |
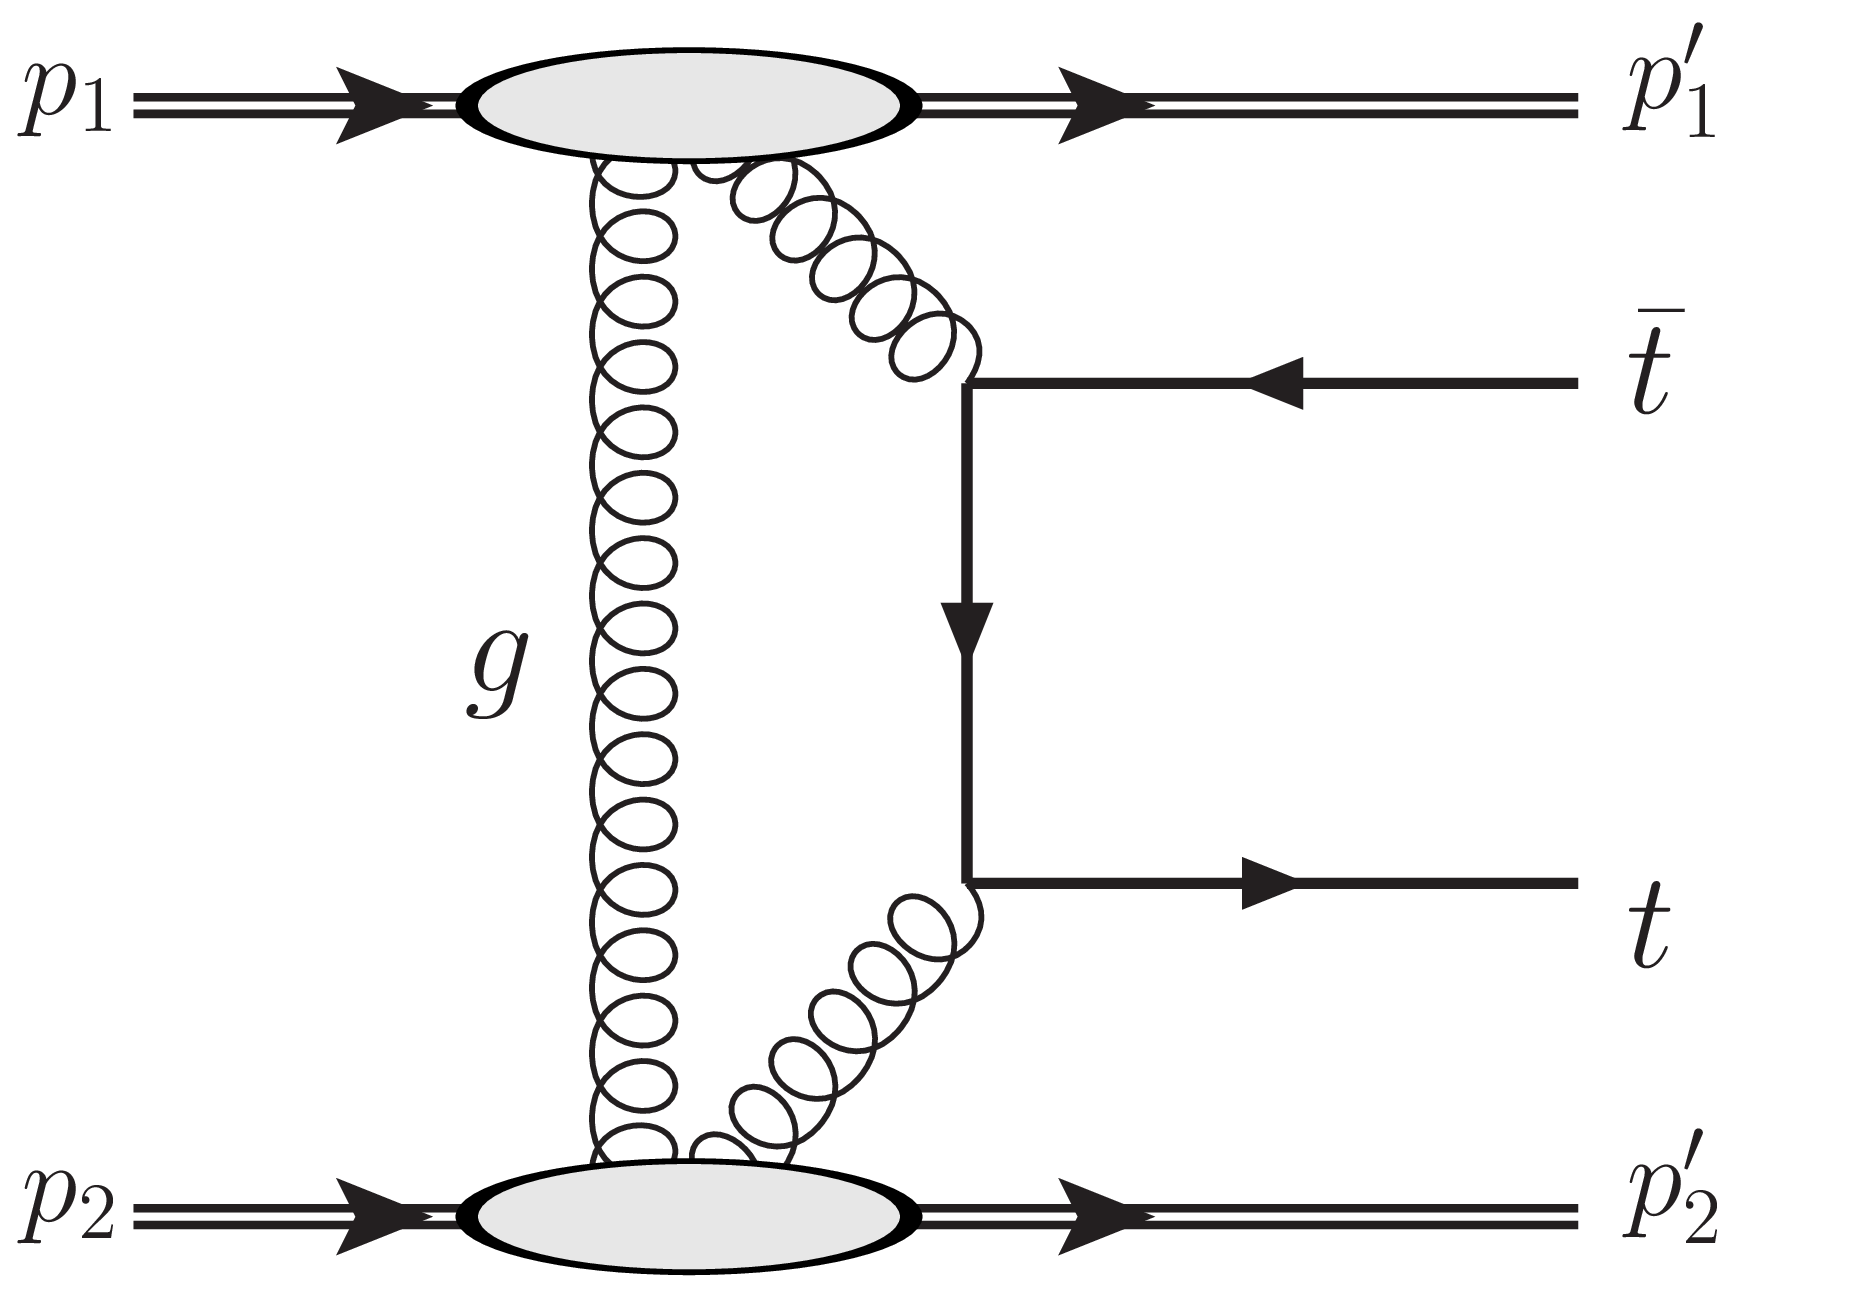
Figure 1-b:
Leading diagrams for ${\mathrm{t} {}\mathrm{\bar{t}}}$ central exclusive production, via $\gamma {}\gamma$ fusion (left) and pomeron exchange (right). |
png pdf |
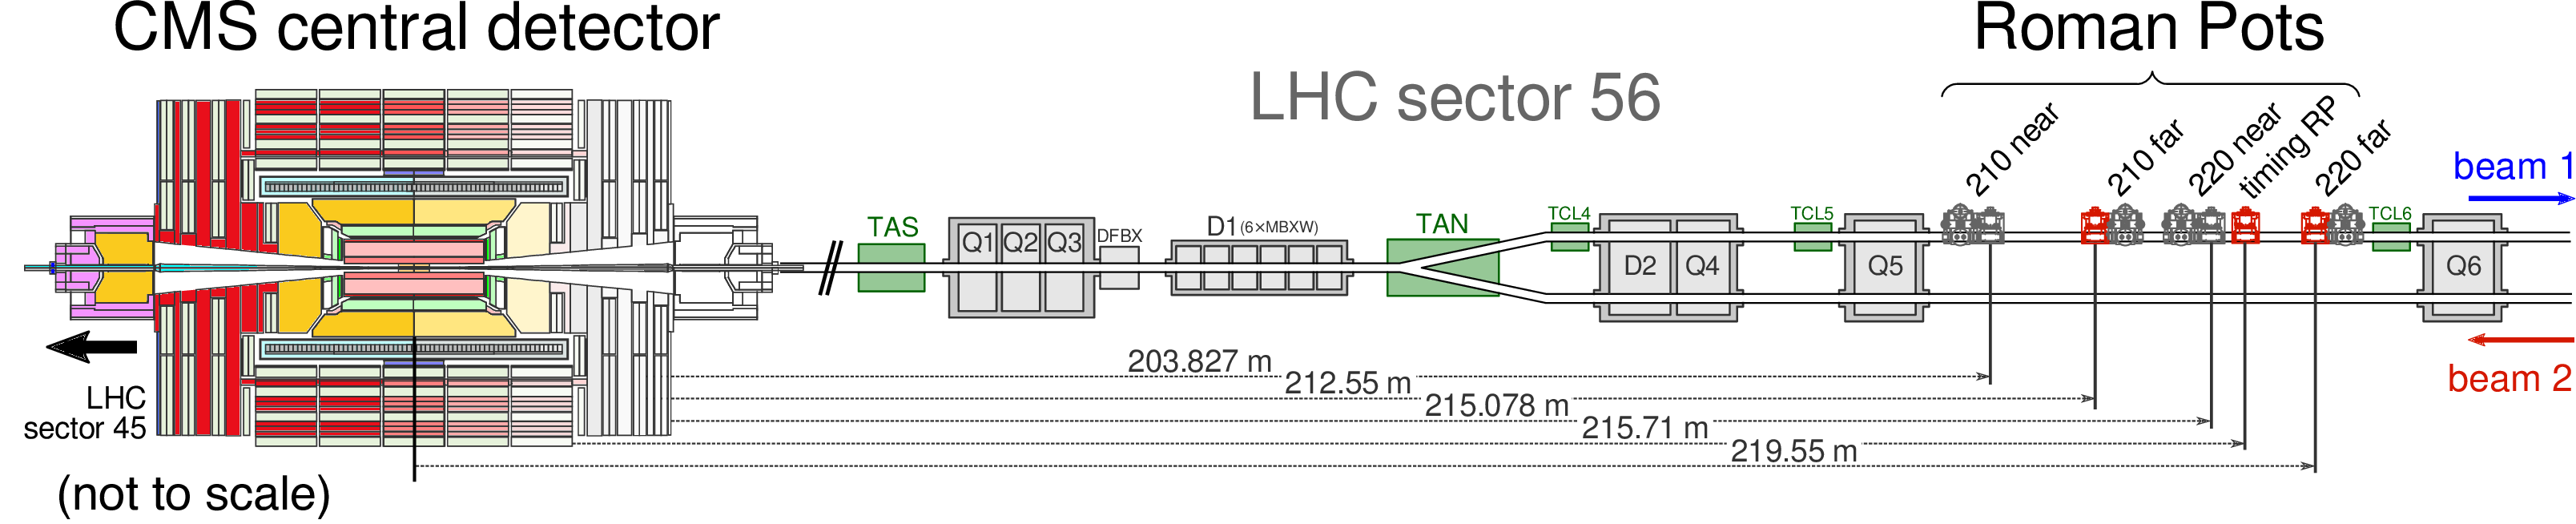
Figure 2:
A schematic layout of one arm of CT-PPS along the LHC beam line. The RP shown in red are those used by CT-PPS; those in grey are part of the TOTEM experiment. |
png pdf |
Figure 3:
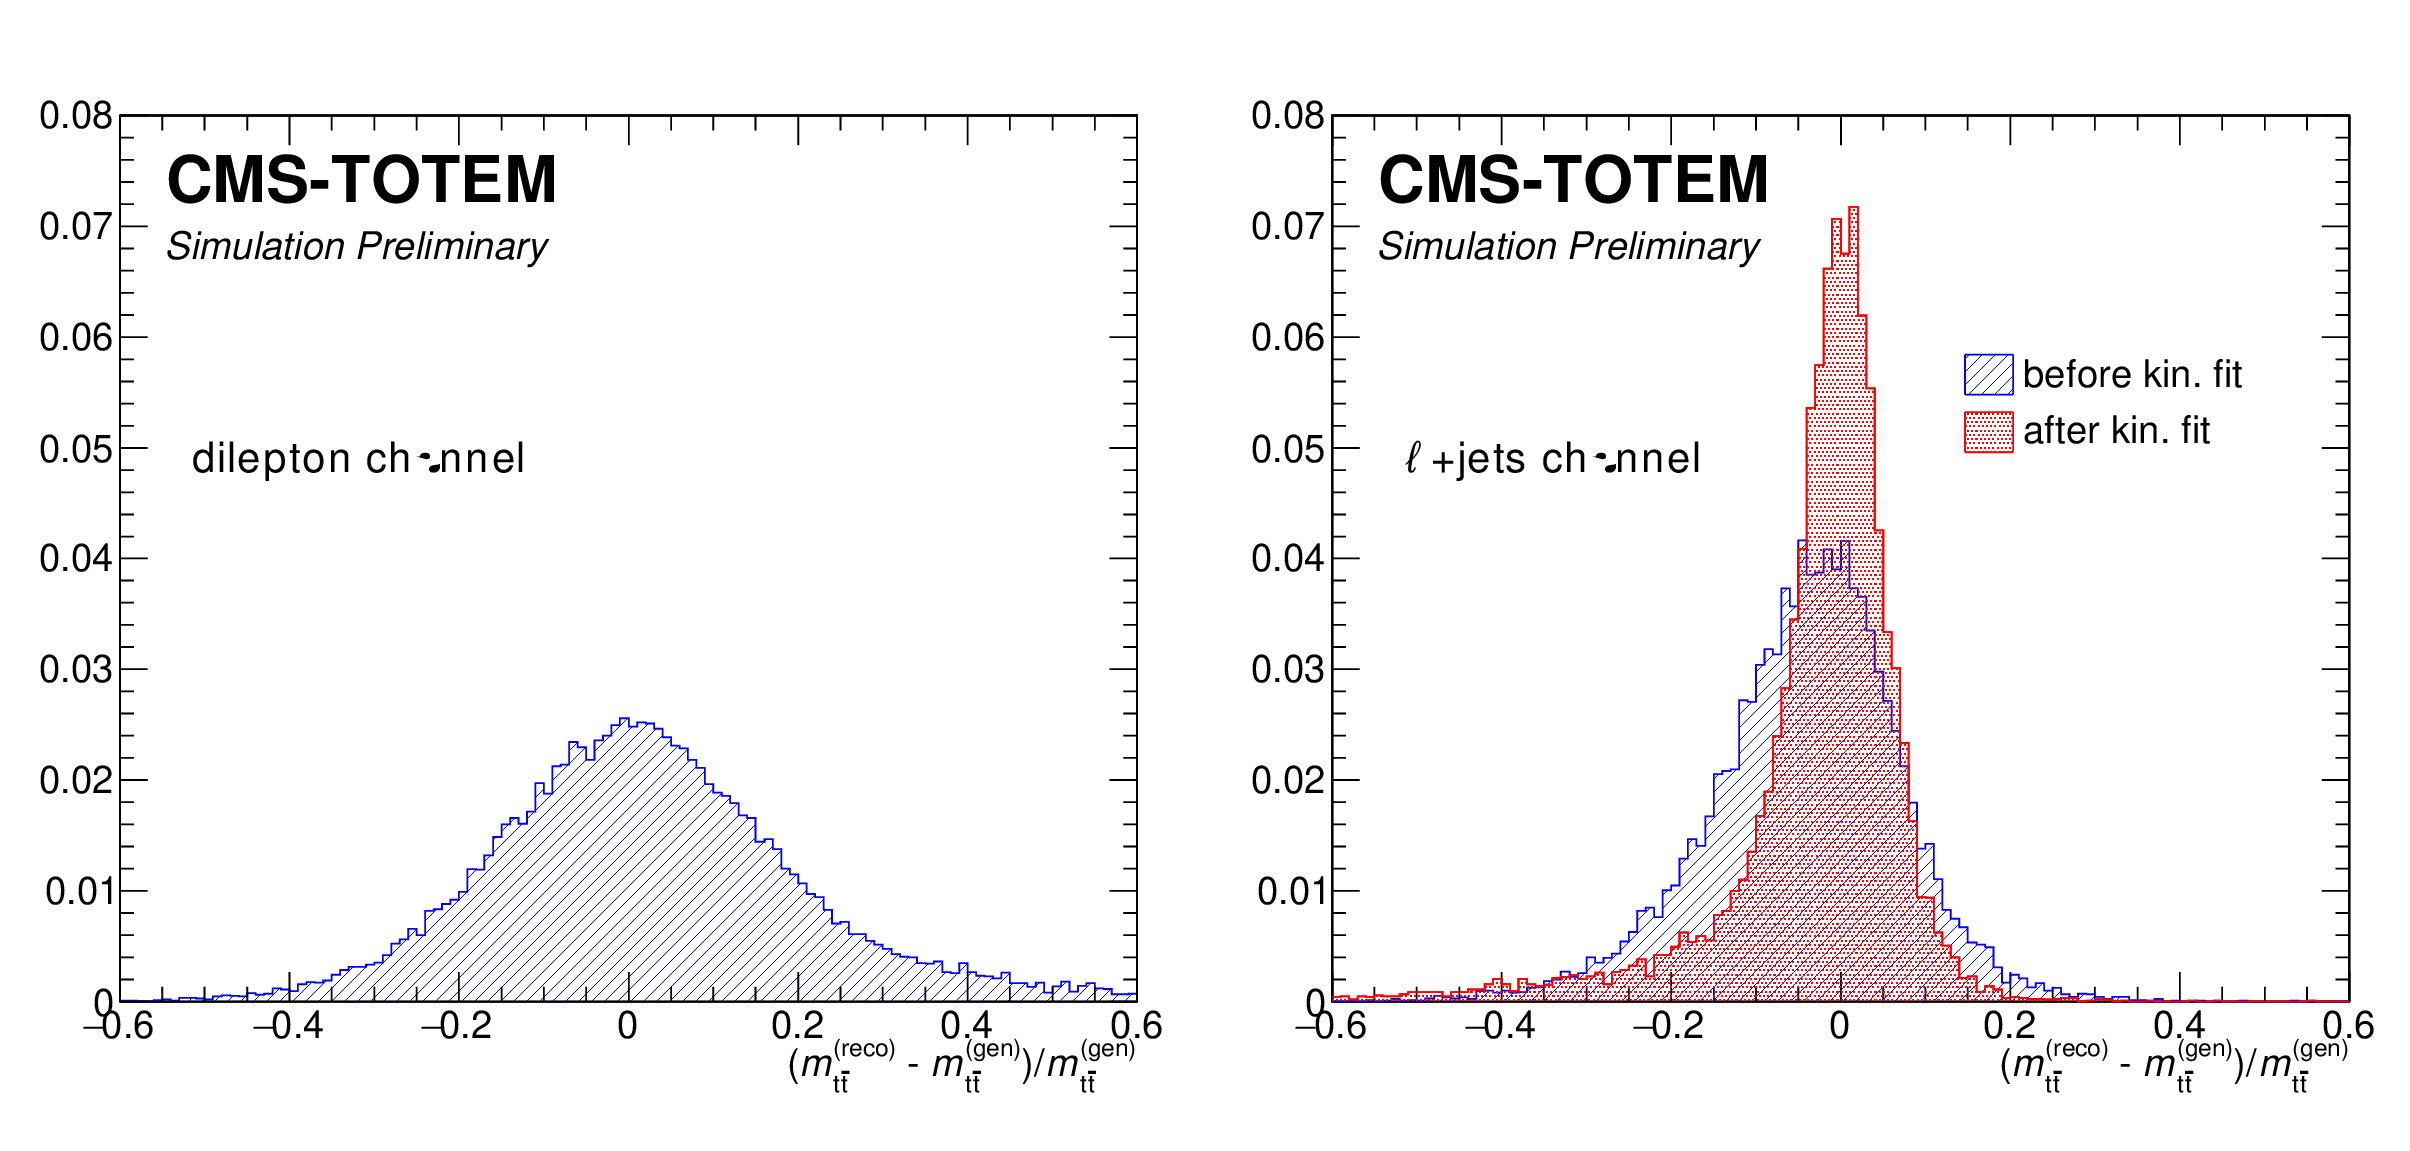
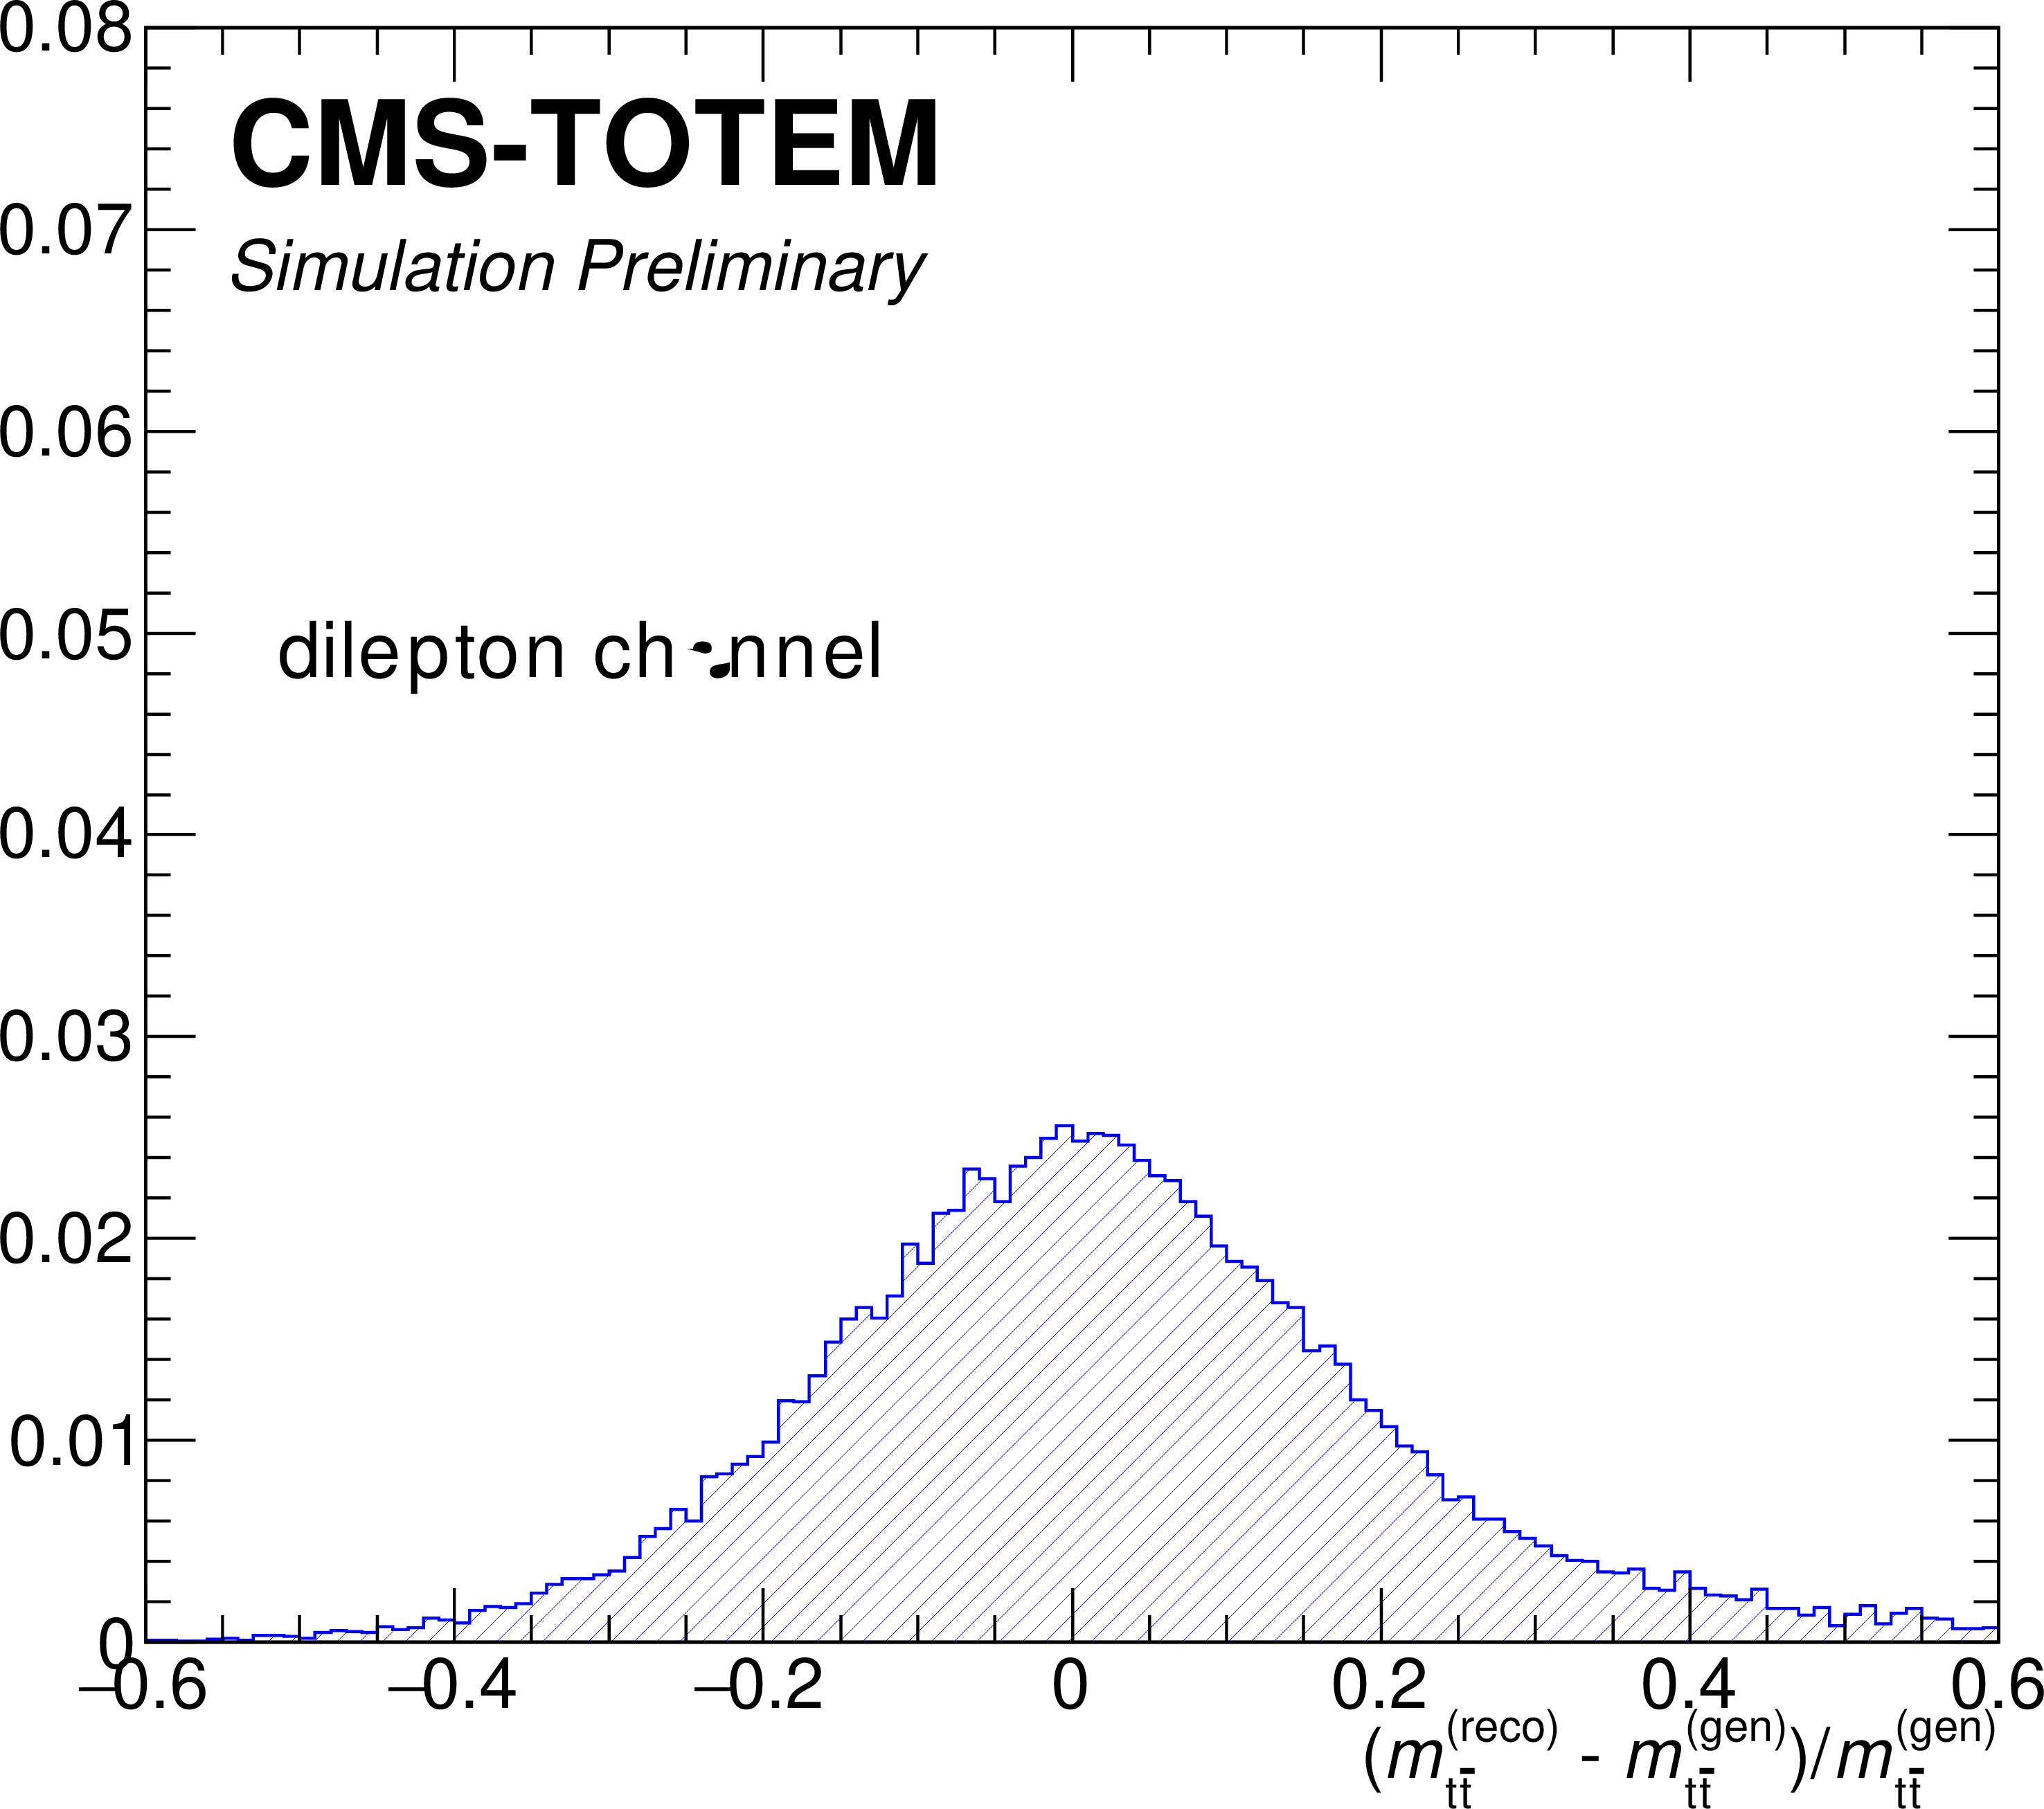
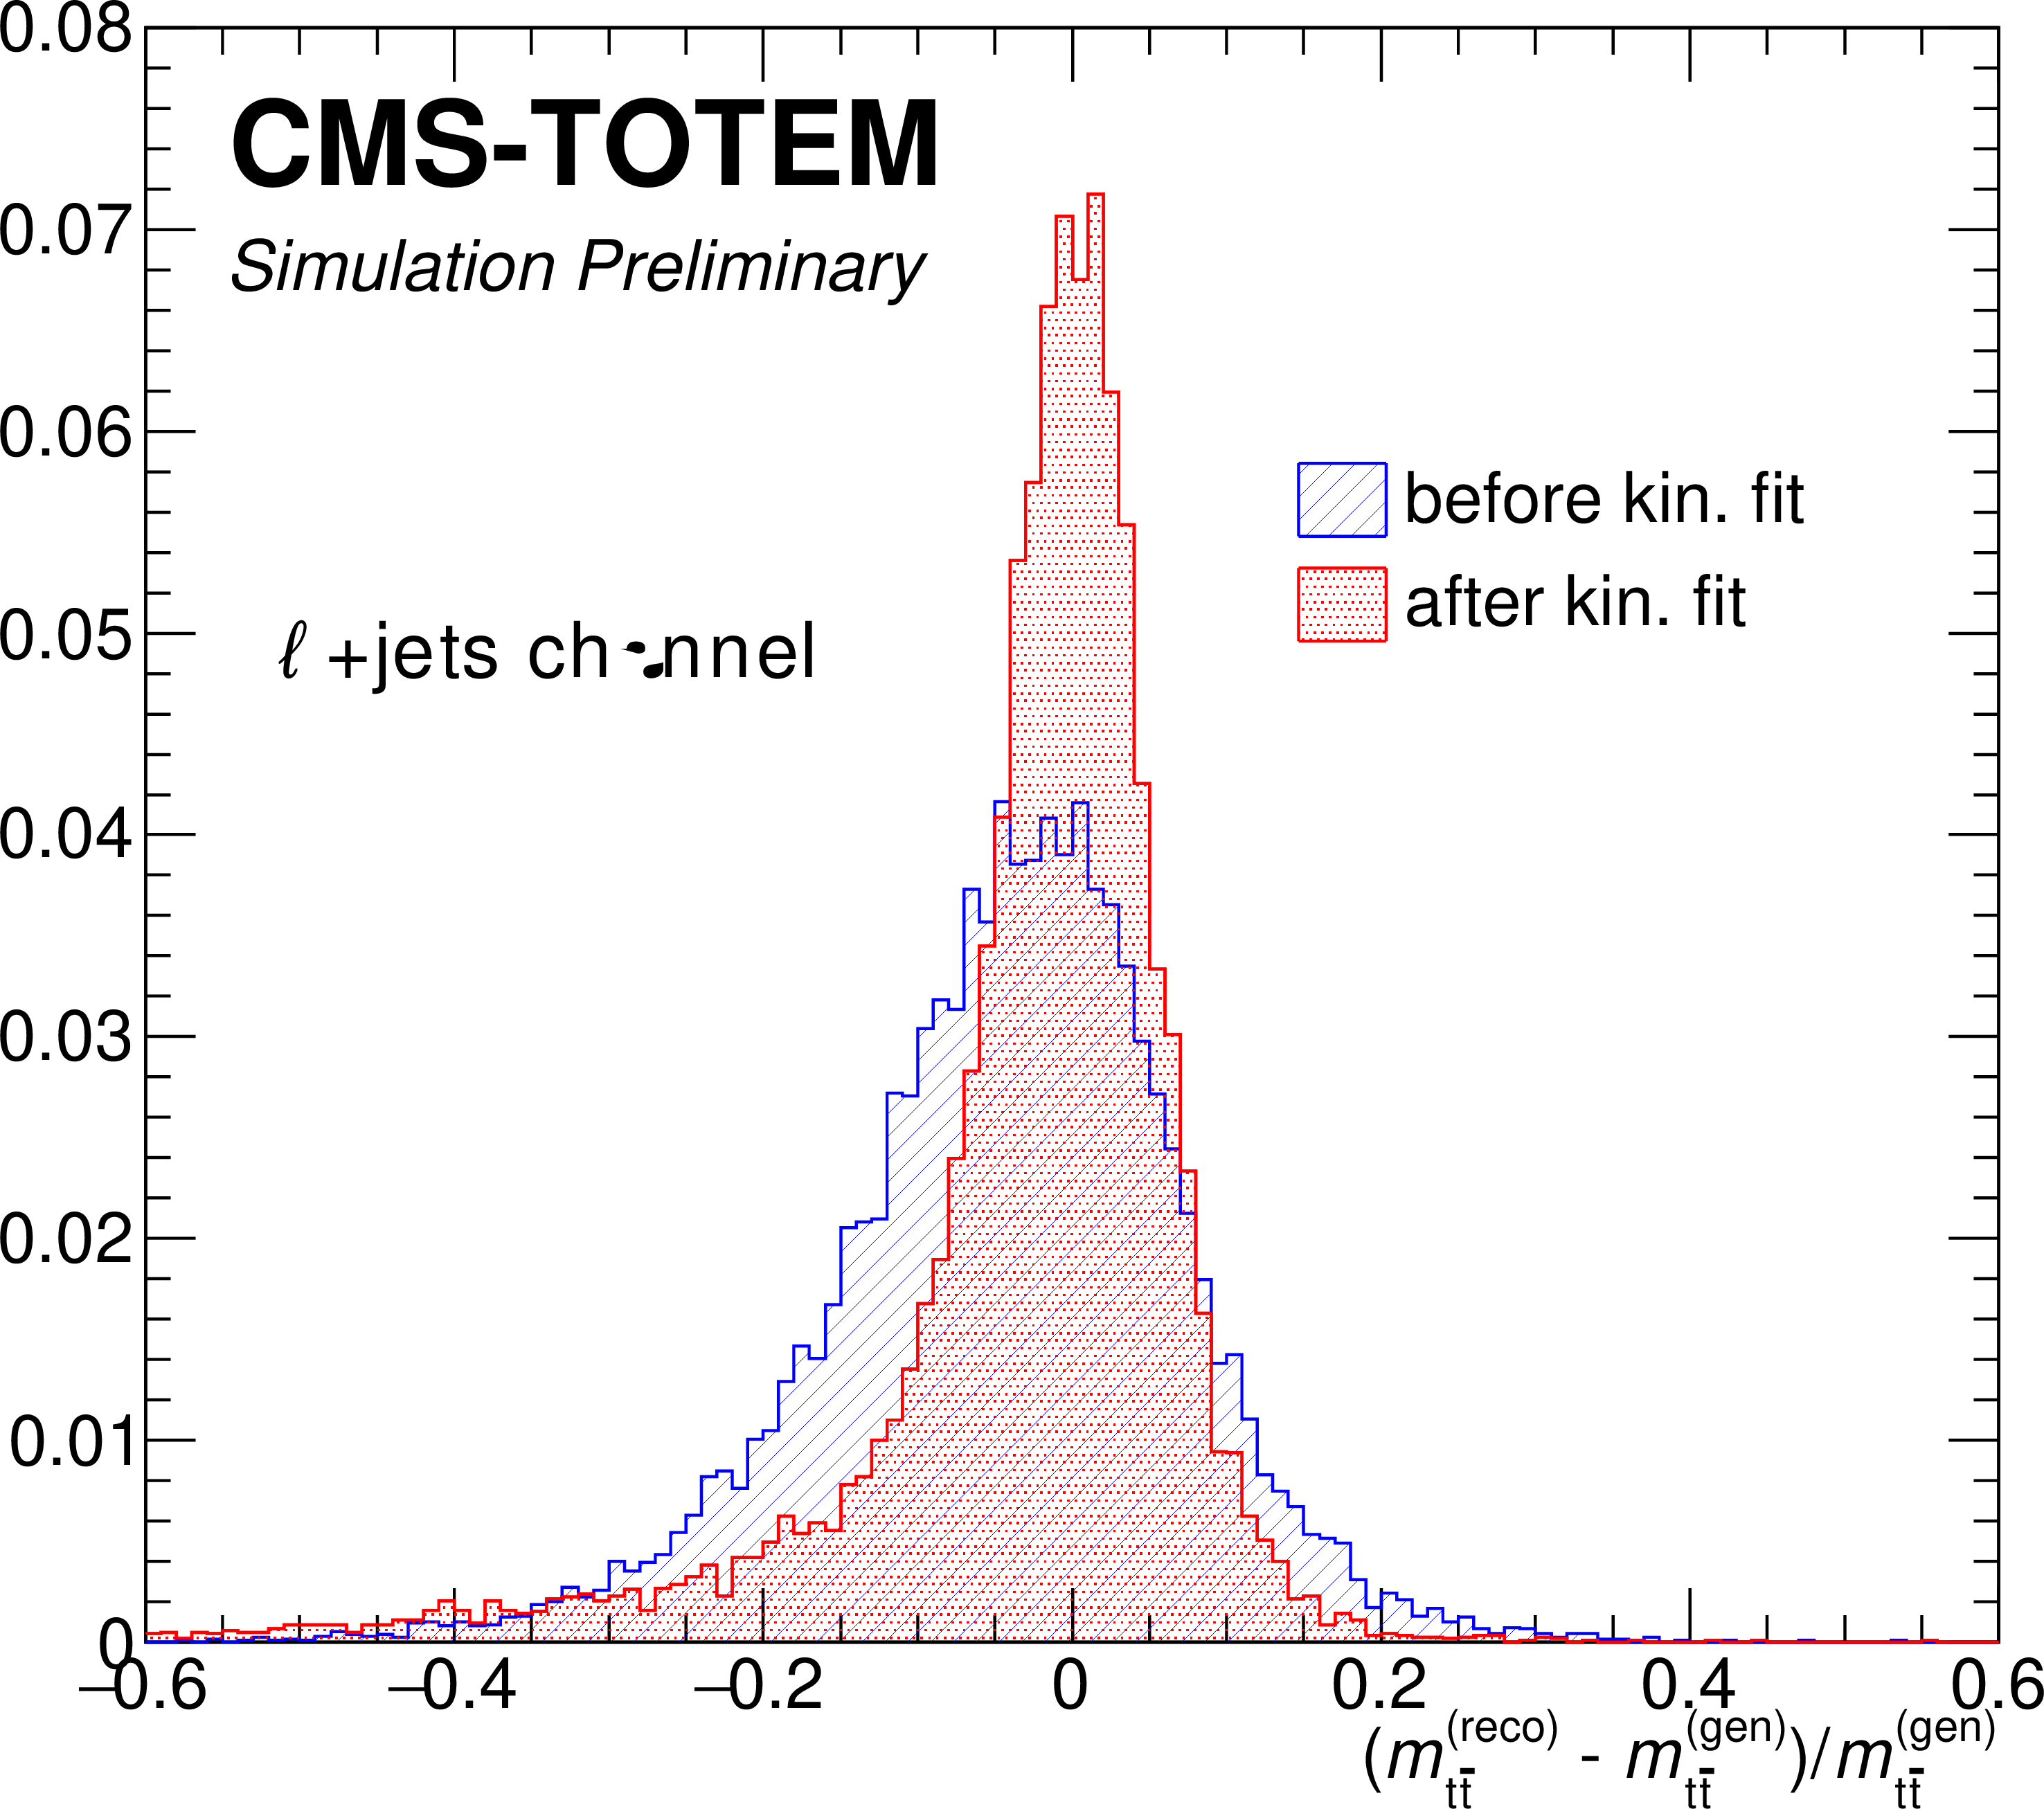
Normalised distribution of the relative invariant mass resolution of the reconstructed ${\mathrm{t} {}\mathrm{\bar{t}}}$ system for the dilepton (left) and $\ell $+jets (right) analyses. For the $\ell $+jets mode, the hatched blue and dotted red histograms represent the distribution before and after applying the kinematic fit, respectively. |
png pdf |
Figure 3-a:
Normalised distribution of the relative invariant mass resolution of the reconstructed ${\mathrm{t} {}\mathrm{\bar{t}}}$ system for the dilepton (left) and $\ell $+jets (right) analyses. For the $\ell $+jets mode, the hatched blue and dotted red histograms represent the distribution before and after applying the kinematic fit, respectively. |
png pdf |
Figure 3-b:
Normalised distribution of the relative invariant mass resolution of the reconstructed ${\mathrm{t} {}\mathrm{\bar{t}}}$ system for the dilepton (left) and $\ell $+jets (right) analyses. For the $\ell $+jets mode, the hatched blue and dotted red histograms represent the distribution before and after applying the kinematic fit, respectively. |
png pdf |
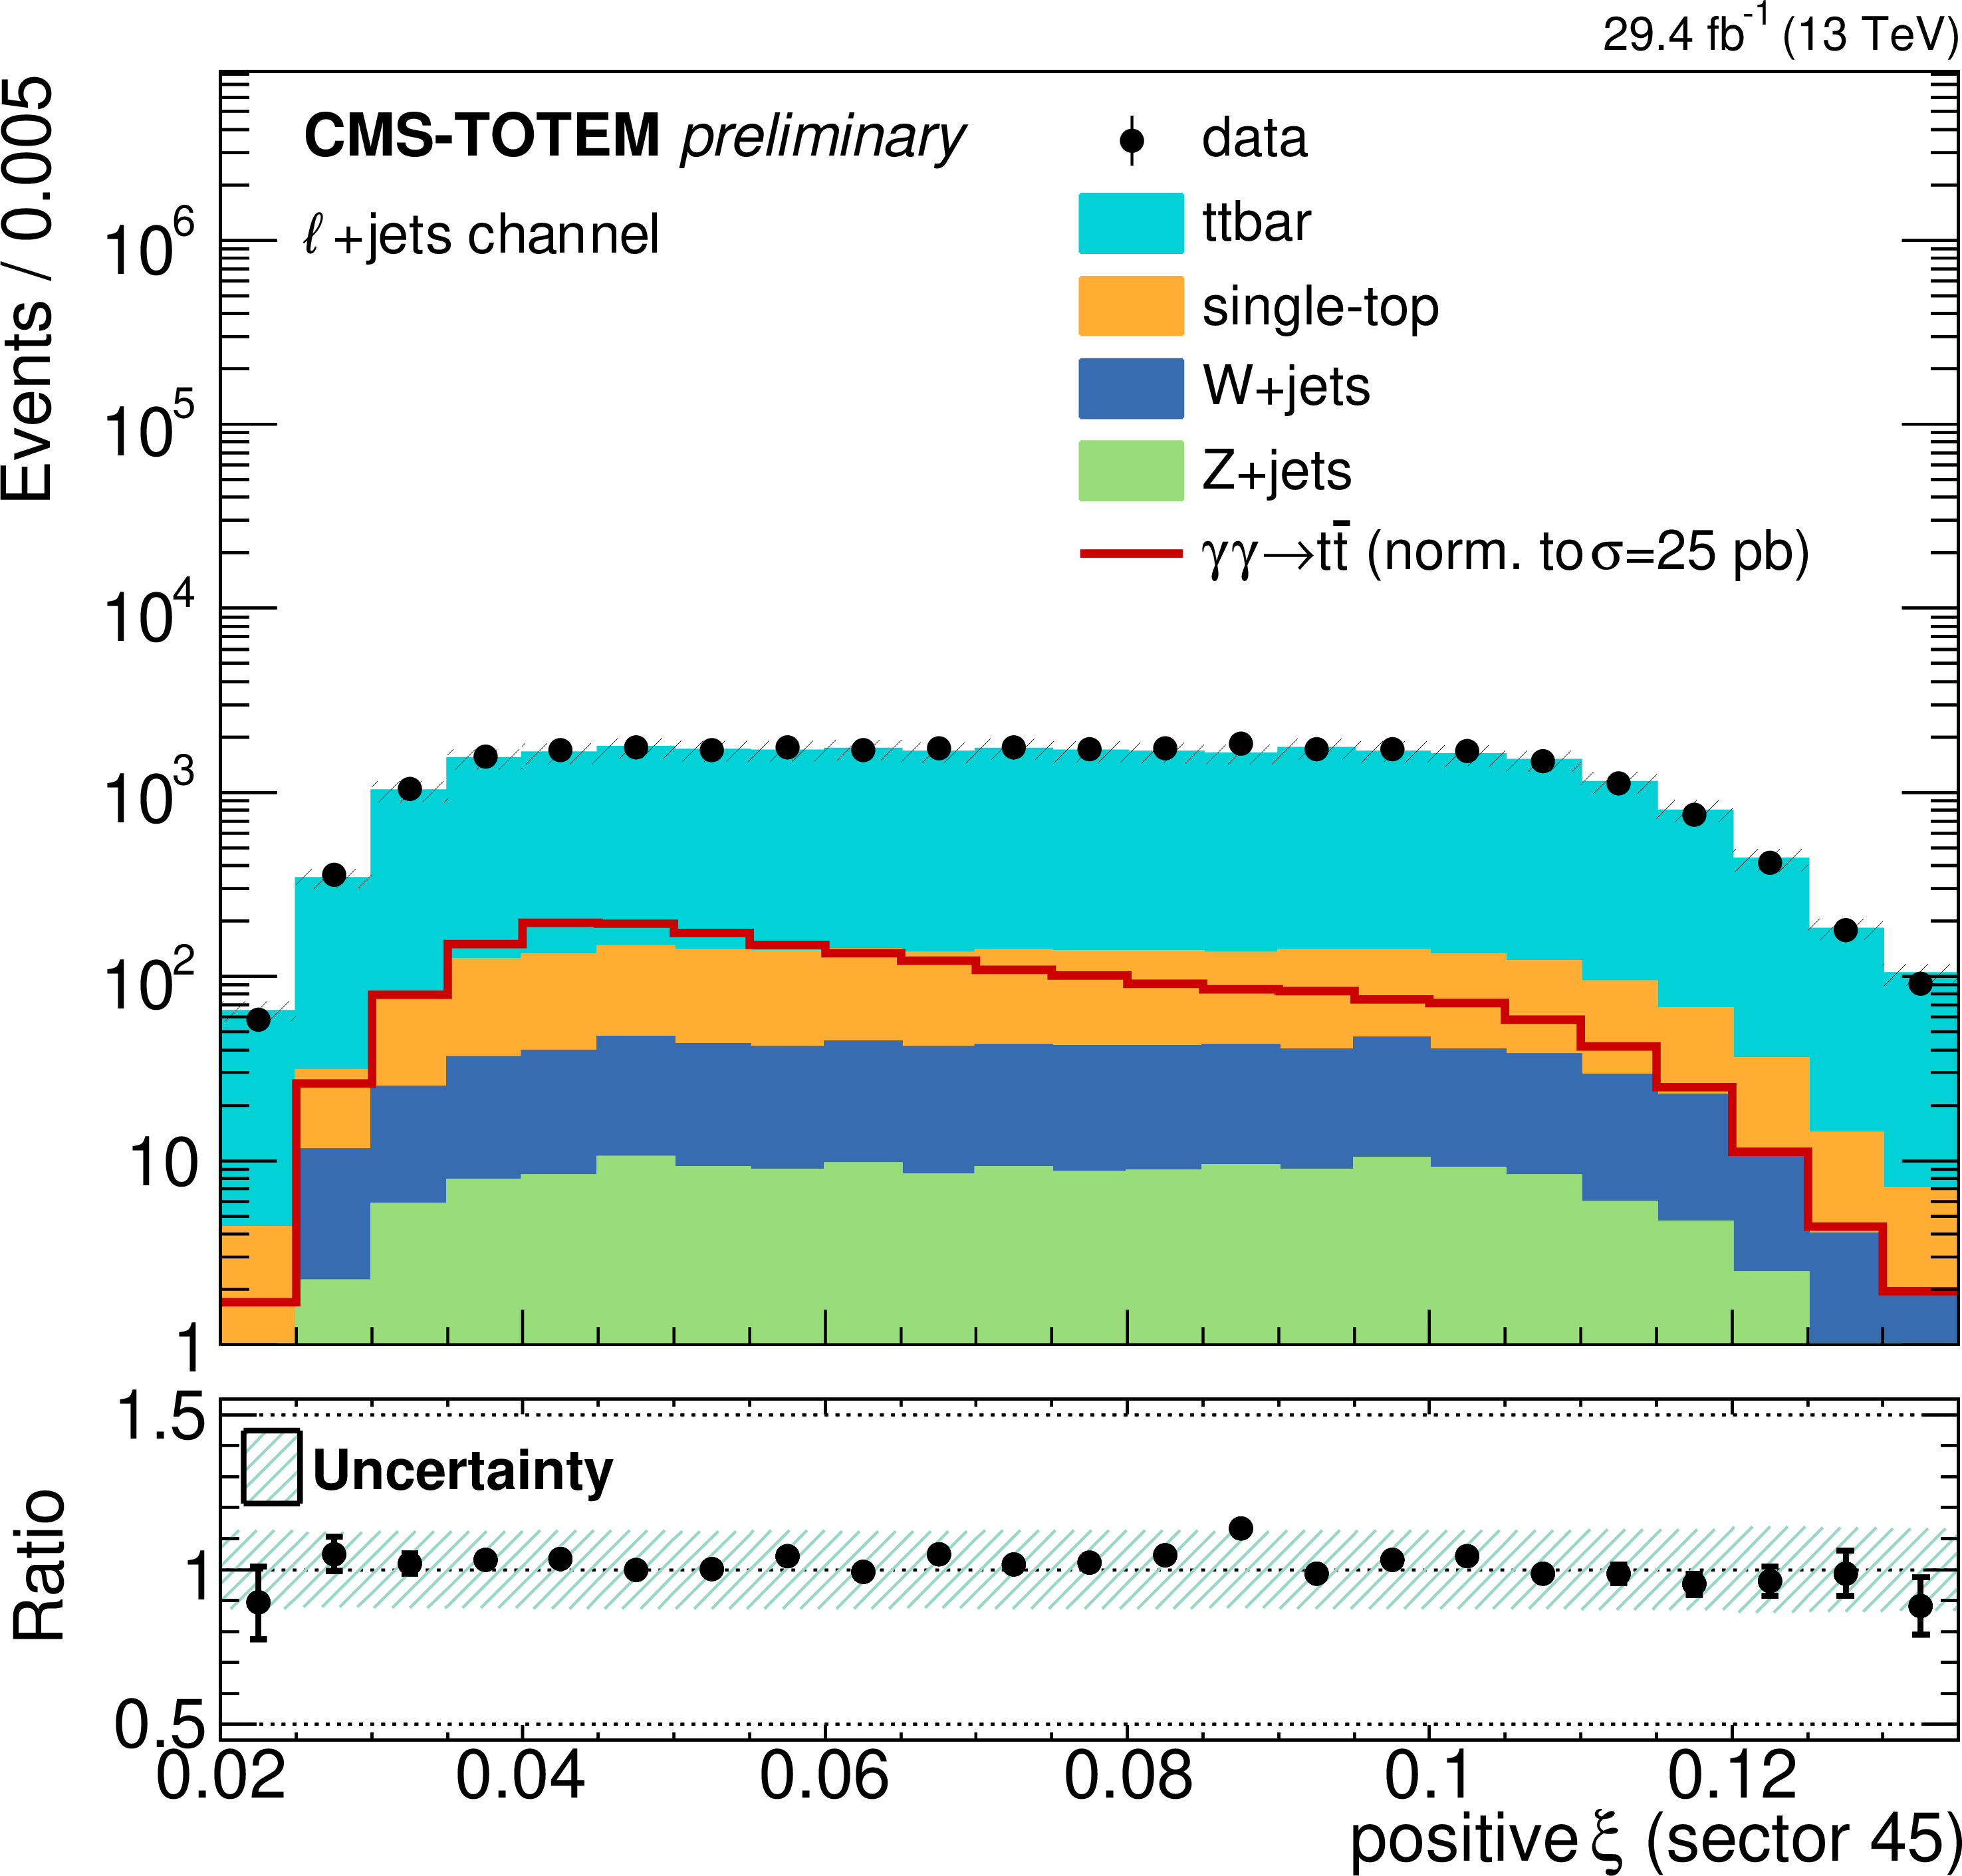
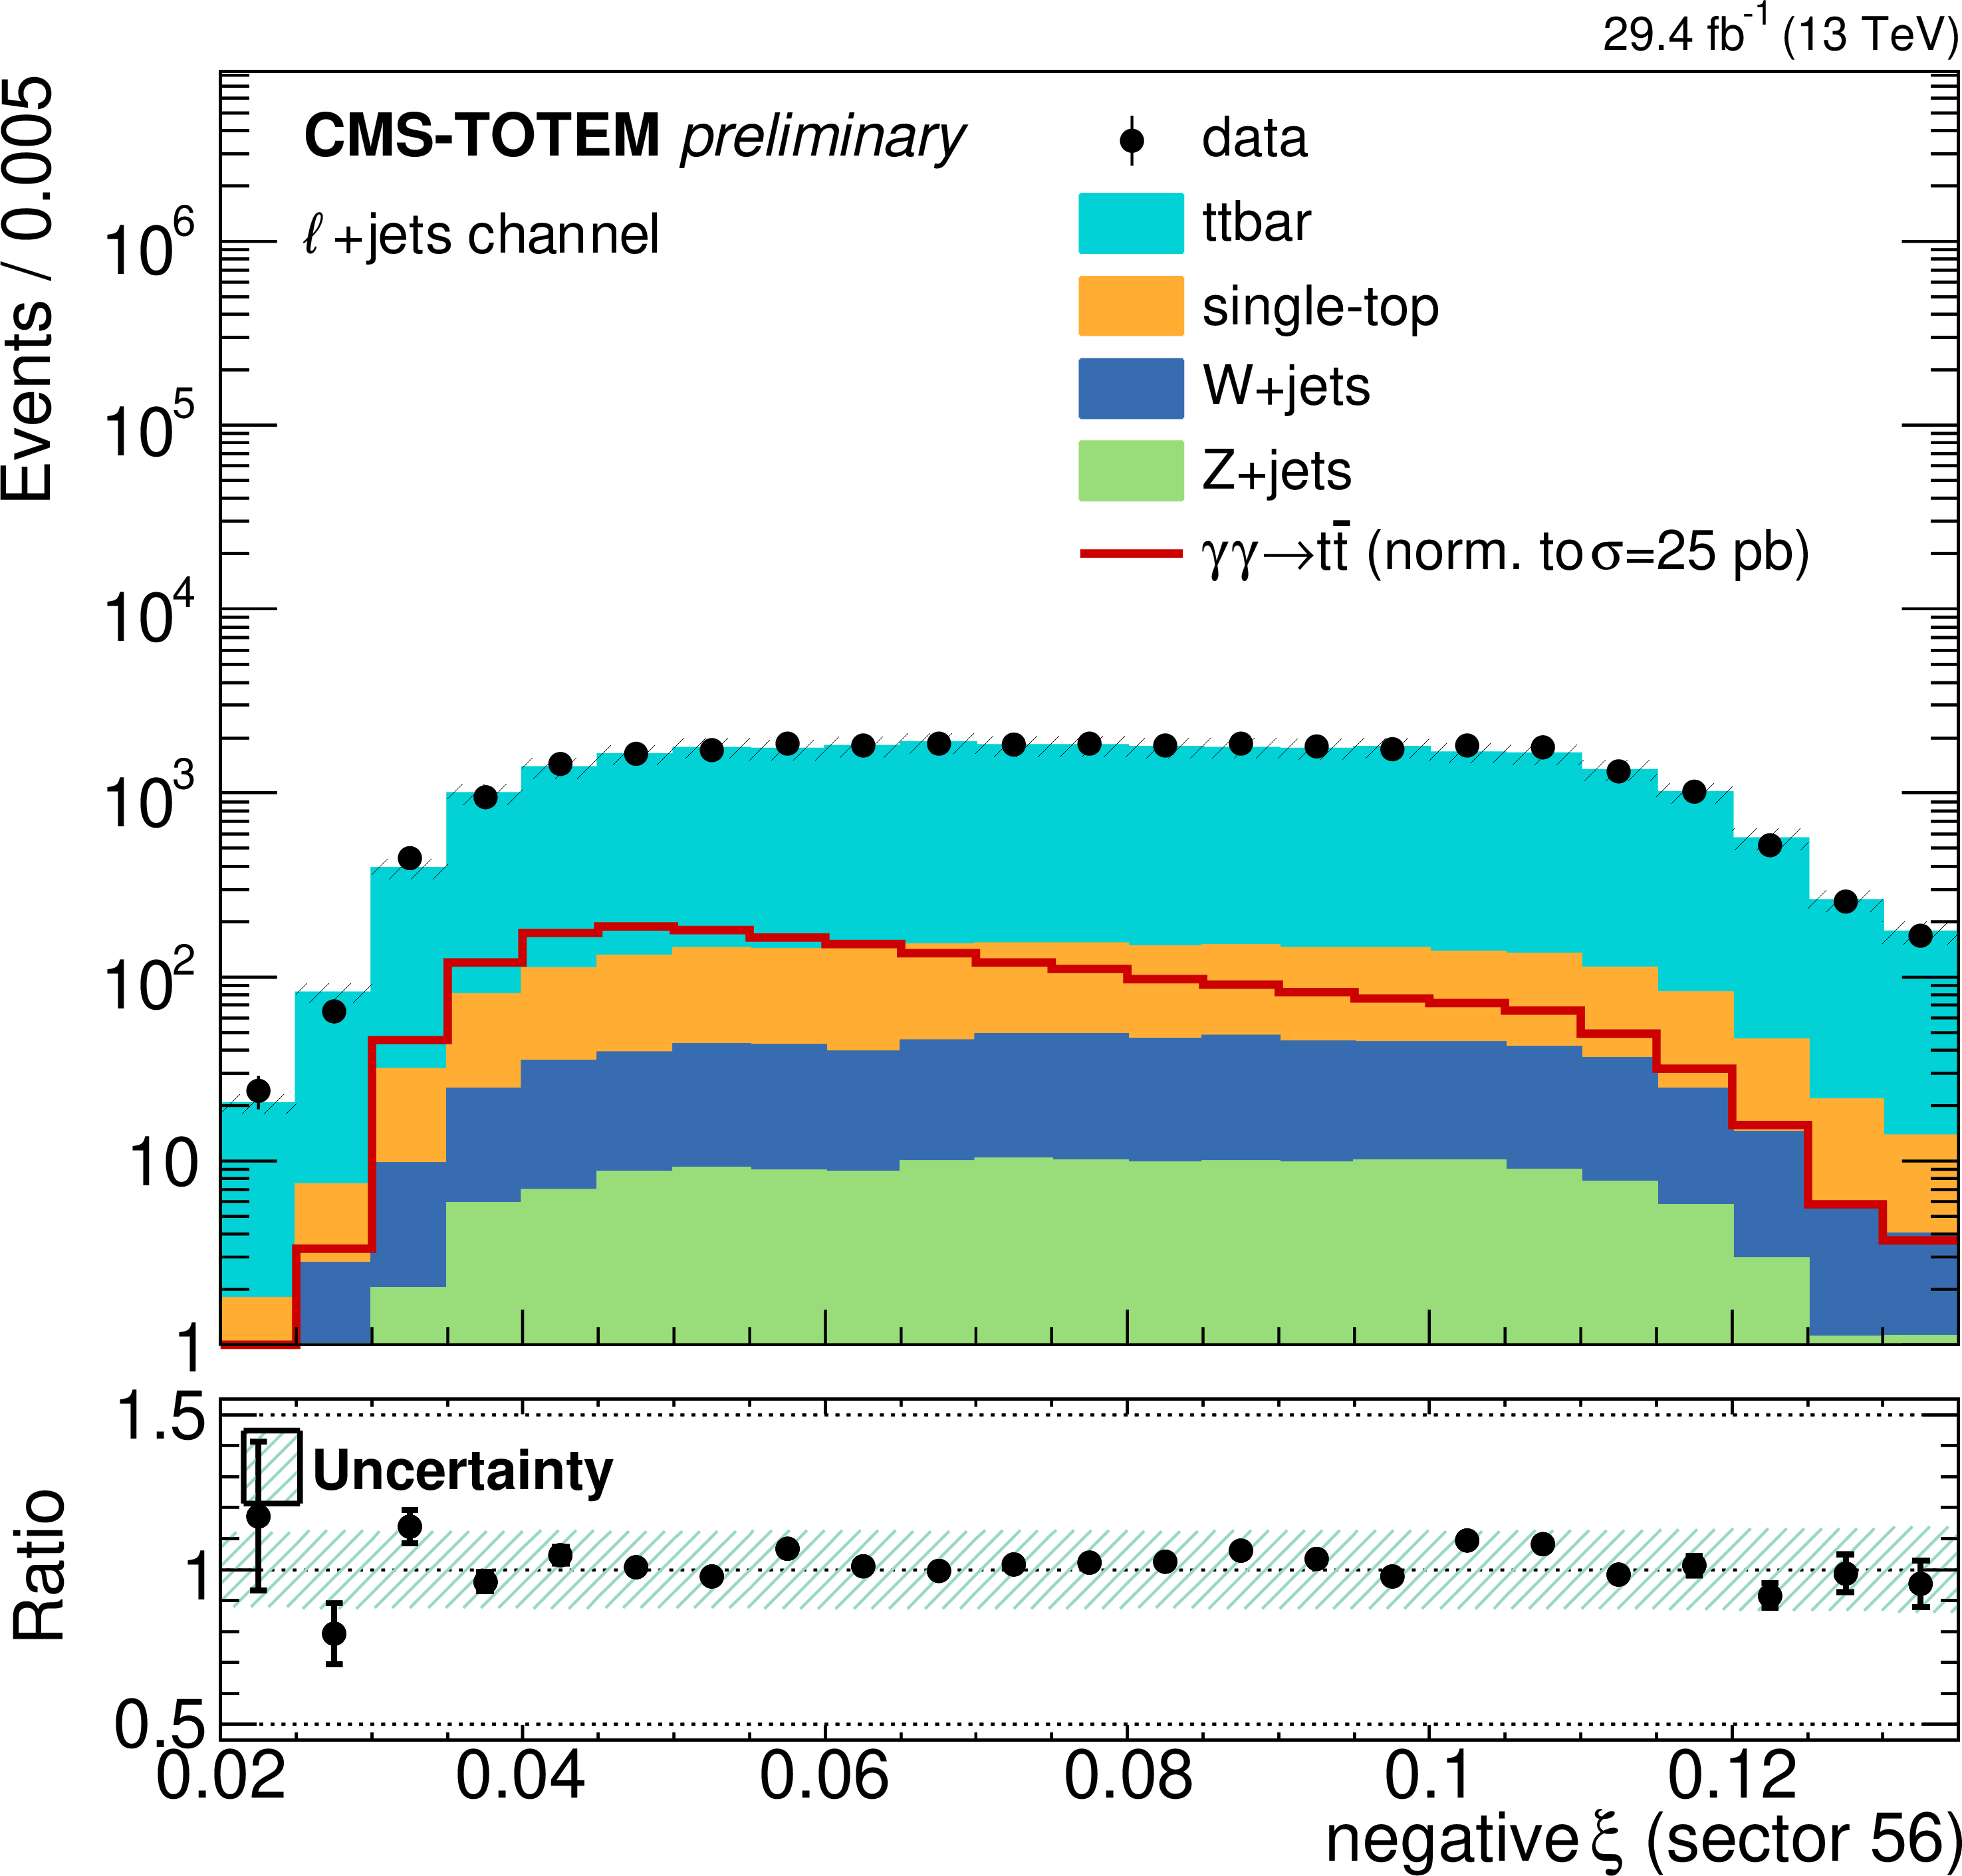
Figure 4:
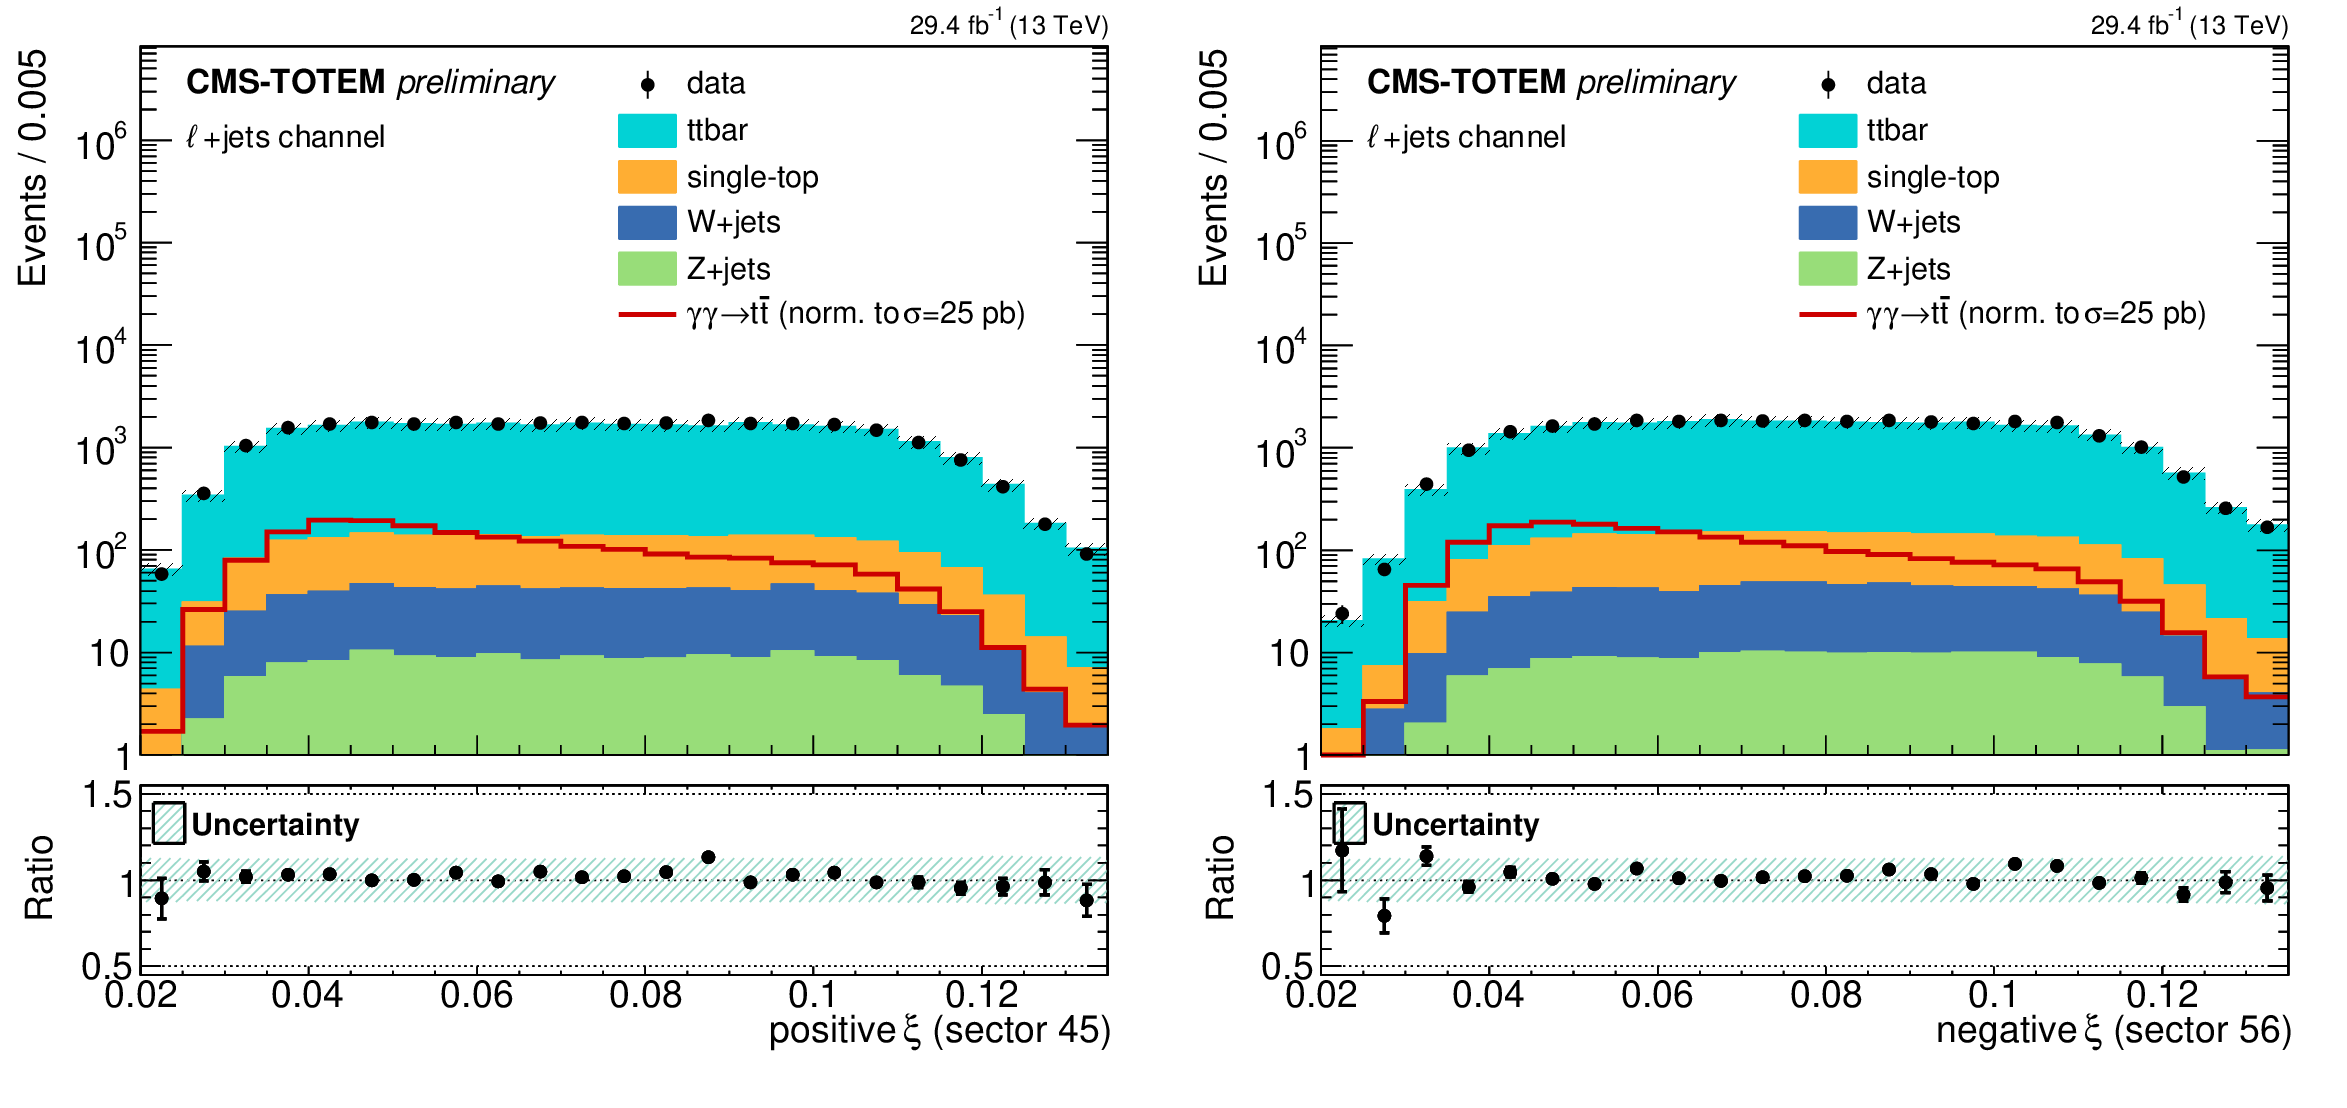
Distribution of the proton fractional momentum loss $\xi $ in data and background simulated samples after pileup proton mixing and pileup reweighting, in the $\ell $ + jets channel. Solid histograms: background; open histogram: signal, normalised to a cross section of 25 pb, approximately 10$^5$ larger than the SM cross section prediction from [18]; points with error bars: data. |
png pdf |
Figure 4-a:
Distribution of the proton fractional momentum loss $\xi $ in data and background simulated samples after pileup proton mixing and pileup reweighting, in the $\ell $ + jets channel. Solid histograms: background; open histogram: signal, normalised to a cross section of 25 pb, approximately 10$^5$ larger than the SM cross section prediction from [18]; points with error bars: data. |
png pdf |
Figure 4-b:
Distribution of the proton fractional momentum loss $\xi $ in data and background simulated samples after pileup proton mixing and pileup reweighting, in the $\ell $ + jets channel. Solid histograms: background; open histogram: signal, normalised to a cross section of 25 pb, approximately 10$^5$ larger than the SM cross section prediction from [18]; points with error bars: data. |
png pdf |
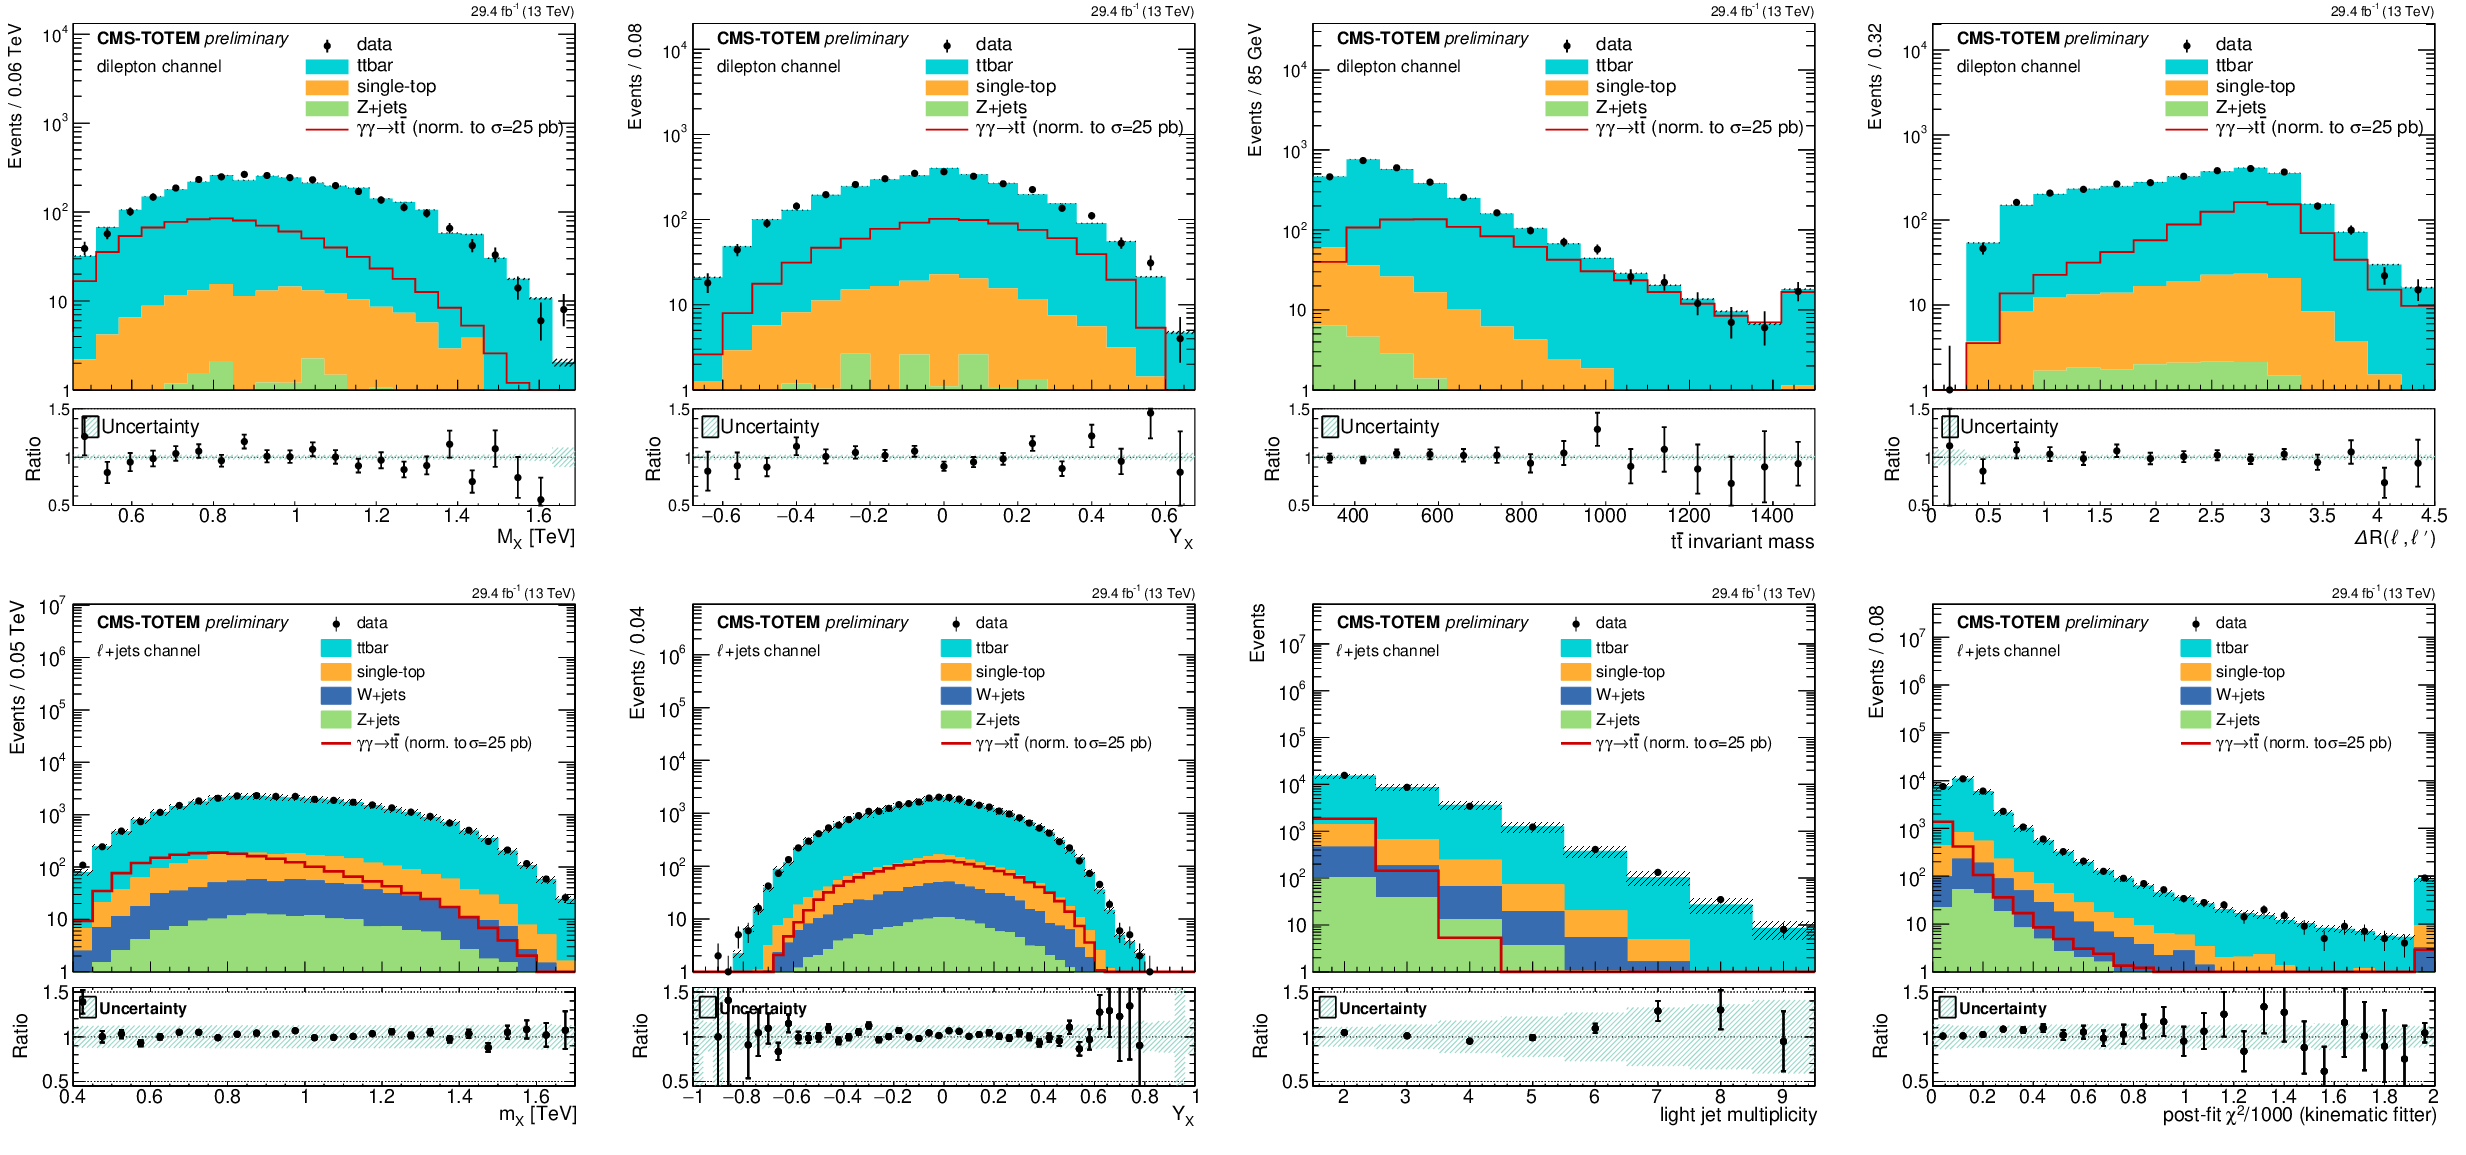
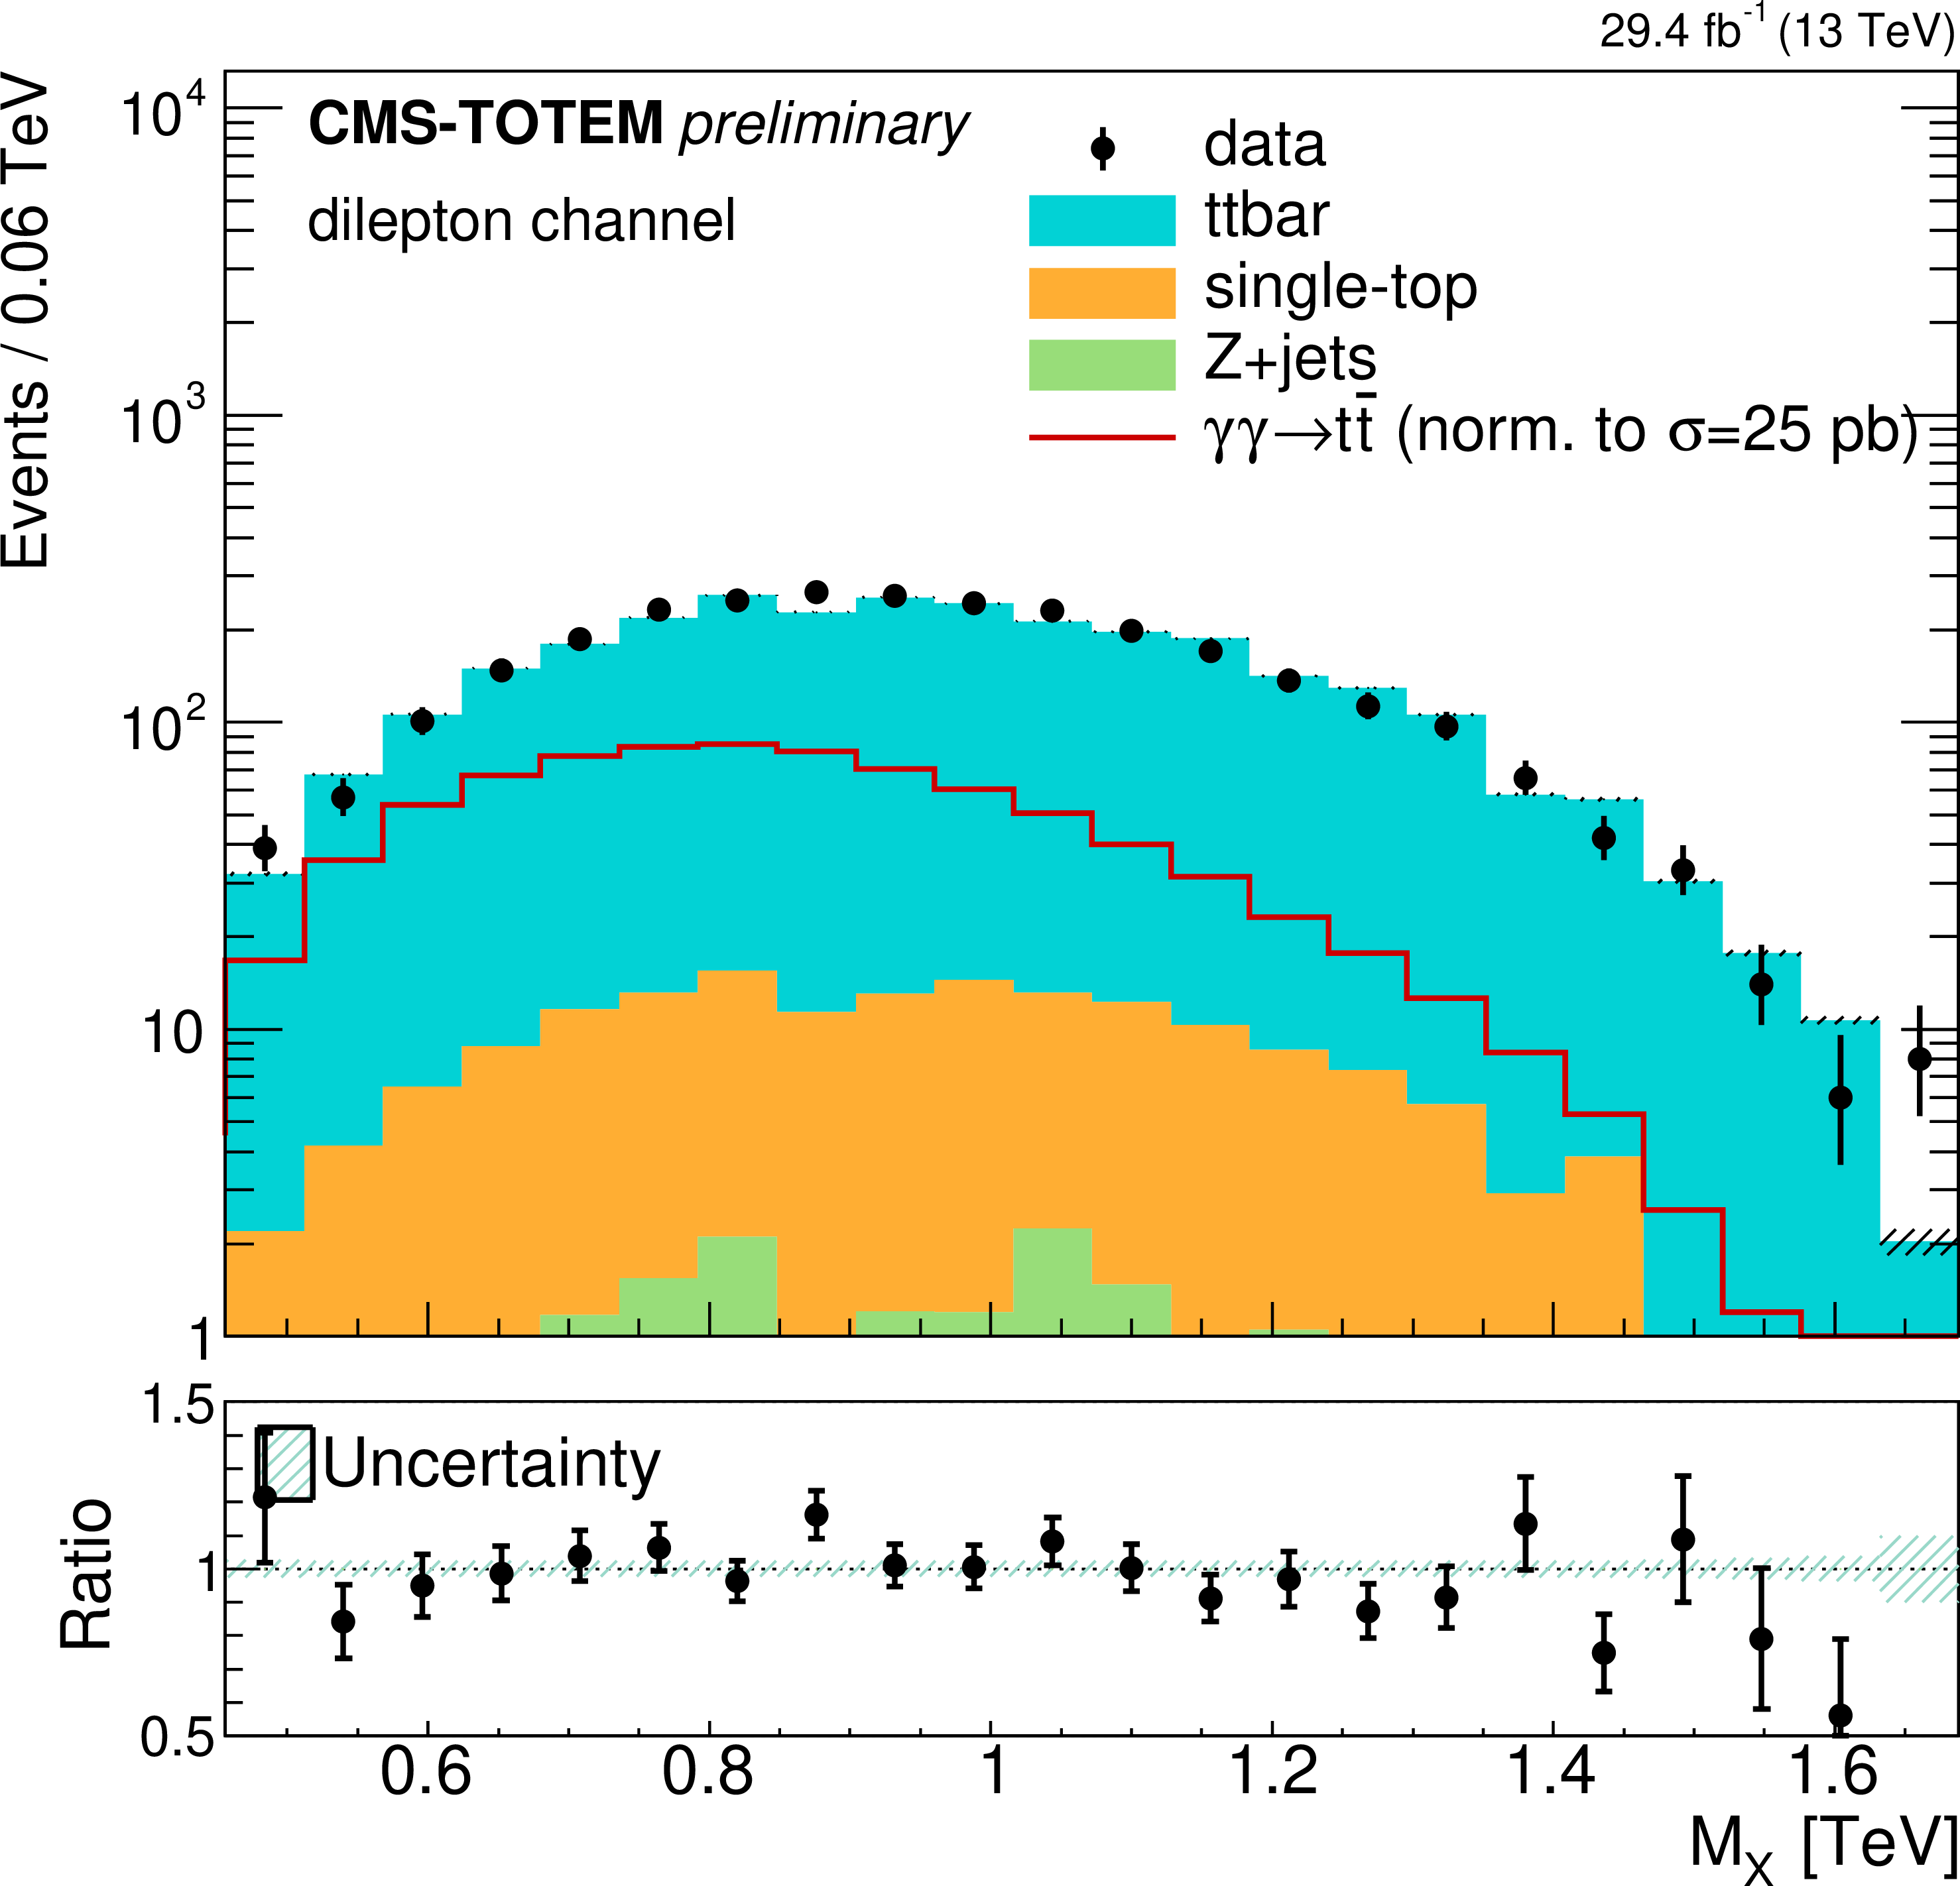
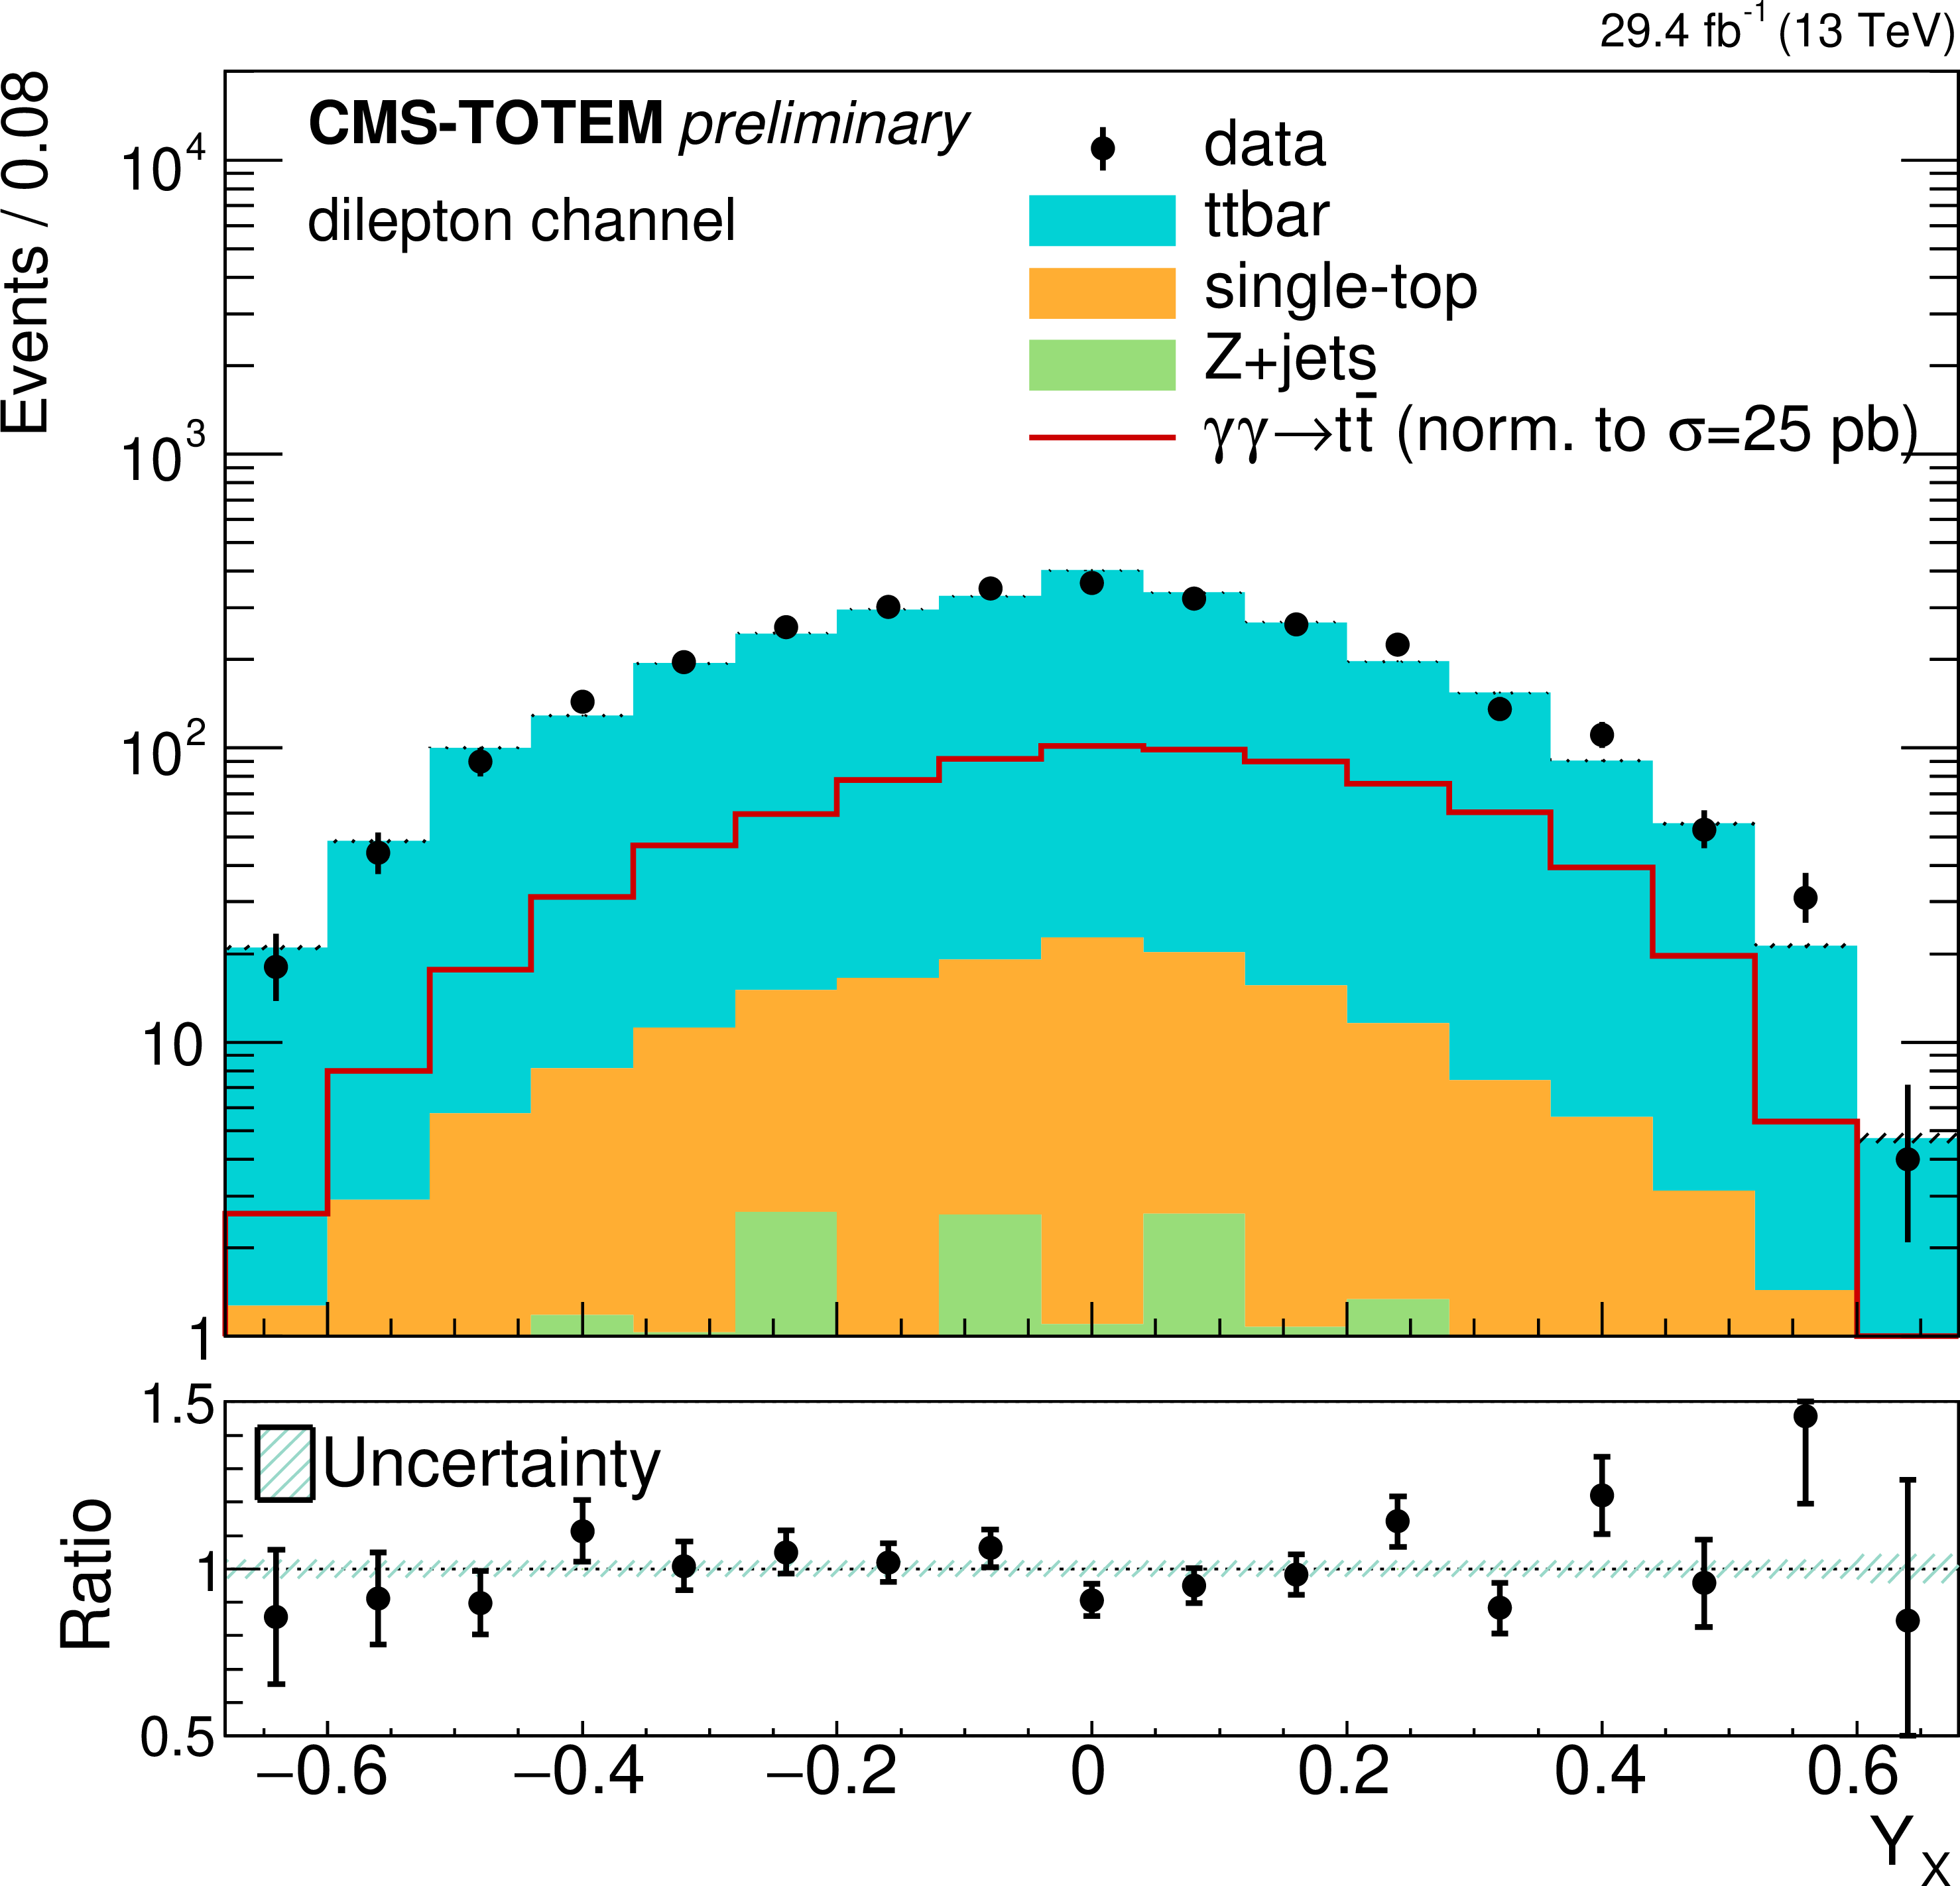
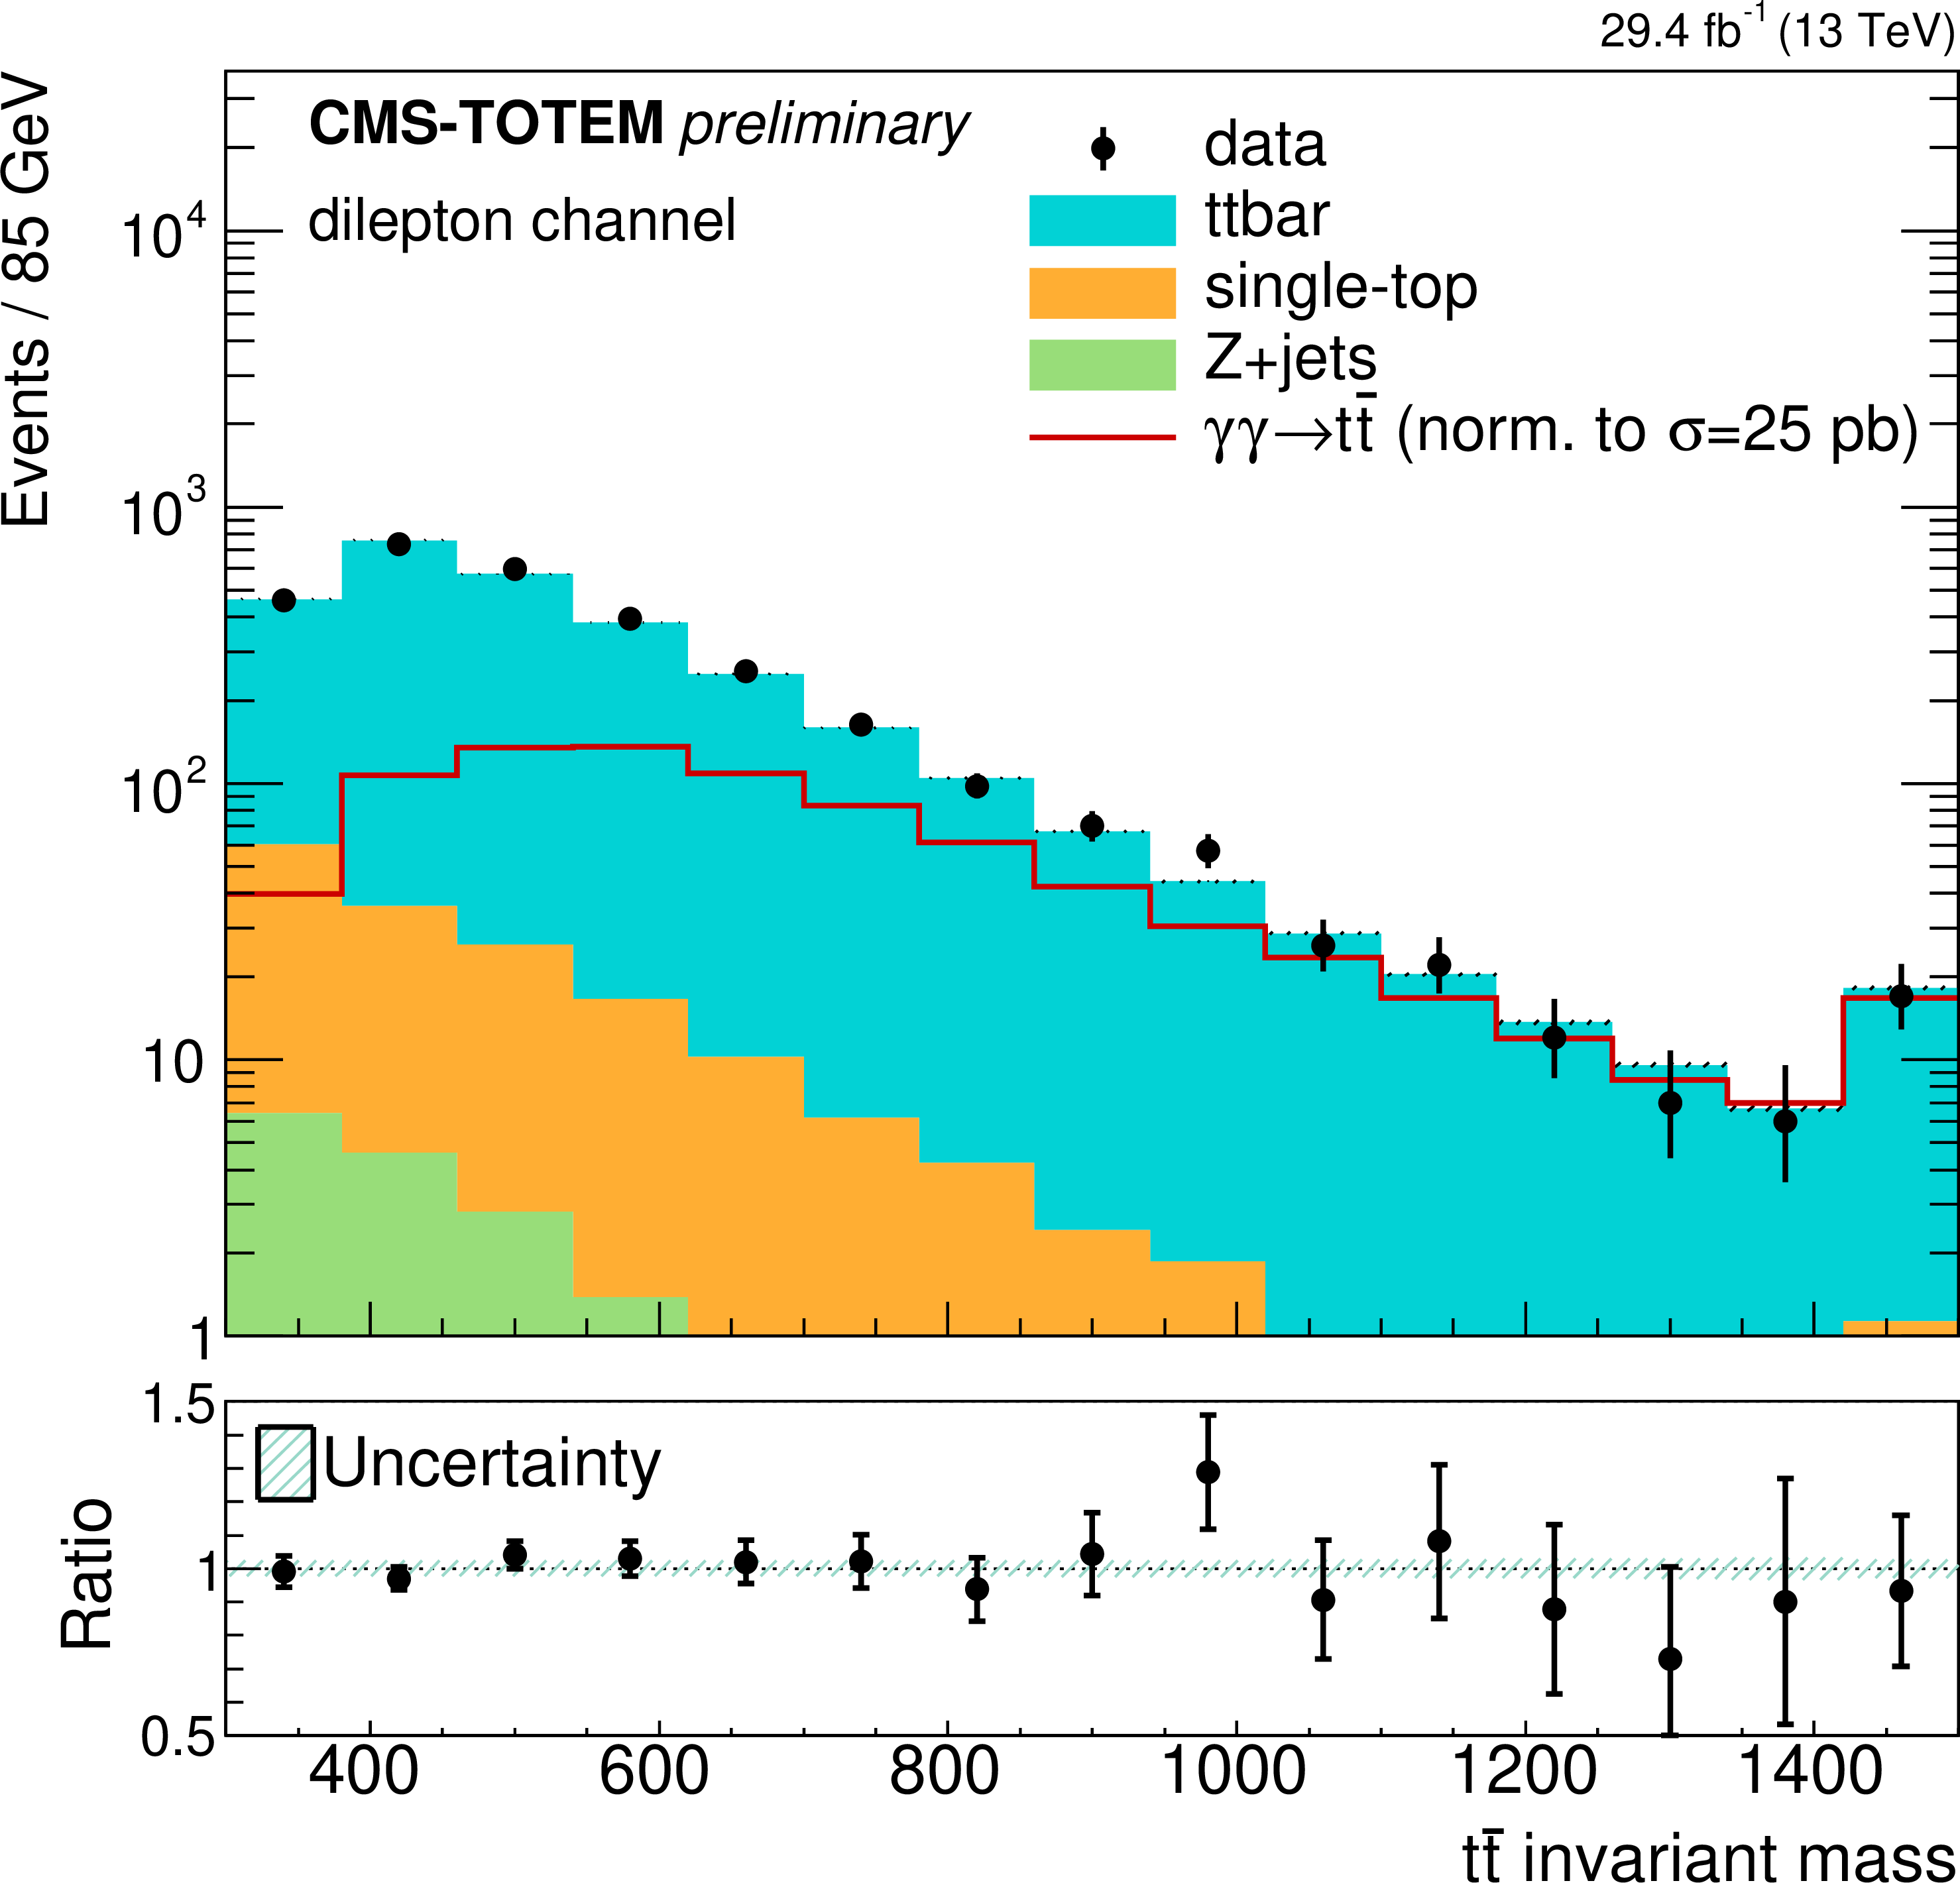
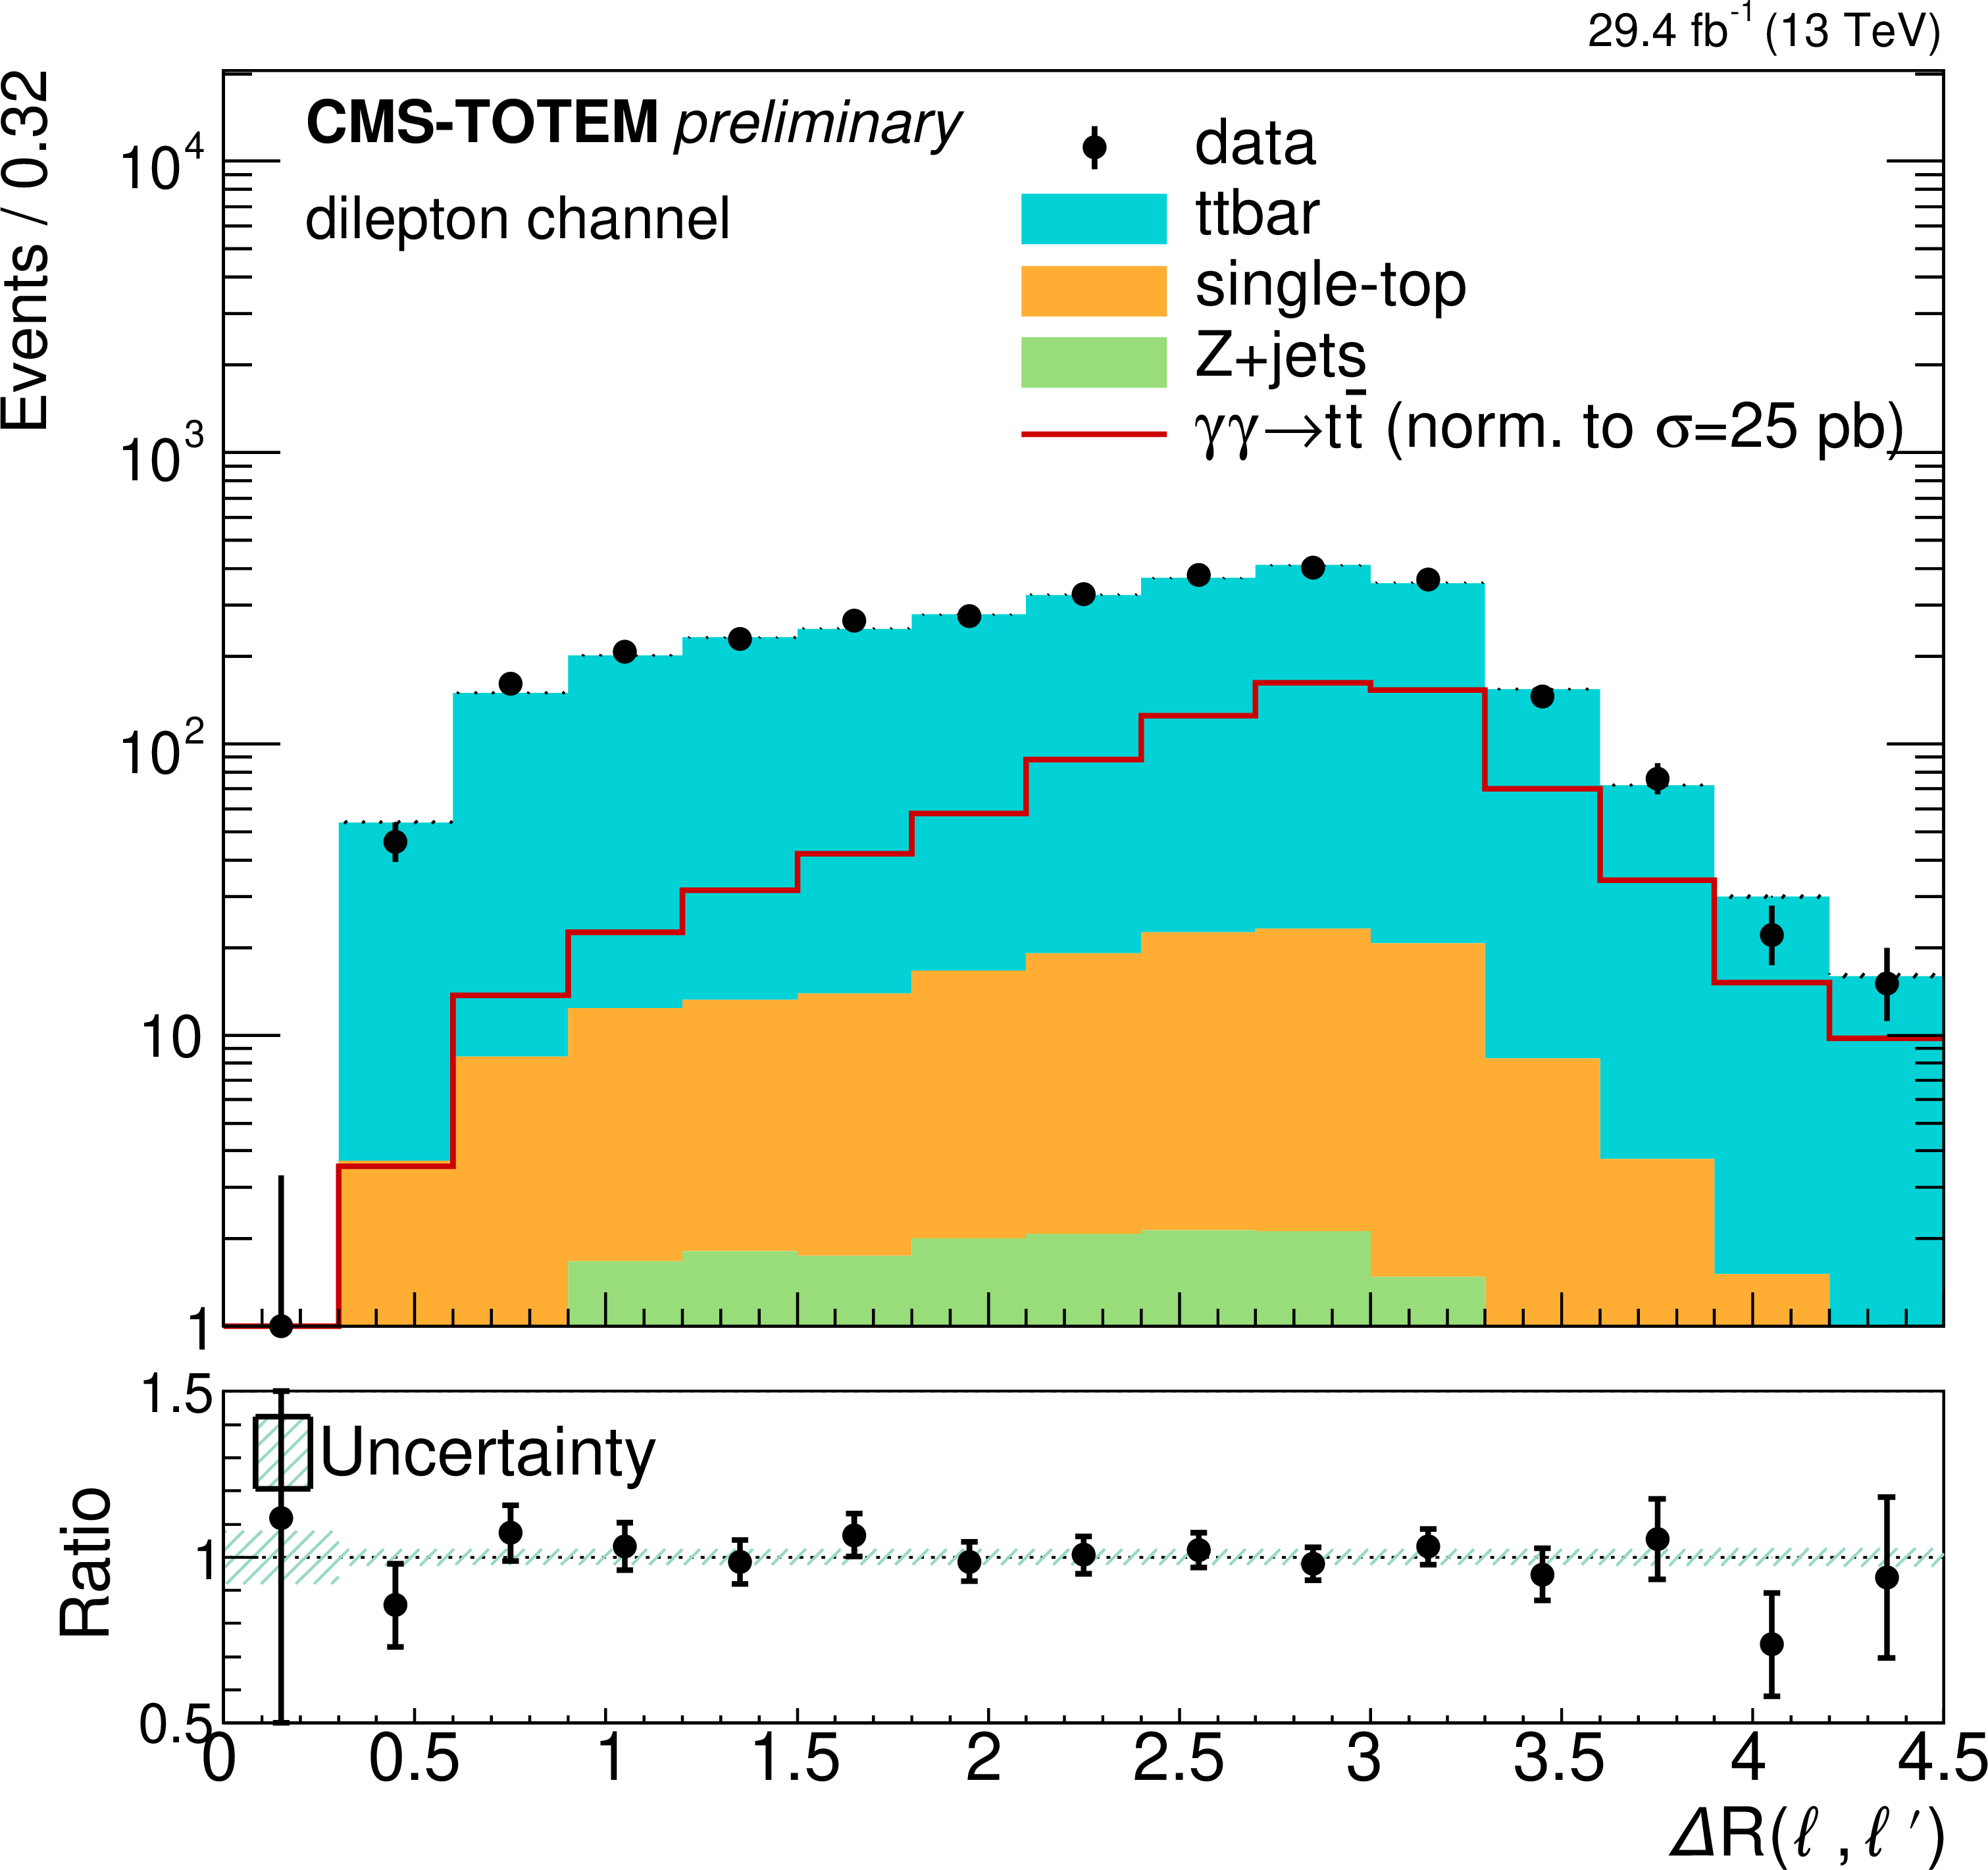
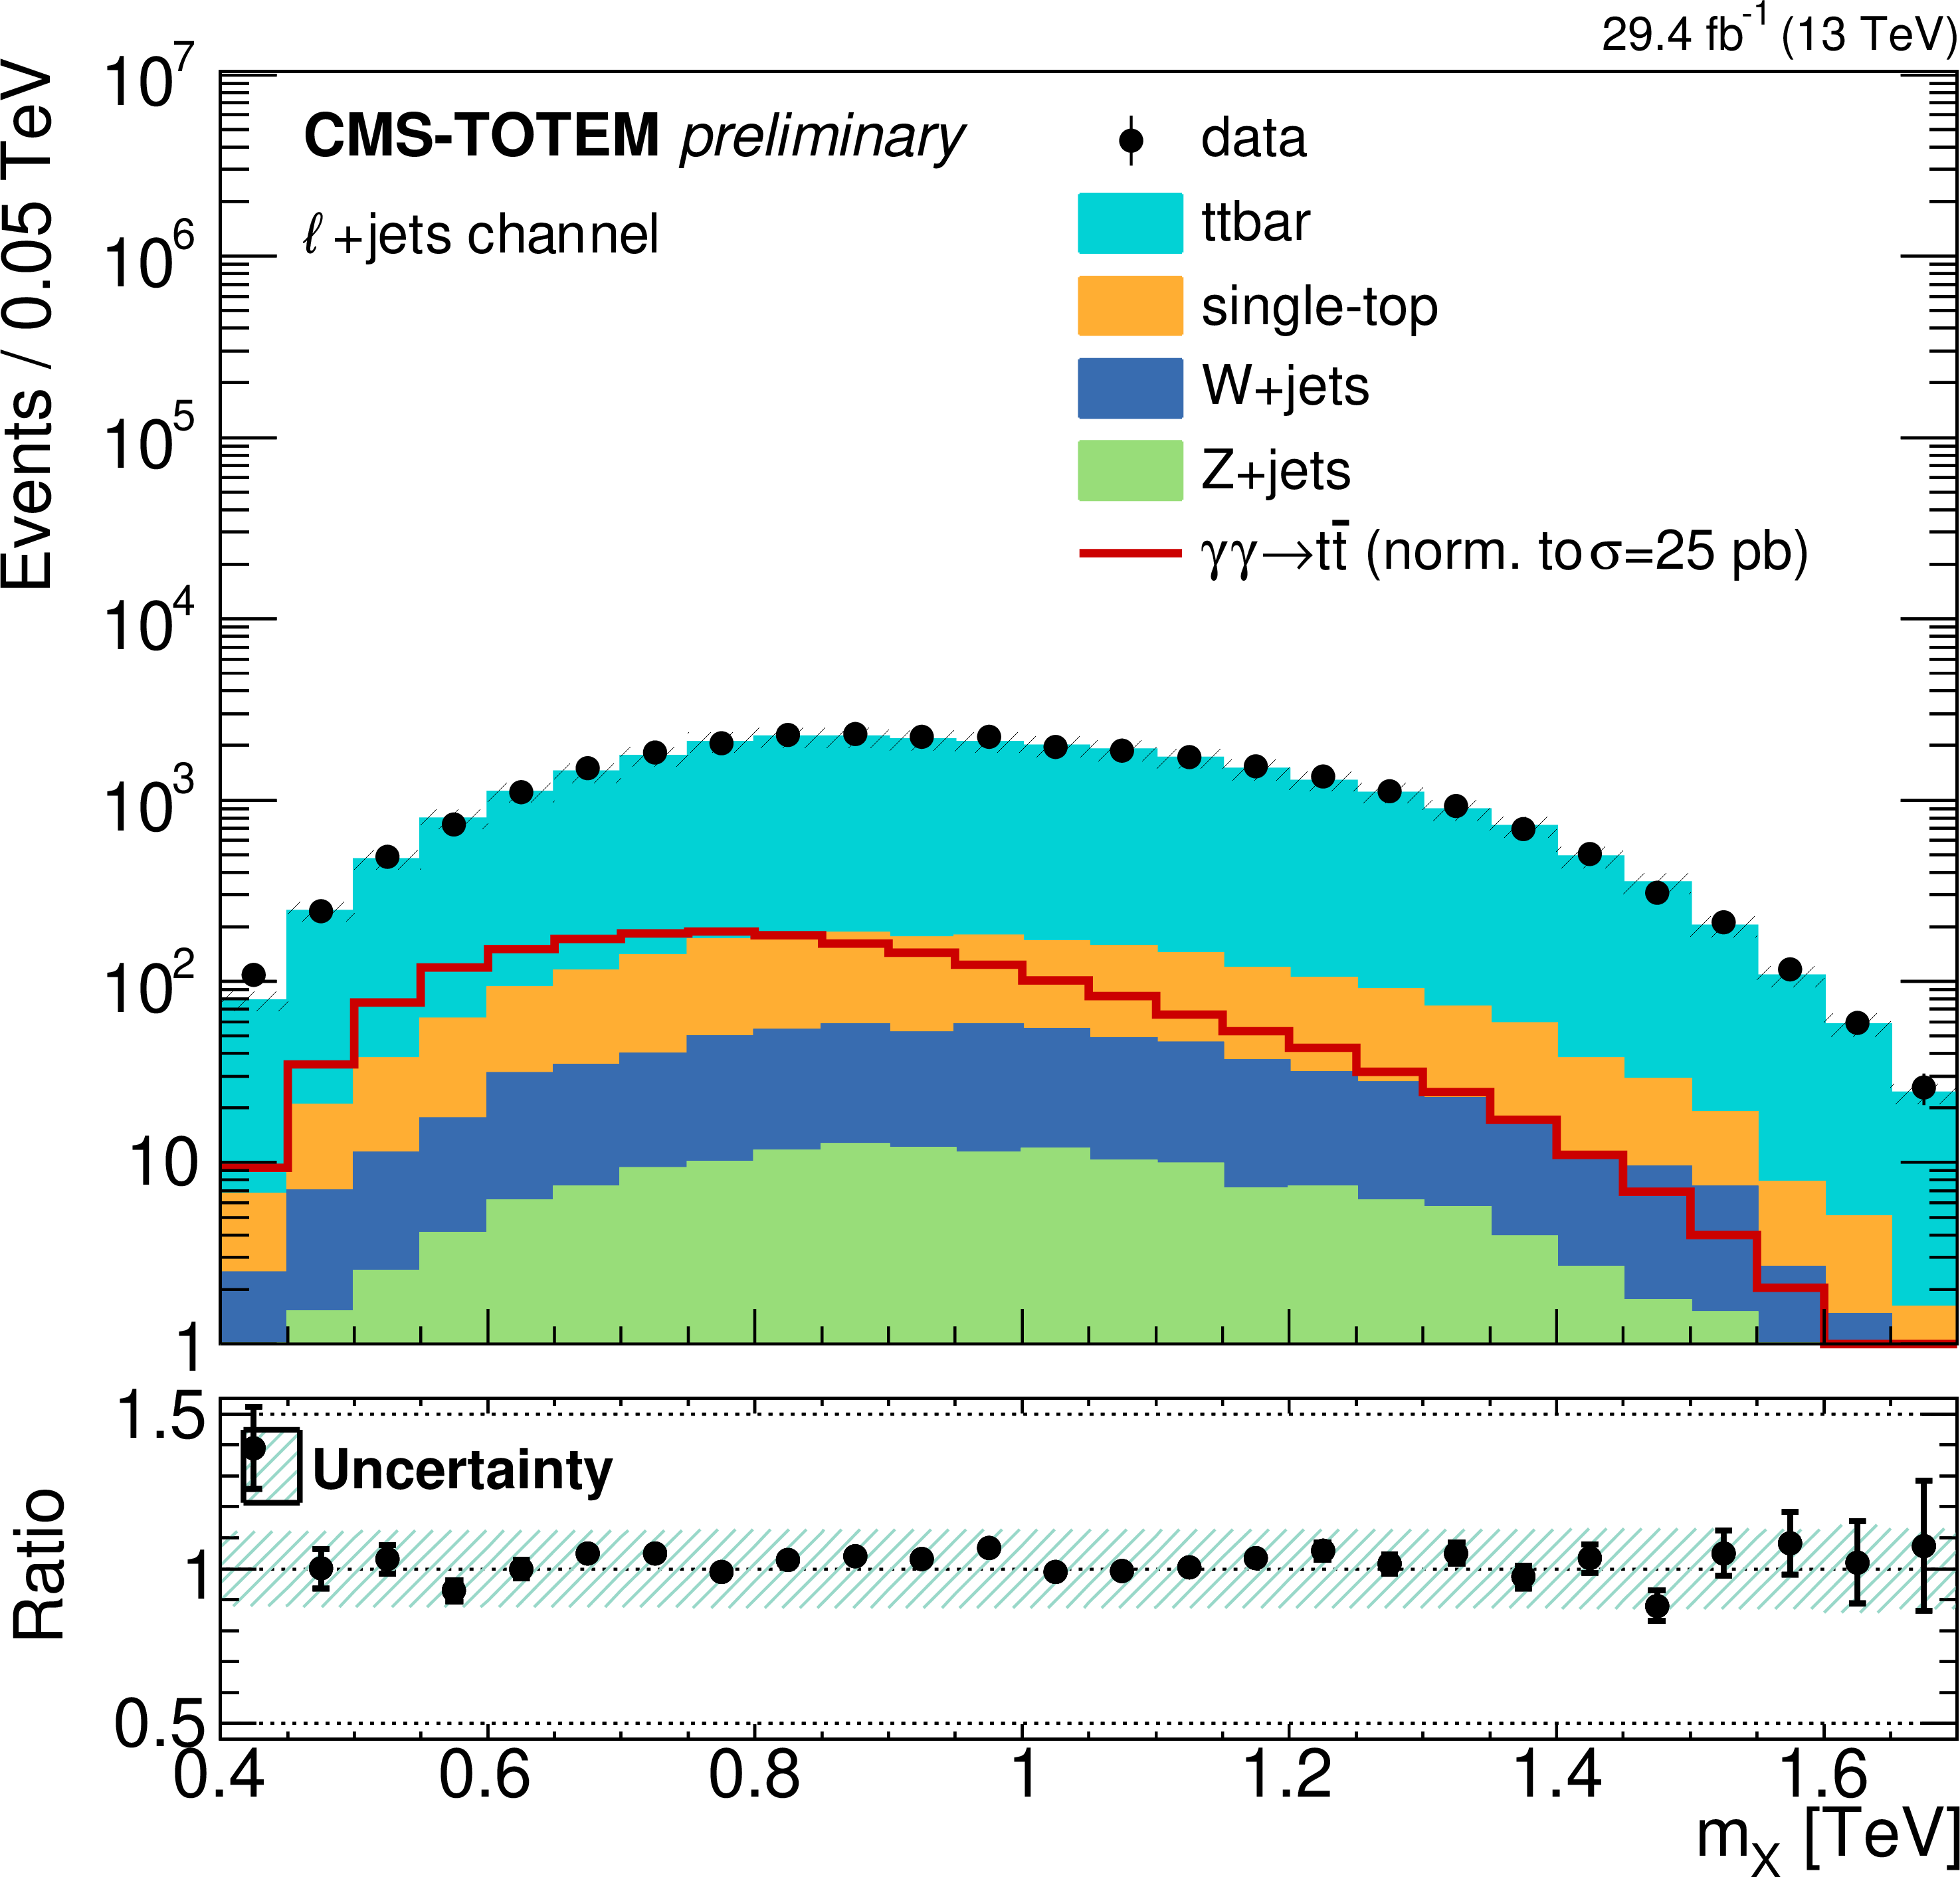
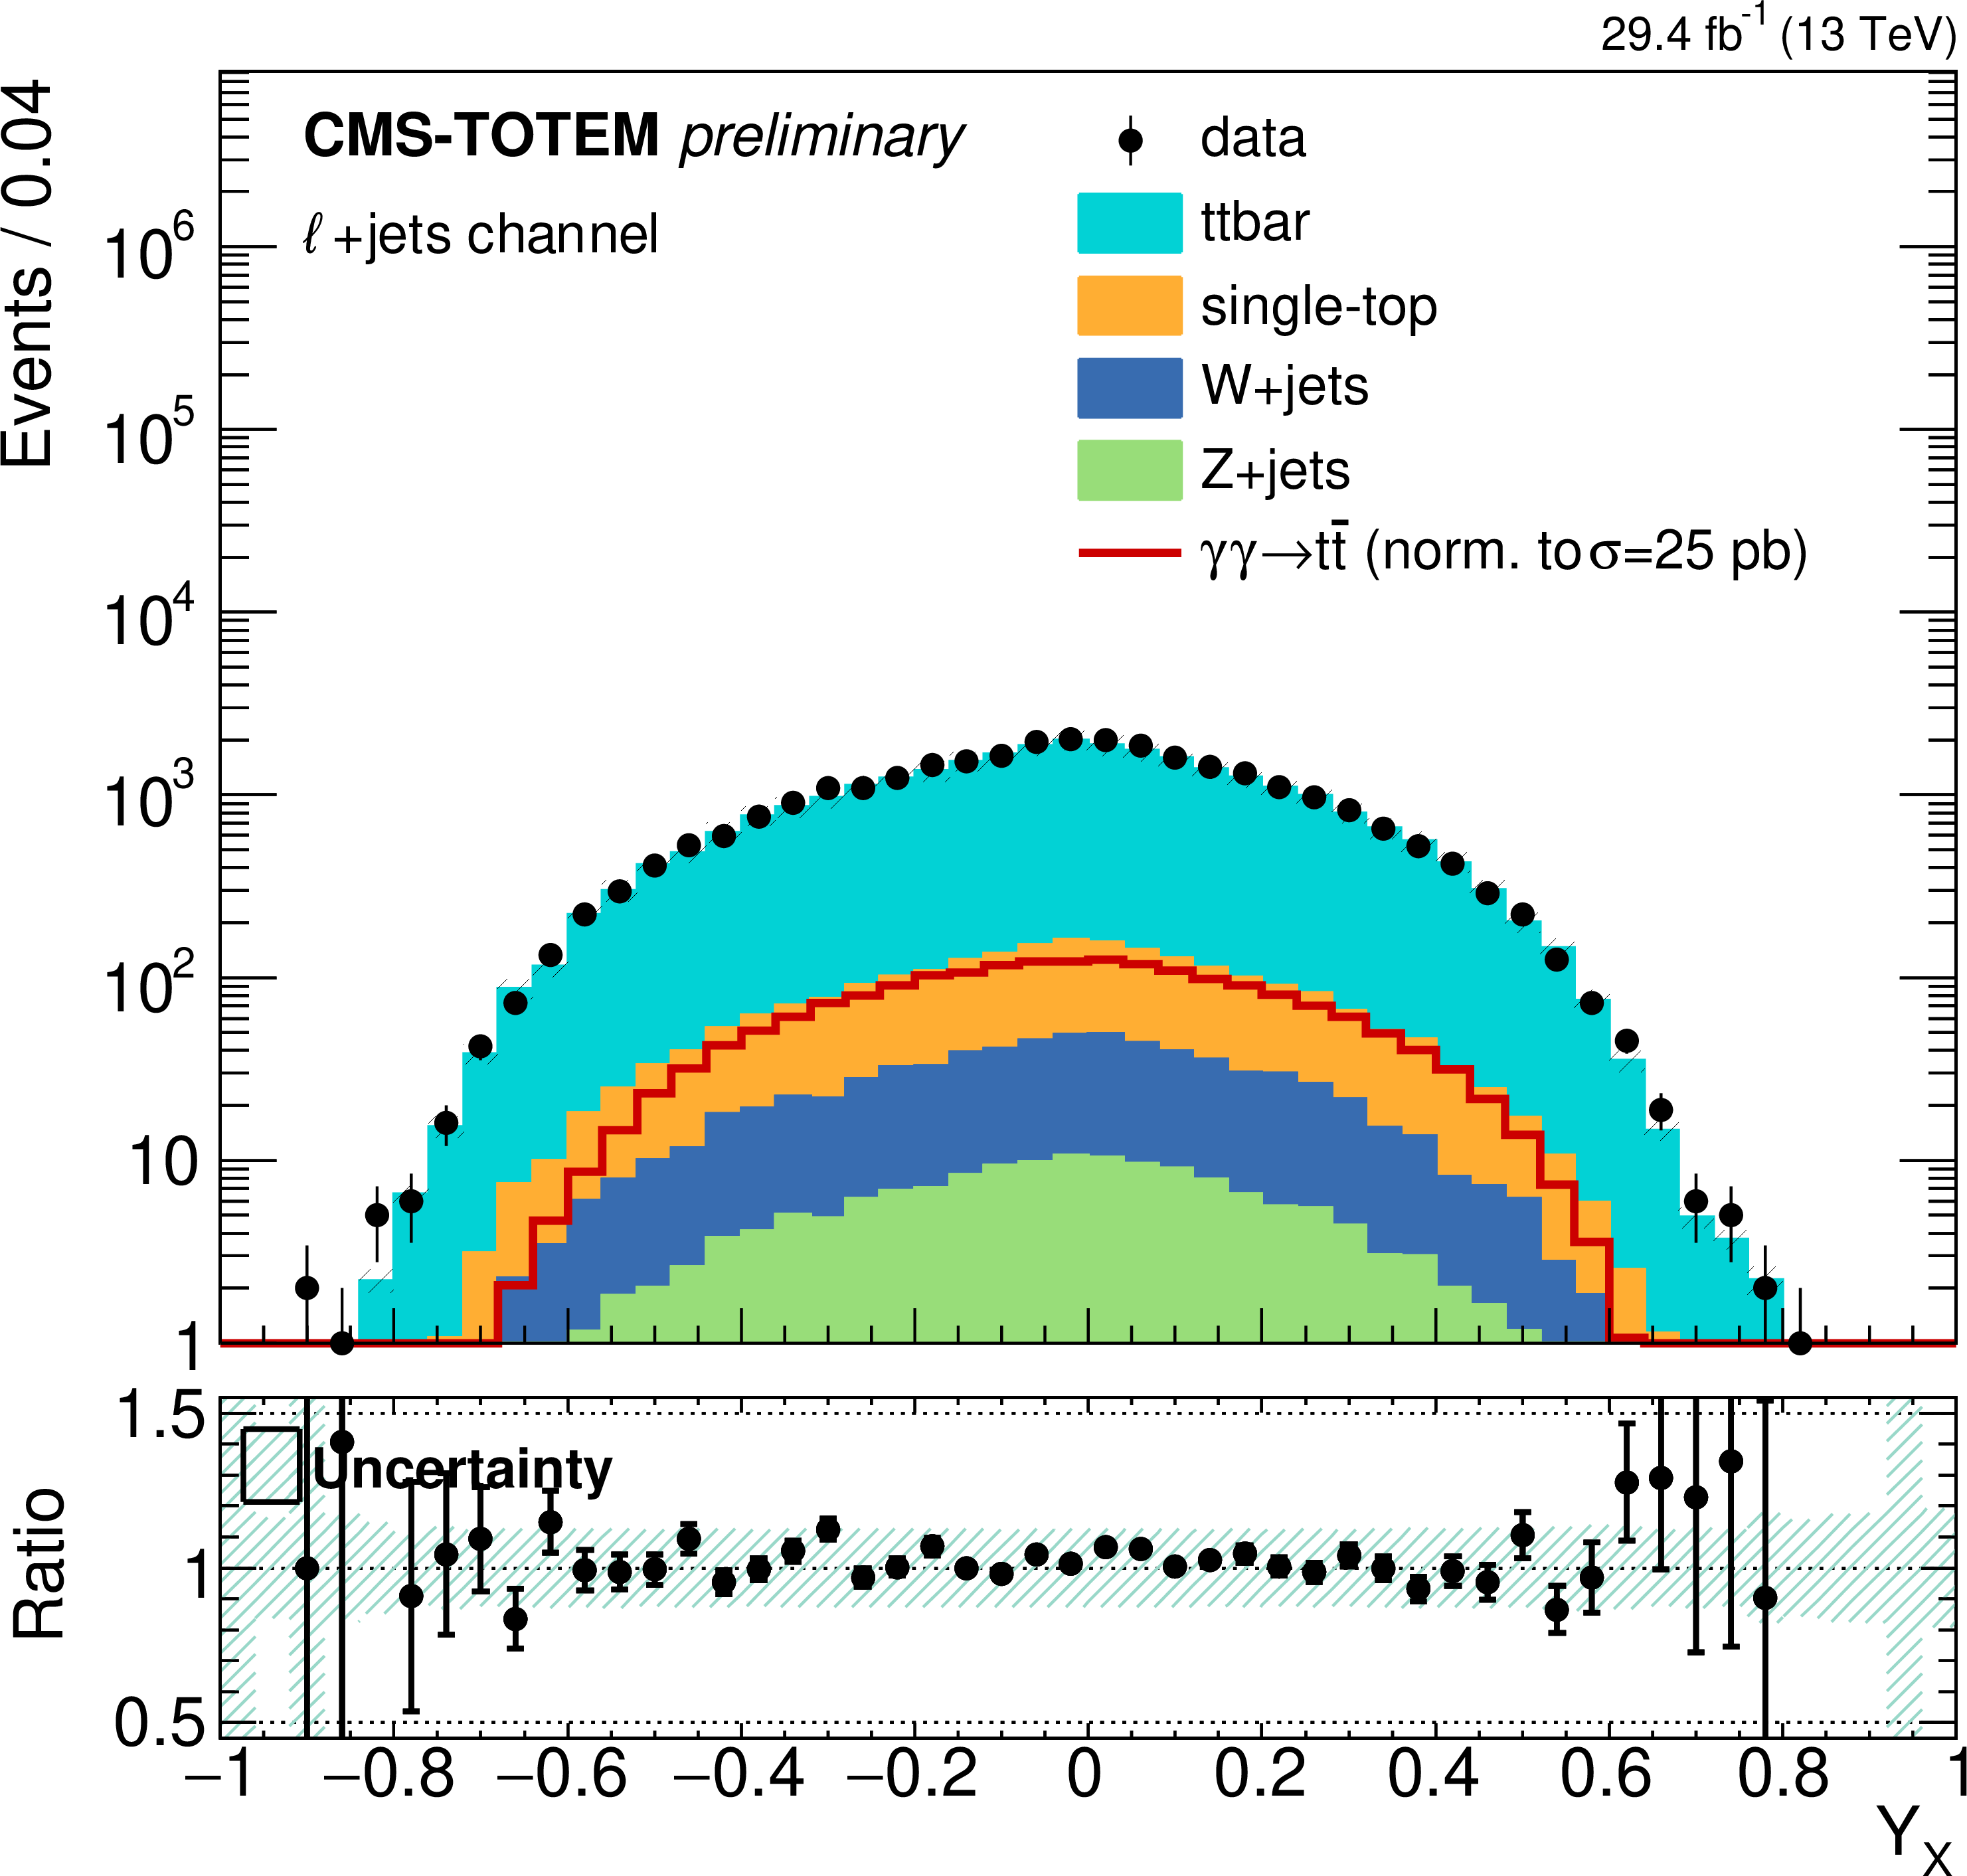
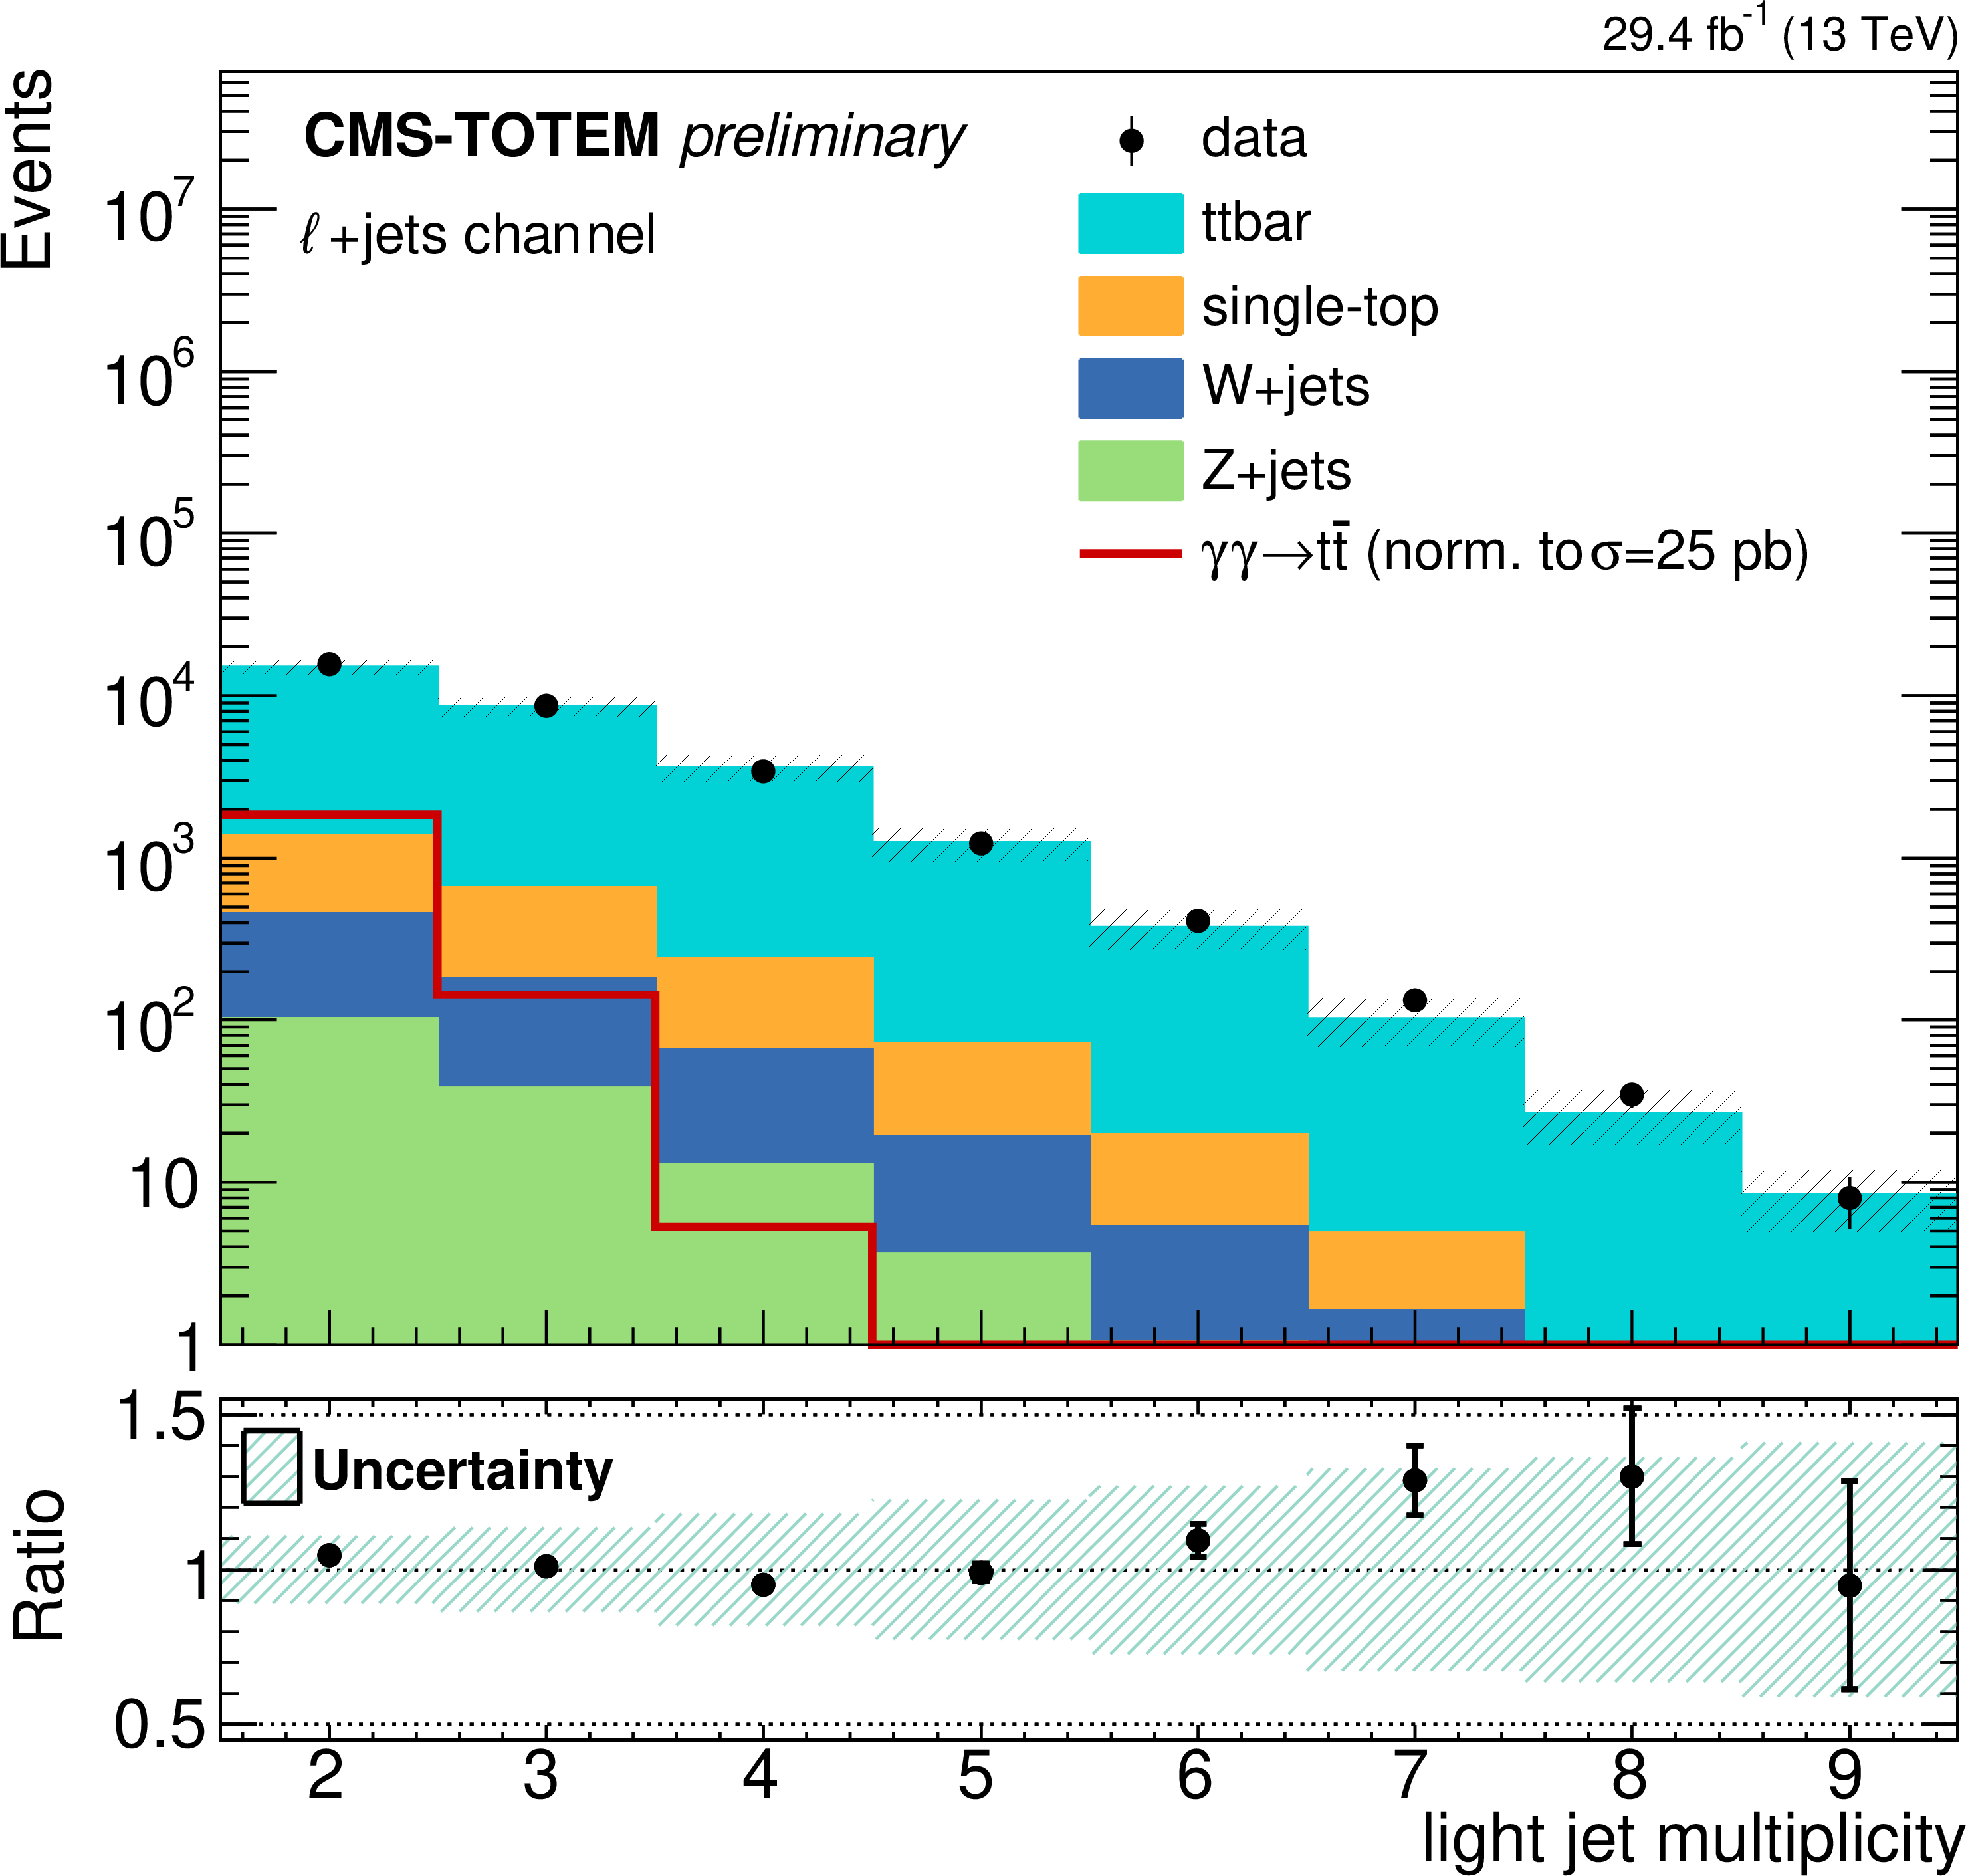
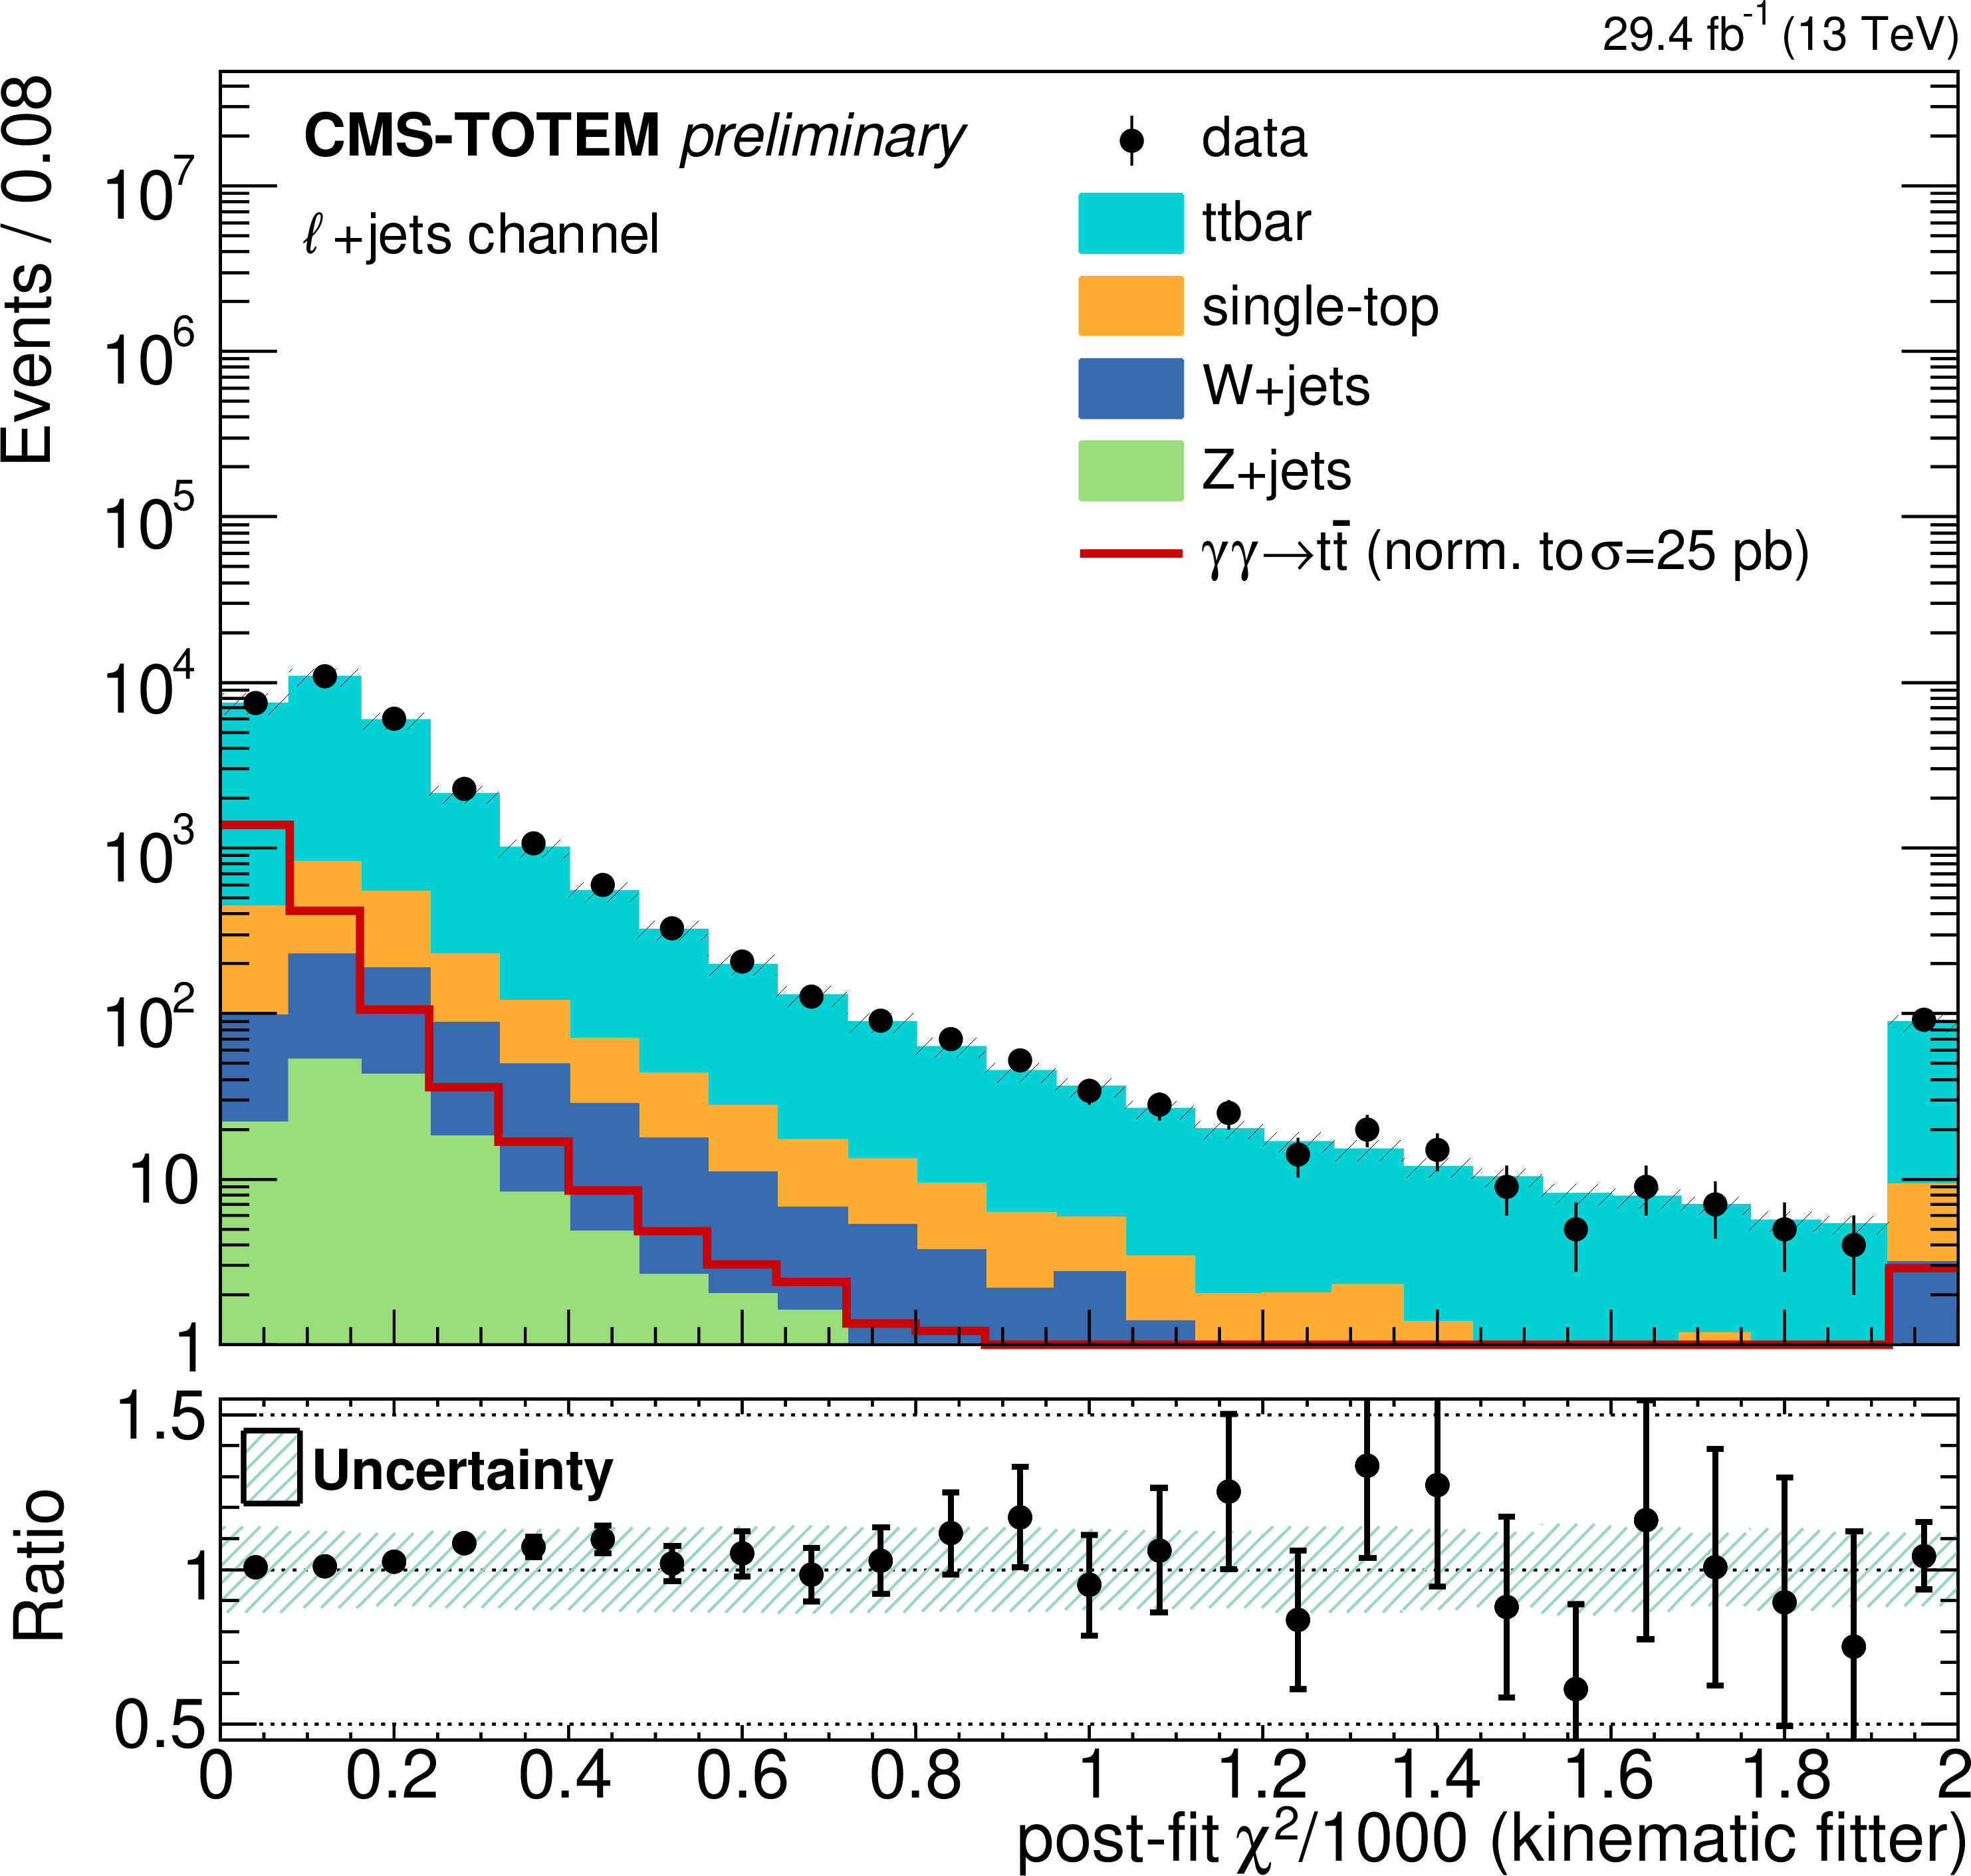
Figure 5:
Distribution of some of the kinematic variables of interest for the dilepton (top) and $\ell $+jets (bottom) analysis. Solid histograms: background; open histogram: signal, normalized to a cross section of 25 pb, approximately 10$^5$ larger than the SM cross section prediction from [18]; points with error bars: data. |
png pdf |
Figure 5-a:
Distribution of some of the kinematic variables of interest for the dilepton (top) and $\ell $+jets (bottom) analysis. Solid histograms: background; open histogram: signal, normalized to a cross section of 25 pb, approximately 10$^5$ larger than the SM cross section prediction from [18]; points with error bars: data. |
png pdf |
Figure 5-b:
Distribution of some of the kinematic variables of interest for the dilepton (top) and $\ell $+jets (bottom) analysis. Solid histograms: background; open histogram: signal, normalized to a cross section of 25 pb, approximately 10$^5$ larger than the SM cross section prediction from [18]; points with error bars: data. |
png pdf |
Figure 5-c:
Distribution of some of the kinematic variables of interest for the dilepton (top) and $\ell $+jets (bottom) analysis. Solid histograms: background; open histogram: signal, normalized to a cross section of 25 pb, approximately 10$^5$ larger than the SM cross section prediction from [18]; points with error bars: data. |
png pdf |
Figure 5-d:
Distribution of some of the kinematic variables of interest for the dilepton (top) and $\ell $+jets (bottom) analysis. Solid histograms: background; open histogram: signal, normalized to a cross section of 25 pb, approximately 10$^5$ larger than the SM cross section prediction from [18]; points with error bars: data. |
png pdf |
Figure 5-e:
Distribution of some of the kinematic variables of interest for the dilepton (top) and $\ell $+jets (bottom) analysis. Solid histograms: background; open histogram: signal, normalized to a cross section of 25 pb, approximately 10$^5$ larger than the SM cross section prediction from [18]; points with error bars: data. |
png pdf |
Figure 5-f:
Distribution of some of the kinematic variables of interest for the dilepton (top) and $\ell $+jets (bottom) analysis. Solid histograms: background; open histogram: signal, normalized to a cross section of 25 pb, approximately 10$^5$ larger than the SM cross section prediction from [18]; points with error bars: data. |
png pdf |
Figure 5-g:
Distribution of some of the kinematic variables of interest for the dilepton (top) and $\ell $+jets (bottom) analysis. Solid histograms: background; open histogram: signal, normalized to a cross section of 25 pb, approximately 10$^5$ larger than the SM cross section prediction from [18]; points with error bars: data. |
png pdf |
Figure 5-h:
Distribution of some of the kinematic variables of interest for the dilepton (top) and $\ell $+jets (bottom) analysis. Solid histograms: background; open histogram: signal, normalized to a cross section of 25 pb, approximately 10$^5$ larger than the SM cross section prediction from [18]; points with error bars: data. |
png pdf |
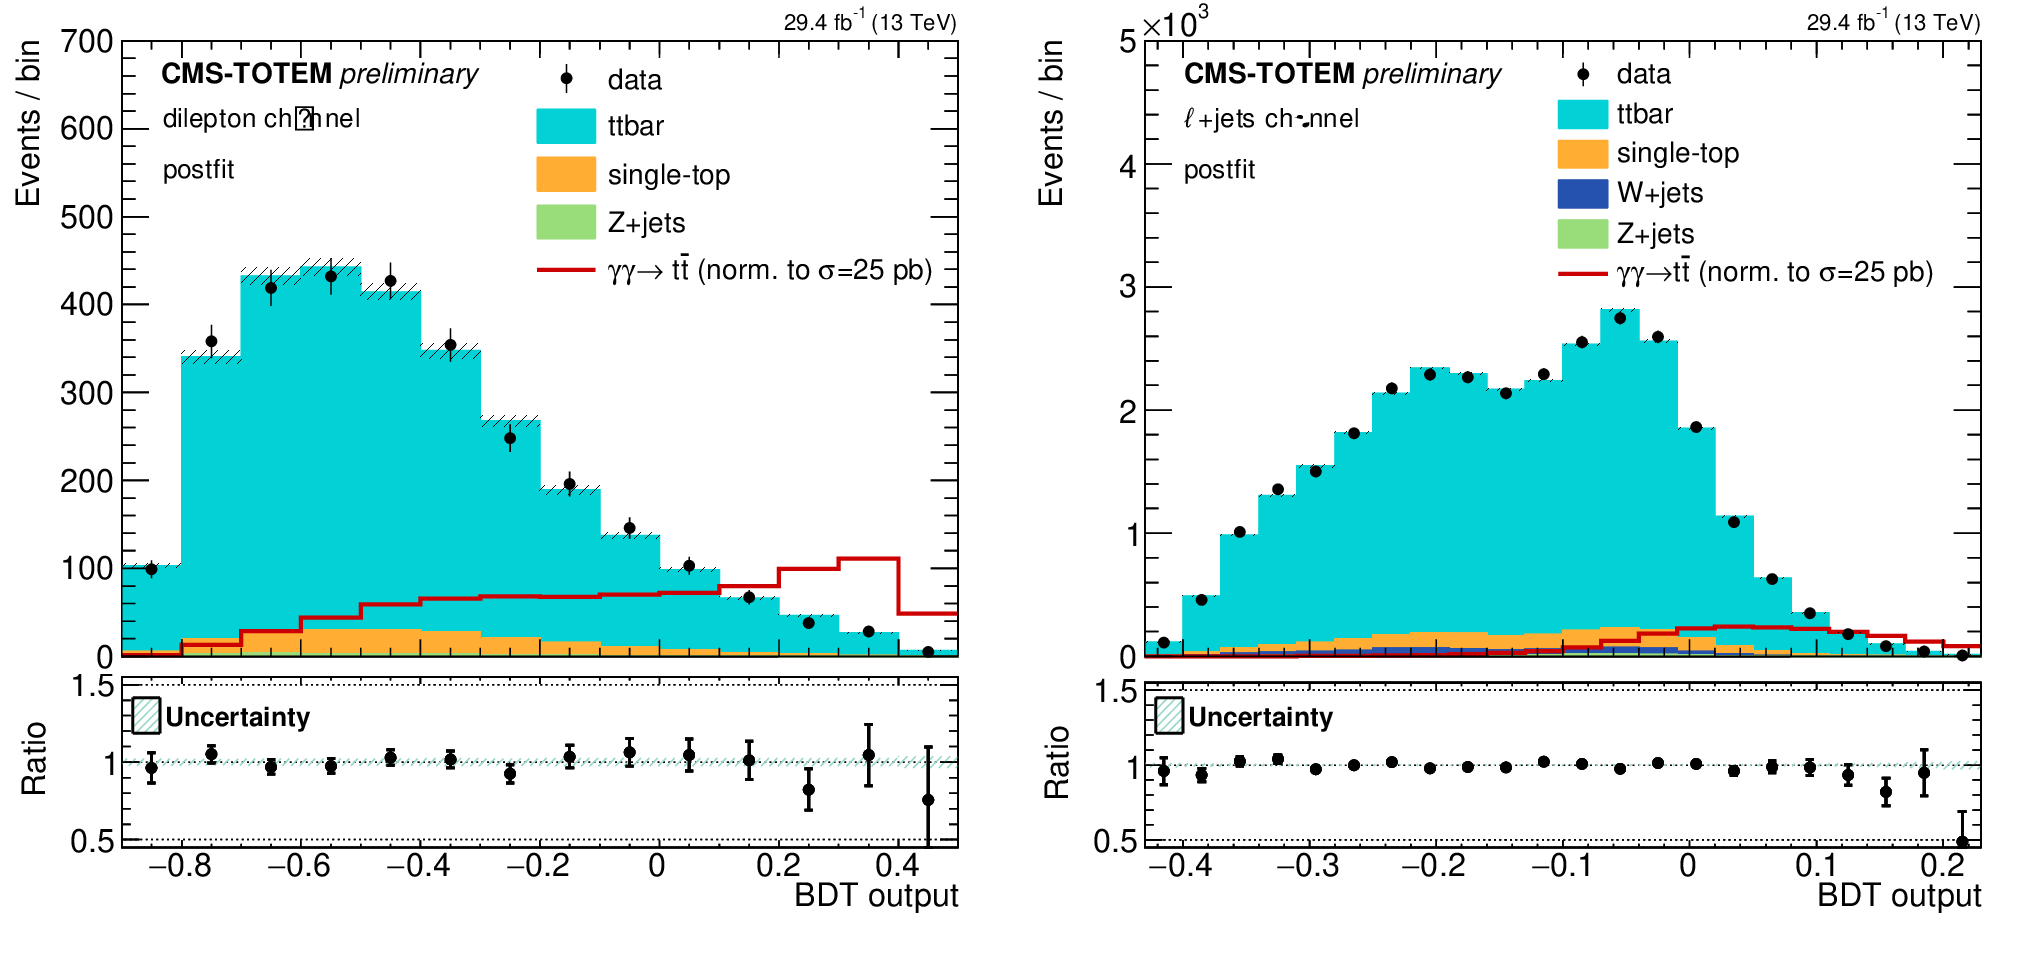
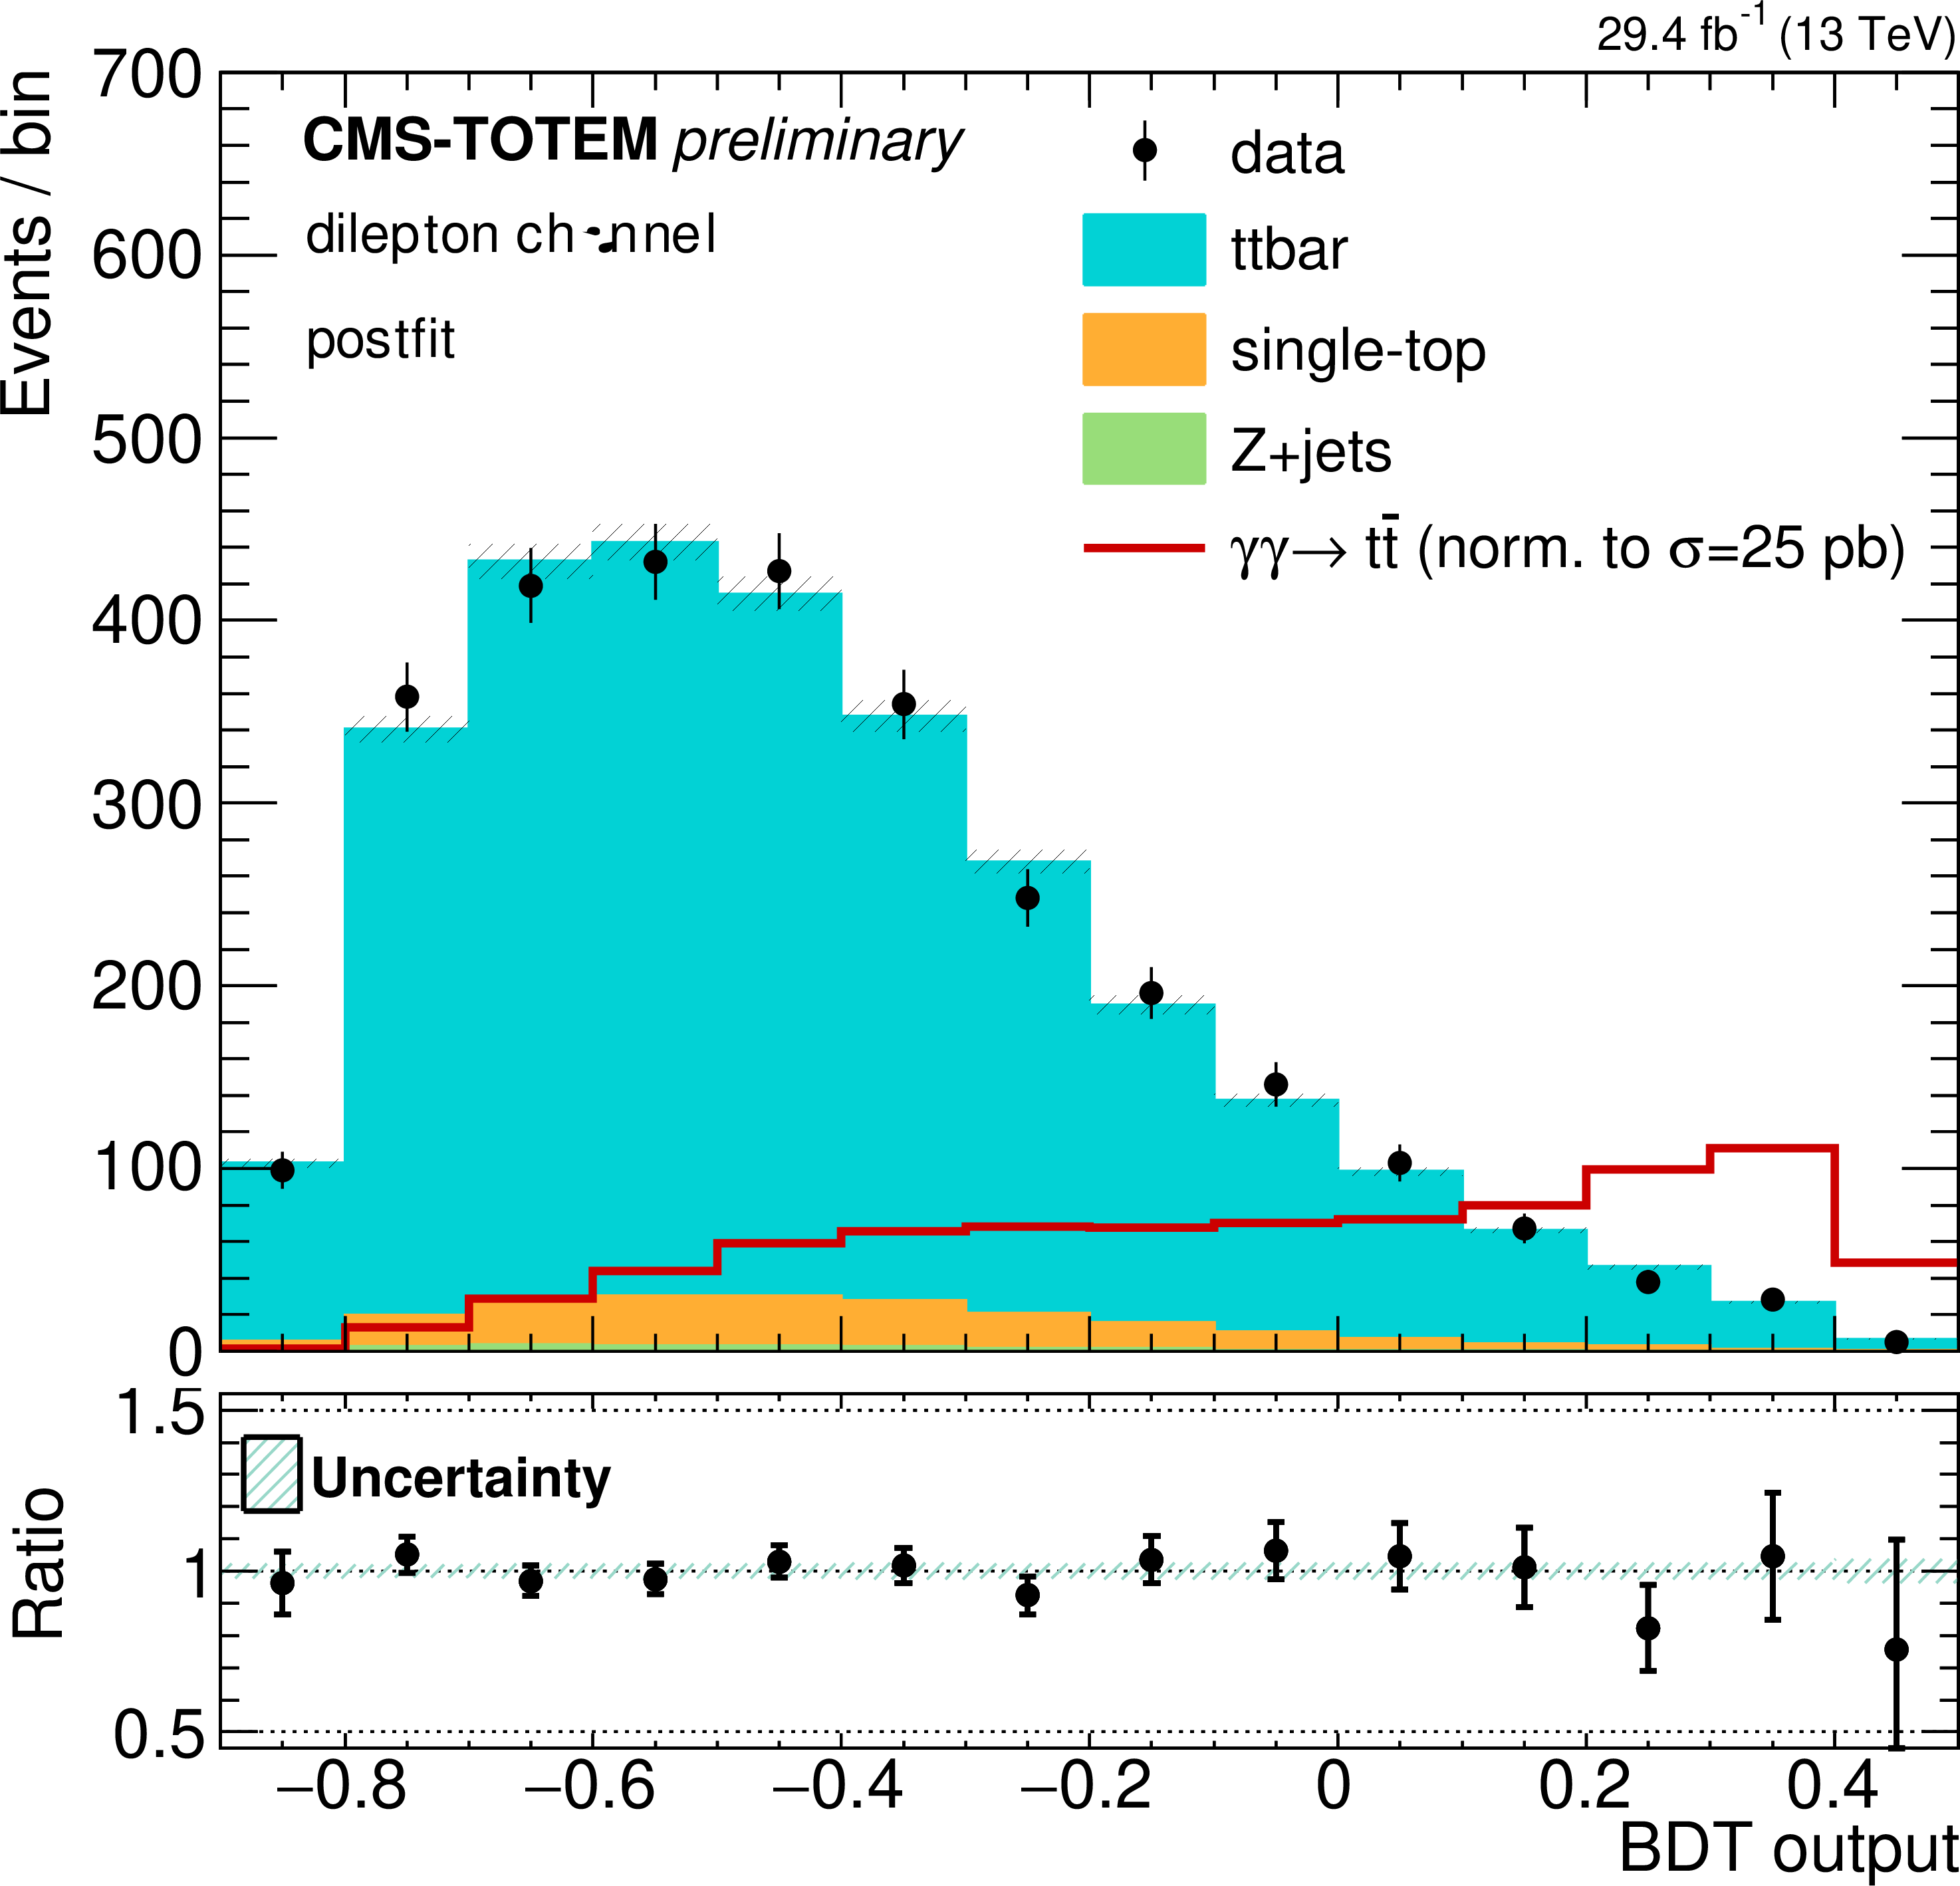
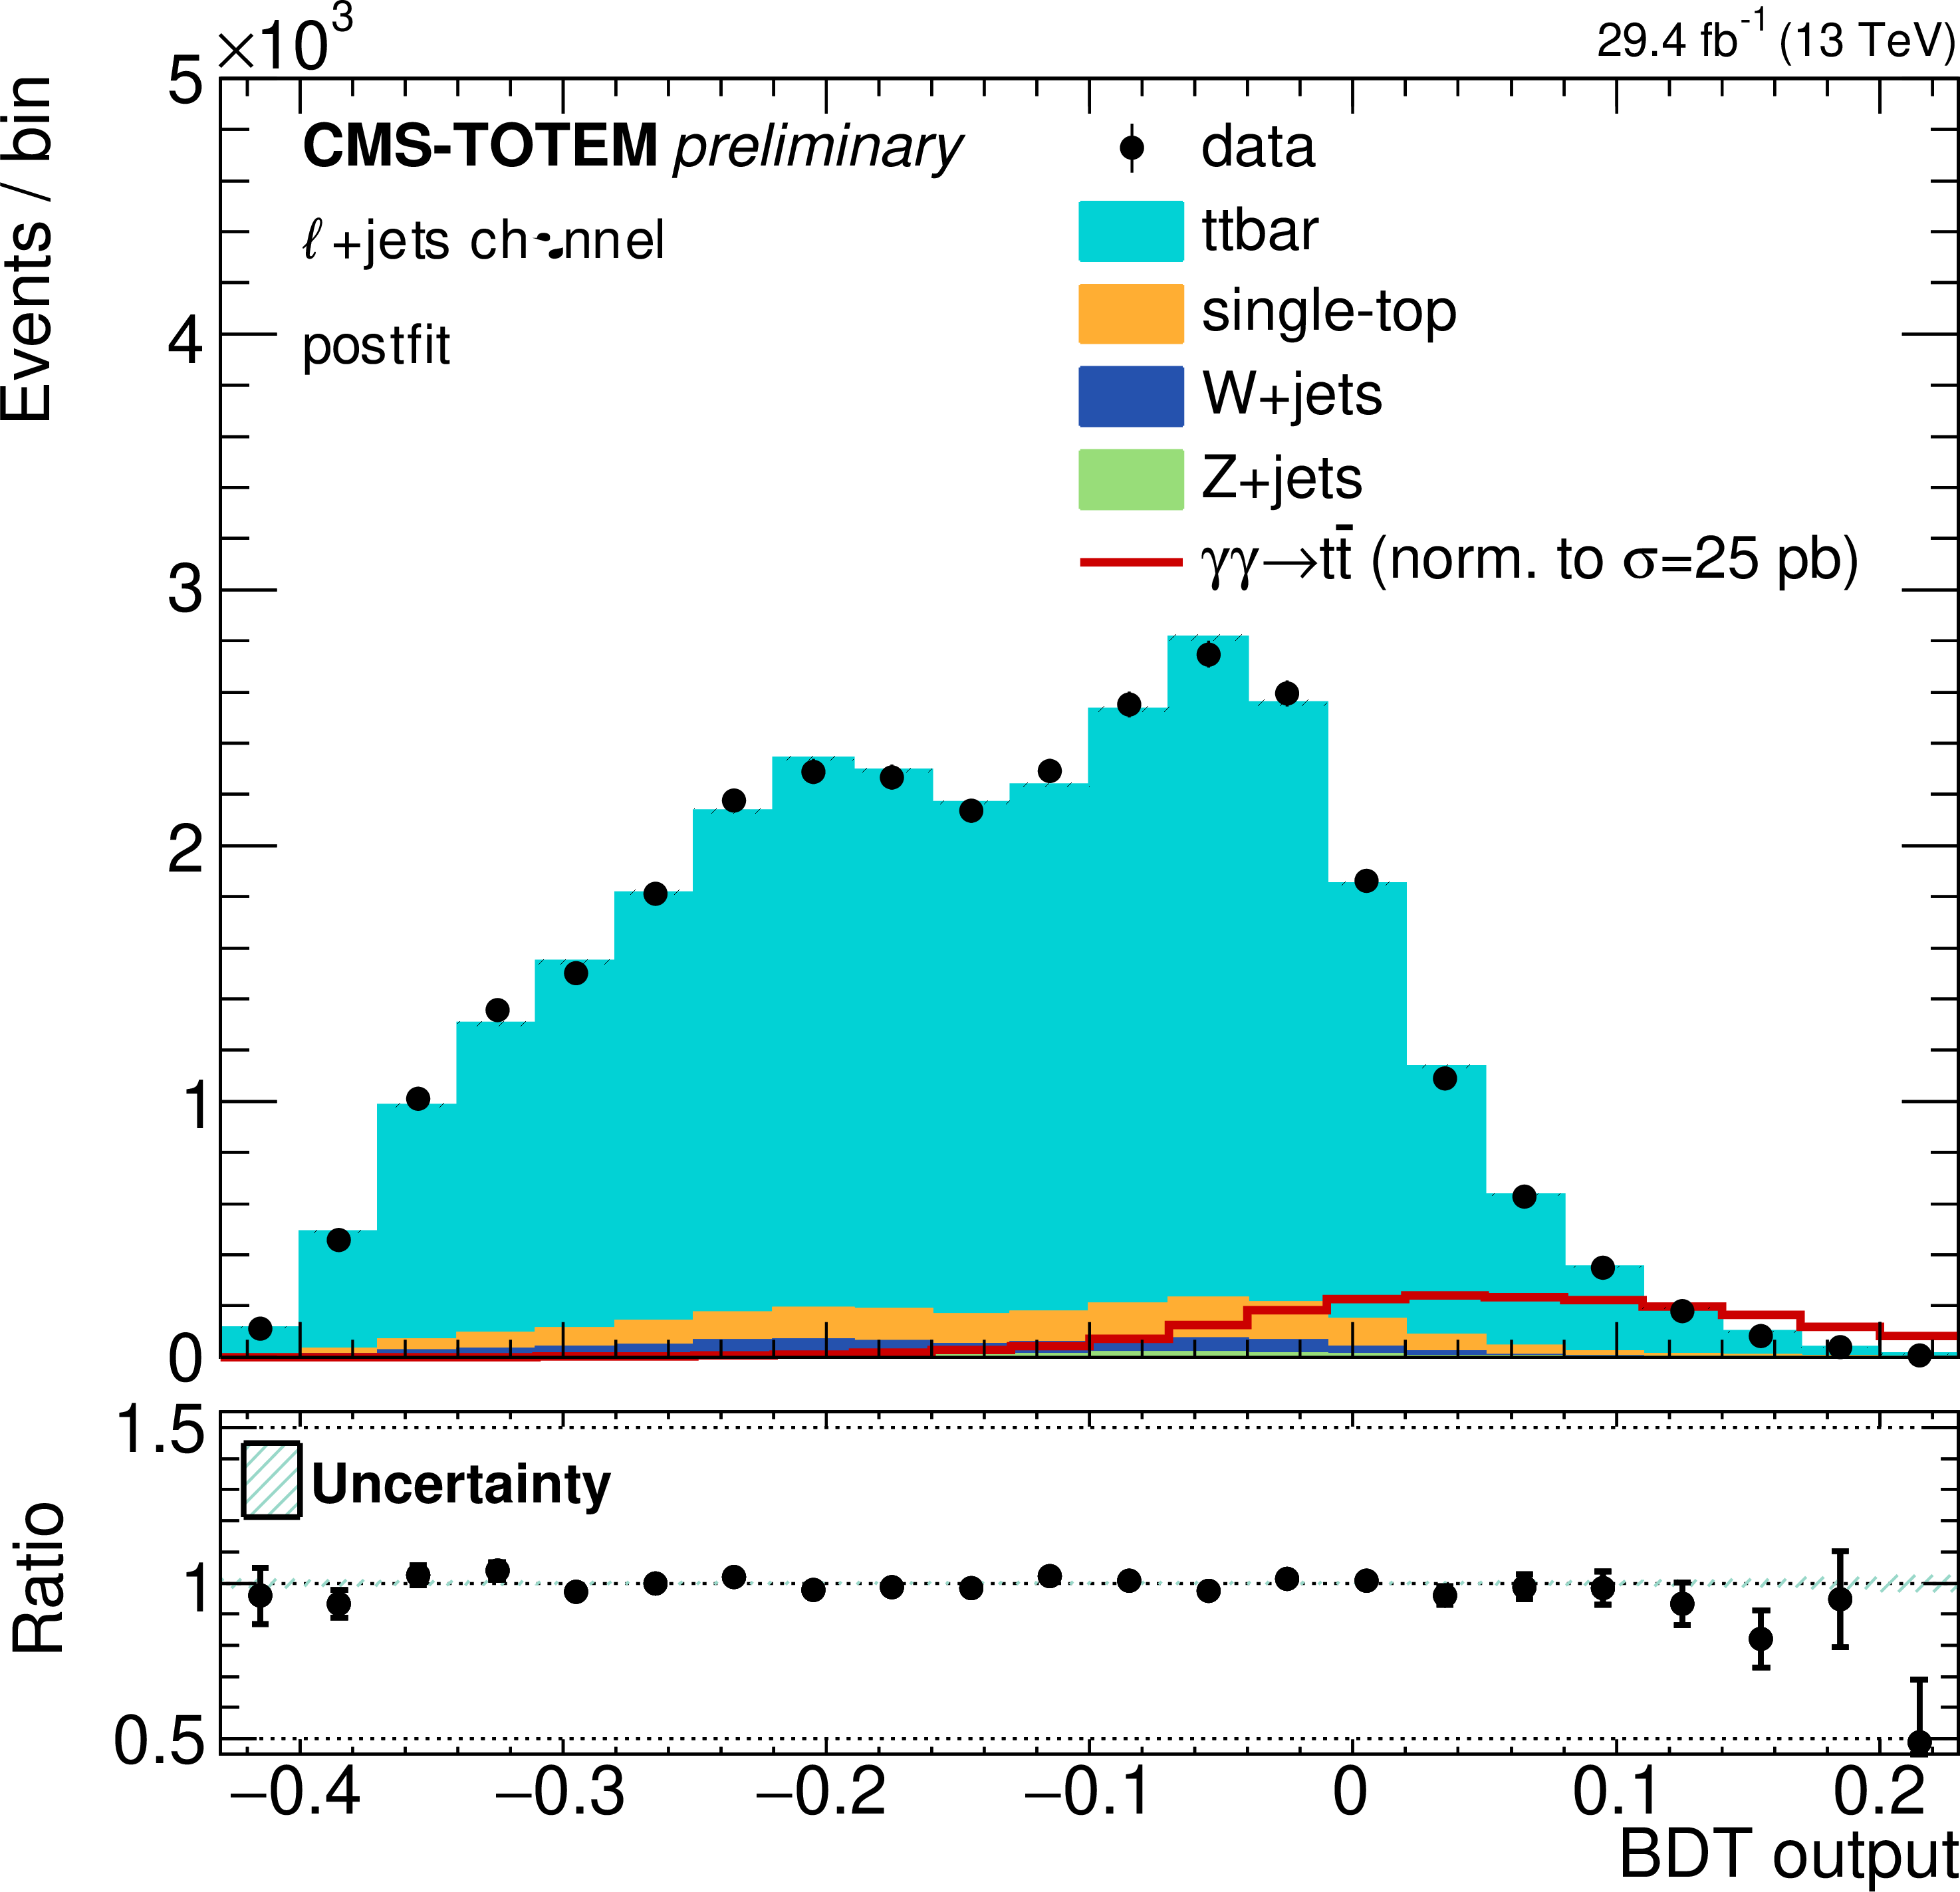
Figure 6:
Distribution of the BDT score in the signal region for simulated events after the fit, and for data. Left: dilepton mode; right: $\ell $+jets mode. The red open histogram shows the expected distribution for signal, normalized to a cross section of 25 pb, approximately 10$^5$ larger than the SM cross section prediction from [18];. For both reconstruction modes, all signal regions are combined. |
png pdf |
Figure 6-a:
Distribution of the BDT score in the signal region for simulated events after the fit, and for data. Left: dilepton mode; right: $\ell $+jets mode. The red open histogram shows the expected distribution for signal, normalized to a cross section of 25 pb, approximately 10$^5$ larger than the SM cross section prediction from [18];. For both reconstruction modes, all signal regions are combined. |
png pdf |
Figure 6-b:
Distribution of the BDT score in the signal region for simulated events after the fit, and for data. Left: dilepton mode; right: $\ell $+jets mode. The red open histogram shows the expected distribution for signal, normalized to a cross section of 25 pb, approximately 10$^5$ larger than the SM cross section prediction from [18];. For both reconstruction modes, all signal regions are combined. |
png pdf |
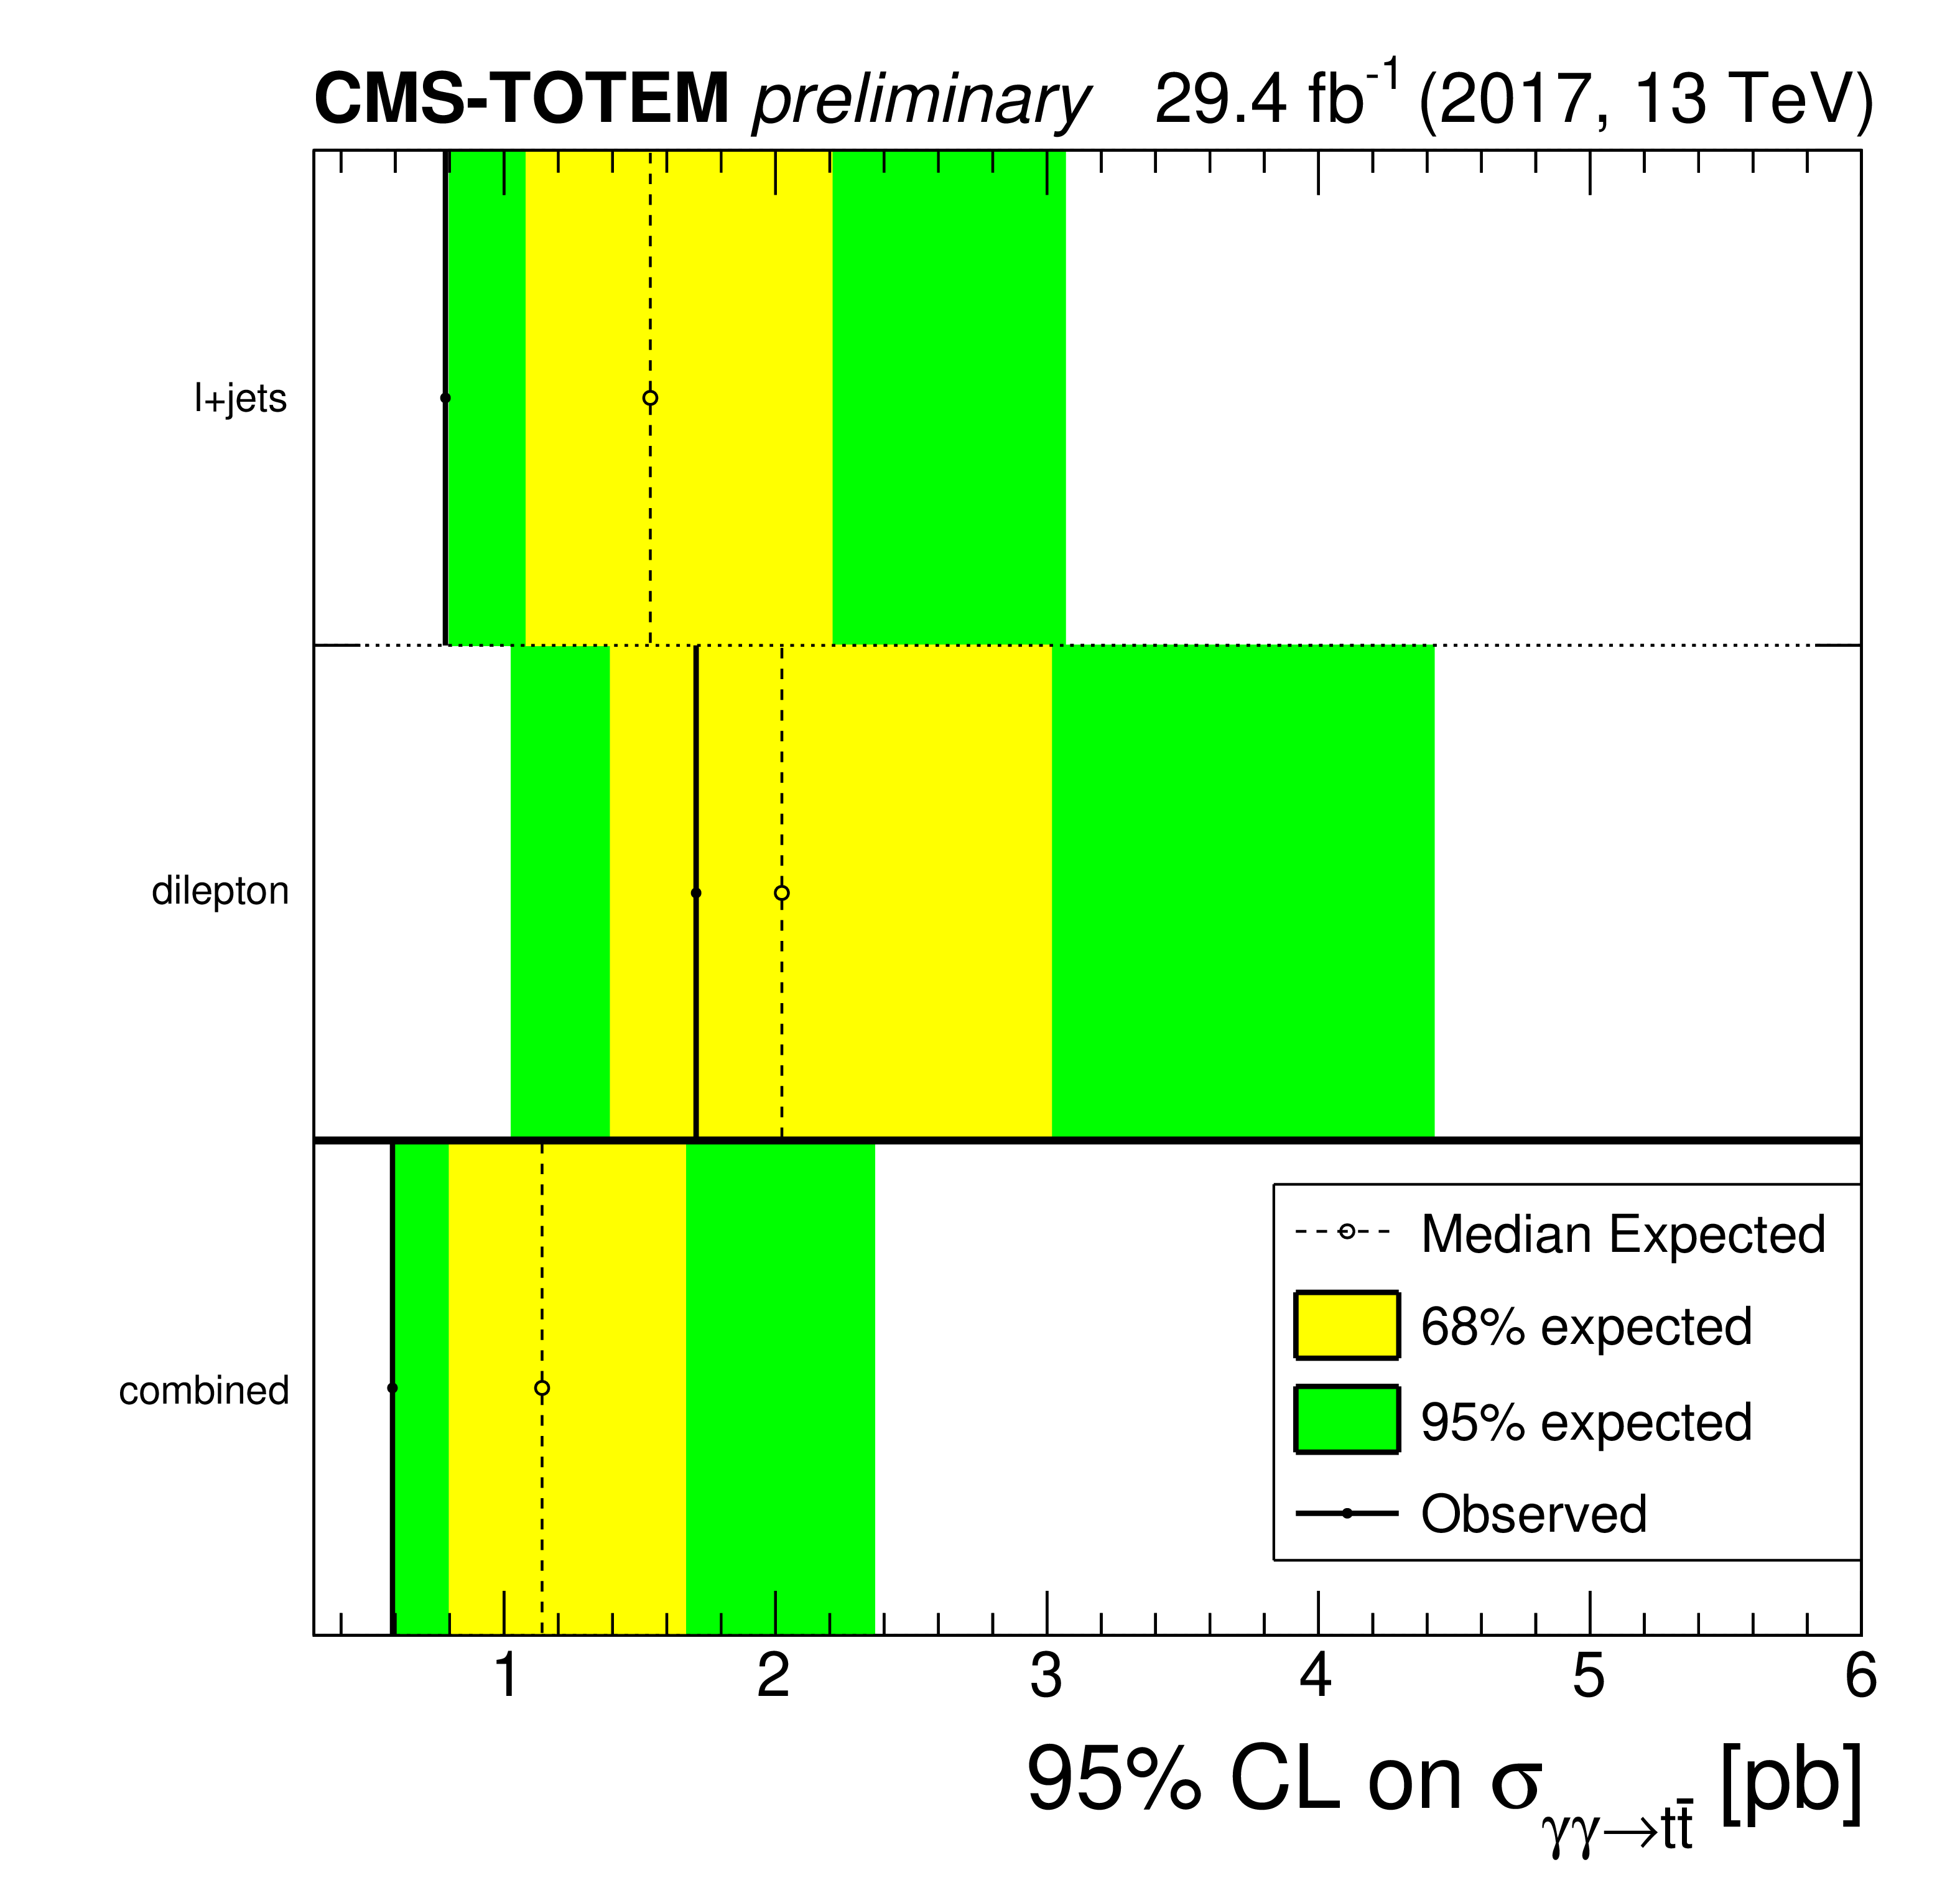
Figure 7:
Expected 95% CL upper limit for the signal cross section, for the two reconstruction modes and for the combination. The green and yellow bands show the $ \pm $1$ \sigma $ and $ \pm $2$ \sigma $ intervals, respectively. |
| Summary |
| In summary, we have searched for the central exclusive production of top quark-antiquark pairs in proton-proton interactions, ${\mathrm{p}} {\mathrm{p}} \rightarrow {\mathrm{p}} \mathrm{t\bar{t}} {\mathrm{p}}$, for the first time using tagged intact protons, reconstructed by the CMS-TOTEM Precision Proton Spectrometer. The $\mathrm{t\bar{t}}$ pairs are reconstructed by the CMS detector either in the dilepton or the lepton+jets decay modes: the search is conducted separately for the two modes, and the results are combined at the end. With a data sample of proton-proton collisions at a centre-of-mass energy of 13 TeV, corresponding to an integrated luminosity of 29.4 fb$^{-1}$, results consistent with predictions from the standard model are obtained, and an upper limit of 0.59 pb at the 95% confidence level is set on the central exclusive production of $\mathrm{t\bar{t}}$ pairs. |
| References | ||||
| 1 | CMS Collaboration | Measurement of the inclusive $ \mathrm{t}\overline{\mathrm{t}} $ cross section in pp collisions at $ \sqrt{s}= $ 5.02 TeV using final states with at least one charged lepton | JHEP 03 (2018) 115 | CMS-TOP-16-023 1711.03143 |
| 2 | ATLAS Collaboration | Measurement of the top quark pair production cross-section with ATLAS in the single lepton channel | PLB 711 (2012) 244 | 1201.1889 |
| 3 | ATLAS Collaboration | Measurement of the $ t\bar{t} $ production cross-section using $ e\mu $ events with b-tagged jets in pp collisions at $ \sqrt{s} = $ 7 and 8 TeV with the ATLAS detector | EPJC 74 (2014) 3109 | 1406.5375 |
| 4 | CMS Collaboration | Measurement of the $ t\bar{t} $ production cross section in the $ e\mu $ channel in proton-proton collisions at sqrt(s) = 7 and 8 TeV | JHEP 08 (2016) 029 | CMS-TOP-13-004 1603.02303 |
| 5 | CMS Collaboration | Measurements of the $ \mathrm{t}\overline{\mathrm{t}} $ production cross section in lepton+jets final states in pp collisions at 8 TeV and ratio of 8 to 7 TeV cross sections | EPJC 77 (2017) 15 | CMS-TOP-12-006 1602.09024 |
| 6 | ATLAS Collaboration | Measurement of the $ t\bar{t} $ production cross-section using $ e\mu $ events with b-tagged jets in pp collisions at $ \sqrt{s} = $ 13 TeV with the ATLAS detector | PLB 761 (2016) 136 | 1606.02699 |
| 7 | CMS Collaboration | Measurement of the top quark pair production cross section in proton-proton collisions at $ \sqrt{s} = $ 13 TeV | PRL 116 (2016) 052002 | CMS-TOP-15-003 1510.05302 |
| 8 | CMS Collaboration | Measurement of the $ t\bar{t} $ production cross section using events in the e$ \mu $ final state in pp collisions at $ \sqrt{s} = $ 13 TeV | EPJC 77 (2017) 172 | CMS-TOP-16-005 1611.04040 |
| 9 | CMS Collaboration | Measurement of the $ t \bar t $ production cross section using events with one lepton and at least one jet in pp collisions at $ \sqrt{s} = $ 13 TeV | JHEP 09 (2017) 051 | CMS-TOP-16-006 1701.06228 |
| 10 | LHCb Collaboration | Measurement of forward top pair production in the dilepton channel in $ pp $ collisions at $ \sqrt{s}= $ 13 TeV | JHEP 08 (2018) 174 | 1803.05188 |
| 11 | ATLAS, CMS Collaboration | Combinations of single-top-quark production cross-section measurements and |f$ _{LV} $V$ _{tb} $| determinations at $ \sqrt{s} = $ 7 and 8 TeV with the ATLAS and CMS experiments | JHEP 05 (2019) 088 | 1902.07158 |
| 12 | ATLAS Collaboration | Measurement of the inclusive cross-sections of single top-quark and top-antiquark $ t $-channel production in $ pp $ collisions at $ \sqrt{s} = $ 13 TeV with the ATLAS detector | JHEP 04 (2017) 086 | 1609.03920 |
| 13 | CMS Collaboration | Measurement of differential cross sections and charge ratios for t-channel single top quark production in proton-proton collisions at $ \sqrt{s}=$ 13 TeV | EPJC 80 (2020) 370 | CMS-TOP-17-023 1907.08330 |
| 14 | ATLAS Collaboration | Measurement of the cross-section for producing a W boson in association with a single top quark in pp collisions at $ \sqrt{s}= $ 13 TeV with ATLAS | JHEP 01 (2018) 063 | 1612.07231 |
| 15 | J. de Favereau de Jeneret et al. | High energy photon interactions at the LHC | 0908.2020 | |
| 16 | D. d'Enterria and J.-P. Lansberg | Study of Higgs boson production and its $ b\bar{b} $ decay in $ \gamma\gamma $ processes in proton-nucleus collisions at the LHC | PRD 81 (2010) 014004 | 0909.3047 |
| 17 | S. Fayazbakhsh, S. T. Monfared, and M. Mohammadi Najafabadi | Top Quark Anomalous Electromagnetic Couplings in Photon-Photon Scattering at the LHC | PRD 92 (2015) 014006 | 1504.06695 |
| 18 | M. \Luszczak, L. Forthomme, W. Schafer, and A. Szczurek | Production of $ t\overline{t} $ pairs via $ \gamma\gamma $ fusion with photon transverse momenta and proton dissociation | JHEP 02 (2019) 100 | 1810.12432 |
| 19 | V. P. Gon\ccalves, D. E. Martins, M. S. Rangel, and M. Tasevsky | Top quark pair production in the exclusive processes at the LHC | PRD 102 (2020) 074014 | 2007.04565 |
| 20 | J. Howarth | Elastic Potential: A proposal to discover elastic production of top quarks at the Large Hadron Collider | 2008.04249 | |
| 21 | CMS Collaboration | The CMS Precision Proton Spectrometer at the HL-LHC -- Expression of Interest | 2103.02752 | |
| 22 | CMS, TOTEM Collaboration | CMS-TOTEM Precision Proton Spectrometer | CERN-LHCC-2014-021, TOTEM-TDR-003, CMS-TDR-13, 9 | |
| 23 | G. Ruggiero et al. | Characteristics of edgeless silicon detectors for the Roman Pots of the TOTEM experiment at the LHC | NIMA 604 (2009) 242 | |
| 24 | CMS, TOTEM Collaboration | The CT-PPS tracking system with 3D pixel detectors | JINST 11 (2016) C11027 | |
| 25 | CMS Collaboration | Particle-flow reconstruction and global event description with the CMS detector | JINST 12 (2017) P10003 | CMS-PRF-14-001 1706.04965 |
| 26 | CMS Collaboration | Performance of electron reconstruction and selection with the CMS detector in proton-proton collisions at $ \sqrt{s} = $ 8 TeV | JINST 10 (2015) P06005 | CMS-EGM-13-001 1502.02701 |
| 27 | CMS Collaboration | Performance of the CMS muon detector and muon reconstruction with proton-proton collisions at $ \sqrt{s}= $ 13 TeV | JINST 13 (2018) P06015 | CMS-MUO-16-001 1804.04528 |
| 28 | M. Cacciari, G. P. Salam, and G. Soyez | The anti-$ k_t $ jet clustering algorithm | JHEP 04 (2008) 063 | 0802.1189 |
| 29 | M. Cacciari, G. P. Salam, and G. Soyez | FastJet user manual | EPJC 72 (2012) 1896 | 1111.6097 |
| 30 | CMS Collaboration | Jet energy scale and resolution in the CMS experiment in pp collisions at 8 TeV | JINST 12 (2017) P02014 | CMS-JME-13-004 1607.03663 |
| 31 | CMS Collaboration | Performance of missing transverse momentum reconstruction in proton-proton collisions at $ \sqrt{s} = $ 13 TeV using the CMS detector | JINST 14 (2019) P07004 | CMS-JME-17-001 1903.06078 |
| 32 | CMS Collaboration | Technical proposal for the Phase-II upgrade of the Compact Muon Solenoid | CMS-PAS-TDR-15-002 | CMS-PAS-TDR-15-002 |
| 33 | CMS, TOTEM Collaboration | Proton reconstruction with the Precision Proton Spectrometer in Run 2 | ||
| 34 | GEANT4 Collaboration | GEANT4: A simulation toolkit | NIMA 506 (2003) 250 | |
| 35 | M. Boonekamp et al. | FPMC: A Generator for forward physics | 1102.2531 | |
| 36 | V. M. Budnev, I. F. Ginzburg, G. V. Meledin, and V. G. Serbo | The Two photon particle production mechanism. Physical problems. Applications. Equivalent photon approximation | Physics Reports 15 (1975) 181 | |
| 37 | P. Artoisenet, R. Frederix, O. Mattelaer, and R. Rietkerk | Automatic spin-entangled decays of heavy resonances in Monte Carlo simulations | JHEP 03 (2013) 015 | 1212.3460 |
| 38 | P. Nason | A New method for combining NLO QCD with shower Monte Carlo algorithms | JHEP 11 (2004) 040 | hep-ph/0409146 |
| 39 | S. Frixione, P. Nason, and C. Oleari | Matching NLO QCD computations with Parton Shower simulations: the POWHEG method | JHEP 11 (2007) 070 | 0709.2092 |
| 40 | S. Alioli, P. Nason, C. Oleari, and E. Re | A general framework for implementing NLO calculations in shower Monte Carlo programs: the POWHEG BOX | JHEP 06 (2010) 043 | 1002.2581 |
| 41 | M. Czakon et al. | Top-pair production at the LHC through NNLO QCD and NLO EW | JHEP 10 (2017) 186 | 1705.04105 |
| 42 | T. Sjostrand, S. Mrenna, and P. Skands | PYTHIA 6.4 physics and manual | JHEP 05 (2006) 026 | hep-ph/0603175 |
| 43 | T. Sjostrand et al. | An introduction to PYTHIA 8.2 | CPC 191 (2015) 159 | 1410.3012 |
| 44 | CMS Collaboration | Extraction and validation of a new set of CMS PYTHIA8 tunes from underlying-event measurements | EPJC 80 (2020) 4 | CMS-GEN-17-001 1903.12179 |
| 45 | NNPDF Collaboration | Parton distributions from high-precision collider data | EPJC 77 (2017) 663 | 1706.00428 |
| 46 | CMS Collaboration | Performance of the CMS Level-1 trigger in proton-proton collisions at $ \sqrt{s} = $ 13 TeV | JINST 15 (2020) P10017 | CMS-TRG-17-001 2006.10165 |
| 47 | CMS Collaboration | The CMS trigger system | JINST 12 (2017) P01020 | CMS-TRG-12-001 1609.02366 |
| 48 | CMS Collaboration | Identification of heavy-flavour jets with the CMS detector in pp collisions at 13 TeV | JINST 13 (2018) P05011 | CMS-BTV-16-002 1712.07158 |
| 49 | CMS Collaboration | Measurements of $ \mathrm{t\overline{t}} $ differential cross sections in proton-proton collisions at $ \sqrt{s}= $ 13 TeV using events containing two leptons | JHEP 02 (2019) 149 | CMS-TOP-17-014 1811.06625 |
| 50 | L. Breiman, J. Friedman, R. A. Olshen, and C. J. Stone | Chapman and Hall/CRC, 1984 ISBN 978-0-412-04841-8 | ||
| 51 | A. Hocker et al. | TMVA - Toolkit for Multivariate Data Analysis | physics/0703039 | |
| 52 | J. H. Friedman | Data Analysis Techniques for High-Energy Particle Physics | in 3rd CERN School of Computing 10 | |
| 53 | CMS Collaboration | CMS luminosity measurement for the 2017 data-taking period at $ \sqrt{s} = $ 13 TeV | CMS-PAS-LUM-17-004 | CMS-PAS-LUM-17-004 |
| 54 | J. Butterworth et al. | PDF4LHC recommendations for LHC Run II | JPG 43 (2016) 023001 | 1510.03865 |
| 55 | R. J. Barlow and C. Beeston | Fitting using finite Monte Carlo samples | CPC 77 (1993) 219 | |
| 56 | G. Cowan, K. Cranmer, E. Gross, and O. Vitells | Asymptotic formulae for likelihood-based tests of new physics | EPJC 71 (2011) 1554 | 1007.1727 |
|
|
Compact Muon Solenoid LHC, CERN |
|

|

|

|

|

|