

Compact Muon Solenoid
LHC, CERN
| CMS-PAS-TOP-18-013 | ||
| Measurement of differential $\mathrm{t\bar{t}}$ production cross sections for high-$p_{\mathrm{T}}$ top quarks in proton-proton collisions at $\sqrt{s} = $ 13 TeV | ||
| CMS Collaboration | ||
| May 2020 | ||
| Abstract: A measurement of the production cross section for high transverse momentum ($p_{\mathrm{T}}$) top quark pairs is reported. The data set was collected during 2016 with the CMS detector at the CERN LHC from proton-proton collisions at a center-of-mass energy of 13 TeV, and corresponds to an integrated luminosity of 35.9 fb$^{-1}$. The measurement uses events where either both top quark candidates decay hadronically and are reconstructed as large-radius jets with $p_{\mathrm{T}} > $ 400 GeV, or where one top quark decays hadronically and is identified as a single large-radius jet with $p_{\mathrm{T}} > $ 400 GeV and the other top quark decays leptonically to a b jet, an electron or a muon, and a neutrino. The cross section is extracted differentially as a function of kinematic variables of the top quark or the top quark pair system. The results are presented at the particle level, within a region of phase space close to that of the experimental acceptance, and at the parton level, and are compared to various theoretical models. The measured differential cross sections are significantly lower in both decay channels in the phase space of interest, compared to the theory predictions, while the normalized differential cross sections are consistent between data and theory. | ||
|
Links:
CDS record (PDF) ;
CADI line (restricted) ;
These preliminary results are superseded in this paper, PRD 103 (2021) 052008. The superseded preliminary plots can be found here. |
||
| Figures | |
png pdf |
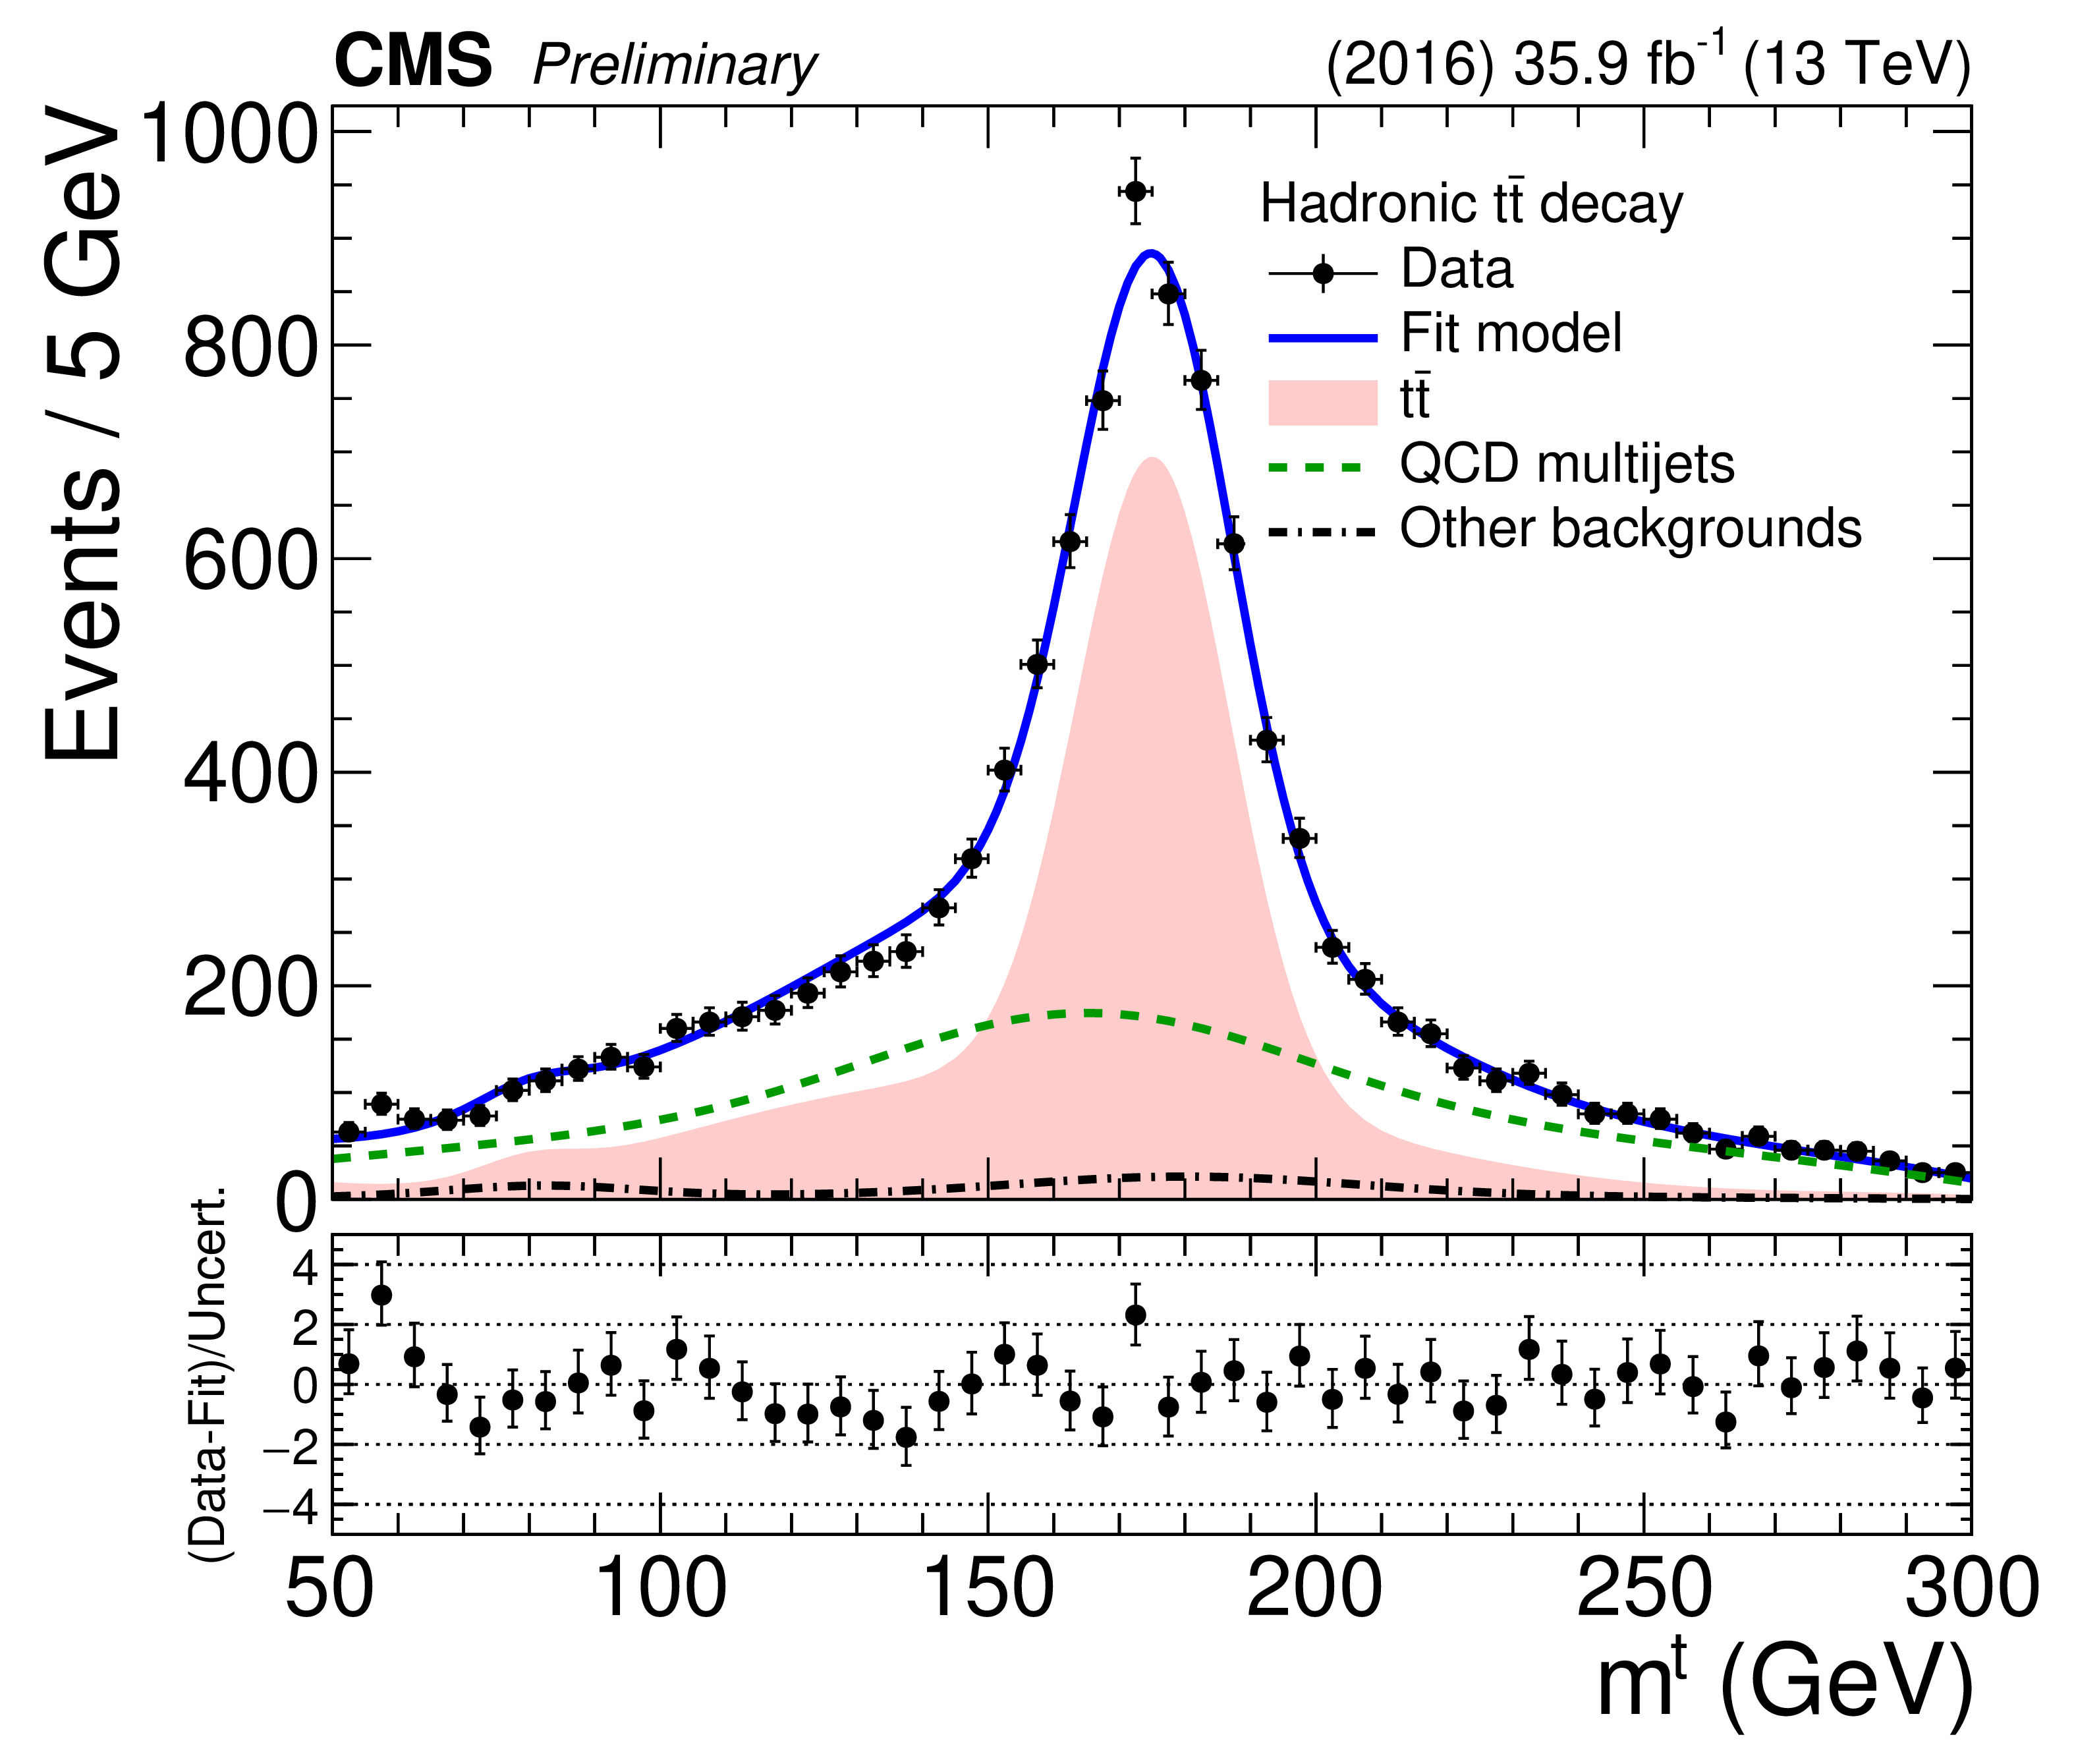
Figure 1:
Result of the fit to data of the soft-drop mass of the t jet candidate, $m^t$, in SR$_{\rm A}$ for the hadronic channel. The shaded area shows the $\mathrm{t\bar{t}}$ contribution, the dashed line shows the QCD multijet background, and the double-dashed line shows the other subdominant backgrounds. The solid line shows the combined signal plus background fit model, and the data points are shown with solid markers. The bottom panel shows the data minus the fit model, divided by the fit uncertainty. |

png pdf |
Figure 2:
Comparison between data and simulation in SR$_{\rm B}$ (same as the SR, without any NN requirement) of the NN output in the hadronic channel. The $\mathrm{t\bar{t}}$ and QCD multijet processes are normalized according to the post-fit values of the respective yields and are shown as stacked histograms. The data points are shown with solid markers, while the shaded band represents the statistical uncertainty in the simulation. The bottom panel shows the data divided by the sum of the prediction from the simulation. |
png pdf |
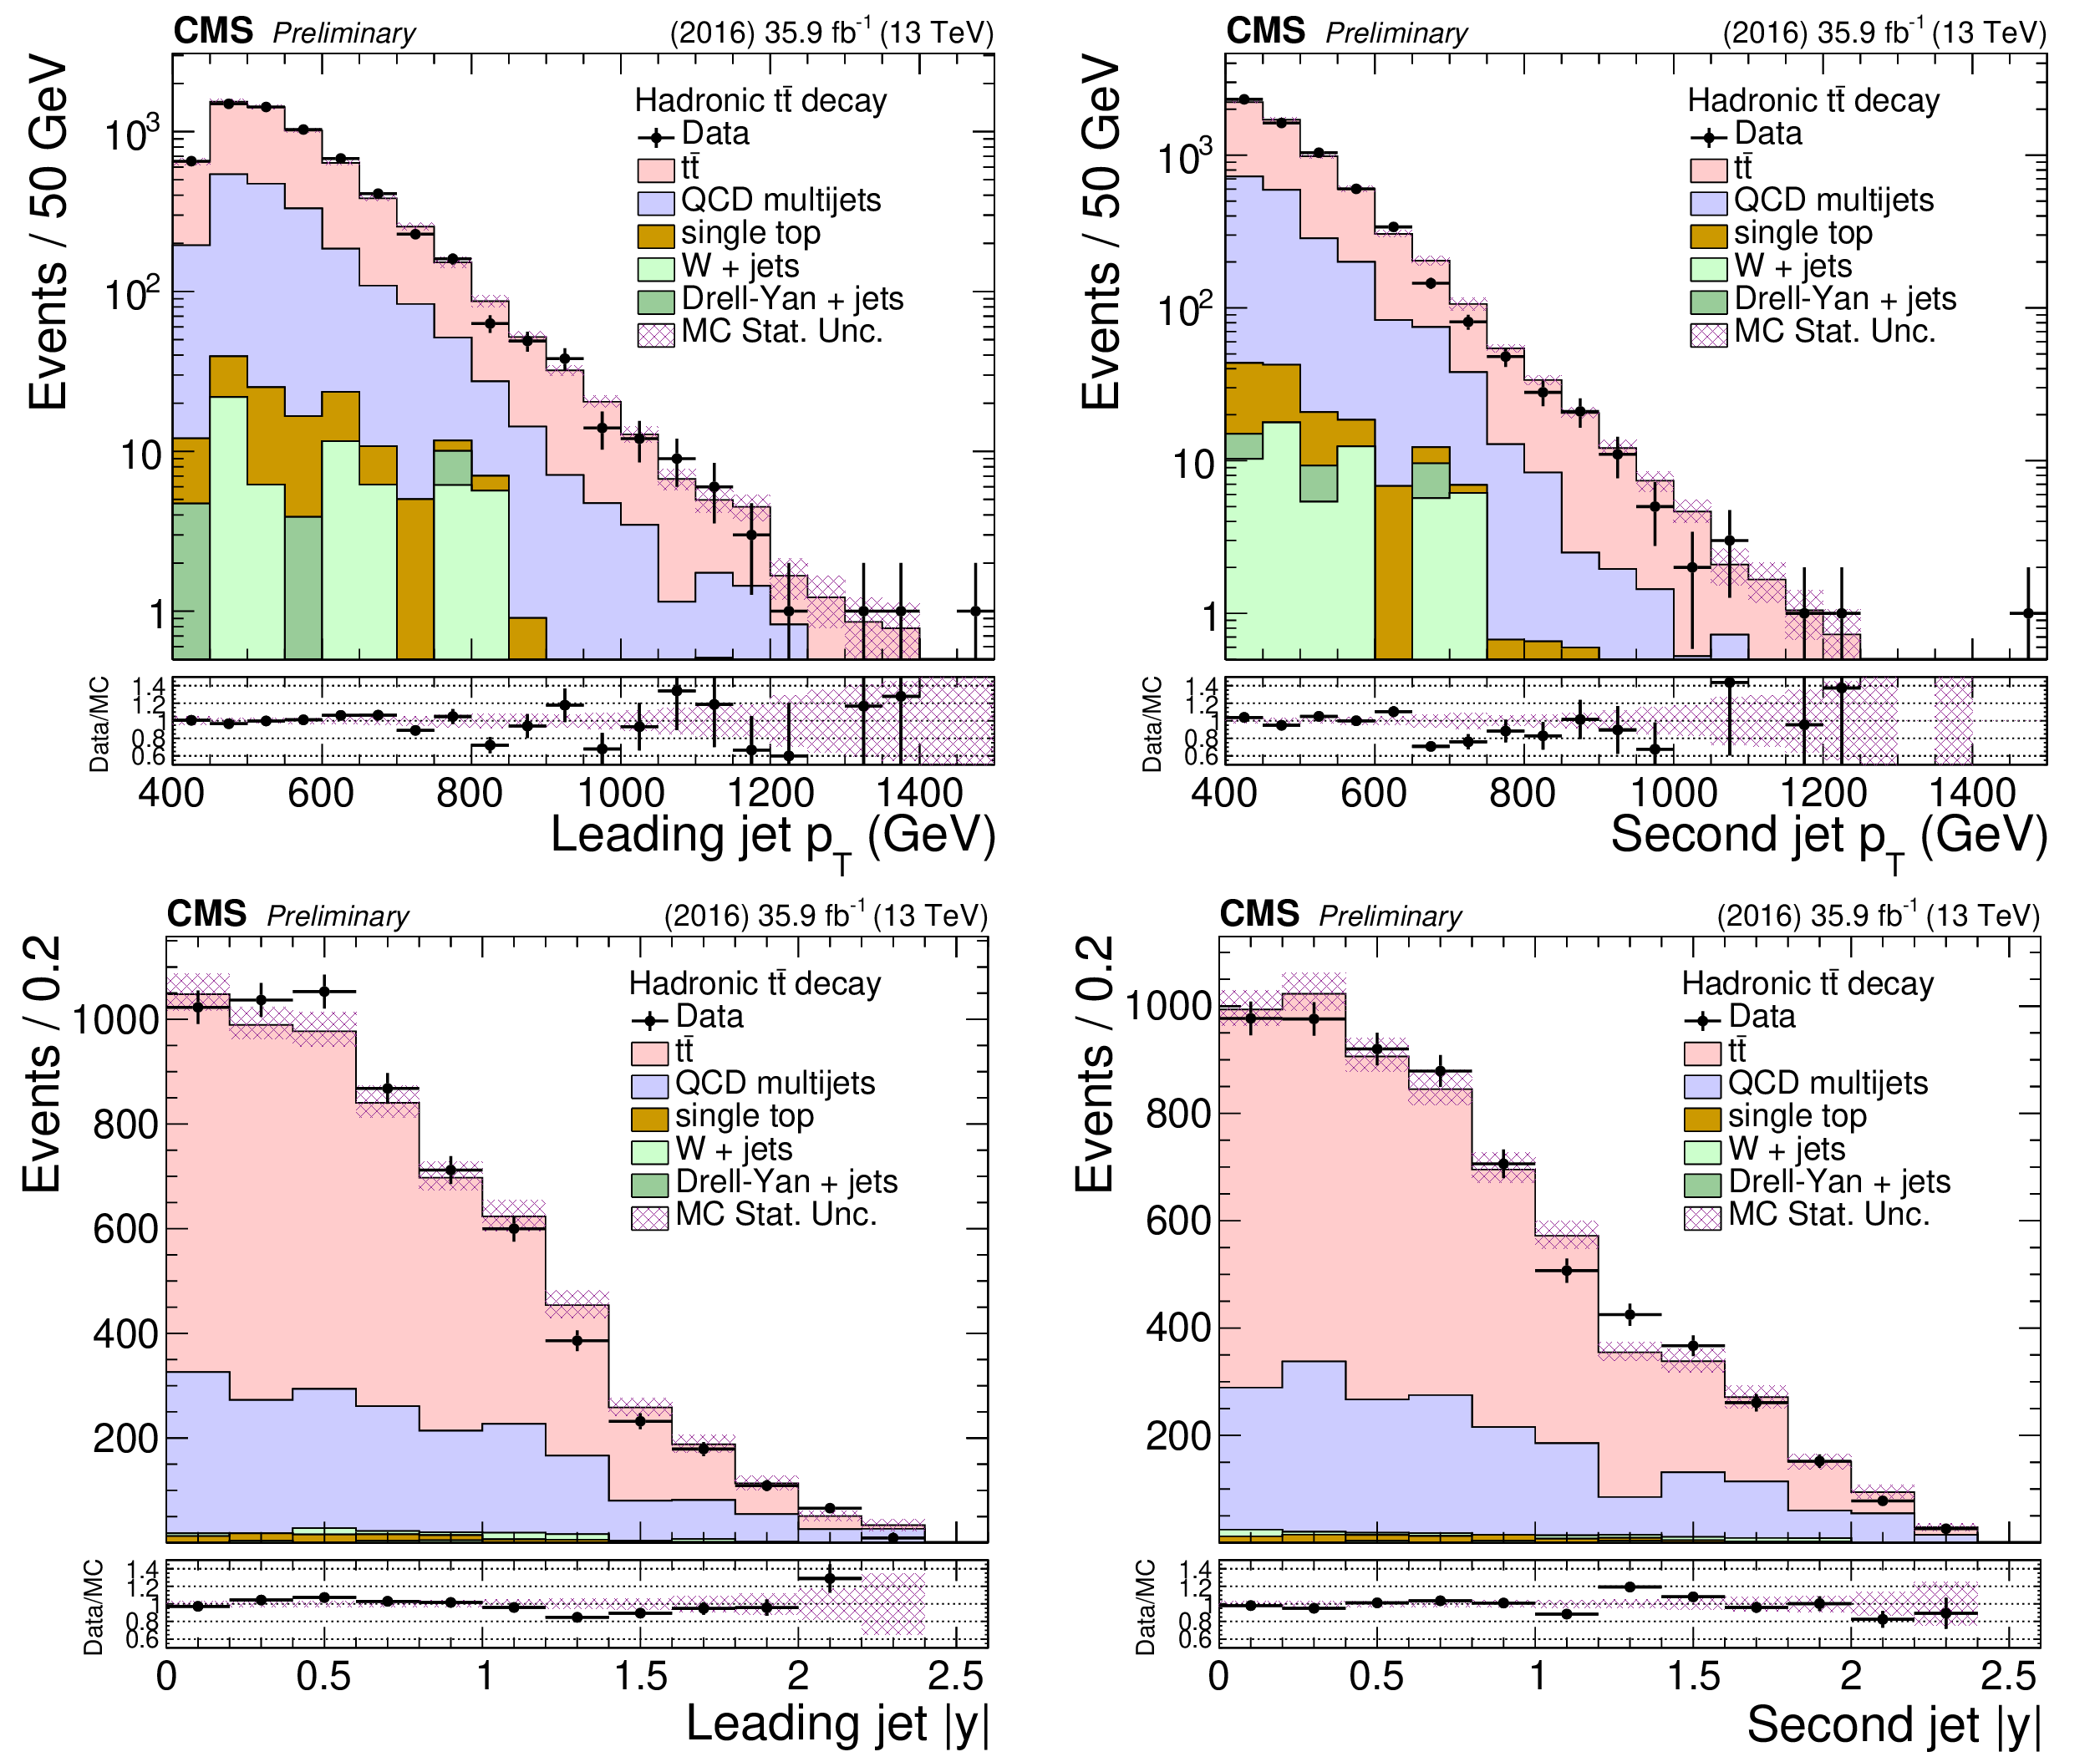
Figure 3:
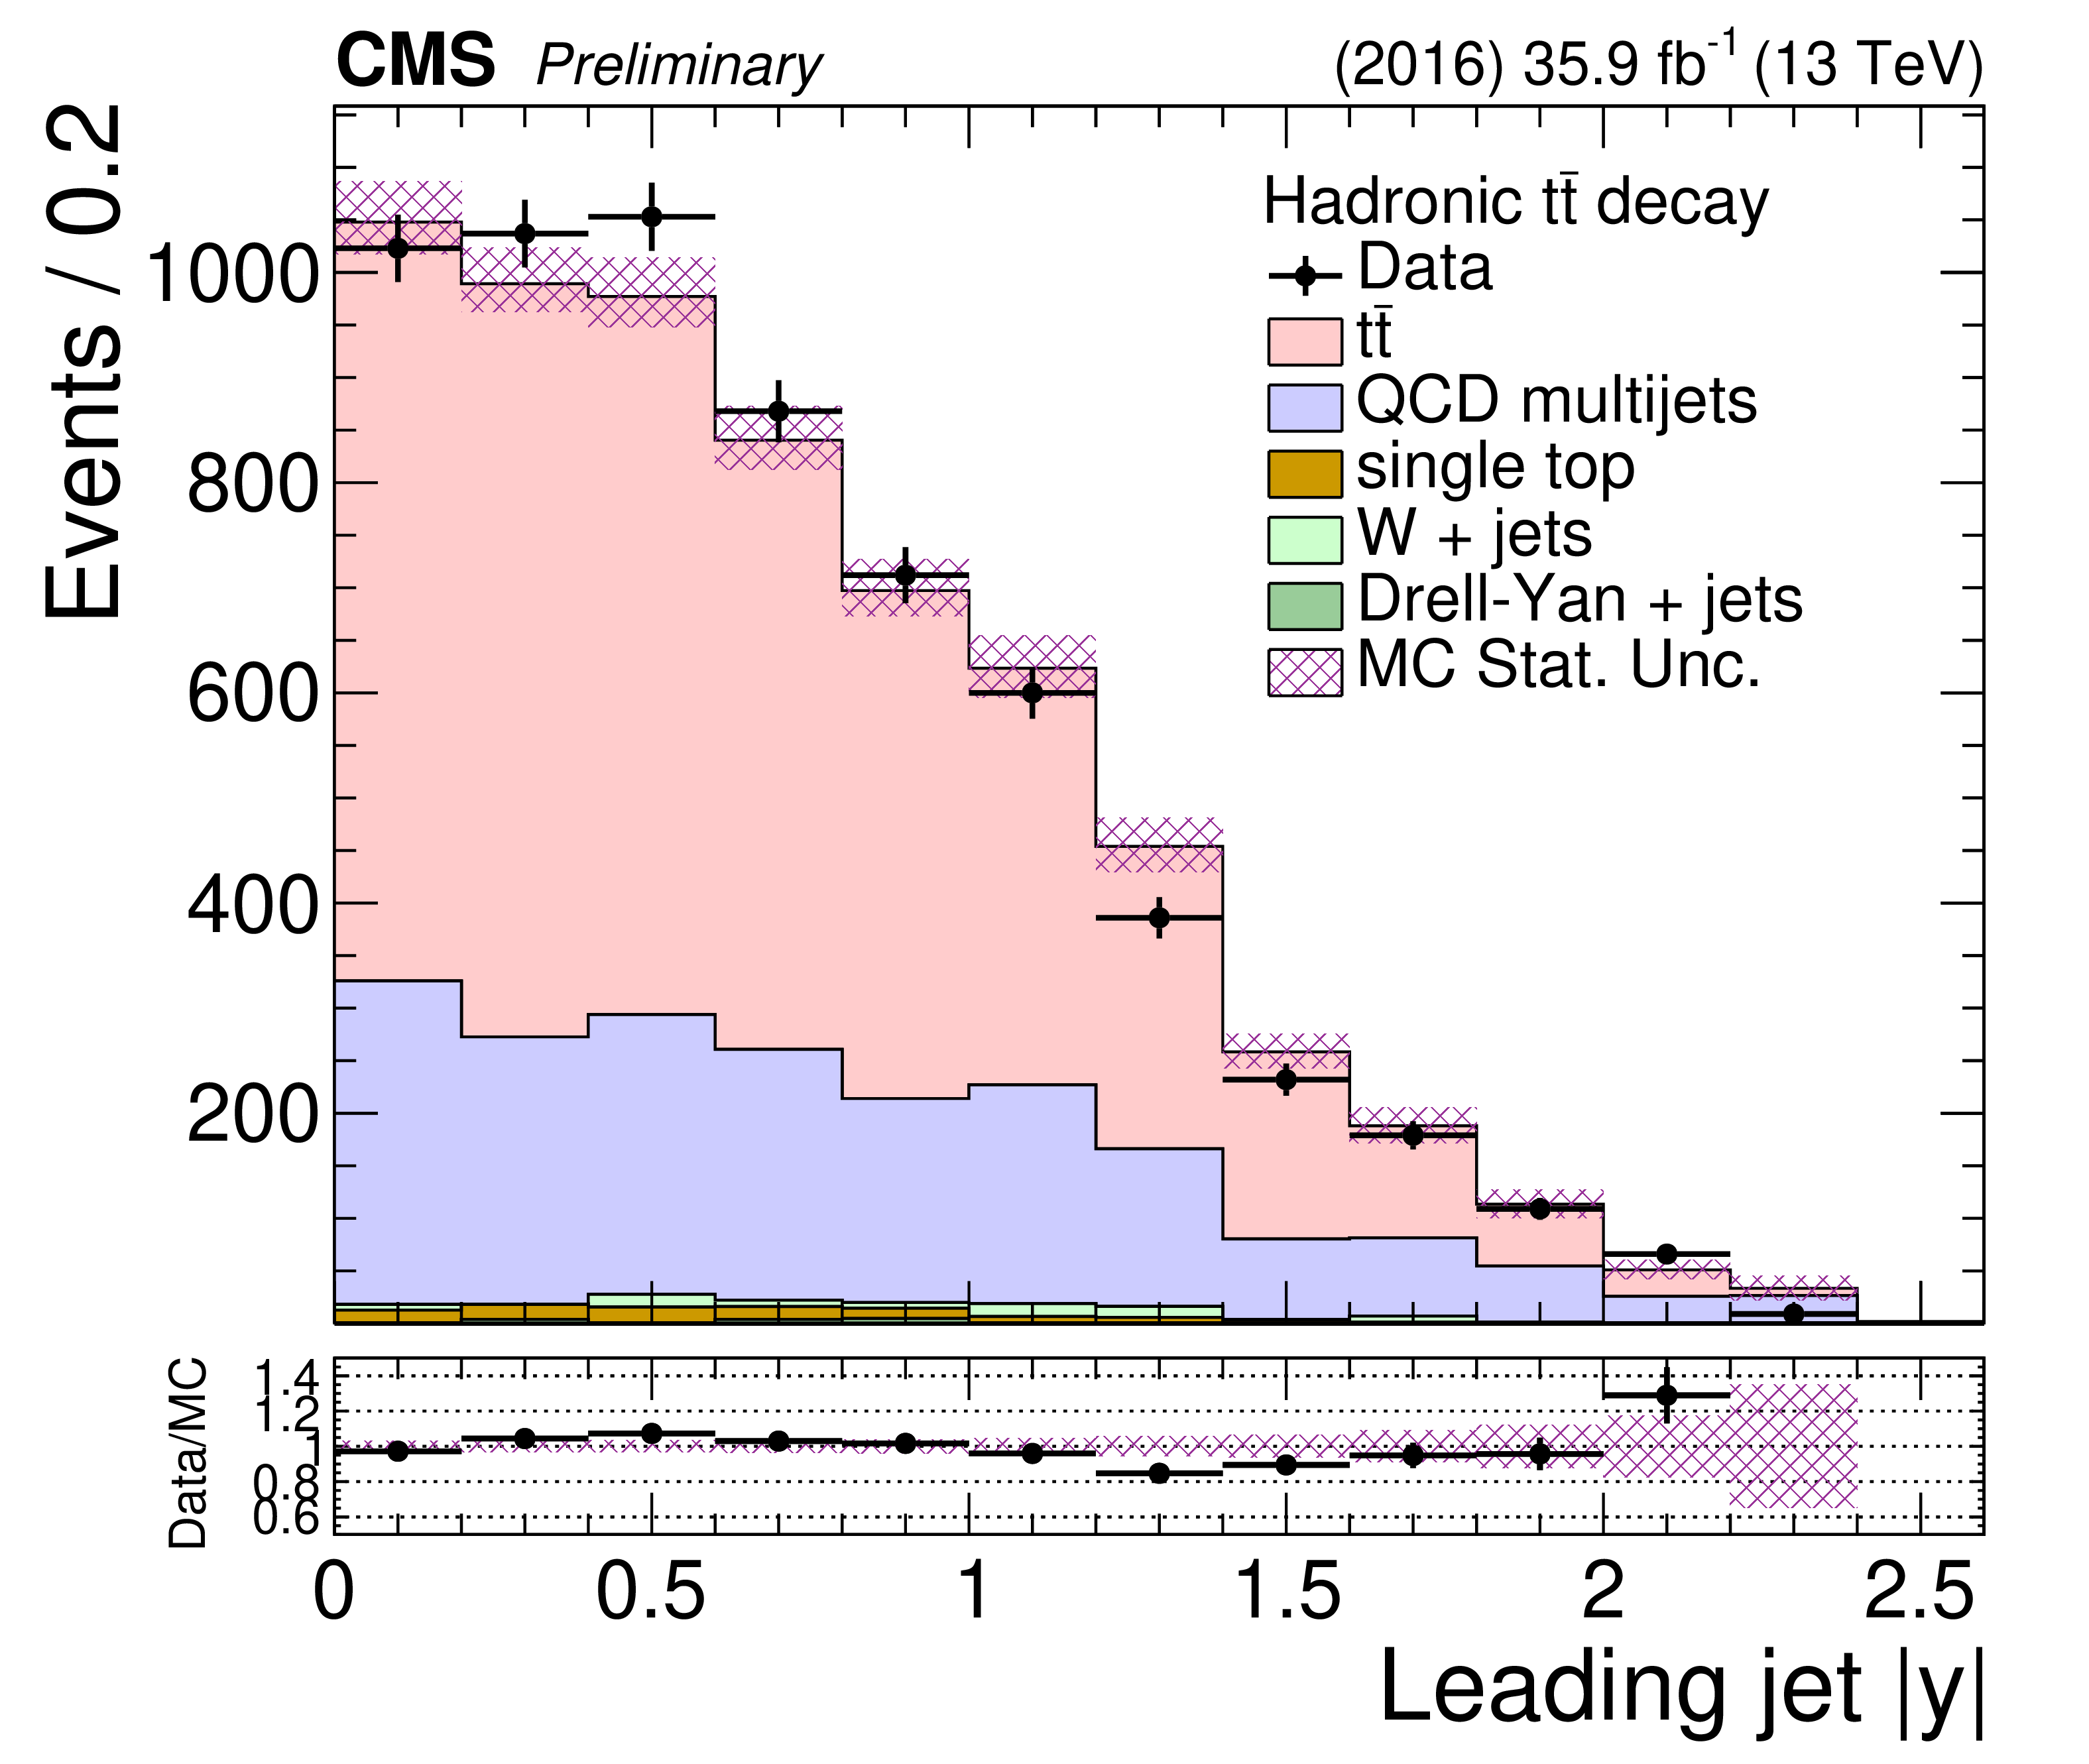
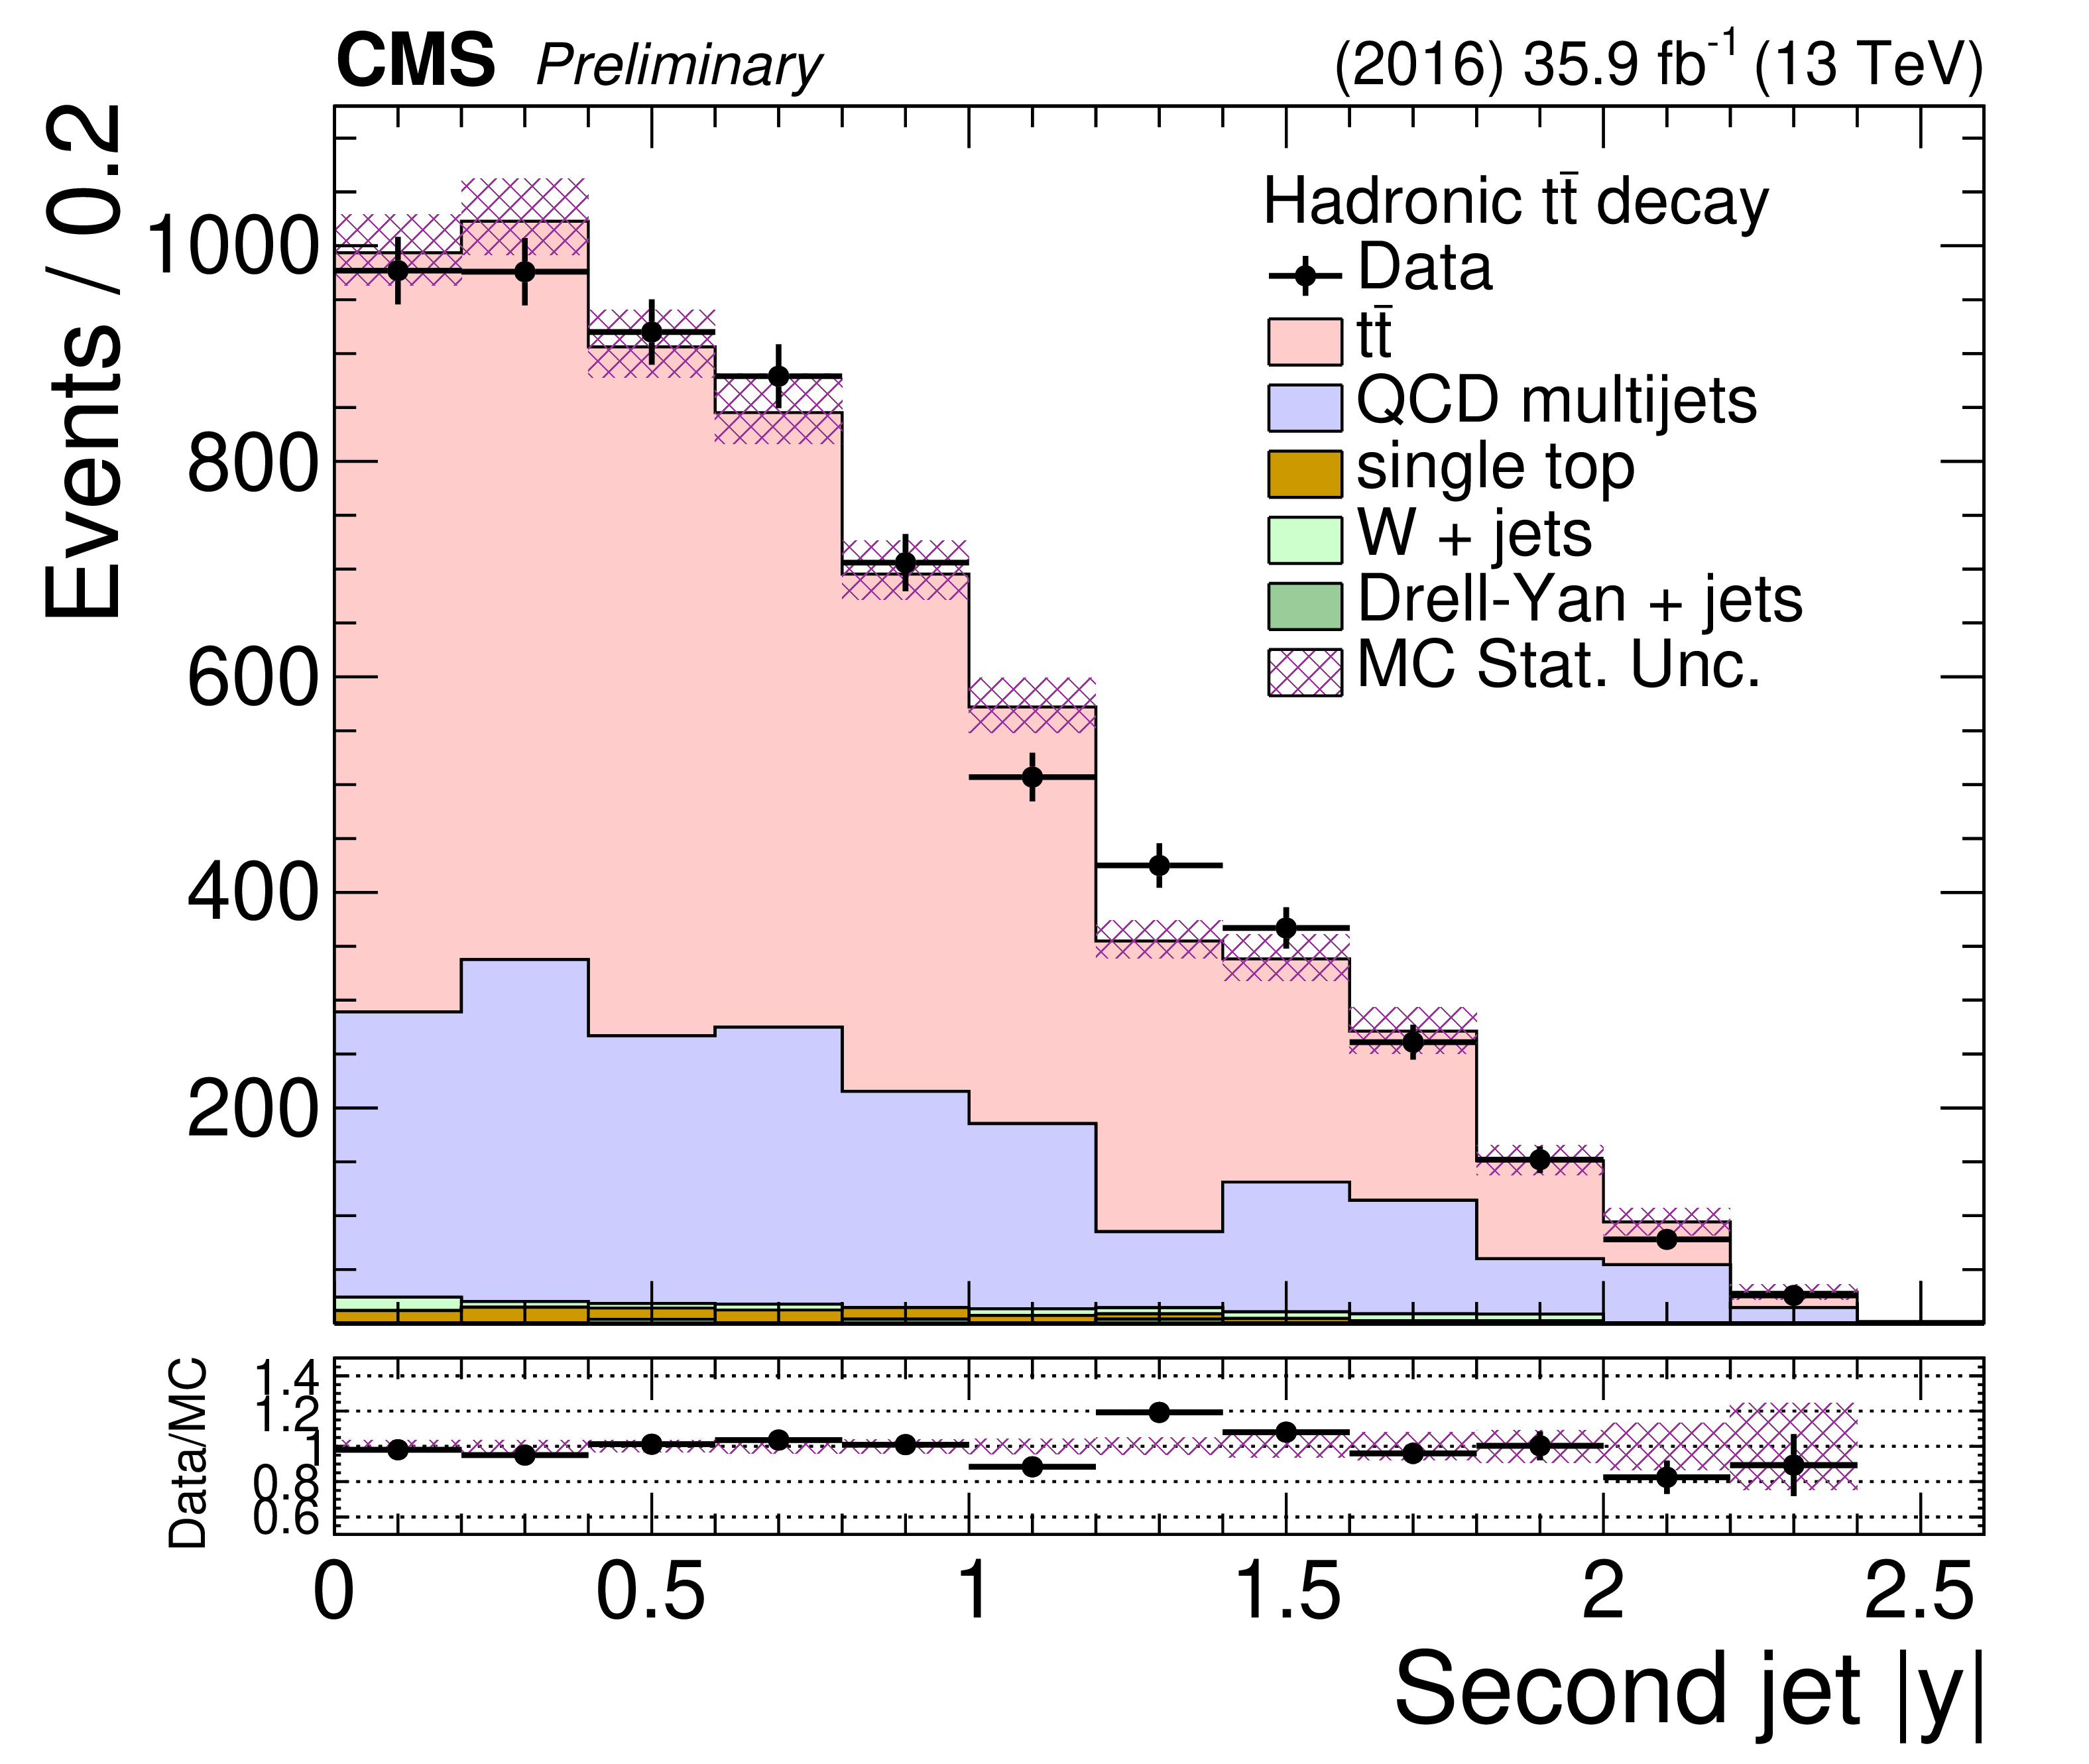
Comparison between data and simulation in the signal region of the ${p_{\mathrm {T}}}$ (top row) and absolute rapidity (bottom row) of the leading (left column) and subleading (right column) large-$R$ jets in the hadronic channel. The $\mathrm{t\bar{t}}$ and QCD multijet processes are normalized according to the post-fit values of the respective yields and are shown as stacked histograms. The data points are shown with solid markers, while the shaded band represents the statistical uncertainty in the simulation. The bottom panel shows the data divided by the sum of the prediction from the simulation. |
png pdf |
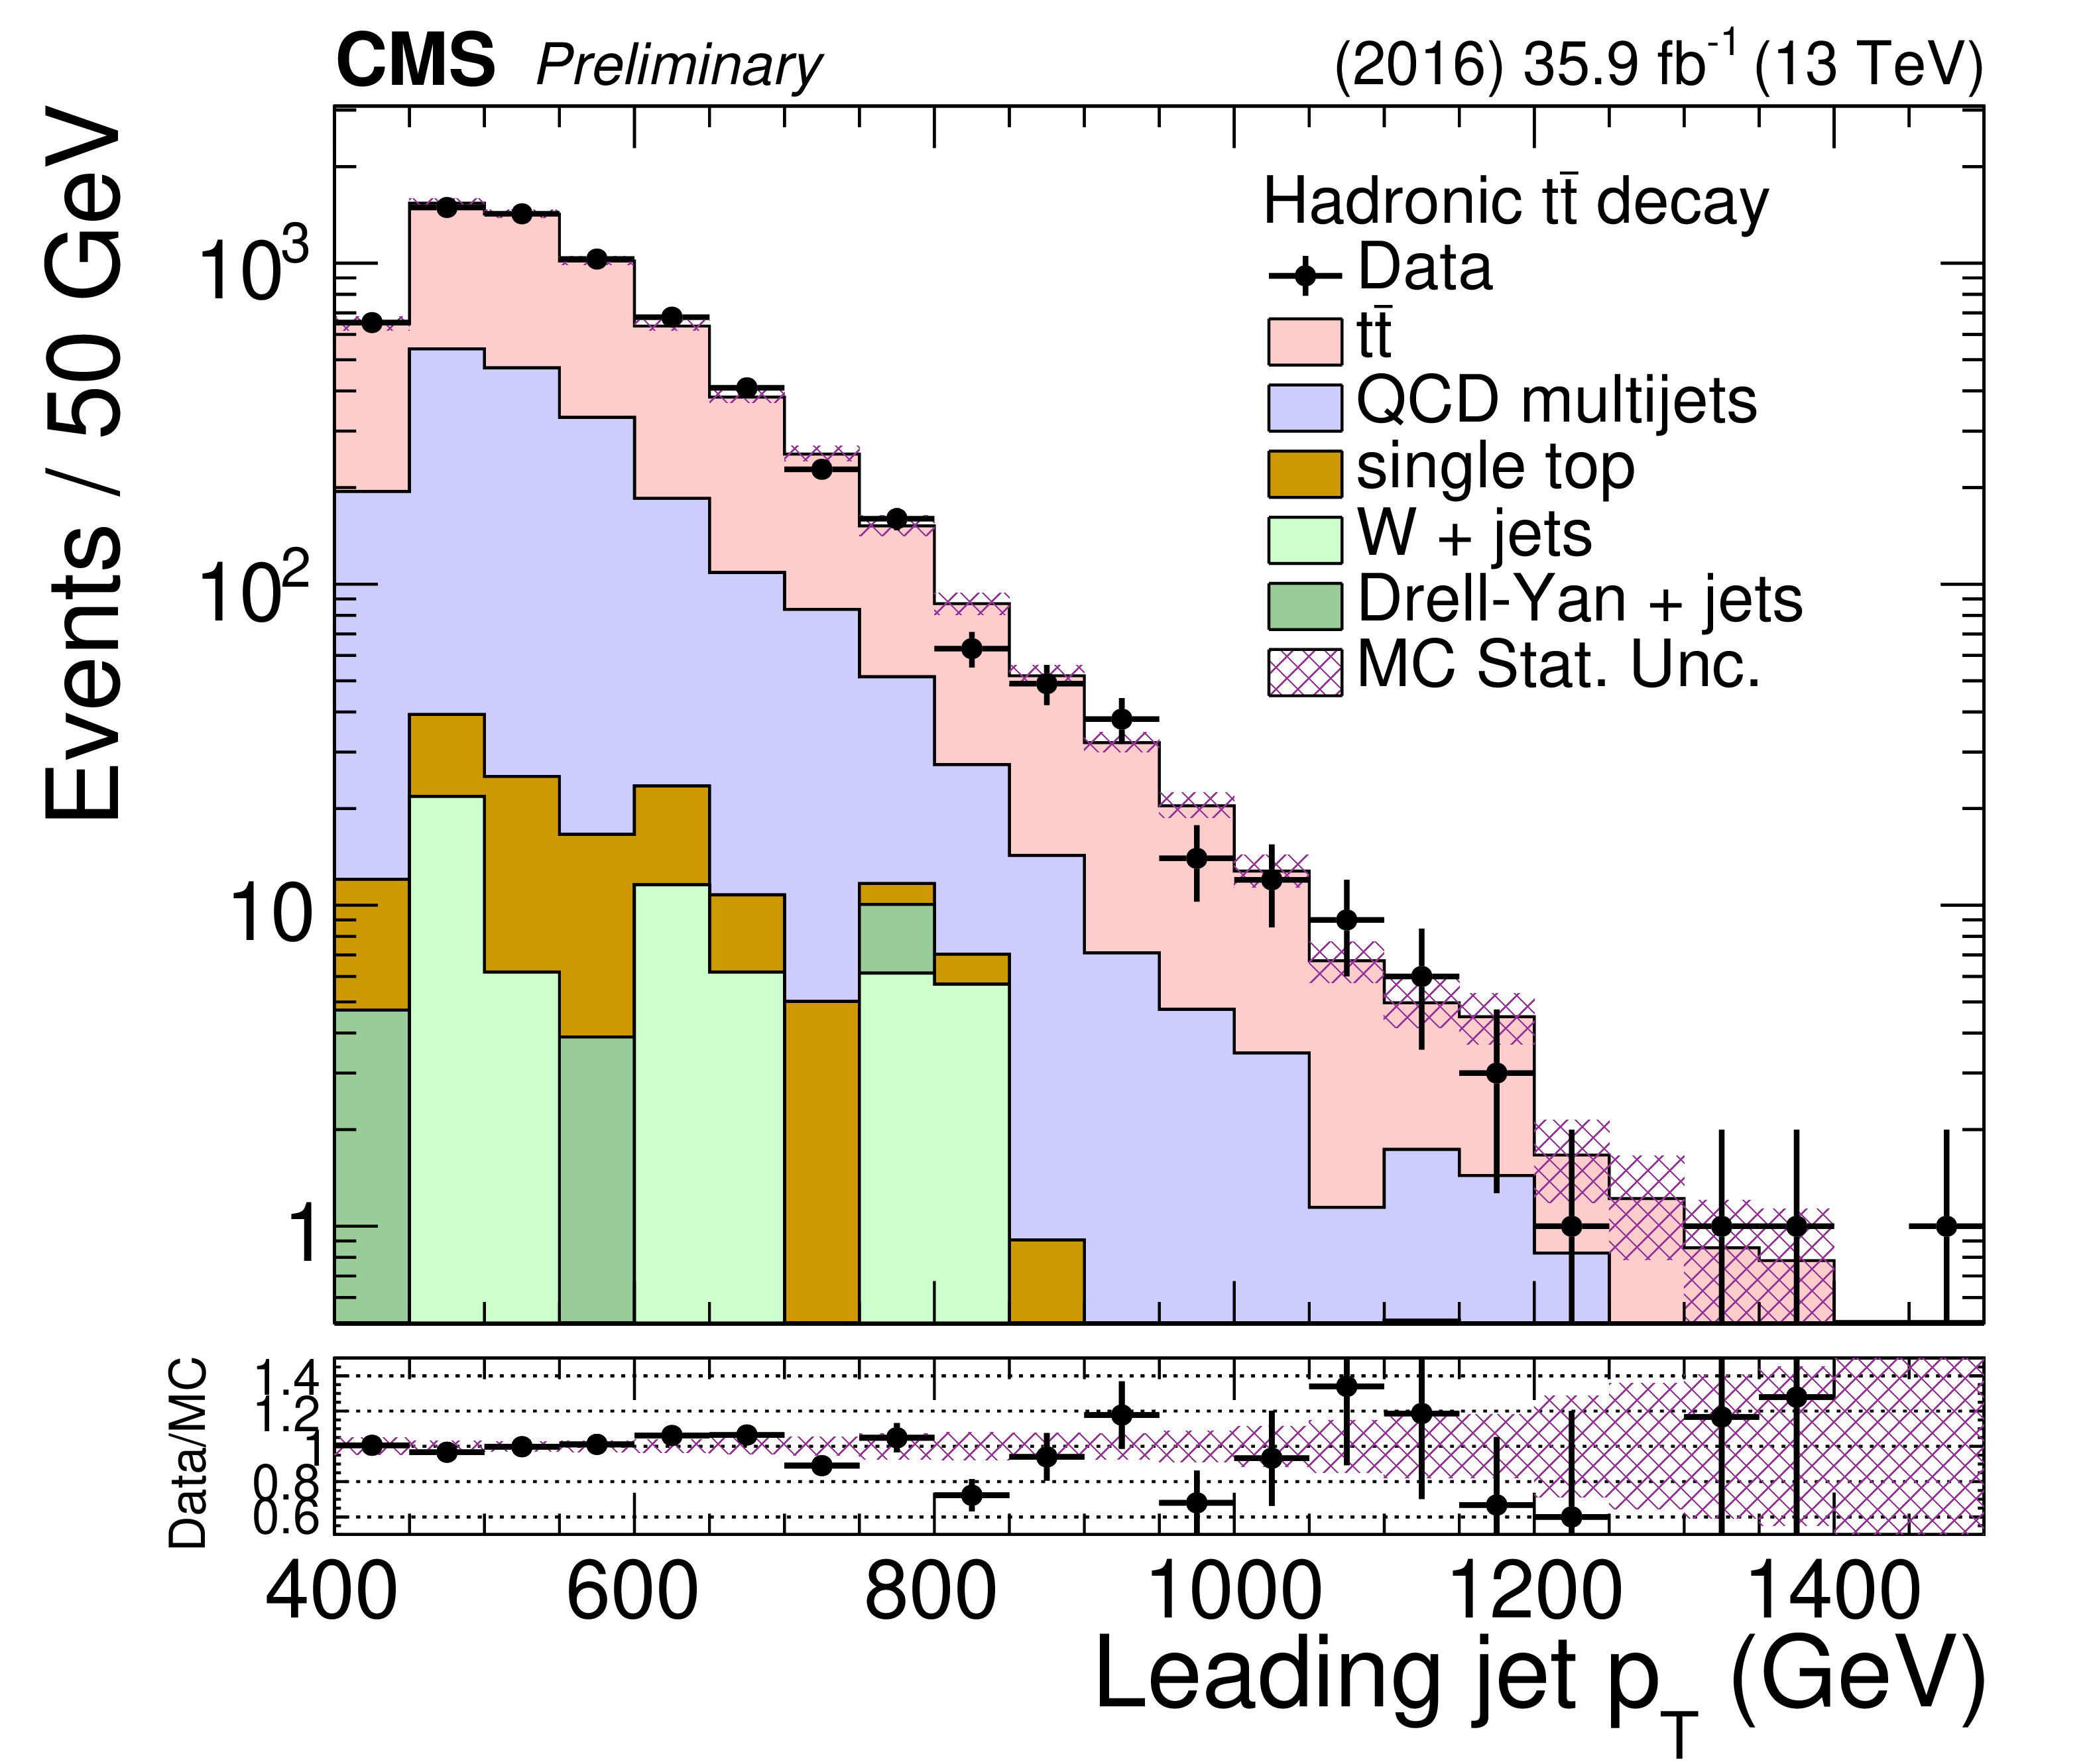
Figure 3-a:
Comparison between data and simulation in the signal region of the ${p_{\mathrm {T}}}$ (top row) and absolute rapidity (bottom row) of the leading (left column) and subleading (right column) large-$R$ jets in the hadronic channel. The $\mathrm{t\bar{t}}$ and QCD multijet processes are normalized according to the post-fit values of the respective yields and are shown as stacked histograms. The data points are shown with solid markers, while the shaded band represents the statistical uncertainty in the simulation. The bottom panel shows the data divided by the sum of the prediction from the simulation. |
png pdf |
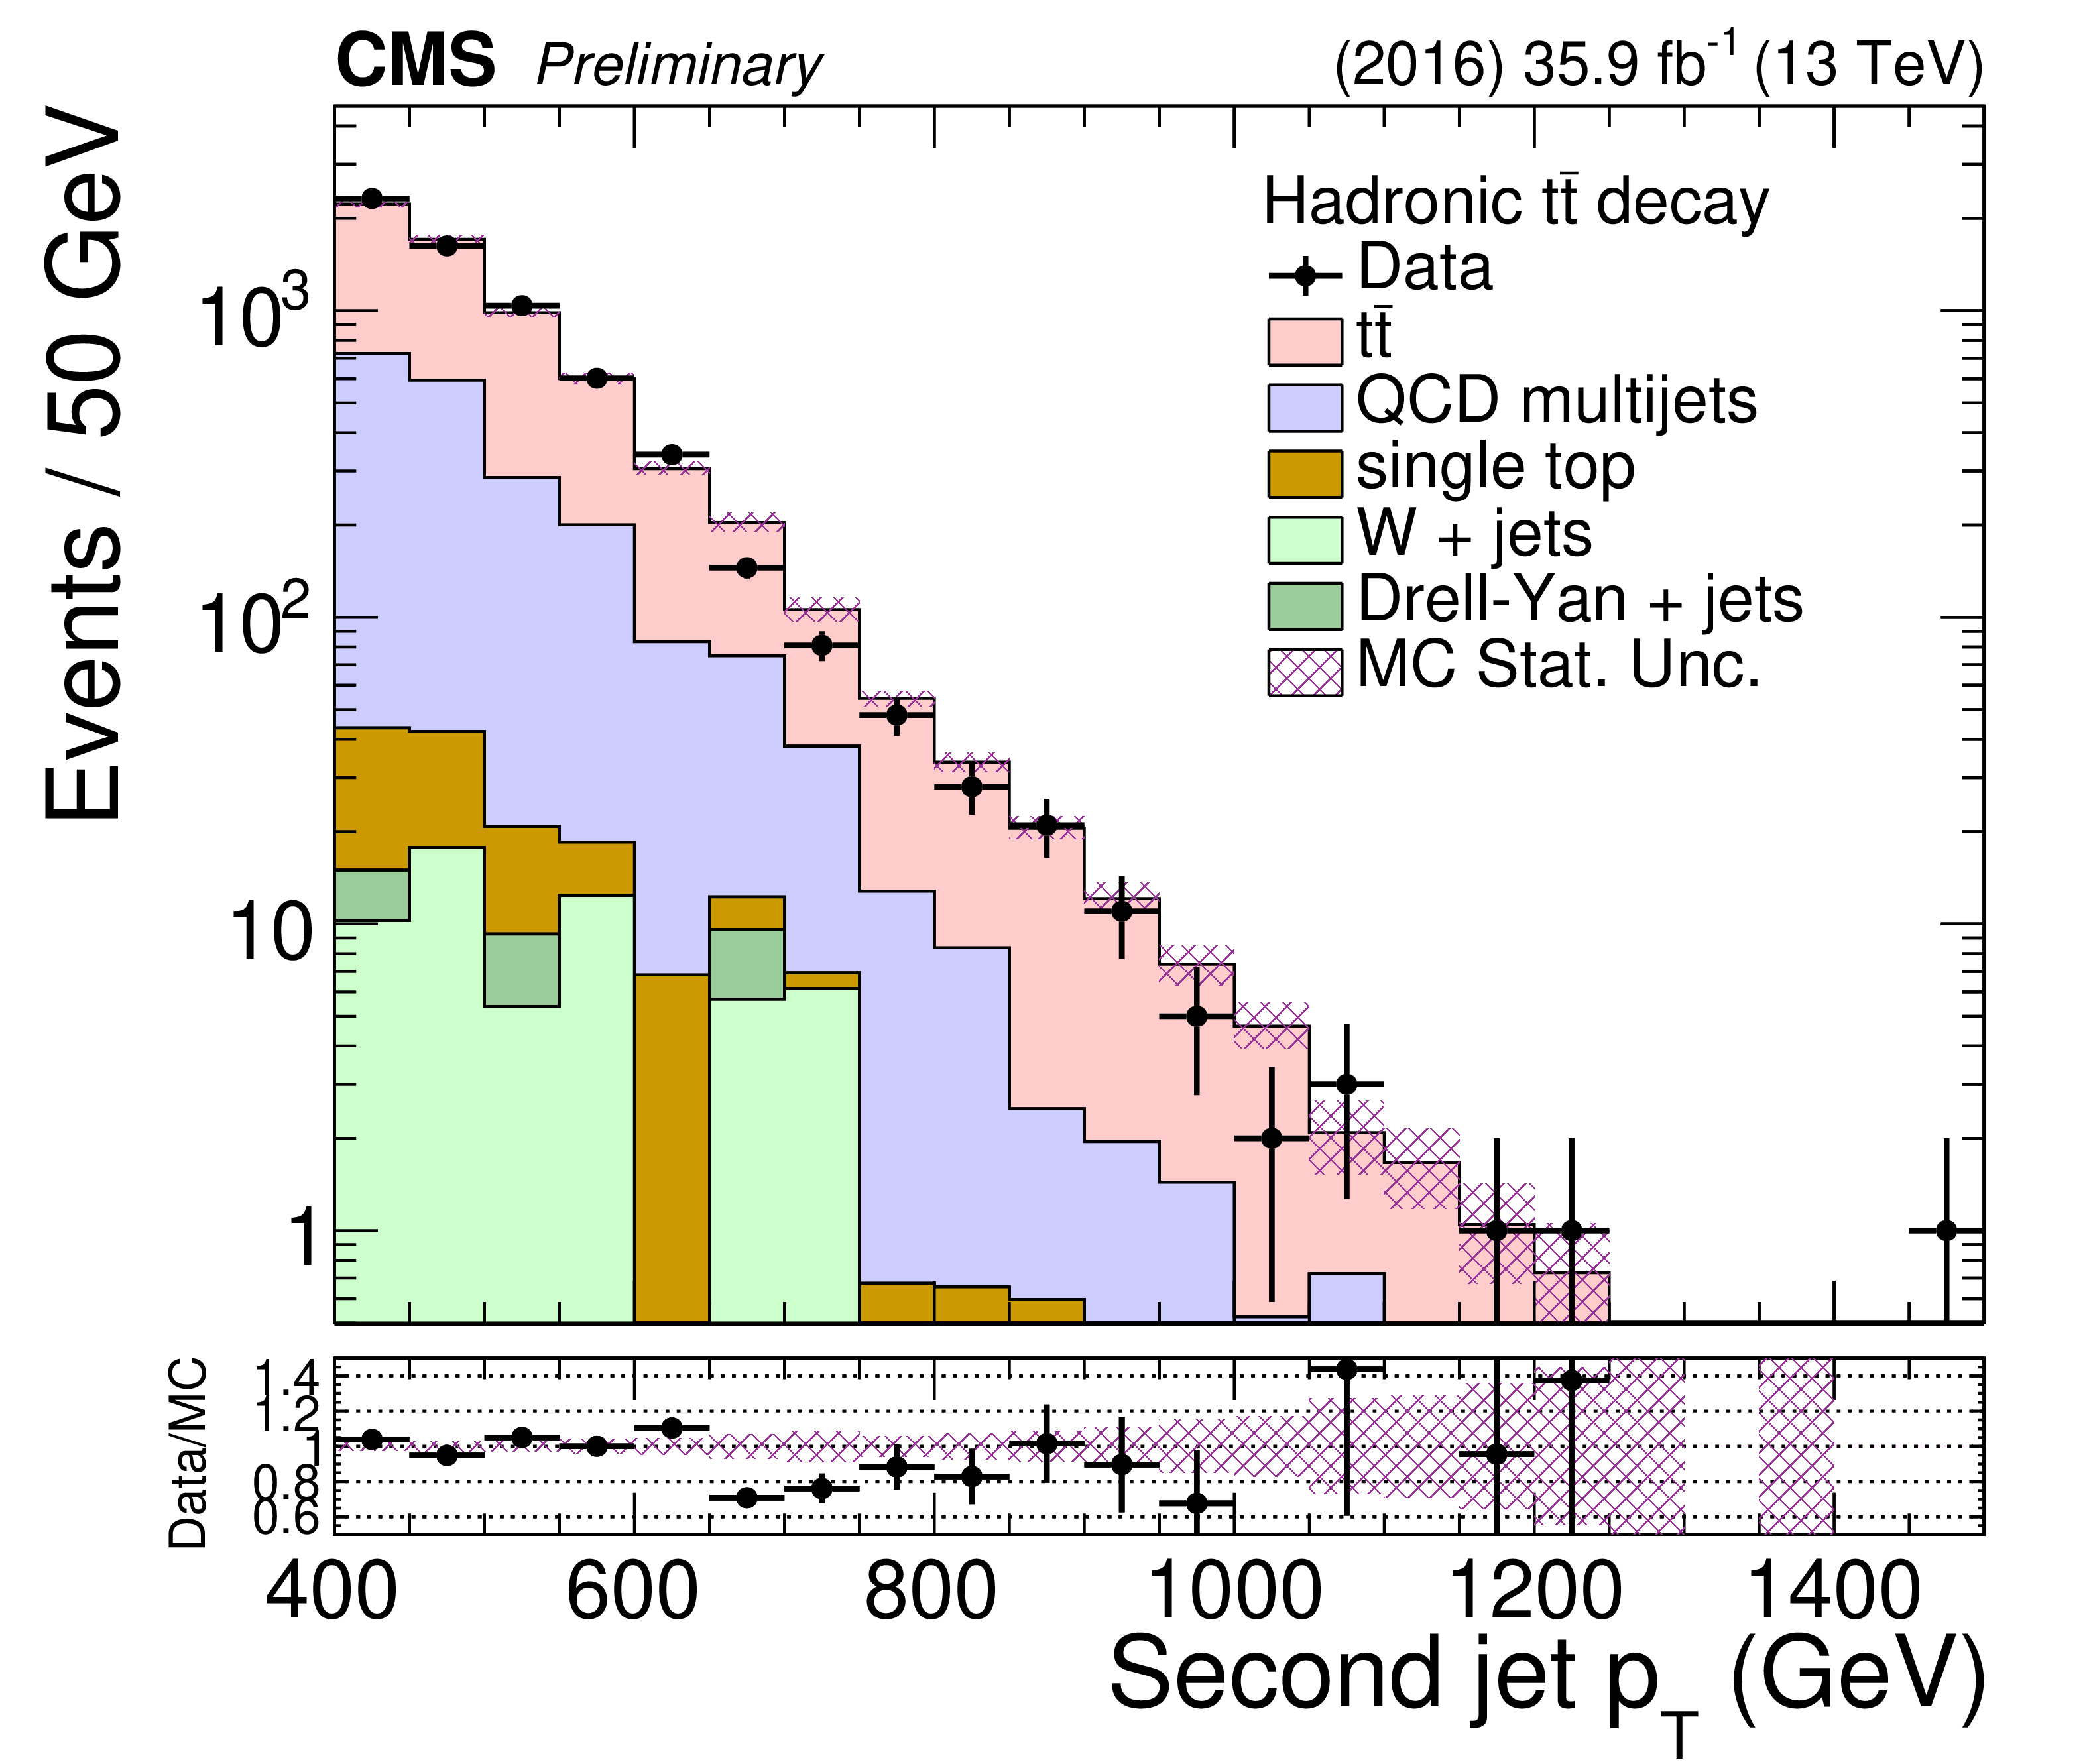
Figure 3-b:
Comparison between data and simulation in the signal region of the ${p_{\mathrm {T}}}$ (top row) and absolute rapidity (bottom row) of the leading (left column) and subleading (right column) large-$R$ jets in the hadronic channel. The $\mathrm{t\bar{t}}$ and QCD multijet processes are normalized according to the post-fit values of the respective yields and are shown as stacked histograms. The data points are shown with solid markers, while the shaded band represents the statistical uncertainty in the simulation. The bottom panel shows the data divided by the sum of the prediction from the simulation. |
png pdf |
Figure 3-c:
Comparison between data and simulation in the signal region of the ${p_{\mathrm {T}}}$ (top row) and absolute rapidity (bottom row) of the leading (left column) and subleading (right column) large-$R$ jets in the hadronic channel. The $\mathrm{t\bar{t}}$ and QCD multijet processes are normalized according to the post-fit values of the respective yields and are shown as stacked histograms. The data points are shown with solid markers, while the shaded band represents the statistical uncertainty in the simulation. The bottom panel shows the data divided by the sum of the prediction from the simulation. |
png pdf |
Figure 3-d:
Comparison between data and simulation in the signal region of the ${p_{\mathrm {T}}}$ (top row) and absolute rapidity (bottom row) of the leading (left column) and subleading (right column) large-$R$ jets in the hadronic channel. The $\mathrm{t\bar{t}}$ and QCD multijet processes are normalized according to the post-fit values of the respective yields and are shown as stacked histograms. The data points are shown with solid markers, while the shaded band represents the statistical uncertainty in the simulation. The bottom panel shows the data divided by the sum of the prediction from the simulation. |
png pdf |
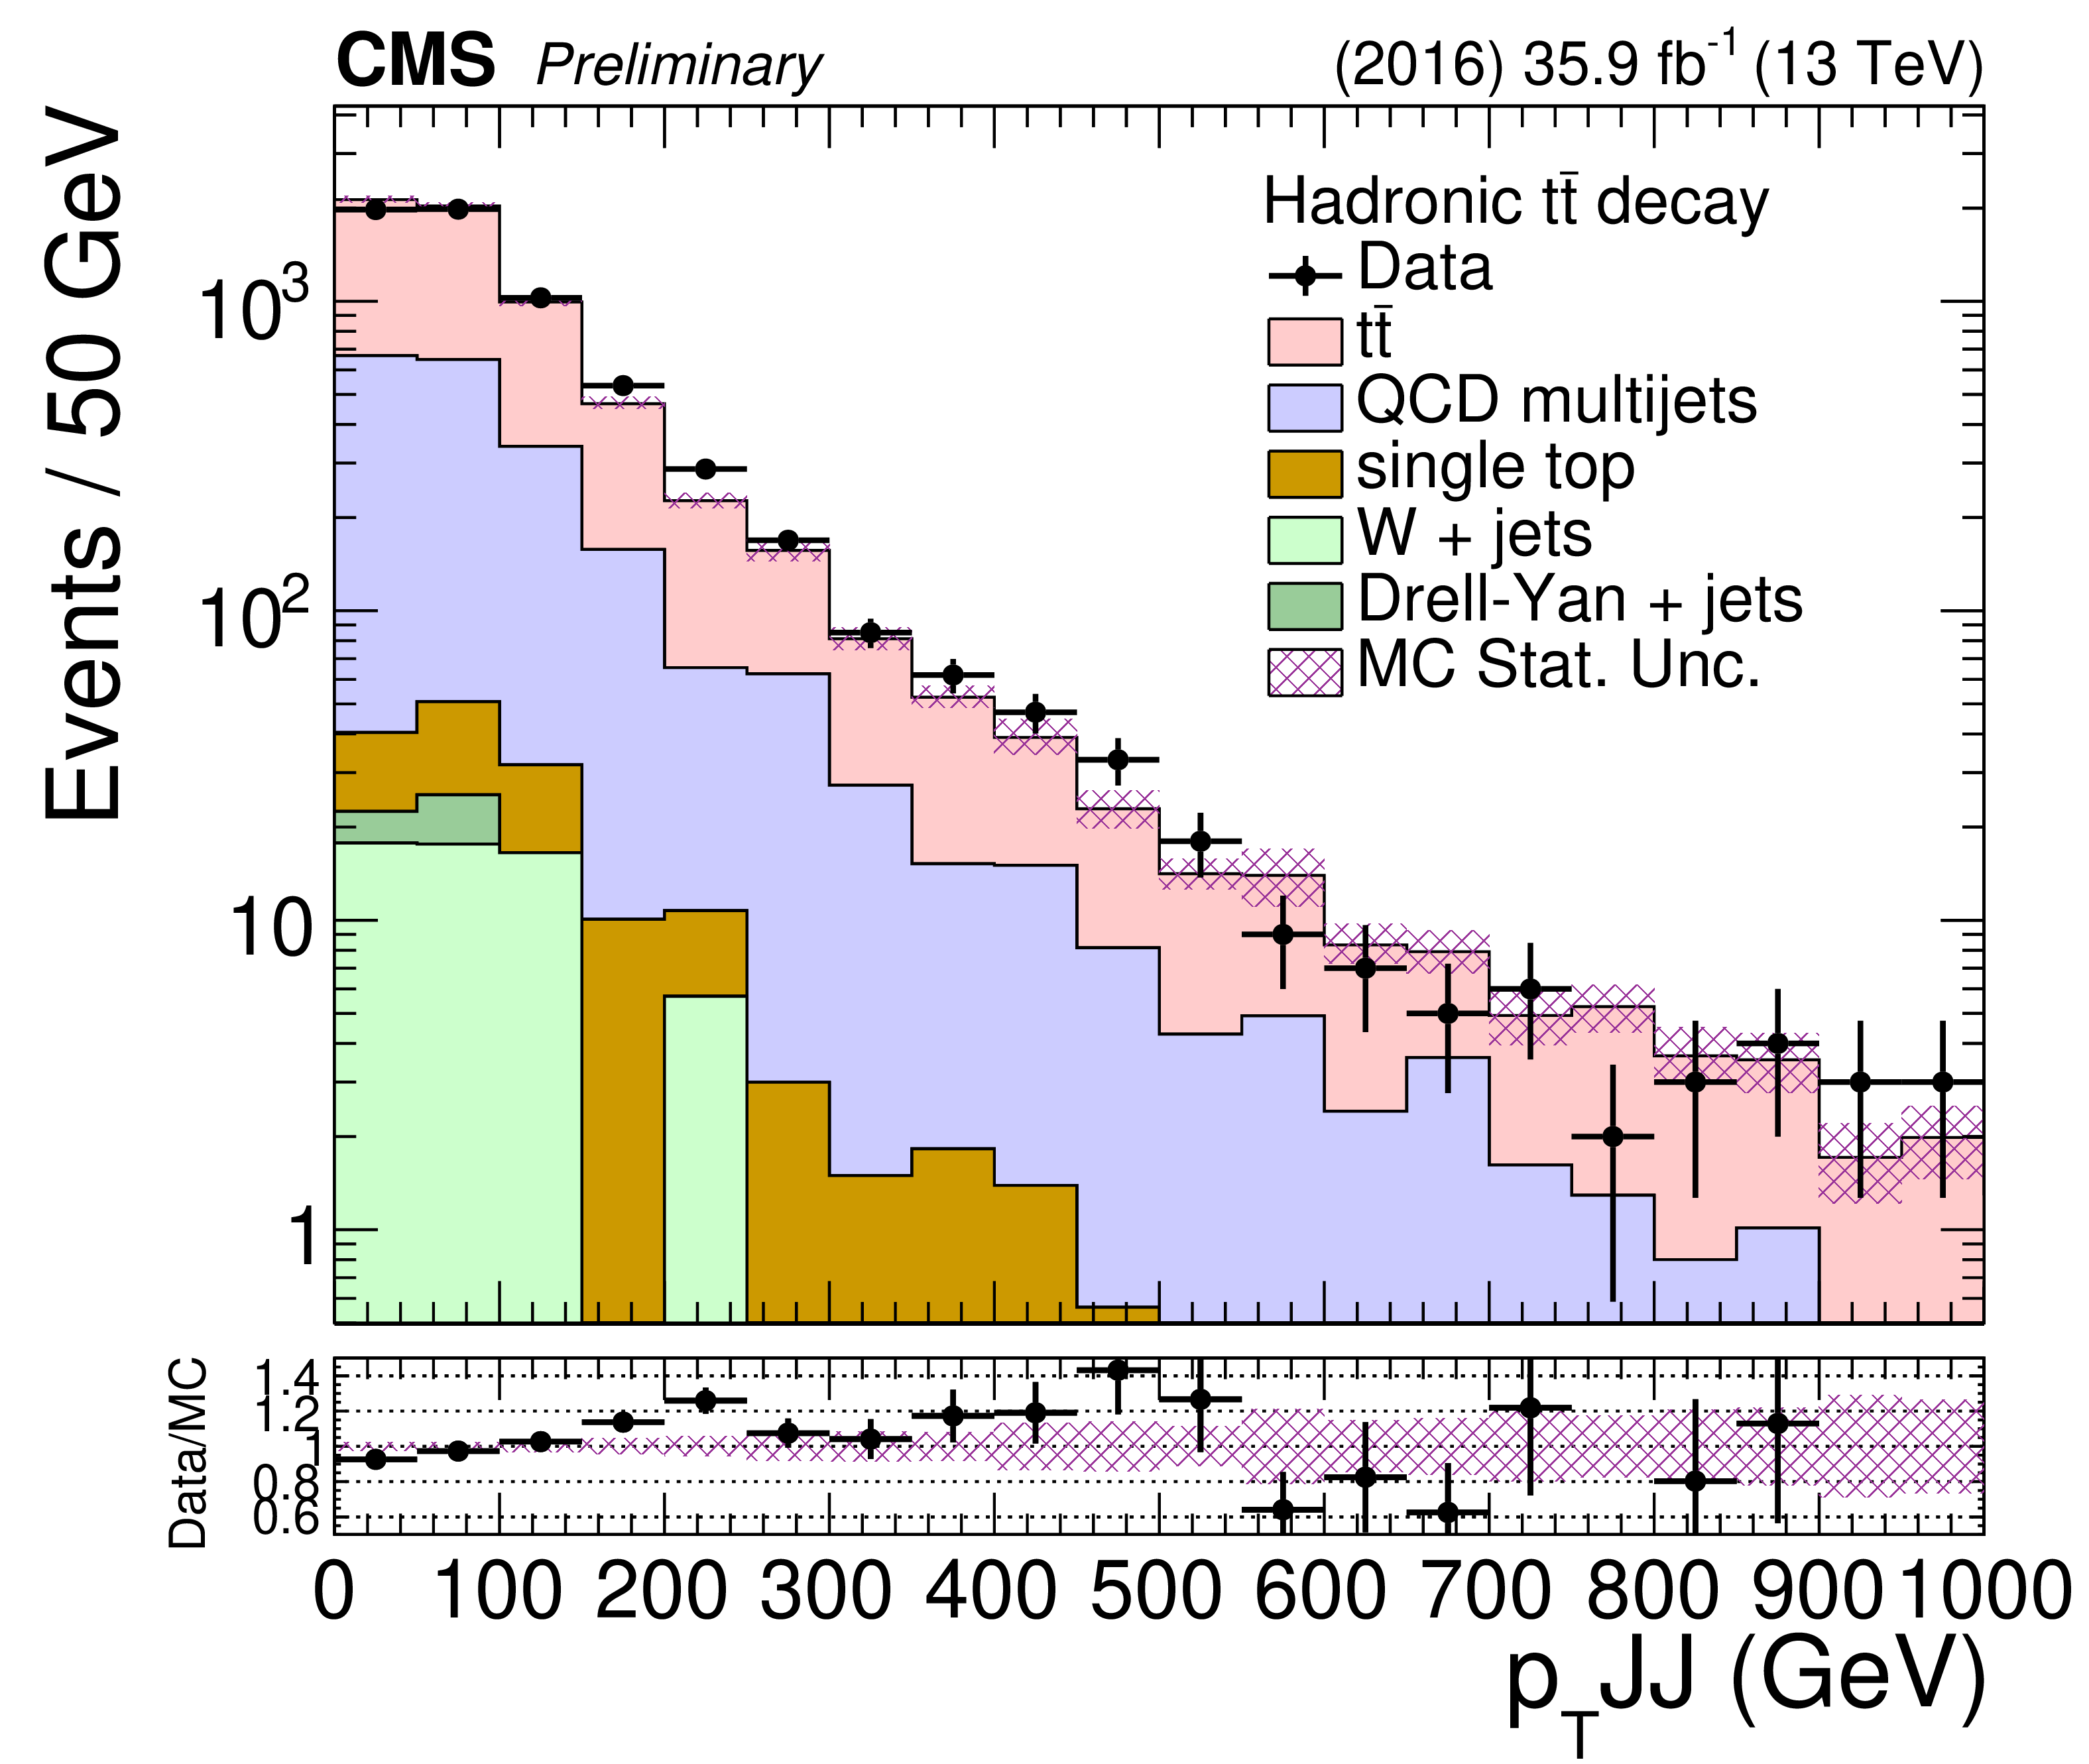
Figure 4:
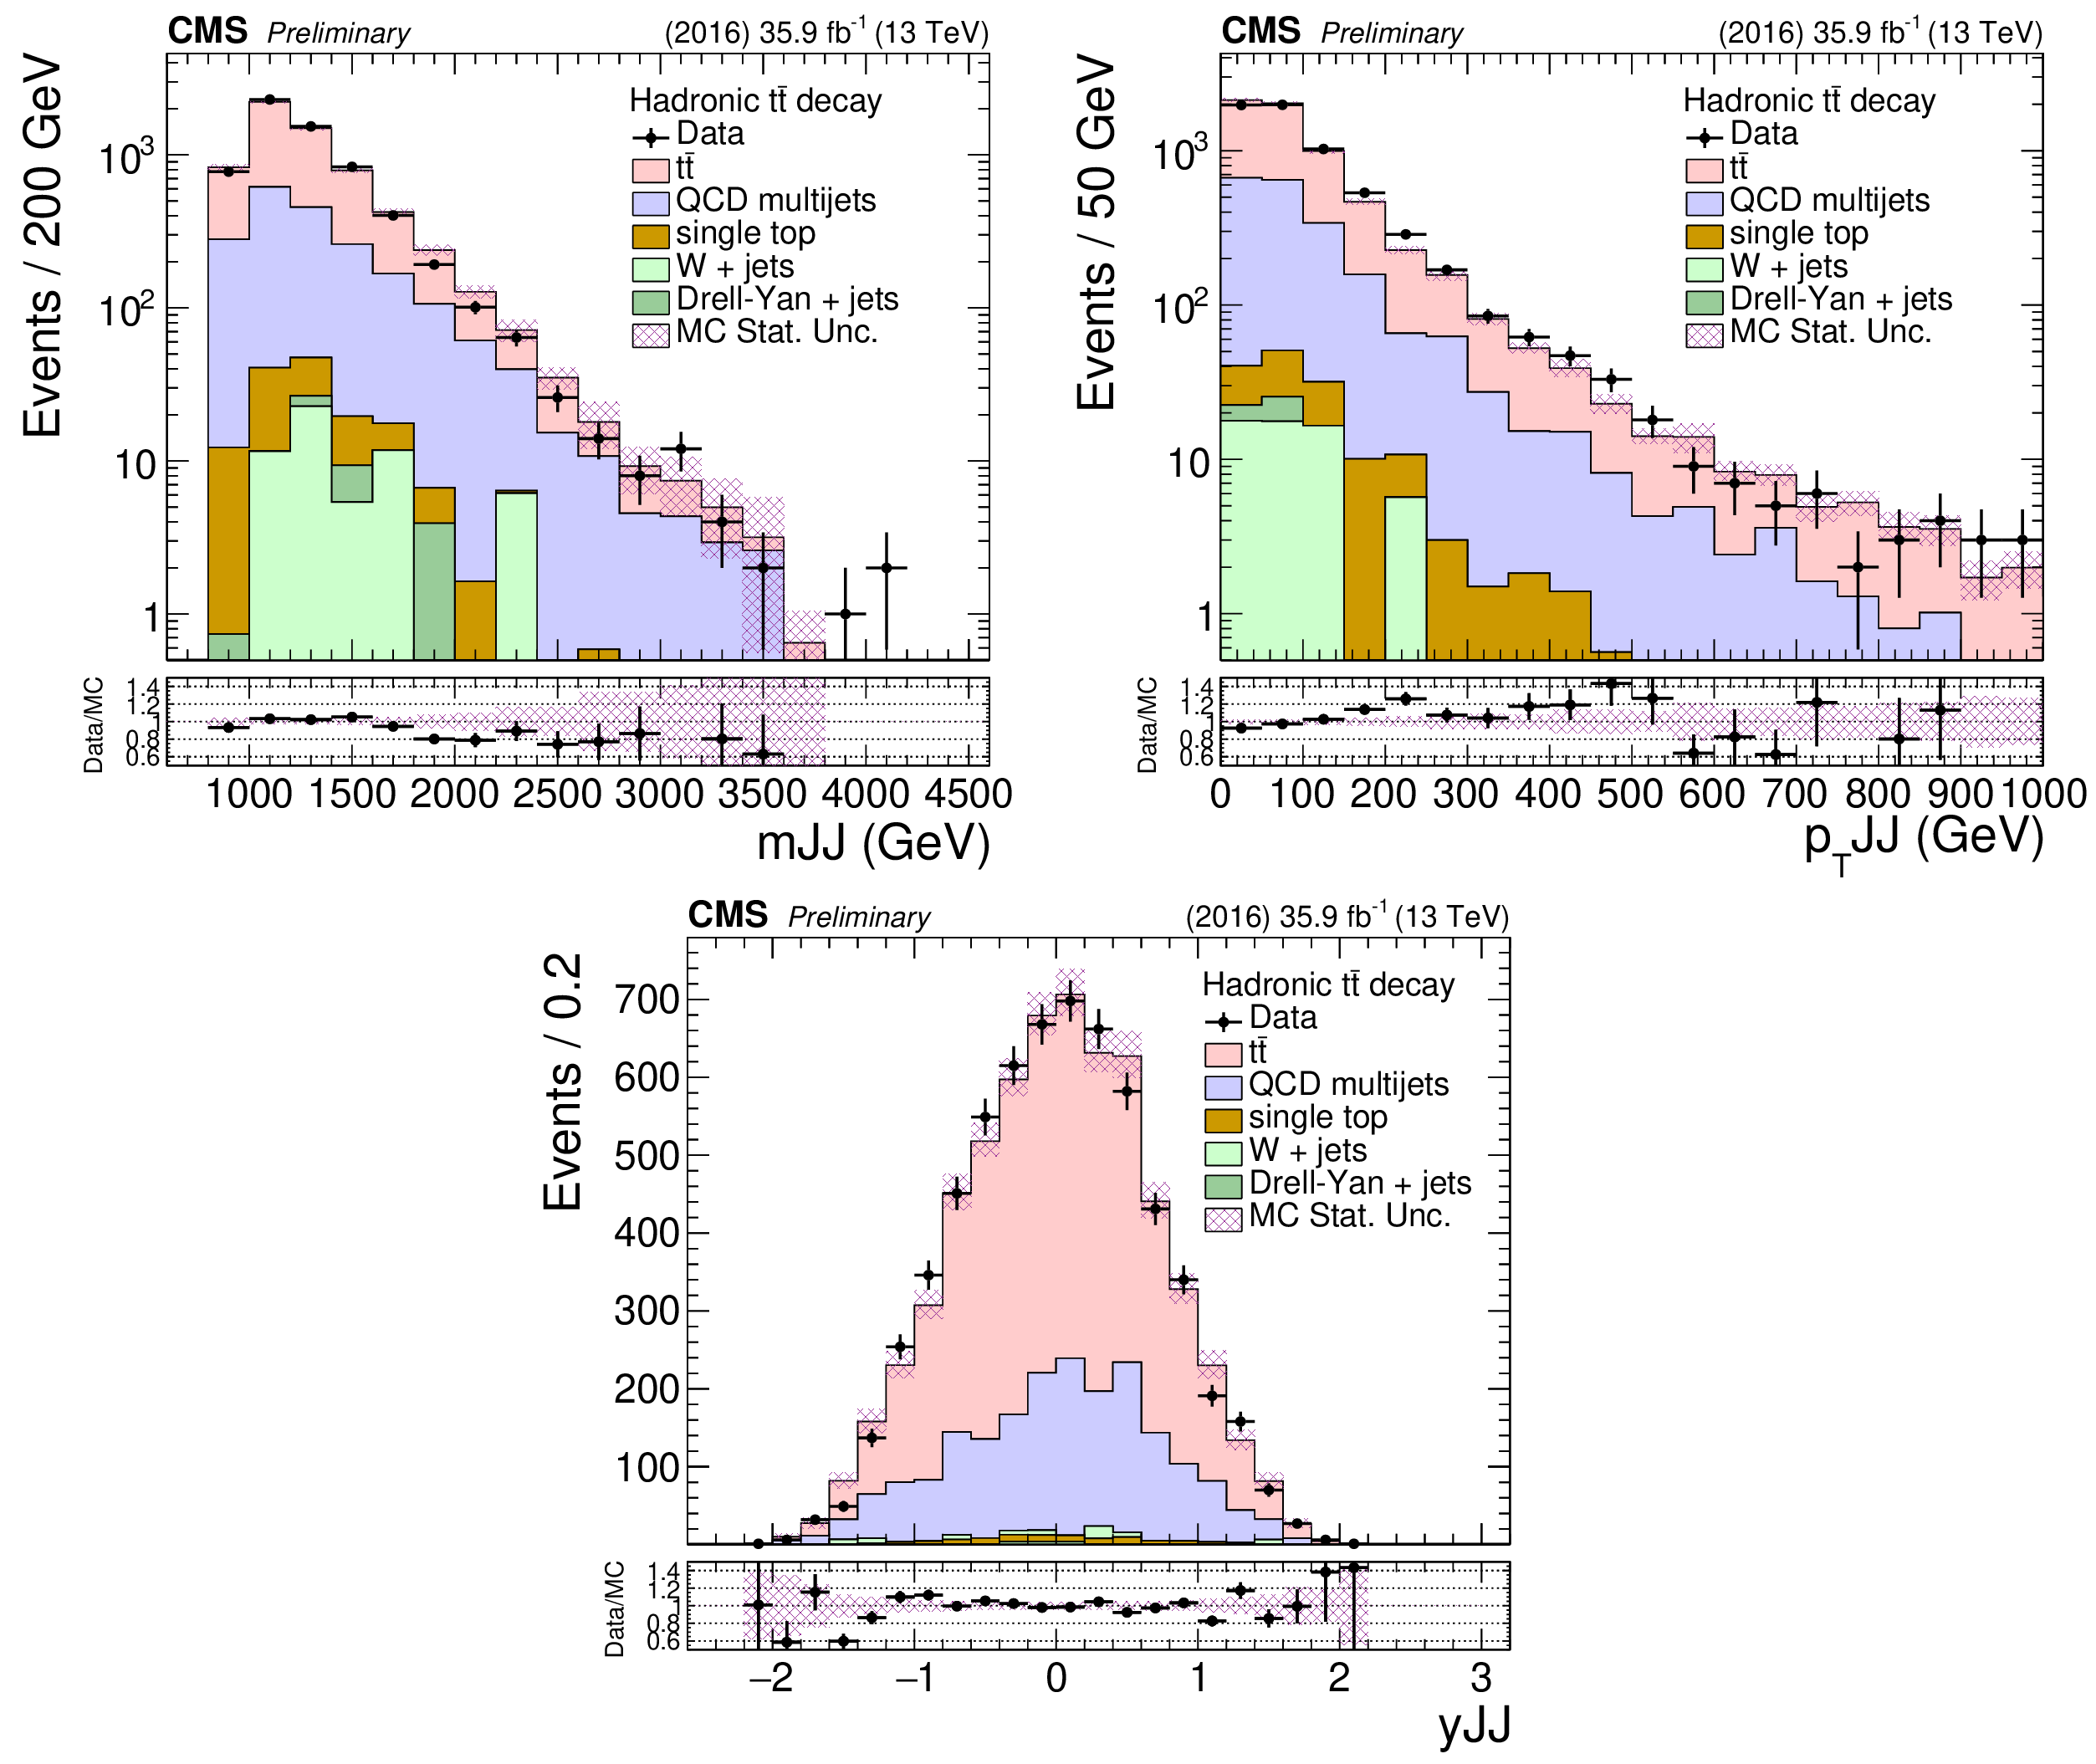
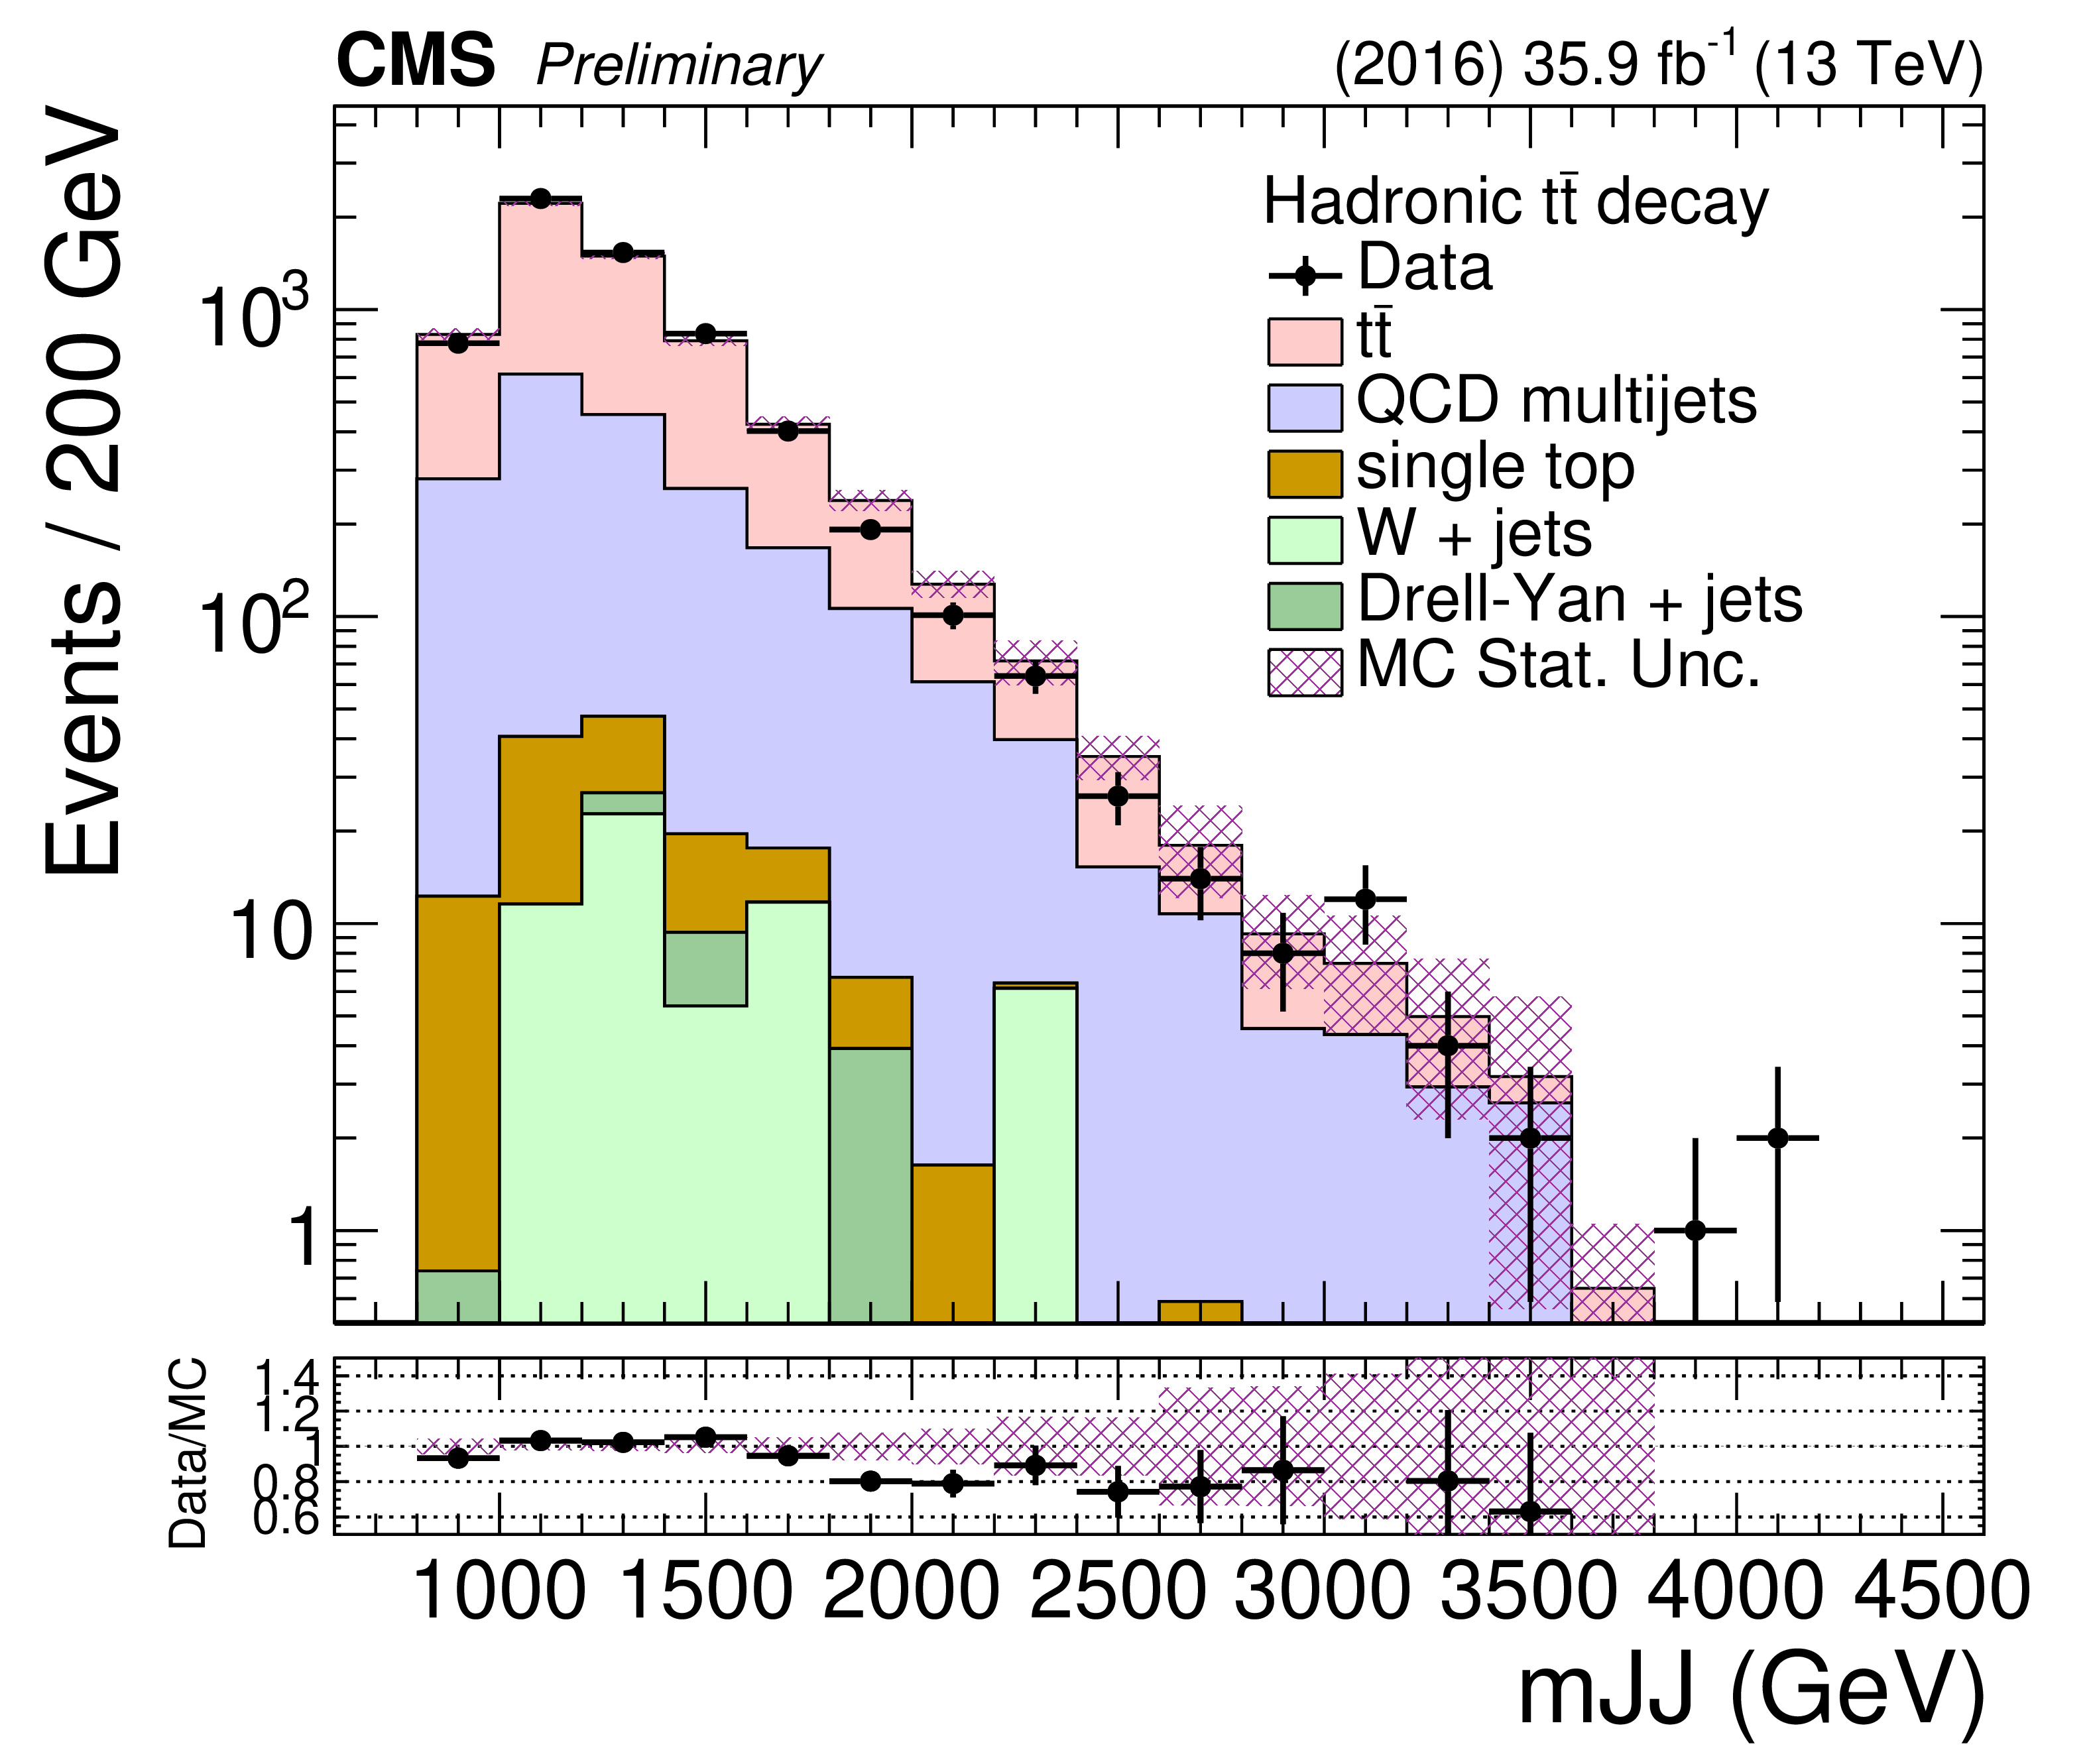
Comparison between data and simulation in the signal region in the hadronic channel of the $\mathrm{t\bar{t}}$ system variables reconstructed from the two leading large-$R$ jets, specifically, the invariant mass (top left), $ {p_{\mathrm {T}}} $ (top right), and rapidity (bottom). The $\mathrm{t\bar{t}}$ and QCD multijet processes are normalized according to the post-fit values of the respective yields and are shown as stacked histograms. The data points are shown with solid markers, while the shaded band represents the statistical uncertainty in the simulation. The bottom panel shows the data divided by the sum of the prediction from the simulation. |
png pdf |
Figure 4-a:
Comparison between data and simulation in the signal region in the hadronic channel of the $\mathrm{t\bar{t}}$ system variables reconstructed from the two leading large-$R$ jets, specifically, the invariant mass (top left), $ {p_{\mathrm {T}}} $ (top right), and rapidity (bottom). The $\mathrm{t\bar{t}}$ and QCD multijet processes are normalized according to the post-fit values of the respective yields and are shown as stacked histograms. The data points are shown with solid markers, while the shaded band represents the statistical uncertainty in the simulation. The bottom panel shows the data divided by the sum of the prediction from the simulation. |
png pdf |
Figure 4-b:
Comparison between data and simulation in the signal region in the hadronic channel of the $\mathrm{t\bar{t}}$ system variables reconstructed from the two leading large-$R$ jets, specifically, the invariant mass (top left), $ {p_{\mathrm {T}}} $ (top right), and rapidity (bottom). The $\mathrm{t\bar{t}}$ and QCD multijet processes are normalized according to the post-fit values of the respective yields and are shown as stacked histograms. The data points are shown with solid markers, while the shaded band represents the statistical uncertainty in the simulation. The bottom panel shows the data divided by the sum of the prediction from the simulation. |

png pdf |
Figure 4-c:
Comparison between data and simulation in the signal region in the hadronic channel of the $\mathrm{t\bar{t}}$ system variables reconstructed from the two leading large-$R$ jets, specifically, the invariant mass (top left), $ {p_{\mathrm {T}}} $ (top right), and rapidity (bottom). The $\mathrm{t\bar{t}}$ and QCD multijet processes are normalized according to the post-fit values of the respective yields and are shown as stacked histograms. The data points are shown with solid markers, while the shaded band represents the statistical uncertainty in the simulation. The bottom panel shows the data divided by the sum of the prediction from the simulation. |
png pdf |
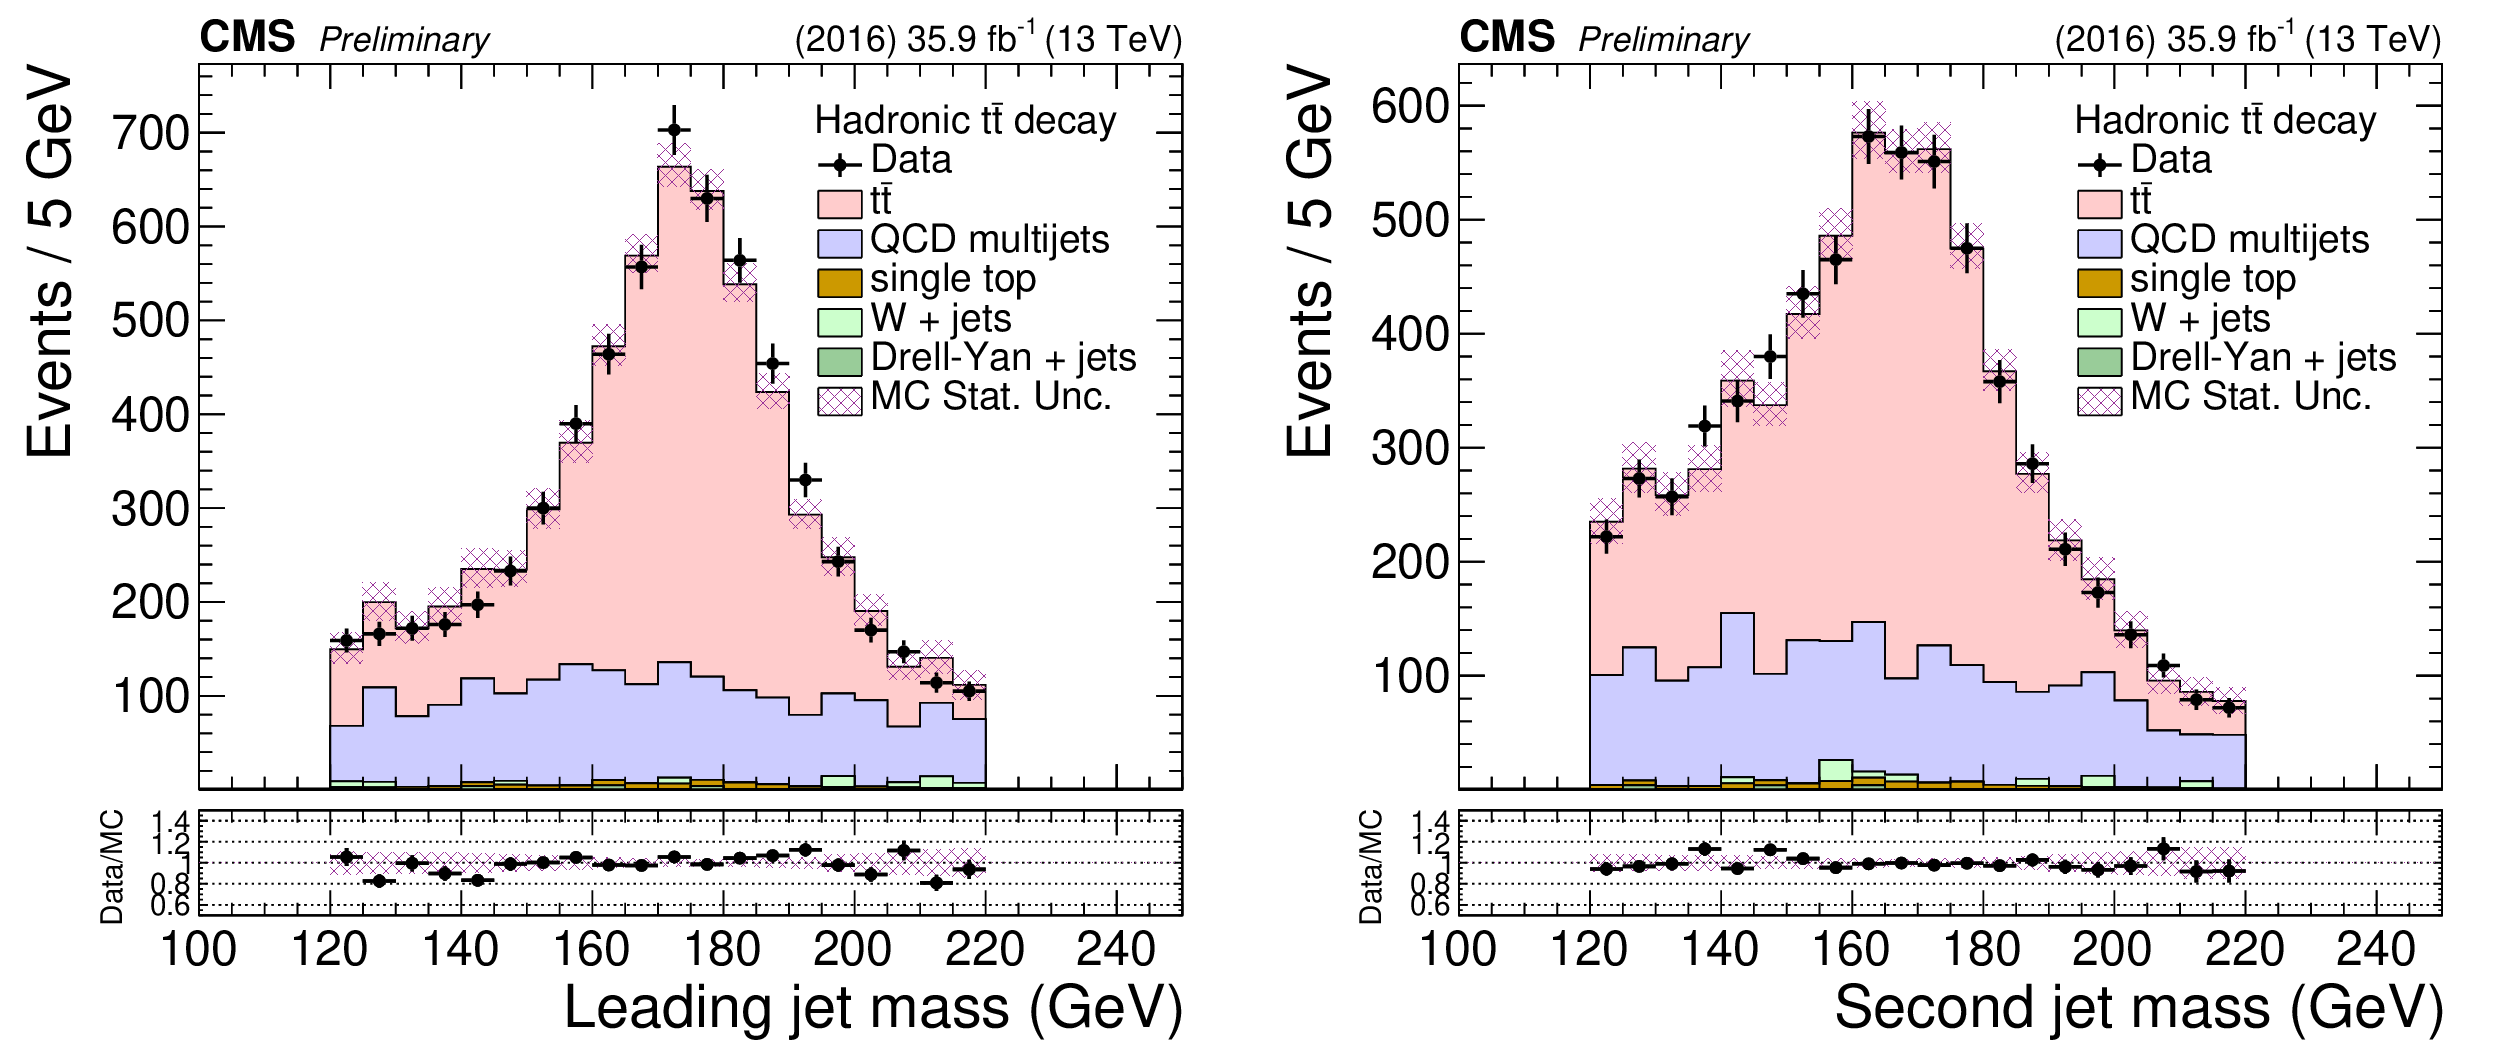
Figure 5:
Comparison between data and simulation in the signal region of the mass of the leading (left) and subleading (right) large-$R$ jets in the hadronic channel. The $\mathrm{t\bar{t}}$ and QCD multijet processes are normalized according to the post-fit values of the respective yields and are shown as stacked histograms. The data points are shown with solid markers, while the shaded band represents the statistical uncertainty in the simulation. The bottom panel shows the data divided by the sum of the prediction from the simulation. |
png pdf |
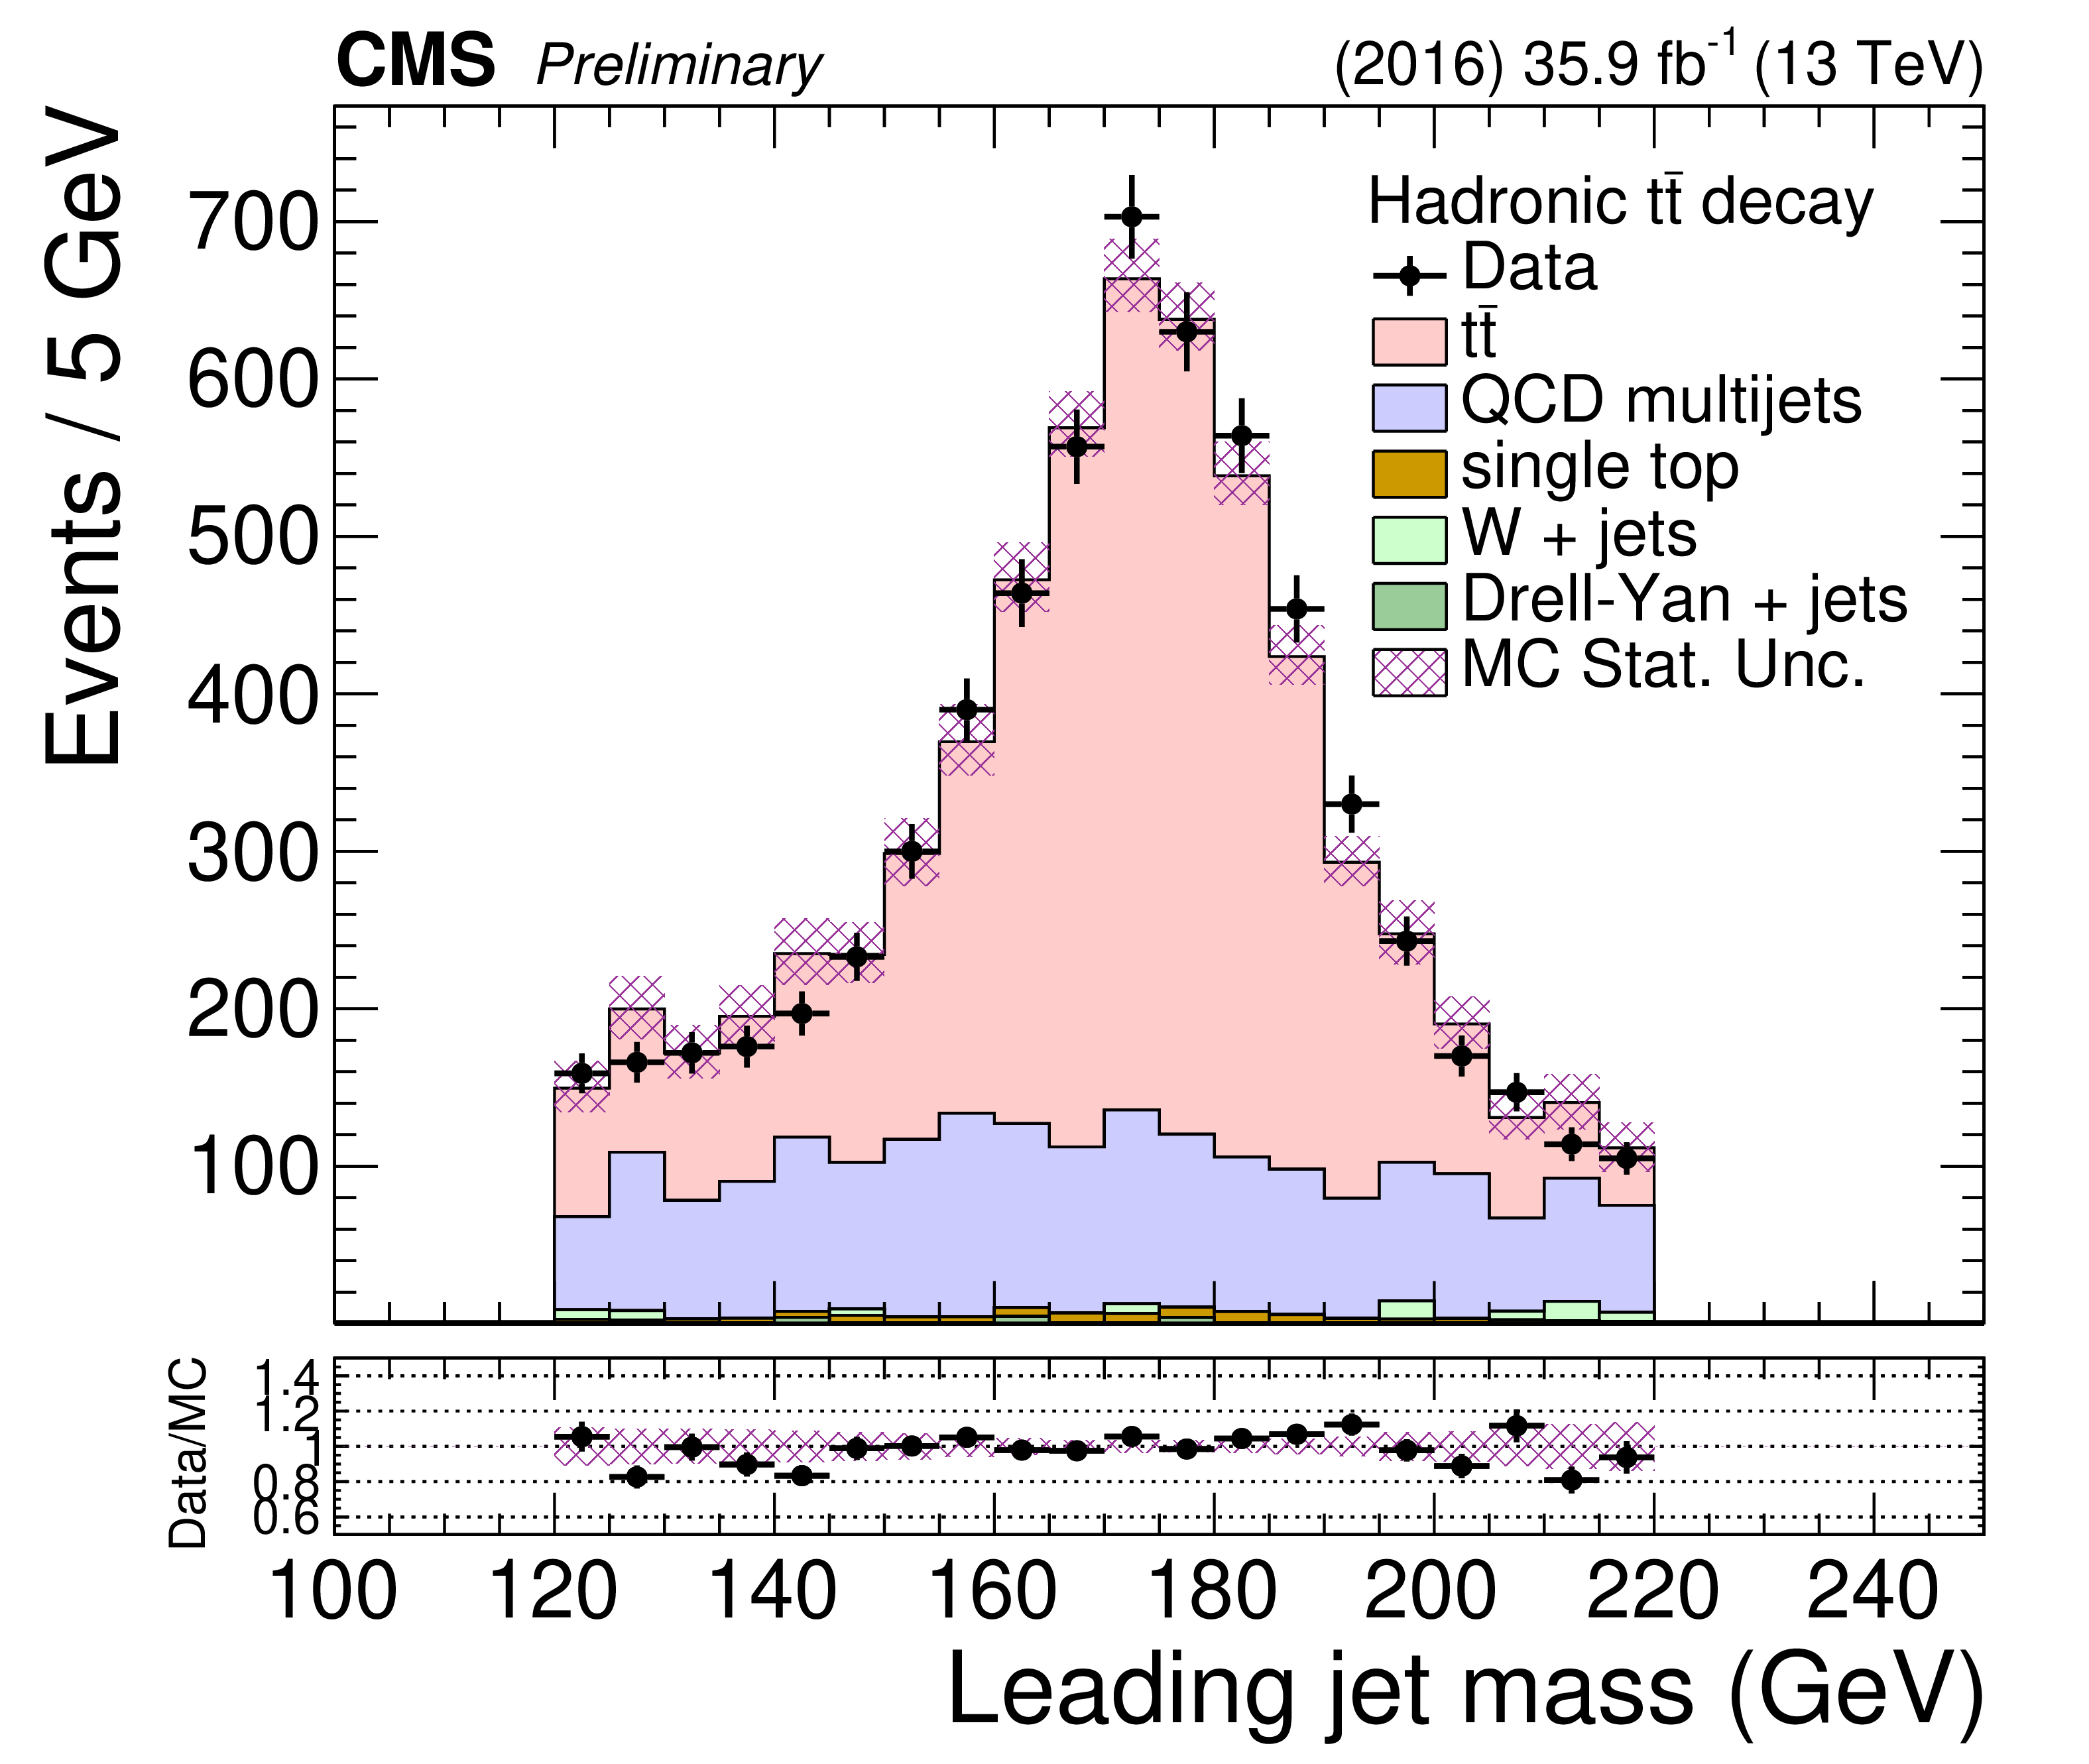
Figure 5-a:
Comparison between data and simulation in the signal region of the mass of the leading (left) and subleading (right) large-$R$ jets in the hadronic channel. The $\mathrm{t\bar{t}}$ and QCD multijet processes are normalized according to the post-fit values of the respective yields and are shown as stacked histograms. The data points are shown with solid markers, while the shaded band represents the statistical uncertainty in the simulation. The bottom panel shows the data divided by the sum of the prediction from the simulation. |
png pdf |
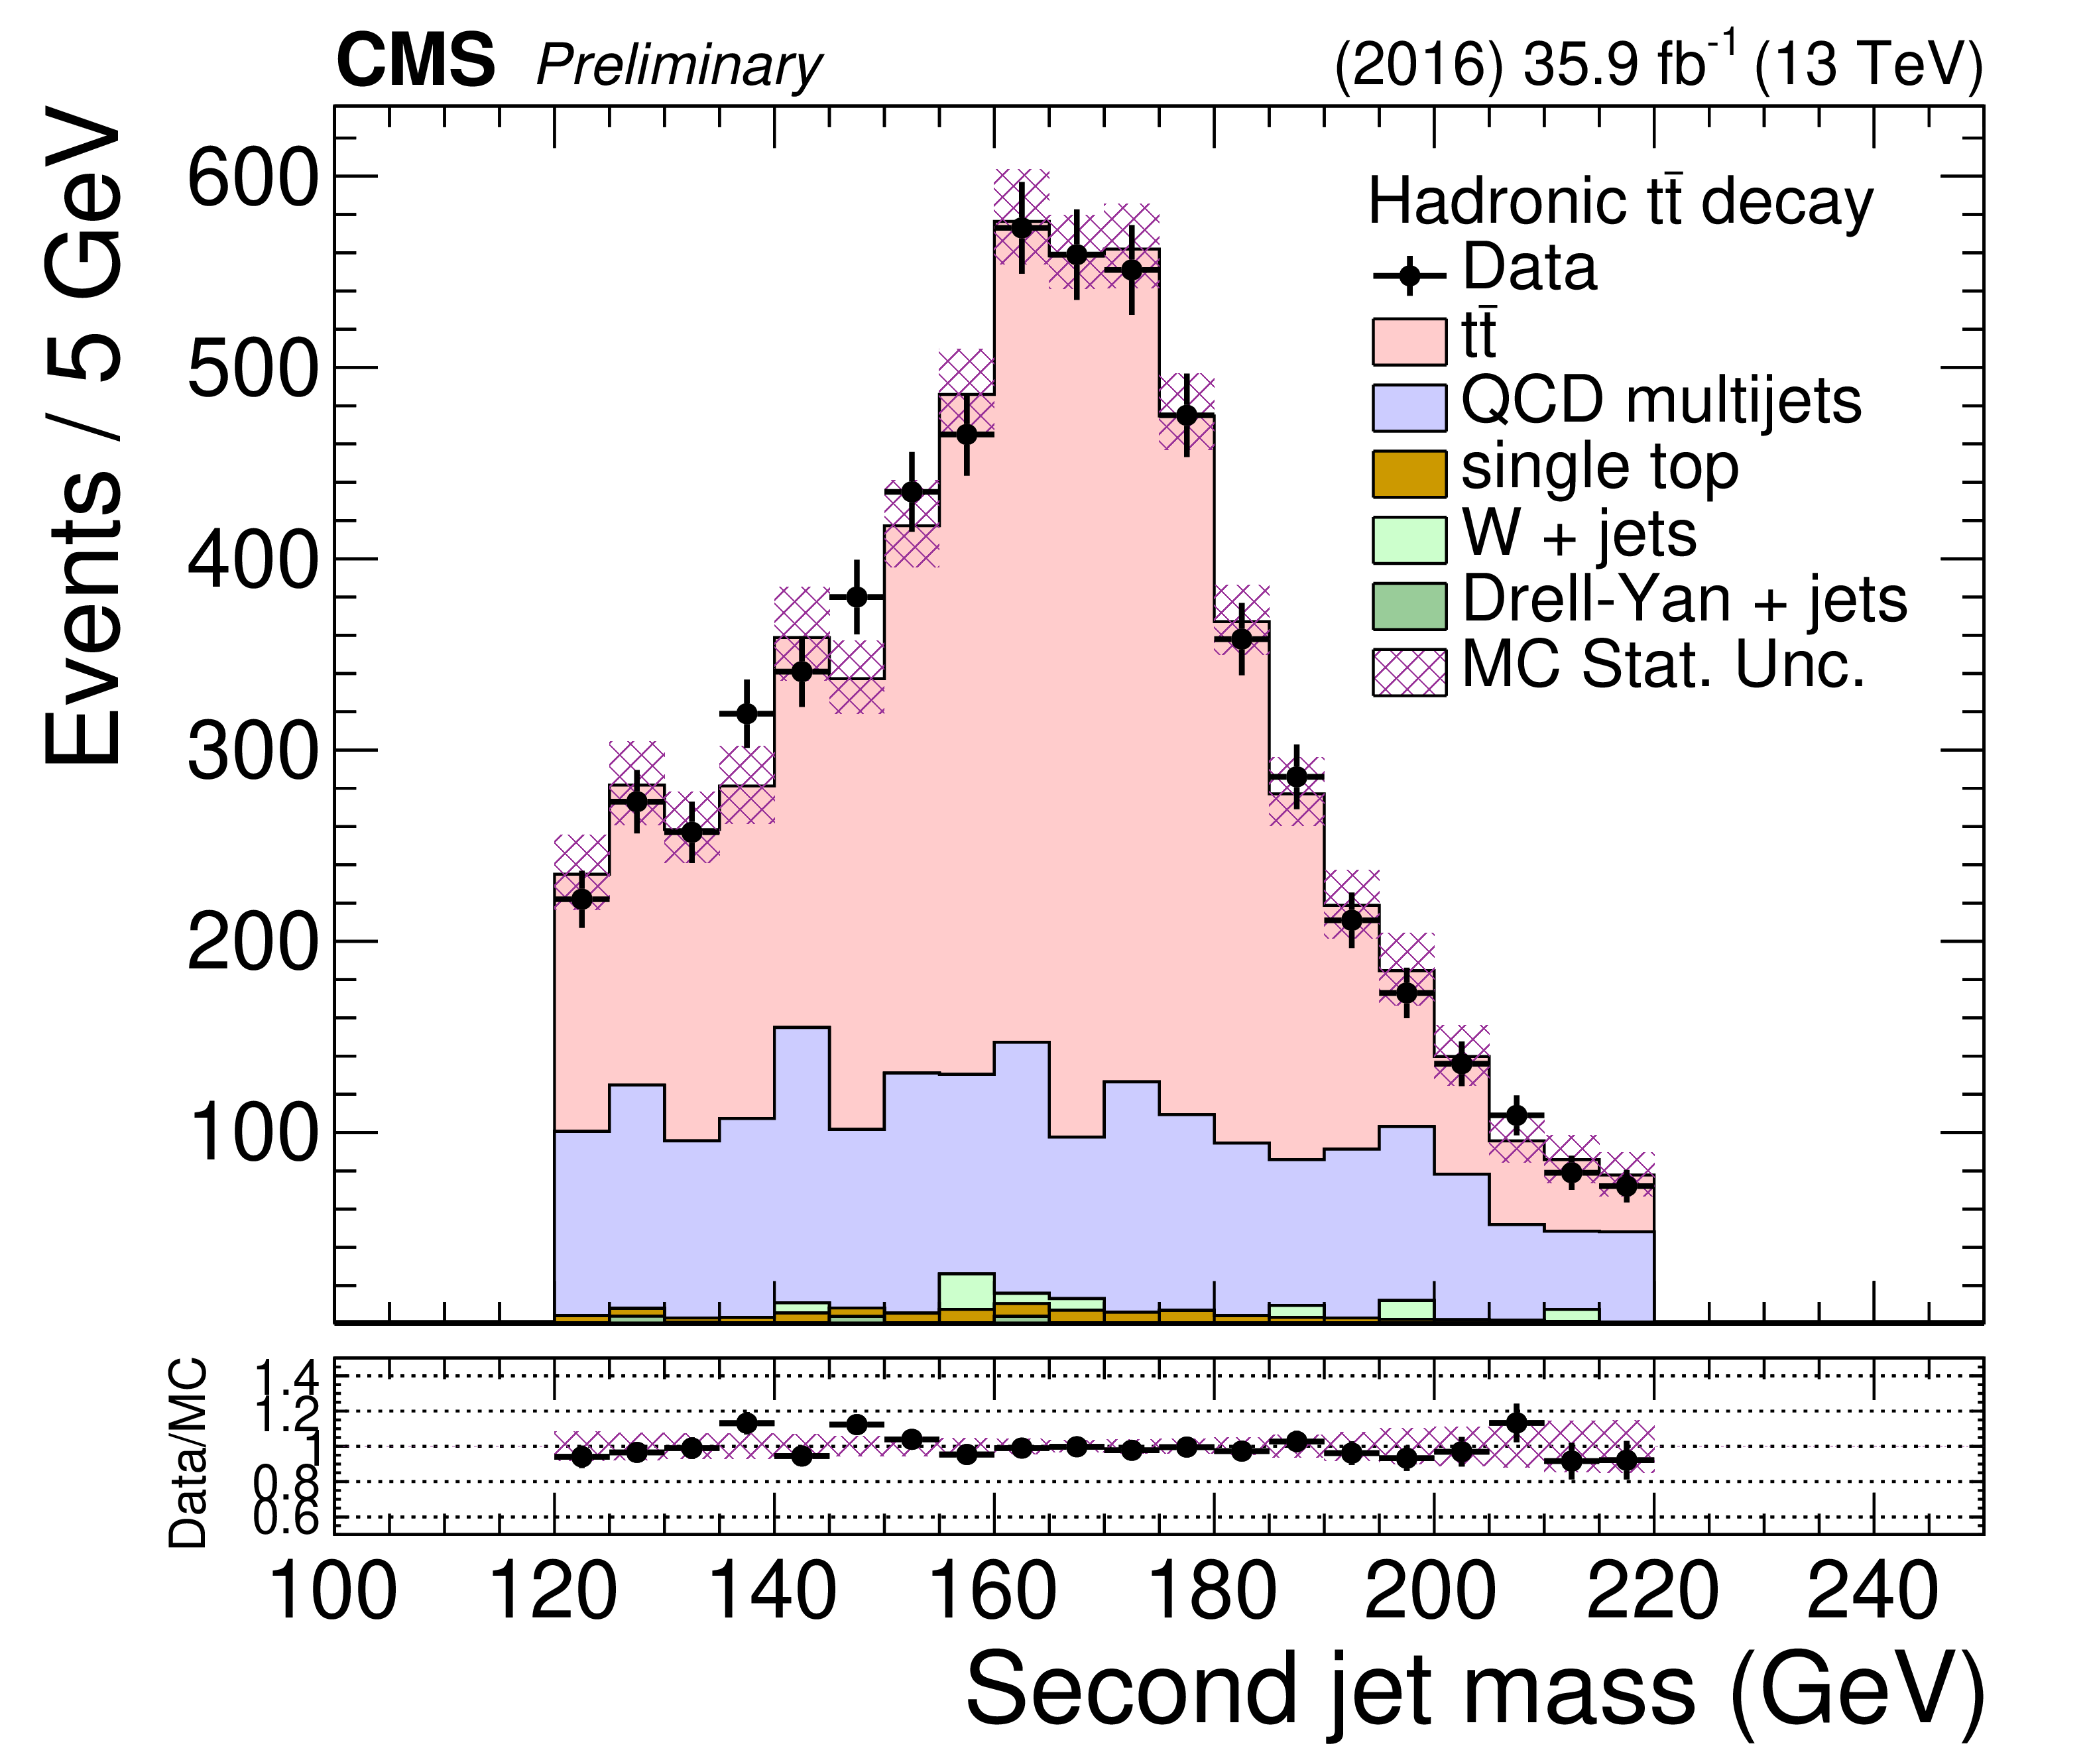
Figure 5-b:
Comparison between data and simulation in the signal region of the mass of the leading (left) and subleading (right) large-$R$ jets in the hadronic channel. The $\mathrm{t\bar{t}}$ and QCD multijet processes are normalized according to the post-fit values of the respective yields and are shown as stacked histograms. The data points are shown with solid markers, while the shaded band represents the statistical uncertainty in the simulation. The bottom panel shows the data divided by the sum of the prediction from the simulation. |
png pdf |
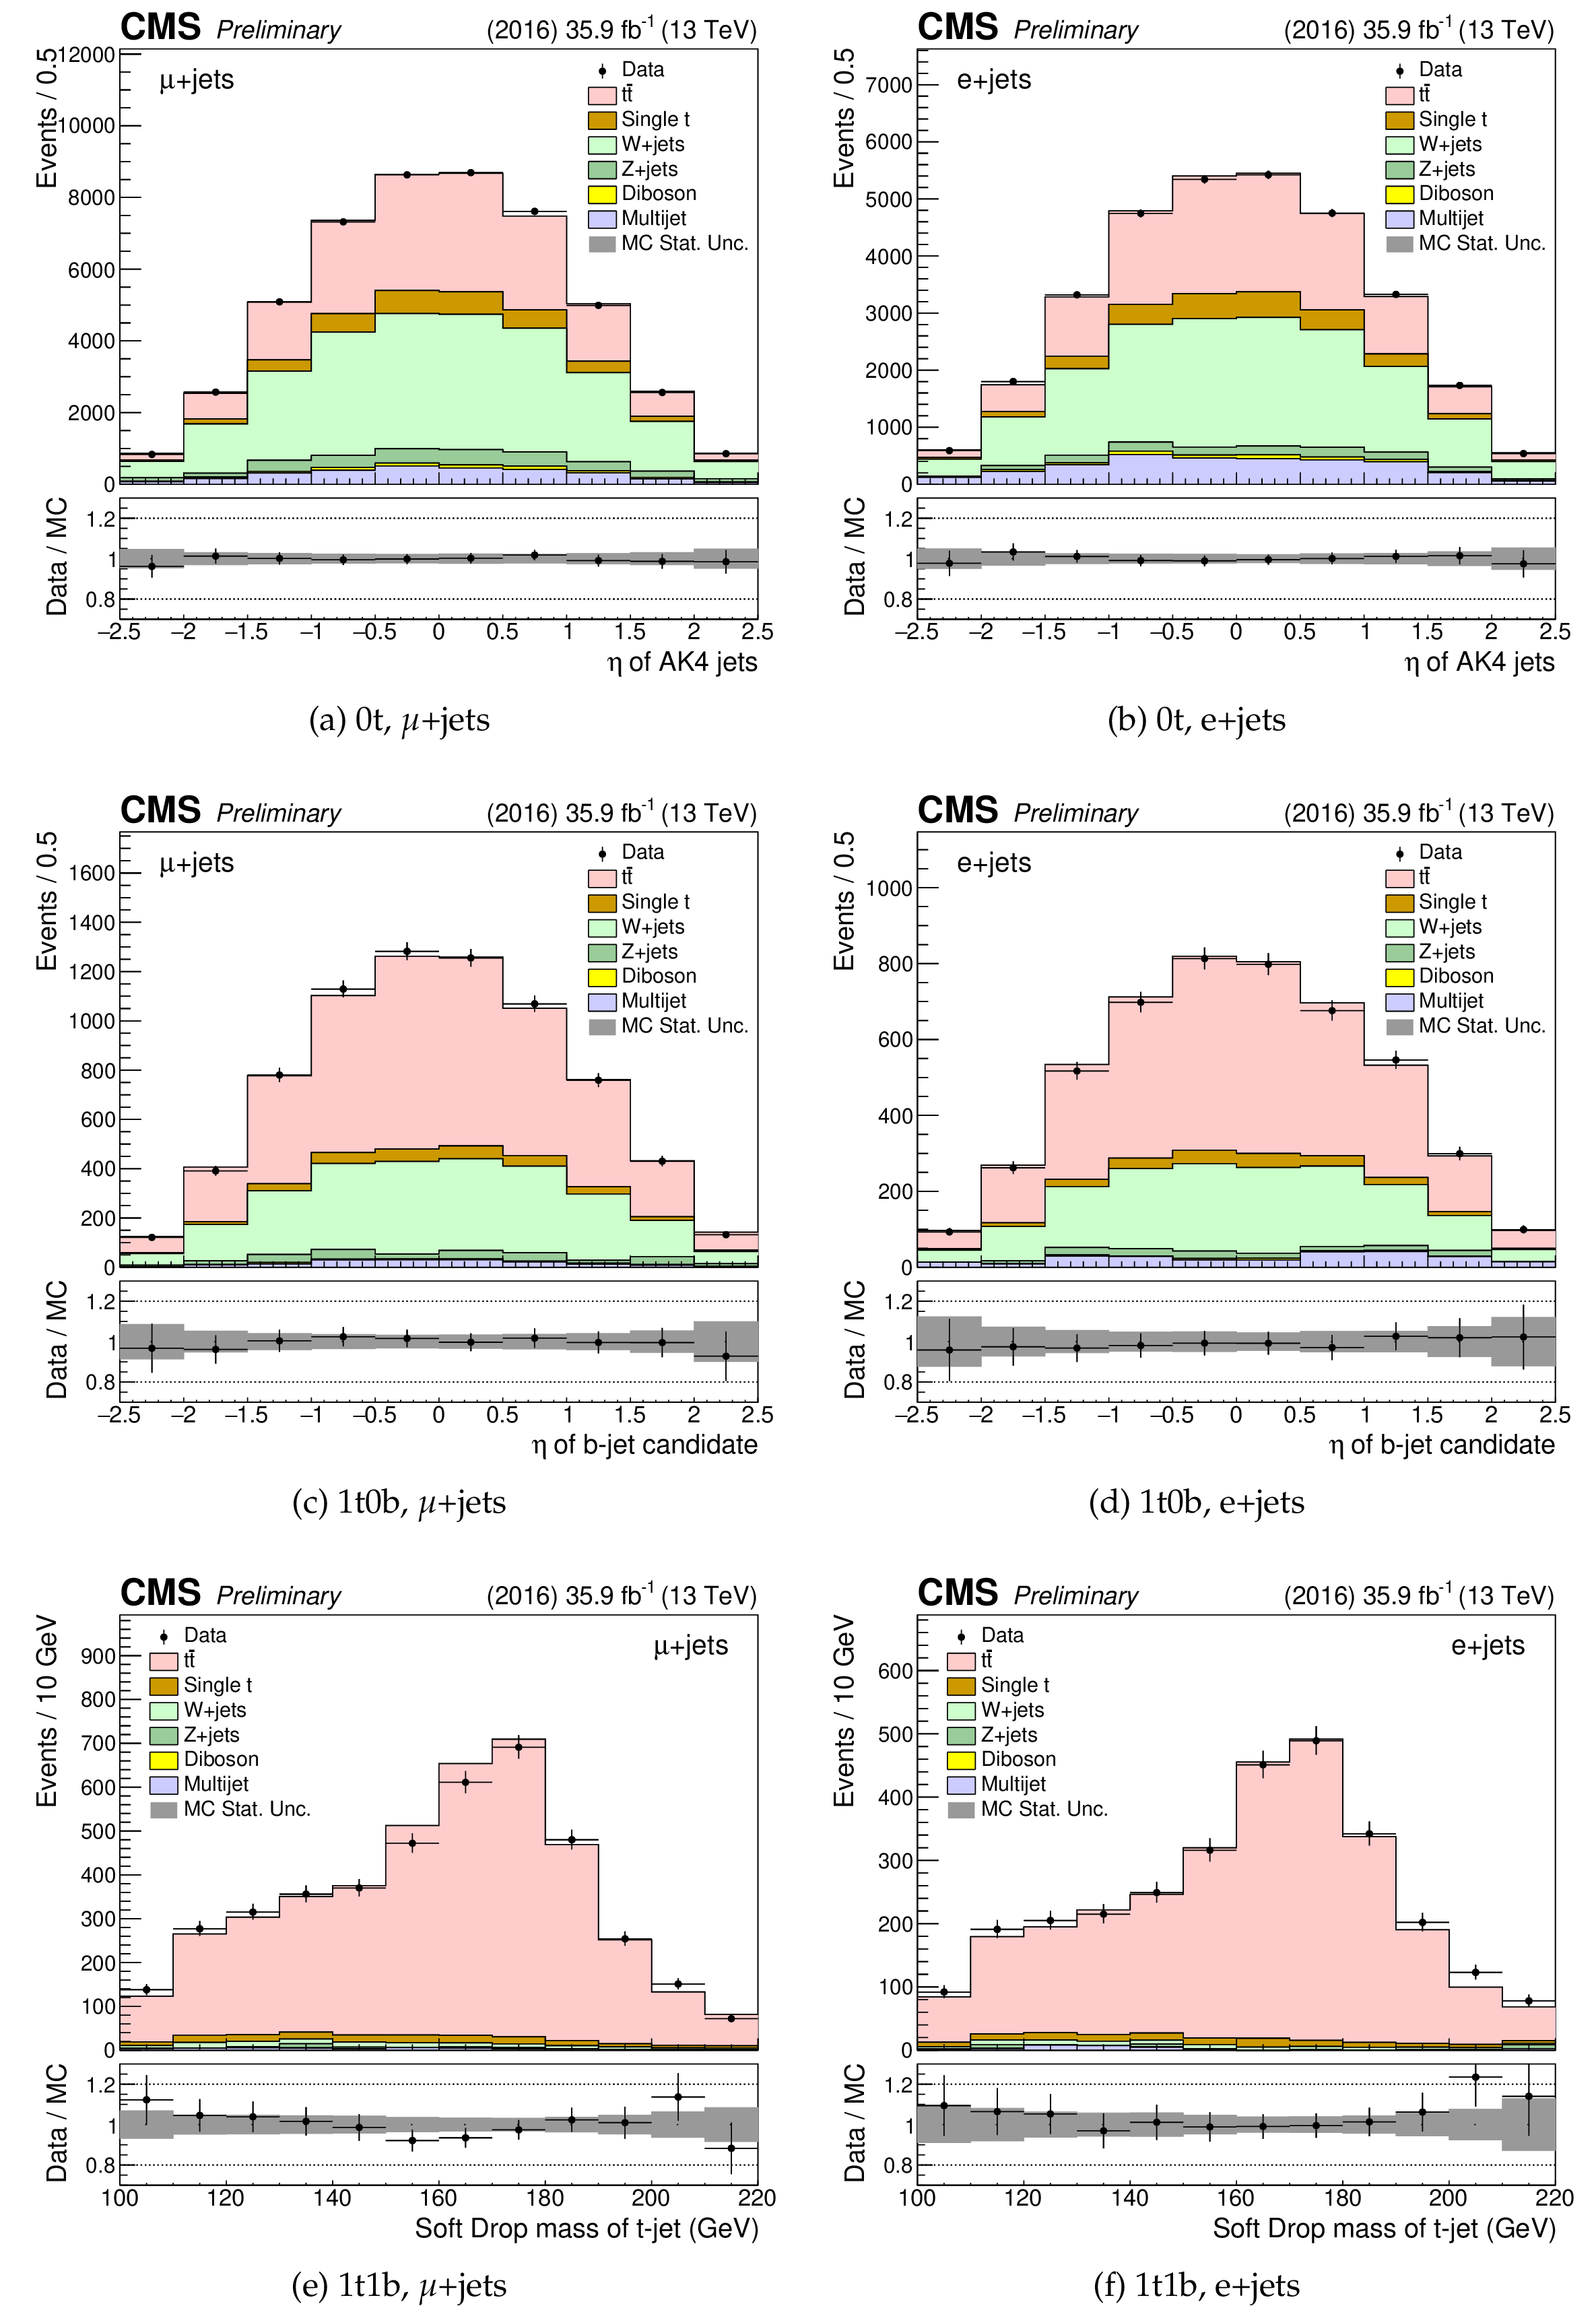
Figure 6:
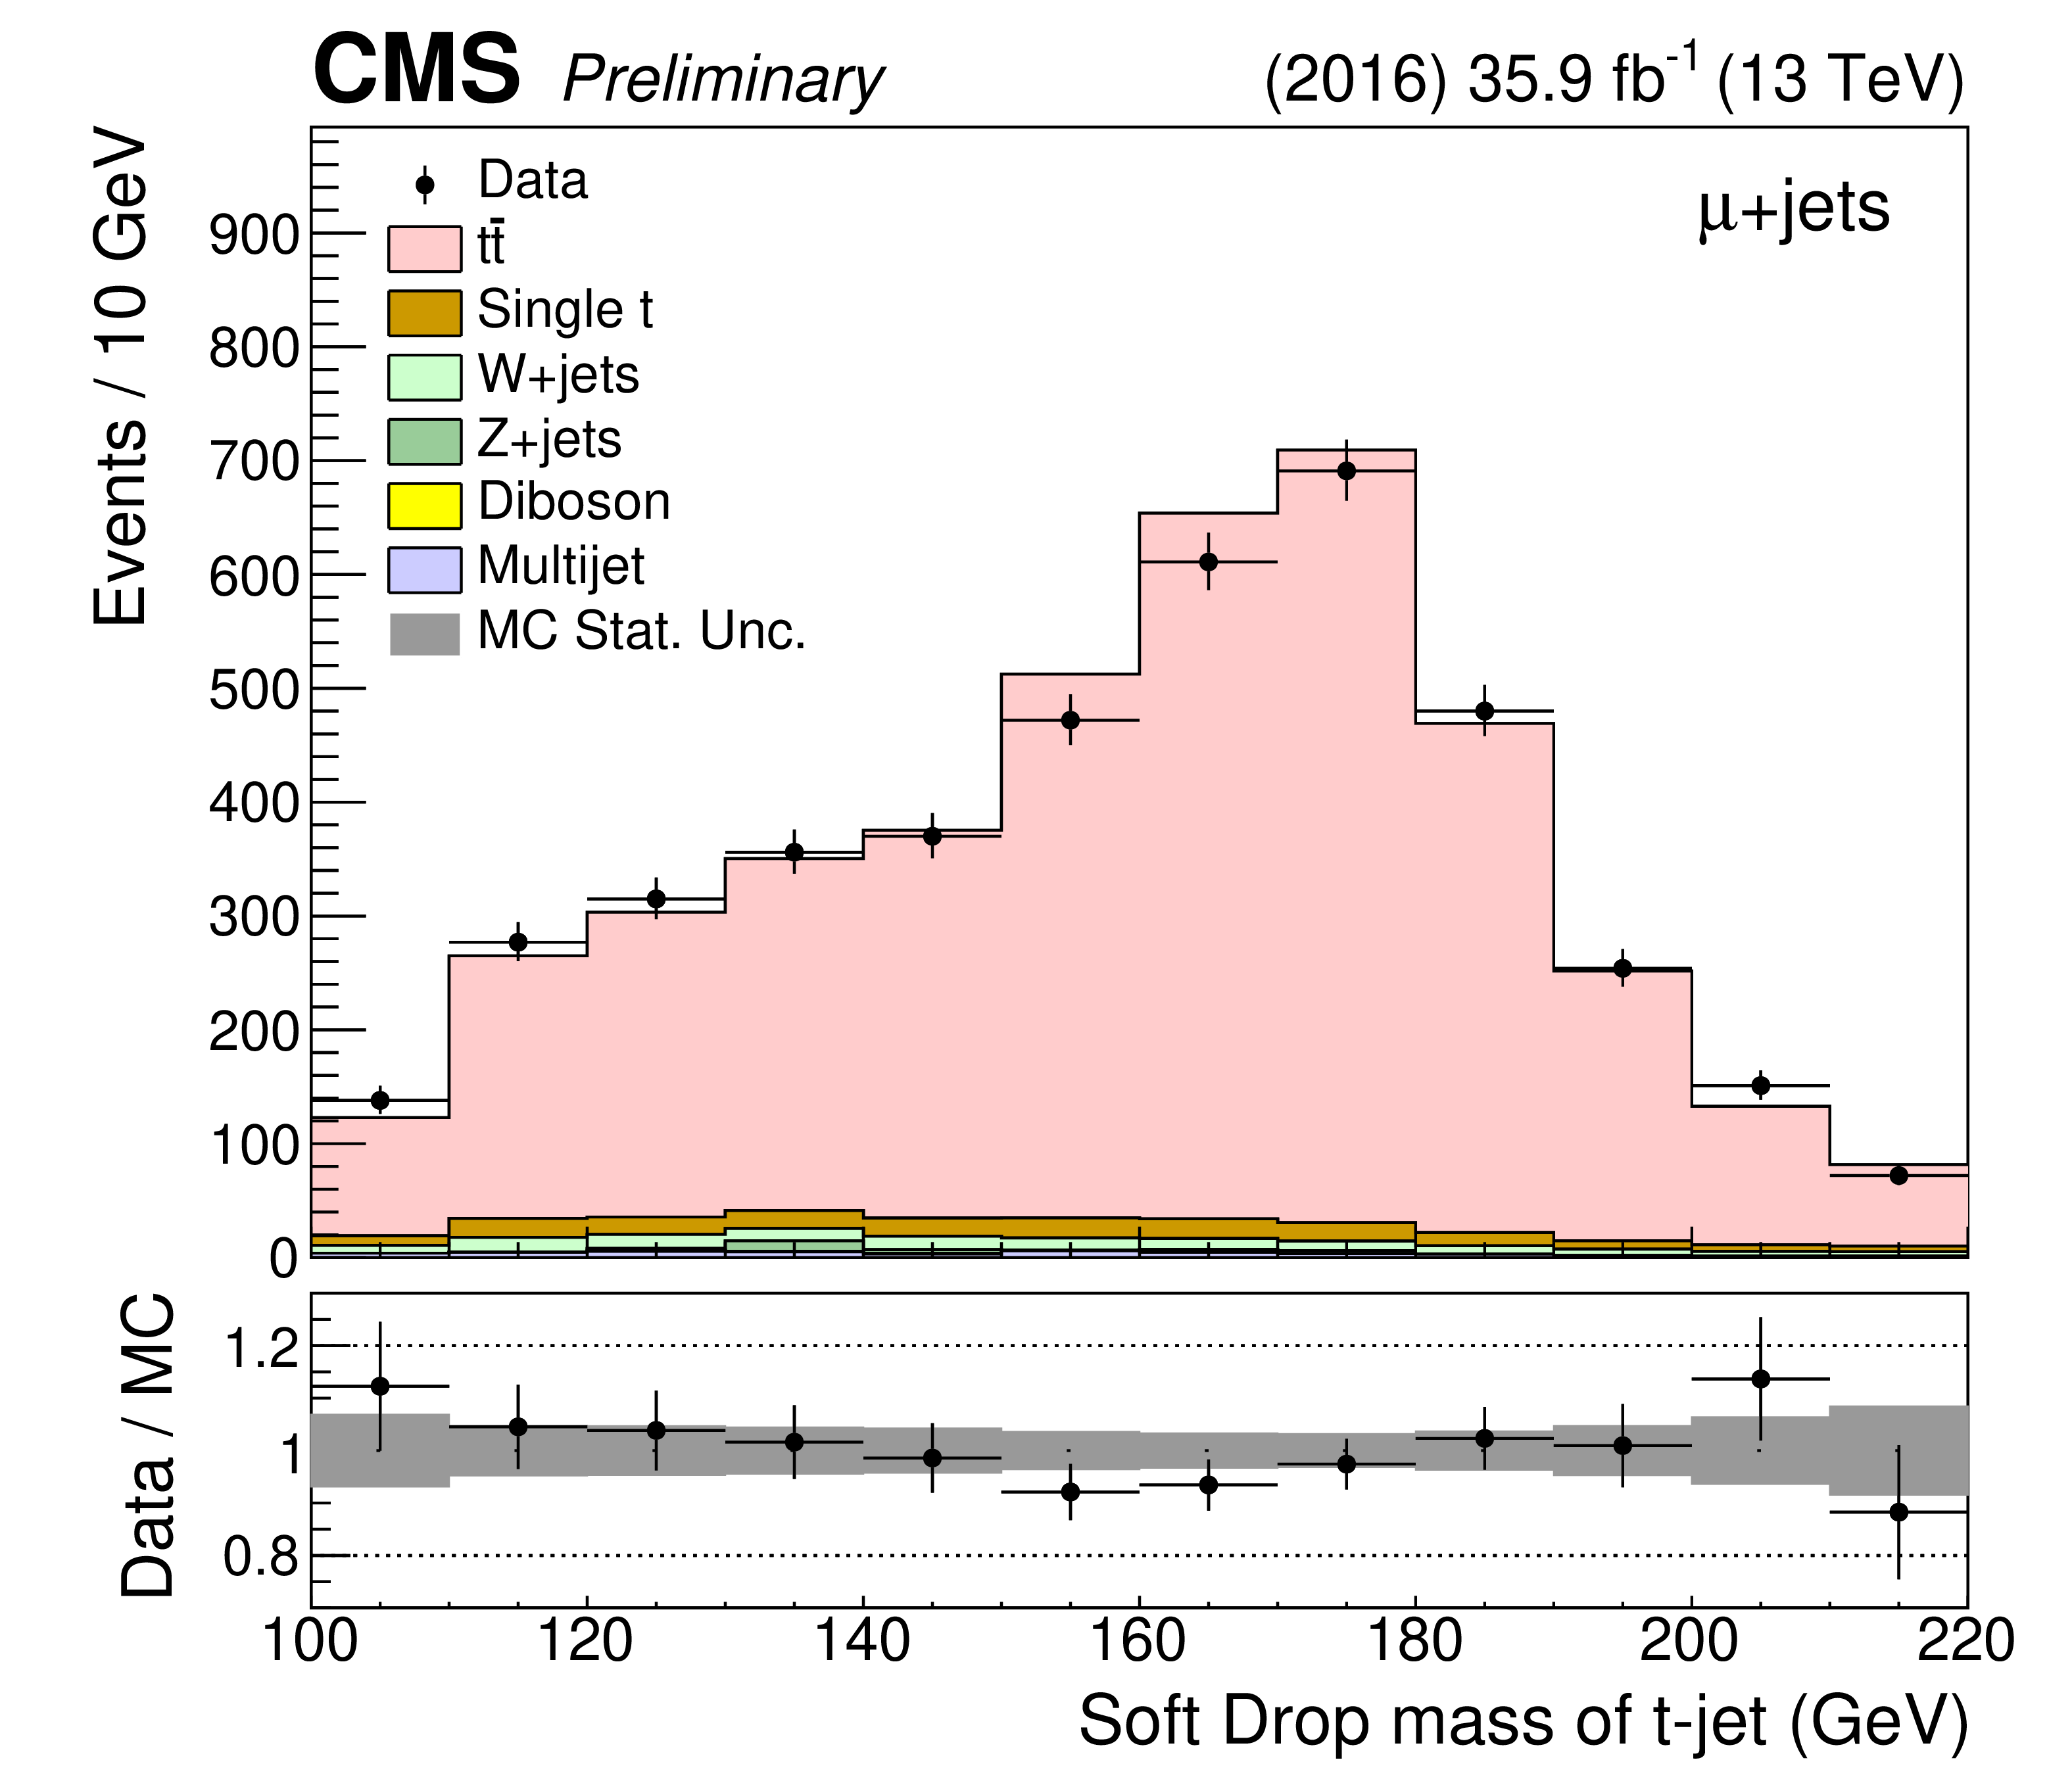
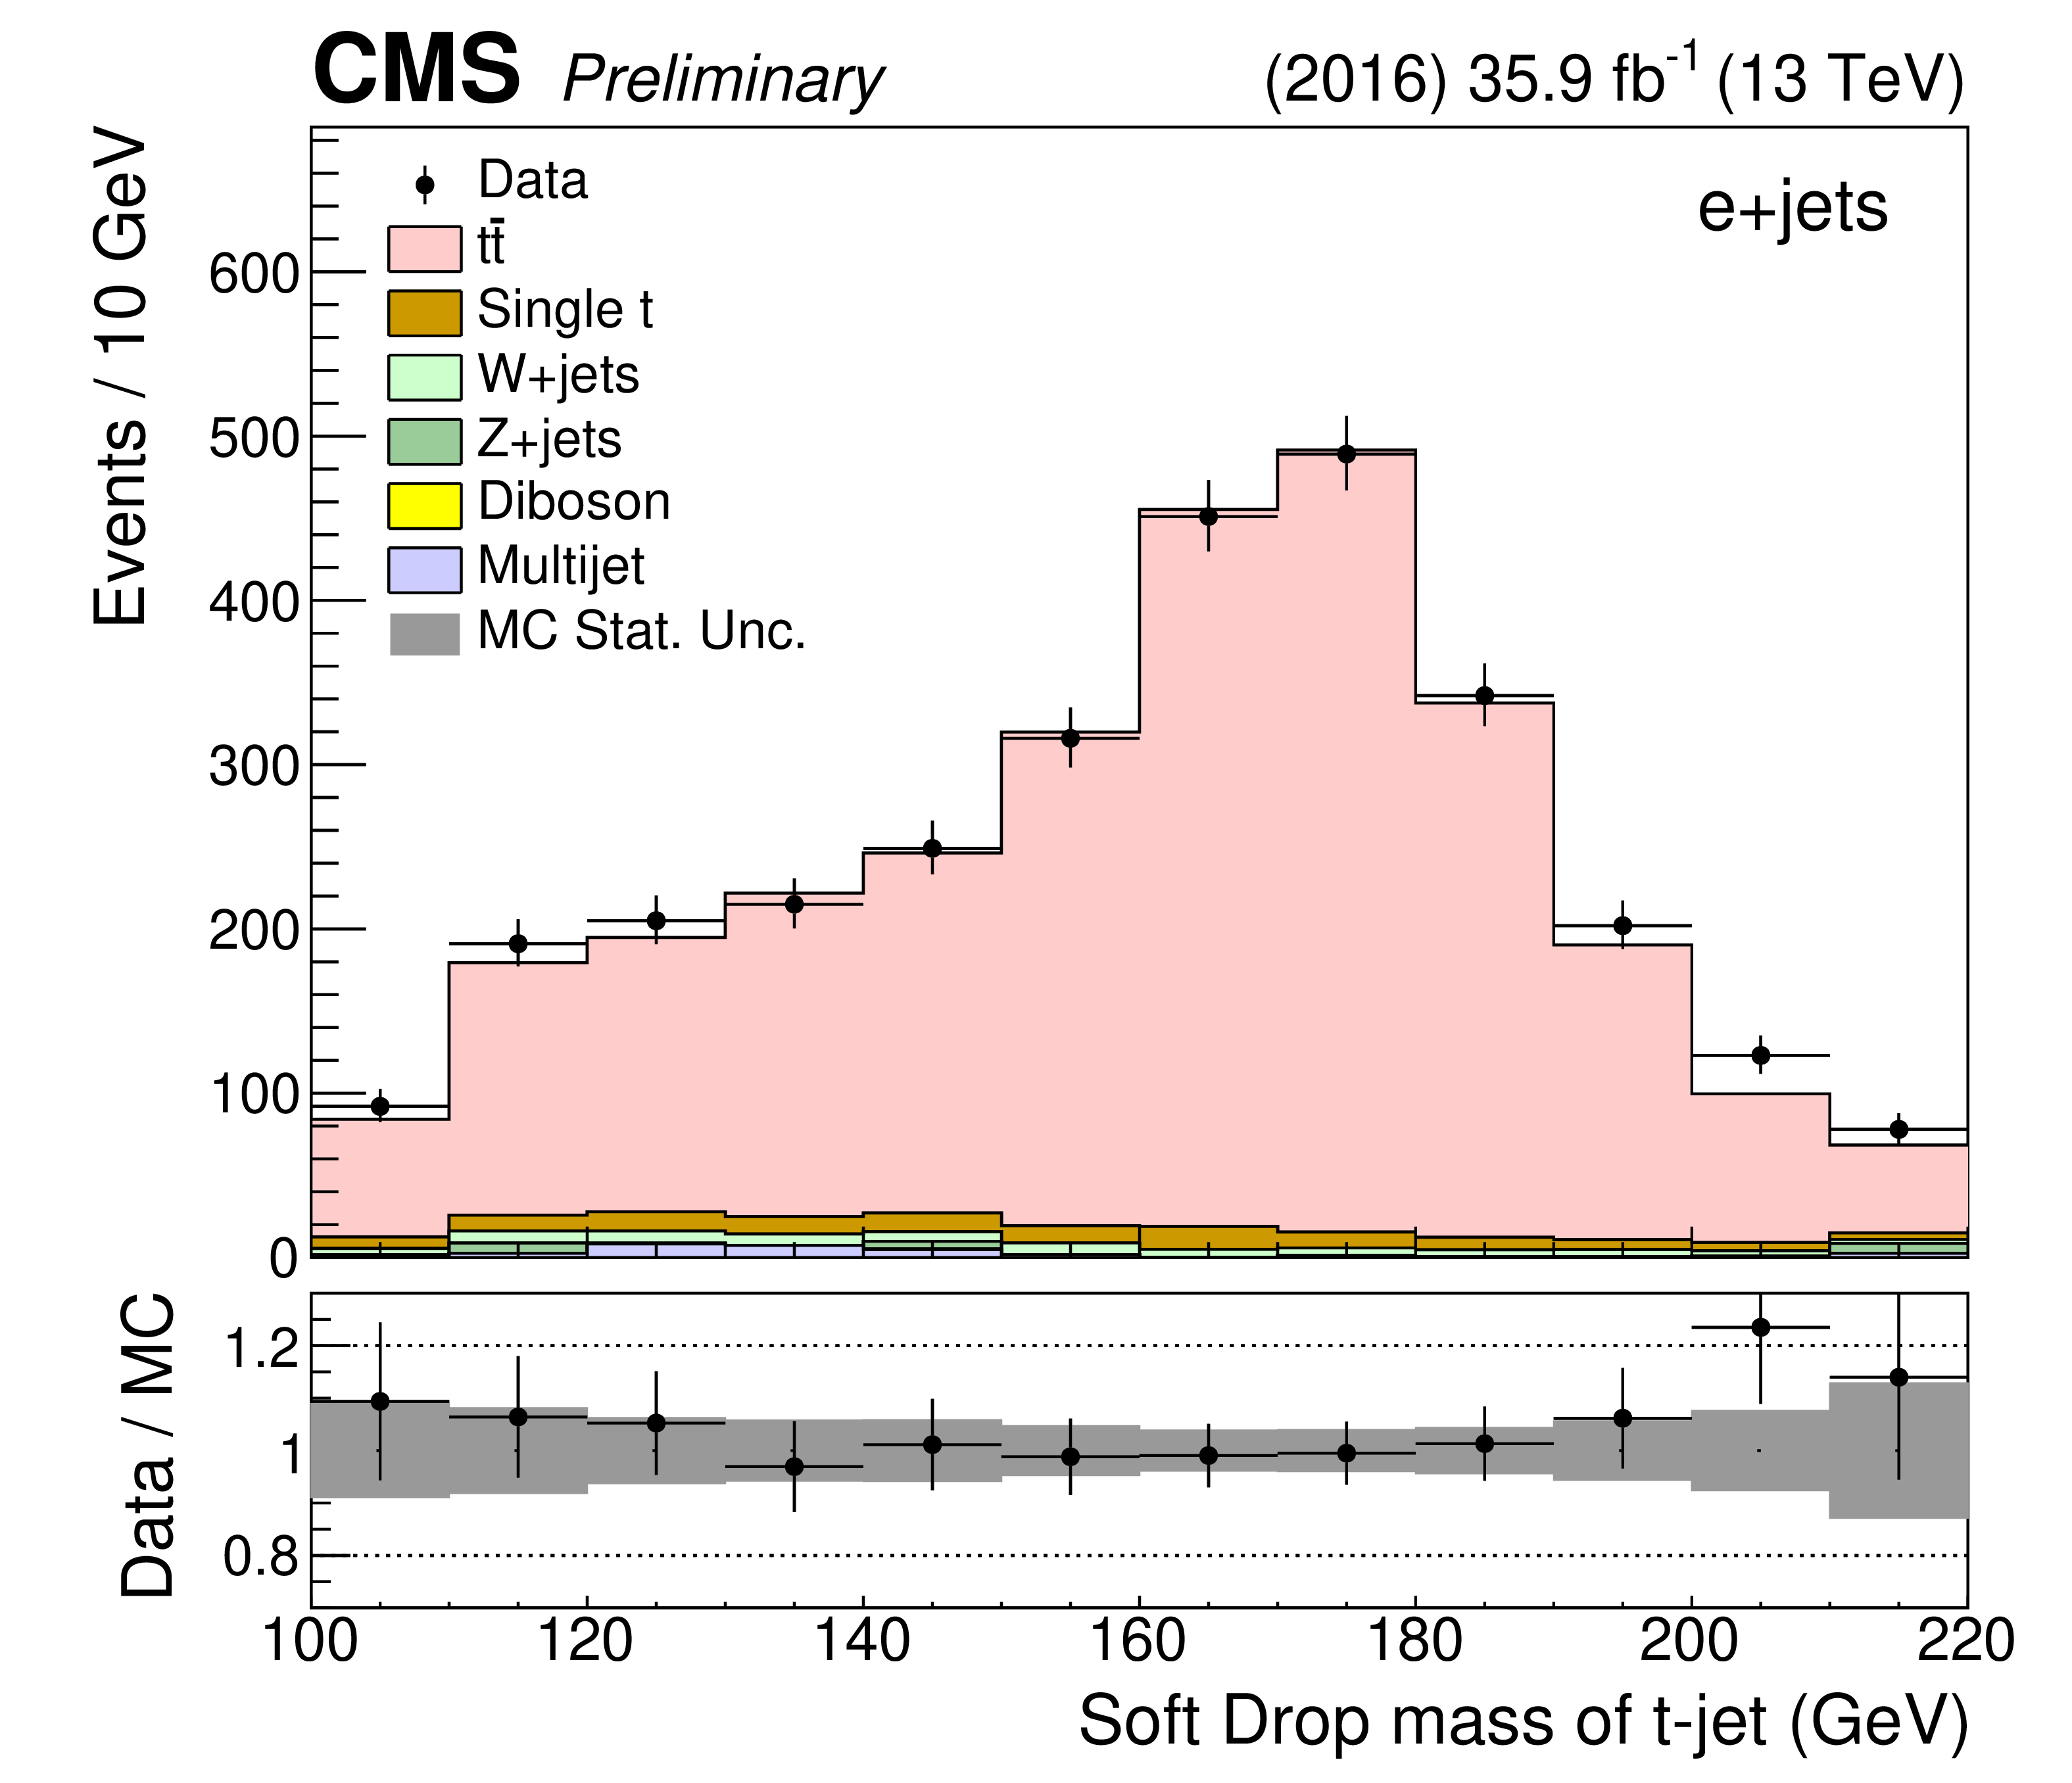
Posterior kinematic distributions for the maximum likelihood fit. Different event categories and variables are used: $\eta $ distribution for the small-$R$ jet in 0t events (top), $\eta $ distribution of the b jet candidate in 1t0b events (middle), and soft drop mass of the t jet candidate in 1t1b events (bottom), in the $\mu $+jets (left) and e+jets (right) channels. The data points are shown with solid markers, while the signal and background predictions are shown as stacked histograms. The bottom panel shows the data divided by the sum of the prediction from the simulation (solid markers) and the systematic uncertainty from the fit (shaded band). |
png pdf |
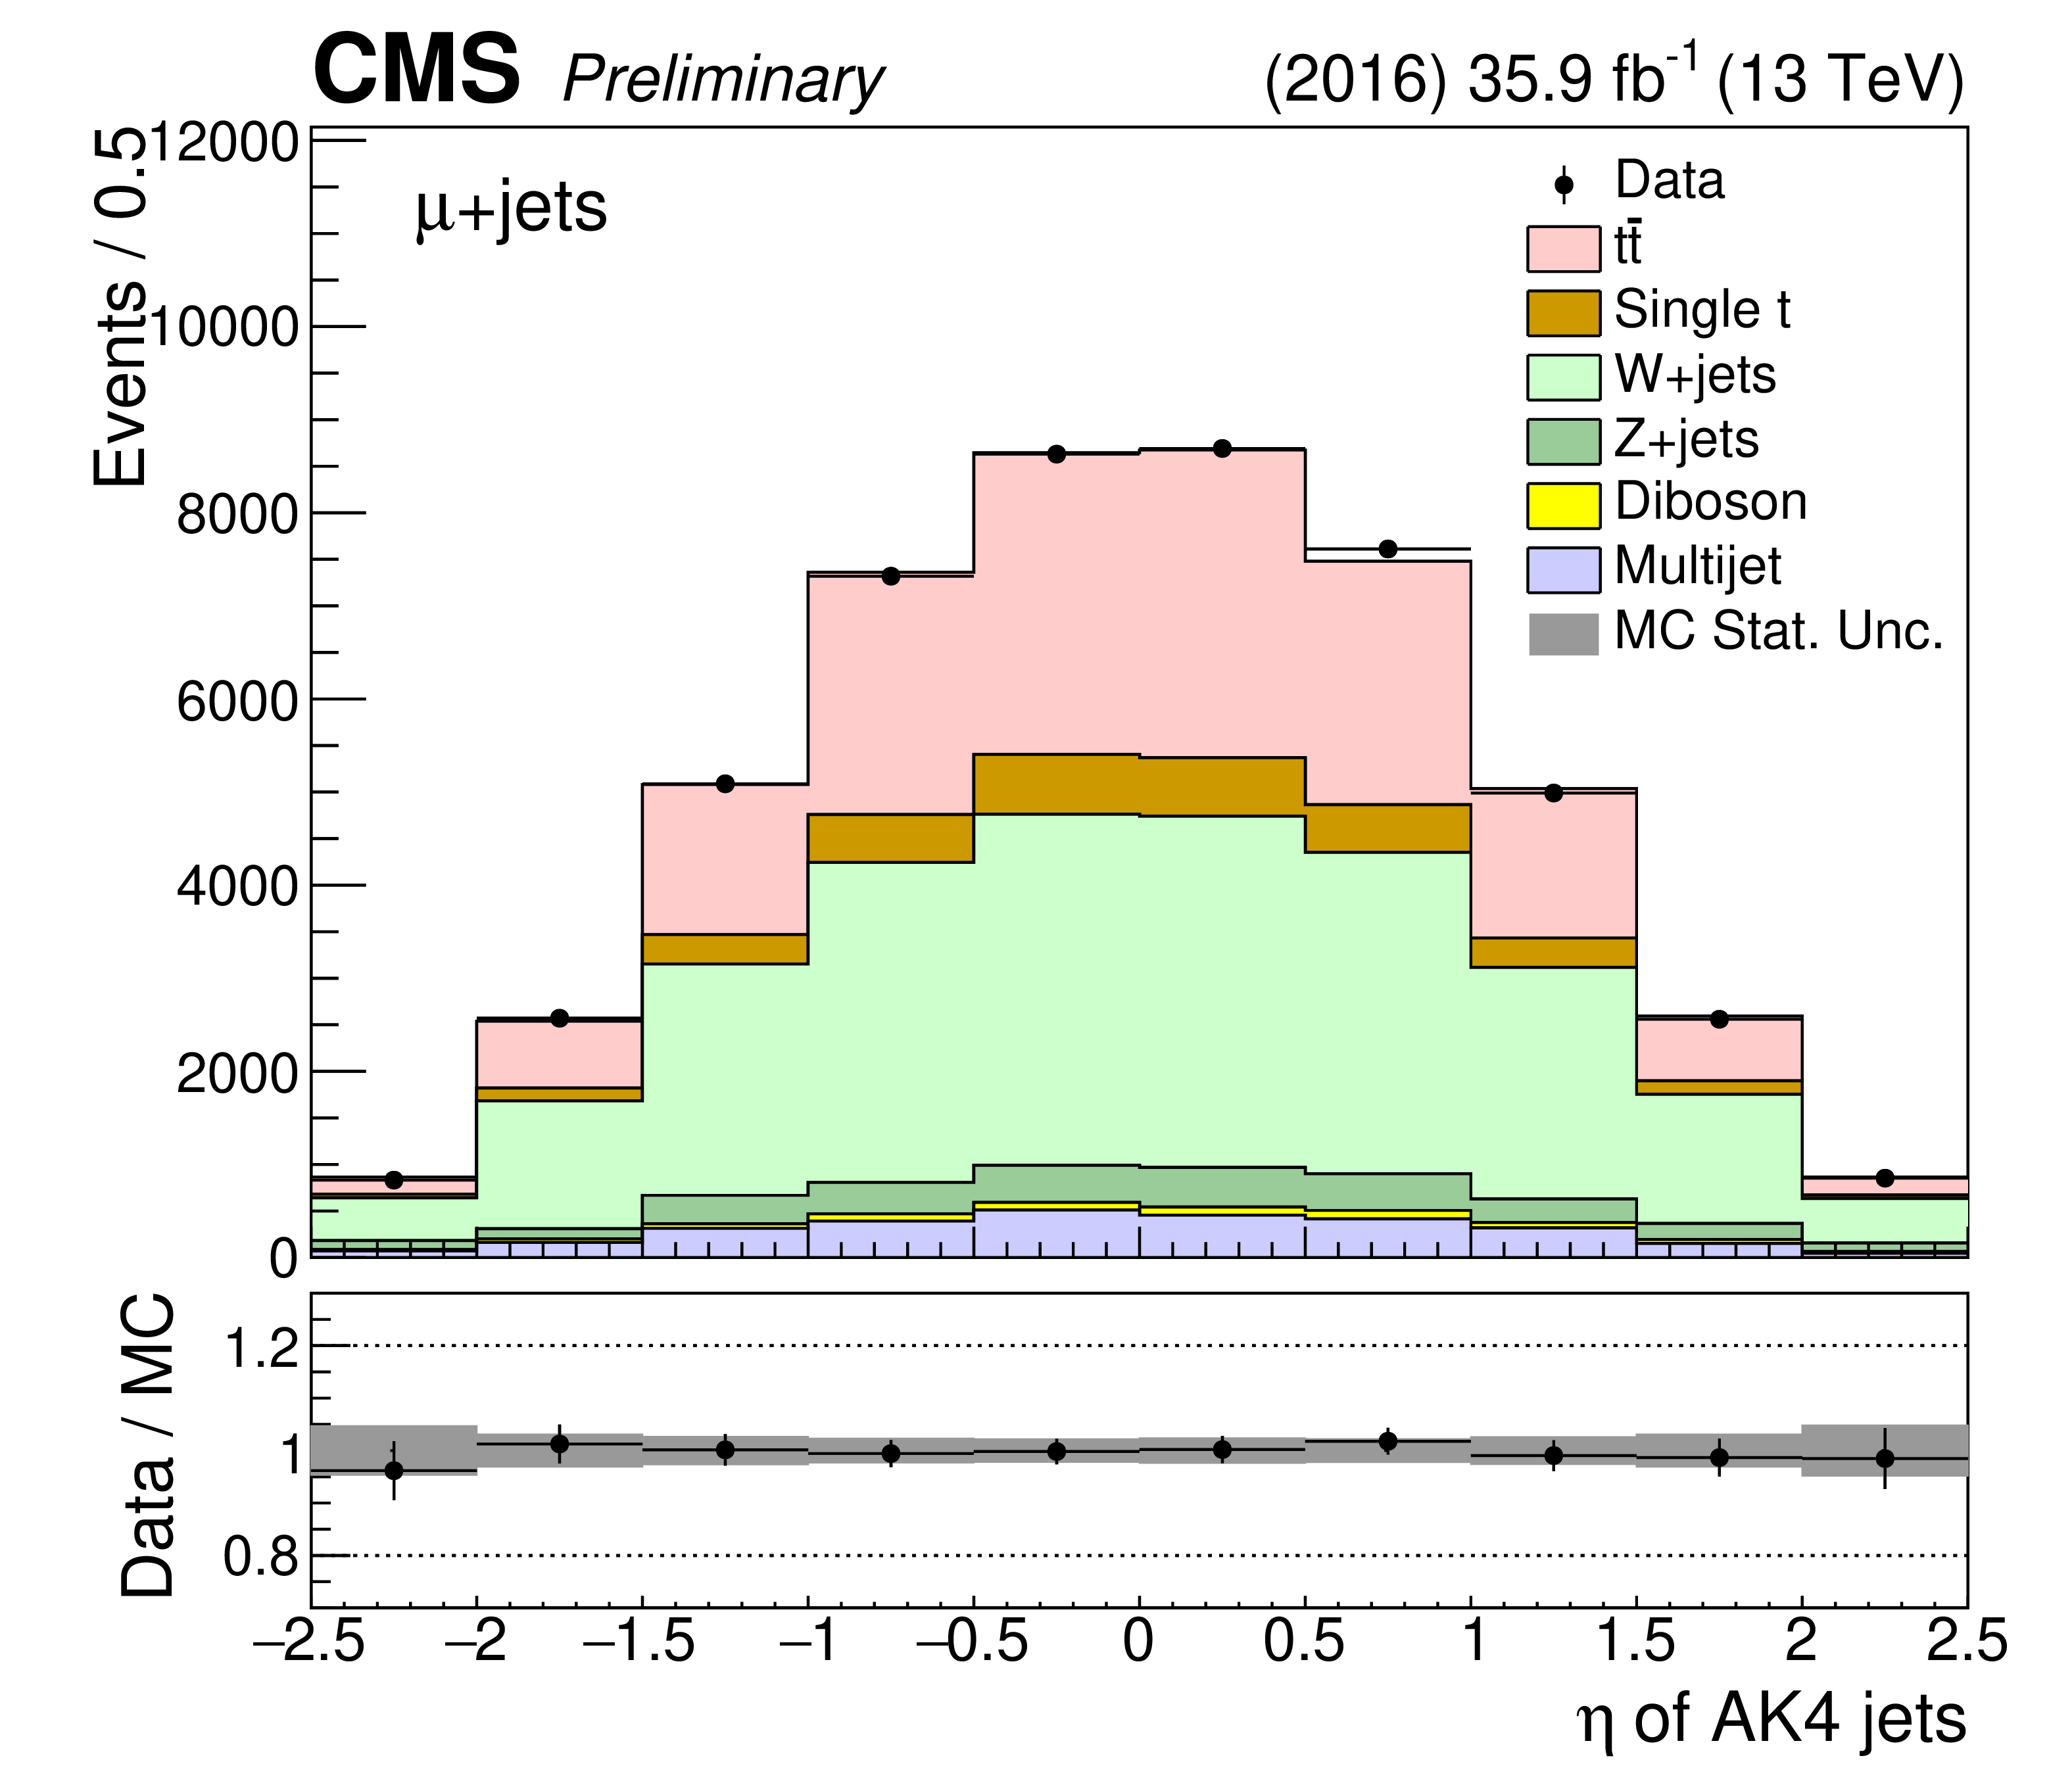
Figure 6-a:
Posterior kinematic distributions for the maximum likelihood fit. Different event categories and variables are used: $\eta $ distribution for the small-$R$ jet in 0t events (top), $\eta $ distribution of the b jet candidate in 1t0b events (middle), and soft drop mass of the t jet candidate in 1t1b events (bottom), in the $\mu $+jets (left) and e+jets (right) channels. The data points are shown with solid markers, while the signal and background predictions are shown as stacked histograms. The bottom panel shows the data divided by the sum of the prediction from the simulation (solid markers) and the systematic uncertainty from the fit (shaded band). |

png pdf |
Figure 6-b:
Posterior kinematic distributions for the maximum likelihood fit. Different event categories and variables are used: $\eta $ distribution for the small-$R$ jet in 0t events (top), $\eta $ distribution of the b jet candidate in 1t0b events (middle), and soft drop mass of the t jet candidate in 1t1b events (bottom), in the $\mu $+jets (left) and e+jets (right) channels. The data points are shown with solid markers, while the signal and background predictions are shown as stacked histograms. The bottom panel shows the data divided by the sum of the prediction from the simulation (solid markers) and the systematic uncertainty from the fit (shaded band). |
png pdf |
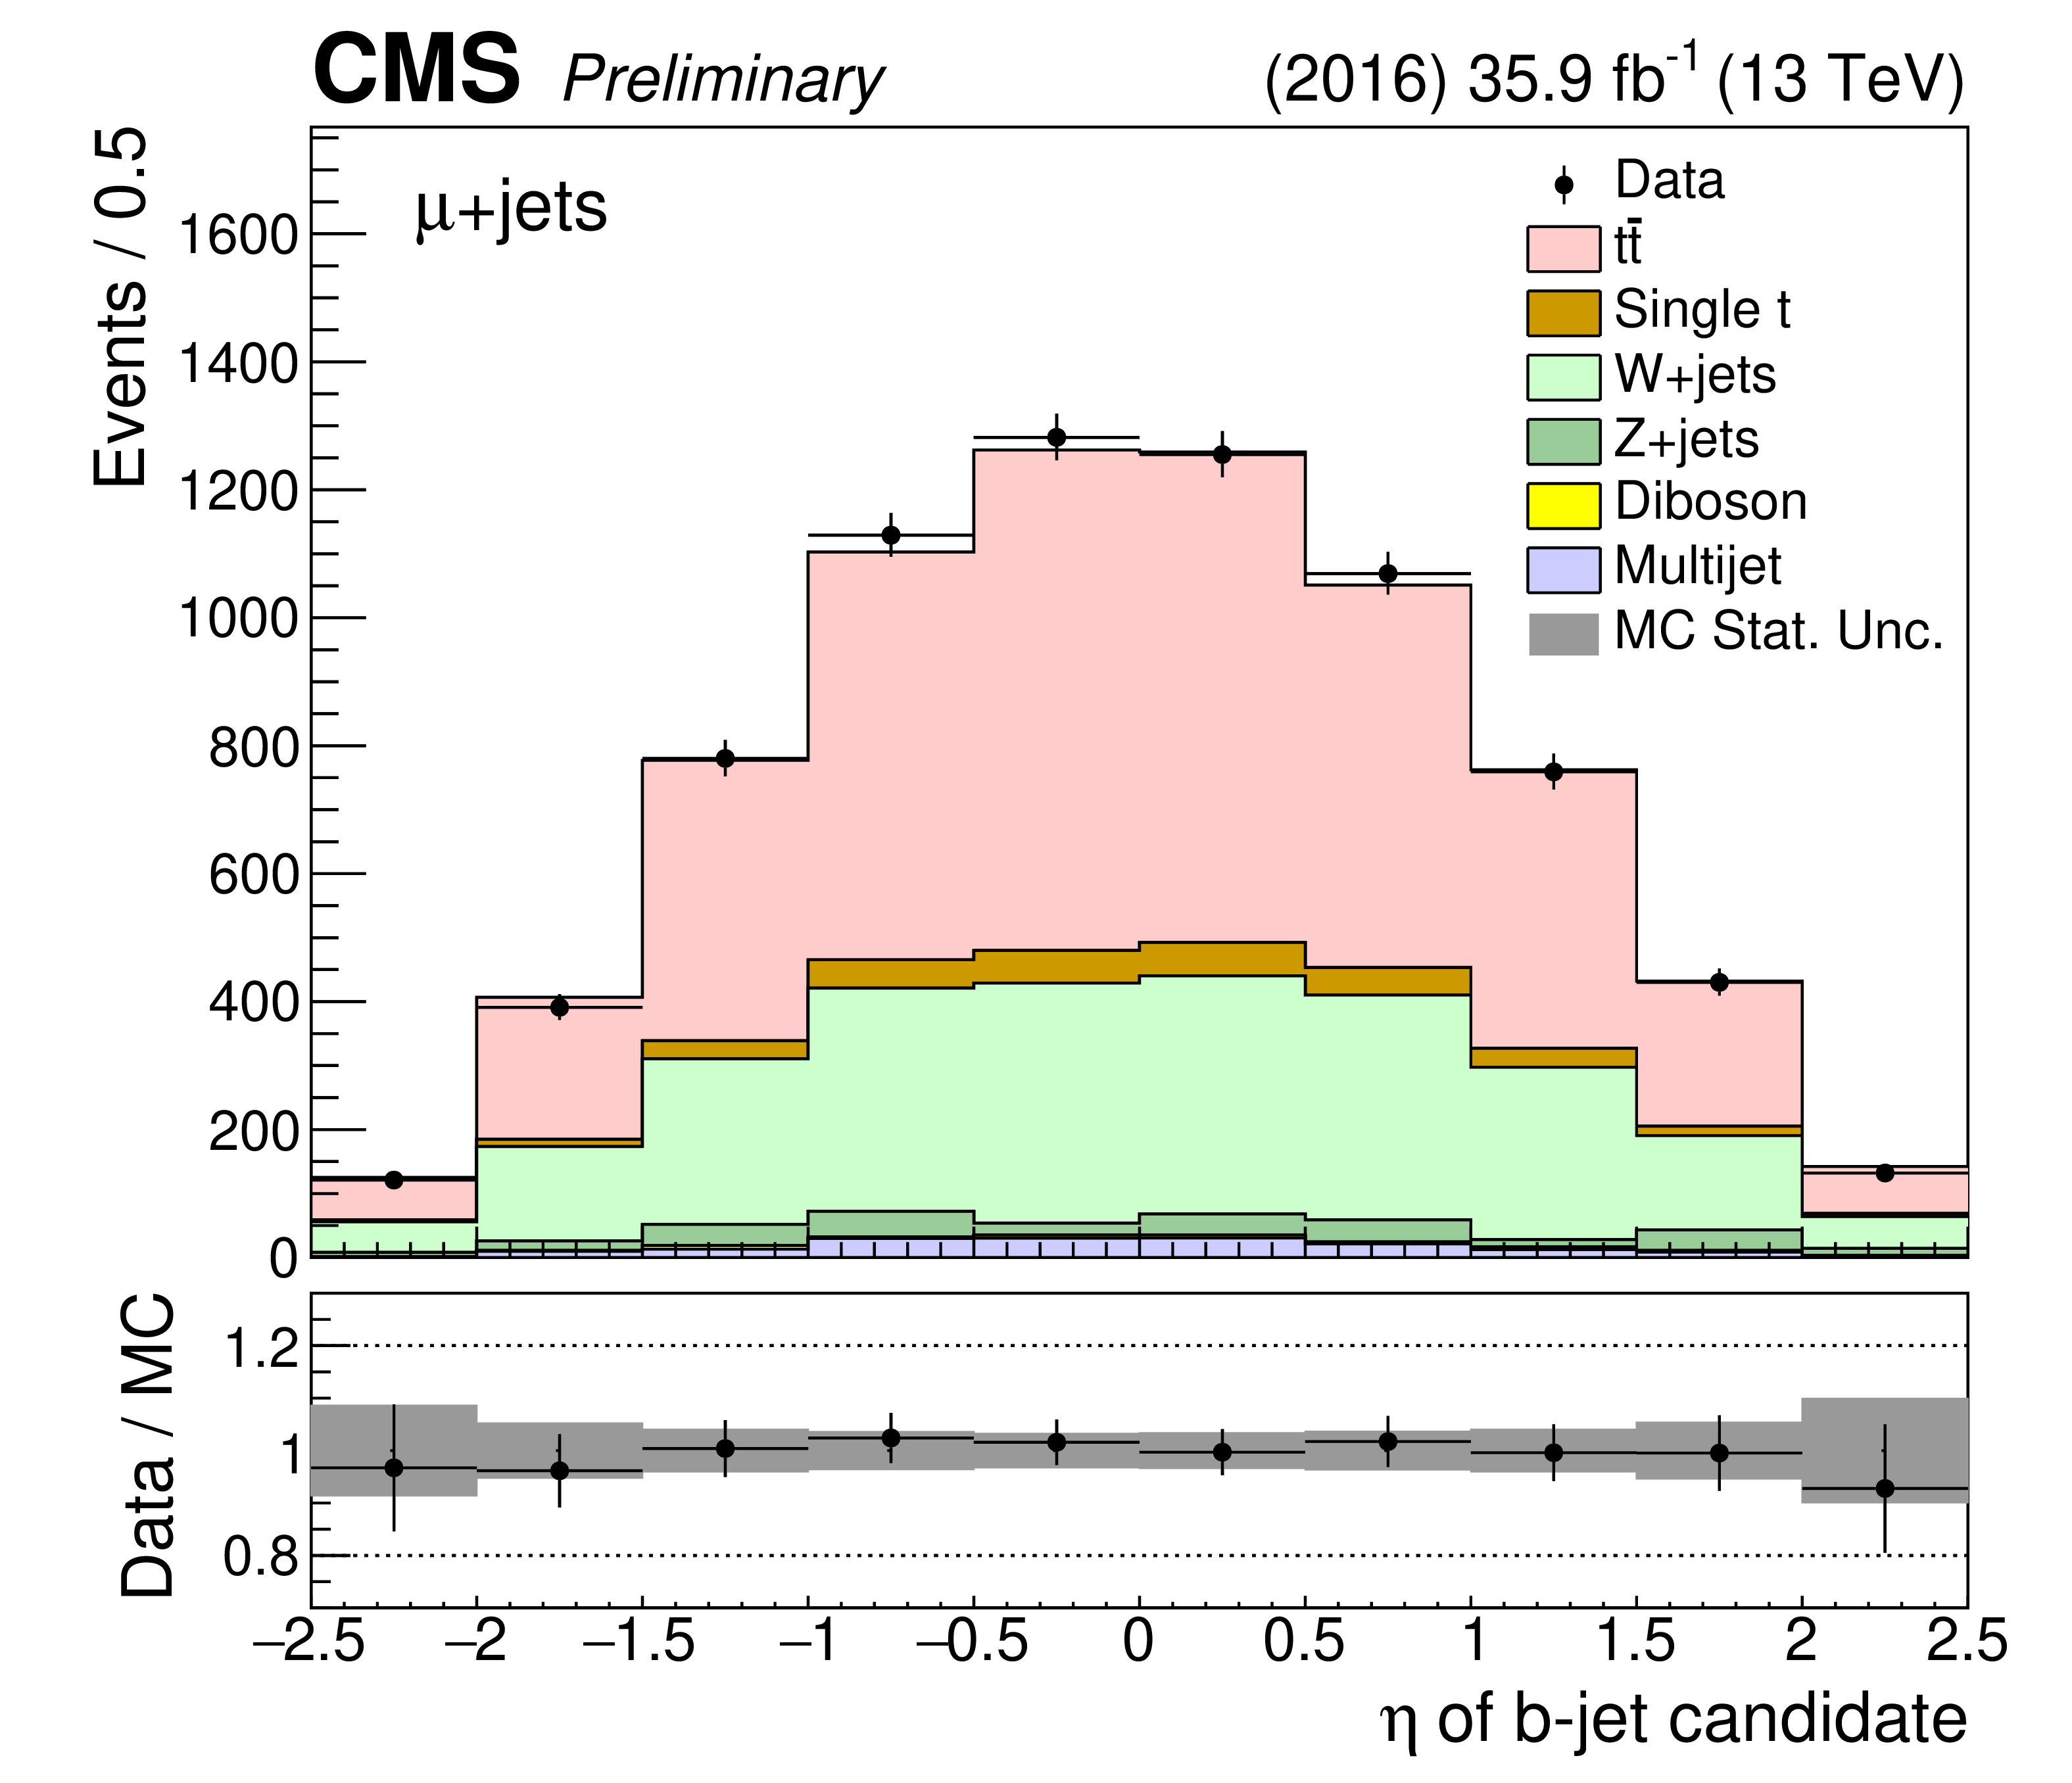
Figure 6-c:
Posterior kinematic distributions for the maximum likelihood fit. Different event categories and variables are used: $\eta $ distribution for the small-$R$ jet in 0t events (top), $\eta $ distribution of the b jet candidate in 1t0b events (middle), and soft drop mass of the t jet candidate in 1t1b events (bottom), in the $\mu $+jets (left) and e+jets (right) channels. The data points are shown with solid markers, while the signal and background predictions are shown as stacked histograms. The bottom panel shows the data divided by the sum of the prediction from the simulation (solid markers) and the systematic uncertainty from the fit (shaded band). |
png pdf |
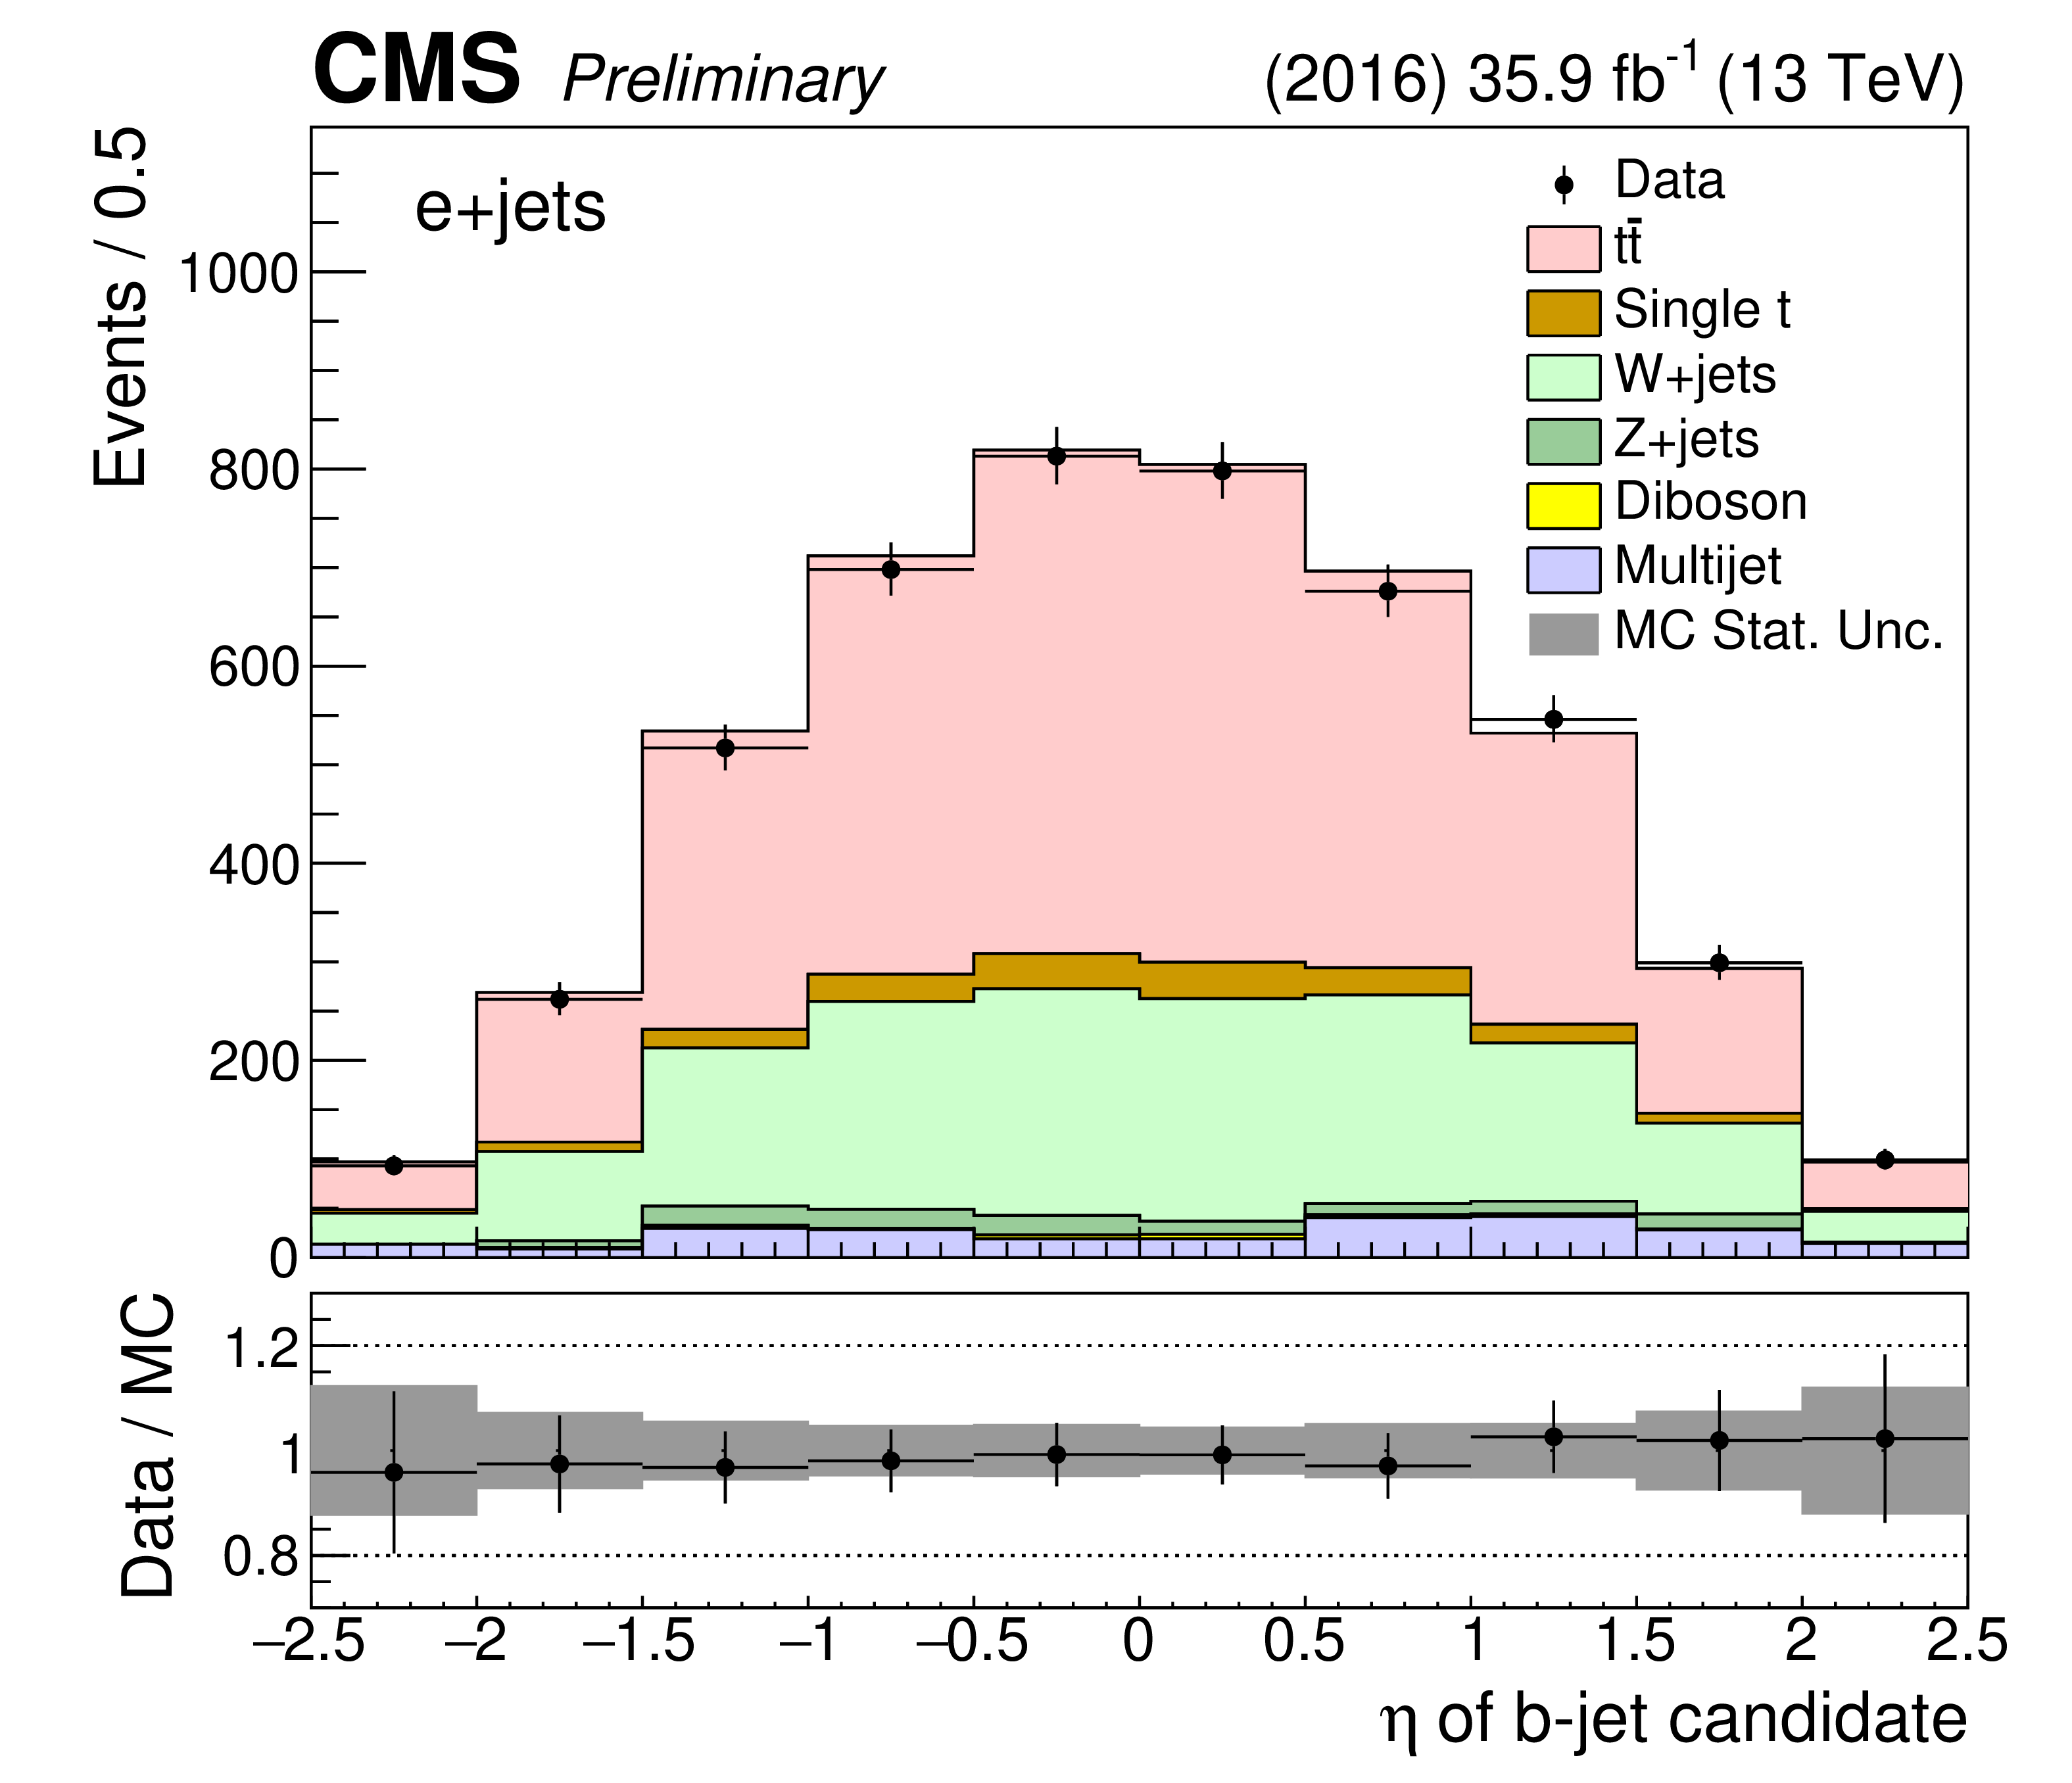
Figure 6-d:
Posterior kinematic distributions for the maximum likelihood fit. Different event categories and variables are used: $\eta $ distribution for the small-$R$ jet in 0t events (top), $\eta $ distribution of the b jet candidate in 1t0b events (middle), and soft drop mass of the t jet candidate in 1t1b events (bottom), in the $\mu $+jets (left) and e+jets (right) channels. The data points are shown with solid markers, while the signal and background predictions are shown as stacked histograms. The bottom panel shows the data divided by the sum of the prediction from the simulation (solid markers) and the systematic uncertainty from the fit (shaded band). |
png pdf |
Figure 6-e:
Posterior kinematic distributions for the maximum likelihood fit. Different event categories and variables are used: $\eta $ distribution for the small-$R$ jet in 0t events (top), $\eta $ distribution of the b jet candidate in 1t0b events (middle), and soft drop mass of the t jet candidate in 1t1b events (bottom), in the $\mu $+jets (left) and e+jets (right) channels. The data points are shown with solid markers, while the signal and background predictions are shown as stacked histograms. The bottom panel shows the data divided by the sum of the prediction from the simulation (solid markers) and the systematic uncertainty from the fit (shaded band). |
png pdf |
Figure 6-f:
Posterior kinematic distributions for the maximum likelihood fit. Different event categories and variables are used: $\eta $ distribution for the small-$R$ jet in 0t events (top), $\eta $ distribution of the b jet candidate in 1t0b events (middle), and soft drop mass of the t jet candidate in 1t1b events (bottom), in the $\mu $+jets (left) and e+jets (right) channels. The data points are shown with solid markers, while the signal and background predictions are shown as stacked histograms. The bottom panel shows the data divided by the sum of the prediction from the simulation (solid markers) and the systematic uncertainty from the fit (shaded band). |
png pdf |
Figure 7:
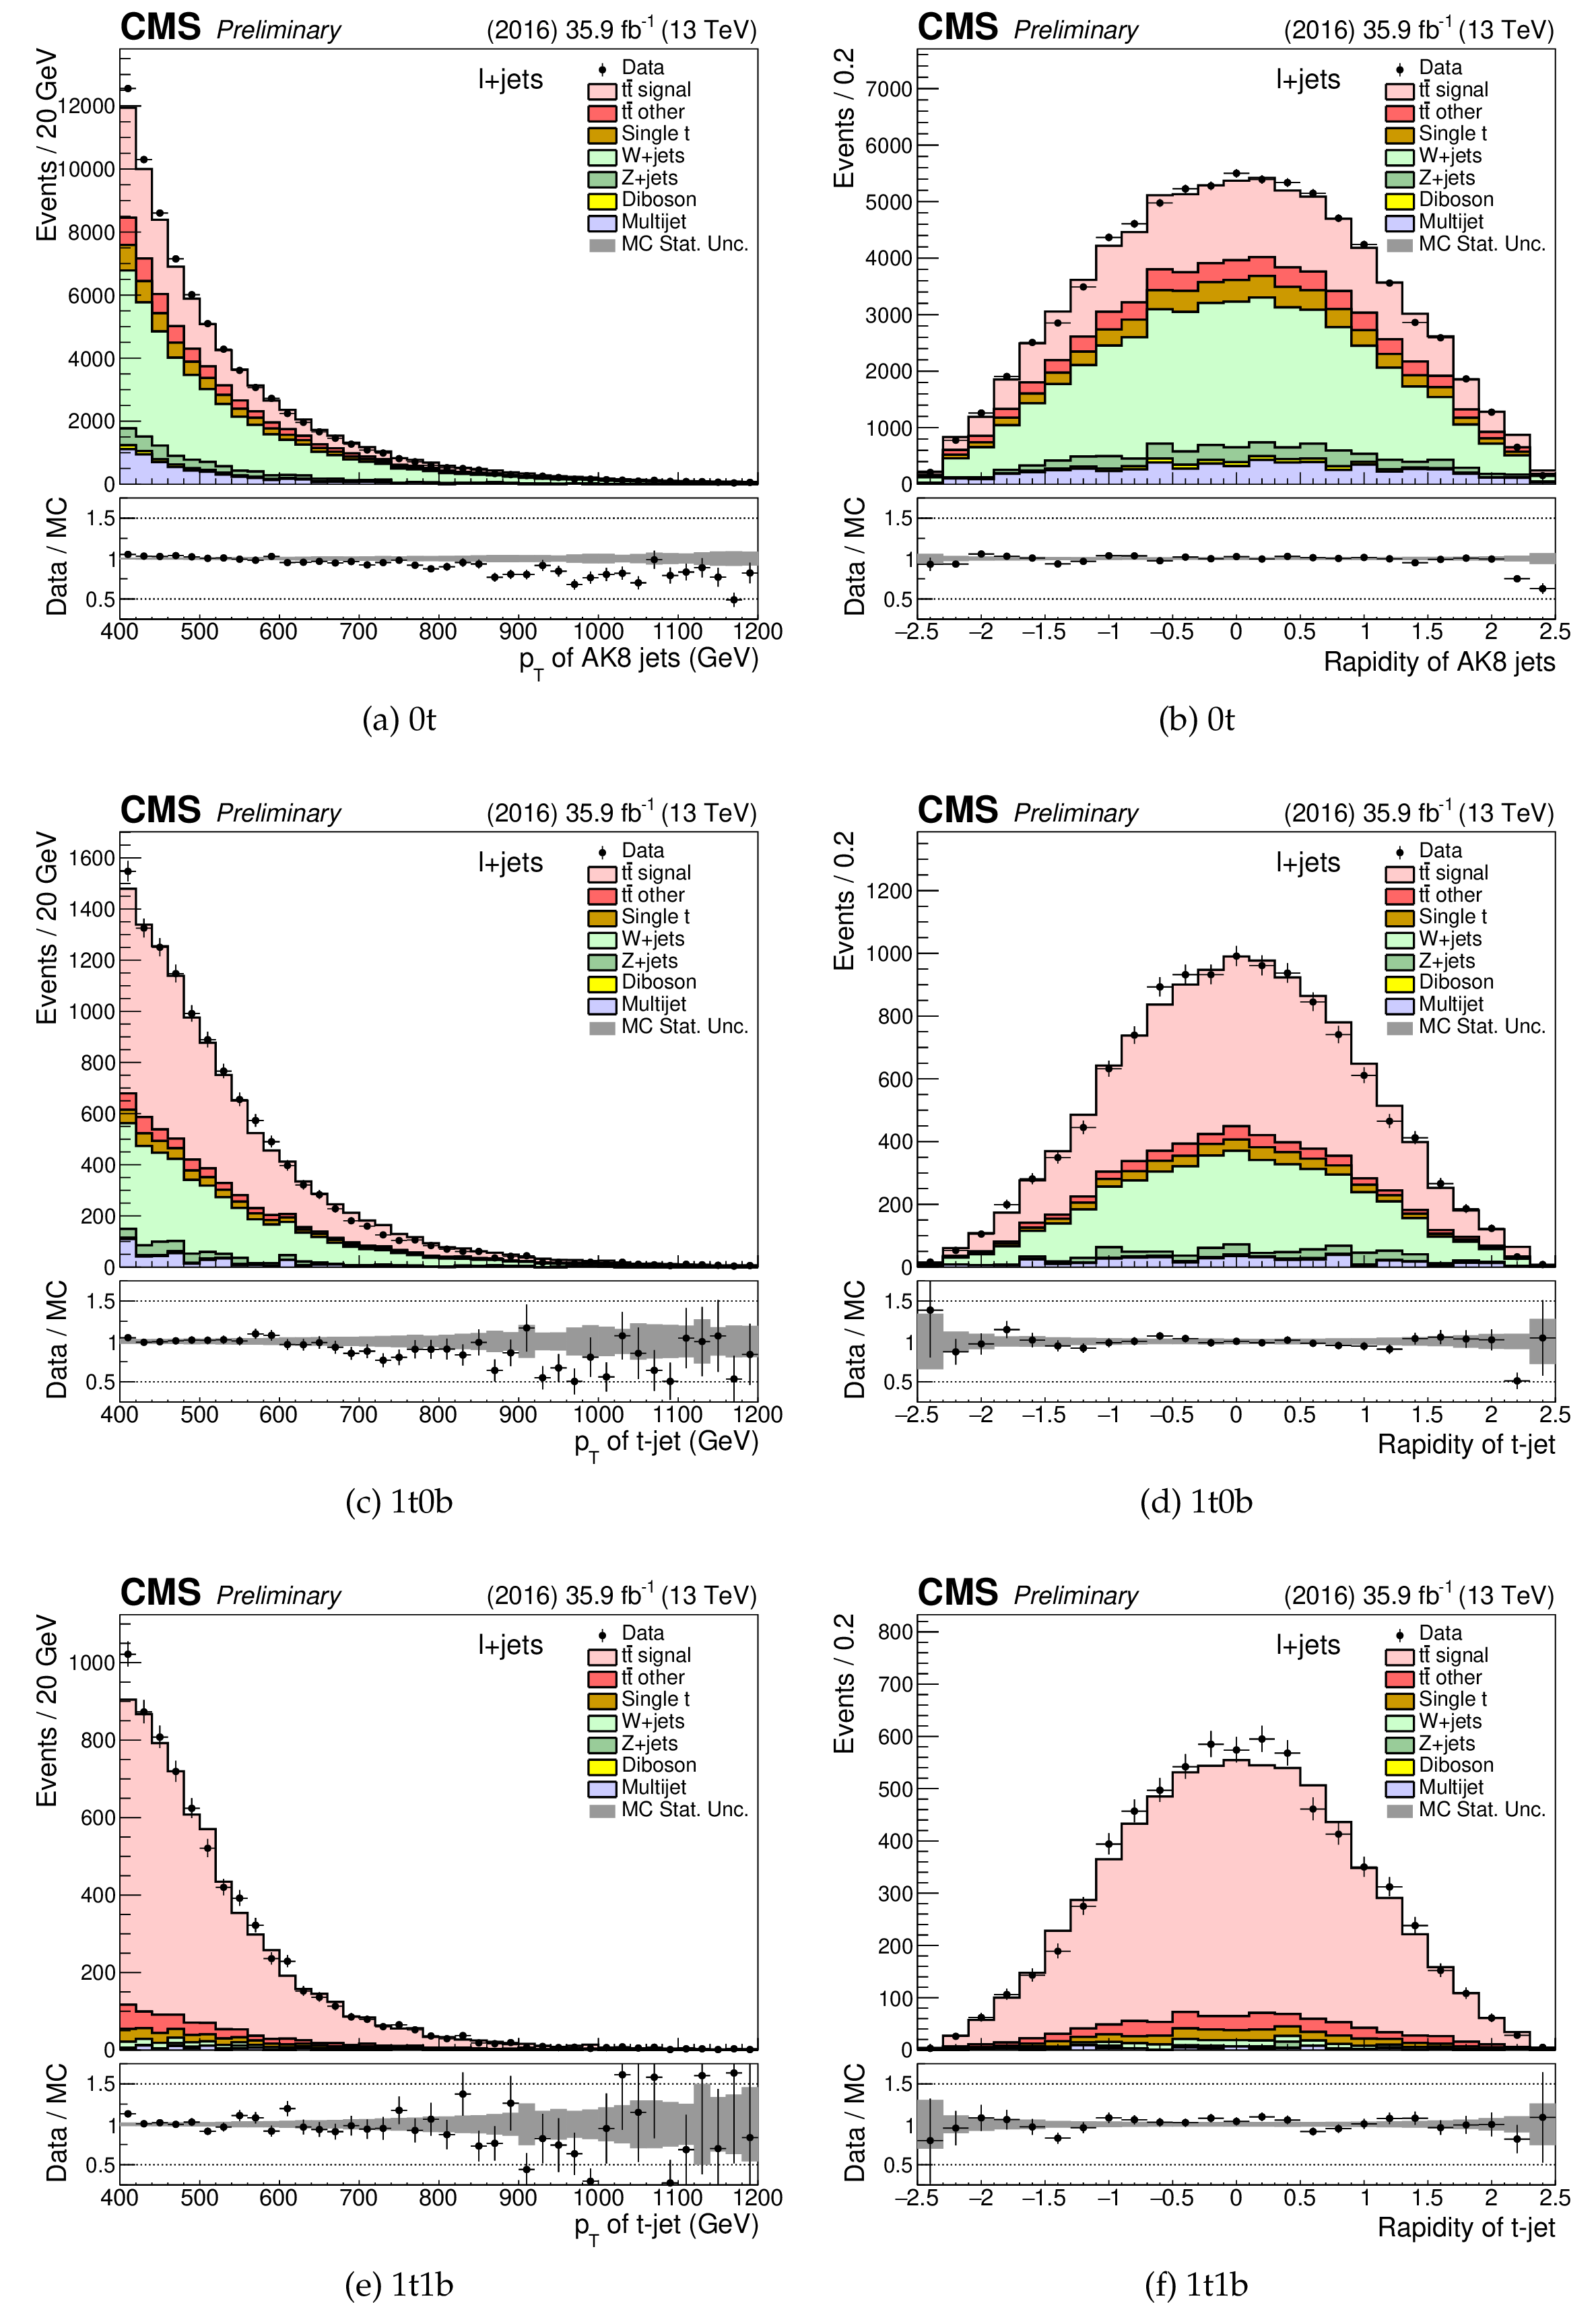
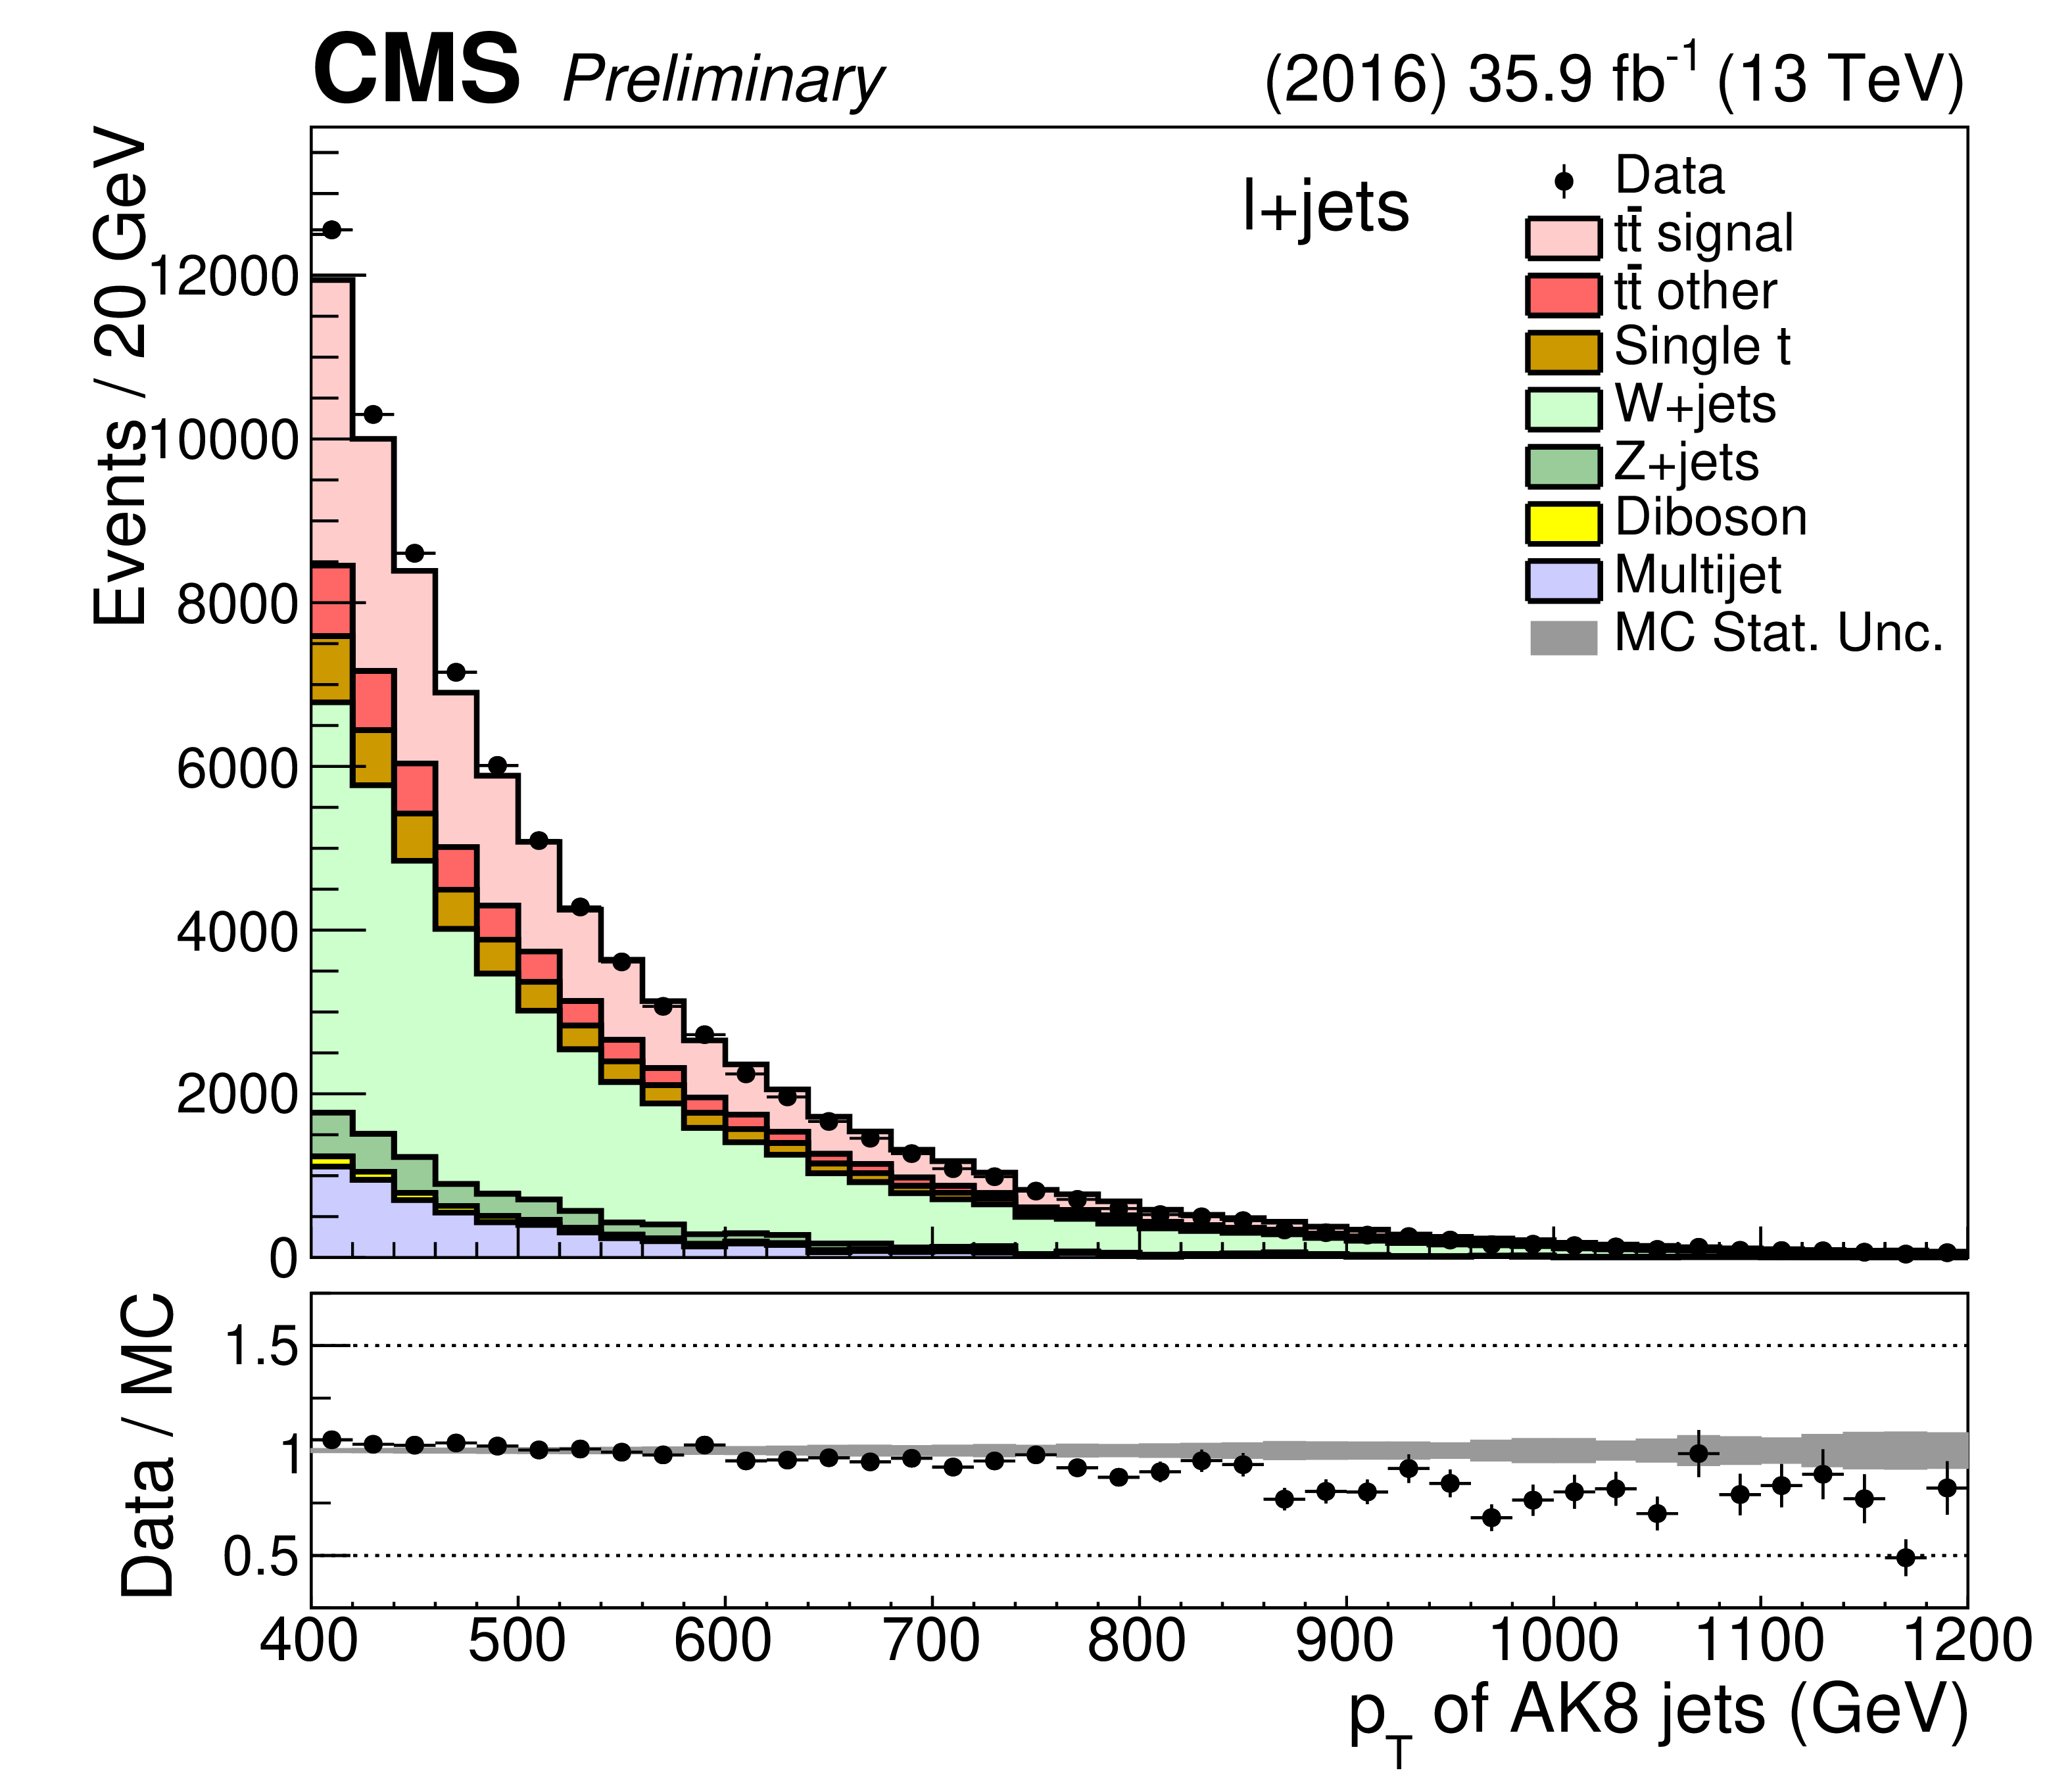
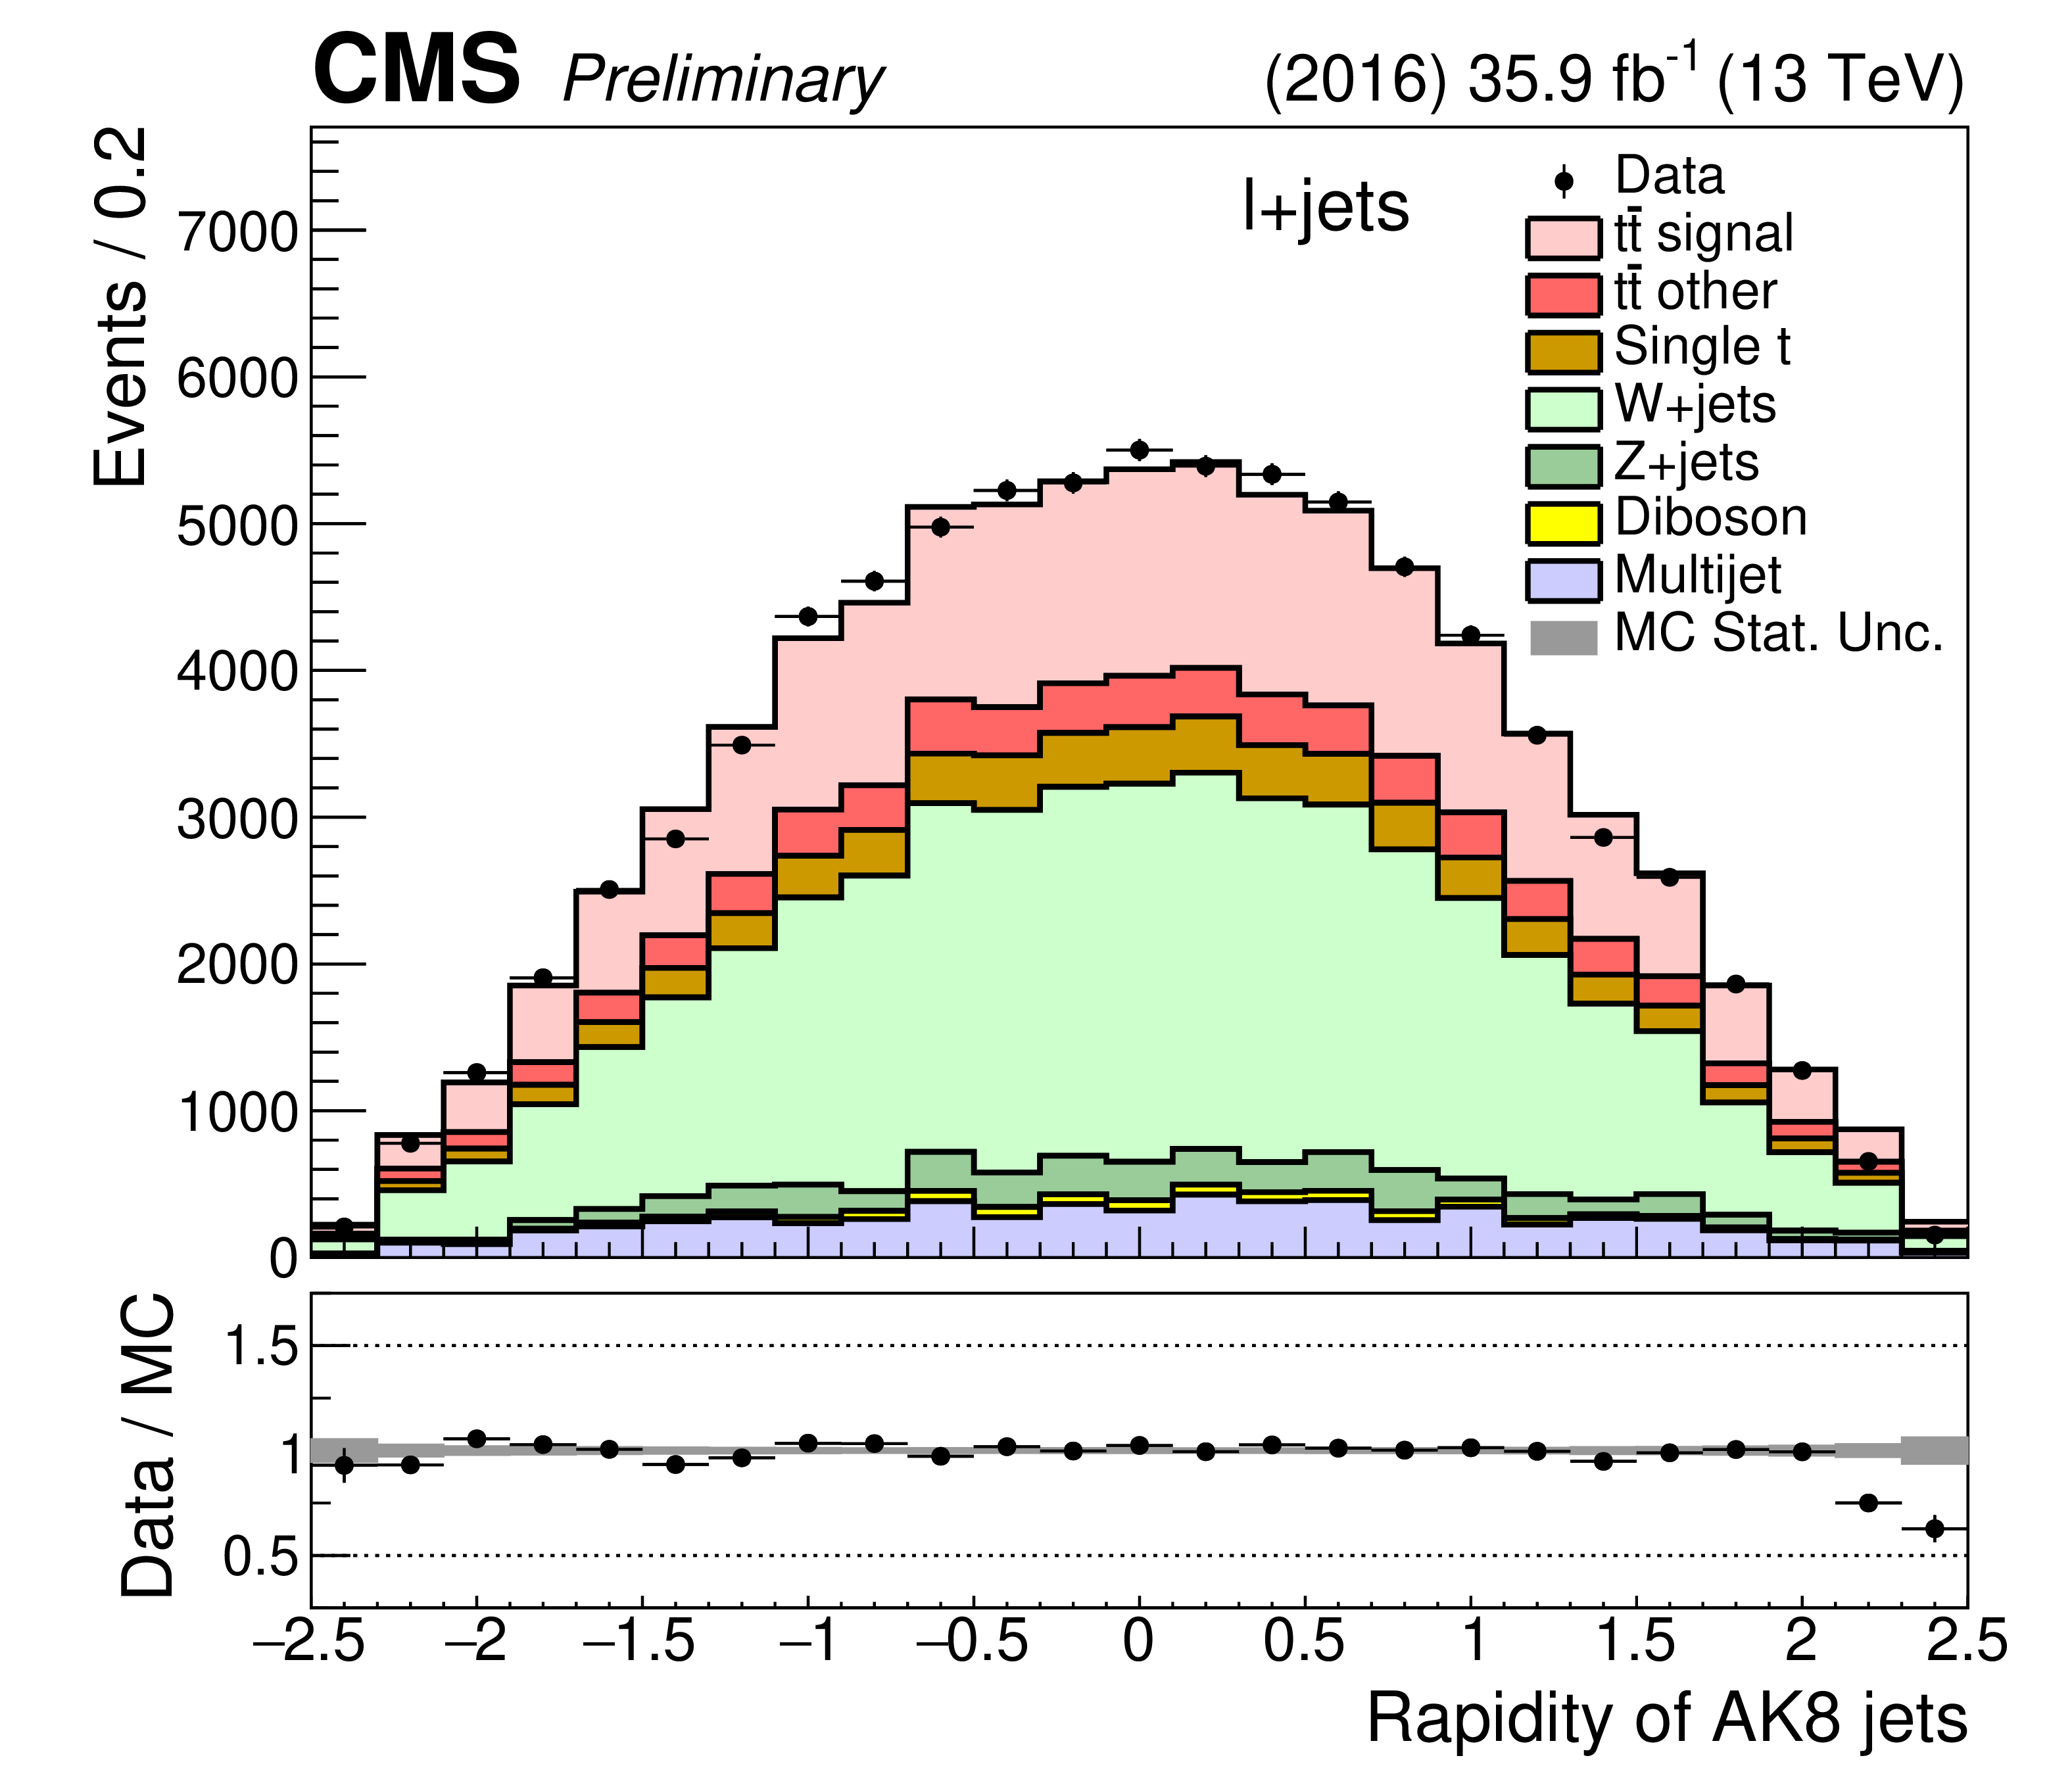
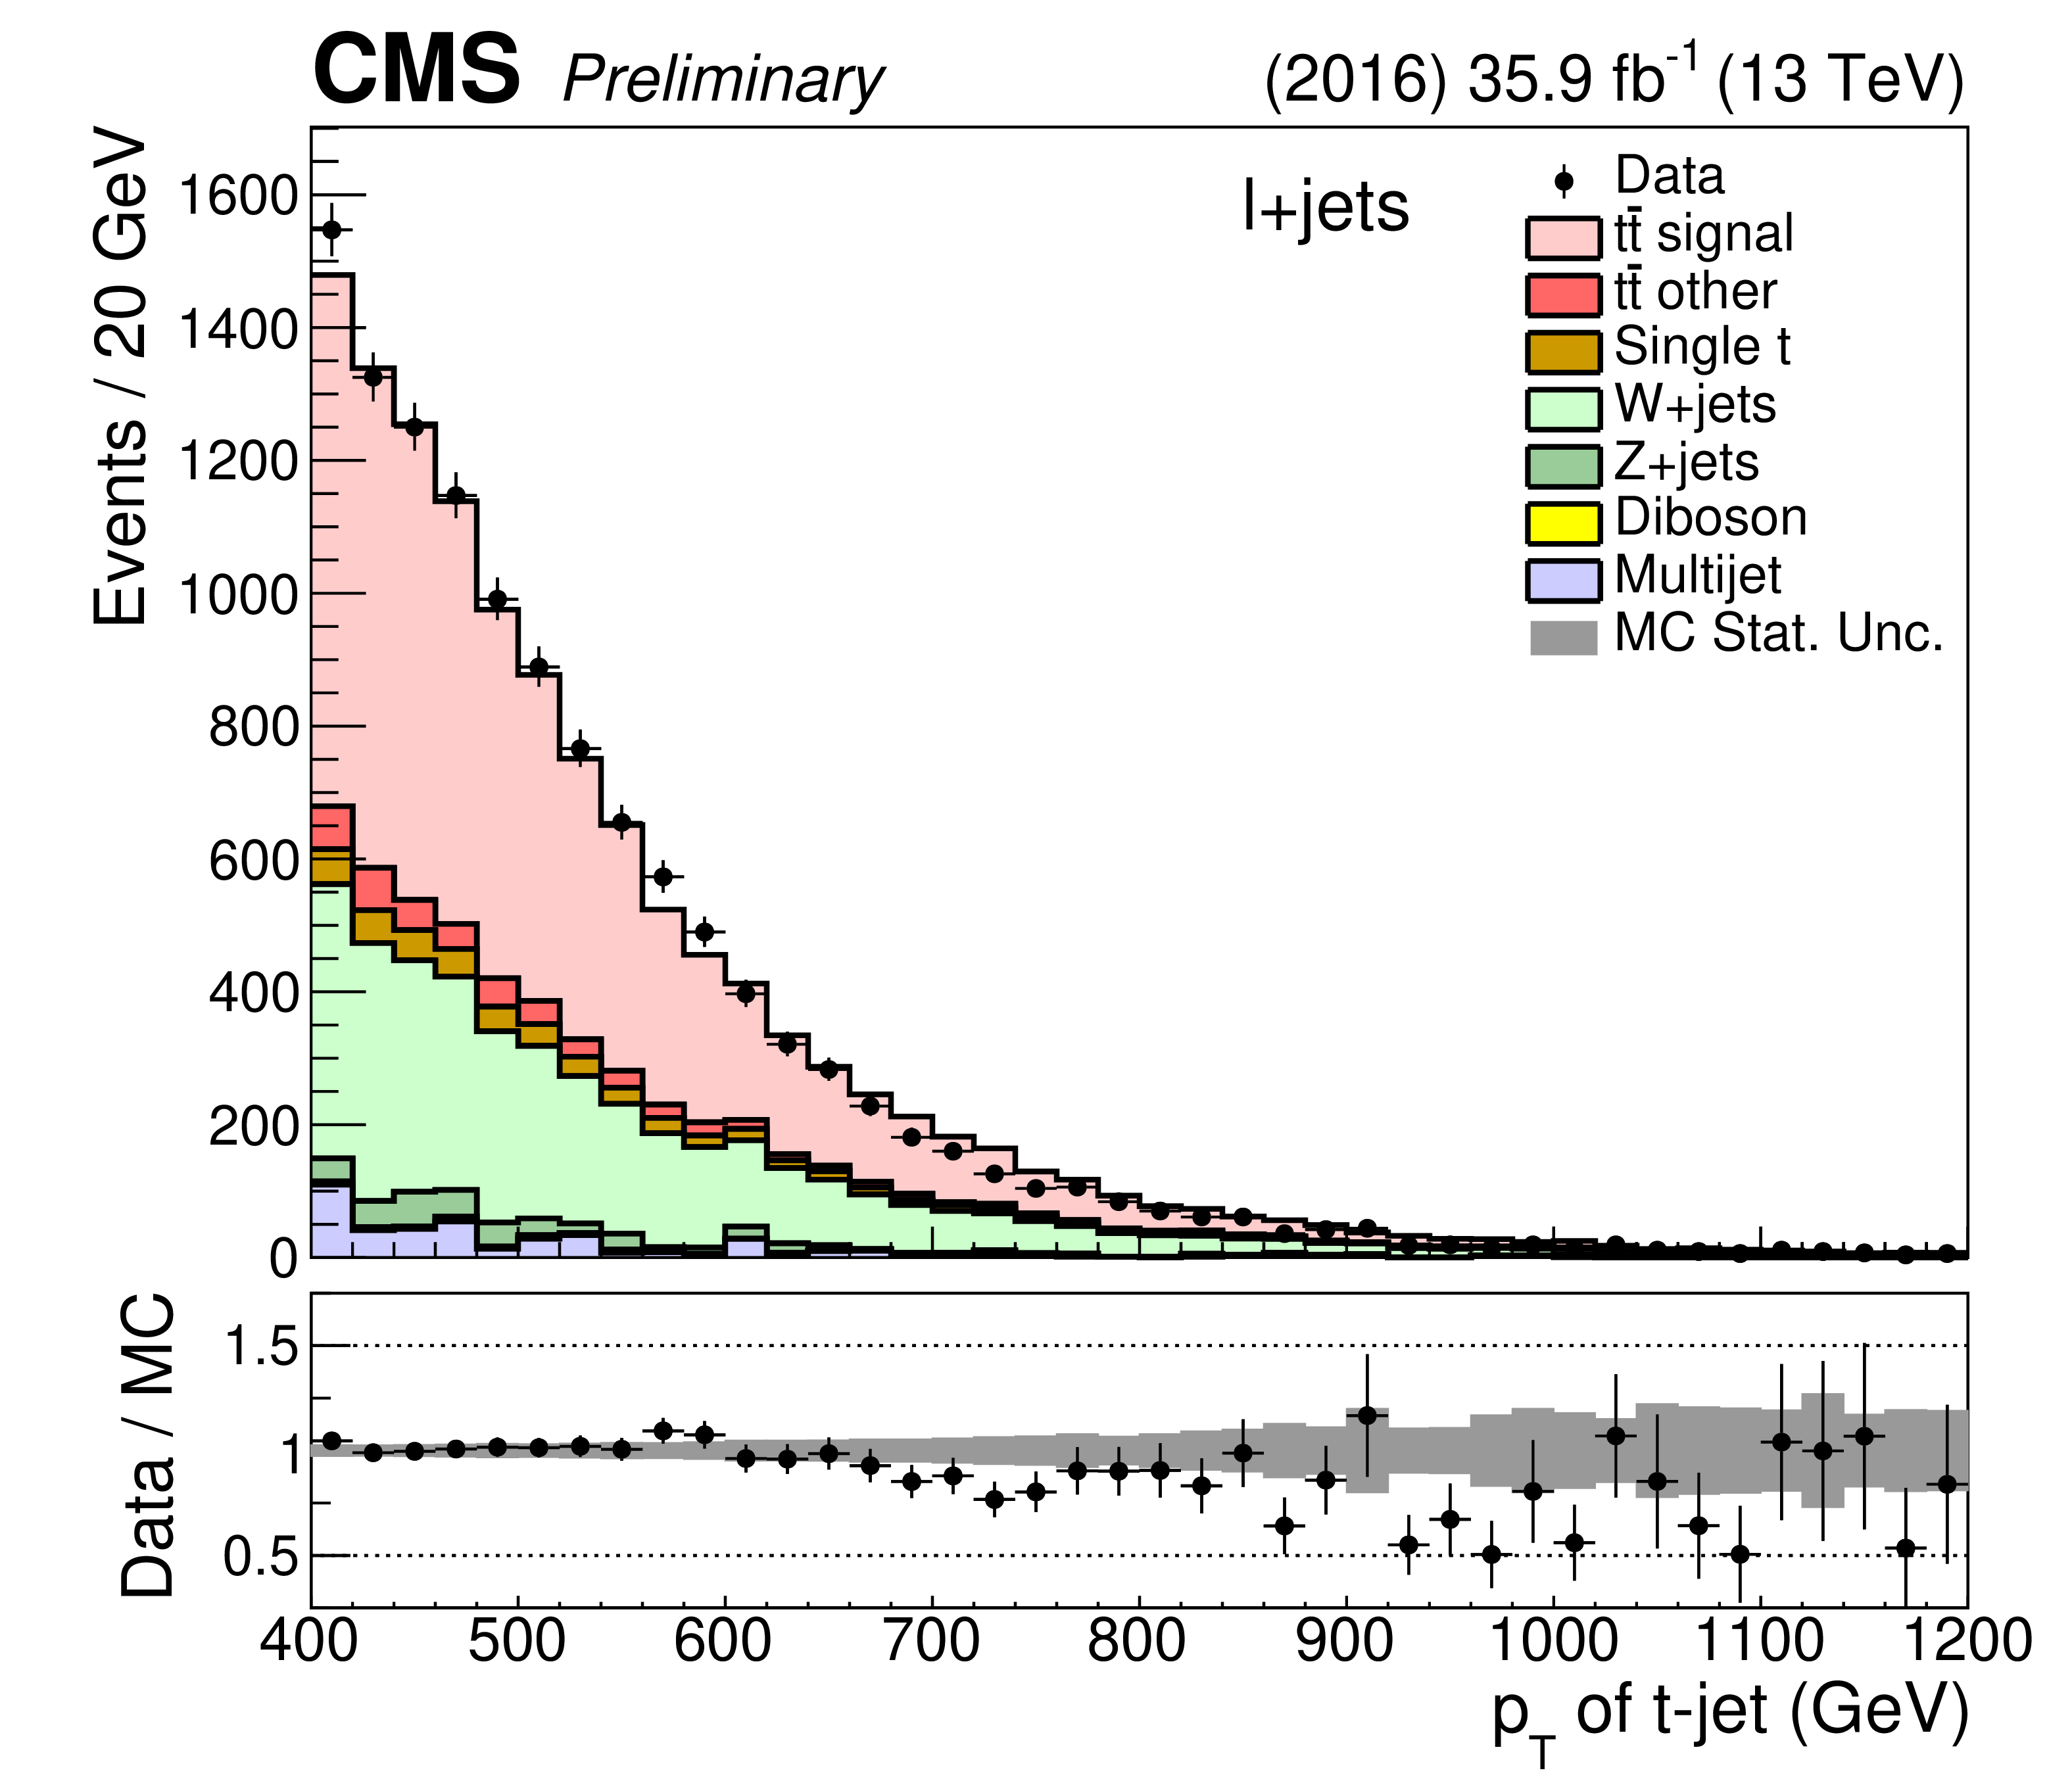
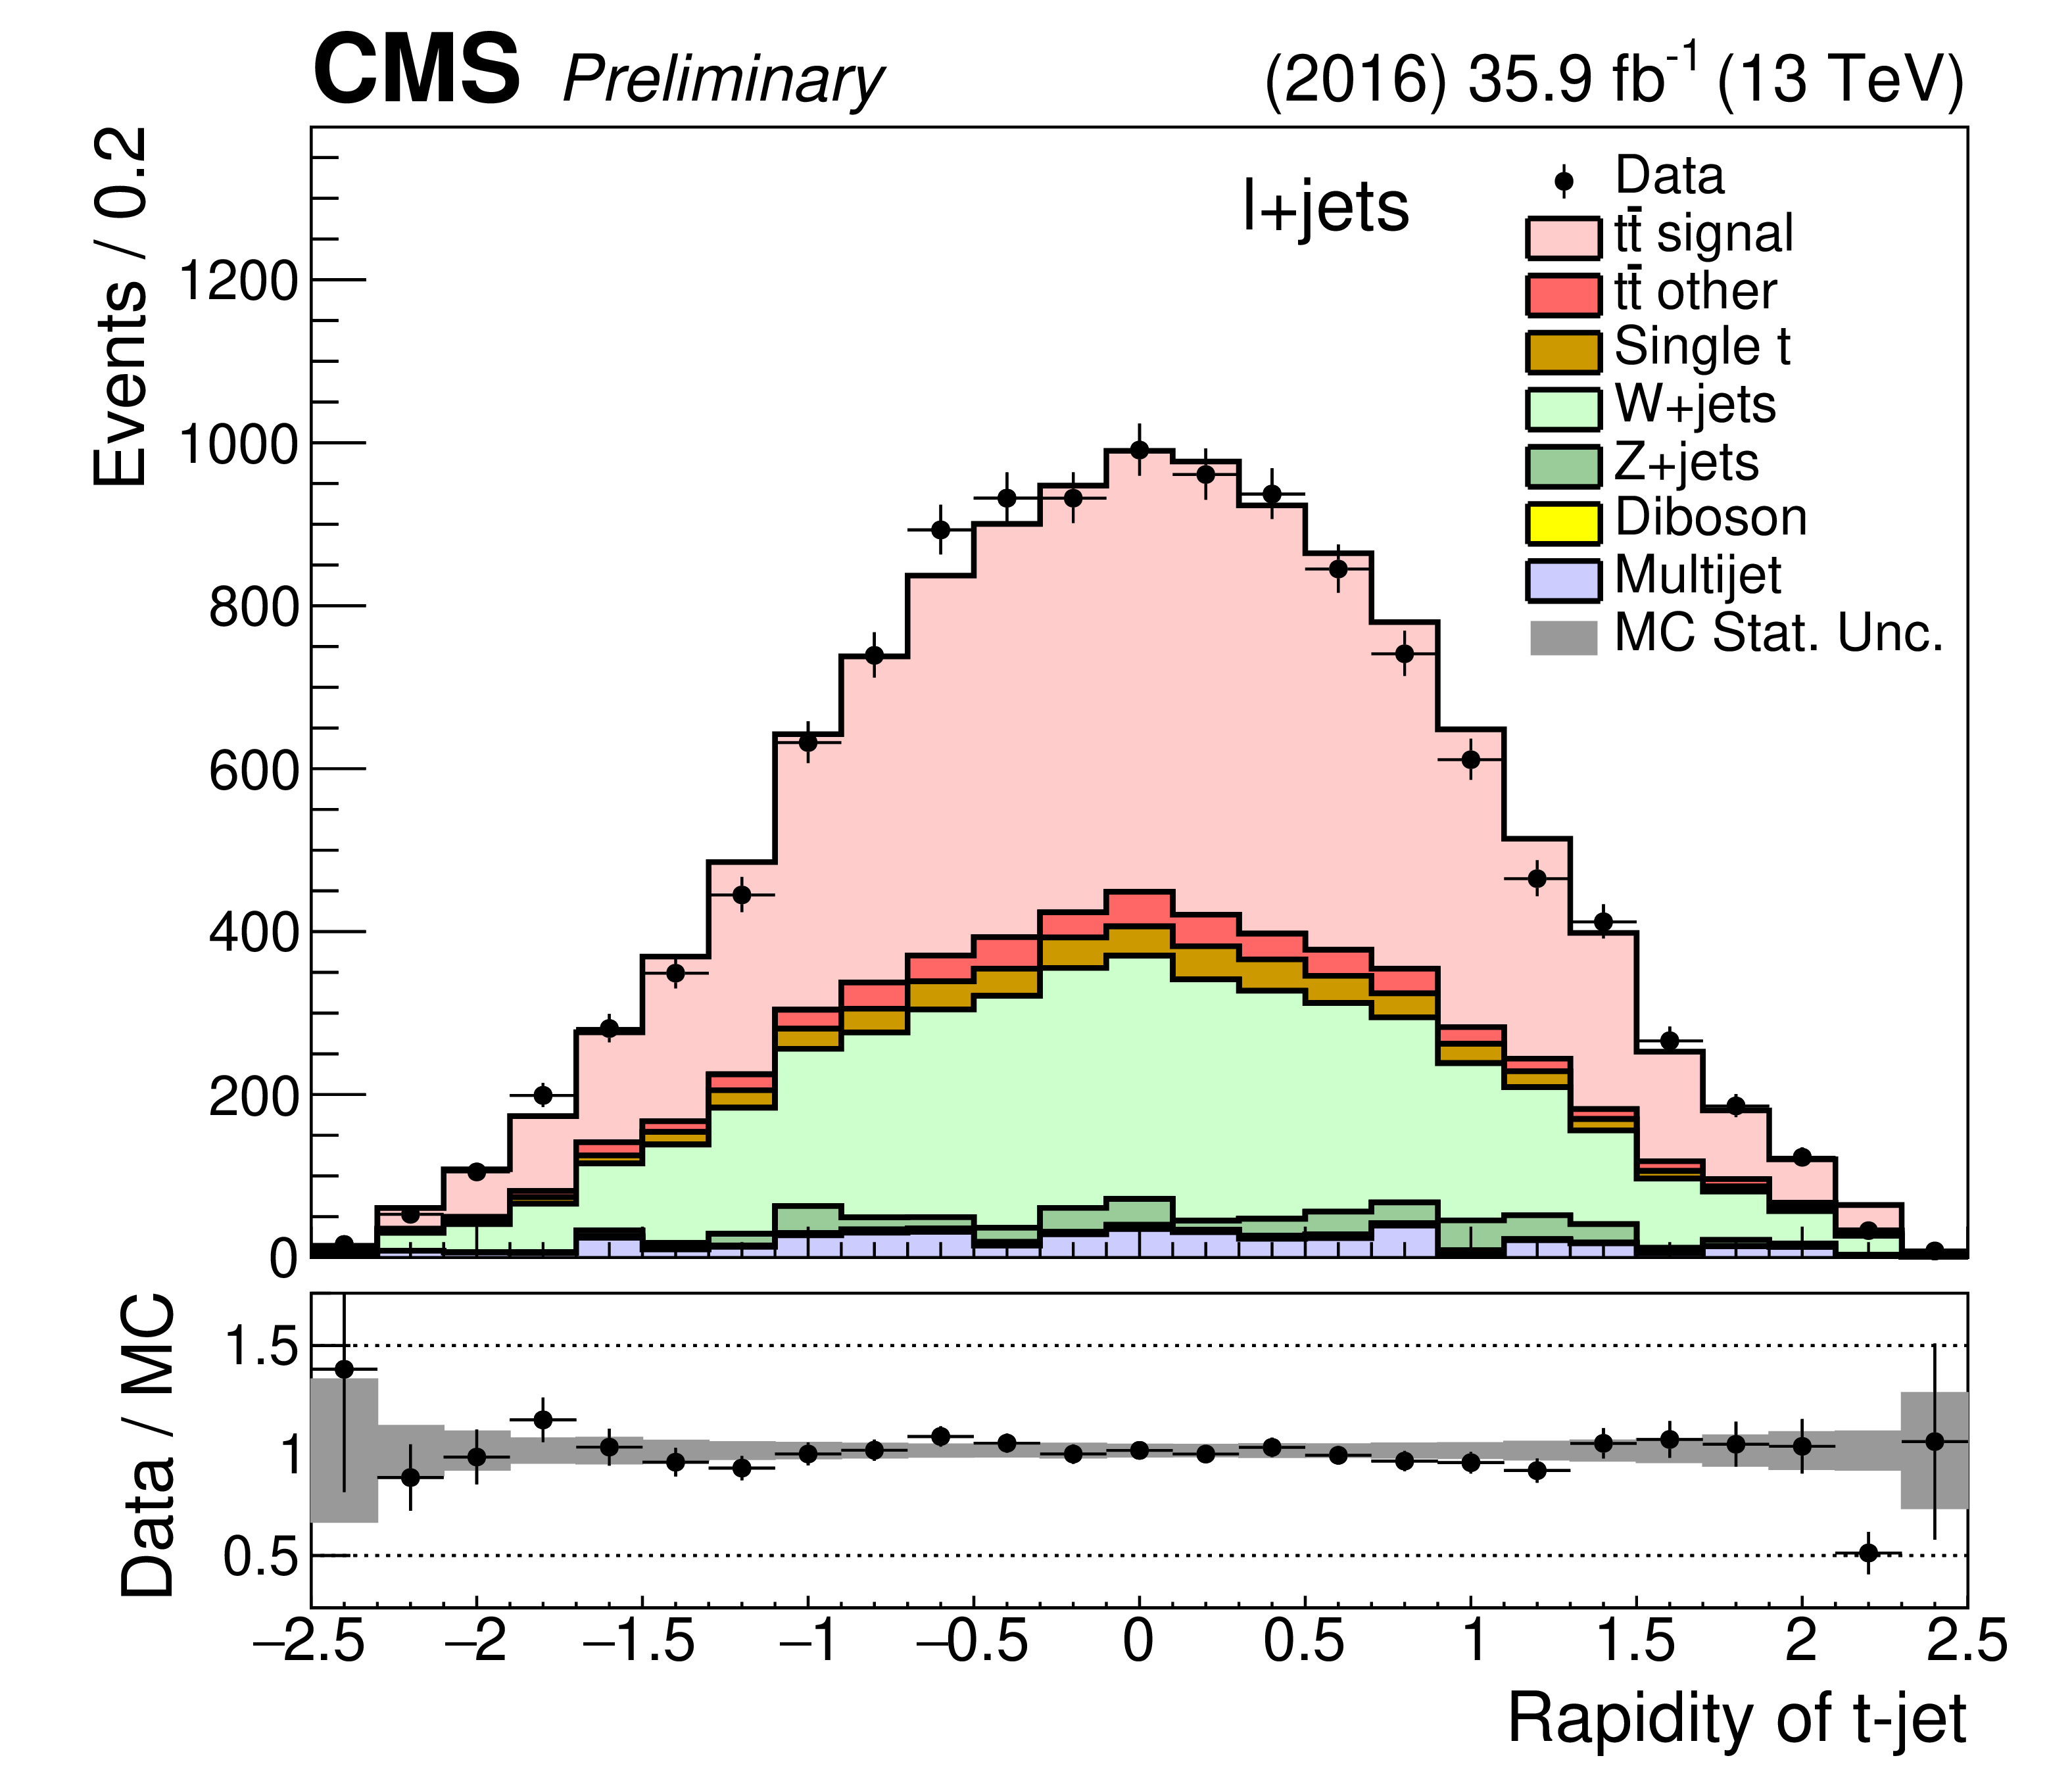
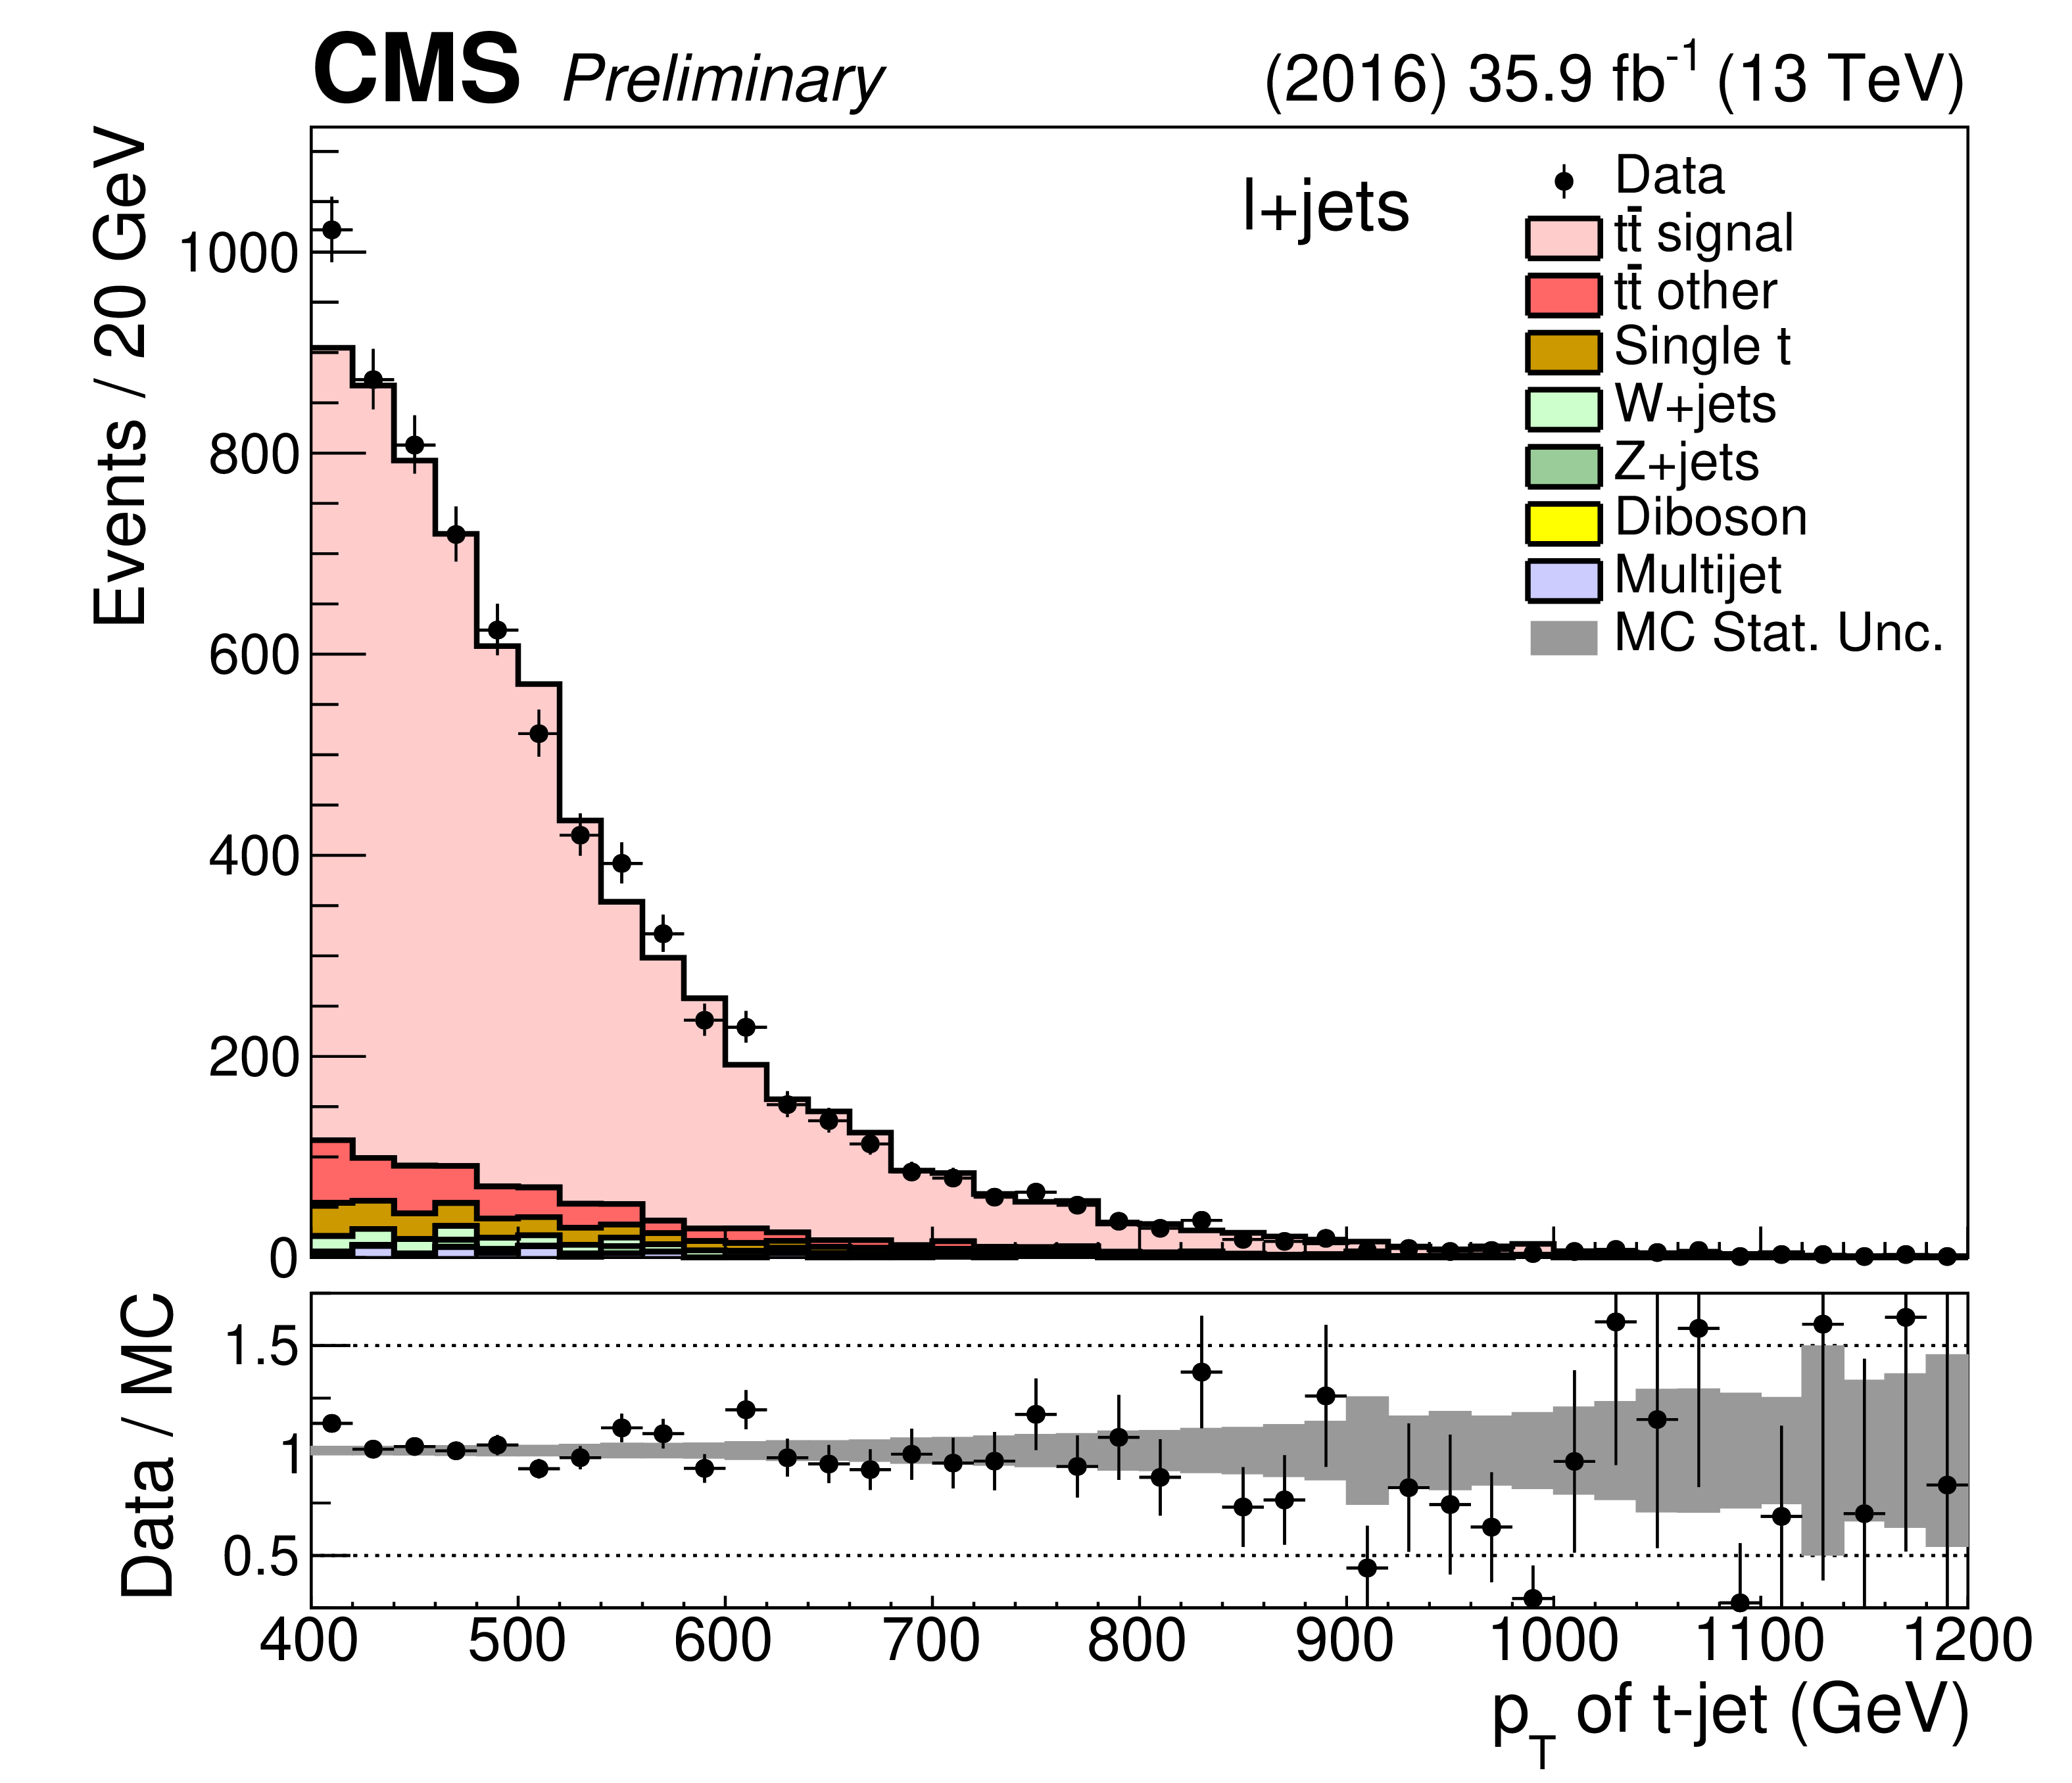
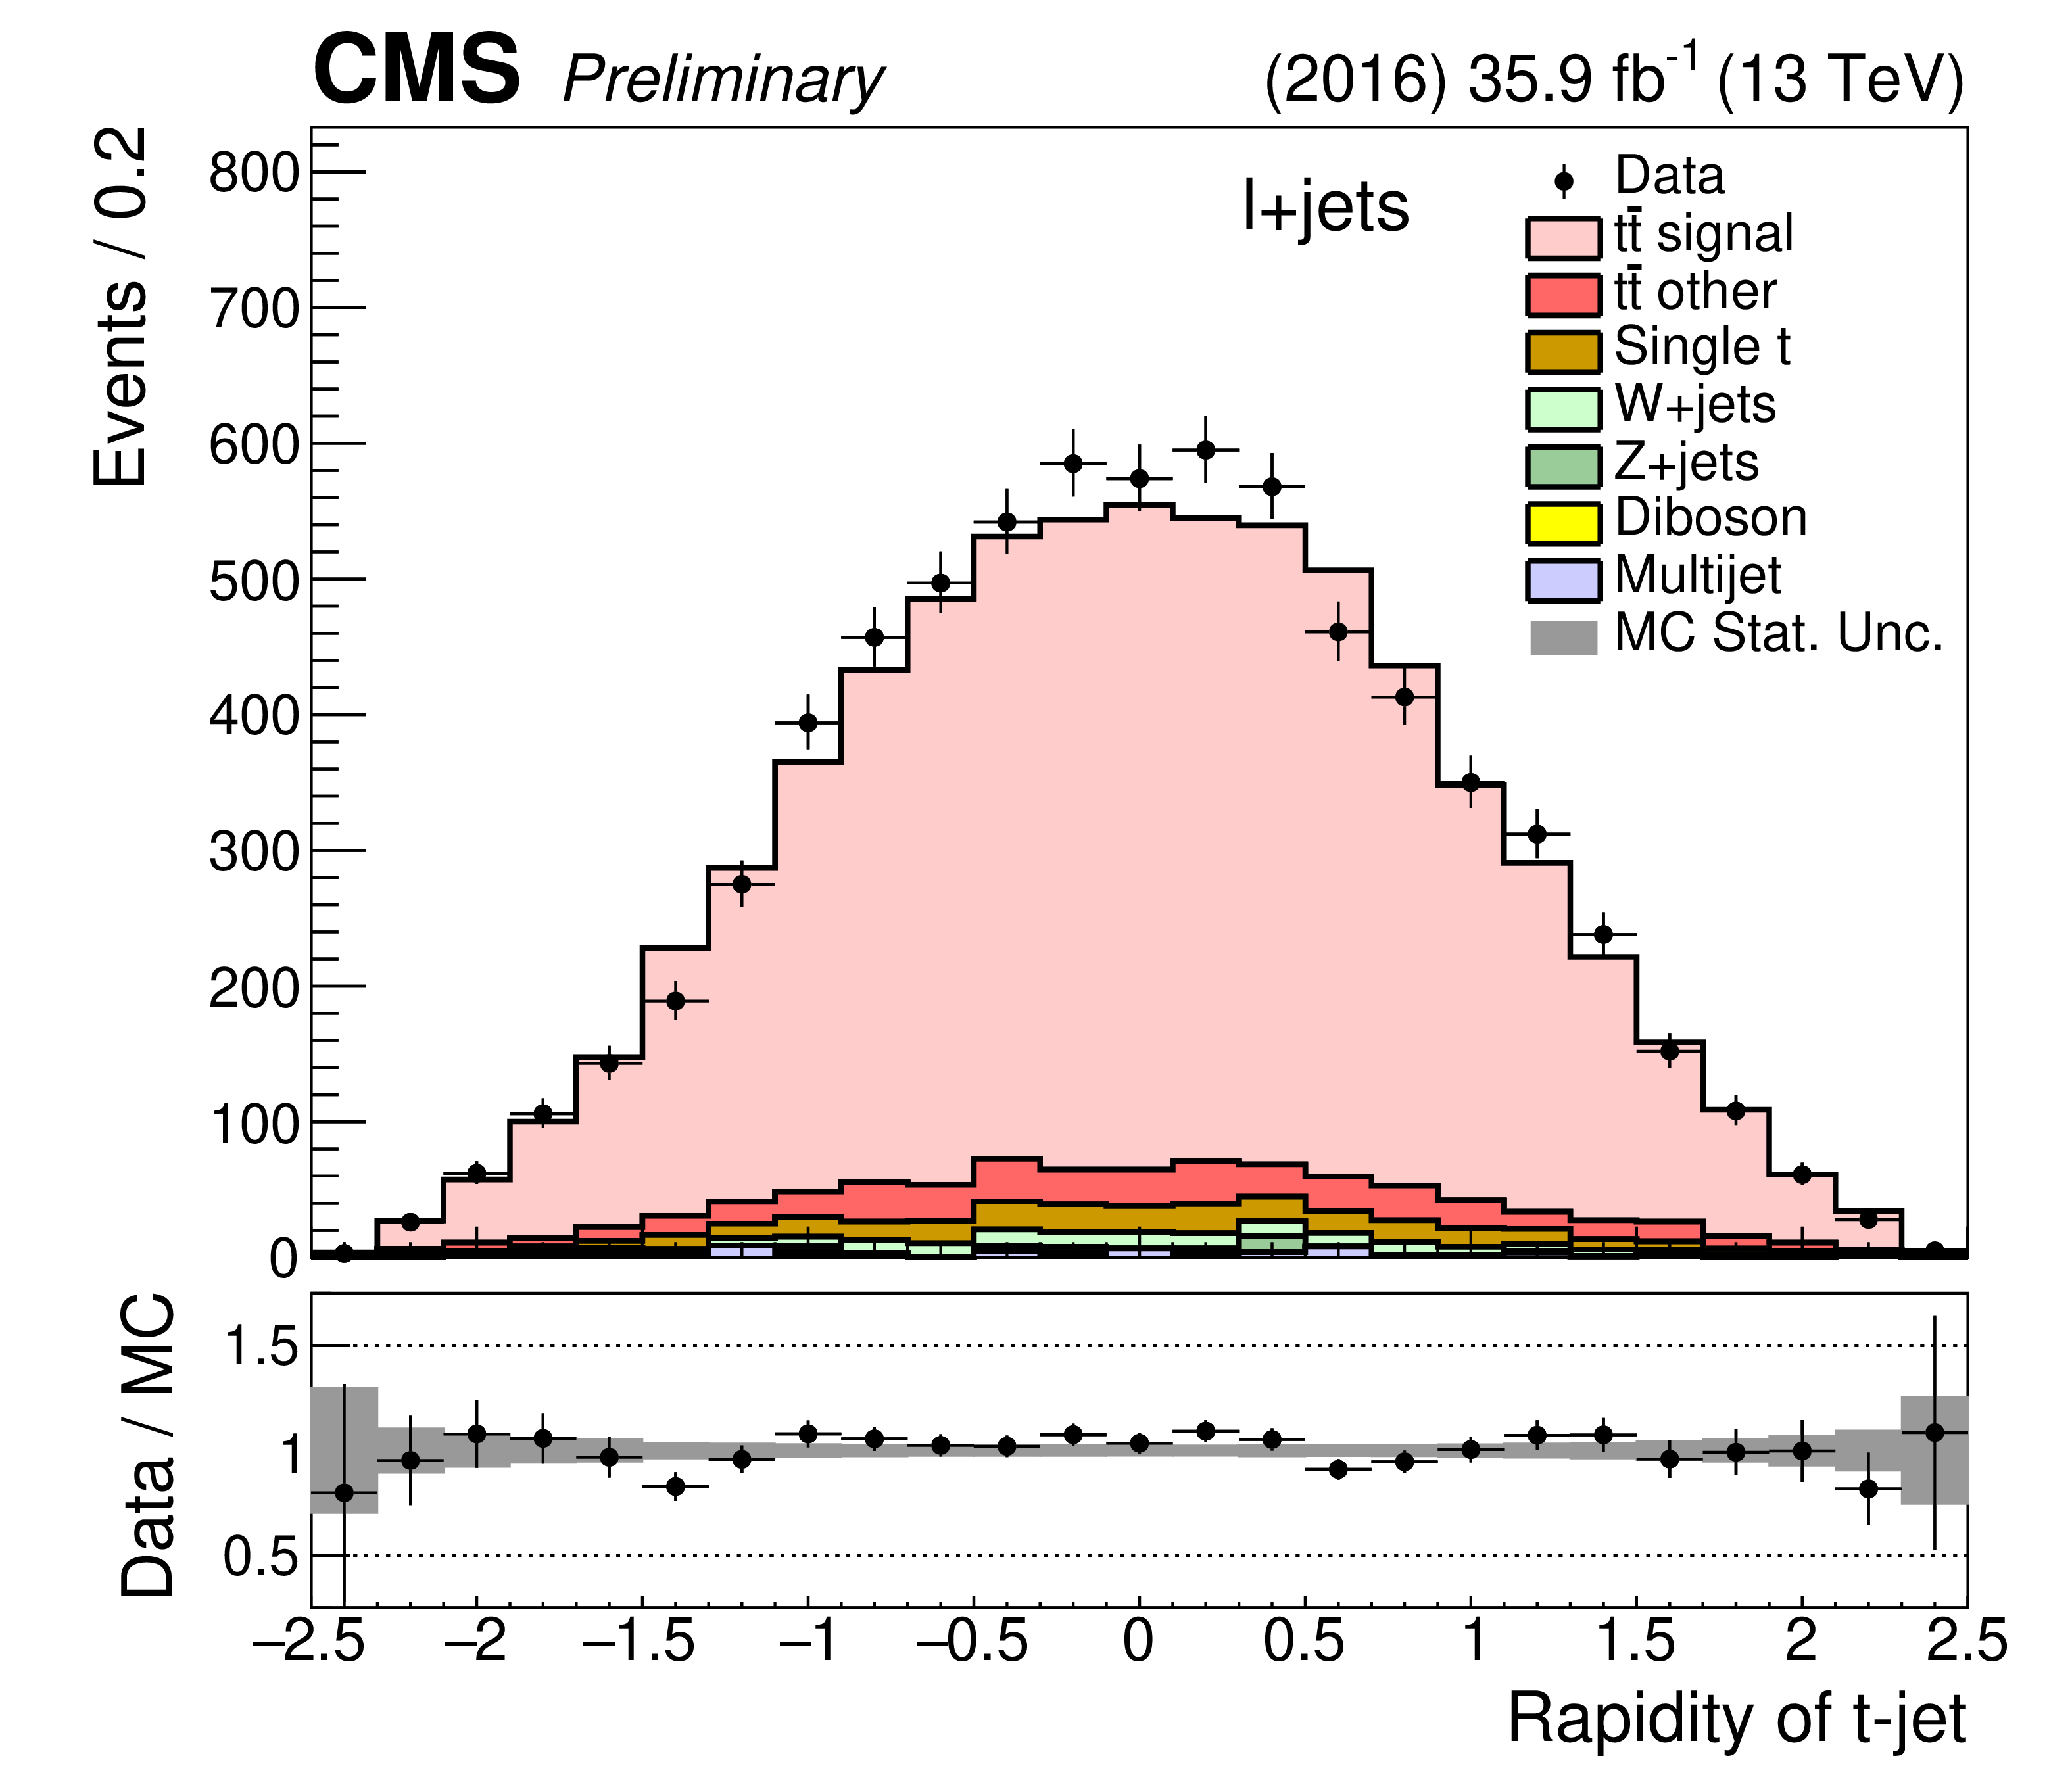
Distributions of the $ {p_{\mathrm {T}}} $ (left) and $y$ (right) of the t jet candidate for the 0t (top), 1t0b (middle), and 1t1b (bottom) regions for events in the combined $\ell $+jets channel. The posterior t tag scale factor and background normalizations are used. The data points are shown with solid markers, while the signal and background predictions are shown as stacked histograms. The bottom panel shows the data divided by the sum of the prediction from the simulation (solid markers) and the systematic uncertainty from the fit (shaded band). |
png pdf |
Figure 7-a:
Distributions of the $ {p_{\mathrm {T}}} $ (left) and $y$ (right) of the t jet candidate for the 0t (top), 1t0b (middle), and 1t1b (bottom) regions for events in the combined $\ell $+jets channel. The posterior t tag scale factor and background normalizations are used. The data points are shown with solid markers, while the signal and background predictions are shown as stacked histograms. The bottom panel shows the data divided by the sum of the prediction from the simulation (solid markers) and the systematic uncertainty from the fit (shaded band). |
png pdf |
Figure 7-b:
Distributions of the $ {p_{\mathrm {T}}} $ (left) and $y$ (right) of the t jet candidate for the 0t (top), 1t0b (middle), and 1t1b (bottom) regions for events in the combined $\ell $+jets channel. The posterior t tag scale factor and background normalizations are used. The data points are shown with solid markers, while the signal and background predictions are shown as stacked histograms. The bottom panel shows the data divided by the sum of the prediction from the simulation (solid markers) and the systematic uncertainty from the fit (shaded band). |
png pdf |
Figure 7-c:
Distributions of the $ {p_{\mathrm {T}}} $ (left) and $y$ (right) of the t jet candidate for the 0t (top), 1t0b (middle), and 1t1b (bottom) regions for events in the combined $\ell $+jets channel. The posterior t tag scale factor and background normalizations are used. The data points are shown with solid markers, while the signal and background predictions are shown as stacked histograms. The bottom panel shows the data divided by the sum of the prediction from the simulation (solid markers) and the systematic uncertainty from the fit (shaded band). |
png pdf |
Figure 7-d:
Distributions of the $ {p_{\mathrm {T}}} $ (left) and $y$ (right) of the t jet candidate for the 0t (top), 1t0b (middle), and 1t1b (bottom) regions for events in the combined $\ell $+jets channel. The posterior t tag scale factor and background normalizations are used. The data points are shown with solid markers, while the signal and background predictions are shown as stacked histograms. The bottom panel shows the data divided by the sum of the prediction from the simulation (solid markers) and the systematic uncertainty from the fit (shaded band). |
png pdf |
Figure 7-e:
Distributions of the $ {p_{\mathrm {T}}} $ (left) and $y$ (right) of the t jet candidate for the 0t (top), 1t0b (middle), and 1t1b (bottom) regions for events in the combined $\ell $+jets channel. The posterior t tag scale factor and background normalizations are used. The data points are shown with solid markers, while the signal and background predictions are shown as stacked histograms. The bottom panel shows the data divided by the sum of the prediction from the simulation (solid markers) and the systematic uncertainty from the fit (shaded band). |
png pdf |
Figure 7-f:
Distributions of the $ {p_{\mathrm {T}}} $ (left) and $y$ (right) of the t jet candidate for the 0t (top), 1t0b (middle), and 1t1b (bottom) regions for events in the combined $\ell $+jets channel. The posterior t tag scale factor and background normalizations are used. The data points are shown with solid markers, while the signal and background predictions are shown as stacked histograms. The bottom panel shows the data divided by the sum of the prediction from the simulation (solid markers) and the systematic uncertainty from the fit (shaded band). |
png pdf |
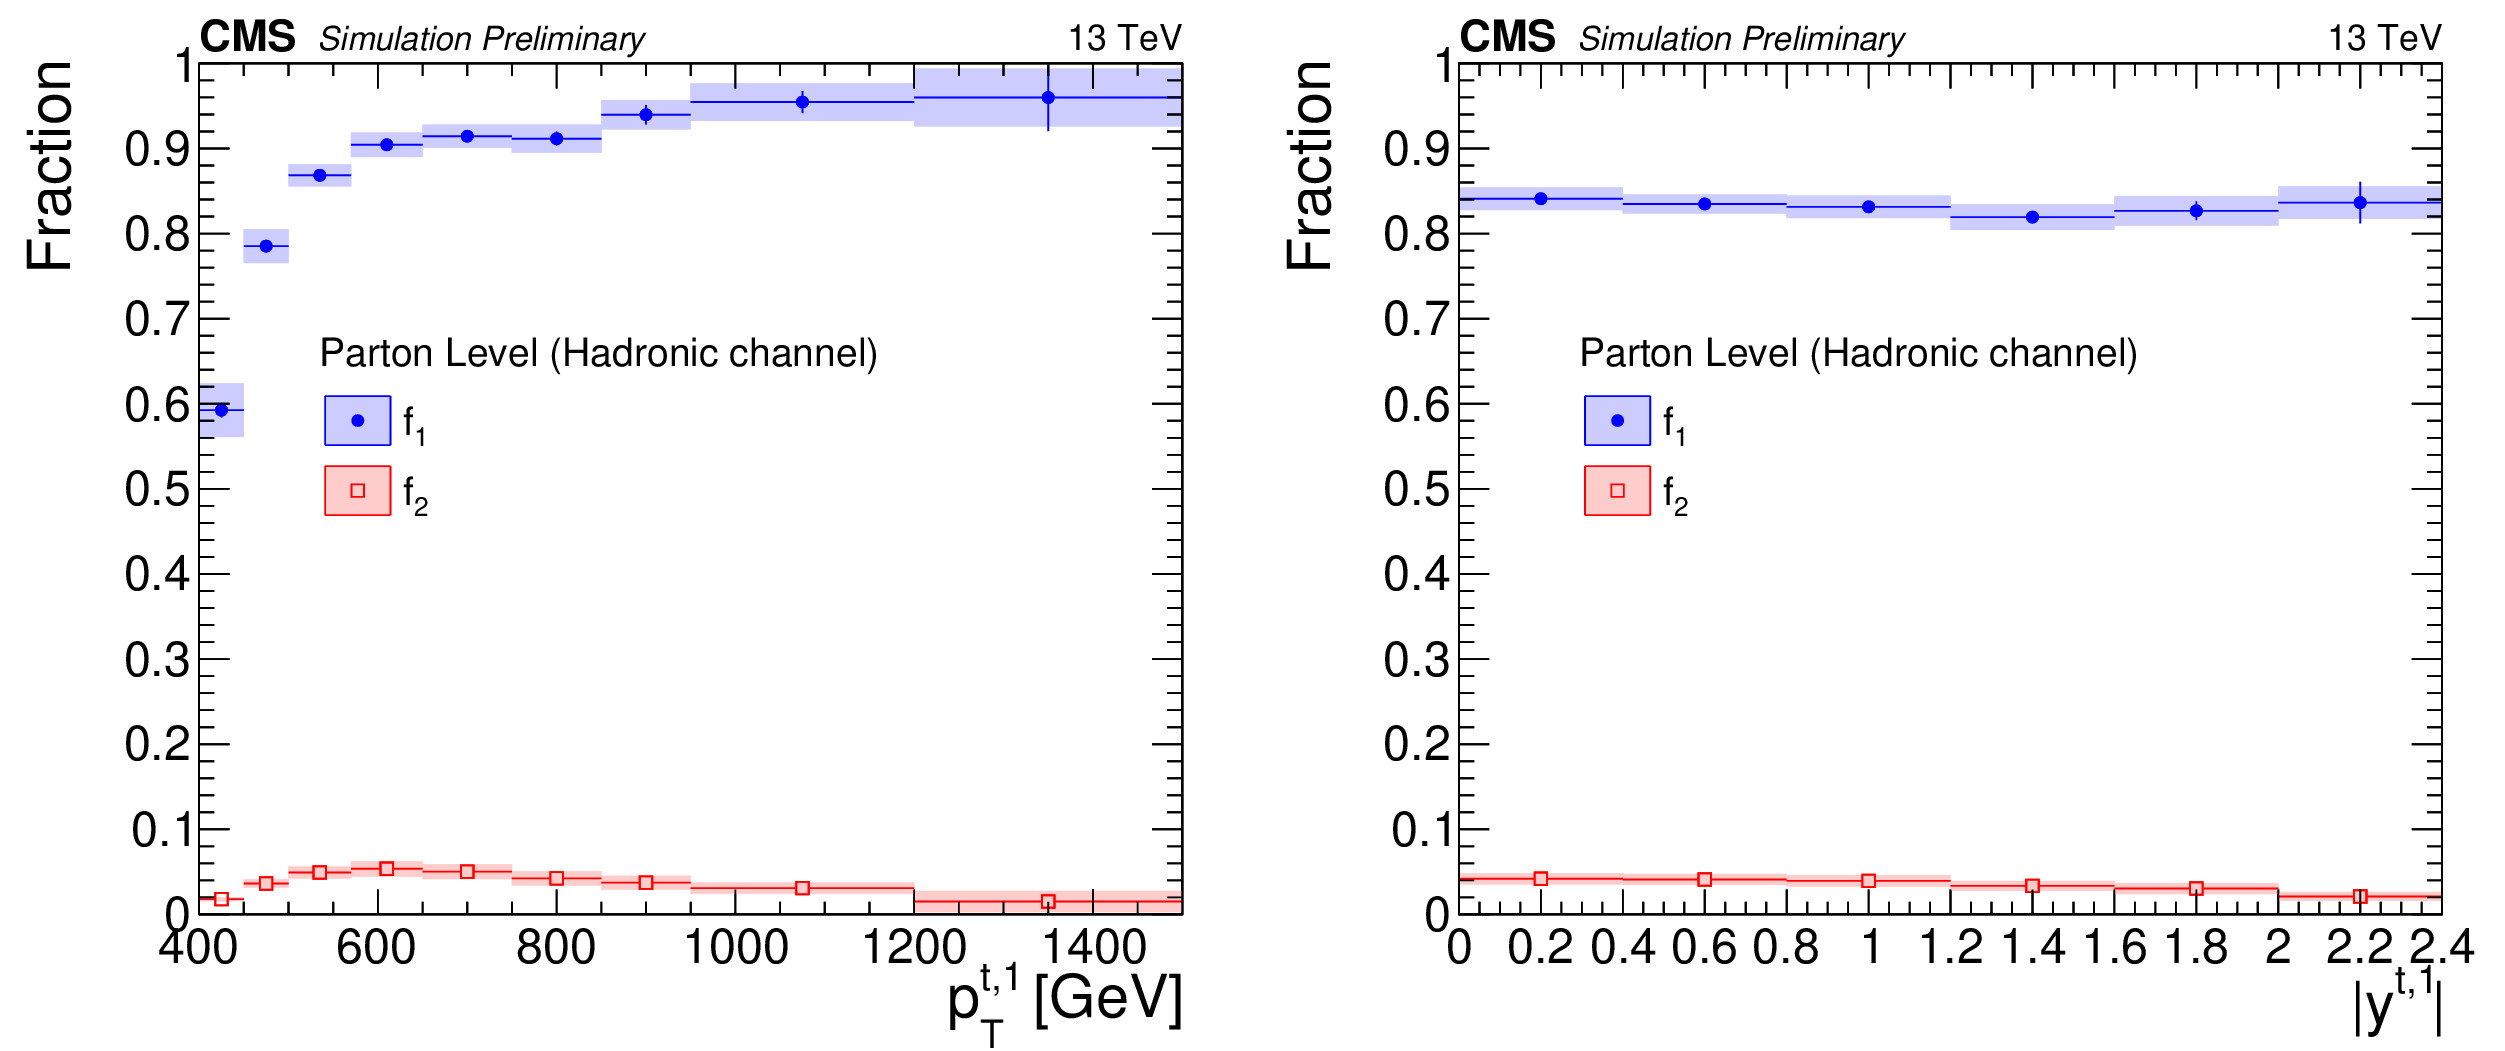
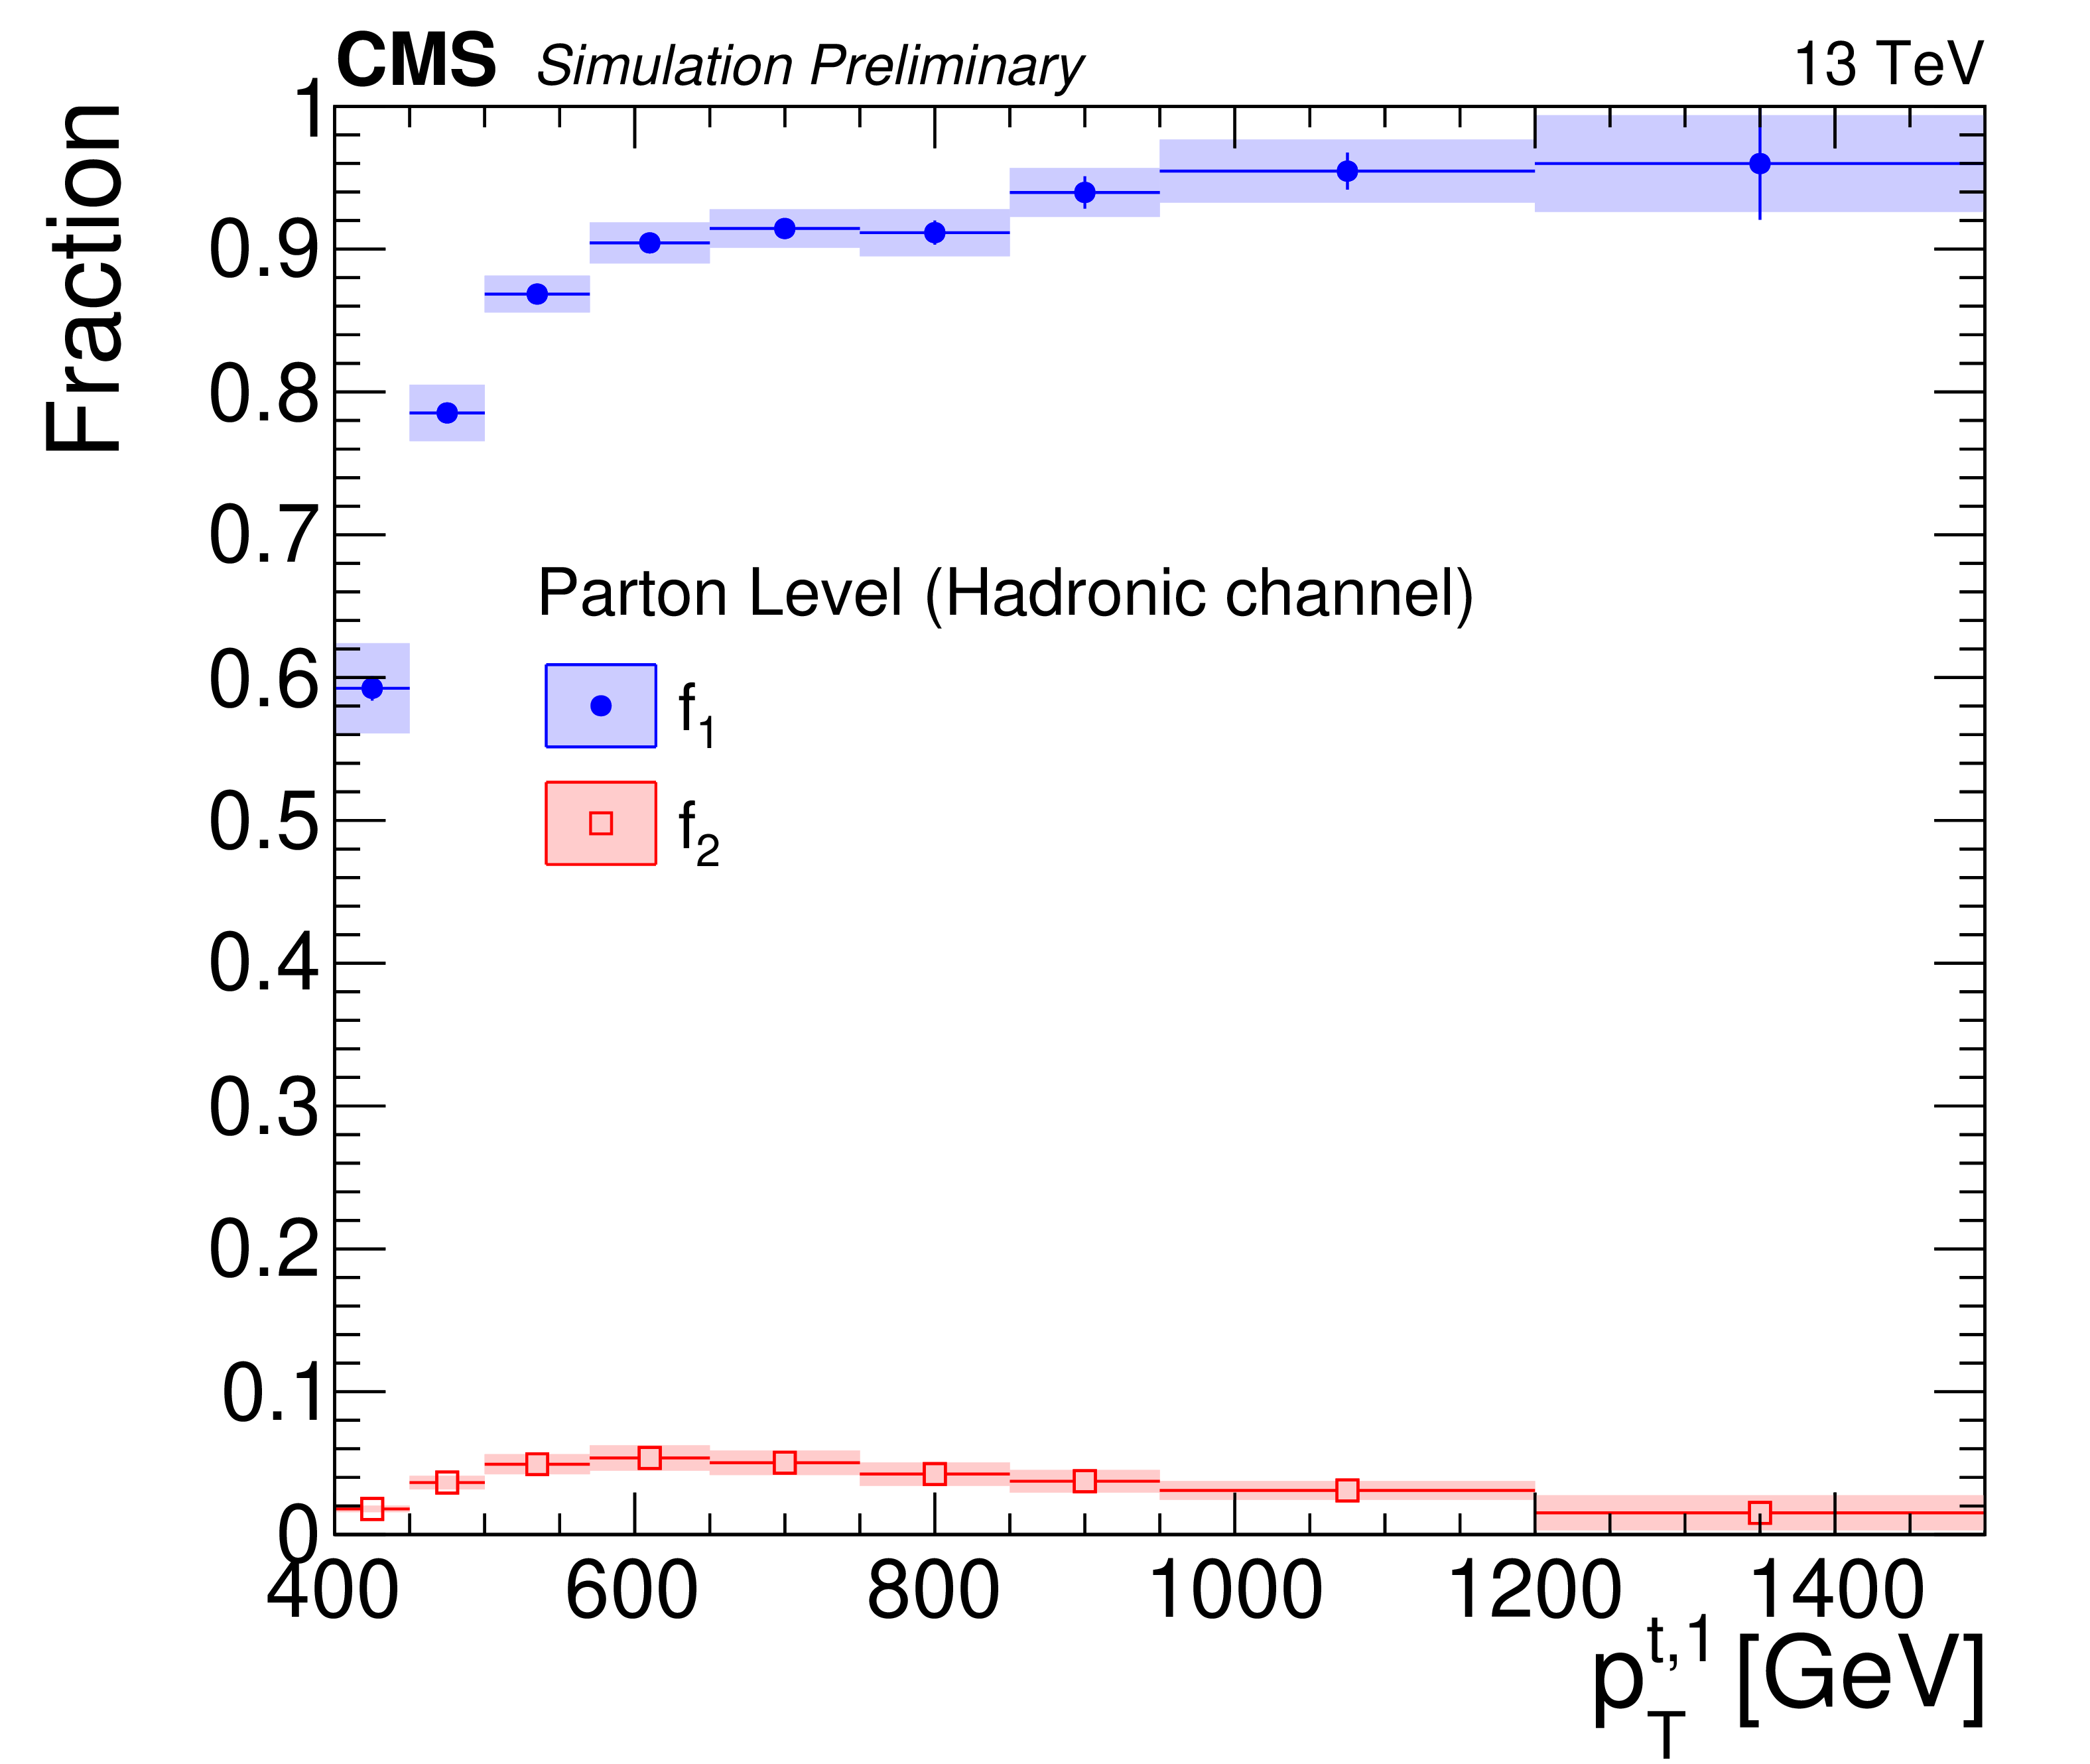
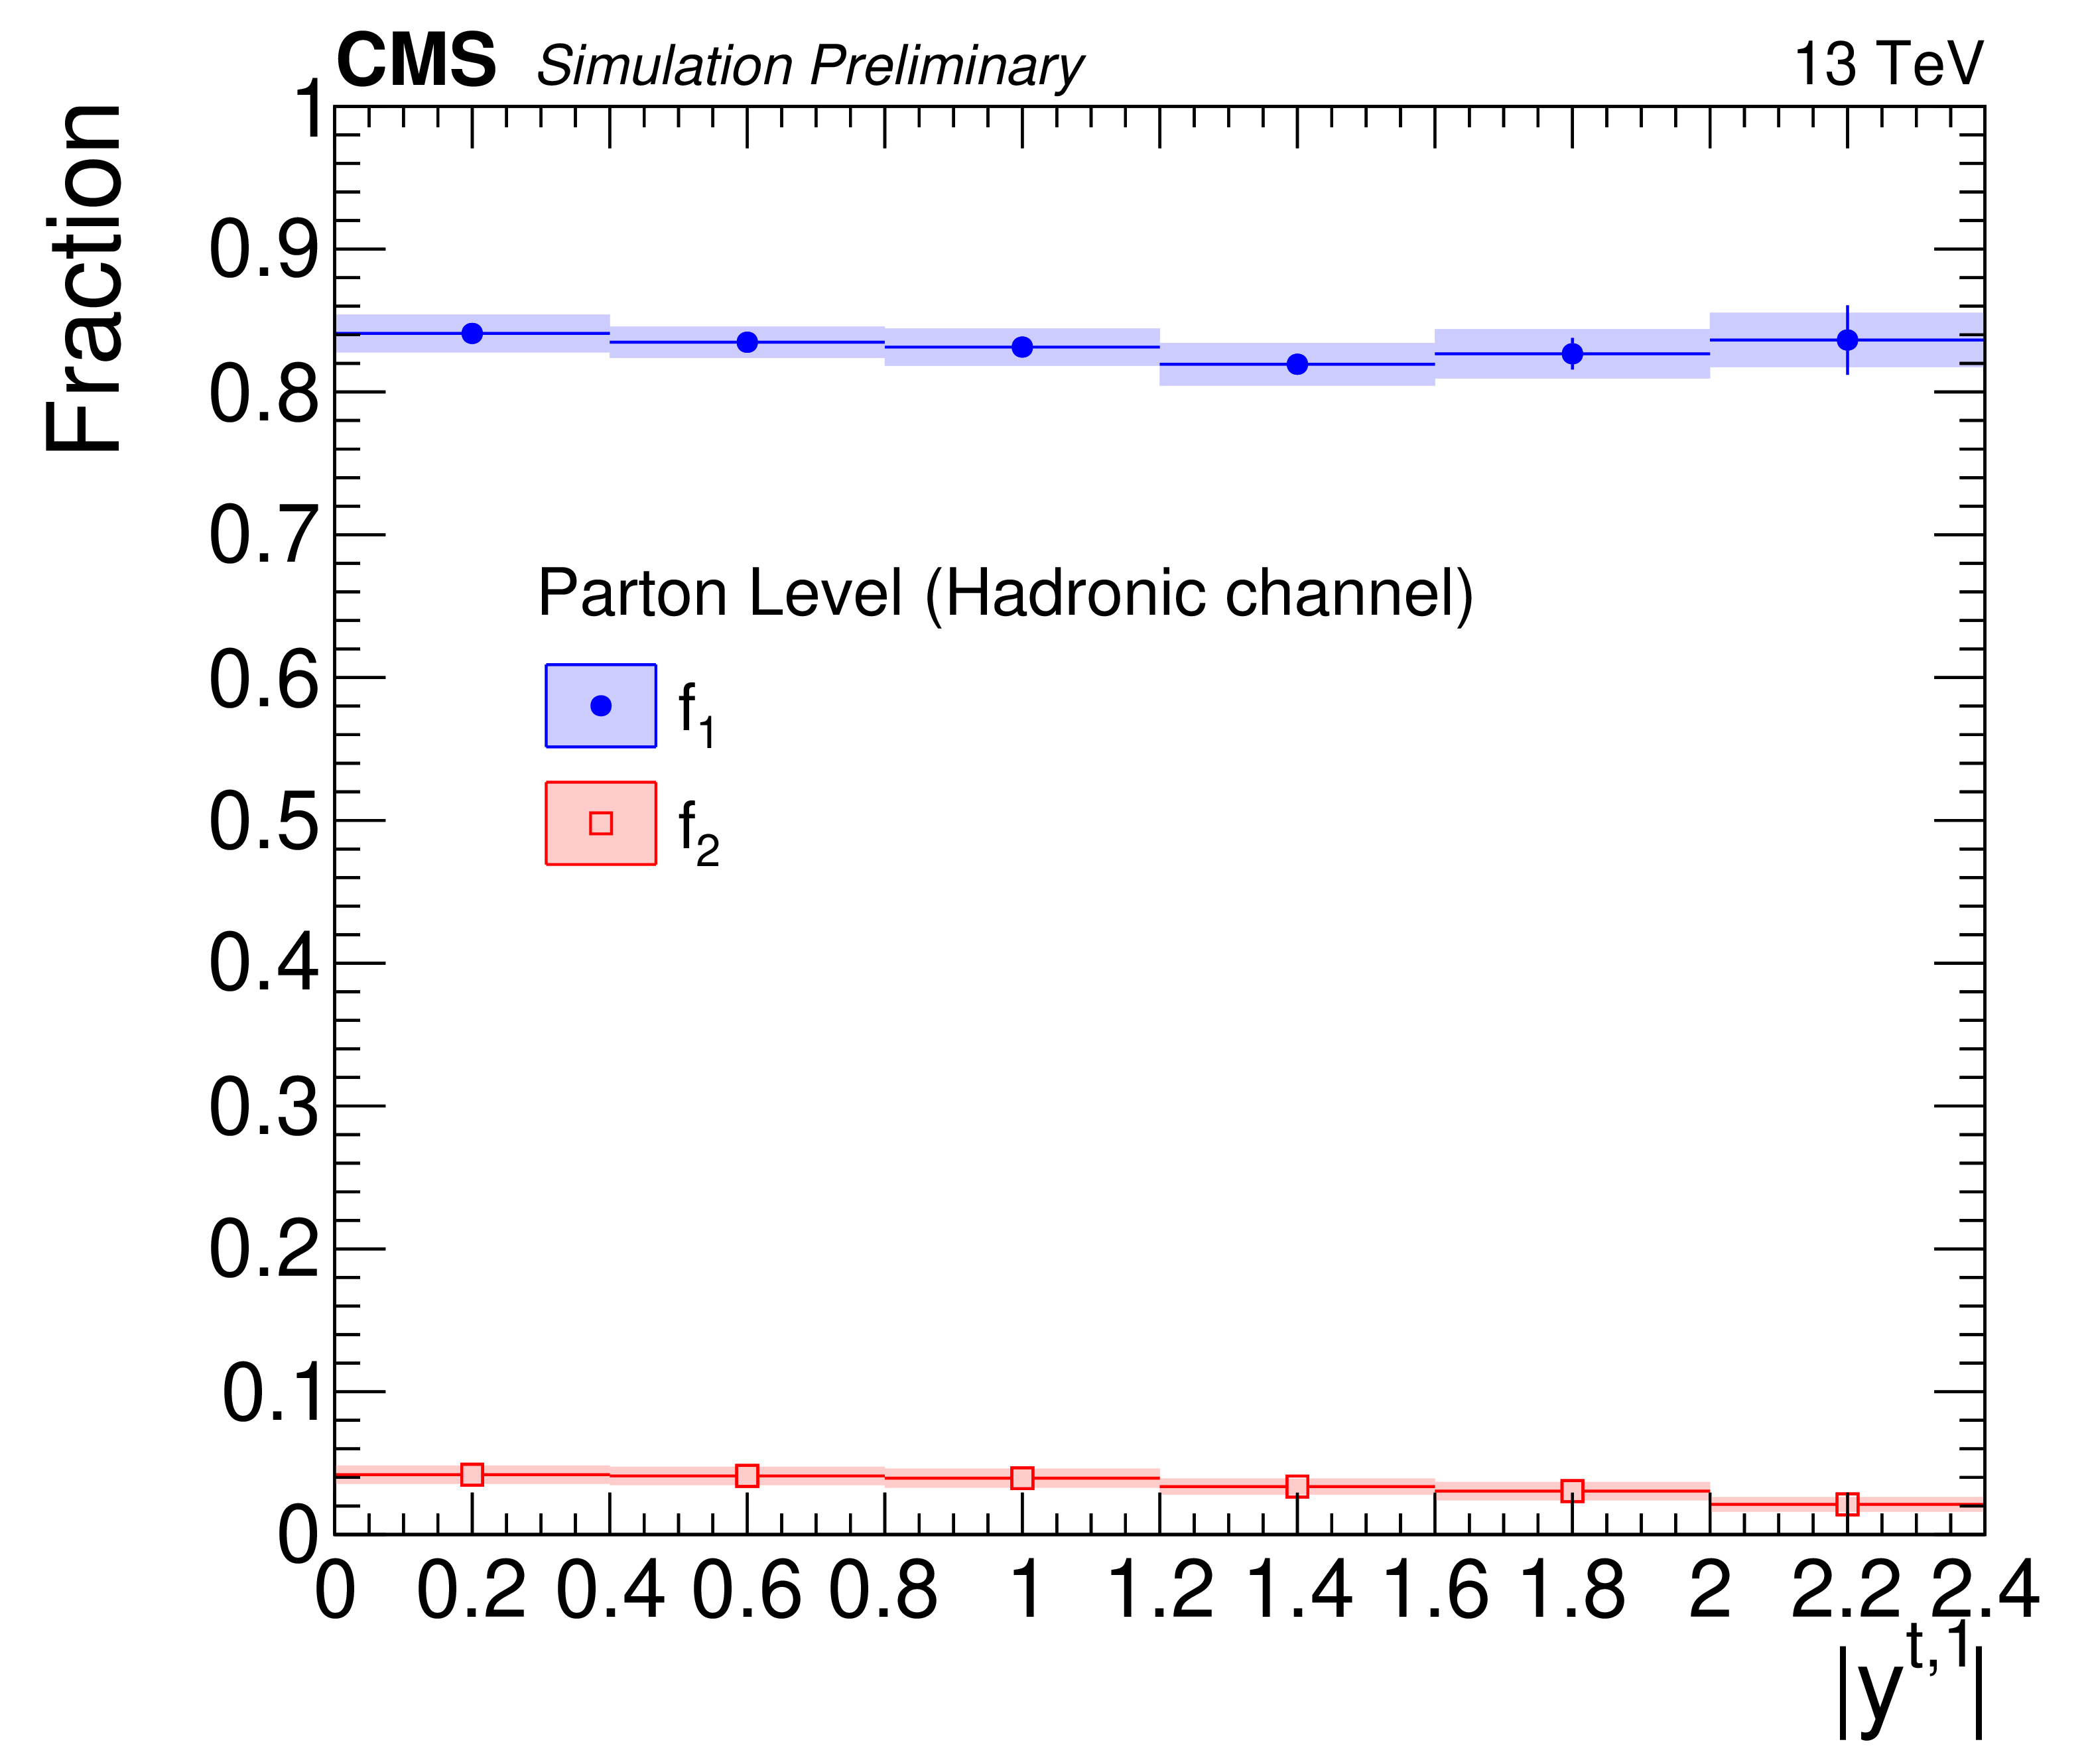
Figure 8:
Simulated fractions $f_{1,2}$ for the parton-level selection in the hadronic channel as a function of the leading top quark ${p_{\mathrm {T}}}$ (left) and $|y|$ (right). |
png pdf |
Figure 8-a:
Simulated fractions $f_{1,2}$ for the parton-level selection in the hadronic channel as a function of the leading top quark ${p_{\mathrm {T}}}$ (left) and $|y|$ (right). |
png pdf |
Figure 8-b:
Simulated fractions $f_{1,2}$ for the parton-level selection in the hadronic channel as a function of the leading top quark ${p_{\mathrm {T}}}$ (left) and $|y|$ (right). |
png pdf |
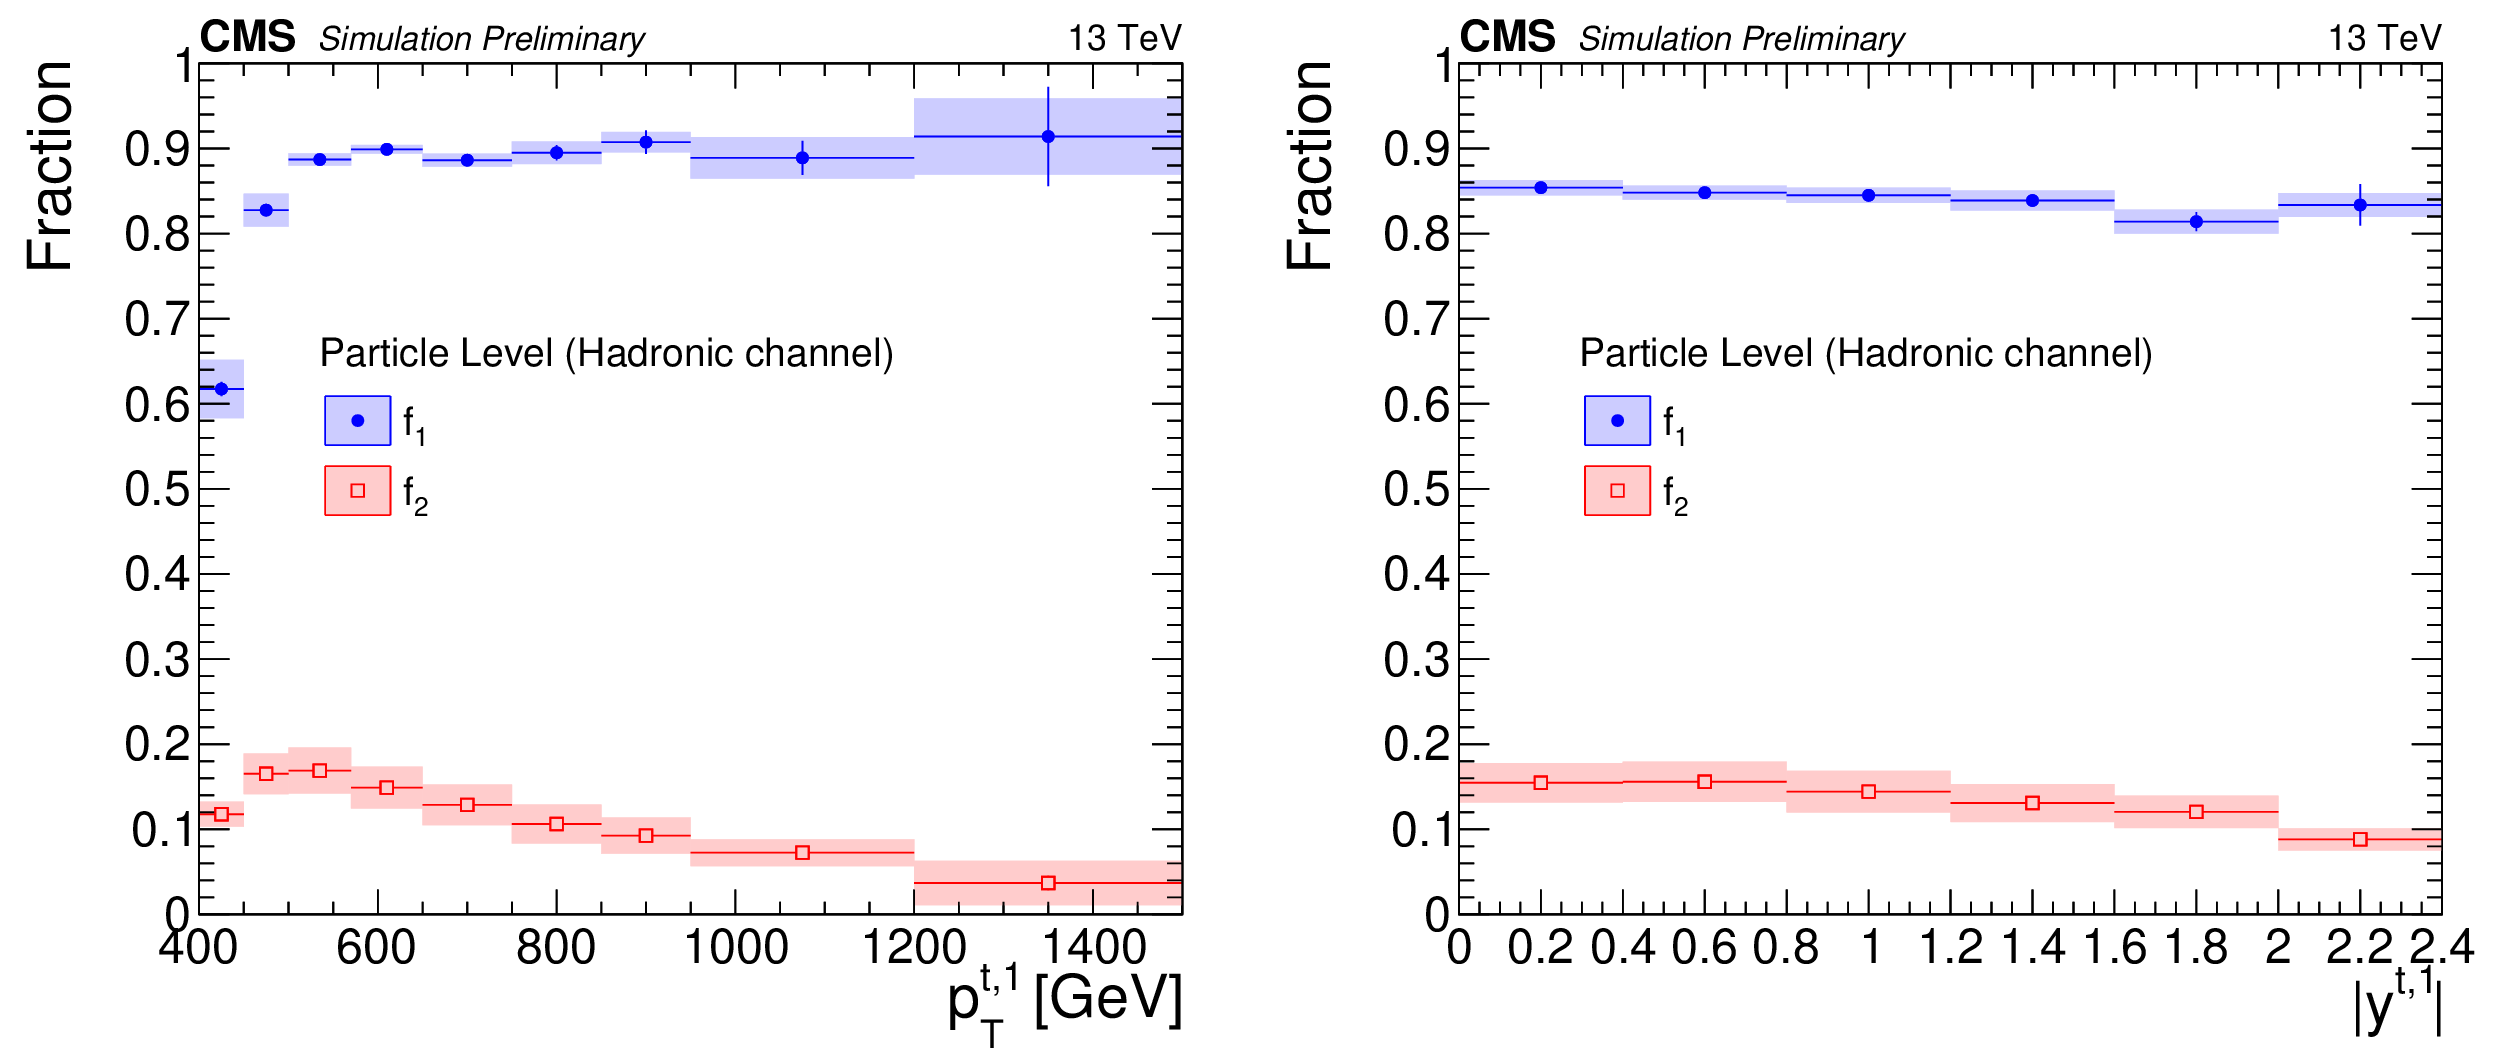
Figure 9:
Simulated fractions $f_{1,2}$ for the particle-level selection in the hadronic channel as a function of the leading top quark ${p_{\mathrm {T}}}$ (left) and $|y|$ (right). |
png pdf |
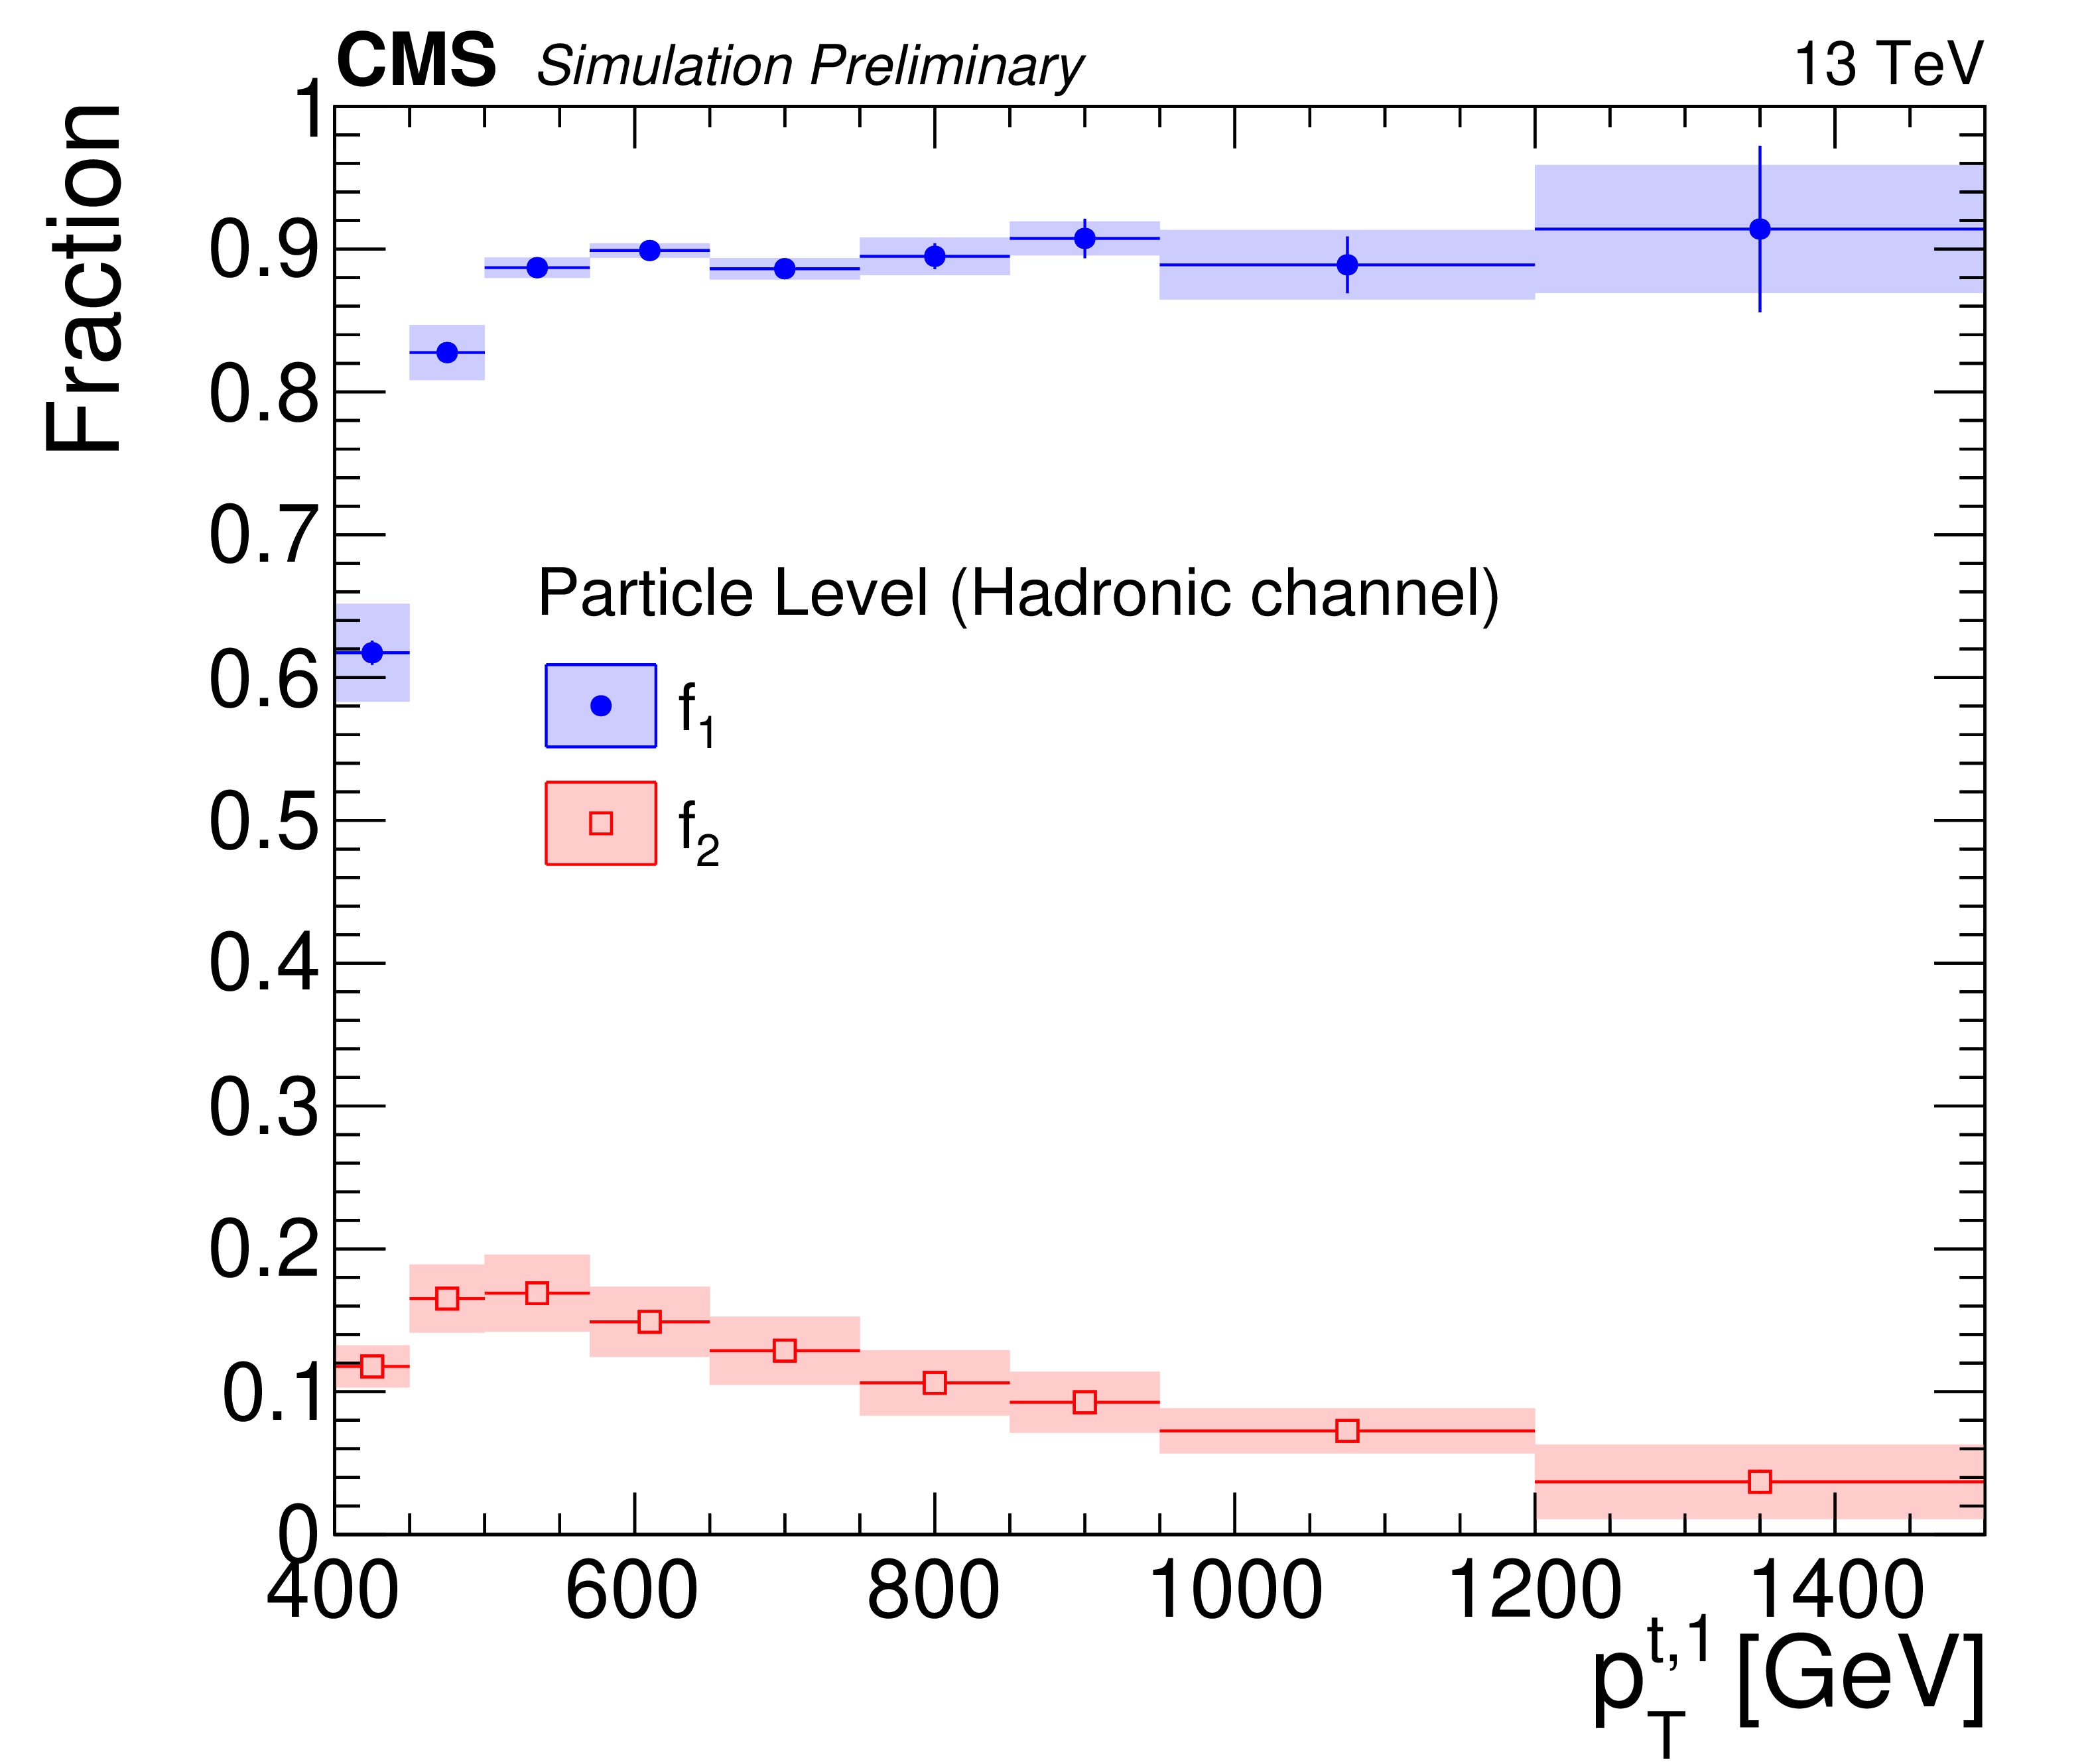
Figure 9-a:
Simulated fractions $f_{1,2}$ for the particle-level selection in the hadronic channel as a function of the leading top quark ${p_{\mathrm {T}}}$ (left) and $|y|$ (right). |
png pdf |
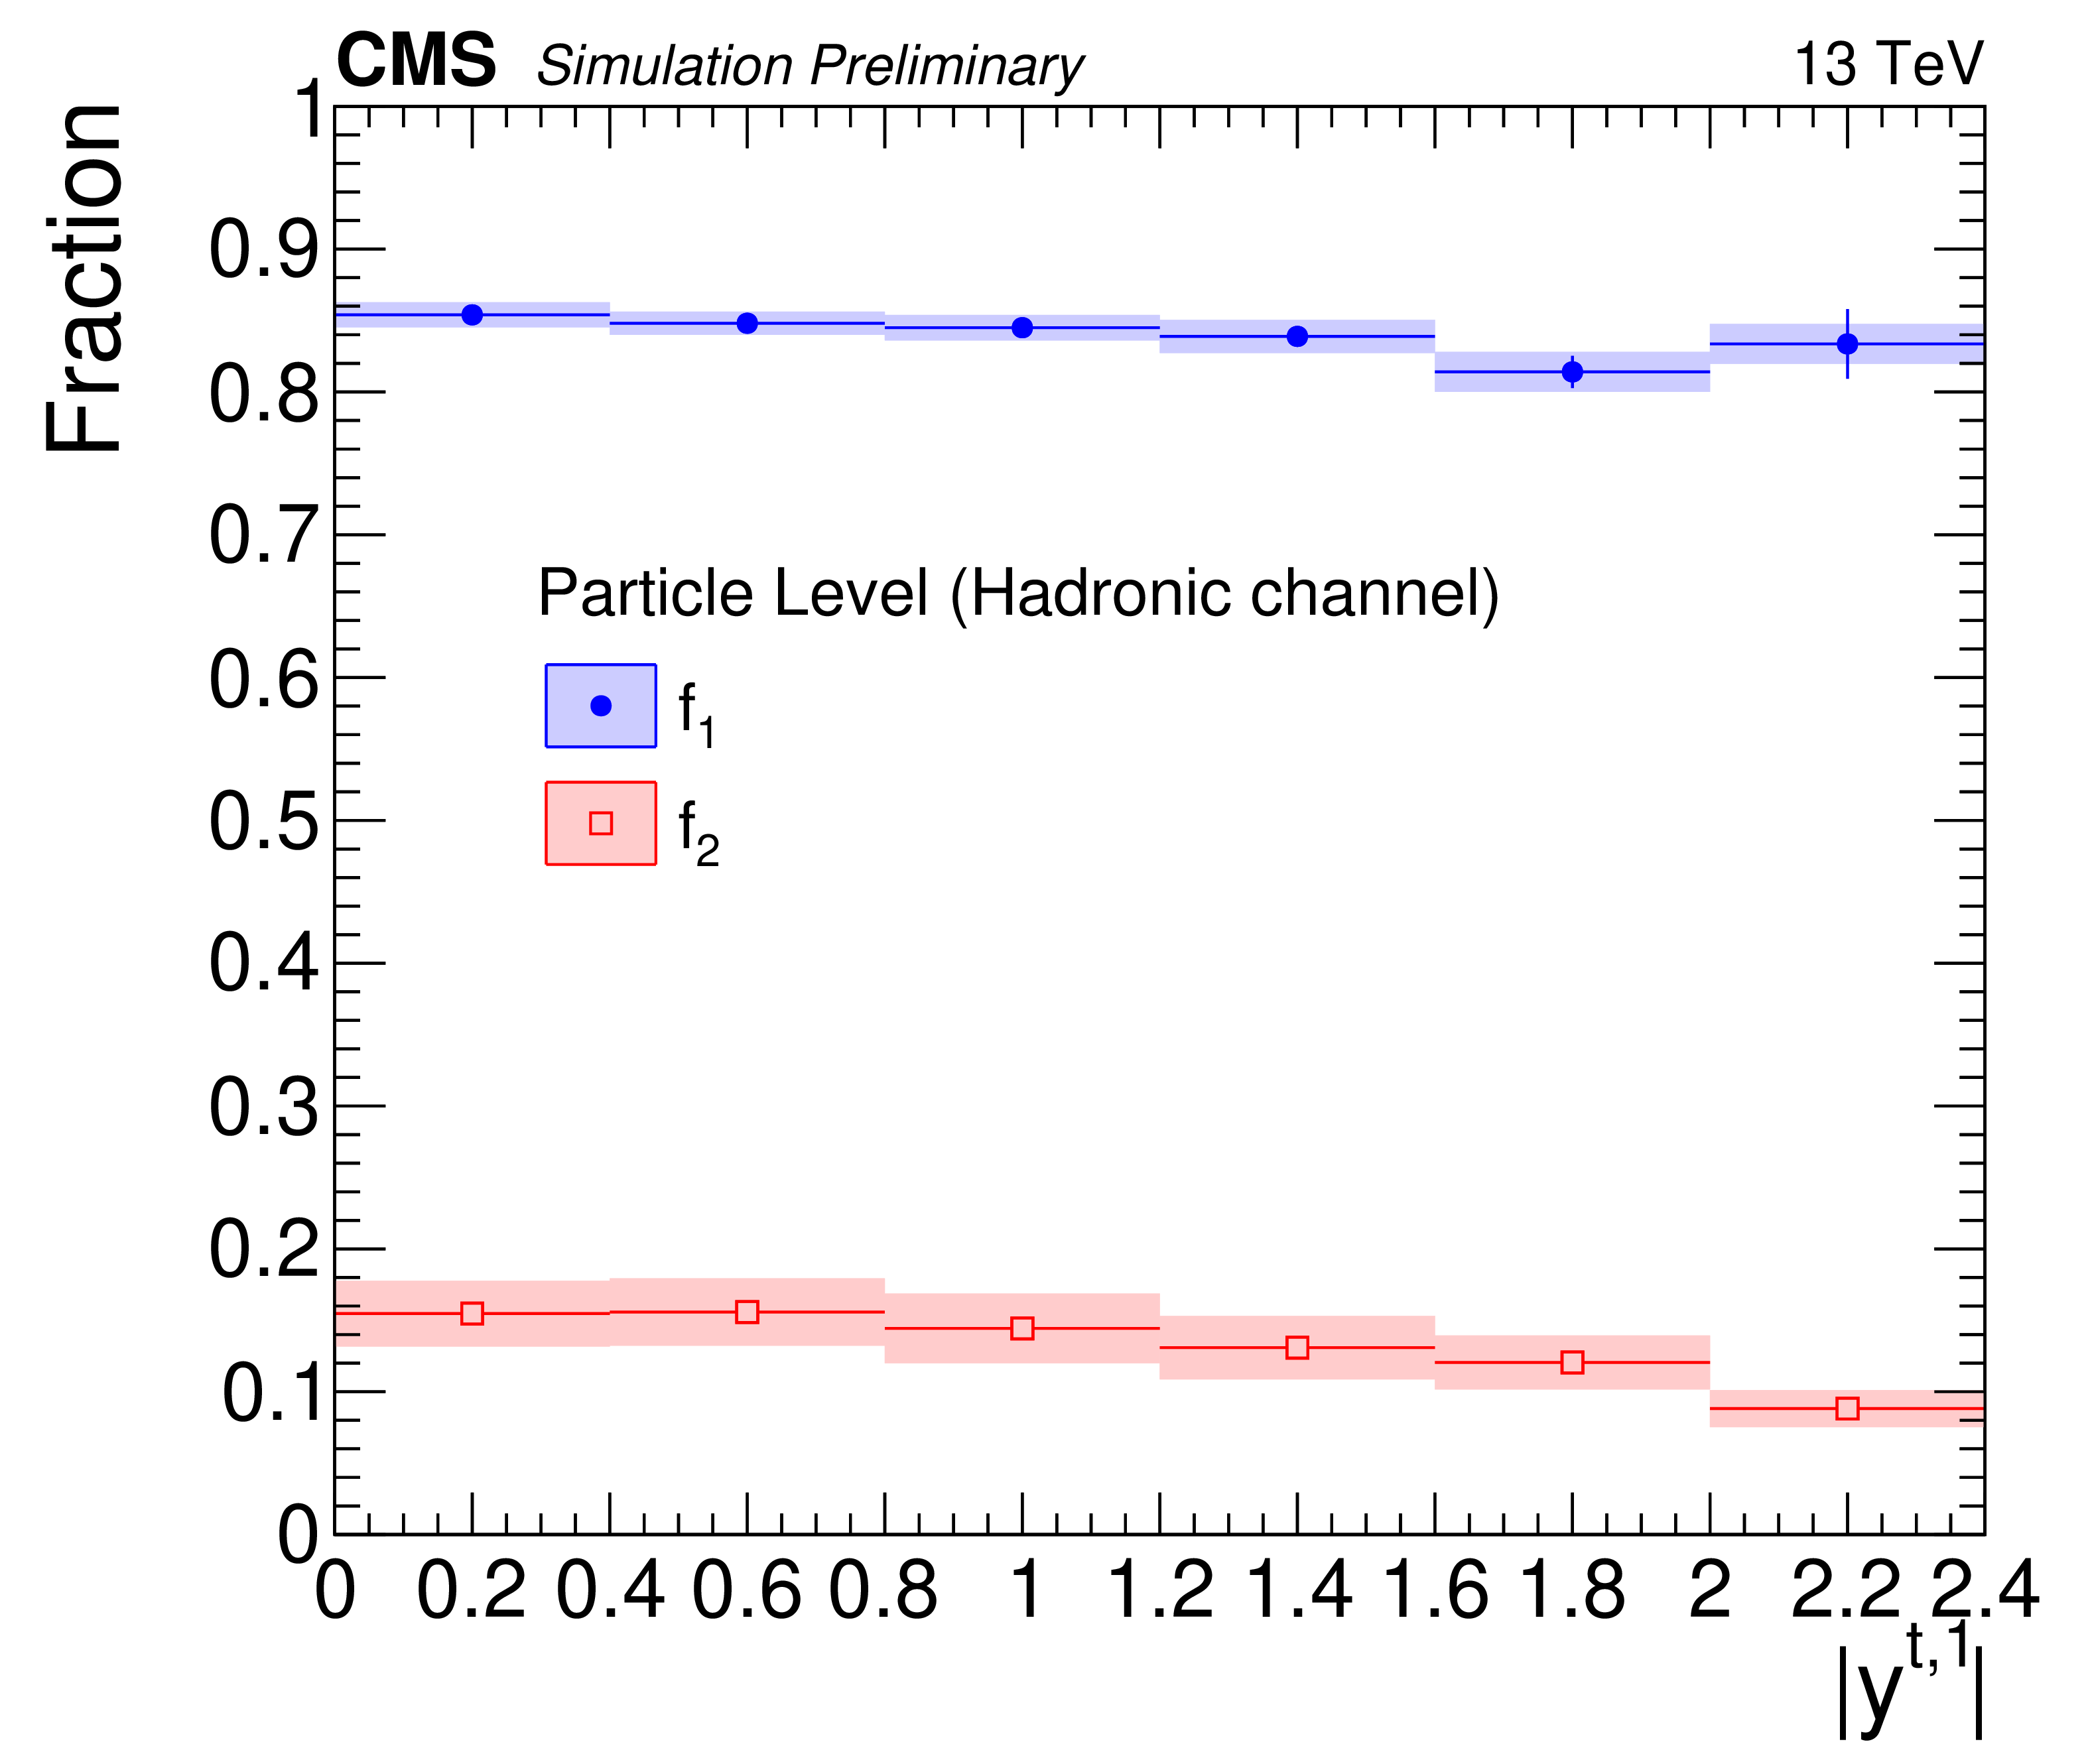
Figure 9-b:
Simulated fractions $f_{1,2}$ for the particle-level selection in the hadronic channel as a function of the leading top quark ${p_{\mathrm {T}}}$ (left) and $|y|$ (right). |
png pdf |
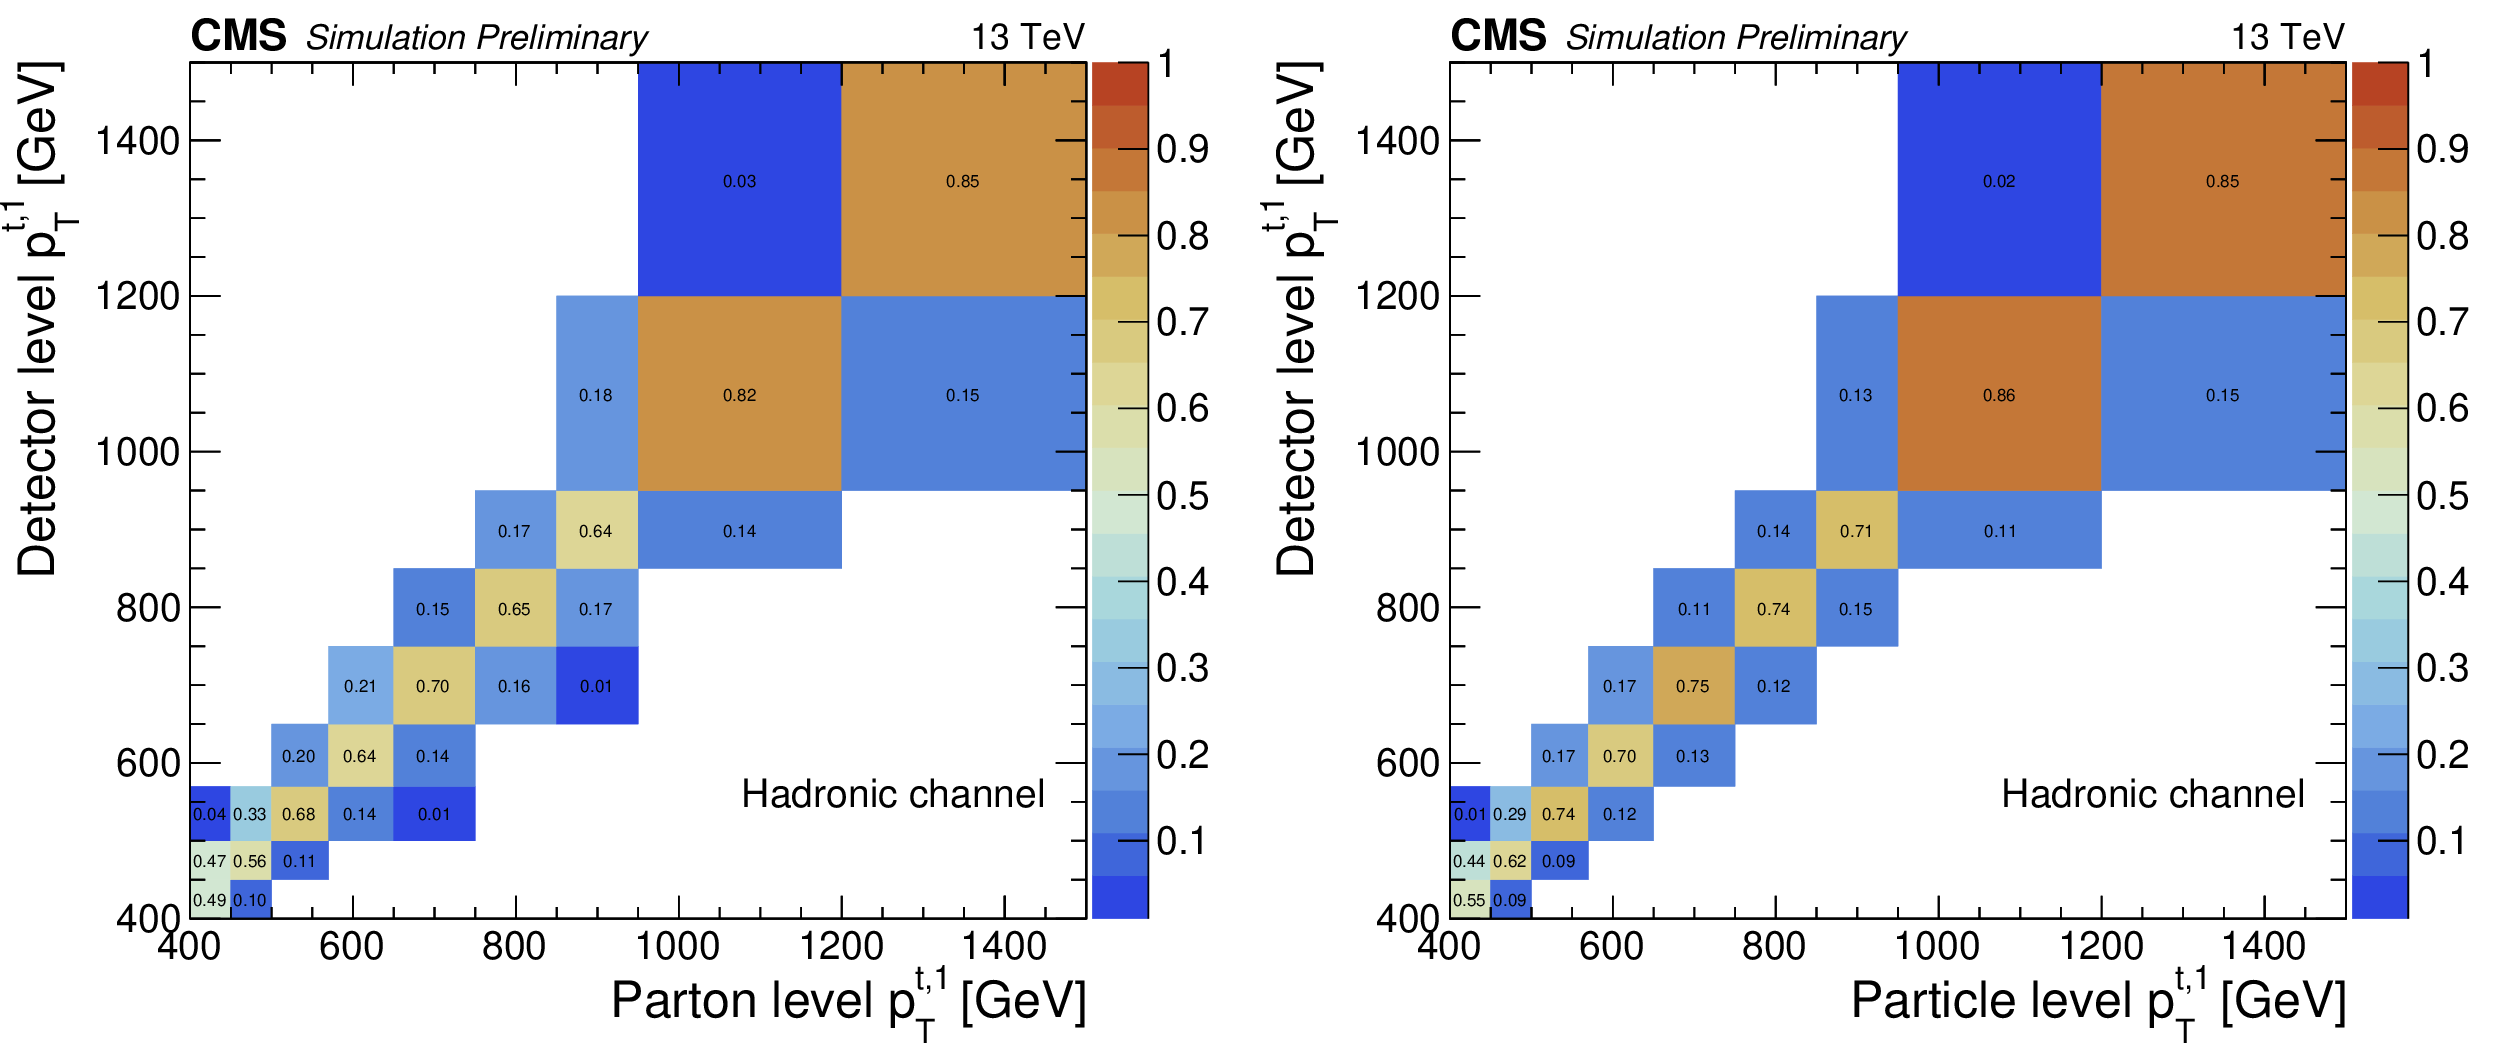
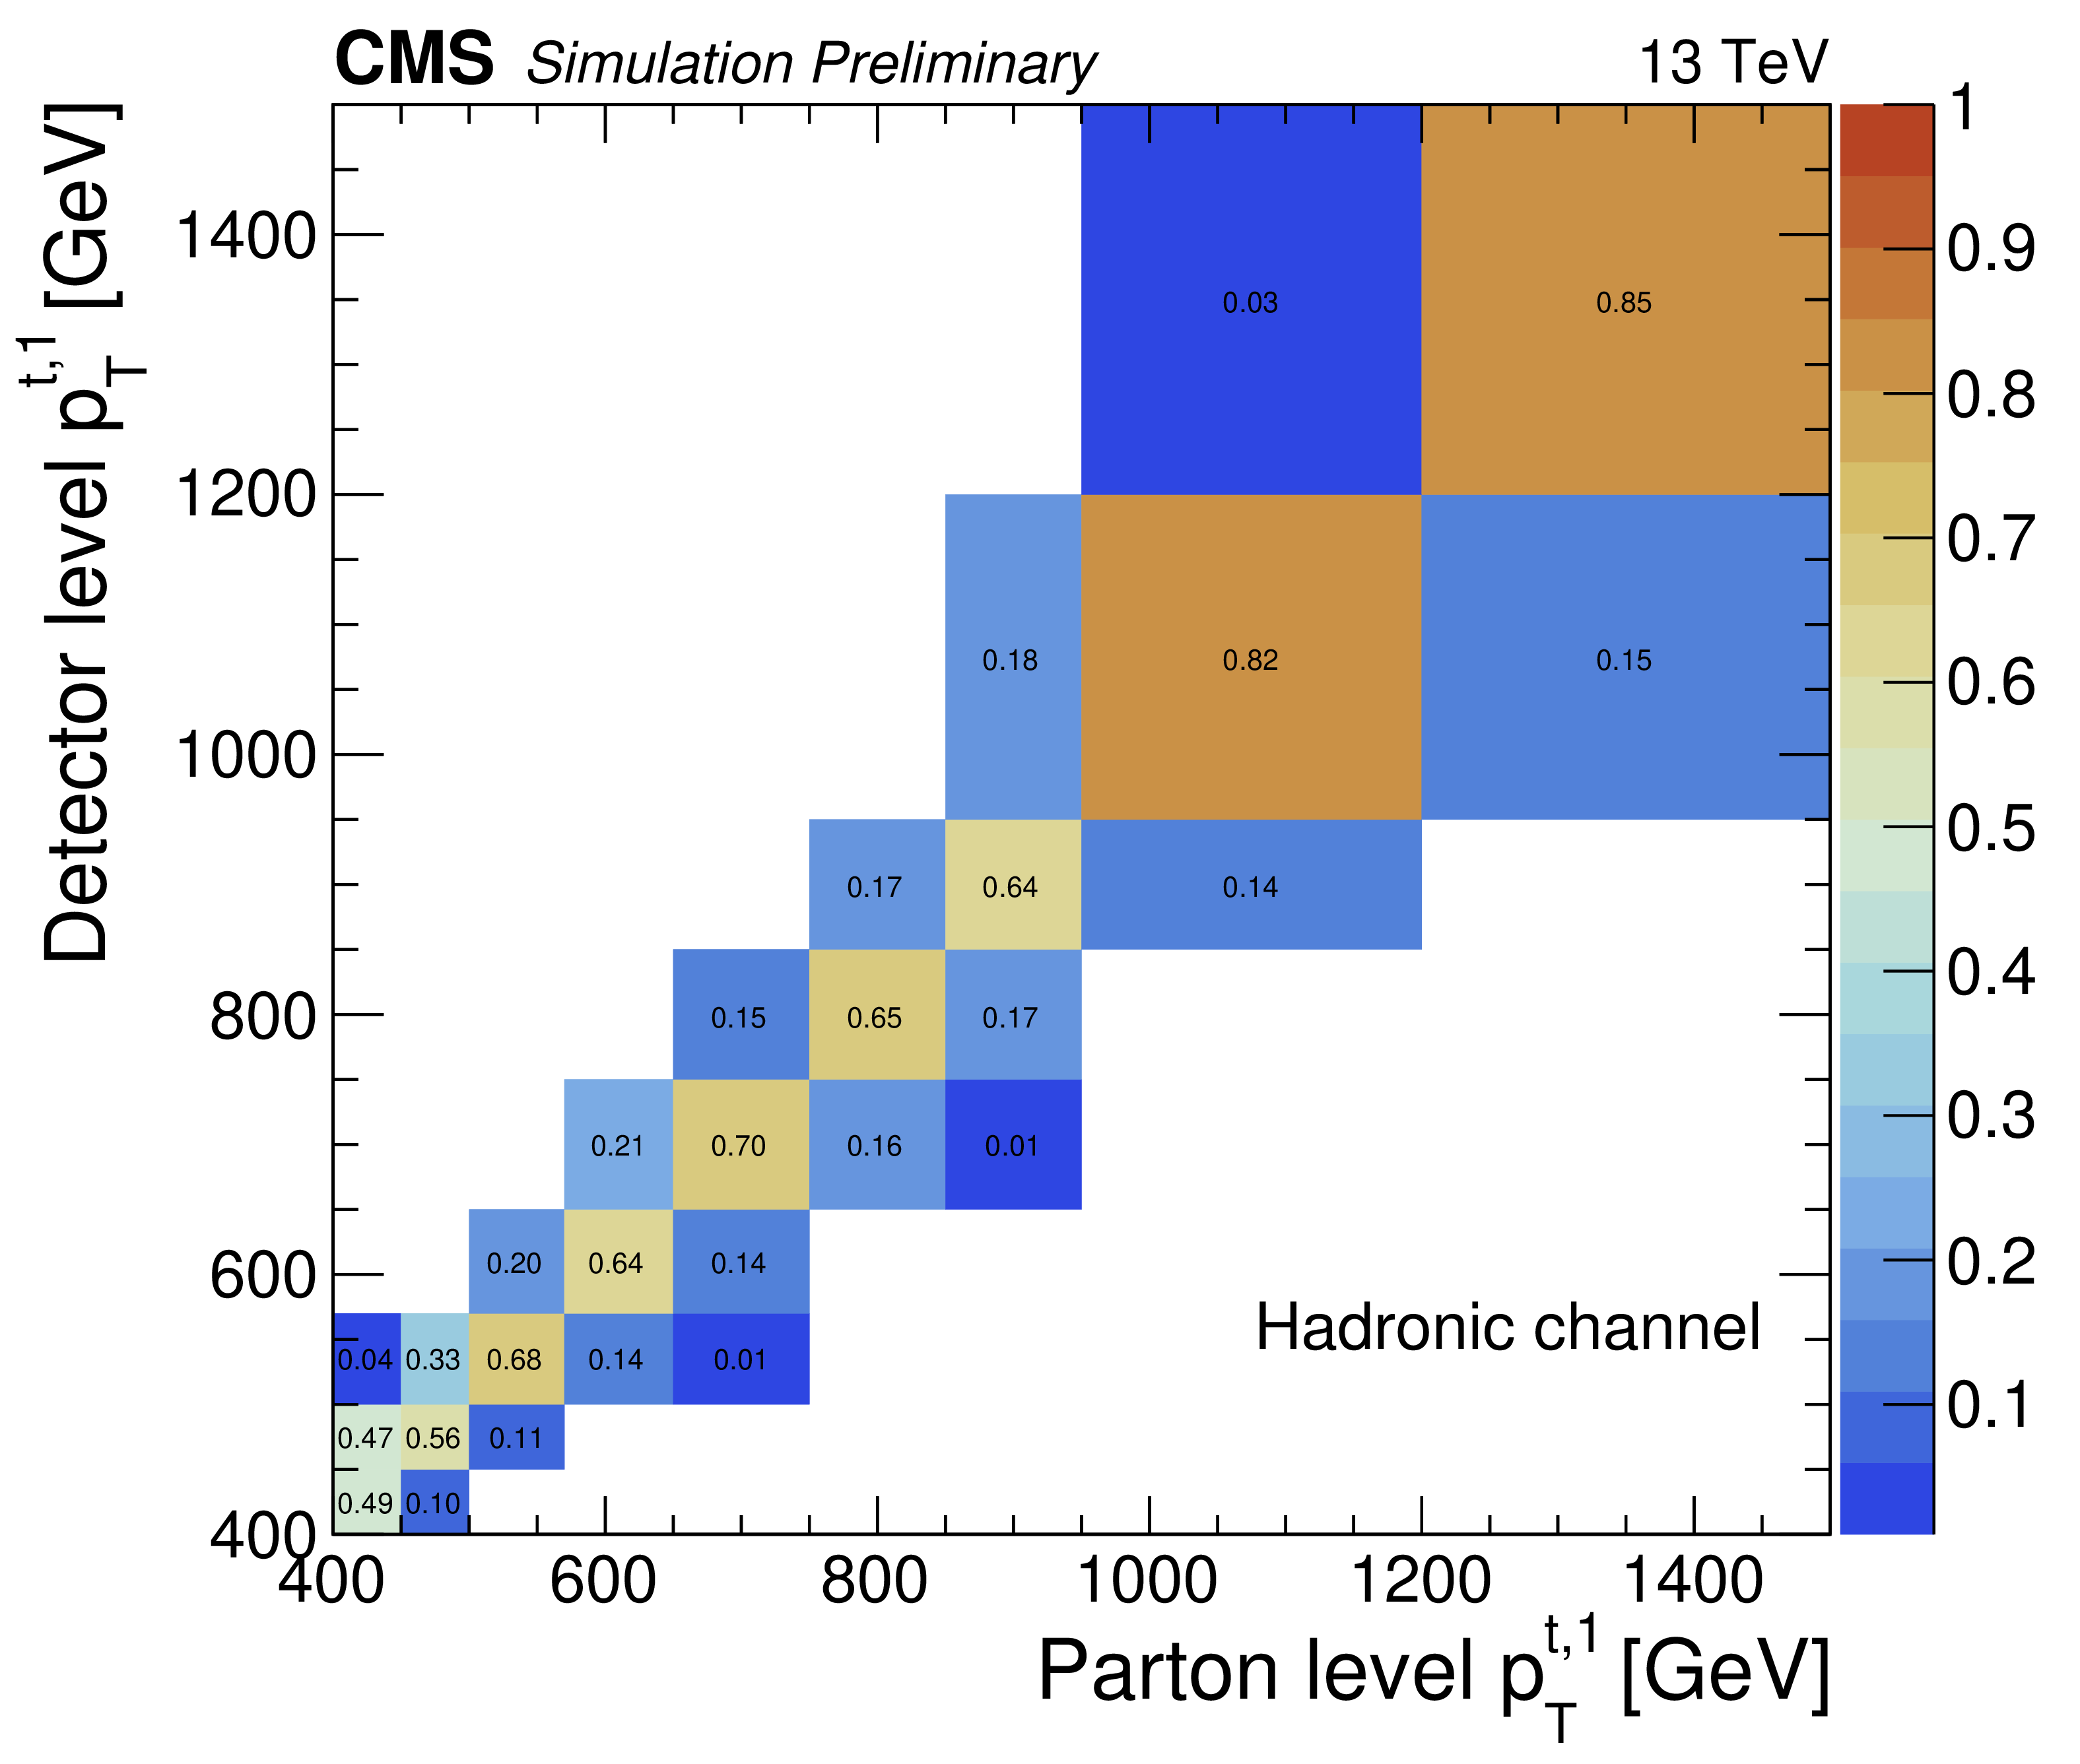
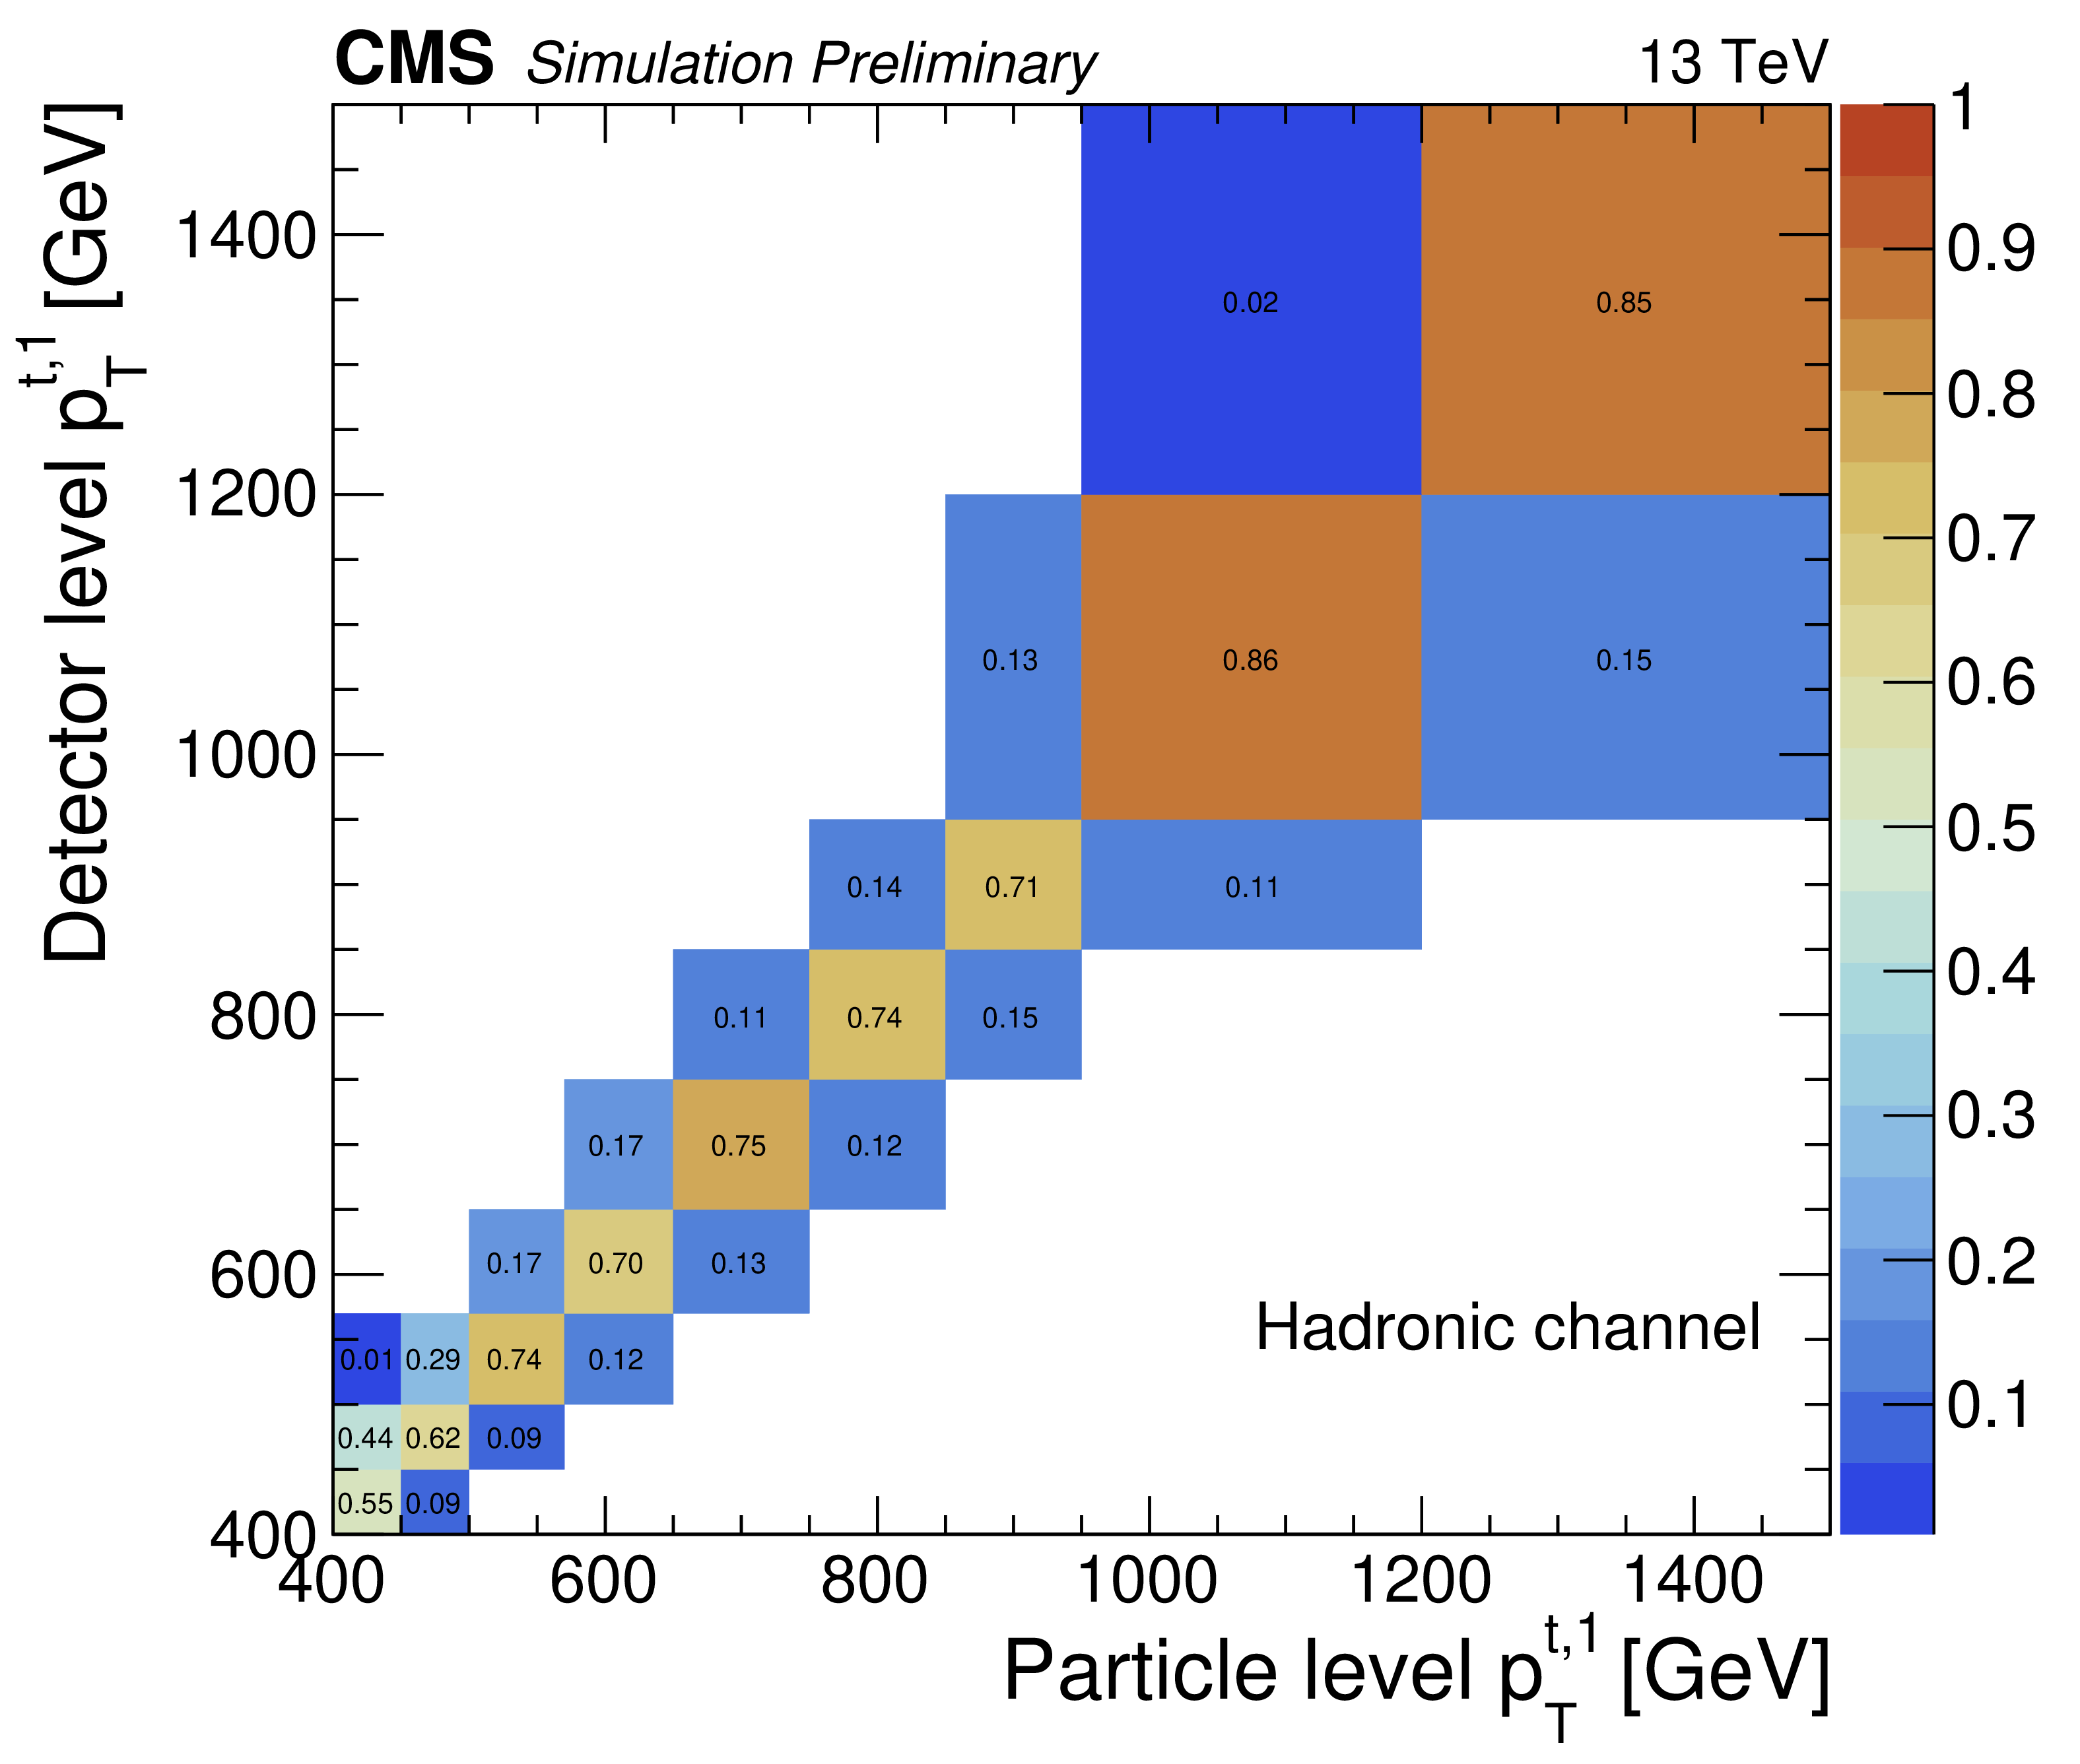
Figure 10:
Simulated migration matrices for the leading top quark ${p_{\mathrm {T}}}$ at the parton level (left) and particle level (right) in the hadronic channel. Each column is normalized to unity. |
png pdf |
Figure 10-a:
Simulated migration matrices for the leading top quark ${p_{\mathrm {T}}}$ at the parton level (left) and particle level (right) in the hadronic channel. Each column is normalized to unity. |
png pdf |
Figure 10-b:
Simulated migration matrices for the leading top quark ${p_{\mathrm {T}}}$ at the parton level (left) and particle level (right) in the hadronic channel. Each column is normalized to unity. |
png pdf |
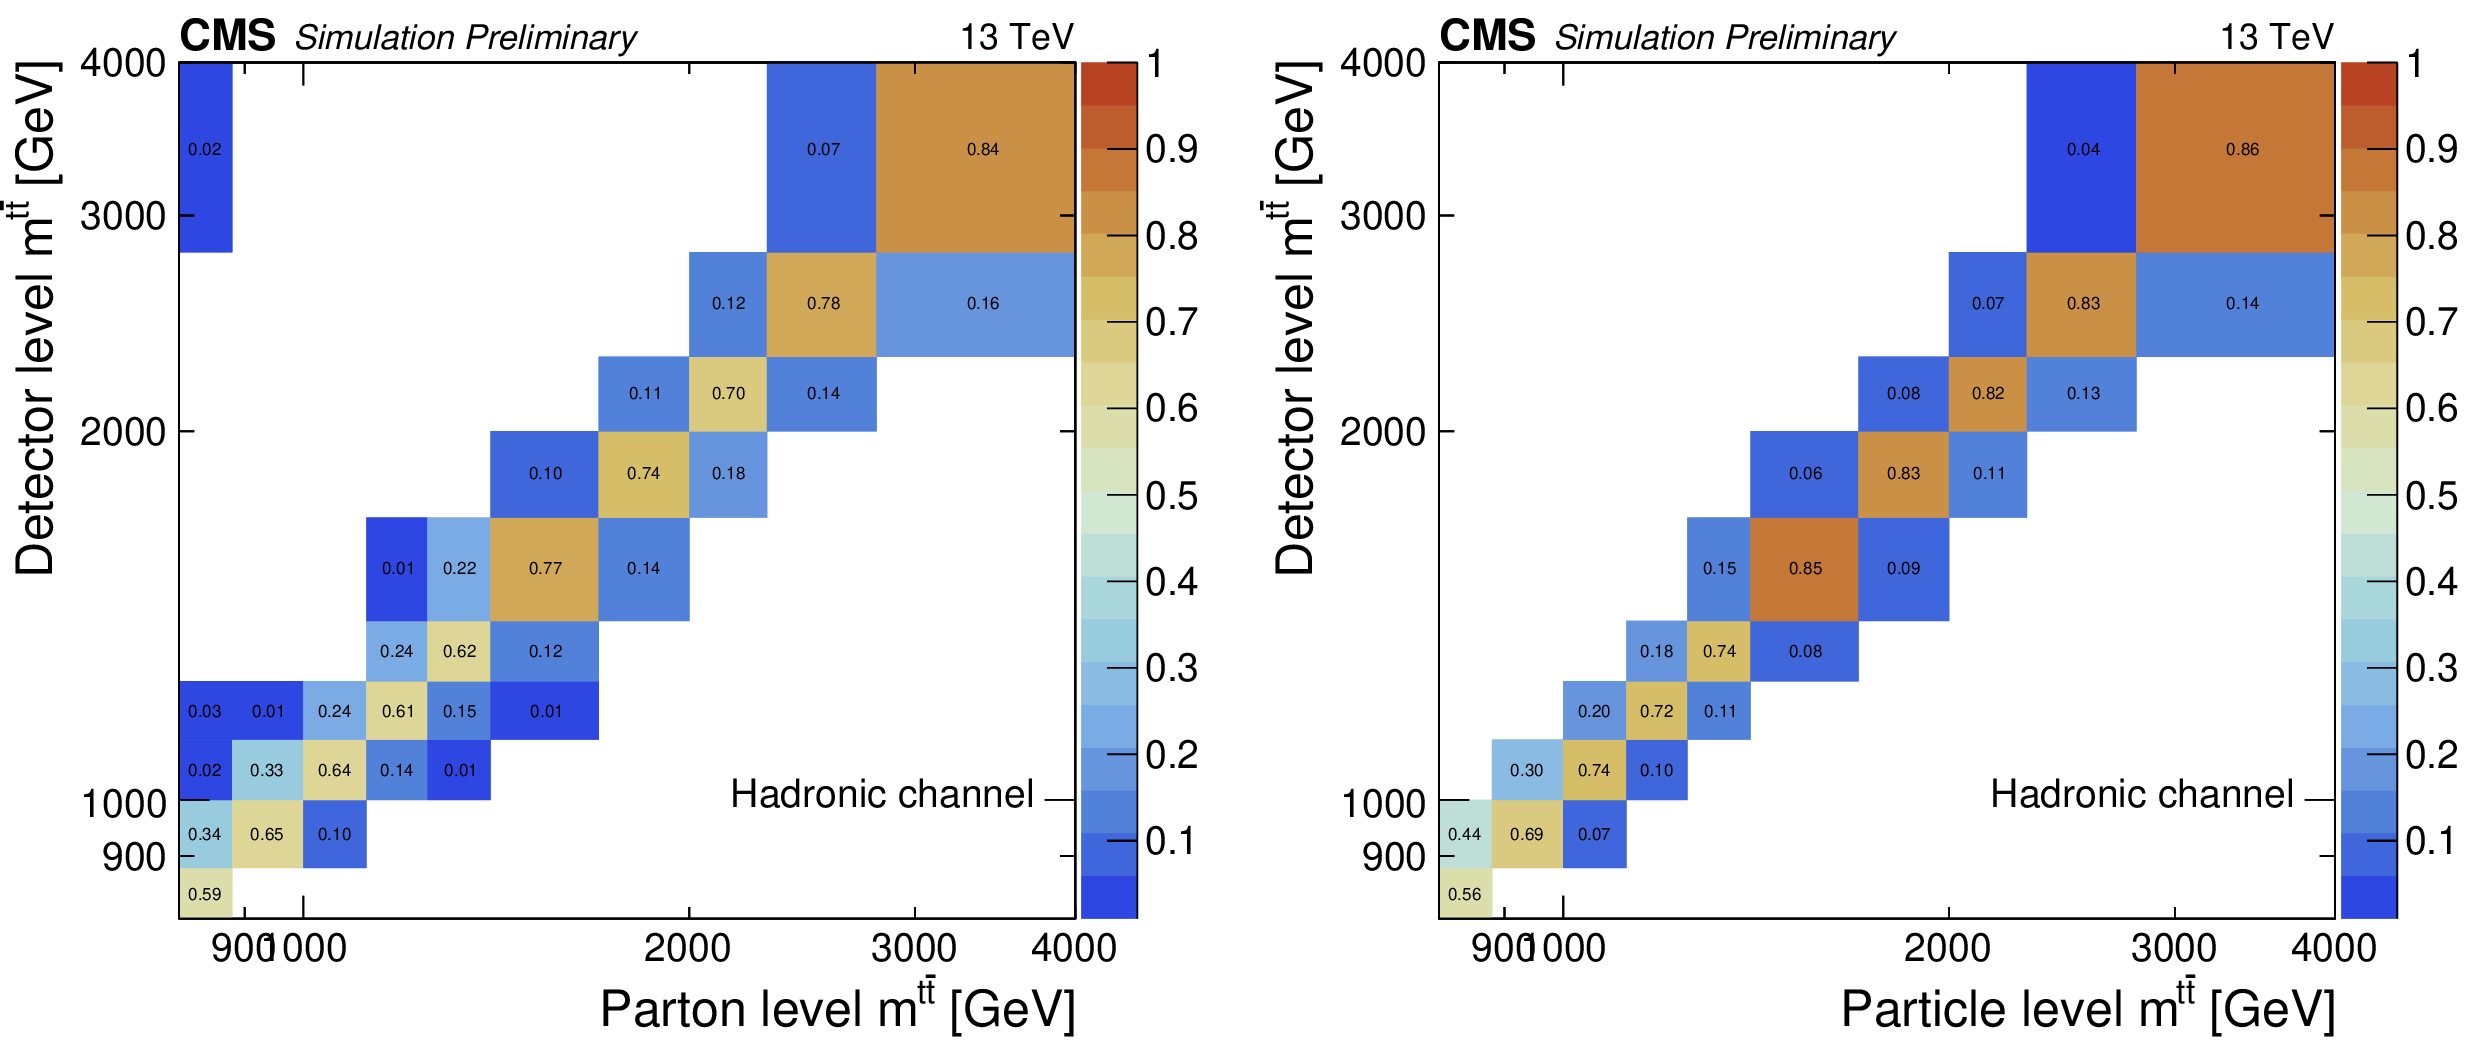
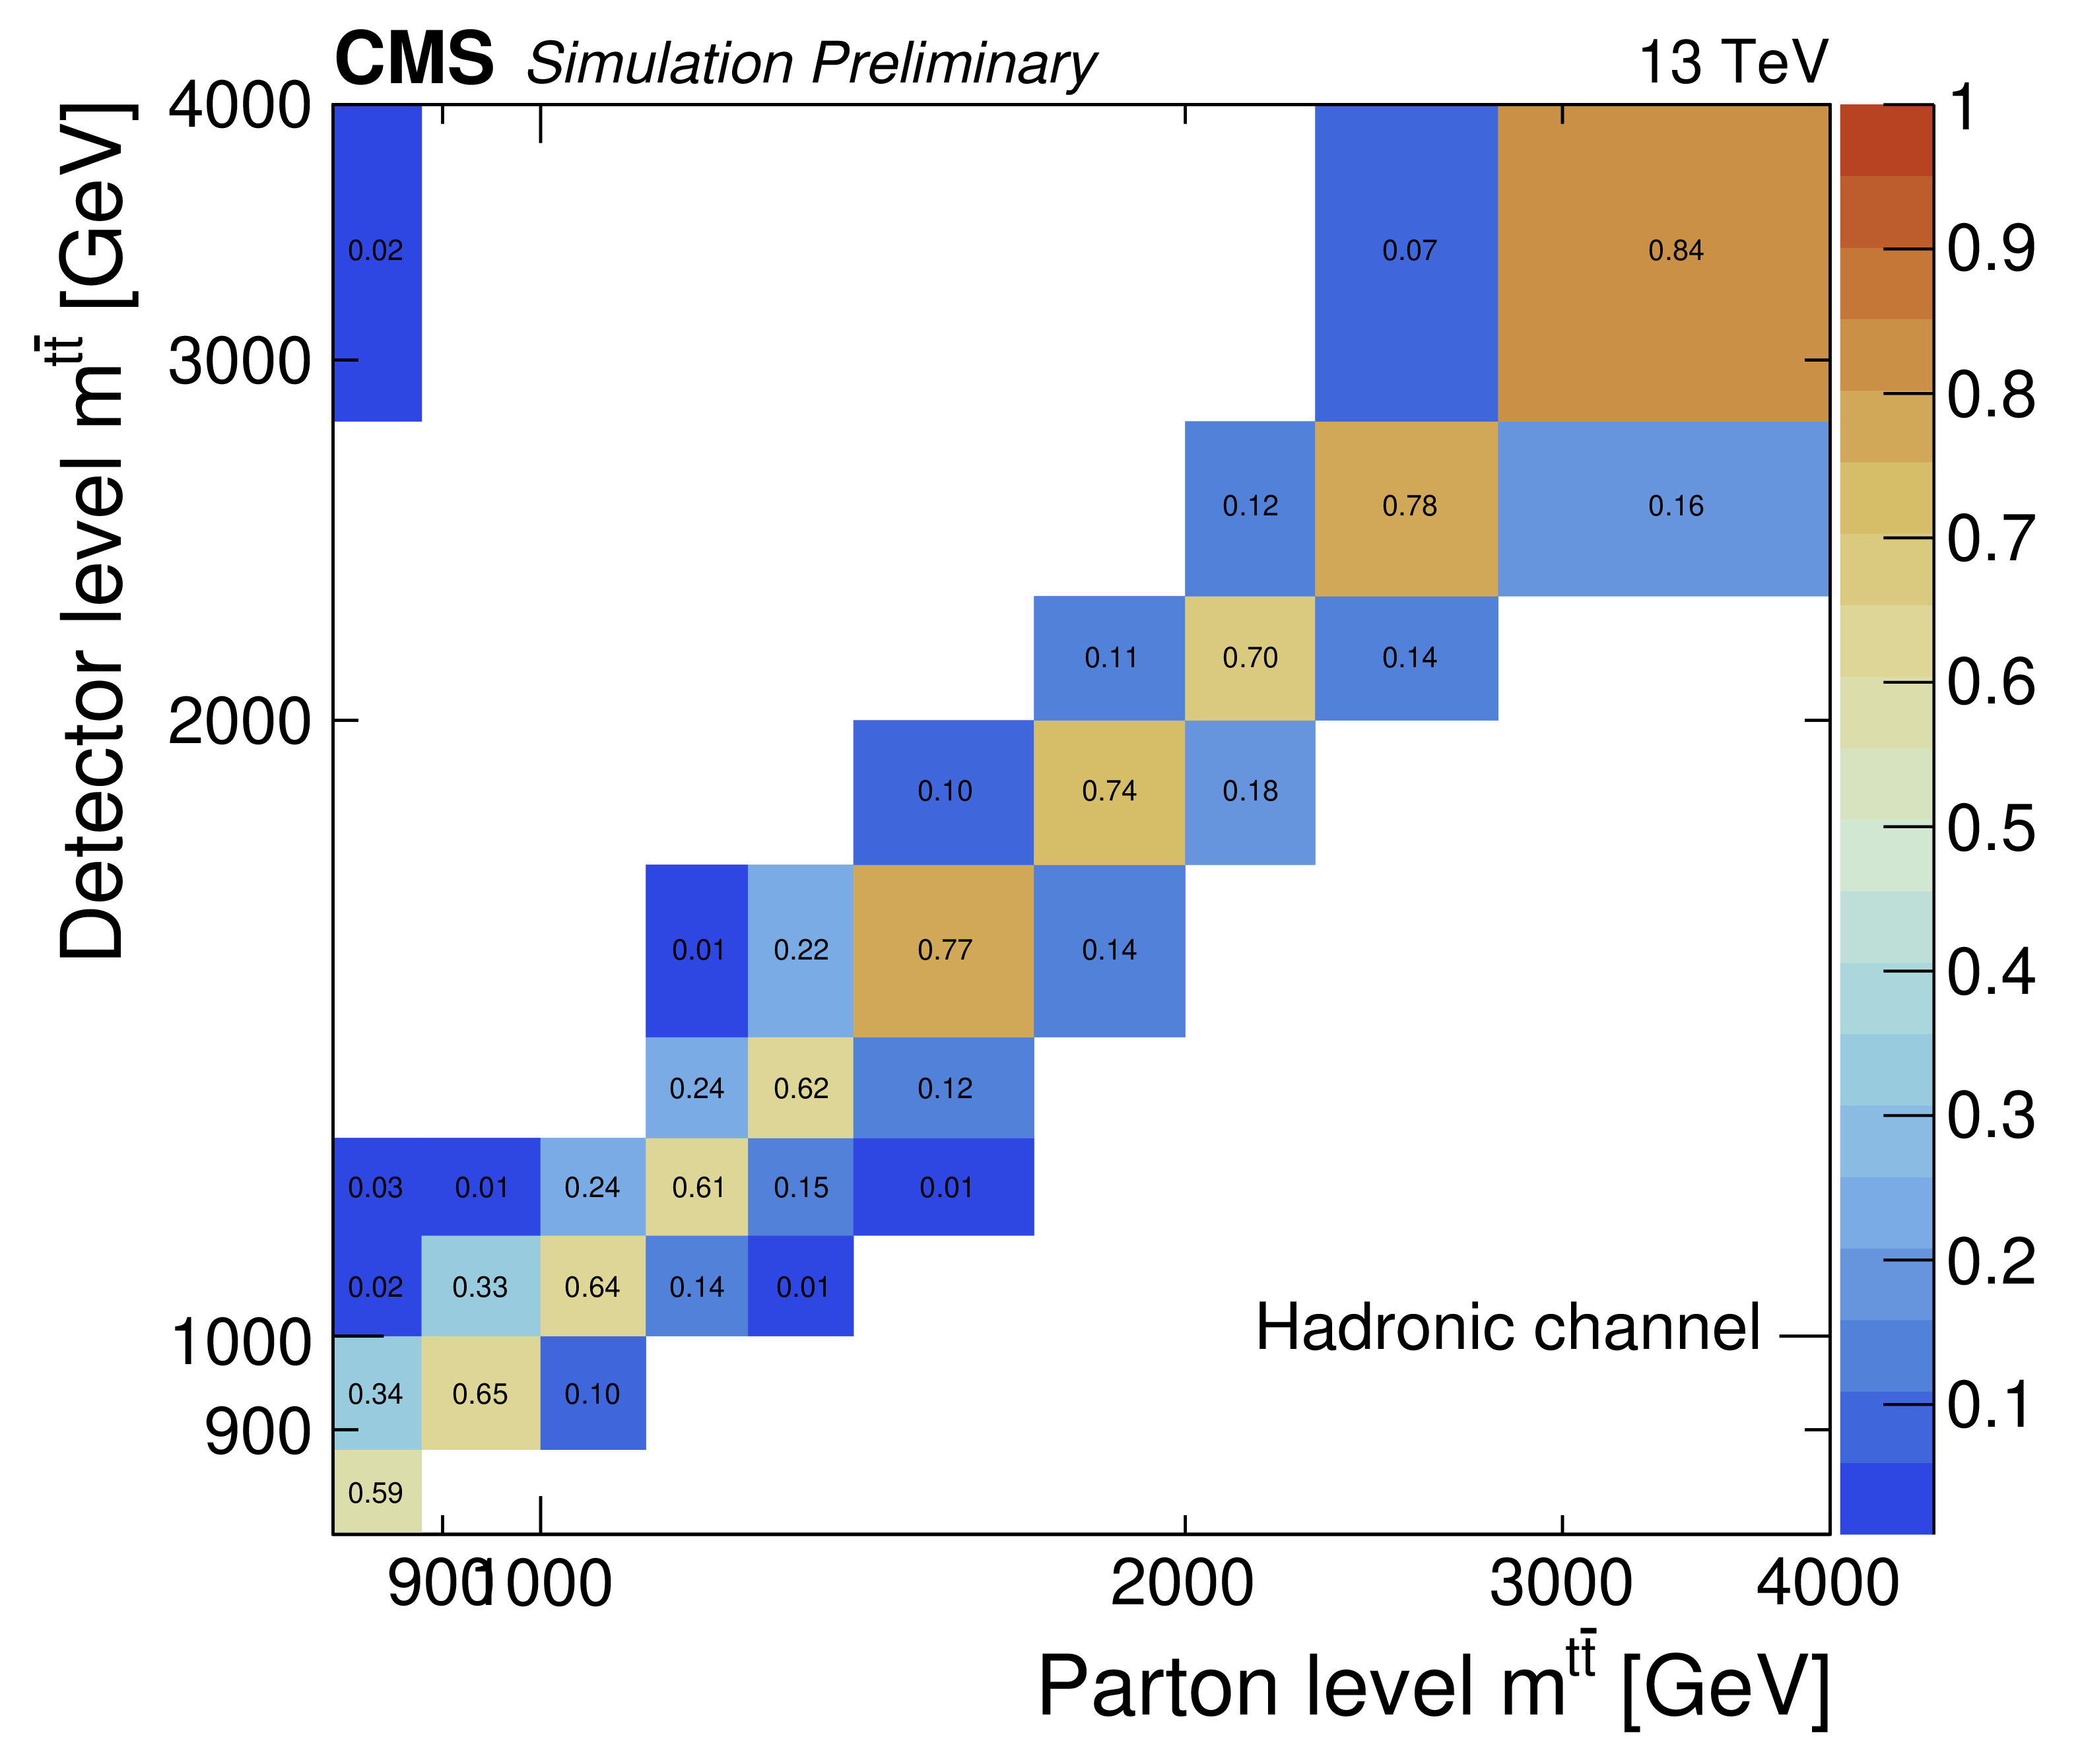
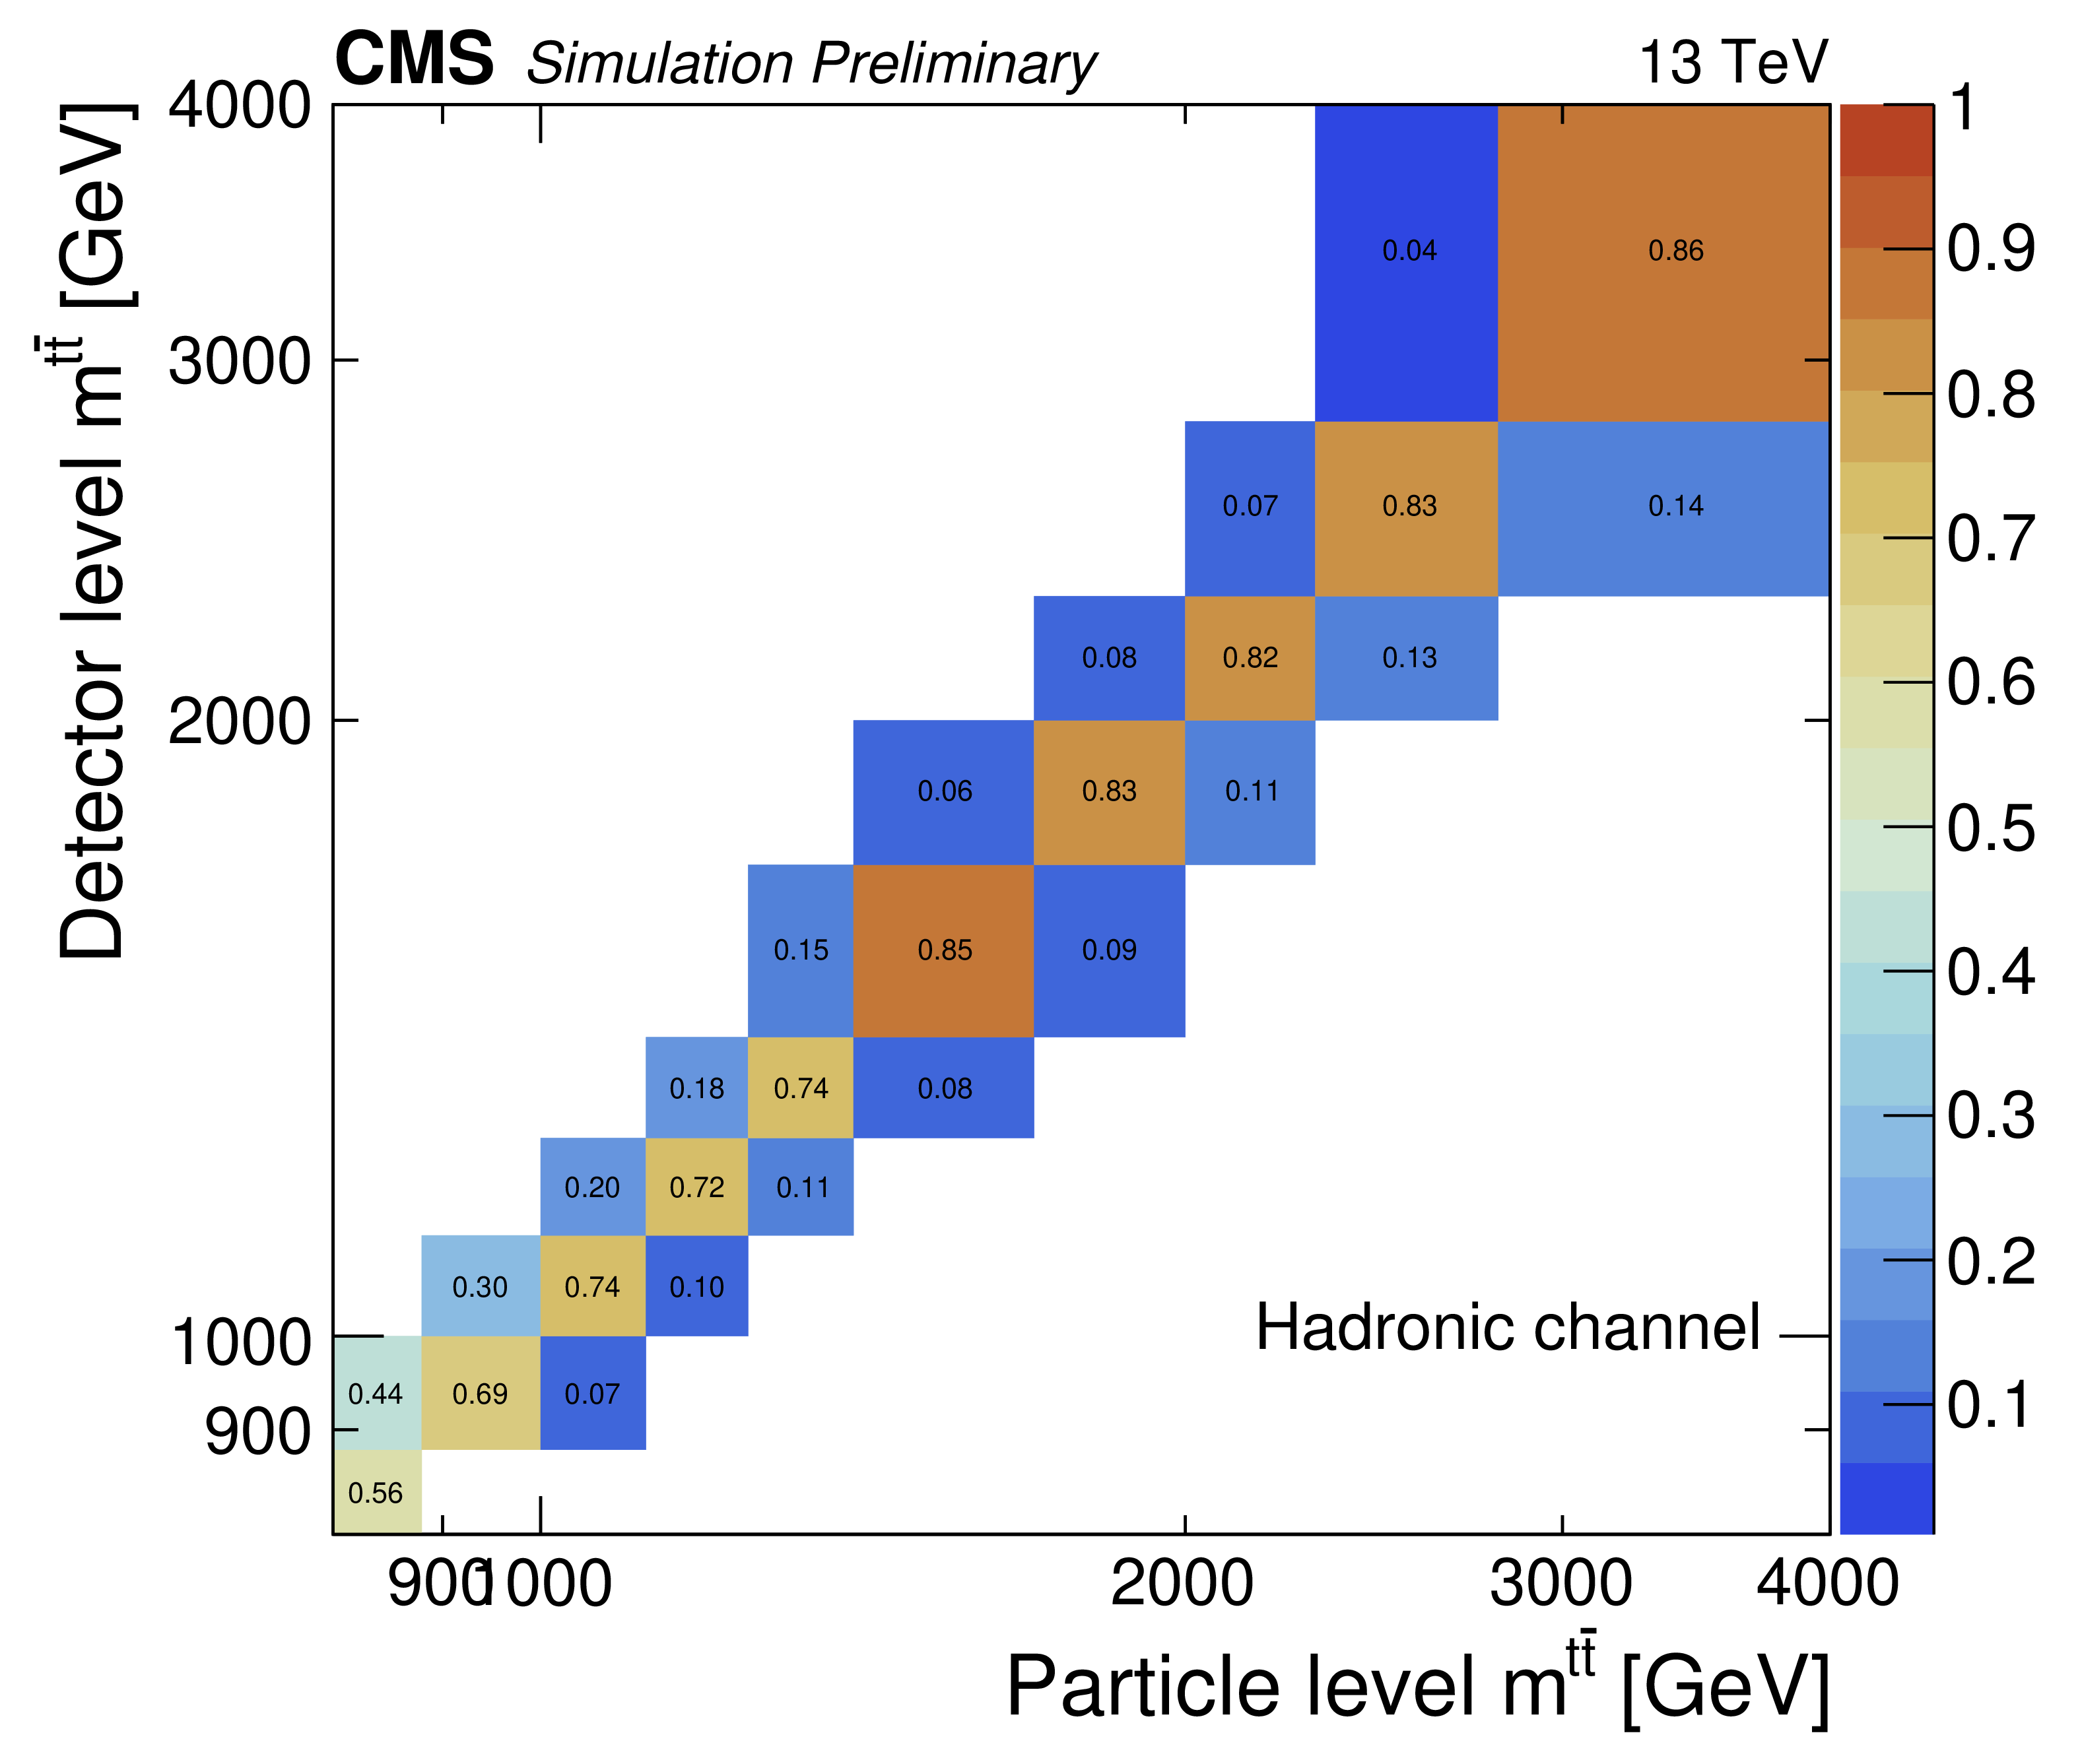
Figure 11:
Simulated migration matrices for $m^{{\mathrm{t\bar{t}}}}$ at the parton level (left) and particle level (right) in the hadronic channel. Each column is normalized to unity. |
png pdf |
Figure 11-a:
Simulated migration matrices for $m^{{\mathrm{t\bar{t}}}}$ at the parton level (left) and particle level (right) in the hadronic channel. Each column is normalized to unity. |
png pdf |
Figure 11-b:
Simulated migration matrices for $m^{{\mathrm{t\bar{t}}}}$ at the parton level (left) and particle level (right) in the hadronic channel. Each column is normalized to unity. |

png pdf |
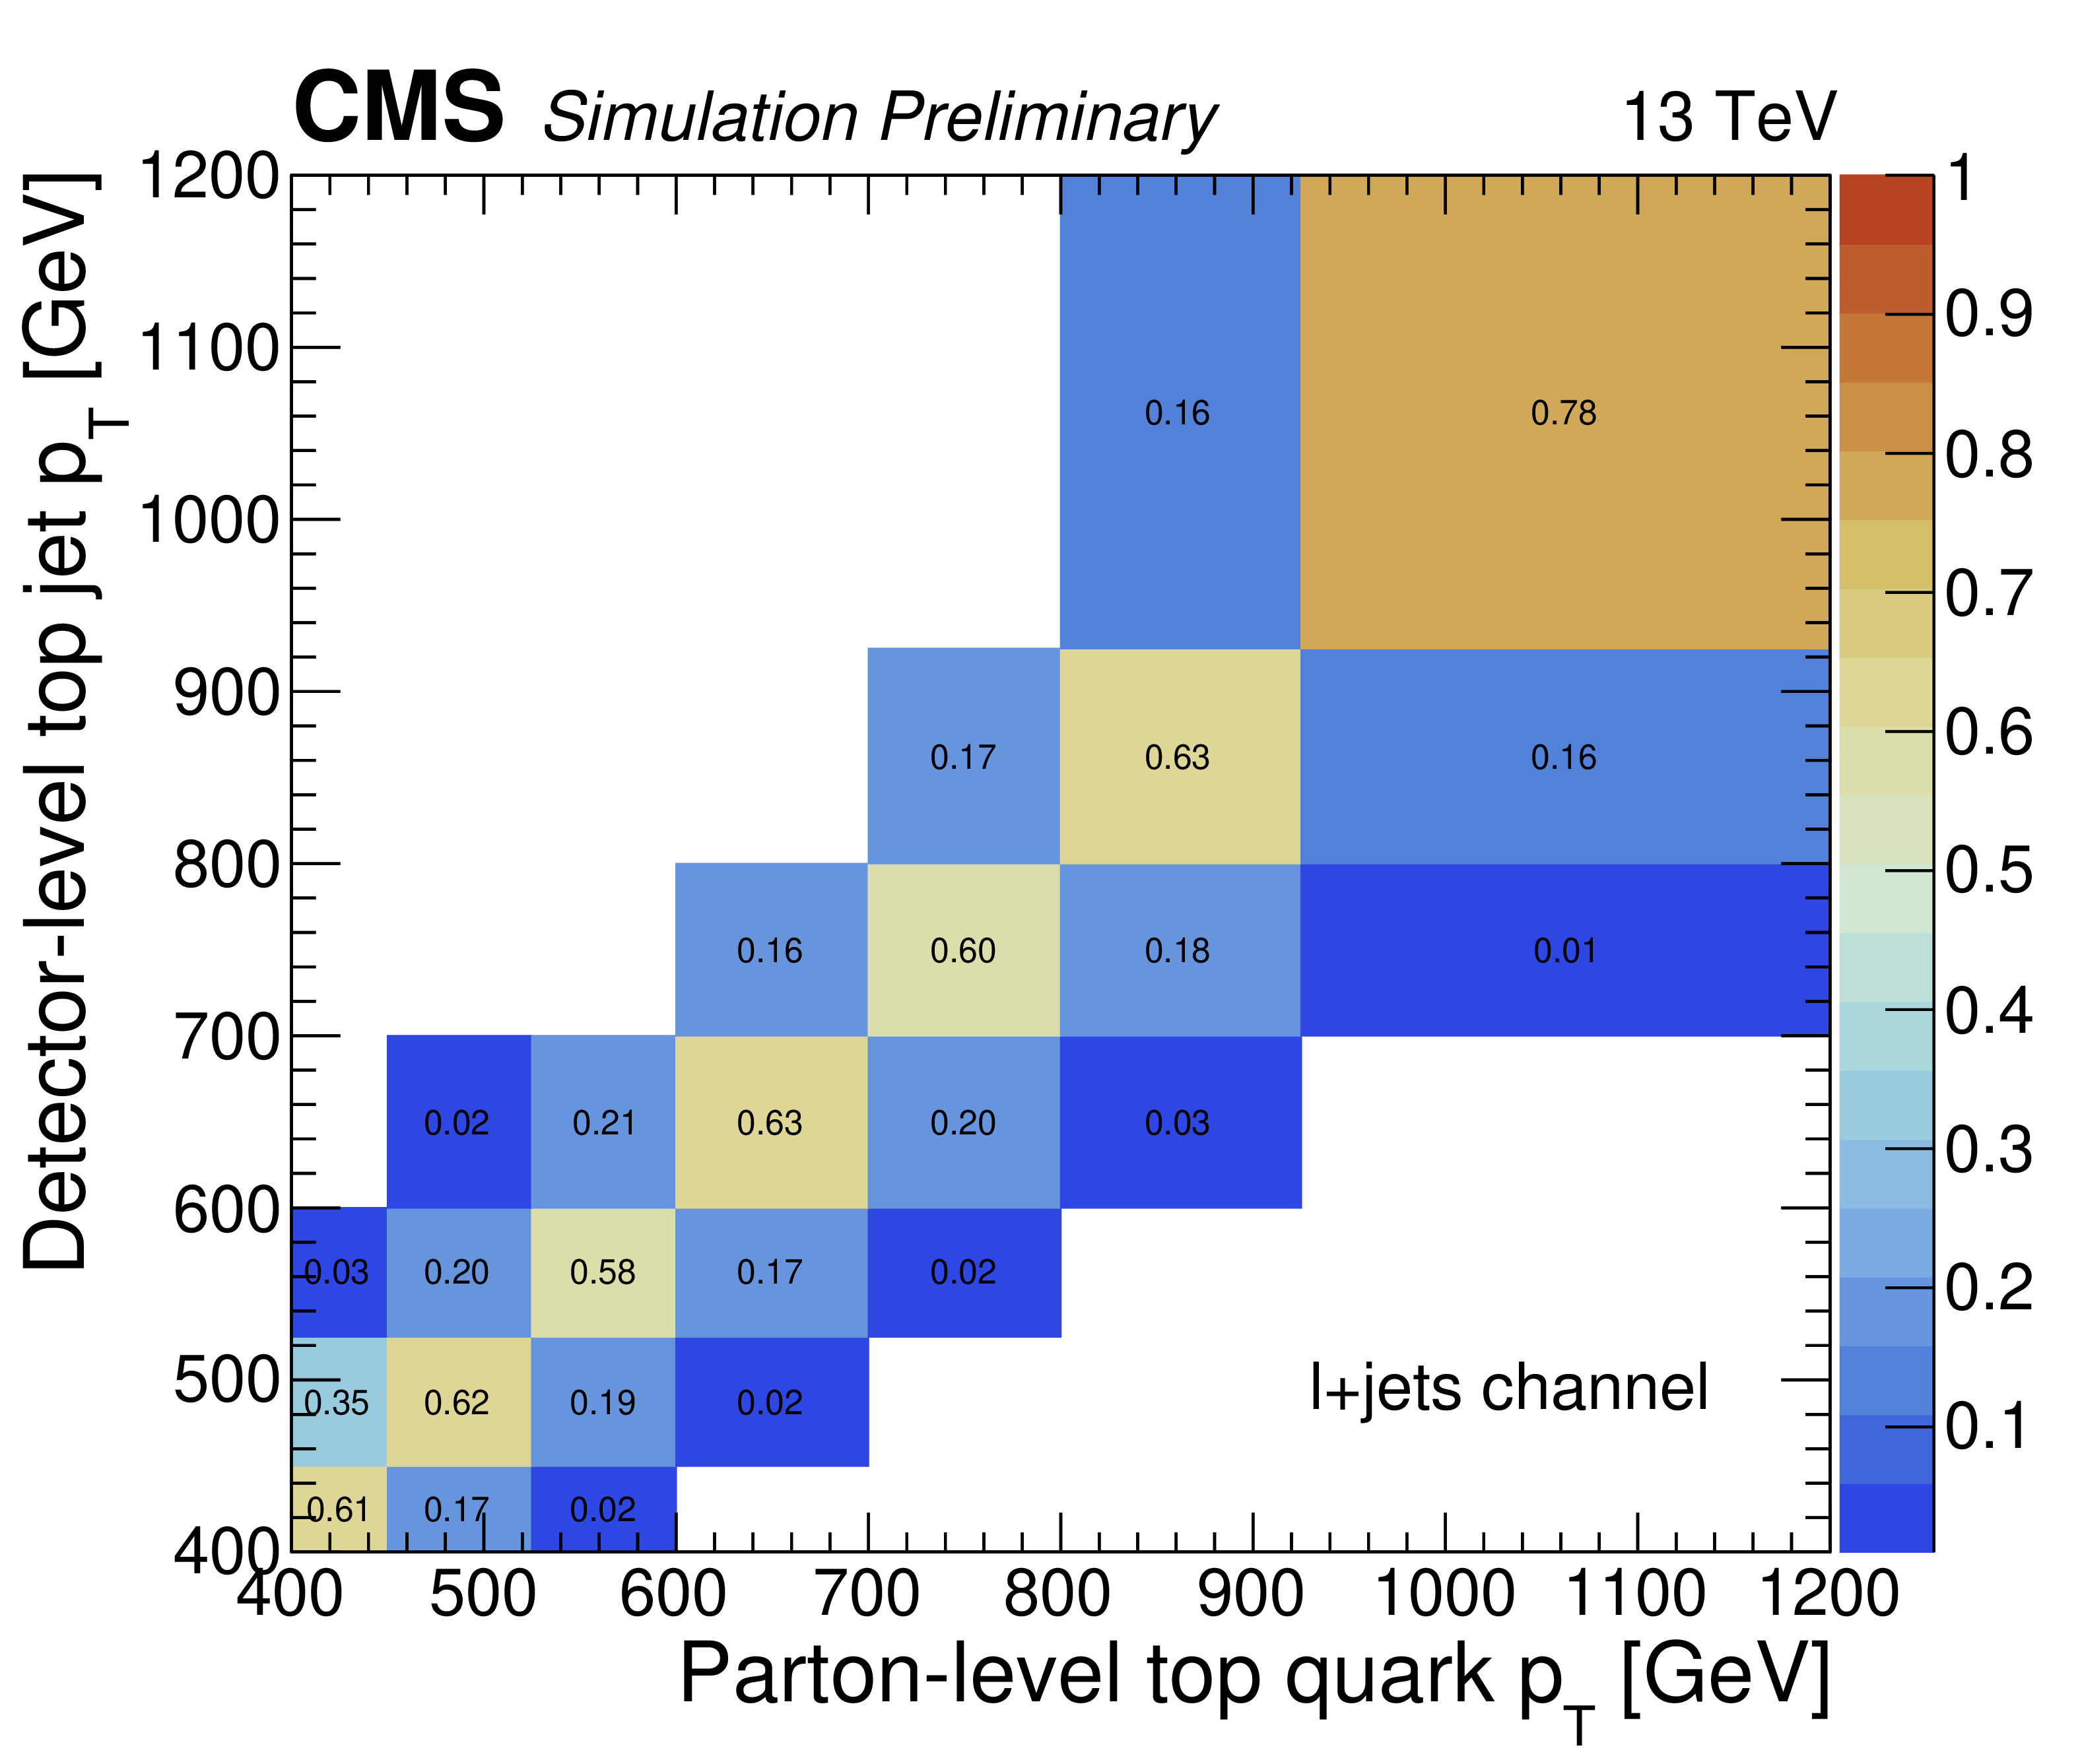
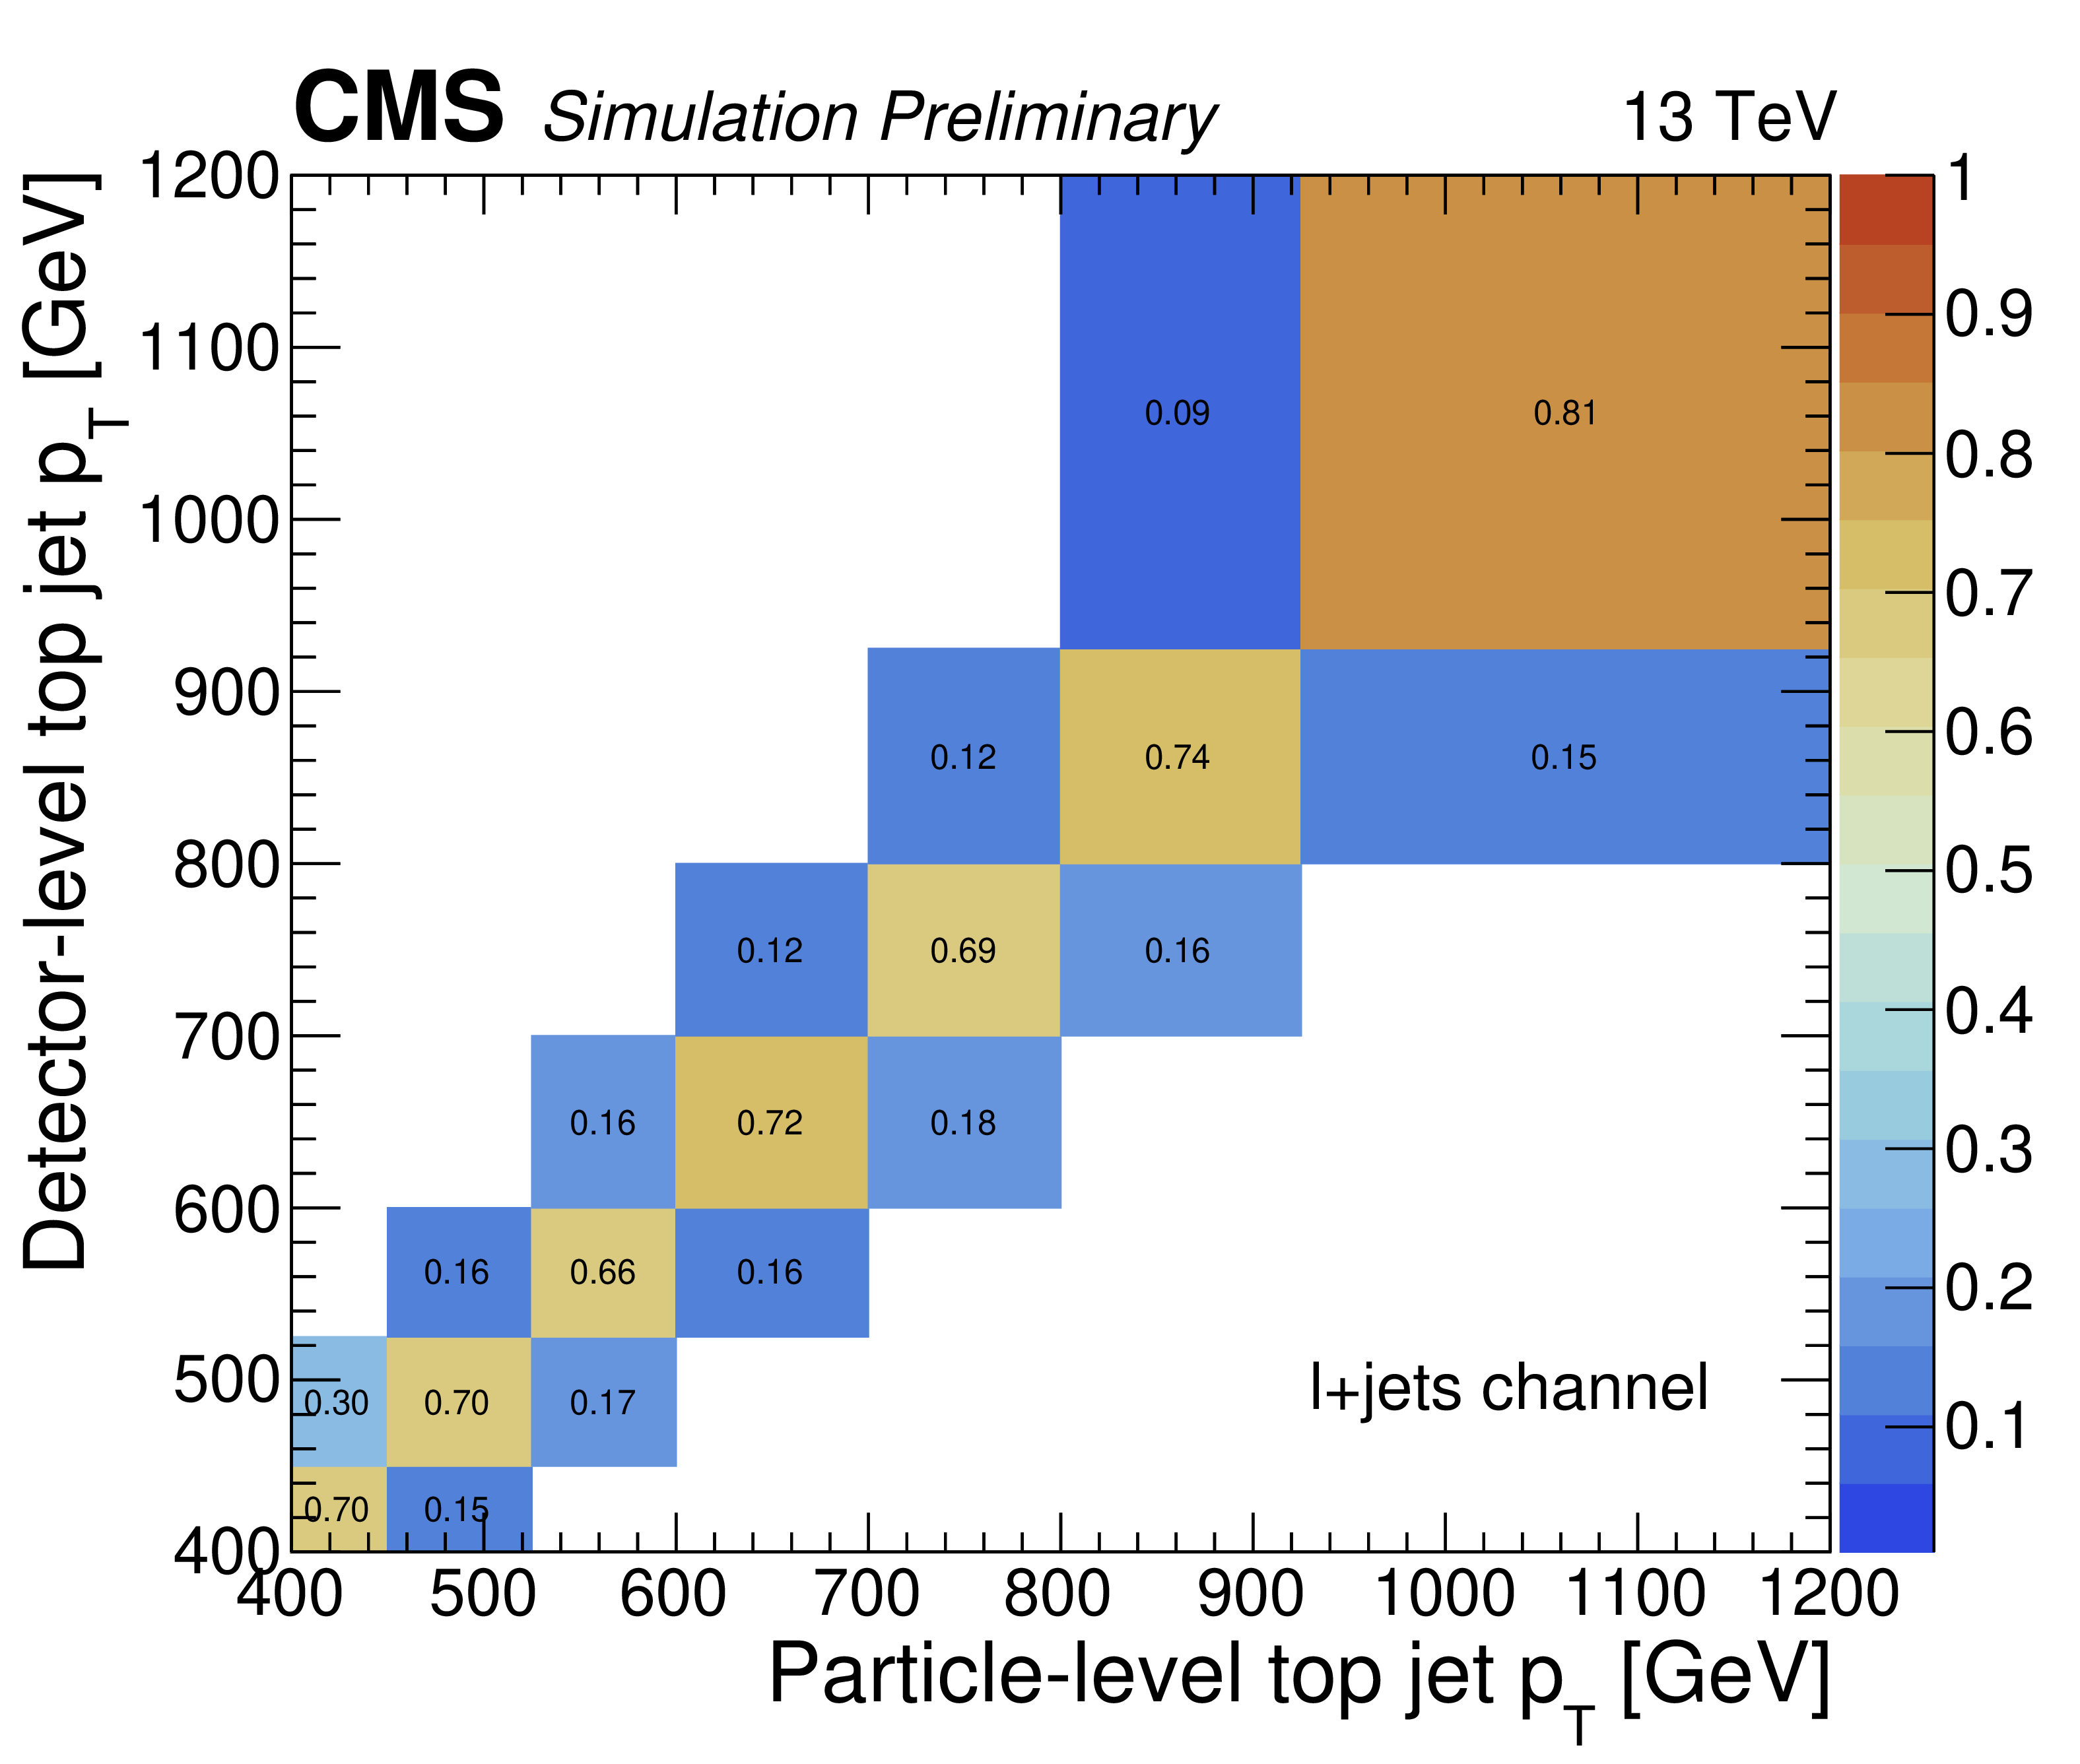
Figure 12:
Simulated migration matrices for top quark ${p_{\mathrm {T}}}$ at the parton level (left) and particle level (right) in the $\ell $+jets channel. Each column is normalized to unity. |
png pdf |
Figure 12-a:
Simulated migration matrices for top quark ${p_{\mathrm {T}}}$ at the parton level (left) and particle level (right) in the $\ell $+jets channel. Each column is normalized to unity. |
png pdf |
Figure 12-b:
Simulated migration matrices for top quark ${p_{\mathrm {T}}}$ at the parton level (left) and particle level (right) in the $\ell $+jets channel. Each column is normalized to unity. |

png pdf |
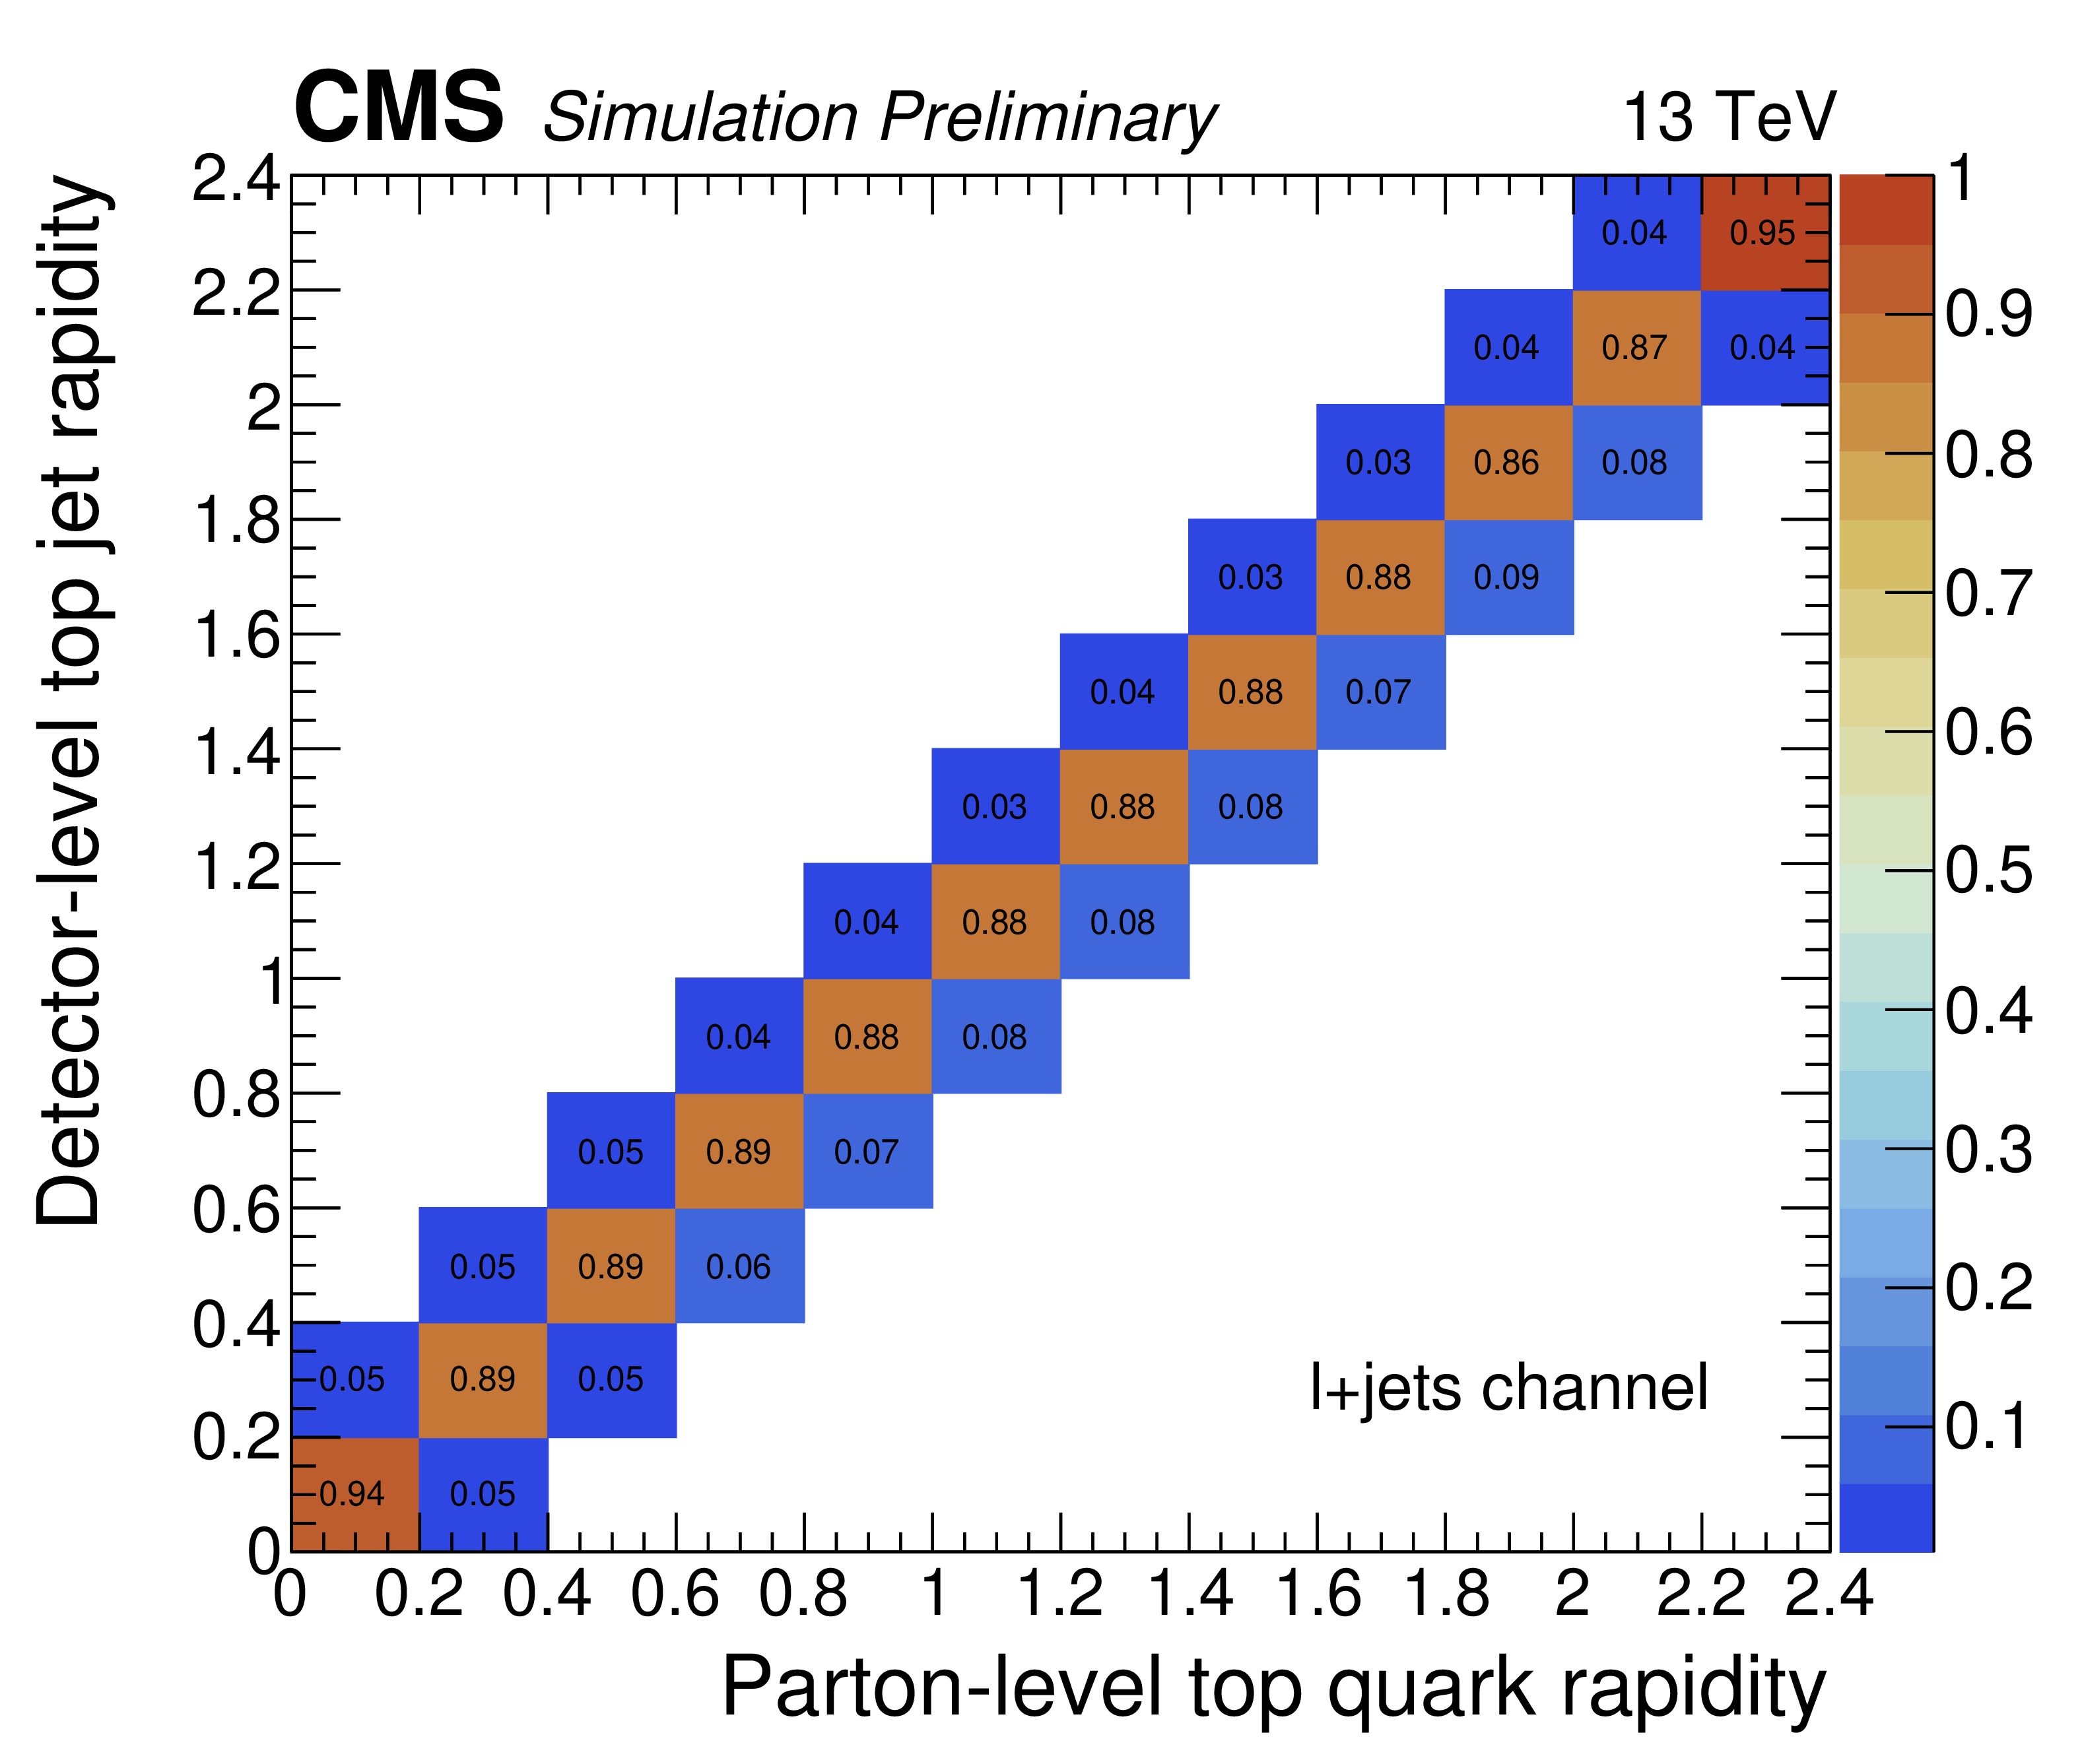
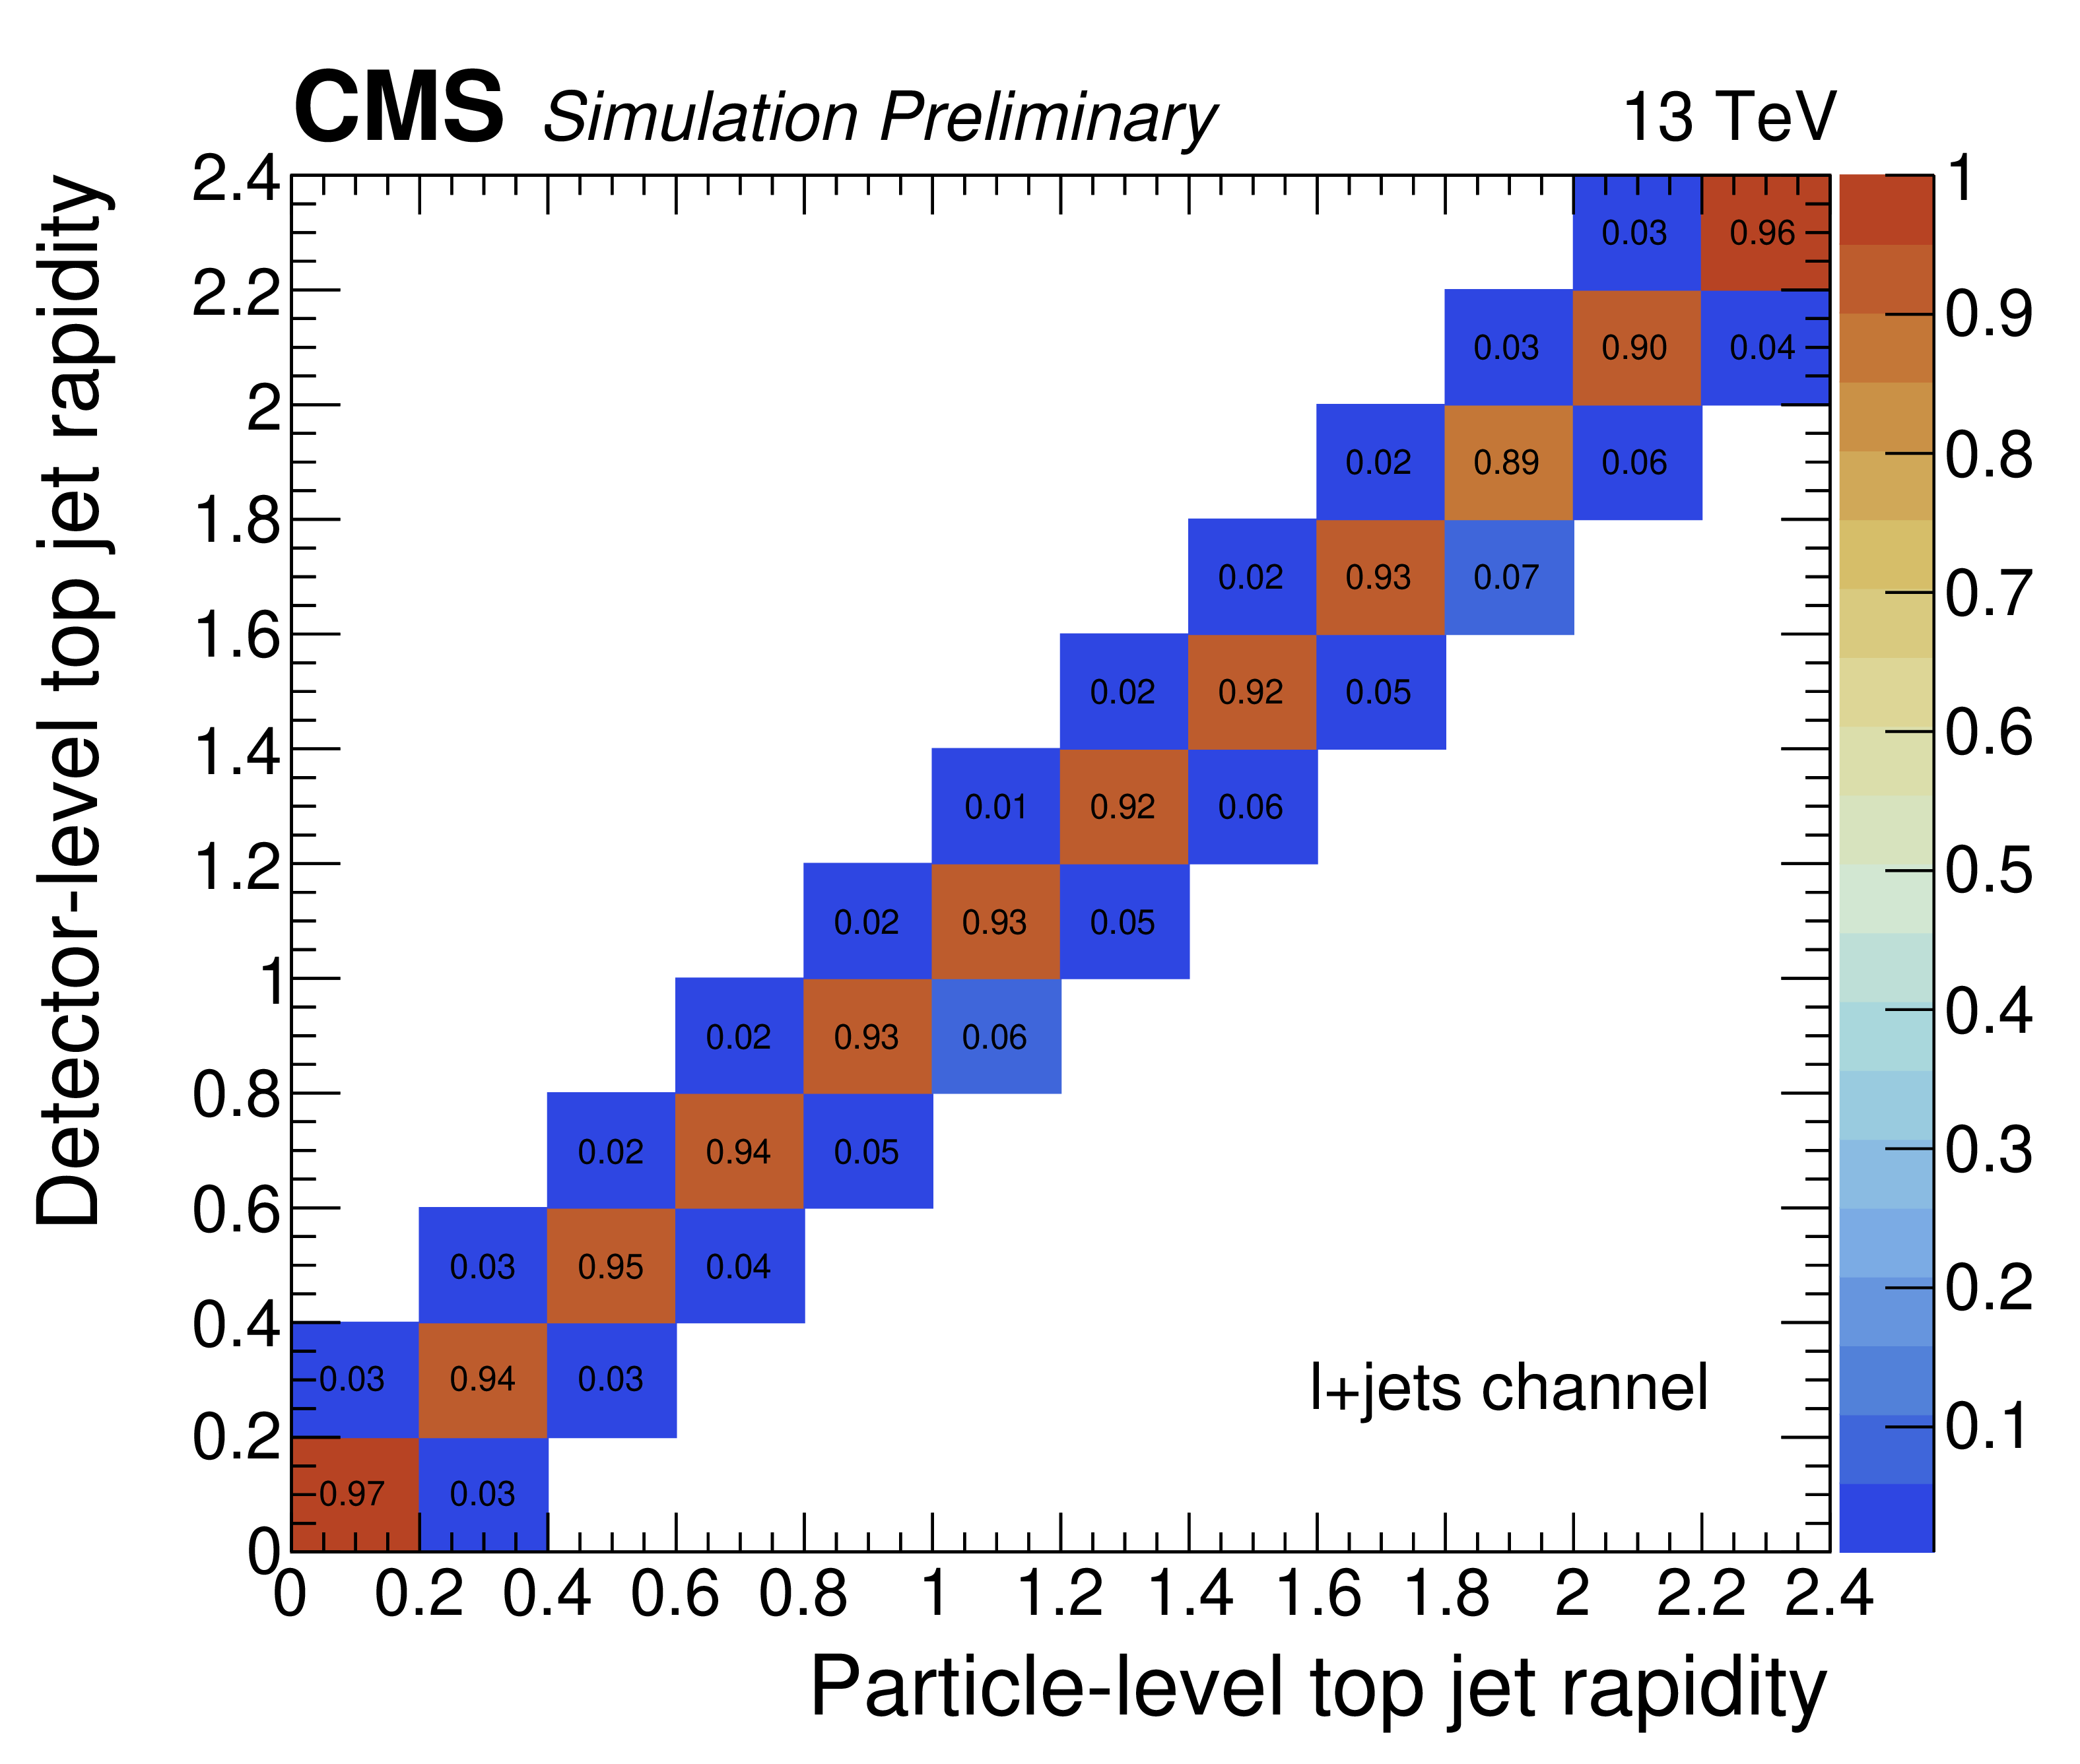
Figure 13:
Simulated migration matrices for top quark rapidity at the parton level (left) and particle level (right) in the $\ell $+jets channel. Each column is normalized to unity. |
png pdf |
Figure 13-a:
Simulated migration matrices for top quark rapidity at the parton level (left) and particle level (right) in the $\ell $+jets channel. Each column is normalized to unity. |
png pdf |
Figure 13-b:
Simulated migration matrices for top quark rapidity at the parton level (left) and particle level (right) in the $\ell $+jets channel. Each column is normalized to unity. |
png pdf |
Figure 14:
Differential cross section unfolded to the particle level, absolute (left) and normalized (right), as a function of the leading top quark ${p_{\mathrm {T}}}$ in the hadronic channel. The bottom panel shows the ratio (theory $-$ data)/data. The uncertainties on the data markers are statistical, while the grey band shows the total statistical and systematic uncertainty. |
png pdf |
Figure 14-a:
Differential cross section unfolded to the particle level, absolute (left) and normalized (right), as a function of the leading top quark ${p_{\mathrm {T}}}$ in the hadronic channel. The bottom panel shows the ratio (theory $-$ data)/data. The uncertainties on the data markers are statistical, while the grey band shows the total statistical and systematic uncertainty. |
png pdf |
Figure 14-b:
Differential cross section unfolded to the particle level, absolute (left) and normalized (right), as a function of the leading top quark ${p_{\mathrm {T}}}$ in the hadronic channel. The bottom panel shows the ratio (theory $-$ data)/data. The uncertainties on the data markers are statistical, while the grey band shows the total statistical and systematic uncertainty. |

png pdf |
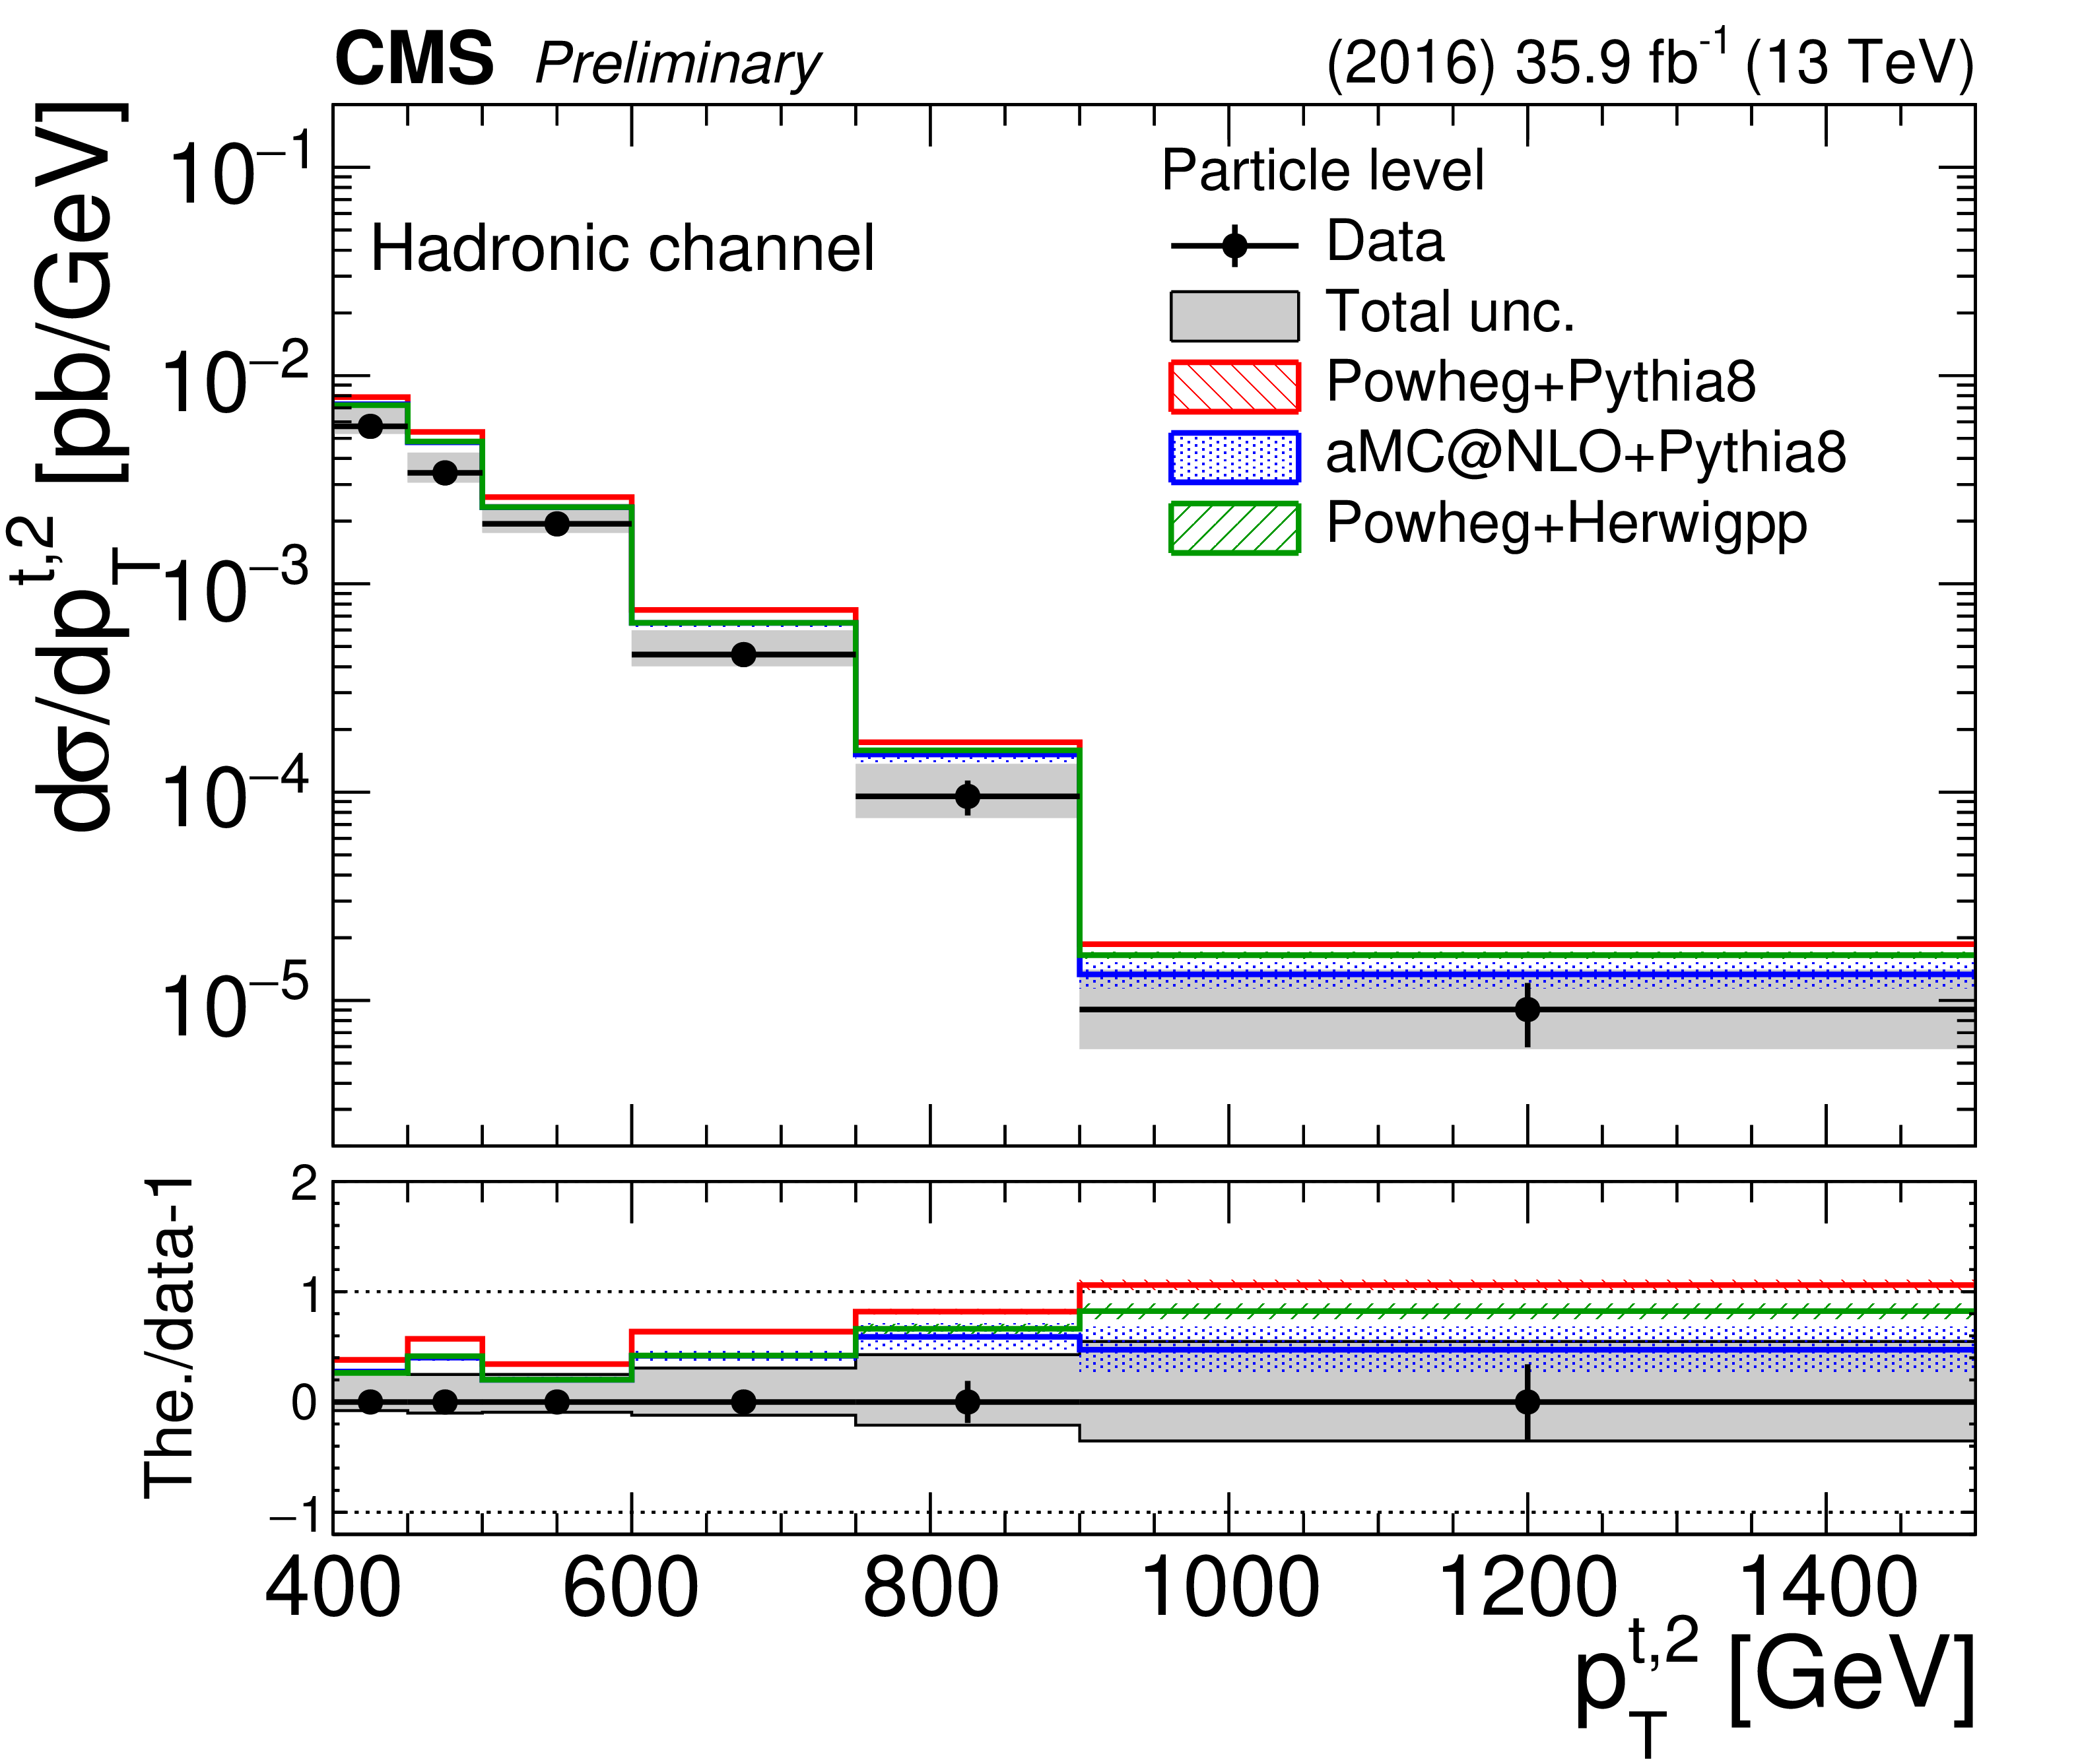
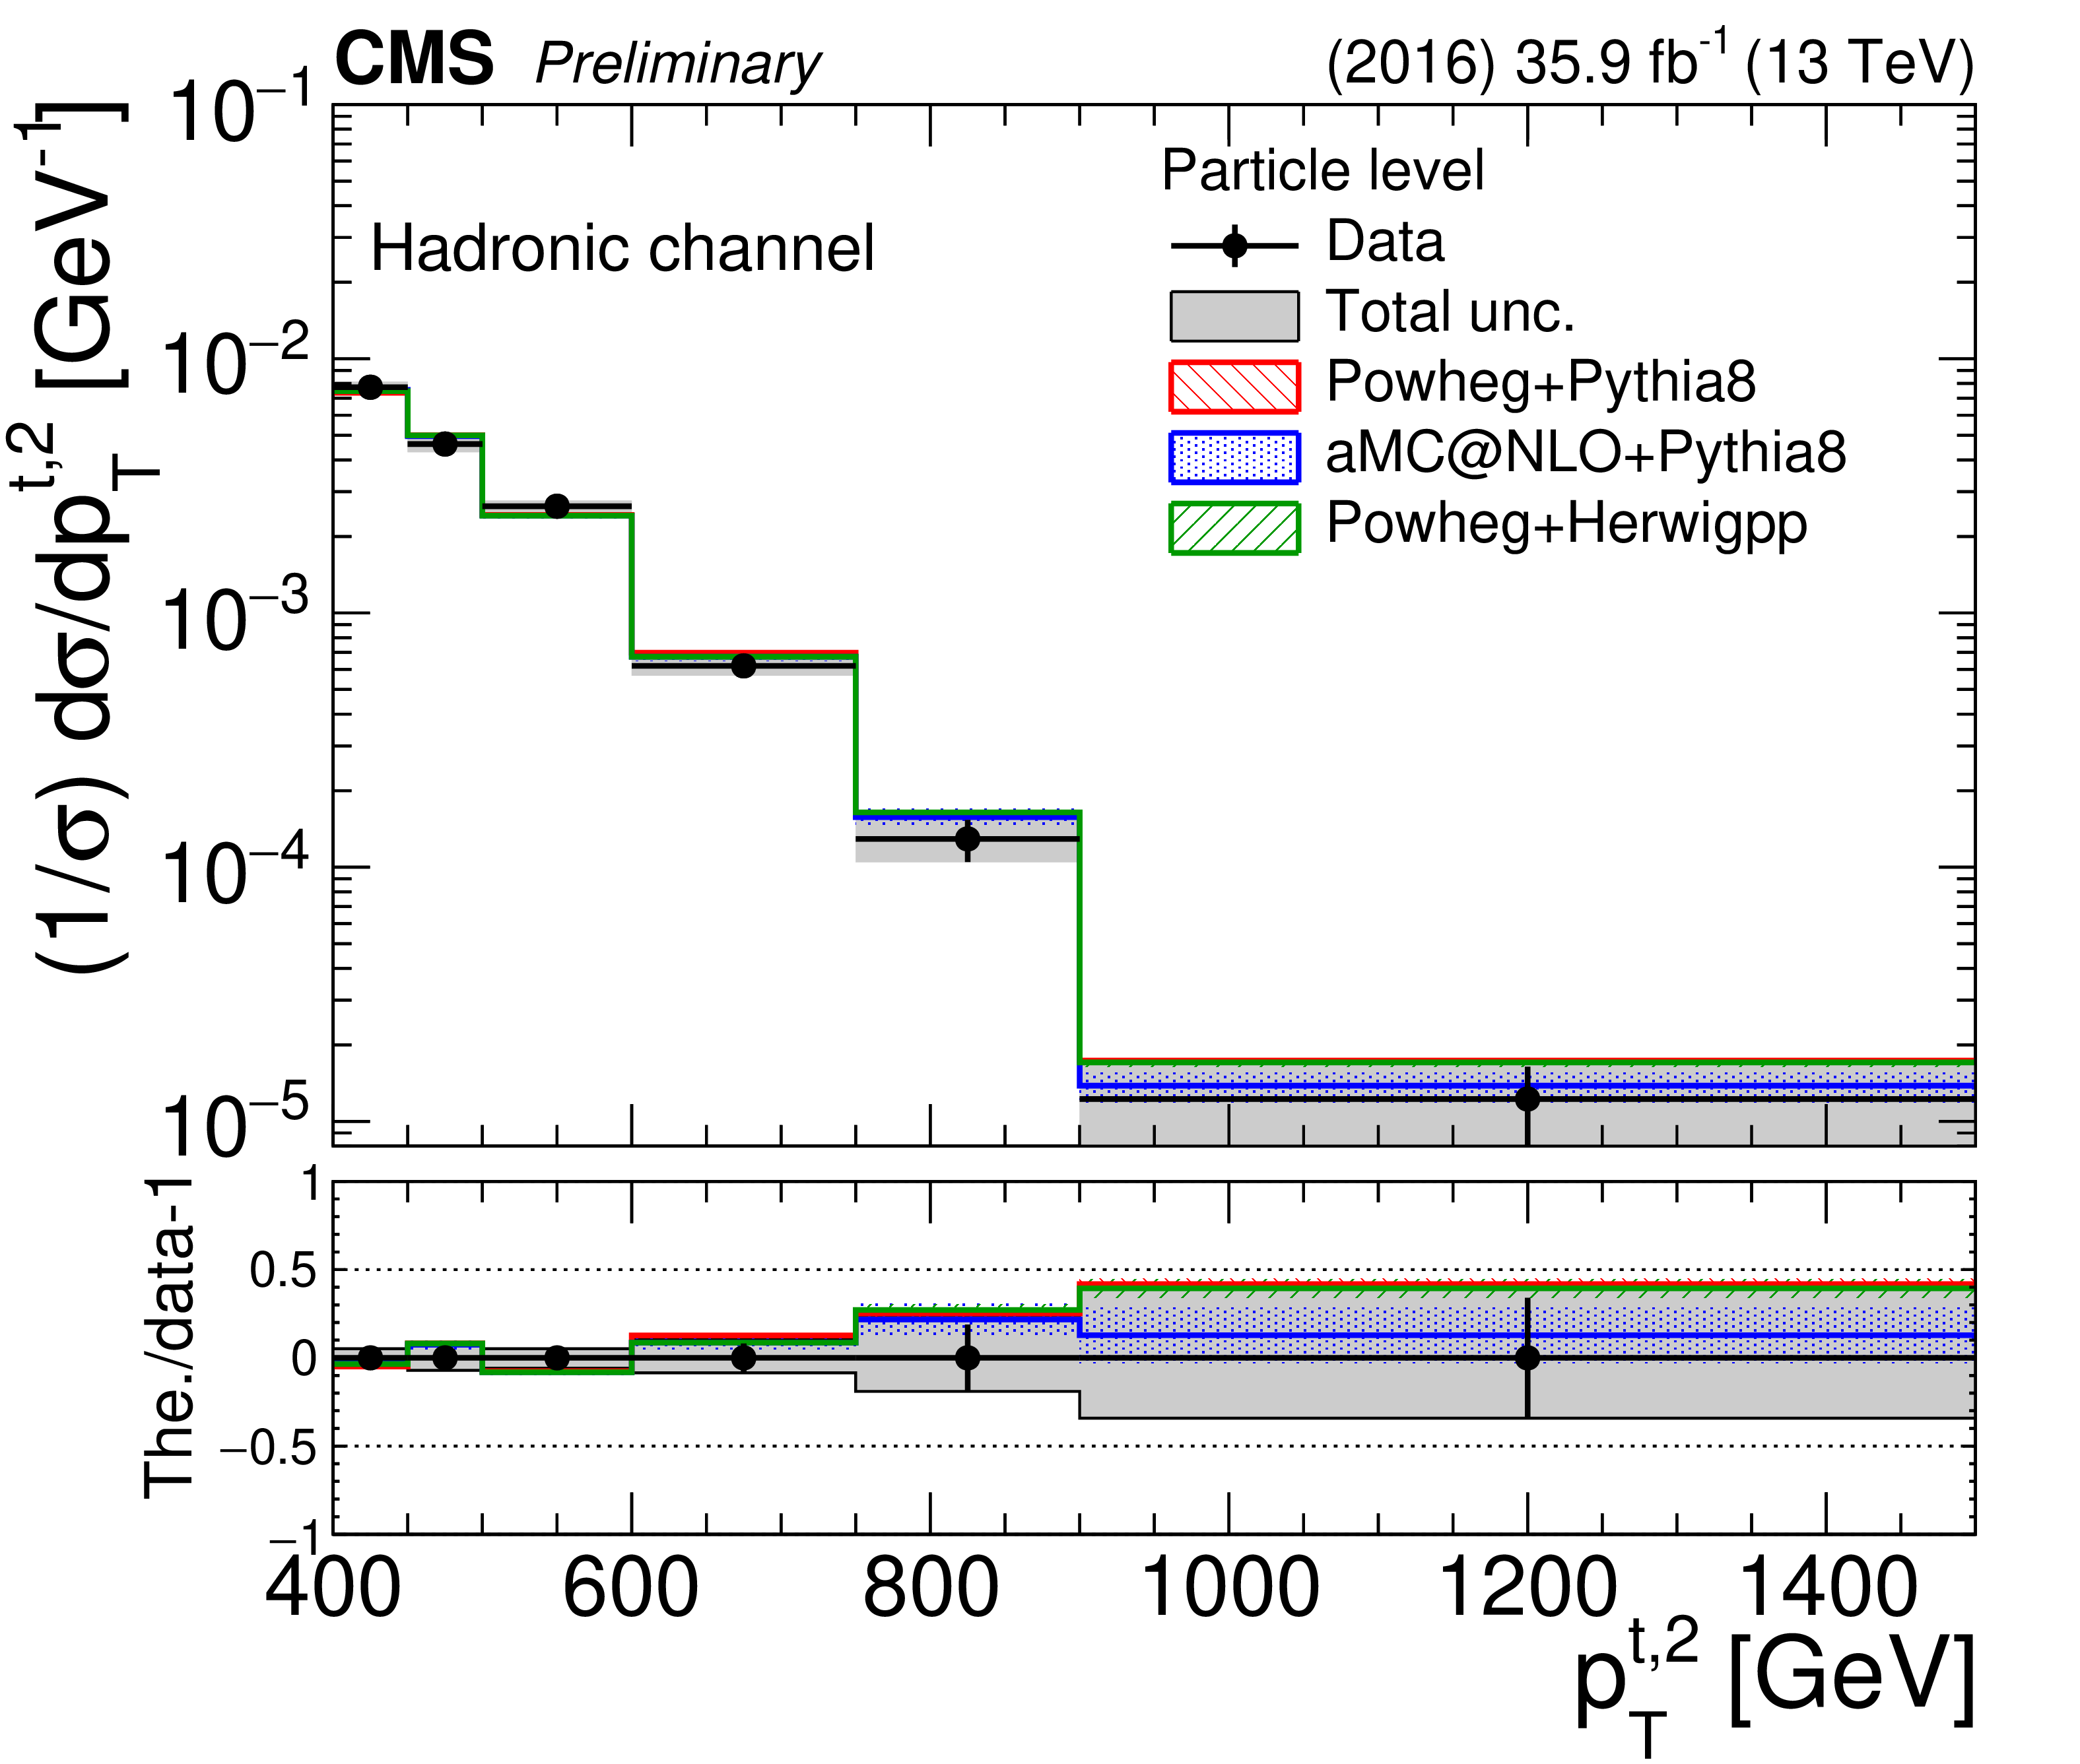
Figure 15:
Differential cross section unfolded to the particle level, absolute (left) and normalized (right), as a function of the second top quark ${p_{\mathrm {T}}}$ in the hadronic channel. The bottom panel shows the ratio (theory $-$ data)/data. The uncertainties on the data markers are statistical, while the grey band shows the total statistical and systematic uncertainty. |
png pdf |
Figure 15-a:
Differential cross section unfolded to the particle level, absolute (left) and normalized (right), as a function of the second top quark ${p_{\mathrm {T}}}$ in the hadronic channel. The bottom panel shows the ratio (theory $-$ data)/data. The uncertainties on the data markers are statistical, while the grey band shows the total statistical and systematic uncertainty. |
png pdf |
Figure 15-b:
Differential cross section unfolded to the particle level, absolute (left) and normalized (right), as a function of the second top quark ${p_{\mathrm {T}}}$ in the hadronic channel. The bottom panel shows the ratio (theory $-$ data)/data. The uncertainties on the data markers are statistical, while the grey band shows the total statistical and systematic uncertainty. |

png pdf |
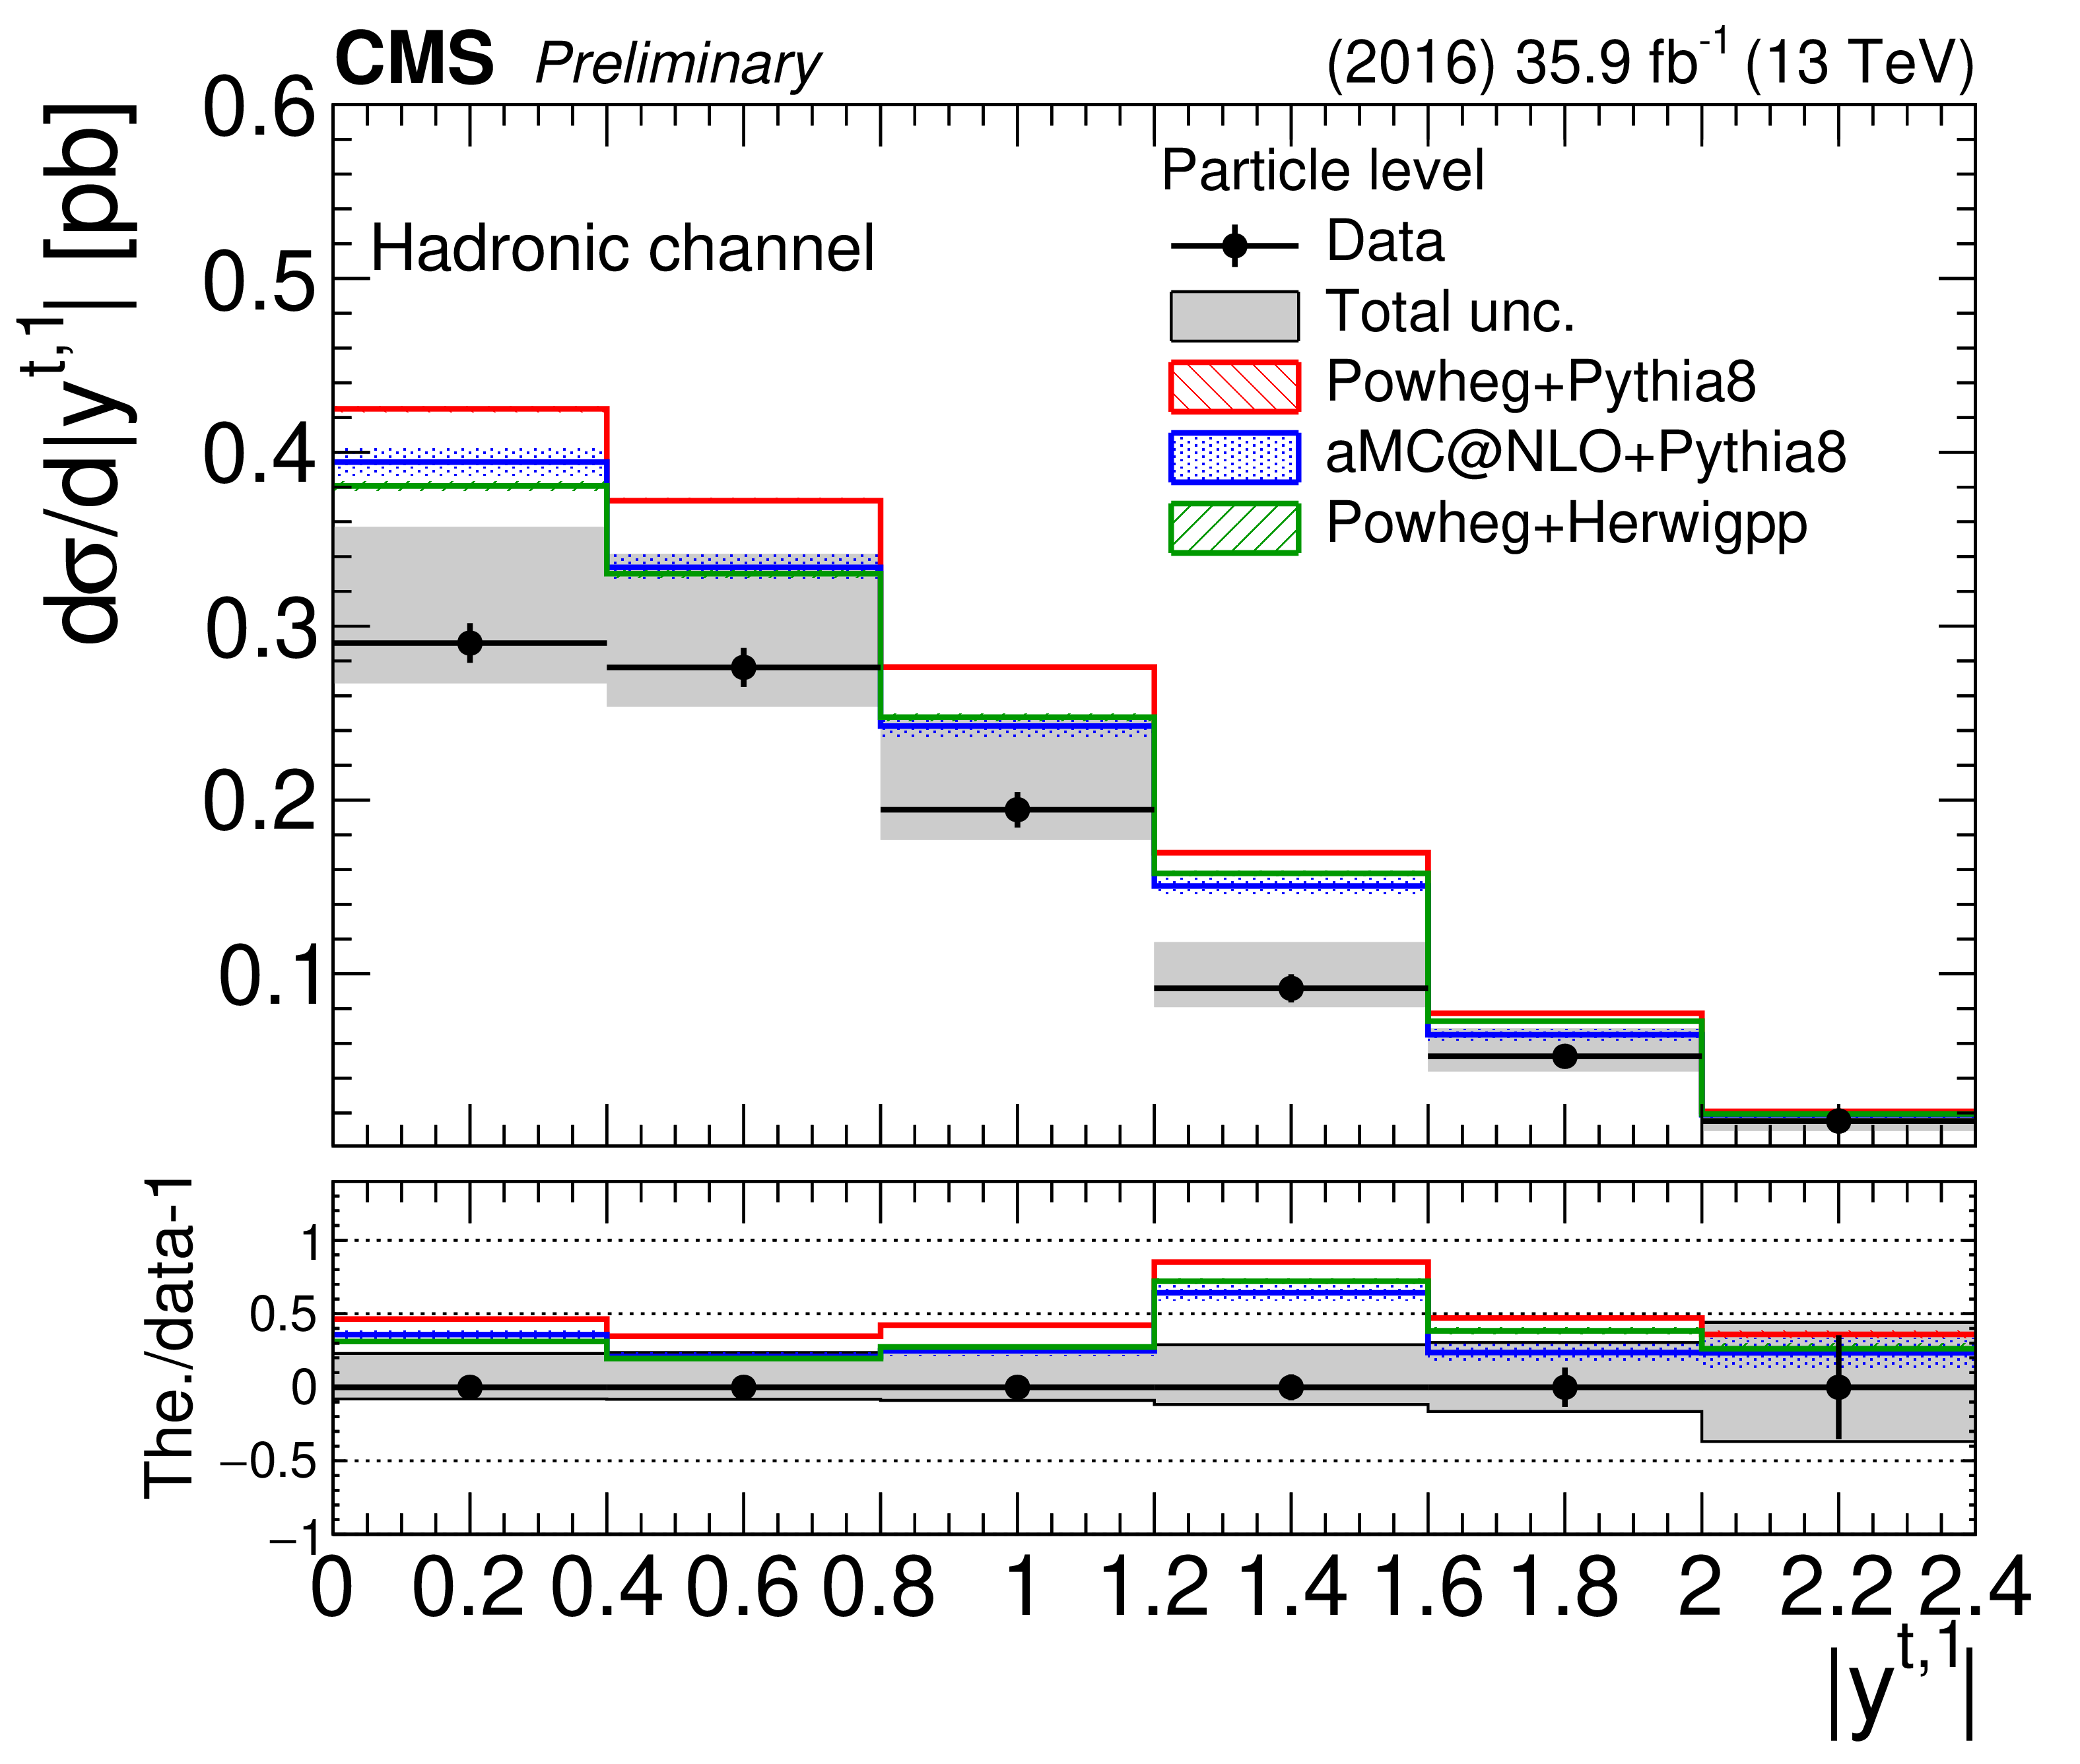
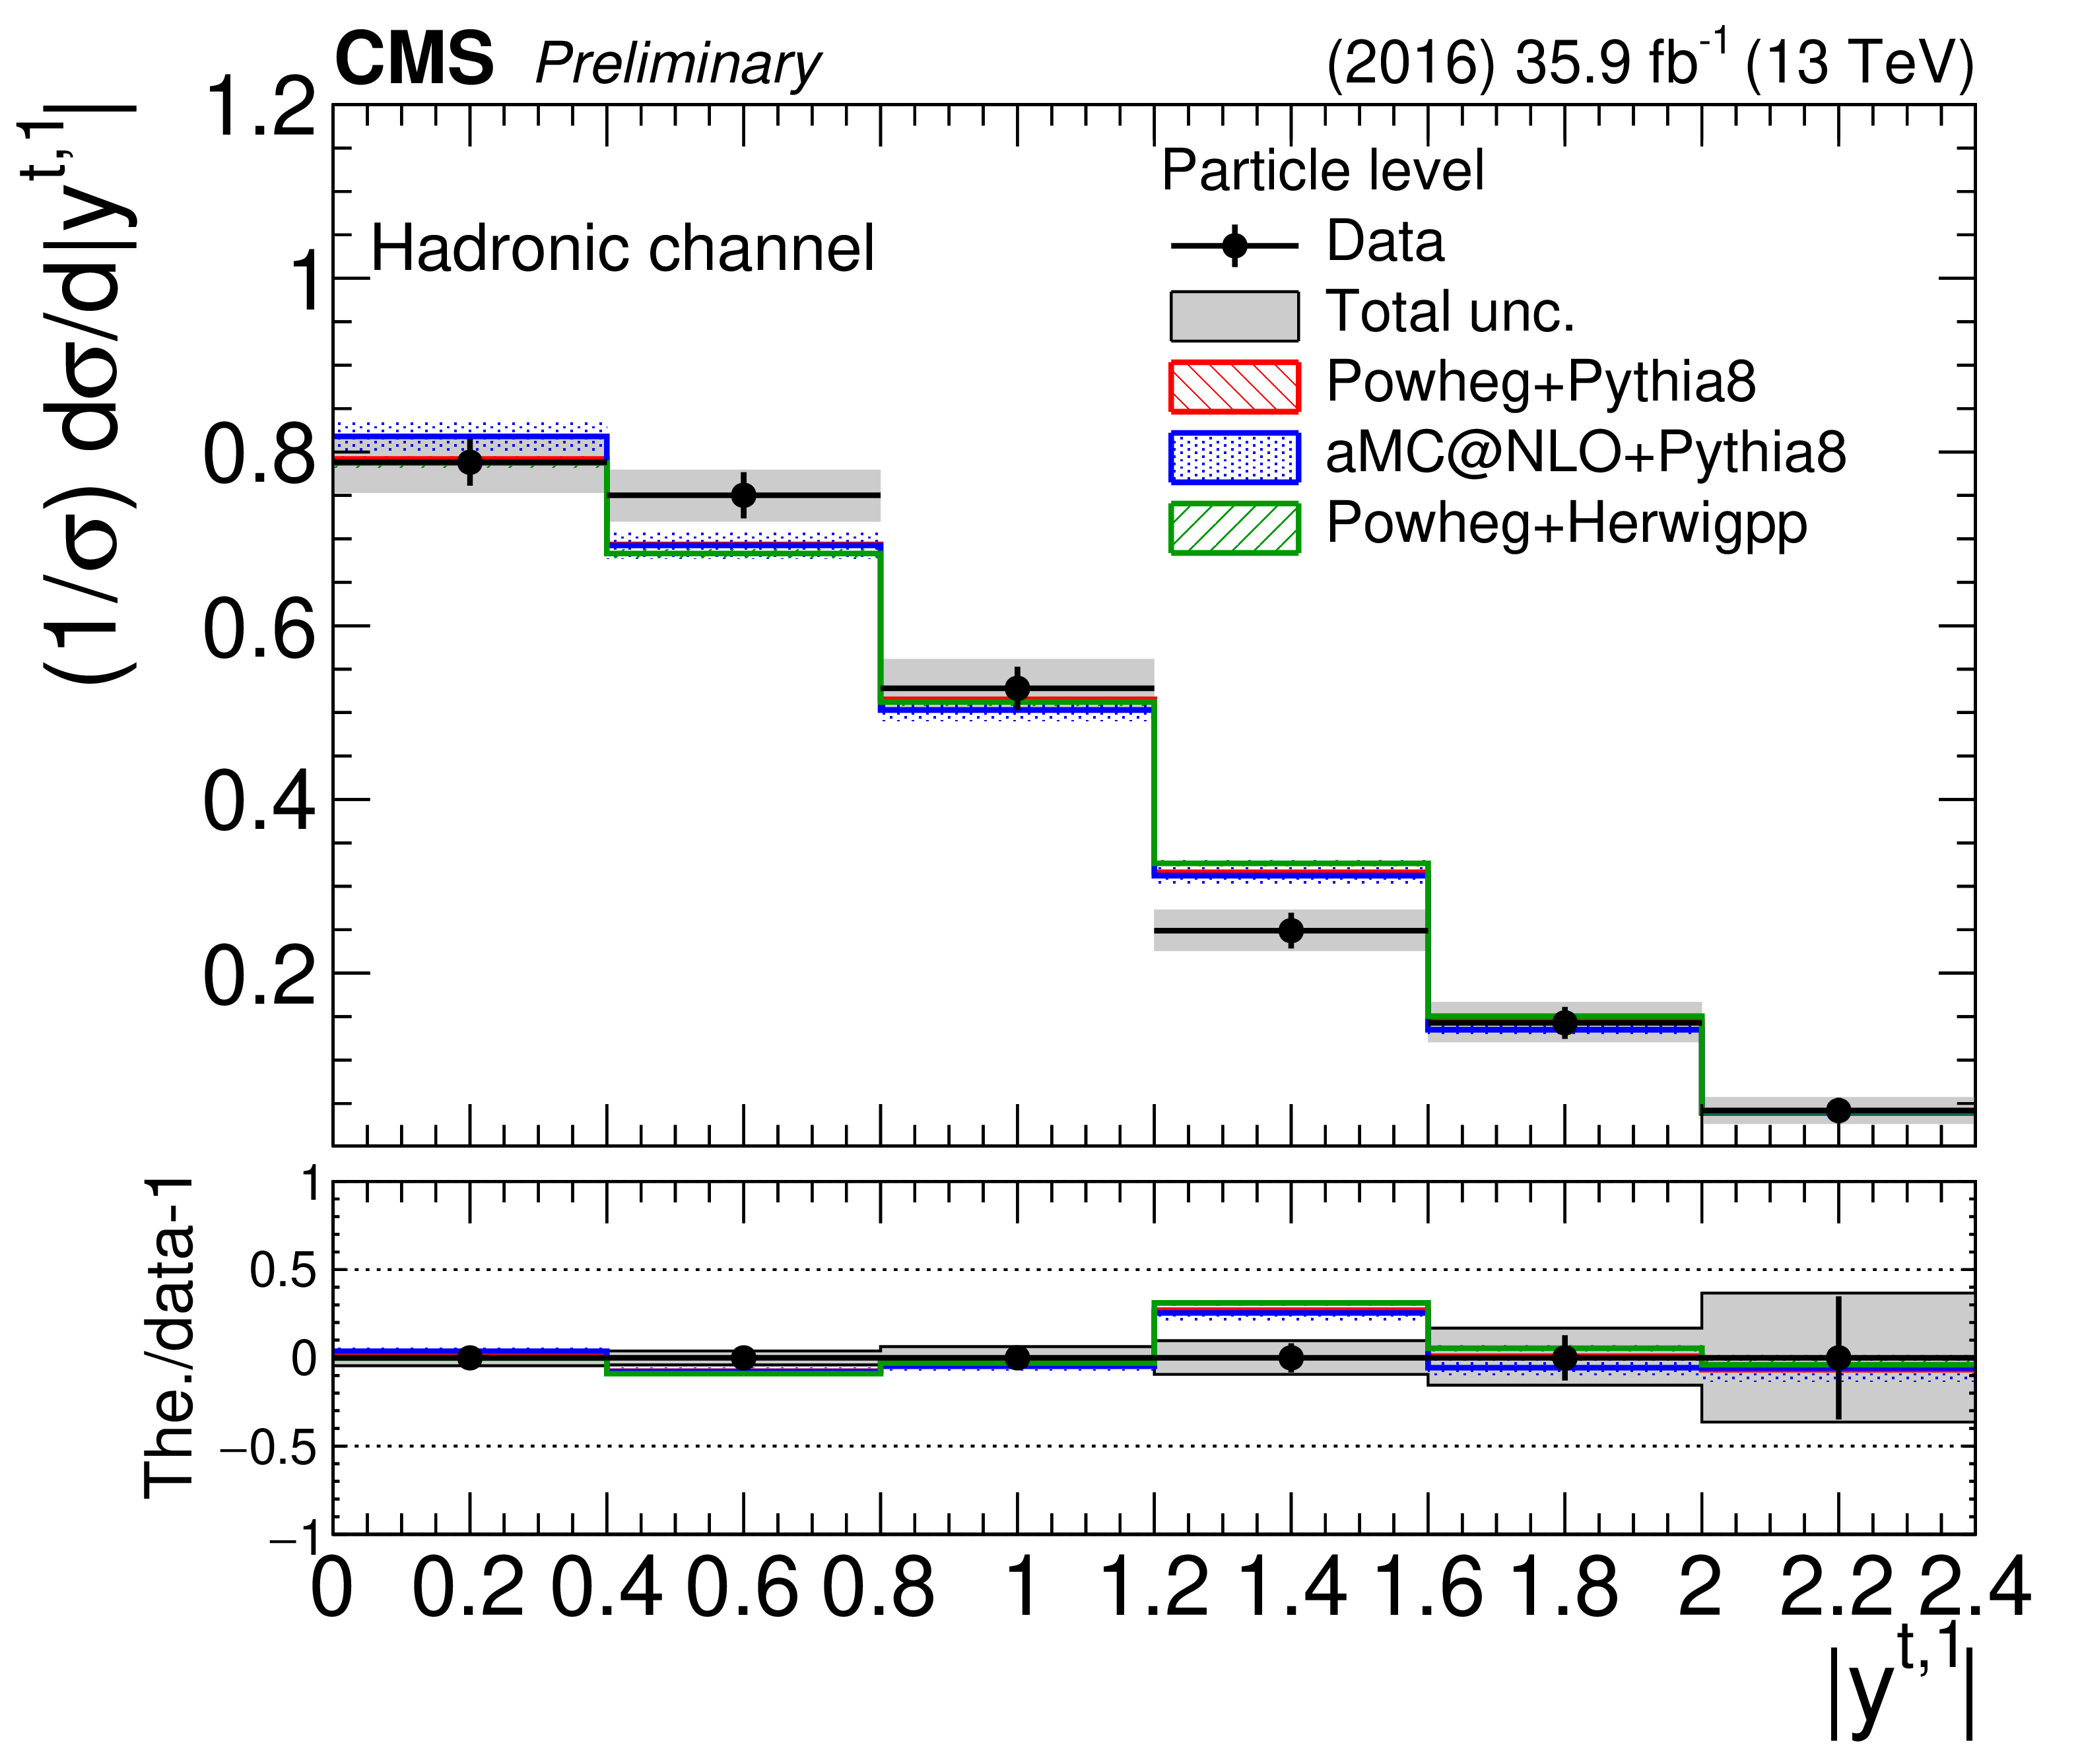
Figure 16:
Differential cross section unfolded to the particle level, absolute (left) and normalized (right), as a function of the leading top quark $|y|$ in the hadronic channel. The bottom panel shows the ratio (theory $-$ data)/data. The uncertainties on the data markers are statistical, while the grey band shows the total statistical and systematic uncertainty. |
png pdf |
Figure 16-a:
Differential cross section unfolded to the particle level, absolute (left) and normalized (right), as a function of the leading top quark $|y|$ in the hadronic channel. The bottom panel shows the ratio (theory $-$ data)/data. The uncertainties on the data markers are statistical, while the grey band shows the total statistical and systematic uncertainty. |
png pdf |
Figure 16-b:
Differential cross section unfolded to the particle level, absolute (left) and normalized (right), as a function of the leading top quark $|y|$ in the hadronic channel. The bottom panel shows the ratio (theory $-$ data)/data. The uncertainties on the data markers are statistical, while the grey band shows the total statistical and systematic uncertainty. |
png pdf |
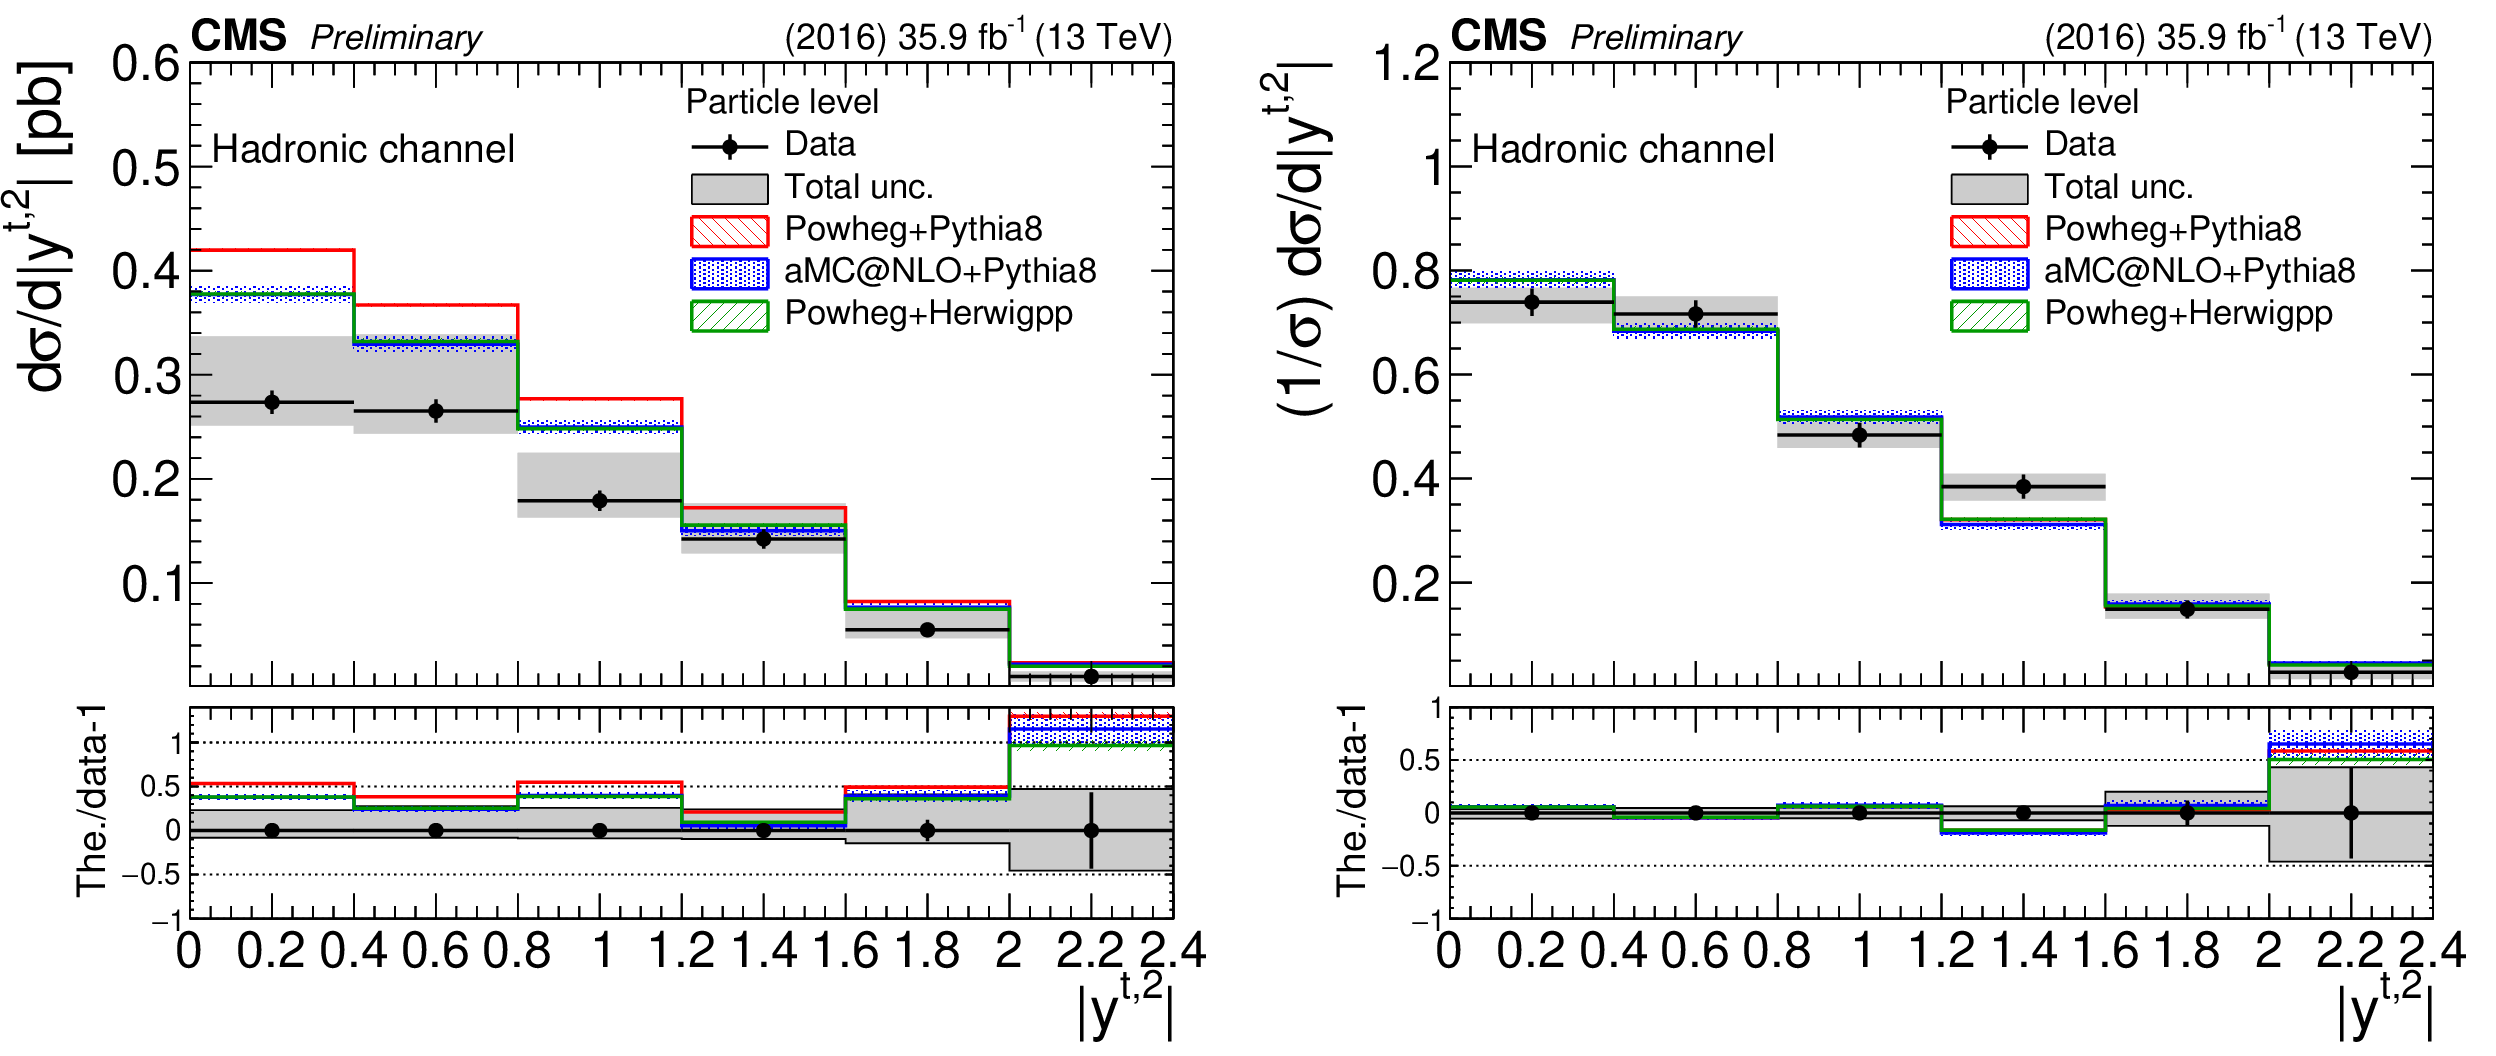
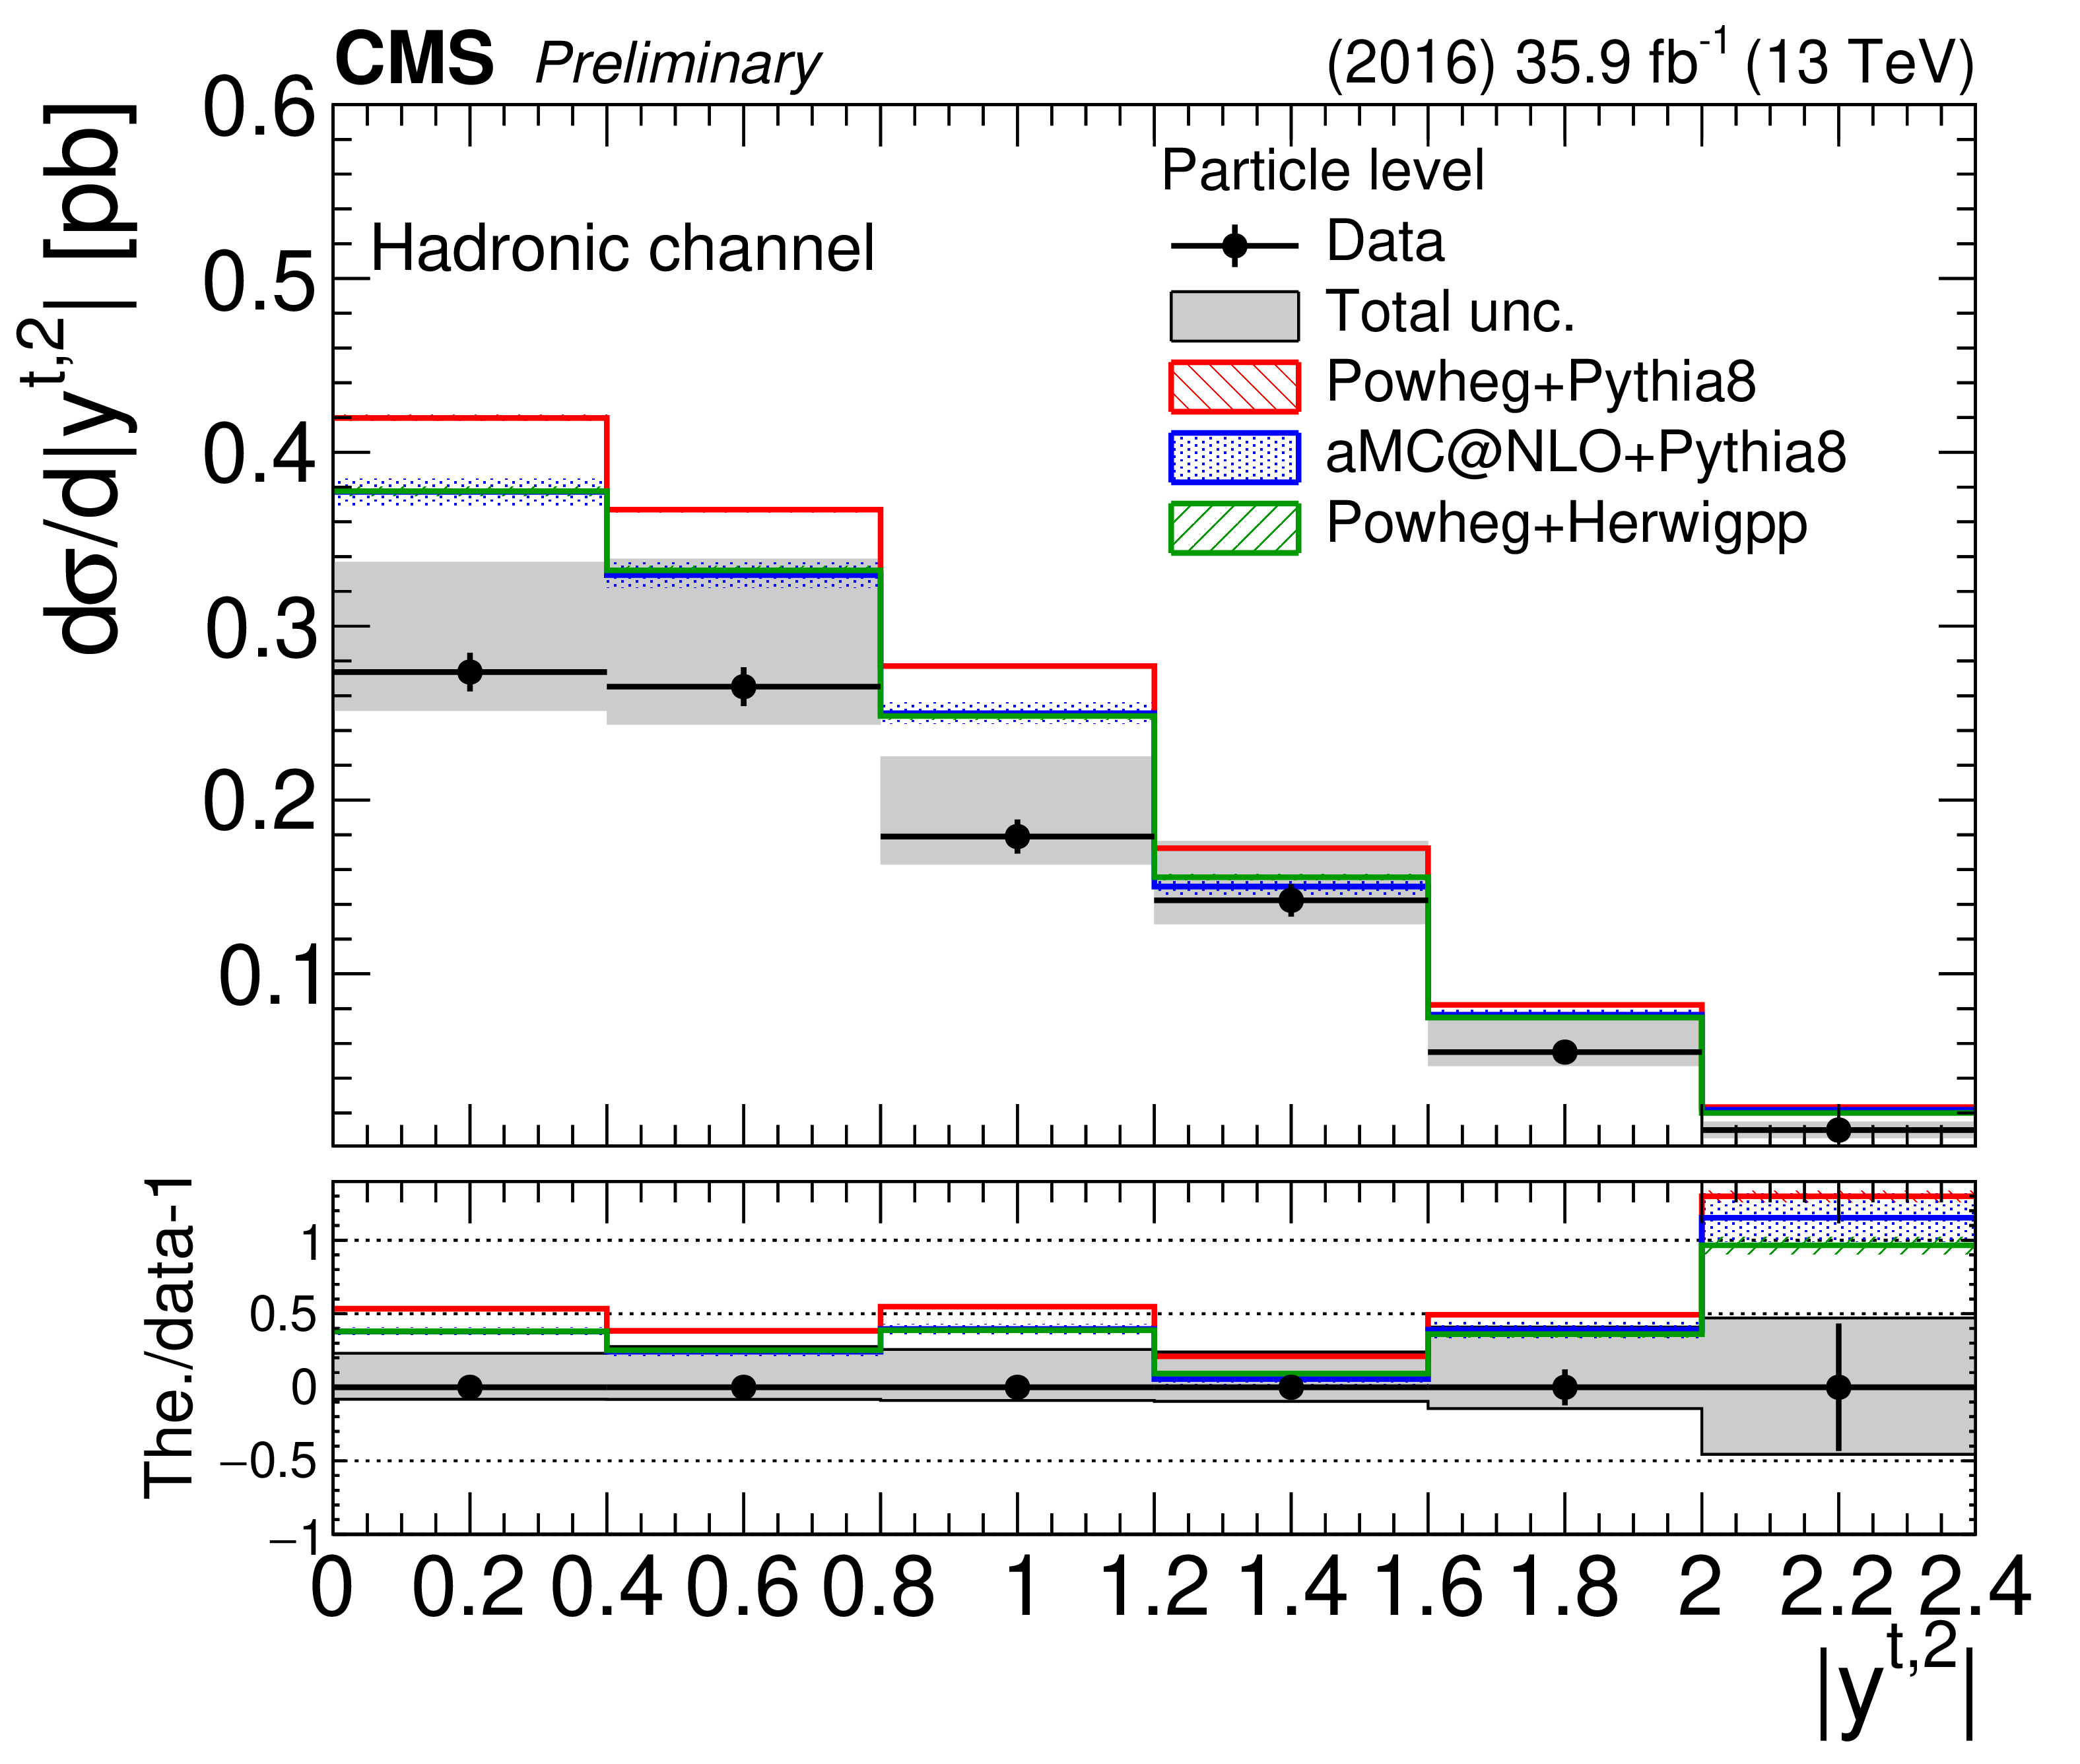
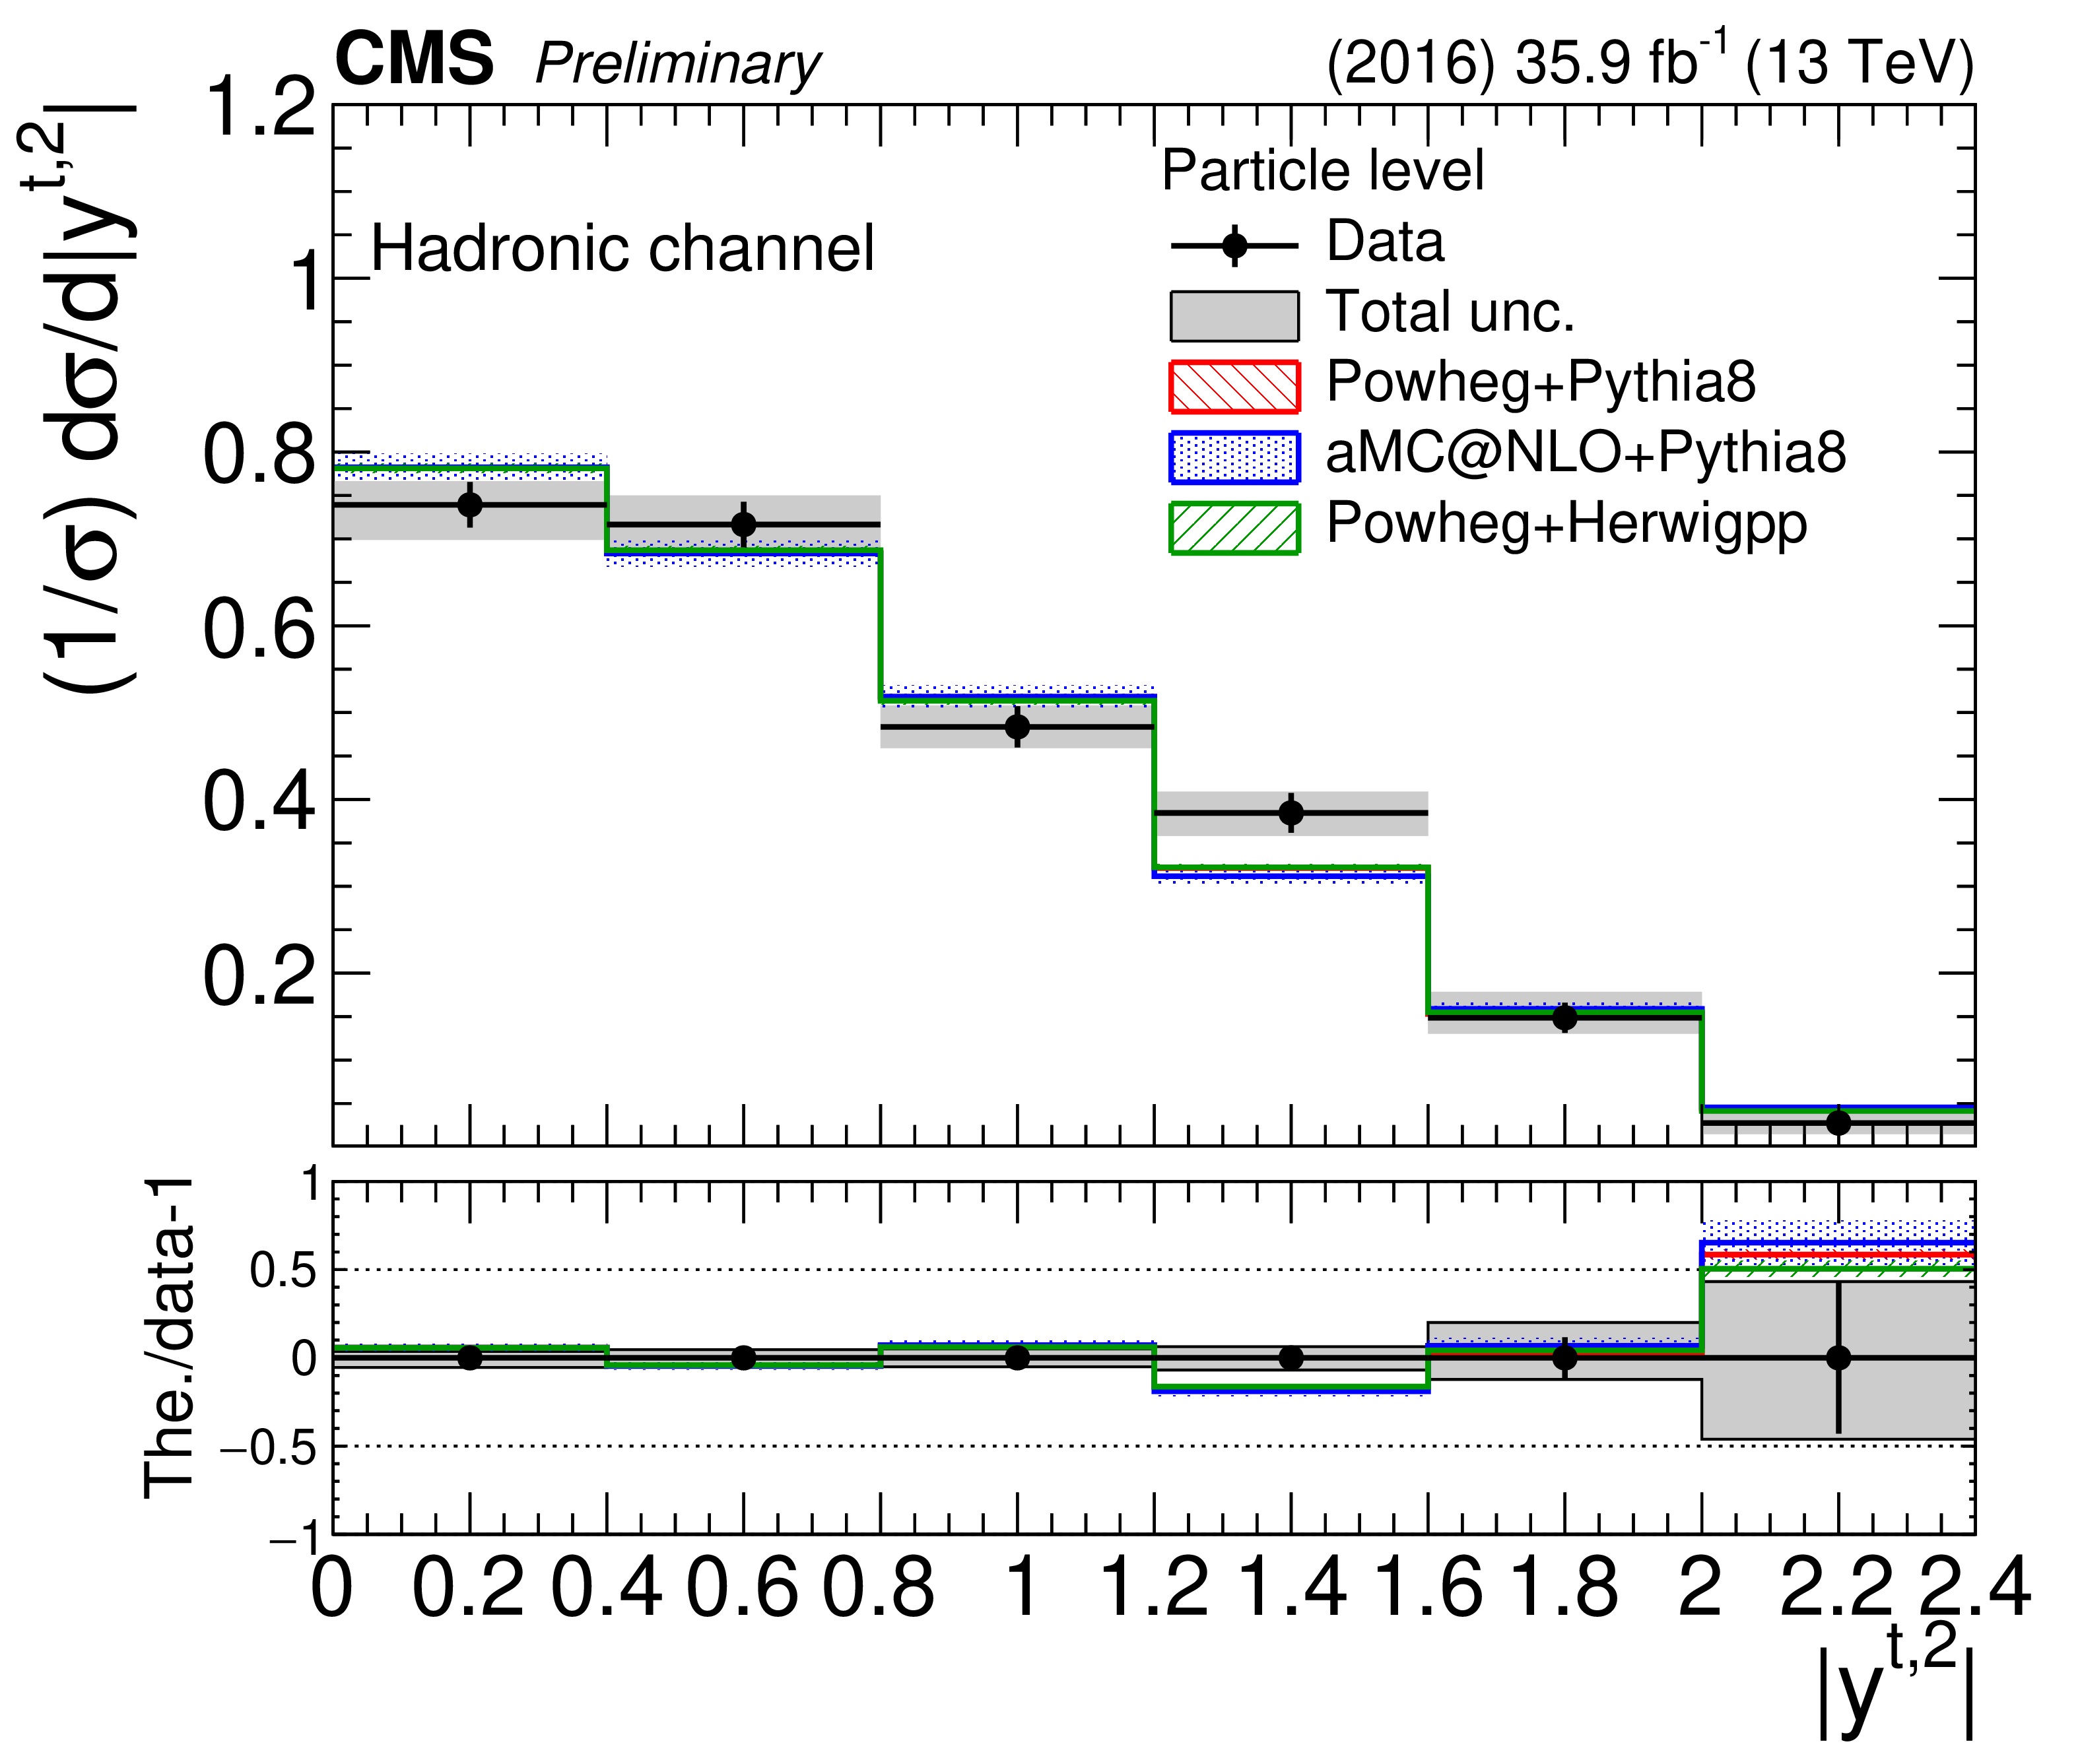
Figure 17:
Differential cross section unfolded to the particle level, absolute (left) and normalized (right), as a function of the second top quark $|y|$ in the hadronic channel. The bottom panel shows the ratio (theory $-$ data)/data. The uncertainties on the data markers are statistical, while the grey band shows the total statistical and systematic uncertainty. |
png pdf |
Figure 17-a:
Differential cross section unfolded to the particle level, absolute (left) and normalized (right), as a function of the second top quark $|y|$ in the hadronic channel. The bottom panel shows the ratio (theory $-$ data)/data. The uncertainties on the data markers are statistical, while the grey band shows the total statistical and systematic uncertainty. |
png pdf |
Figure 17-b:
Differential cross section unfolded to the particle level, absolute (left) and normalized (right), as a function of the second top quark $|y|$ in the hadronic channel. The bottom panel shows the ratio (theory $-$ data)/data. The uncertainties on the data markers are statistical, while the grey band shows the total statistical and systematic uncertainty. |

png pdf |
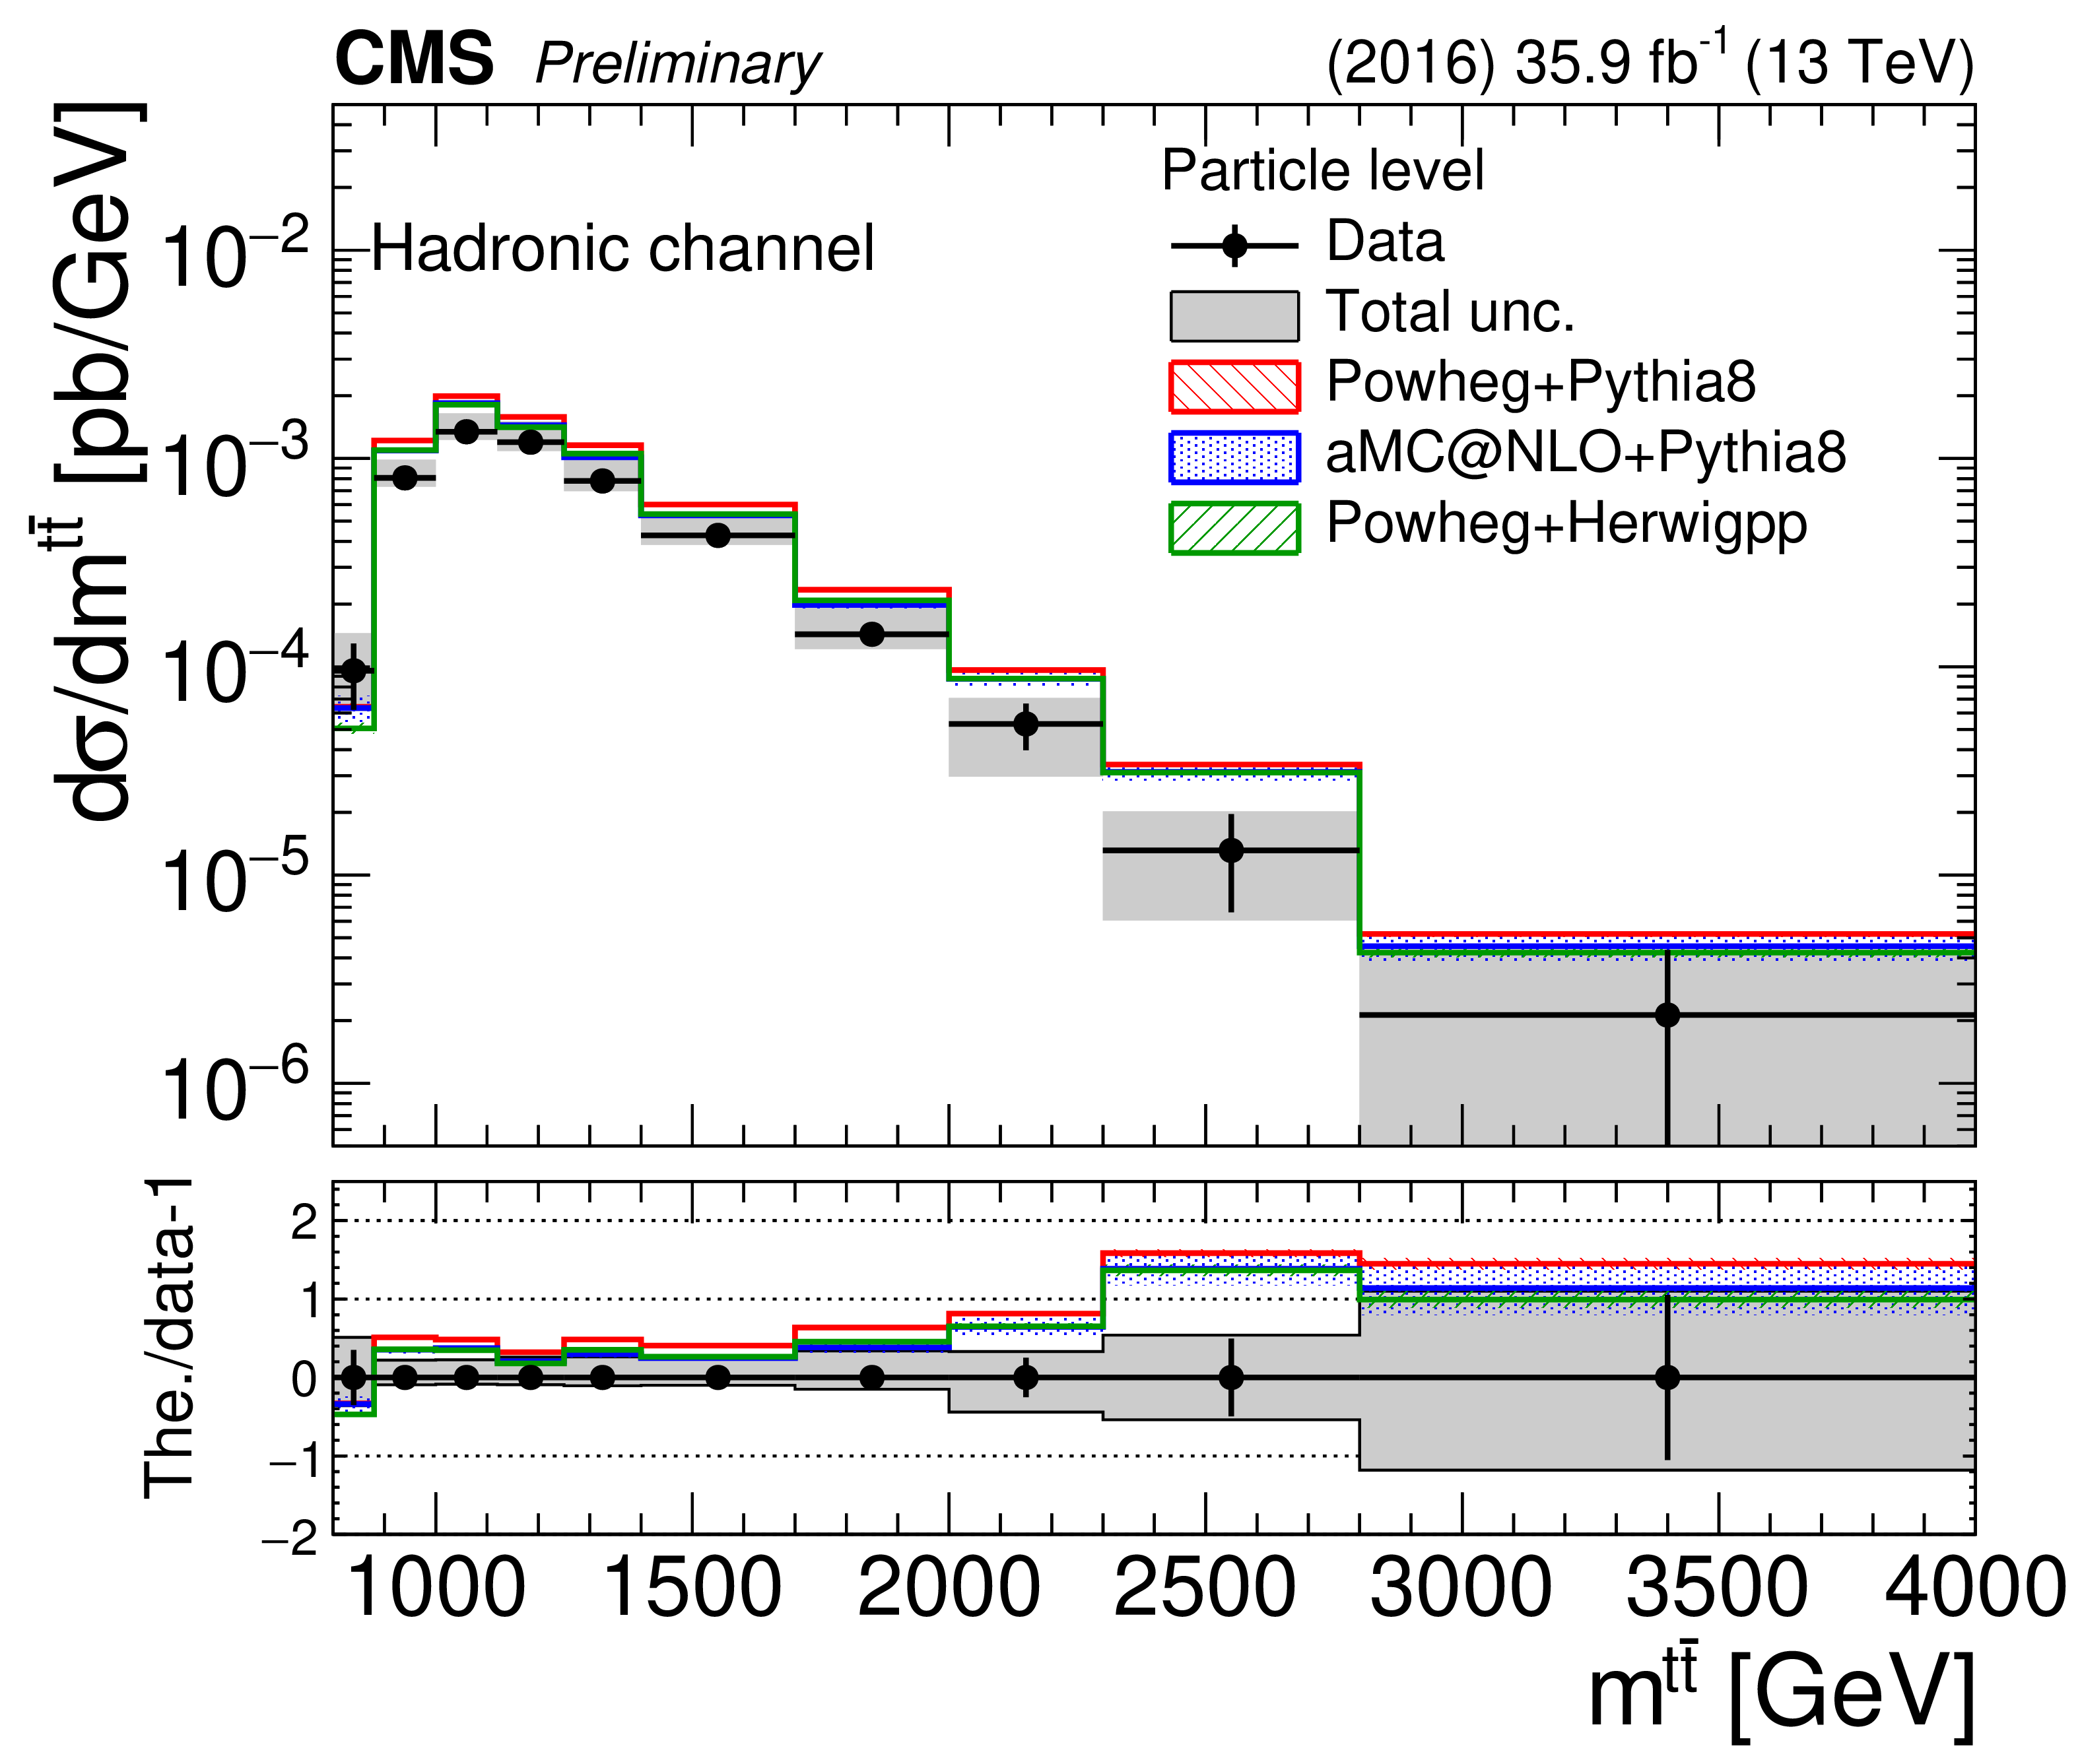
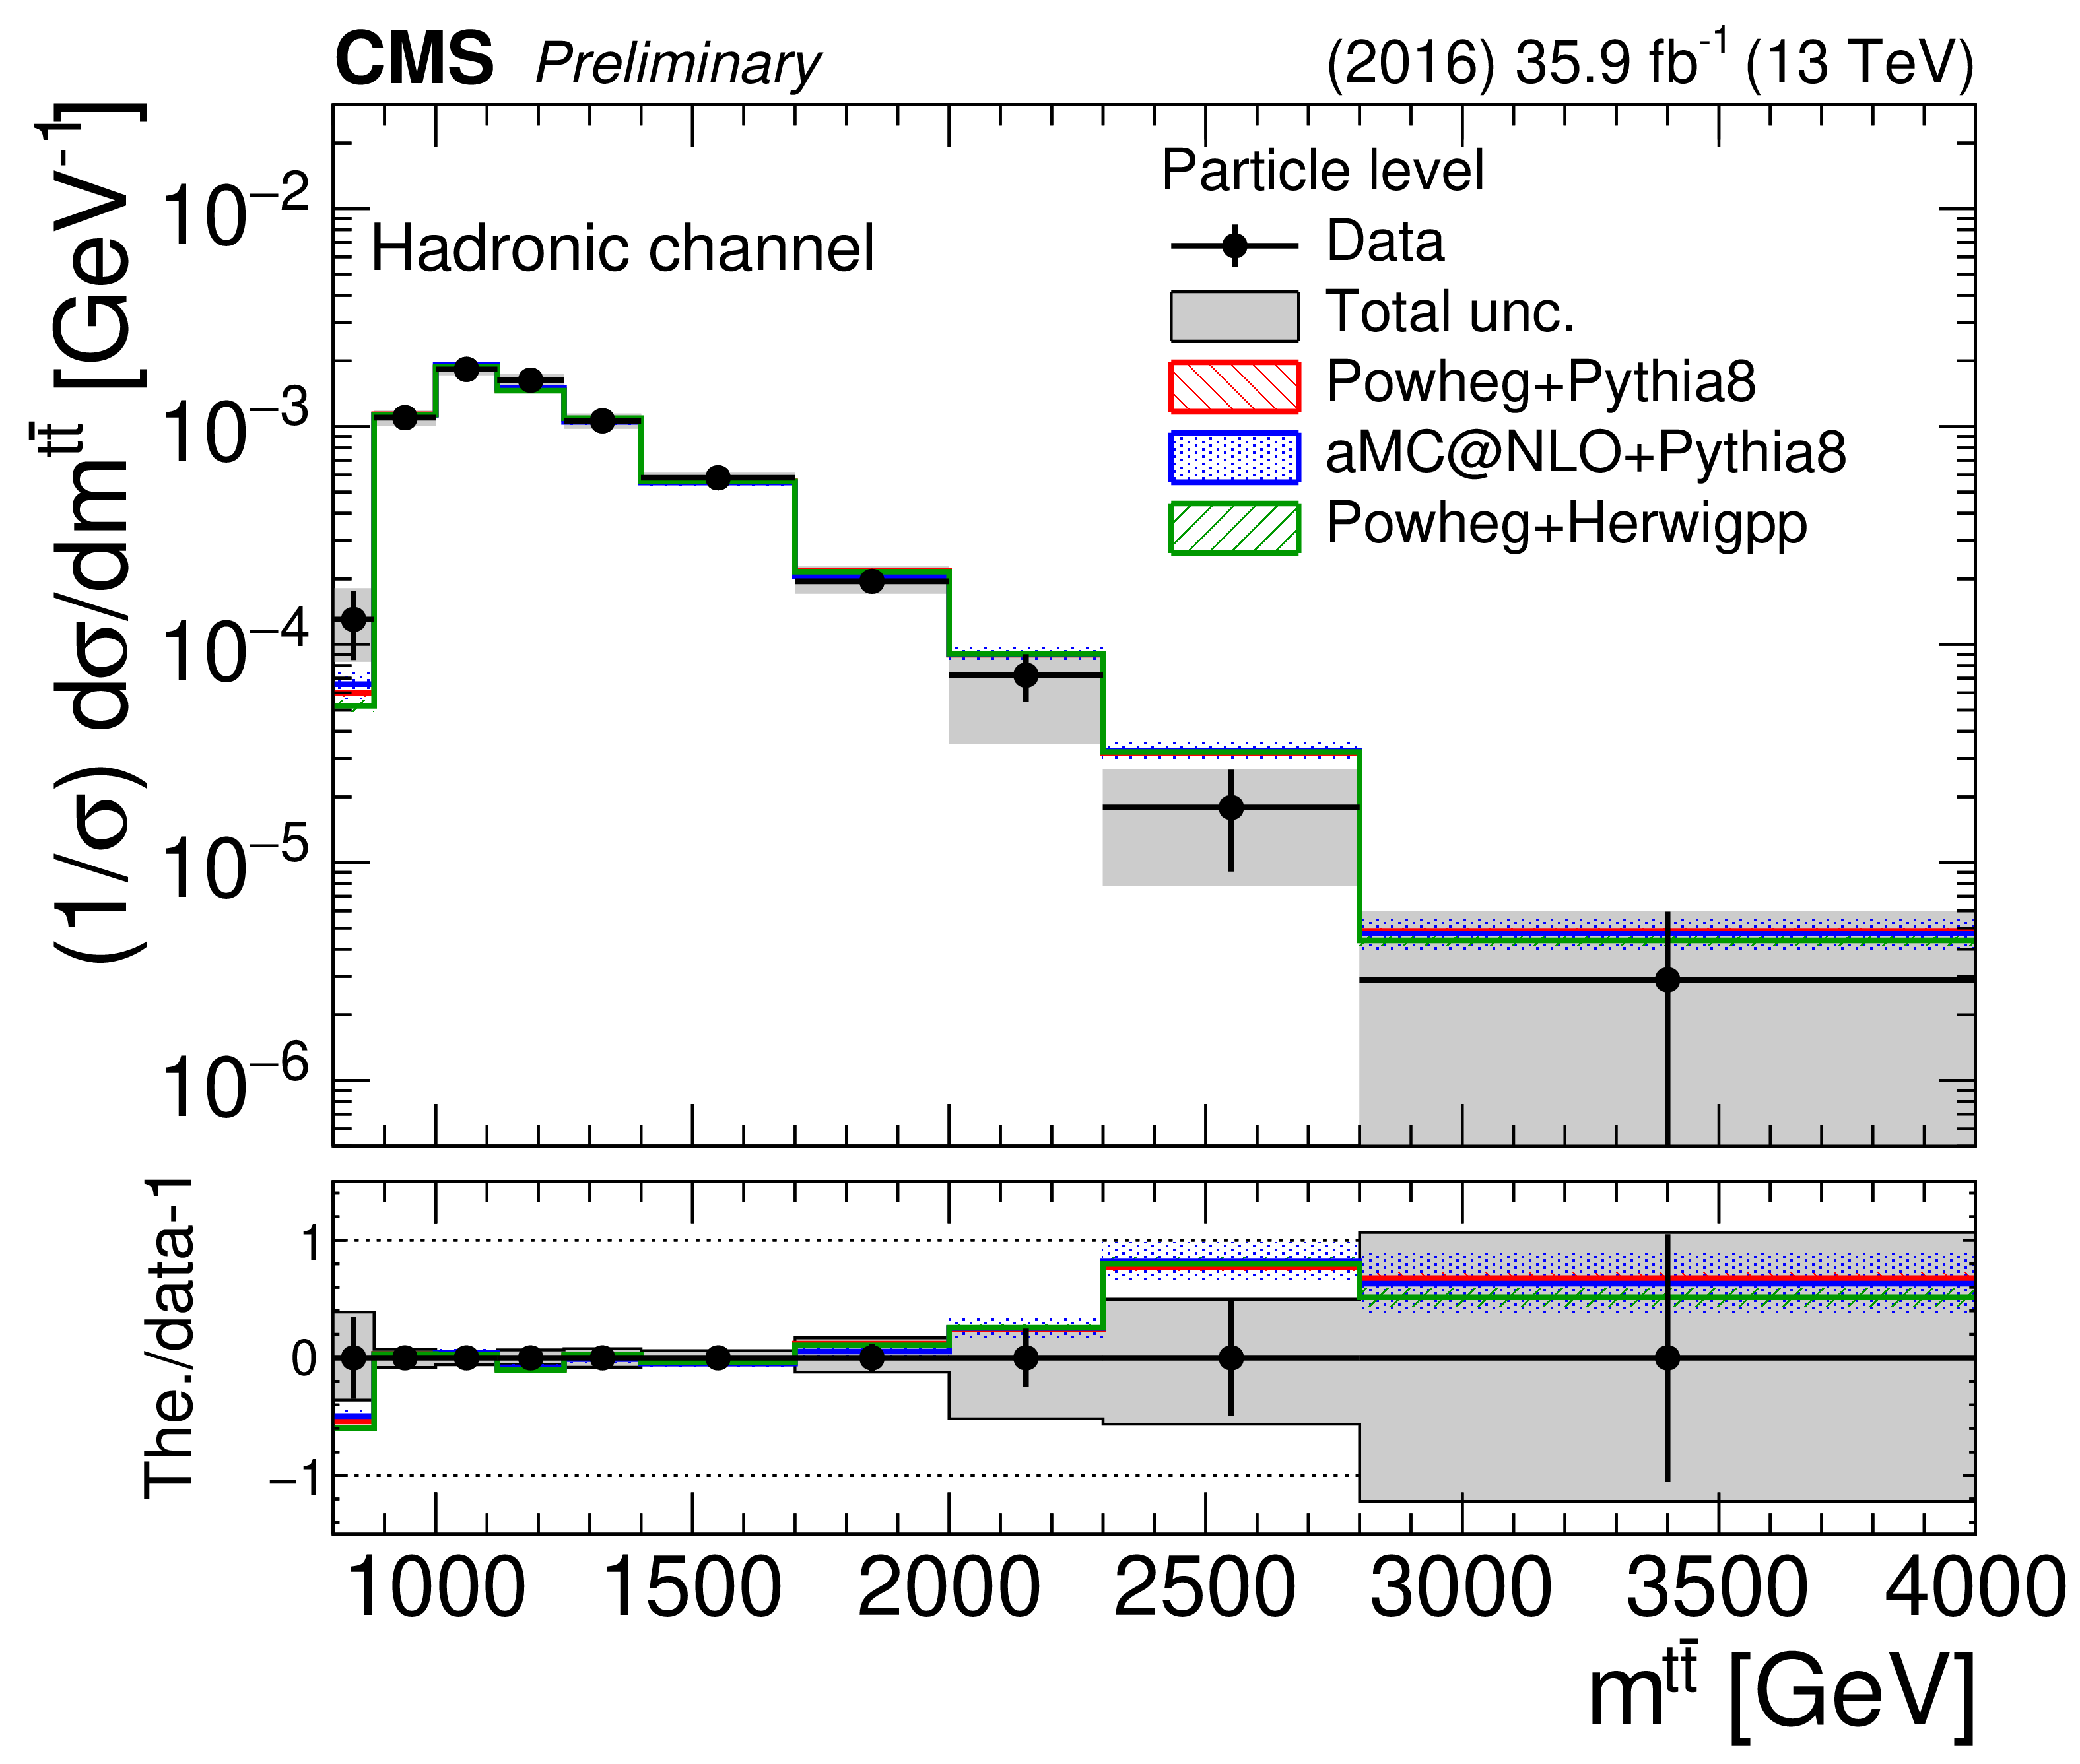
Figure 18:
Differential cross section unfolded to the particle level, absolute (left) and normalized (right), as a function of $m^{{\mathrm{t\bar{t}}}}$ in the hadronic channel. The bottom panel shows the ratio (theory $-$ data)/data. The uncertainties on the data markers are statistical, while the grey band shows the total statistical and systematic uncertainty. |
png pdf |
Figure 18-a:
Differential cross section unfolded to the particle level, absolute (left) and normalized (right), as a function of $m^{{\mathrm{t\bar{t}}}}$ in the hadronic channel. The bottom panel shows the ratio (theory $-$ data)/data. The uncertainties on the data markers are statistical, while the grey band shows the total statistical and systematic uncertainty. |
png pdf |
Figure 18-b:
Differential cross section unfolded to the particle level, absolute (left) and normalized (right), as a function of $m^{{\mathrm{t\bar{t}}}}$ in the hadronic channel. The bottom panel shows the ratio (theory $-$ data)/data. The uncertainties on the data markers are statistical, while the grey band shows the total statistical and systematic uncertainty. |
png pdf |
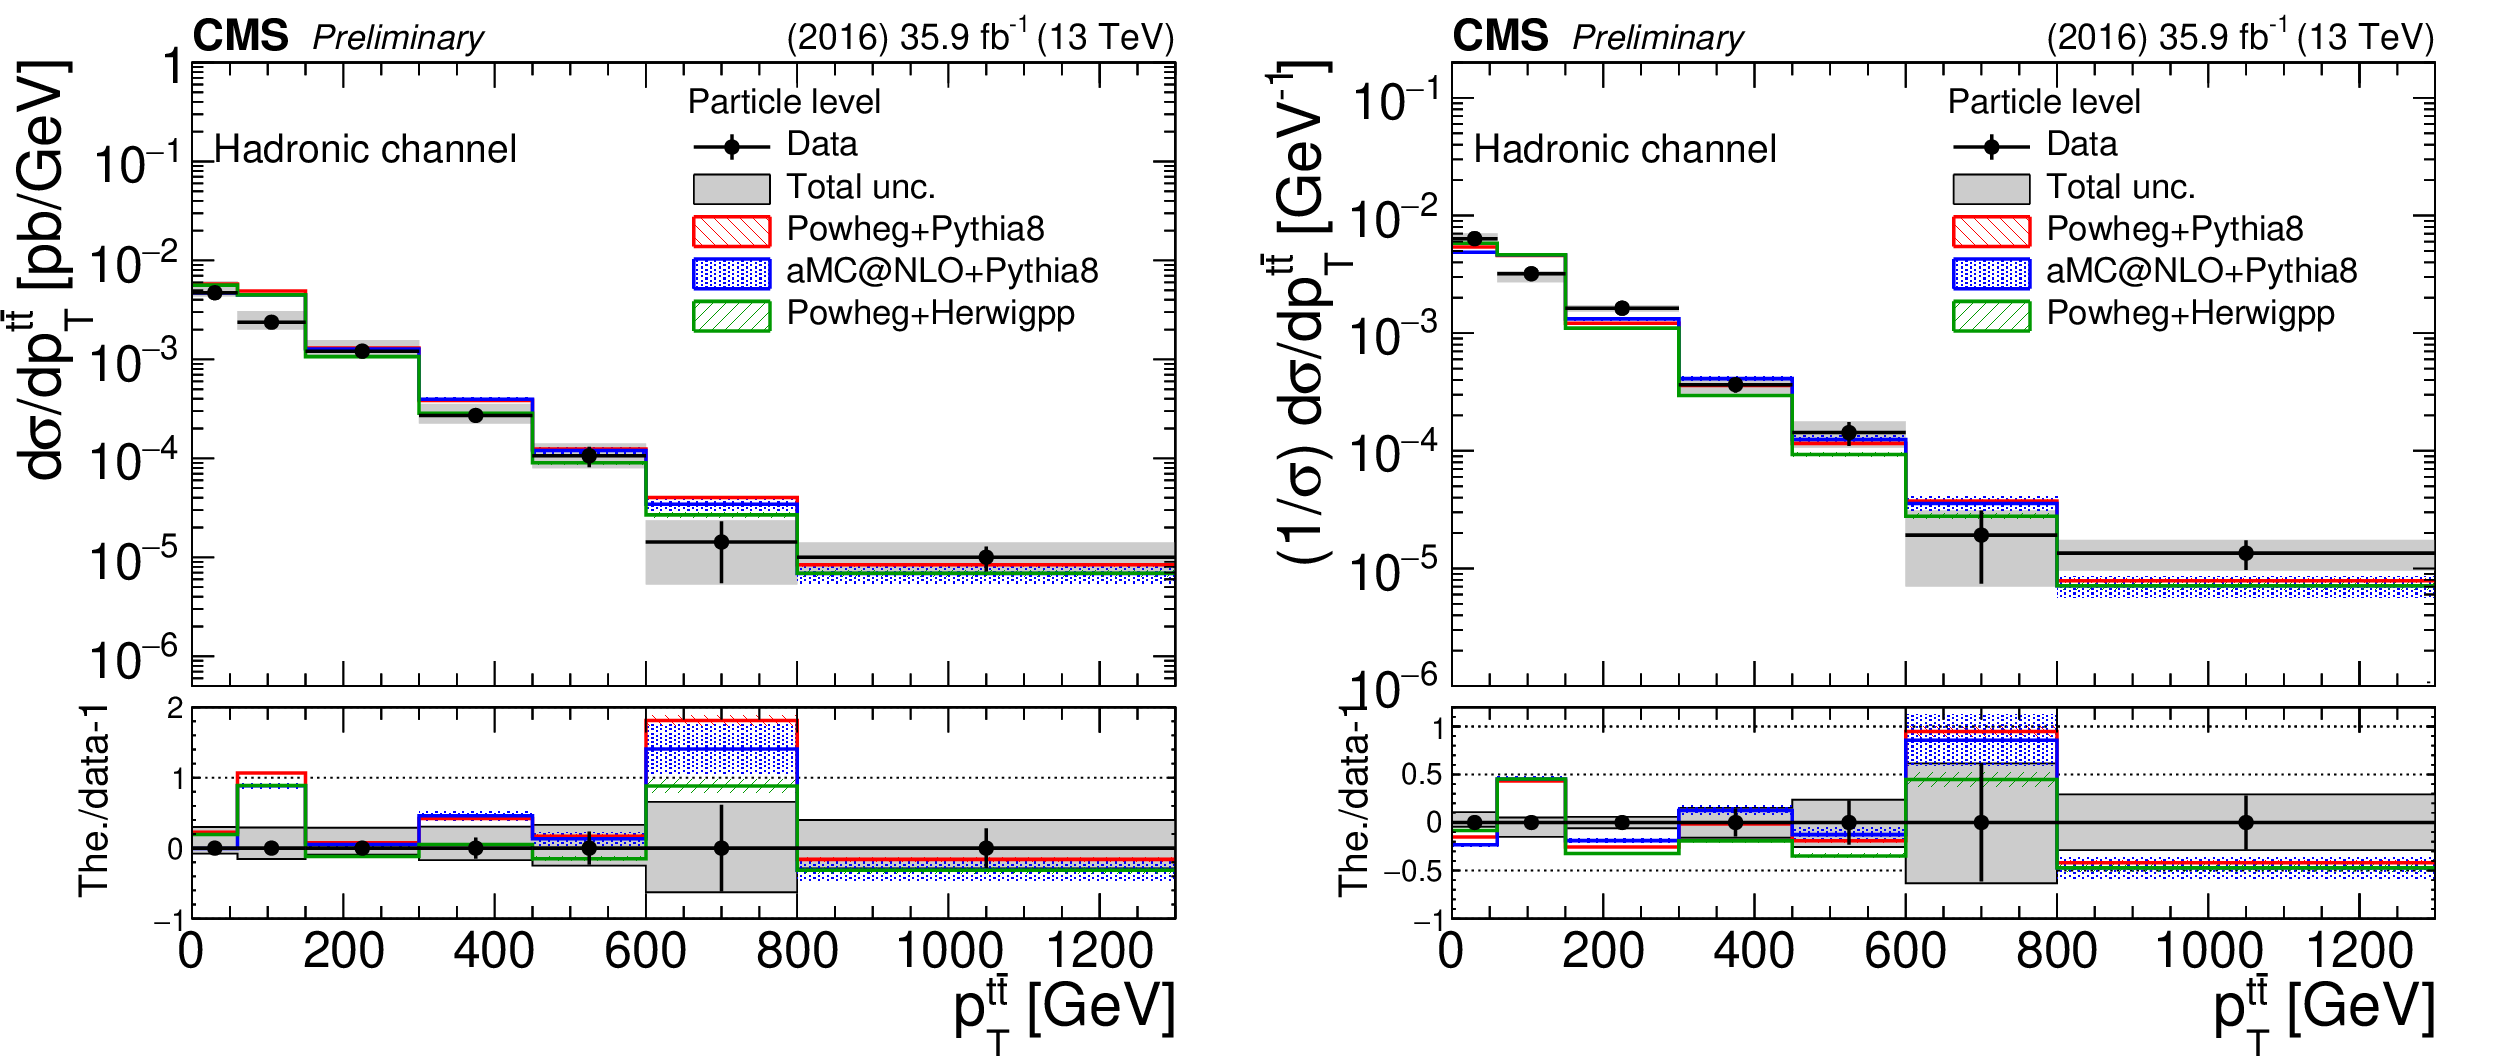
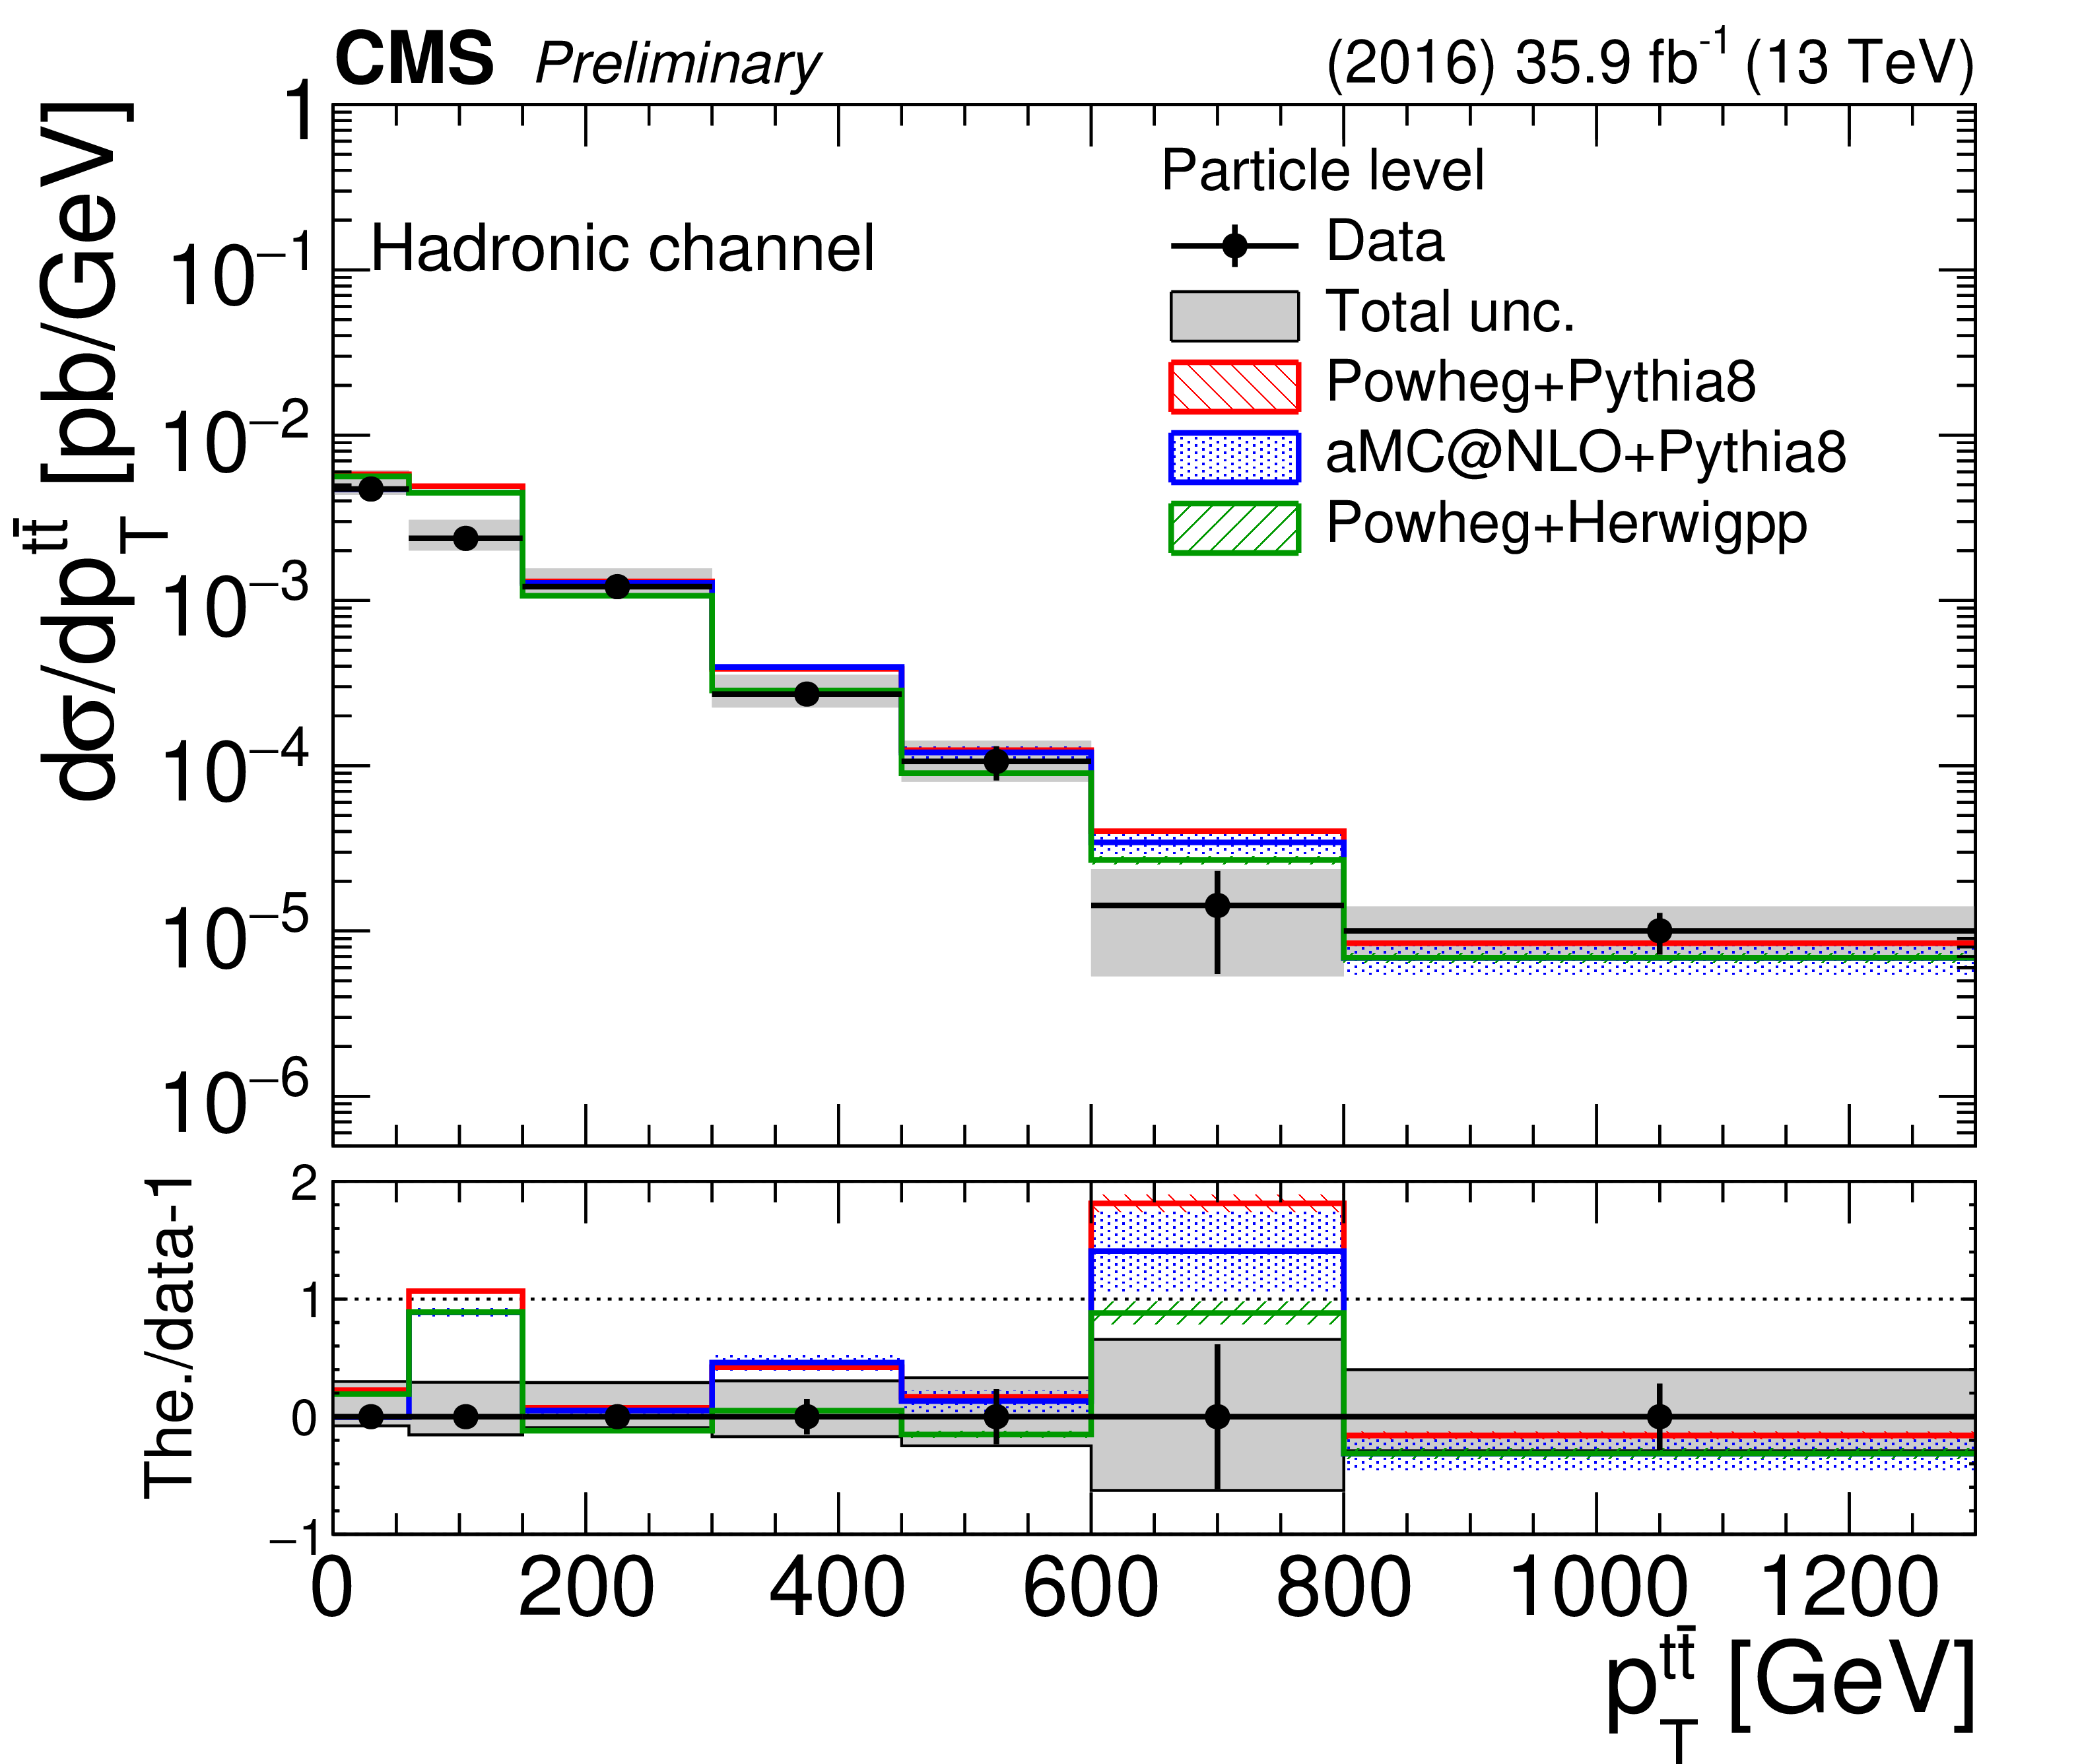
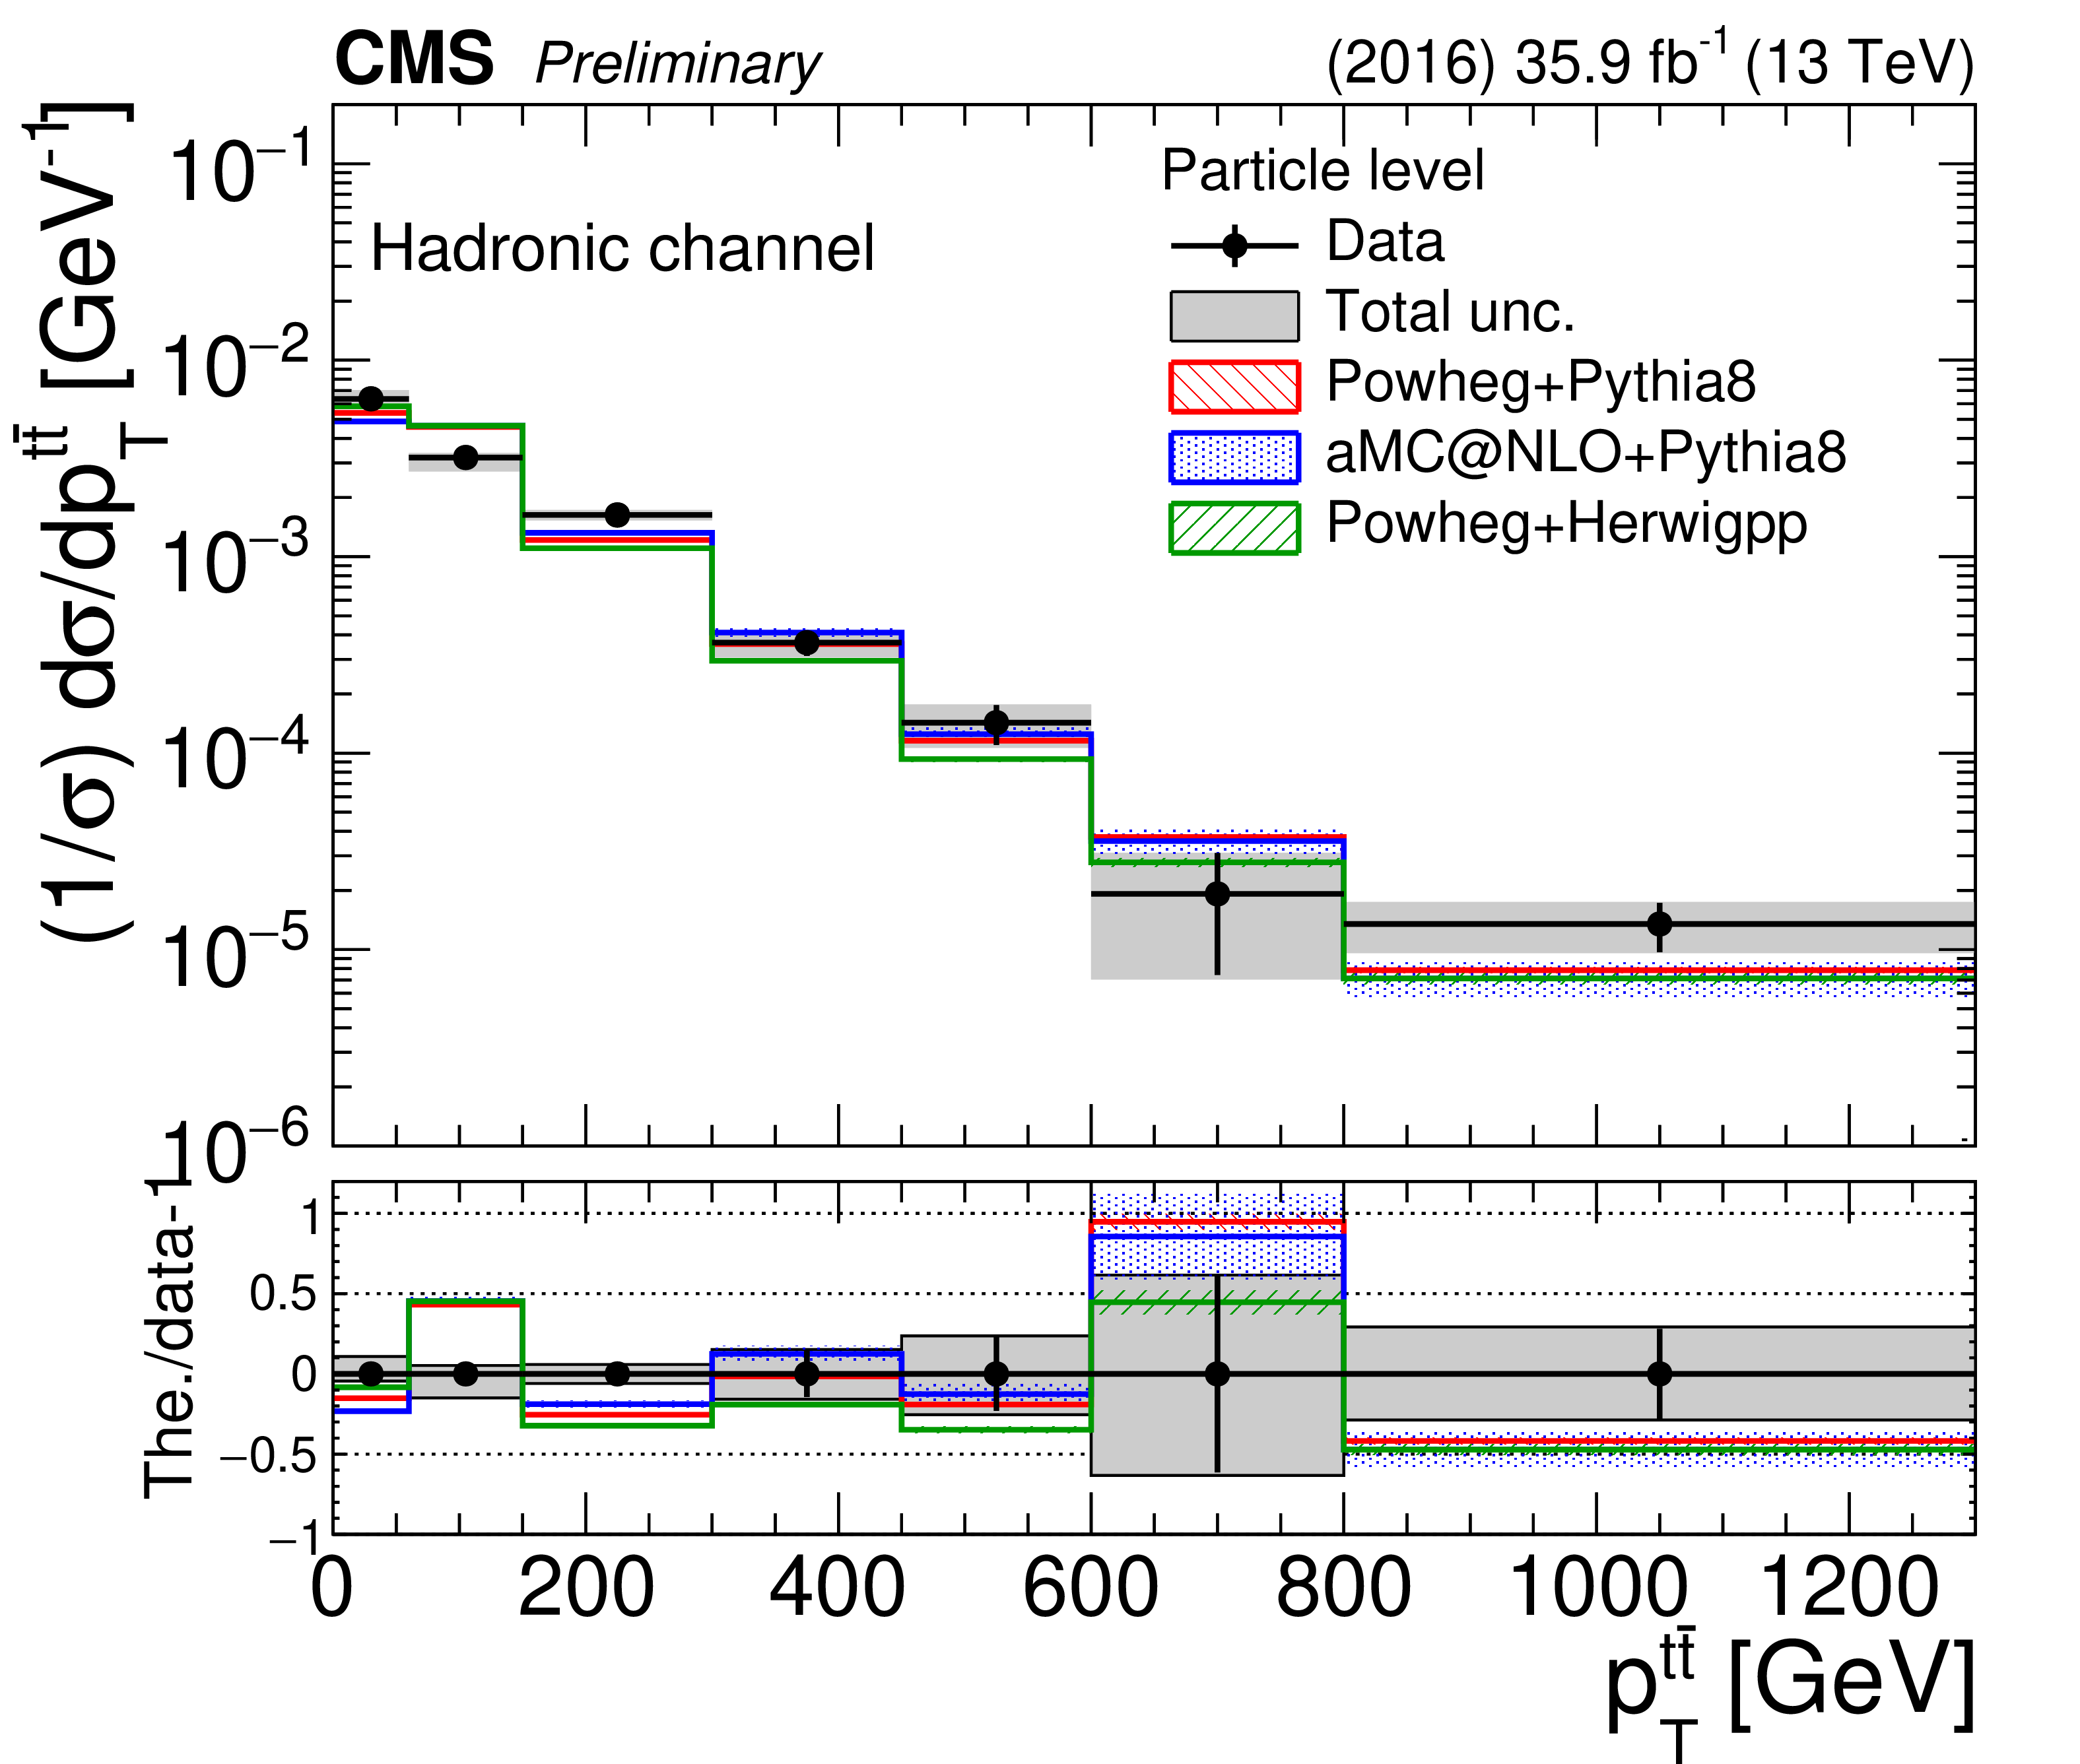
Figure 19:
Differential cross section unfolded to the particle level, absolute (left) and normalized (right), as a function of $ {p_{\mathrm {T}}} ^{{\mathrm{t\bar{t}}}}$ in the hadronic channel. The bottom panel shows the ratio (theory $-$ data)/data. The uncertainties on the data markers are statistical, while the grey band shows the total statistical and systematic uncertainty. |
png pdf |
Figure 19-a:
Differential cross section unfolded to the particle level, absolute (left) and normalized (right), as a function of $ {p_{\mathrm {T}}} ^{{\mathrm{t\bar{t}}}}$ in the hadronic channel. The bottom panel shows the ratio (theory $-$ data)/data. The uncertainties on the data markers are statistical, while the grey band shows the total statistical and systematic uncertainty. |
png pdf |
Figure 19-b:
Differential cross section unfolded to the particle level, absolute (left) and normalized (right), as a function of $ {p_{\mathrm {T}}} ^{{\mathrm{t\bar{t}}}}$ in the hadronic channel. The bottom panel shows the ratio (theory $-$ data)/data. The uncertainties on the data markers are statistical, while the grey band shows the total statistical and systematic uncertainty. |
png pdf |
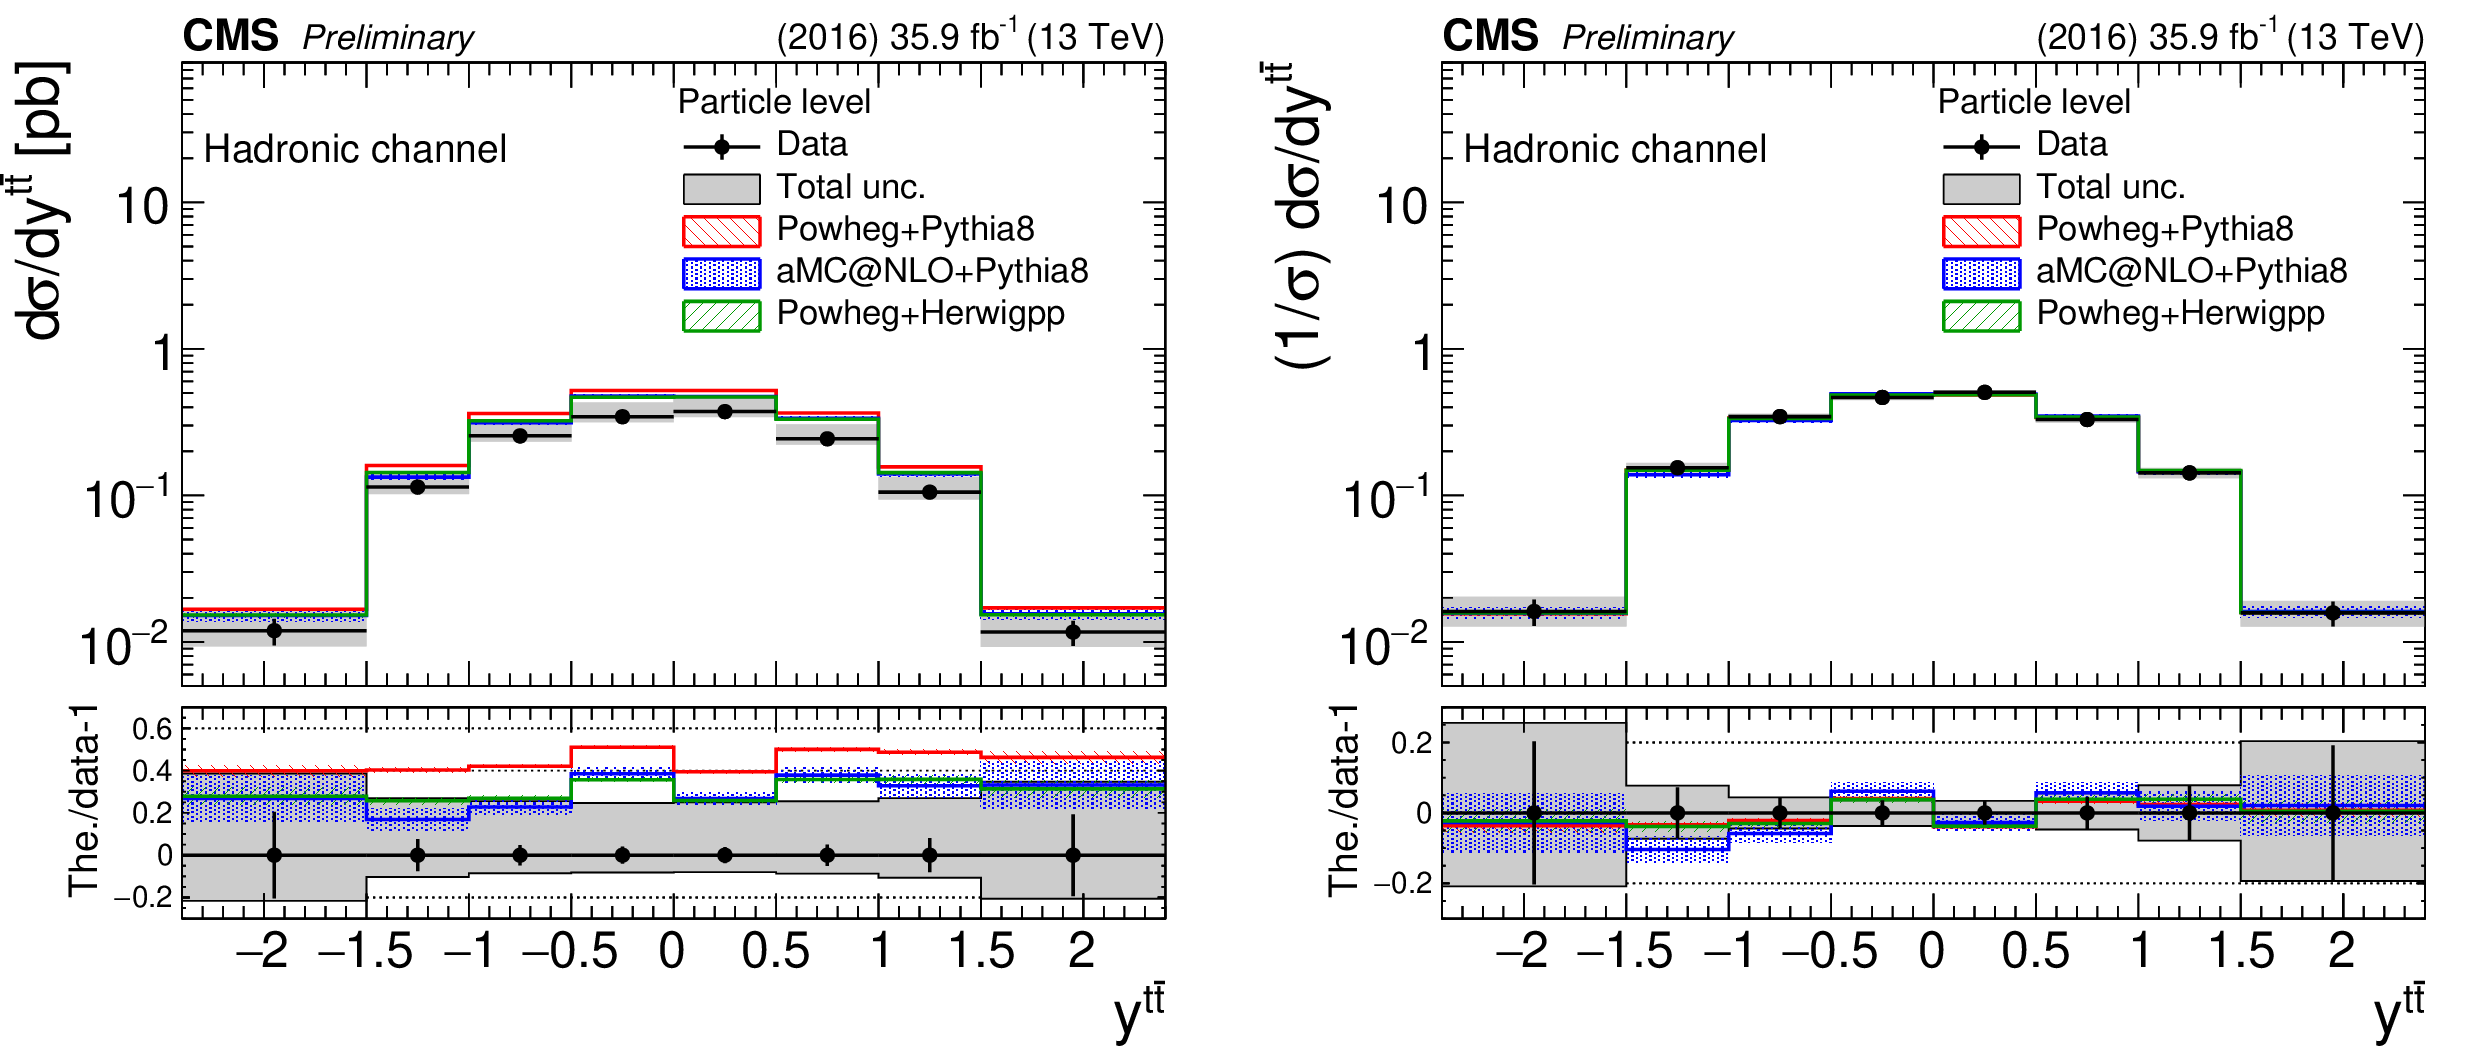
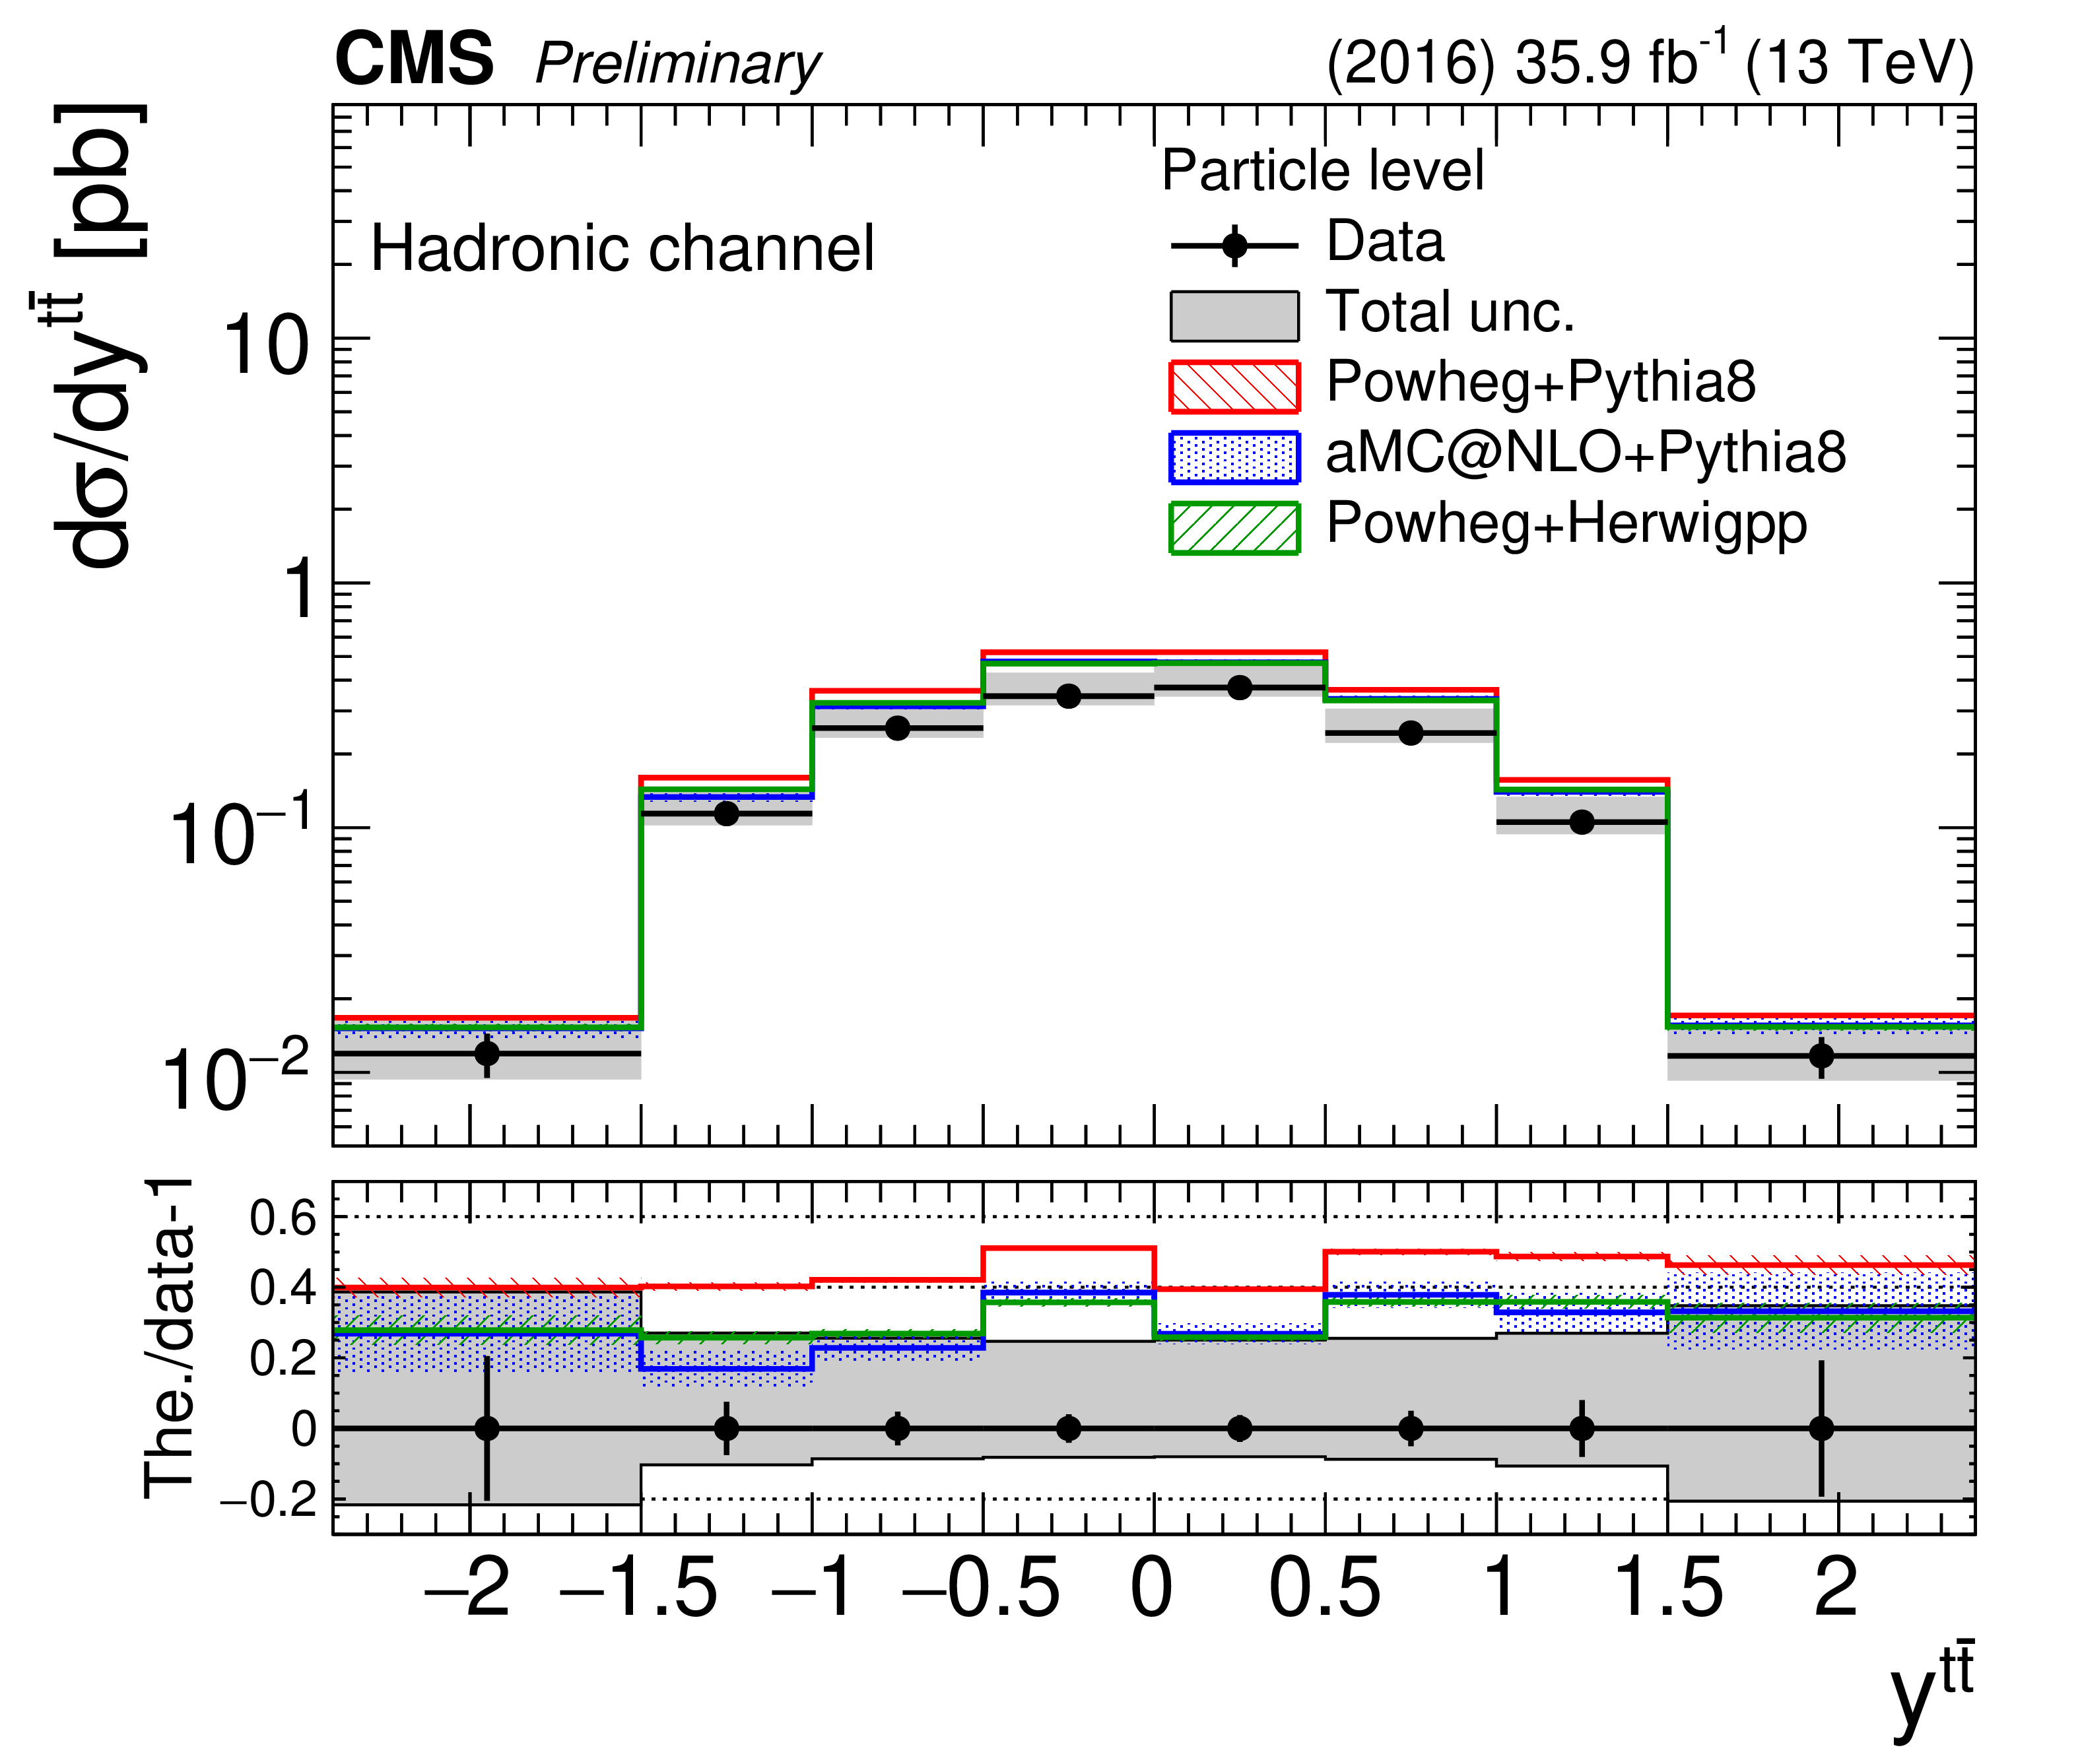
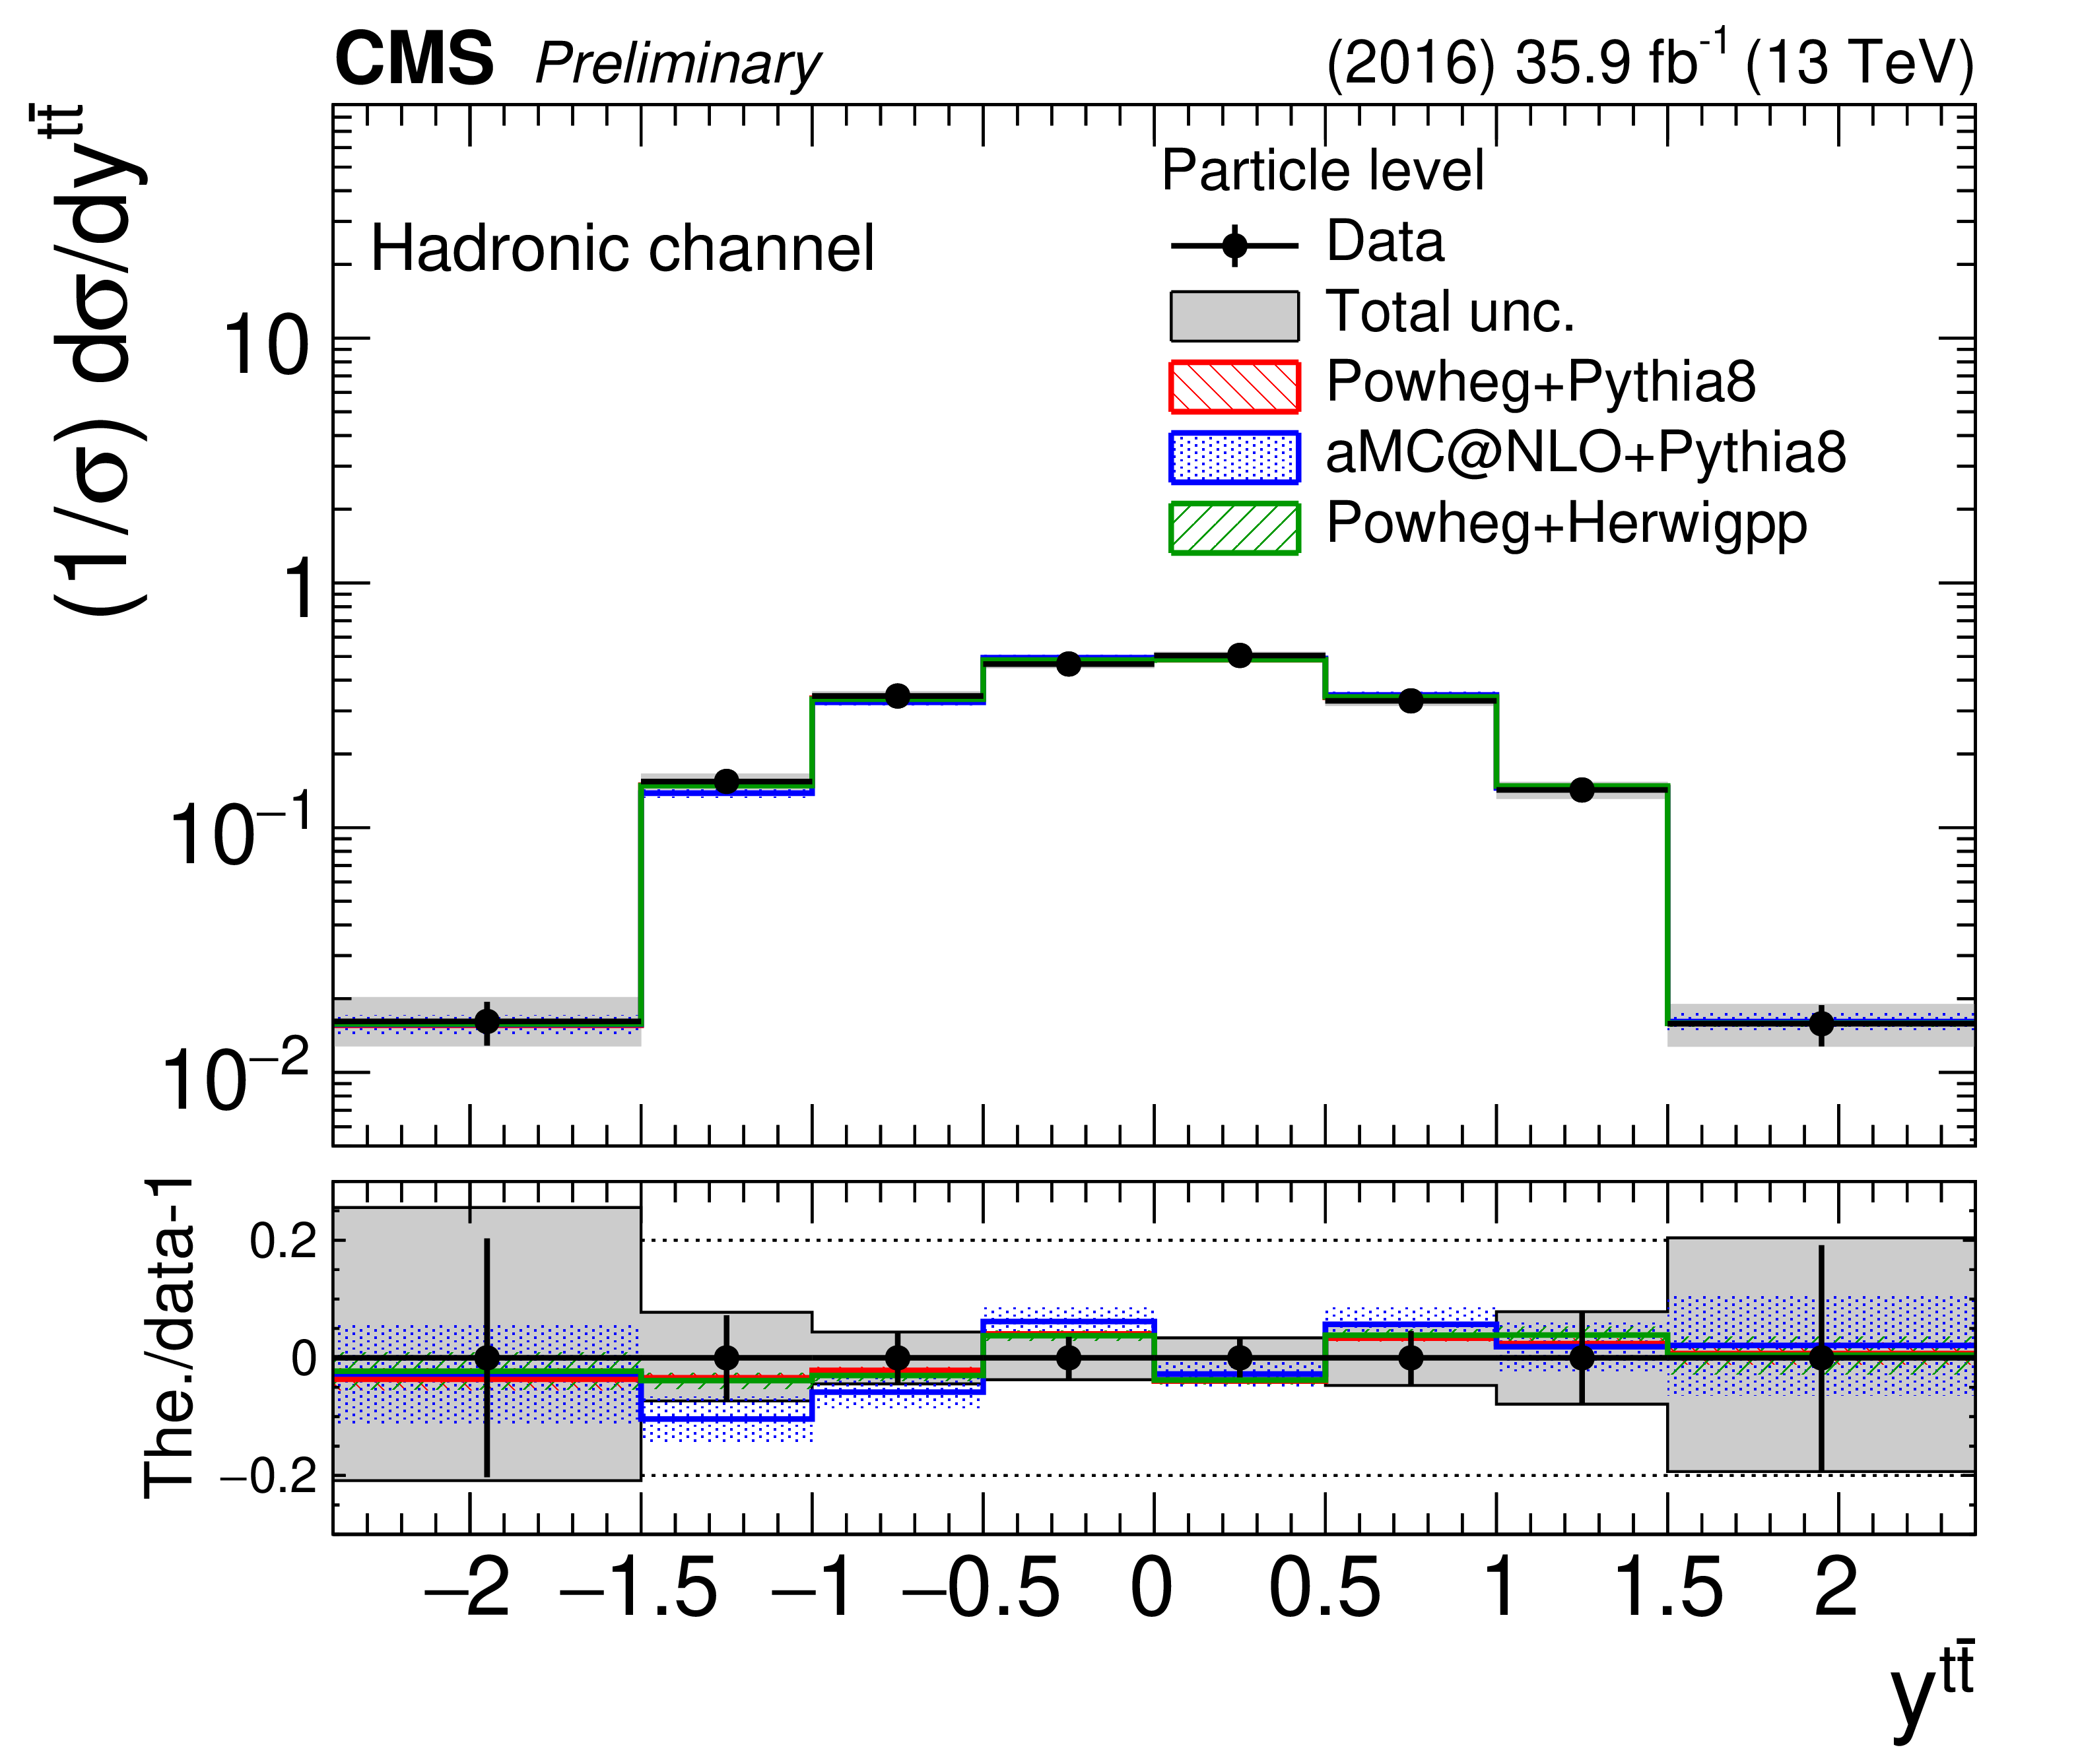
Figure 20:
Differential cross section unfolded to the particle level, absolute (left) and normalized (right), as a function of $y^{{\mathrm{t\bar{t}}}}$ in the hadronic channel. The bottom panel shows the ratio (theory $-$ data)/data. The uncertainties on the data markers are statistical, while the grey band shows the total statistical and systematic uncertainty. |
png pdf |
Figure 20-a:
Differential cross section unfolded to the particle level, absolute (left) and normalized (right), as a function of $y^{{\mathrm{t\bar{t}}}}$ in the hadronic channel. The bottom panel shows the ratio (theory $-$ data)/data. The uncertainties on the data markers are statistical, while the grey band shows the total statistical and systematic uncertainty. |
png pdf |
Figure 20-b:
Differential cross section unfolded to the particle level, absolute (left) and normalized (right), as a function of $y^{{\mathrm{t\bar{t}}}}$ in the hadronic channel. The bottom panel shows the ratio (theory $-$ data)/data. The uncertainties on the data markers are statistical, while the grey band shows the total statistical and systematic uncertainty. |
png pdf |
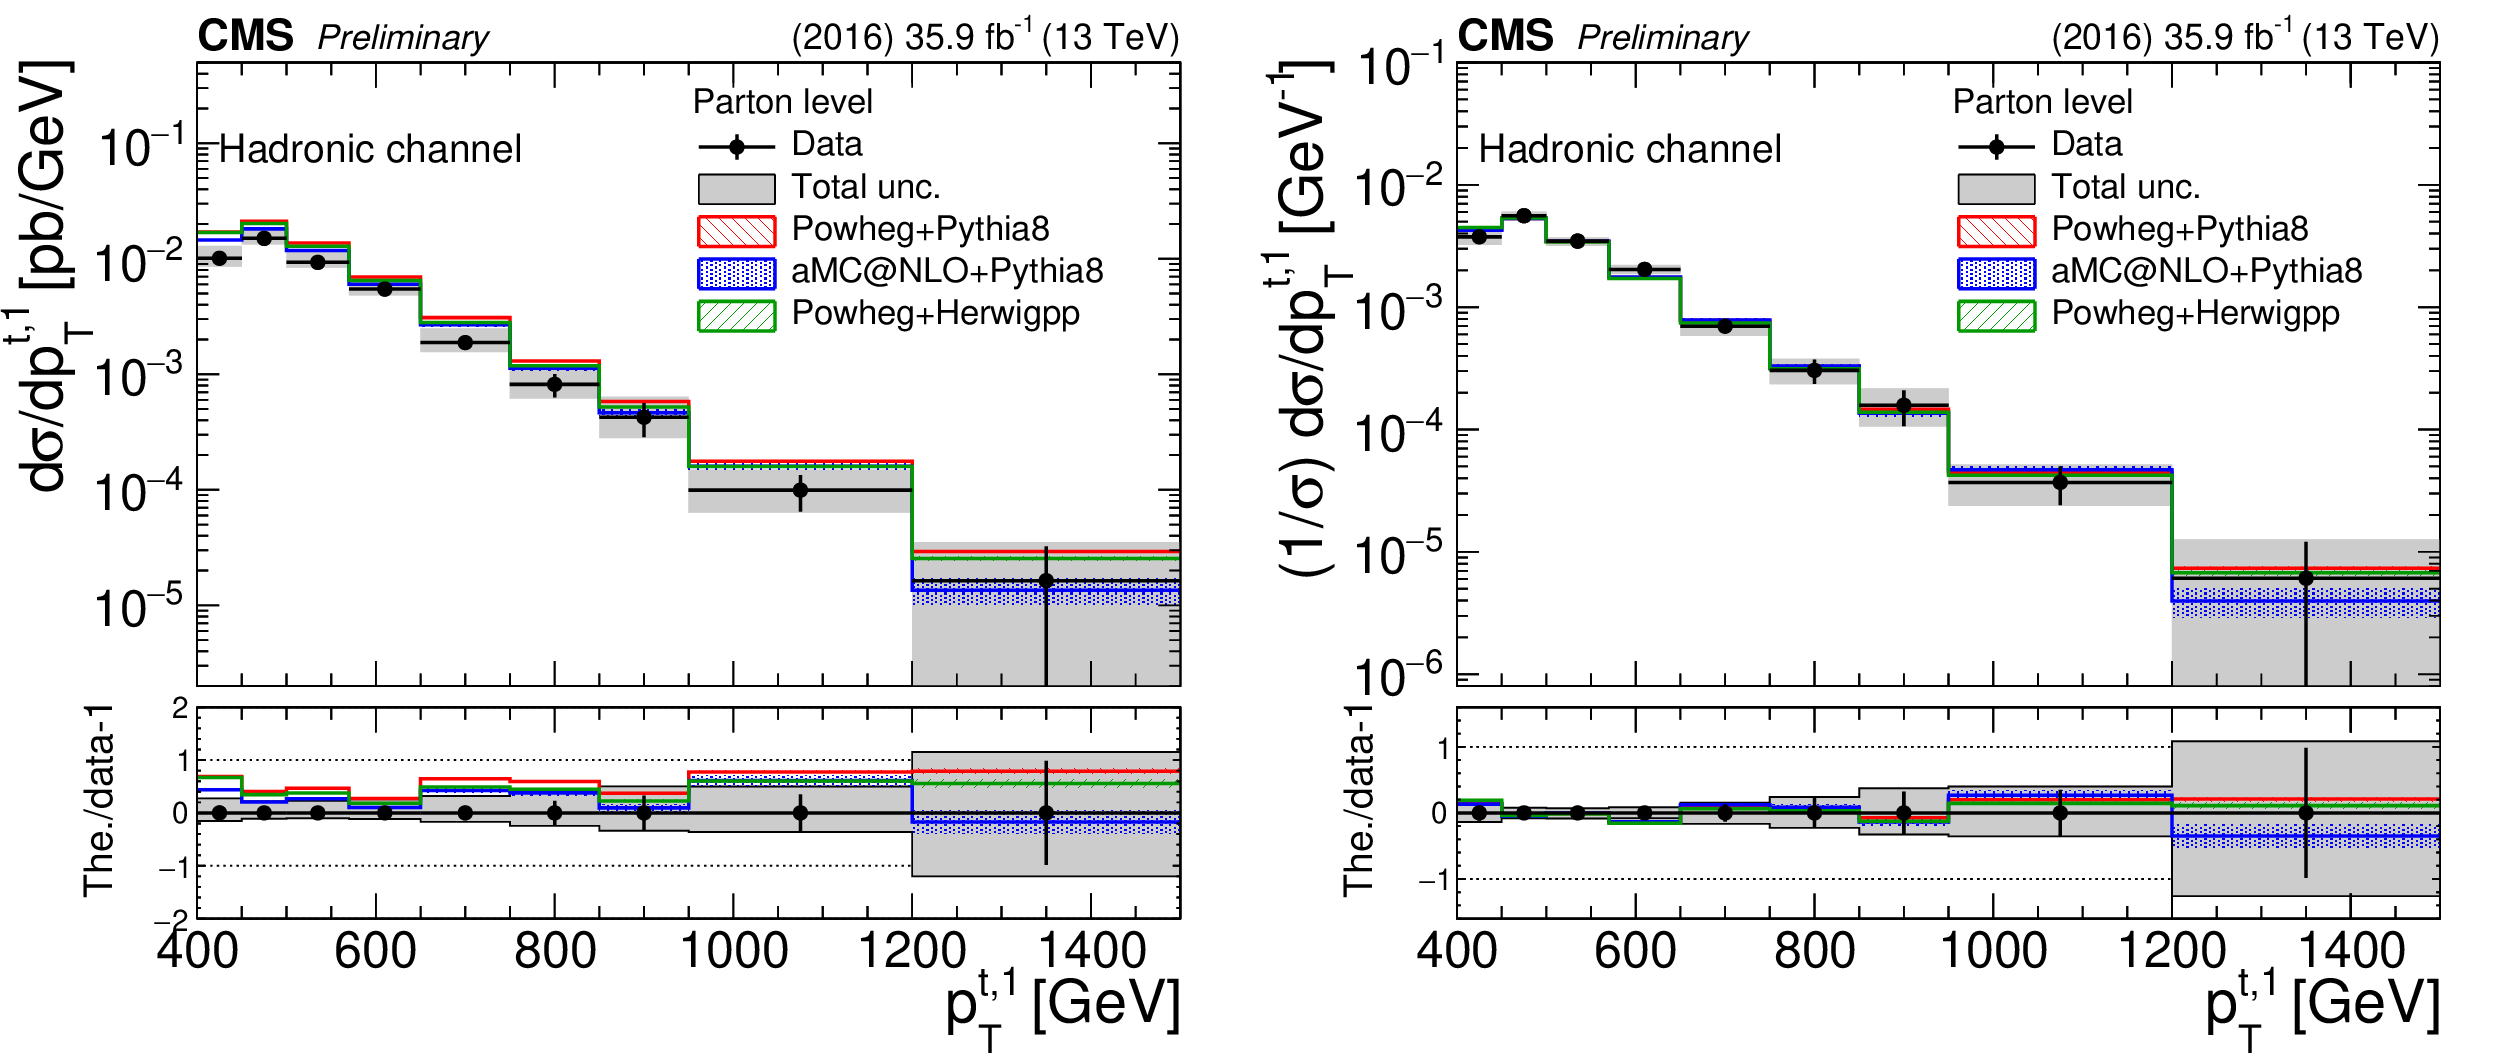
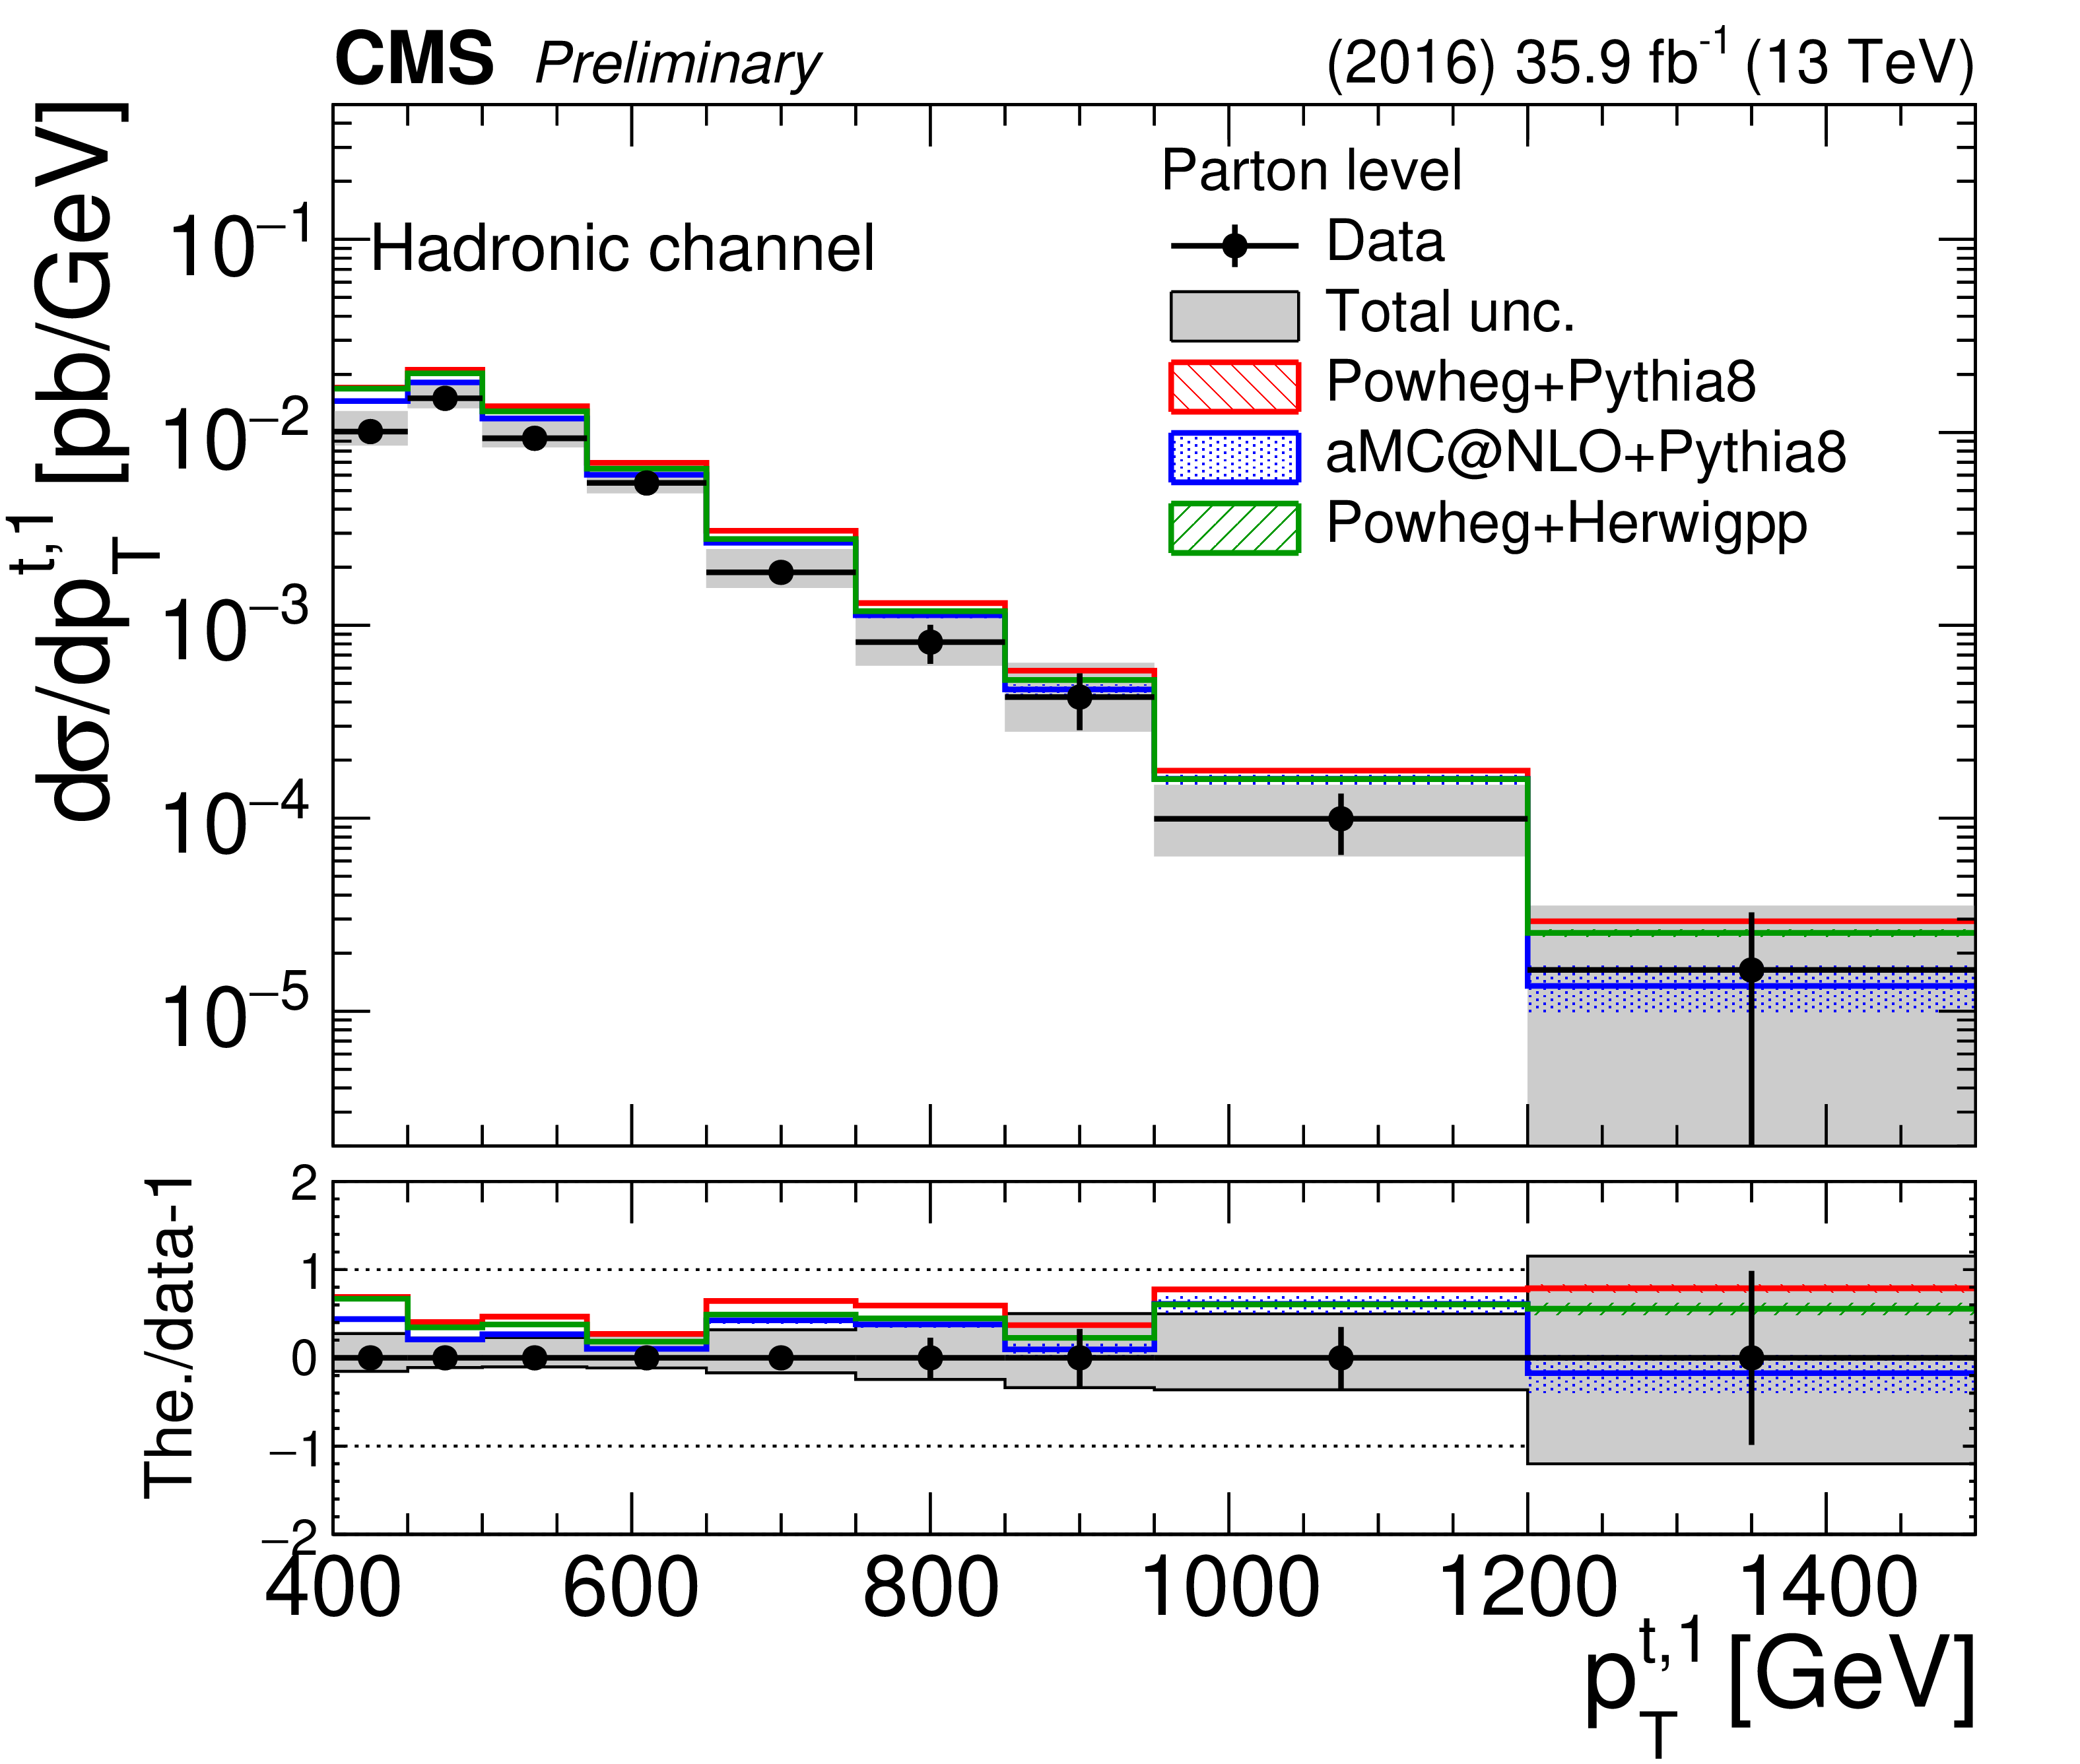
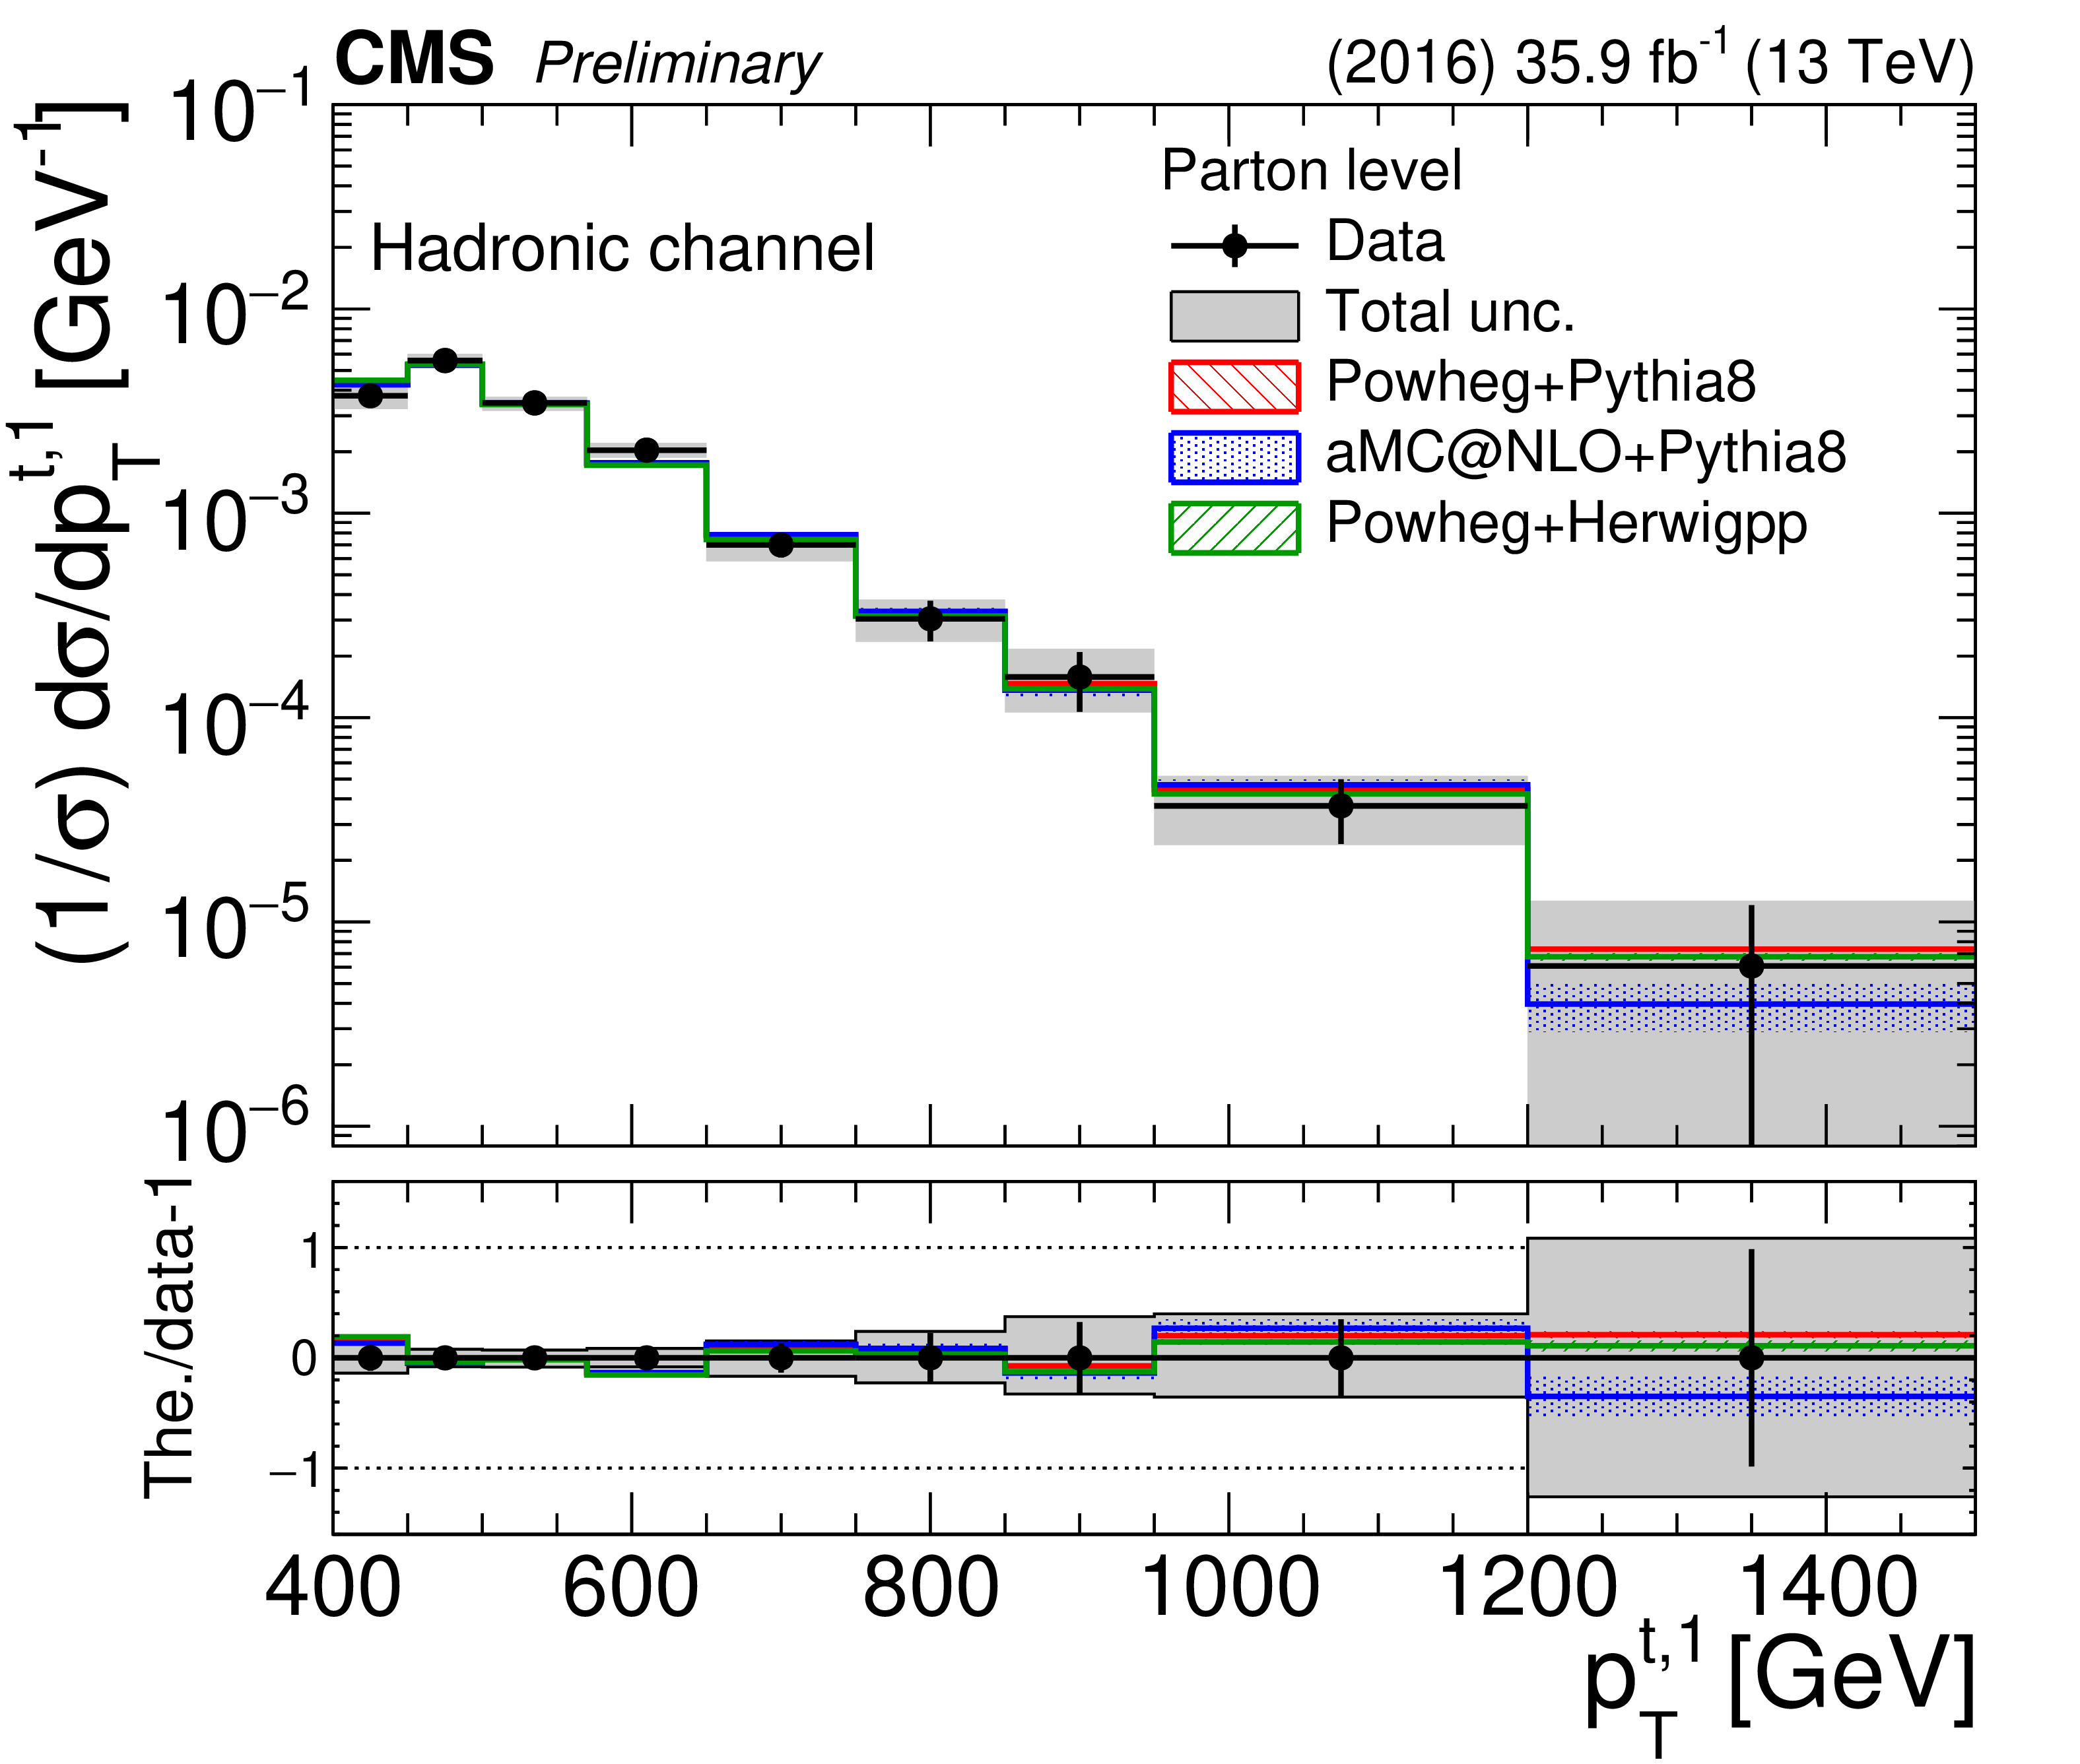
Figure 21:
Differential cross section unfolded to the parton level, absolute (left) and normalized (right), as a function of the leading top quark ${p_{\mathrm {T}}}$ in the hadronic channel. The bottom panel shows the ratio (theory $-$ data)/data. The uncertainties on the data markers are statistical, while the grey band shows the total statistical and systematic uncertainty. |
png pdf |
Figure 21-a:
Differential cross section unfolded to the parton level, absolute (left) and normalized (right), as a function of the leading top quark ${p_{\mathrm {T}}}$ in the hadronic channel. The bottom panel shows the ratio (theory $-$ data)/data. The uncertainties on the data markers are statistical, while the grey band shows the total statistical and systematic uncertainty. |
png pdf |
Figure 21-b:
Differential cross section unfolded to the parton level, absolute (left) and normalized (right), as a function of the leading top quark ${p_{\mathrm {T}}}$ in the hadronic channel. The bottom panel shows the ratio (theory $-$ data)/data. The uncertainties on the data markers are statistical, while the grey band shows the total statistical and systematic uncertainty. |
png pdf |
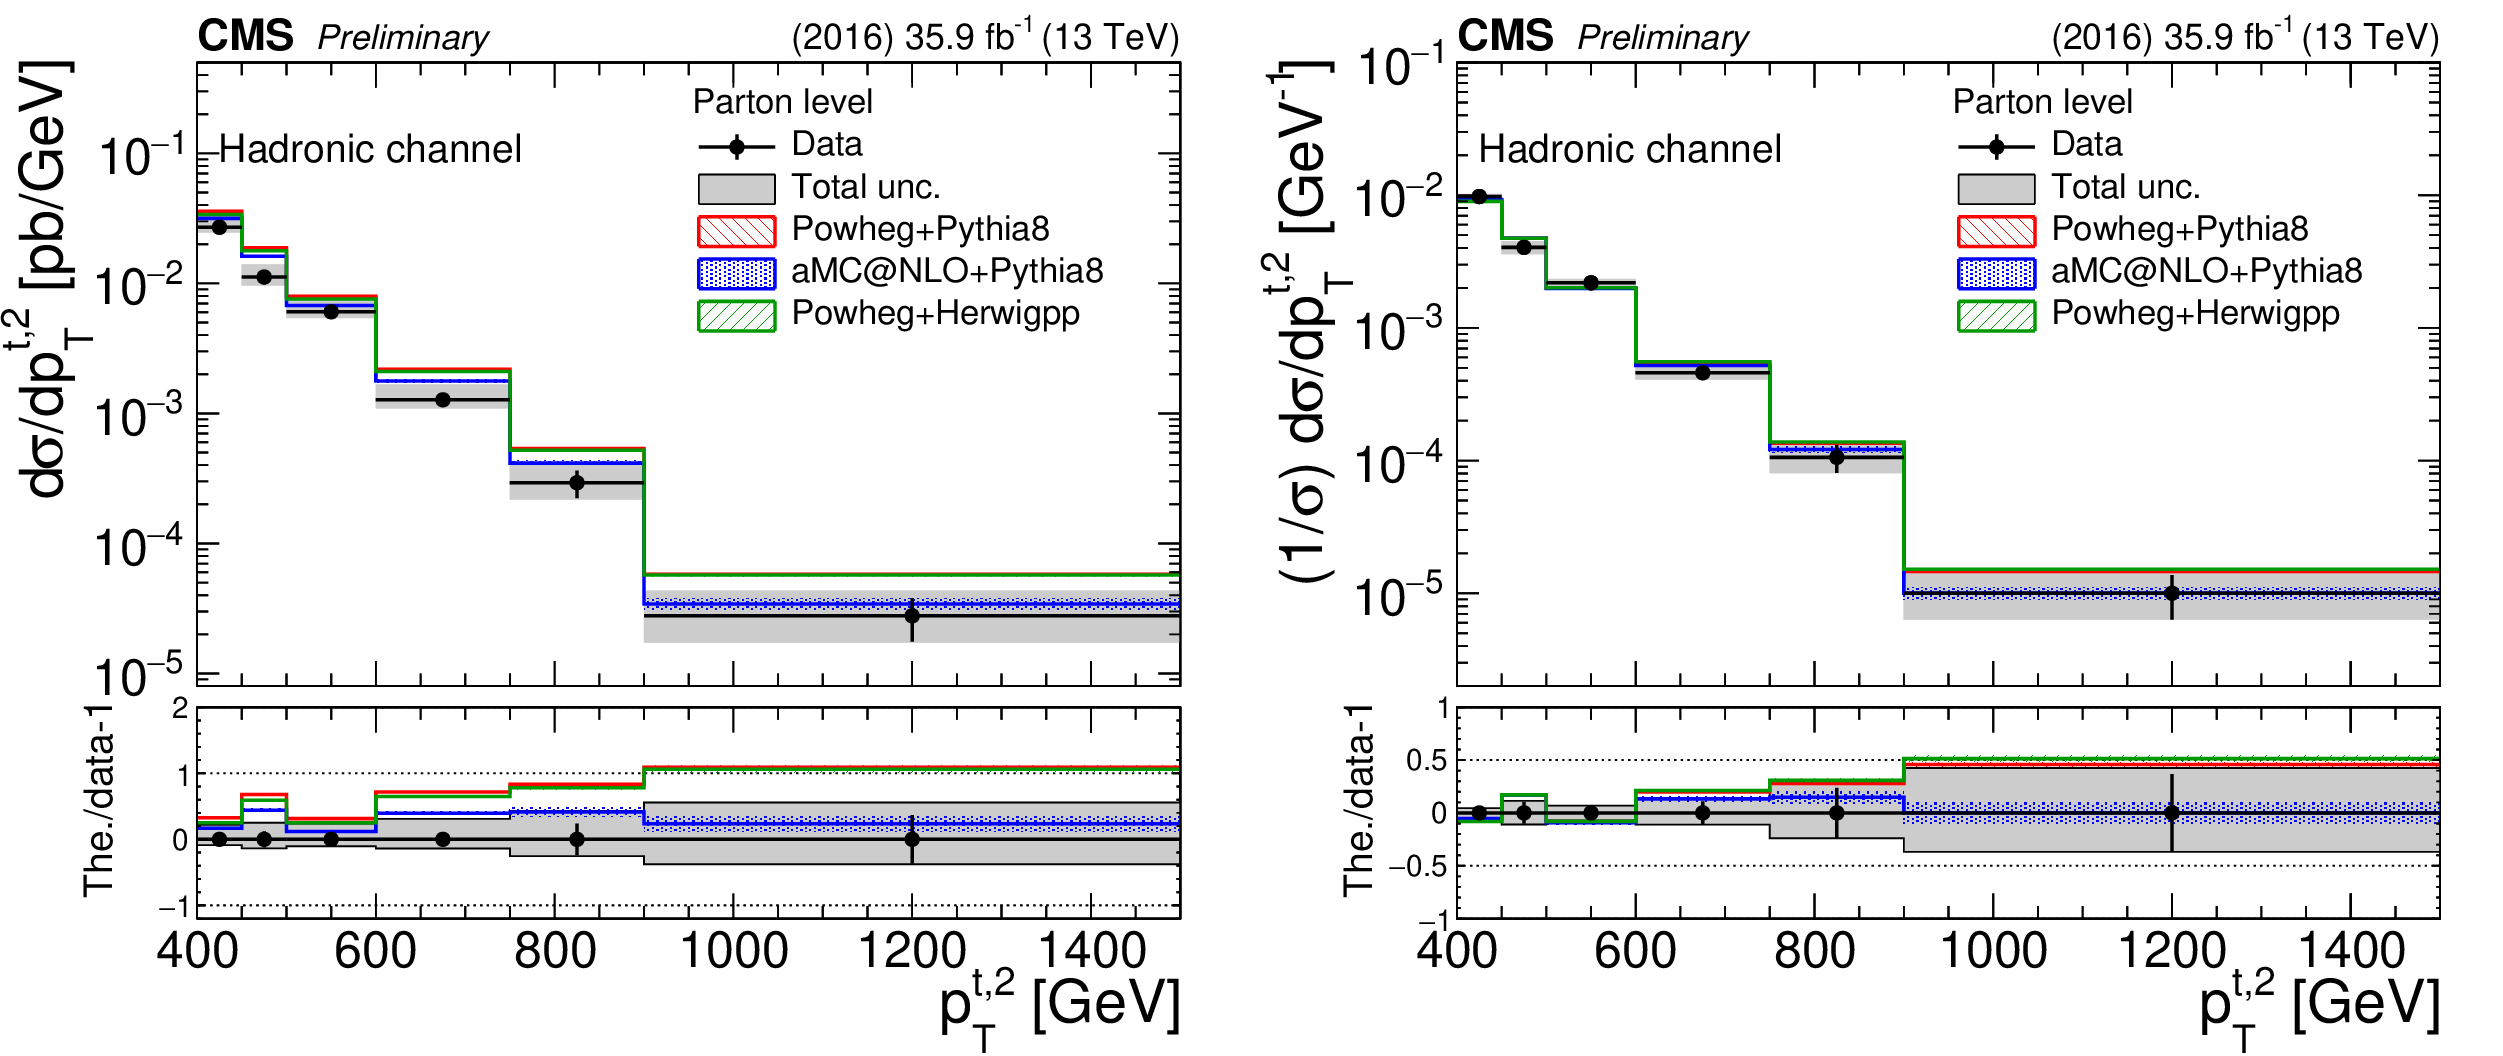
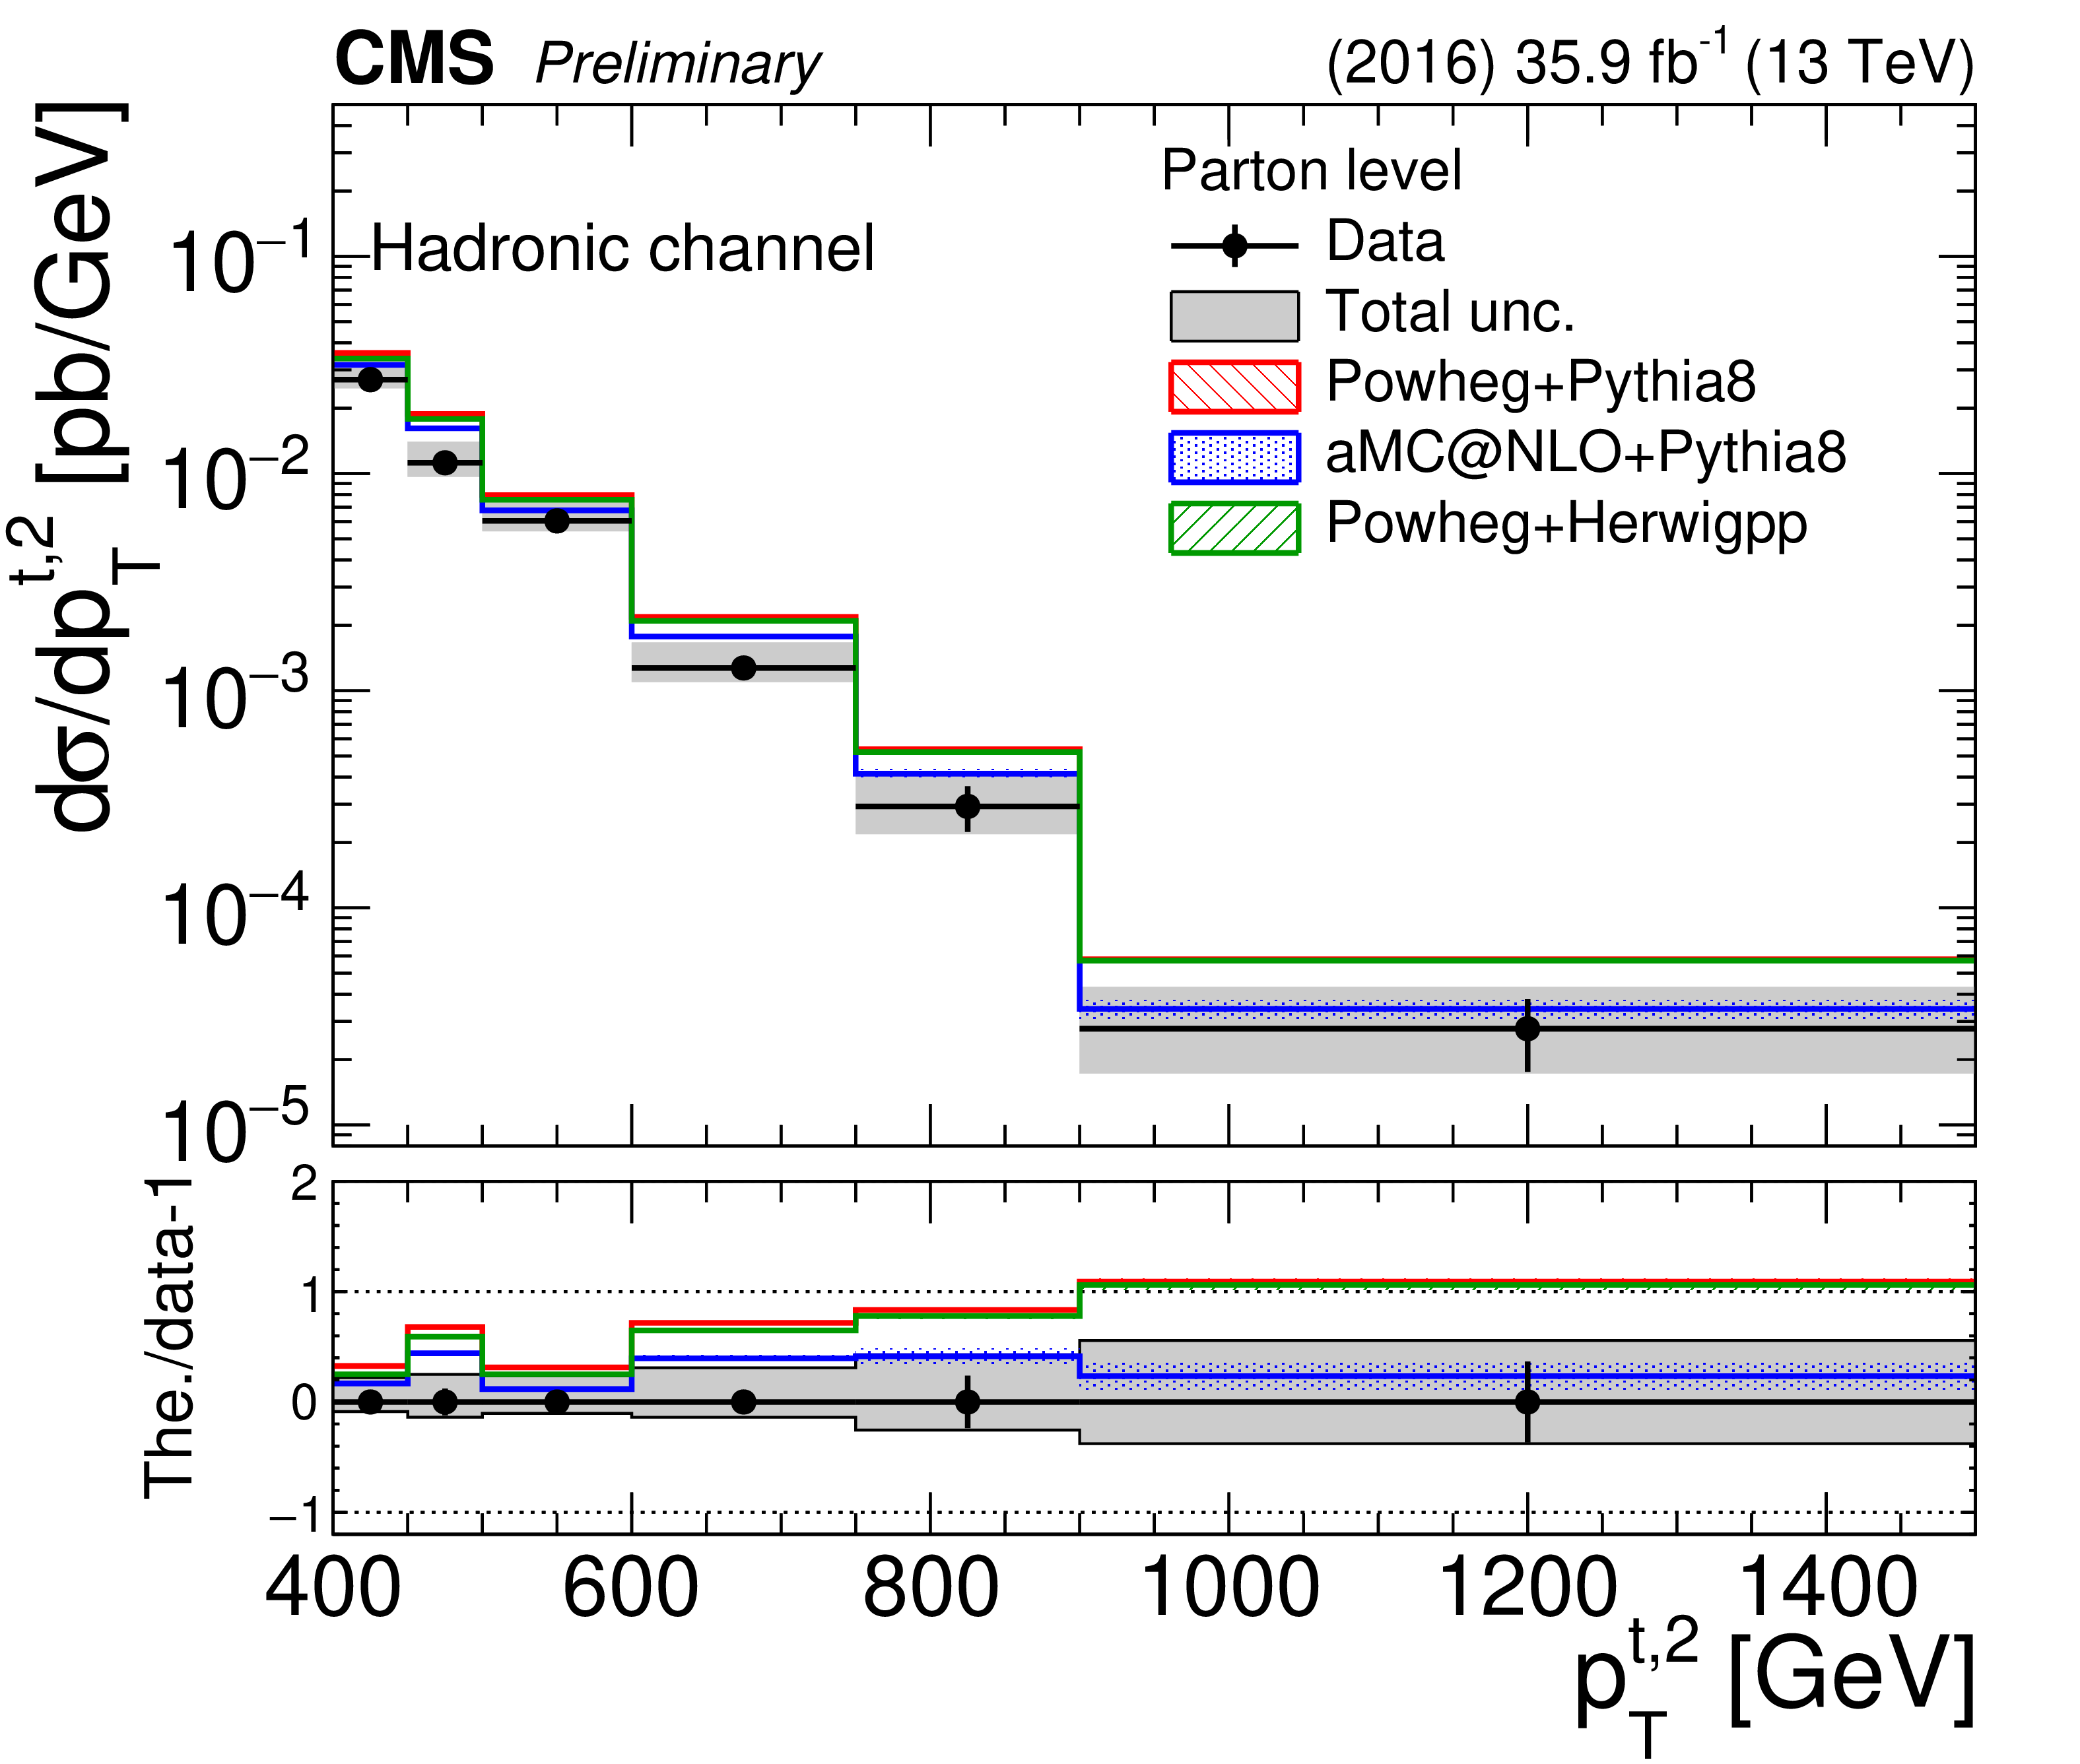
Figure 22:
Differential cross section unfolded to the parton level, absolute (left) and normalized (right), as a function of the second top quark ${p_{\mathrm {T}}}$ in the hadronic channel. The bottom panel shows the ratio (theory $-$ data)/data. The uncertainties on the data markers are statistical, while the grey band shows the total statistical and systematic uncertainty. |
png pdf |
Figure 22-a:
Differential cross section unfolded to the parton level, absolute (left) and normalized (right), as a function of the second top quark ${p_{\mathrm {T}}}$ in the hadronic channel. The bottom panel shows the ratio (theory $-$ data)/data. The uncertainties on the data markers are statistical, while the grey band shows the total statistical and systematic uncertainty. |

png pdf |
Figure 22-b:
Differential cross section unfolded to the parton level, absolute (left) and normalized (right), as a function of the second top quark ${p_{\mathrm {T}}}$ in the hadronic channel. The bottom panel shows the ratio (theory $-$ data)/data. The uncertainties on the data markers are statistical, while the grey band shows the total statistical and systematic uncertainty. |
png pdf |
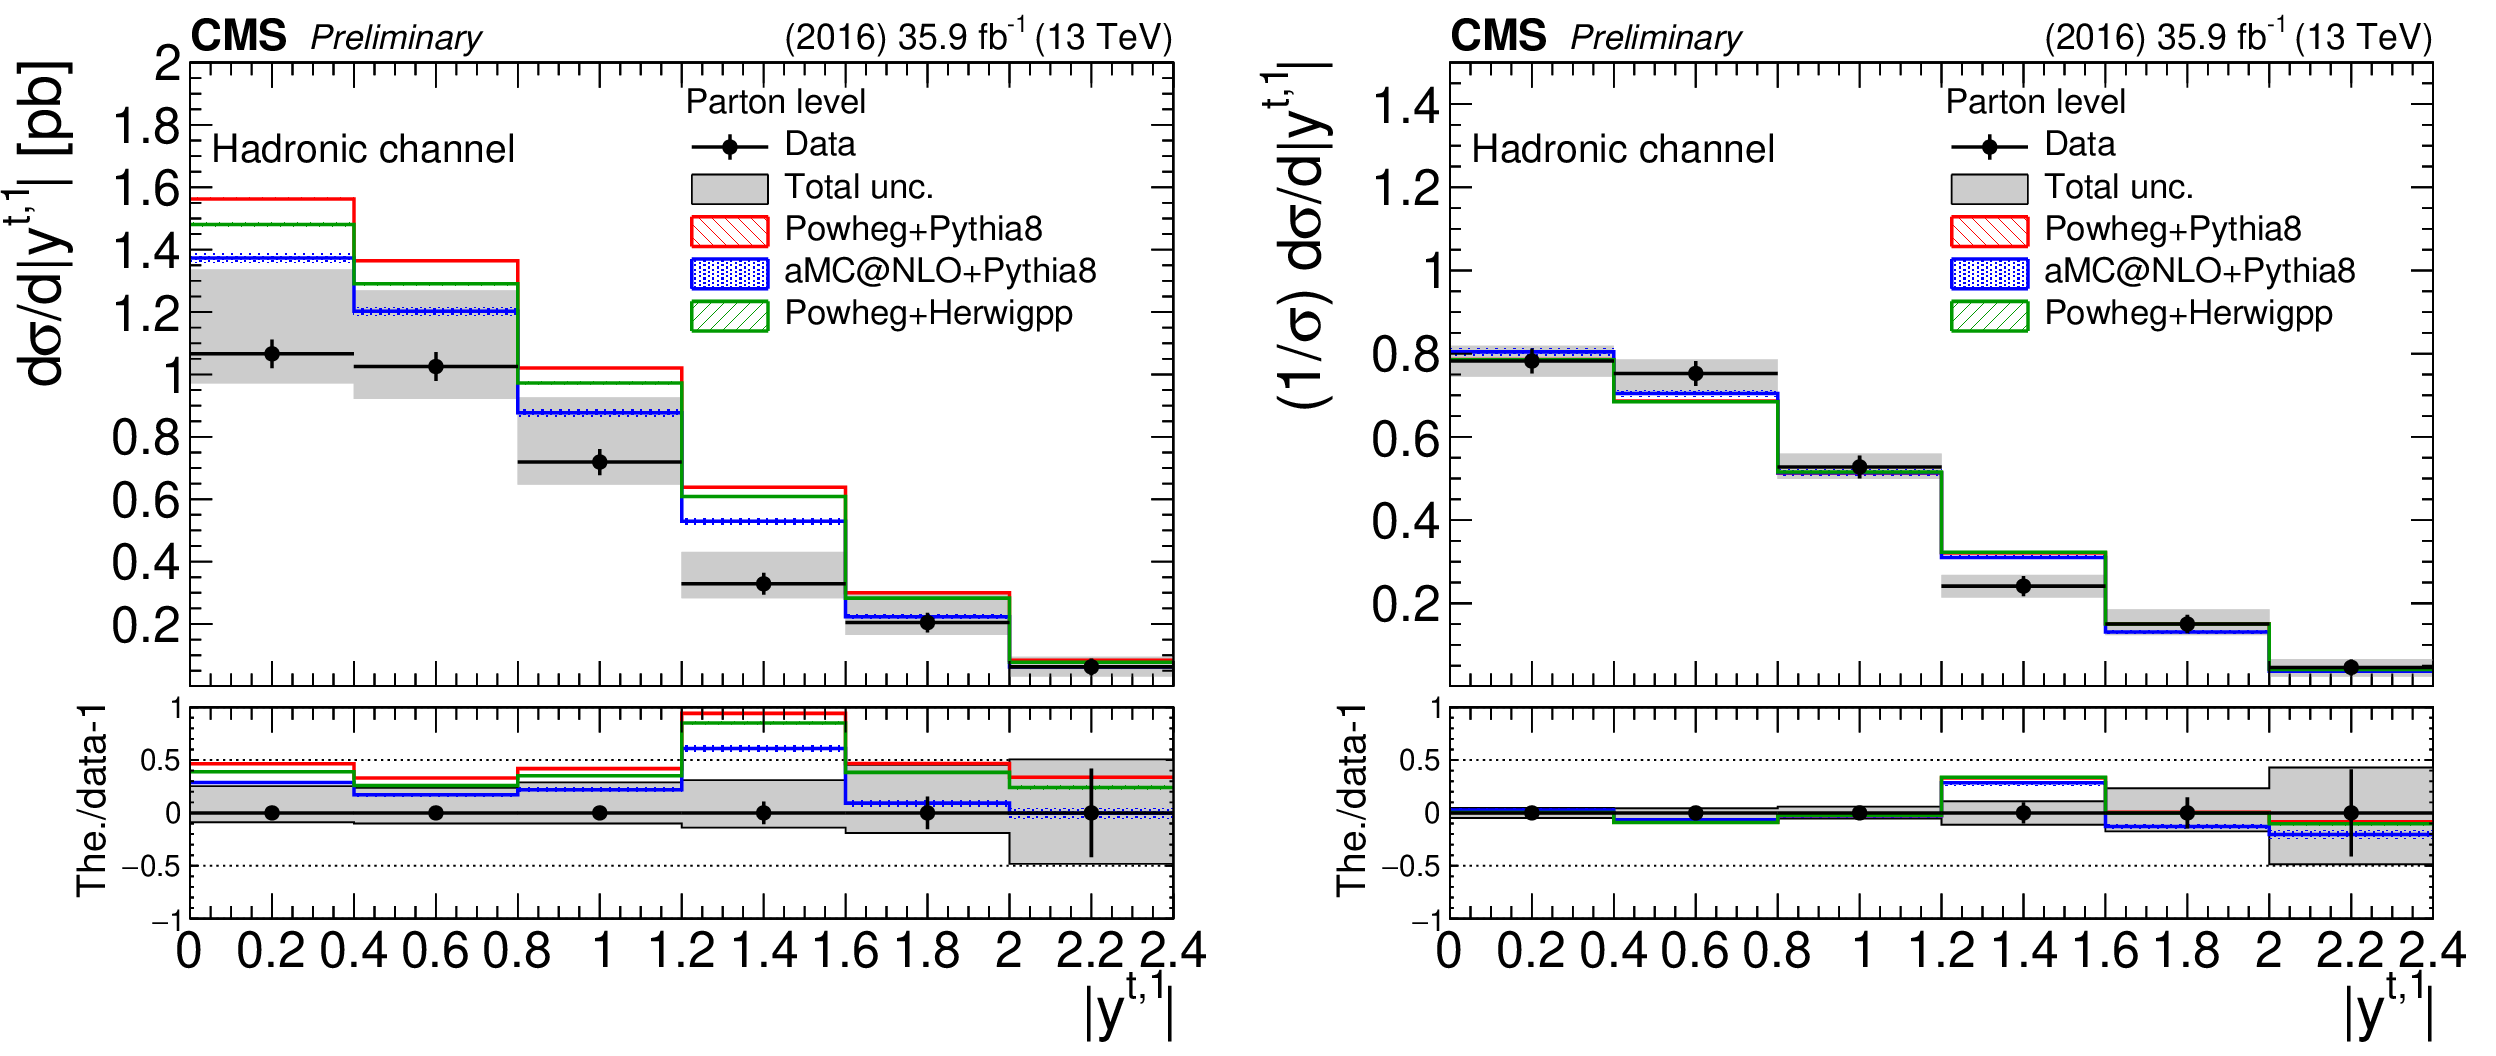
Figure 23:
Differential cross section unfolded to the parton level, absolute (left) and normalized (right), as a function of the leading top $|y|$ in the hadronic channel. The bottom panel shows the ratio (theory $-$ data)/data. The uncertainties on the data markers are statistical, while the grey band shows the total statistical and systematic uncertainty. |

png pdf |
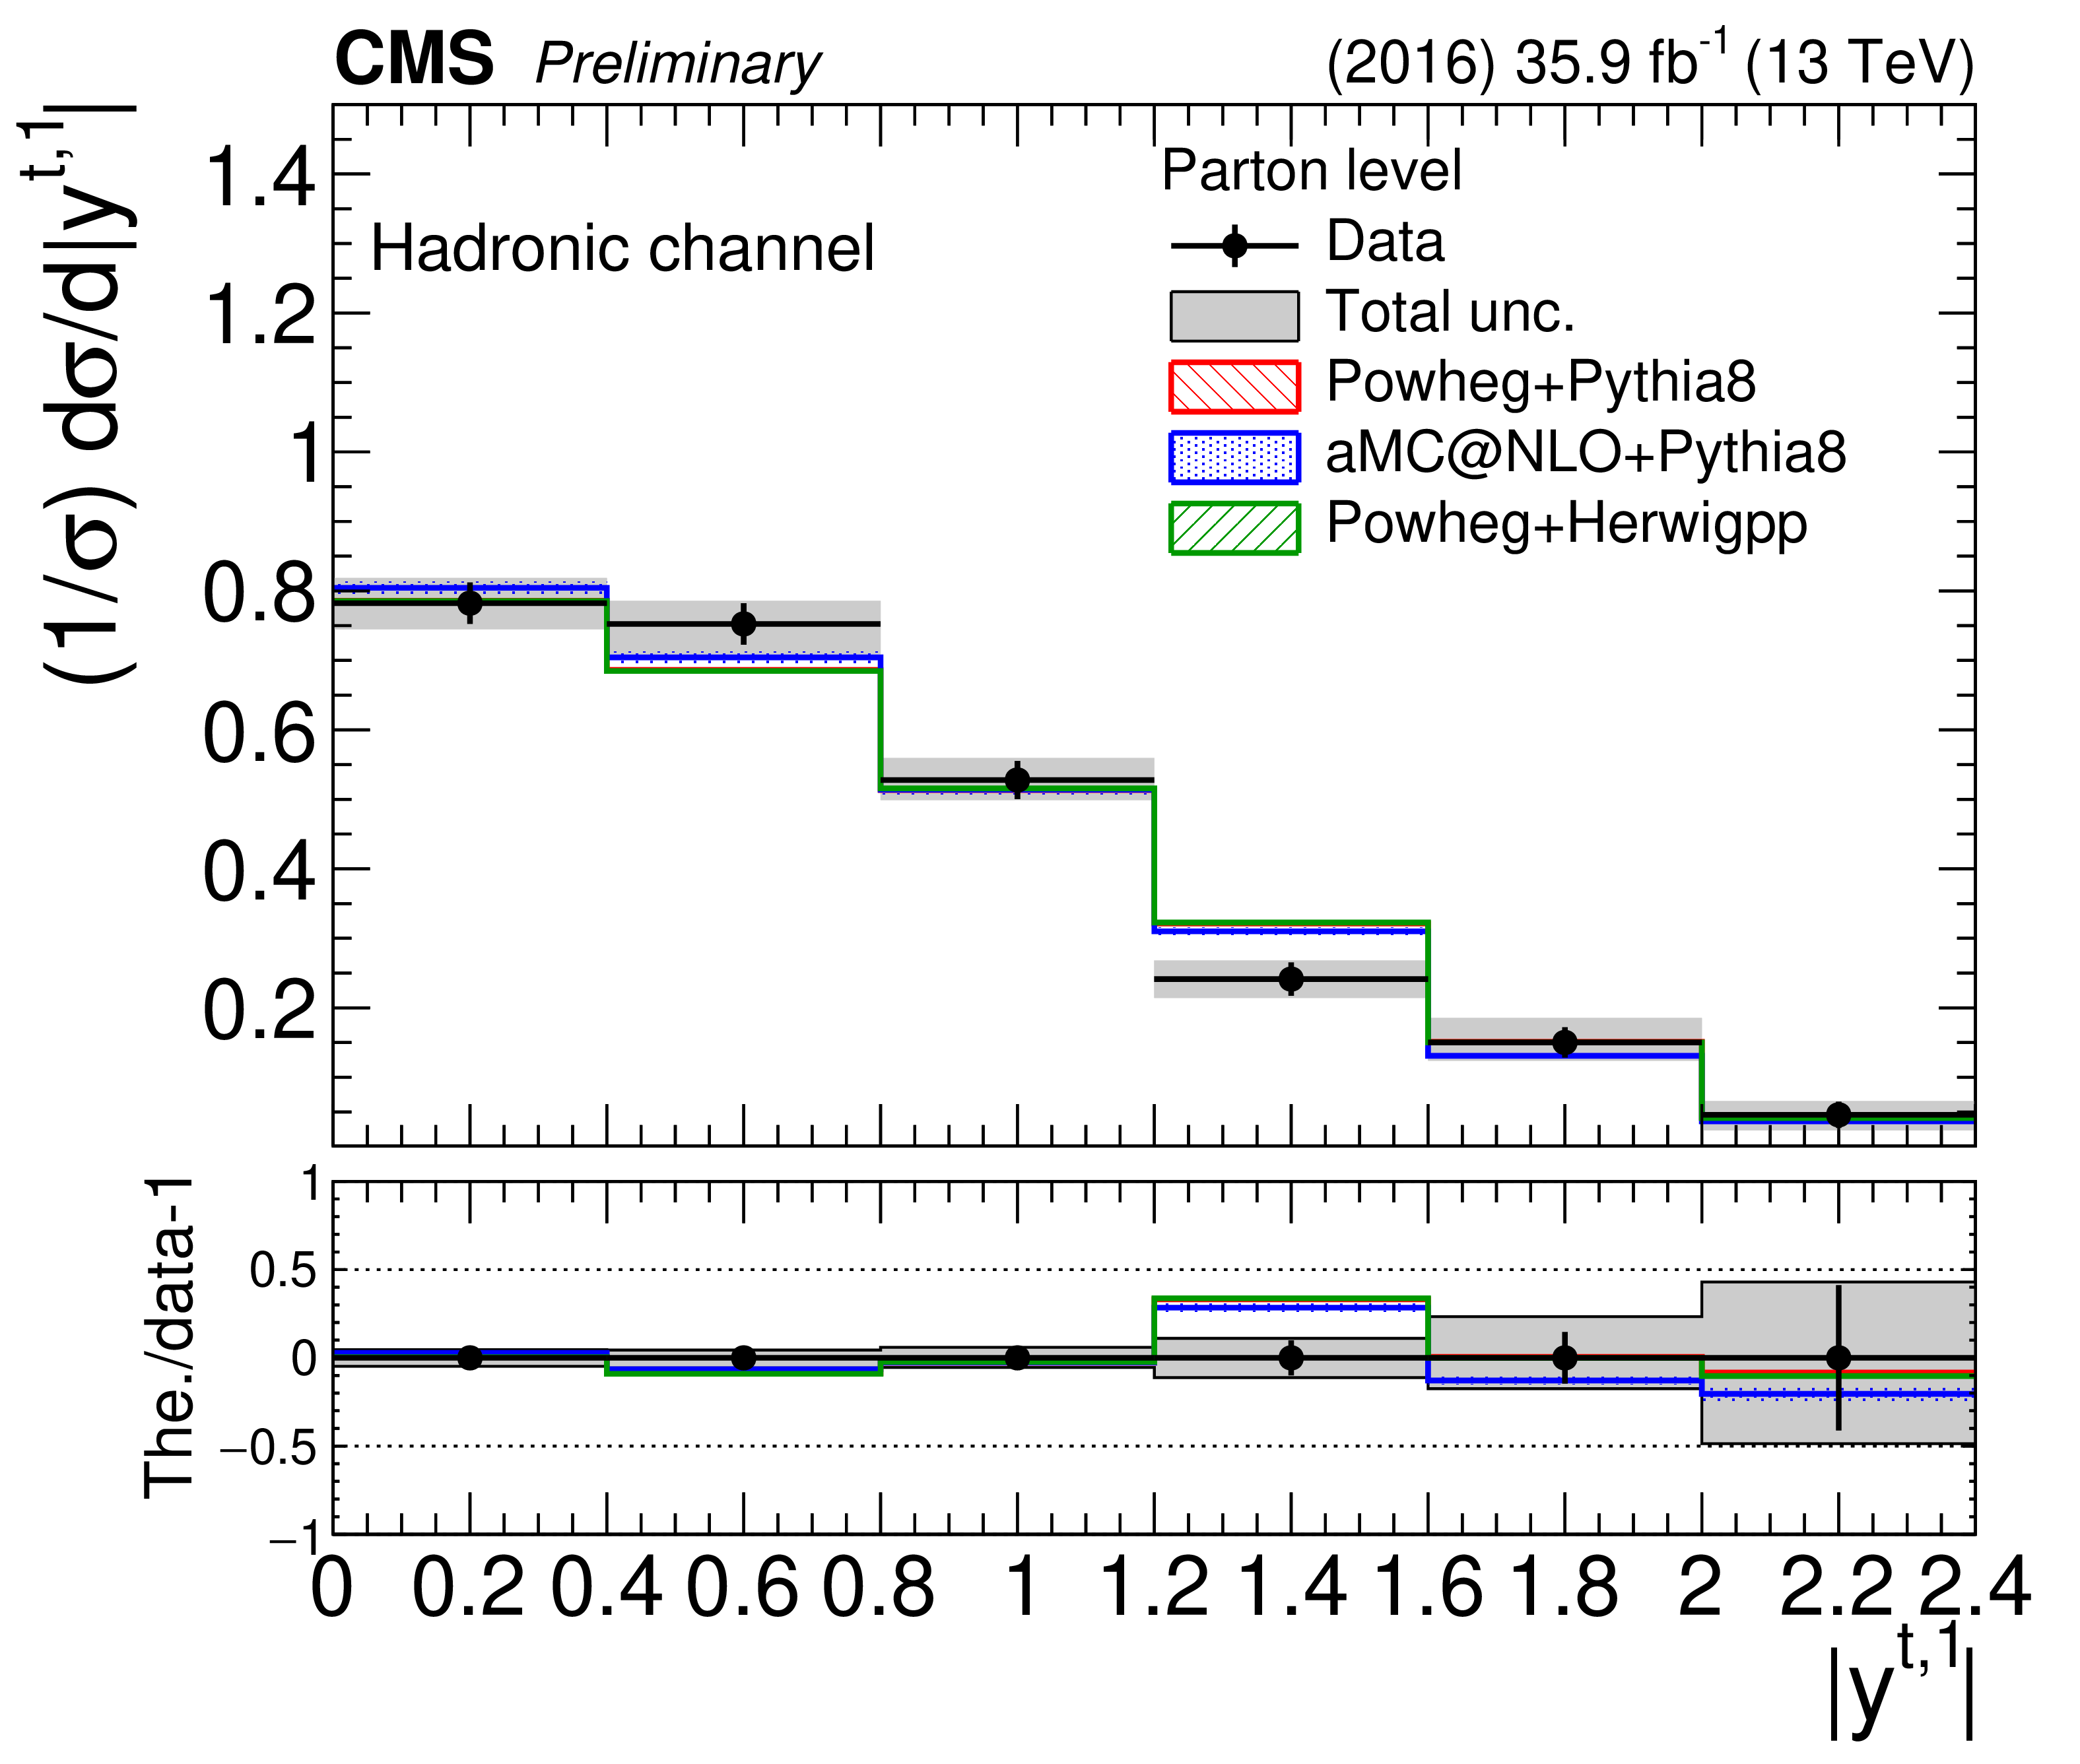
Figure 23-a:
Differential cross section unfolded to the parton level, absolute (left) and normalized (right), as a function of the leading top $|y|$ in the hadronic channel. The bottom panel shows the ratio (theory $-$ data)/data. The uncertainties on the data markers are statistical, while the grey band shows the total statistical and systematic uncertainty. |
png pdf |
Figure 23-b:
Differential cross section unfolded to the parton level, absolute (left) and normalized (right), as a function of the leading top $|y|$ in the hadronic channel. The bottom panel shows the ratio (theory $-$ data)/data. The uncertainties on the data markers are statistical, while the grey band shows the total statistical and systematic uncertainty. |
png pdf |
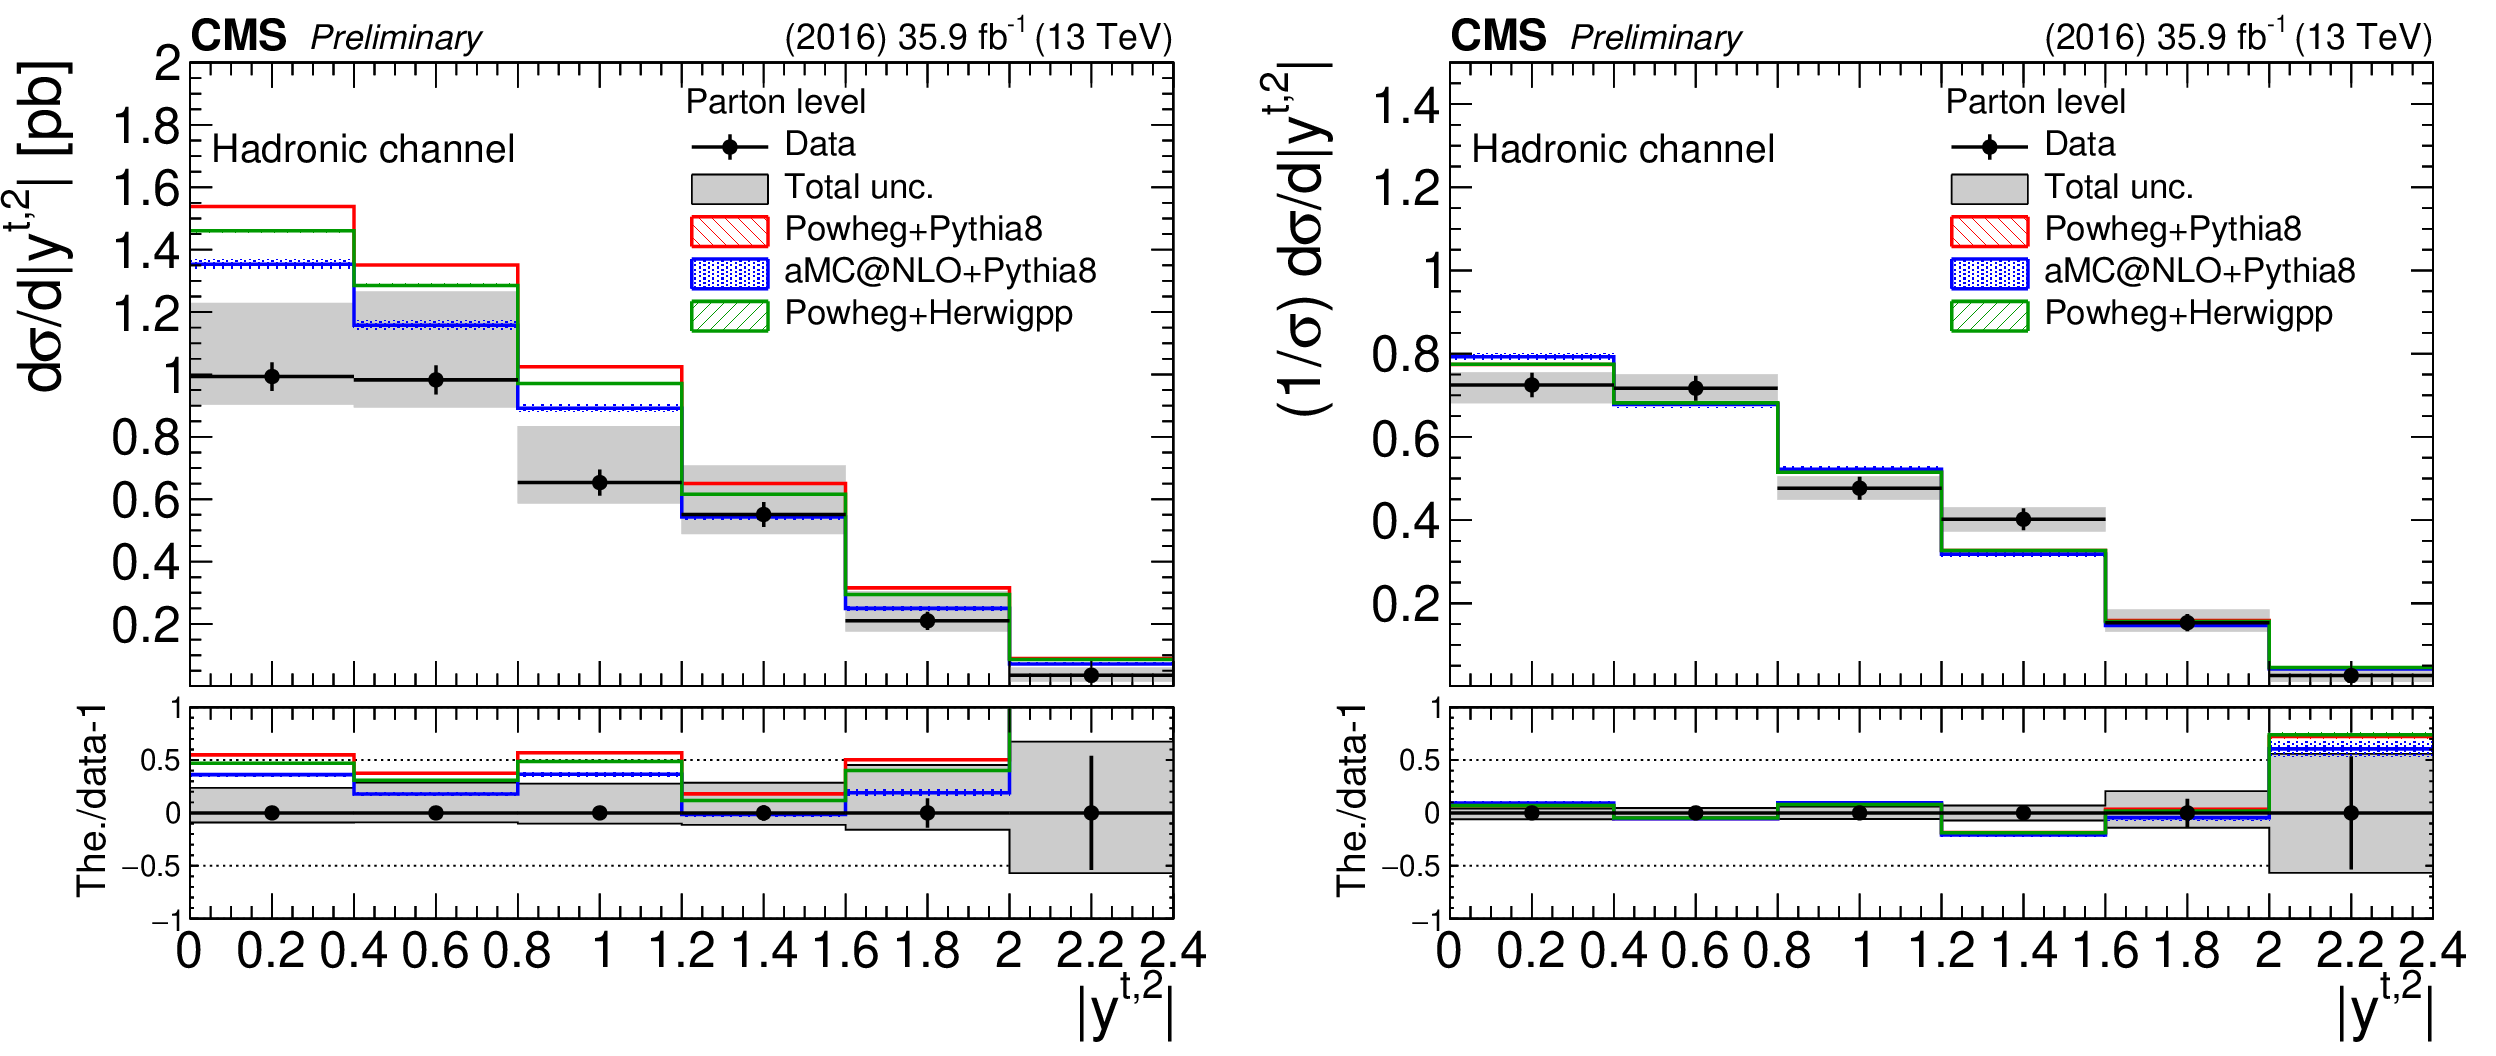
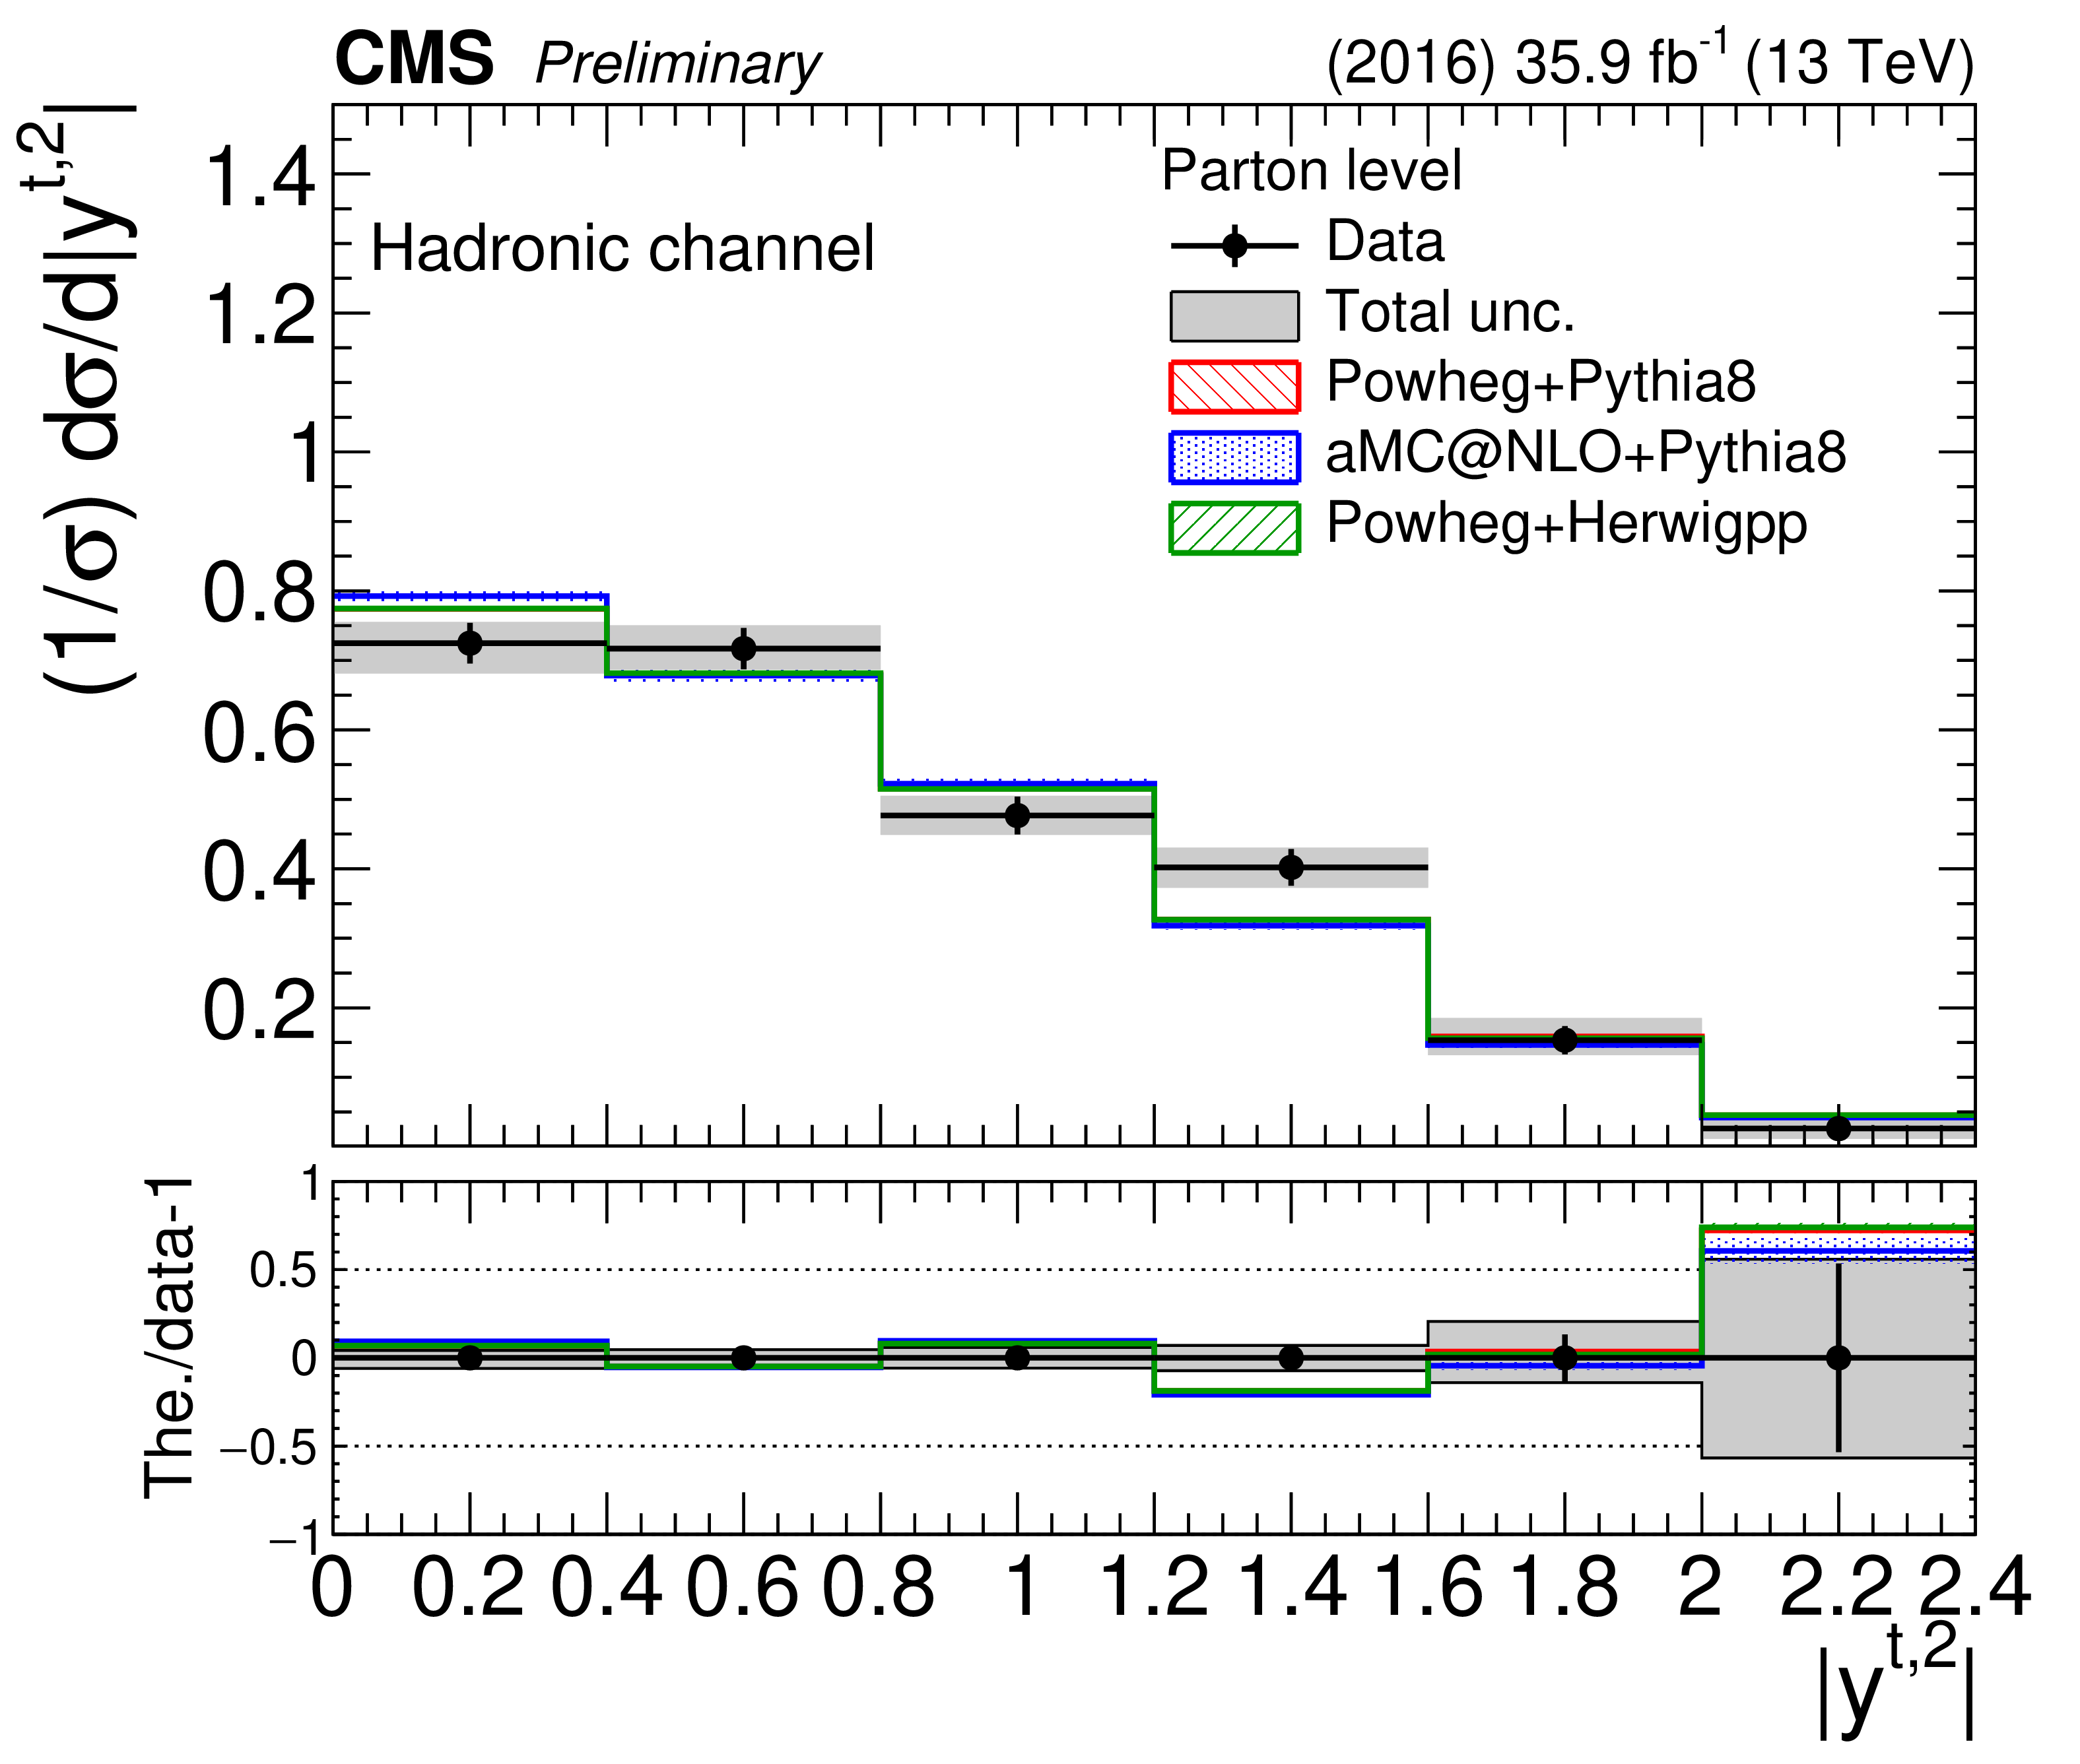
Figure 24:
Differential cross section unfolded to the parton level, absolute (left) and normalized (right), as a function of the second top quark $|y|$ in the hadronic channel. The bottom panel shows the ratio (theory $-$ data)/data. The uncertainties on the data markers are statistical, while the grey band shows the total statistical and systematic uncertainty. |
png pdf |
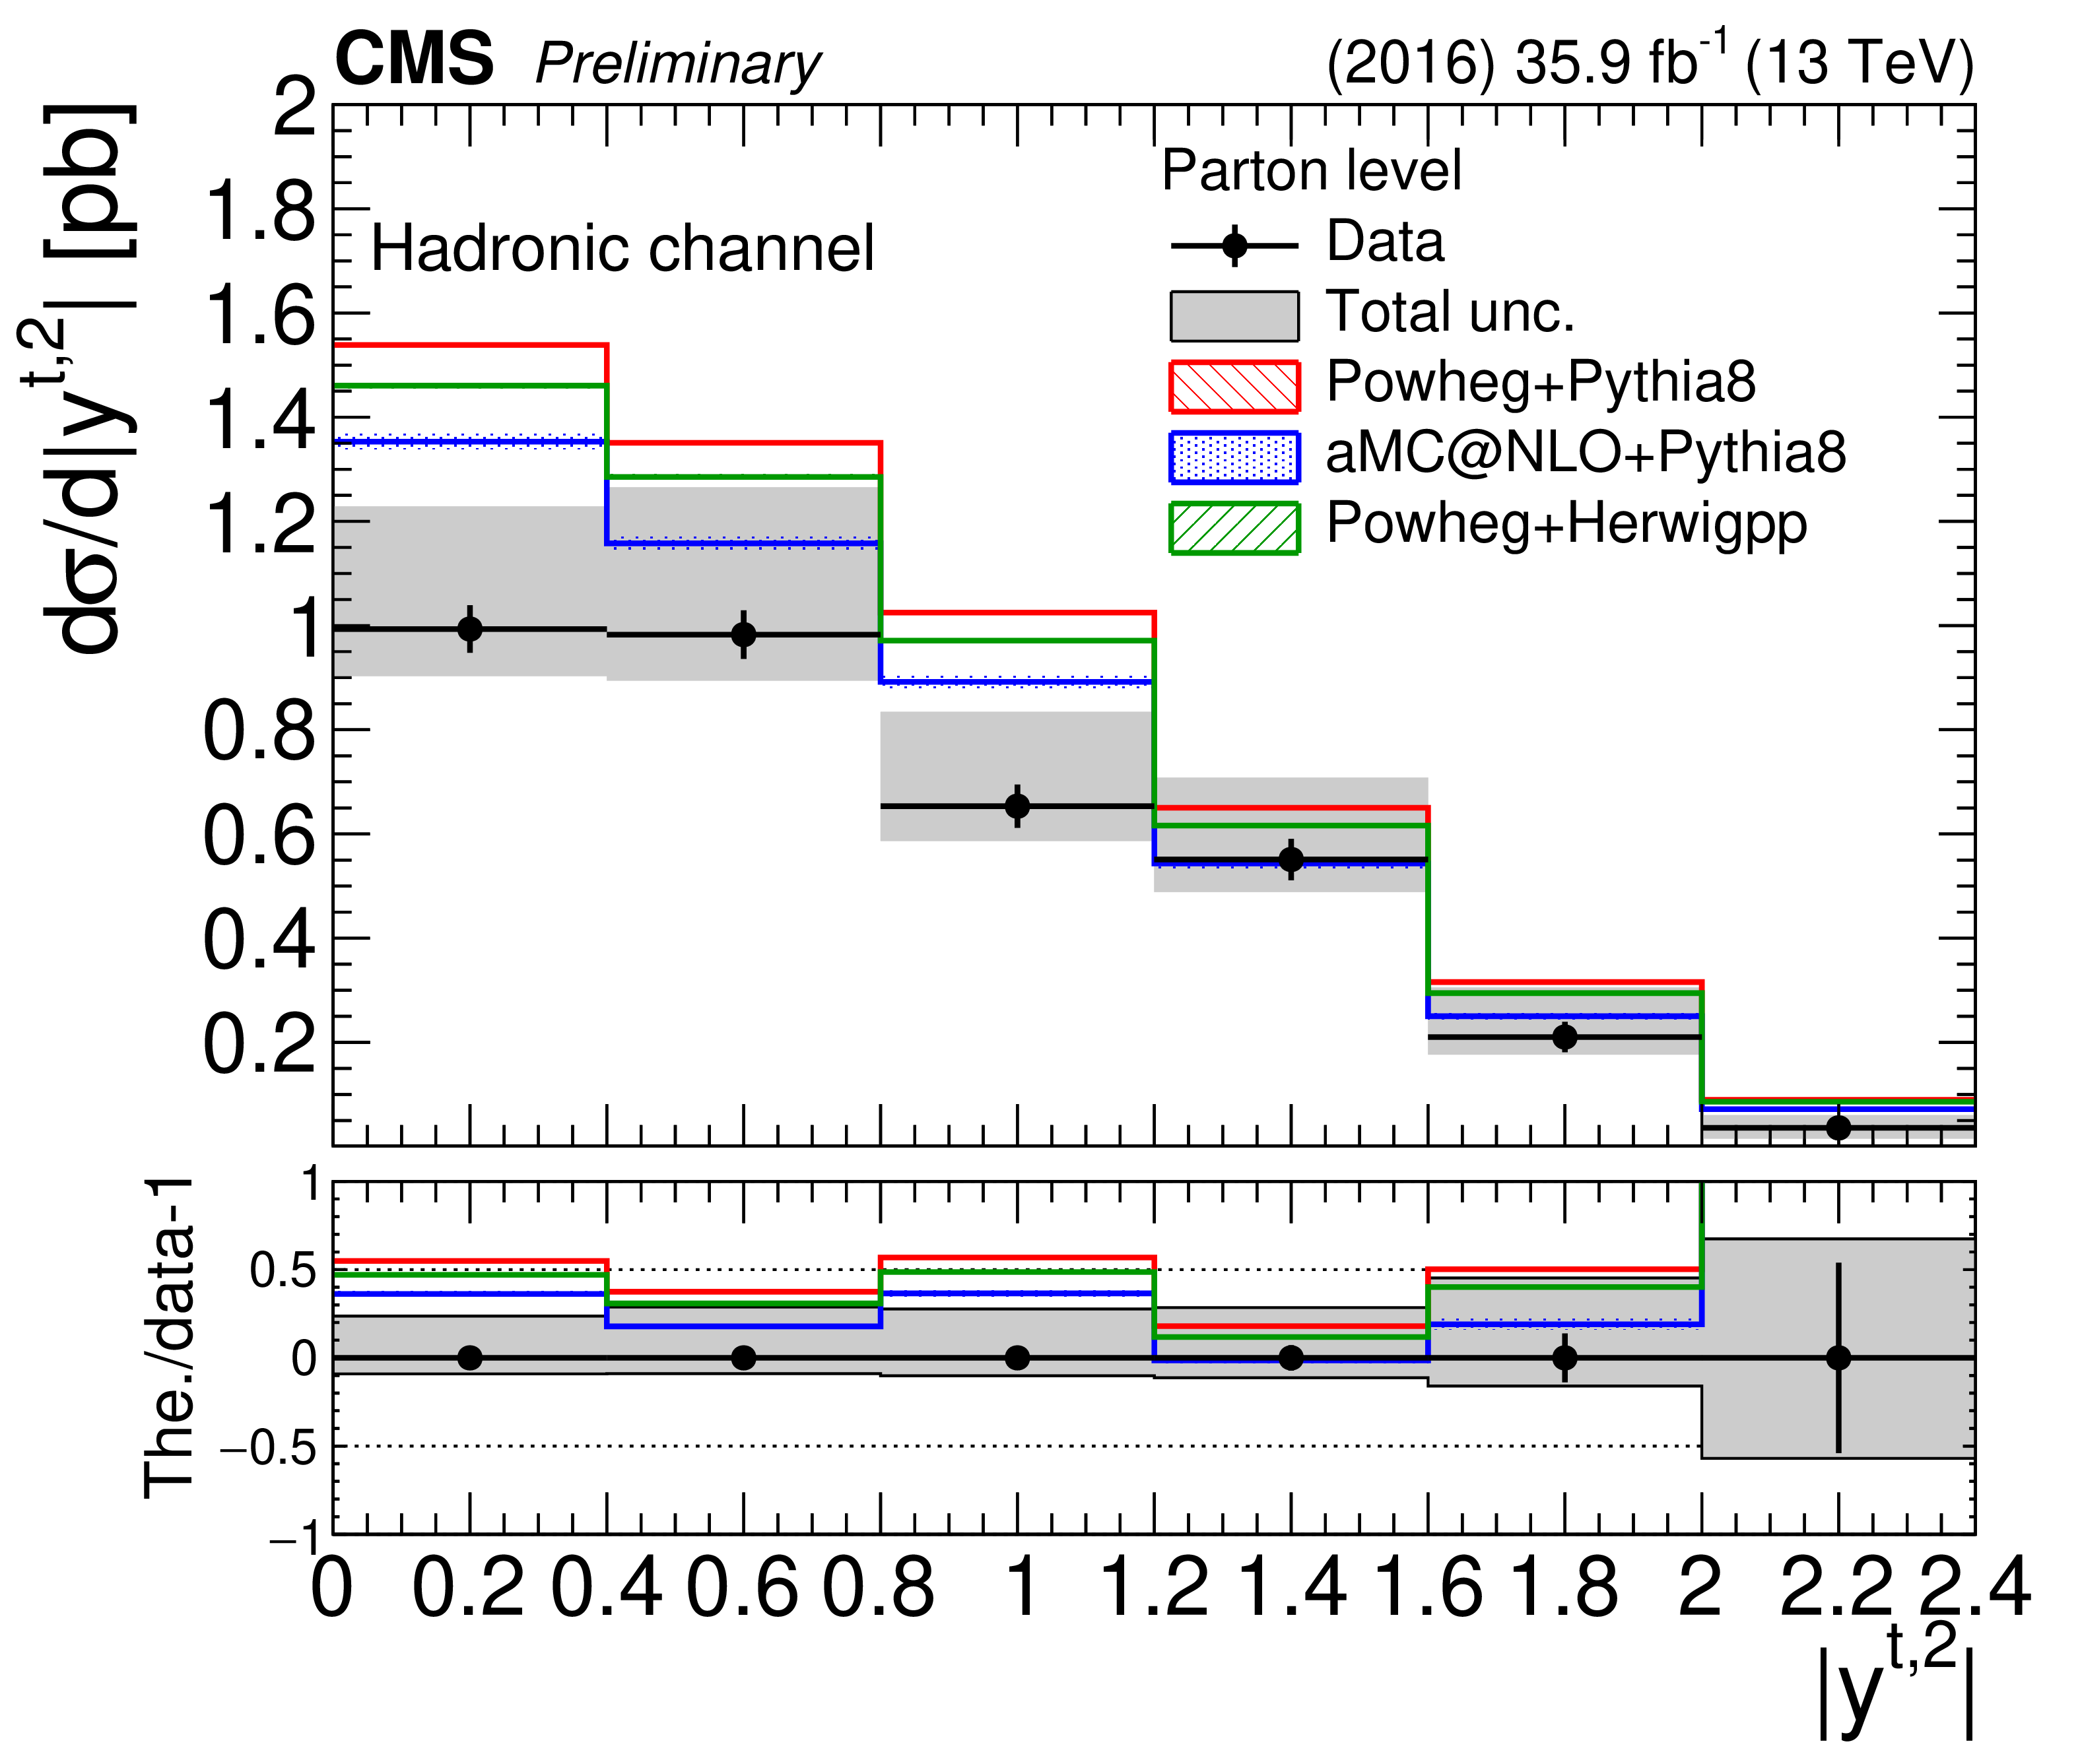
Figure 24-a:
Differential cross section unfolded to the parton level, absolute (left) and normalized (right), as a function of the second top quark $|y|$ in the hadronic channel. The bottom panel shows the ratio (theory $-$ data)/data. The uncertainties on the data markers are statistical, while the grey band shows the total statistical and systematic uncertainty. |
png pdf |
Figure 24-b:
Differential cross section unfolded to the parton level, absolute (left) and normalized (right), as a function of the second top quark $|y|$ in the hadronic channel. The bottom panel shows the ratio (theory $-$ data)/data. The uncertainties on the data markers are statistical, while the grey band shows the total statistical and systematic uncertainty. |
png pdf |
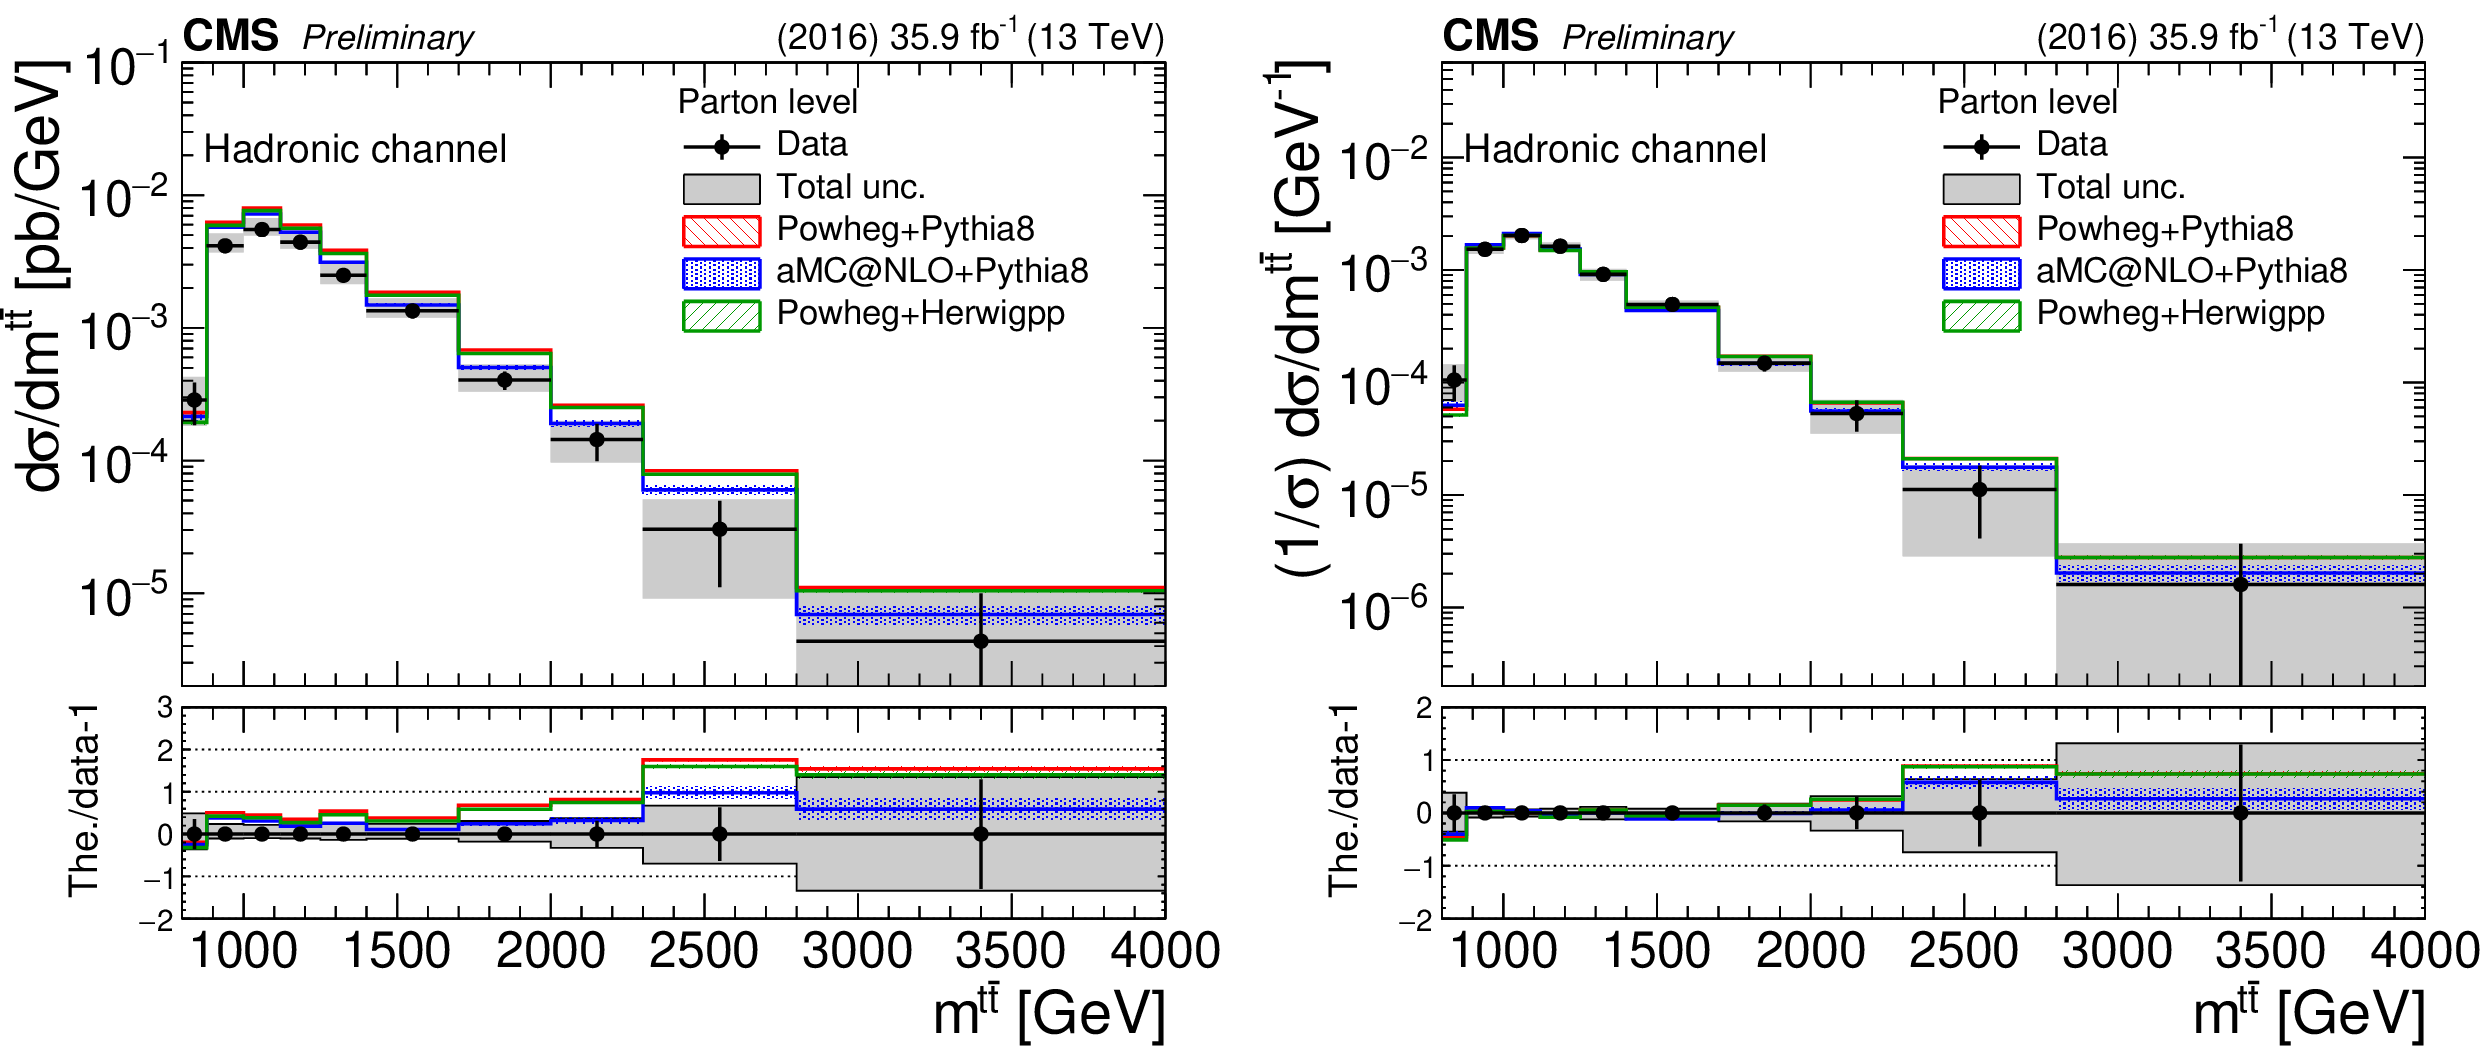
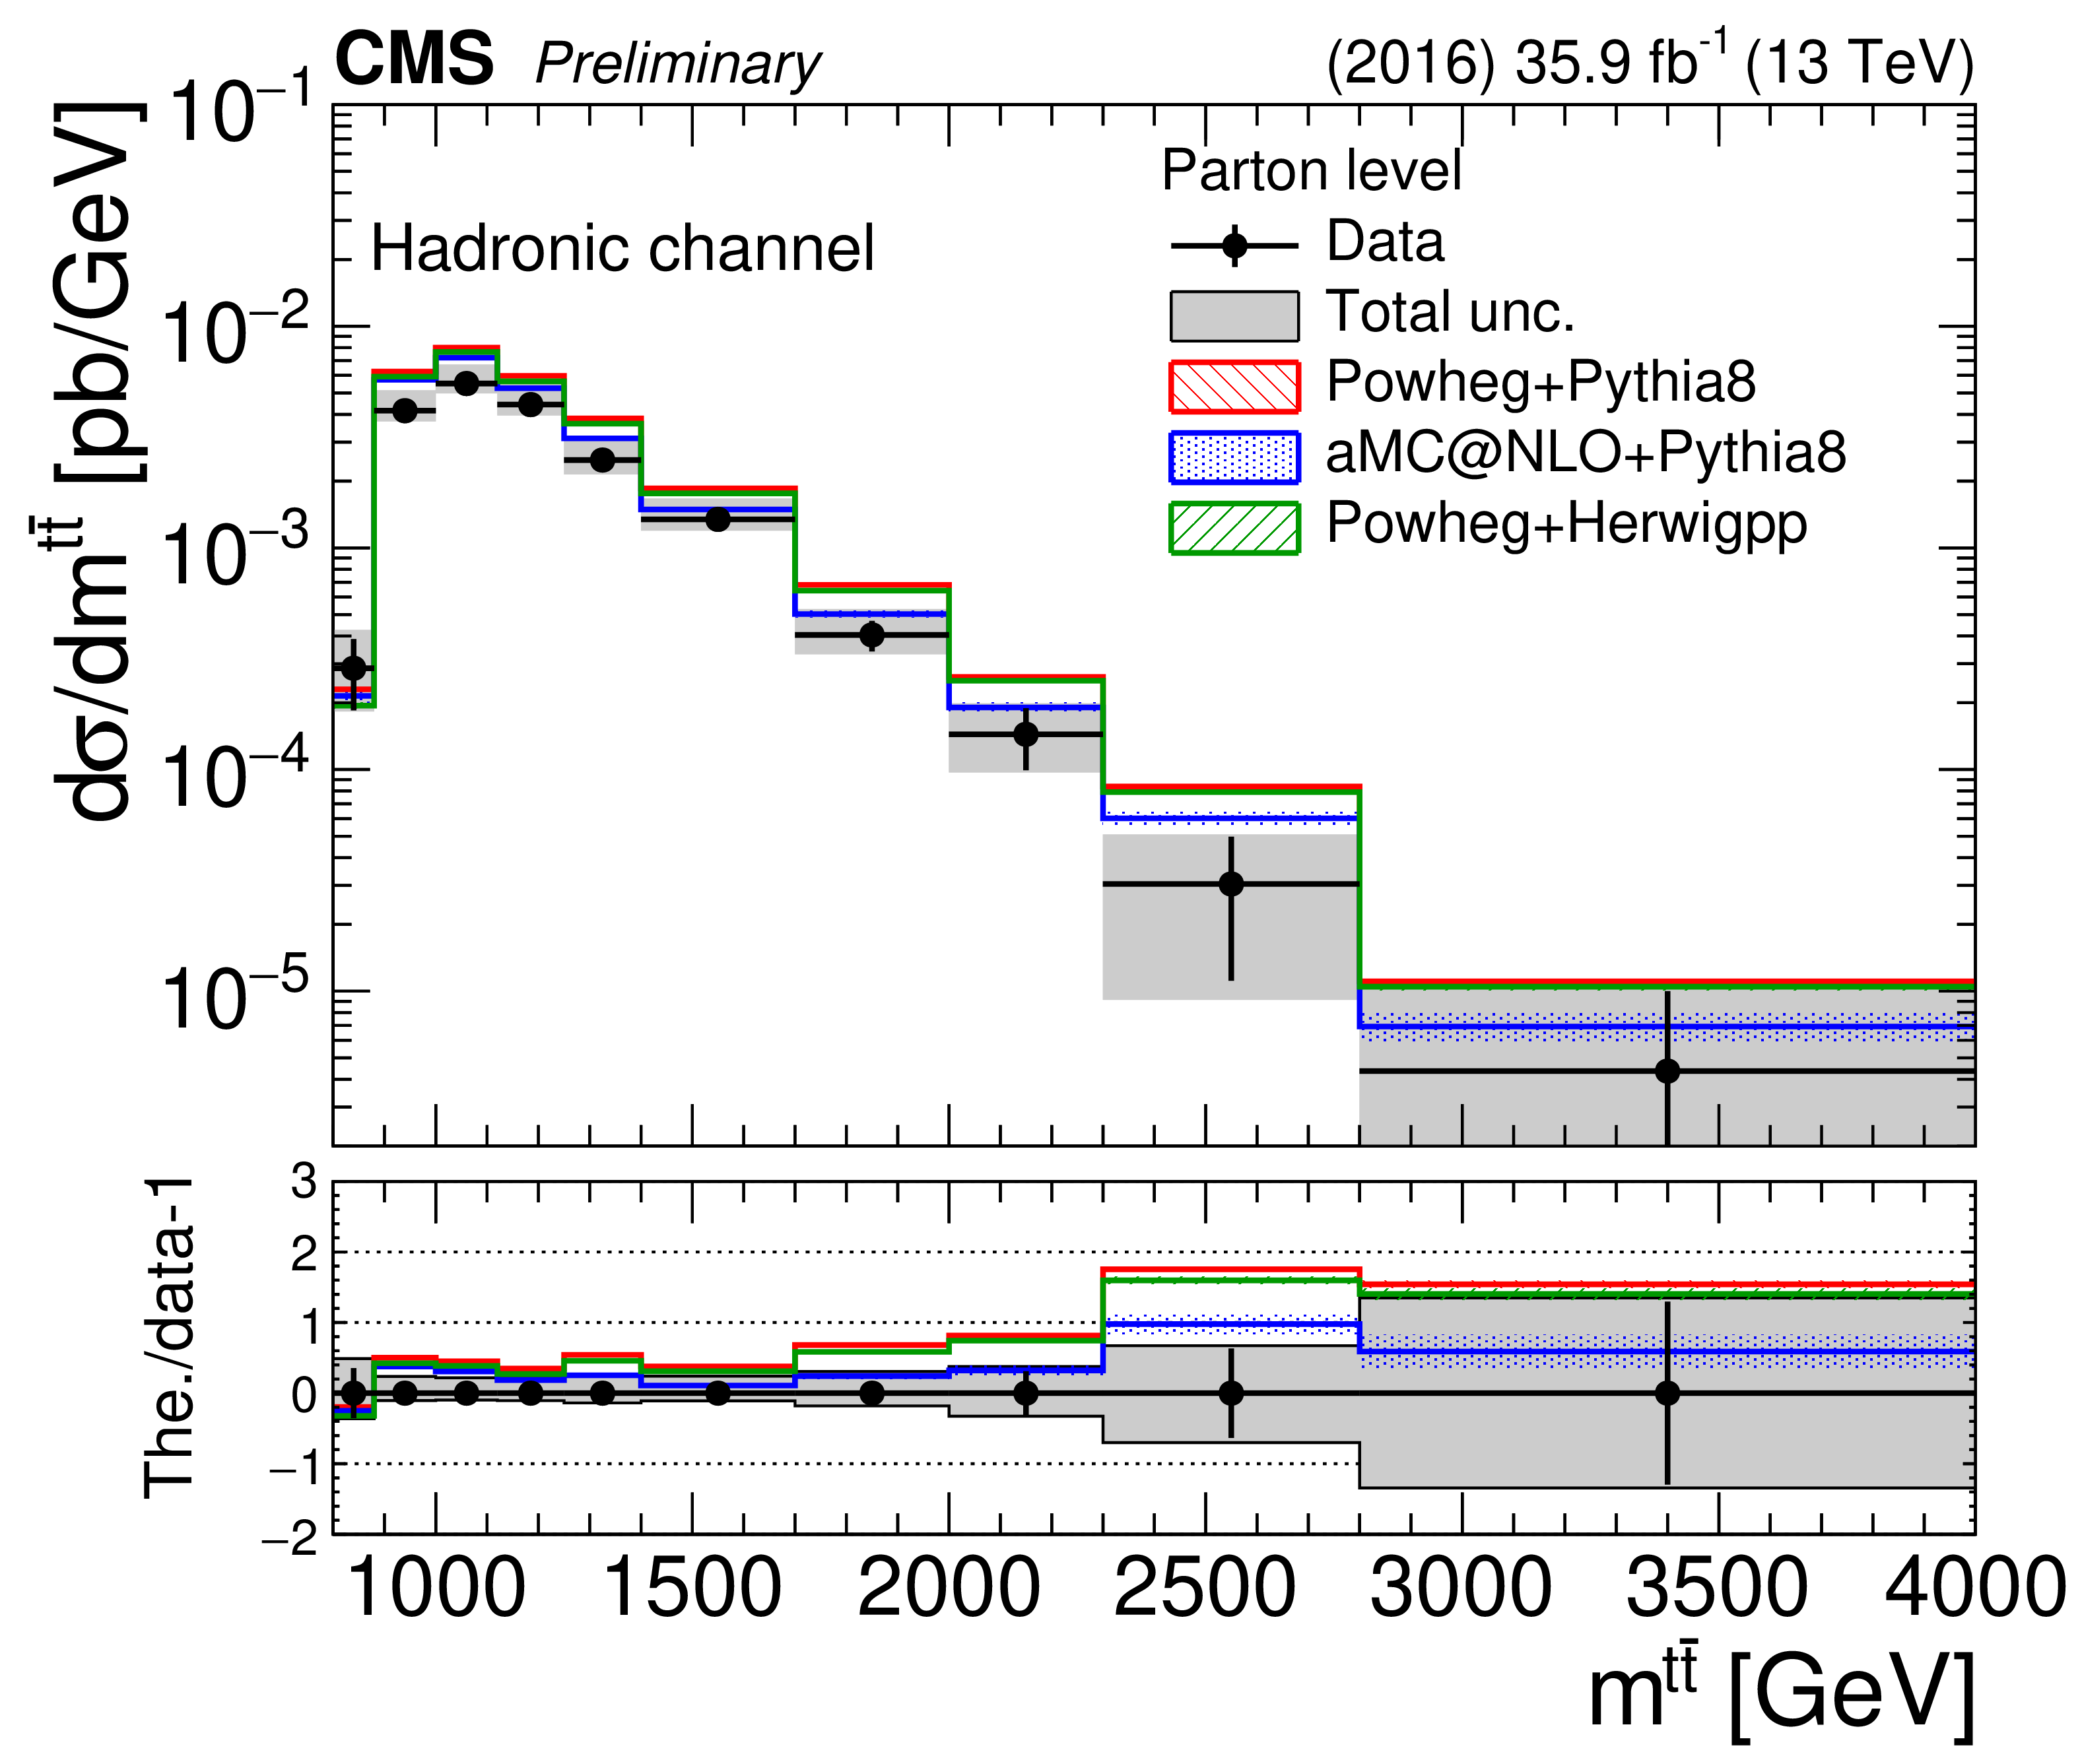
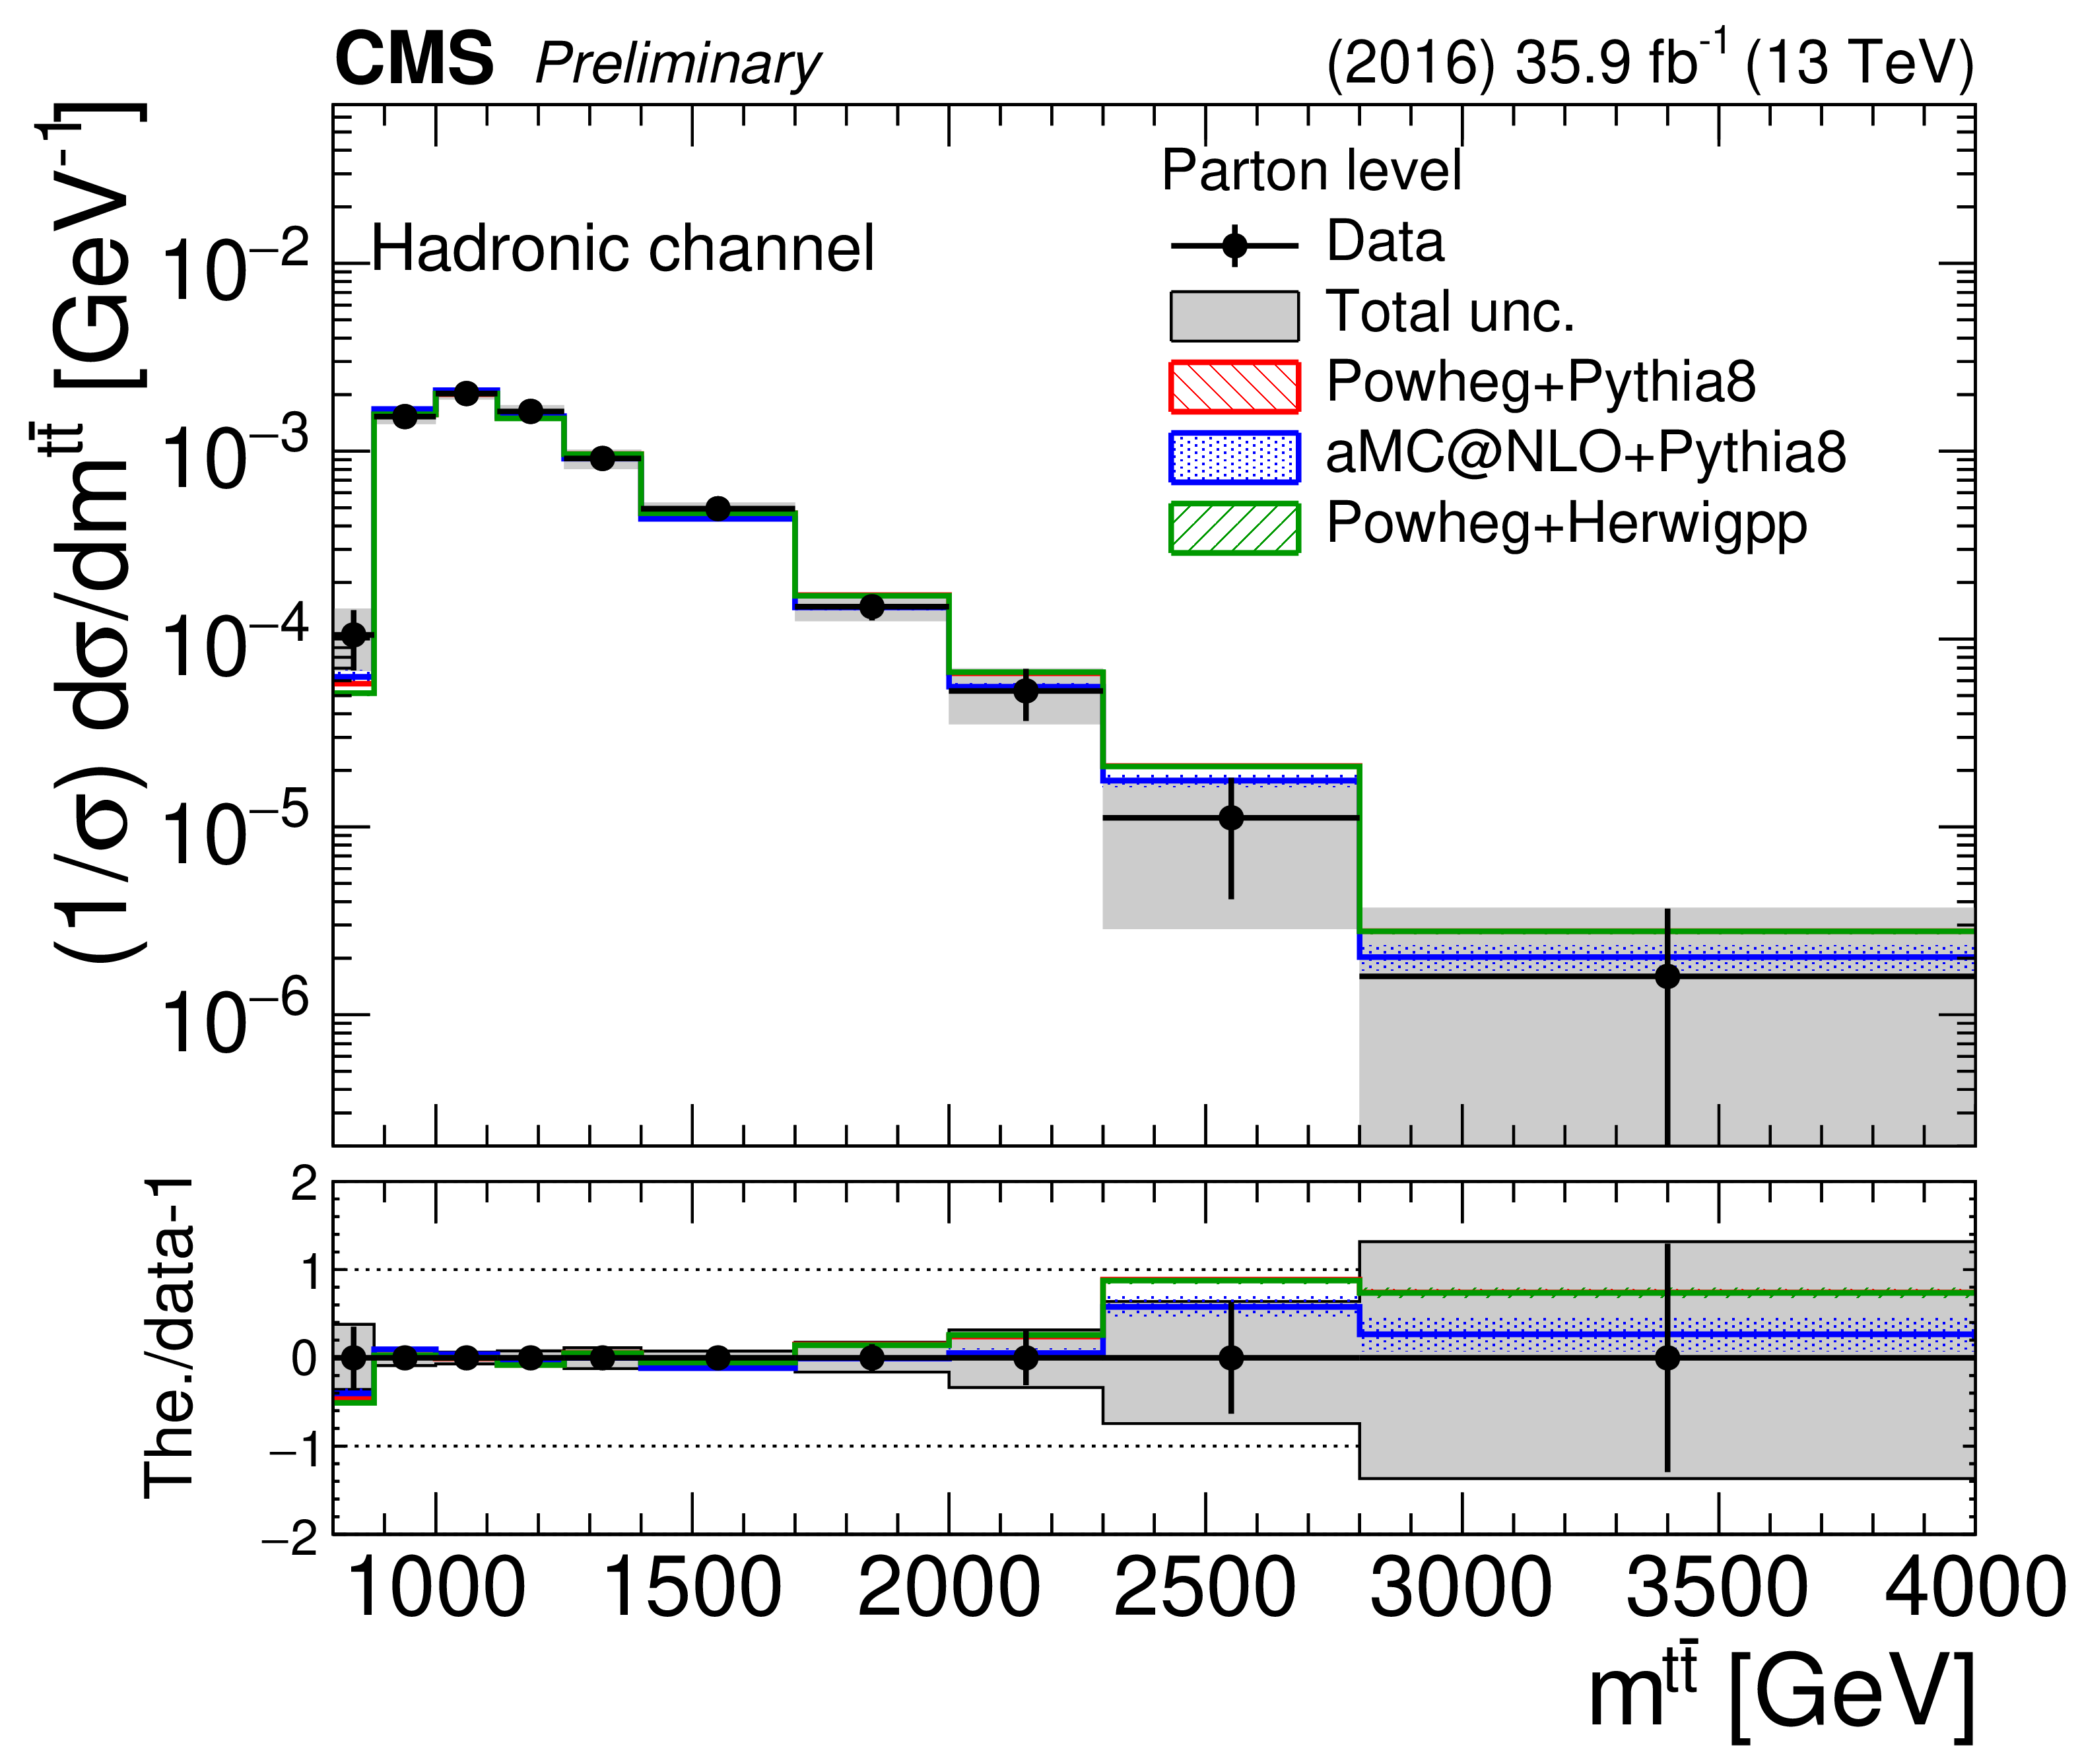
Figure 25:
Differential cross section unfolded to the parton level, absolute (left) and normalized (right), as a function of $m^{{\mathrm{t\bar{t}}}}$ in the hadronic channel. The bottom panel shows the ratio (theory $-$ data)/data. The uncertainties on the data markers are statistical, while the grey band shows the total statistical and systematic uncertainty. |
png pdf |
Figure 25-a:
Differential cross section unfolded to the parton level, absolute (left) and normalized (right), as a function of $m^{{\mathrm{t\bar{t}}}}$ in the hadronic channel. The bottom panel shows the ratio (theory $-$ data)/data. The uncertainties on the data markers are statistical, while the grey band shows the total statistical and systematic uncertainty. |
png pdf |
Figure 25-b:
Differential cross section unfolded to the parton level, absolute (left) and normalized (right), as a function of $m^{{\mathrm{t\bar{t}}}}$ in the hadronic channel. The bottom panel shows the ratio (theory $-$ data)/data. The uncertainties on the data markers are statistical, while the grey band shows the total statistical and systematic uncertainty. |
png pdf |
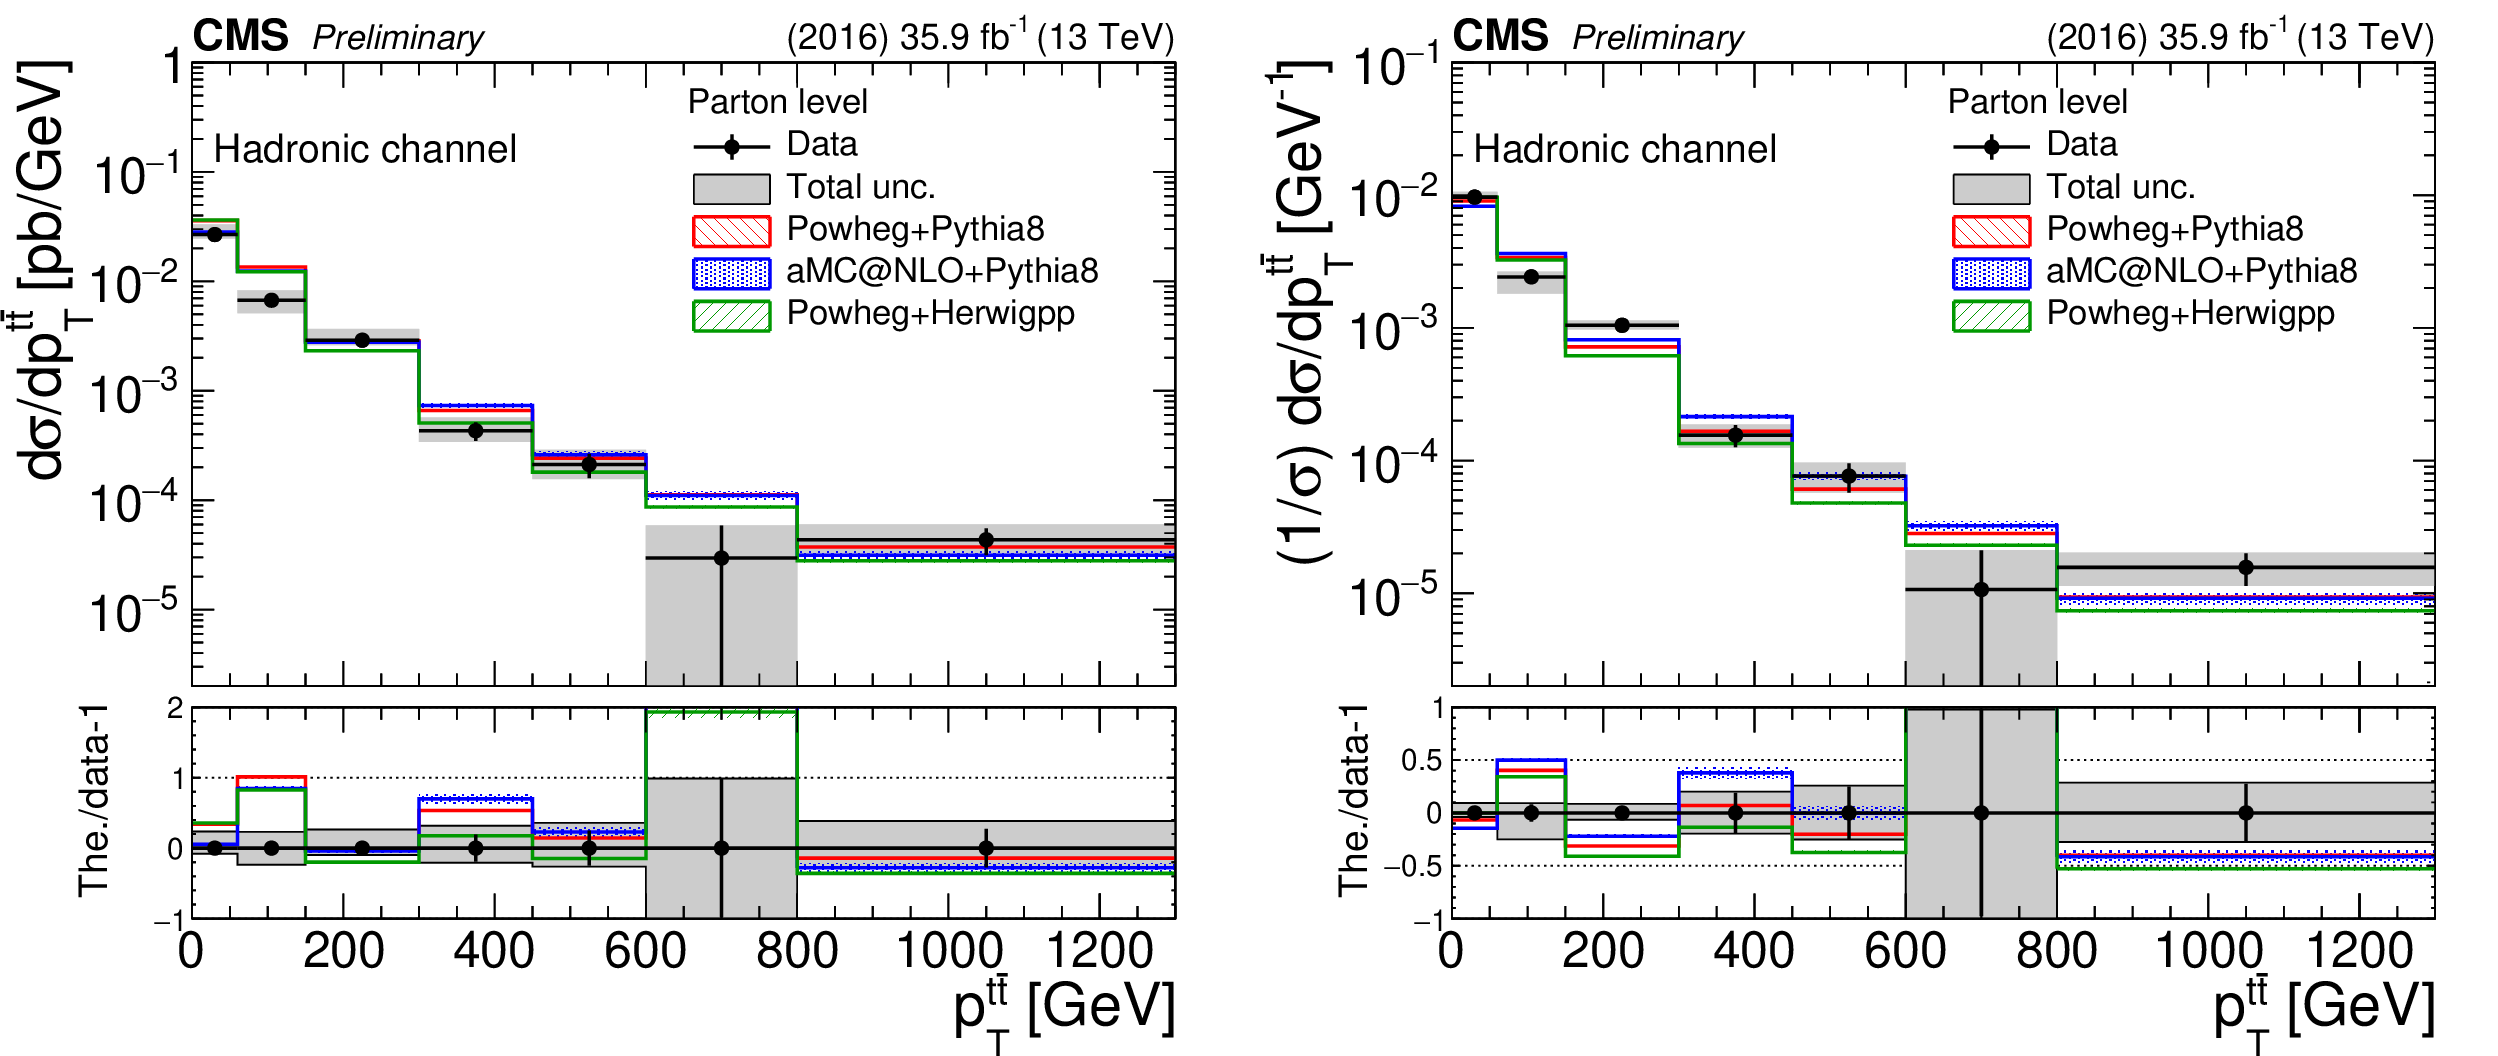
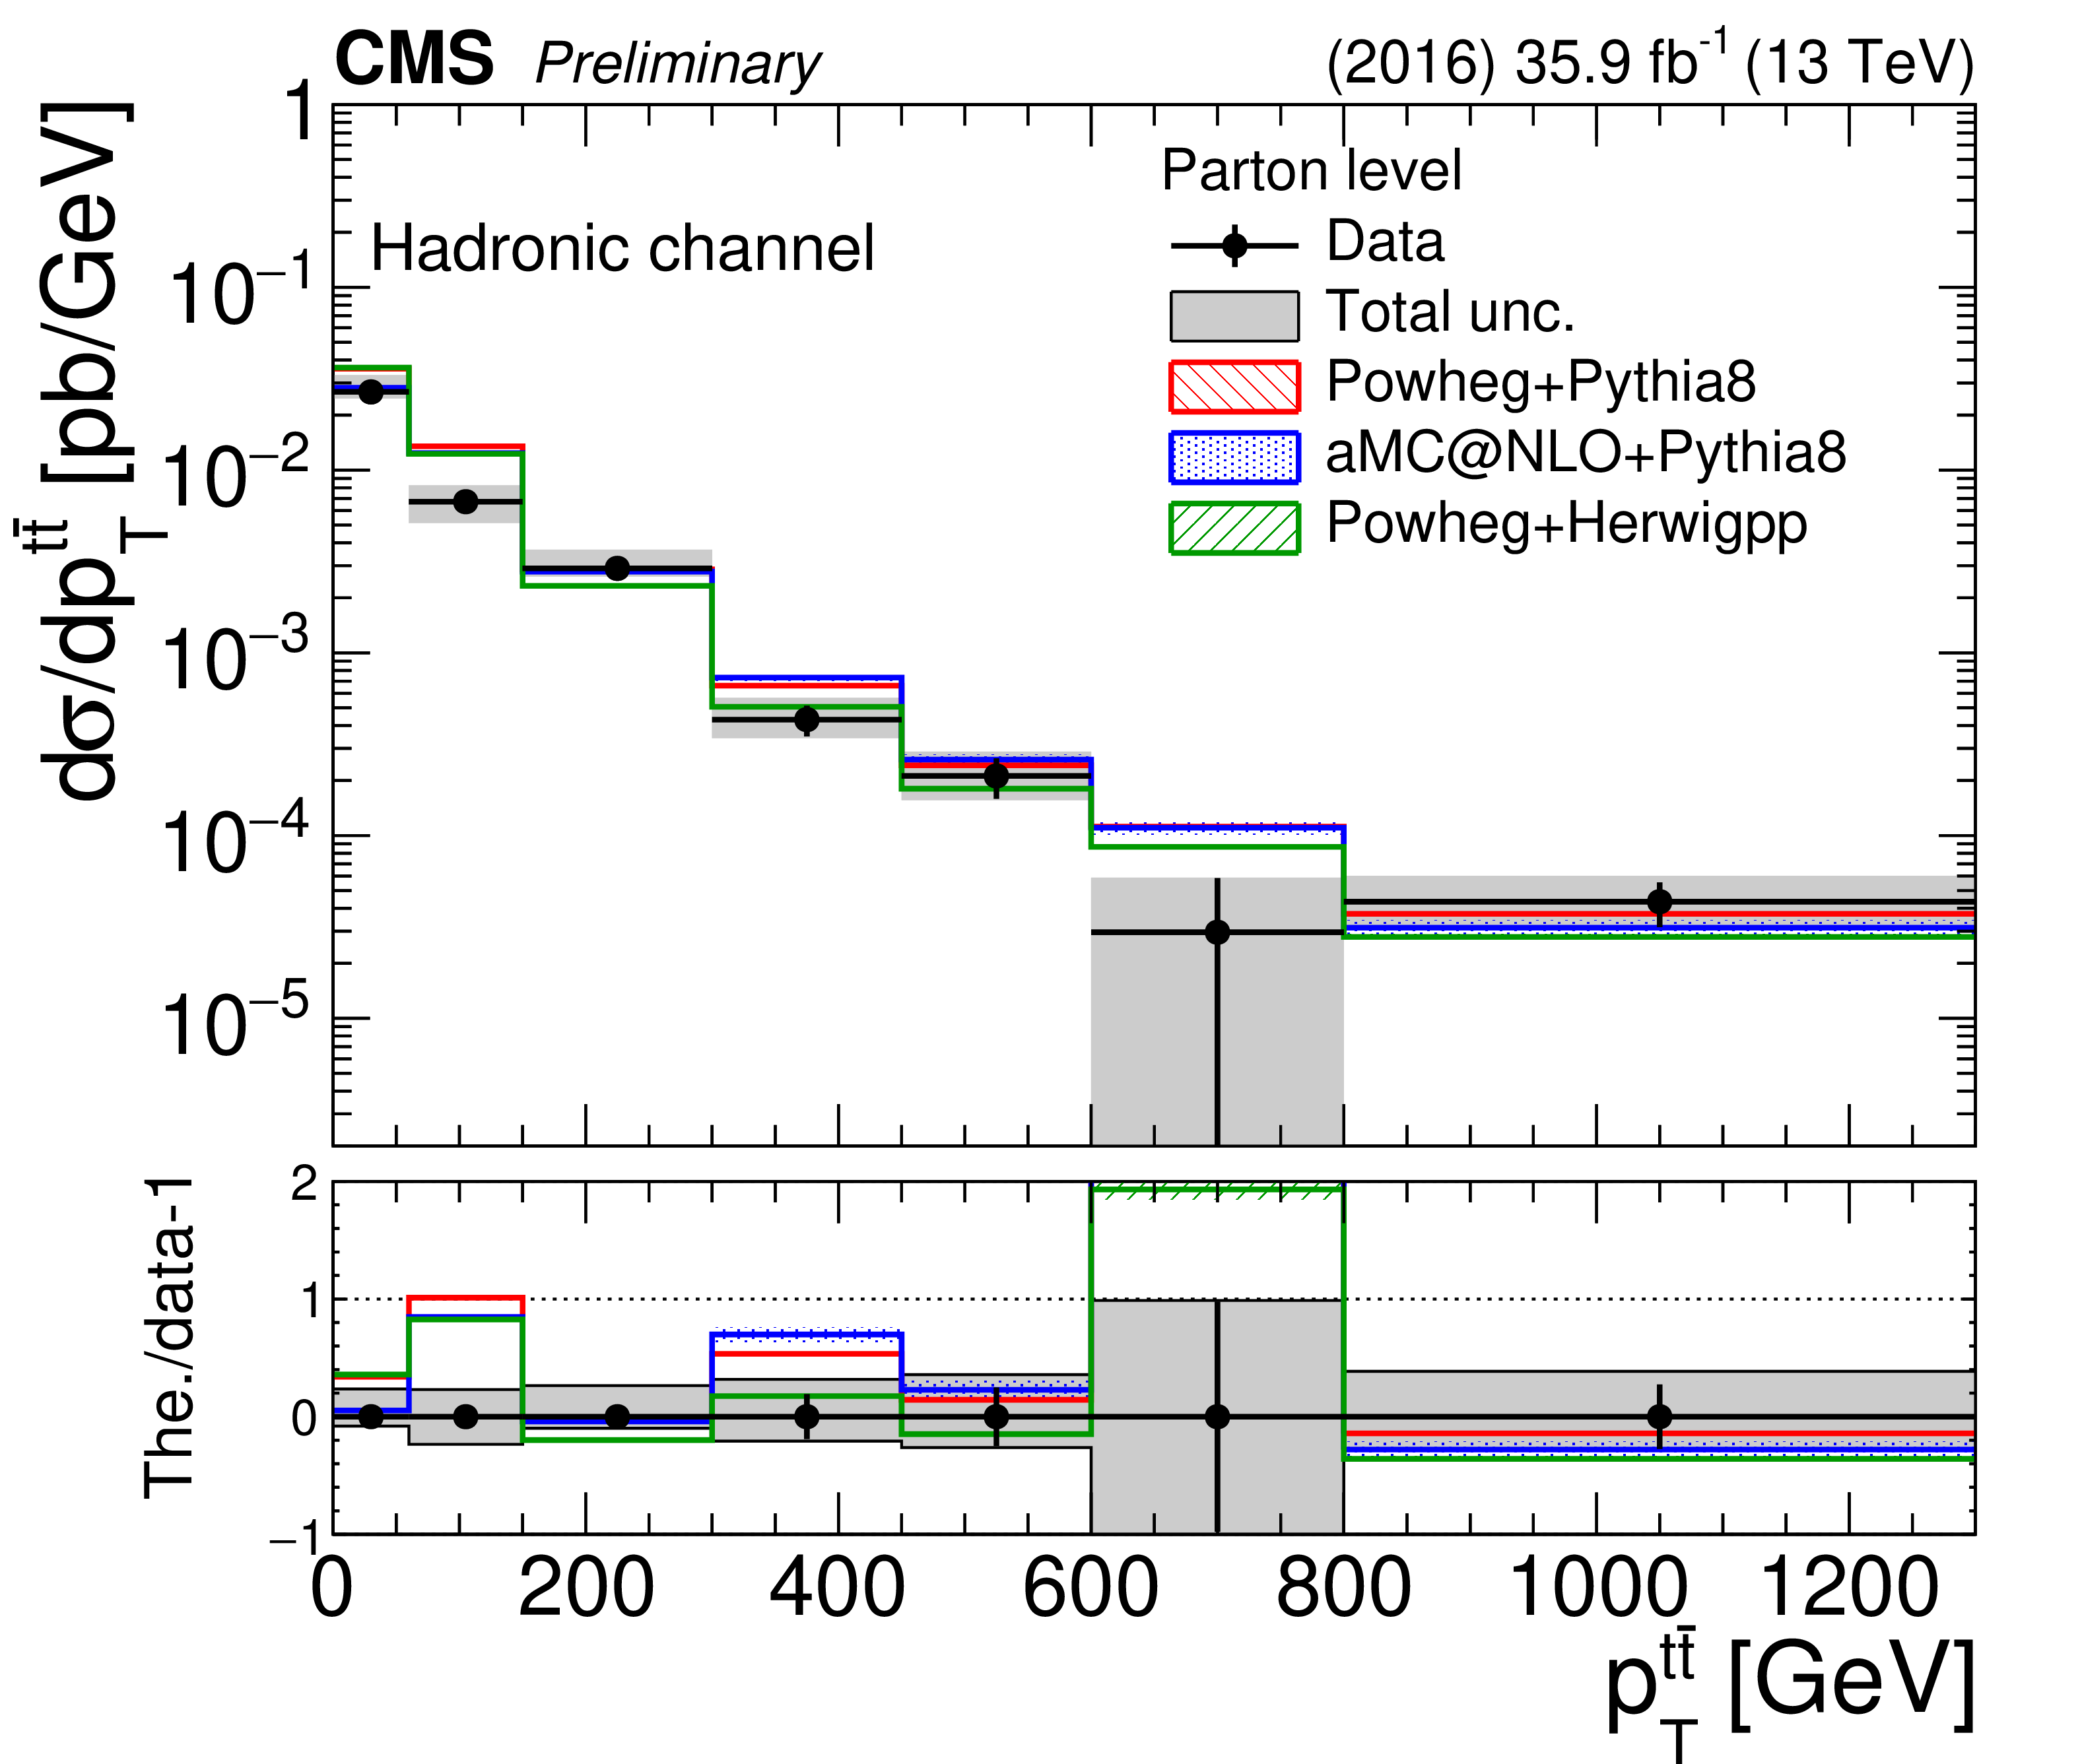
Figure 26:
Differential cross section unfolded to the parton level, absolute (left) and normalized (right), as a function of $ {p_{\mathrm {T}}} ^{{\mathrm{t\bar{t}}}}$ in the hadronic channel. The bottom panel shows the ratio (theory $-$ data)/data. The uncertainties on the data markers are statistical, while the grey band shows the total statistical and systematic uncertainty. |
png pdf |
Figure 26-a:
Differential cross section unfolded to the parton level, absolute (left) and normalized (right), as a function of $ {p_{\mathrm {T}}} ^{{\mathrm{t\bar{t}}}}$ in the hadronic channel. The bottom panel shows the ratio (theory $-$ data)/data. The uncertainties on the data markers are statistical, while the grey band shows the total statistical and systematic uncertainty. |
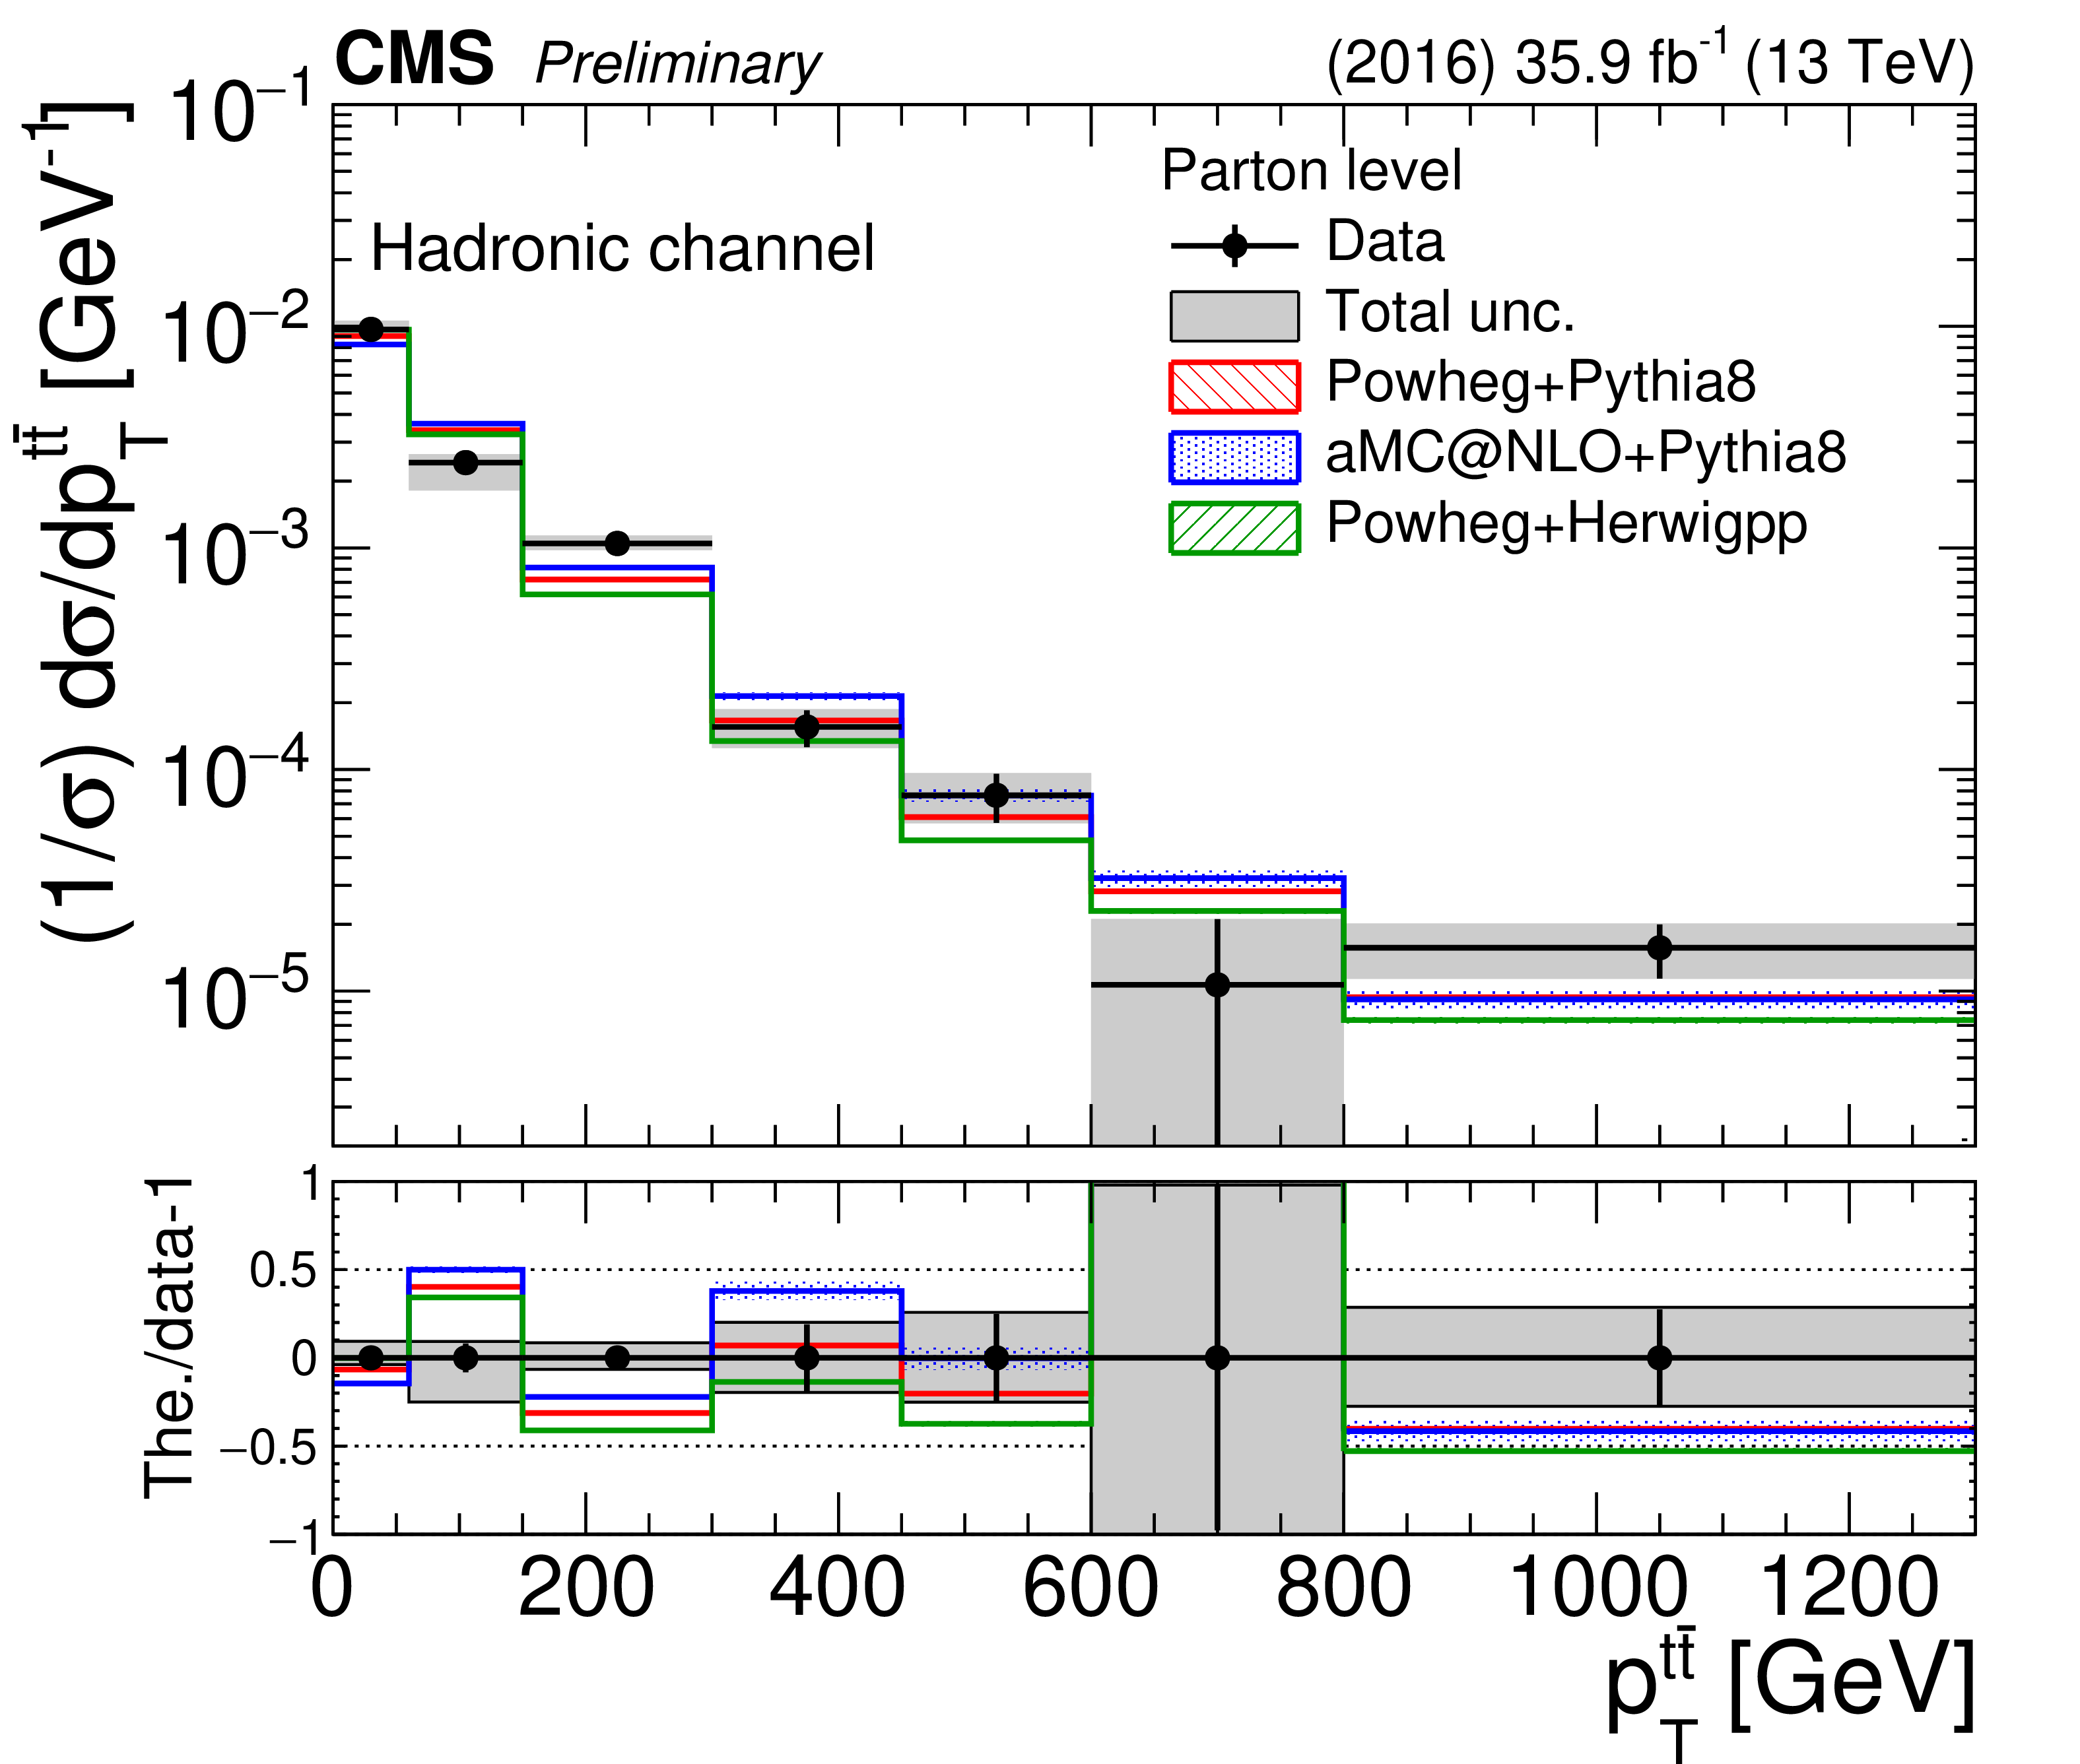
png pdf |
Figure 26-b:
Differential cross section unfolded to the parton level, absolute (left) and normalized (right), as a function of $ {p_{\mathrm {T}}} ^{{\mathrm{t\bar{t}}}}$ in the hadronic channel. The bottom panel shows the ratio (theory $-$ data)/data. The uncertainties on the data markers are statistical, while the grey band shows the total statistical and systematic uncertainty. |
png pdf |
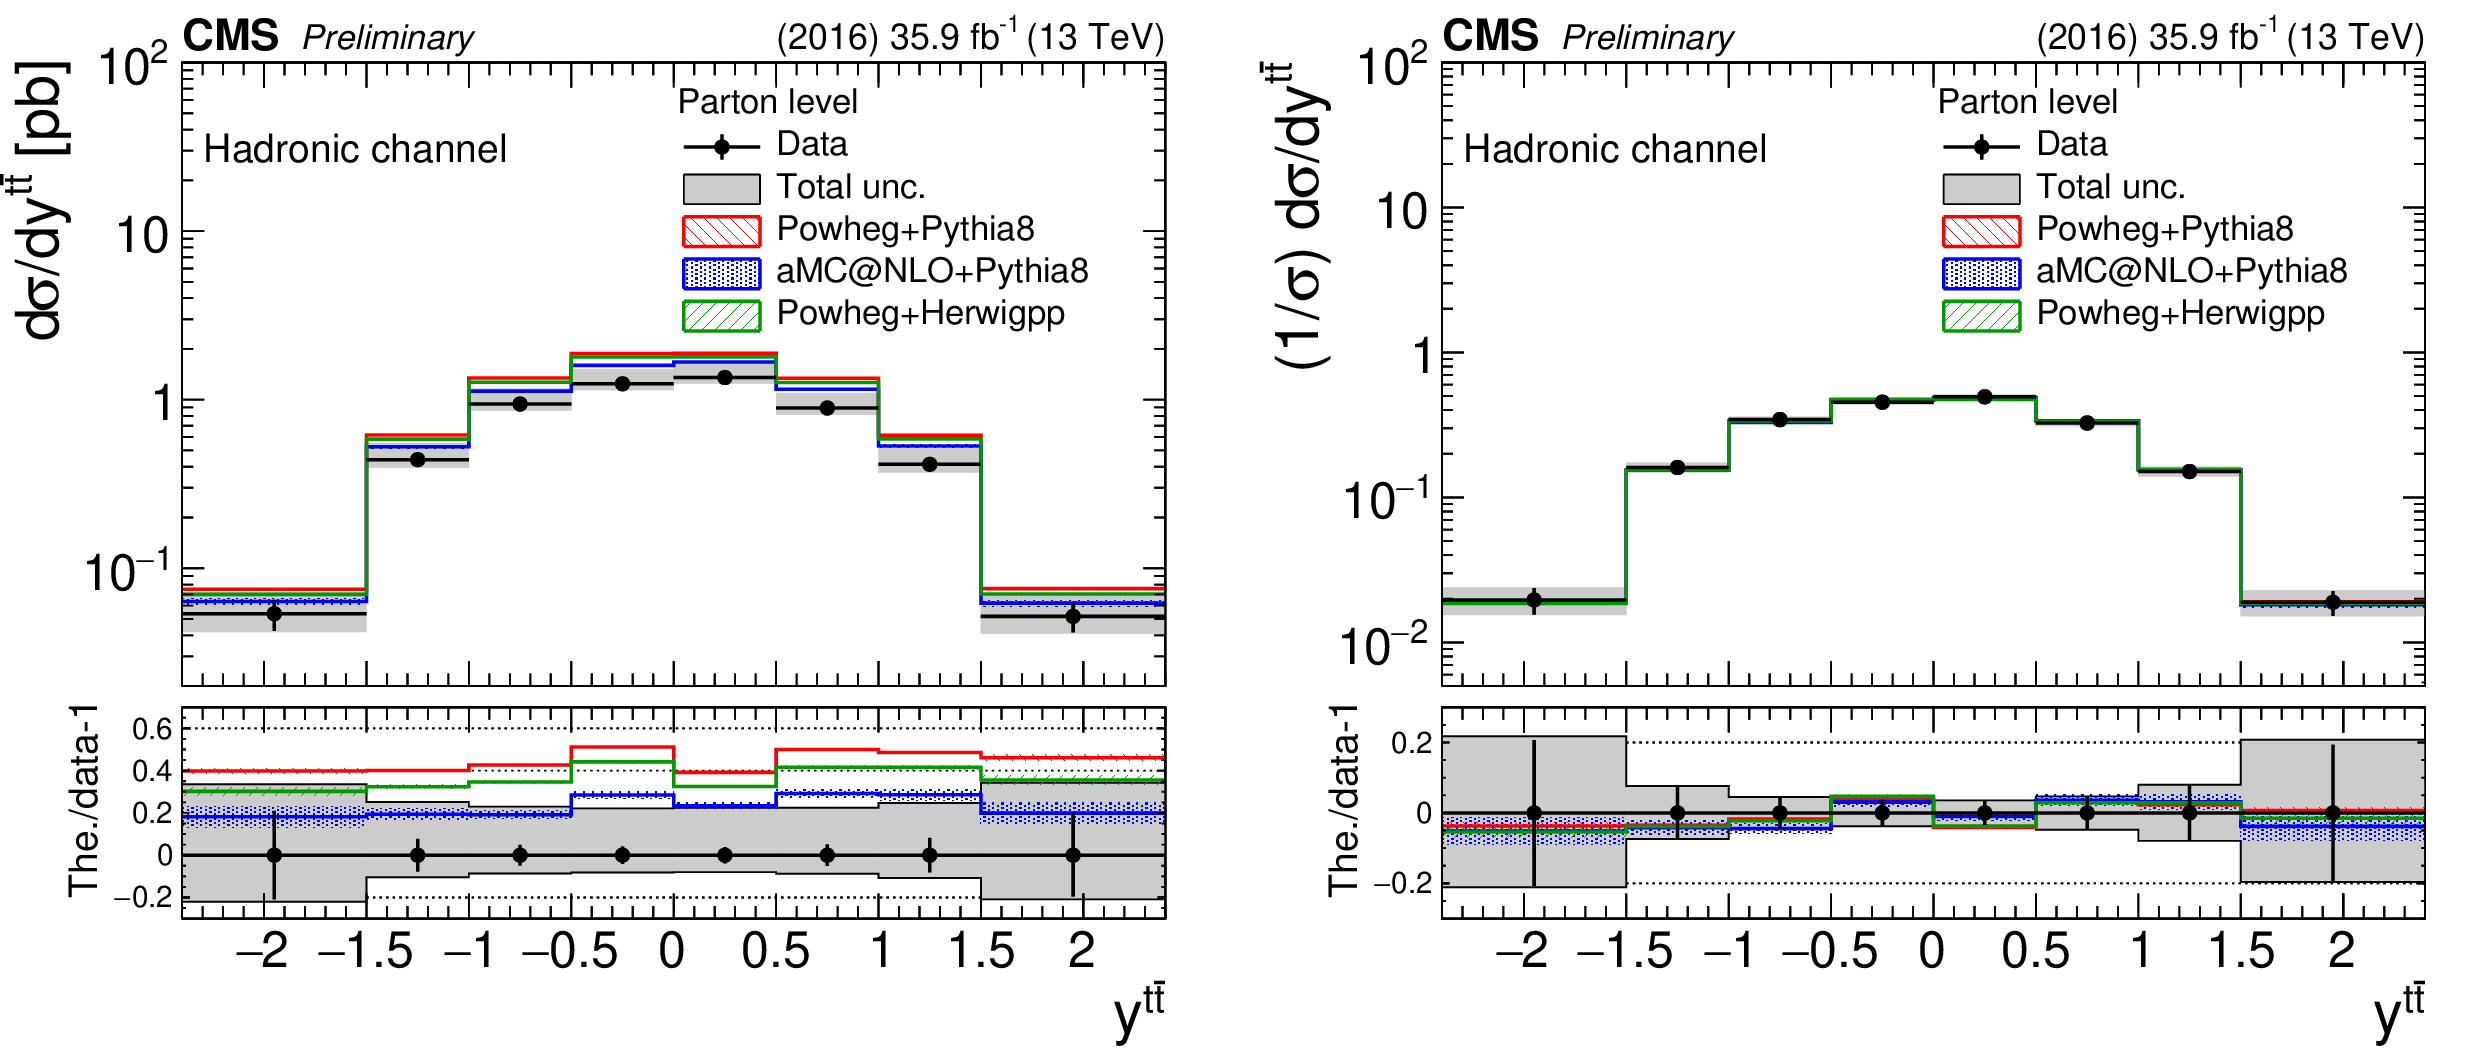
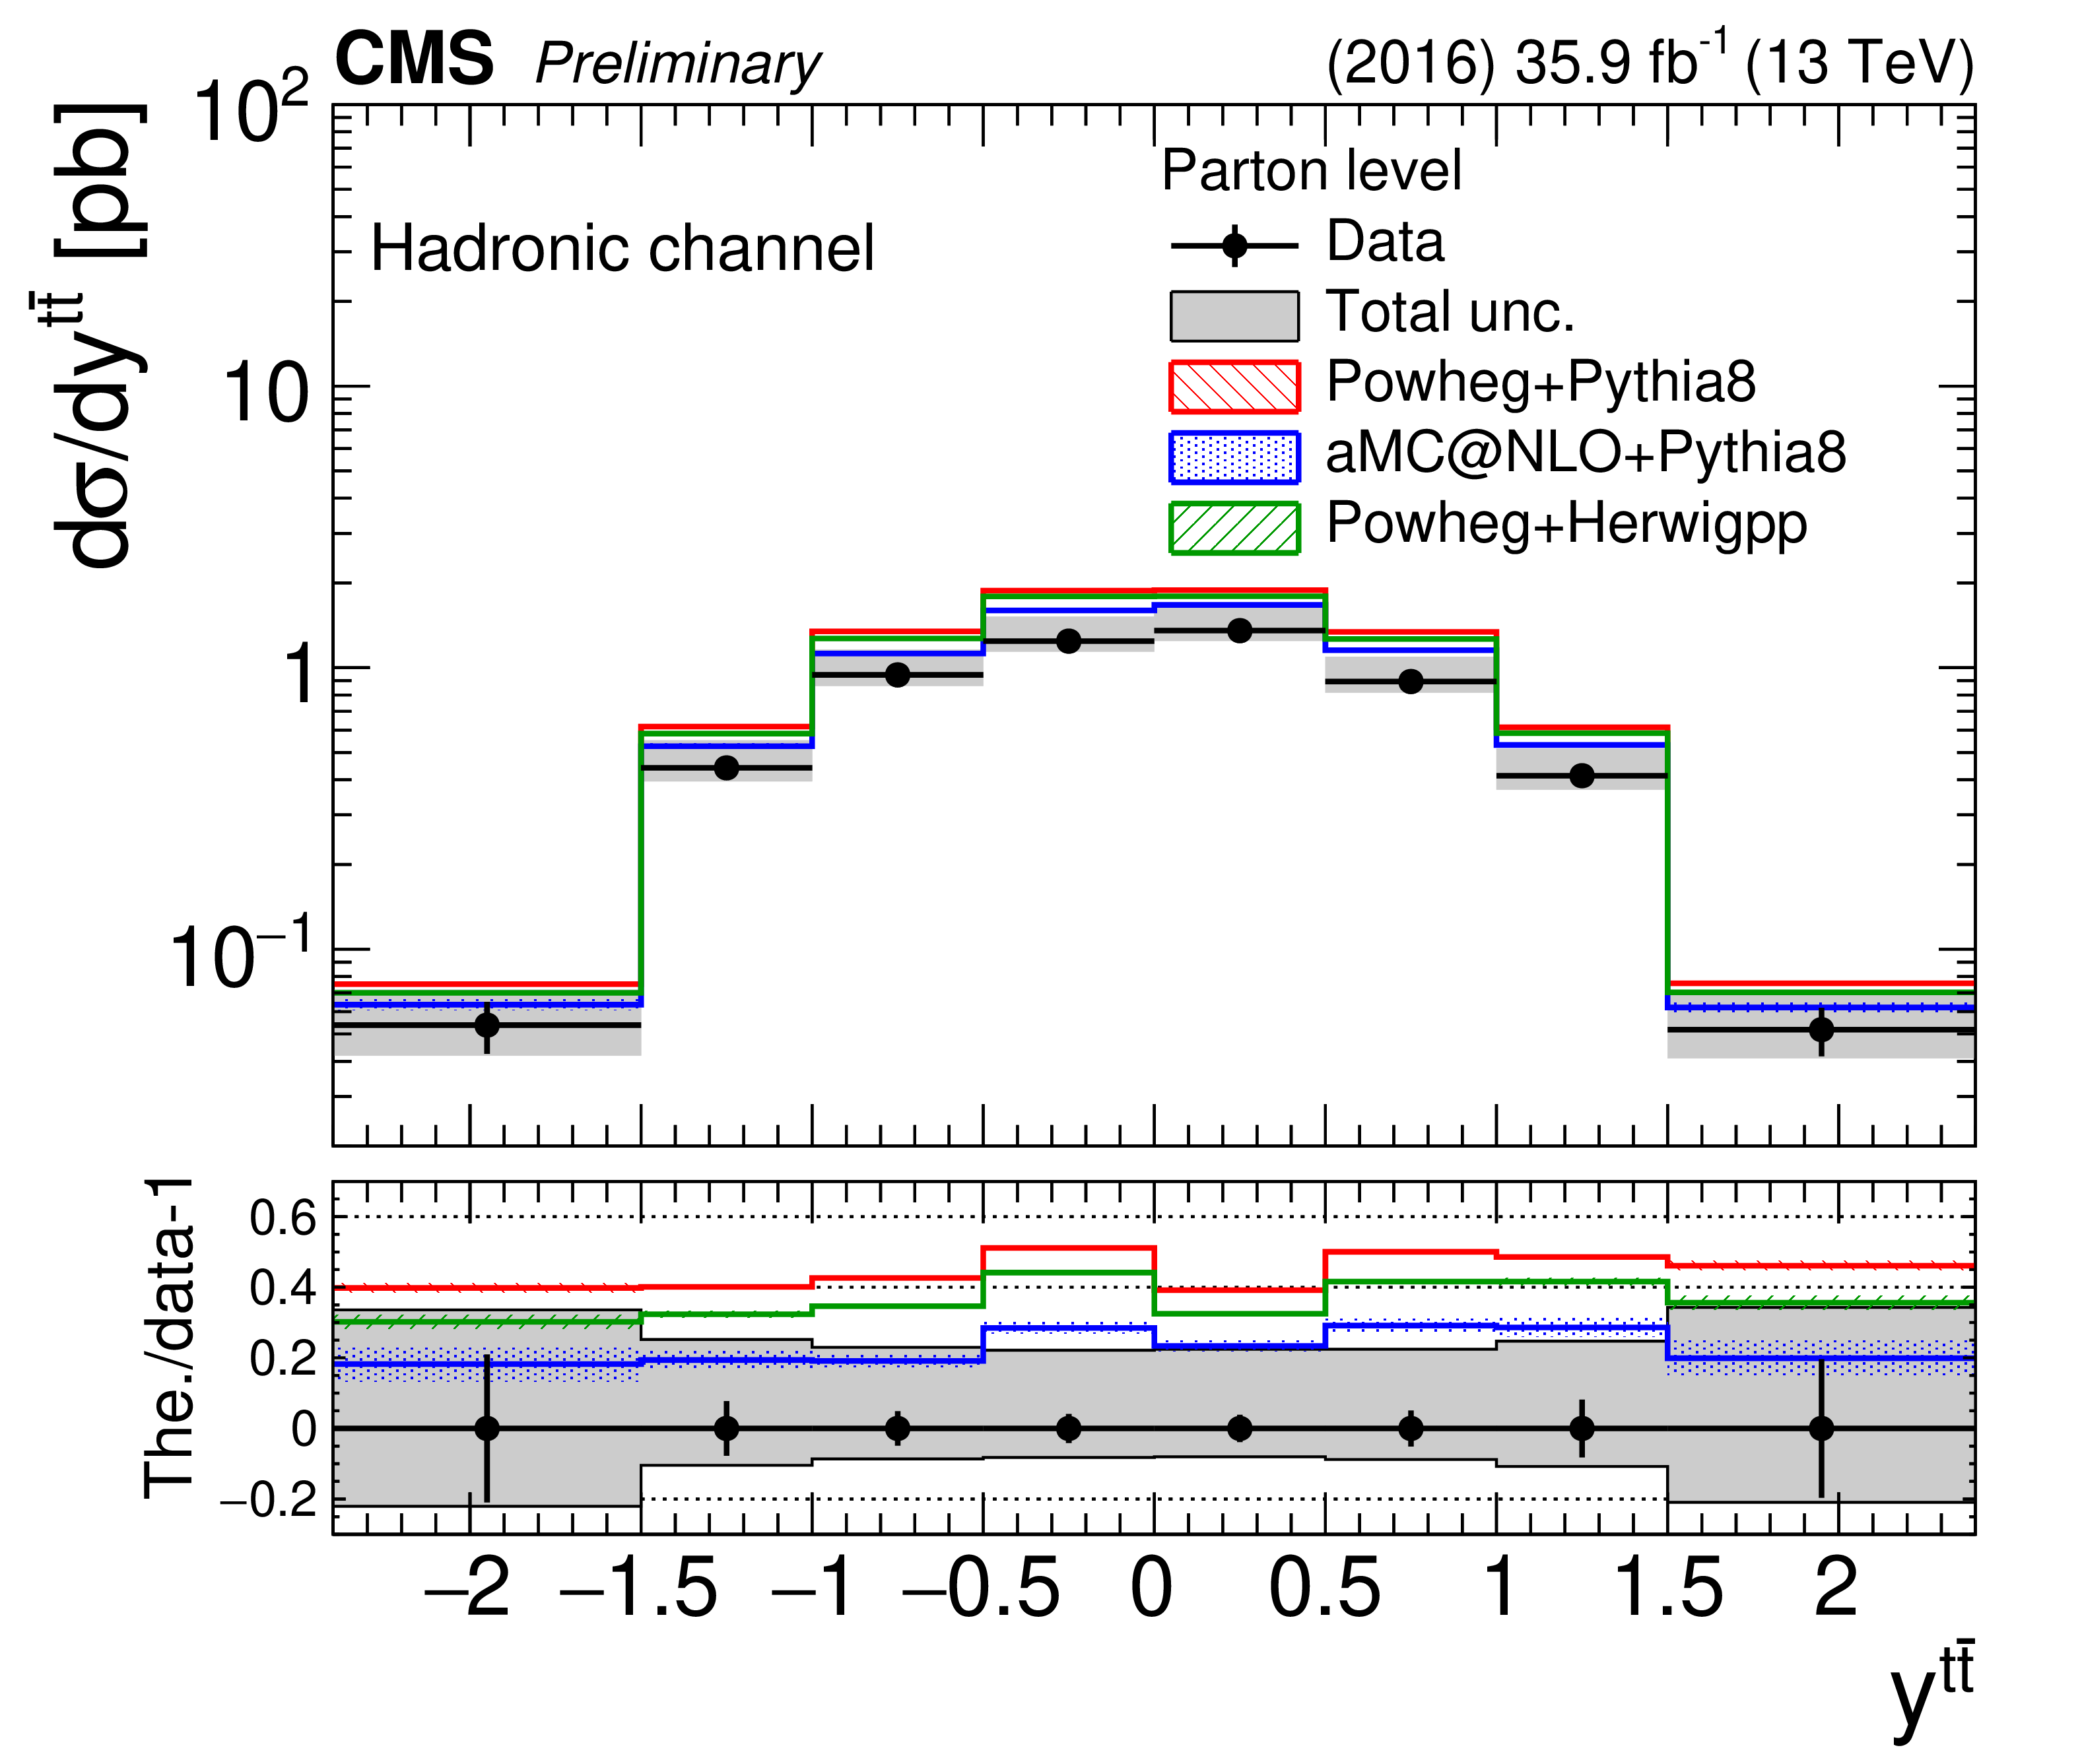
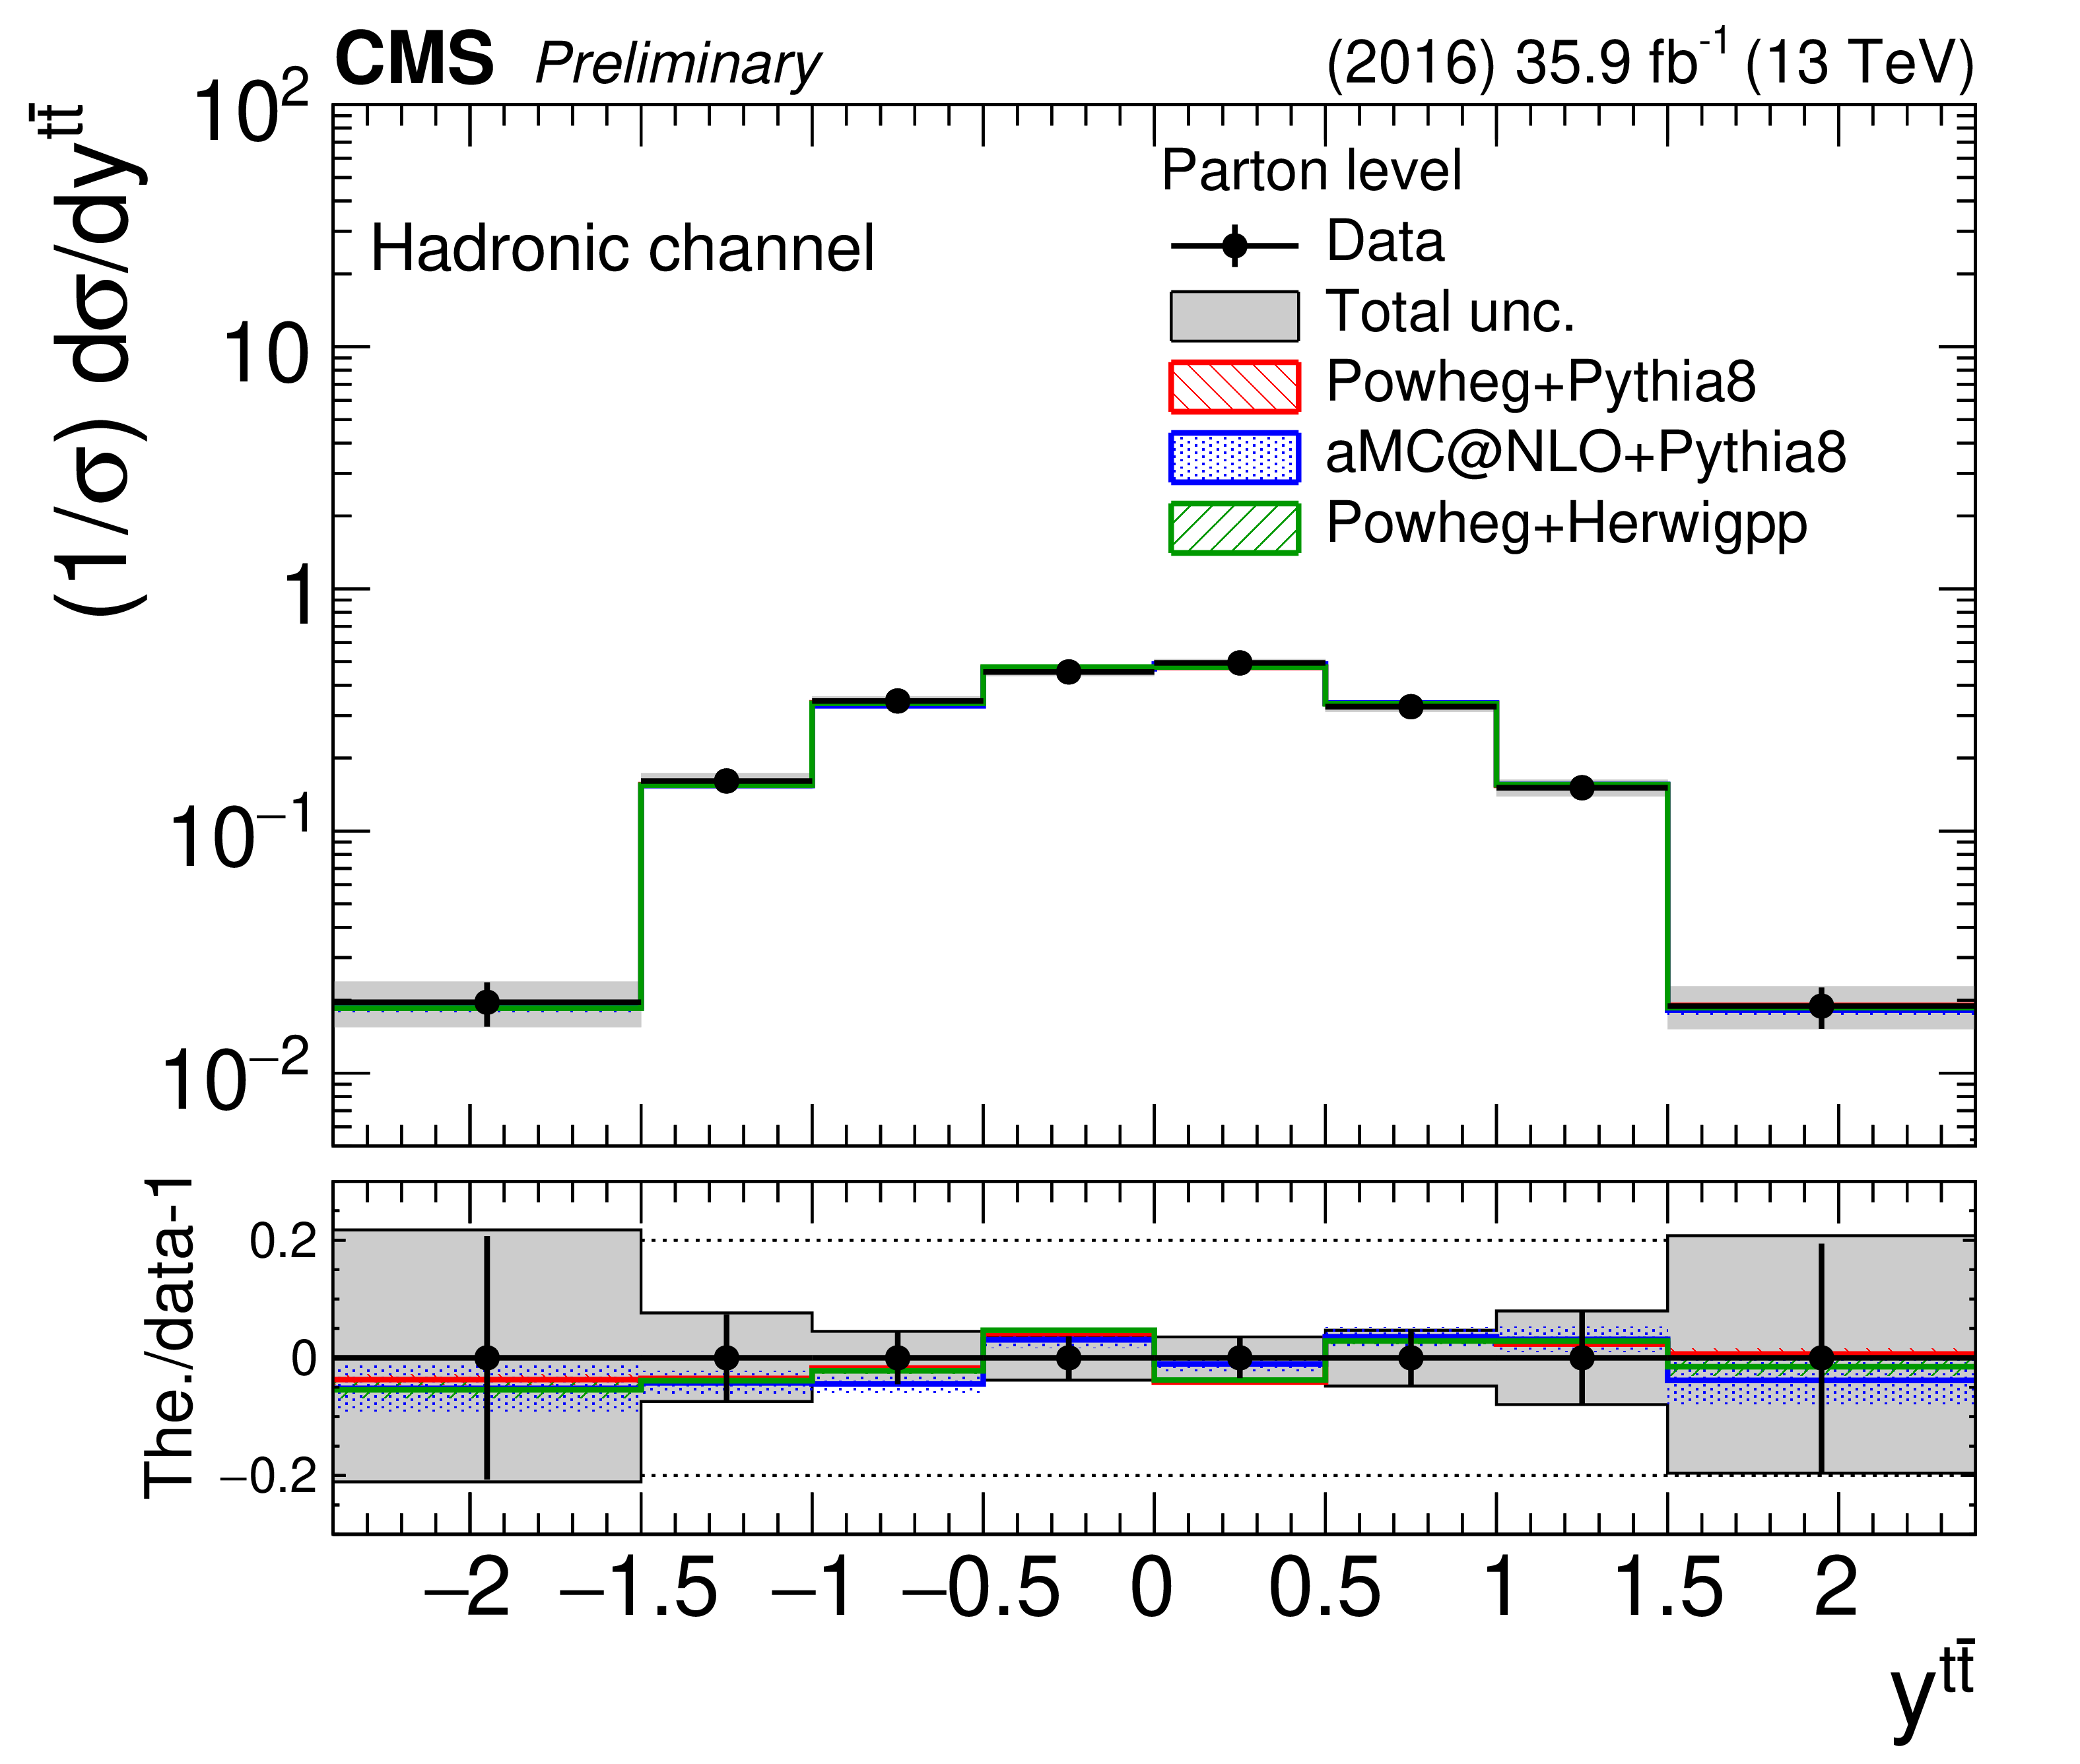
Figure 27:
Differential cross section unfolded to the parton level, absolute (left) and normalized (right), as a function of $y^{{\mathrm{t\bar{t}}}}$ in the hadronic channel. The bottom panel shows the ratio (theory $-$ data)/data. The uncertainties on the data markers are statistical, while the grey band shows the total statistical and systematic uncertainty. |
png pdf |
Figure 27-a:
Differential cross section unfolded to the parton level, absolute (left) and normalized (right), as a function of $y^{{\mathrm{t\bar{t}}}}$ in the hadronic channel. The bottom panel shows the ratio (theory $-$ data)/data. The uncertainties on the data markers are statistical, while the grey band shows the total statistical and systematic uncertainty. |
png pdf |
Figure 27-b:
Differential cross section unfolded to the parton level, absolute (left) and normalized (right), as a function of $y^{{\mathrm{t\bar{t}}}}$ in the hadronic channel. The bottom panel shows the ratio (theory $-$ data)/data. The uncertainties on the data markers are statistical, while the grey band shows the total statistical and systematic uncertainty. |
png pdf |
Figure 28:
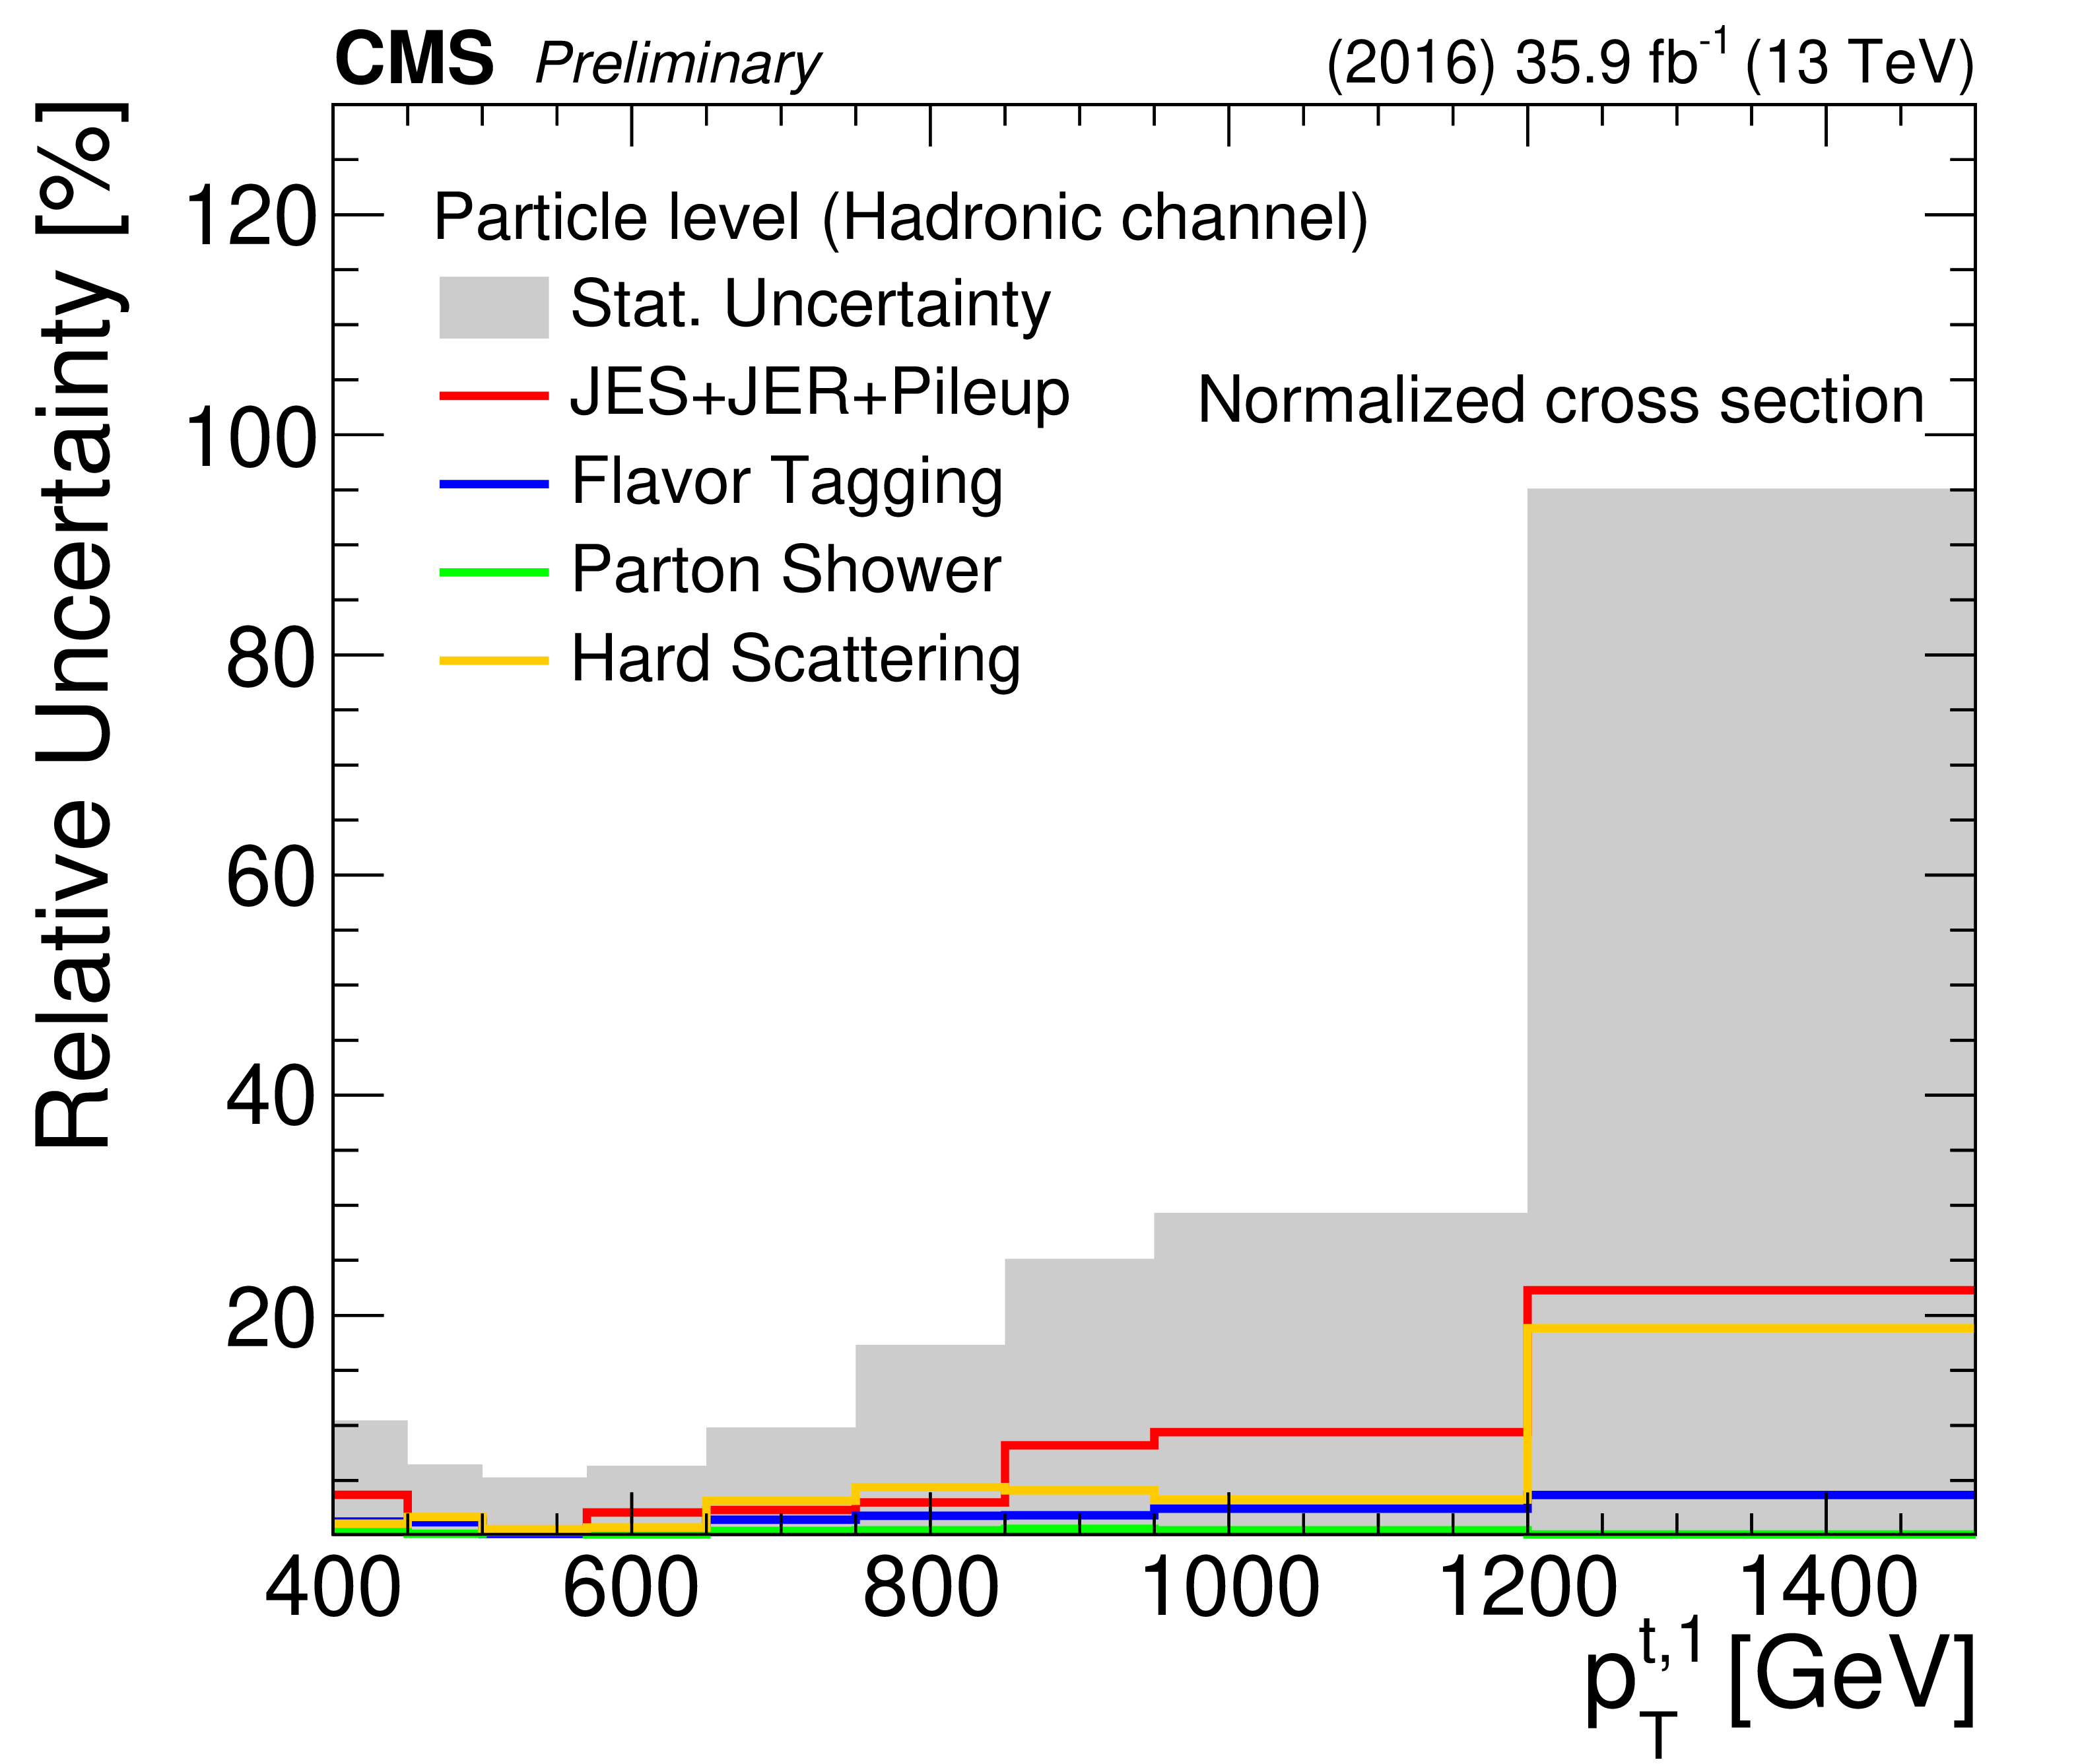
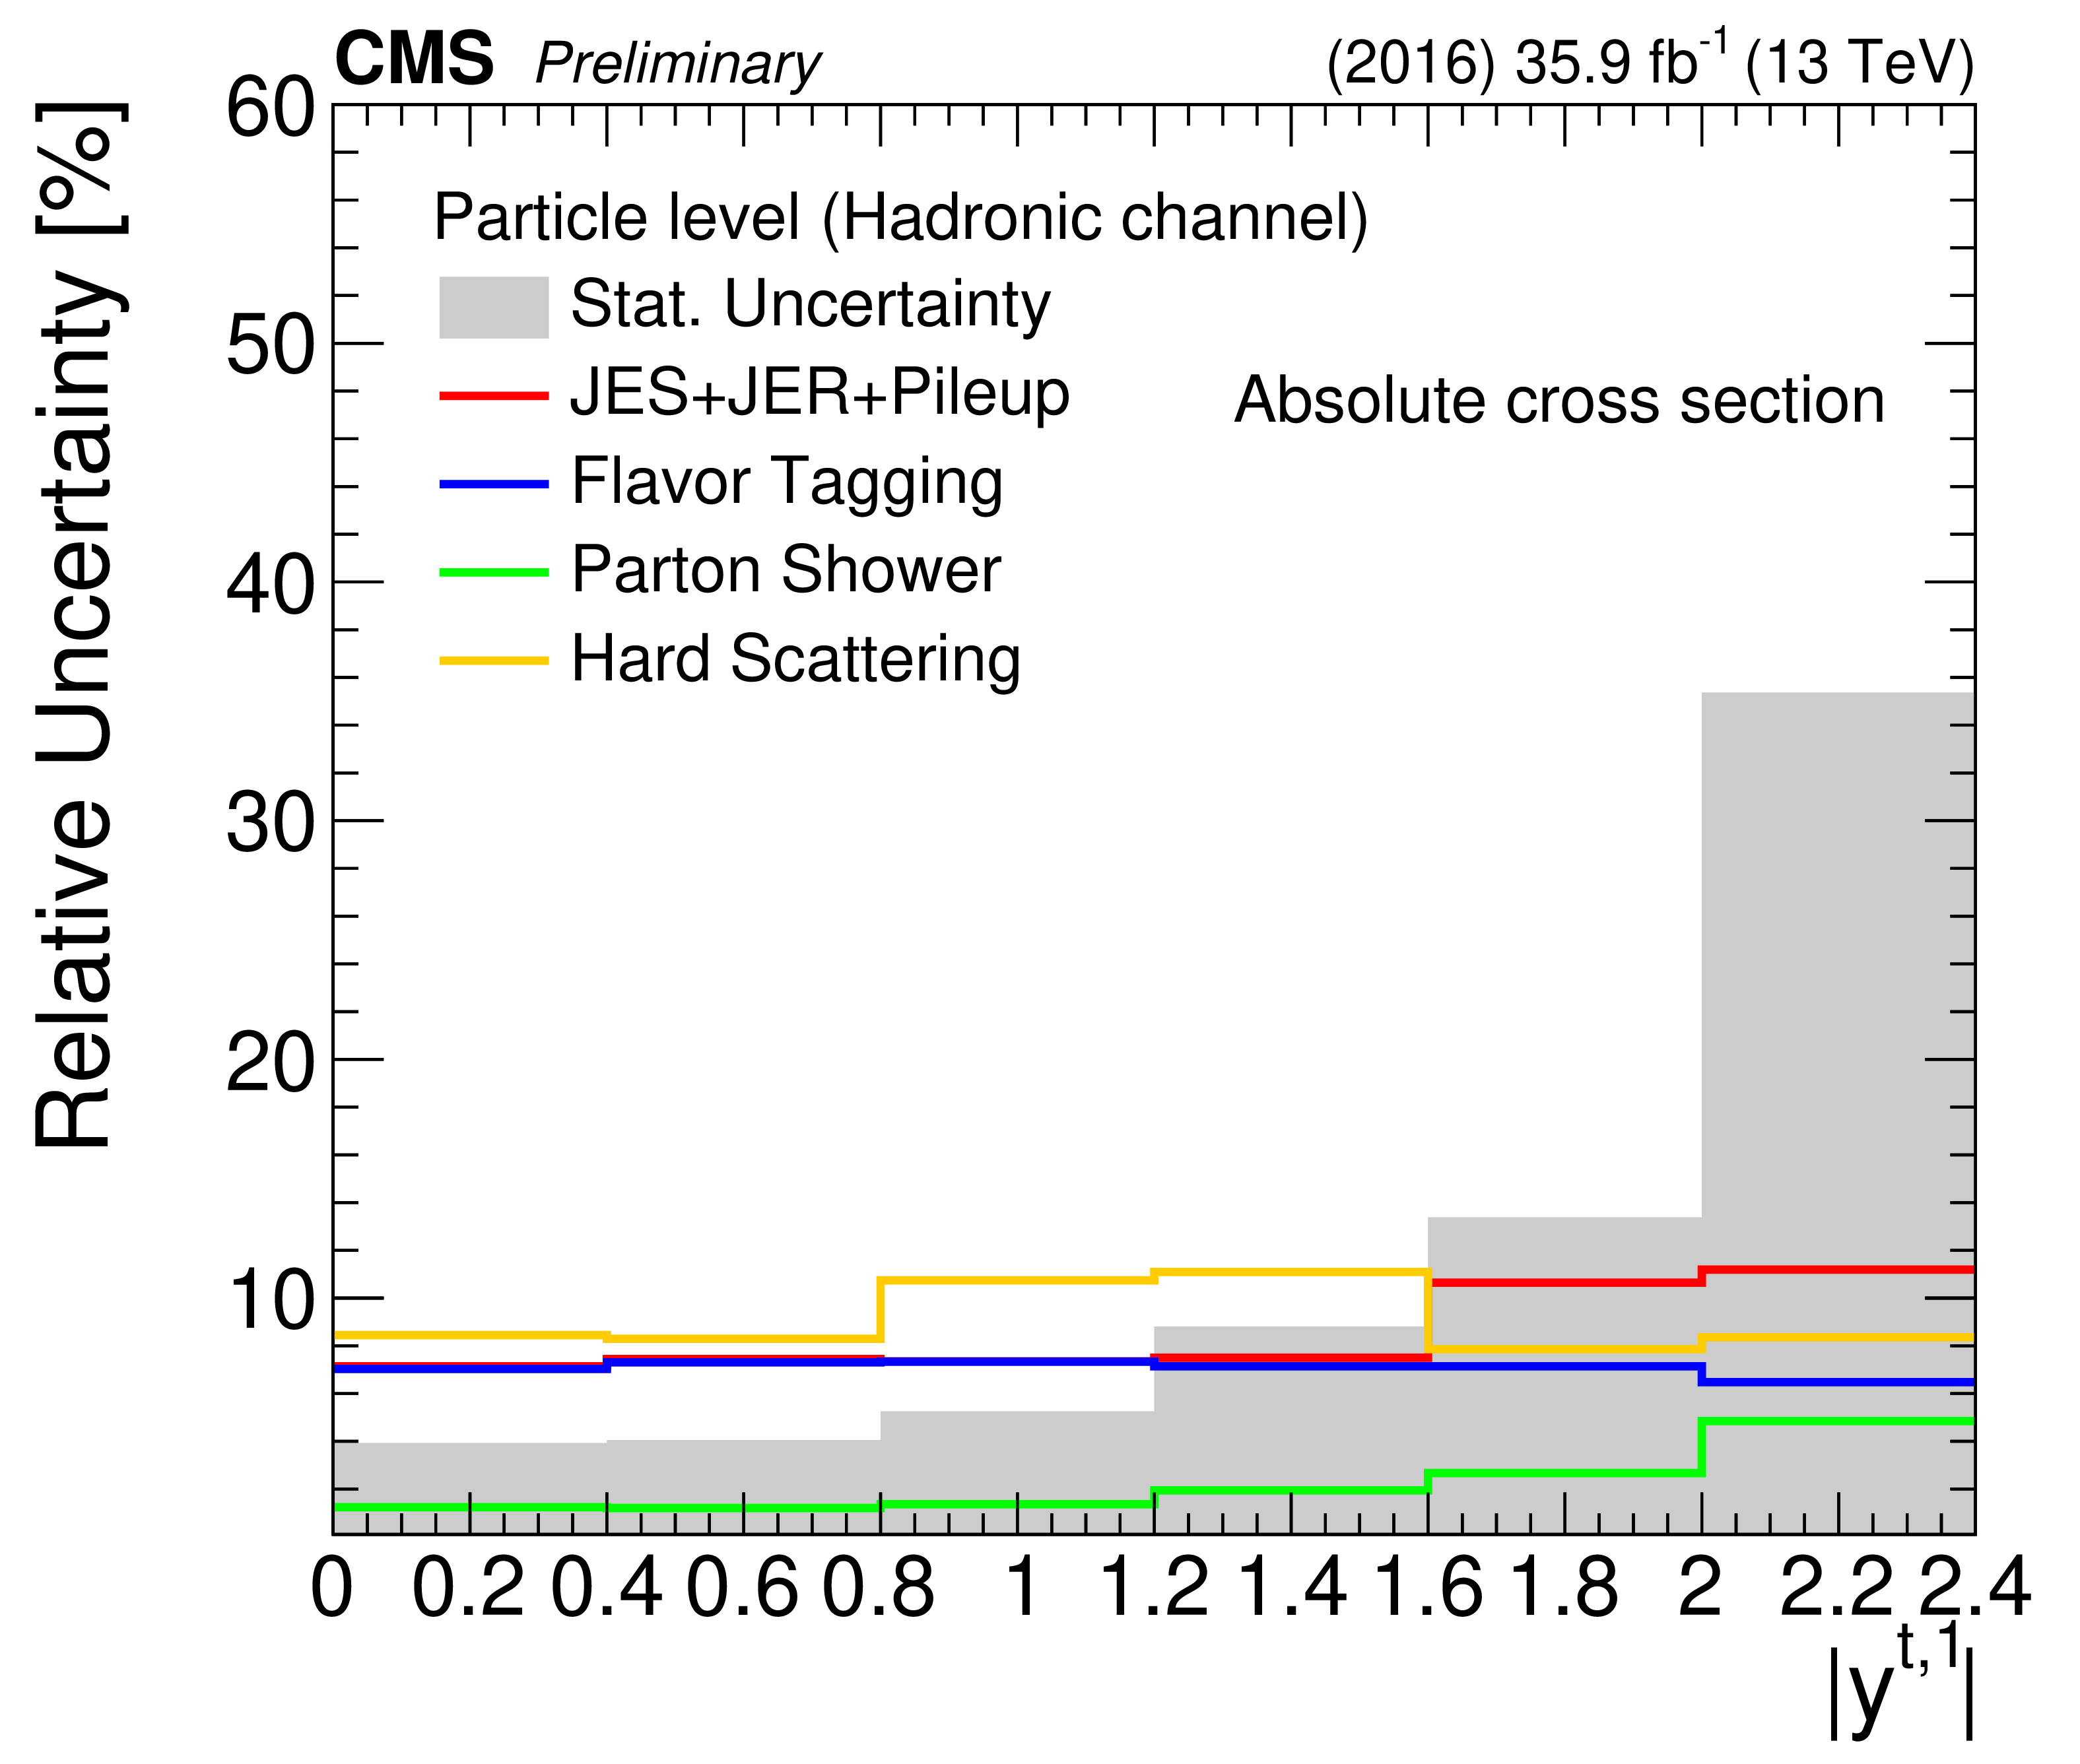
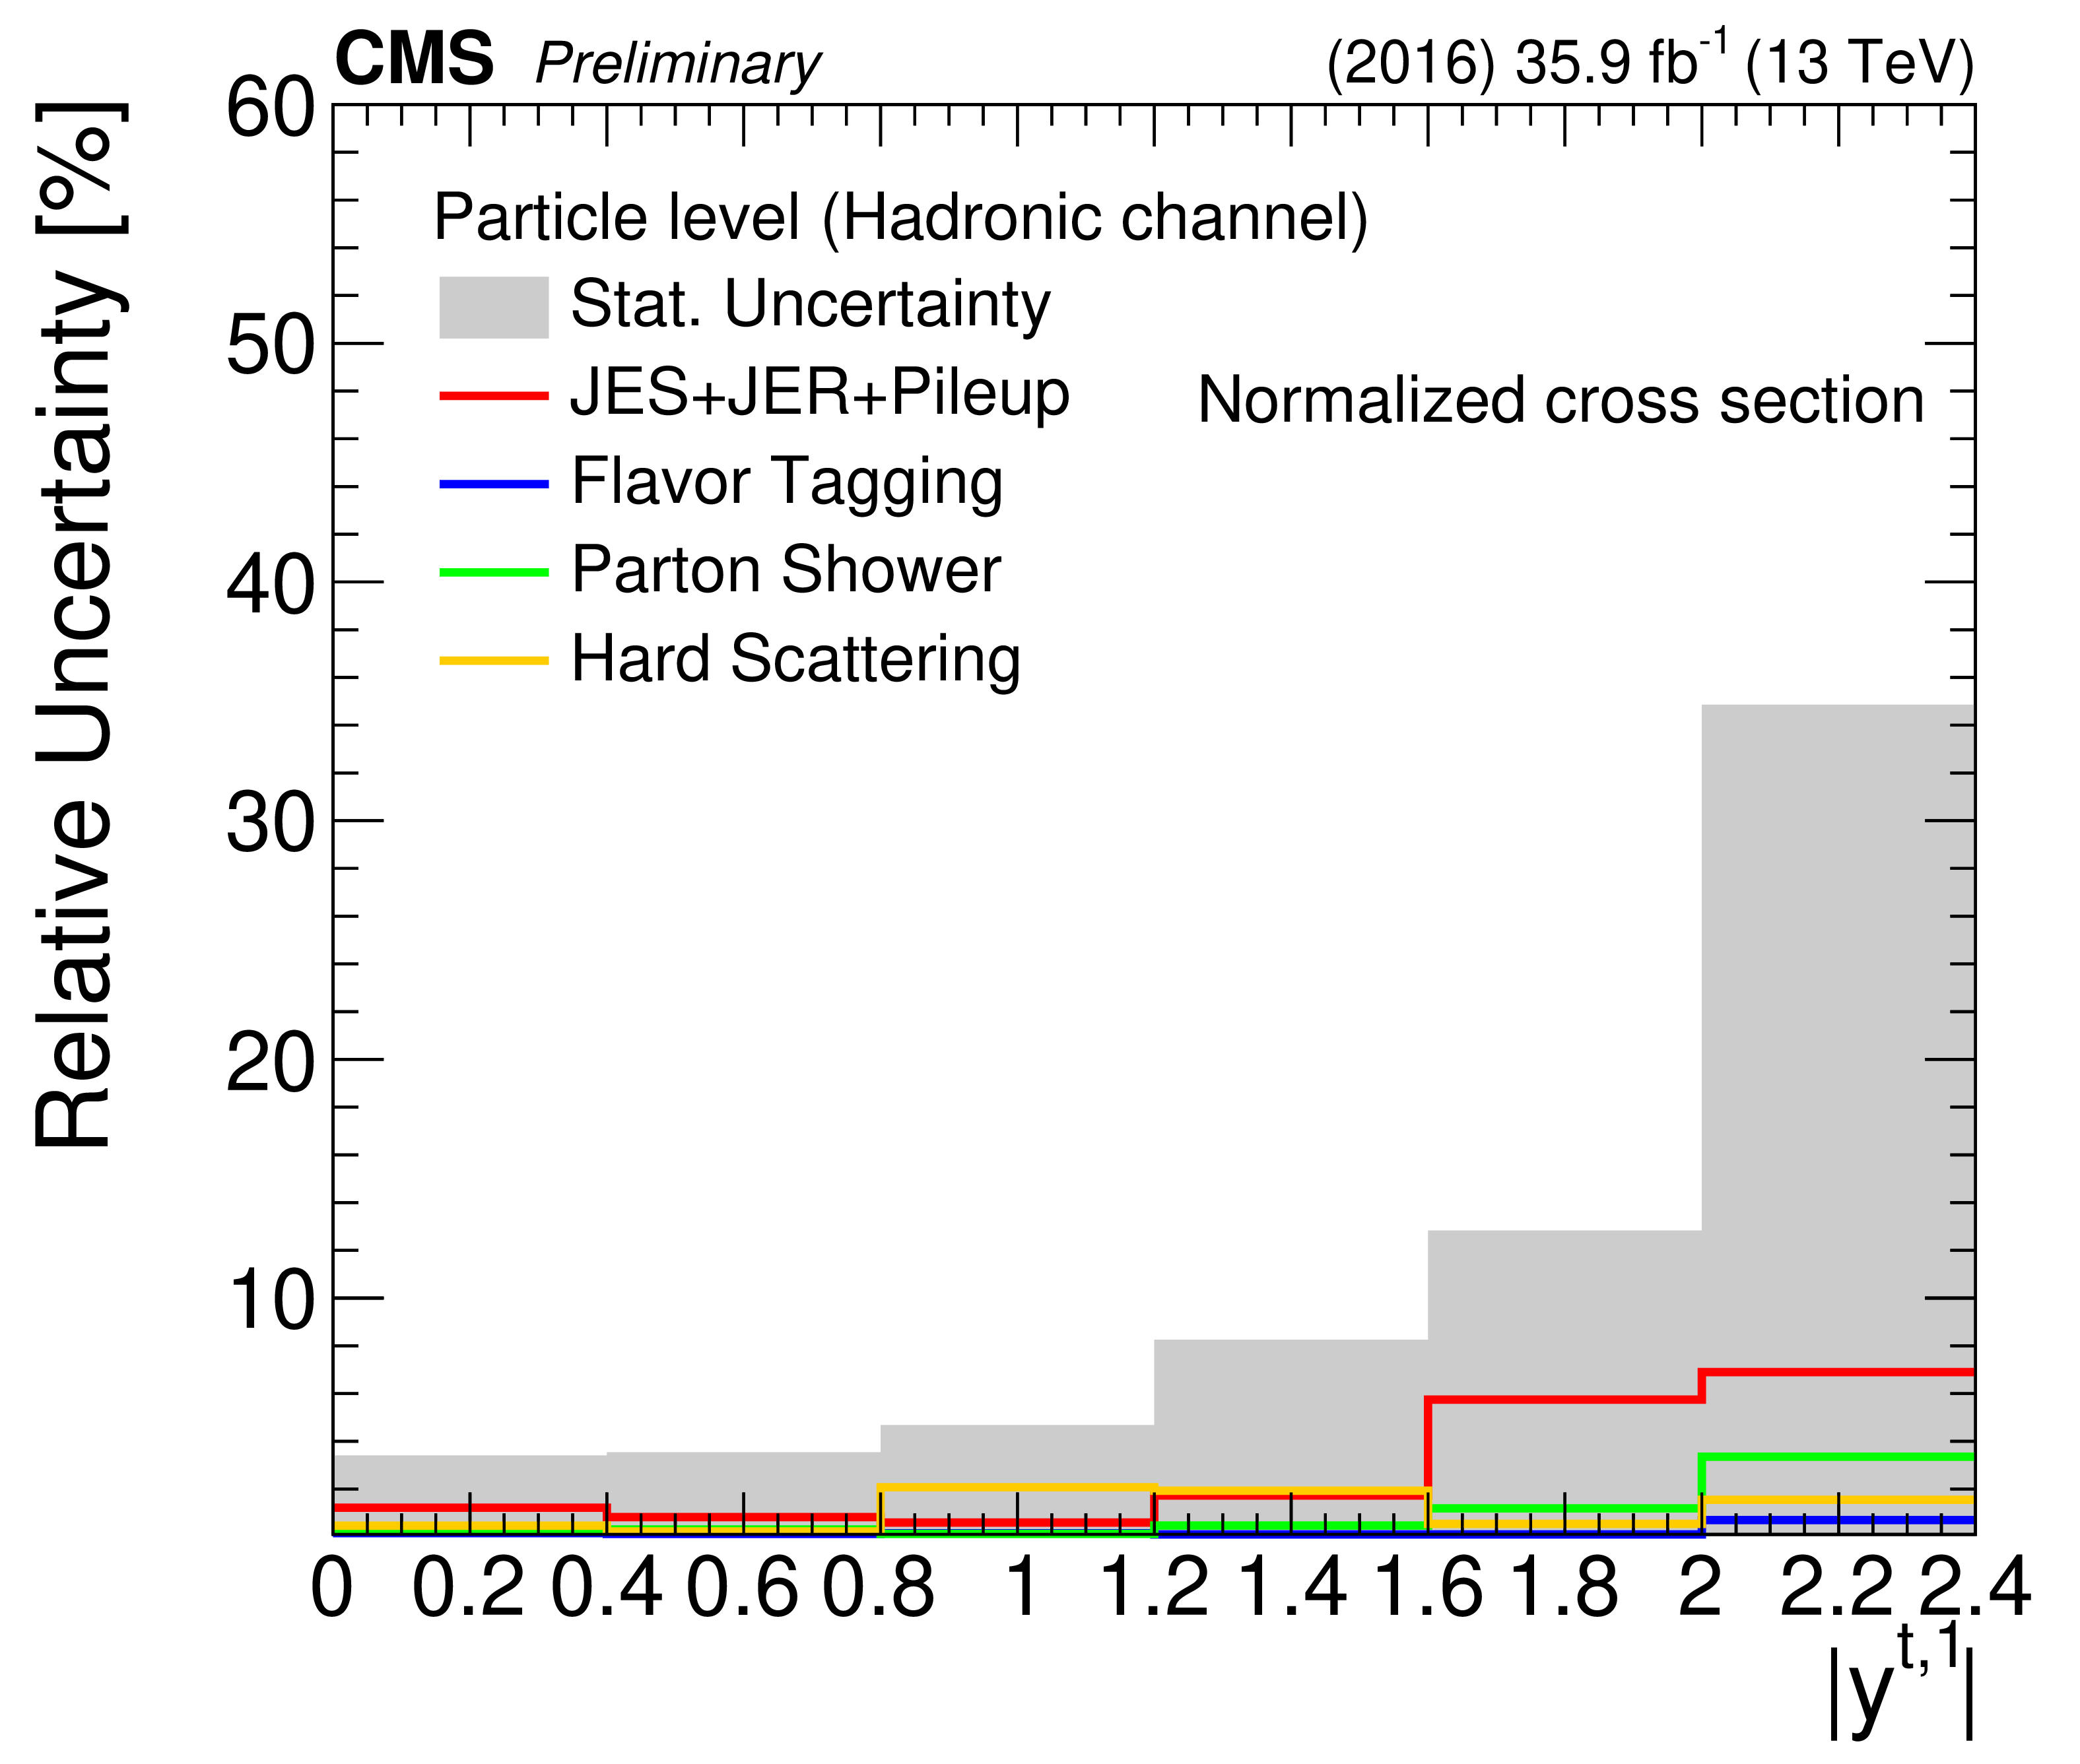
Decomposition of uncertainties in the absolute (left) and normalized (right) measurements at the particle level as a function of the leading top quark ${p_{\mathrm {T}}}$ (top) and $|y|$ (bottom) in the hadronic channel. The grey band shows the statistical uncertainty, while the solid lines show the systematic uncertainties grouped in four categories: a) uncertainty due to pileup and the jet energy scale and resolution of the large-$R$ jets, b) uncertainty due to flavor tagging of the subjets, c) uncertainty due to the modeling of the parton shower, and d) uncertainty due to the modeling of the hard scattering. |
png pdf |
Figure 28-a:
Decomposition of uncertainties in the absolute (left) and normalized (right) measurements at the particle level as a function of the leading top quark ${p_{\mathrm {T}}}$ (top) and $|y|$ (bottom) in the hadronic channel. The grey band shows the statistical uncertainty, while the solid lines show the systematic uncertainties grouped in four categories: a) uncertainty due to pileup and the jet energy scale and resolution of the large-$R$ jets, b) uncertainty due to flavor tagging of the subjets, c) uncertainty due to the modeling of the parton shower, and d) uncertainty due to the modeling of the hard scattering. |
png pdf |
Figure 28-b:
Decomposition of uncertainties in the absolute (left) and normalized (right) measurements at the particle level as a function of the leading top quark ${p_{\mathrm {T}}}$ (top) and $|y|$ (bottom) in the hadronic channel. The grey band shows the statistical uncertainty, while the solid lines show the systematic uncertainties grouped in four categories: a) uncertainty due to pileup and the jet energy scale and resolution of the large-$R$ jets, b) uncertainty due to flavor tagging of the subjets, c) uncertainty due to the modeling of the parton shower, and d) uncertainty due to the modeling of the hard scattering. |
png pdf |
Figure 28-c:
Decomposition of uncertainties in the absolute (left) and normalized (right) measurements at the particle level as a function of the leading top quark ${p_{\mathrm {T}}}$ (top) and $|y|$ (bottom) in the hadronic channel. The grey band shows the statistical uncertainty, while the solid lines show the systematic uncertainties grouped in four categories: a) uncertainty due to pileup and the jet energy scale and resolution of the large-$R$ jets, b) uncertainty due to flavor tagging of the subjets, c) uncertainty due to the modeling of the parton shower, and d) uncertainty due to the modeling of the hard scattering. |
png pdf |
Figure 28-d:
Decomposition of uncertainties in the absolute (left) and normalized (right) measurements at the particle level as a function of the leading top quark ${p_{\mathrm {T}}}$ (top) and $|y|$ (bottom) in the hadronic channel. The grey band shows the statistical uncertainty, while the solid lines show the systematic uncertainties grouped in four categories: a) uncertainty due to pileup and the jet energy scale and resolution of the large-$R$ jets, b) uncertainty due to flavor tagging of the subjets, c) uncertainty due to the modeling of the parton shower, and d) uncertainty due to the modeling of the hard scattering. |
png pdf |
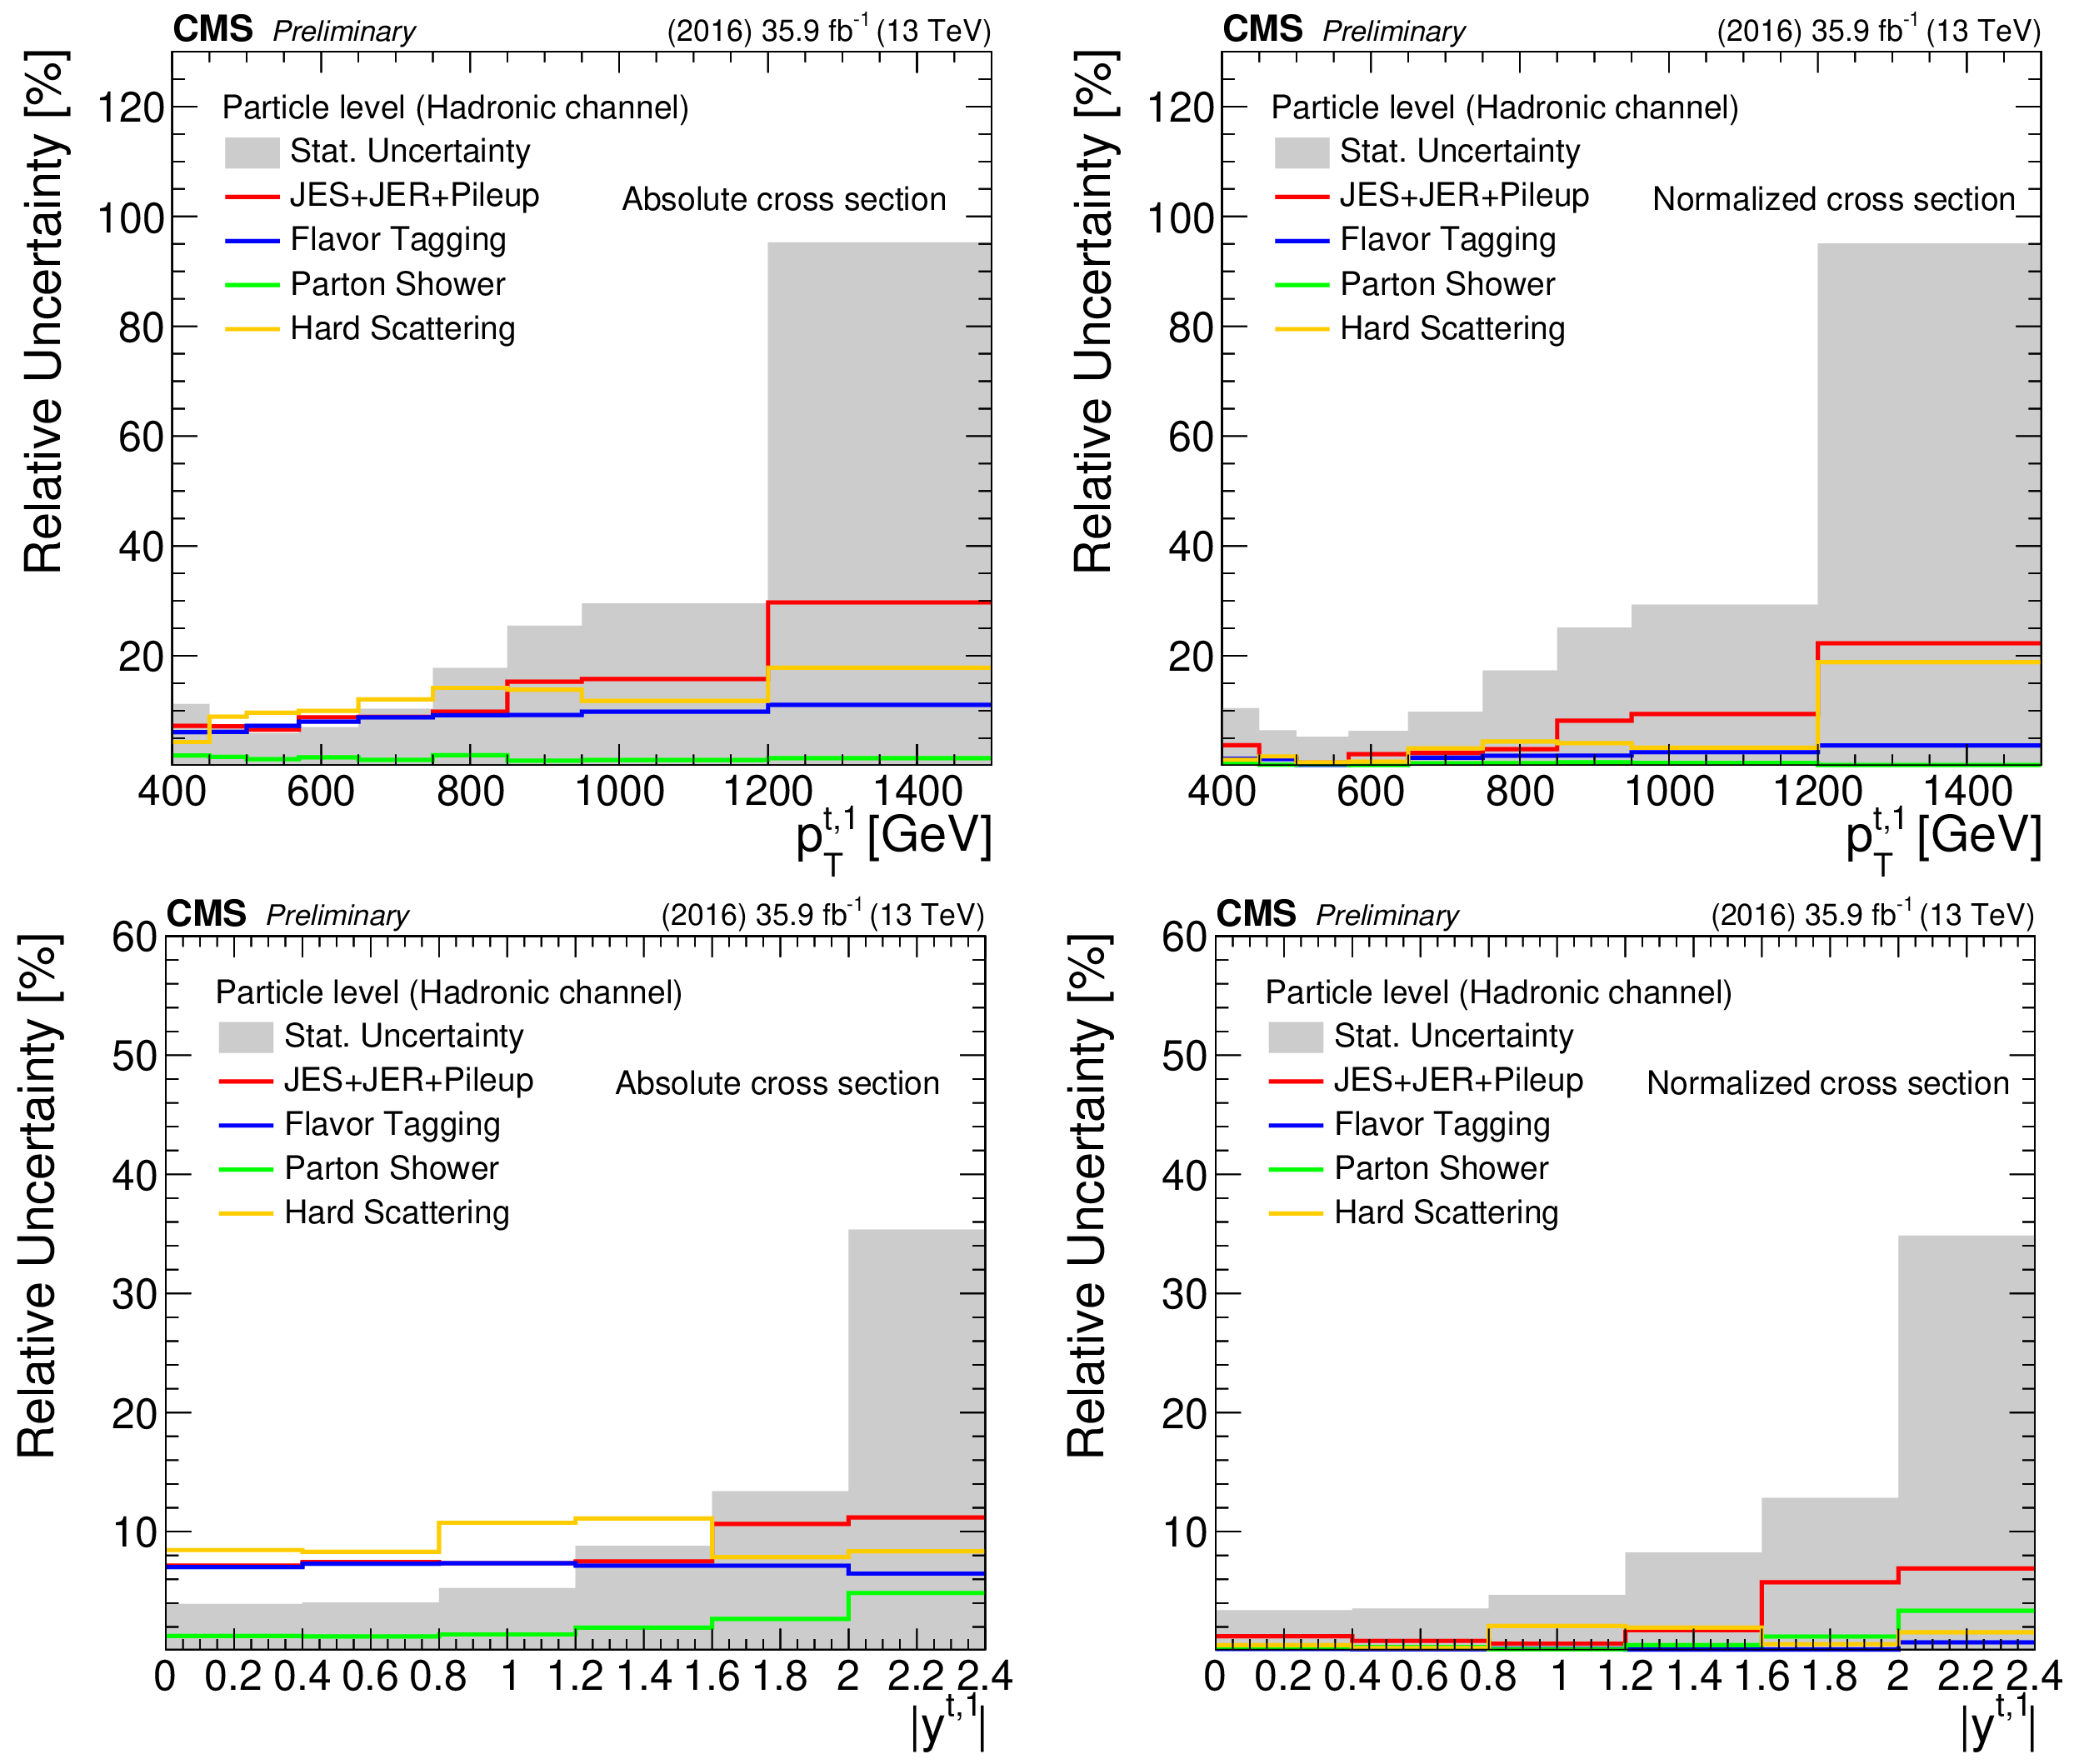
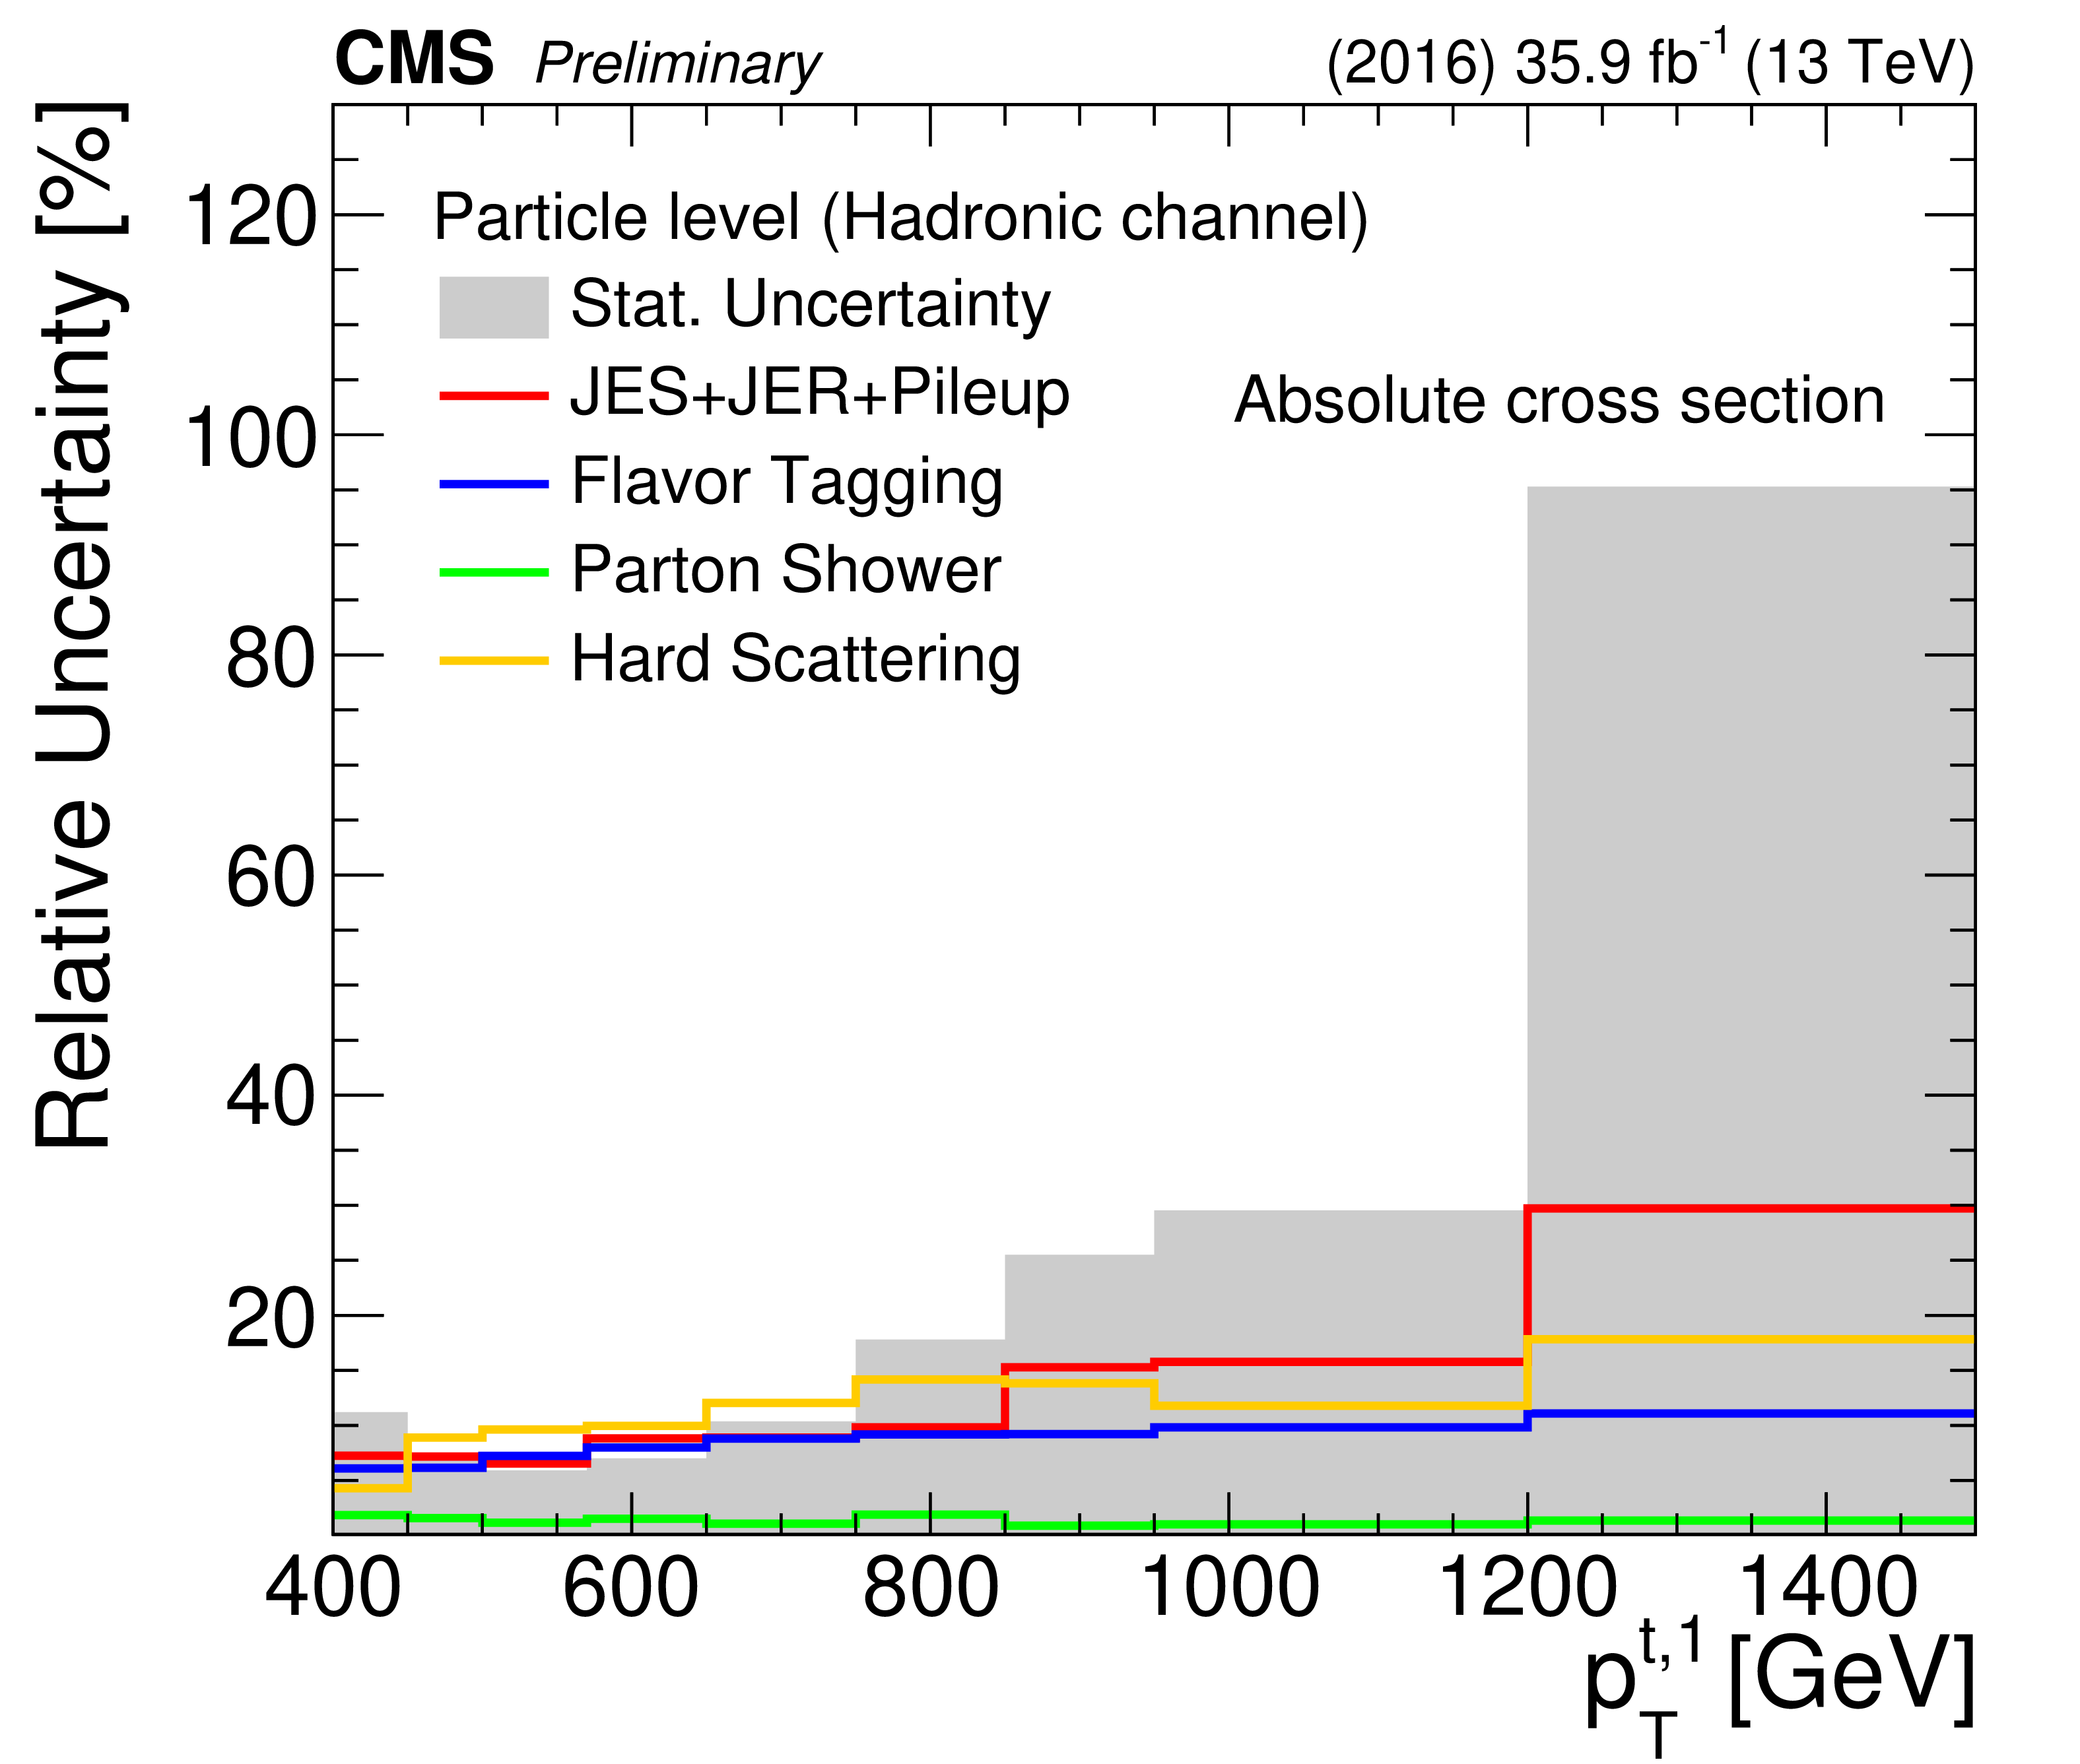
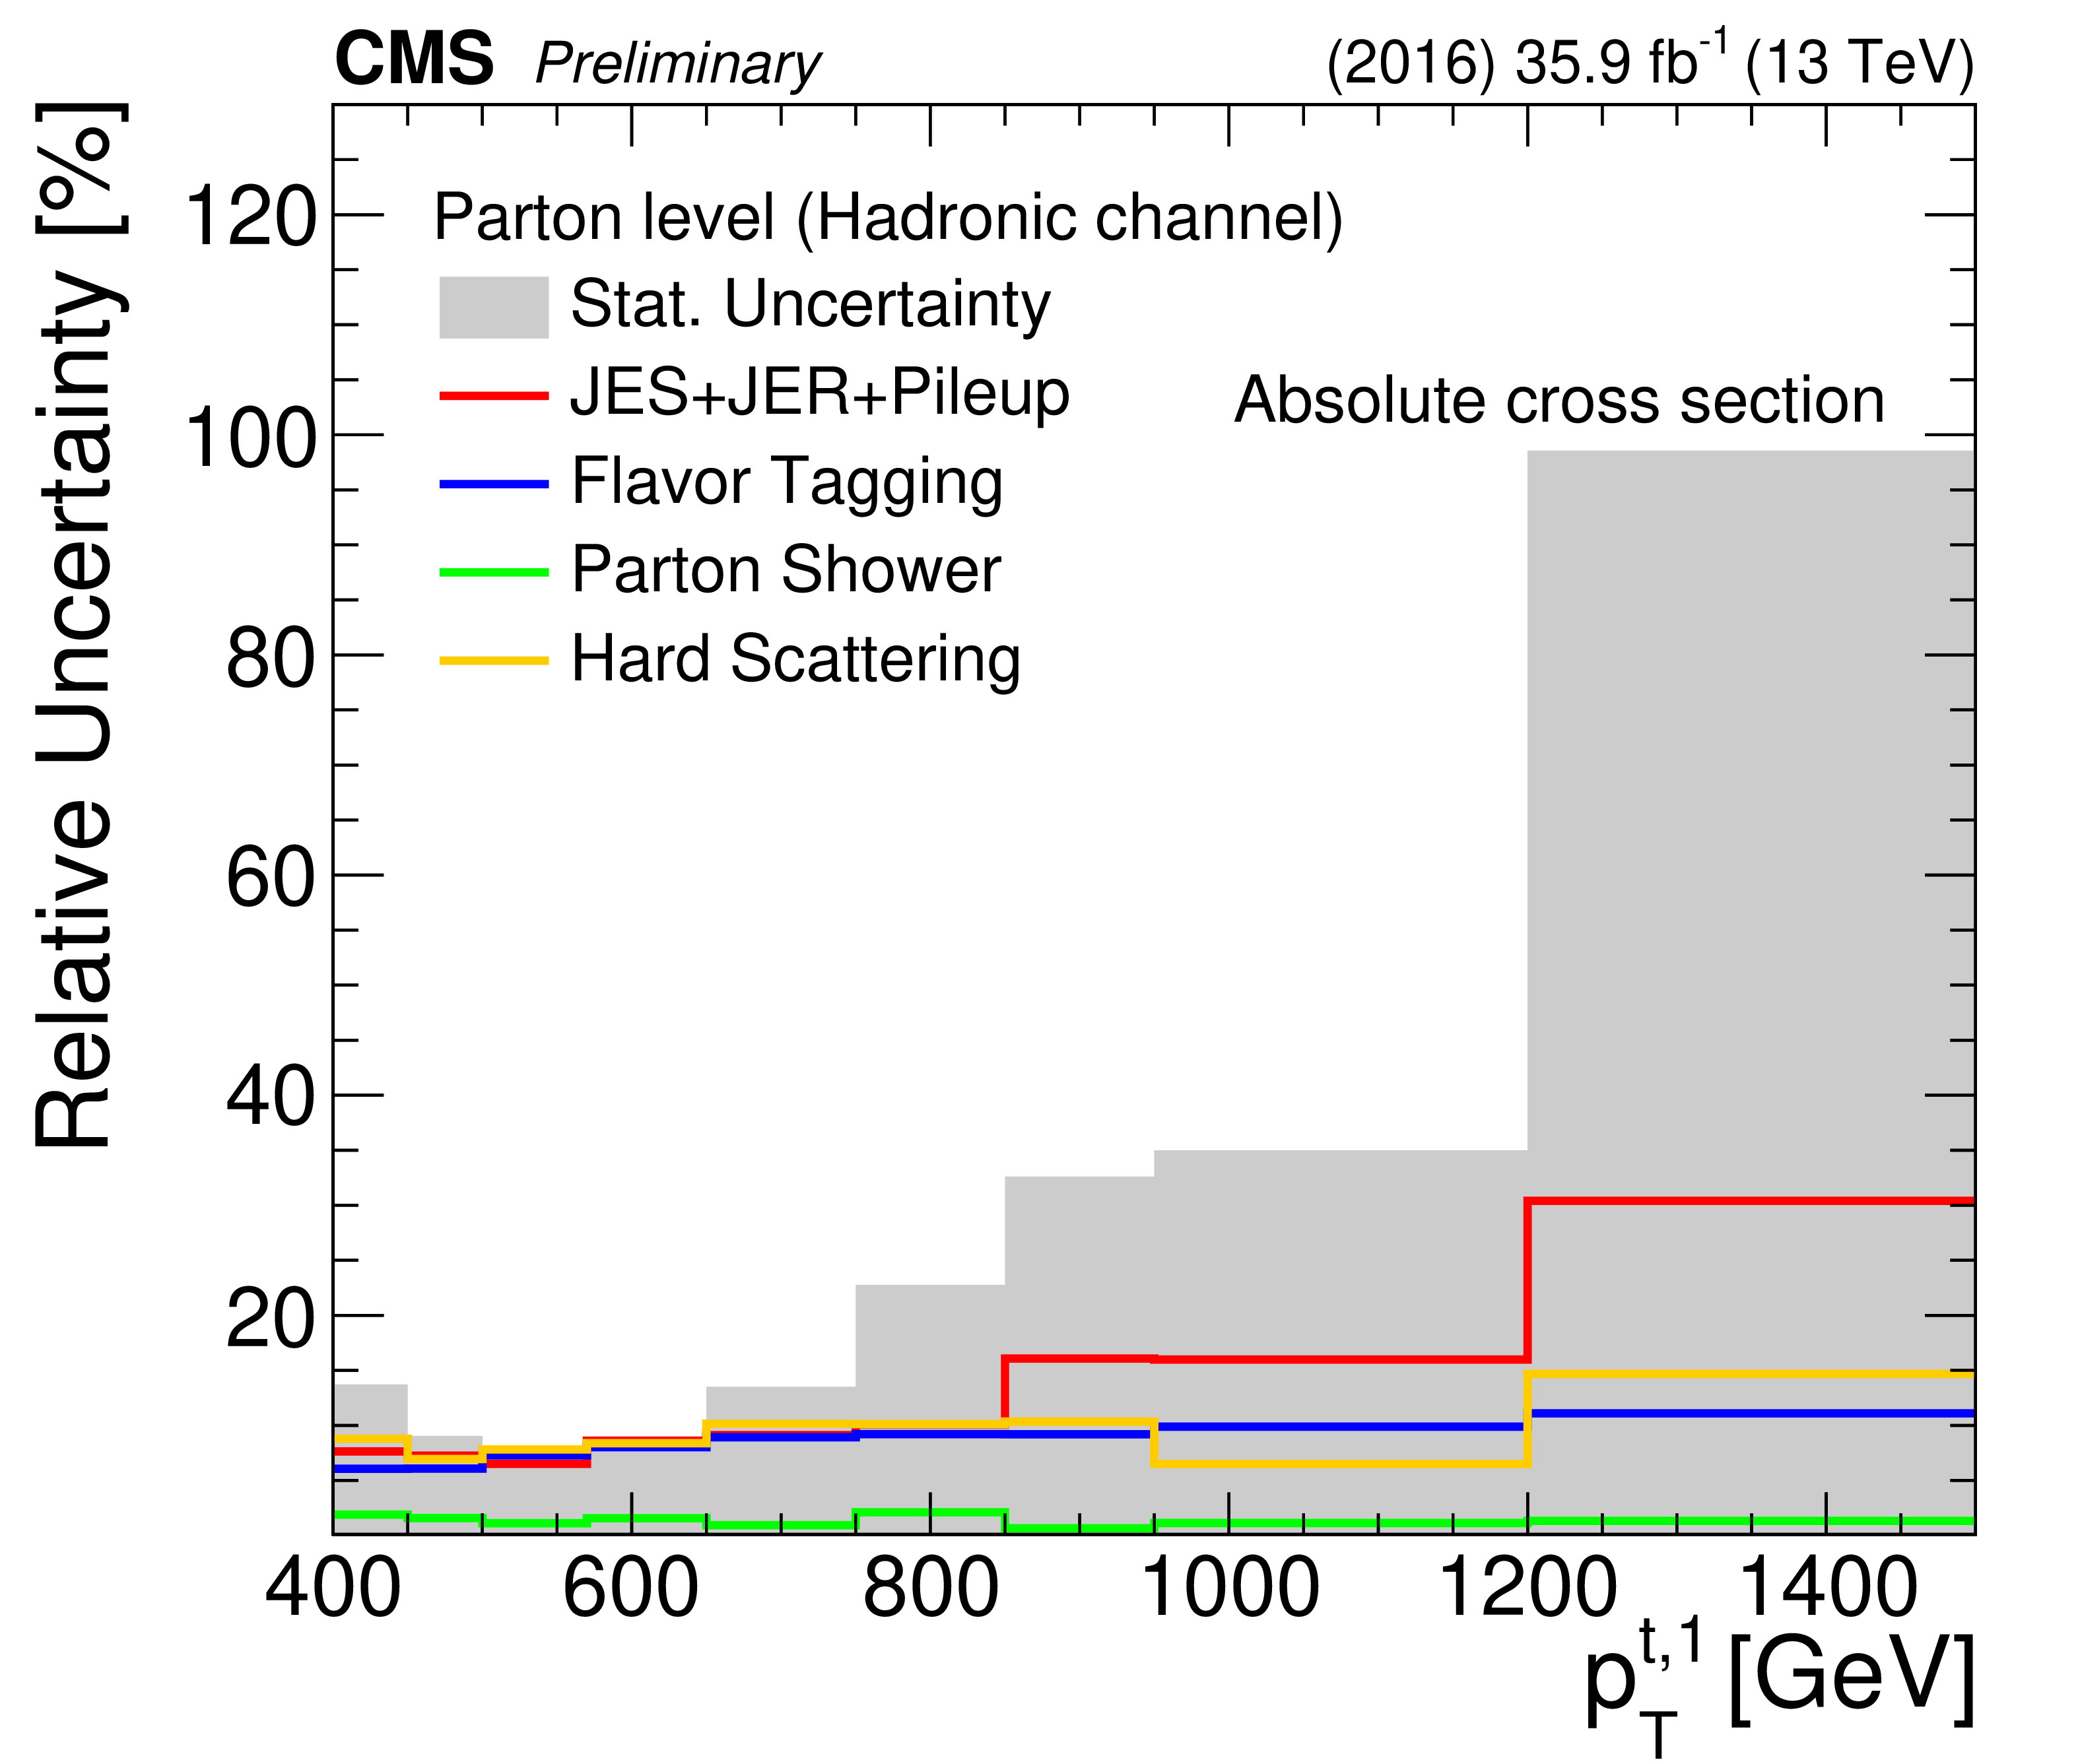
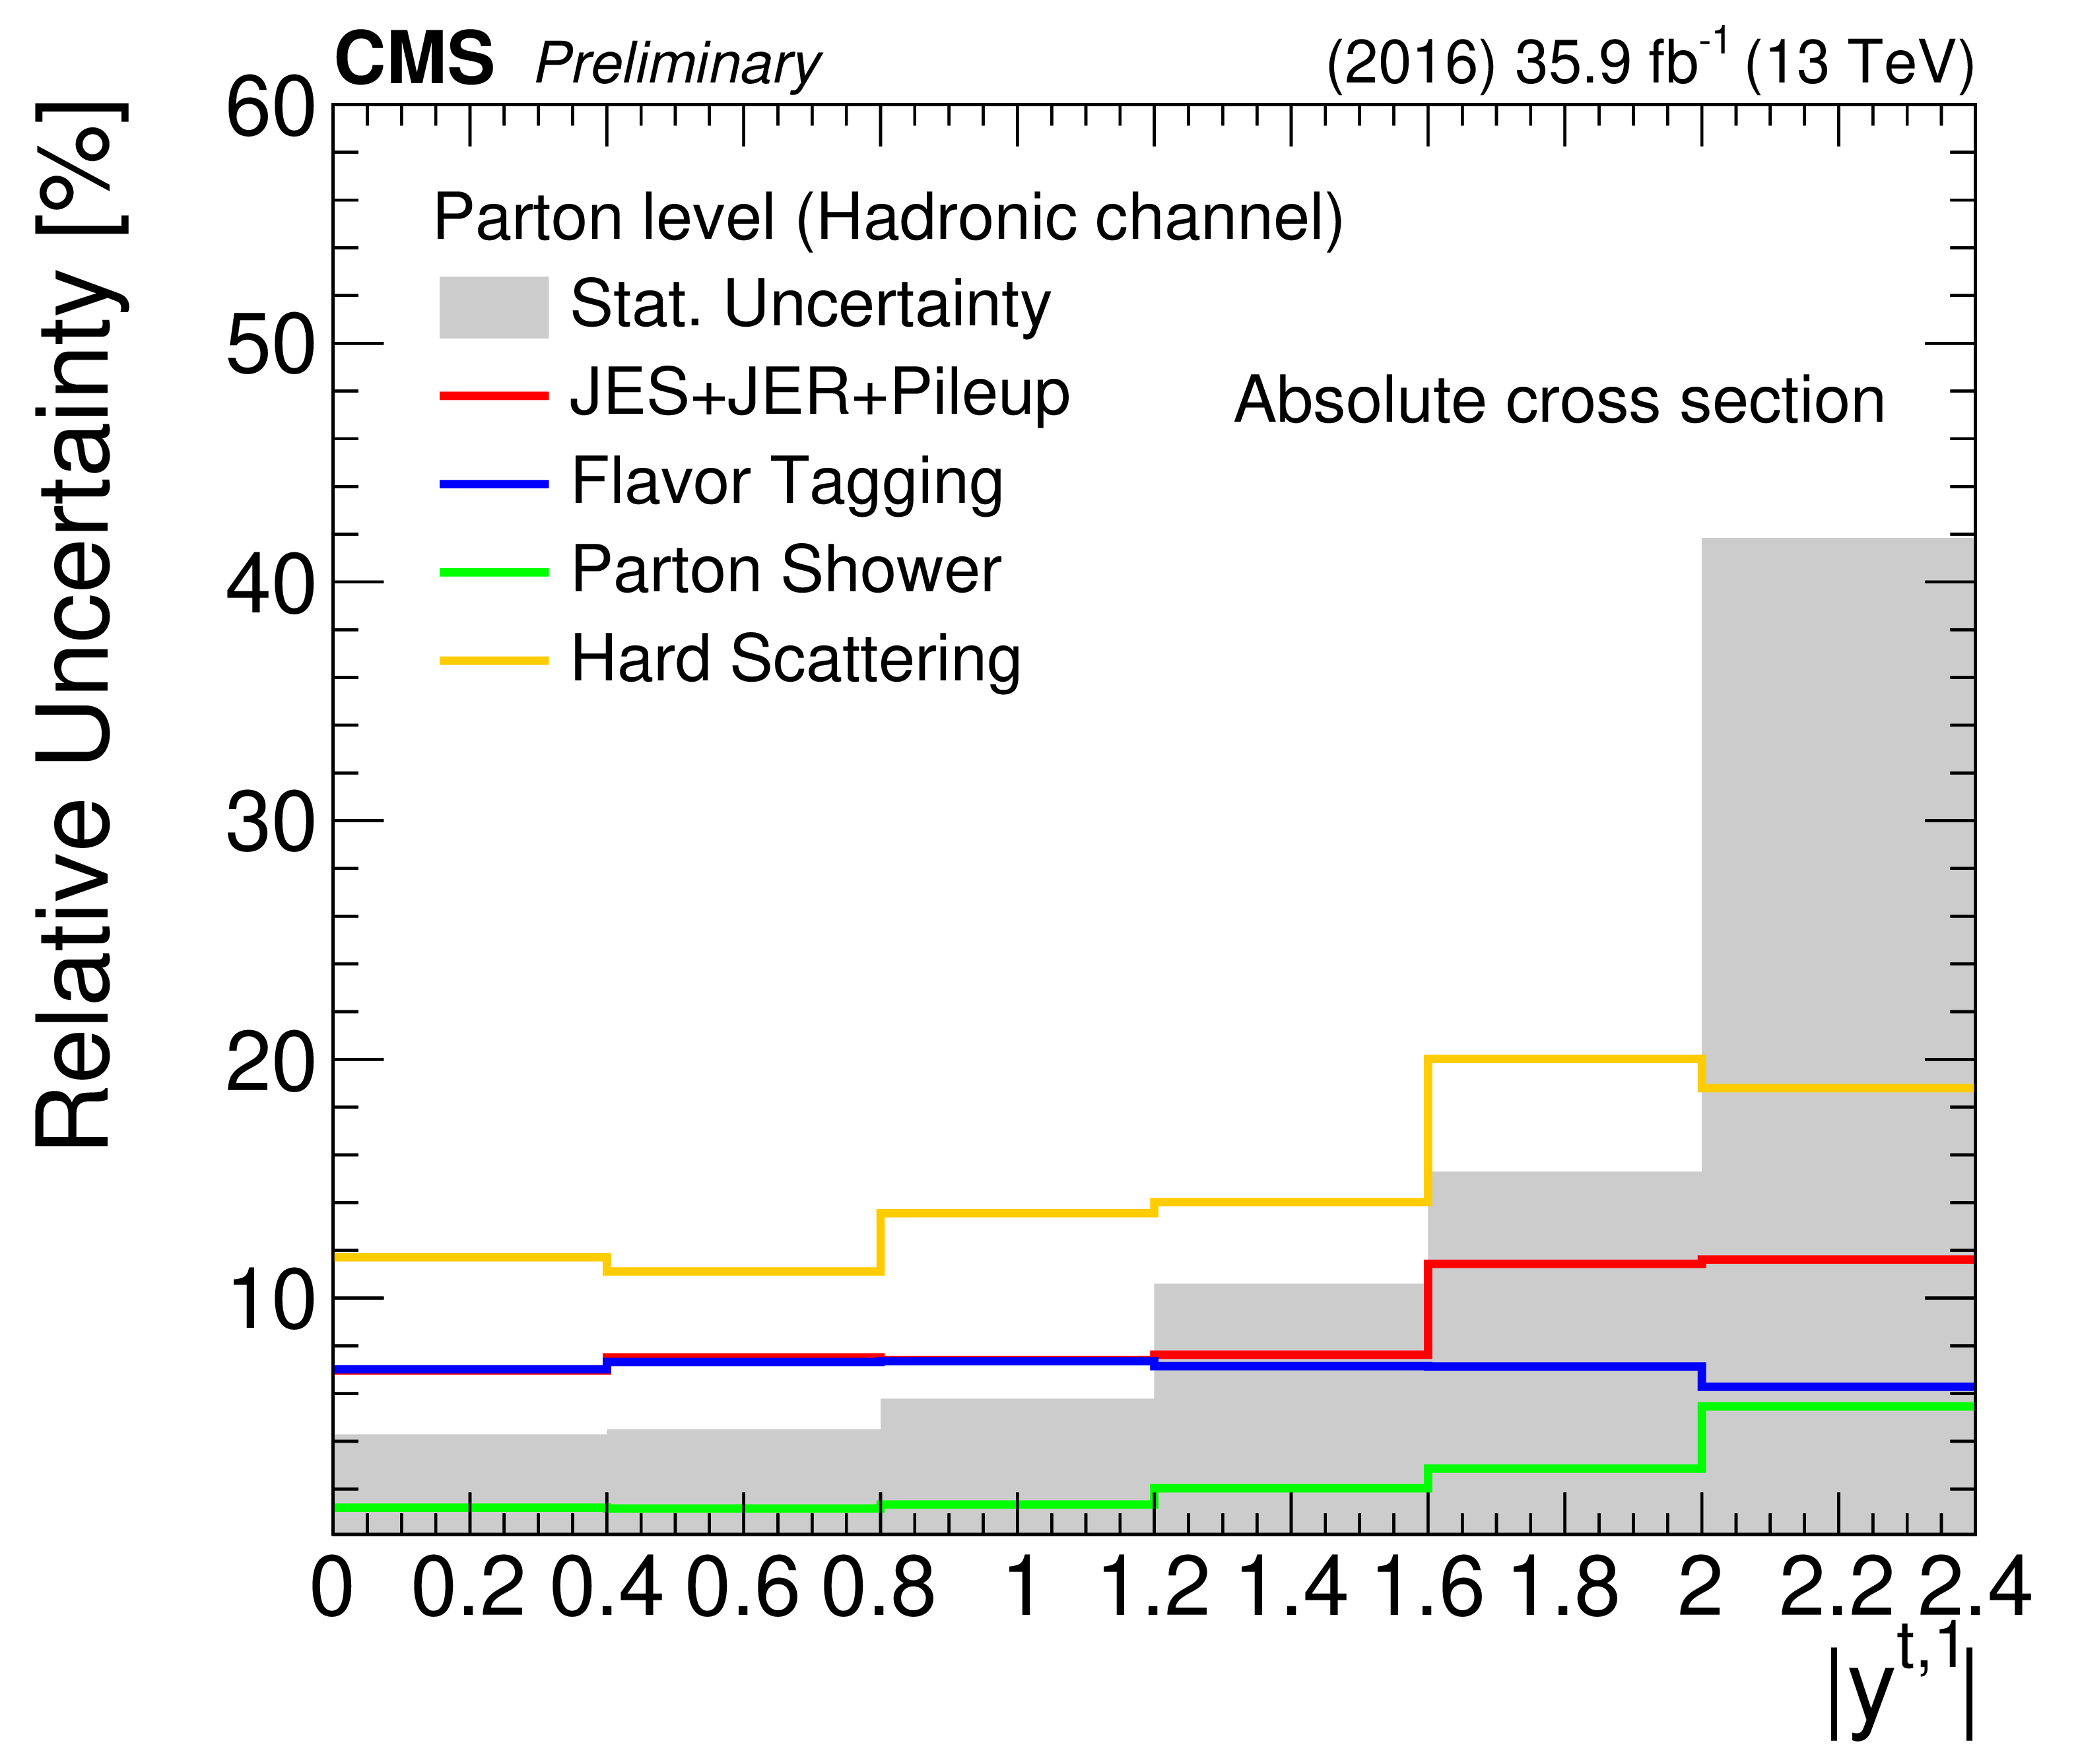
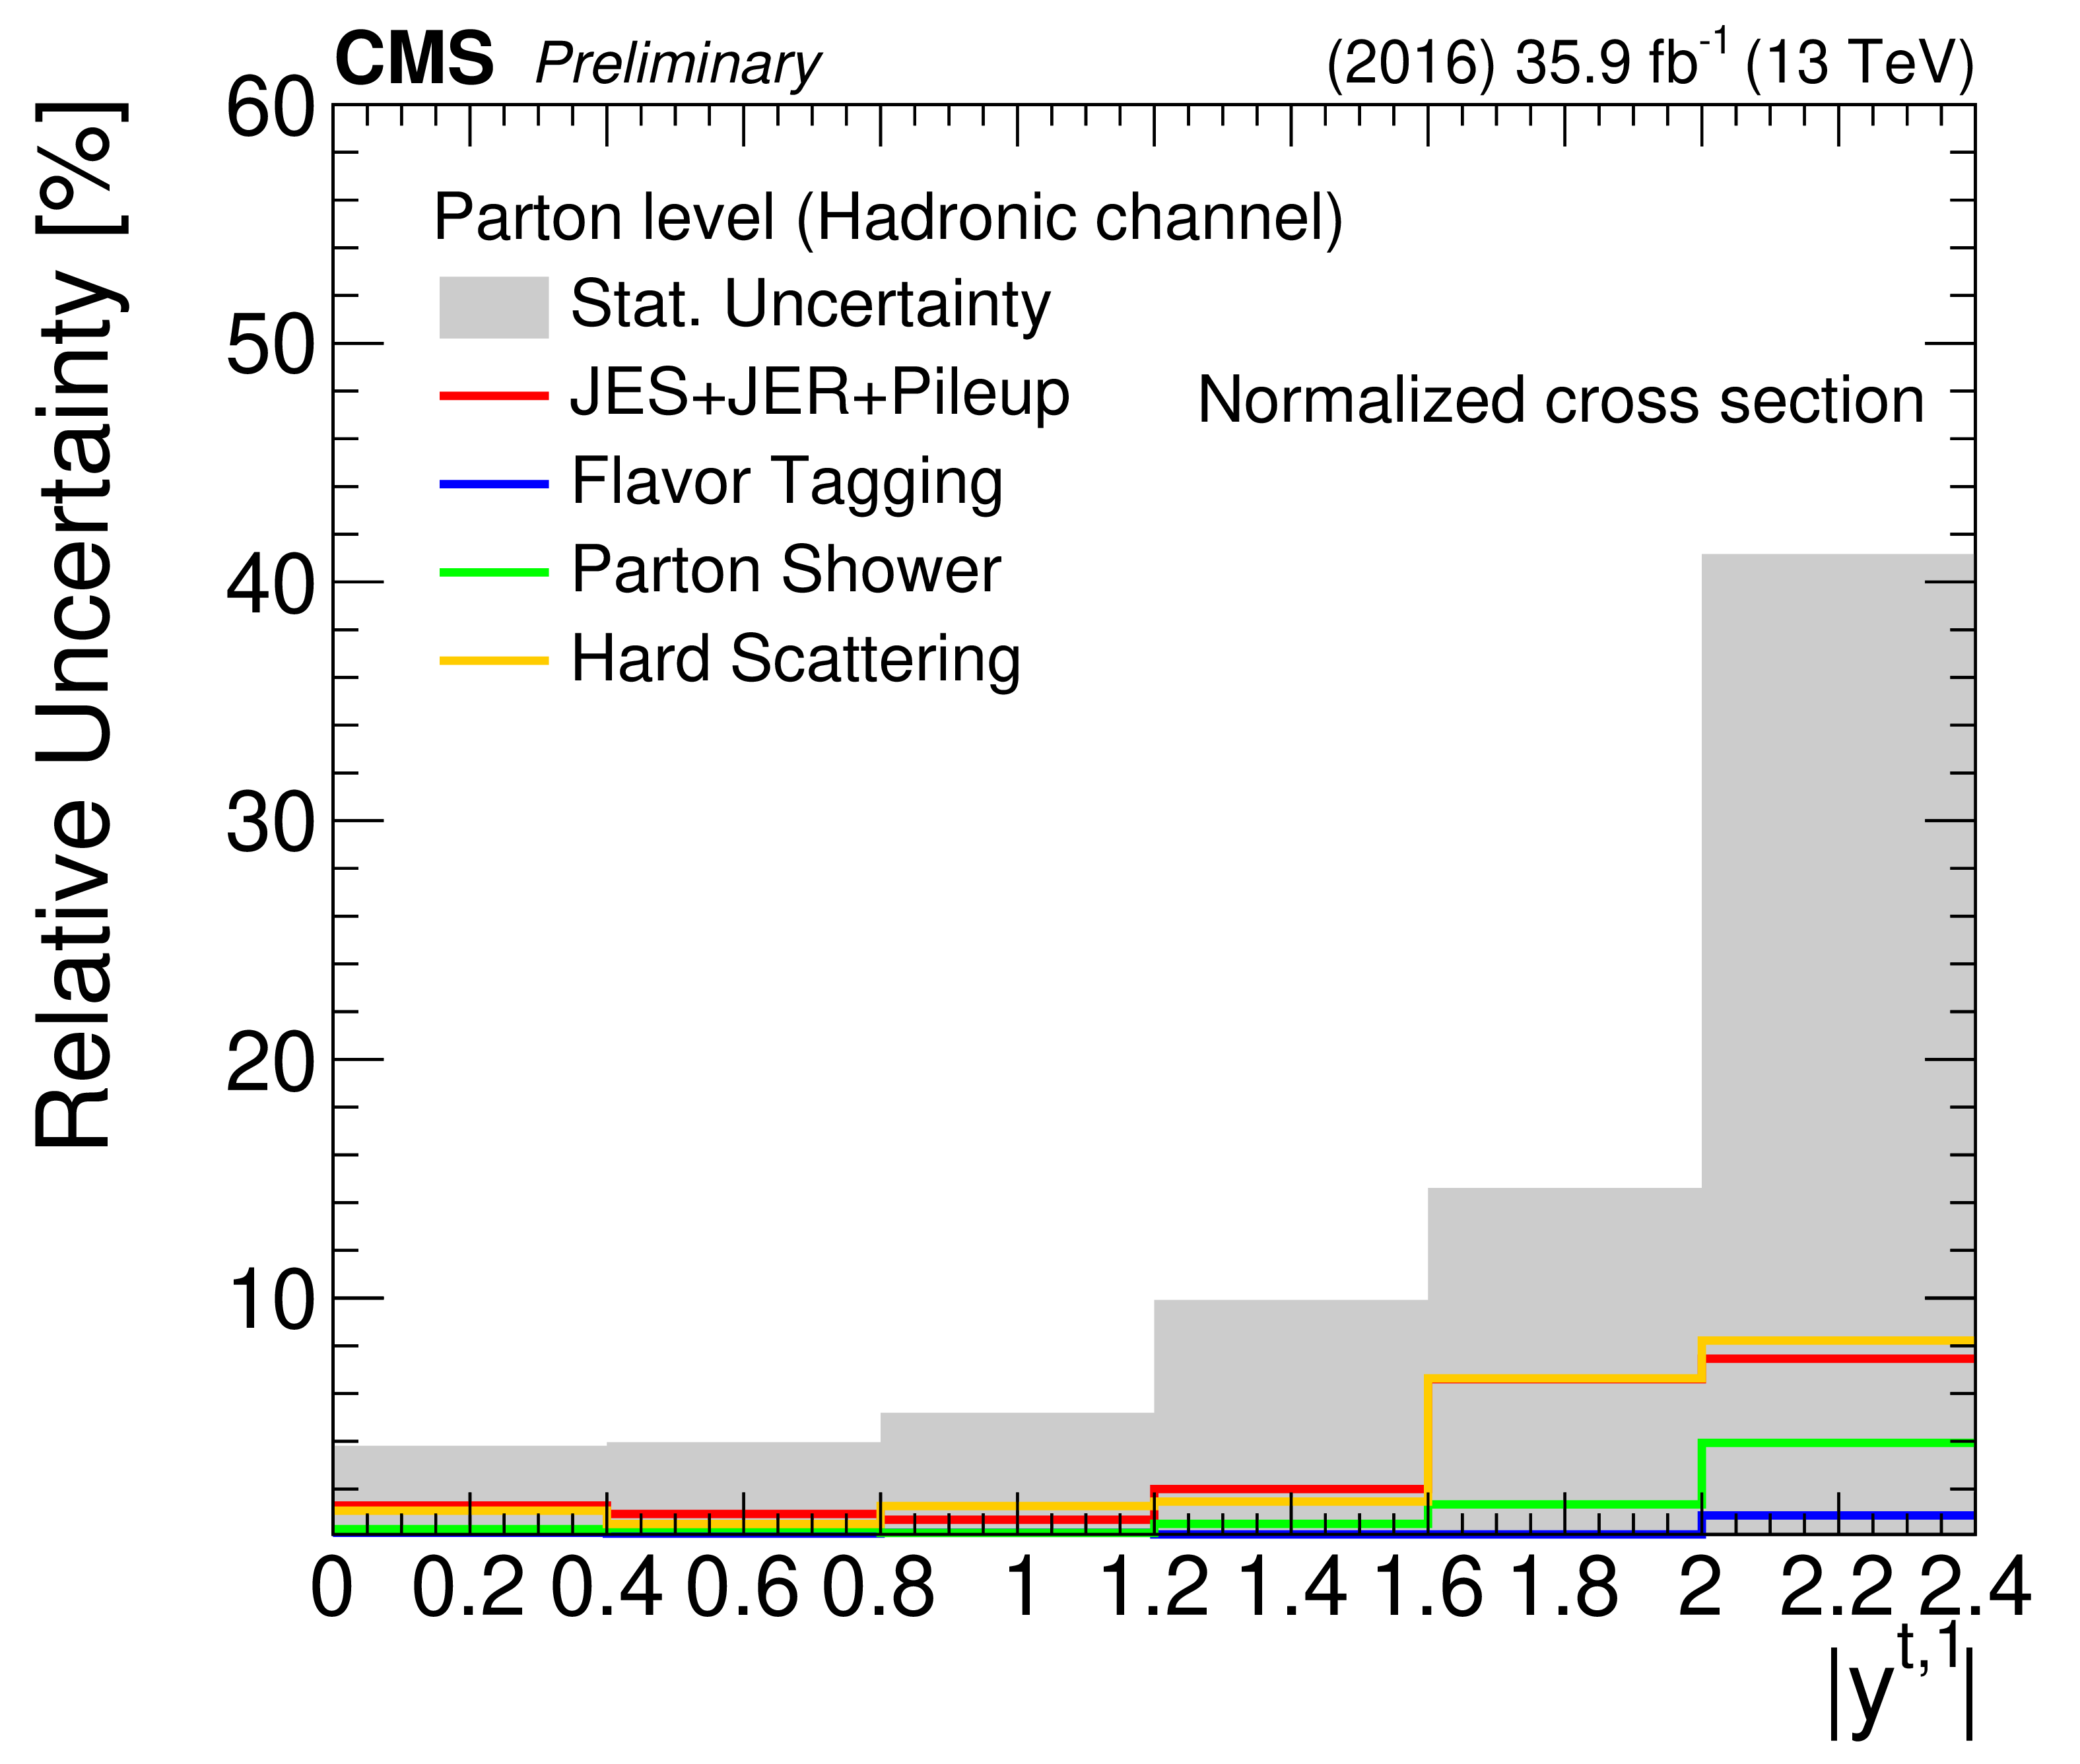
Figure 29:
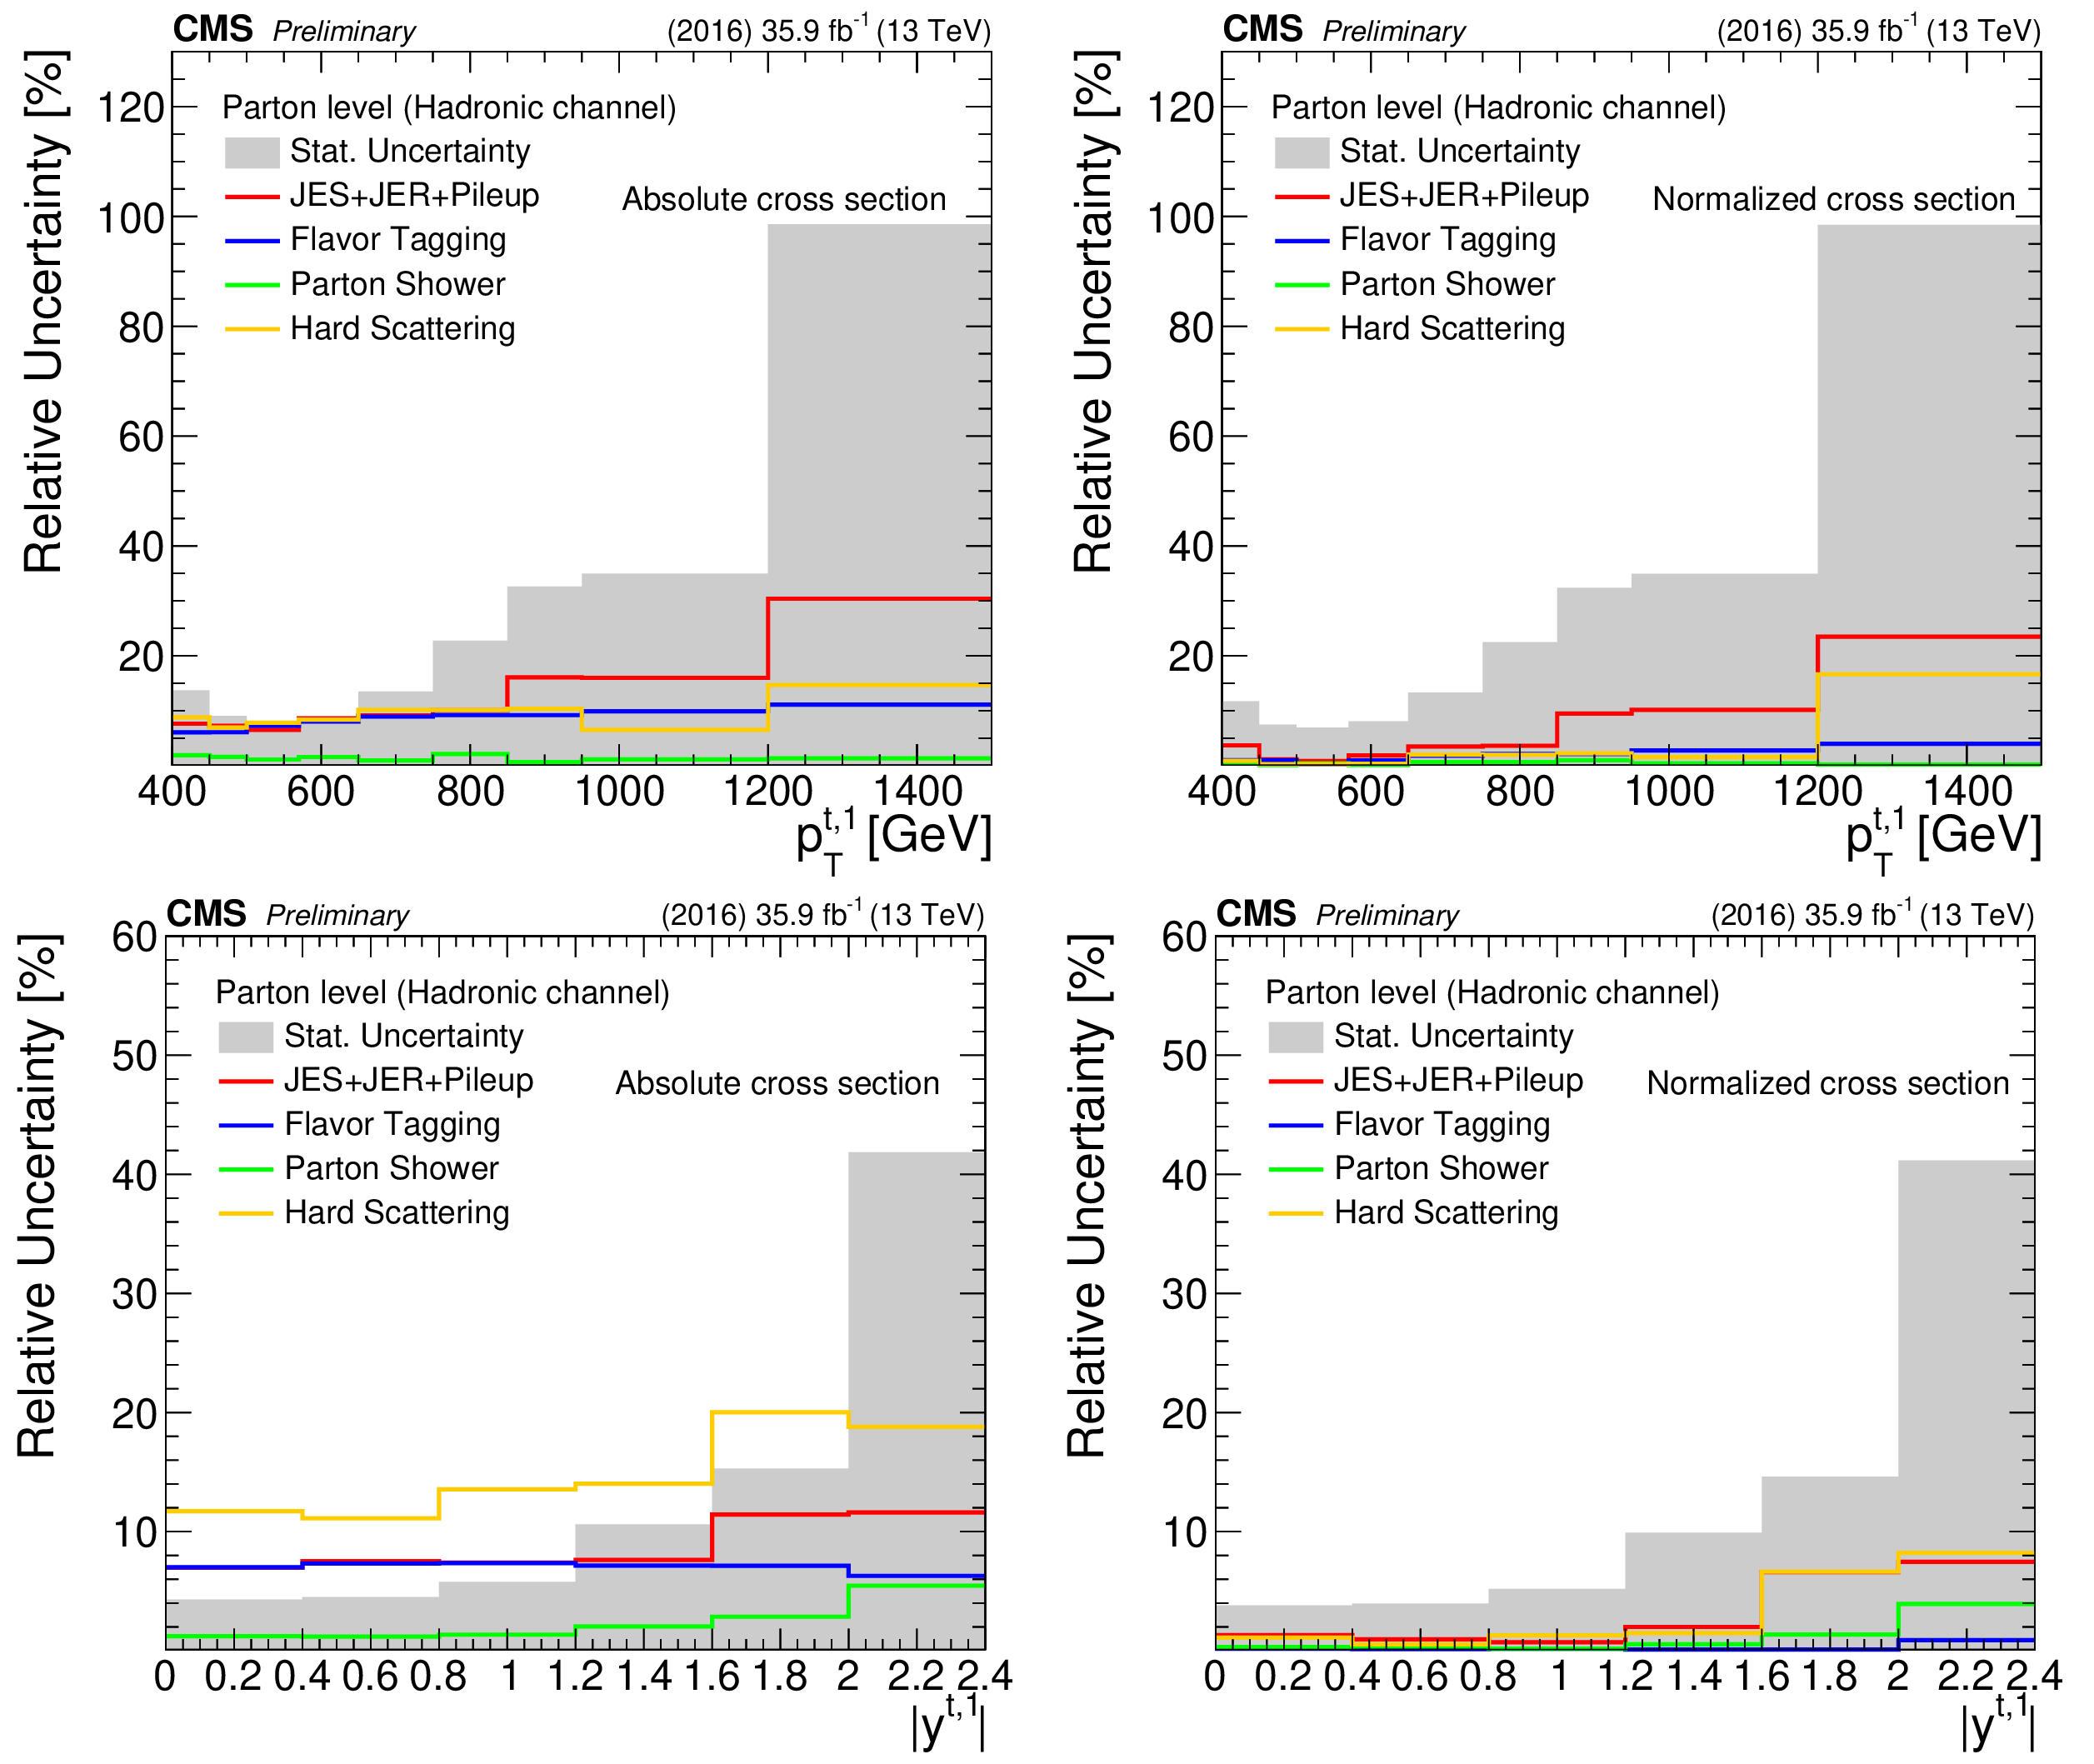
Decomposition of uncertainties in the absolute (left) and normalized (right) measurements at the parton level as a function of the leading top quark $ {p_{\mathrm {T}}} $ (top) and $|y|$ (bottom) in the hadronic channel. The grey band shows the statistical uncertainty, while the solid lines show the systematic uncertainties grouped in four categories: a) uncertainty due to pileup and the jet energy scale and resolution of the large-$R$ jets, b) uncertainty due to flavor tagging of the subjets, c) uncertainty due to the modeling of the parton shower, and d) uncertainty due to the modeling of the hard scattering. |
png pdf |
Figure 29-a:
Decomposition of uncertainties in the absolute (left) and normalized (right) measurements at the parton level as a function of the leading top quark $ {p_{\mathrm {T}}} $ (top) and $|y|$ (bottom) in the hadronic channel. The grey band shows the statistical uncertainty, while the solid lines show the systematic uncertainties grouped in four categories: a) uncertainty due to pileup and the jet energy scale and resolution of the large-$R$ jets, b) uncertainty due to flavor tagging of the subjets, c) uncertainty due to the modeling of the parton shower, and d) uncertainty due to the modeling of the hard scattering. |

png pdf |
Figure 29-b:
Decomposition of uncertainties in the absolute (left) and normalized (right) measurements at the parton level as a function of the leading top quark $ {p_{\mathrm {T}}} $ (top) and $|y|$ (bottom) in the hadronic channel. The grey band shows the statistical uncertainty, while the solid lines show the systematic uncertainties grouped in four categories: a) uncertainty due to pileup and the jet energy scale and resolution of the large-$R$ jets, b) uncertainty due to flavor tagging of the subjets, c) uncertainty due to the modeling of the parton shower, and d) uncertainty due to the modeling of the hard scattering. |
png pdf |
Figure 29-c:
Decomposition of uncertainties in the absolute (left) and normalized (right) measurements at the parton level as a function of the leading top quark $ {p_{\mathrm {T}}} $ (top) and $|y|$ (bottom) in the hadronic channel. The grey band shows the statistical uncertainty, while the solid lines show the systematic uncertainties grouped in four categories: a) uncertainty due to pileup and the jet energy scale and resolution of the large-$R$ jets, b) uncertainty due to flavor tagging of the subjets, c) uncertainty due to the modeling of the parton shower, and d) uncertainty due to the modeling of the hard scattering. |
png pdf |
Figure 29-d:
Decomposition of uncertainties in the absolute (left) and normalized (right) measurements at the parton level as a function of the leading top quark $ {p_{\mathrm {T}}} $ (top) and $|y|$ (bottom) in the hadronic channel. The grey band shows the statistical uncertainty, while the solid lines show the systematic uncertainties grouped in four categories: a) uncertainty due to pileup and the jet energy scale and resolution of the large-$R$ jets, b) uncertainty due to flavor tagging of the subjets, c) uncertainty due to the modeling of the parton shower, and d) uncertainty due to the modeling of the hard scattering. |
png pdf |
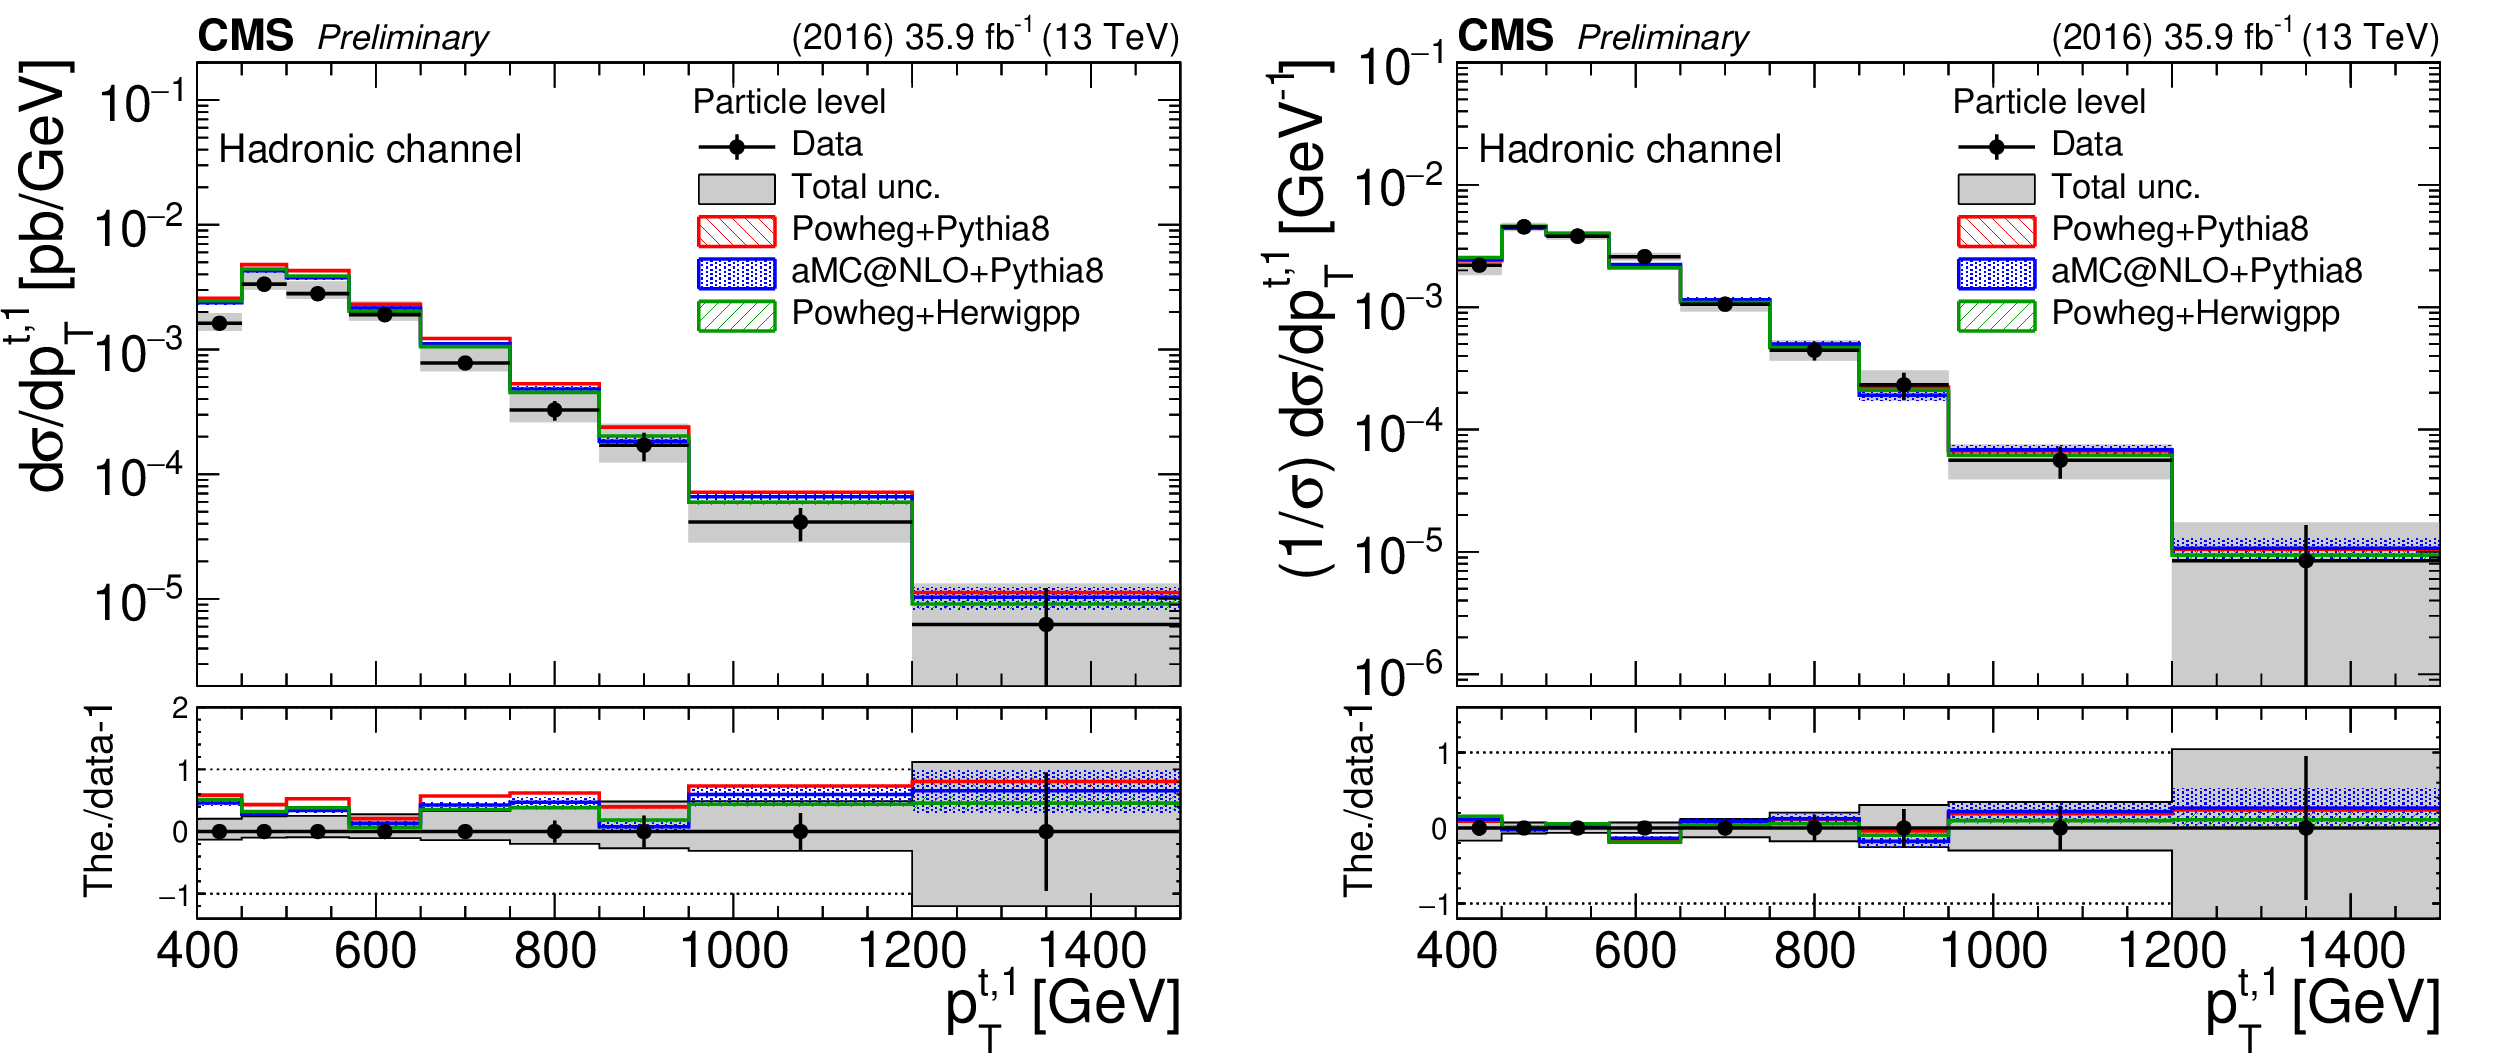
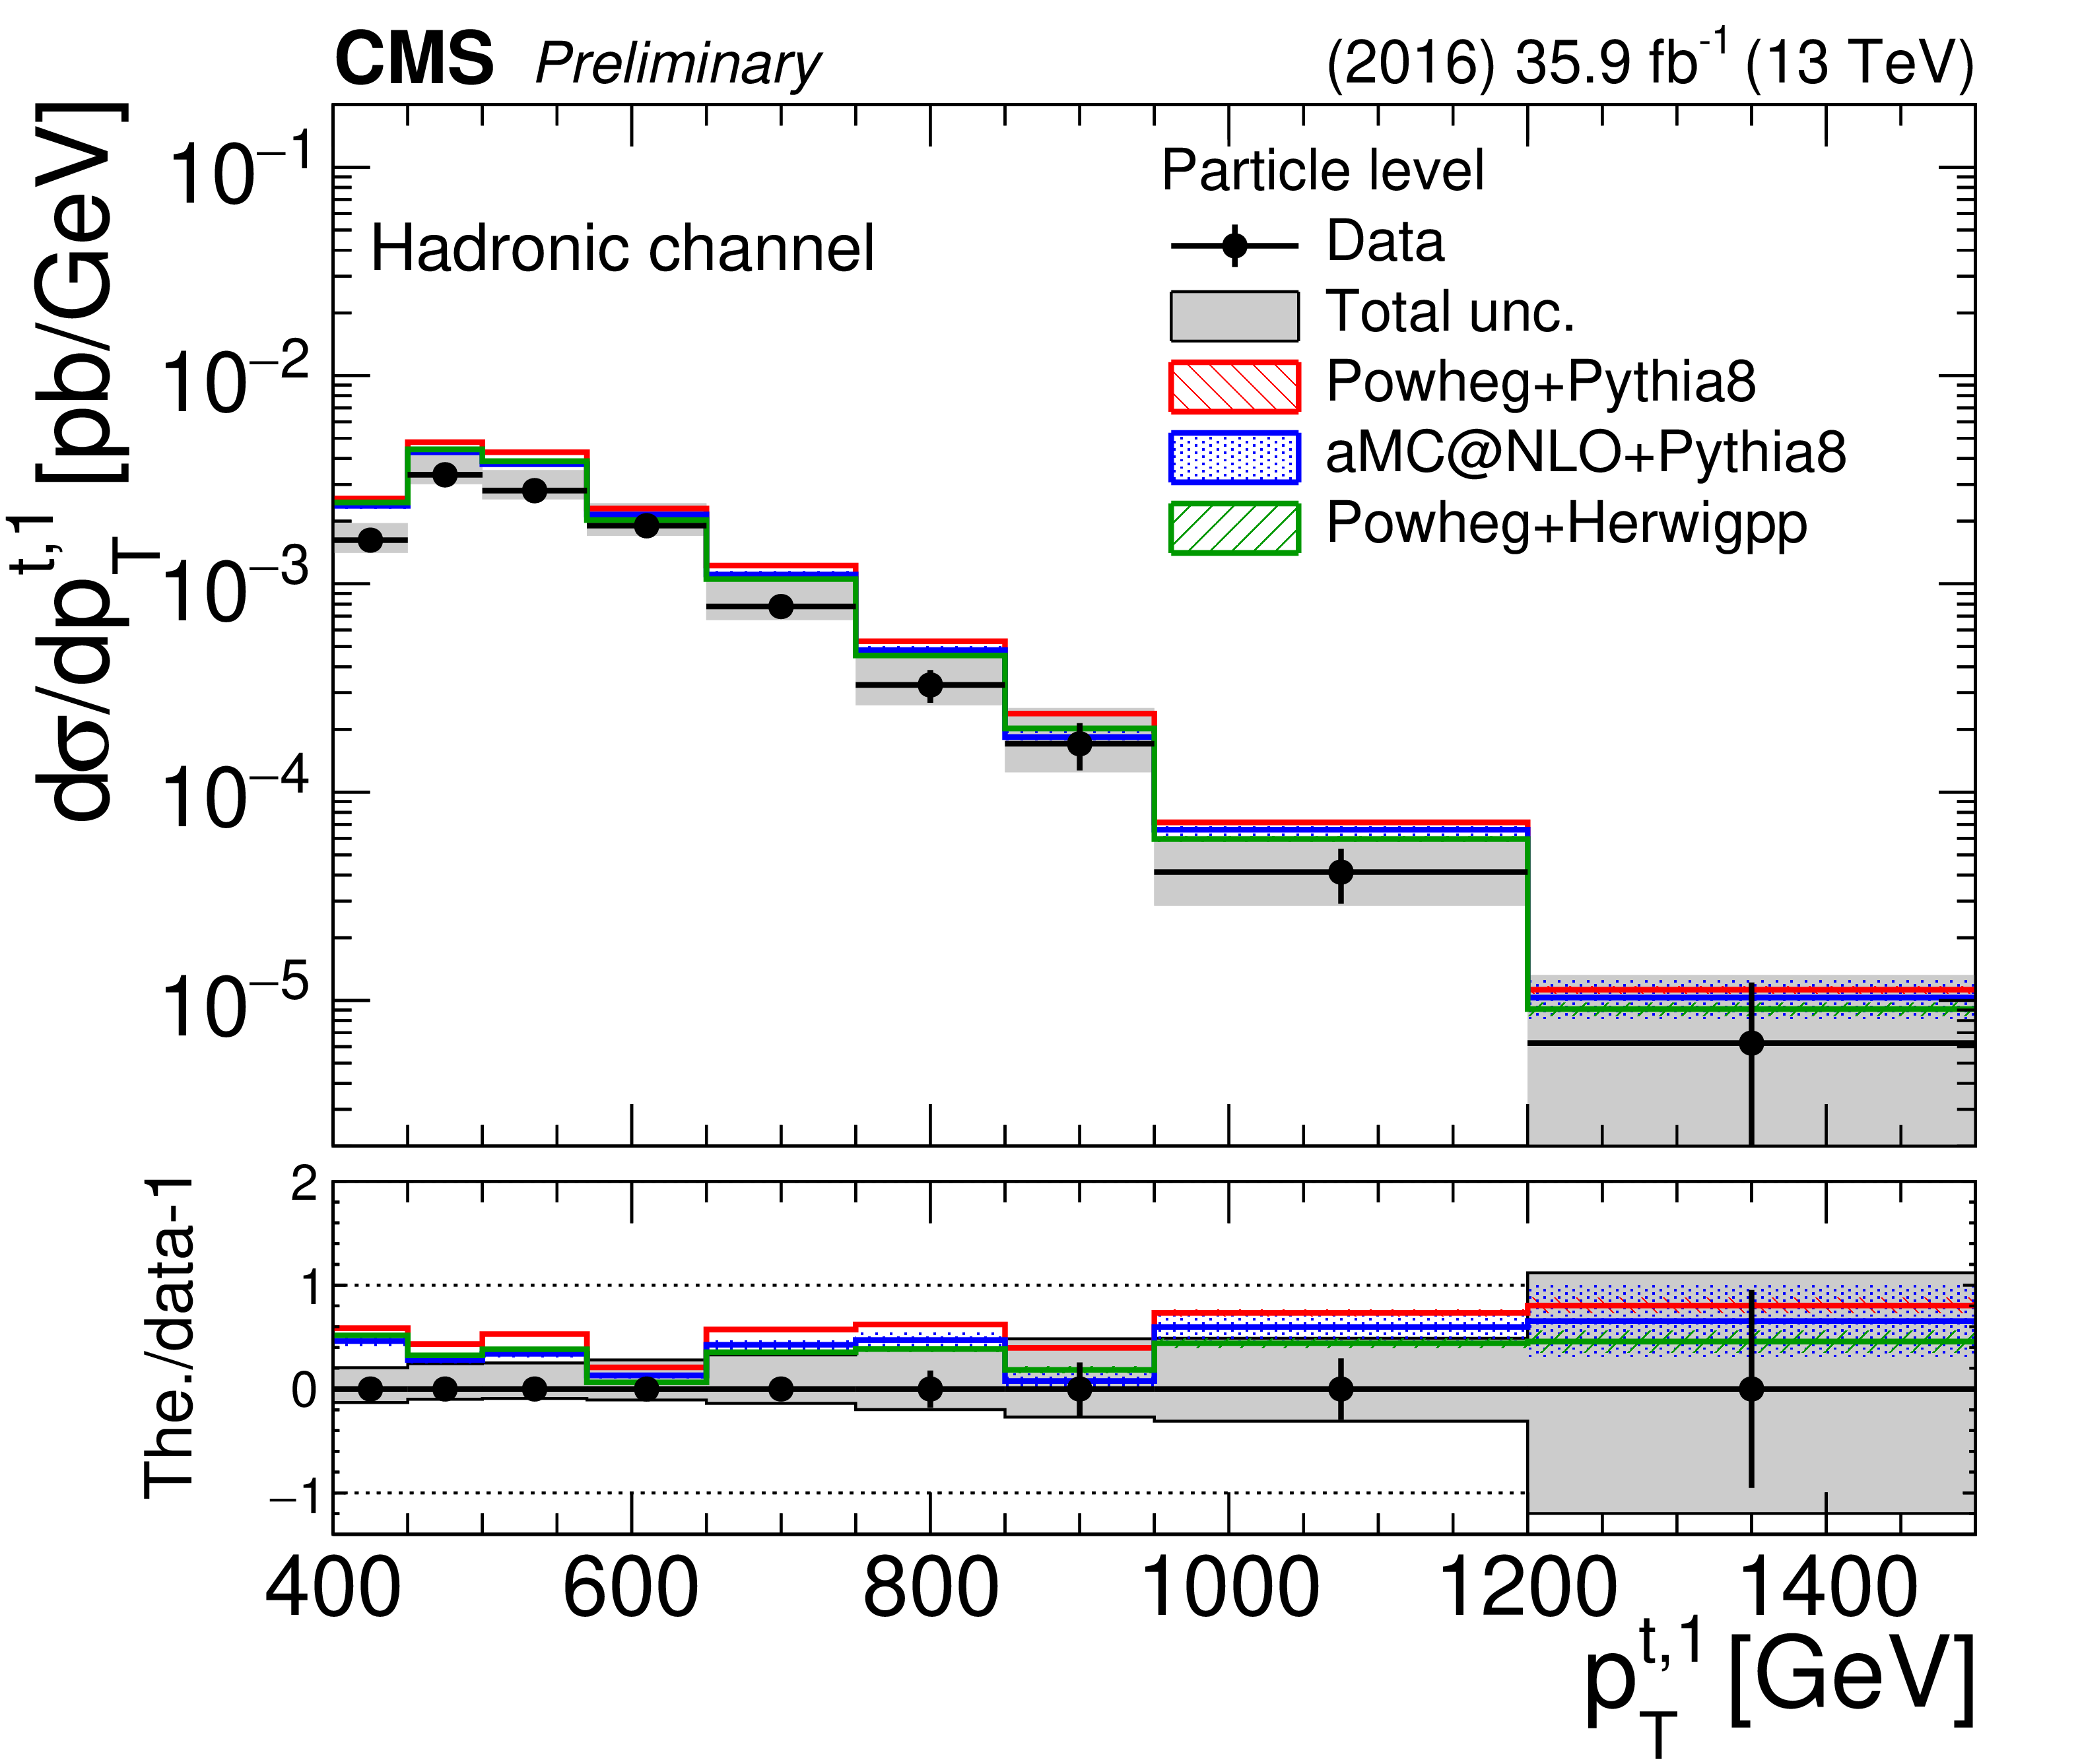
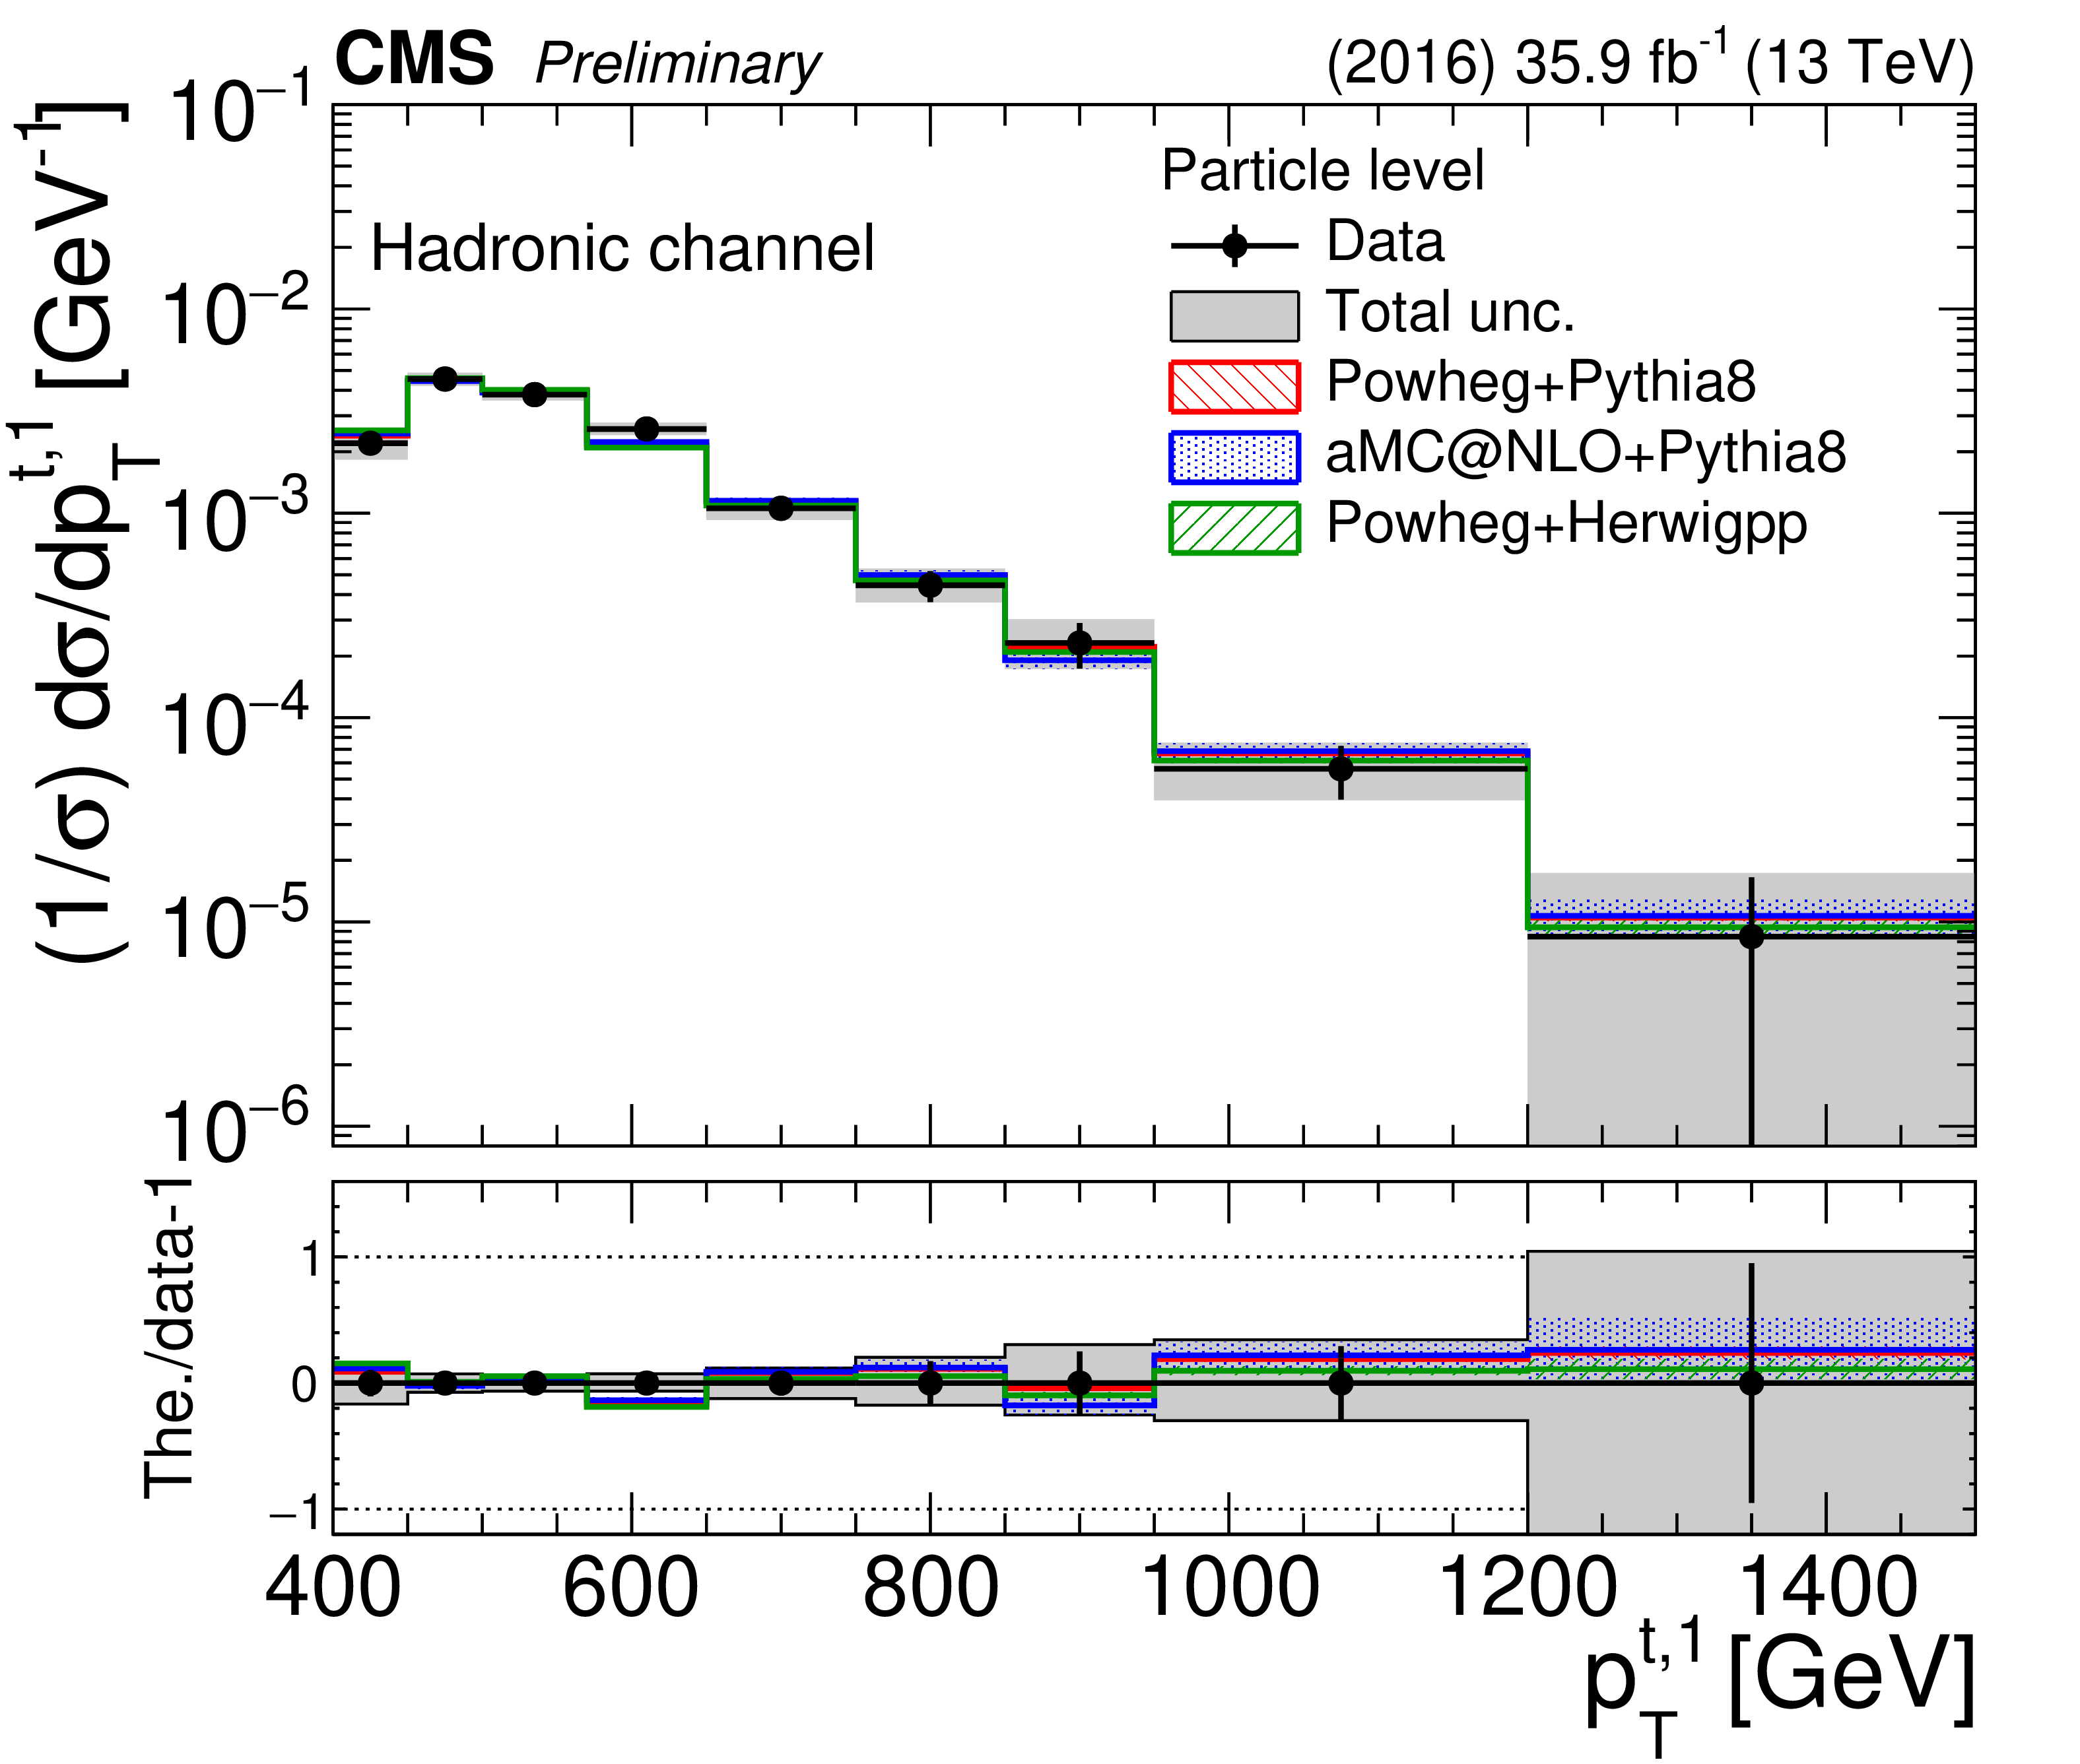
Figure 30:
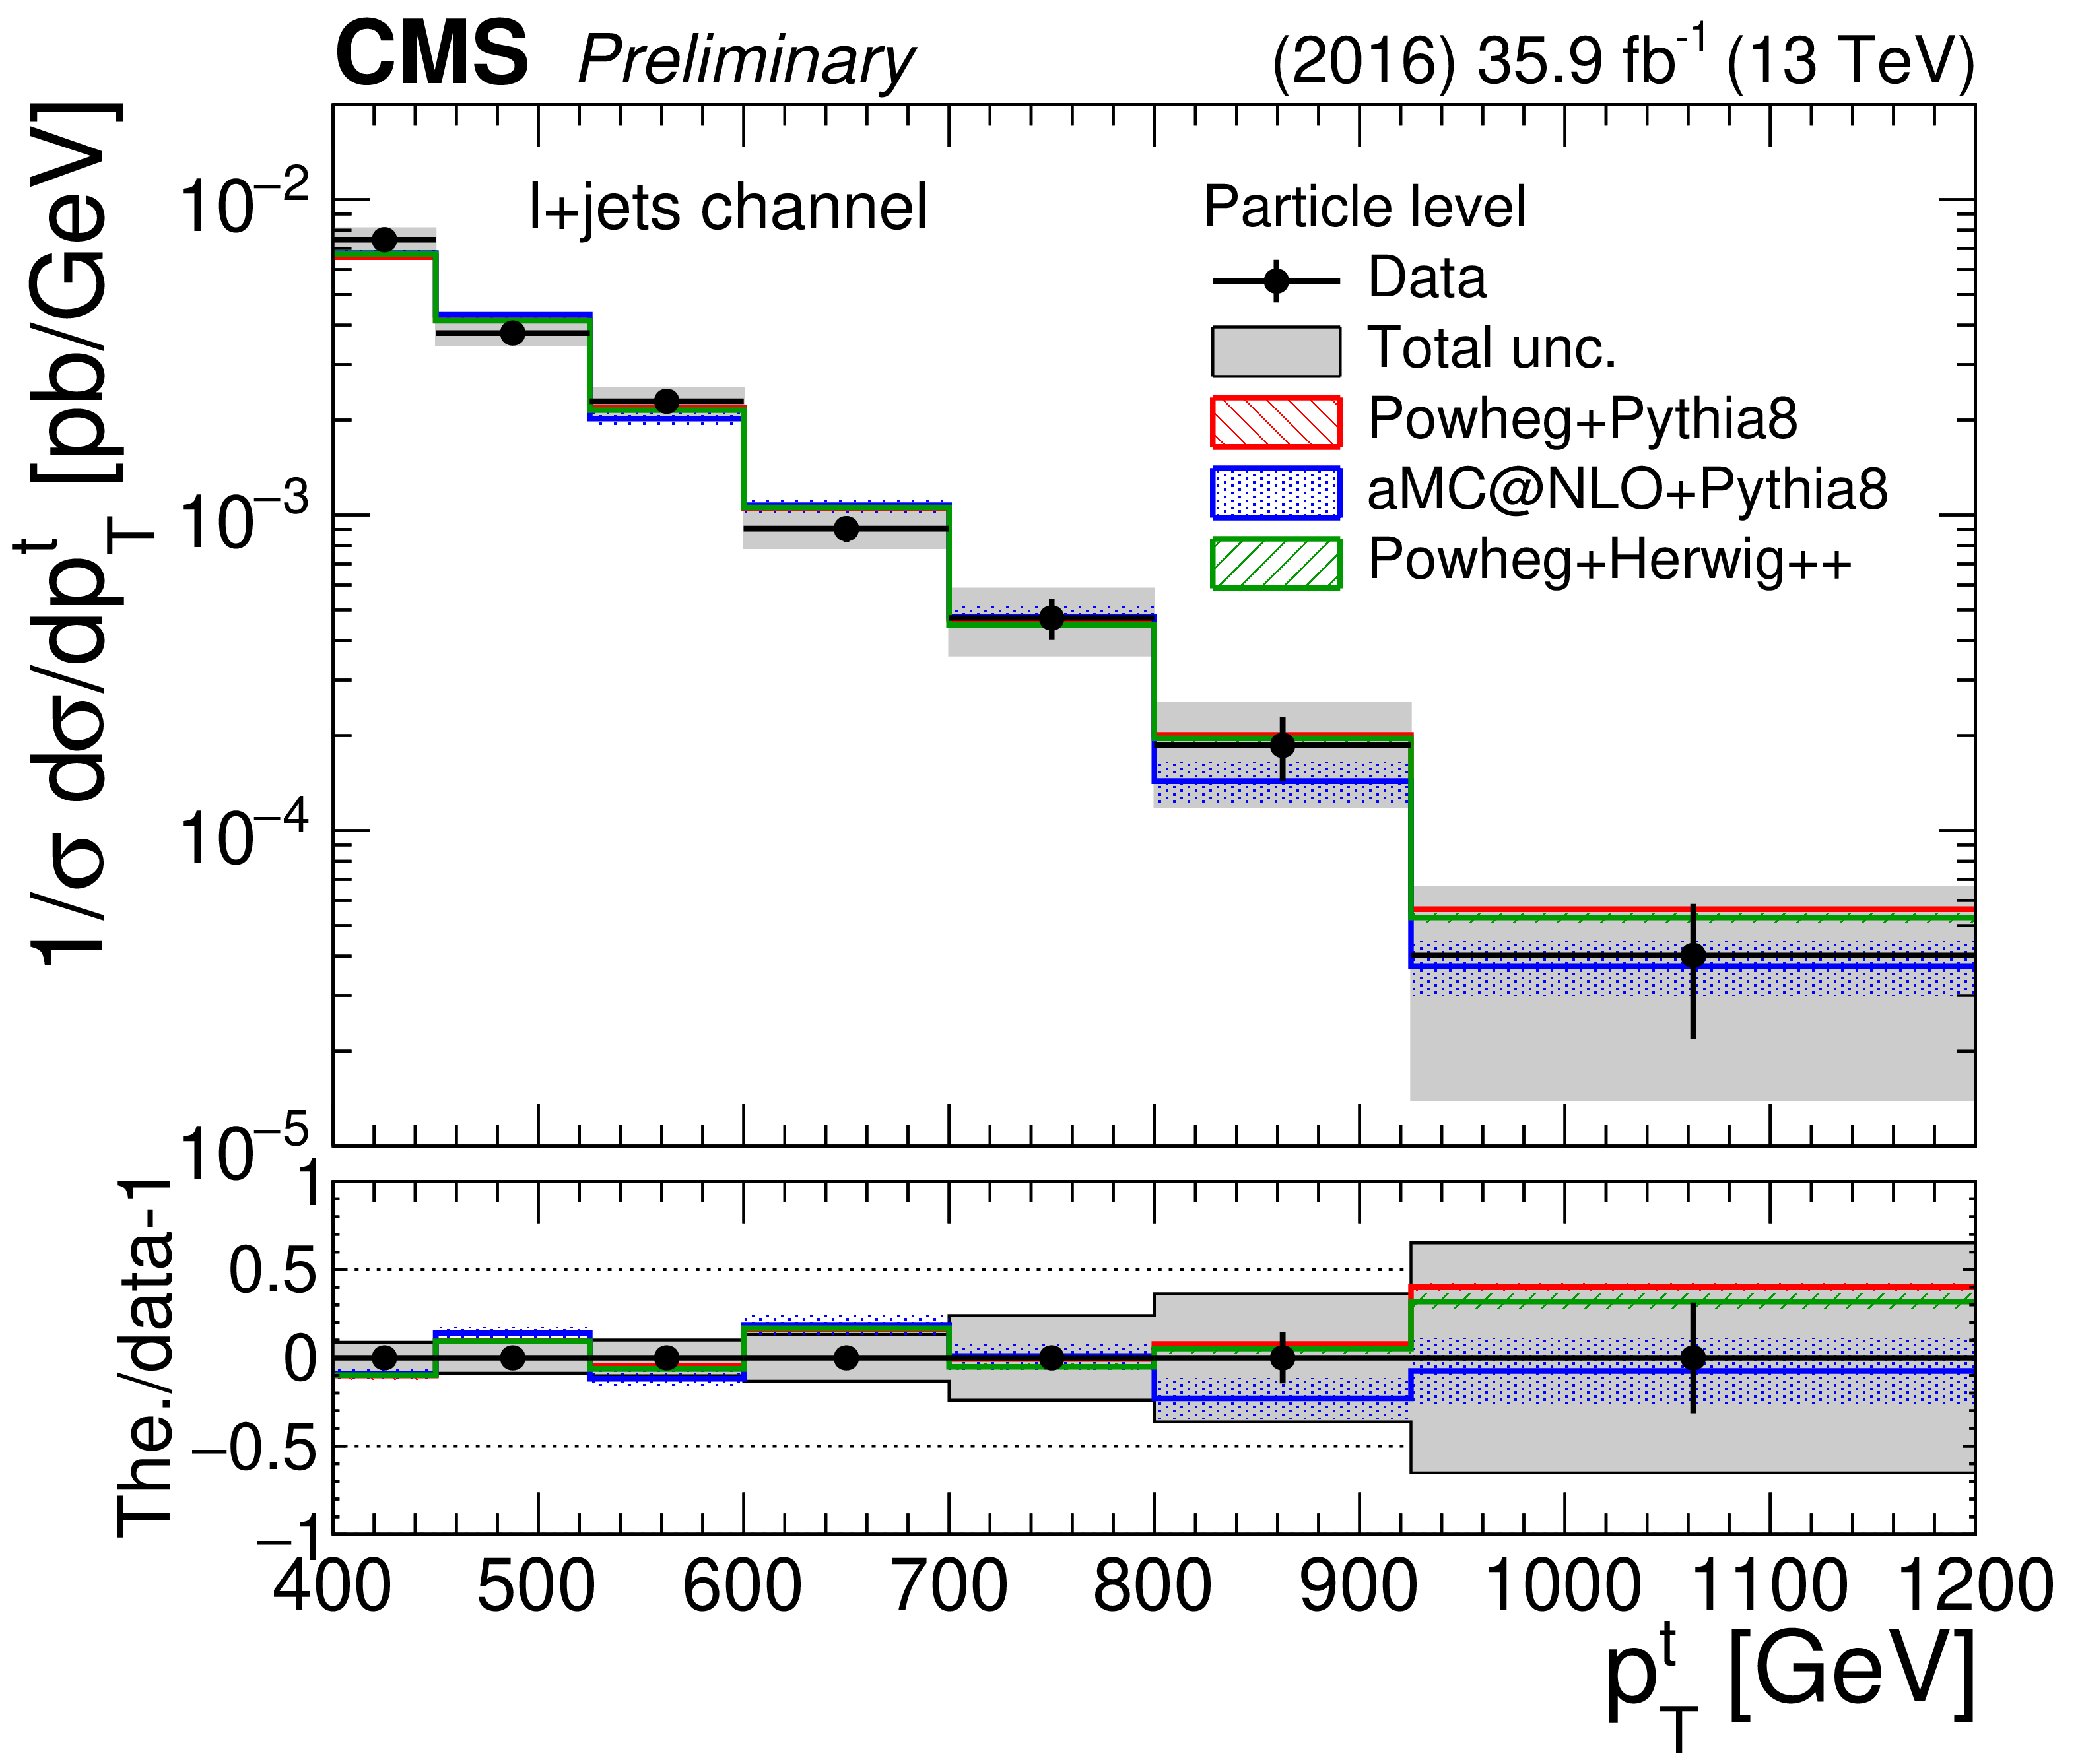
Differential cross section measurements at the particle level as a function of the particle-level t jet $ {p_{\mathrm {T}}} $ for the $\ell $+jets channel. Both absolute (left) and normalized (right) cross sections are shown. The uncertainties on the data markers are statistical, while the grey band shows the total statistical and systematic uncertainty. |

png pdf |
Figure 30-a:
Differential cross section measurements at the particle level as a function of the particle-level t jet $ {p_{\mathrm {T}}} $ for the $\ell $+jets channel. Both absolute (left) and normalized (right) cross sections are shown. The uncertainties on the data markers are statistical, while the grey band shows the total statistical and systematic uncertainty. |
png pdf |
Figure 30-b:
Differential cross section measurements at the particle level as a function of the particle-level t jet $ {p_{\mathrm {T}}} $ for the $\ell $+jets channel. Both absolute (left) and normalized (right) cross sections are shown. The uncertainties on the data markers are statistical, while the grey band shows the total statistical and systematic uncertainty. |
png pdf |
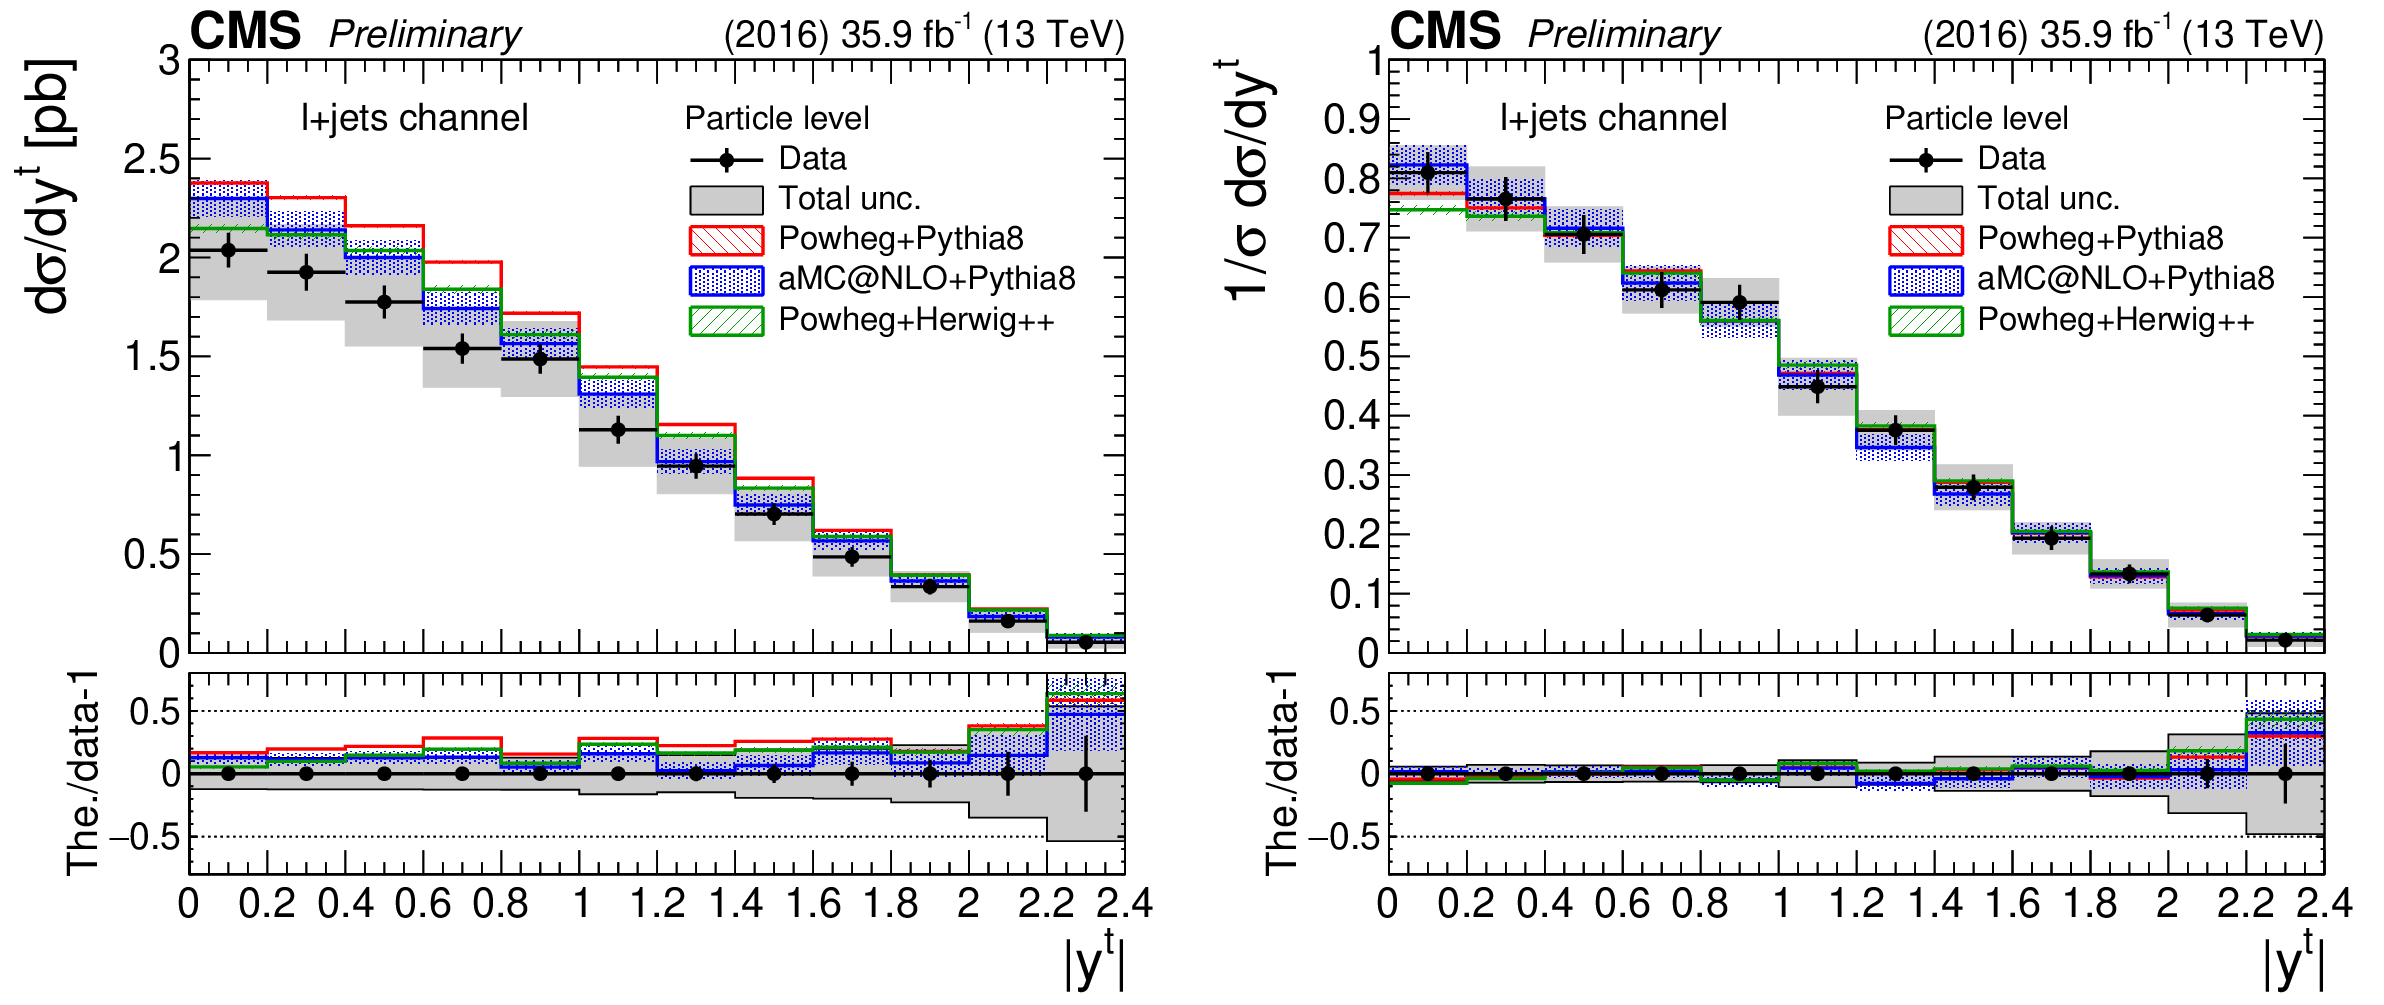
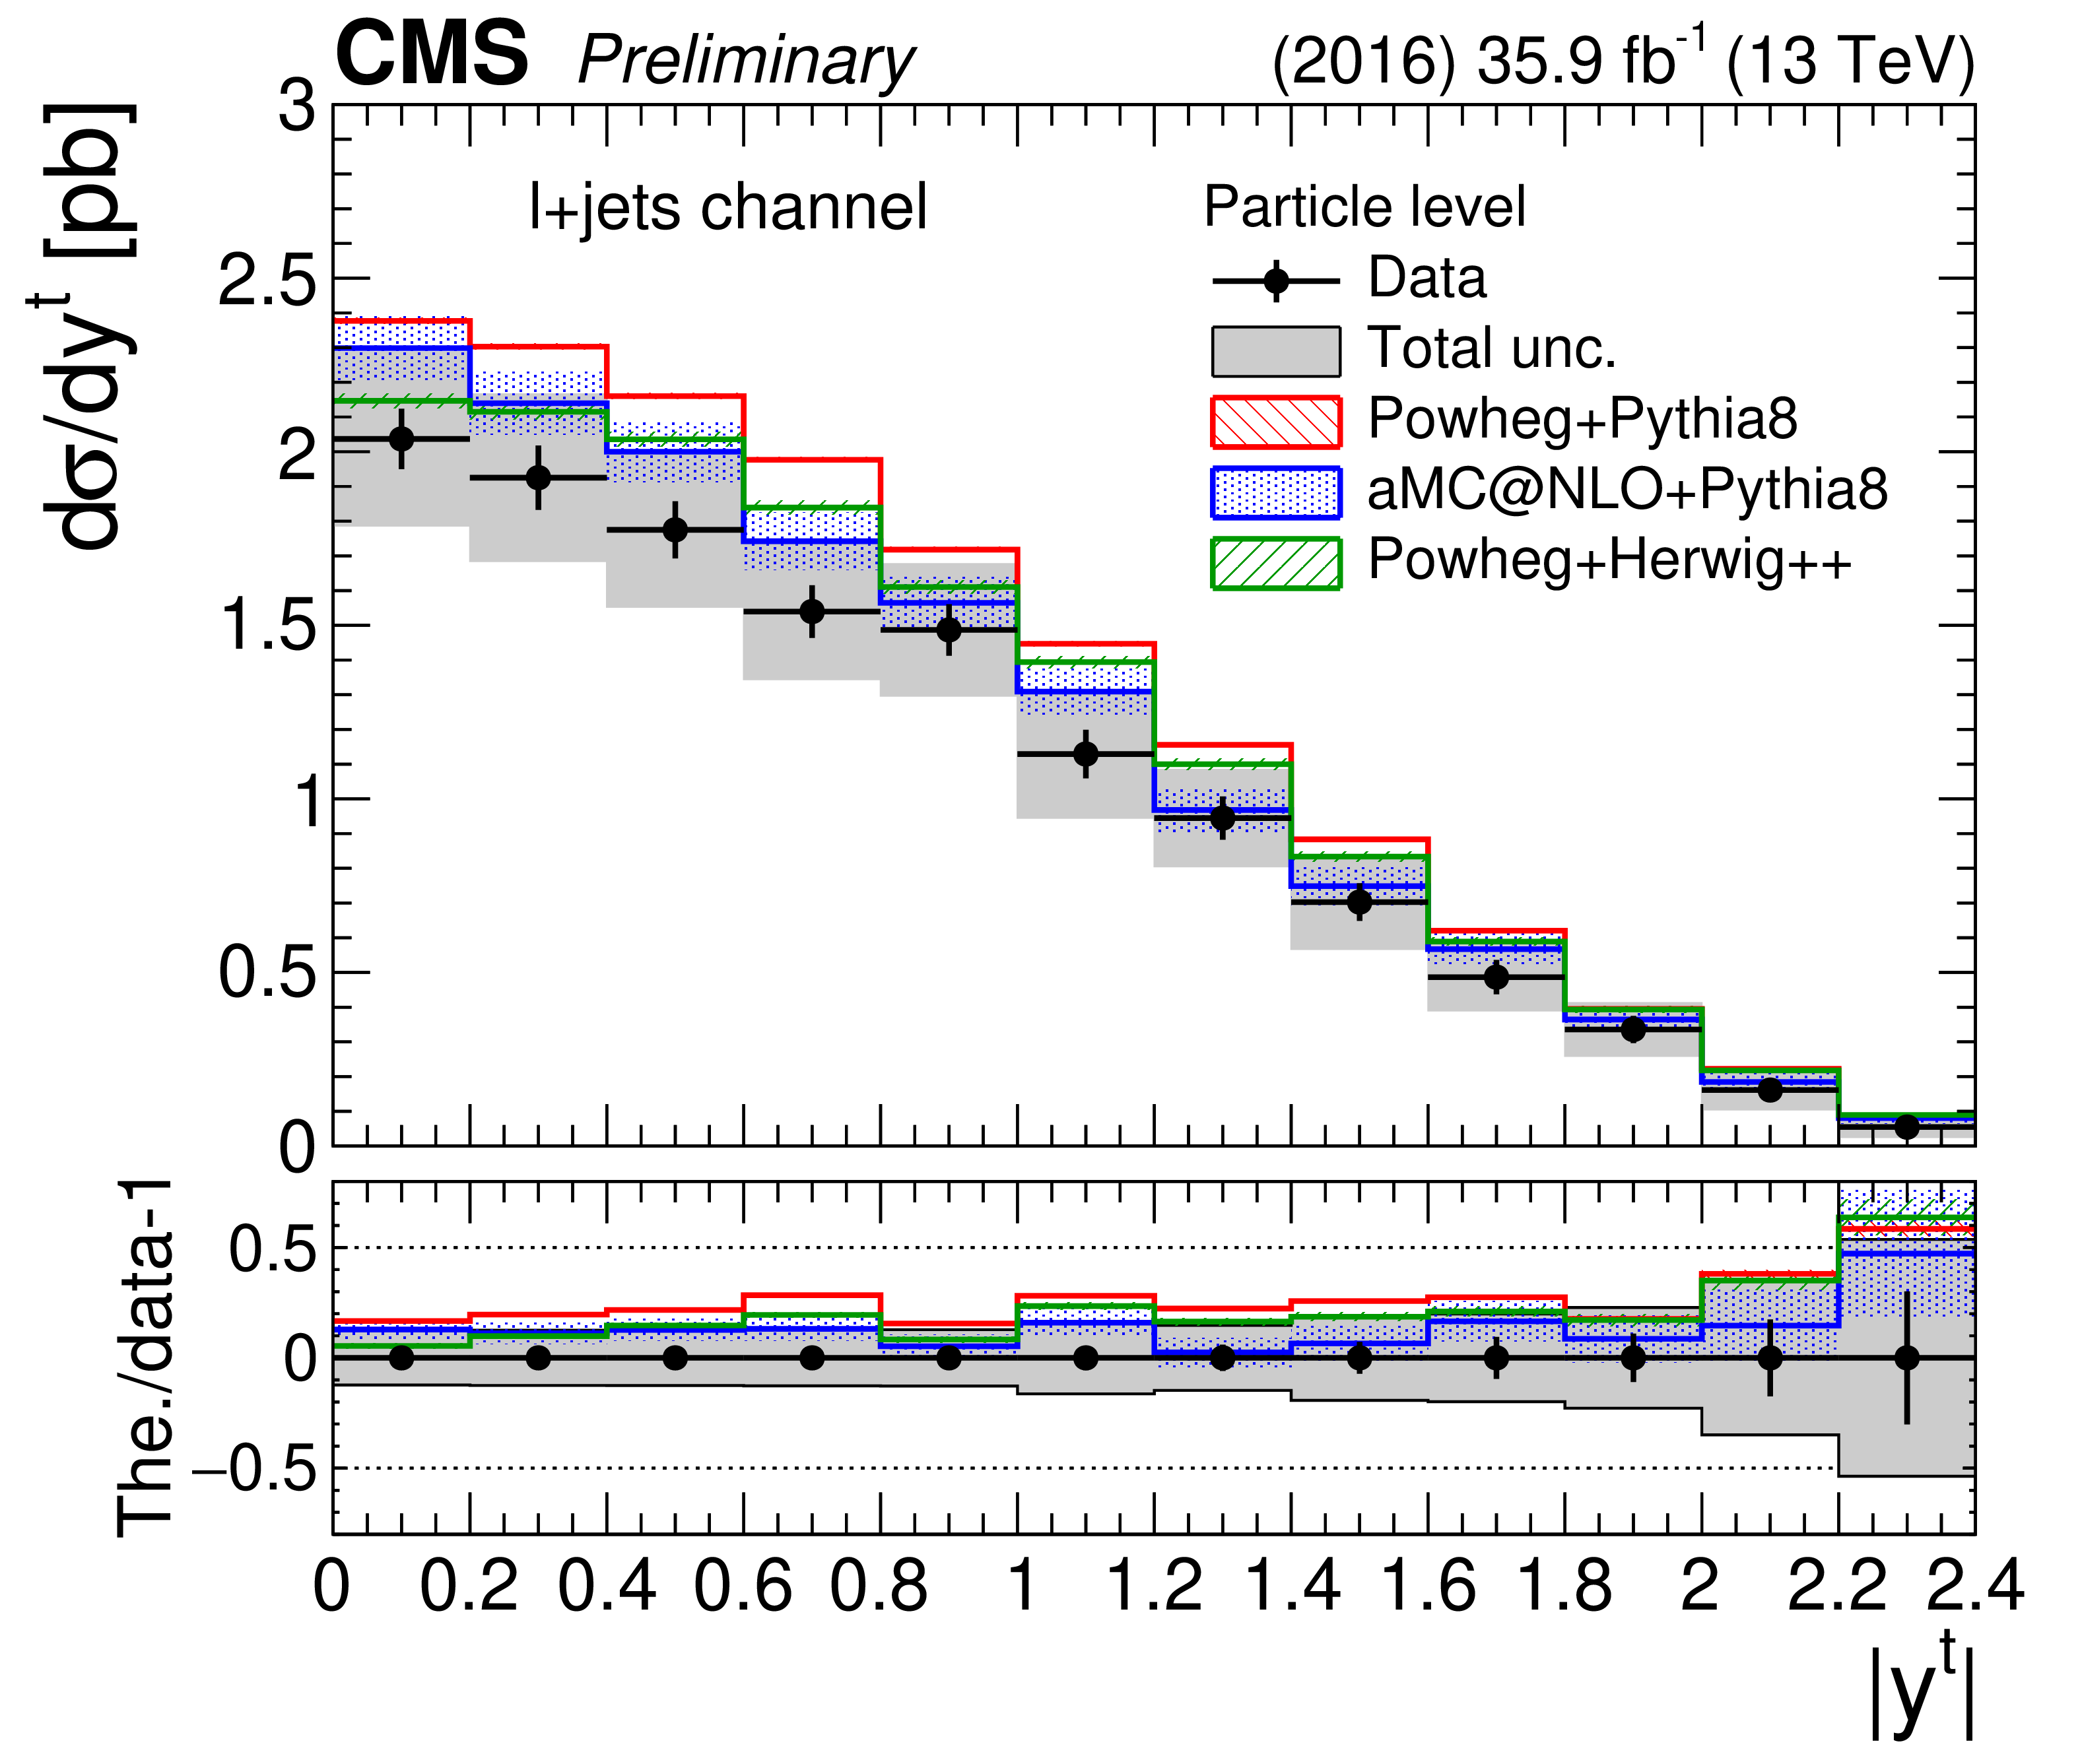
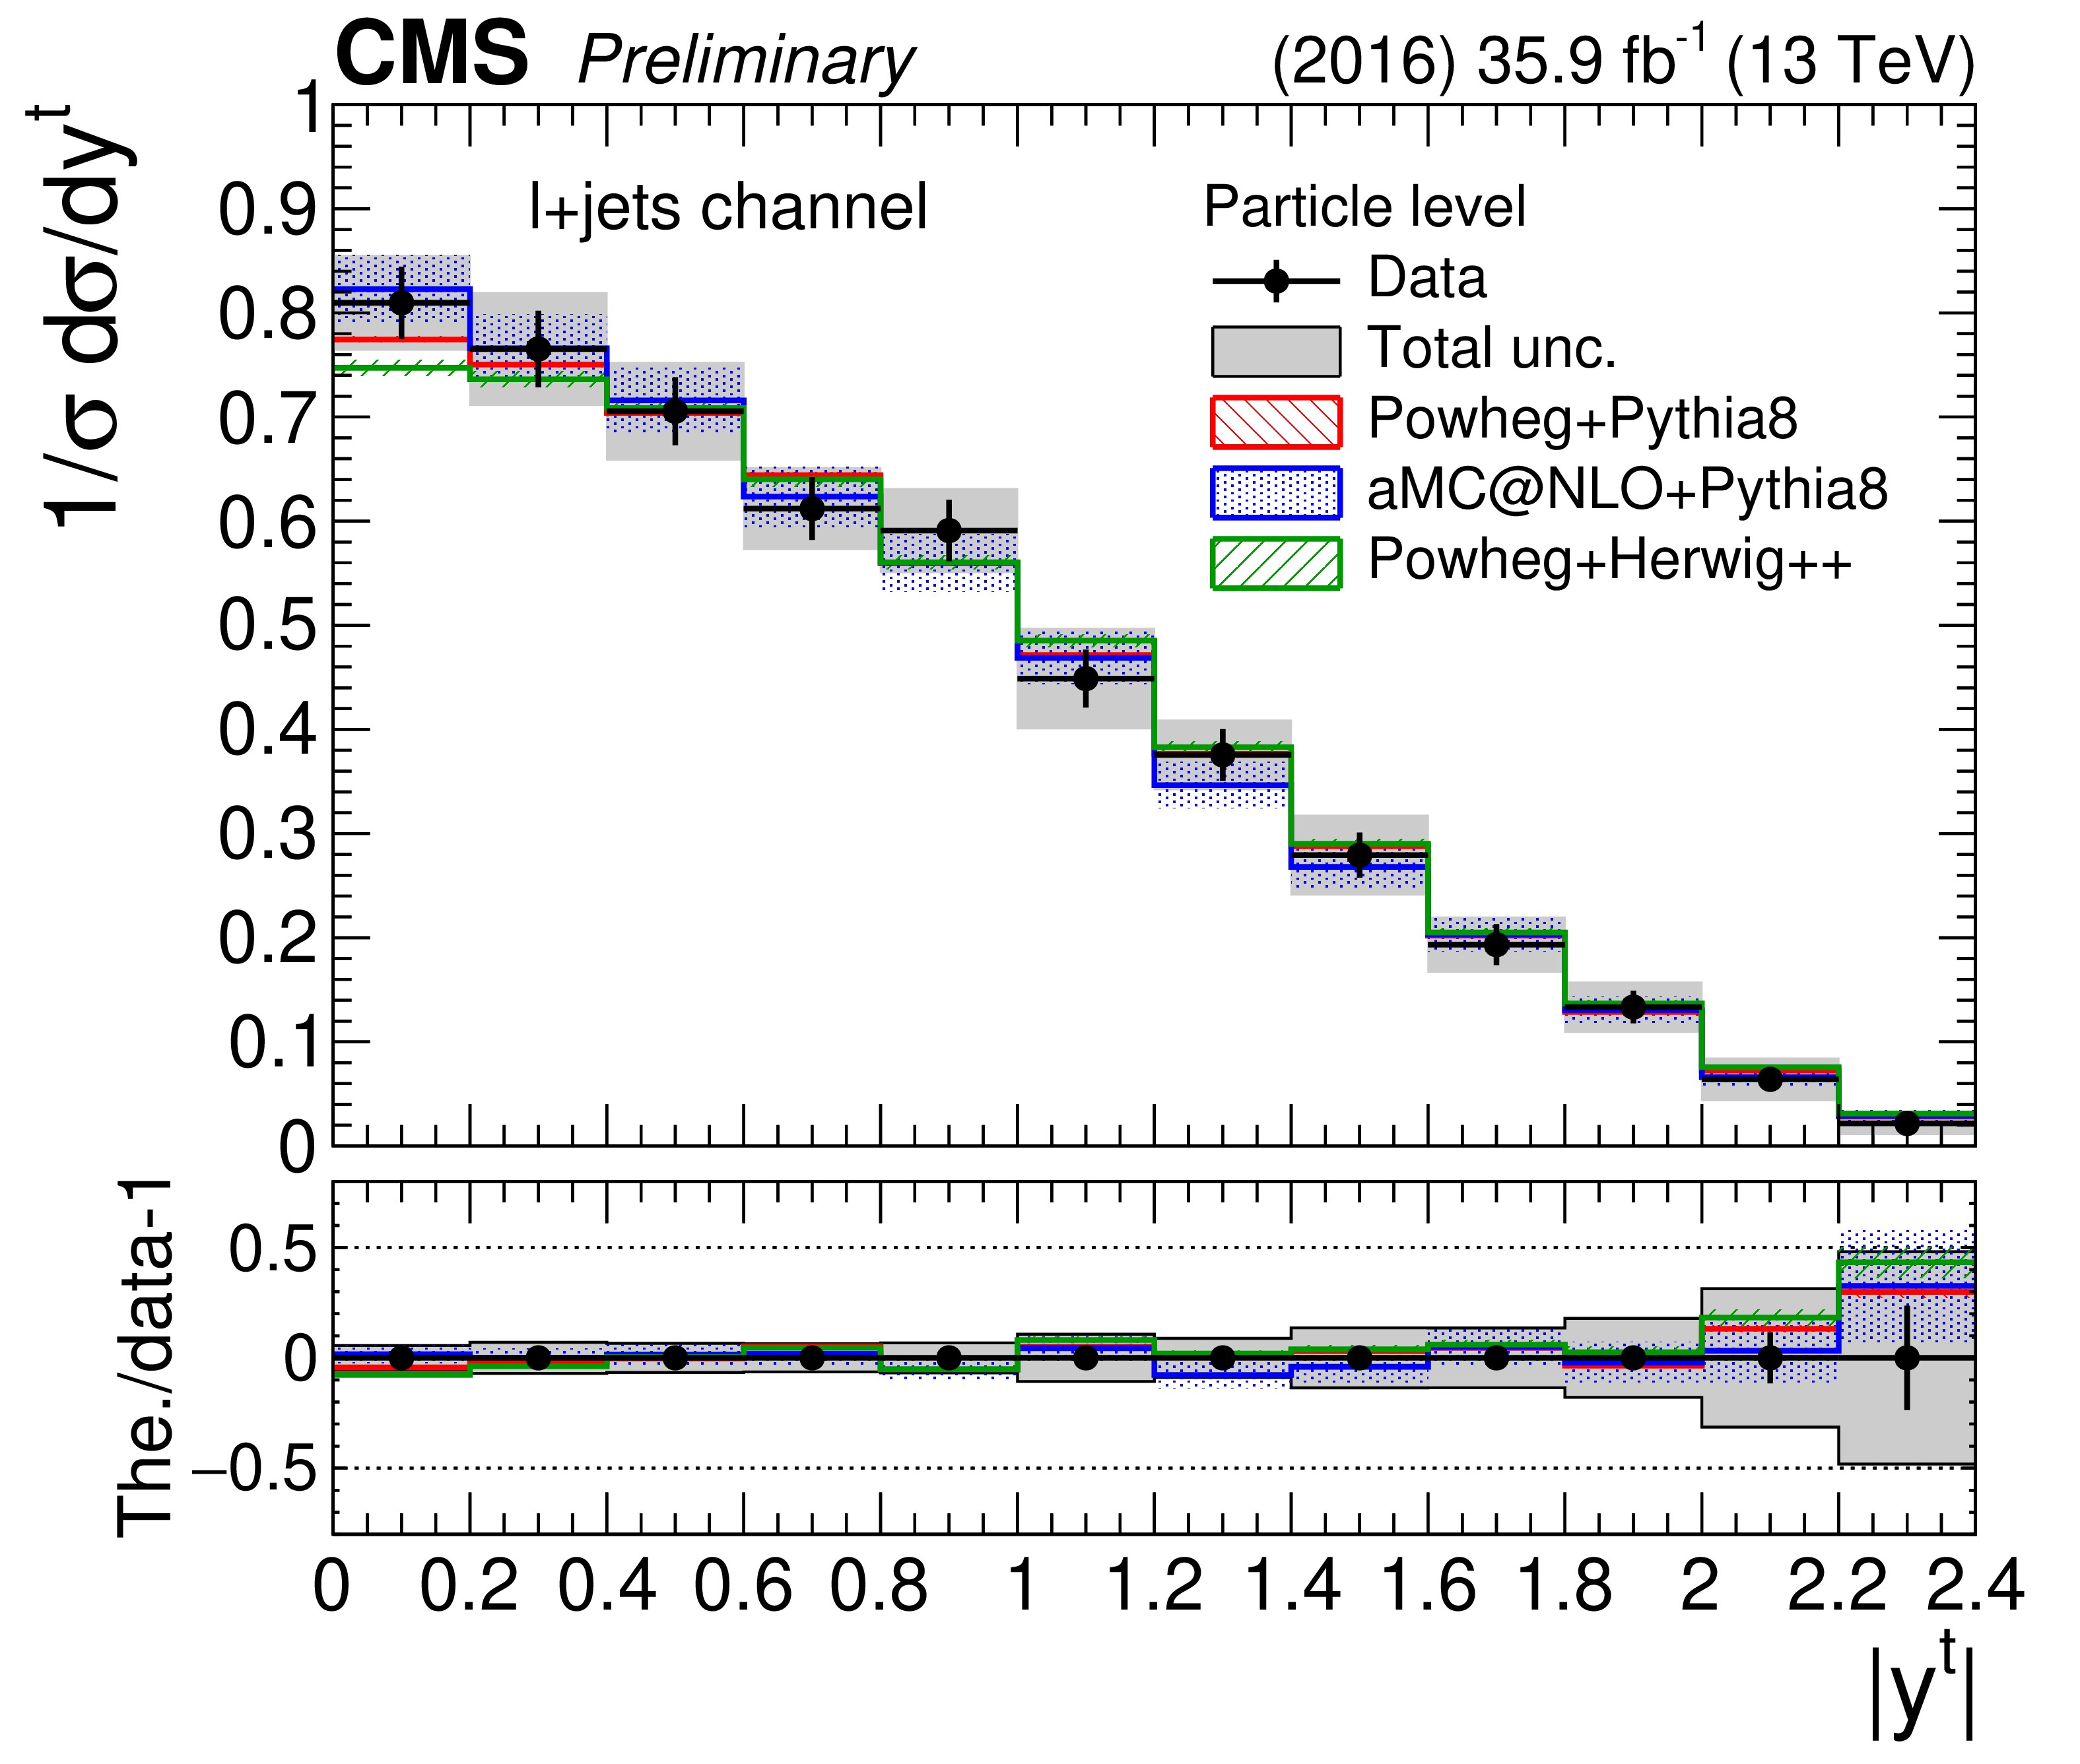
Figure 31:
Differential cross section measurements at the particle level as a function of the particle-level t jet $|y|$ for the $\ell $+jets channel. Both absolute (left) and normalized (right) cross sections are shown. The uncertainties on the data markers are statistical, while the grey band shows the total statistical and systematic uncertainty. |
png pdf |
Figure 31-a:
Differential cross section measurements at the particle level as a function of the particle-level t jet $|y|$ for the $\ell $+jets channel. Both absolute (left) and normalized (right) cross sections are shown. The uncertainties on the data markers are statistical, while the grey band shows the total statistical and systematic uncertainty. |
png pdf |
Figure 31-b:
Differential cross section measurements at the particle level as a function of the particle-level t jet $|y|$ for the $\ell $+jets channel. Both absolute (left) and normalized (right) cross sections are shown. The uncertainties on the data markers are statistical, while the grey band shows the total statistical and systematic uncertainty. |
png pdf |
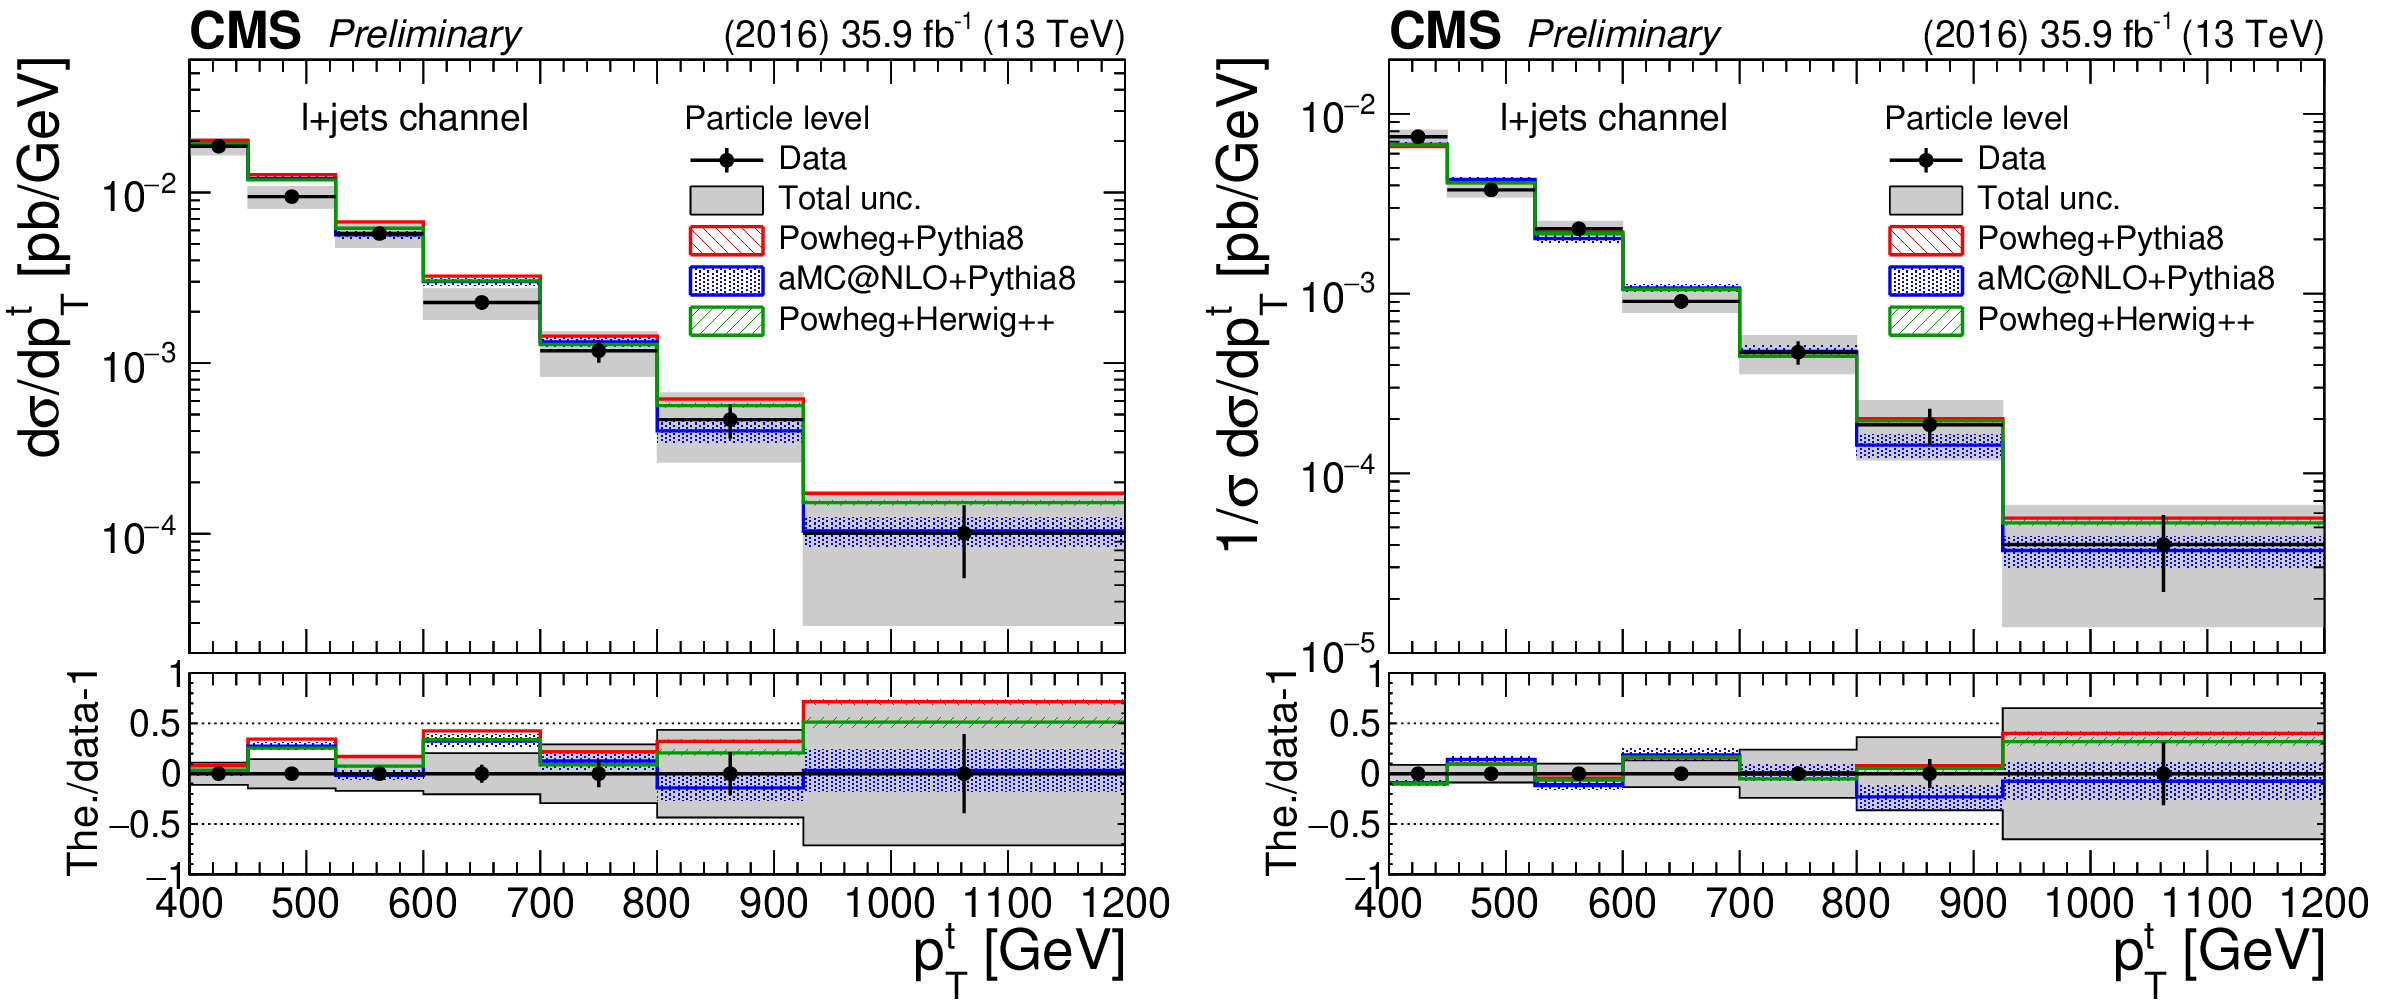
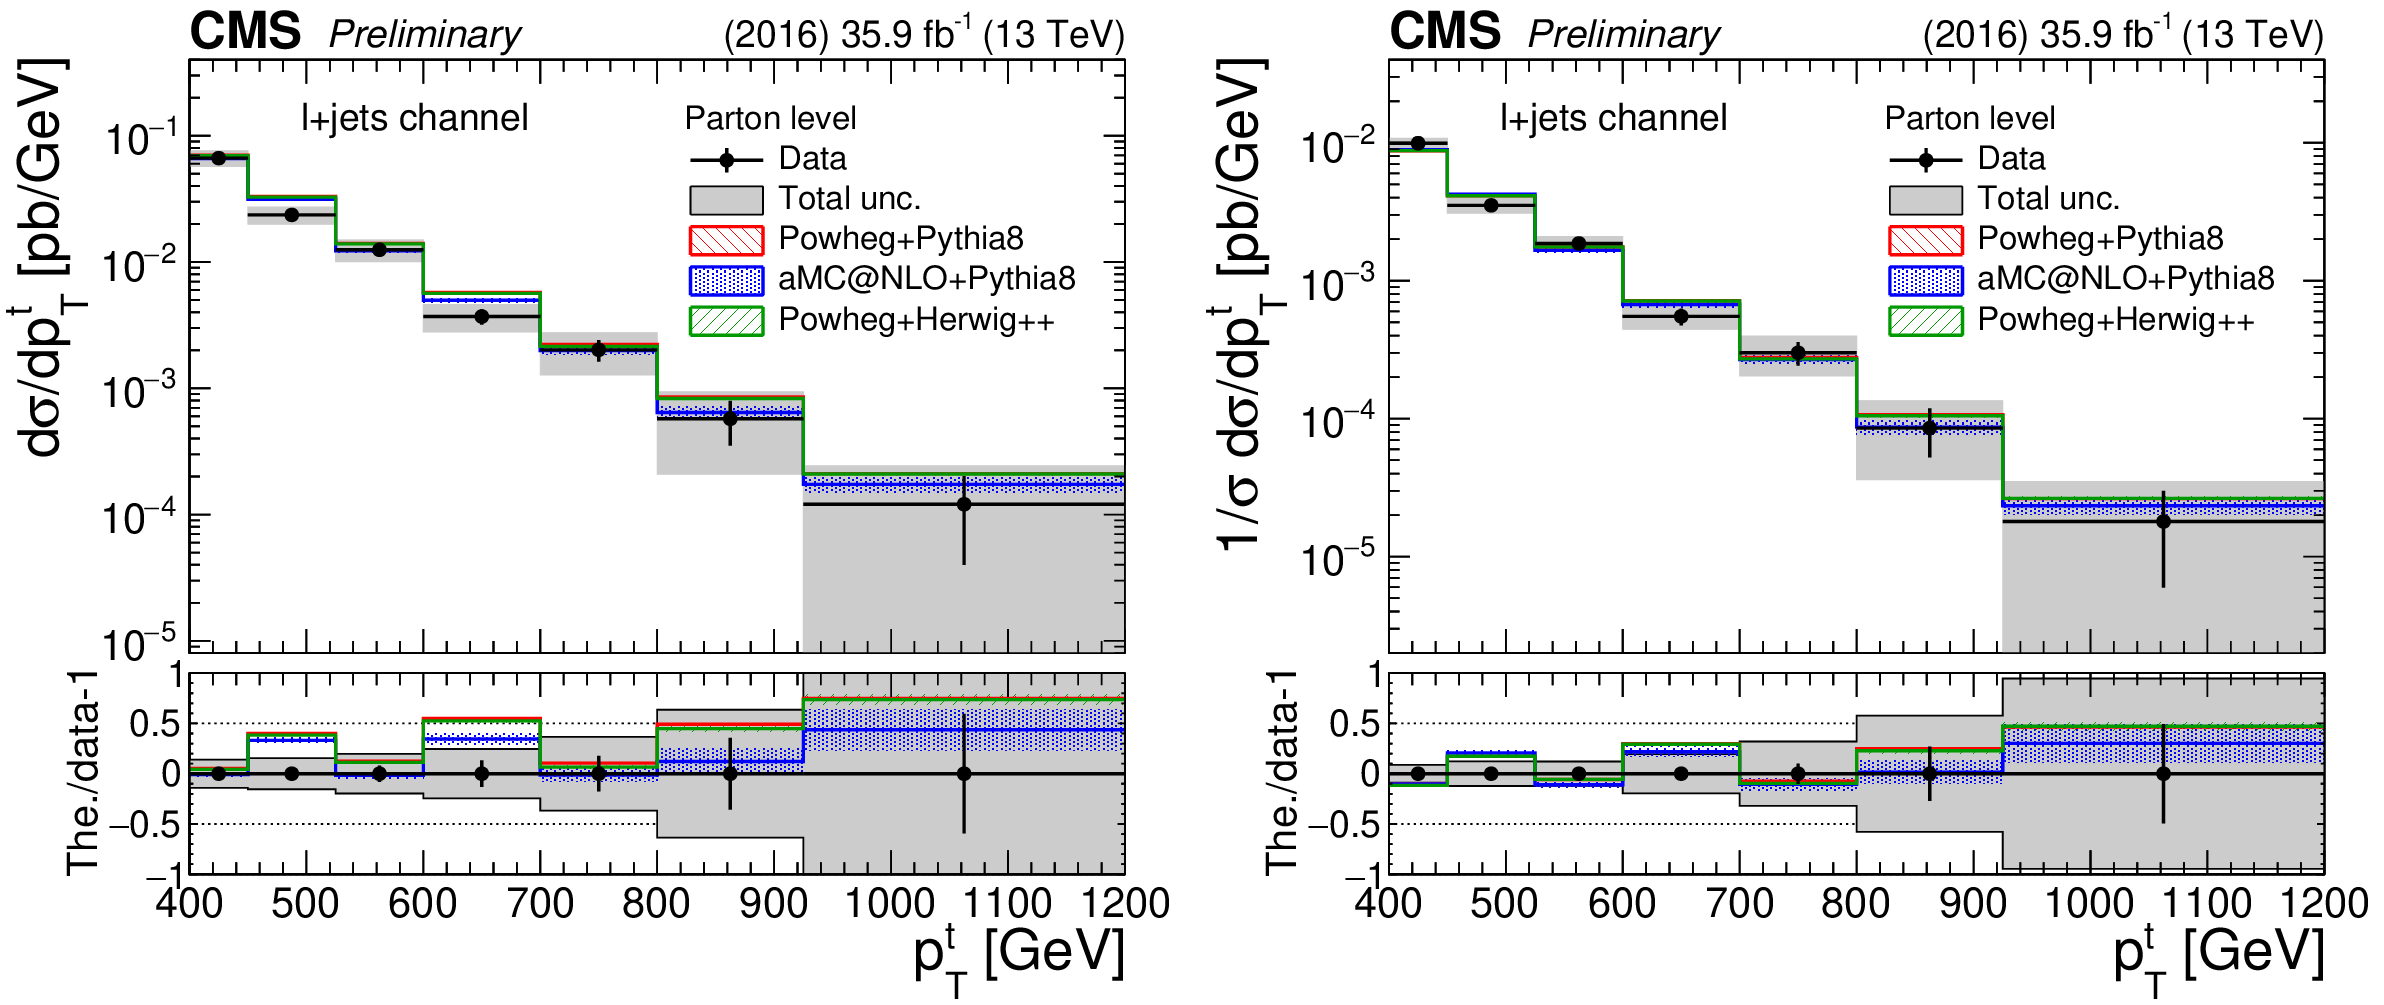
Figure 32:
Differential cross section measurements at the parton level as a function of the parton-level top quark $ {p_{\mathrm {T}}} $ for the $\ell $+jets channel. Both absolute (left) and normalized (right) cross sections are shown. The uncertainties on the data markers are statistical, while the grey band shows the total statistical and systematic uncertainty. |
png pdf |
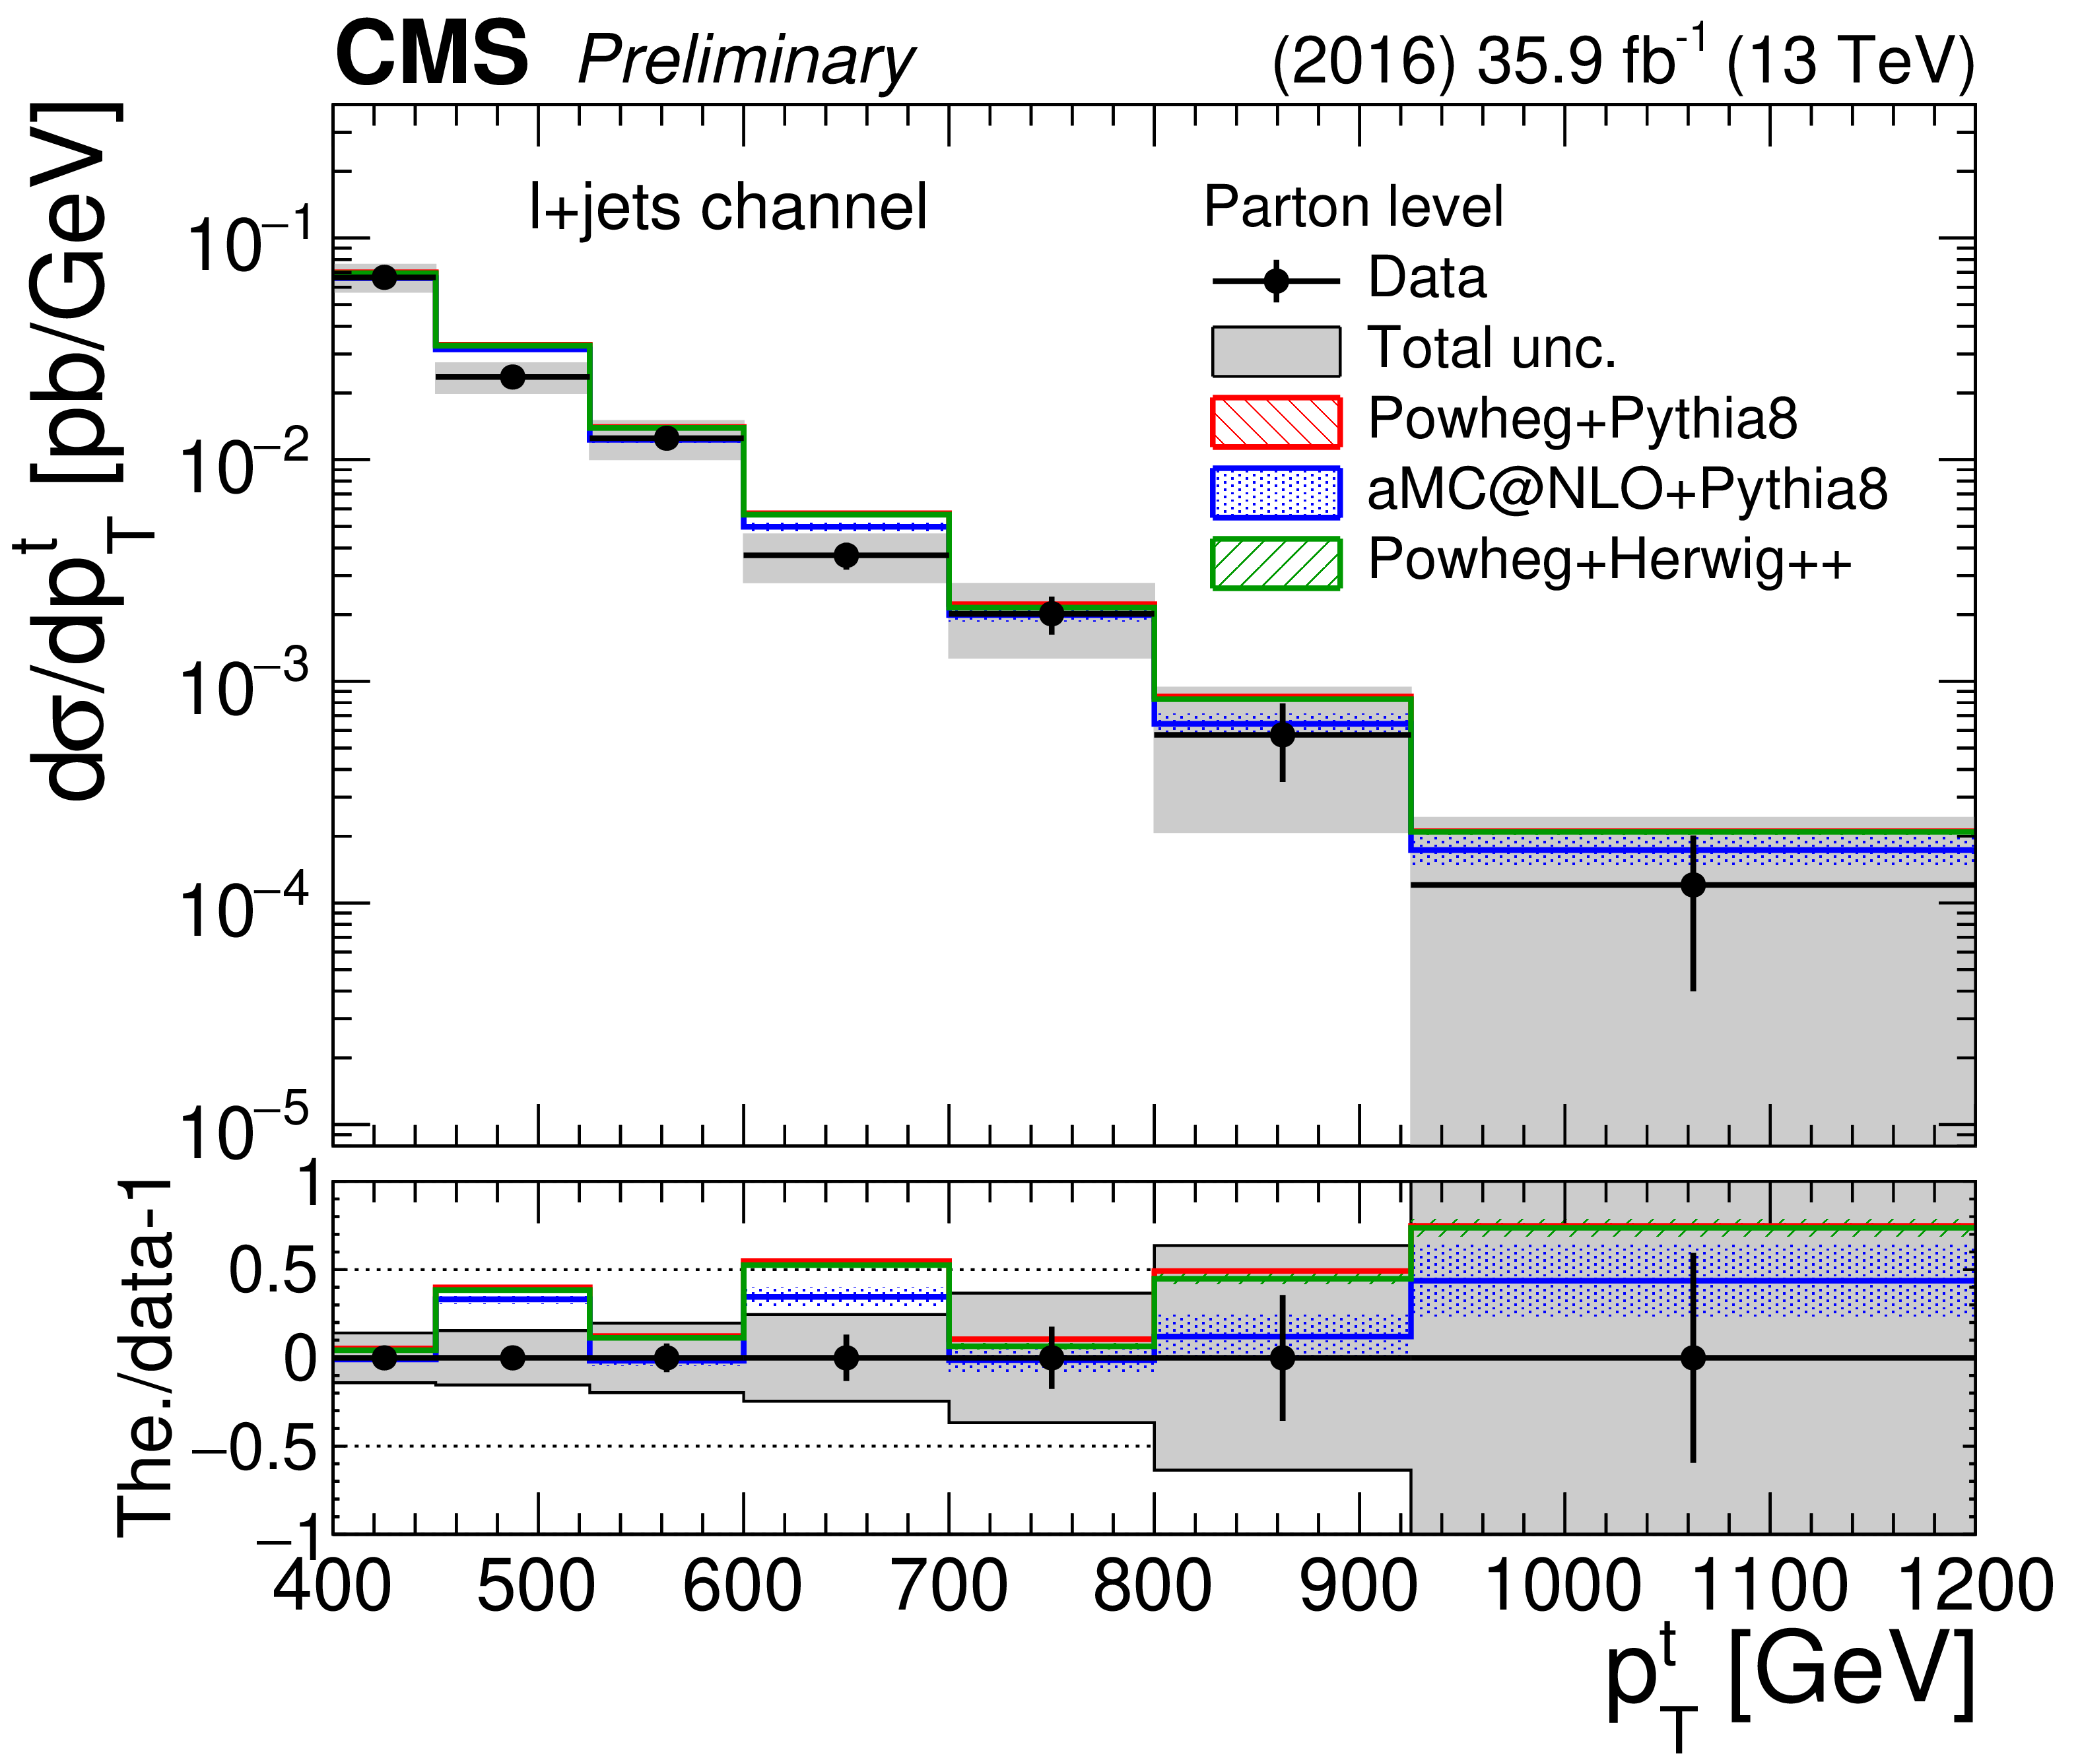
Figure 32-a:
Differential cross section measurements at the parton level as a function of the parton-level top quark $ {p_{\mathrm {T}}} $ for the $\ell $+jets channel. Both absolute (left) and normalized (right) cross sections are shown. The uncertainties on the data markers are statistical, while the grey band shows the total statistical and systematic uncertainty. |
png pdf |
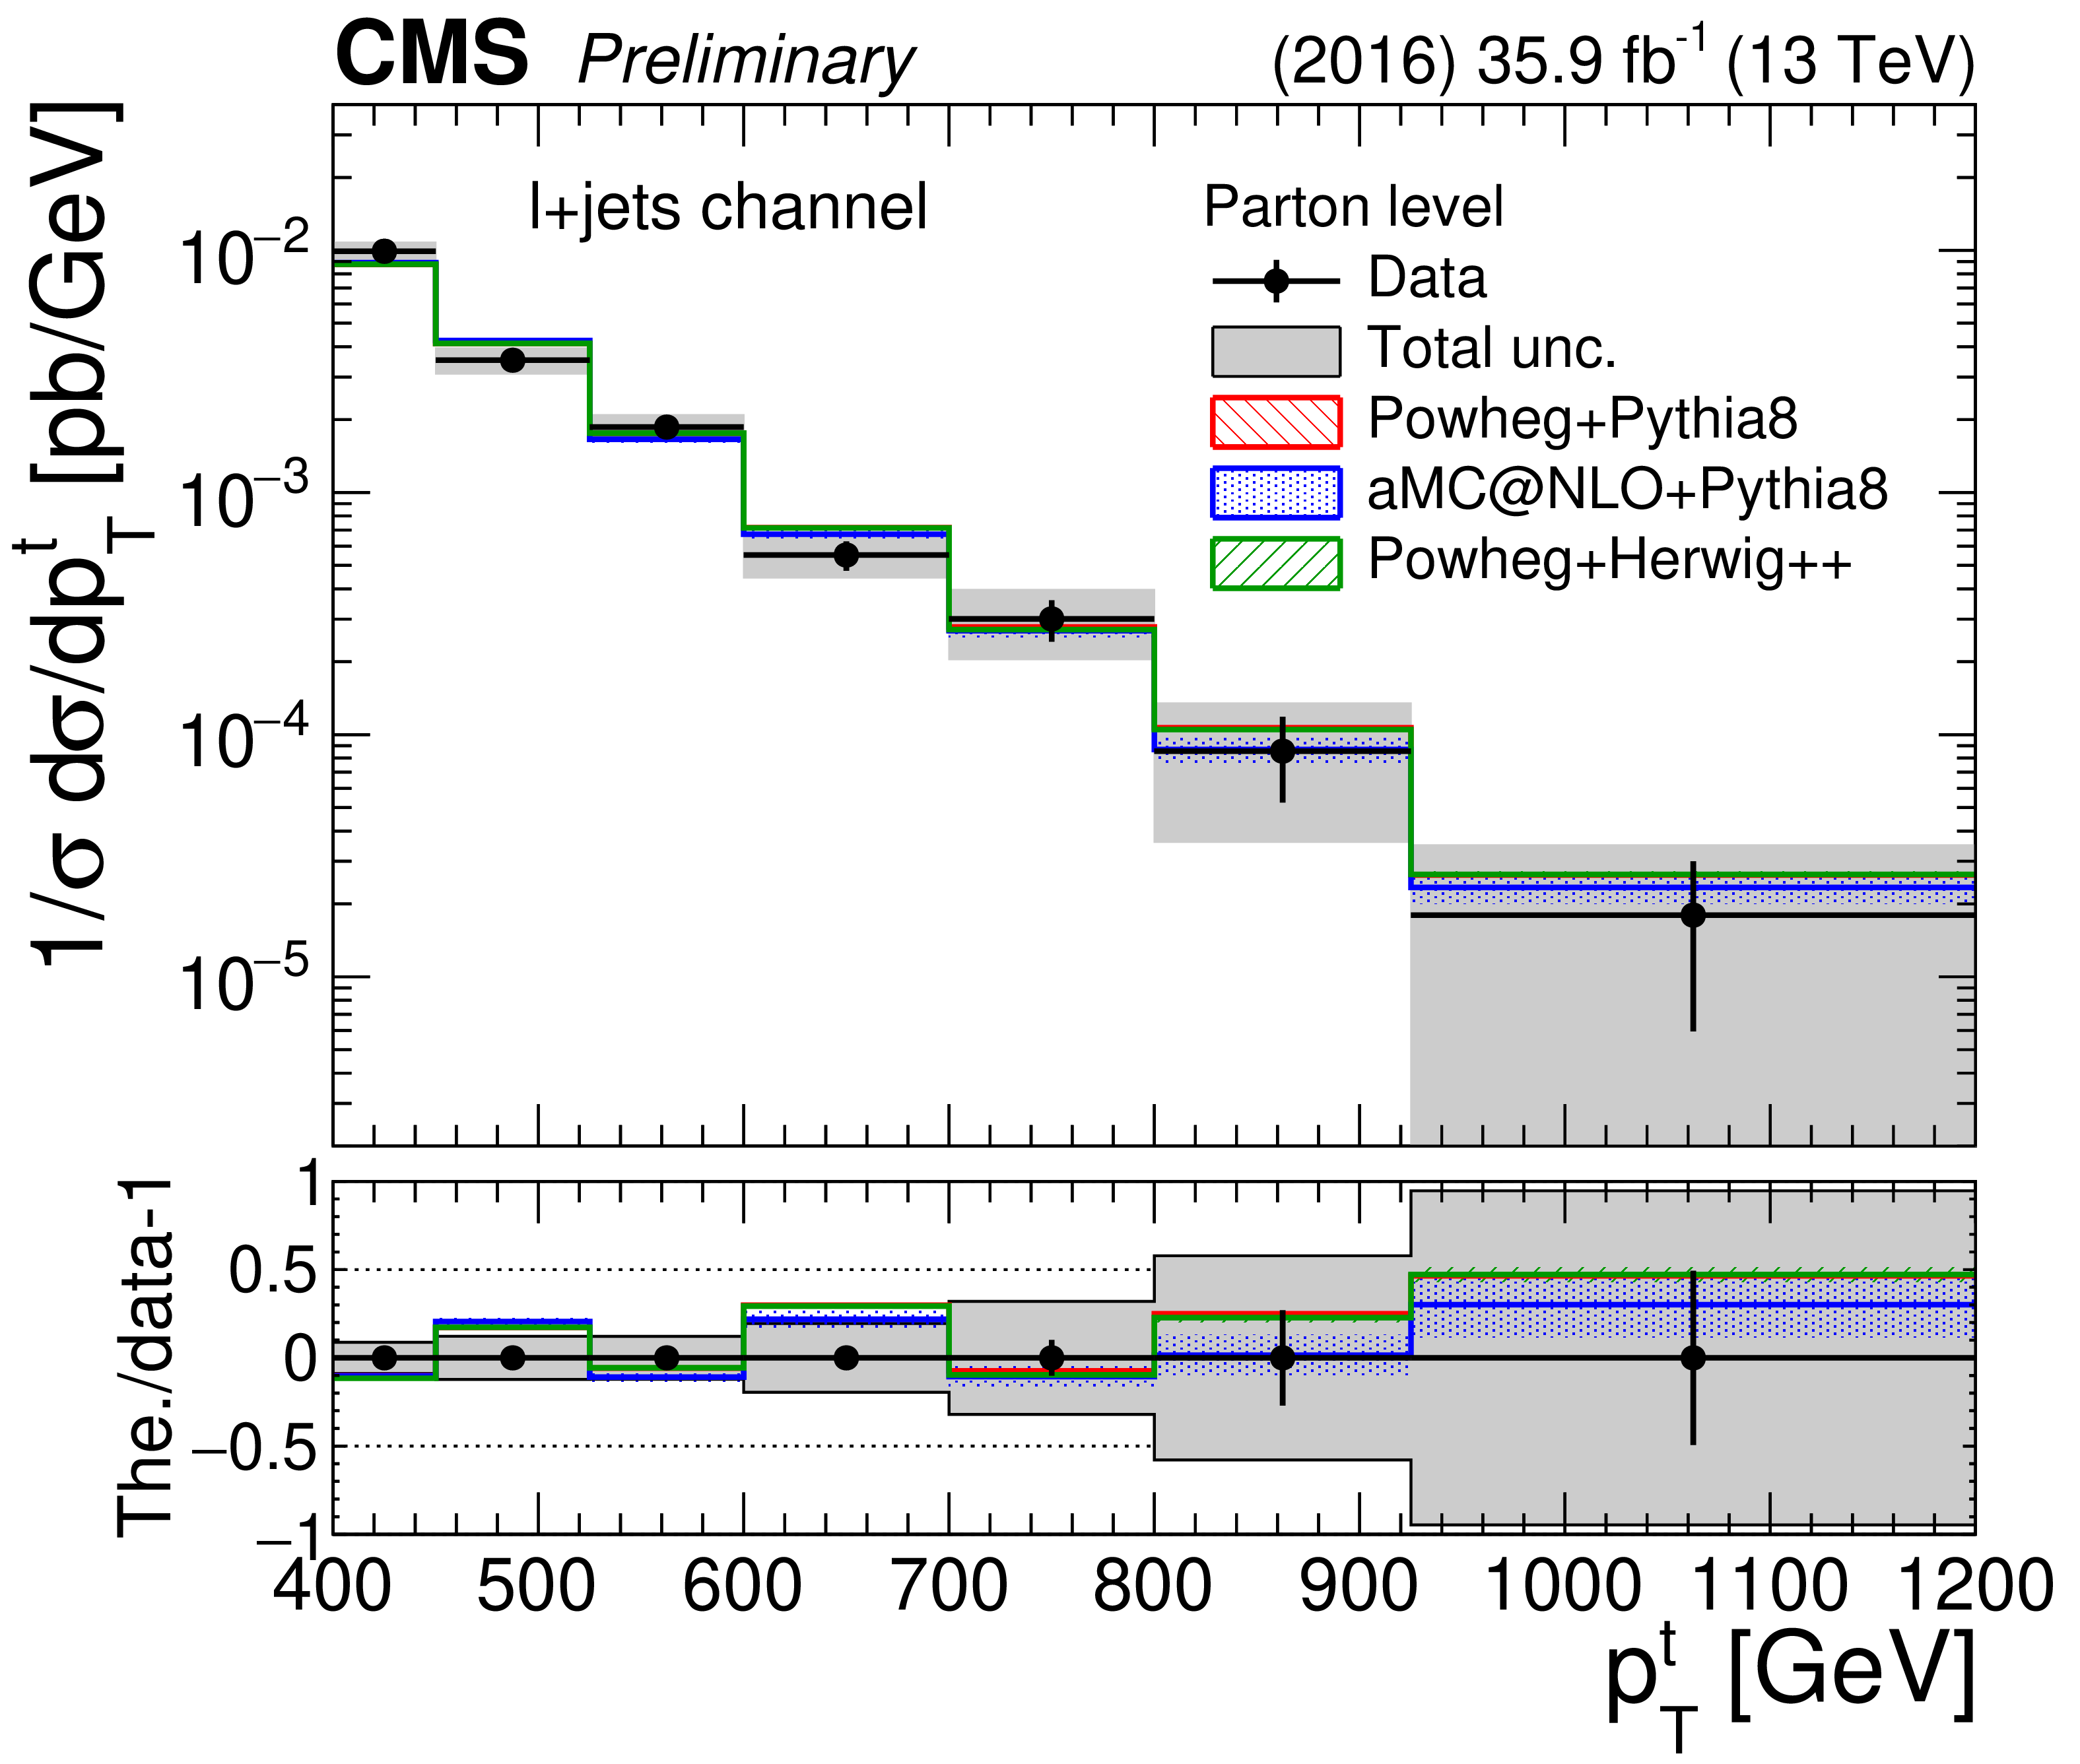
Figure 32-b:
Differential cross section measurements at the parton level as a function of the parton-level top quark $ {p_{\mathrm {T}}} $ for the $\ell $+jets channel. Both absolute (left) and normalized (right) cross sections are shown. The uncertainties on the data markers are statistical, while the grey band shows the total statistical and systematic uncertainty. |
png pdf |
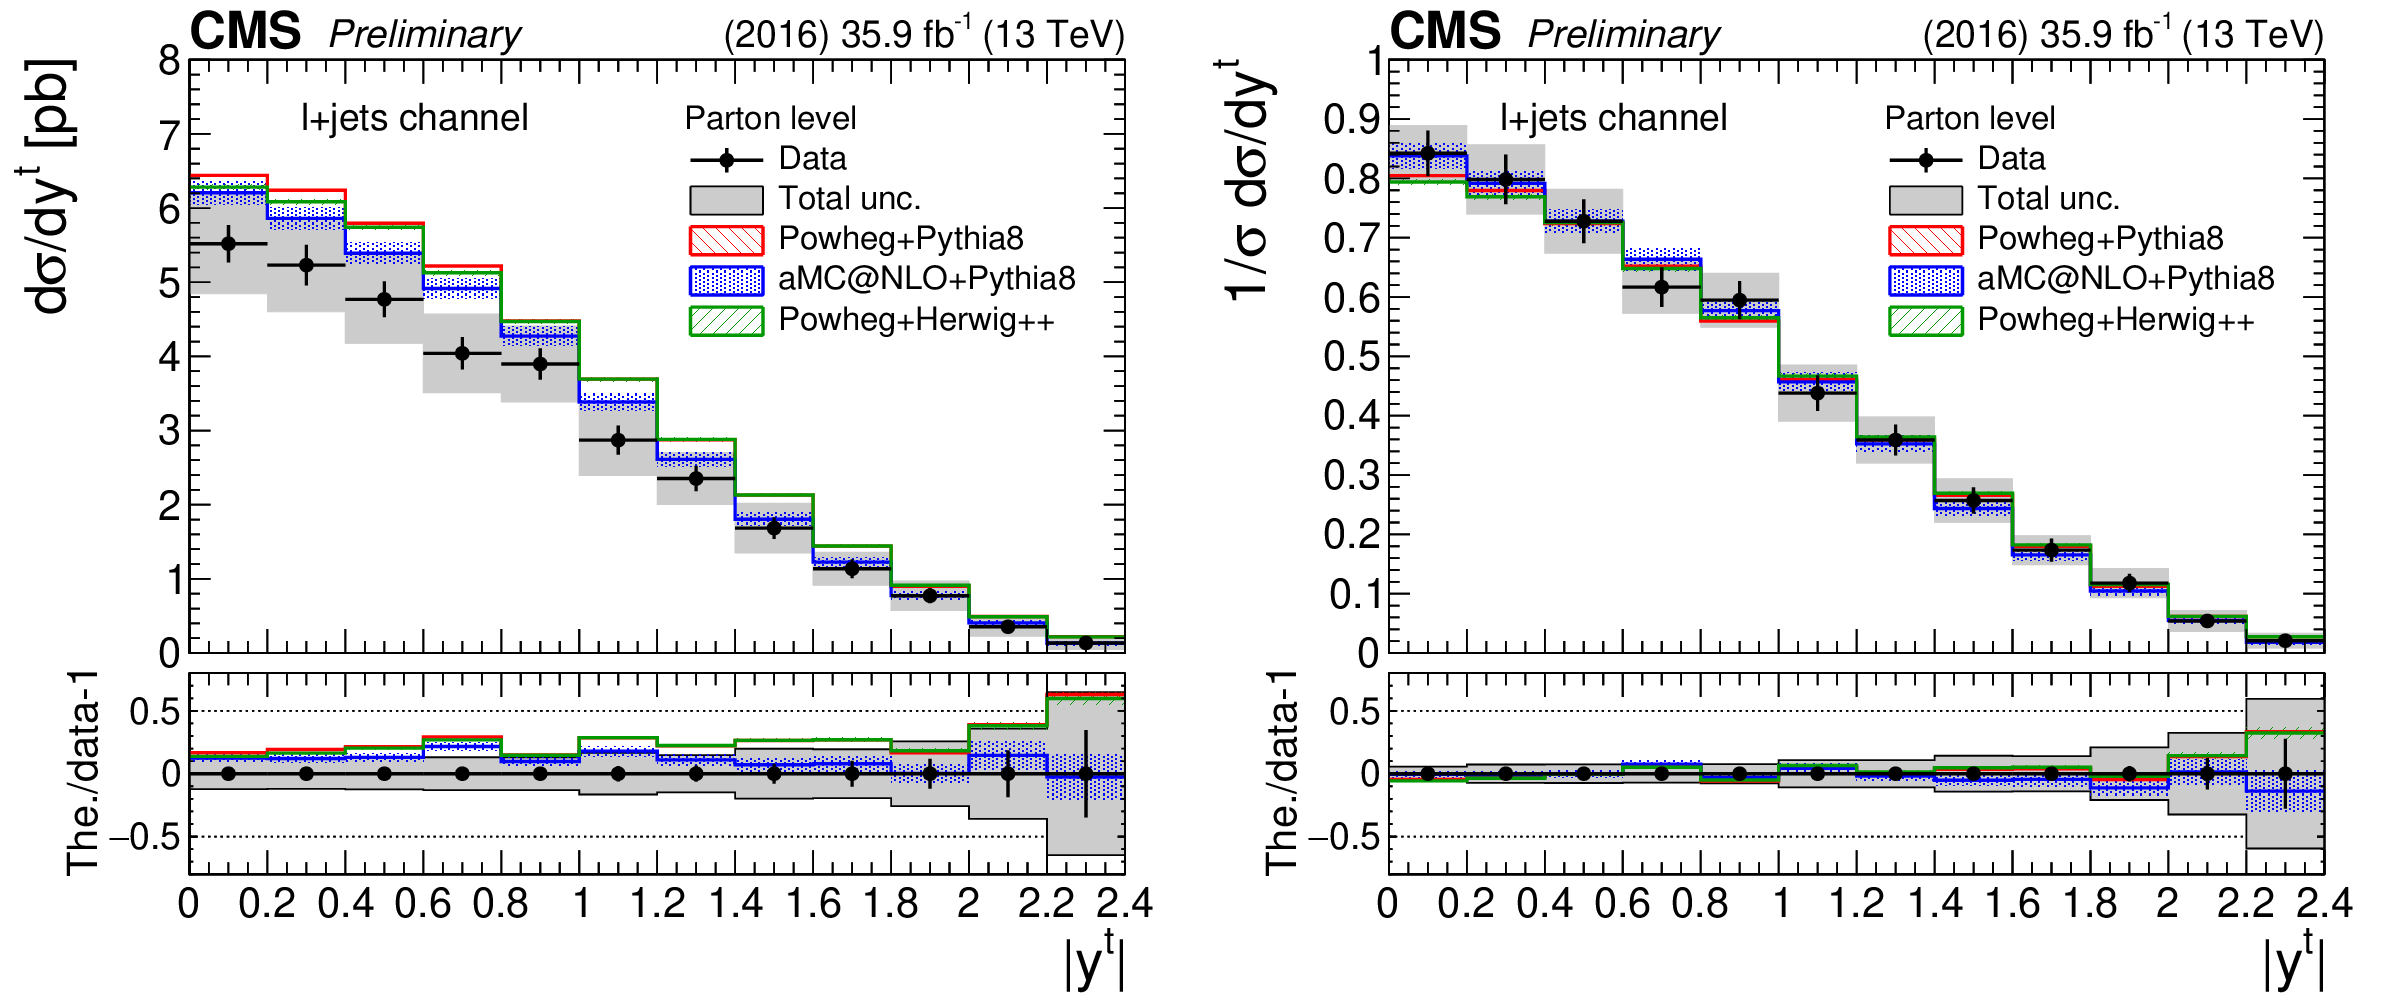
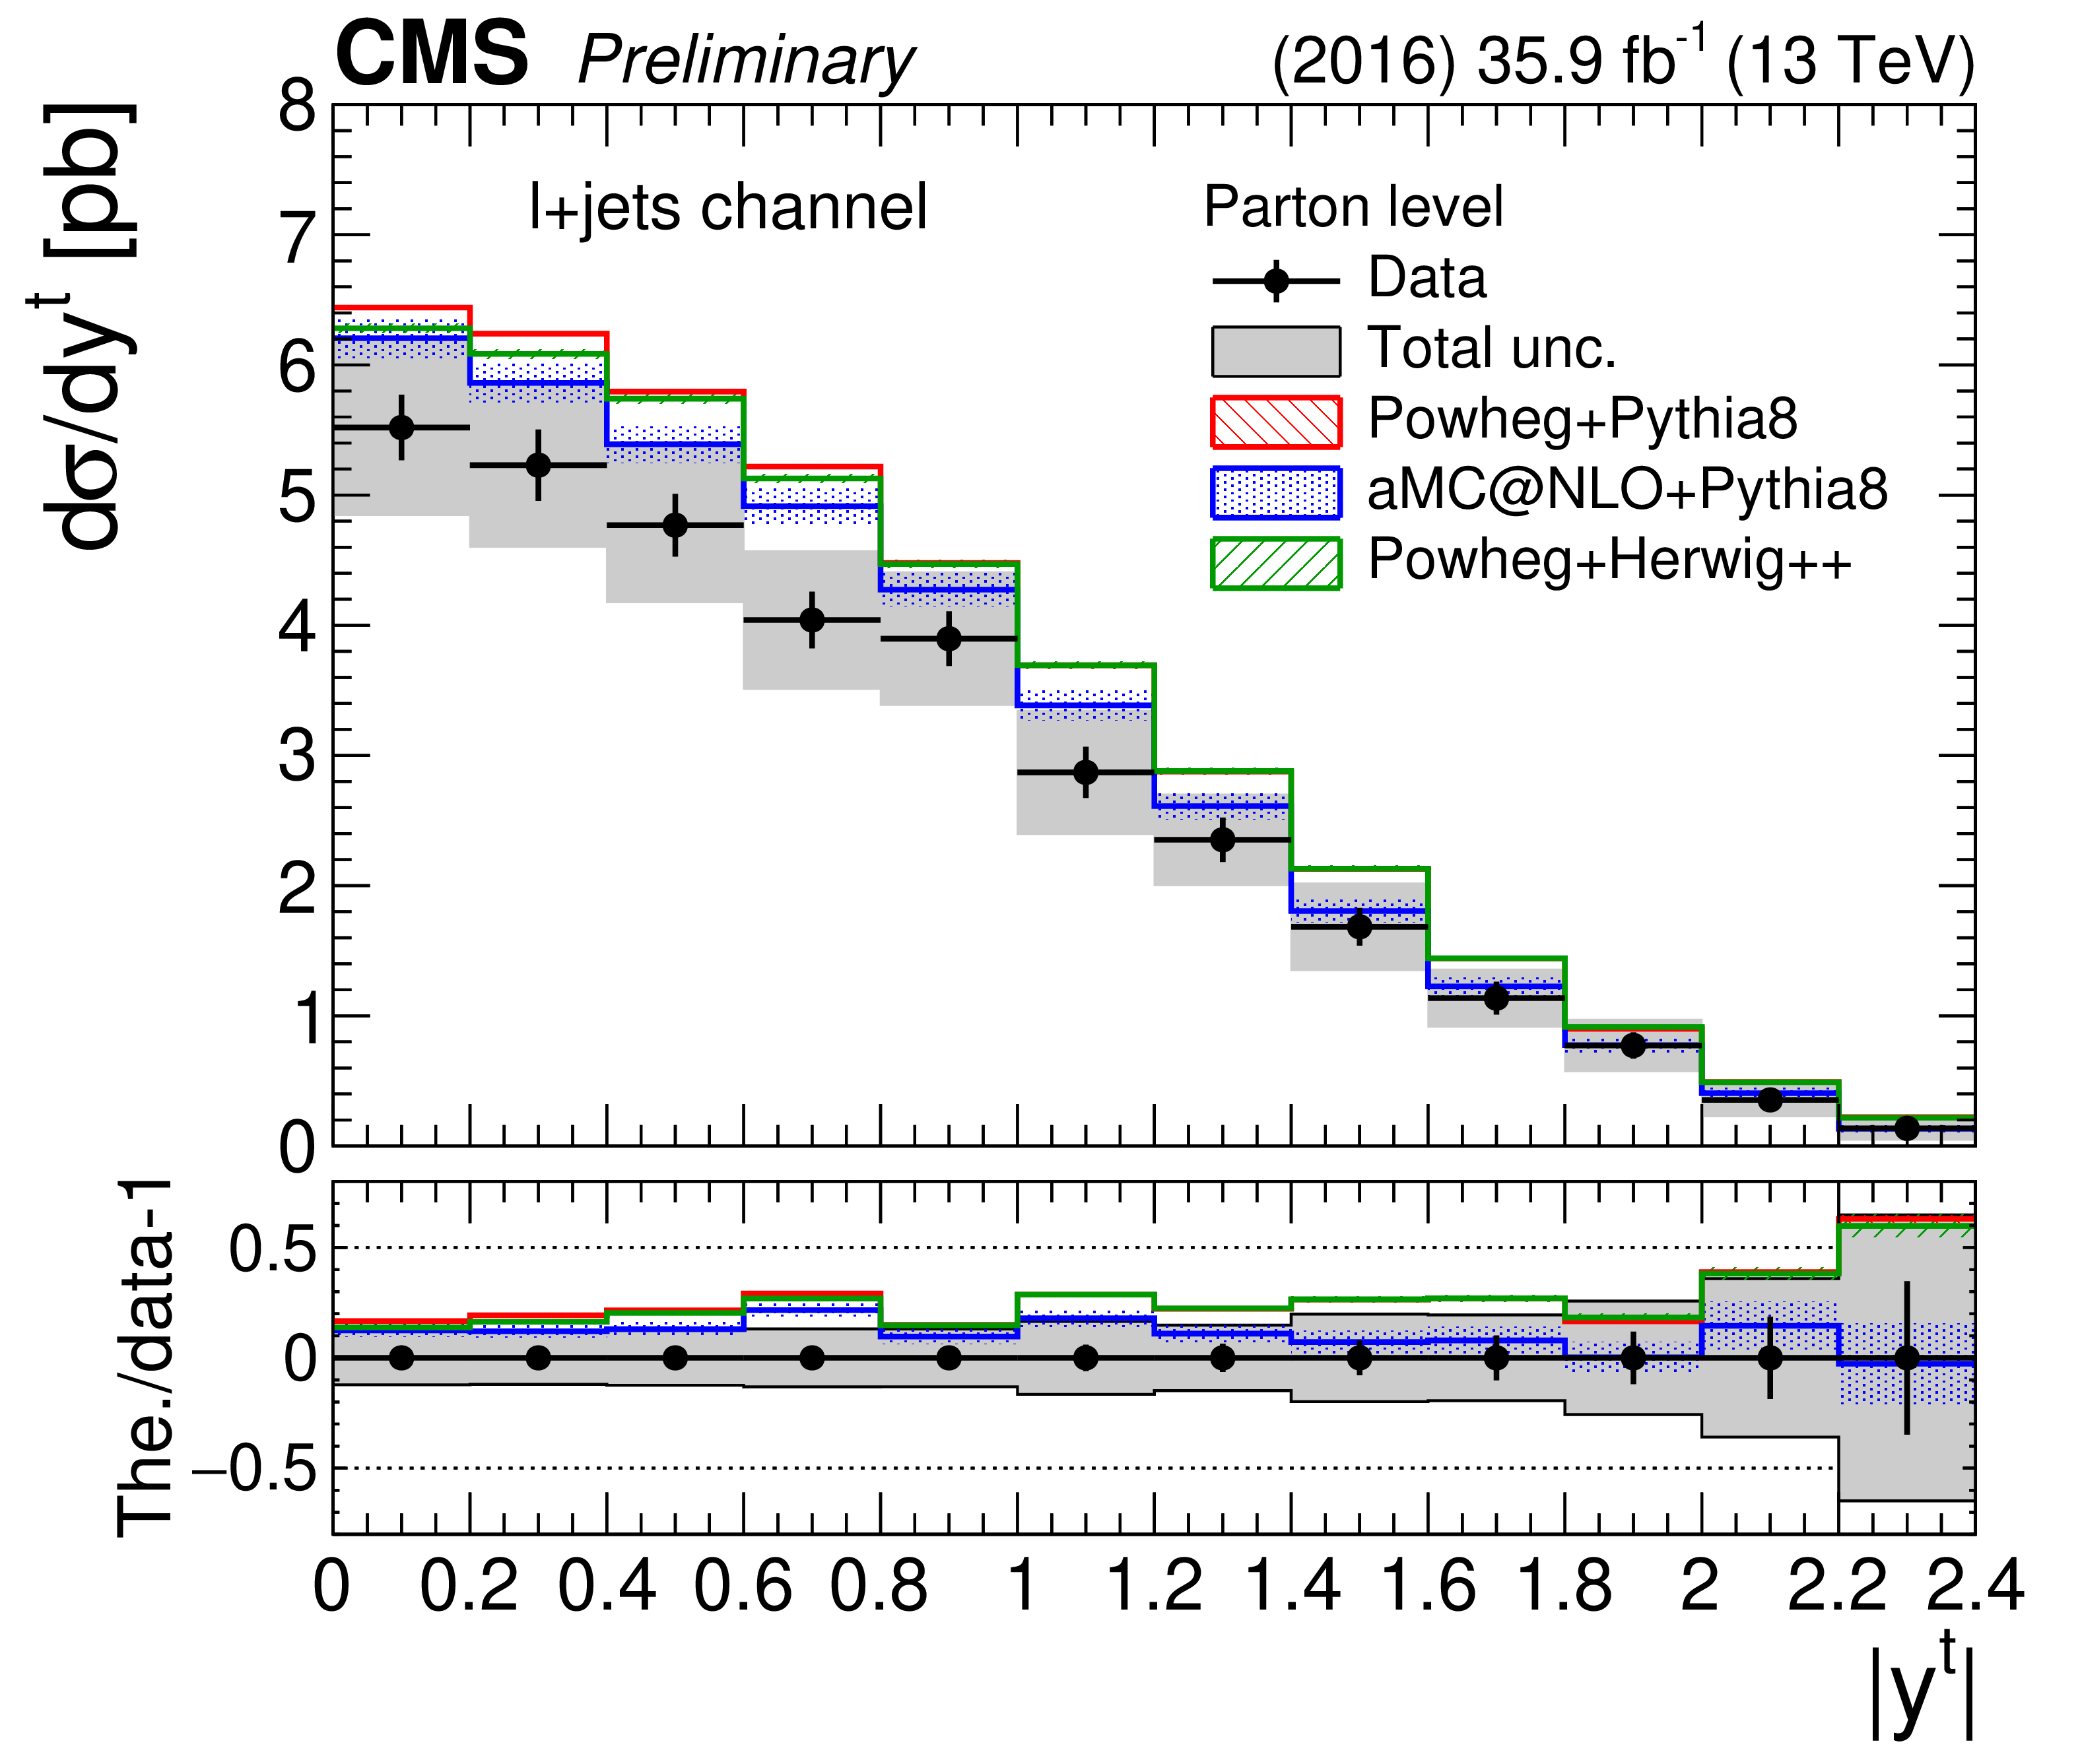
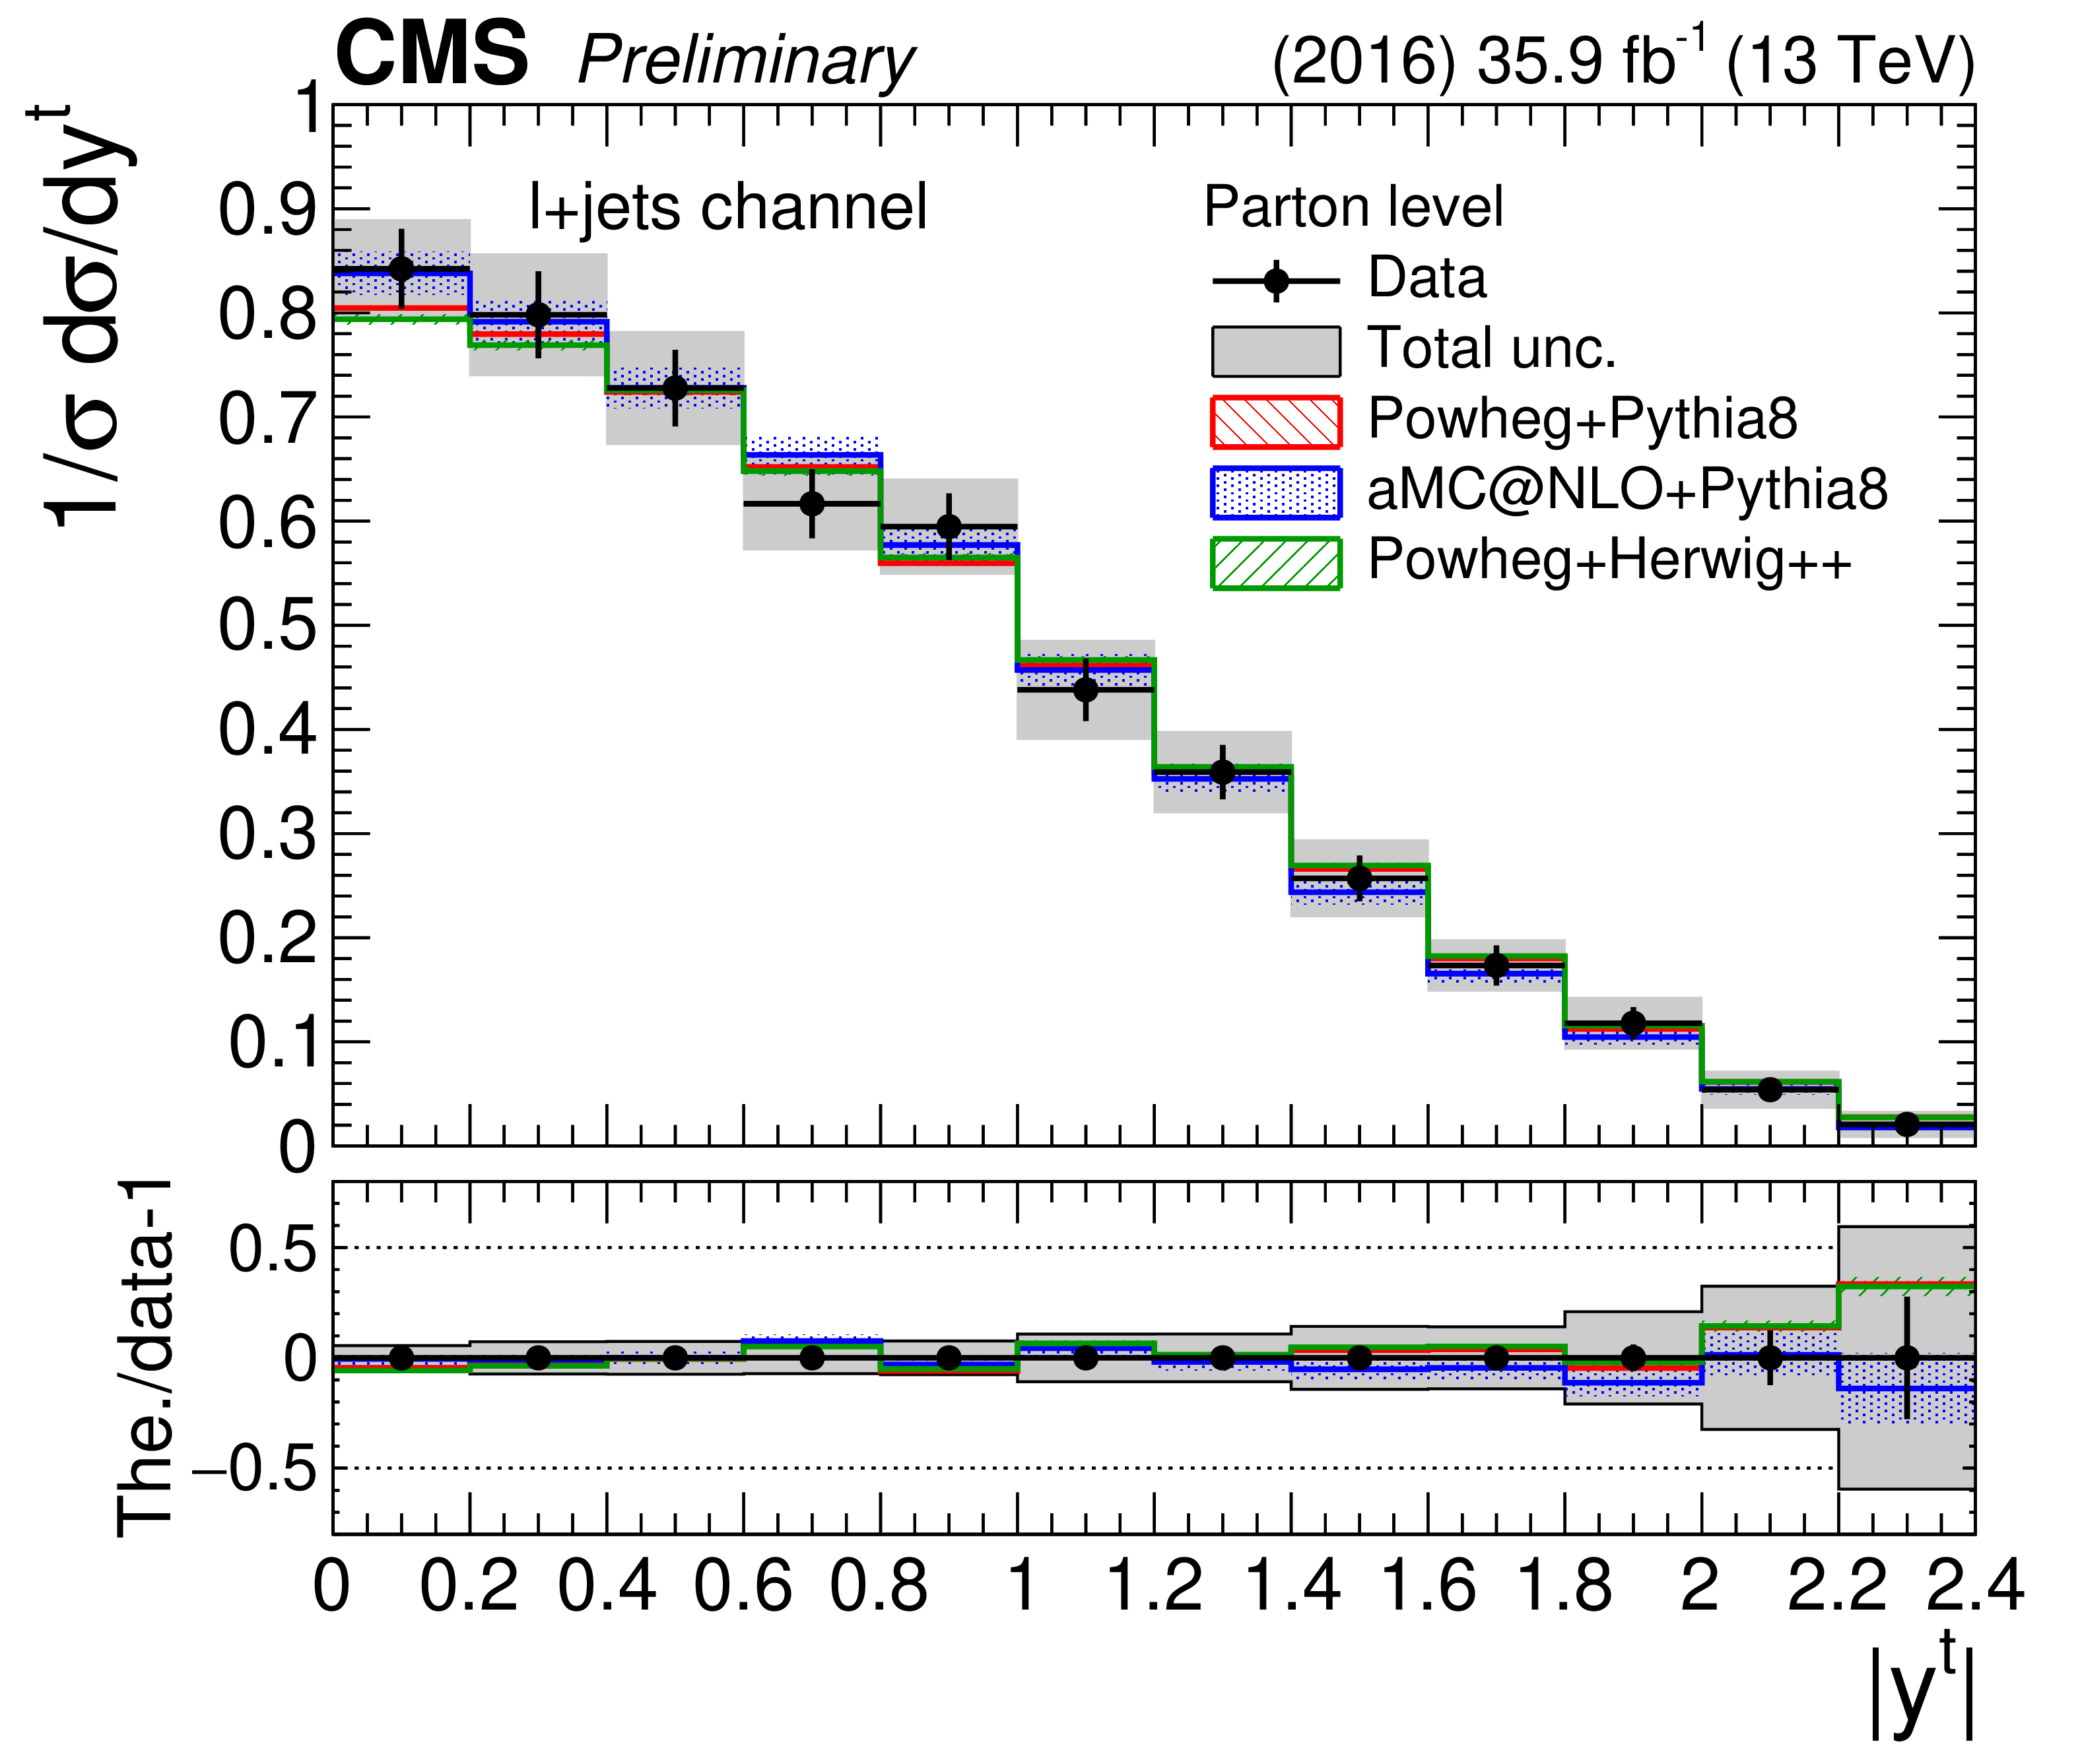
Figure 33:
Differential cross section measurements at the parton level as a function of the parton-level top quark $|y|$ for the $\ell $+jets channel. Both absolute (left) and normalized (right) cross sections are shown. The uncertainties on the data markers are statistical, while the grey band shows the total statistical and systematic uncertainty. |
png pdf |
Figure 33-a:
Differential cross section measurements at the parton level as a function of the parton-level top quark $|y|$ for the $\ell $+jets channel. Both absolute (left) and normalized (right) cross sections are shown. The uncertainties on the data markers are statistical, while the grey band shows the total statistical and systematic uncertainty. |
png pdf |
Figure 33-b:
Differential cross section measurements at the parton level as a function of the parton-level top quark $|y|$ for the $\ell $+jets channel. Both absolute (left) and normalized (right) cross sections are shown. The uncertainties on the data markers are statistical, while the grey band shows the total statistical and systematic uncertainty. |
png pdf |
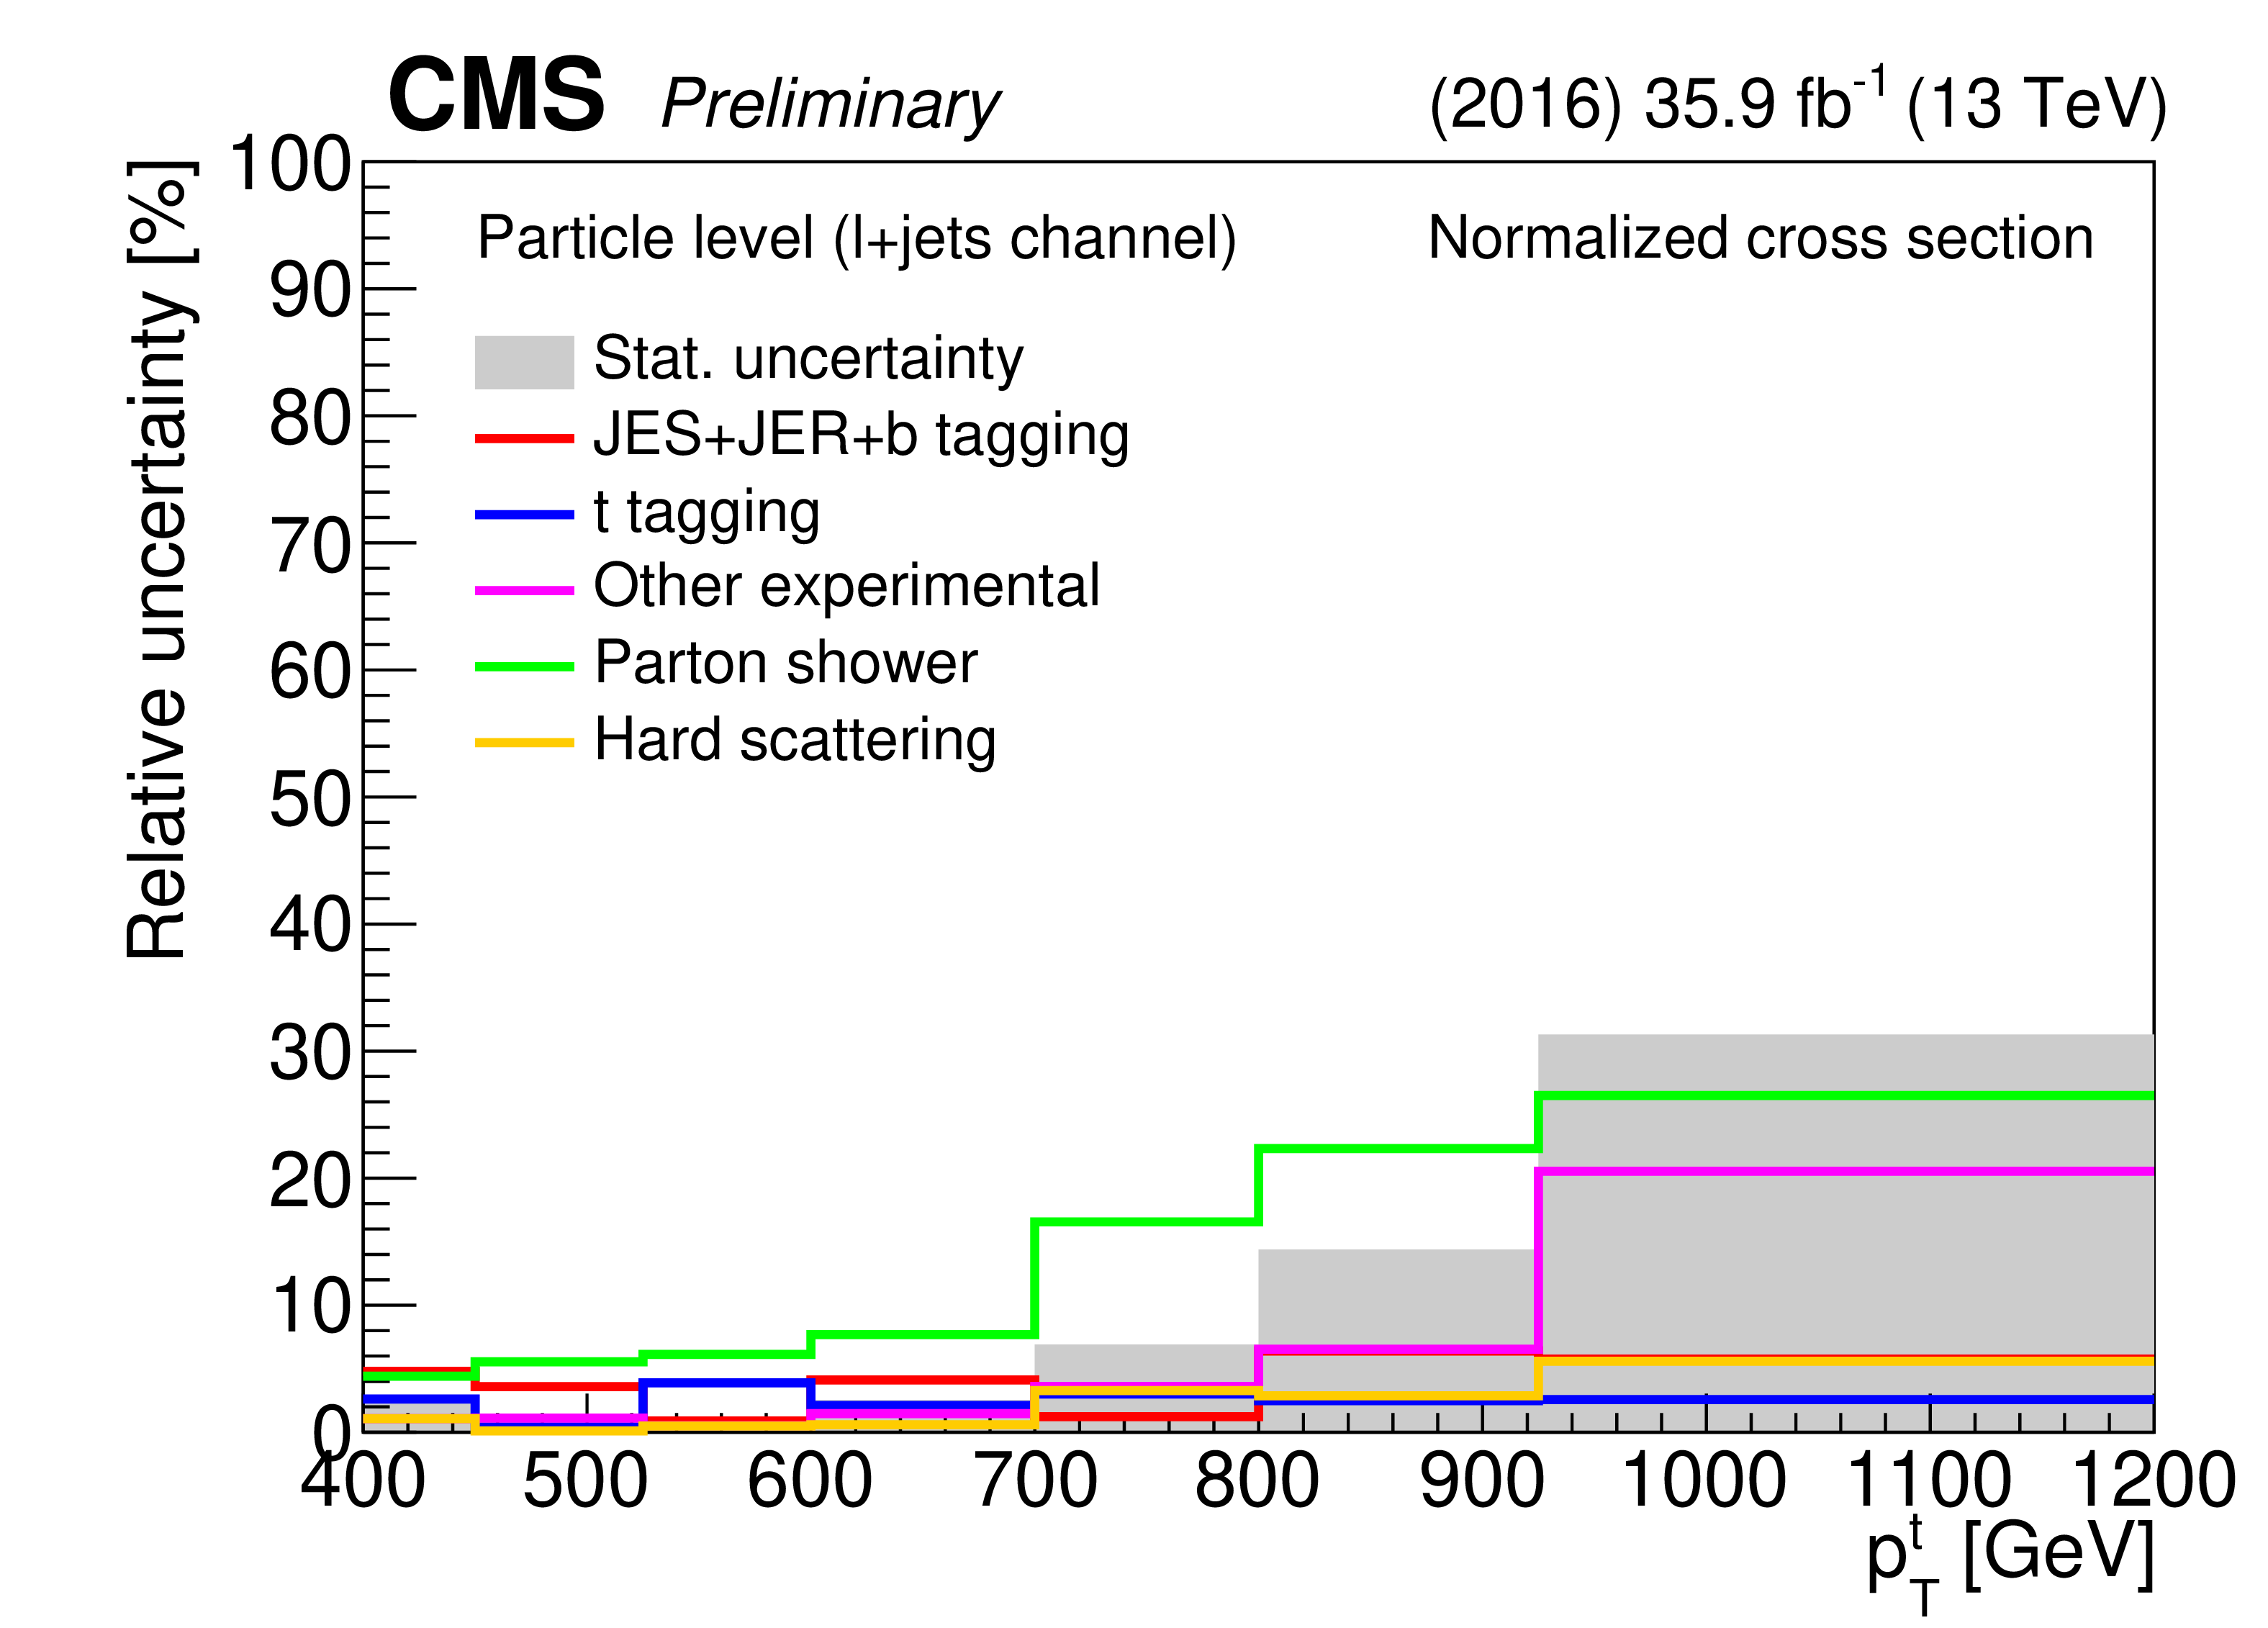
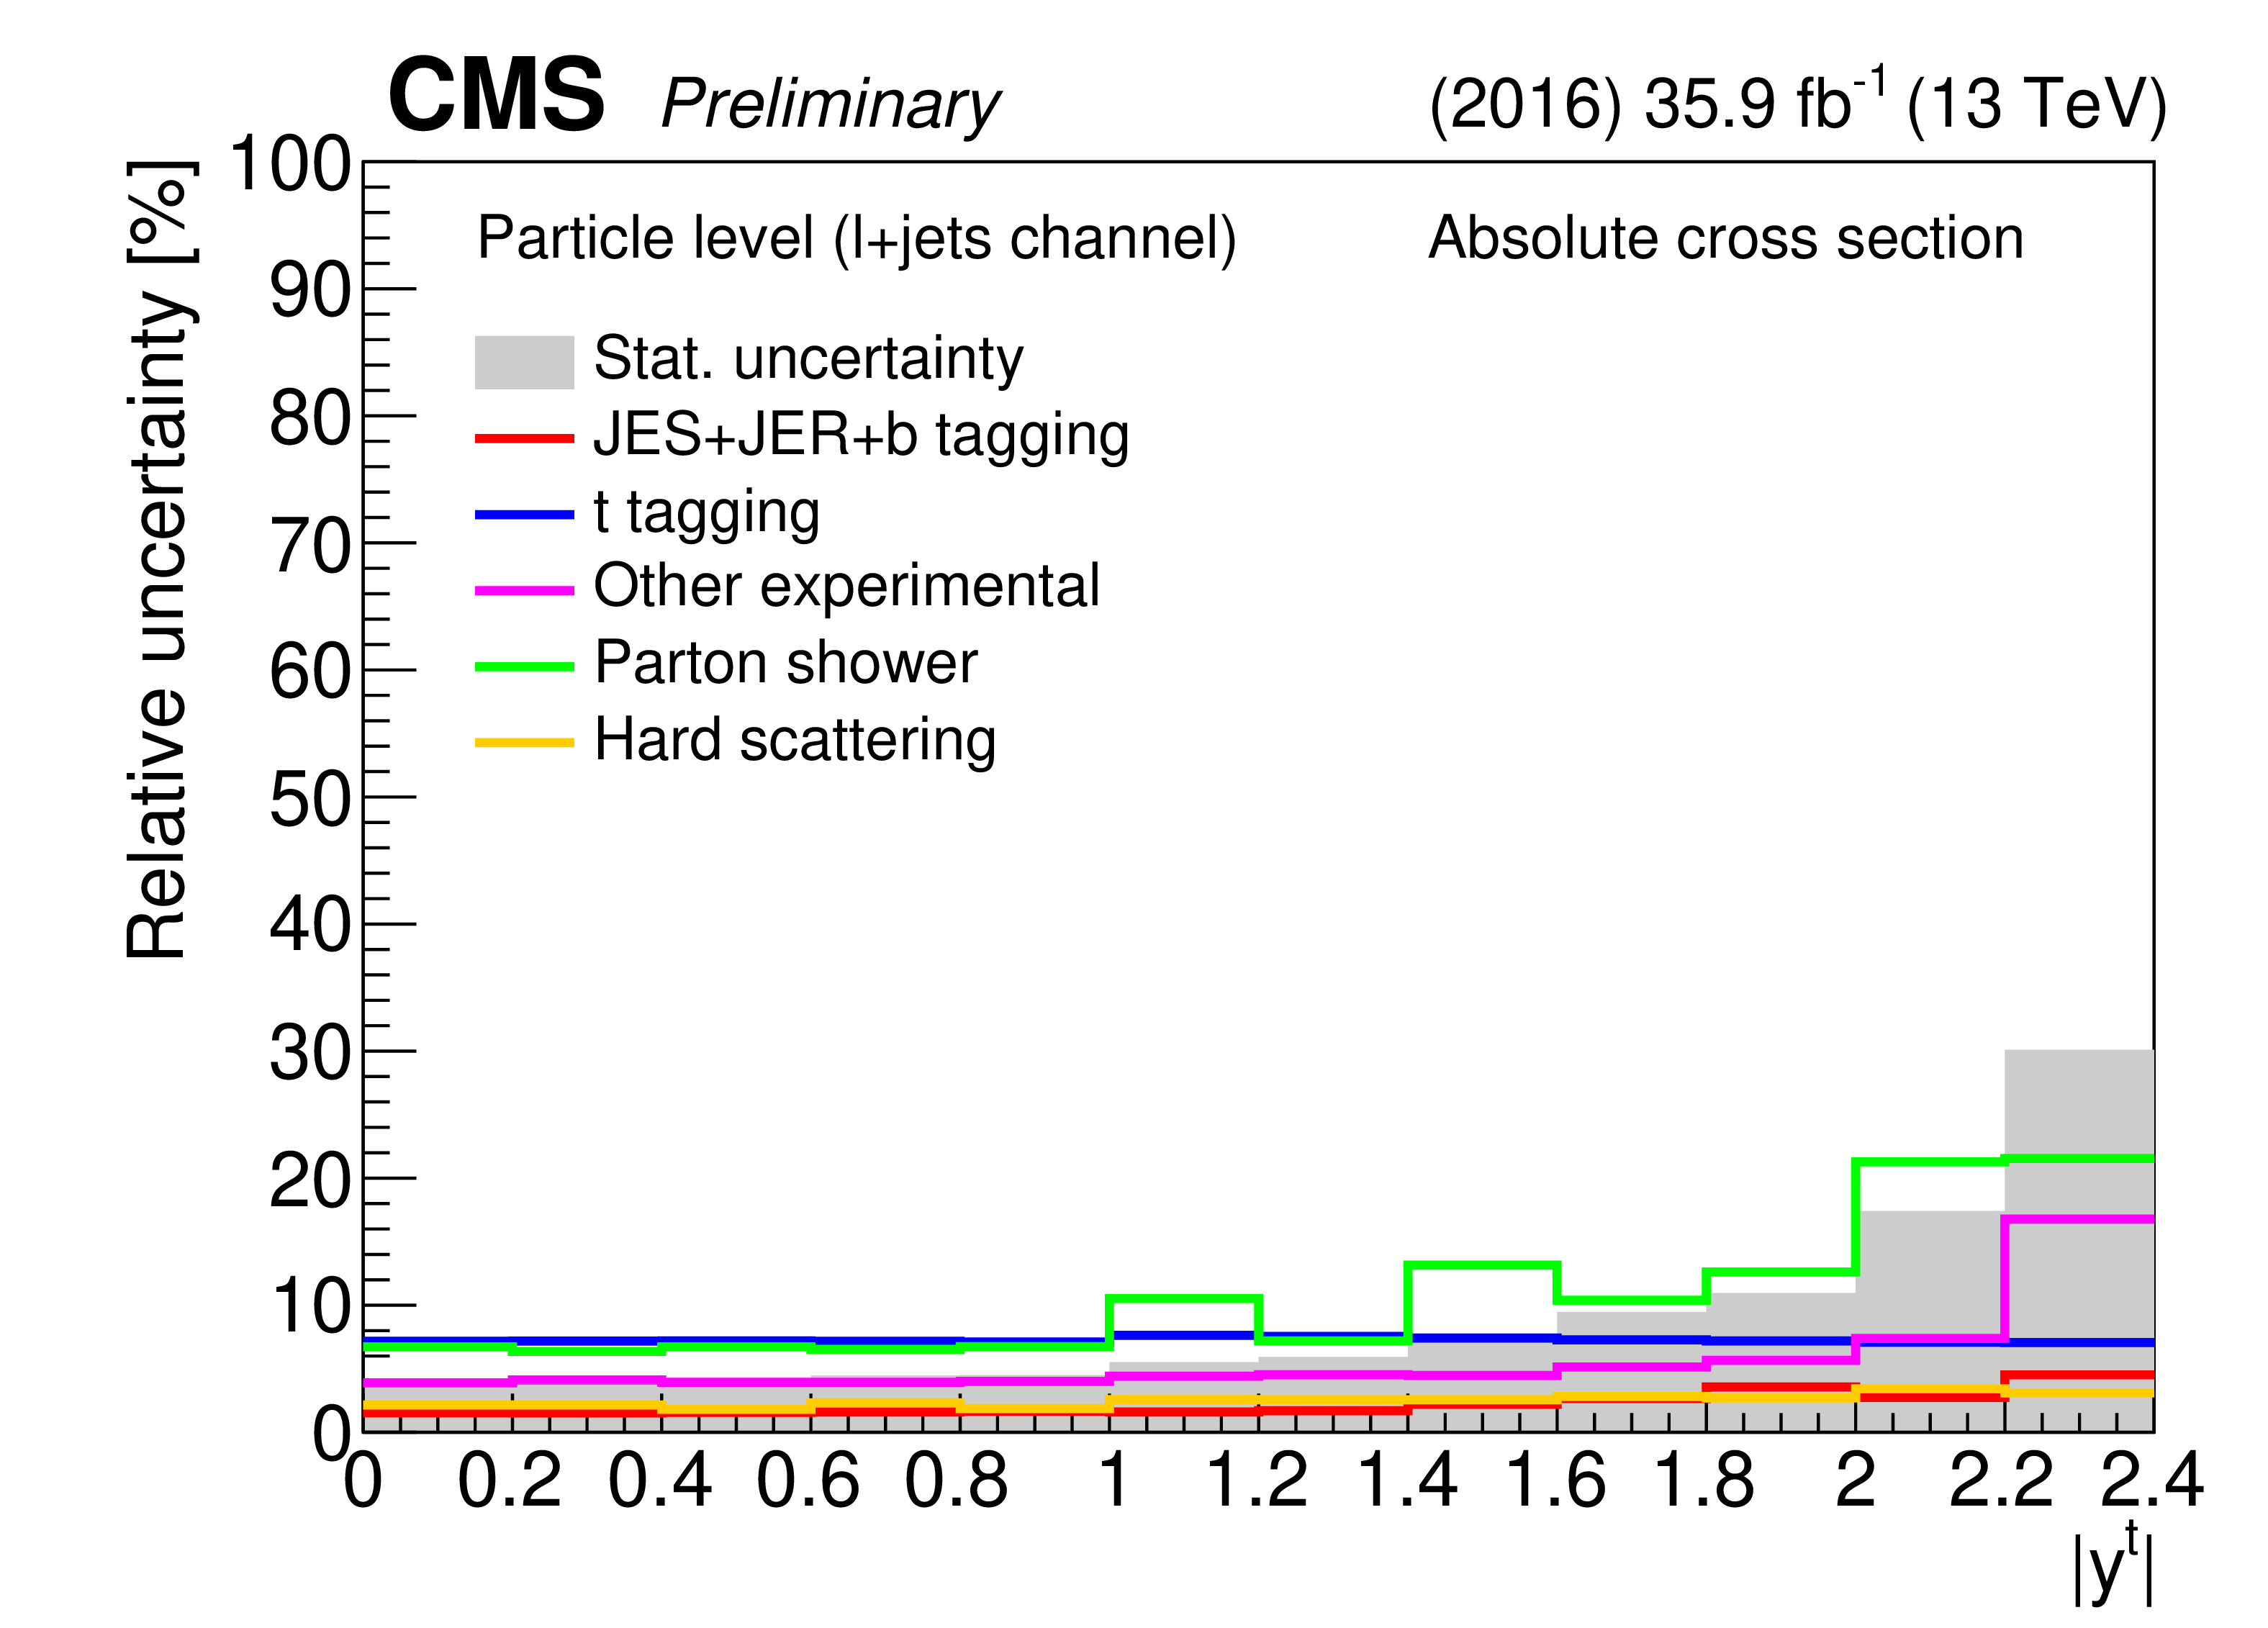
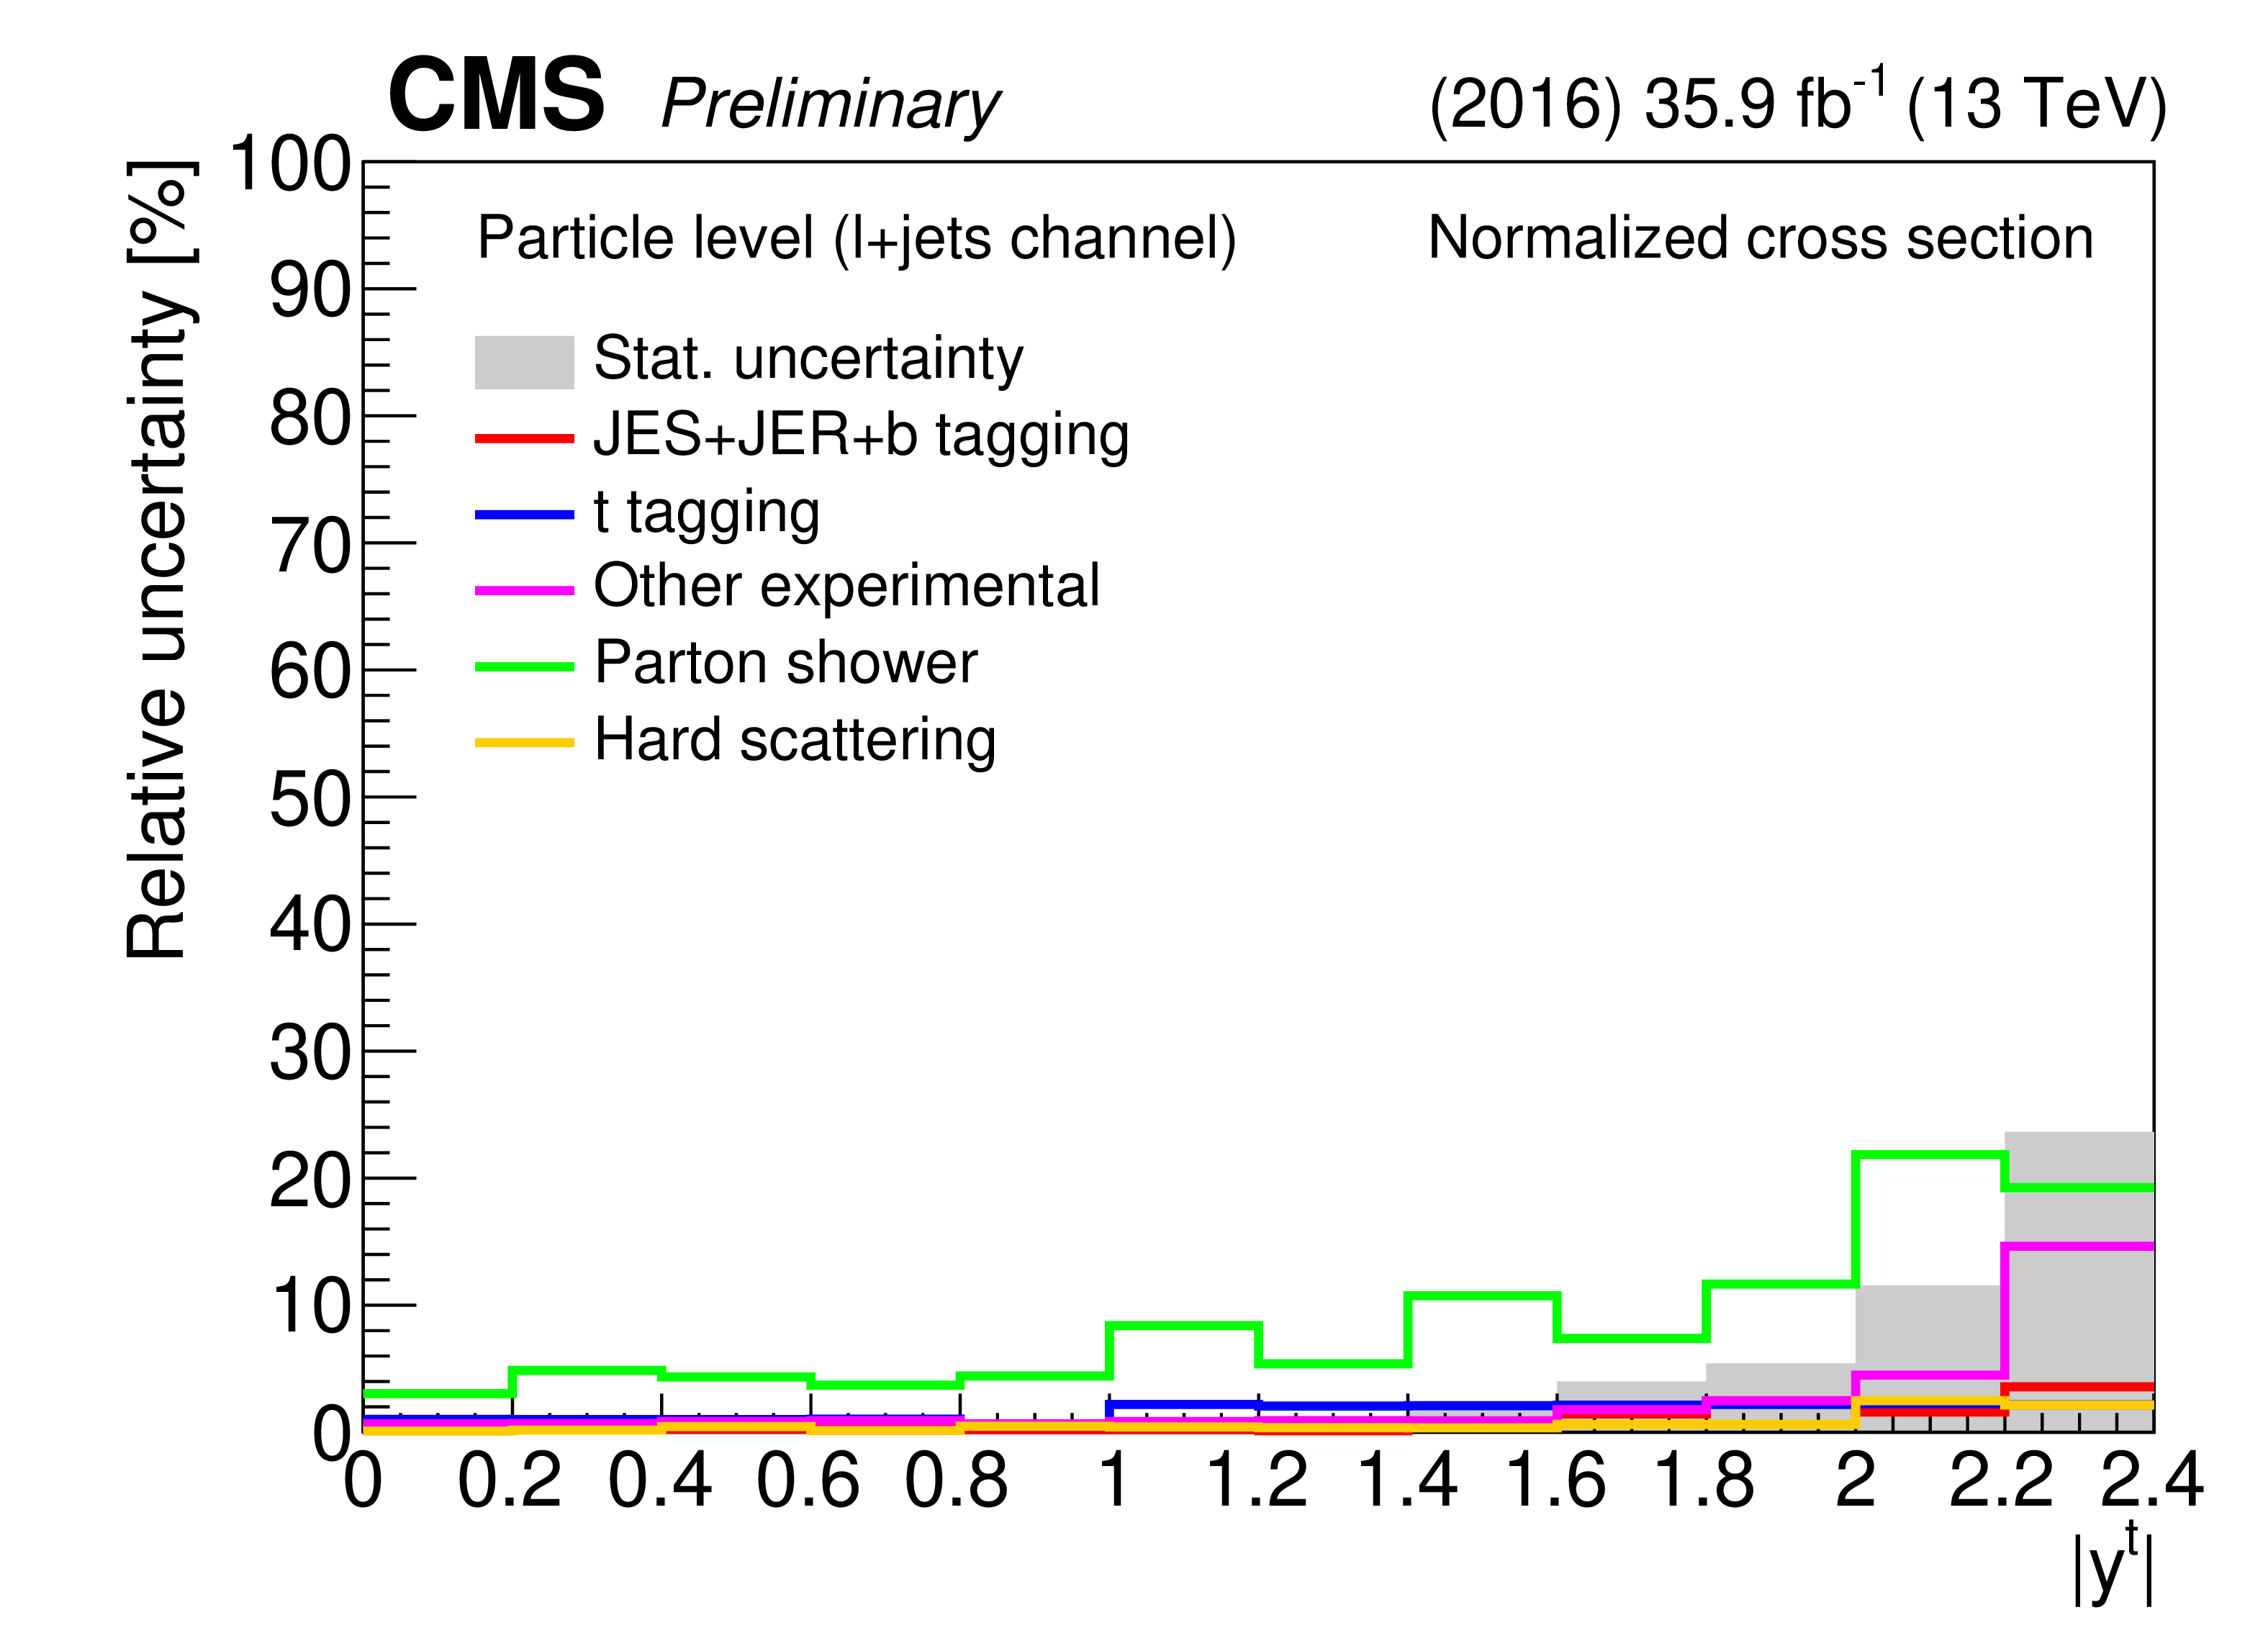
Figure 34:
Breakdown of the sources of systematic uncertainty affecting the differential cross section measurements in the $\ell $+jets channel at the particle level as a function of the particle-level t jet $ {p_{\mathrm {T}}} $ (top row) or $|y|$ (bottom row). Both the systematic uncertainties in the absolute (left column) and the normalized (right column) cross sections are shown. "JES+JER+b tagging" includes uncertainties due to the jet energy scale, jet energy resolution, and small-$R$ jet b tagging efficiency; "t tagging" is the uncertainty associated with the large-$R$ jet t tagging efficiency; "Other experimental" includes the uncertainties originating from the background estimate, pileup modeling, lepton identification and trigger efficiency, and measurement of the integrated luminosity; "Parton shower" includes contributions from initial- and final-state radiation, underlying event tune, ME-PS matching, and color reconnection; "Hard scattering" includes the uncertainty due to PDFs as well as renormalization and factorization scales. |
png pdf |
Figure 34-a:
Breakdown of the sources of systematic uncertainty affecting the differential cross section measurements in the $\ell $+jets channel at the particle level as a function of the particle-level t jet $ {p_{\mathrm {T}}} $ (top row) or $|y|$ (bottom row). Both the systematic uncertainties in the absolute (left column) and the normalized (right column) cross sections are shown. "JES+JER+b tagging" includes uncertainties due to the jet energy scale, jet energy resolution, and small-$R$ jet b tagging efficiency; "t tagging" is the uncertainty associated with the large-$R$ jet t tagging efficiency; "Other experimental" includes the uncertainties originating from the background estimate, pileup modeling, lepton identification and trigger efficiency, and measurement of the integrated luminosity; "Parton shower" includes contributions from initial- and final-state radiation, underlying event tune, ME-PS matching, and color reconnection; "Hard scattering" includes the uncertainty due to PDFs as well as renormalization and factorization scales. |
png pdf |
Figure 34-b:
Breakdown of the sources of systematic uncertainty affecting the differential cross section measurements in the $\ell $+jets channel at the particle level as a function of the particle-level t jet $ {p_{\mathrm {T}}} $ (top row) or $|y|$ (bottom row). Both the systematic uncertainties in the absolute (left column) and the normalized (right column) cross sections are shown. "JES+JER+b tagging" includes uncertainties due to the jet energy scale, jet energy resolution, and small-$R$ jet b tagging efficiency; "t tagging" is the uncertainty associated with the large-$R$ jet t tagging efficiency; "Other experimental" includes the uncertainties originating from the background estimate, pileup modeling, lepton identification and trigger efficiency, and measurement of the integrated luminosity; "Parton shower" includes contributions from initial- and final-state radiation, underlying event tune, ME-PS matching, and color reconnection; "Hard scattering" includes the uncertainty due to PDFs as well as renormalization and factorization scales. |
png pdf |
Figure 34-c:
Breakdown of the sources of systematic uncertainty affecting the differential cross section measurements in the $\ell $+jets channel at the particle level as a function of the particle-level t jet $ {p_{\mathrm {T}}} $ (top row) or $|y|$ (bottom row). Both the systematic uncertainties in the absolute (left column) and the normalized (right column) cross sections are shown. "JES+JER+b tagging" includes uncertainties due to the jet energy scale, jet energy resolution, and small-$R$ jet b tagging efficiency; "t tagging" is the uncertainty associated with the large-$R$ jet t tagging efficiency; "Other experimental" includes the uncertainties originating from the background estimate, pileup modeling, lepton identification and trigger efficiency, and measurement of the integrated luminosity; "Parton shower" includes contributions from initial- and final-state radiation, underlying event tune, ME-PS matching, and color reconnection; "Hard scattering" includes the uncertainty due to PDFs as well as renormalization and factorization scales. |
png pdf |
Figure 34-d:
Breakdown of the sources of systematic uncertainty affecting the differential cross section measurements in the $\ell $+jets channel at the particle level as a function of the particle-level t jet $ {p_{\mathrm {T}}} $ (top row) or $|y|$ (bottom row). Both the systematic uncertainties in the absolute (left column) and the normalized (right column) cross sections are shown. "JES+JER+b tagging" includes uncertainties due to the jet energy scale, jet energy resolution, and small-$R$ jet b tagging efficiency; "t tagging" is the uncertainty associated with the large-$R$ jet t tagging efficiency; "Other experimental" includes the uncertainties originating from the background estimate, pileup modeling, lepton identification and trigger efficiency, and measurement of the integrated luminosity; "Parton shower" includes contributions from initial- and final-state radiation, underlying event tune, ME-PS matching, and color reconnection; "Hard scattering" includes the uncertainty due to PDFs as well as renormalization and factorization scales. |
png pdf |
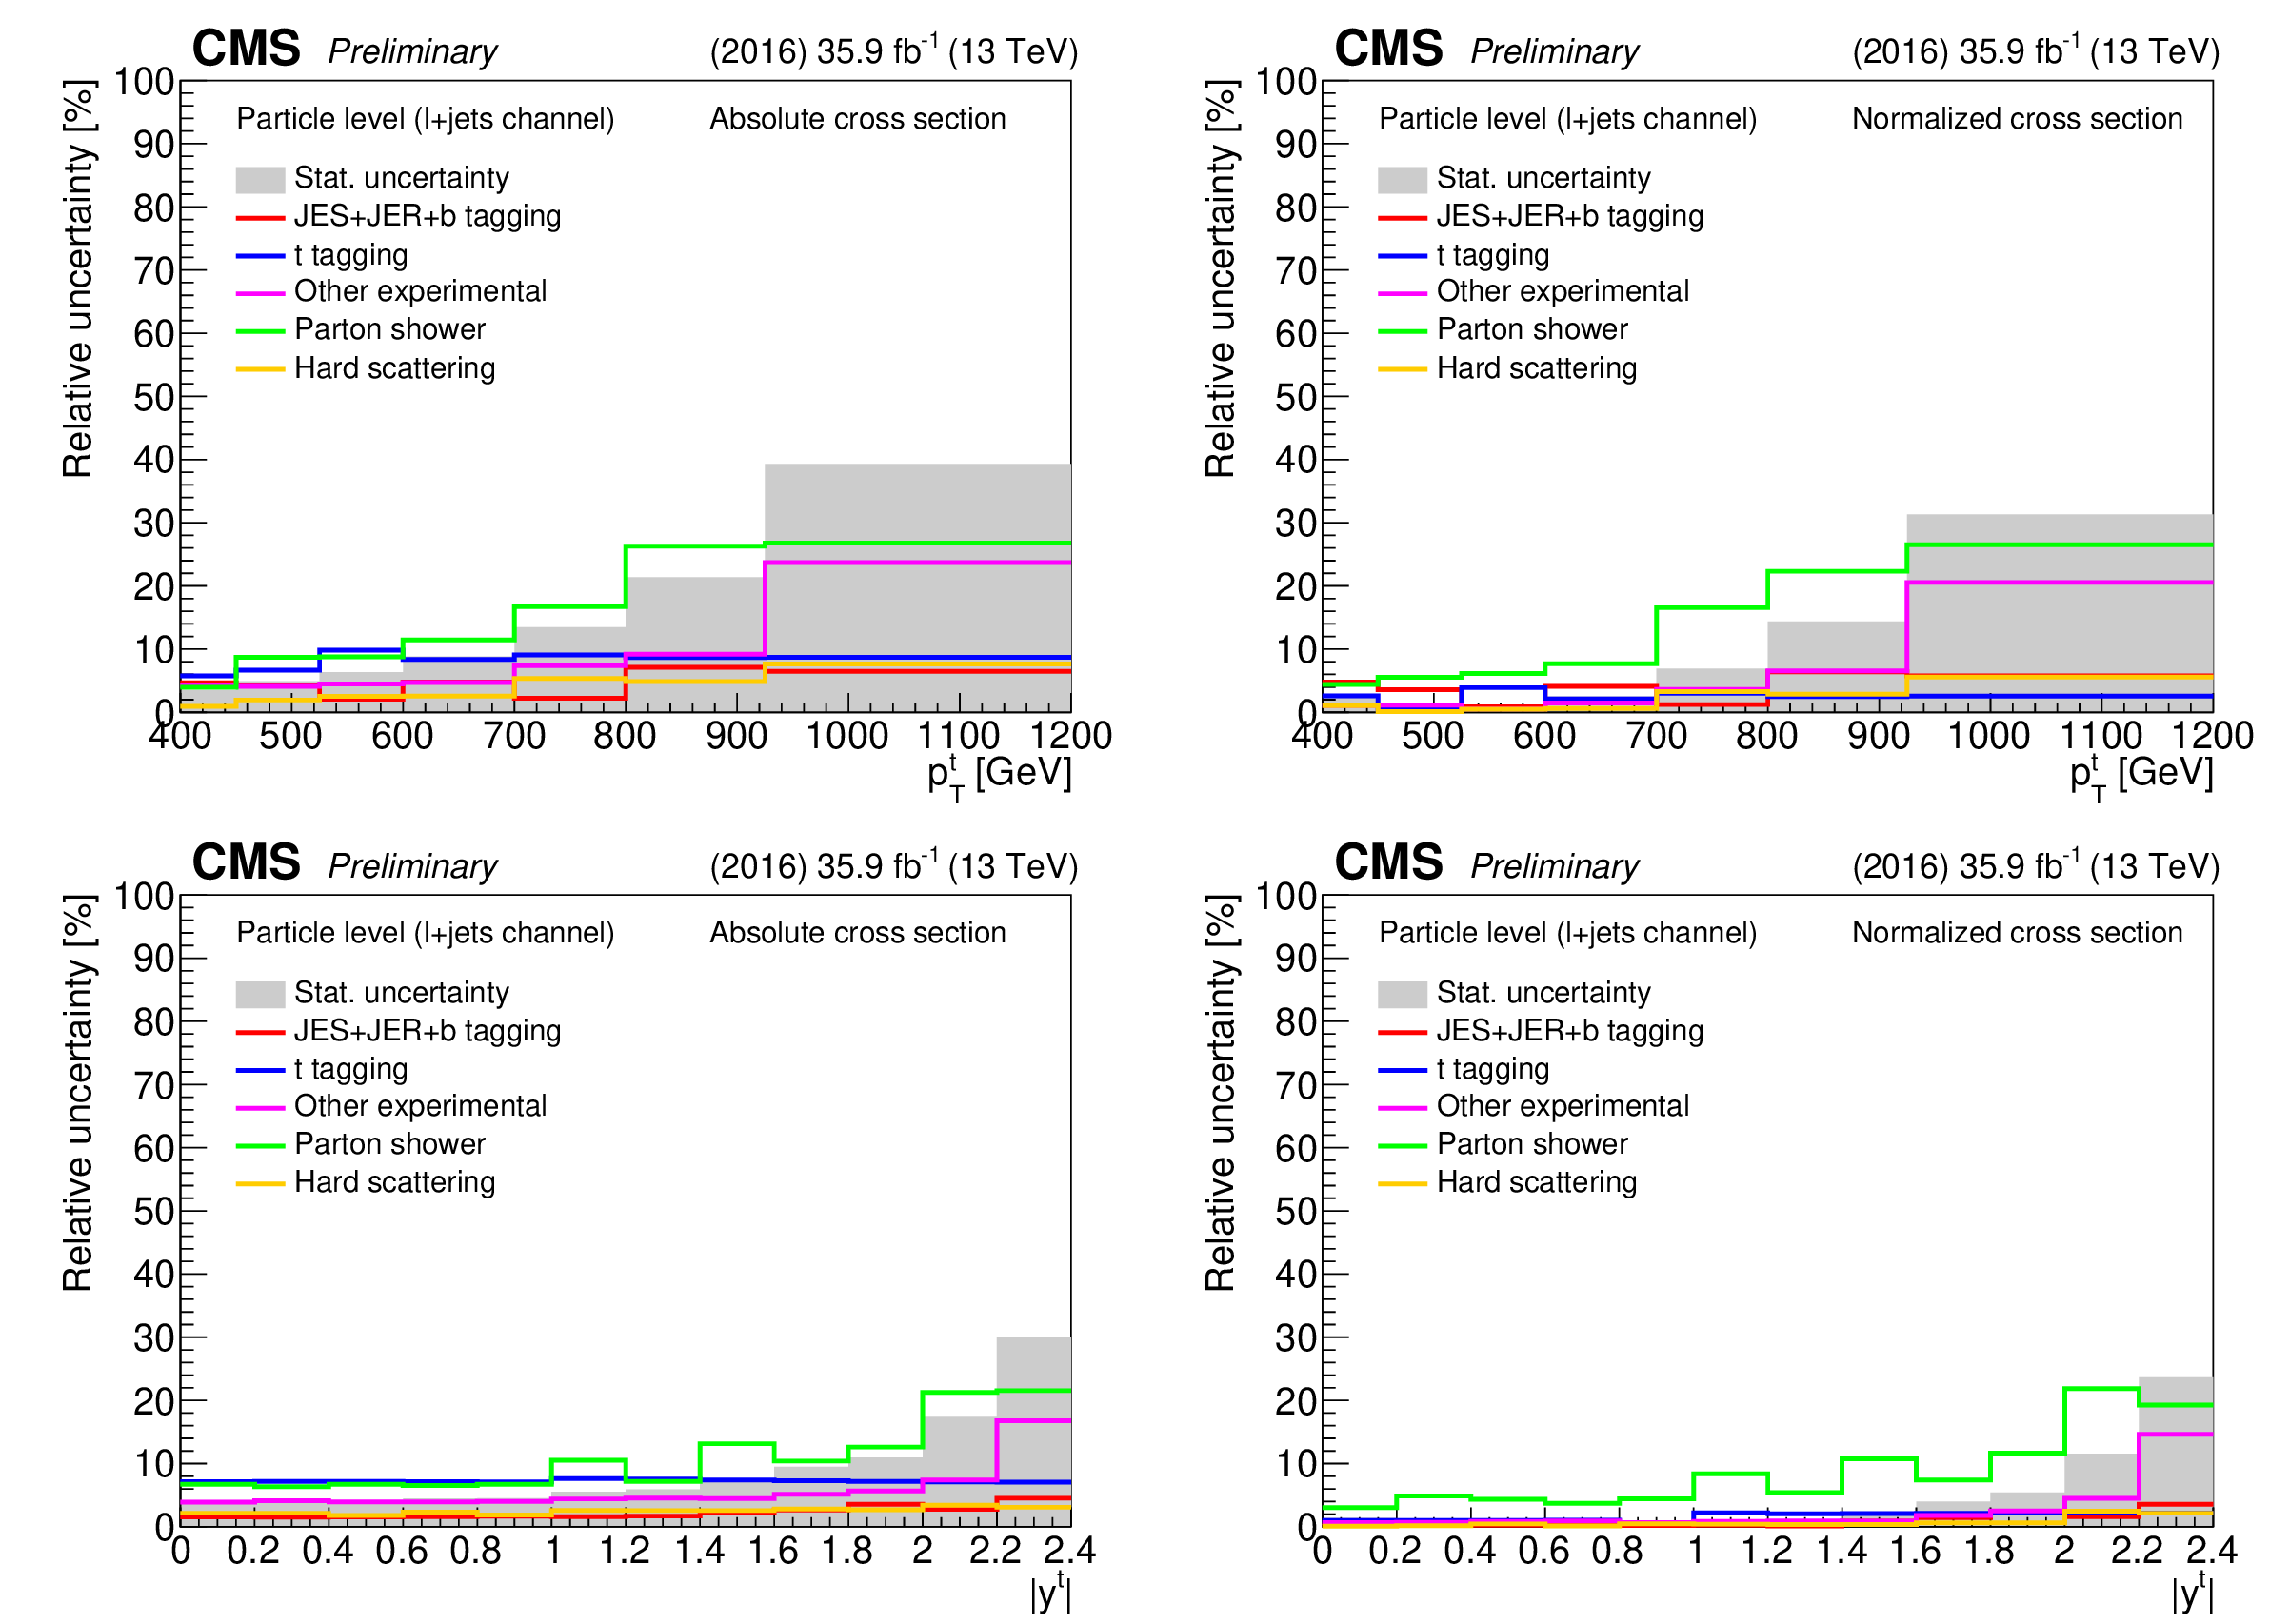
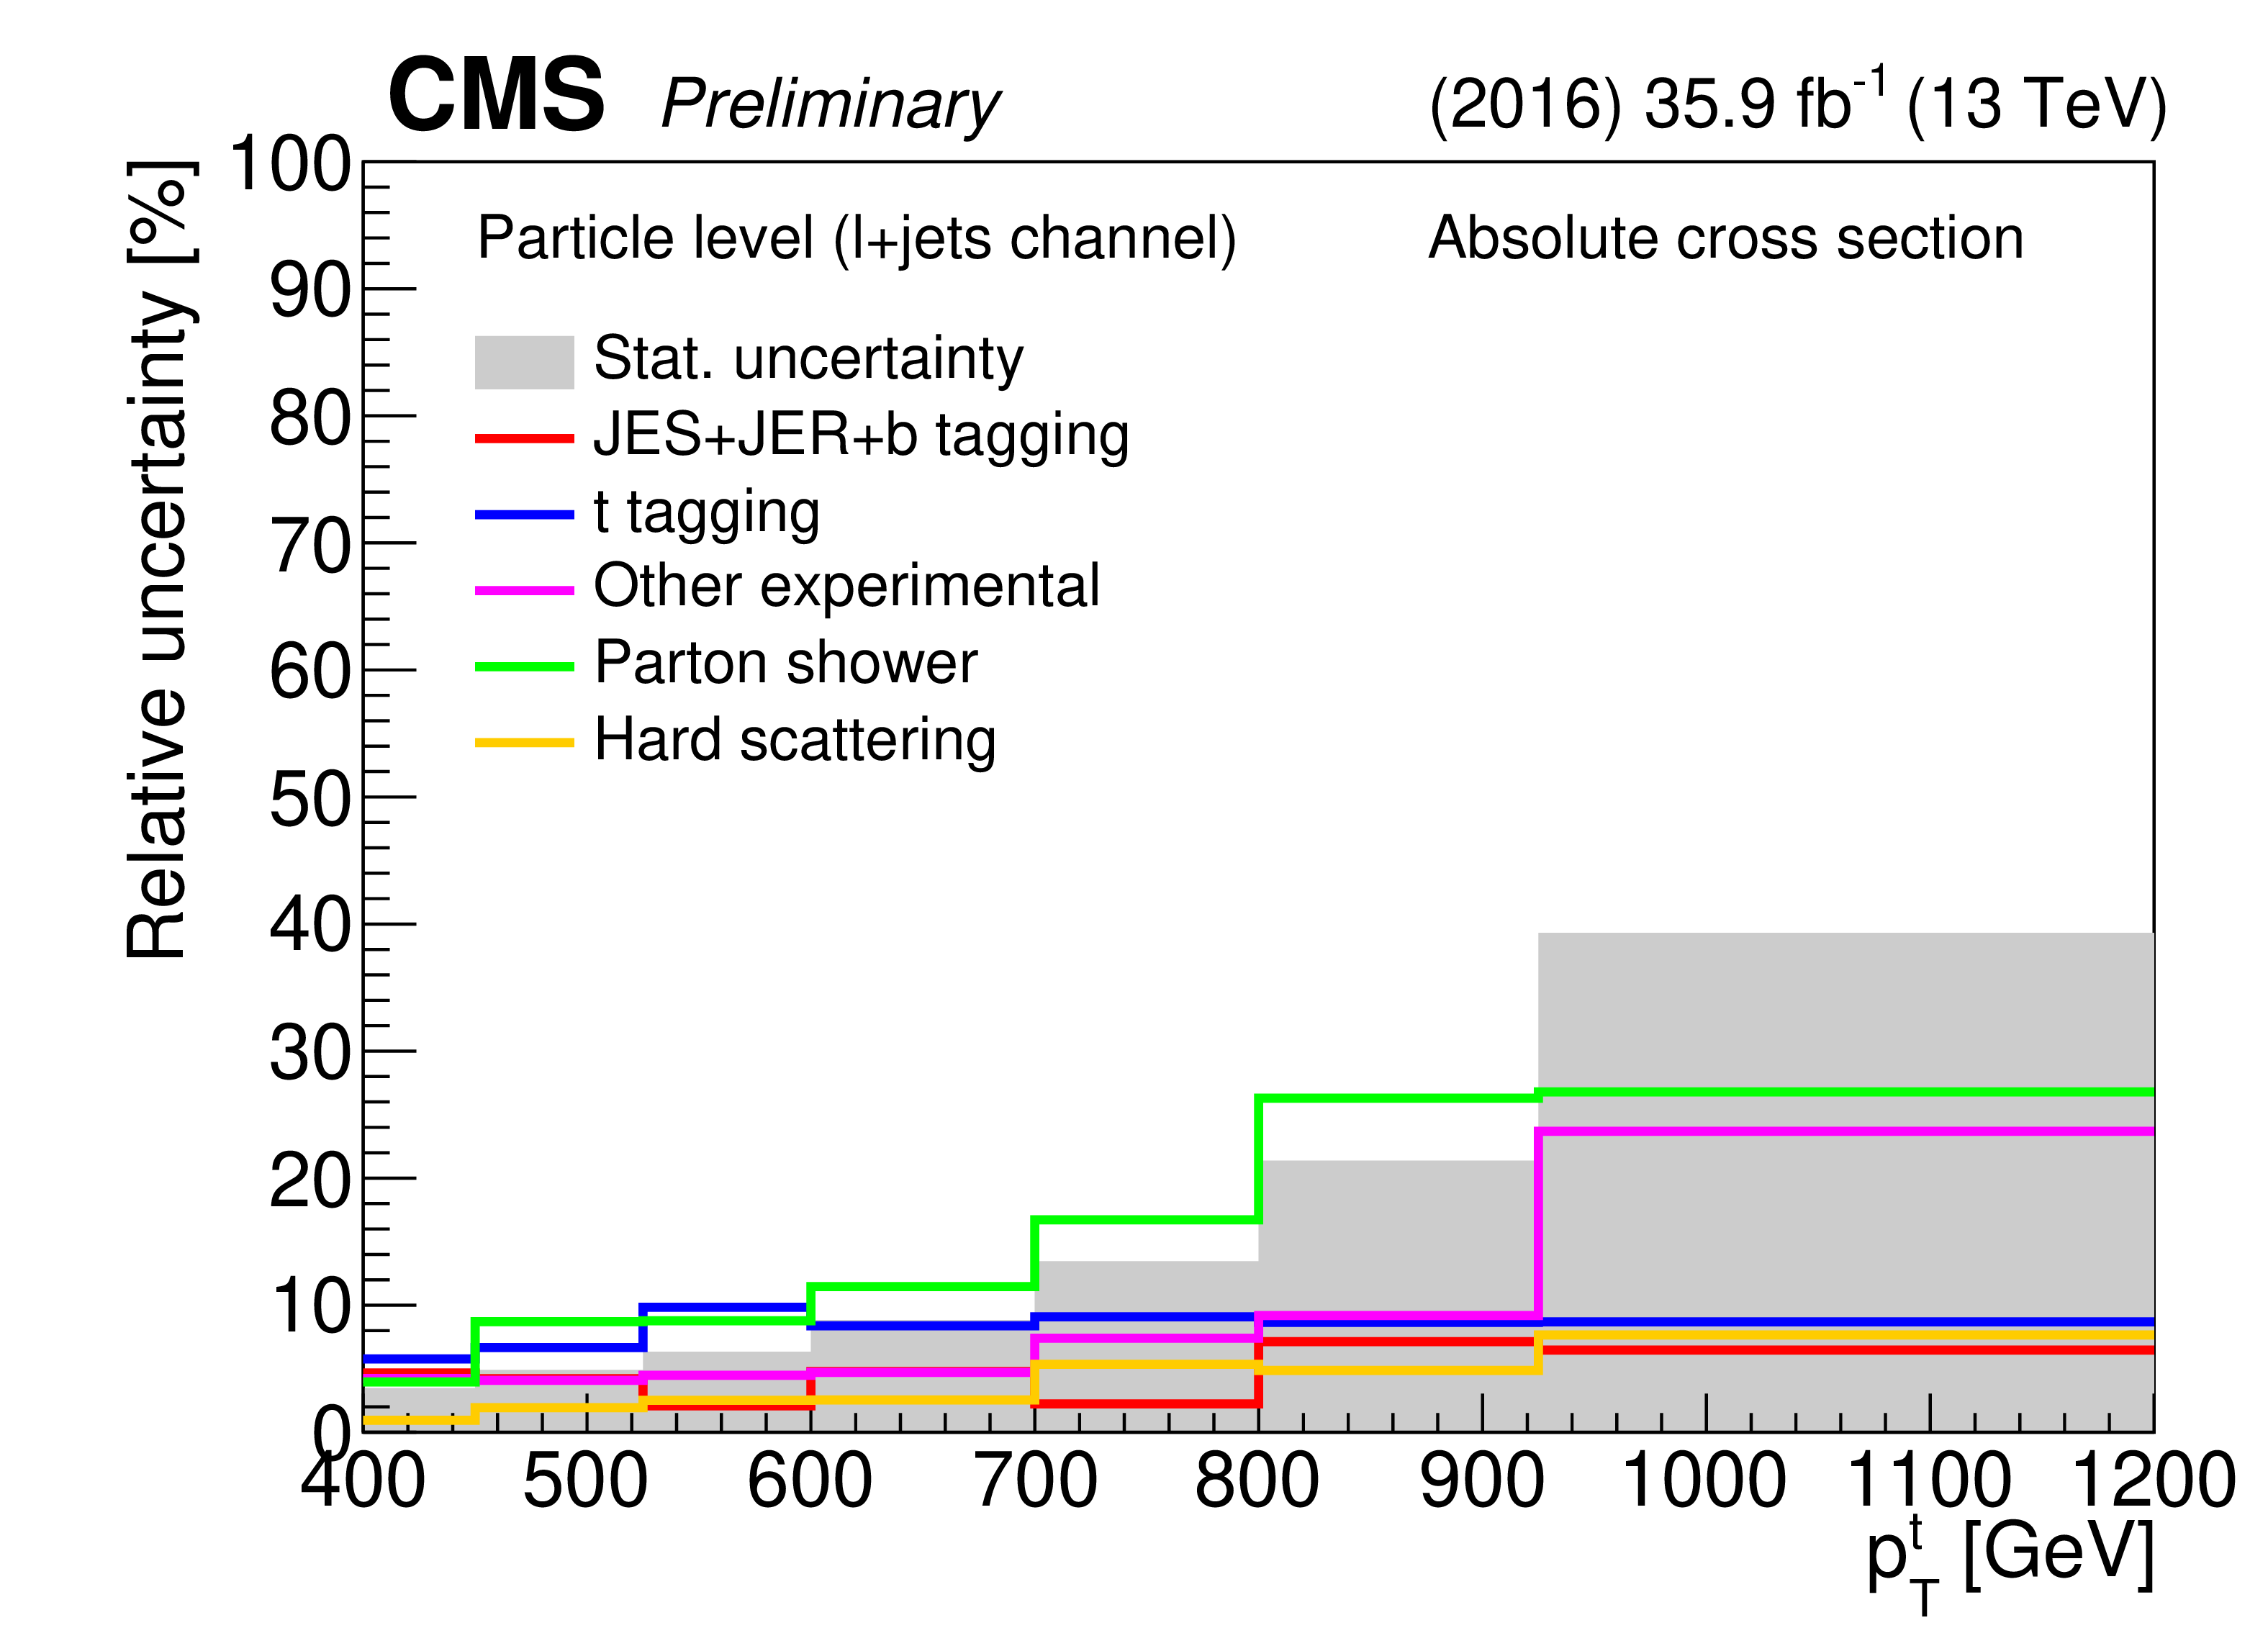
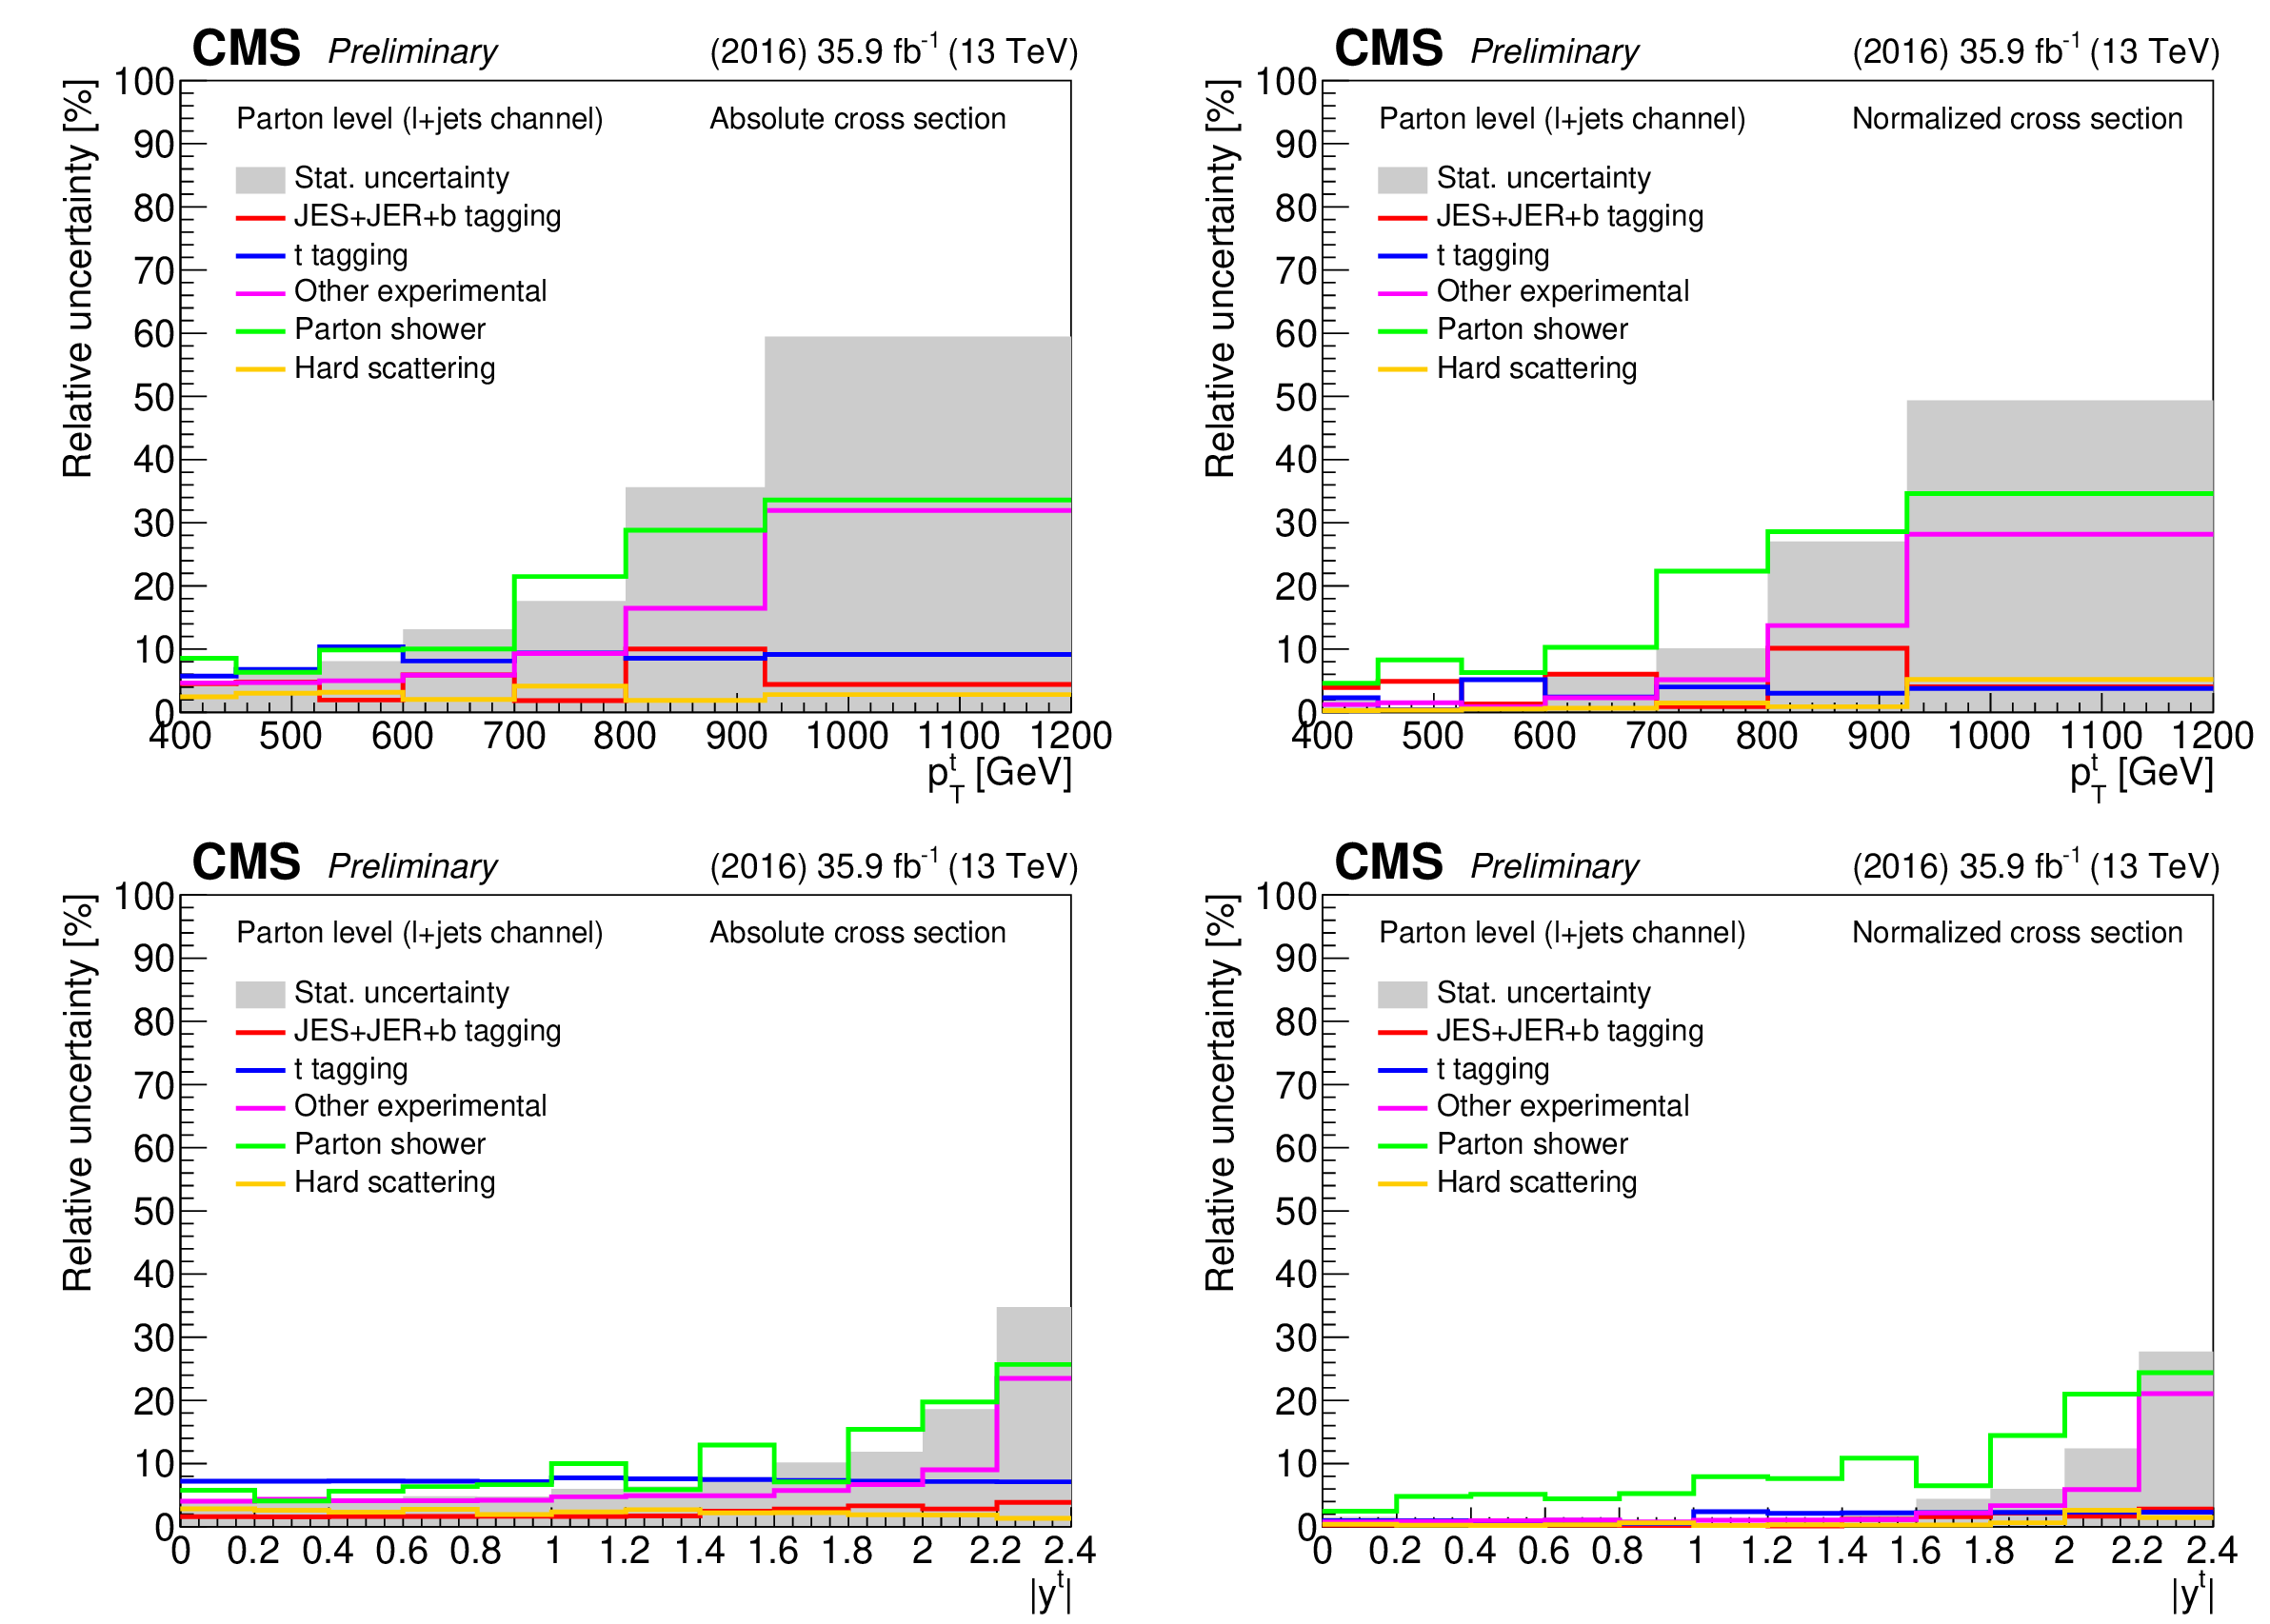
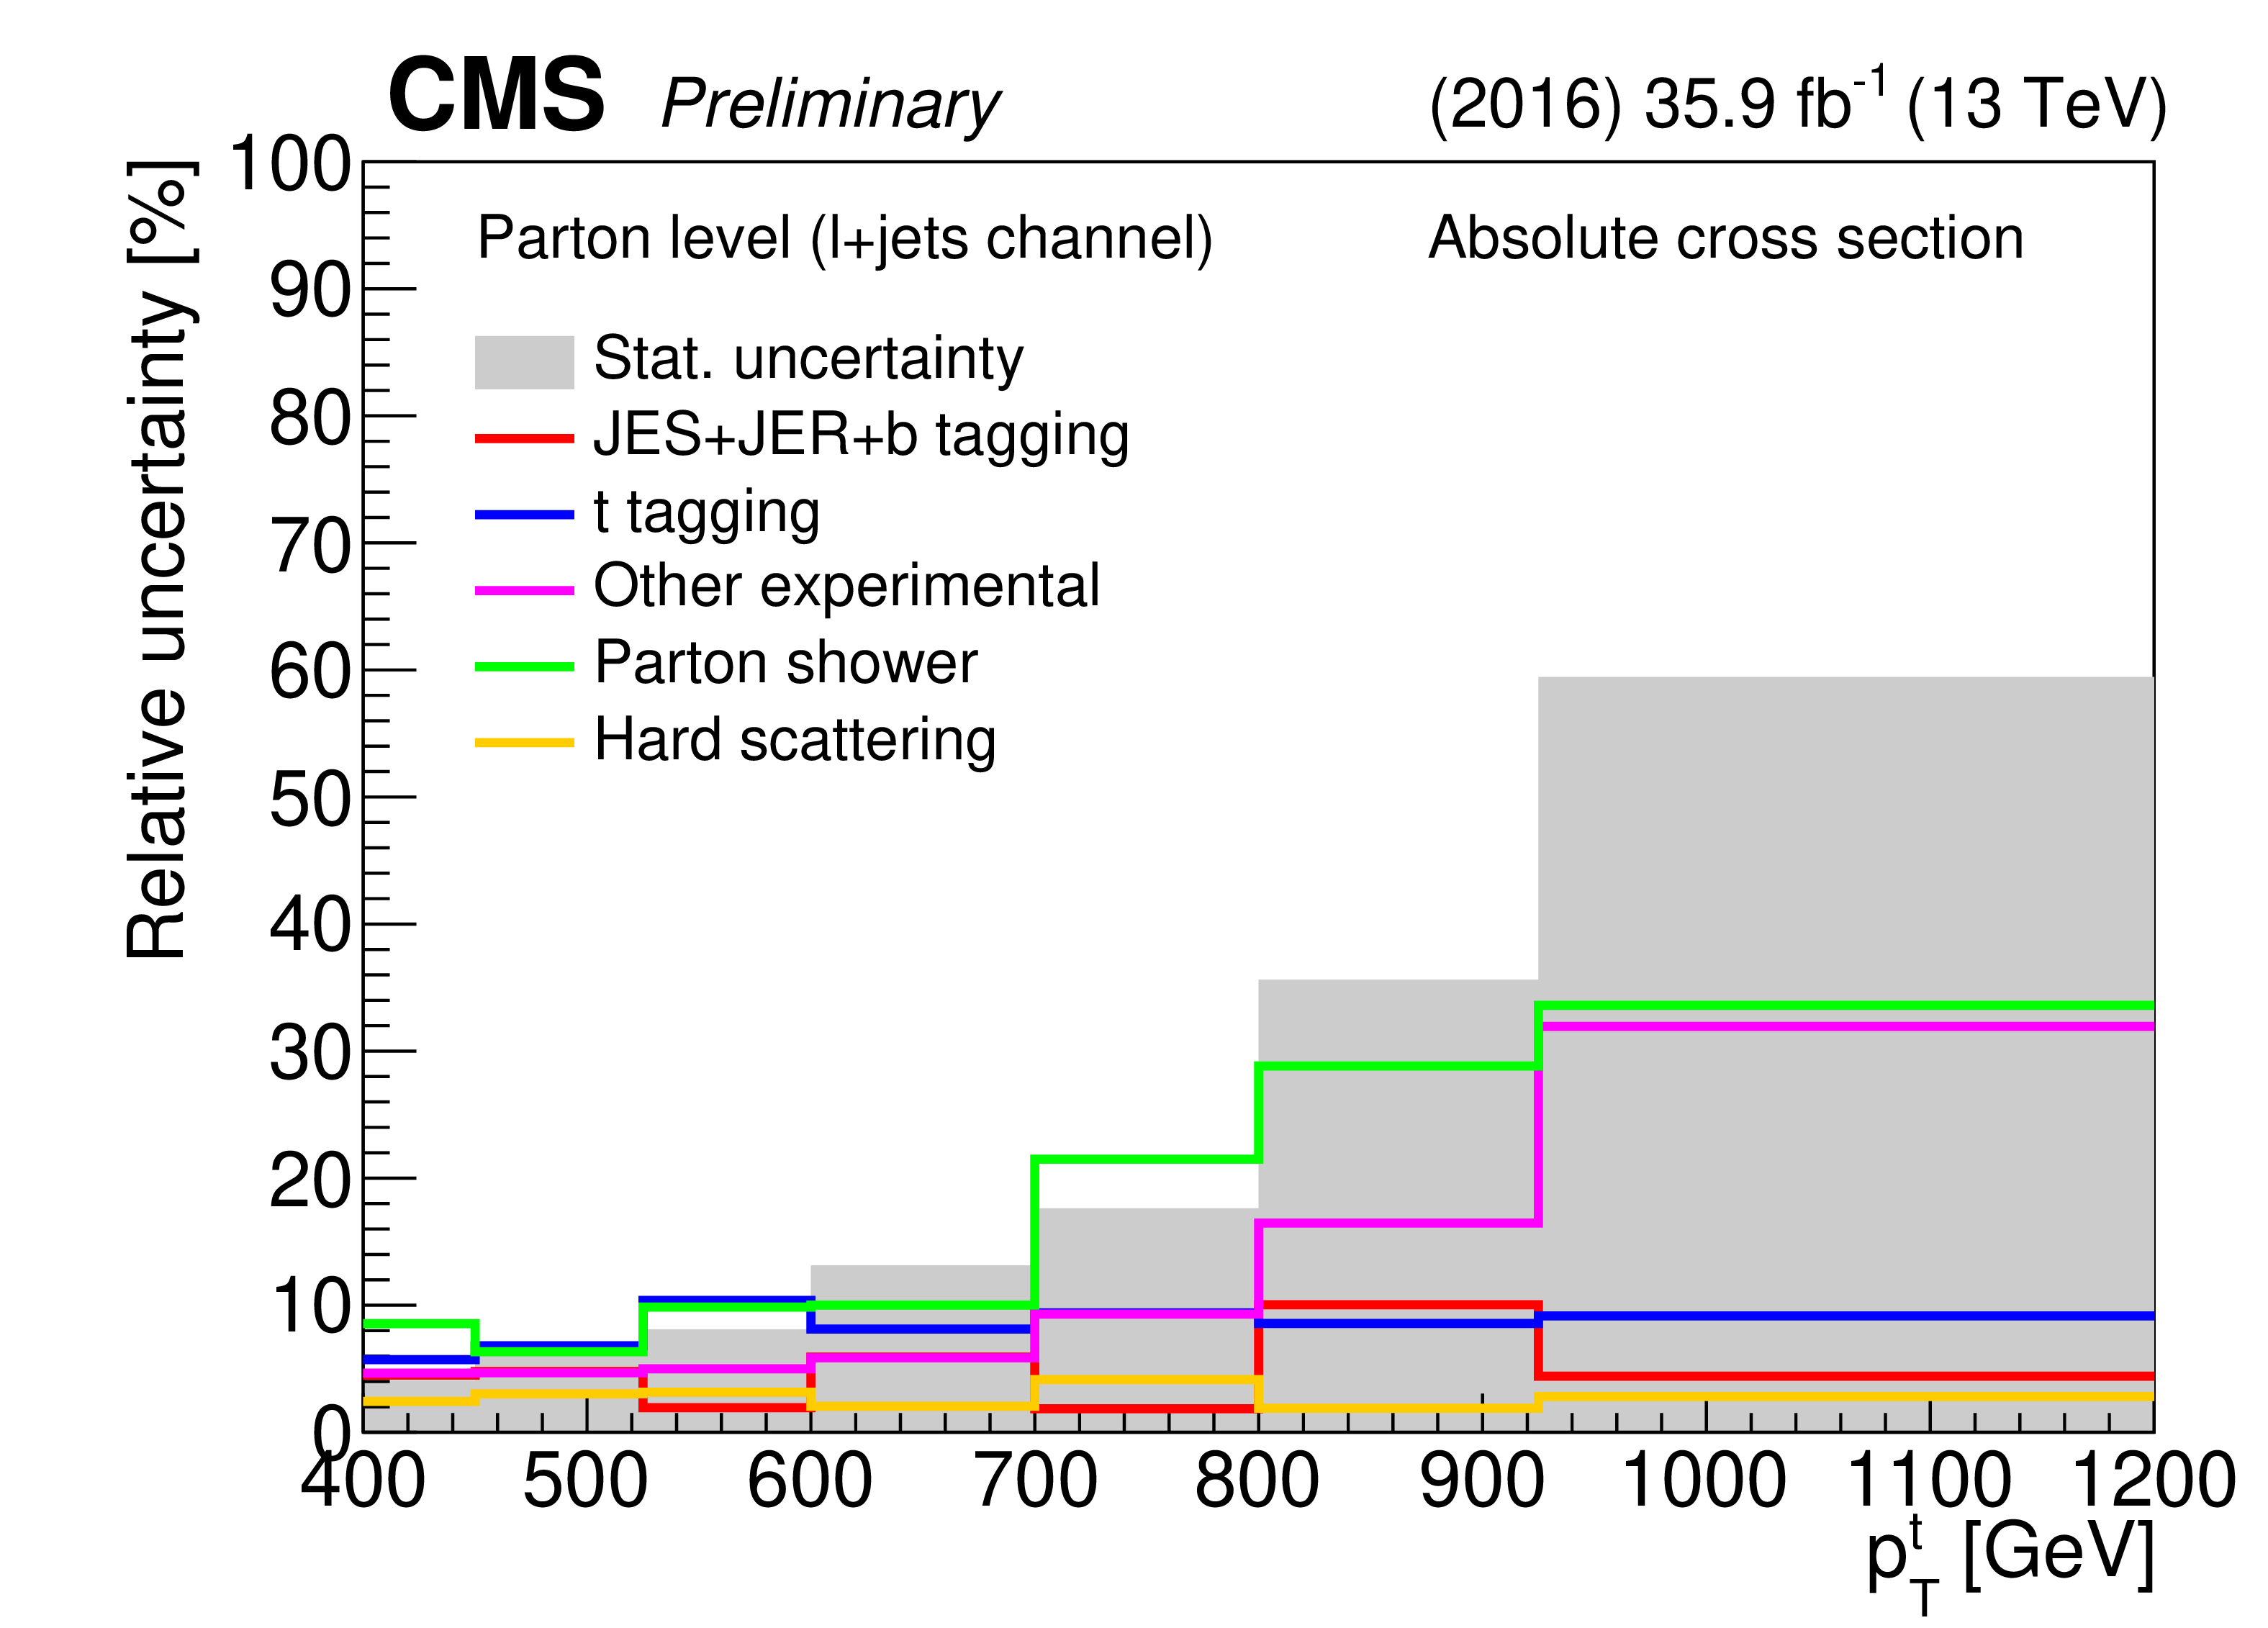
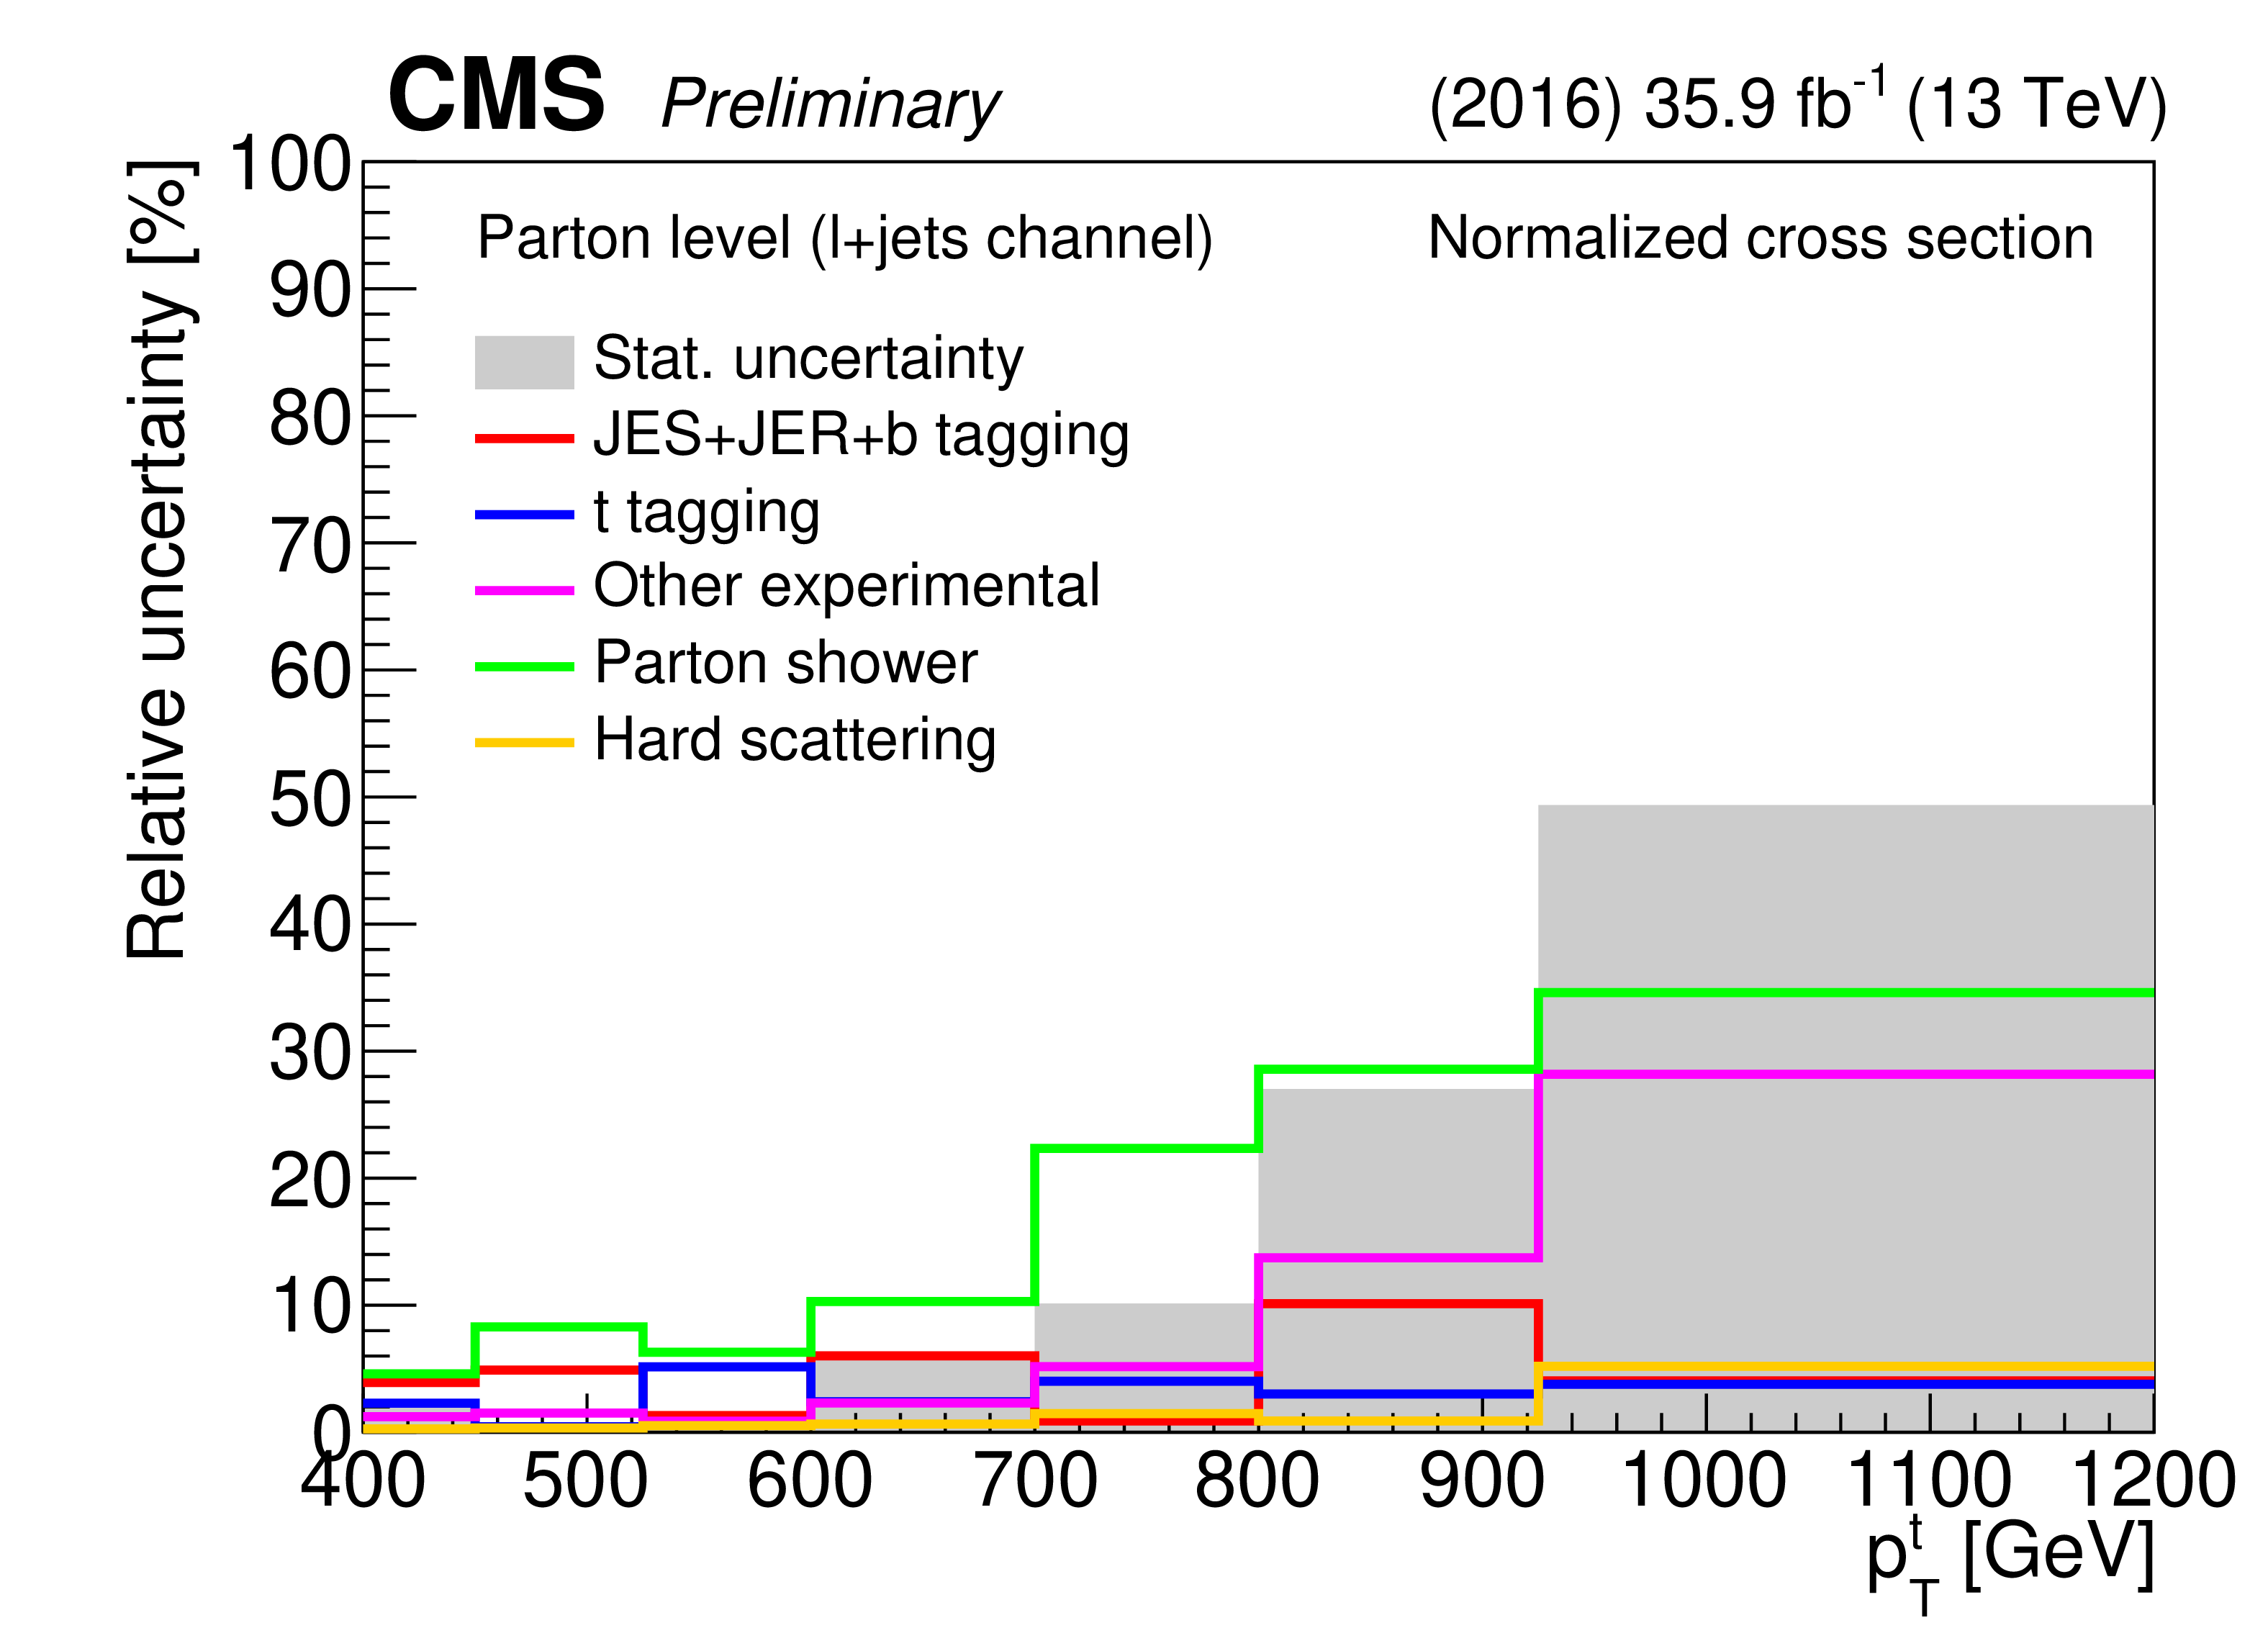
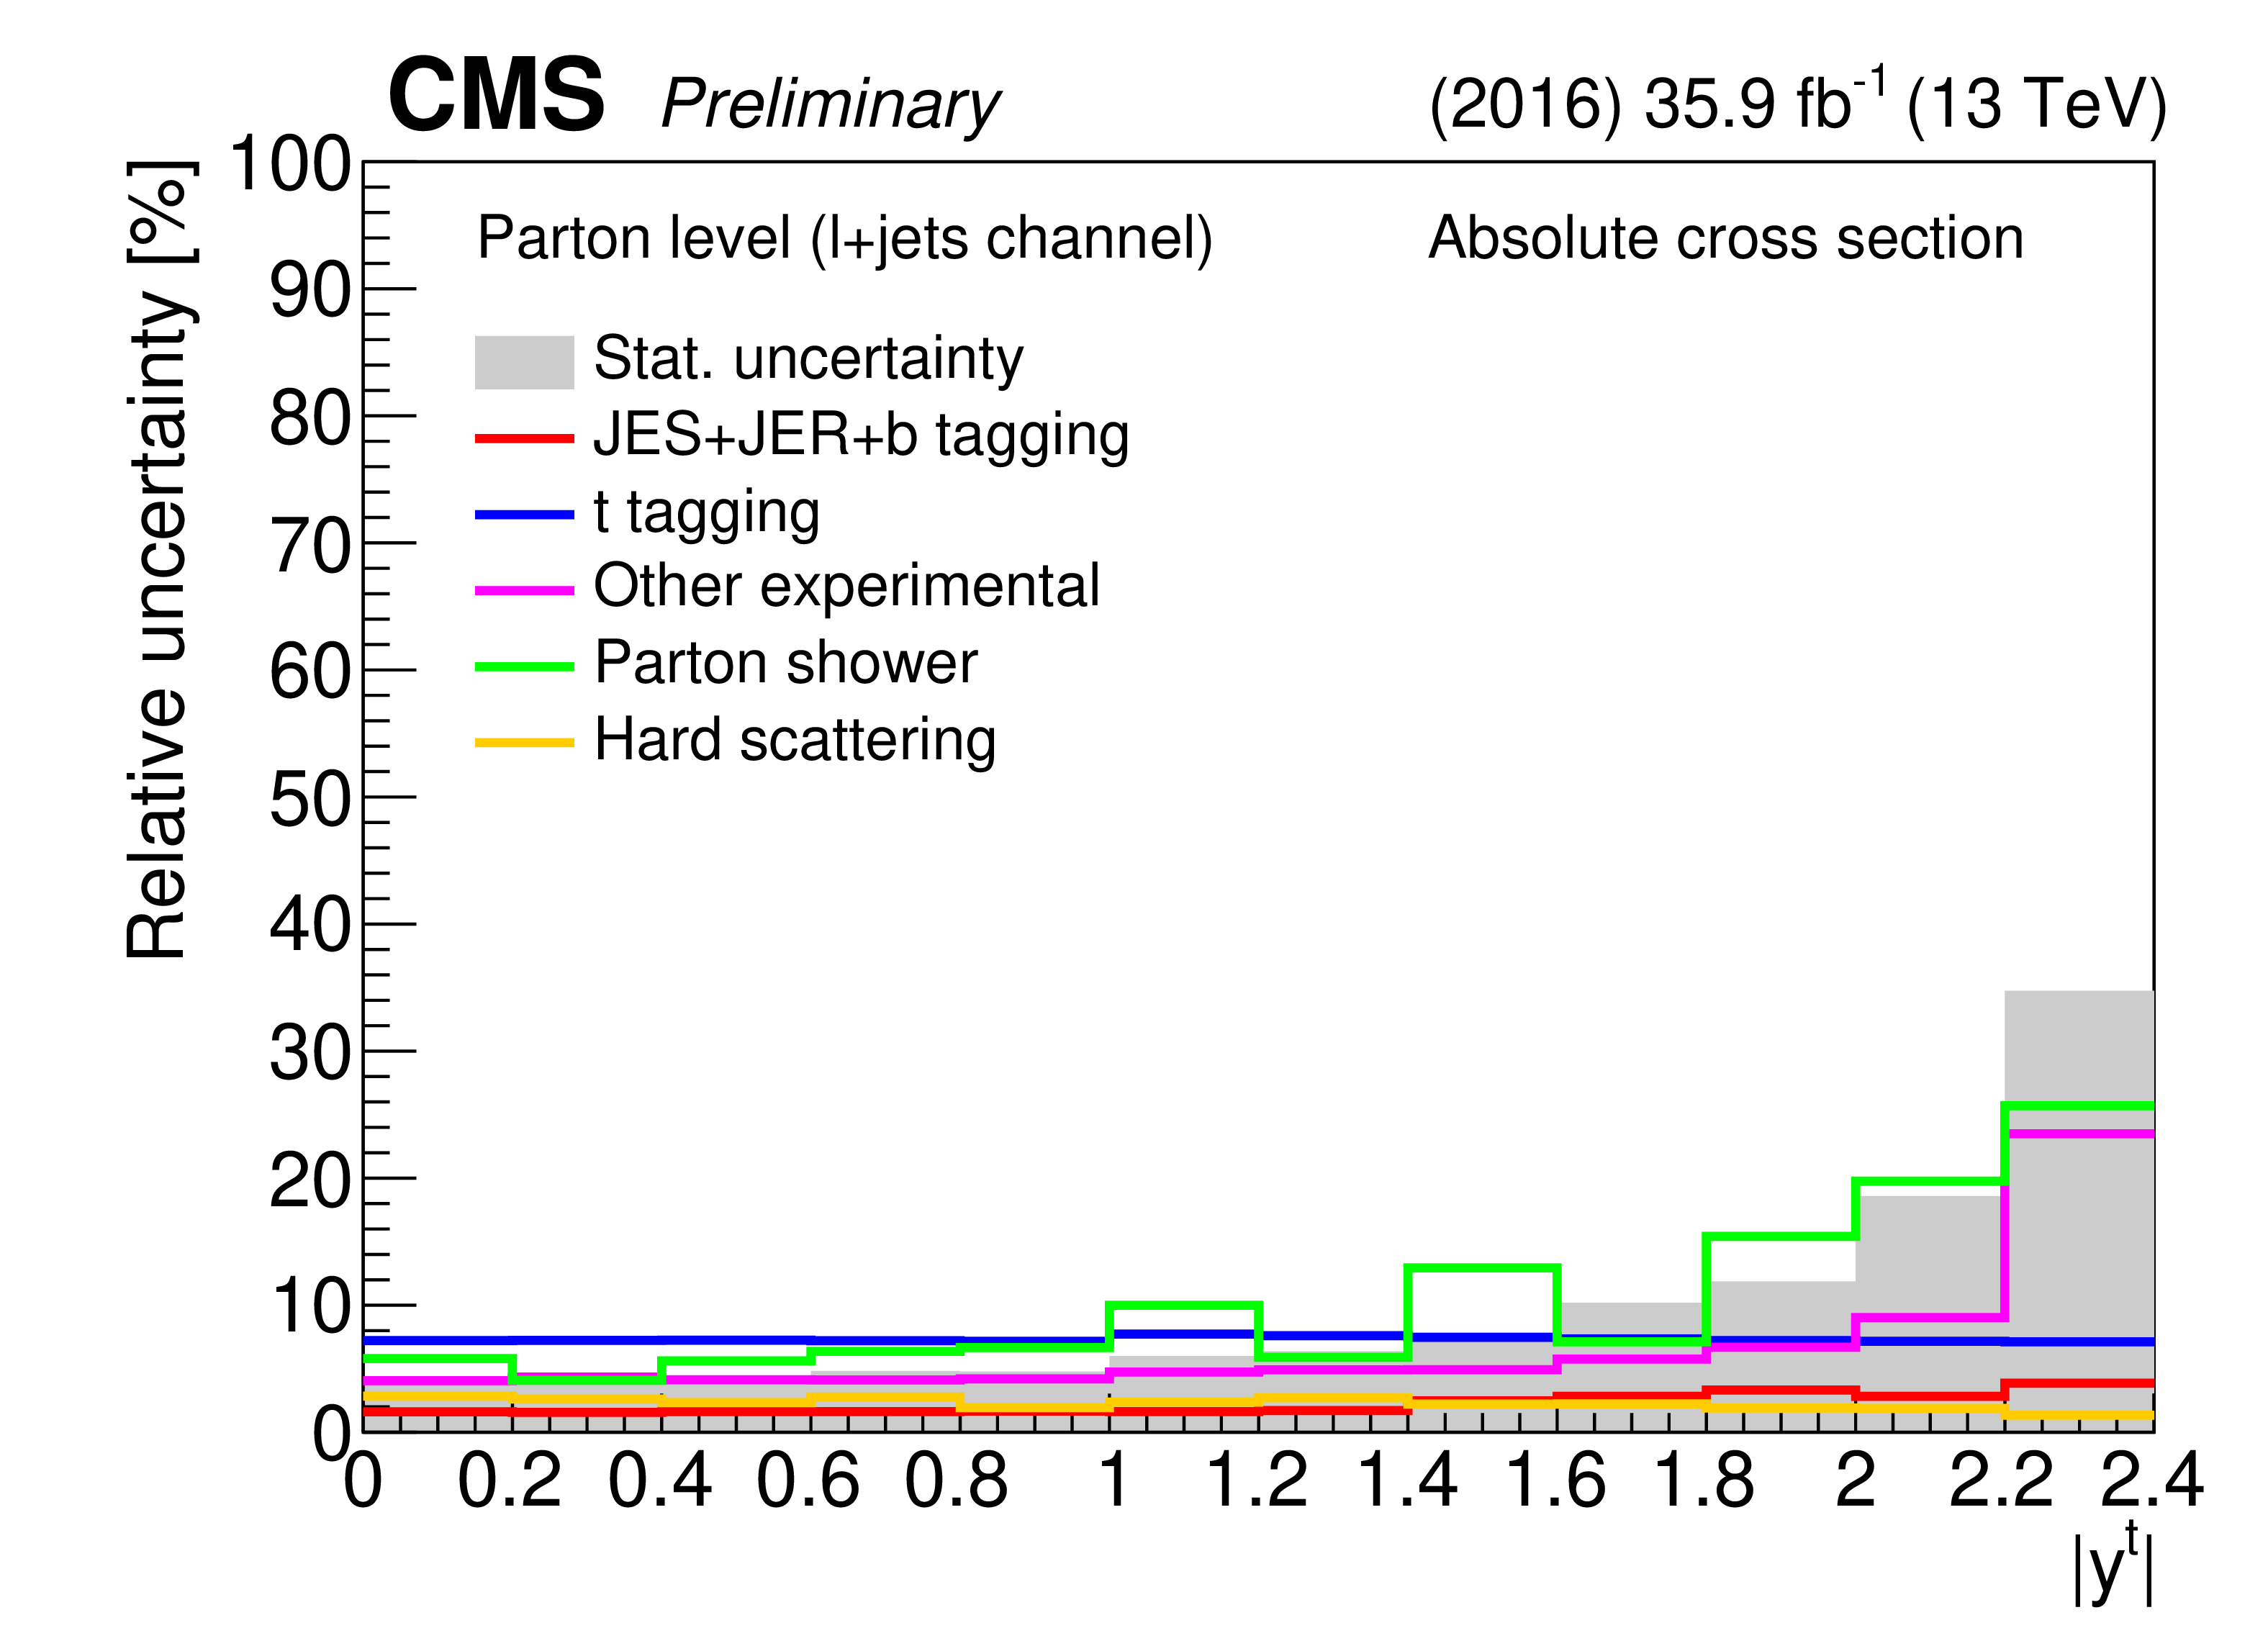
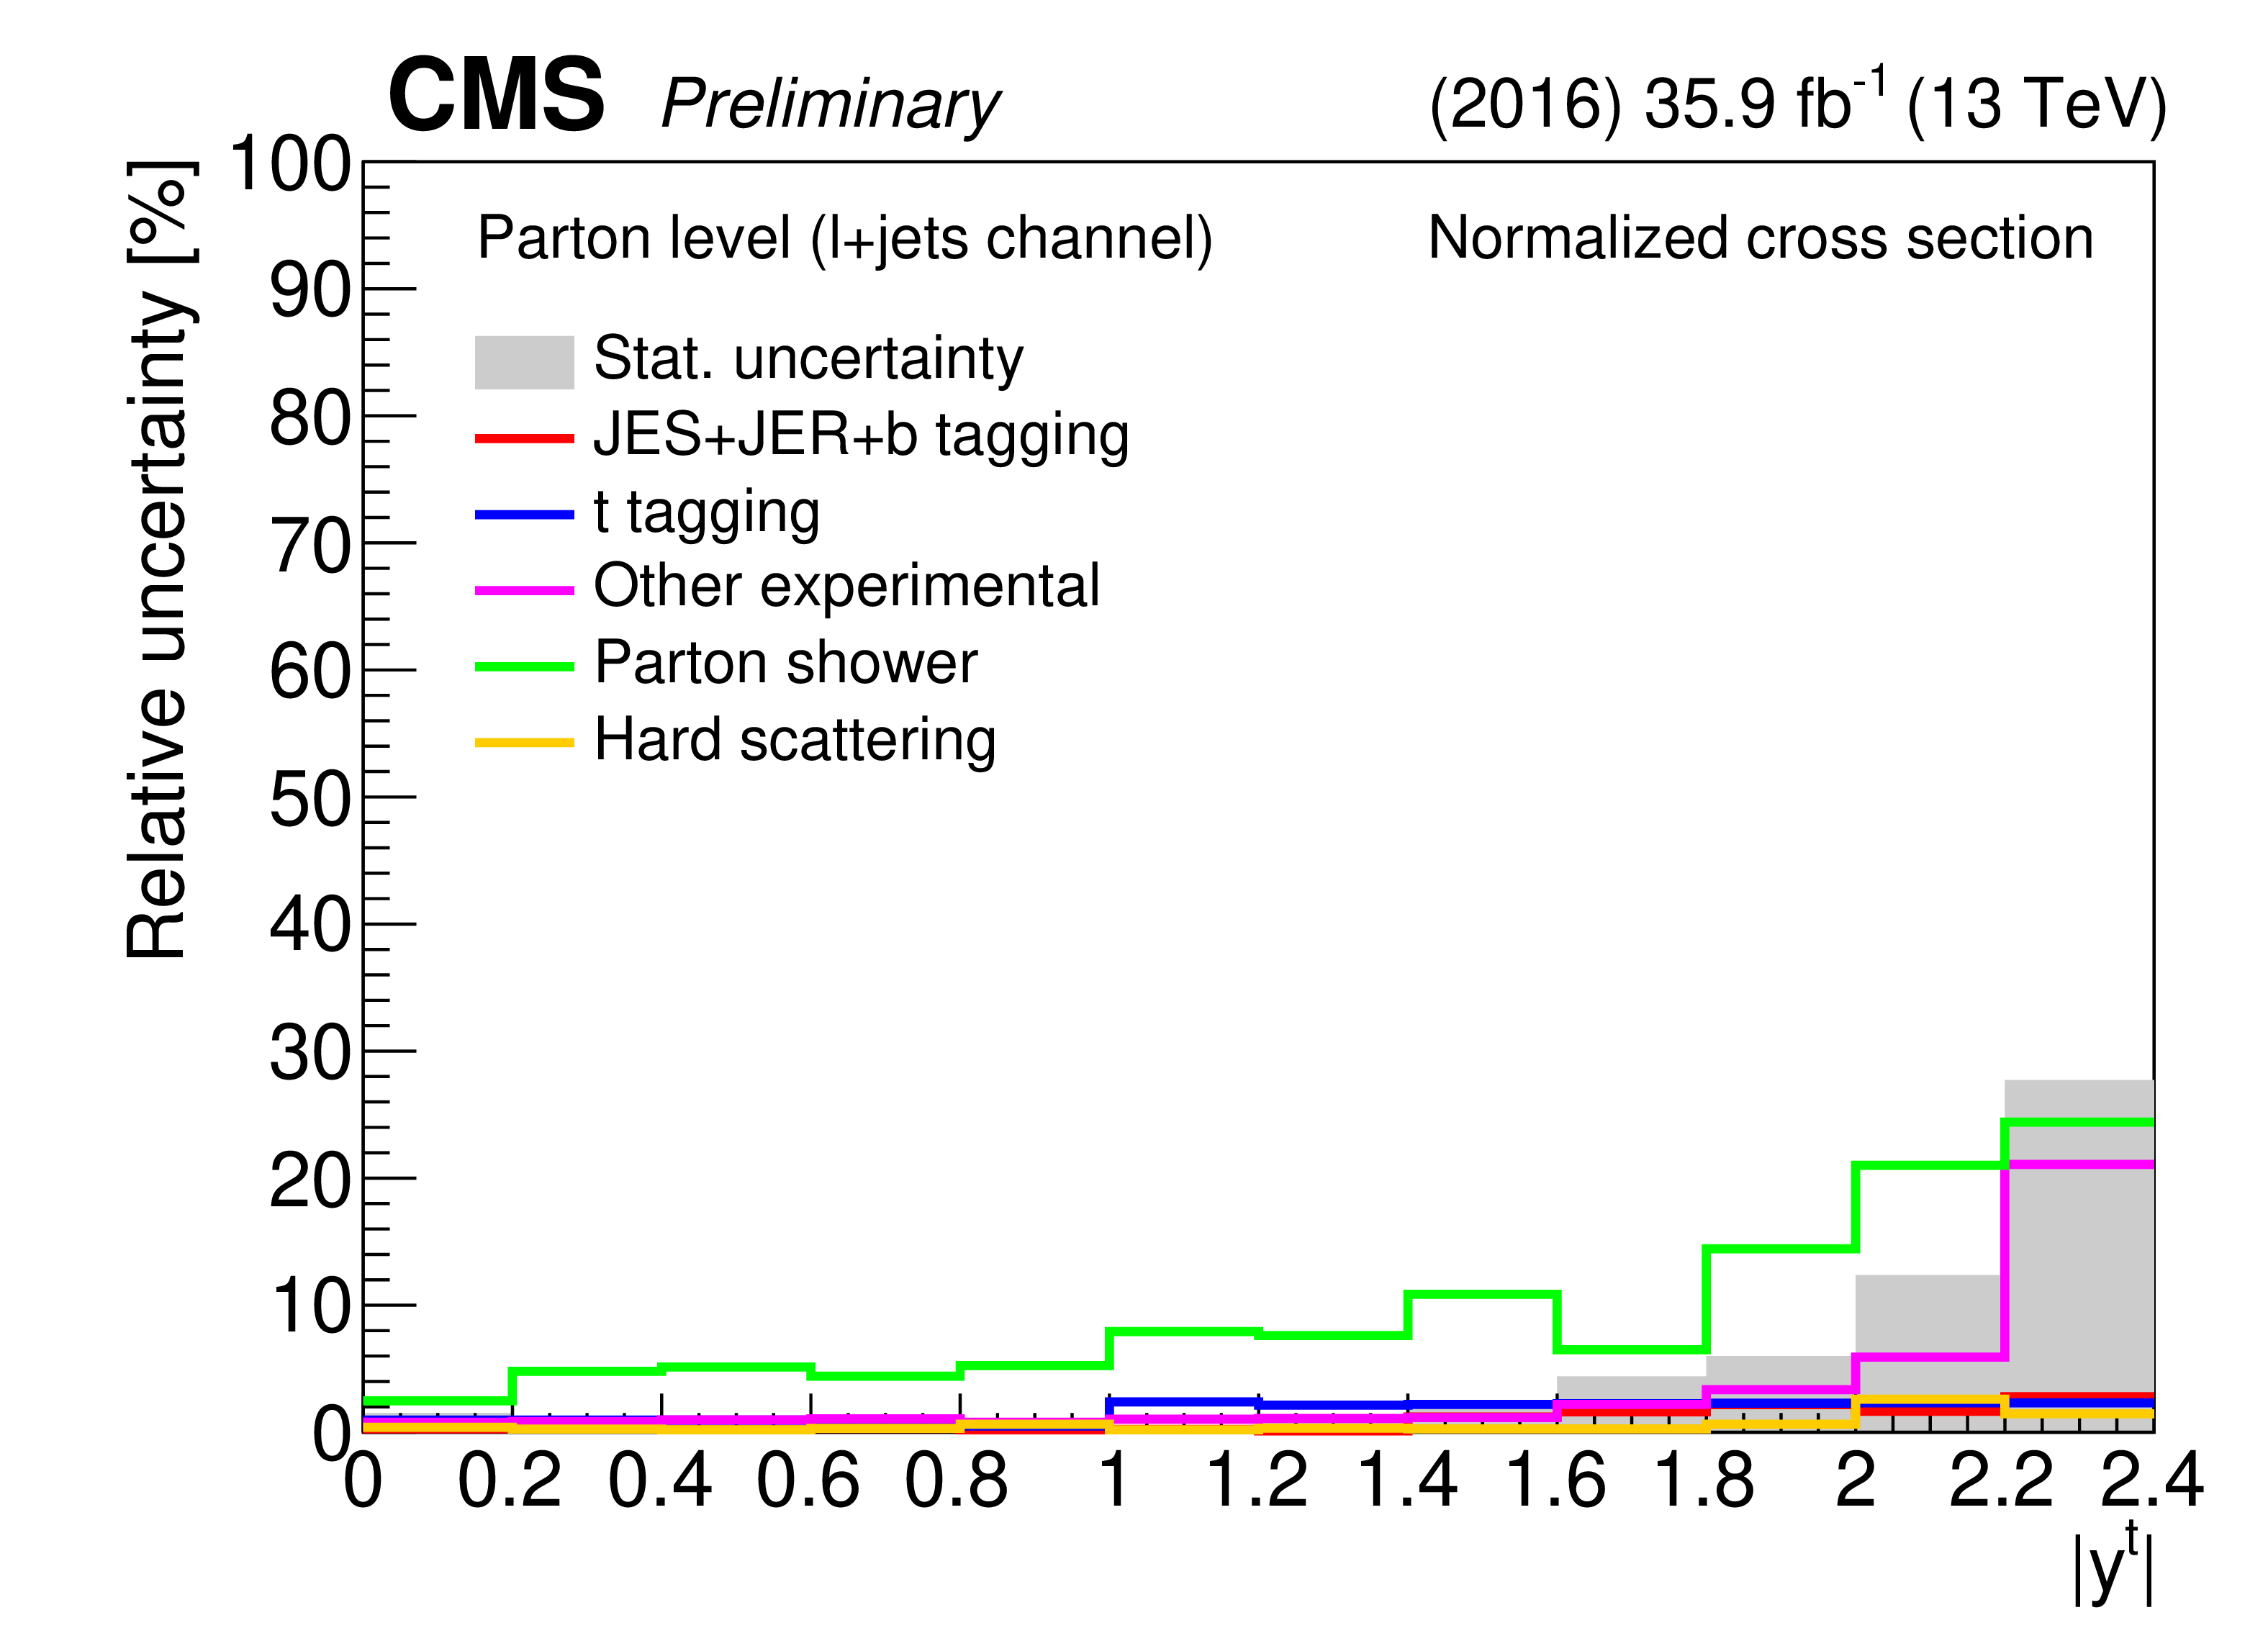
Figure 35:
Breakdown of the sources of systematic uncertainty affecting the differential cross section measurements in the $\ell $+jets channel at the parton level as a function of the top quark $ {p_{\mathrm {T}}} $ (top row) or $|y|$ (bottom row). Both the systematic uncertainties in the absolute (left column) and the normalized (right column) cross sections are shown. "JES+JER+b tagging" includes uncertainties due to the jet energy scale, jet energy resolution, and small-$R$ jet b tagging efficiency; "t tagging" is the uncertainty associated with the large-$R$ jet t tagging efficiency; "Other experimental" includes the uncertainties originating from the background estimate, pileup modeling, lepton identification and trigger efficiency, and measurement of the integrated luminosity; "Parton shower" includes contributions from initial- and final-state radiation, underlying event tune, ME-PS matching, and color reconnection; "Hard scattering" includes the uncertainty due to PDFs as well as renormalization and factorization scales. |
png pdf |
Figure 35-a:
Breakdown of the sources of systematic uncertainty affecting the differential cross section measurements in the $\ell $+jets channel at the parton level as a function of the top quark $ {p_{\mathrm {T}}} $ (top row) or $|y|$ (bottom row). Both the systematic uncertainties in the absolute (left column) and the normalized (right column) cross sections are shown. "JES+JER+b tagging" includes uncertainties due to the jet energy scale, jet energy resolution, and small-$R$ jet b tagging efficiency; "t tagging" is the uncertainty associated with the large-$R$ jet t tagging efficiency; "Other experimental" includes the uncertainties originating from the background estimate, pileup modeling, lepton identification and trigger efficiency, and measurement of the integrated luminosity; "Parton shower" includes contributions from initial- and final-state radiation, underlying event tune, ME-PS matching, and color reconnection; "Hard scattering" includes the uncertainty due to PDFs as well as renormalization and factorization scales. |
png pdf |
Figure 35-b:
Breakdown of the sources of systematic uncertainty affecting the differential cross section measurements in the $\ell $+jets channel at the parton level as a function of the top quark $ {p_{\mathrm {T}}} $ (top row) or $|y|$ (bottom row). Both the systematic uncertainties in the absolute (left column) and the normalized (right column) cross sections are shown. "JES+JER+b tagging" includes uncertainties due to the jet energy scale, jet energy resolution, and small-$R$ jet b tagging efficiency; "t tagging" is the uncertainty associated with the large-$R$ jet t tagging efficiency; "Other experimental" includes the uncertainties originating from the background estimate, pileup modeling, lepton identification and trigger efficiency, and measurement of the integrated luminosity; "Parton shower" includes contributions from initial- and final-state radiation, underlying event tune, ME-PS matching, and color reconnection; "Hard scattering" includes the uncertainty due to PDFs as well as renormalization and factorization scales. |
png pdf |
Figure 35-c:
Breakdown of the sources of systematic uncertainty affecting the differential cross section measurements in the $\ell $+jets channel at the parton level as a function of the top quark $ {p_{\mathrm {T}}} $ (top row) or $|y|$ (bottom row). Both the systematic uncertainties in the absolute (left column) and the normalized (right column) cross sections are shown. "JES+JER+b tagging" includes uncertainties due to the jet energy scale, jet energy resolution, and small-$R$ jet b tagging efficiency; "t tagging" is the uncertainty associated with the large-$R$ jet t tagging efficiency; "Other experimental" includes the uncertainties originating from the background estimate, pileup modeling, lepton identification and trigger efficiency, and measurement of the integrated luminosity; "Parton shower" includes contributions from initial- and final-state radiation, underlying event tune, ME-PS matching, and color reconnection; "Hard scattering" includes the uncertainty due to PDFs as well as renormalization and factorization scales. |
png pdf |
Figure 35-d:
Breakdown of the sources of systematic uncertainty affecting the differential cross section measurements in the $\ell $+jets channel at the parton level as a function of the top quark $ {p_{\mathrm {T}}} $ (top row) or $|y|$ (bottom row). Both the systematic uncertainties in the absolute (left column) and the normalized (right column) cross sections are shown. "JES+JER+b tagging" includes uncertainties due to the jet energy scale, jet energy resolution, and small-$R$ jet b tagging efficiency; "t tagging" is the uncertainty associated with the large-$R$ jet t tagging efficiency; "Other experimental" includes the uncertainties originating from the background estimate, pileup modeling, lepton identification and trigger efficiency, and measurement of the integrated luminosity; "Parton shower" includes contributions from initial- and final-state radiation, underlying event tune, ME-PS matching, and color reconnection; "Hard scattering" includes the uncertainty due to PDFs as well as renormalization and factorization scales. |
| Tables | |
png pdf |
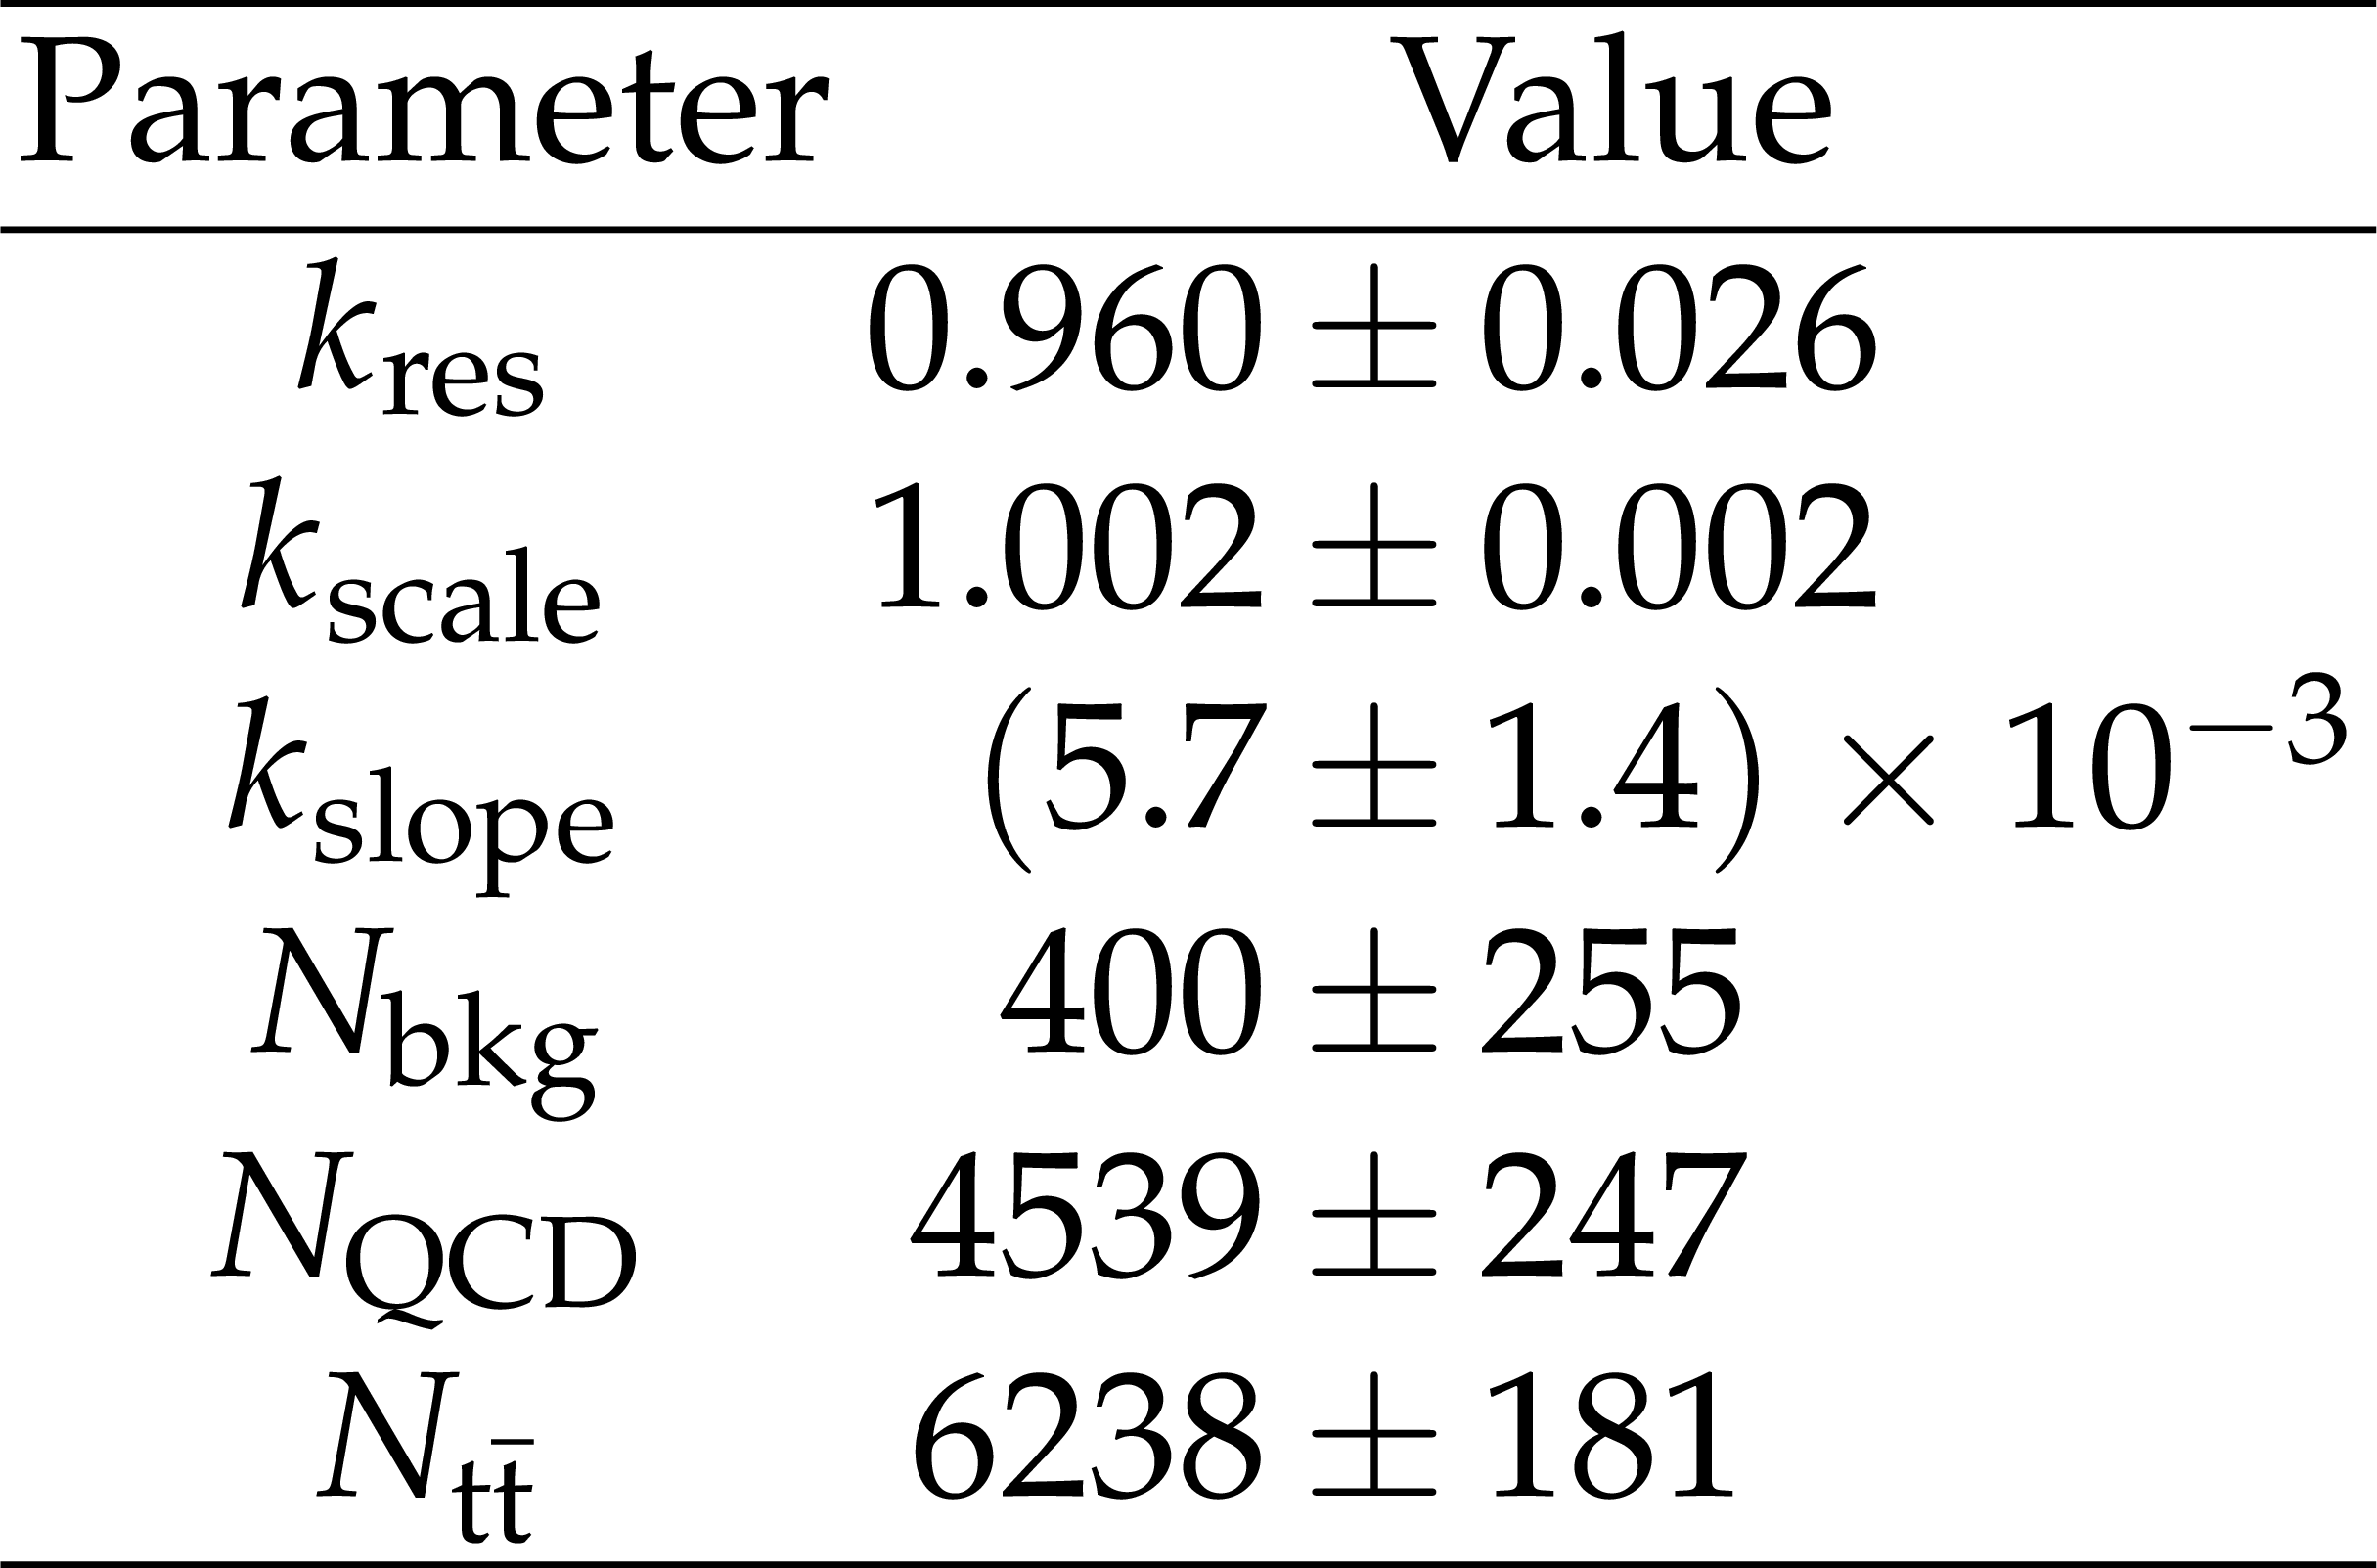
Table 1:
Post-fit values of the nuisance parameters for the fit to data in SR$_{\rm A}$ in the hadronic channel. |
png pdf |
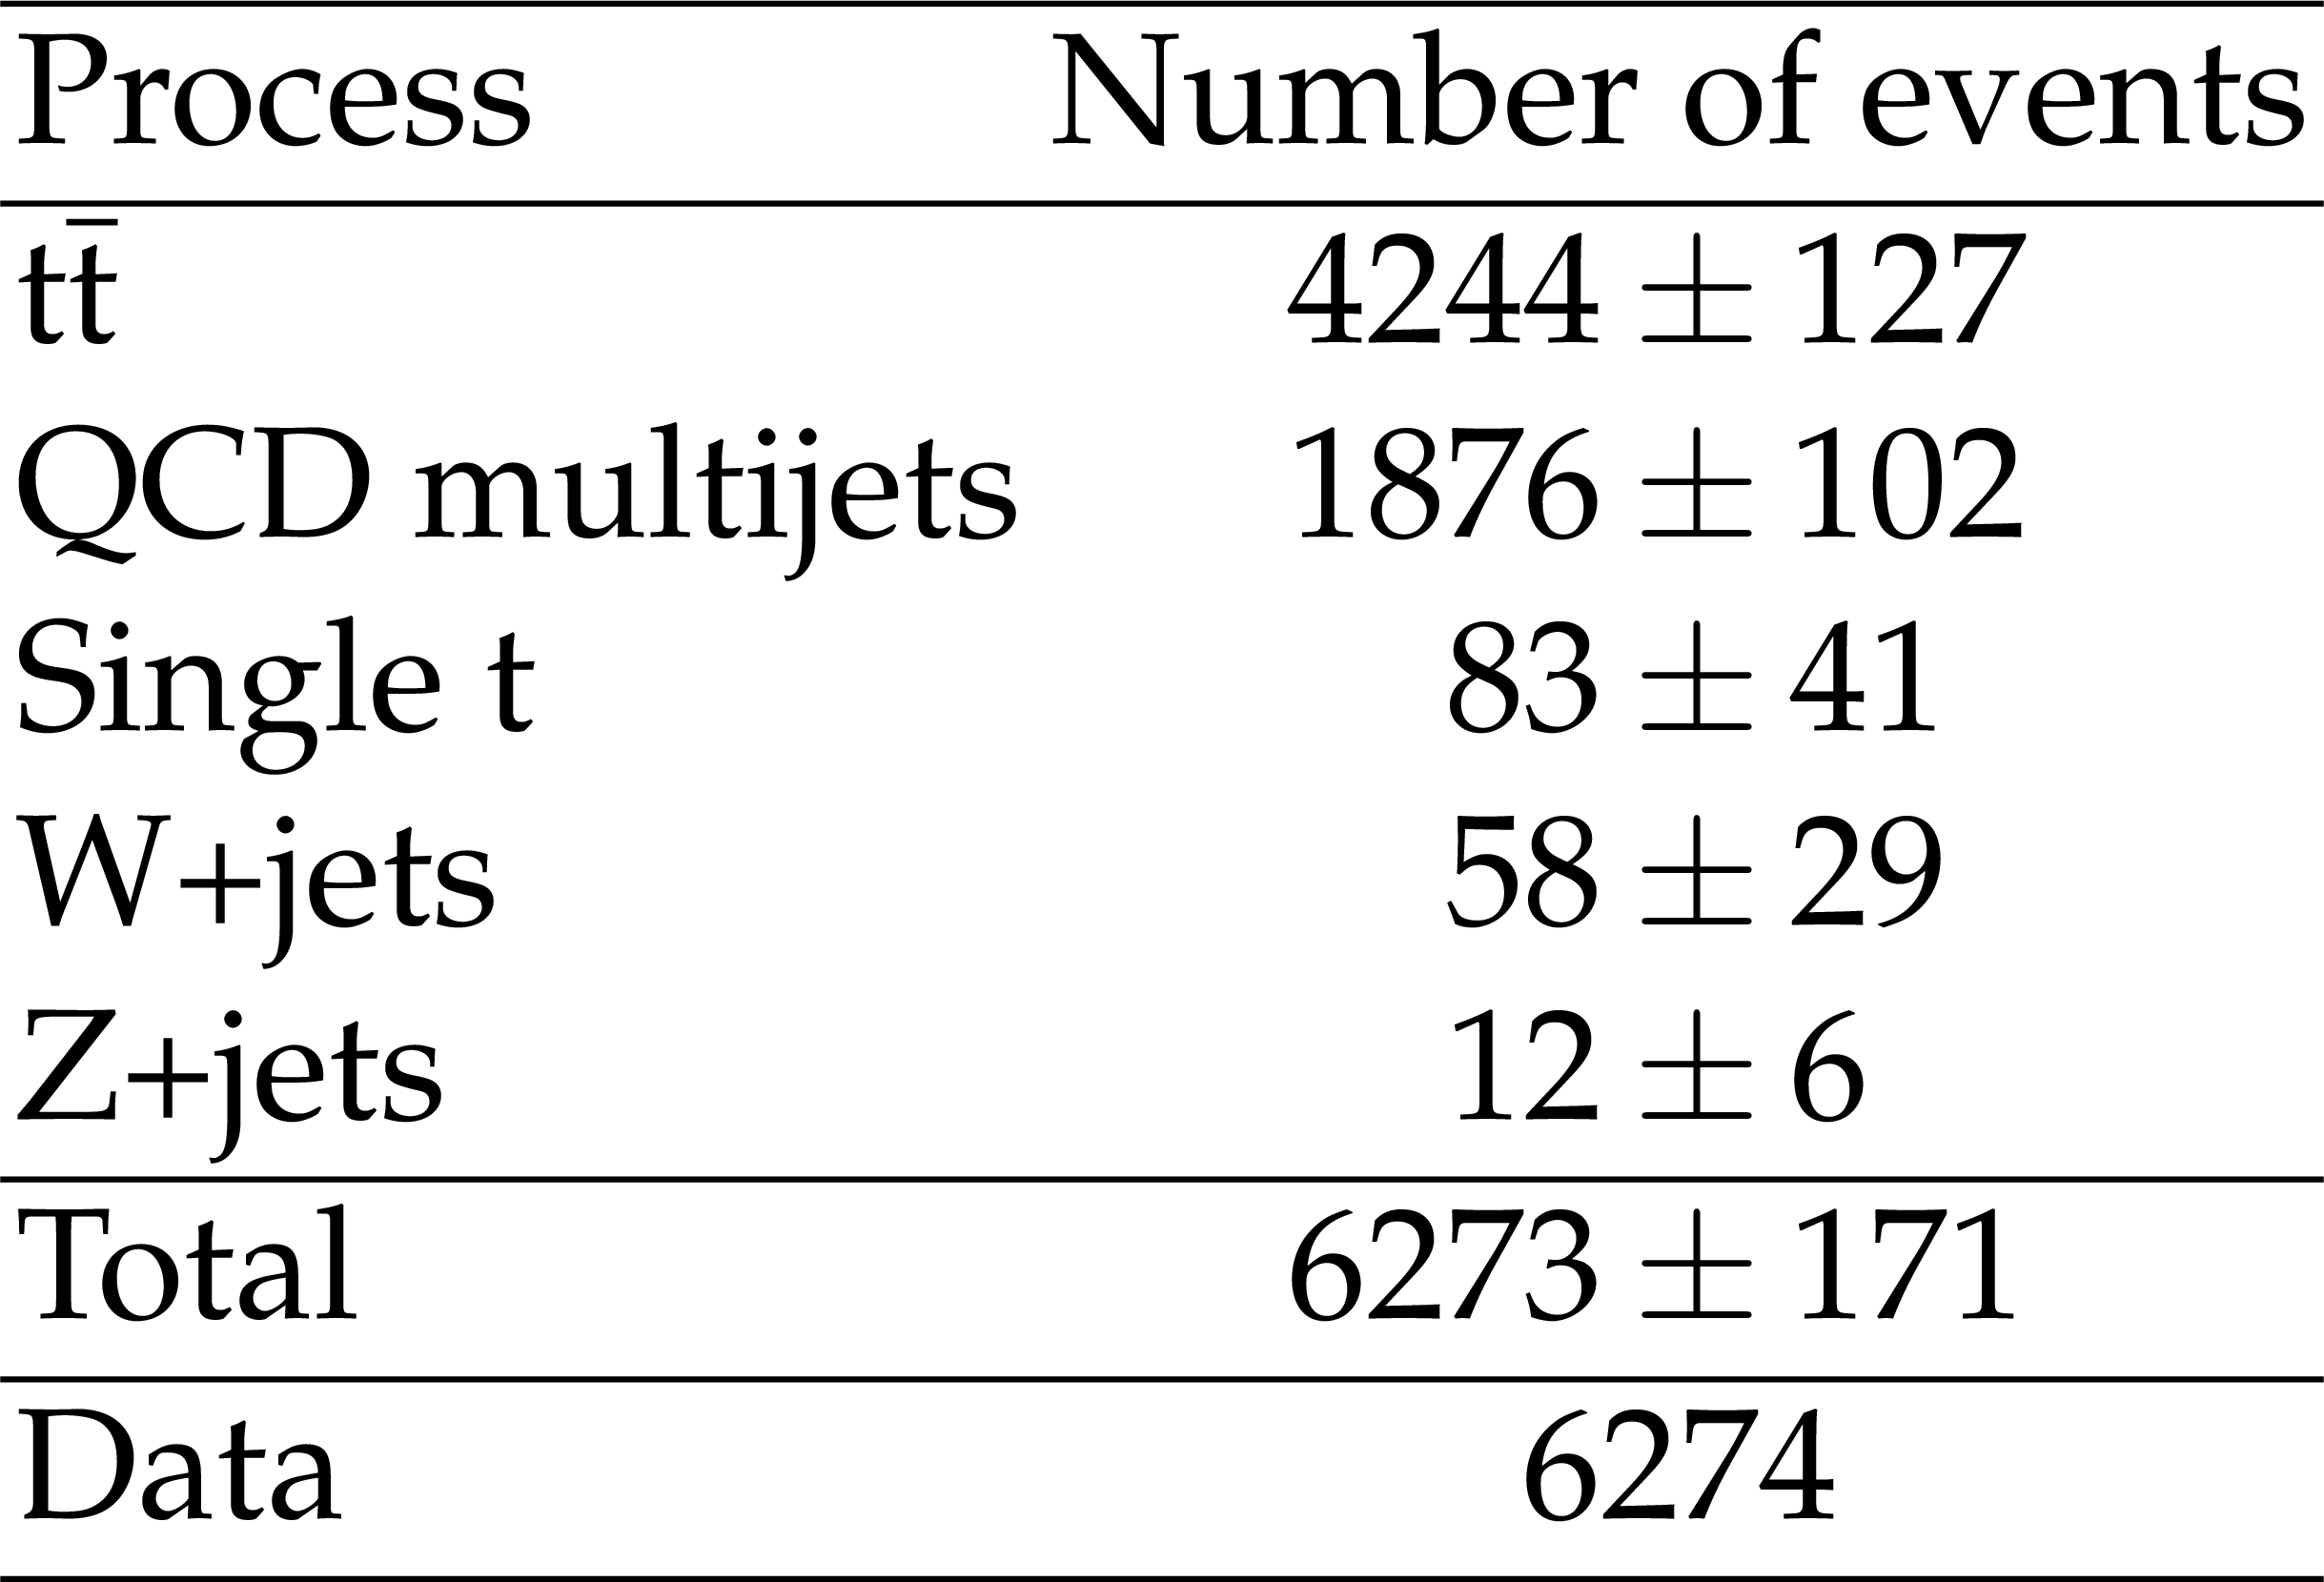
Table 2:
Observed and predicted event yields with their respective statistical uncertainties in the signal region for the hadronic channel. The $\mathrm{t\bar{t}}$ and QCD multijet yields are obtained after the fit in SR$_{\rm A}$. |
png pdf |
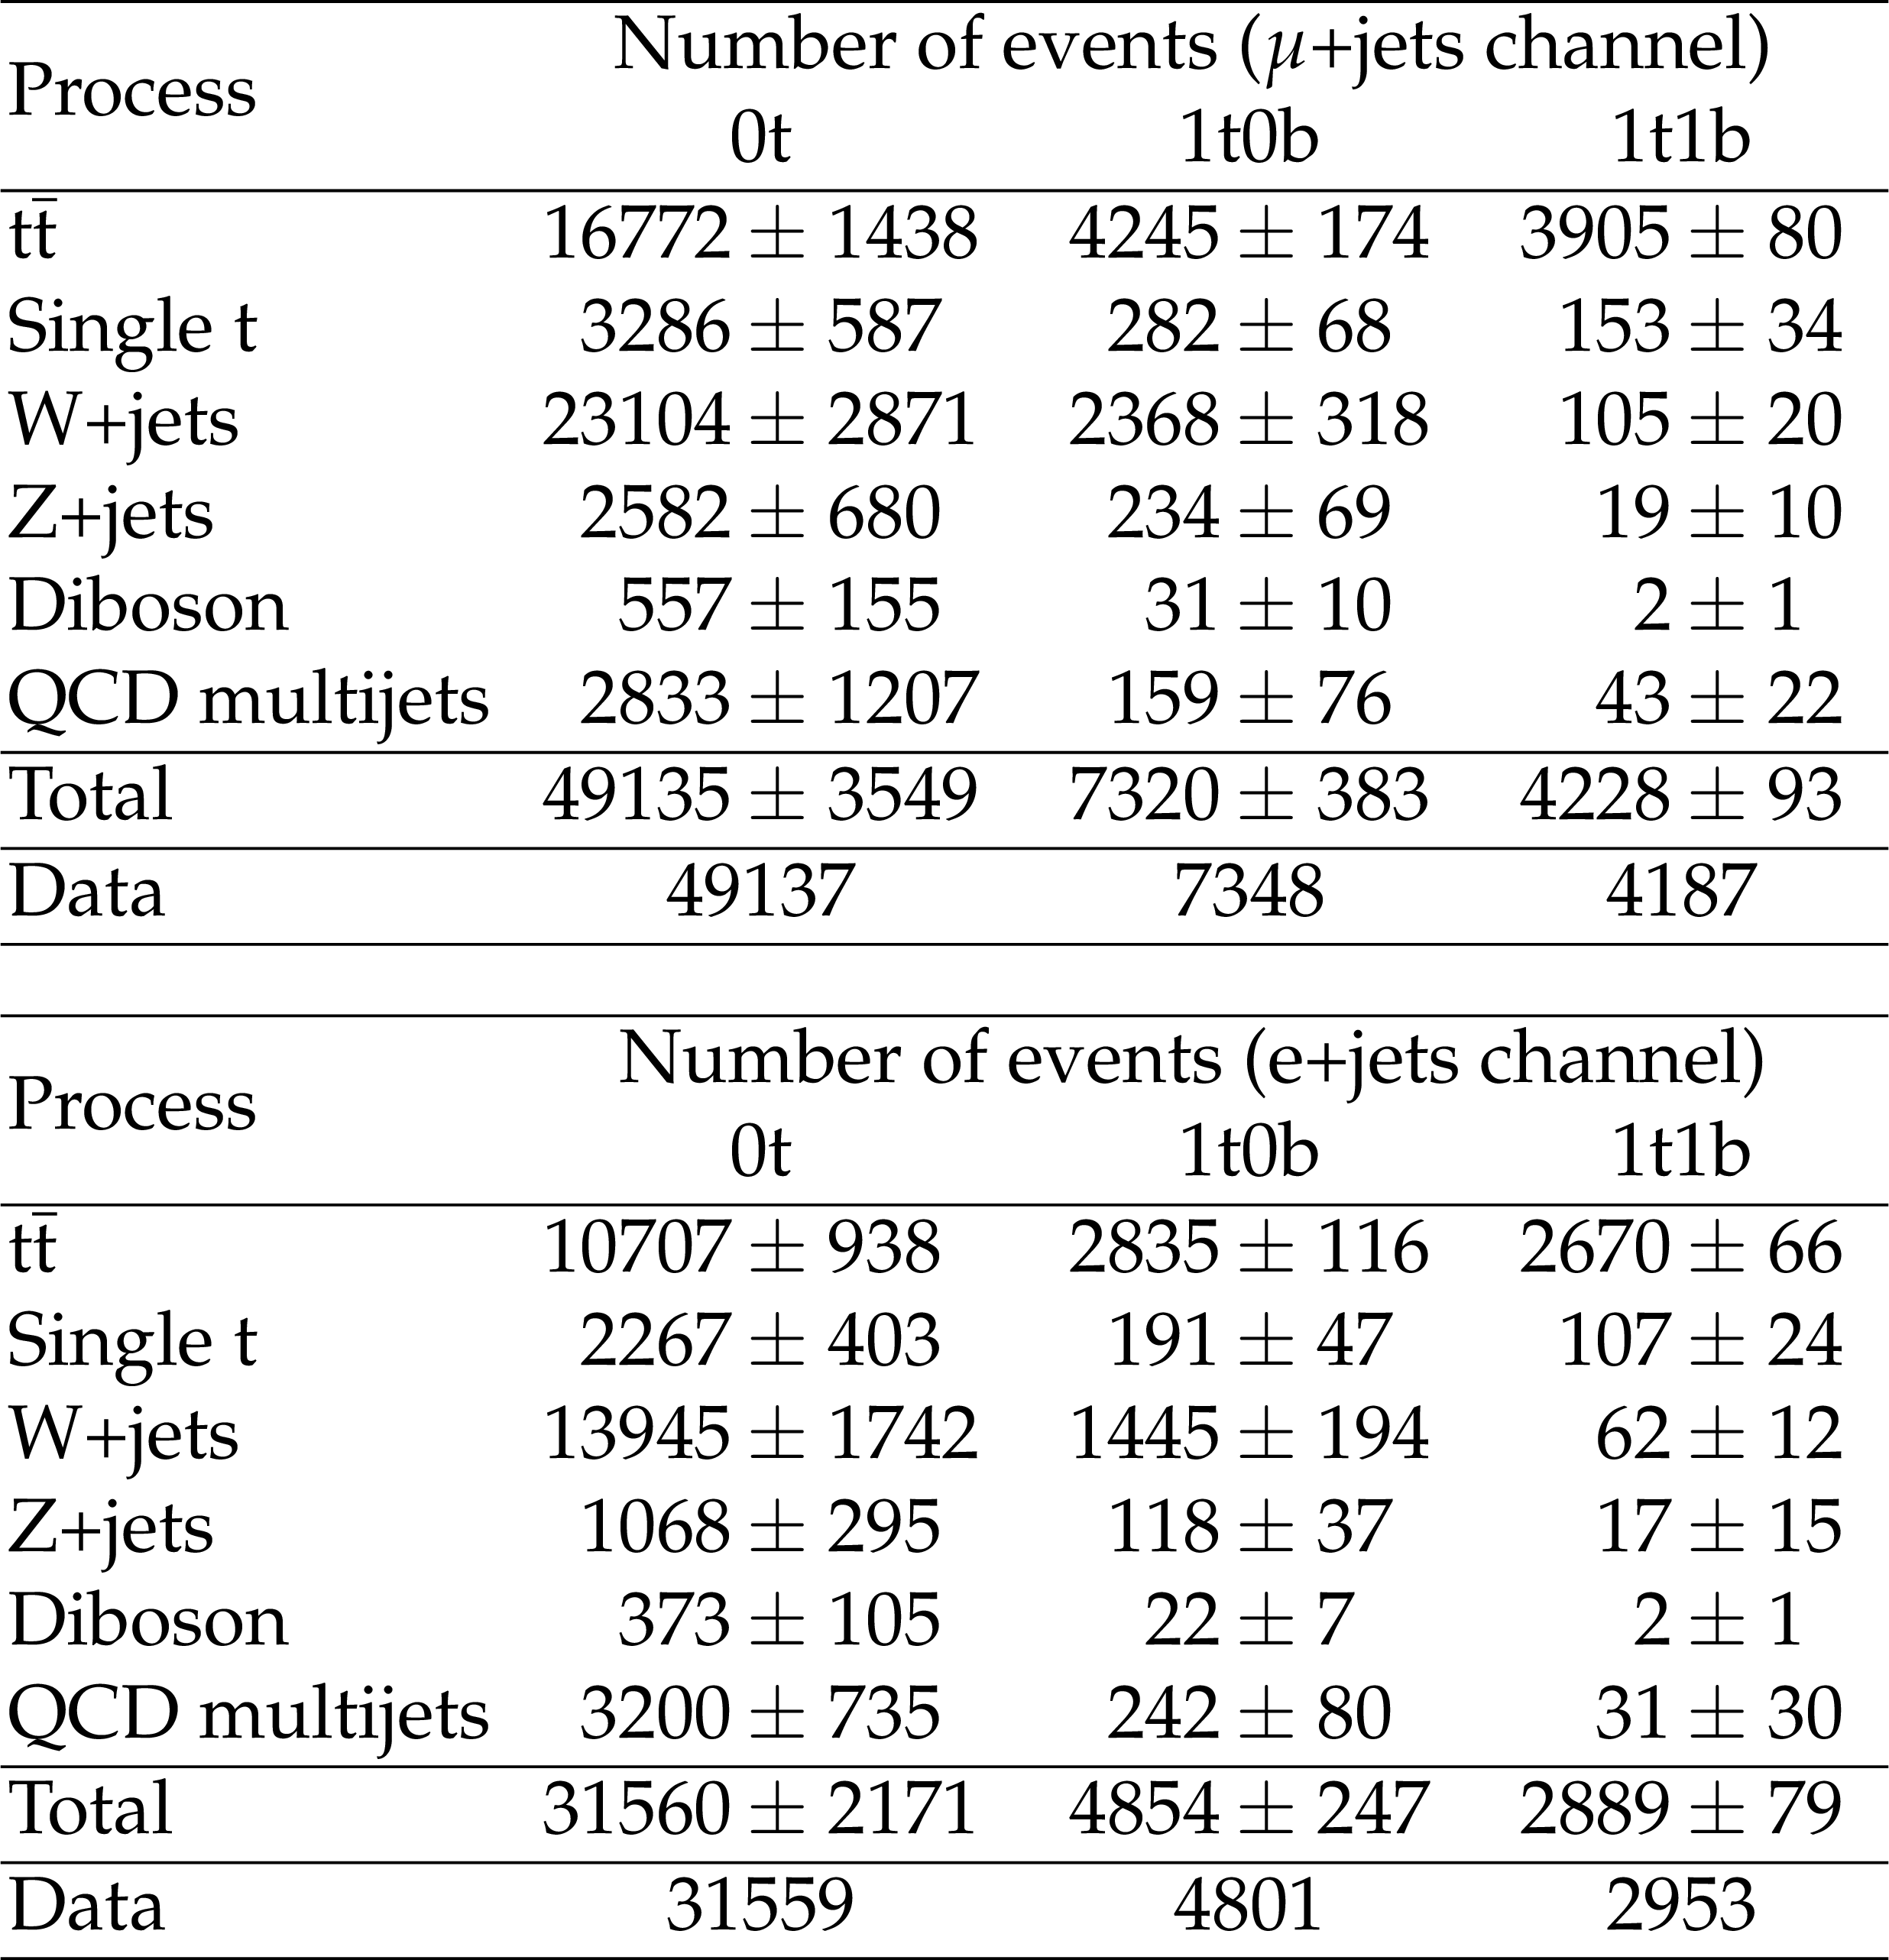
Table 3:
Posterior signal and background event yields in the 0t, 1t0b, and 1t1b categories, together with the observation in data. The uncertainties include all posterior experimental uncertainties. |
| Summary |
| A measurement of the $\mathrm{t\bar{t}}$ production cross section for high-${p_{\mathrm{T}}}$ top quarks in proton-proton collisions at 13 TeV has been presented. The measurement uses events where either one or both top quarks decay hadronically, and where the hadronic decay products cannot be resolved but are instead clustered in a single large-$R$ jet with ${p_{\mathrm{T}}} > $ 400 GeV. The hadronic final state contains two such large-$R$ jets, while the $\ell$+jets final state is identified through the presence of an electron/muon, a b-tagged jet from the leptonically decaying top quark, missing transverse momentum from the escaping neutrino, and a single t-tagged large-$R$ jet. The measurement utilizes a larger data set compared to previous results in order to explore a wider phase space of the $\mathrm{t\bar{t}}$ production and elucidate the discrepancies with the theory predictions that have been reported in earlier publications. For the hadronic channel, absolute and normalized differential cross sections are presented as a function of the leading and subleading top quark ${p_{\mathrm{T}}}$ and $|y|$, and as a function of the invariant mass, ${p_{\mathrm{T}}}$, and $y$ of the $\mathrm{t\bar{t}}$ system, unfolded to the particle and parton level. For the $\ell$+jets channel, the differential cross section is measured as a function of the ${p_{\mathrm{T}}}$ and $|y|$ of the hadronically decaying top quark, at the particle level within a fiducial phase space and at the parton level. The results are compared to theoretical predictions from the POWHEG matrix-element generator, interfaced with PYTHIA8 or HERWIG++ for the underlying event and parton shower, and from the MCatNLO matrix-element generator, interfaced with PYTHIA8. All the models overpredict significantly the absolute cross section in the phase space of the measurement (by up to 35%), while they describe consistently the differential distribution of most variables. The most notable discrepancy is observed for the hadronic channel in the invariant mass of the $\mathrm{t\bar{t}}$ system and the ${p_{\mathrm{T}}}$ of the subleading t jet, where the theoretical models predict a higher cross section at high mass and ${p_{\mathrm{T}}}$ values, respectively. To further investigate the severity of this discrepancy, more data is needed to enhance the statistical significance of the measurement in this region of phase space. |
| References | ||||
| 1 | ATLAS Collaboration | Measurements of top-quark pair differential cross-sections in the lepton+jets channel in $ pp $ collisions at $ \sqrt{s}= $ 13 TeV using the ATLAS detector | JHEP 11 (2017) 191 | 1708.00727 |
| 2 | ATLAS Collaboration | Measurements of top-quark pair differential cross-sections in the $ e\mu $ channel in $ pp $ collisions at $ \sqrt{s} = $ 13 TeV using the ATLAS detector | EPJC 77 (2017) 292 | 1612.05220 |
| 3 | ATLAS Collaboration | Measurement of lepton differential distributions and the top quark mass in $ t\bar{t} $ production in $ pp $ collisions at $ \sqrt{s}= $ 8 TeV with the ATLAS detector | EPJC 77 (2017) 804 | 1709.09407 |
| 4 | ATLAS Collaboration | Measurement of top quark pair differential cross-sections in the dilepton channel in $ pp $ collisions at $ \sqrt{s} = $ 7 and 8 TeV with ATLAS | PRD 94 (2016) 092003 | 1607.07281 |
| 5 | ATLAS Collaboration | Differential top-antitop cross-section measurements as a function of observables constructed from final-state particles using pp collisions at $ \sqrt{s}= $ 7 TeV in the ATLAS detector | JHEP 06 (2015) 100 | 1502.05923 |
| 6 | ATLAS Collaboration | Measurements of top quark pair relative differential cross-sections with ATLAS in $ pp $ collisions at $ \sqrt{s}= $ 7 TeV | EPJC 73 (2013) 2261 | 1207.5644 |
| 7 | CMS Collaboration | Measurement of normalized differential $ \mathrm{t}\overline{\mathrm{t}} $ cross sections in the dilepton channel from pp collisions at $ \sqrt{s}= $ 13 TeV | JHEP 04 (2018) 060 | CMS-TOP-16-007 1708.07638 |
| 8 | CMS Collaboration | Measurements of normalised multi-differential cross sections for top quark pair production in pp collisions at $ \sqrt{s}= $ 13 TeV and simultaneous determination of the strong coupling strength, top quark pole mass and parton distribution functions | Submitted to Eur. Phys. J | CMS-TOP-18-004 1904.05237 |
| 9 | CMS Collaboration | Measurements of $ \mathrm{t\overline{t}} $ differential cross sections in proton-proton collisions at $ \sqrt{s}= $ 13 TeV using events containing two leptons | JHEP 02 (2019) 149 | CMS-TOP-17-014 1811.06625 |
| 10 | CMS Collaboration | Measurement of differential cross sections for top quark pair production using the lepton+jets final state in proton-proton collisions at 13 TeV | PRD 95 (2017) 092001 | CMS-TOP-16-008 1610.04191 |
| 11 | CMS Collaboration | Measurements of differential cross sections of top quark pair production as a function of kinematic event variables in proton-proton collisions at $ \sqrt{s}= $ 13 TeV | JHEP 06 (2018) 002 | CMS-TOP-16-014 1803.03991 |
| 12 | CMS Collaboration | Measurement of double-differential cross sections for top quark pair production in pp collisions at $ \sqrt{s} = $ 8 TeV and impact on parton distribution functions | EPJC 77 (2017) 459 | CMS-TOP-14-013 1703.01630 |
| 13 | CMS Collaboration | Measurement of the differential cross section for top quark pair production in pp collisions at $ \sqrt{s} = $ 8 TeV | EPJC 75 (2015) 542 | CMS-TOP-12-028 1505.04480 |
| 14 | CMS Collaboration | Measurement of the differential cross sections for top quark pair production as a function of kinematic event variables in pp collisions at $ \sqrt{s} = $ 7 and 8 TeV | PRD 94 (2016) 052006 | CMS-TOP-12-042 1607.00837 |
| 15 | CMS Collaboration | Measurement of differential top-quark pair production cross sections in pp collisions at $ \sqrt{s}= $ 7 TeV | EPJC 73 (2013) 2339 | CMS-TOP-11-013 1211.2220 |
| 16 | CMS Collaboration | Measurement of differential cross sections for the production of top quark pairs and of additional jets in lepton+jets events from pp collisions at $ \sqrt{s} = $ 13 TeV | PRD 97 (2018) 112003 | CMS-TOP-17-002 1803.08856 |
| 17 | ATLAS Collaboration | Measurements of $ t\bar{t} $ differential cross-sections of highly boosted top quarks decaying to all-hadronic final states in $ pp $ collisions at $ \sqrt{s}= $ 13 TeV using the ATLAS detector | PRD 98 (2018) 012003 | 1801.02052 |
| 18 | ATLAS Collaboration | Measurement of the differential cross-section of highly boosted top quarks as a function of their transverse momentum in $ \sqrt{s} = $ 8 TeV proton-proton collisions using the ATLAS detector | PRD 93 (2016) 032009 | 1510.03818 |
| 19 | CMS Collaboration | Measurement of the integrated and differential $ t \bar t $ production cross sections for high-$ p_t $ top quarks in $ pp $ collisions at $ \sqrt s = $ 8 TeV | PRD 94 (2016) 072002 | CMS-TOP-14-012 1605.00116 |
| 20 | P. Nason | A new method for combining NLO QCD with shower Monte Carlo algorithms | JHEP 11 (2004) 040 | hep-ph/0409146 |
| 21 | S. Frixione, P. Nason, and G. Ridolfi | A Positive-weight next-to-leading-order Monte Carlo for heavy flavour hadroproduction | JHEP 09 (2007) 126 | 0707.3088 |
| 22 | S. Frixione, P. Nason, and C. Oleari | Matching NLO QCD computations with parton shower simulations: the POWHEG method | JHEP 11 (2007) 070 | 0709.2092 |
| 23 | S. Alioli, P. Nason, C. Oleari, and E. Re | A general framework for implementing NLO calculations in shower Monte Carlo programs: the POWHEG BOX | JHEP 06 (2010) 043 | 1002.2581 |
| 24 | S. Alioli, S. O. Moch, and P. Uwer | Hadronic top-quark pair-production with one jet and parton showering | JHEP 01 (2012) 137 | 1110.5251 |
| 25 | S. Alioli, P. Nason, C. Oleari, and E. Re | NLO single-top production matched with shower in POWHEG: $ s $- and $ t $-channel contributions | JHEP 09 (2009) 111 | 0907.4076 |
| 26 | J. Alwall et al. | The automated computation of tree-level and next-to-leading order differential cross sections, and their matching to parton shower simulations | JHEP 07 (2014) 079 | 1405.0301 |
| 27 | J. Alwall et al. | Comparative study of various algorithms for the merging of parton showers and matrix elements in hadronic collisions | EPJC 53 (2008) 473 | 0706.2569 |
| 28 | T. Sjostrand, S. Mrenna, and P. Z. Skands | PYTHIA 6.4 physics and manual | JHEP 05 (2006) 026 | hep-ph/0603175 |
| 29 | T. Sjostrand, S. Mrenna, and P. Z. Skands | A brief introduction to PYTHIA 8.1 | CPC 178 (2008) 852 | 0710.3820 |
| 30 | NNPDF Collaboration | Parton distributions for the LHC Run II | JHEP 04 (2015) 040 | 1410.8849 |
| 31 | CMS Collaboration | Event generator tunes obtained from underlying event and multiparton scattering measurements | EPJC 76 (2015) 155 | CMS-GEN-14-001 1512.00815 |
| 32 | CMS Collaboration | Investigations of the impact of the parton shower tuning in Pythia 8 in the modelling of $ \mathrm{t\overline{t}} $ at $ \sqrt{s}= $ 8 and 13 TeV | CMS-PAS-TOP-16-021 | CMS-PAS-TOP-16-021 |
| 33 | GEANT4 Collaboration | GEANT4---a simulation toolkit | NIMA 506 (2003) 250 | |
| 34 | M. Czakon and A. Mitov | Top++: A program for the calculation of the top-pair cross-section at hadron colliders | CPC 185 (2014) 2930 | 1112.5675 |
| 35 | Y. Li and F. Petriello | Combining QCD and electroweak corrections to dilepton production in the framework of the FEWZ simulation code | PRD 86 (2012) 094034 | 1208.5967 |
| 36 | N. Kidonakis | Top Quark Production | 1311.0283 | |
| 37 | M. Bahr et al. | Herwig++ Physics and Manual | EPJC 58 (2008) 639 | 0803.0883 |
| 38 | S. Gieseke, C. Rohr, and A. Siodmok | Colour reconnections in Herwig++ | EPJC 72 (2012) 2225 | 1206.0041 |
| 39 | CMS Collaboration | Particle-flow reconstruction and global event description with the cms detector | JINST 12 (2017) P10003 | CMS-PRF-14-001 1706.04965 |
| 40 | M. Cacciari, G. P. Salam, and G. Soyez | The anti-$ k_{\rm t} $ jet clustering algorithm | JHEP 04 (2008) 063 | 0802.1189 |
| 41 | M. Cacciari, G. P. Salam, and G. Soyez | FastJet user manual | EPJC 72 (2012) 1896 | 1111.6097 |
| 42 | CMS Collaboration | Jet energy scale and resolution in the CMS experiment in pp collisions at 8 TeV | JINST 12 (2017) P02014 | CMS-JME-13-004 1607.03663 |
| 43 | J. Thaler and K. Van Tilburg | Identifying boosted objects with $ N $-subjettiness | JHEP 03 (2011) 015 | 1011.2268 |
| 44 | S. Catani, Y. L. Dokshitzer, M. H. Seymour, and B. R. Webber | Longitudinally invariant $ K_t $ clustering algorithms for hadron-hadron collisions | NPB 406 (1993) 187 | |
| 45 | J. Thaler and K. Van Tilburg | Maximizing Boosted Top Identification by Minimizing $ N $-subjettiness | JHEP 02 (2012) 093 | 1108.2701 |
| 46 | M. Dasgupta, A. Fregoso, S. Marzani, and G. P. Salam | Towards an understanding of jet substructure | JHEP 09 (2013) 029 | 1307.0007 |
| 47 | J. M. Butterworth, A. R. Davison, M. Rubin, and G. P. Salam | Jet substructure as a new Higgs search channel at the LHC | PRL 100 (2008) 242001 | 0802.2470 |
| 48 | A. J. Larkoski, S. Marzani, G. Soyez, and J. Thaler | Soft drop | JHEP 05 (2014) 146 | 1402.2657 |
| 49 | Y. L. Dokshitzer, G. D. Leder, S. Moretti, and B. R. Webber | Better jet clustering algorithms | JHEP 08 (1997) 001 | hep-ph/9707323 |
| 50 | M. Wobisch and T. Wengler | Hadronization corrections to jet cross-sections in deep inelastic scattering | in Proceedings of the Workshop on Monte Carlo Generators for HERA Physics, Hamburg, Germany, p. 270 1998 | hep-ph/9907280 |
| 51 | CMS Collaboration | Identification of heavy-flavour jets with the CMS detector in pp collisions at 13 TeV | JINST 13 (2018) P05011 | CMS-BTV-16-002 1712.07158 |
| 52 | W. Verkerke and D. P. Kirkby | The RooFit toolkit for data modeling | eConf C0303241 (2003) MOLT007 | physics/0306116 |
| 53 | ATLAS Collaboration | Measurement of the Inelastic Proton-Proton Cross Section at $ \sqrt{s} = $ 13 TeV with the ATLAS Detector at the LHC | PRL 117 (2016) 182002 | 1606.02625 |
| 54 | CMS Collaboration | CMS Luminosity Measurements for the 2016 Data Taking Period | CMS-PAS-LUM-17-001 | CMS-PAS-LUM-17-001 |
| 55 | P. Skands, S. Carrazza, and J. Rojo | Tuning PYTHIA 8.1: the Monash 2013 tune | EPJC 74 (2014) 3024 | 1404.5630 |
| 56 | S. Schmitt | TUnfold: an algorithm for correcting migration effects in high energy physics | JINST 7 (2012) T10003 | 1205.6201 |
|
|
Compact Muon Solenoid LHC, CERN |
|

|

|

|

|

|