

Compact Muon Solenoid
LHC, CERN
| CMS-PAS-SUS-20-003 | ||
| Search for chargino-neutralino production in final states with a Higgs boson and a W boson | ||
| CMS Collaboration | ||
| March 2021 | ||
| Abstract: A search is presented for electroweak production of supersymmetric particles in final states with one lepton, a Higgs boson decaying to a pair of bottom quarks, and large missing transverse momentum. The search uses data from proton-proton collisions at a center-of-mass energy of 13 TeV collected with the CMS detector at the CERN LHC, corresponding to an integrated luminosity of 137 fb$^{-1}$. The observed data yields are consistent with the estimated standard model backgrounds. Exclusions are set in the context of a simplified supersymmetric model of chargino-neutralino production, with the chargino decaying to a W boson and the lightest supersymmetric particle (LSP) and the neutralino decaying to a Higgs boson plus an LSP. Charginos and neutralinos with masses up to 820 GeV are excluded at 95% confidence level when the LSP mass is small, and LSPs with mass up to 350 GeV are excluded when the mass of the chargino and neutralino is about 700 GeV. | ||
|
Links:
CDS record (PDF) ;
inSPIRE record ;
CADI line (restricted) ;
These preliminary results are superseded in this paper, Submitted to JHEP. The superseded preliminary plots can be found here. |
||
| Figures | |
png pdf |
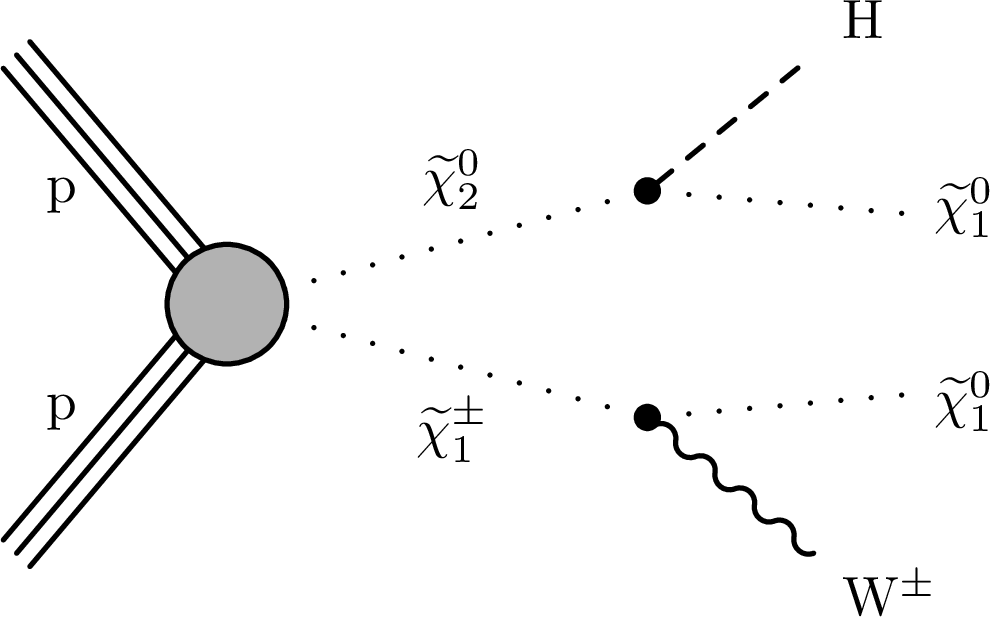
Figure 1:
Diagram for a simplified SUSY model with electroweak production of the lightest chargino $\tilde{\chi}^{\pm}_1$ and next-to-lightest neutralino $\tilde{\chi}^0_2$. The $\tilde{\chi}^{\pm}_1$ decays to a W boson and the lightest neutralino $\tilde{\chi}^0_1$. The $\tilde{\chi}^0_2$ decays to a H boson and a $\tilde{\chi}^0_1$. |
png pdf |
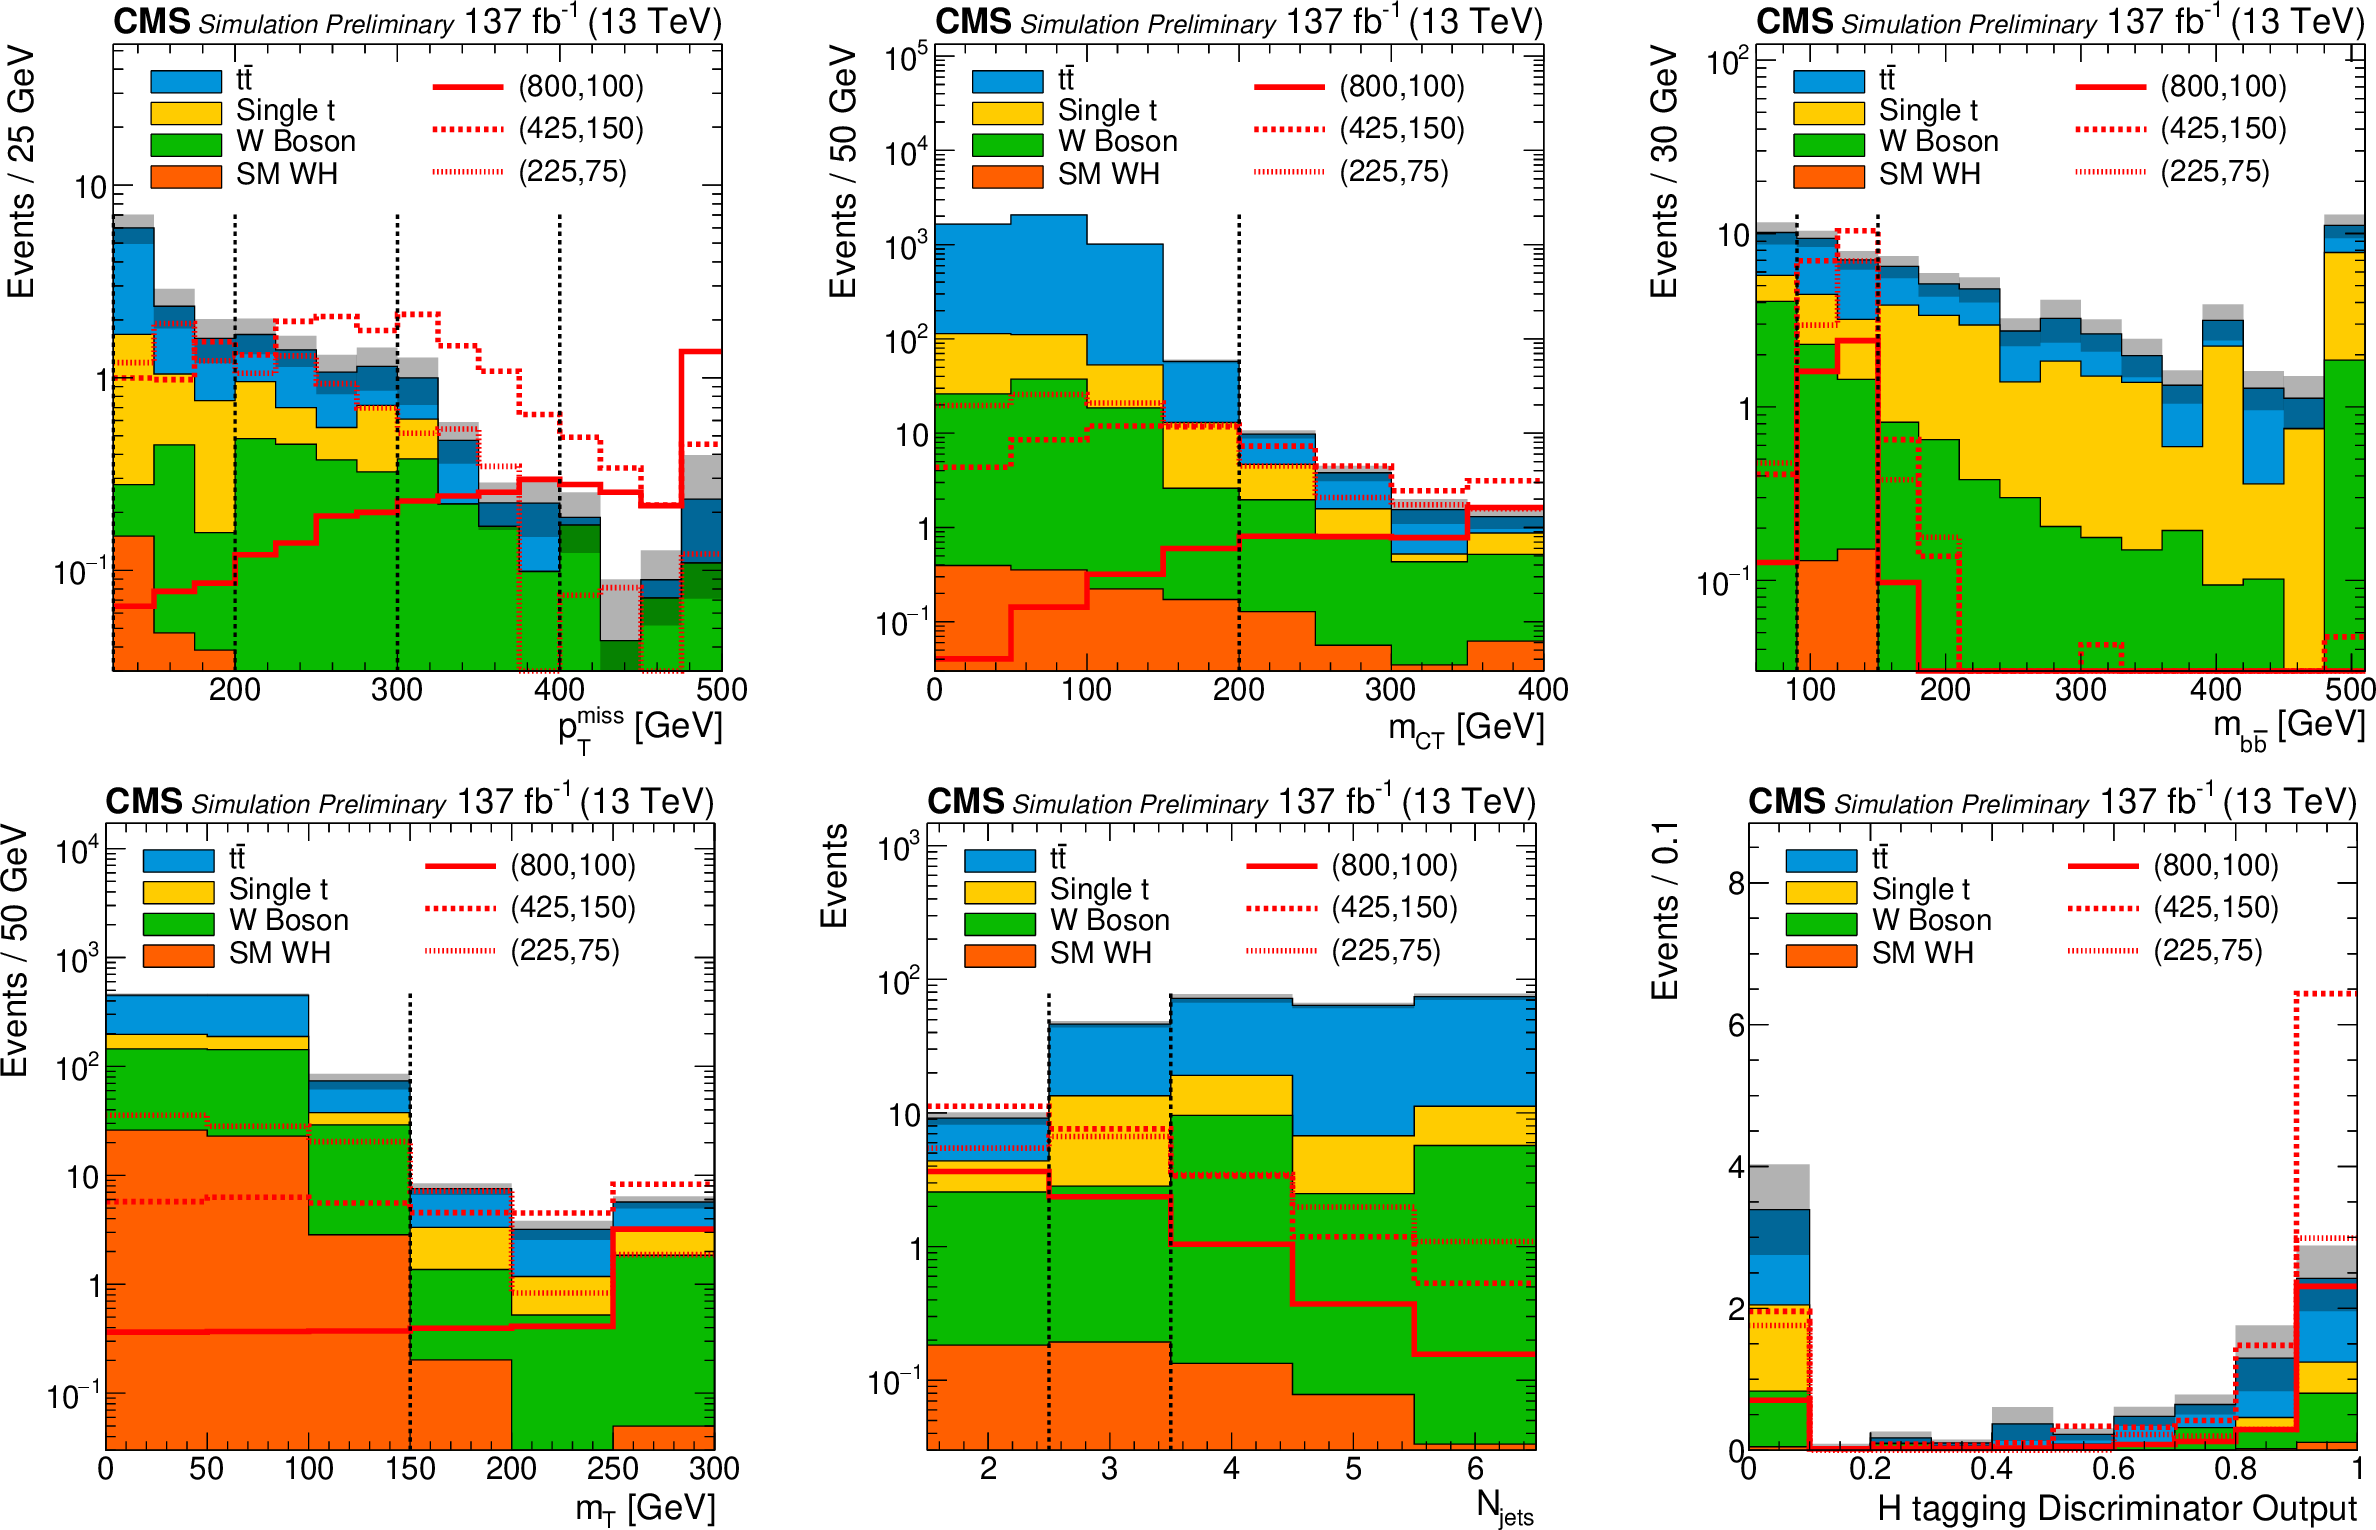
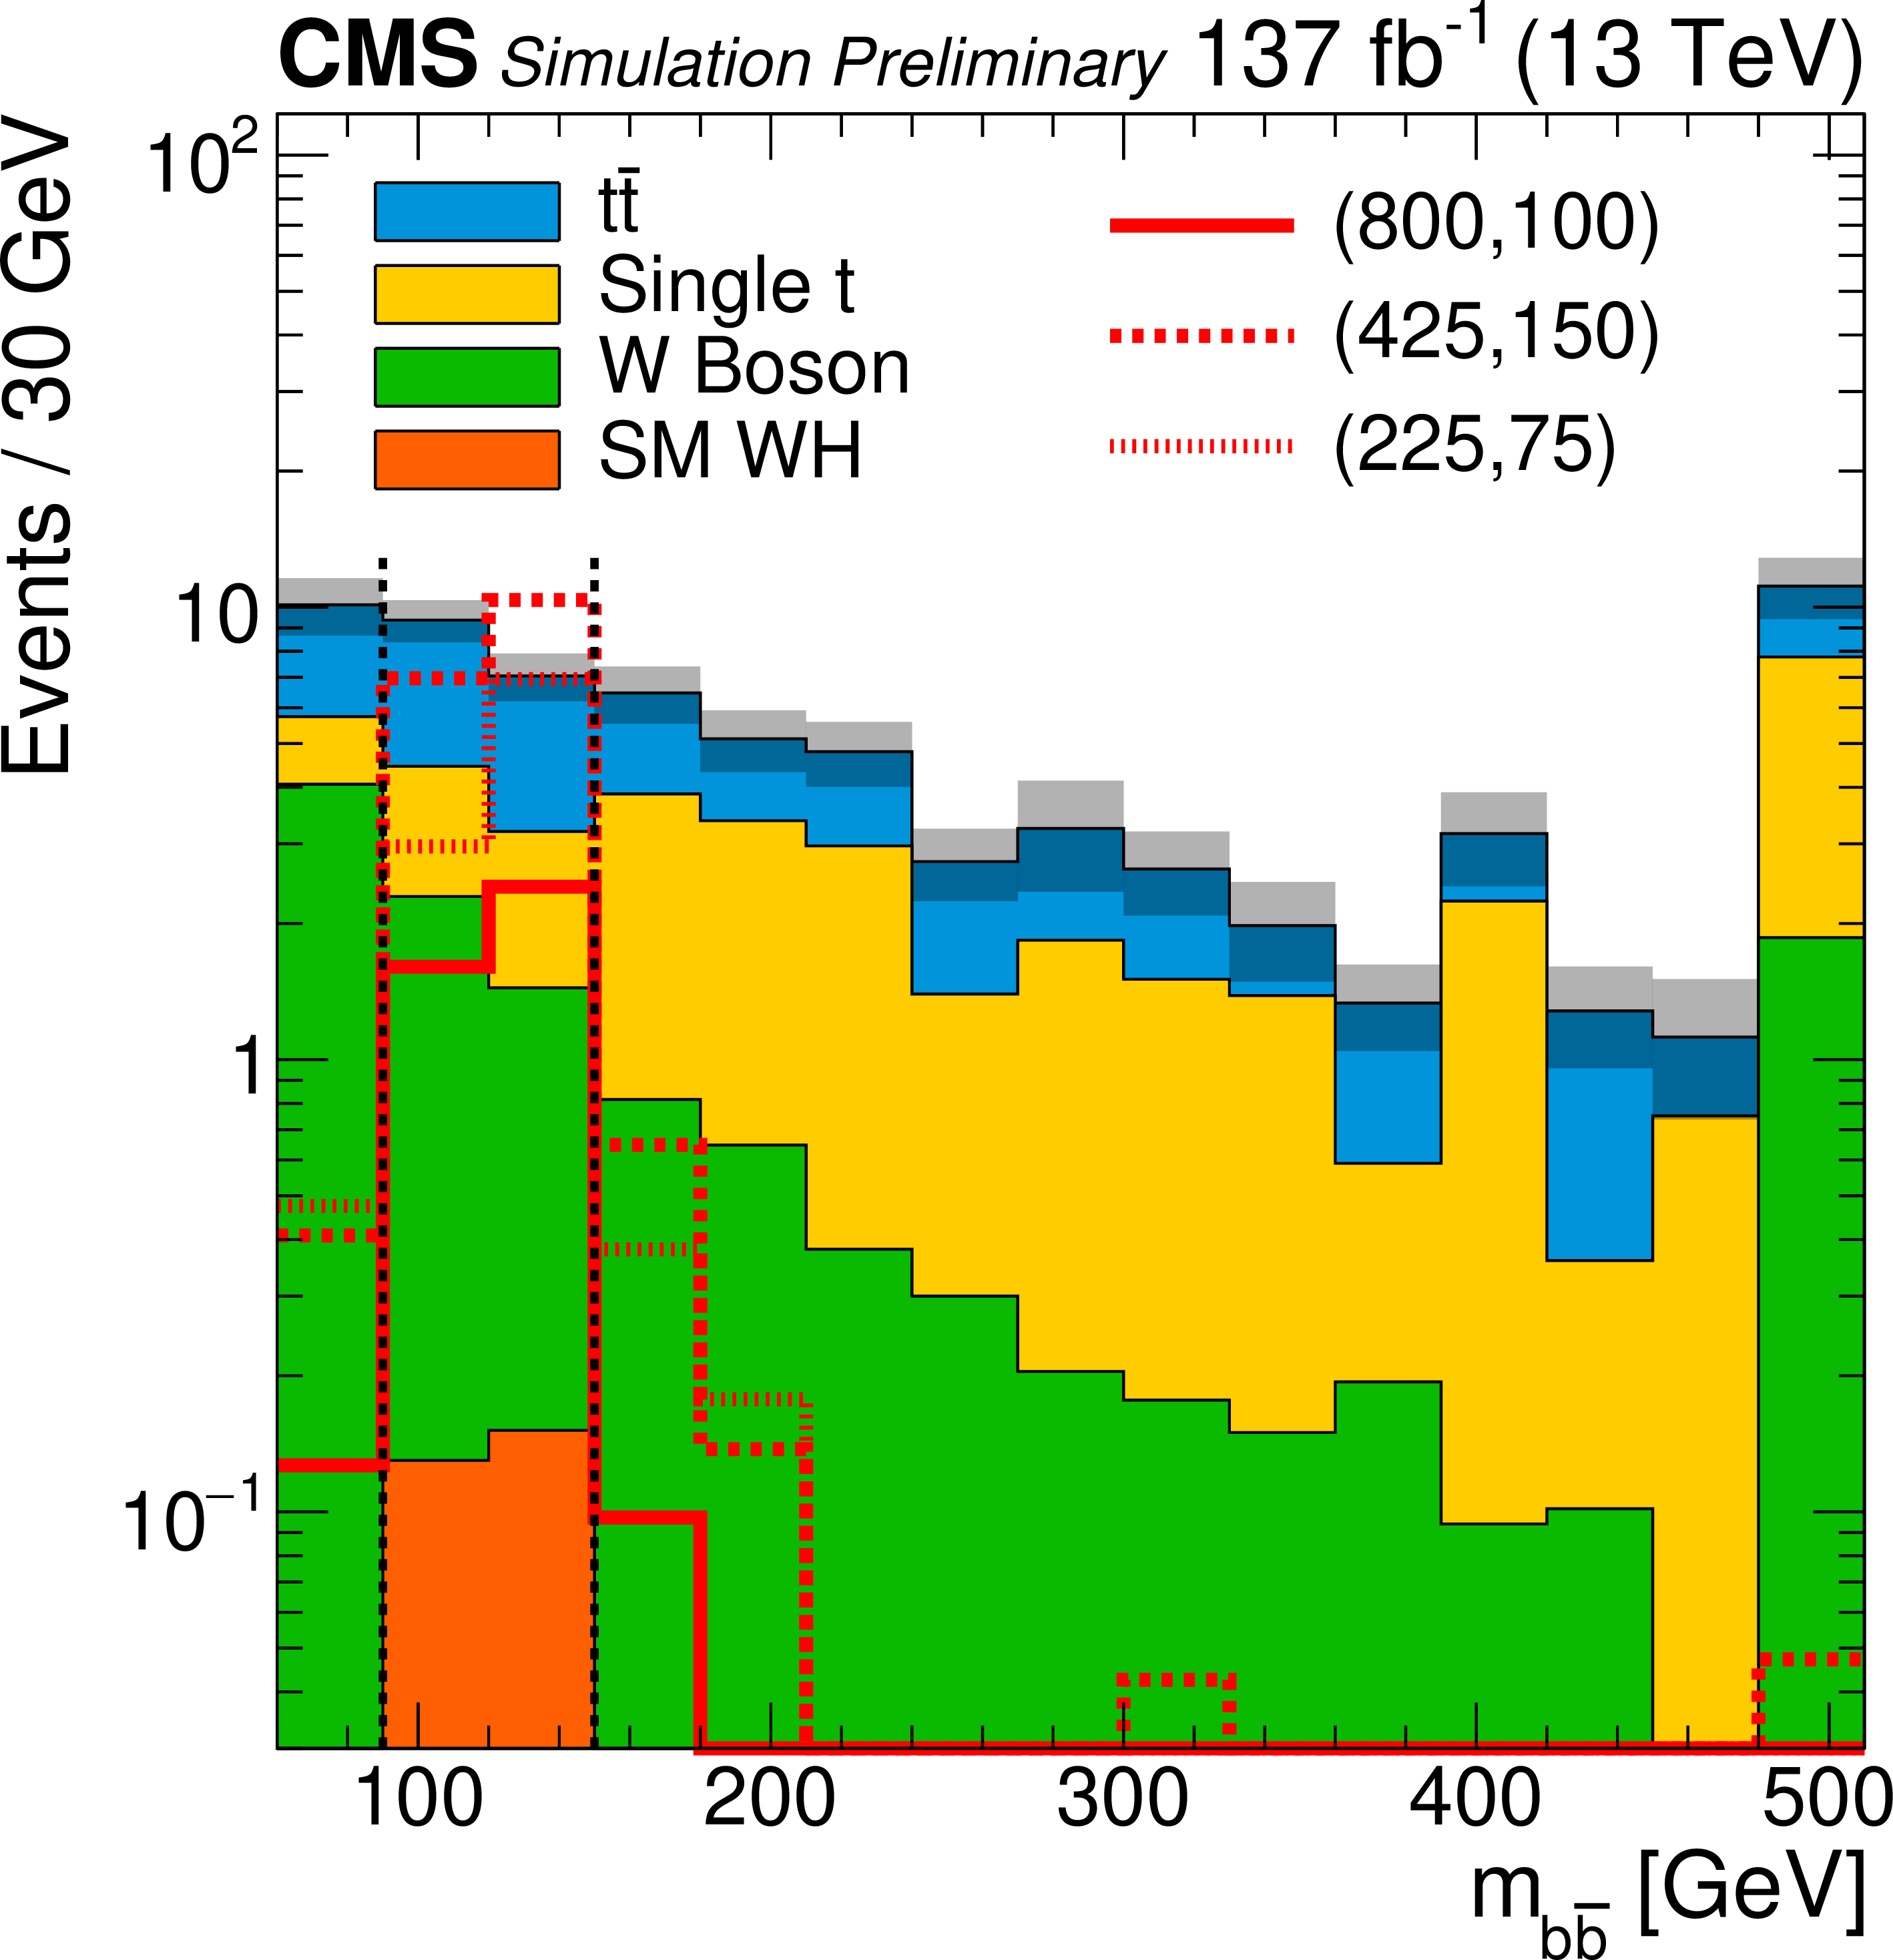
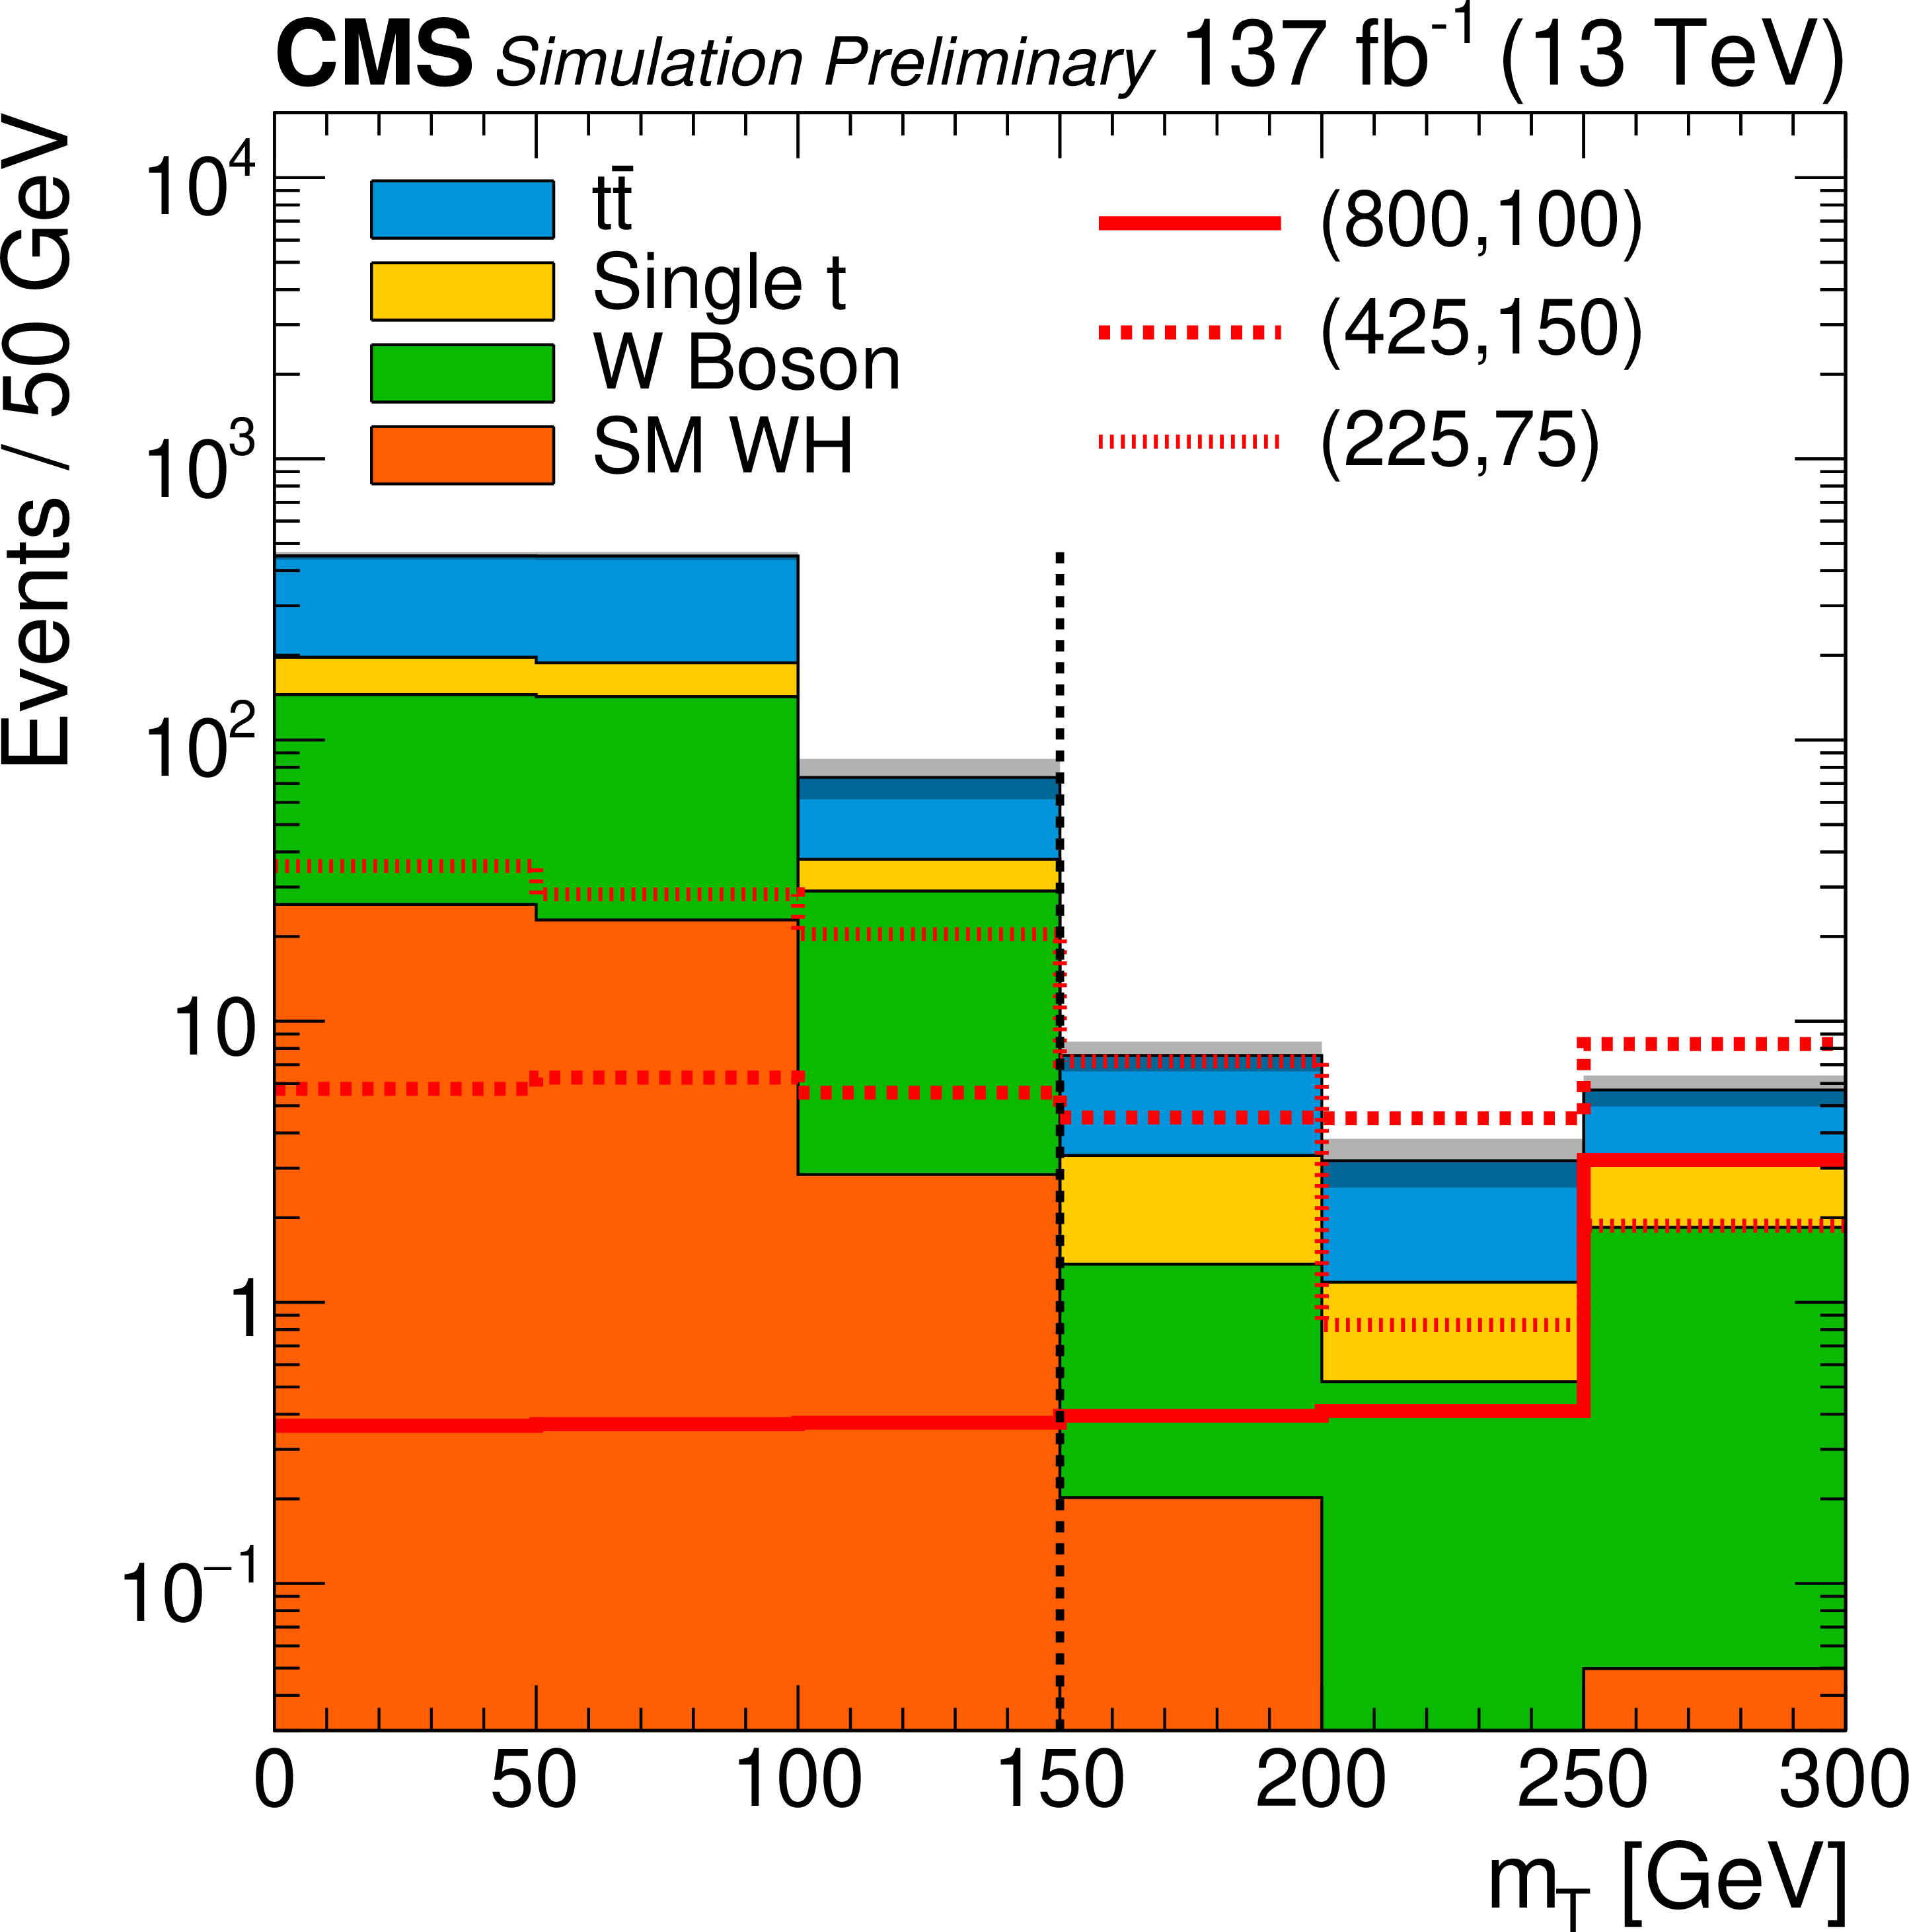
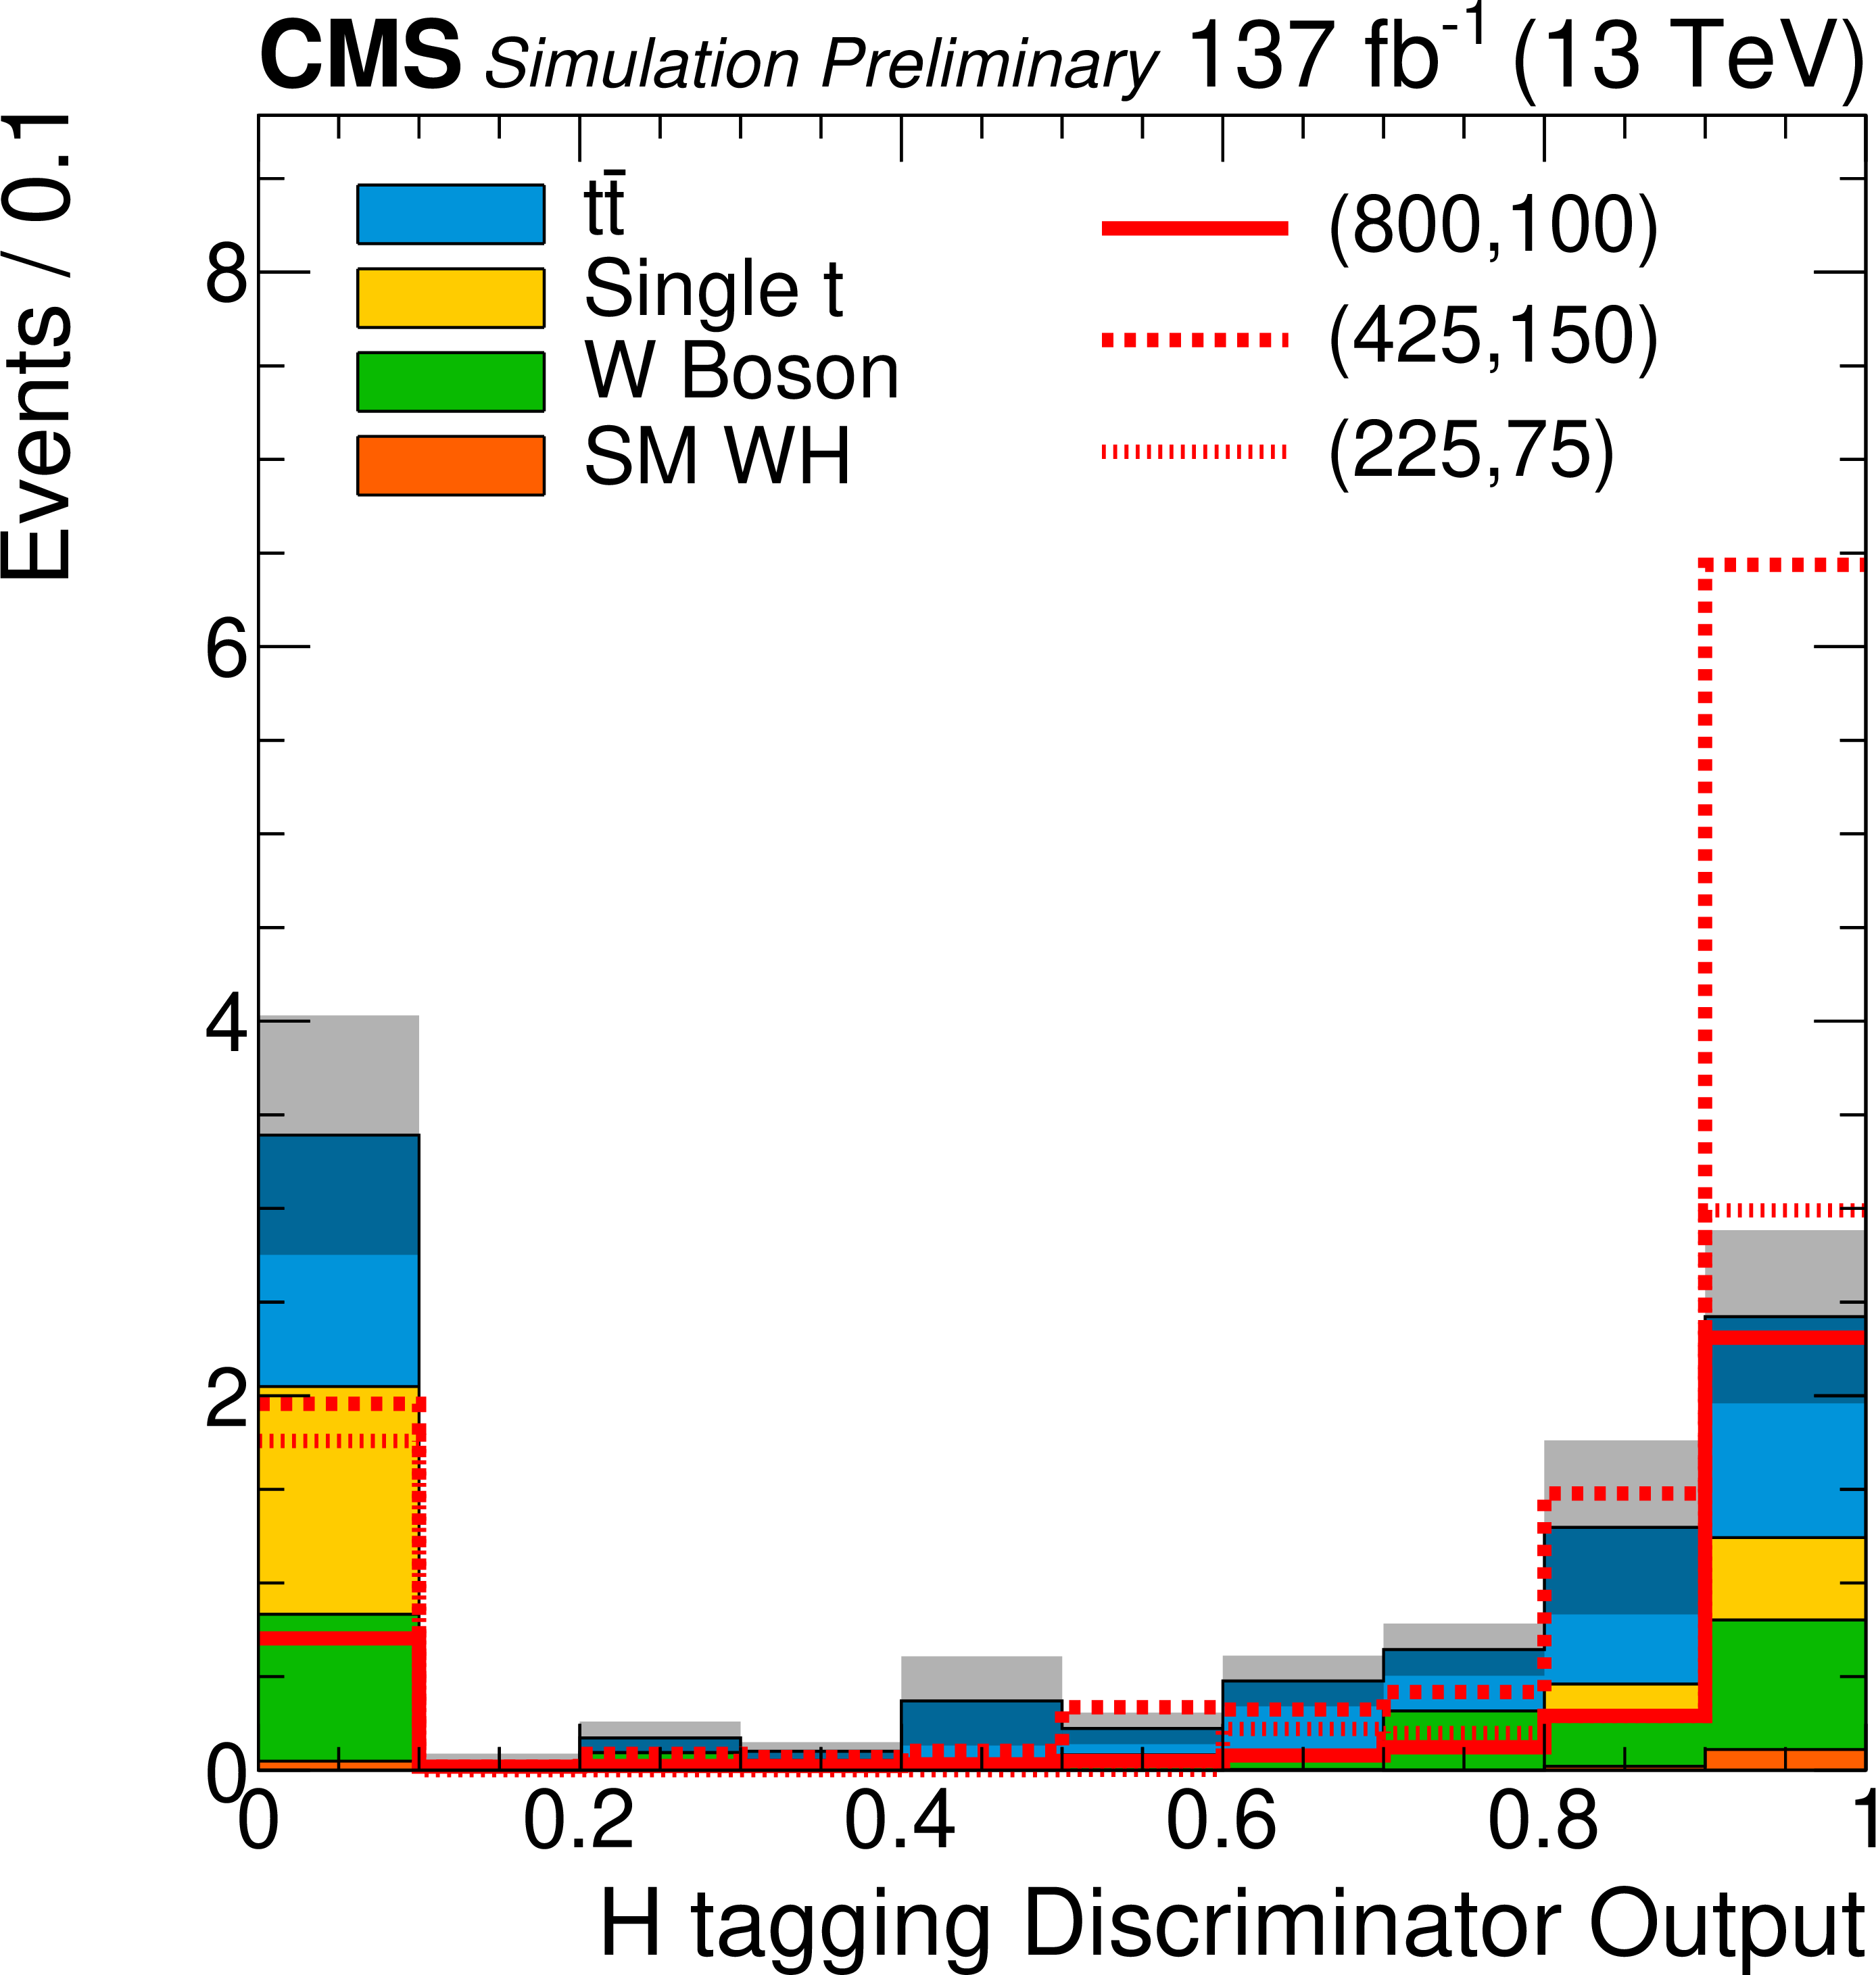
Figure 2:
Distributions of ${{p_{\mathrm {T}}} ^{\mathrm {miss}}}$, ${m_{\mathrm {CT}}}$, ${m_{\mathrm {b}\bar{\mathrm {b}}}}$, ${m_{\mathrm {T}}}$, ${N_{\mathrm {jets}}}$, and the $\mathrm{H} \to \mathrm{b} \mathrm{\bar{b}} $ large-R jet discriminator in simulated background and signal samples, illustrating the discrimination power of each variable. Three benchmark signal points corresponding to masses in GeV ($m_{ \tilde{\chi}^0_2 /\tilde{\chi}^{\pm}_1}$, $m_{\tilde{\chi}^0_1}$) of (800, 100), (425, 150) and (225, 75) are shown as solid, dashed and short dashed lines, respectively. Events are taken from the 2-jet signal regions with $ {{p_{\mathrm {T}}} ^\text {miss}} > $ 125 GeV, with all the requirements specified in Table 3 except for the plotted variable. The gray bands correspond to the statistical uncertainty of the simulated backgrounds. The dashed vertical lines indicate the thresholds used to define the signal regions. These indicators are not shown on the Higgs tag discriminator score distribution because the required values vary between 0.83 and 0.9 from year to year. |
png pdf |
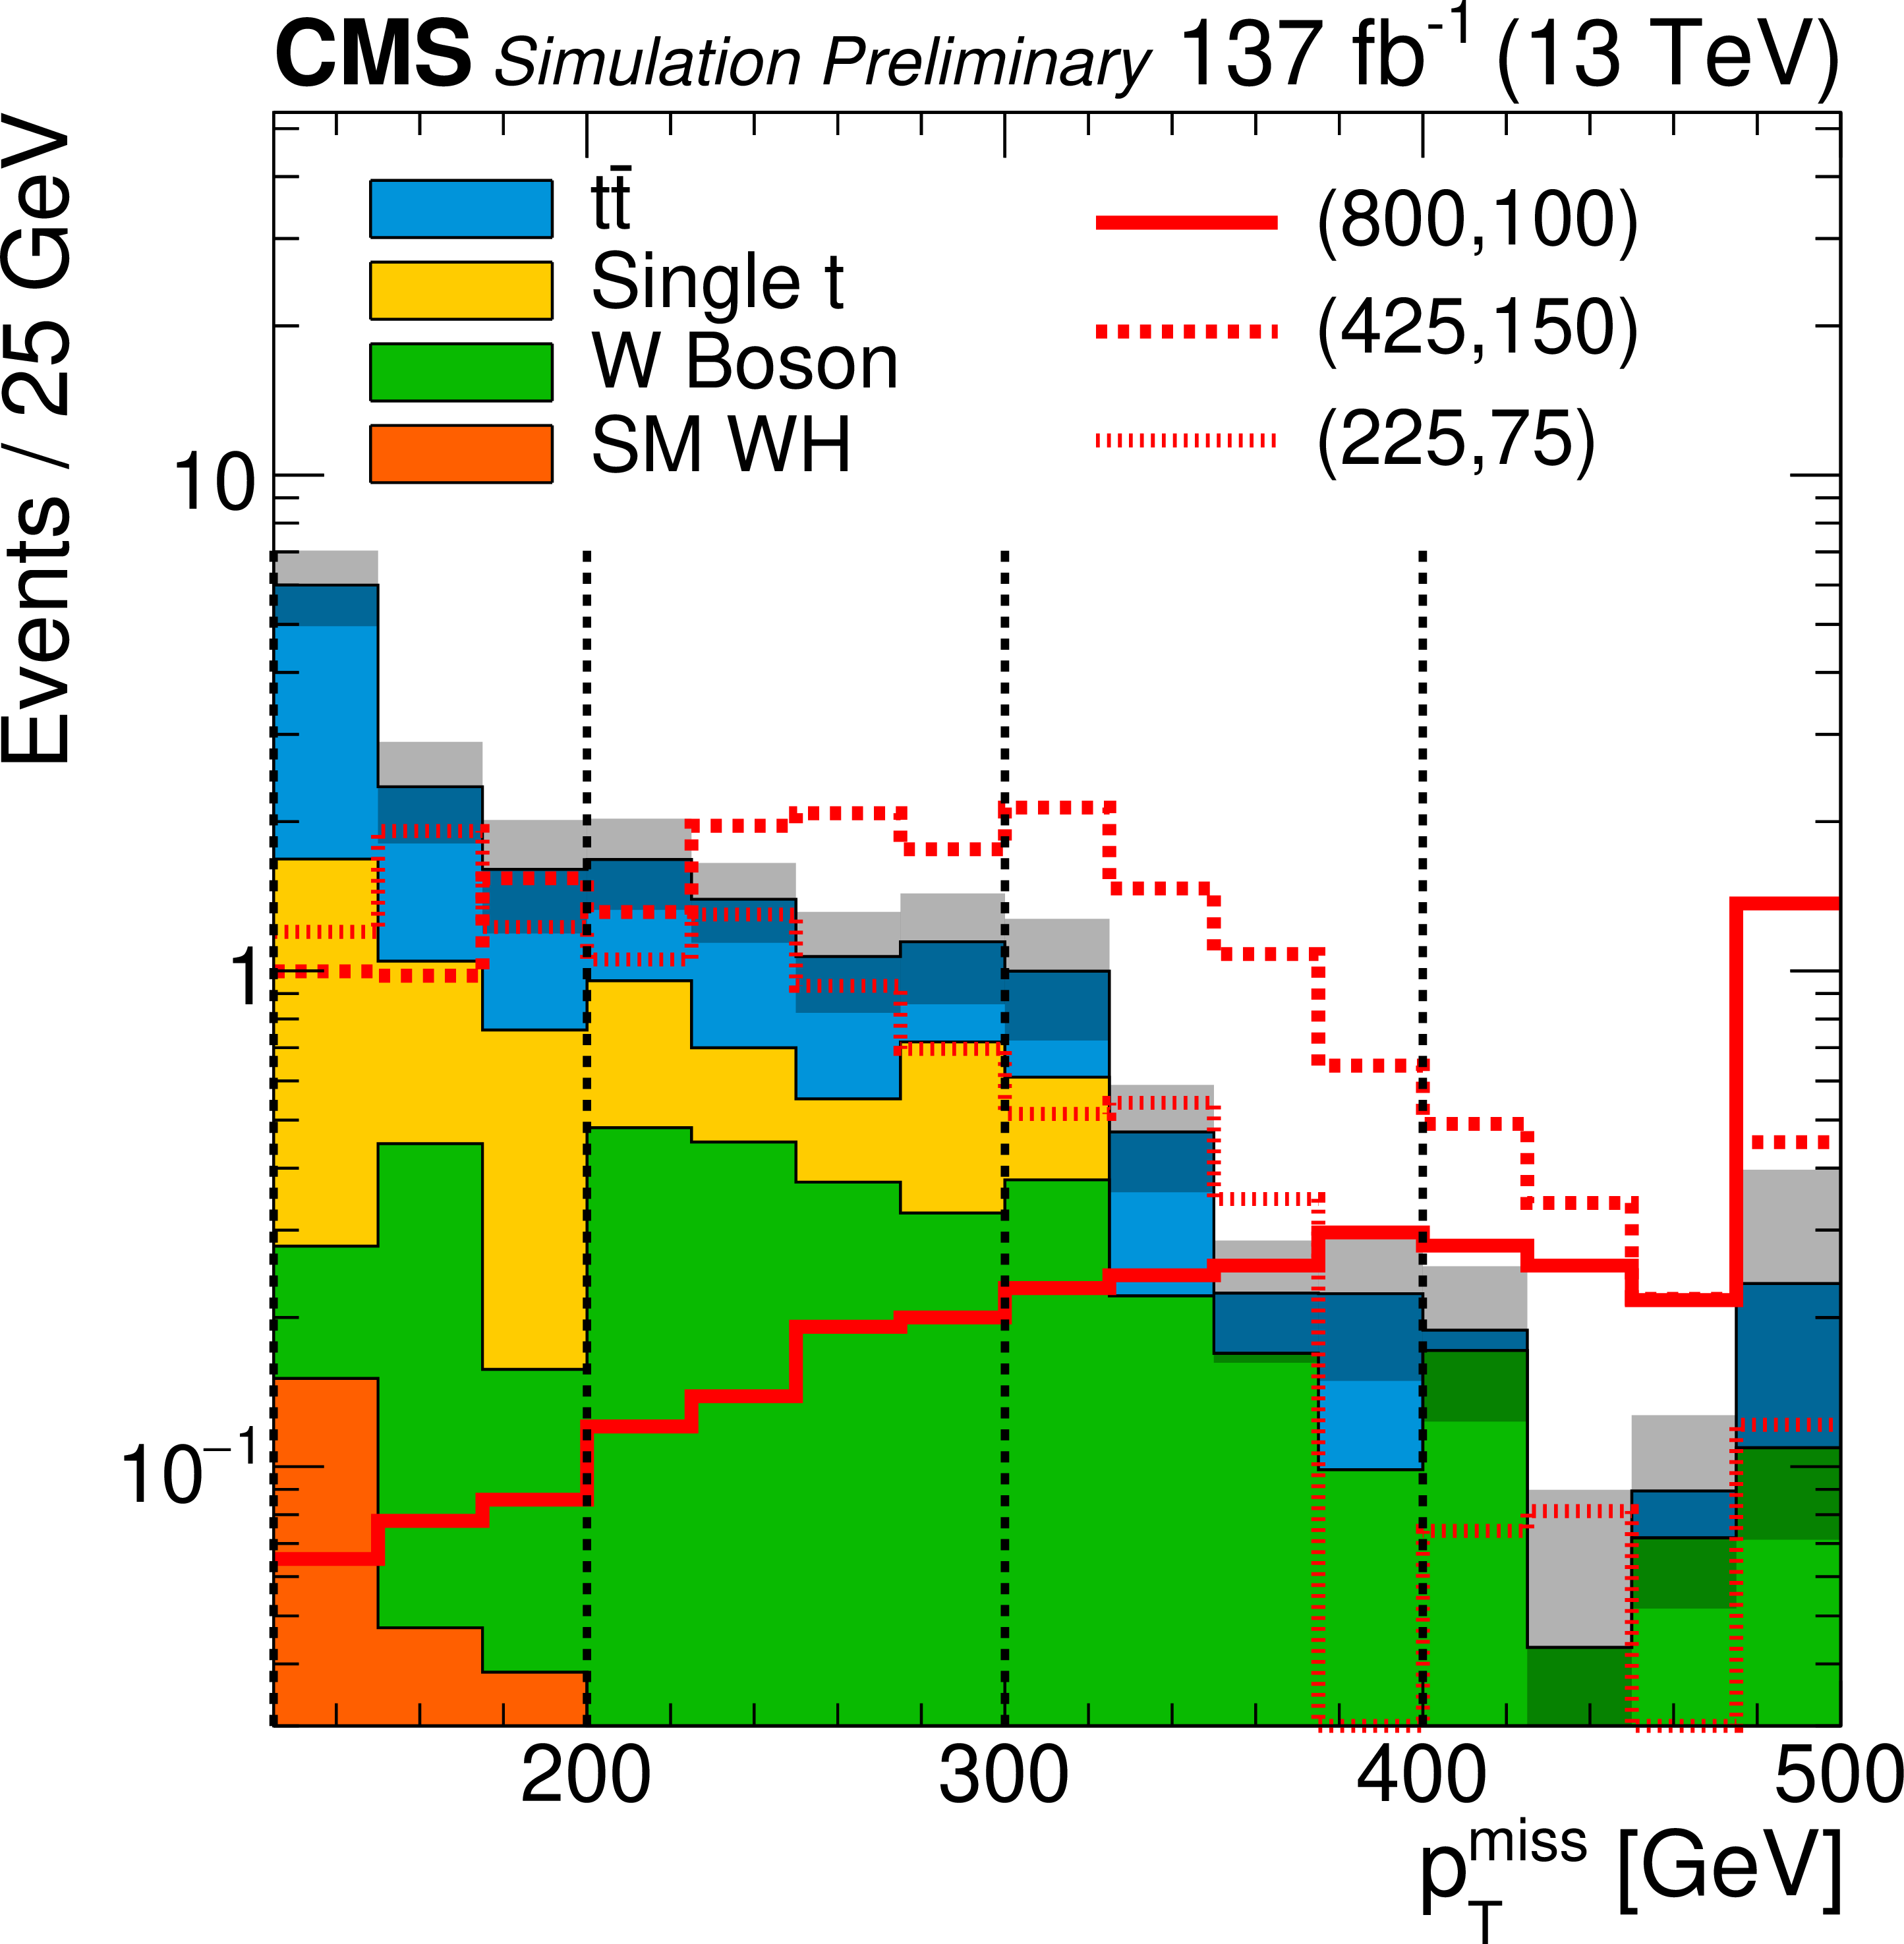
Figure 2-a:
Distributions of ${{p_{\mathrm {T}}} ^{\mathrm {miss}}}$, ${m_{\mathrm {CT}}}$, ${m_{\mathrm {b}\bar{\mathrm {b}}}}$, ${m_{\mathrm {T}}}$, ${N_{\mathrm {jets}}}$, and the $\mathrm{H} \to \mathrm{b} \mathrm{\bar{b}} $ large-R jet discriminator in simulated background and signal samples, illustrating the discrimination power of each variable. Three benchmark signal points corresponding to masses in GeV ($m_{ \tilde{\chi}^0_2 /\tilde{\chi}^{\pm}_1}$, $m_{\tilde{\chi}^0_1}$) of (800, 100), (425, 150) and (225, 75) are shown as solid, dashed and short dashed lines, respectively. Events are taken from the 2-jet signal regions with $ {{p_{\mathrm {T}}} ^\text {miss}} > $ 125 GeV, with all the requirements specified in Table 3 except for the plotted variable. The gray bands correspond to the statistical uncertainty of the simulated backgrounds. The dashed vertical lines indicate the thresholds used to define the signal regions. These indicators are not shown on the Higgs tag discriminator score distribution because the required values vary between 0.83 and 0.9 from year to year. |
png pdf |
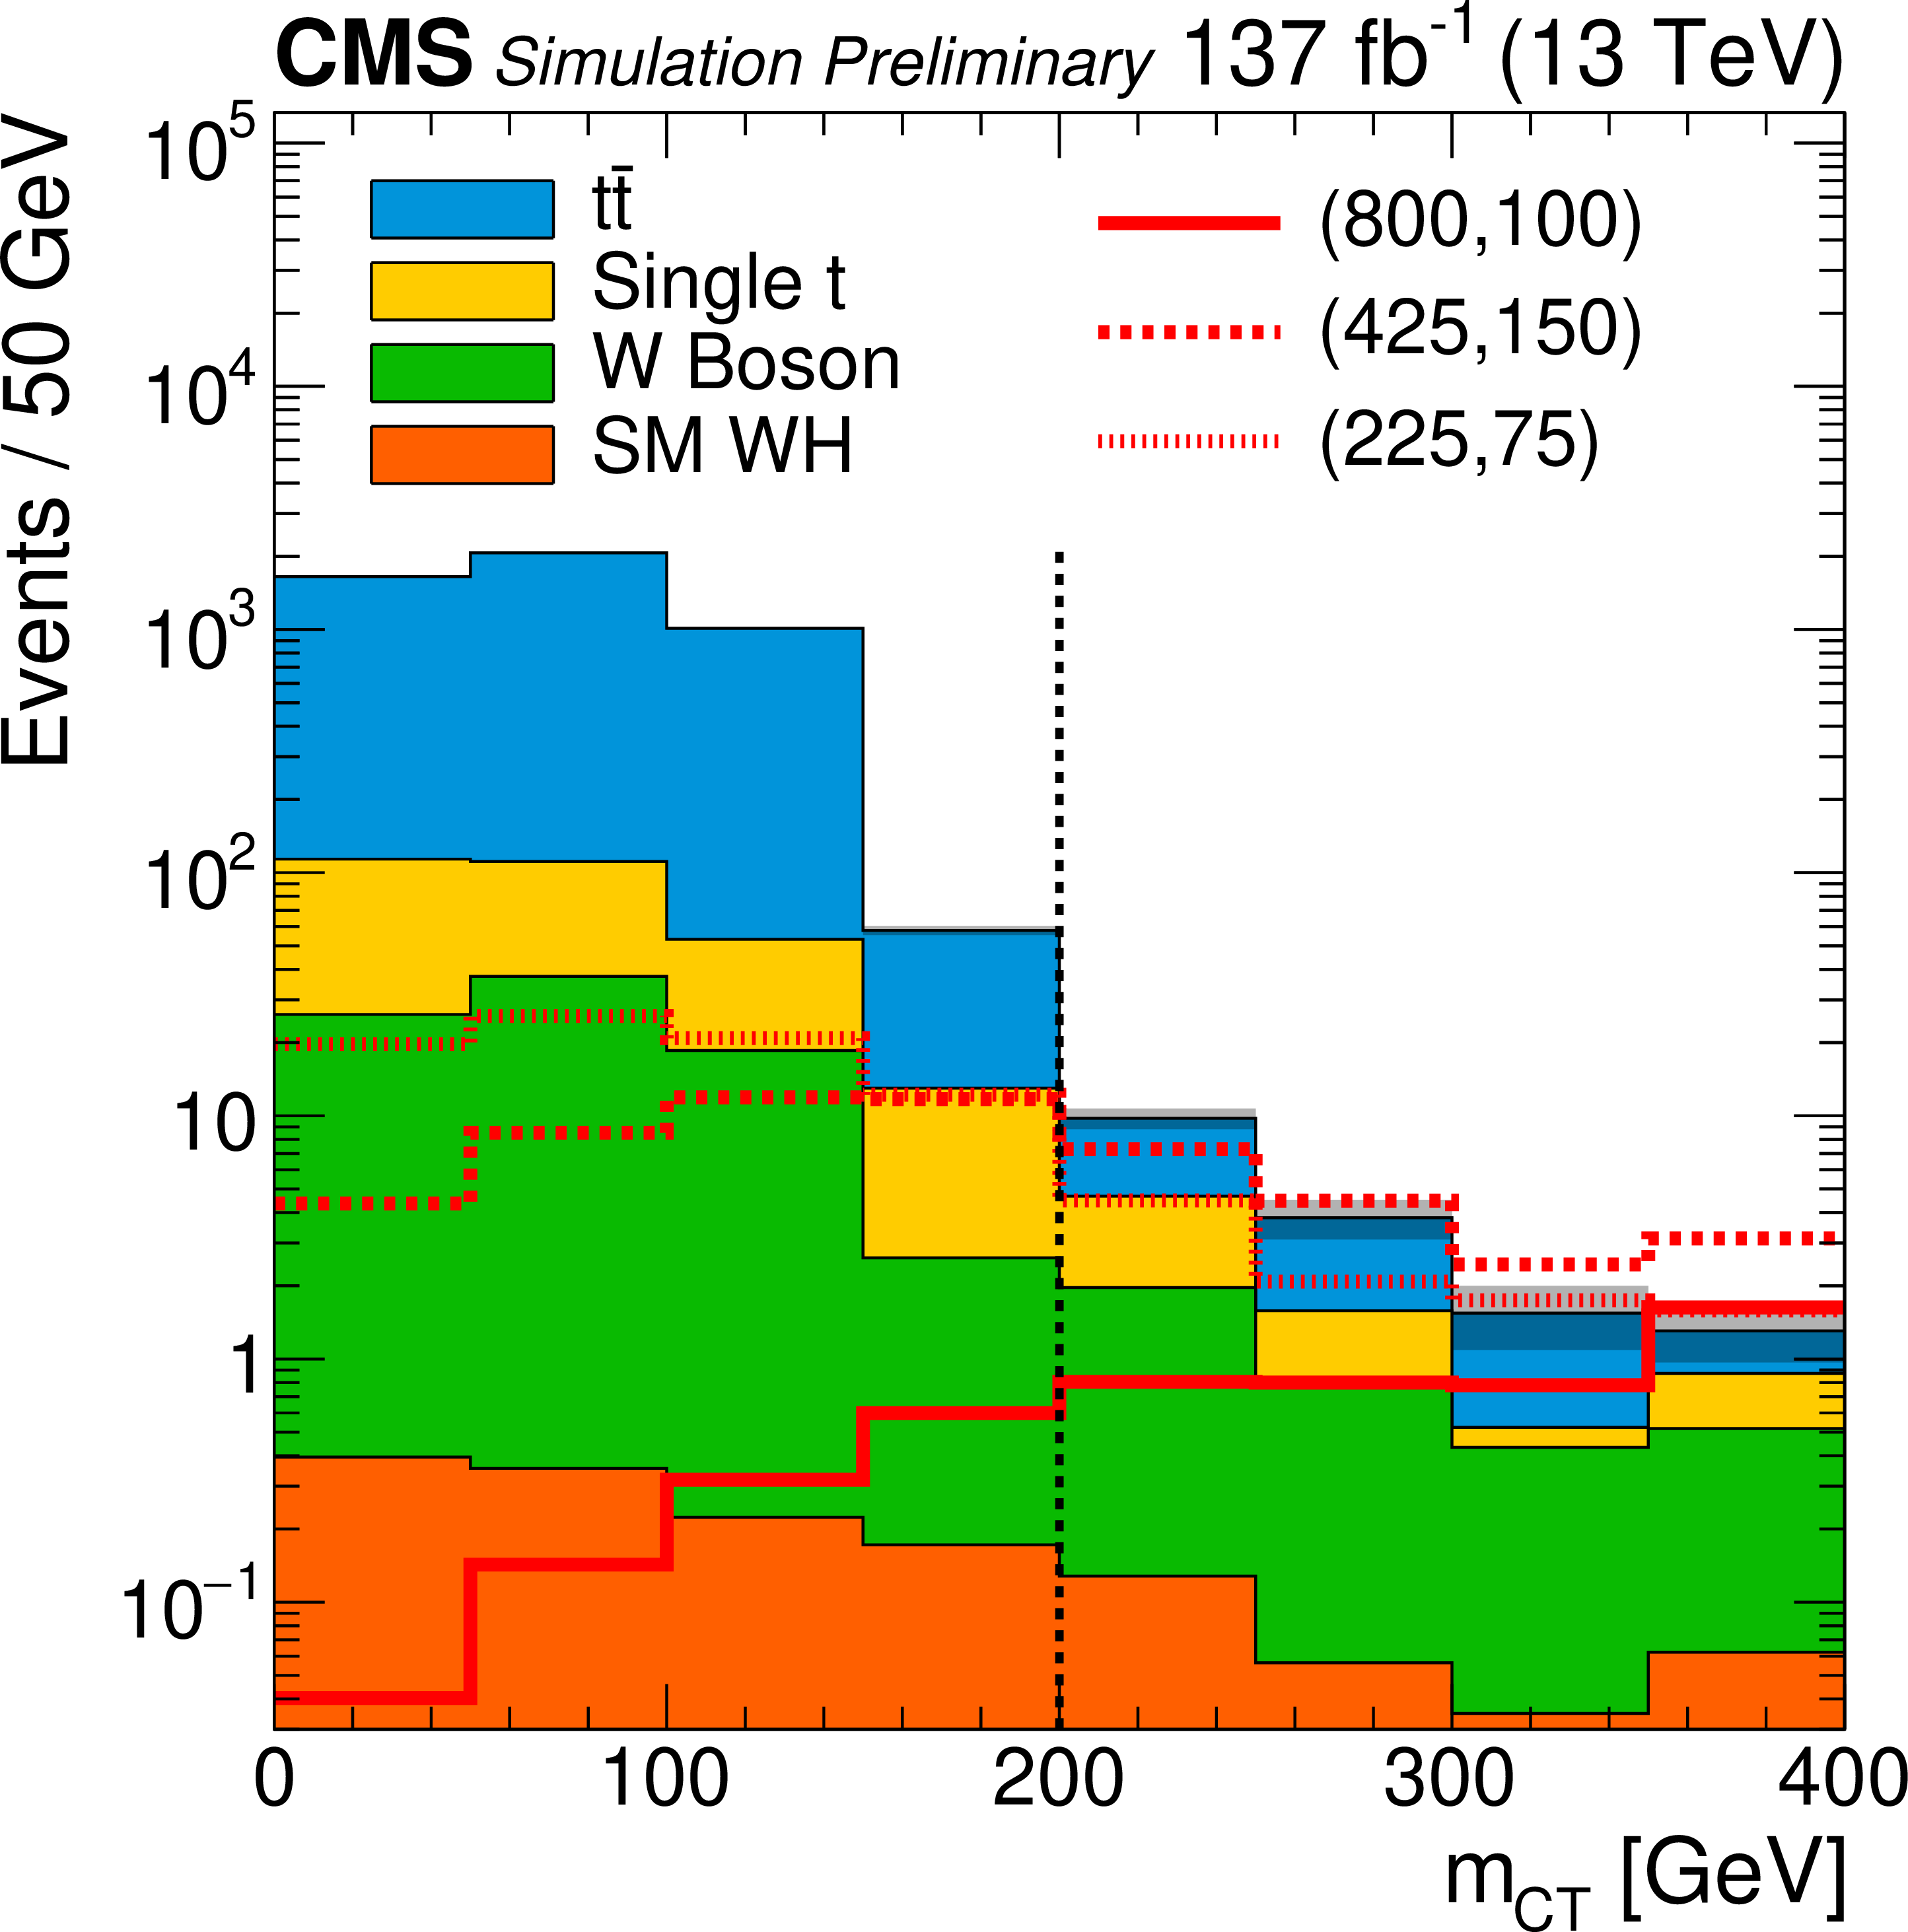
Figure 2-b:
Distributions of ${{p_{\mathrm {T}}} ^{\mathrm {miss}}}$, ${m_{\mathrm {CT}}}$, ${m_{\mathrm {b}\bar{\mathrm {b}}}}$, ${m_{\mathrm {T}}}$, ${N_{\mathrm {jets}}}$, and the $\mathrm{H} \to \mathrm{b} \mathrm{\bar{b}} $ large-R jet discriminator in simulated background and signal samples, illustrating the discrimination power of each variable. Three benchmark signal points corresponding to masses in GeV ($m_{ \tilde{\chi}^0_2 /\tilde{\chi}^{\pm}_1}$, $m_{\tilde{\chi}^0_1}$) of (800, 100), (425, 150) and (225, 75) are shown as solid, dashed and short dashed lines, respectively. Events are taken from the 2-jet signal regions with $ {{p_{\mathrm {T}}} ^\text {miss}} > $ 125 GeV, with all the requirements specified in Table 3 except for the plotted variable. The gray bands correspond to the statistical uncertainty of the simulated backgrounds. The dashed vertical lines indicate the thresholds used to define the signal regions. These indicators are not shown on the Higgs tag discriminator score distribution because the required values vary between 0.83 and 0.9 from year to year. |
png pdf |
Figure 2-c:
Distributions of ${{p_{\mathrm {T}}} ^{\mathrm {miss}}}$, ${m_{\mathrm {CT}}}$, ${m_{\mathrm {b}\bar{\mathrm {b}}}}$, ${m_{\mathrm {T}}}$, ${N_{\mathrm {jets}}}$, and the $\mathrm{H} \to \mathrm{b} \mathrm{\bar{b}} $ large-R jet discriminator in simulated background and signal samples, illustrating the discrimination power of each variable. Three benchmark signal points corresponding to masses in GeV ($m_{ \tilde{\chi}^0_2 /\tilde{\chi}^{\pm}_1}$, $m_{\tilde{\chi}^0_1}$) of (800, 100), (425, 150) and (225, 75) are shown as solid, dashed and short dashed lines, respectively. Events are taken from the 2-jet signal regions with $ {{p_{\mathrm {T}}} ^\text {miss}} > $ 125 GeV, with all the requirements specified in Table 3 except for the plotted variable. The gray bands correspond to the statistical uncertainty of the simulated backgrounds. The dashed vertical lines indicate the thresholds used to define the signal regions. These indicators are not shown on the Higgs tag discriminator score distribution because the required values vary between 0.83 and 0.9 from year to year. |
png pdf |
Figure 2-d:
Distributions of ${{p_{\mathrm {T}}} ^{\mathrm {miss}}}$, ${m_{\mathrm {CT}}}$, ${m_{\mathrm {b}\bar{\mathrm {b}}}}$, ${m_{\mathrm {T}}}$, ${N_{\mathrm {jets}}}$, and the $\mathrm{H} \to \mathrm{b} \mathrm{\bar{b}} $ large-R jet discriminator in simulated background and signal samples, illustrating the discrimination power of each variable. Three benchmark signal points corresponding to masses in GeV ($m_{ \tilde{\chi}^0_2 /\tilde{\chi}^{\pm}_1}$, $m_{\tilde{\chi}^0_1}$) of (800, 100), (425, 150) and (225, 75) are shown as solid, dashed and short dashed lines, respectively. Events are taken from the 2-jet signal regions with $ {{p_{\mathrm {T}}} ^\text {miss}} > $ 125 GeV, with all the requirements specified in Table 3 except for the plotted variable. The gray bands correspond to the statistical uncertainty of the simulated backgrounds. The dashed vertical lines indicate the thresholds used to define the signal regions. These indicators are not shown on the Higgs tag discriminator score distribution because the required values vary between 0.83 and 0.9 from year to year. |

png pdf |
Figure 2-e:
Distributions of ${{p_{\mathrm {T}}} ^{\mathrm {miss}}}$, ${m_{\mathrm {CT}}}$, ${m_{\mathrm {b}\bar{\mathrm {b}}}}$, ${m_{\mathrm {T}}}$, ${N_{\mathrm {jets}}}$, and the $\mathrm{H} \to \mathrm{b} \mathrm{\bar{b}} $ large-R jet discriminator in simulated background and signal samples, illustrating the discrimination power of each variable. Three benchmark signal points corresponding to masses in GeV ($m_{ \tilde{\chi}^0_2 /\tilde{\chi}^{\pm}_1}$, $m_{\tilde{\chi}^0_1}$) of (800, 100), (425, 150) and (225, 75) are shown as solid, dashed and short dashed lines, respectively. Events are taken from the 2-jet signal regions with $ {{p_{\mathrm {T}}} ^\text {miss}} > $ 125 GeV, with all the requirements specified in Table 3 except for the plotted variable. The gray bands correspond to the statistical uncertainty of the simulated backgrounds. The dashed vertical lines indicate the thresholds used to define the signal regions. These indicators are not shown on the Higgs tag discriminator score distribution because the required values vary between 0.83 and 0.9 from year to year. |
png pdf |
Figure 2-f:
Distributions of ${{p_{\mathrm {T}}} ^{\mathrm {miss}}}$, ${m_{\mathrm {CT}}}$, ${m_{\mathrm {b}\bar{\mathrm {b}}}}$, ${m_{\mathrm {T}}}$, ${N_{\mathrm {jets}}}$, and the $\mathrm{H} \to \mathrm{b} \mathrm{\bar{b}} $ large-R jet discriminator in simulated background and signal samples, illustrating the discrimination power of each variable. Three benchmark signal points corresponding to masses in GeV ($m_{ \tilde{\chi}^0_2 /\tilde{\chi}^{\pm}_1}$, $m_{\tilde{\chi}^0_1}$) of (800, 100), (425, 150) and (225, 75) are shown as solid, dashed and short dashed lines, respectively. Events are taken from the 2-jet signal regions with $ {{p_{\mathrm {T}}} ^\text {miss}} > $ 125 GeV, with all the requirements specified in Table 3 except for the plotted variable. The gray bands correspond to the statistical uncertainty of the simulated backgrounds. The dashed vertical lines indicate the thresholds used to define the signal regions. These indicators are not shown on the Higgs tag discriminator score distribution because the required values vary between 0.83 and 0.9 from year to year. |
png pdf |
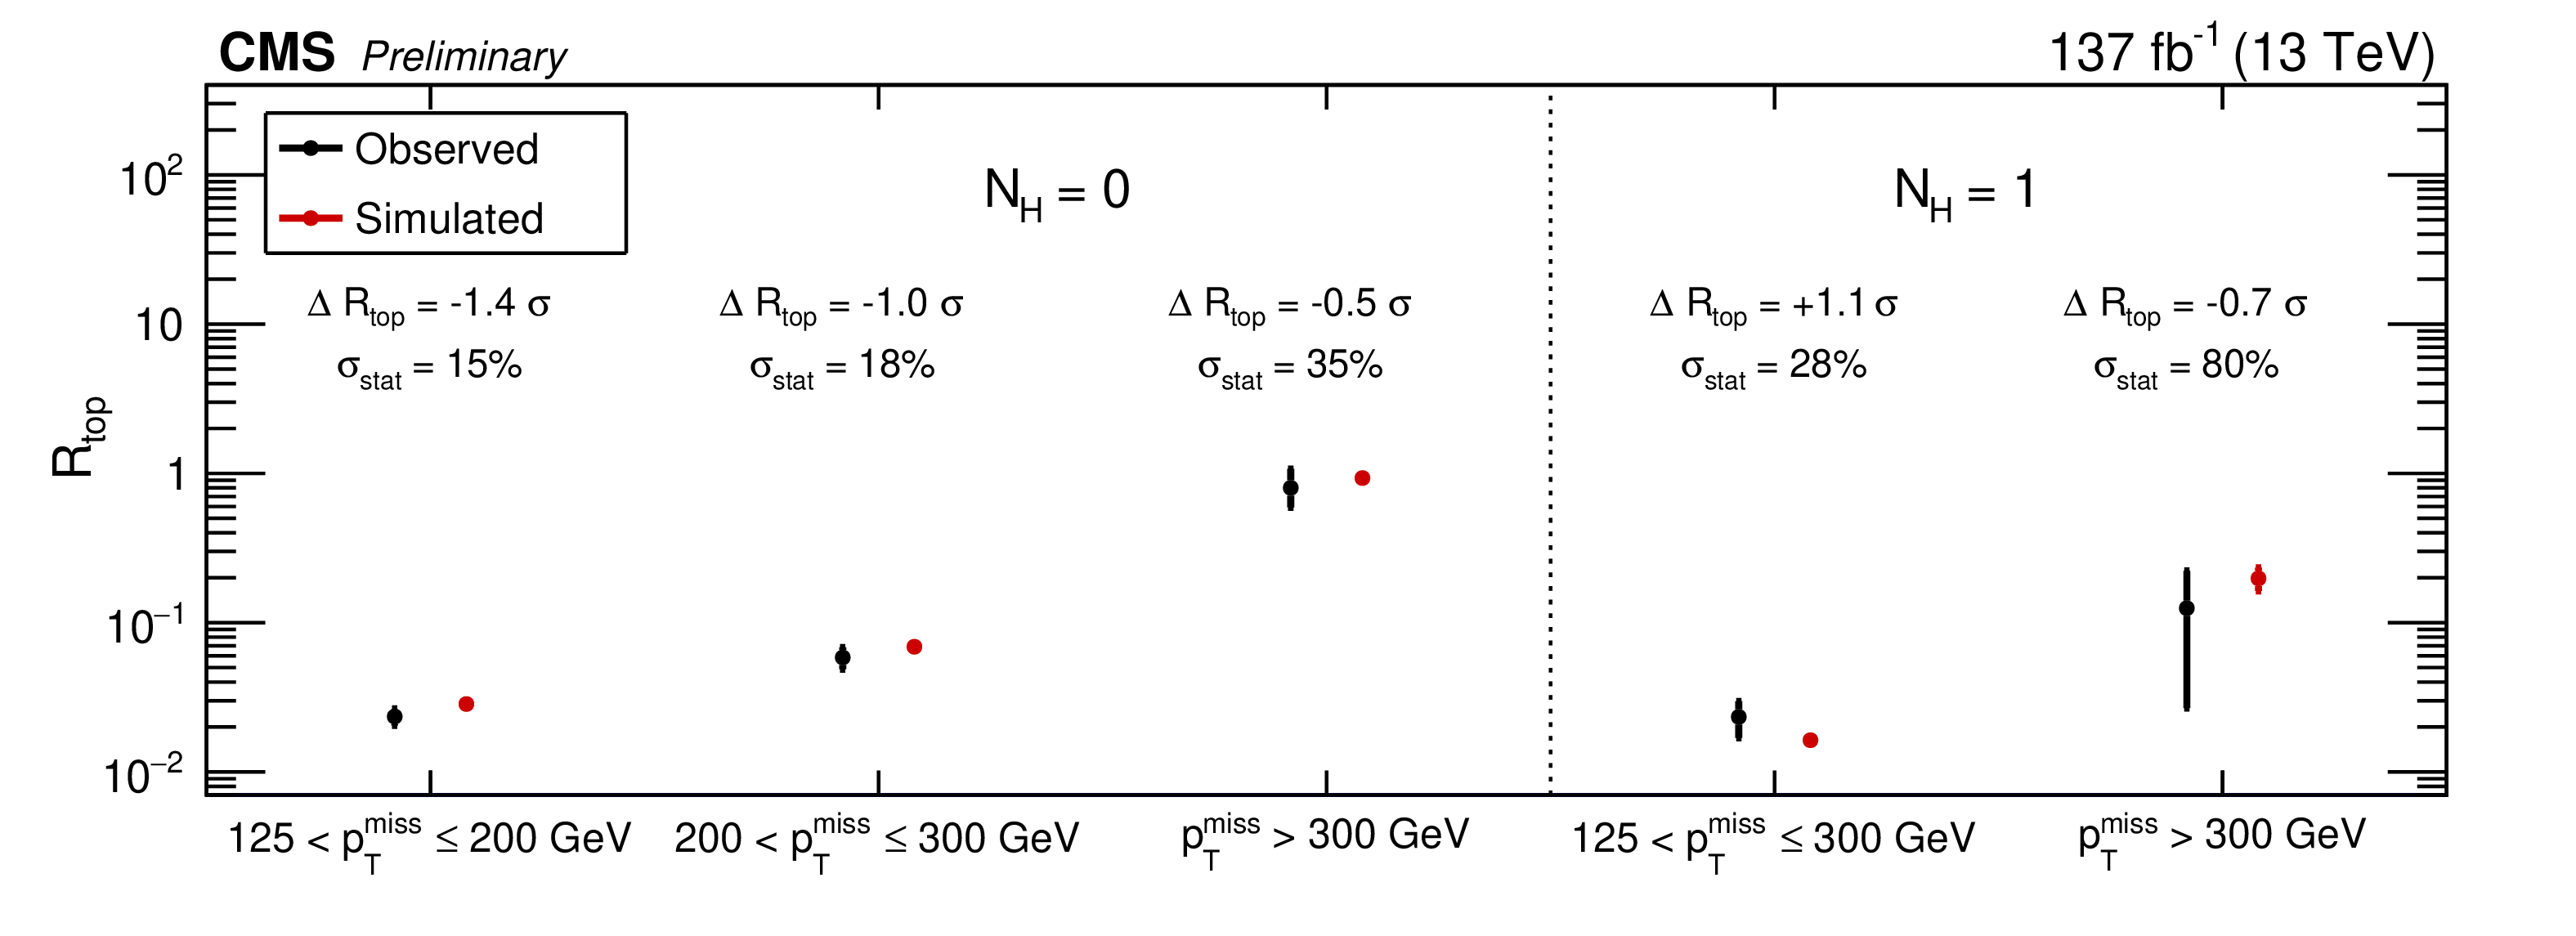
Figure 3:
Comparison of the observed and simulated ${R_{\mathrm {top}}}$ values in the $ {m_{\mathrm {b}\bar{\mathrm {b}}}} > $ 150 GeV validation regions. The pulls of the ${R_{\mathrm {top}}}$ values are shown (the difference of the observed and simulated values, divided by the total statistical uncertainty) as well as the statistical precision of the comparisons, which are assigned as a systematic uncertainty in ${R_{\mathrm {top}}}$ for the corresponding bins in the signal region. |

png pdf |
Figure 4:
Distribution of ${N_{\mathrm{b}}}$ in the low ${m_{\mathrm {T}}}$ control sample. The ${\mathrm{t} {}\mathrm{\bar{t}}} $+jets contribution is suppressed by requiring $ {m_{\mathrm {CT}}} > $ 200 GeV. The shaded area reflects the statistical uncertainty in the simulation. |
png pdf |
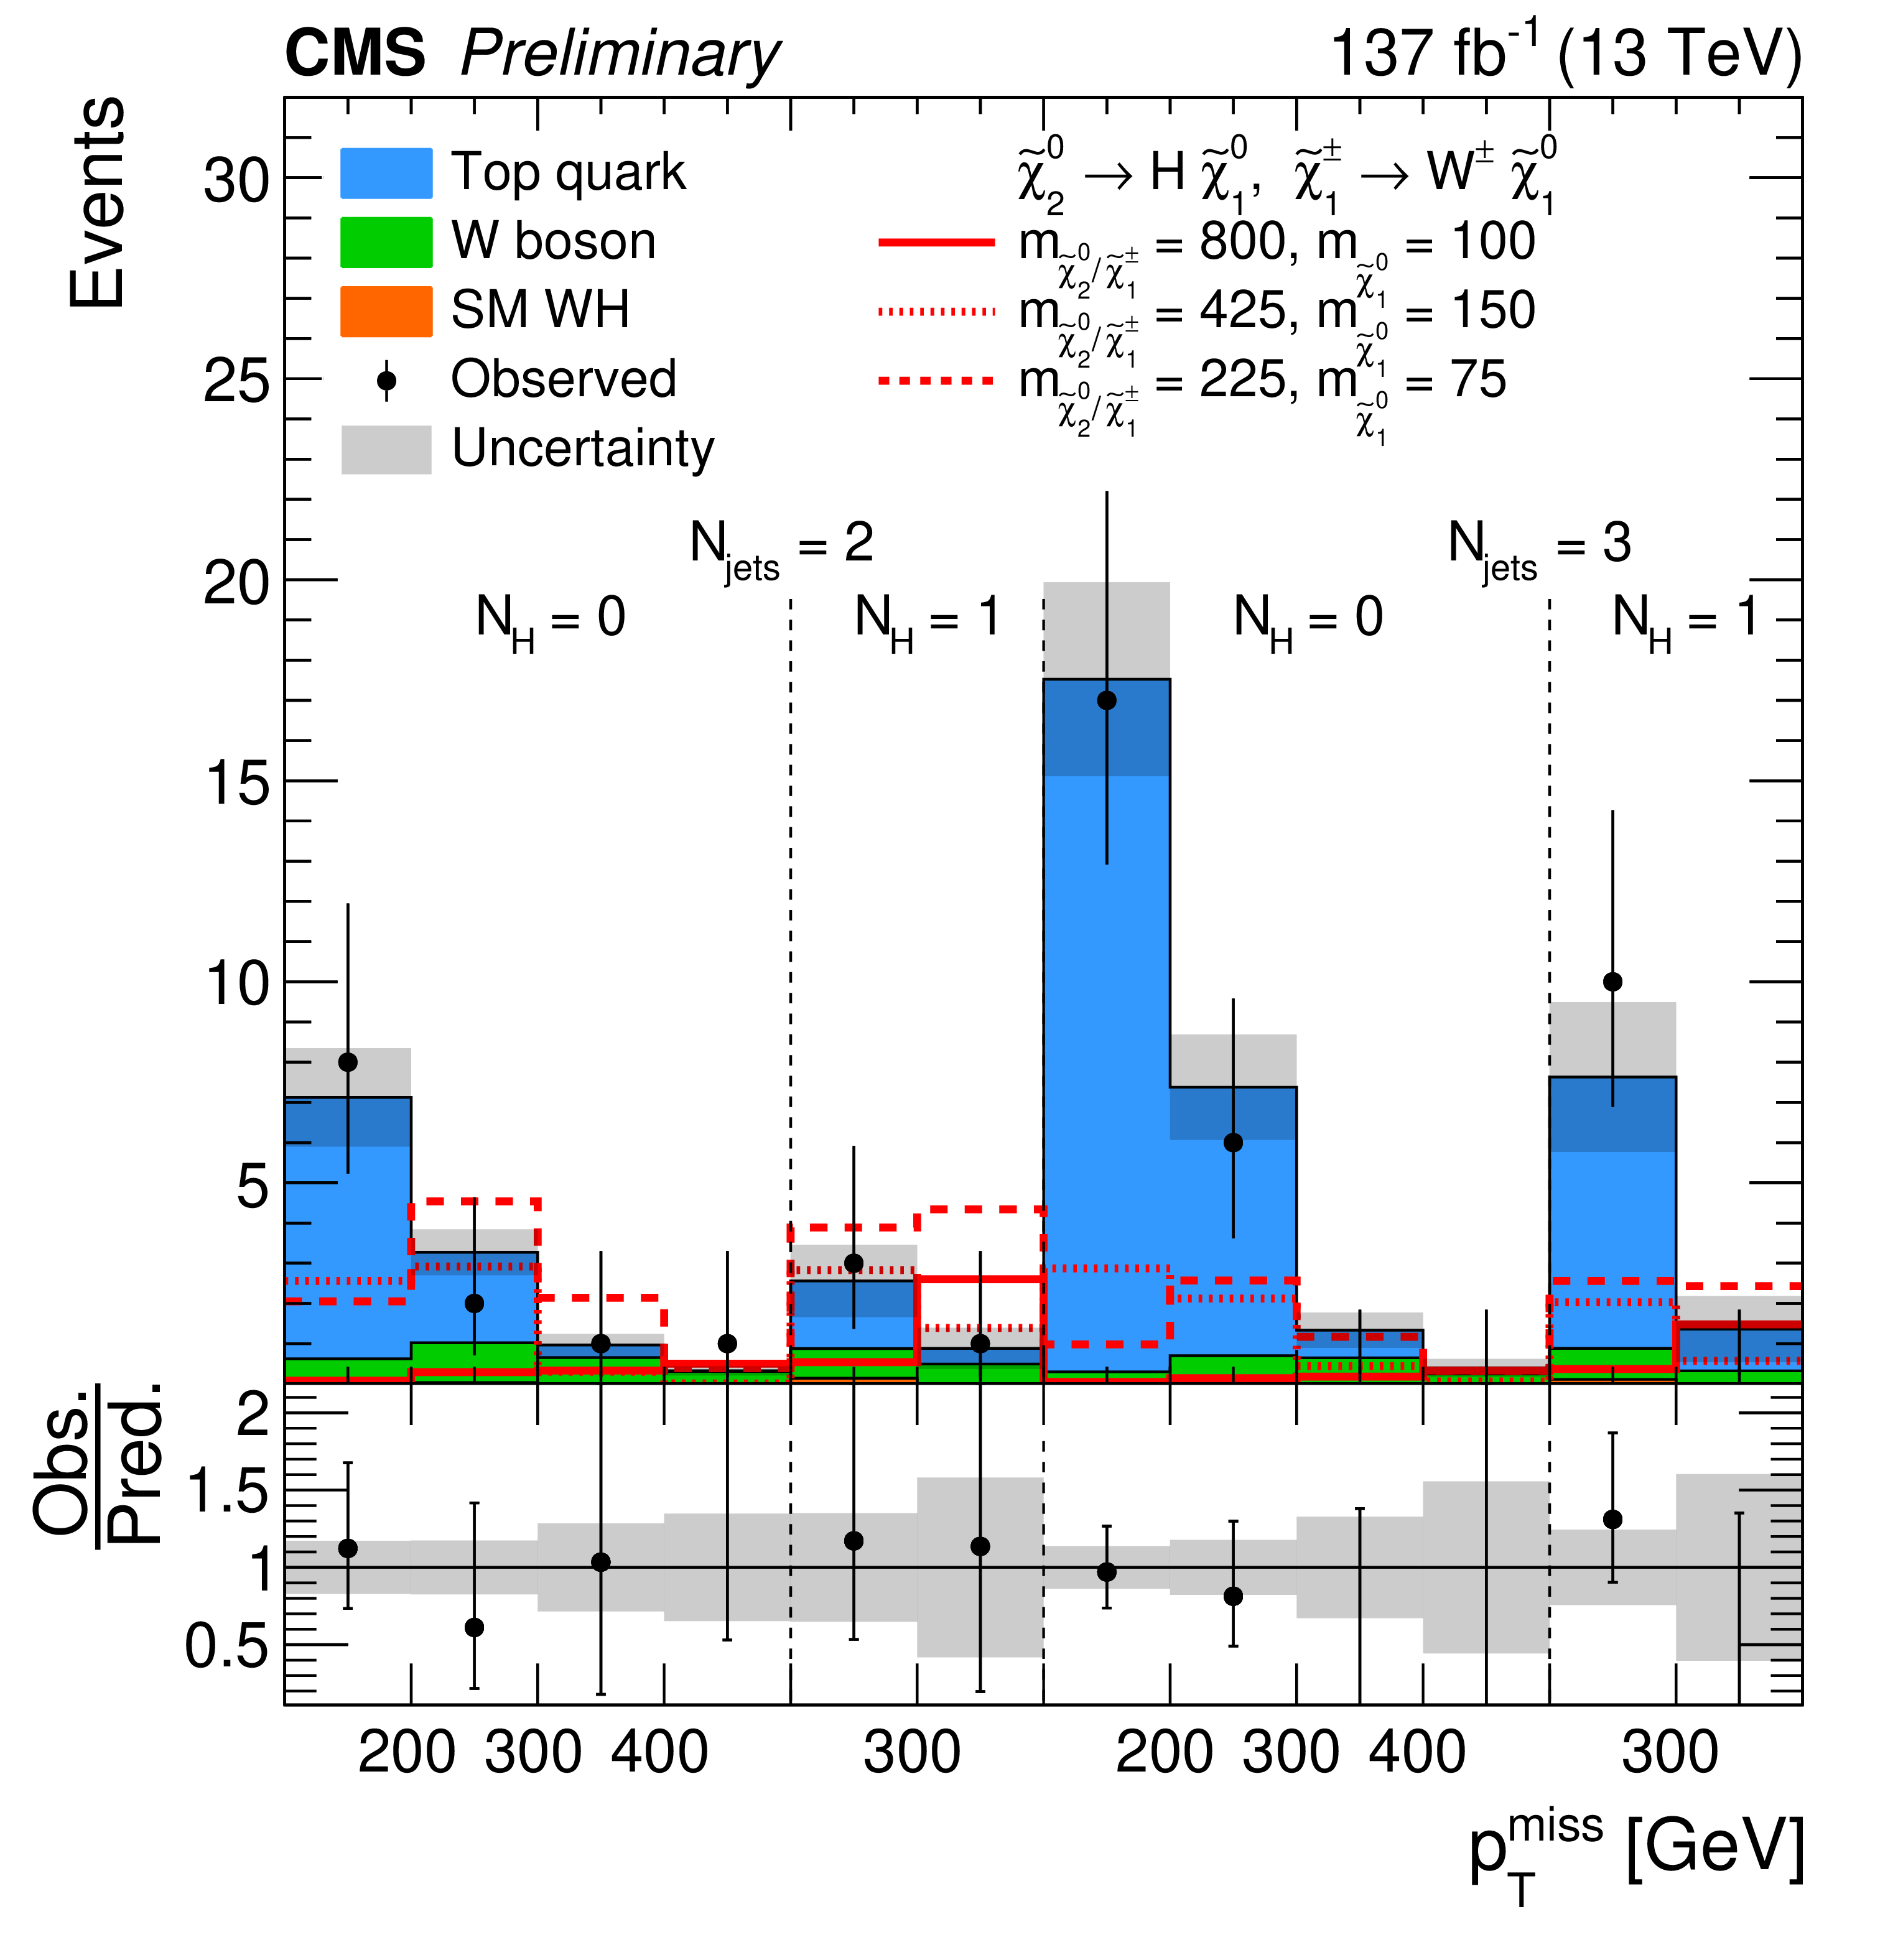
Figure 5:
Predictions of the SM background after performing the signal extraction fit (filled histograms) and observed yields in the signal regions. The lower panel provides the ratio between the observation and the predicted SM backgrounds. Three signal models with different values of $m_{ \tilde{\chi}^0_2 /\tilde{\chi}^{\pm}_1}$ and $m_{\tilde{\chi}^0_1}$ are shown as solid, short dashed, and long dashed lines. The shaded band reflects the post-fit systematic and statistical uncertainties in the background prediction. |
png pdf |
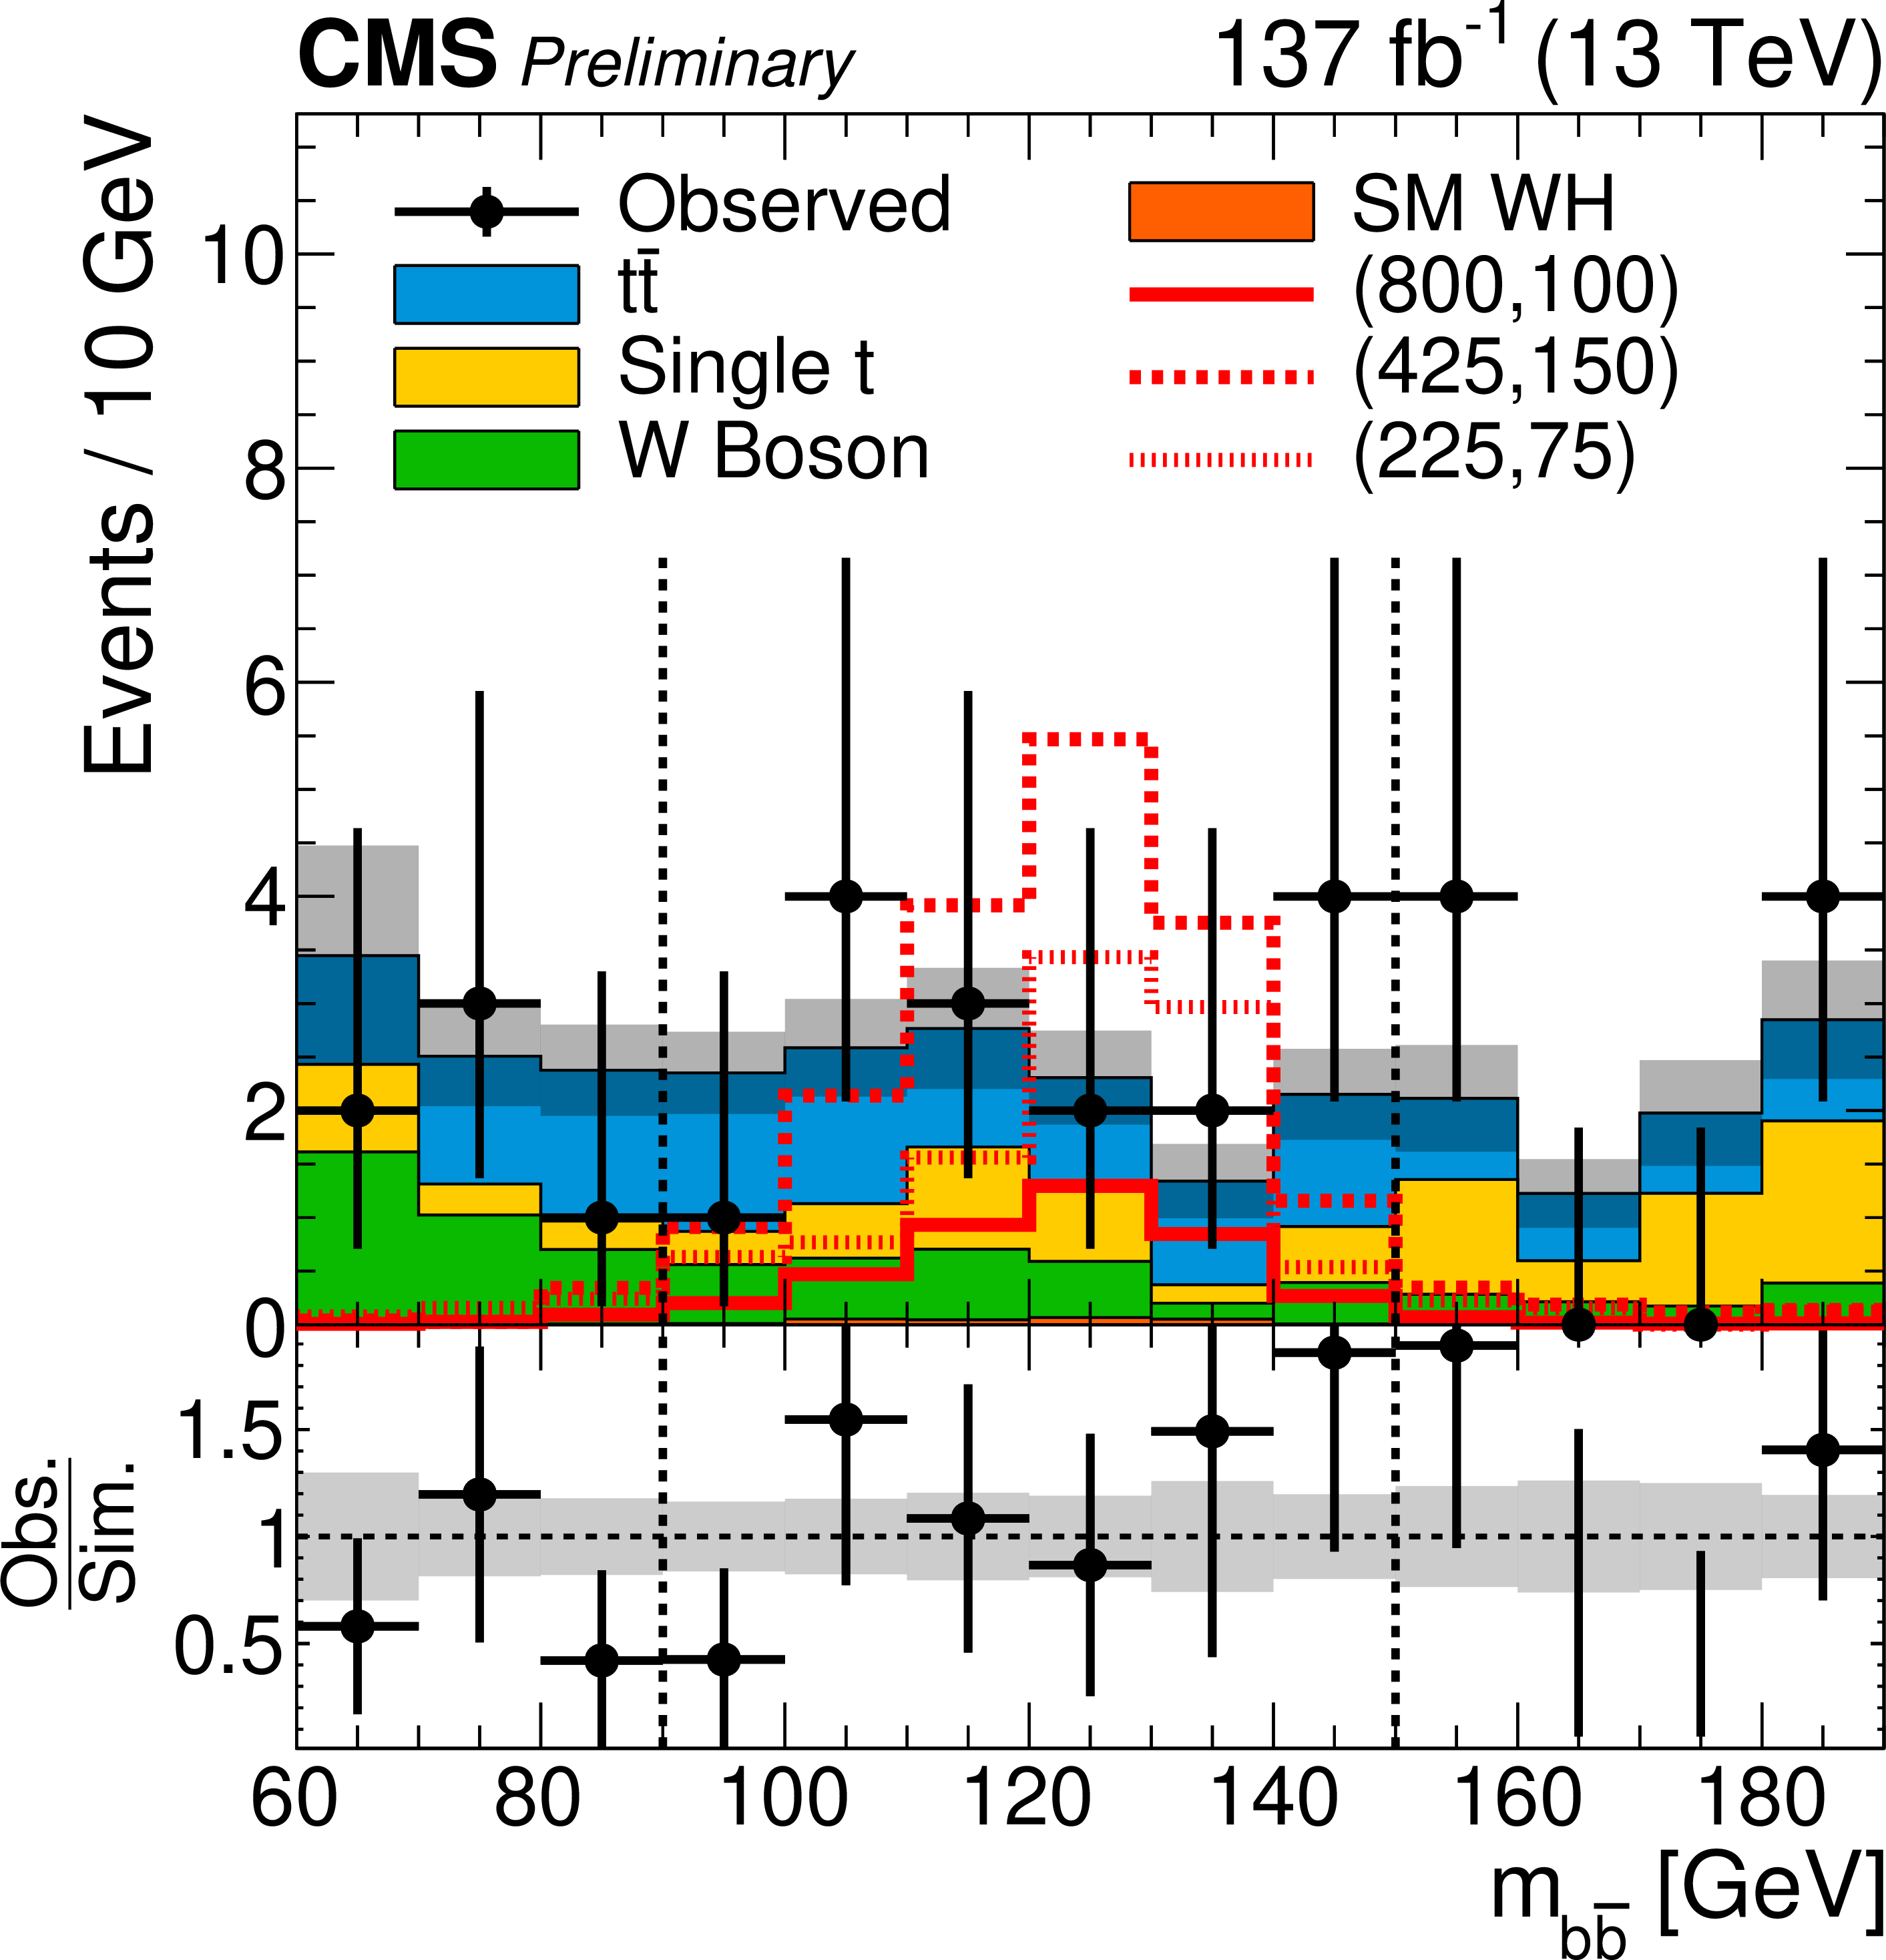
Figure 6:
Distribution of ${m_{\mathrm {b}\bar{\mathrm {b}}}}$ in the 2 jet signal regions, requiring $ {{p_{\mathrm {T}}} ^\text {miss}} > $ 125 GeV, $ {m_{\mathrm {T}}} > $ 150 GeV, $ {m_{\mathrm {CT}}} > $ 200 GeV and two b-tagged jets. The shaded area reflects the statistical uncertainties in the simulated event yields. The Monte Carlo simulation in this distribution is not representative of the background estimate; instead, the simulation is normalized to the data. |
png pdf |
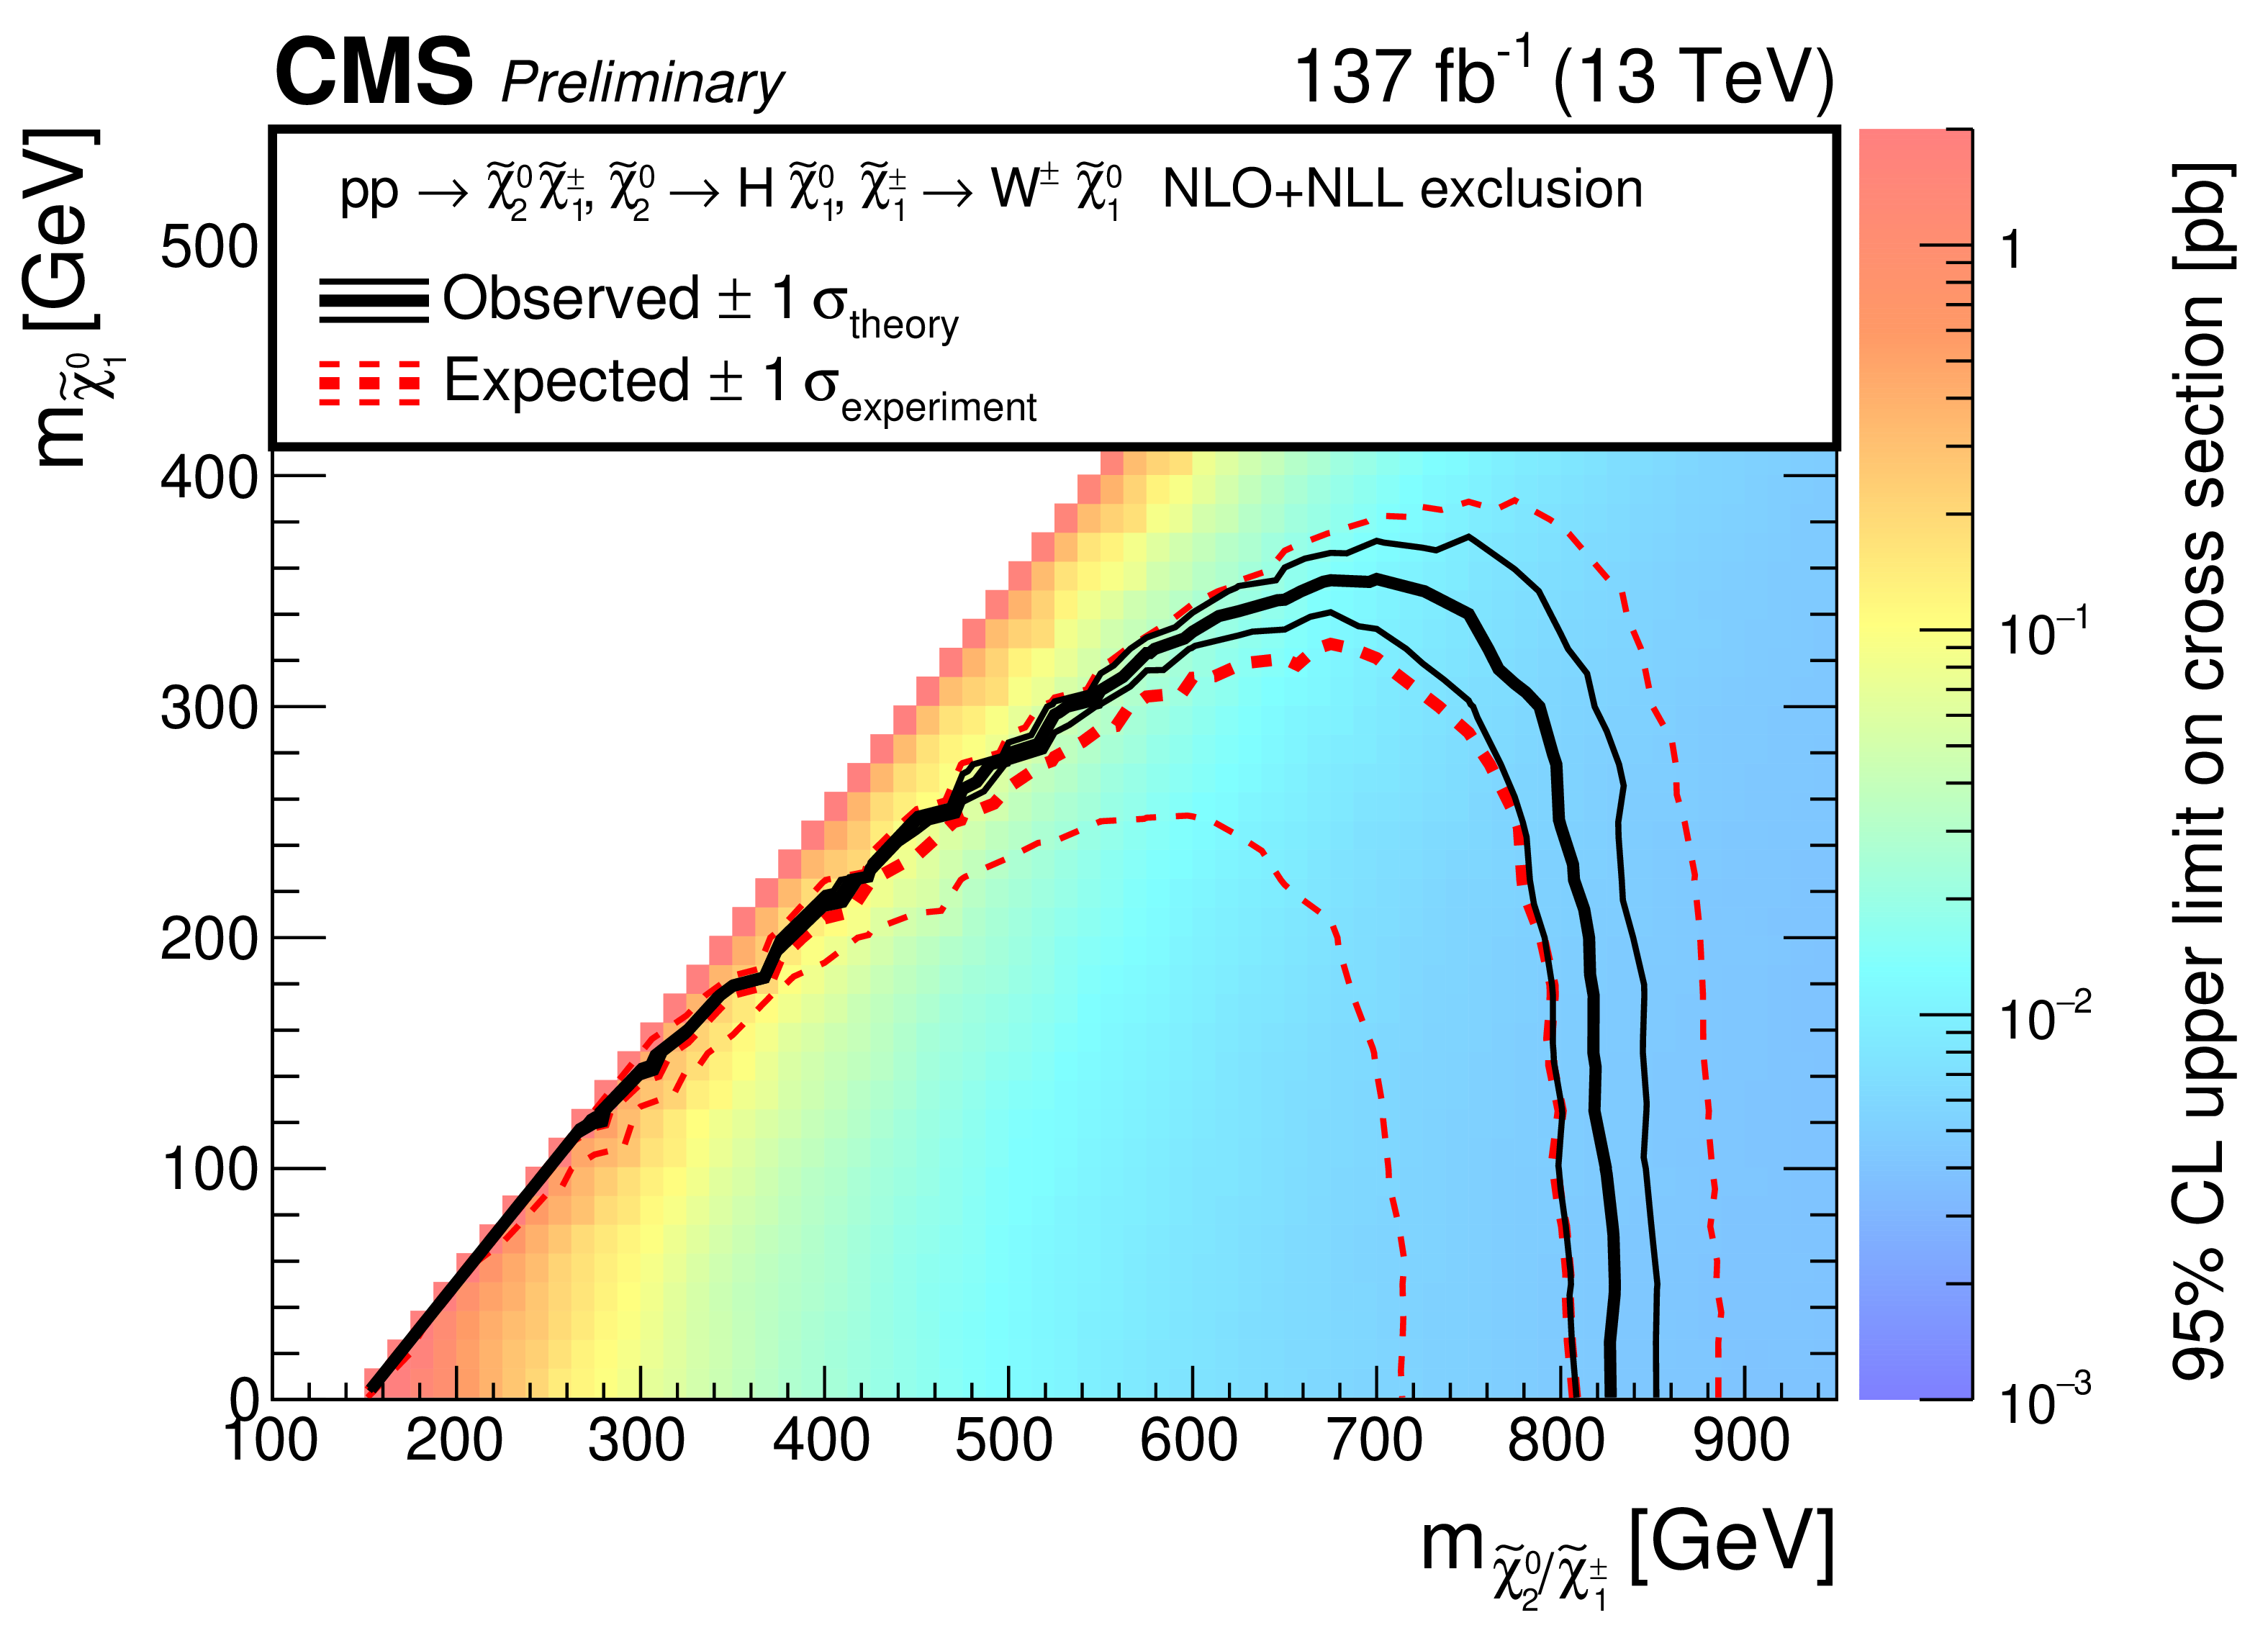
Figure 7:
Expected limits calculated with the data-driven background estimates and all of the background systematic uncertainties described in Sections 5.1 and 5.2. The color on the $z$ axis represents the 95% CL upper limit on the cross section at each point in the $m_{\tilde{\chi}^0_1}$ - $m_{ \tilde{\chi}^0_2}$ plane. The area below the thick black curve represents the observed exclusion region at this CL. The thick dashed red line indicates the expected limit at this CL, while the region containing 68% of the distribution of limits expected under the background-only hypothesis is bounded by thin dashed red lines. The thin black lines show the effect of the theoretical uncertainties in the signal cross section. |
| Tables | |
png pdf |
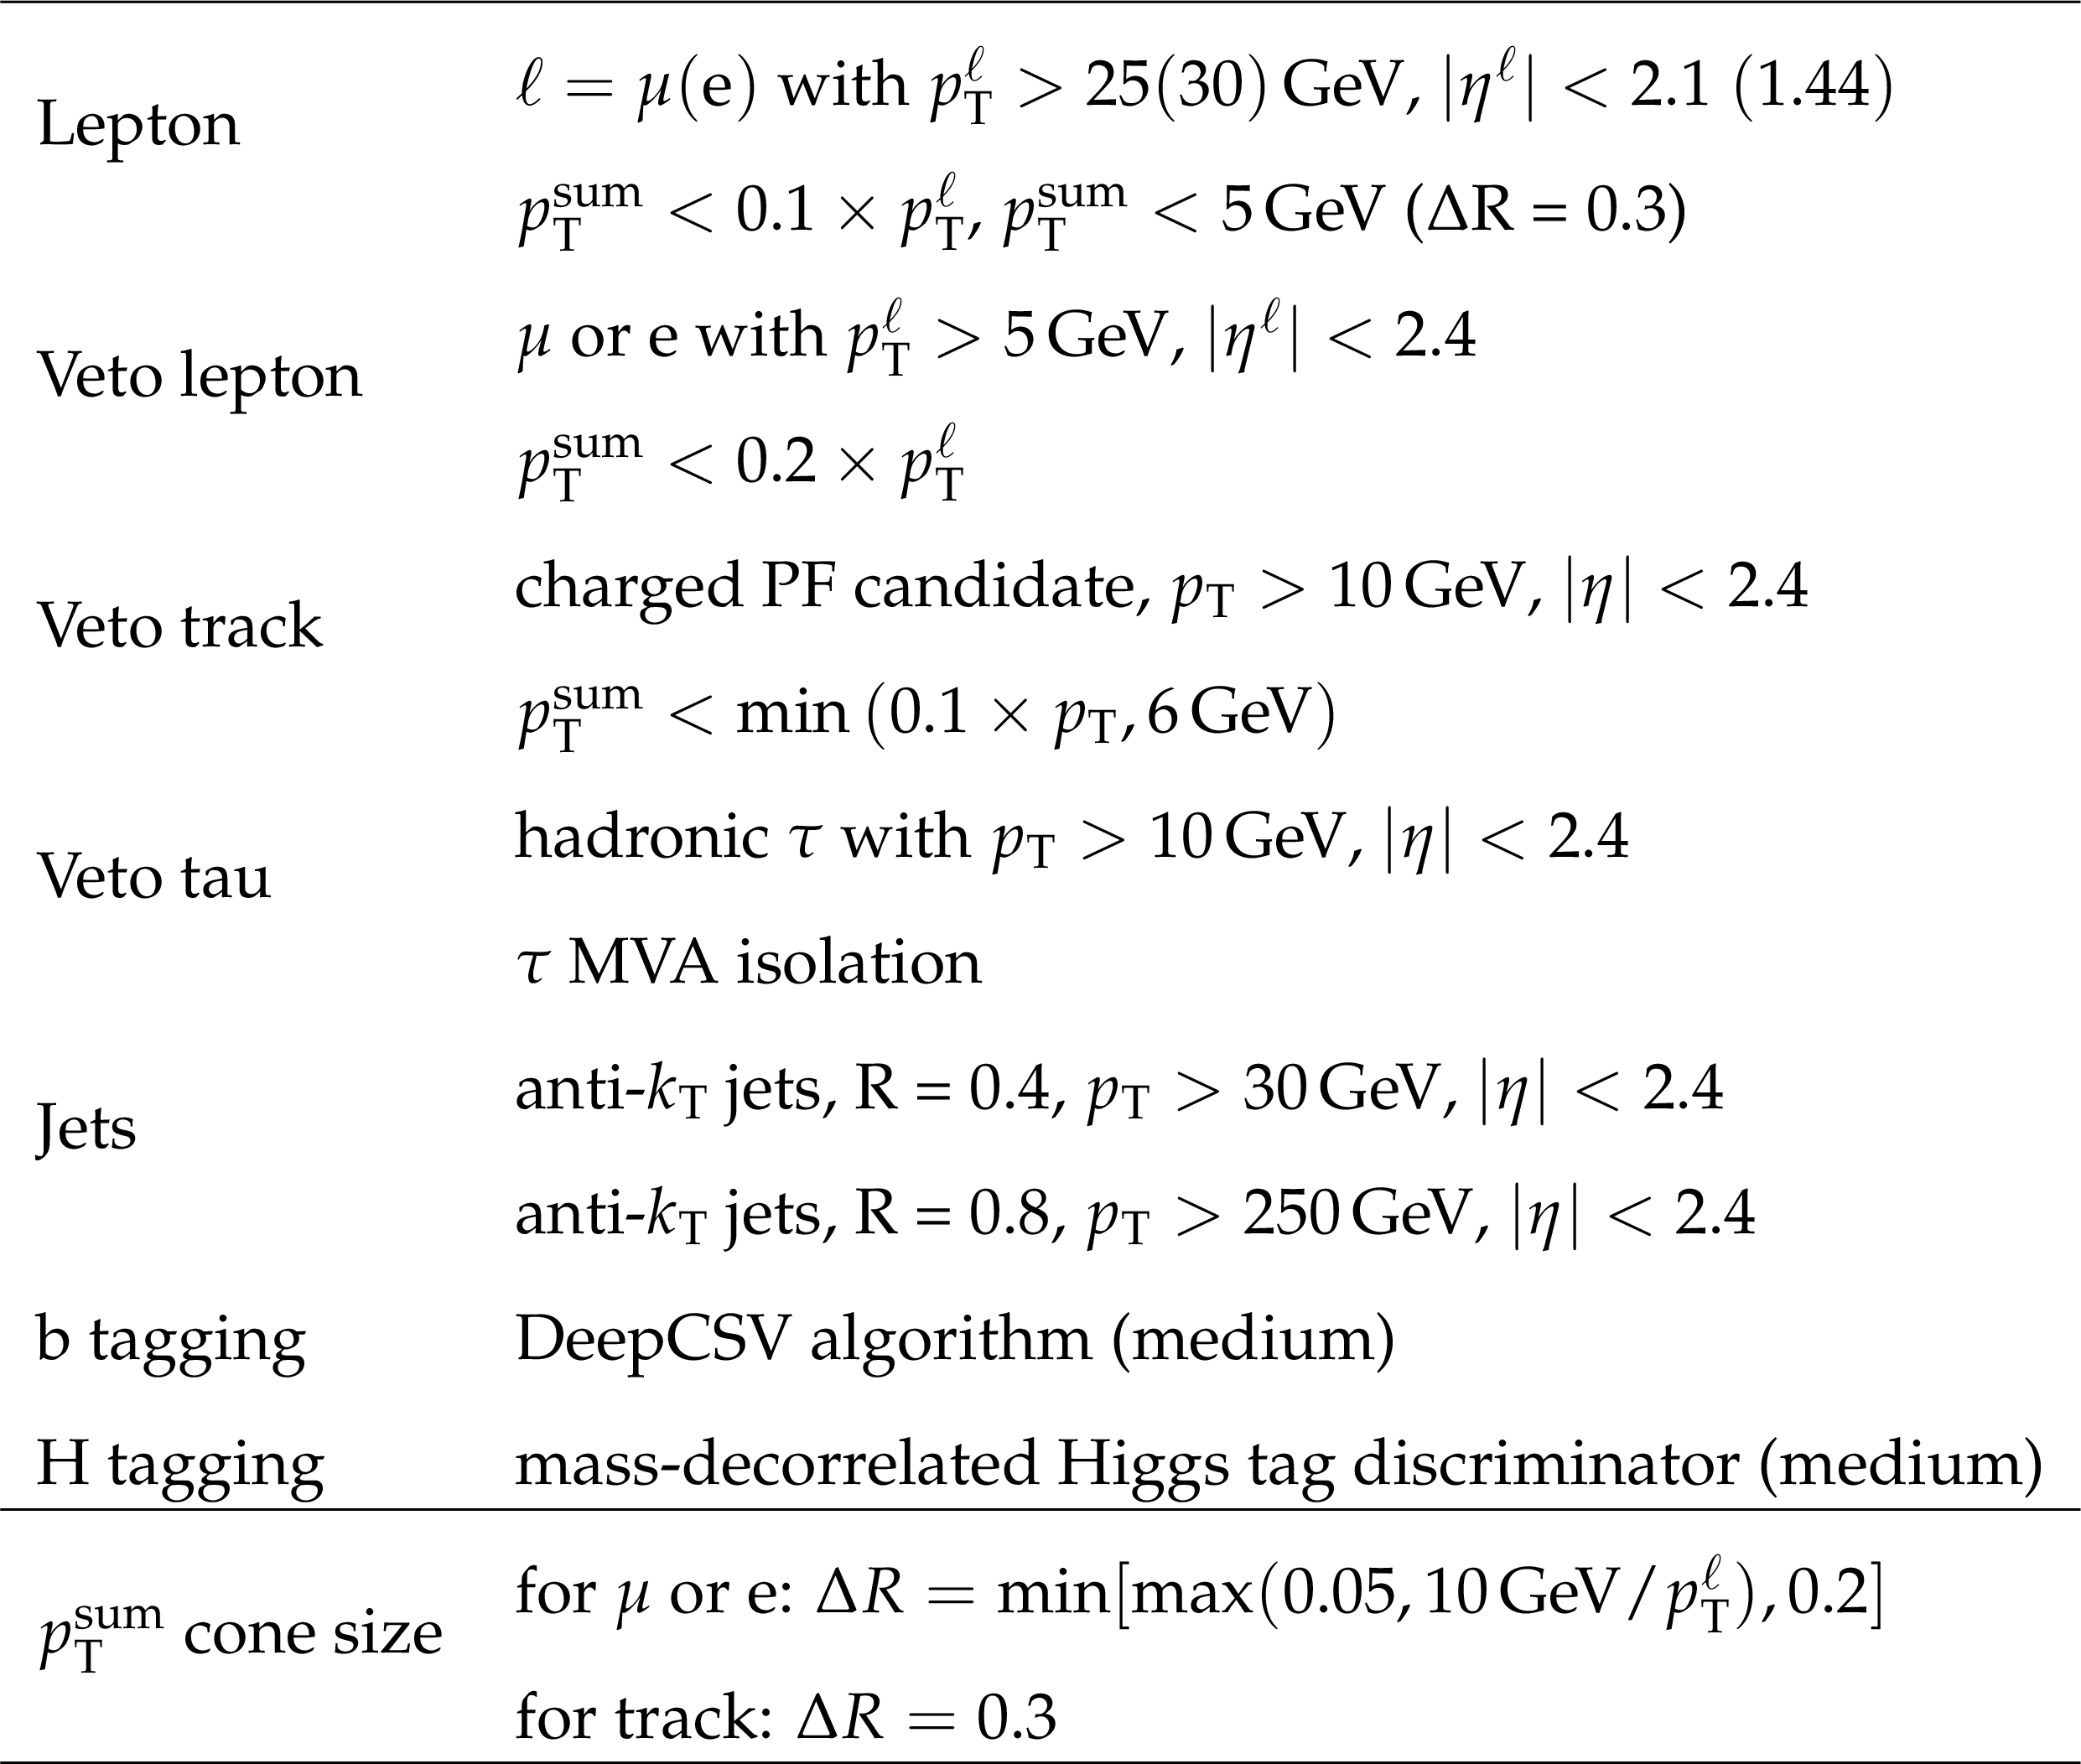
Table 1:
Summary of the physics objects used in this analysis. $ {{p_{\mathrm {T}}} ^{\text {sum}}} $ is the scalar sum of the ${p_{\mathrm {T}}}$ of all charged particle-flow (PF) candidates in a cone around the lepton (track), excluding the lepton (track) itself. |
png pdf |
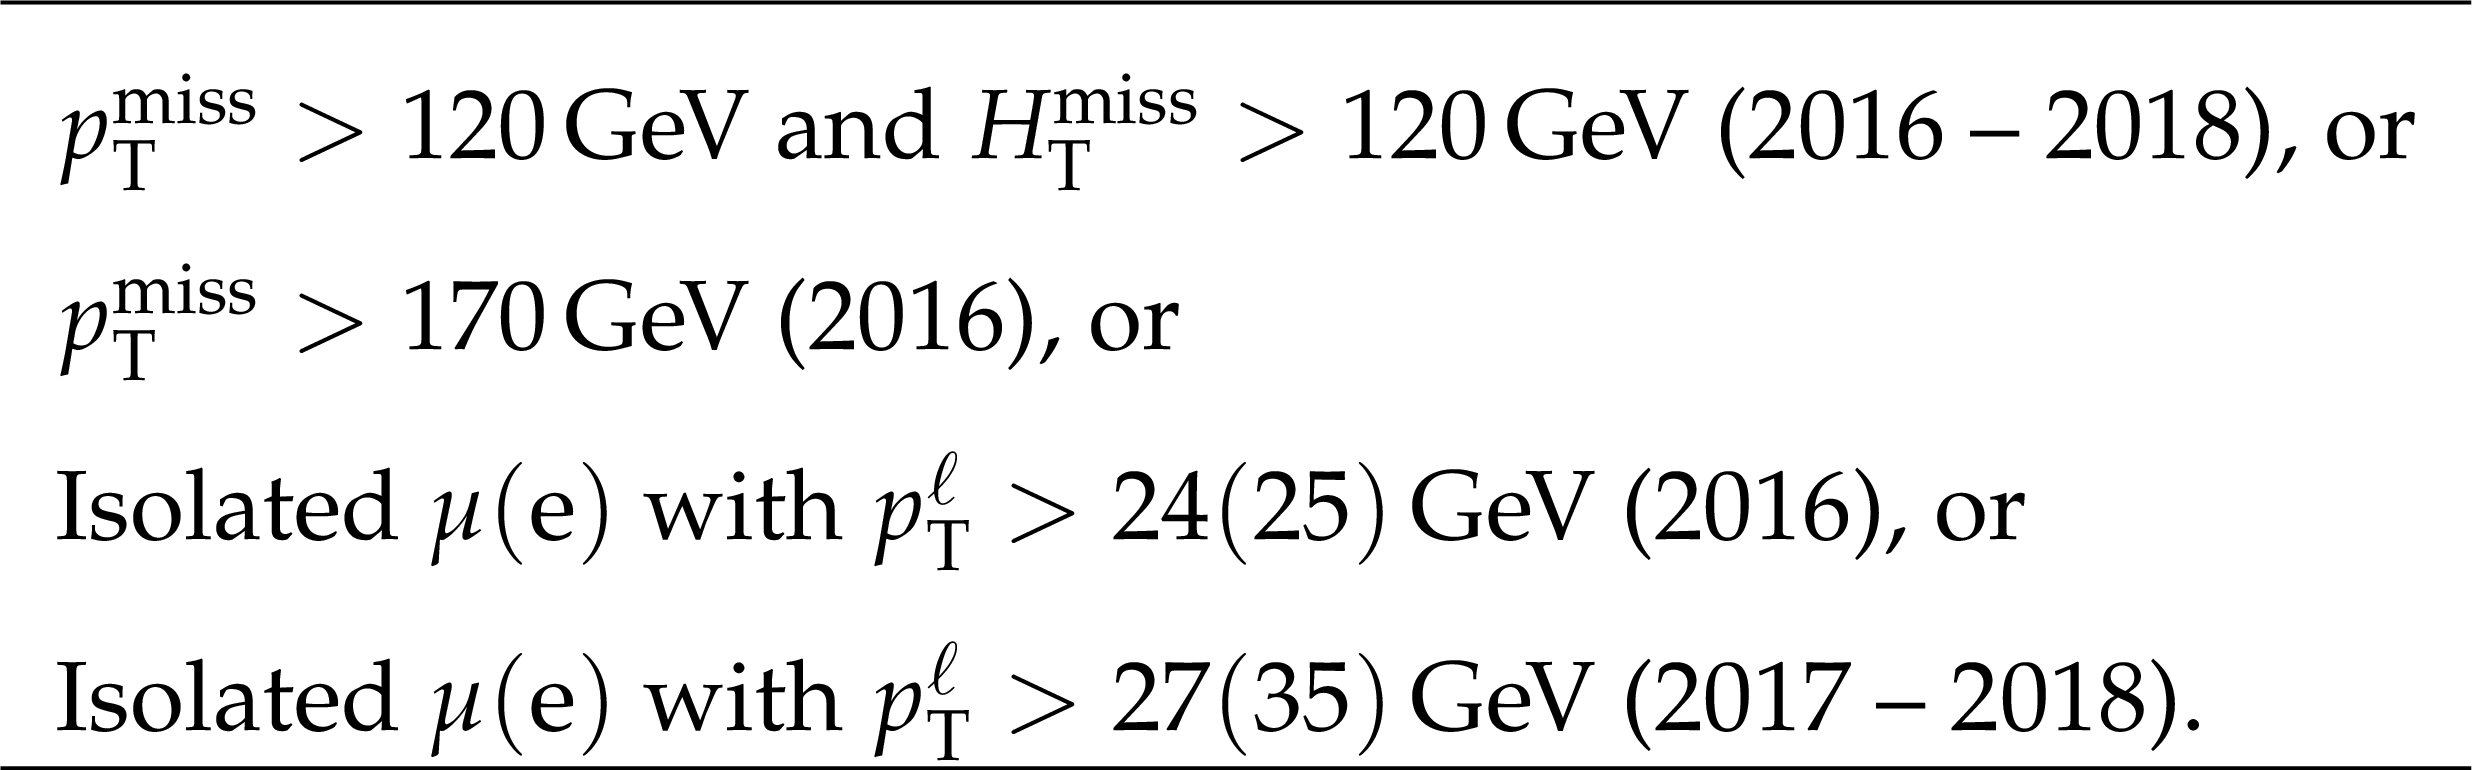
Table 2:
Summary of the triggers used to select the analysis data set. The magnitude of the negative vector sum of the ${p_{\mathrm {T}}}$ of all jets and leptons in the event is denoted by ${H_{\mathrm {T}}^{\text {miss}}}$. The symbols $ {p_{\mathrm {T}}} ^{\ell}$ and $\eta ^{\ell}$ correspond to the transverse momentum and pseudorapidity of the lepton. |
png pdf |
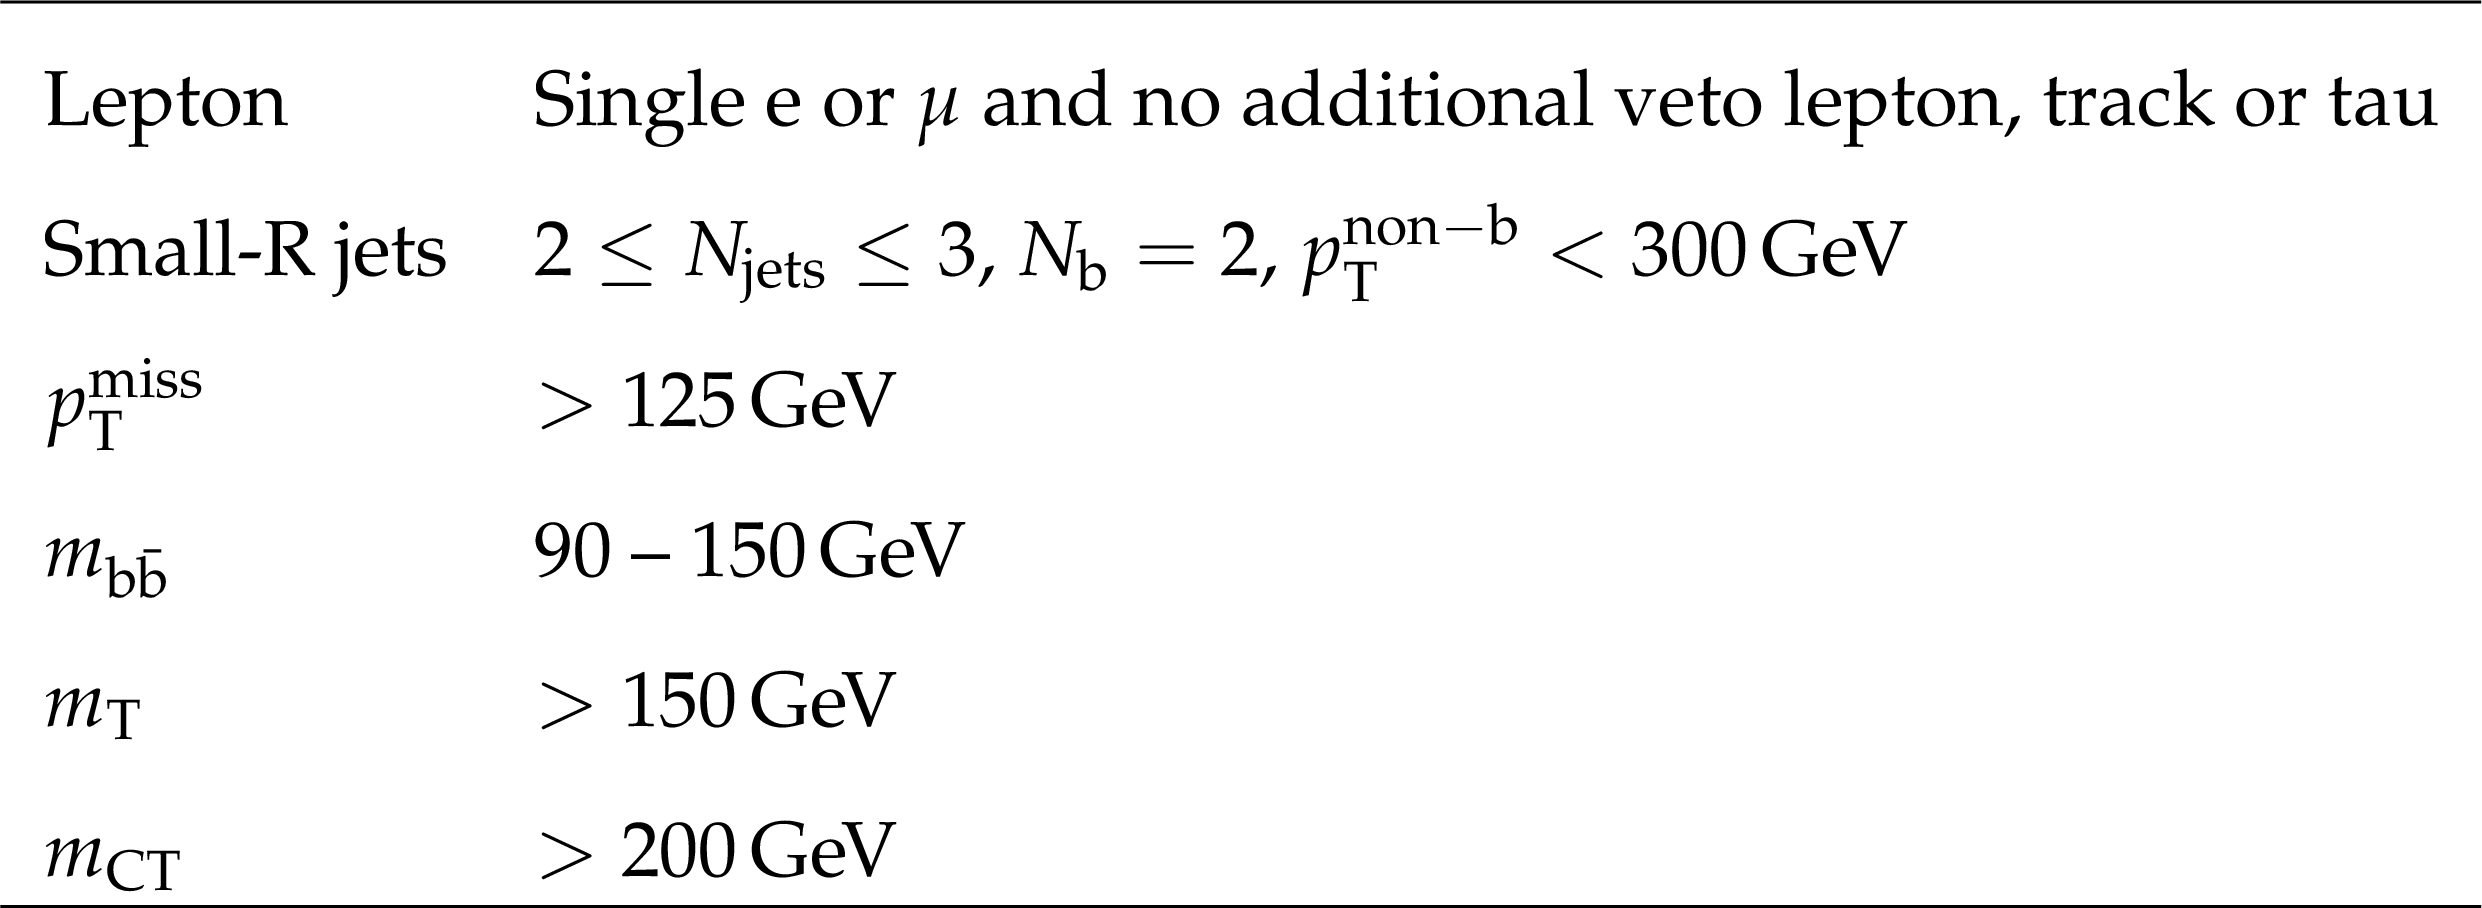
Table 3:
Summary of the requirements common to all signal regions. The $ {N_{\mathrm{b}}} $ is the multiplicity of b-tagged jets and $ {p_{\mathrm {T}}} ^{\mathrm {non-\mathrm{b}}}$ is the ${p_{\mathrm {T}}}$ of non-b-tagged jets. |
png pdf |
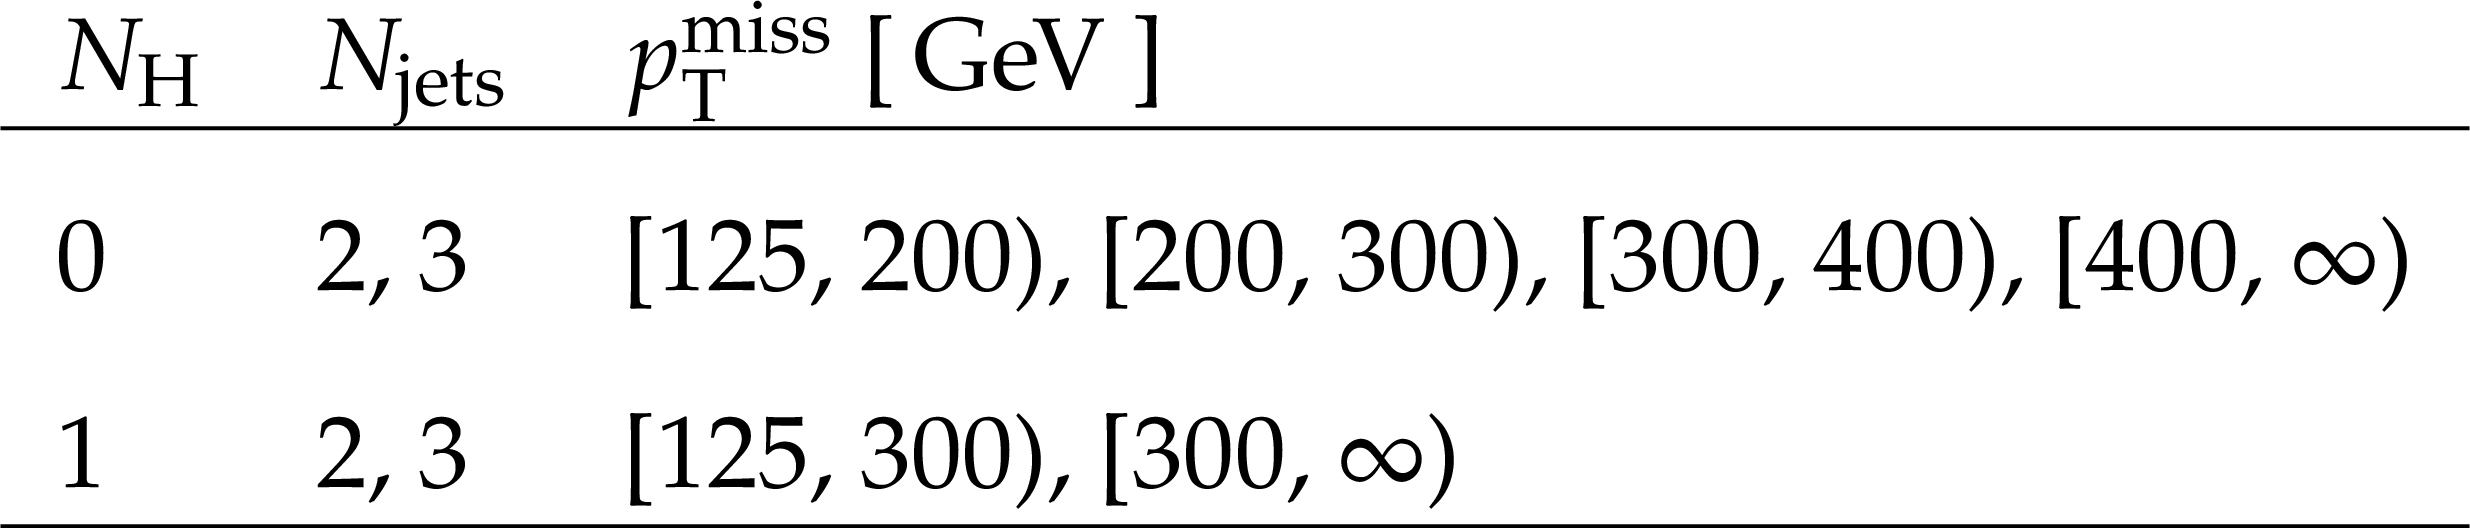
Table 4:
Definition of the 12 orthogonal signal regions categorized in ${N_{\mathrm {\mathrm{H}}}}$, ${N_{\mathrm {jets}}}$, and ${{p_{\mathrm {T}}} ^\text {miss}}$. The $ {N_{\mathrm {\mathrm{H}}}} $ is the number of large-R jets tagged as $\mathrm{H} \to \mathrm{b} \mathrm{\bar{b}} $. |
png pdf |
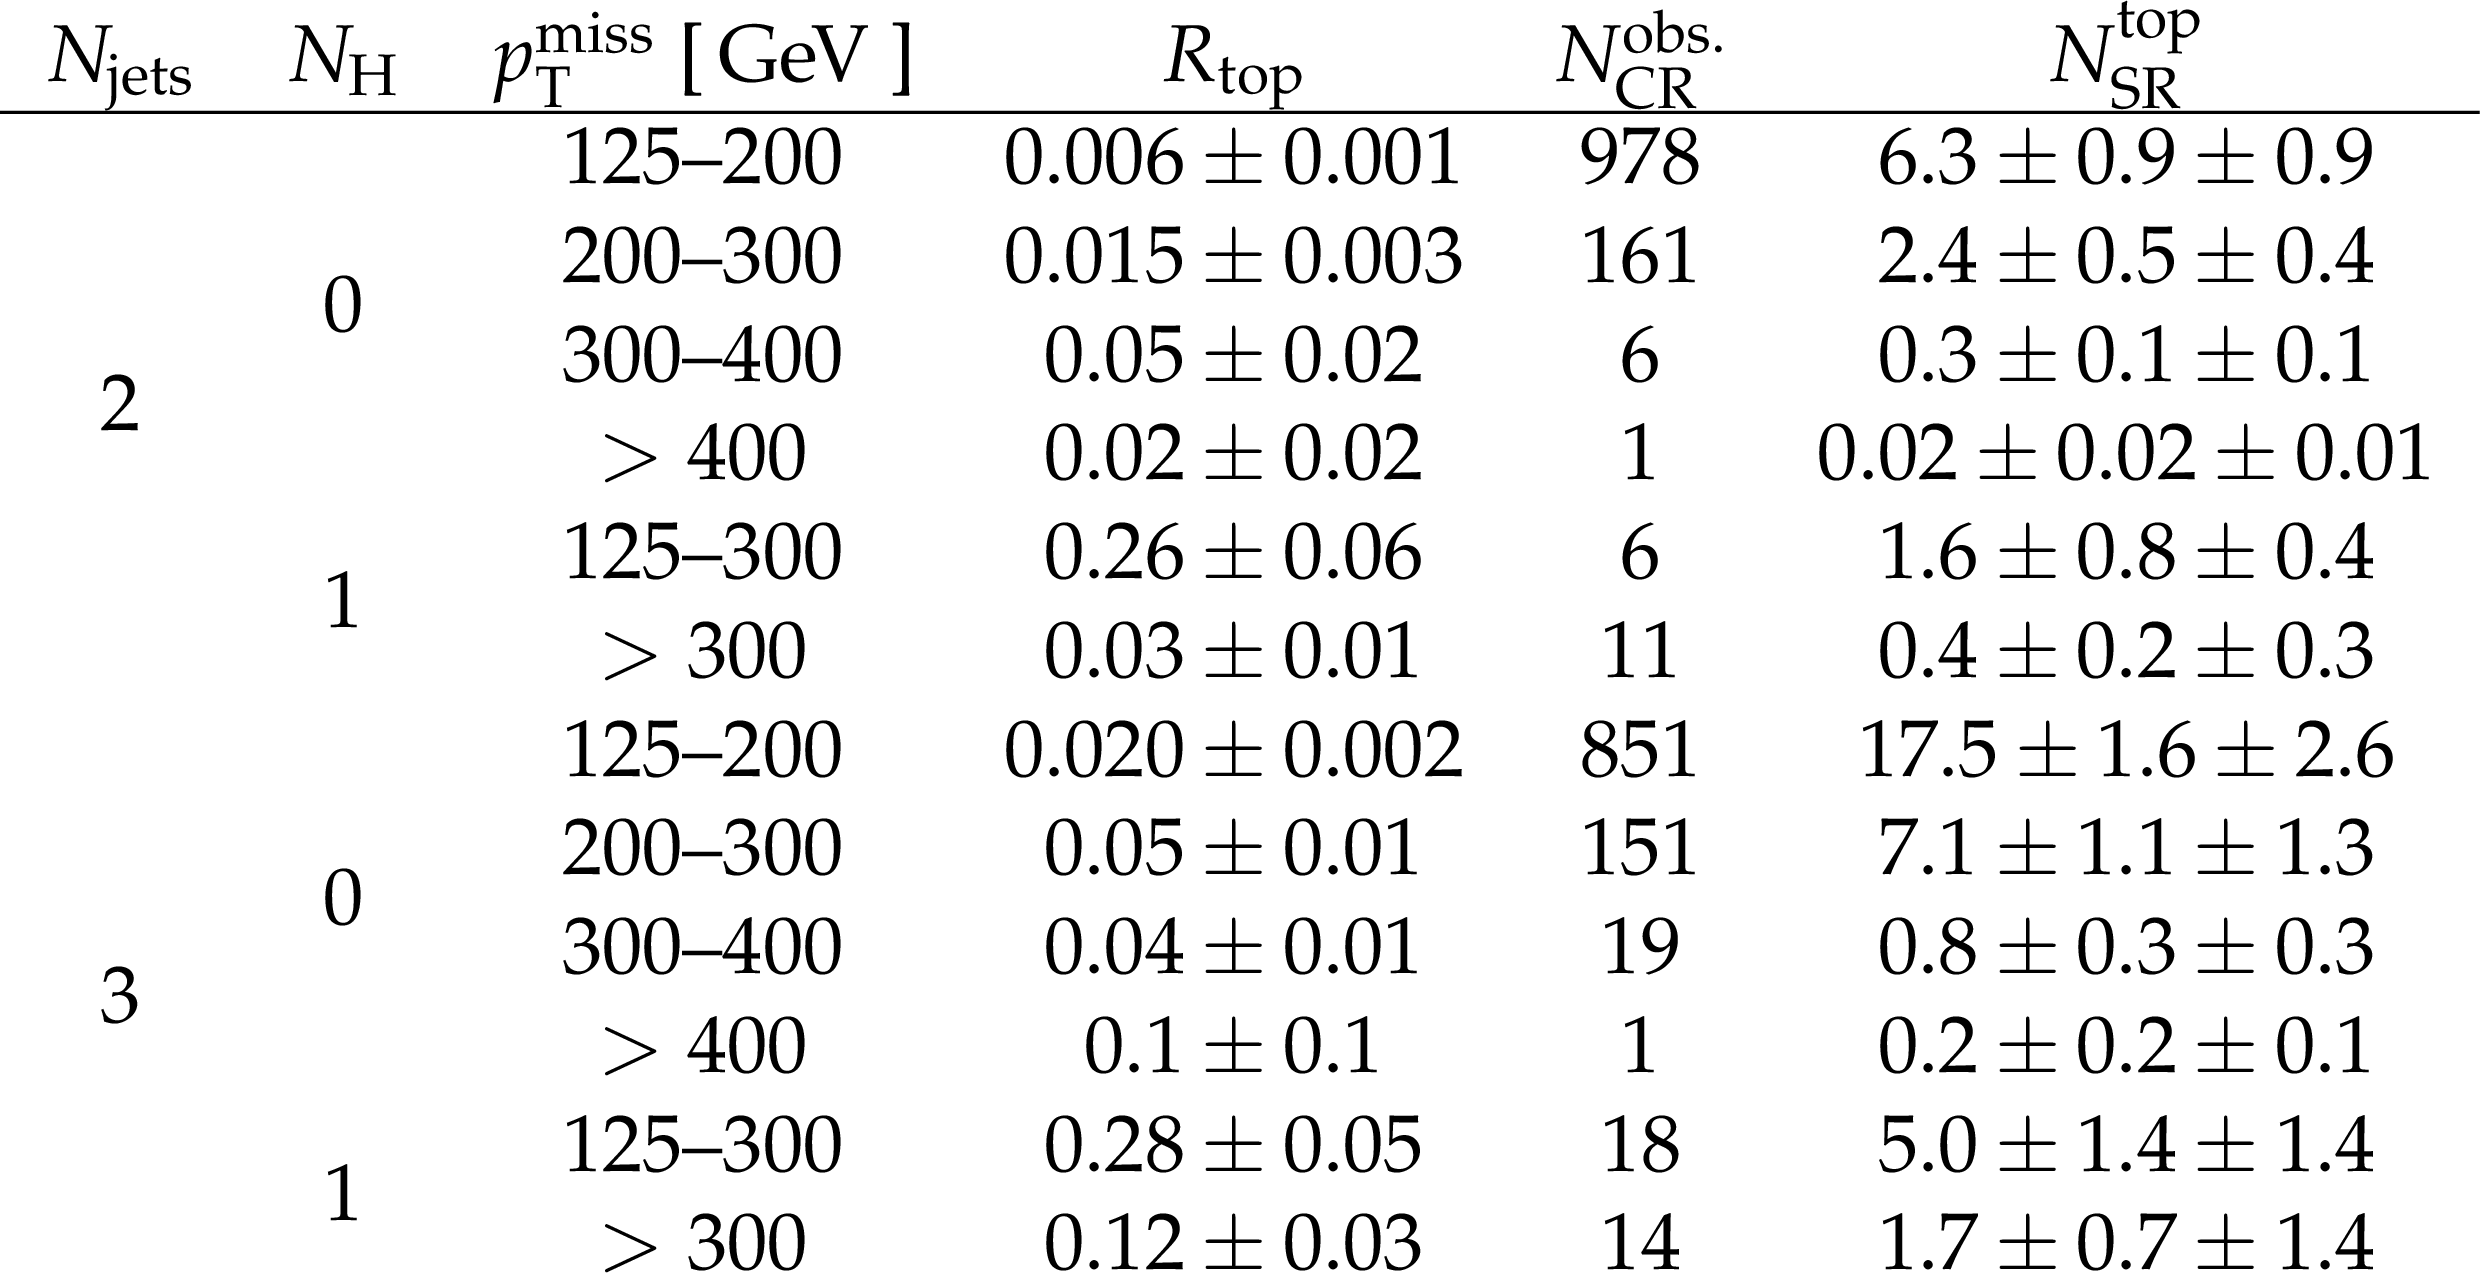
Table 5:
Summary of the observed yields in the low ${m_{\mathrm {CT}}}$ CRs, the ${R_{\mathrm {top}}}$ transfer factors, and the resulting top quark background estimate. The uncertainty shown for ${R_{\mathrm {top}}}$ is entirely of statistical origin. The top quark prediction includes the statistical uncertainty followed by the systematic uncertainty. |
png pdf |
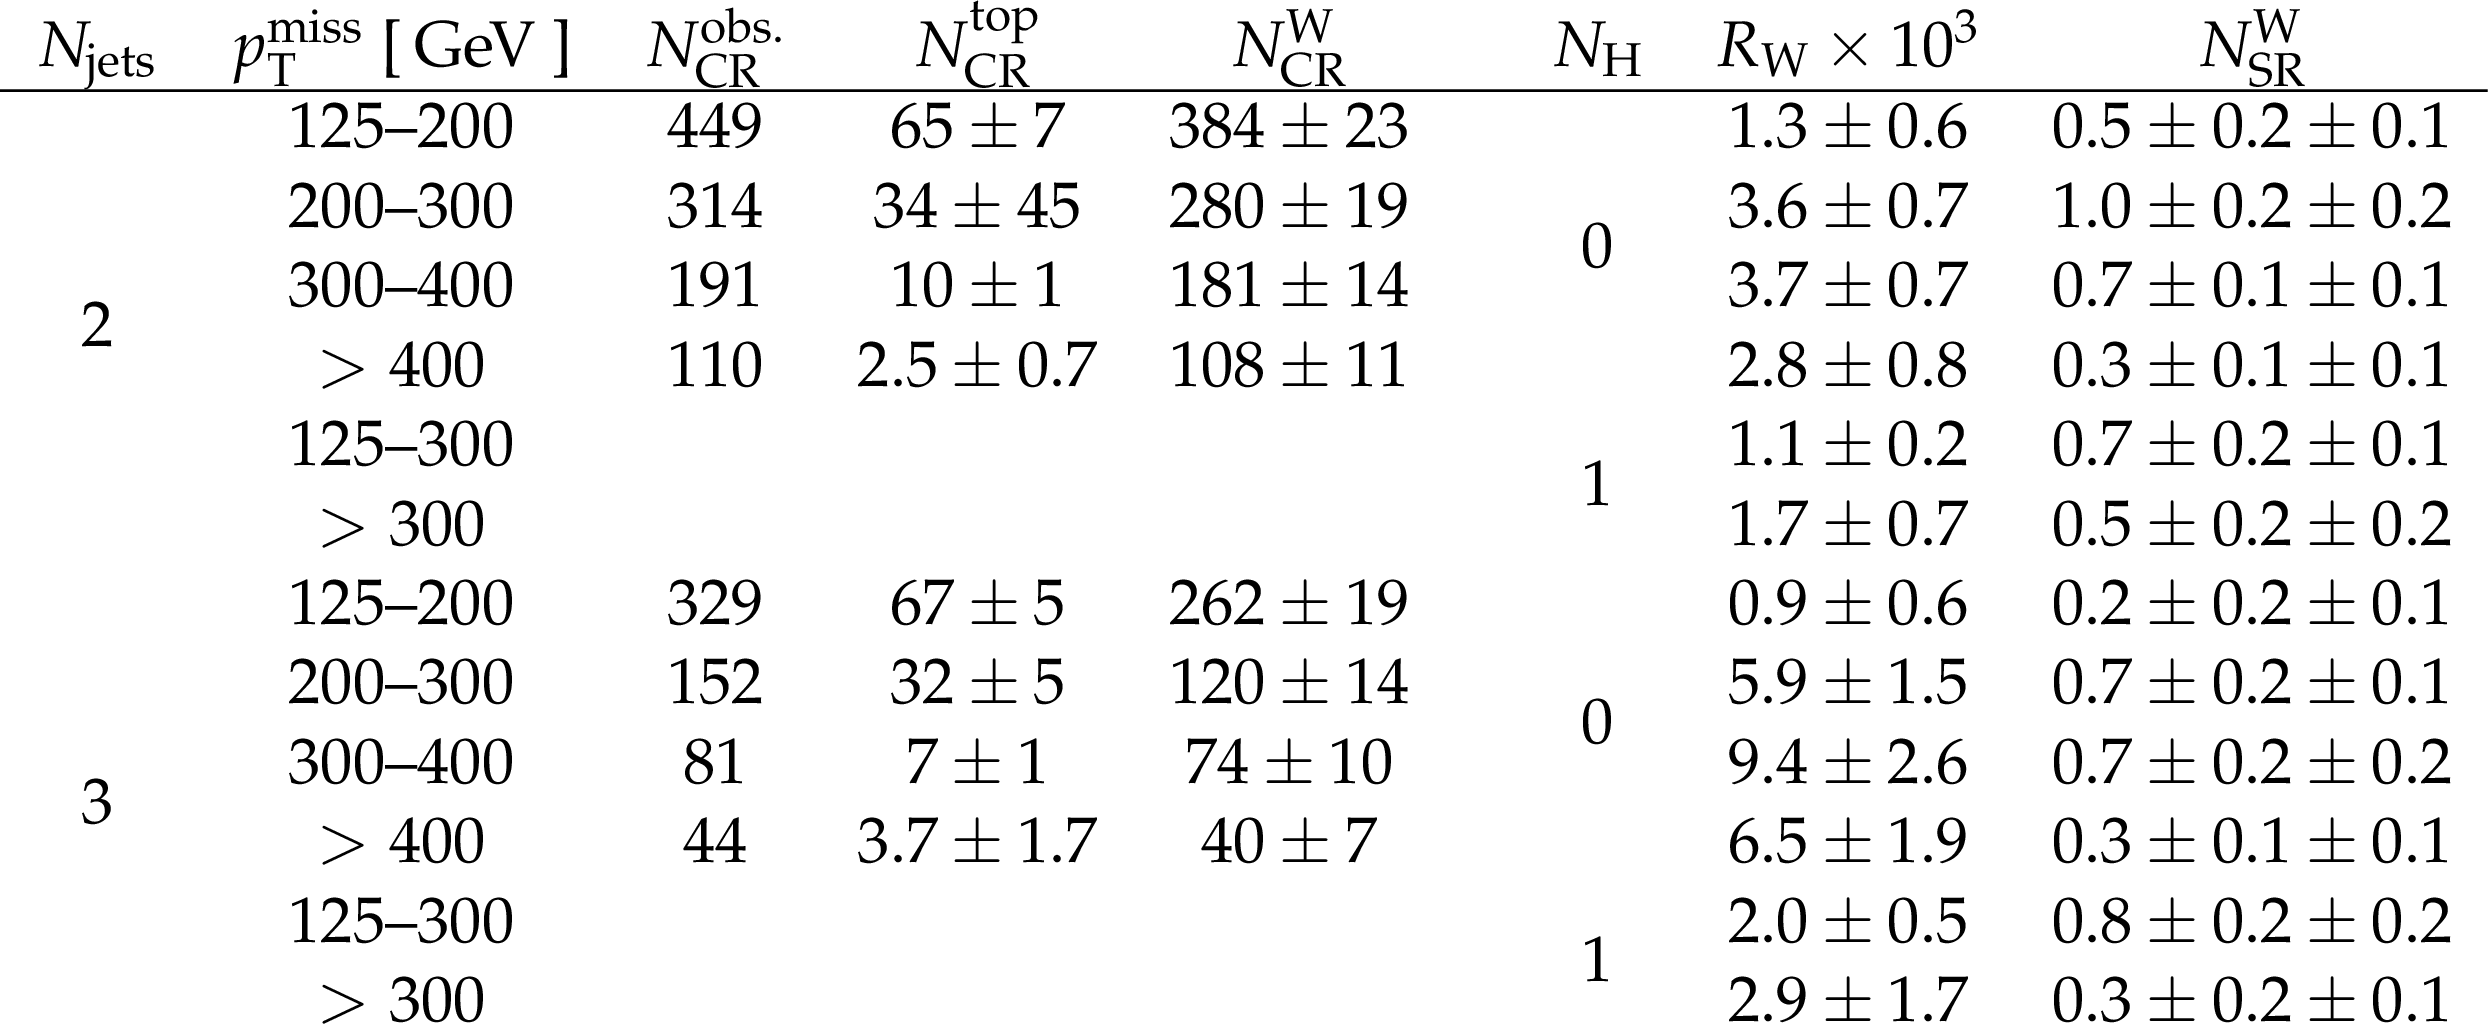
Table 6:
Values of ${R_{\mathrm{W}}}$ for the extrapolation of the W boson background from the CR to the SR, together with the observed ($N_{{\mathrm {CR}}}^{\textrm {obs.}}$) and top quark background subtracted yield ($N_{{\mathrm {CR}}}^{\mathrm{W}}$) in the CR, and the final W boson prediction. The CRs are defined inclusively in ${N_{\mathrm {\mathrm{H}}}}$. The W boson predictions for $ {N_{\mathrm {\mathrm{H}}}} =$ 1 signal regions use the sum of the CR yields from the corresponding $ {N_{\mathrm {\mathrm{H}}}} = $ 0 rows. The uncertainties in ${R_{\mathrm{W}}}$ include the statistical uncertainty only. The W boson prediction includes the statistical uncertainty, followed by the systematic uncertainty. |
png pdf |
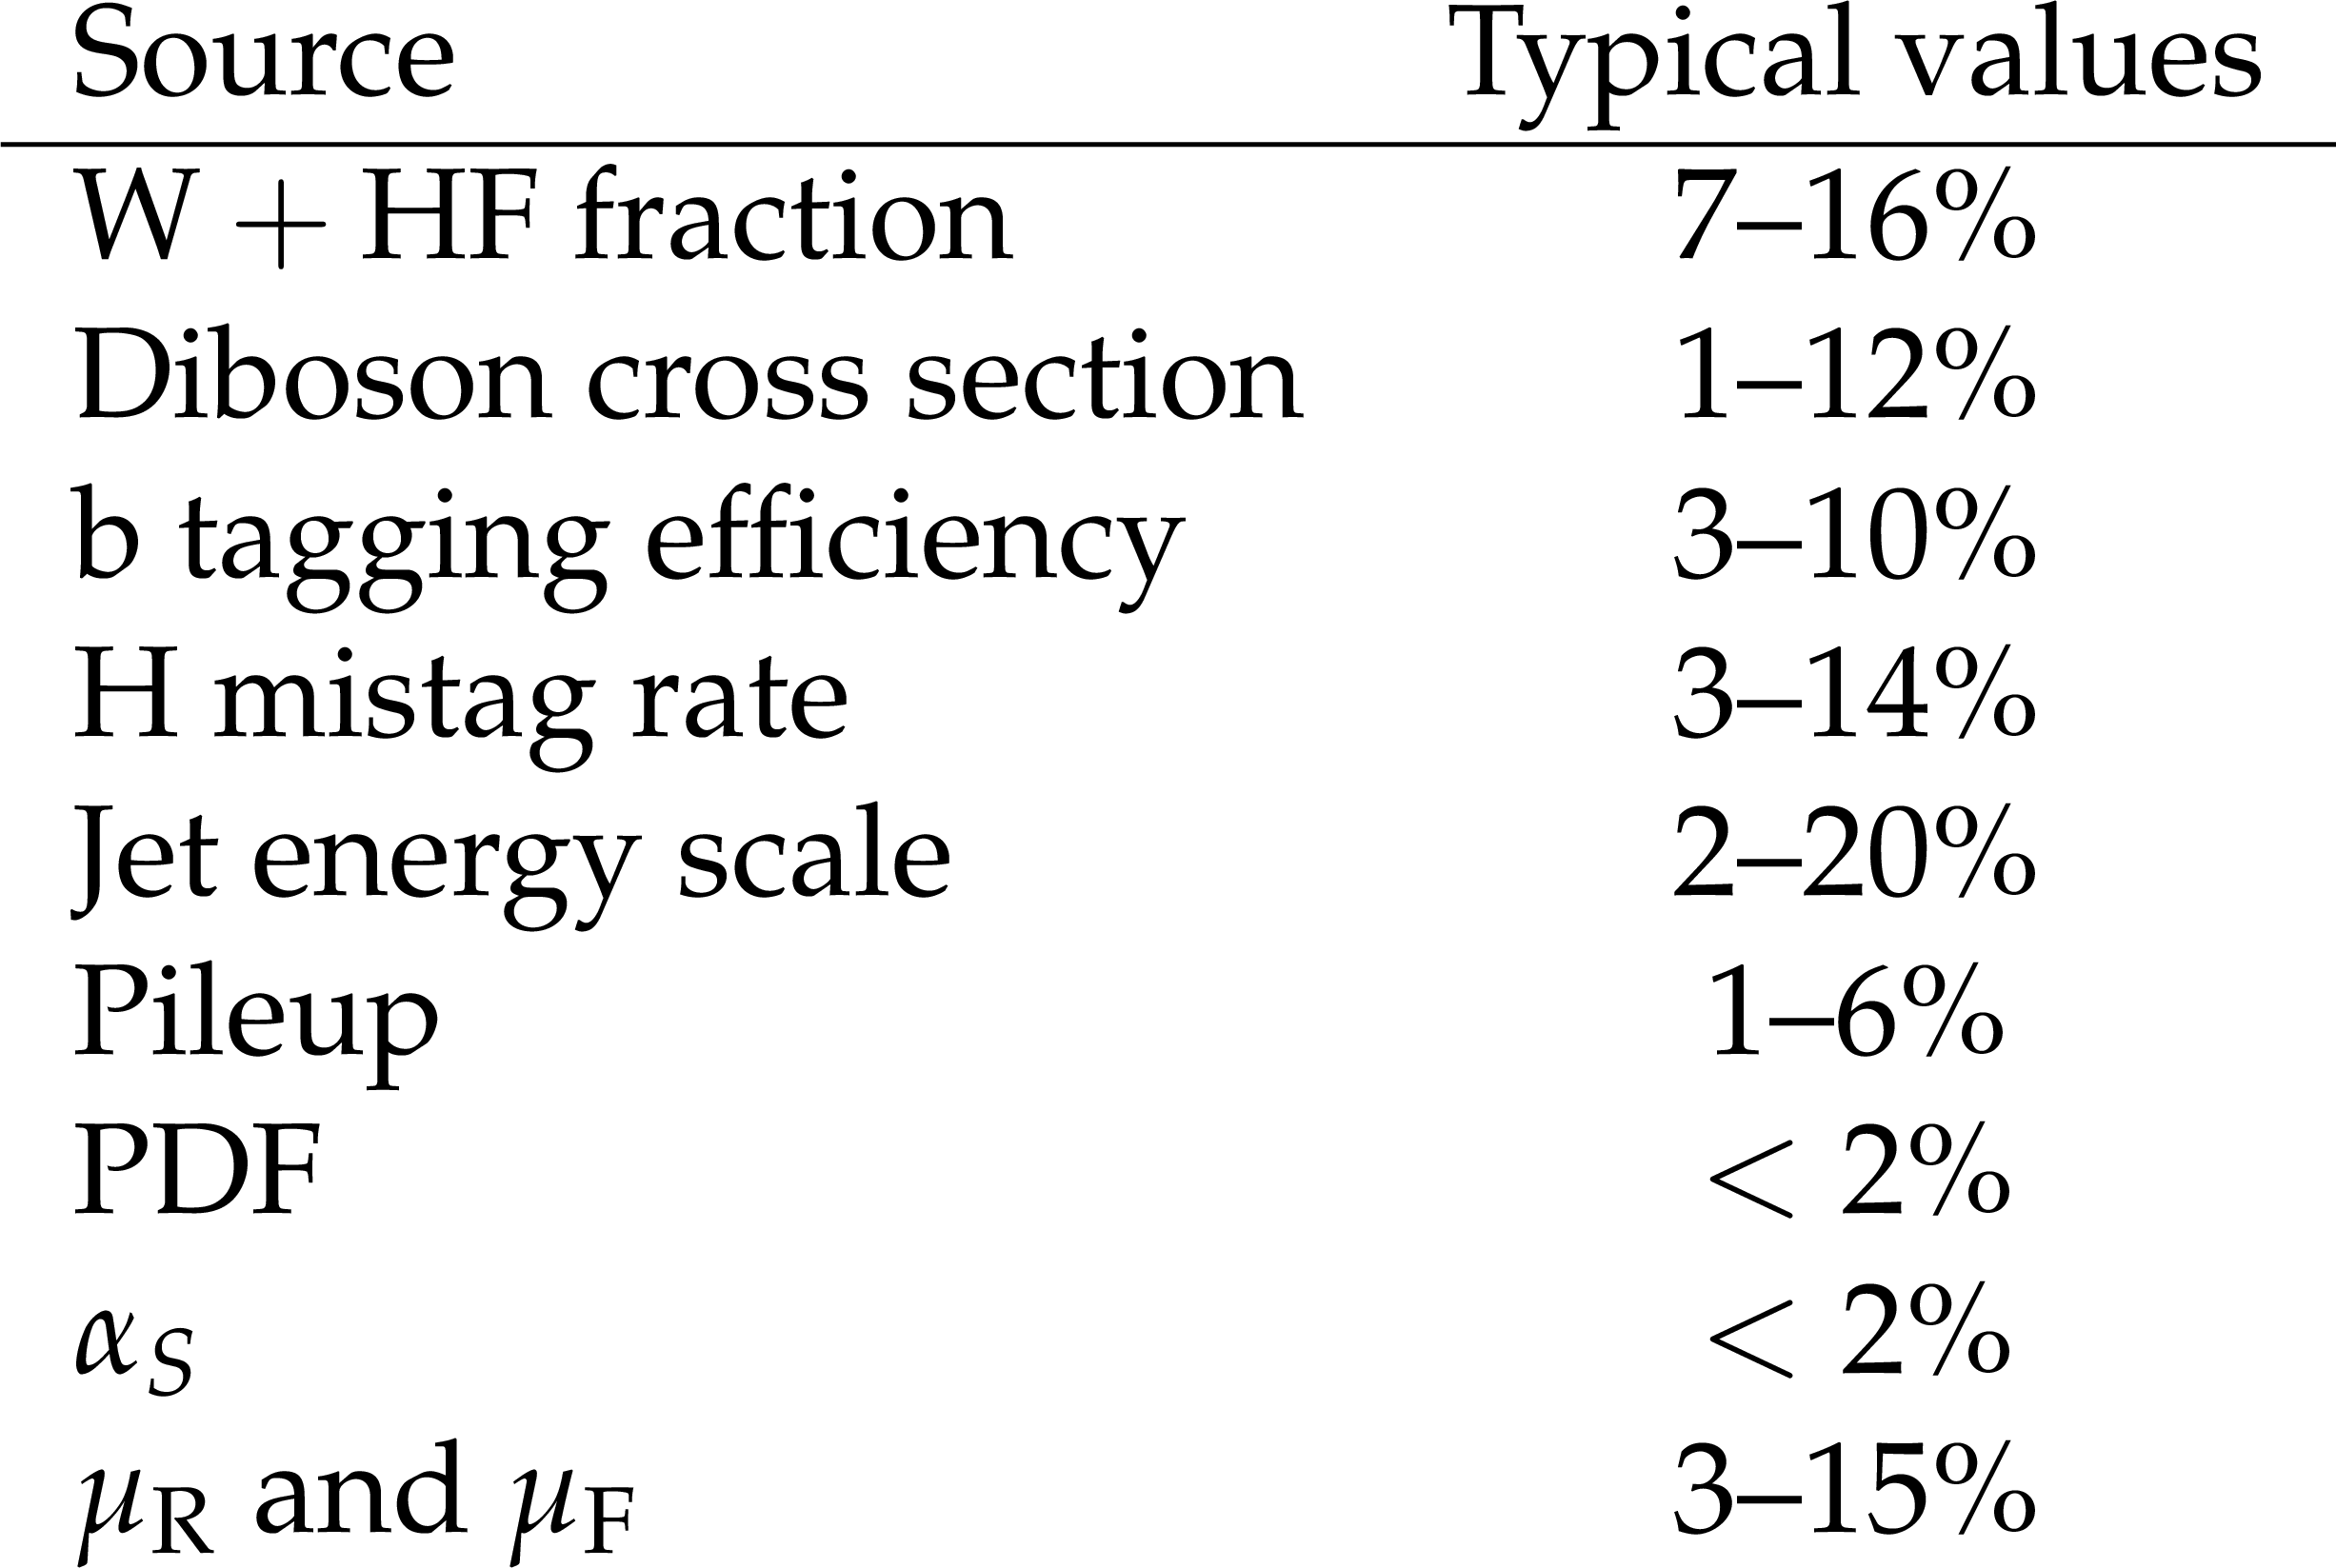
Table 7:
Sources of systematic uncertainties and their typical impact on ${R_{\mathrm{W}}}$. |
png pdf |
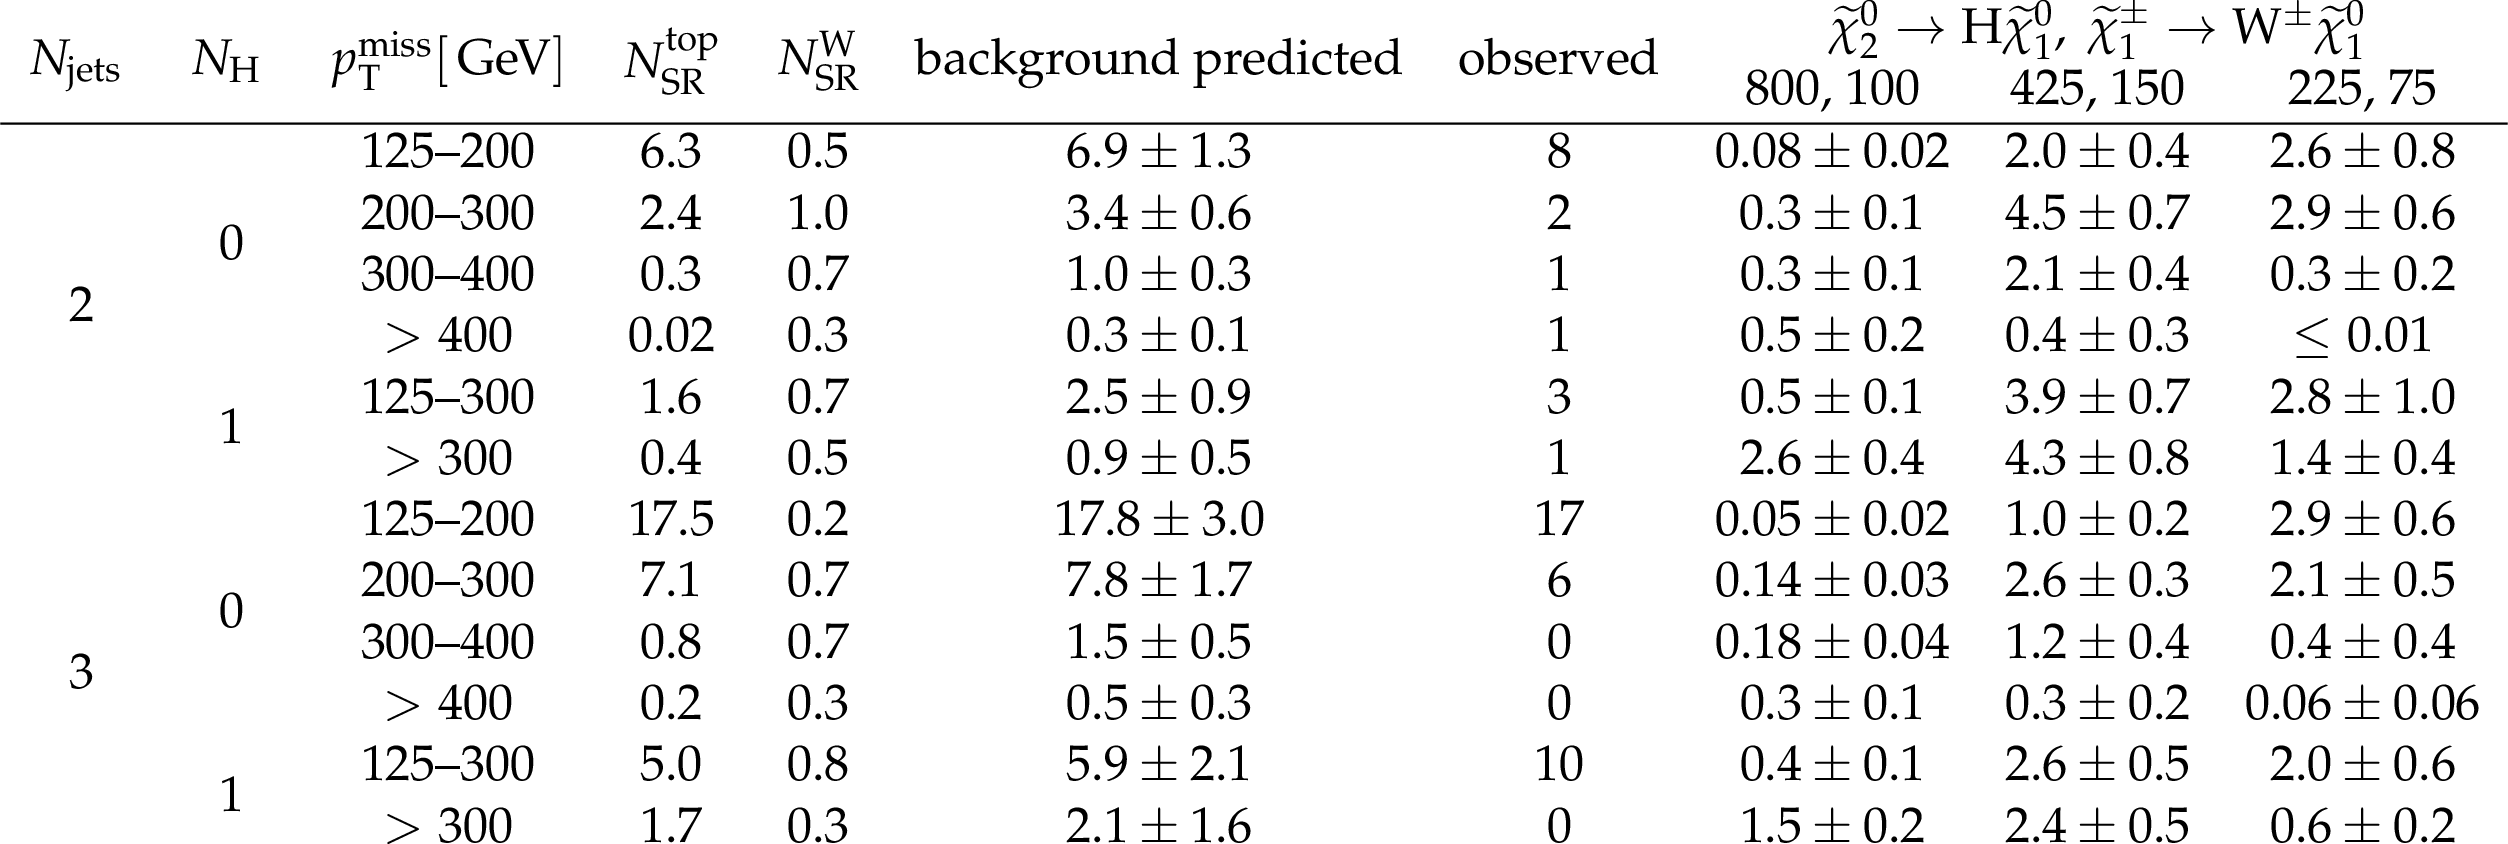
Table 8:
Summary of the predicted SM background and the observed yield in the signal regions, together with the expected yields for three signal benchmark models. The total prediction is the sum of the top quark and W boson predictions, $N_{\mathrm {SR}}^{\mathrm {top}}$ and $N_{\mathrm {SR}}^{\mathrm {\mathrm{W}}}$, as well as small contributions from standard model WH production. The uncertainties include the statistical and systematic components. For each benchmark model column, the ordered pairs indicate the masses (in GeV) of the $\tilde{\chi}^0_2 /\tilde{\chi}^{\pm}_1$ and the $\tilde{\chi}^0_1$, respectively. |

png pdf |
Table 9:
Sources of systematic uncertainties and their typical impact on the expected signal yields. The ranges reported reflect the magnitudes of the median 68% of all impacts, considering all 12 signal regions and every signal mass pair used. When the lower bound is very close to 0, an upper bound is shown instead. |
| Summary |
| This note presents the results of a search for chargino-neutralino production in a final state with a W boson decaying to leptons, a H boson decaying to a bottom quark-antiquark pair, and missing transverse momentum. Expected yields from SM processes are estimated by extrapolating yields in data control regions using transfer factors obtained from simulation. The observed data agree with the expected background yields. The results are interpreted as an exclusion on chargino-neutralino production. Charginos with mass below 820 GeV are disfavored for a low mass LSP, and values of the LSP mass up to about 350 GeV are excluded for a chargino mass around 700 GeV. |
| References | ||||
| 1 | CMS Collaboration | Search for supersymmetry using Higgs boson to diphoton decays at $ \sqrt{s}= $ 13 TeV | JHEP 11 (2019) 109 | |
| 2 | CMS Collaboration | Combined search for supersymmetry with photons in proton-proton collisions at $ \sqrt{s}= $ 13 TeV | PLB 801 (2019) 135183 | |
| 3 | CMS Collaboration | Search for supersymmetry in pp collisions at $ \sqrt{s}= $ 13 TeV with 137 $ \text{fb}^{\text{-1}} $ in final states with a single lepton using the sum of masses of large-radius jets | PRD 101 (2020) | |
| 4 | CMS Collaboration | Search for physics beyond the standard model in events with jets and two same-sign or at least three charged leptons in proton-proton collisions at $ \sqrt{s}= $ 13 TeV | EPJC 80 (2020) | |
| 5 | CMS Collaboration | Searches for physics beyond the standard model with the $ m_{\mathrm {t2}} $ variable in hadronic final states with and without disappearing tracks in proton-proton collisions at $ \sqrt{s}= $ 13 TeV | EPJC 80 (2020) | |
| 6 | CMS Collaboration | Search for direct top squark pair production in events with one lepton, jets, and missing transverse momentum at 13 TeV with the CMS experiment | JHEP 2020 (2020) | |
| 7 | CMS Collaboration | Search for top squark pair production using dilepton final states in $ {\text {p}}{\text {p}} $ collision data collected at $ \sqrt{s}= $ 13 TeV | EPJC 81 (2021) 3 | |
| 8 | CMS Collaboration | Search for gauge-mediated supersymmetry in events with at least one photon and missing transverse momentum in pp collisions at $ \sqrt{s}= $ 13 TeV | PLB 780 (2018) 118--143 | |
| 9 | ATLAS Collaboration | Search for photonic signatures of gauge-mediated supersymmetry in 13 $ TeV pp $ collisions with the ATLAS detector | PRD 97 (2018), no. 9 | |
| 10 | ATLAS Collaboration | Search for new phenomena in final states with large jet multiplicities and missing transverse momentum using $ \sqrt{s} = $ 13 TeV proton-proton collisions recorded by ATLAS in Run 2 of the LHC | JHEP 10 (2020) 062 | 2008.06032 |
| 11 | ATLAS Collaboration | Search for a scalar partner of the top quark in the all-hadronic $ t{\bar{t}} $ plus missing transverse momentum final state at $ \sqrt{s}= $ 13 TeV with the ATLAS detector | EPJC 80 (2020), no. 8, 737 | 2004.14060 |
| 12 | ATLAS Collaboration | Search for squarks and gluinos in final states with same-sign leptons and jets using 139 fb$ ^{-1} $ of data collected with the ATLAS detector | JHEP 06 (2020) 046 | 1909.08457 |
| 13 | ATLAS Collaboration | Search for bottom-squark pair production with the ATLAS detector in final states containing Higgs bosons, $ b $-jets and missing transverse momentum | JHEP 12 (2019) 060 | 1908.03122 |
| 14 | CMS Collaboration | Search for electroweak production of charginos and neutralinos in WH events in proton-proton collisions at $ \sqrt{s}= $ 13 TeV | JHEP 11 (2017) 029 | CMS-SUS-16-043 1706.09933 |
| 15 | ATLAS Collaboration | Search for direct production of electroweakinos in final states with one lepton, missing transverse momentum and a higgs boson decaying into two b-jets in pp collisions $ \sqrt{s}= $ 13 TeV with the atlas detector | EPJC 80 (2020) 691 | |
| 16 | CMS Collaboration | Searches for electroweak neutralino and chargino production in channels with Higgs, Z, and W bosons in pp collisions at 8 TeV | PRD 90 (2014), no. 9, 092007 | CMS-SUS-14-002 1409.3168 |
| 17 | CMS Collaboration | Searches for electroweak production of charginos, neutralinos, and sleptons decaying to leptons and W, Z, and Higgs bosons in pp collisions at 8 TeV | EPJC 74 (2014), no. 9 | CMS-SUS-13-006 1405.7570 |
| 18 | ATLAS Collaboration | Search for the electroweak production of supersymmetric particles in $ \sqrt{s} = $ 8 TeV pp collisions with the ATLAS detector | PRD 93 (2016), no. 5, 052002 | 1509.07152 |
| 19 | CMS Collaboration | The CMS experiment at the CERN LHC | JINST 3 (2008) S08004 | CMS-00-001 |
| 20 | CMS Collaboration | The CMS trigger system | JINST 12 (2017) P01020 | CMS-TRG-12-001 1609.02366 |
| 21 | J. Alwall et al. | The automated computation of tree-level and next-to-leading order differential cross sections, and their matching to parton shower simulations | JHEP 07 (2014) 079 | 1405.0301 |
| 22 | P. Nason | A new method for combining NLO QCD with shower Monte Carlo algorithms | JHEP 11 (2004) 040 | hep-ph/0409146 |
| 23 | S. Frixione, P. Nason, and C. Oleari | Matching NLO QCD computations with parton shower simulations: the POWHEG method | JHEP 11 (2007) 070 | 0709.2092 |
| 24 | S. Alioli, P. Nason, C. Oleari, and E. Re | A general framework for implementing NLO calculations in shower Monte Carlo programs: the POWHEG BOX | JHEP 06 (2010) 043 | 1002.2581 |
| 25 | E. Re | Single-top $ \mathrm{W}\mathrm{t} $-channel production matched with parton showers using the POWHEG method | EPJC 71 (2011) 1547 | 1009.2450 |
| 26 | NNPDF Collaboration | Unbiased global determination of parton distributions and their uncertainties at NNLO and at LO | NPB 855 (2012) 153 | 1107.2652 |
| 27 | NNPDF Collaboration | Parton distributions for the LHC Run II | JHEP 04 (2015) 040 | 1410.8849 |
| 28 | NNPDF Collaboration | Parton distributions from high-precision collider data | EPJC 77 (2017) 663 | 1706.00428 |
| 29 | T. Sjostrand et al. | An introduction to PYTHIA 8.2 | CPC 191 (2015) 159 | 1410.3012 |
| 30 | J. Alwall et al. | Comparative study of various algorithms for the merging of parton showers and matrix elements in hadronic collisions | EPJC 53 (2008) 473 | 0706.2569 |
| 31 | R. Frederix and S. Frixione | Merging meets matching in MC@NLO | JHEP 12 (2012) 061 | 1209.6215 |
| 32 | CMS Collaboration | Event generator tunes obtained from underlying event and multiparton scattering measurements | EPJC 76 (2016) 155 | CMS-GEN-14-001 1512.00815 |
| 33 | CMS Collaboration | Extraction and validation of a new set of CMS PYTHIA8 tunes from underlying-event measurements | EPJC 80 (2020) 4 | CMS-GEN-17-001 1903.12179 |
| 34 | GEANT 4 Collaboration | GEANT4 -- a simulation toolkit | NIMA 506 (2003) 250 | |
| 35 | S. Abdullin et al. | The fast simulation of the CMS detector at LHC | J. Phys. Conf. Ser. 331 (2011) 032049 | |
| 36 | A. Giammanco | The Fast Simulation of the CMS Experiment | J. Phys. Conf. Ser. 513 (2014) 022012 | |
| 37 | Y. Li and F. Petriello | Combining QCD and electroweak corrections to dilepton production in FEWZ | PRD 86 (2012) 094034 | 1208.5967 |
| 38 | M. Aliev et al. | HATHOR: HAdronic Top and Heavy quarks crOss section calculatoR | CPC 182 (2011) 1034 | 1007.1327 |
| 39 | P. Kant et al. | HatHor for single top-quark production: Updated predictions and uncertainty estimates for single top-quark production in hadronic collisions | CPC 191 (2015) 74 | 1406.4403 |
| 40 | M. Beneke, P. Falgari, S. Klein, and C. Schwinn | Hadronic top-quark pair production with NNLL threshold resummation | NPB 855 (2012) 695 | 1109.1536 |
| 41 | M. Cacciari et al. | Top-pair production at hadron colliders with next-to-next-to-leading logarithmic soft-gluon resummation | PLB 710 (2012) 612 | 1111.5869 |
| 42 | M. Czakon and A. Mitov | Top++: A Program for the Calculation of the Top-Pair Cross-Section at Hadron Colliders | CPC 185 (2014) 2930 | 1112.5675 |
| 43 | P. Barnreuther, M. Czakon, and A. Mitov | Percent level precision physics at the tevatron: First genuine NNLO QCD corrections to $ q \bar{q} \to t \bar{t} + X $ | PRL 109 (2012) 132001 | 1204.5201 |
| 44 | M. Czakon and A. Mitov | NNLO corrections to top-pair production at hadron colliders: the all-fermionic scattering channels | JHEP 12 (2012) 054 | 1207.0236 |
| 45 | M. Czakon and A. Mitov | NNLO corrections to top pair production at hadron colliders: the quark-gluon reaction | JHEP 01 (2013) 080 | 1210.6832 |
| 46 | M. Czakon, P. Fiedler, and A. Mitov | Total top-quark pair-production cross section at hadron colliders through $ O({\alpha_S}^4) $ | PRL 110 (2013) 252004 | 1303.6254 |
| 47 | W. Beenakker, R. Hopker, M. Spira, and P. M. Zerwas | Squark and gluino production at hadron colliders | NPB 492 (1997) 51 | hep-ph/9610490 |
| 48 | A. Kulesza and L. Motyka | Threshold resummation for squark-antisquark and gluino-pair production at the LHC | PRL 102 (2009) 111802 | 0807.2405 |
| 49 | A. Kulesza and L. Motyka | Soft gluon resummation for the production of gluino-gluino and squark-antisquark pairs at the LHC | PRD 80 (2009) 095004 | 0905.4749 |
| 50 | W. Beenakker et al. | Soft-gluon resummation for squark and gluino hadroproduction | JHEP 12 (2009) 041 | 0909.4418 |
| 51 | W. Beenakker et al. | Squark and Gluino Hadroproduction | Int. J. Mod. Phys. A 26 (2011) 2637 | 1105.1110 |
| 52 | C. Borschensky et al. | Squark and gluino production cross sections in $ pp $ collisions at $ \sqrt{s} = $ 13, 14, 33 and 100 TeV | EPJC 74 (2014) 3174 | 1407.5066 |
| 53 | W. Beenakker et al. | NNLL-fast: predictions for coloured supersymmetric particle production at the LHC with threshold and Coulomb resummation | JHEP 12 (2016) 133 | 1607.07741 |
| 54 | CMS Collaboration | Particle-flow reconstruction and global event description with the CMS detector | JINST 12 (2017) P10003 | CMS-PRF-14-001 1706.04965 |
| 55 | CMS Collaboration | Performance of electron reconstruction and selection with the CMS detector in proton-proton collisions at $ \sqrt{s} = $ 8 TeV | JINST 10 (2015) P06005 | CMS-EGM-13-001 1502.02701 |
| 56 | CMS Collaboration | Performance of the CMS muon detector and muon reconstruction with proton-proton collisions at $ \sqrt{s} = $ 13 TeV | JINST 13 (2018) P06015 | CMS-MUO-16-001 1804.04528 |
| 57 | M. Cacciari, G. P. Salam, and G. Soyez | The anti-$ {k_{\mathrm{T}}} $ jet clustering algorithm | JHEP 04 (2008) 063 | 0802.1189 |
| 58 | M. Cacciari, G. P. Salam, and G. Soyez | FastJet user manual | EPJC 72 (2012) 1896 | 1111.6097 |
| 59 | CMS Collaboration | Determination of Jet Energy Calibration and Transverse Momentum Resolution in CMS | JINST 6 (2011) P11002 | CMS-JME-10-011 1107.4277 |
| 60 | CMS Collaboration | Identification of heavy-flavour jets with the CMS detector in $ {\mathrm{p}}{\mathrm{p}} $ collisions at 13 TeV | JINST 13 (2018) P05011 | CMS-BTV-16-002 1712.07158 |
| 61 | CMS Collaboration | Machine learning-based identification of highly Lorentz-boosted hadronically decaying particles at the CMS experiment | CMS-PAS-JME-18-002 | CMS-PAS-JME-18-002 |
| 62 | CMS Collaboration | Performance of missing transverse momentum reconstruction in proton-proton collisions at $ \sqrt{s} = $ 13 TeV using the CMS detector | JINST 14 (2019) P07004 | CMS-JME-17-001 1903.06078 |
| 63 | CMS Collaboration | Missing transverse energy performance of the CMS detector | JINST 6 (2011) P09001 | CMS-JME-10-009 1106.5048 |
| 64 | D. R. Tovey | On measuring the masses of pair-produced semi-invisibly decaying particles at hadron colliders | JHEP 04 (2008) 034 | 0802.2879 |
| 65 | CMS Collaboration | Jet energy scale and resolution performance with 13 TeV data collected by CMS in 2016-2018 | CDS | |
| 66 | S. Catani, D. de Florian, M. Grazzini, and P. Nason | Soft gluon resummation for Higgs boson production at hadron colliders | JHEP 07 (2003) 028 | hep-ph/0306211 |
| 67 | M. Cacciari et al. | The t anti-t cross-section at 1.8-TeV and 1.96-TeV: A Study of the systematics due to parton densities and scale dependence | JHEP 04 (2004) 068 | hep-ph/0303085 |
| 68 | A. Kalogeropoulos and J. Alwall | The syscalc code: A tool to derive theoretical systematic uncertainties | 1801.08401 | |
| 69 | CMS Collaboration | CMS Luminosity Measurements for the 2016 Data Taking Period | CMS-PAS-LUM-17-001 | CMS-PAS-LUM-17-001 |
| 70 | CMS Collaboration | CMS luminosity measurement for the 2017 data-taking period at $ \sqrt{s} = $ 13 TeV | CMS-PAS-LUM-17-004 | CMS-PAS-LUM-17-004 |
| 71 | CMS Collaboration | CMS luminosity measurement for the 2018 data-taking period at $ \sqrt{s} = $ 13 TeV | CMS-PAS-LUM-18-002 | CMS-PAS-LUM-18-002 |
| 72 | T. Junk | Confidence level computation for combining searches with small statistics | NIM A 434 (1999) 435--443 | |
| 73 | A. L. Read | Presentation of search results: the CL$_{s} $ technique | J. Physics G 28 (2002) 2693--2704 | |
|
|
Compact Muon Solenoid LHC, CERN |
|

|

|

|

|

|