

Compact Muon Solenoid
LHC, CERN
| CMS-PAS-HIN-19-013 | ||
| Study of in-medium modification of dijets in PbPb collisions at 5.02 TeV | ||
| CMS Collaboration | ||
| July 2020 | ||
| Abstract: Modifications to the distribution of charged particles with respect to high transverse momentum $(p_{\mathrm{T}})$ jets passing through a quark-gluon plasma are explored. Jets corresponding to dijet selection where the leading and subleading jets are back-to-back are studied in lead-lead (PbPb) and proton-proton (pp) collisions. Correlations of charged particles are measured in relative pseudorapidity and relative azimuth from the jet axes. Jet momentum density profiles ("jet shapes") are determined. The events are categorized in bins of collision centrality, charged particle $p_{\mathrm{T}}$ and dijet momentum balance $x_{j}$, which is the ratio between the subleading and leading jet $p_{\mathrm{T}}$. In comparing the PbPb and pp collision results, modifications to the charged particle yields is found to depend on the $x_{j}$ value. Modifications to both the charged-particle pseudorapidity dependence and the jet momentum density profile are observed to be greater for the leading jet in more momentum balanced conditions. The modifications become more pronounced with respect to the subleading jet for events with a larger dijet momentum imbalance. | ||
|
Links:
CDS record (PDF) ;
CADI line (restricted) ;
These preliminary results are superseded in this paper, JHEP 05 (2021) 116. The superseded preliminary plots can be found here. |
||
| Figures & Tables | Summary | Additional Figures | References | CMS Publications |
|---|
| Figures | |
png pdf |
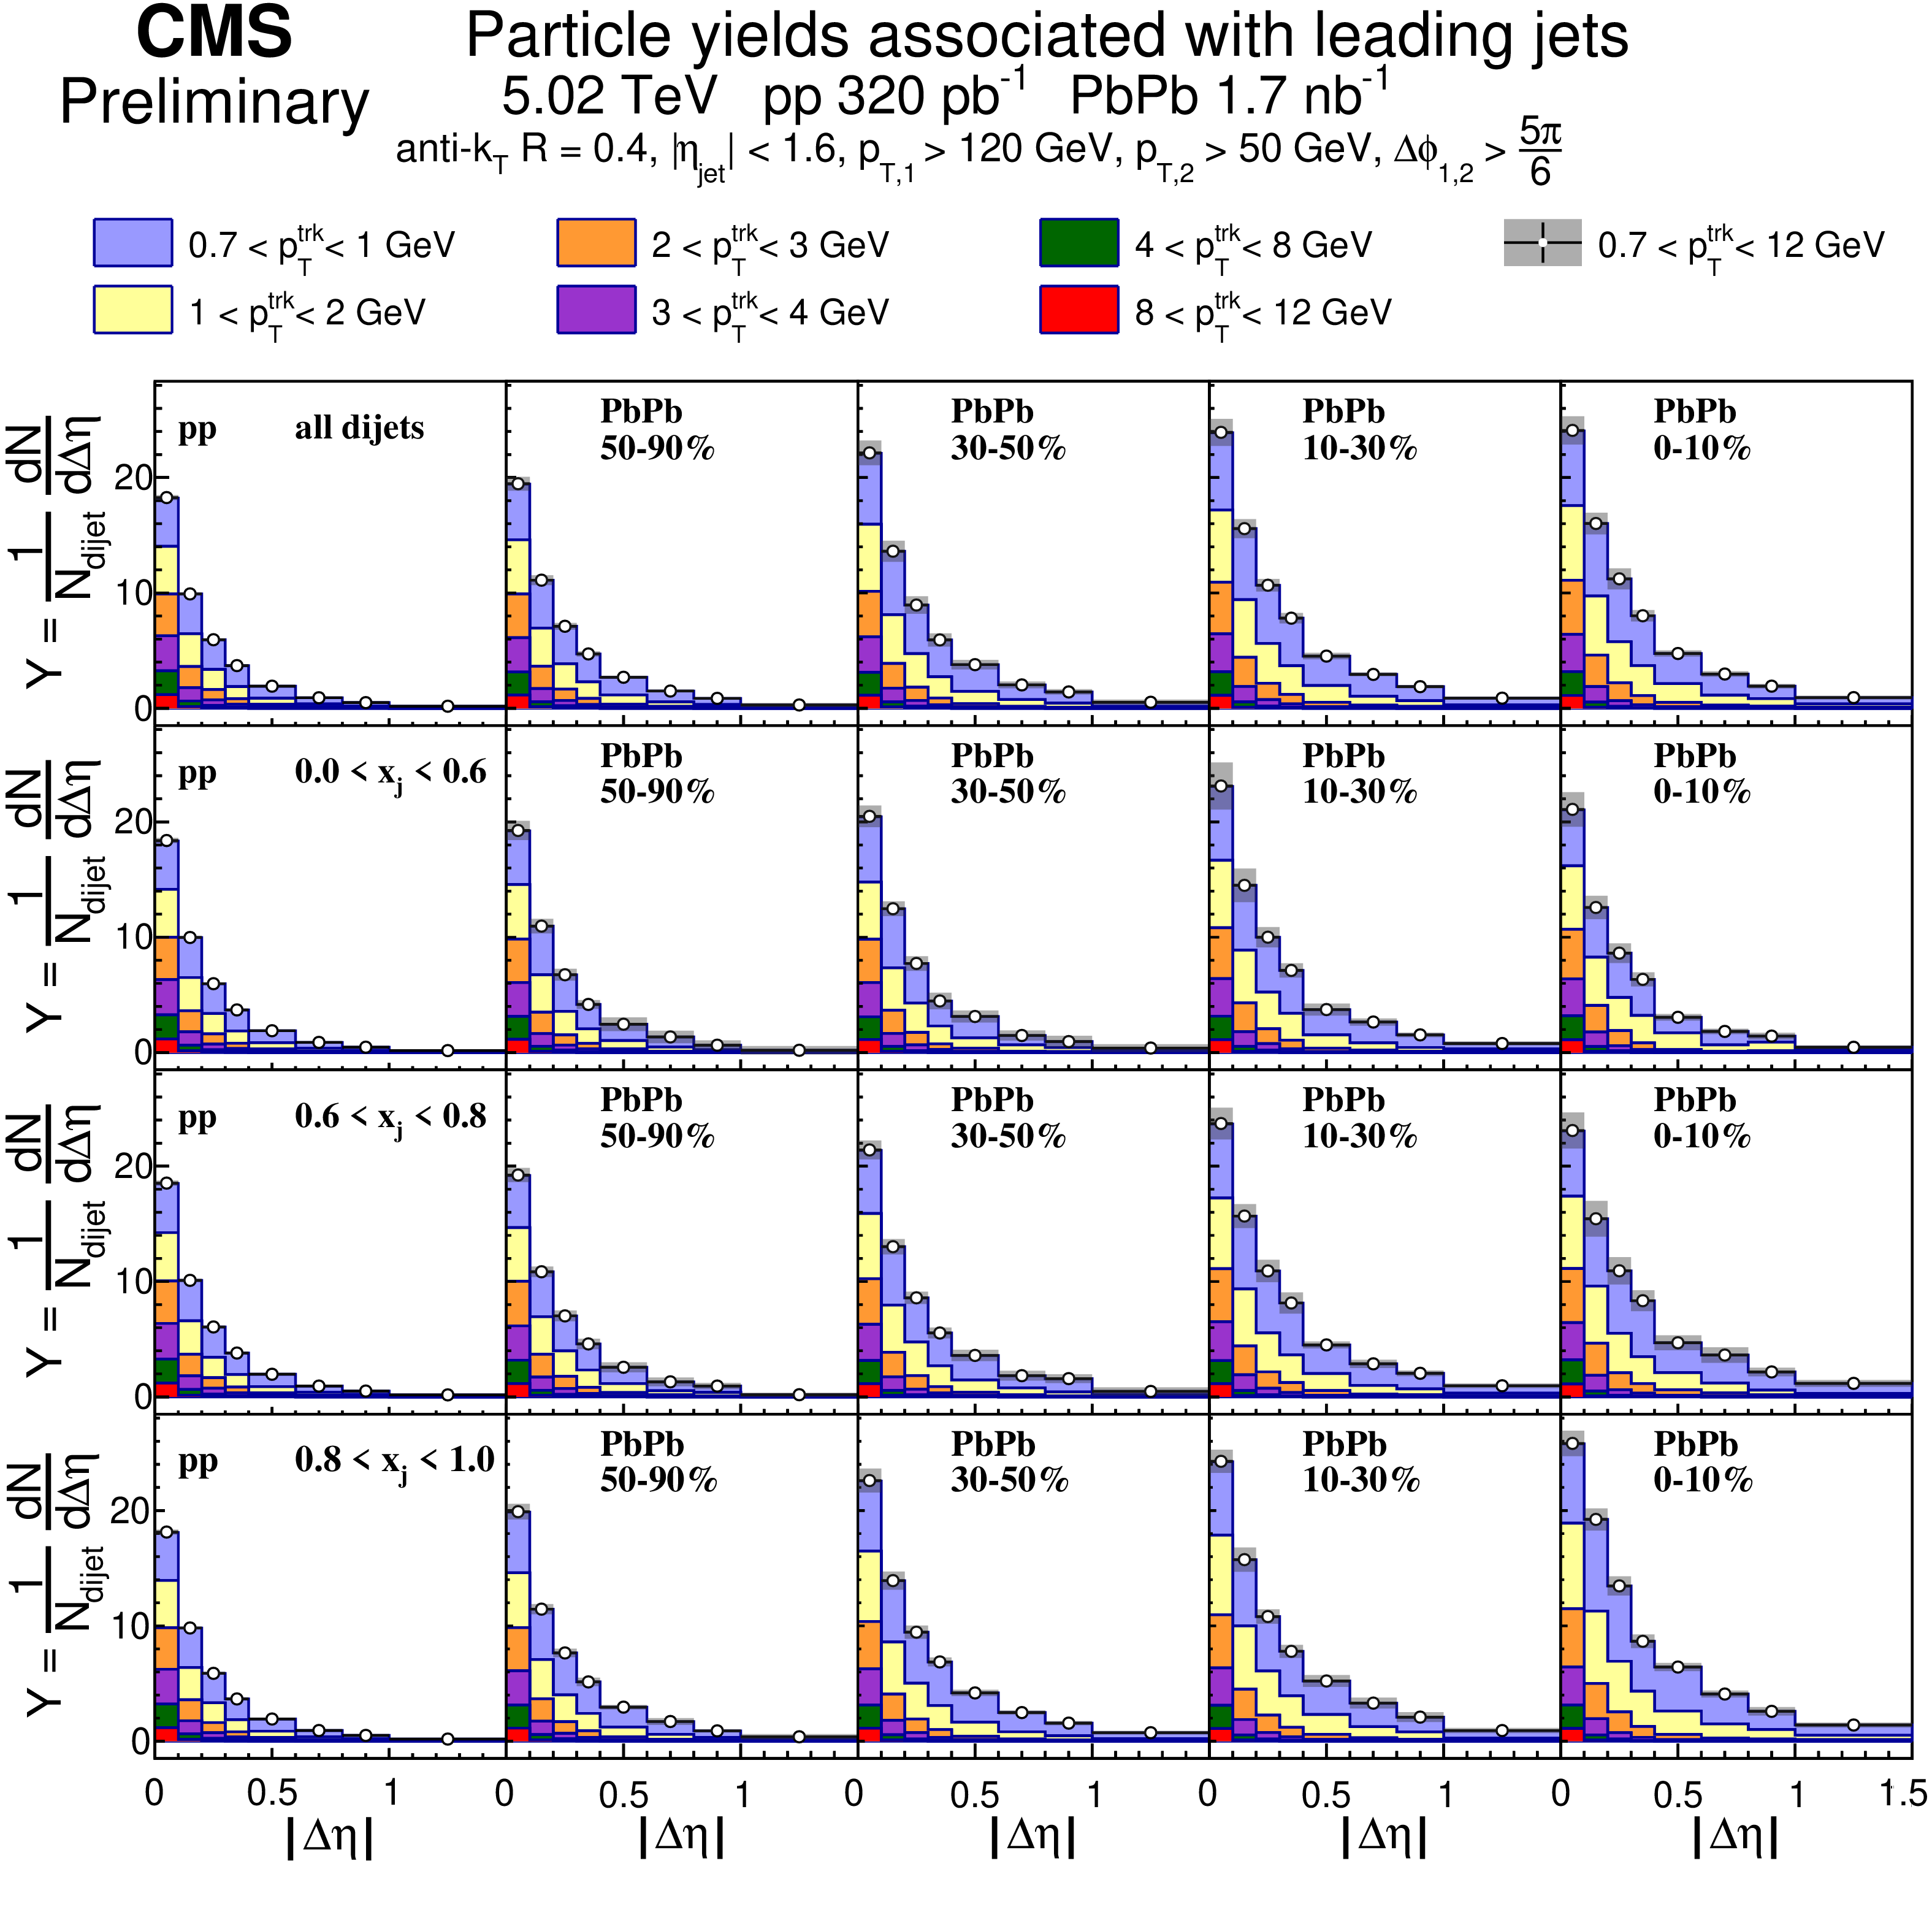
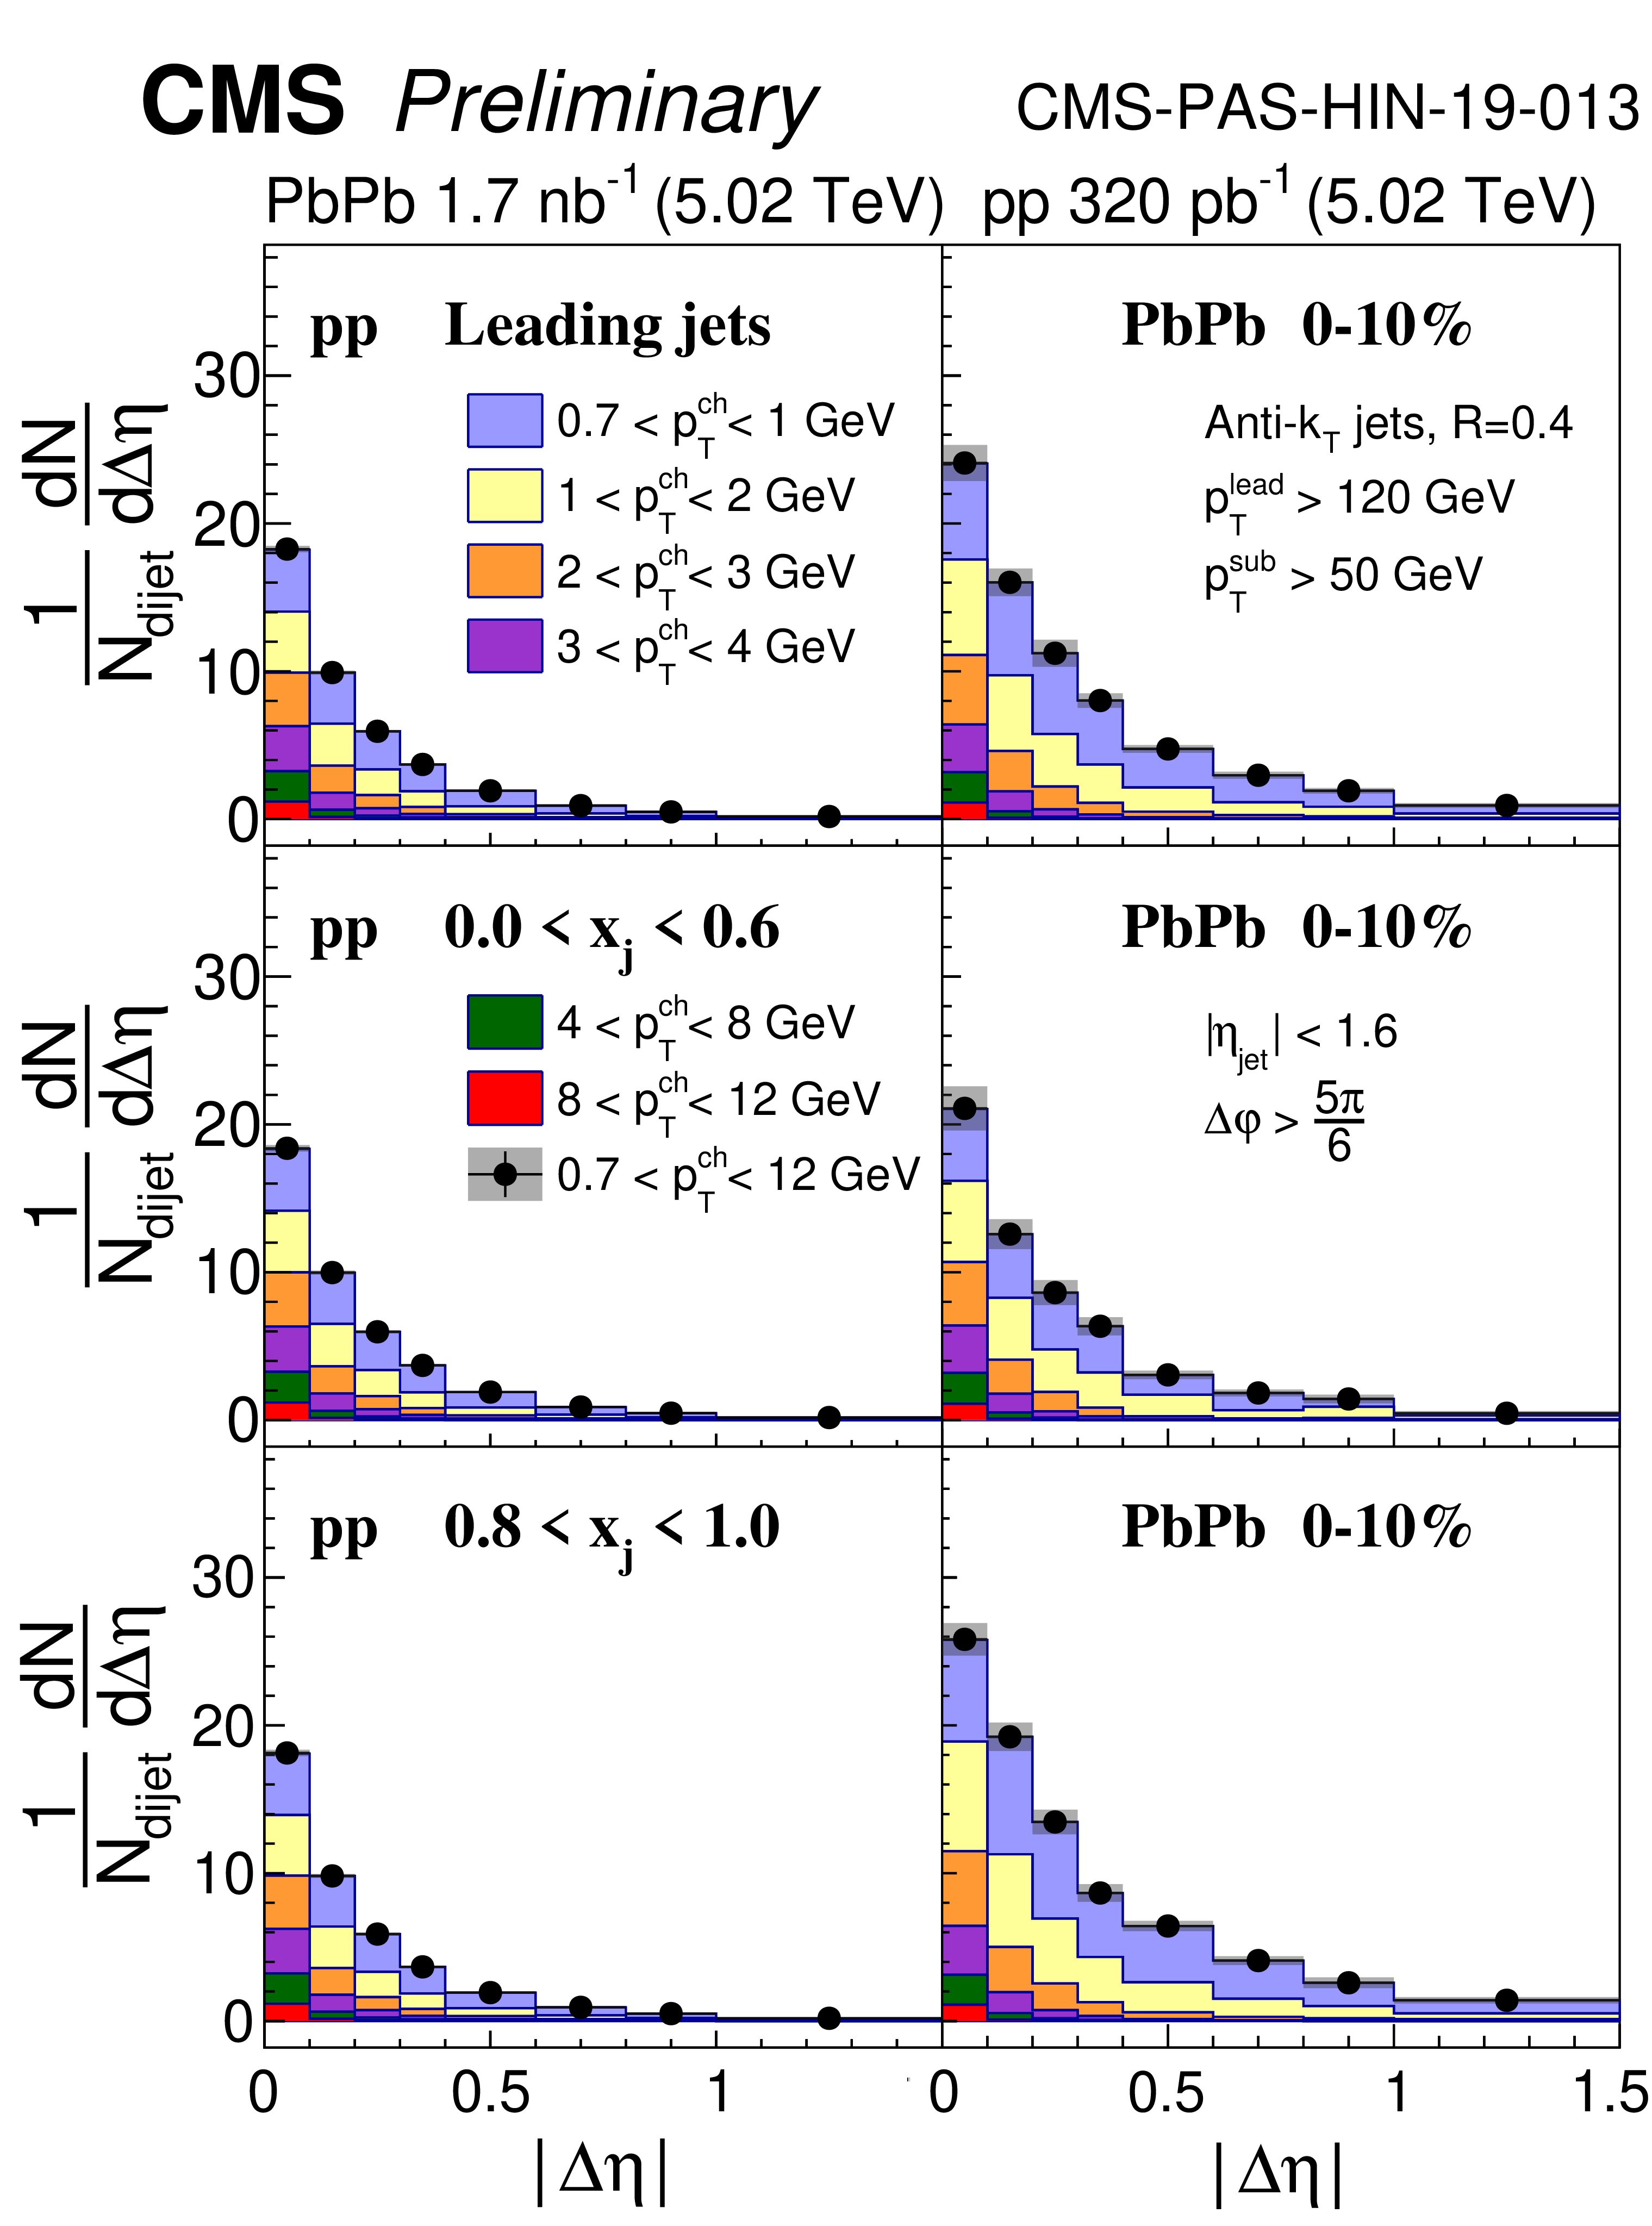
Figure 1:
Distributions of charged particle yields correlated to leading jets as a function of $|\Delta \eta |$ for pp (first column) and PbPb collisions in different centrality bins (second to fifth column), shown differentially for all $p_{\rm T}^{\rm trk}$ bins. The first row shows the charged particle yields without any selection on $x_{j}$, while other rows show the charged particle yields in different bins of $x_{j}$, starting with the most unbalanced 0 $ < x_{j} < $ 0.6 (second row) to most balanced 0.8 $ < x_{j} < $ 1.0 (fourth row) dijet events. |
png pdf |
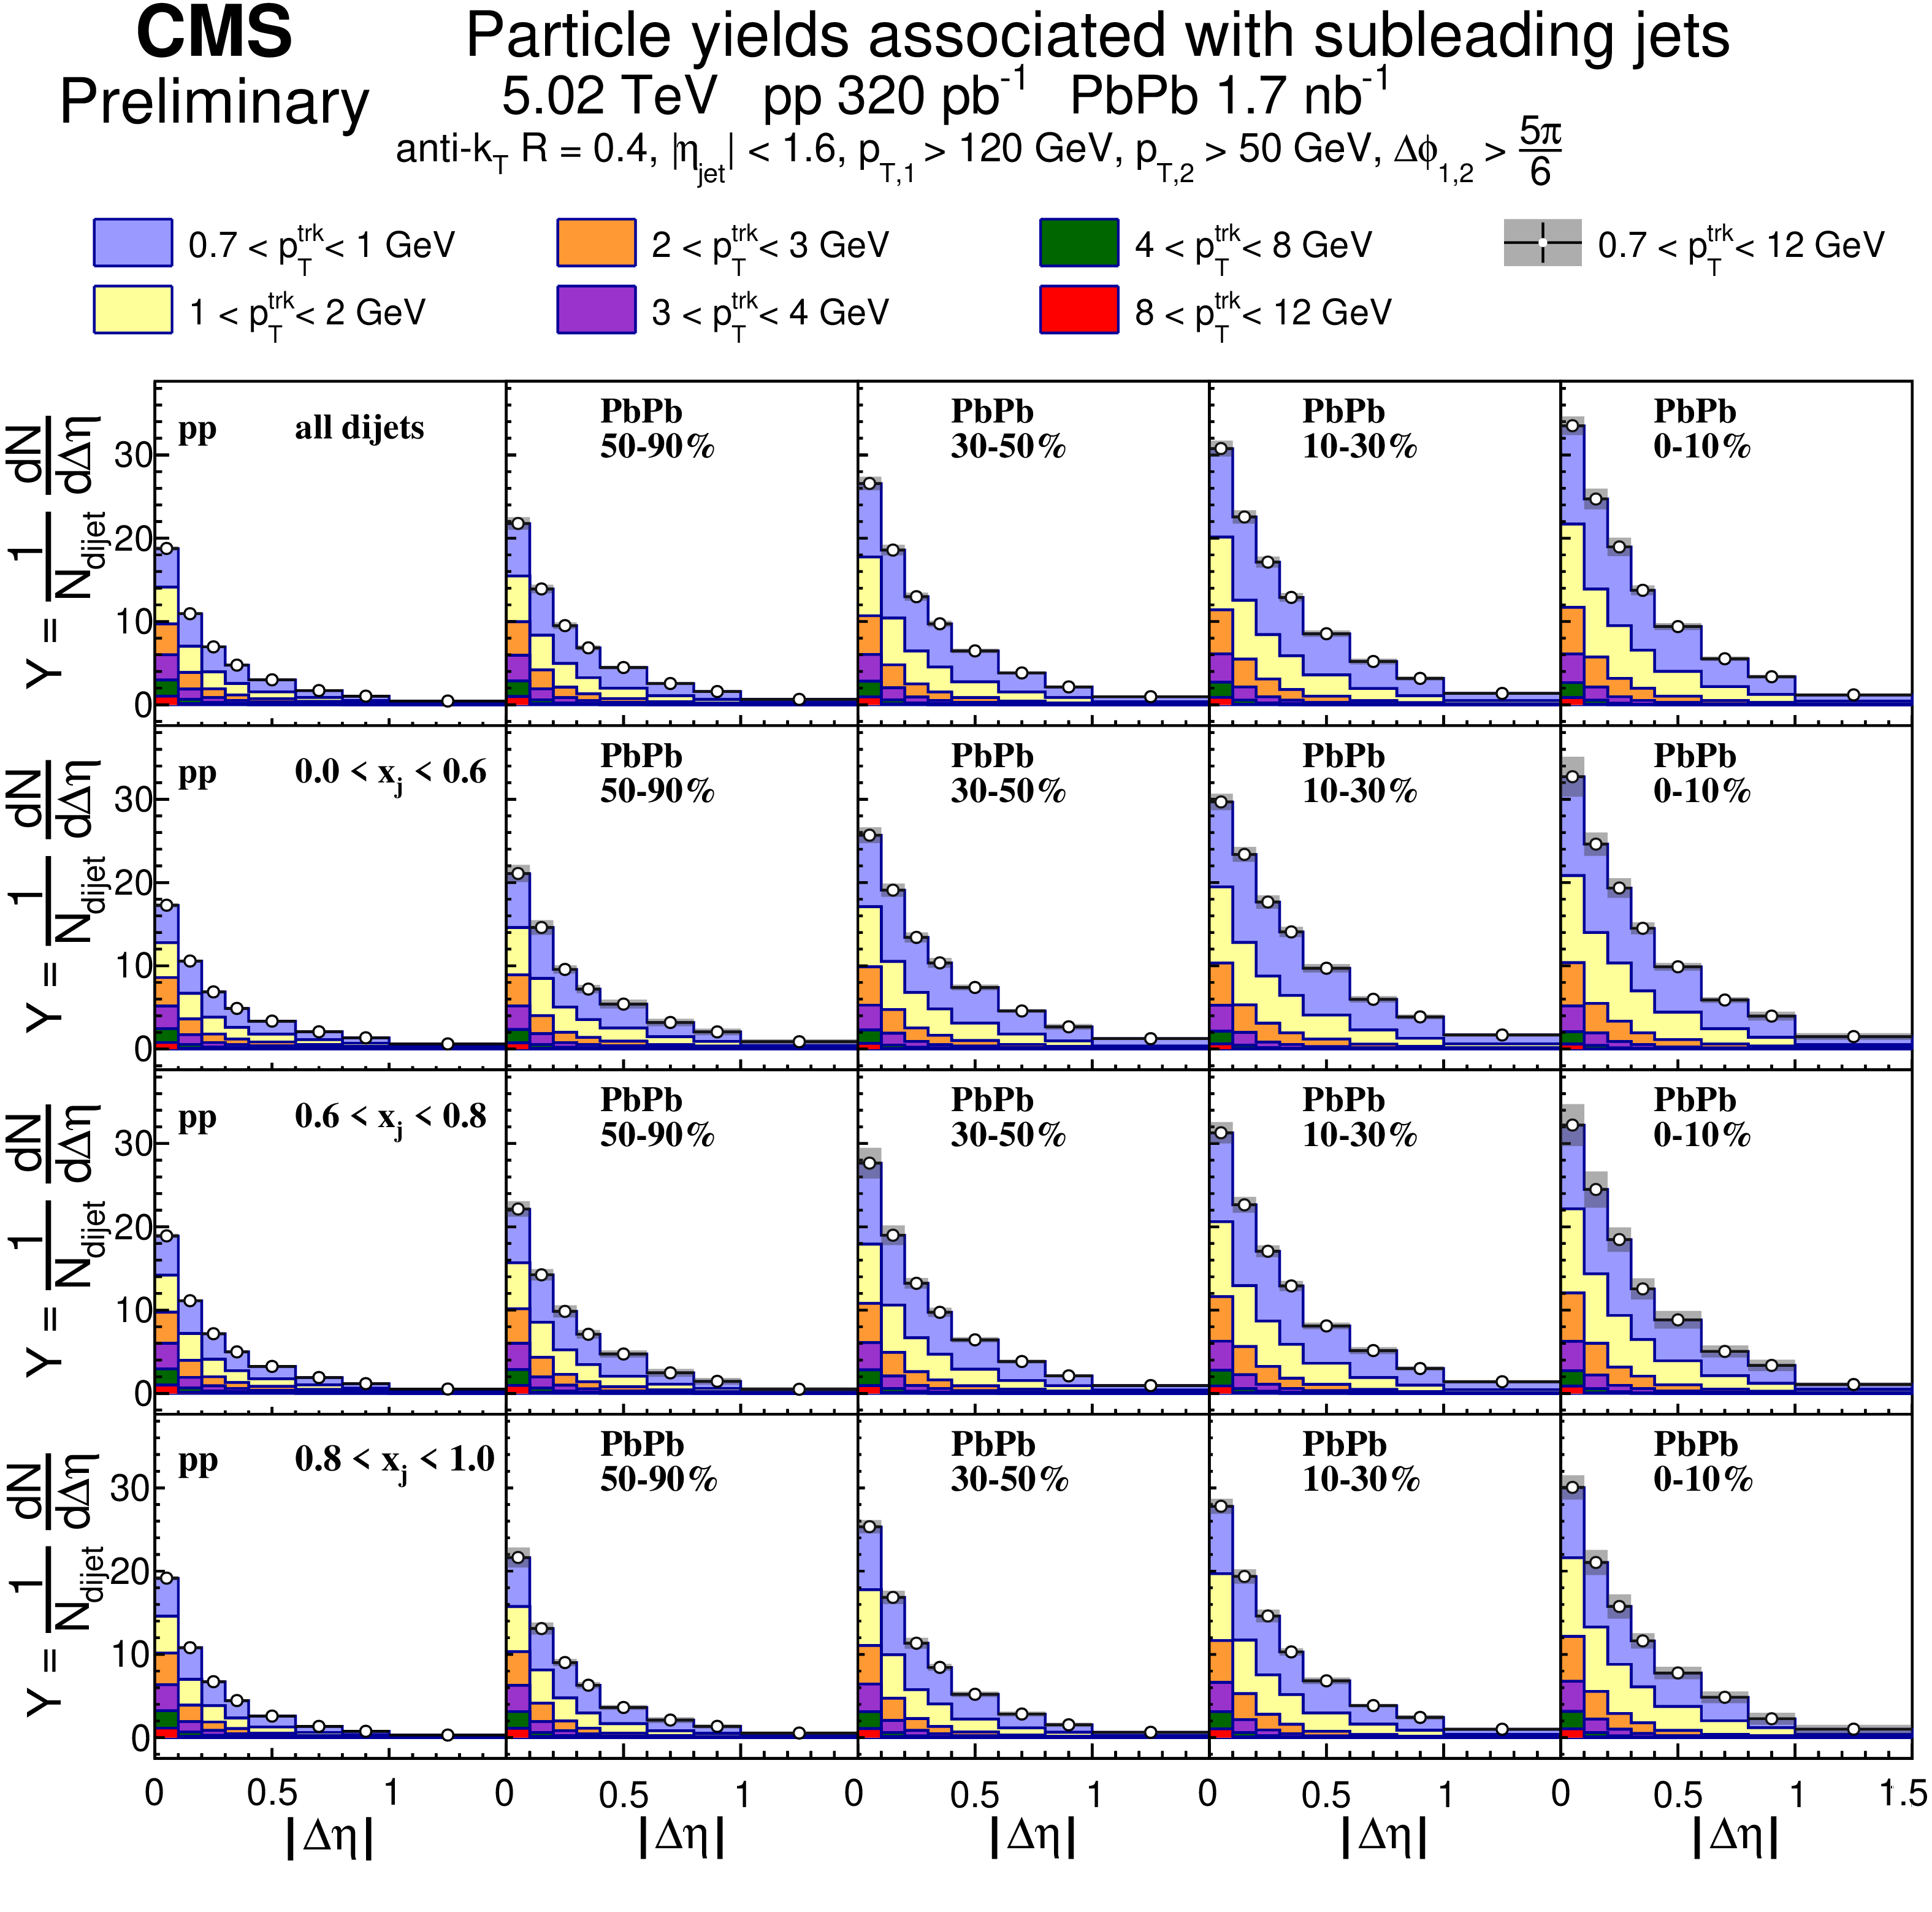
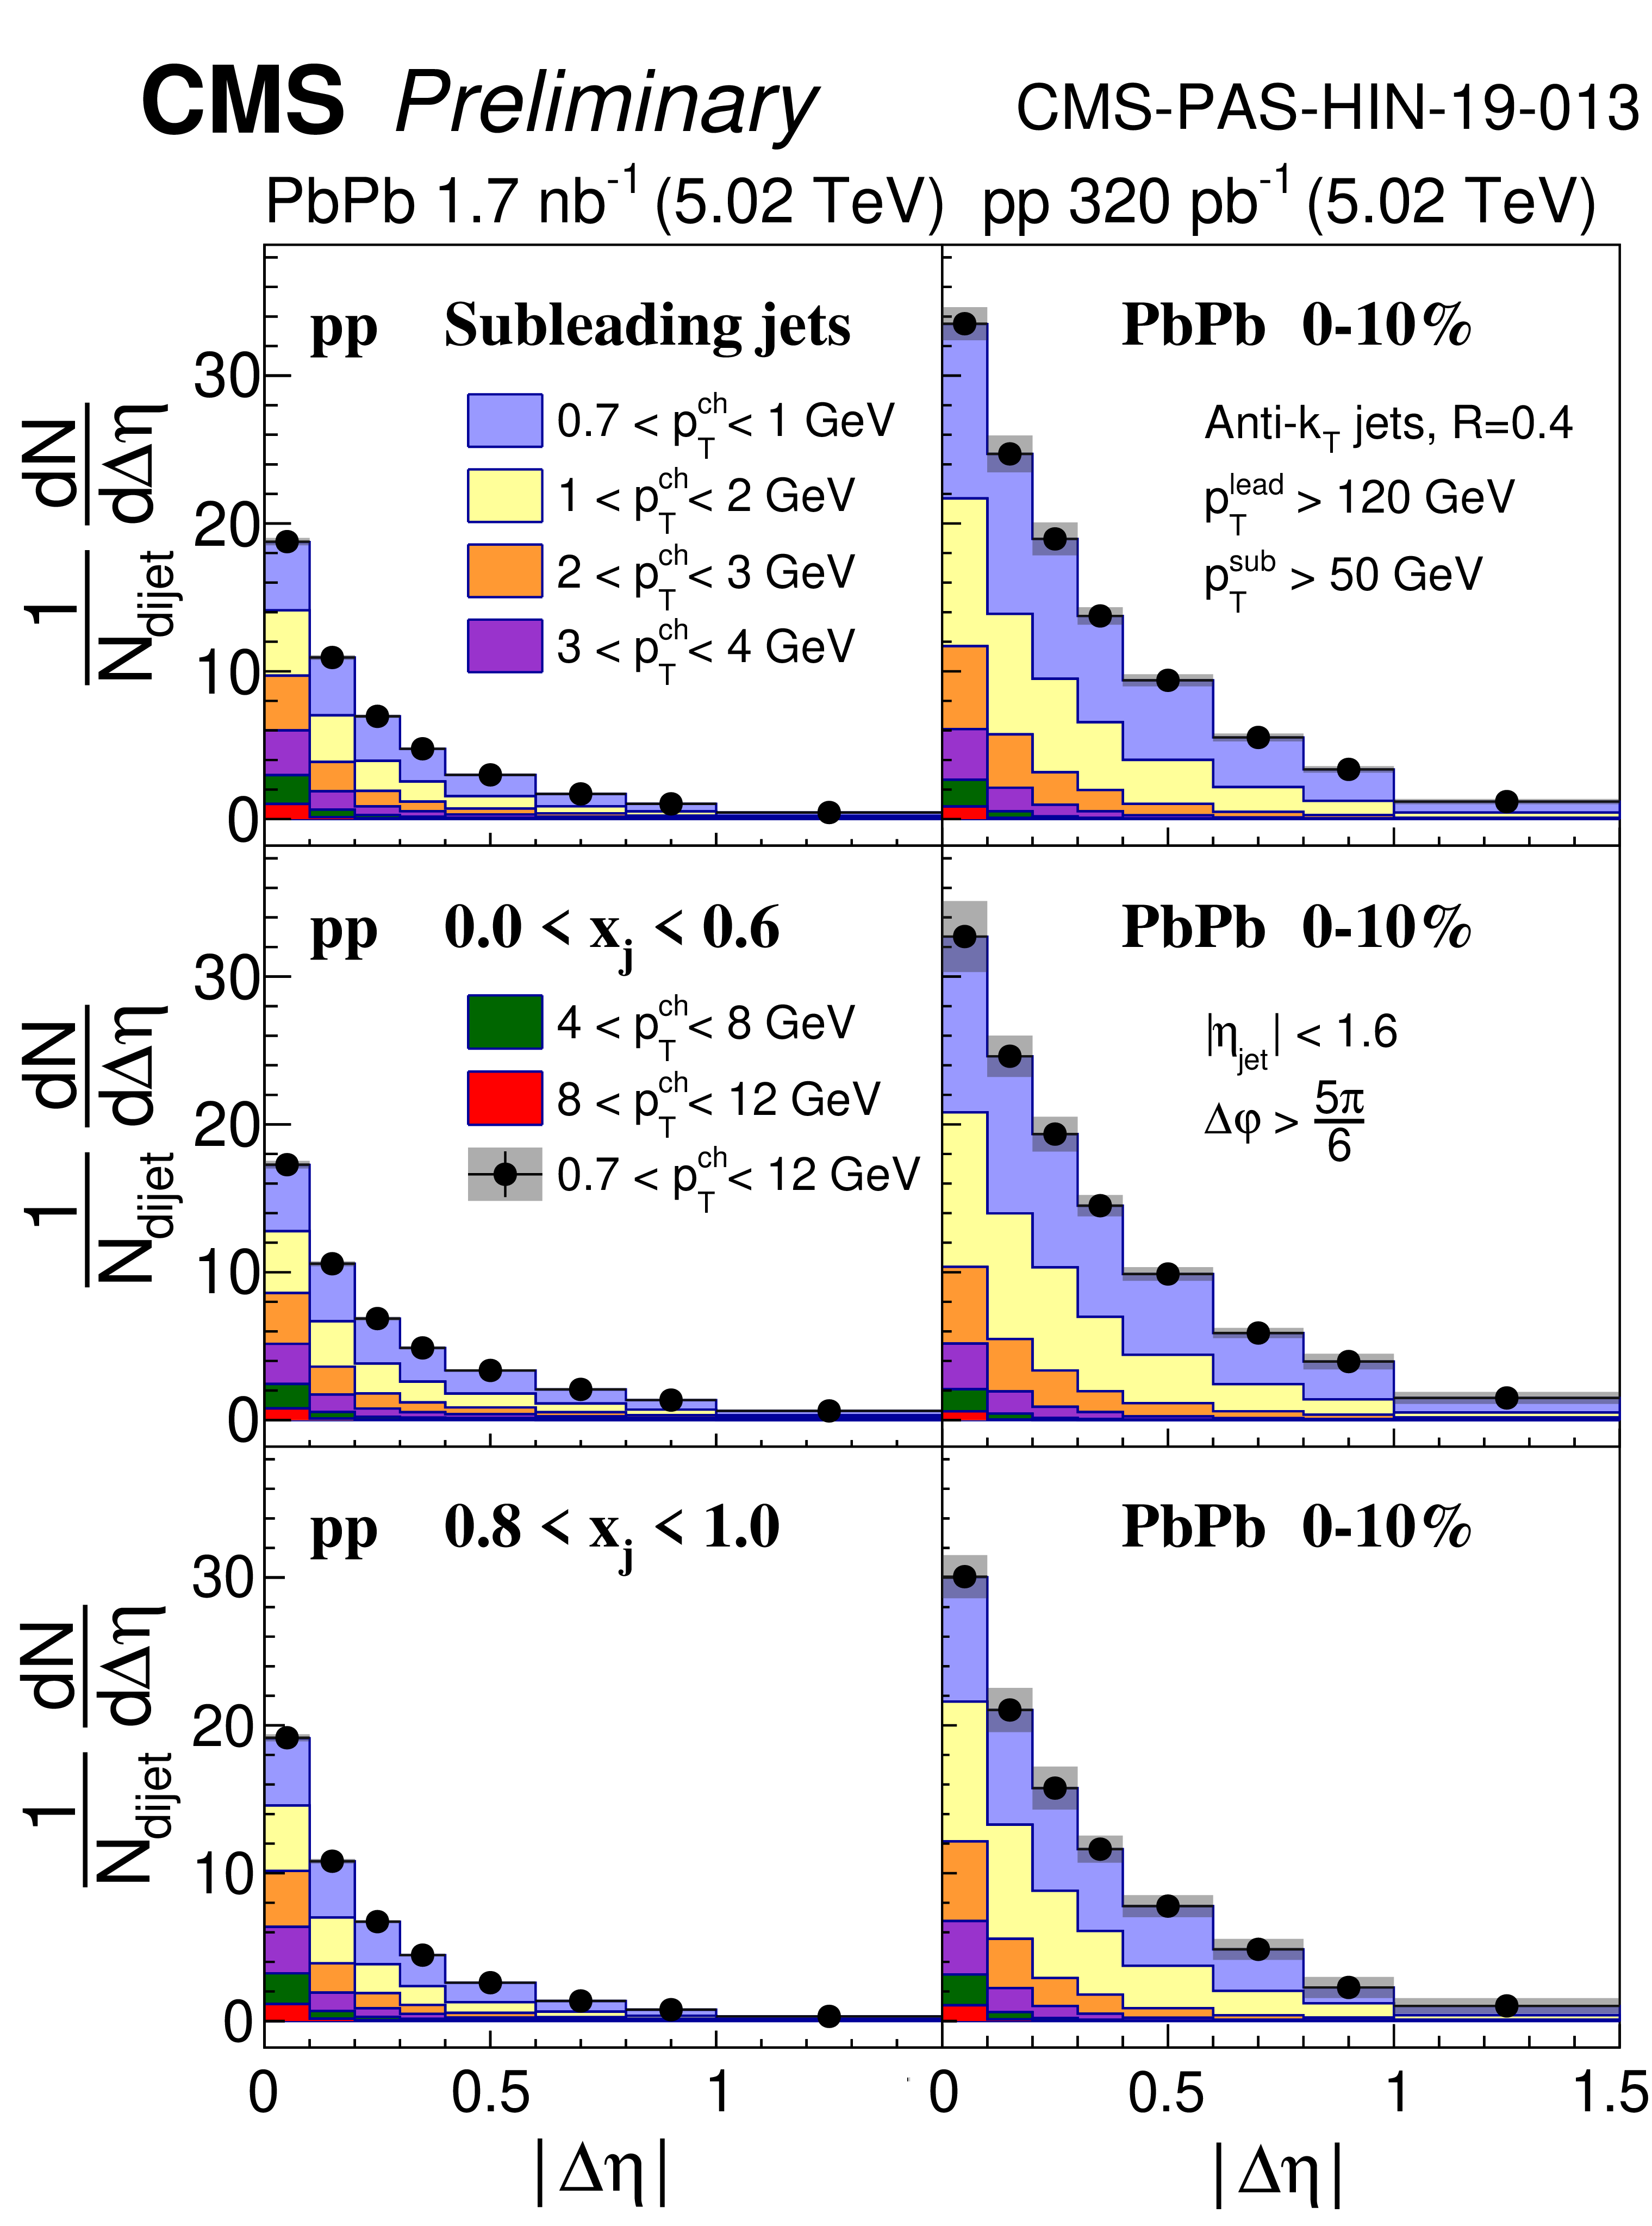
Figure 2:
Distributions of charged particle yields correlated to subleading jets as a function of $|\Delta \eta |$ for pp (first column) and PbPb collisions in different centrality bins (second to fifth column), shown differentially for all $p_{\rm T}^{\rm trk}$ bins. The first row shows the charged particle yields without any selection on $x_{j}$, while other rows show the charged particle yields in different bins of $x_{j}$, starting with the most unbalanced 0 $ < x_{j} < $ 0.6 (second row) to most balanced 0.8 $ < x_{j} < $ 1.0 (fourth row) dijet events. |
png pdf |
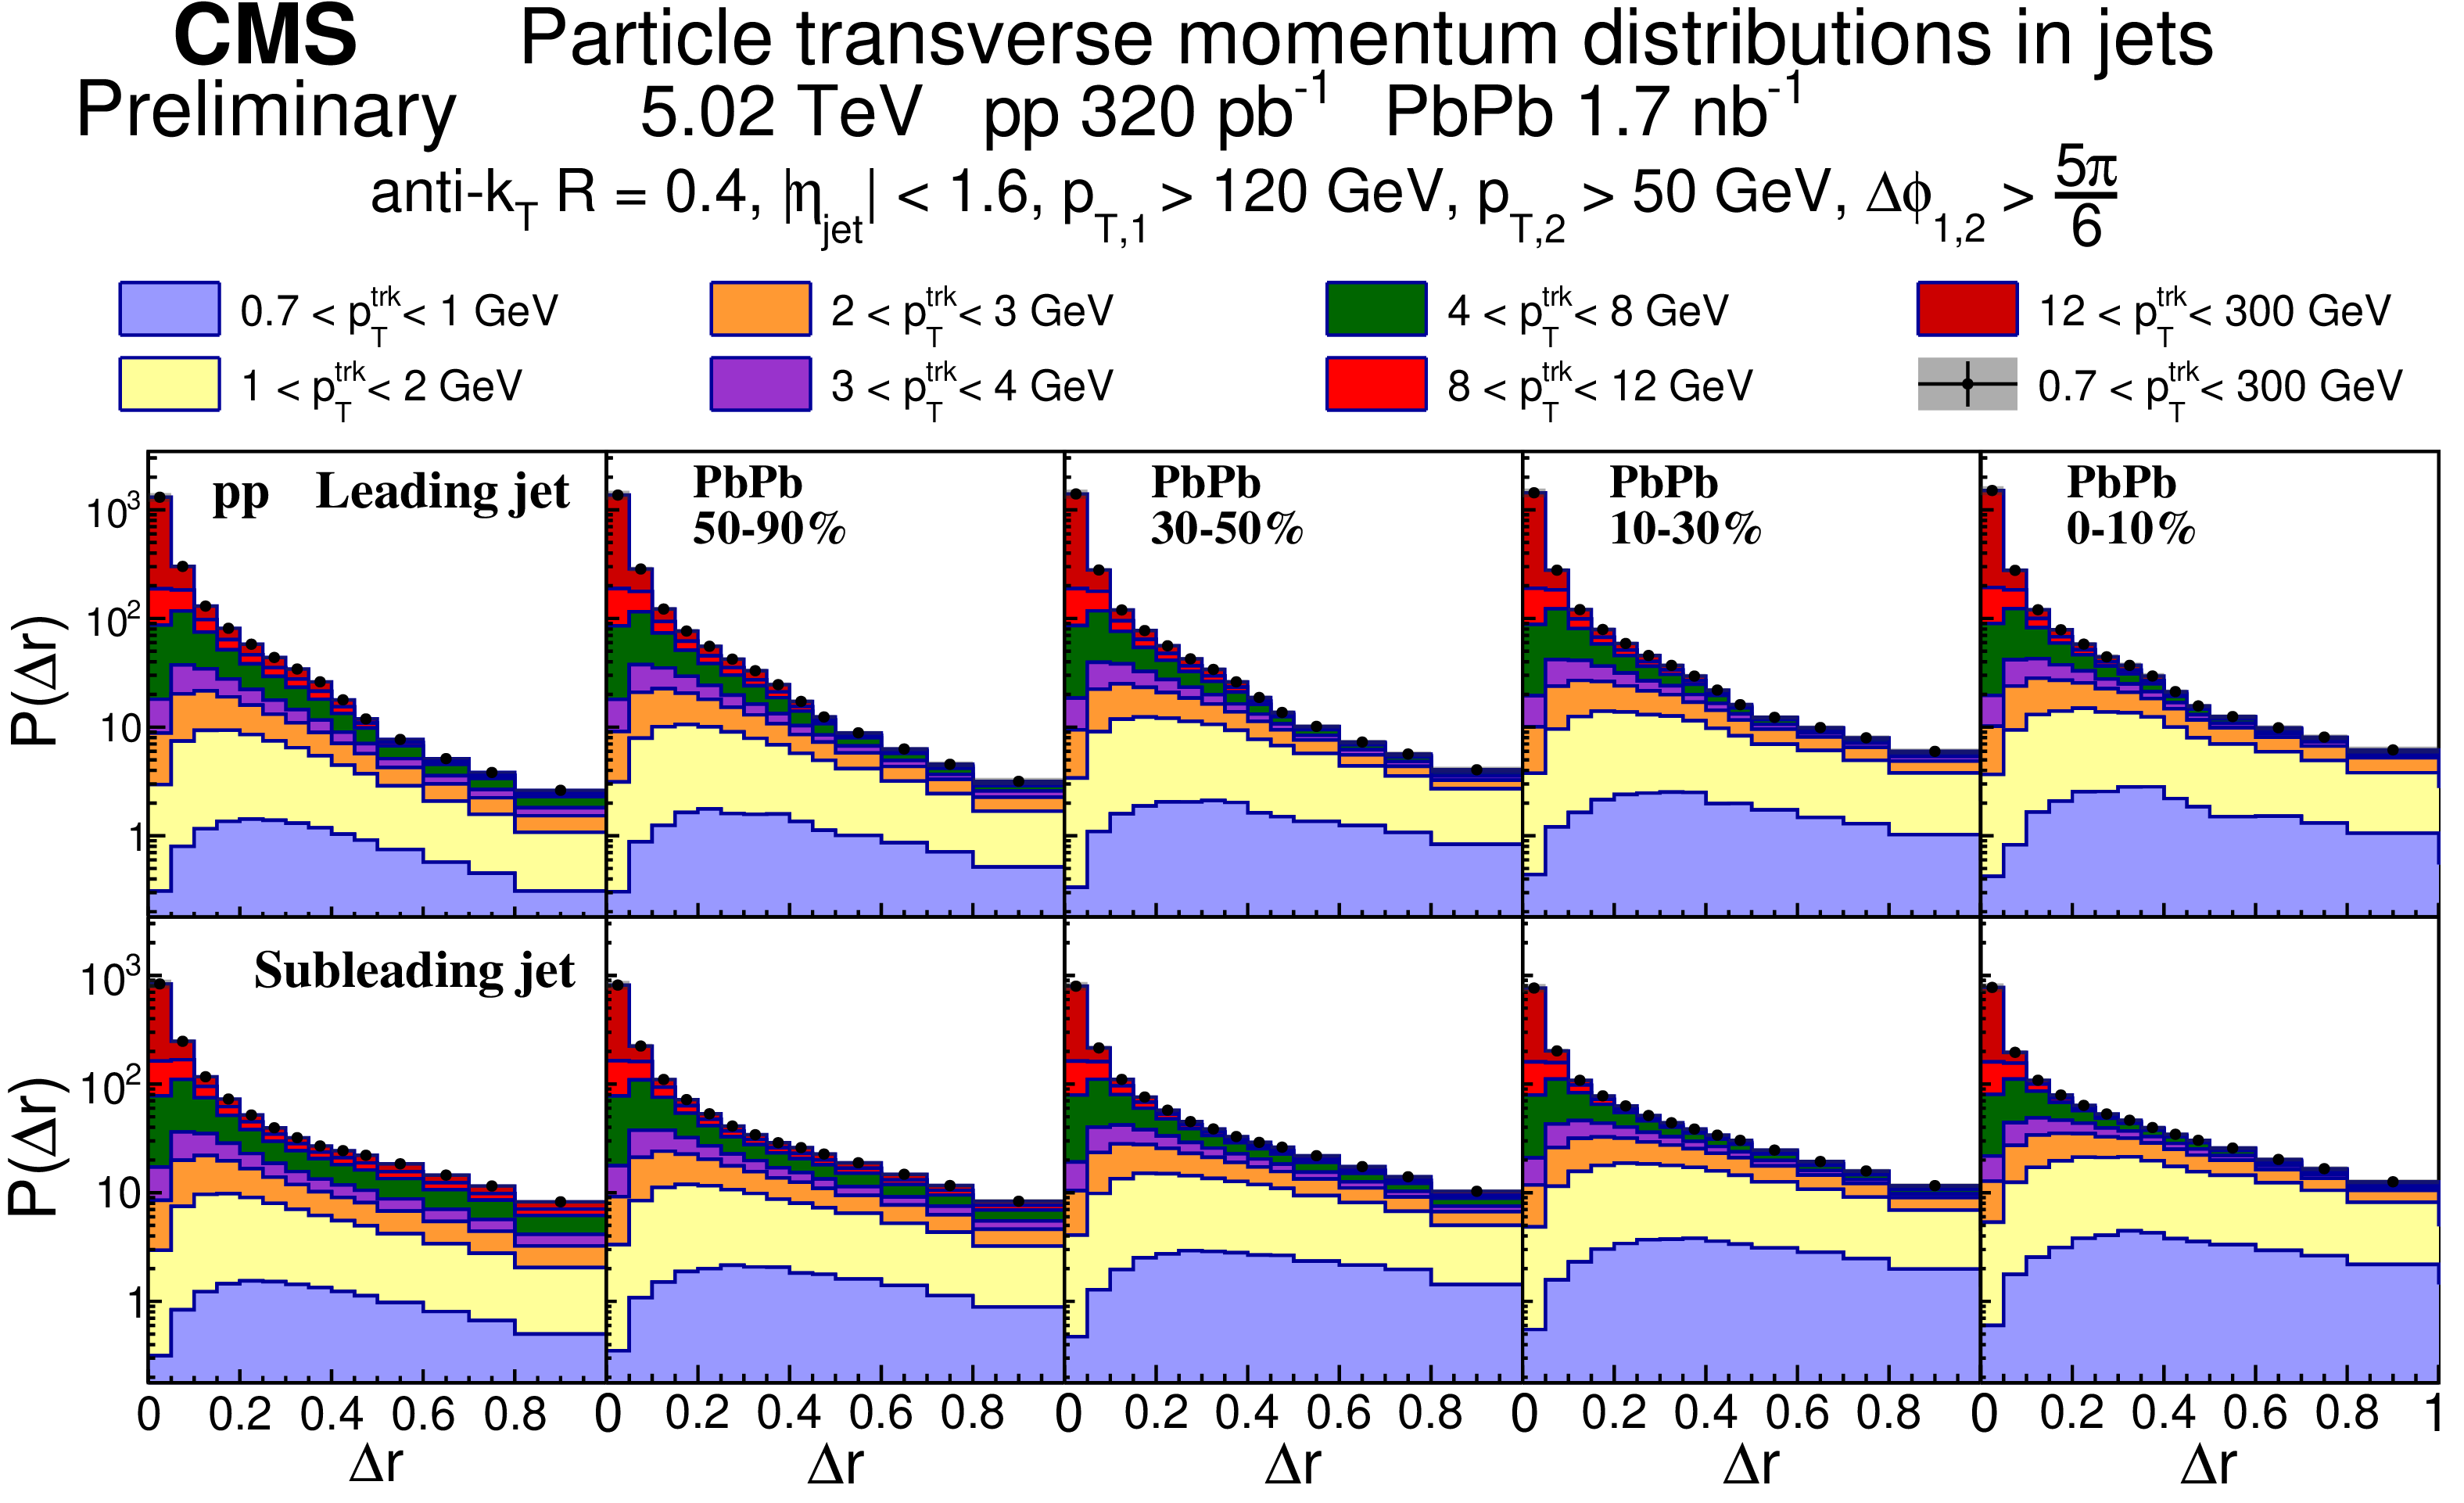
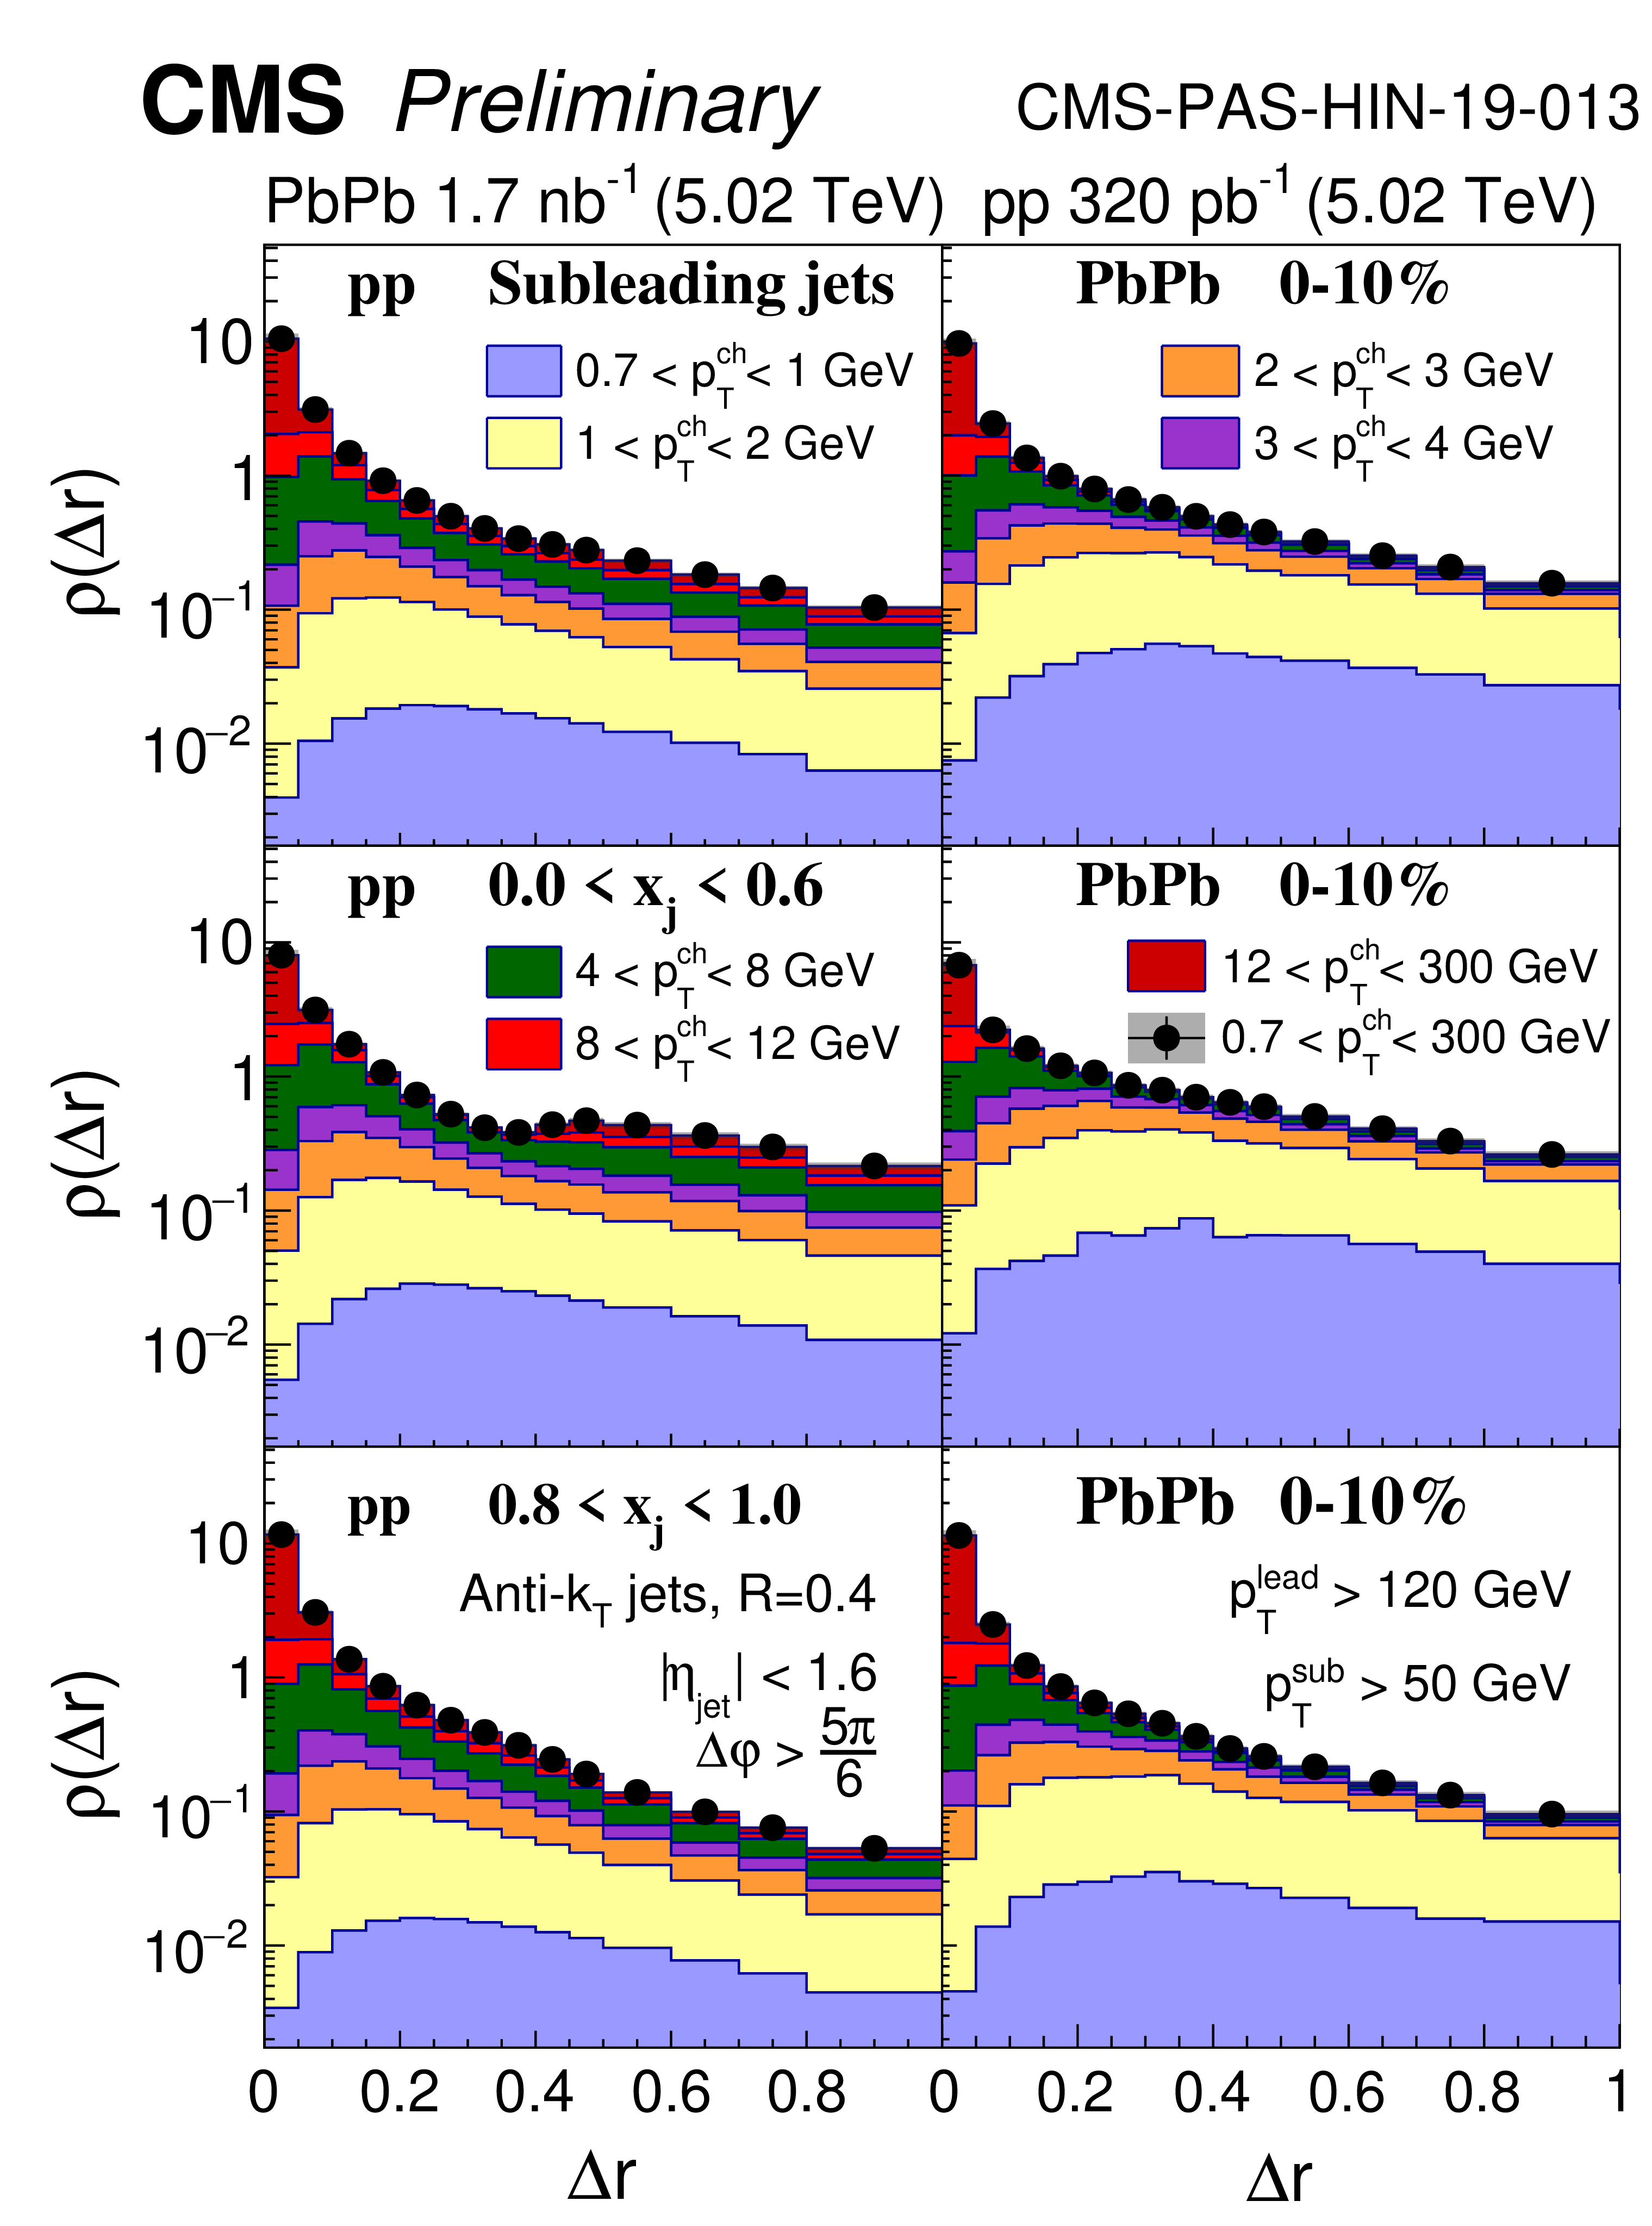
Figure 3:
Jet radial momentum profile $\mathrm {P}(\Delta r)$ for pp (first column) and PbPb collisions in different centrality bins (second to fifth column), shown differentially in $p_{\rm T}^{\rm trk}$ for leading (top row) and subleading (bottom row) jets. |
png pdf |
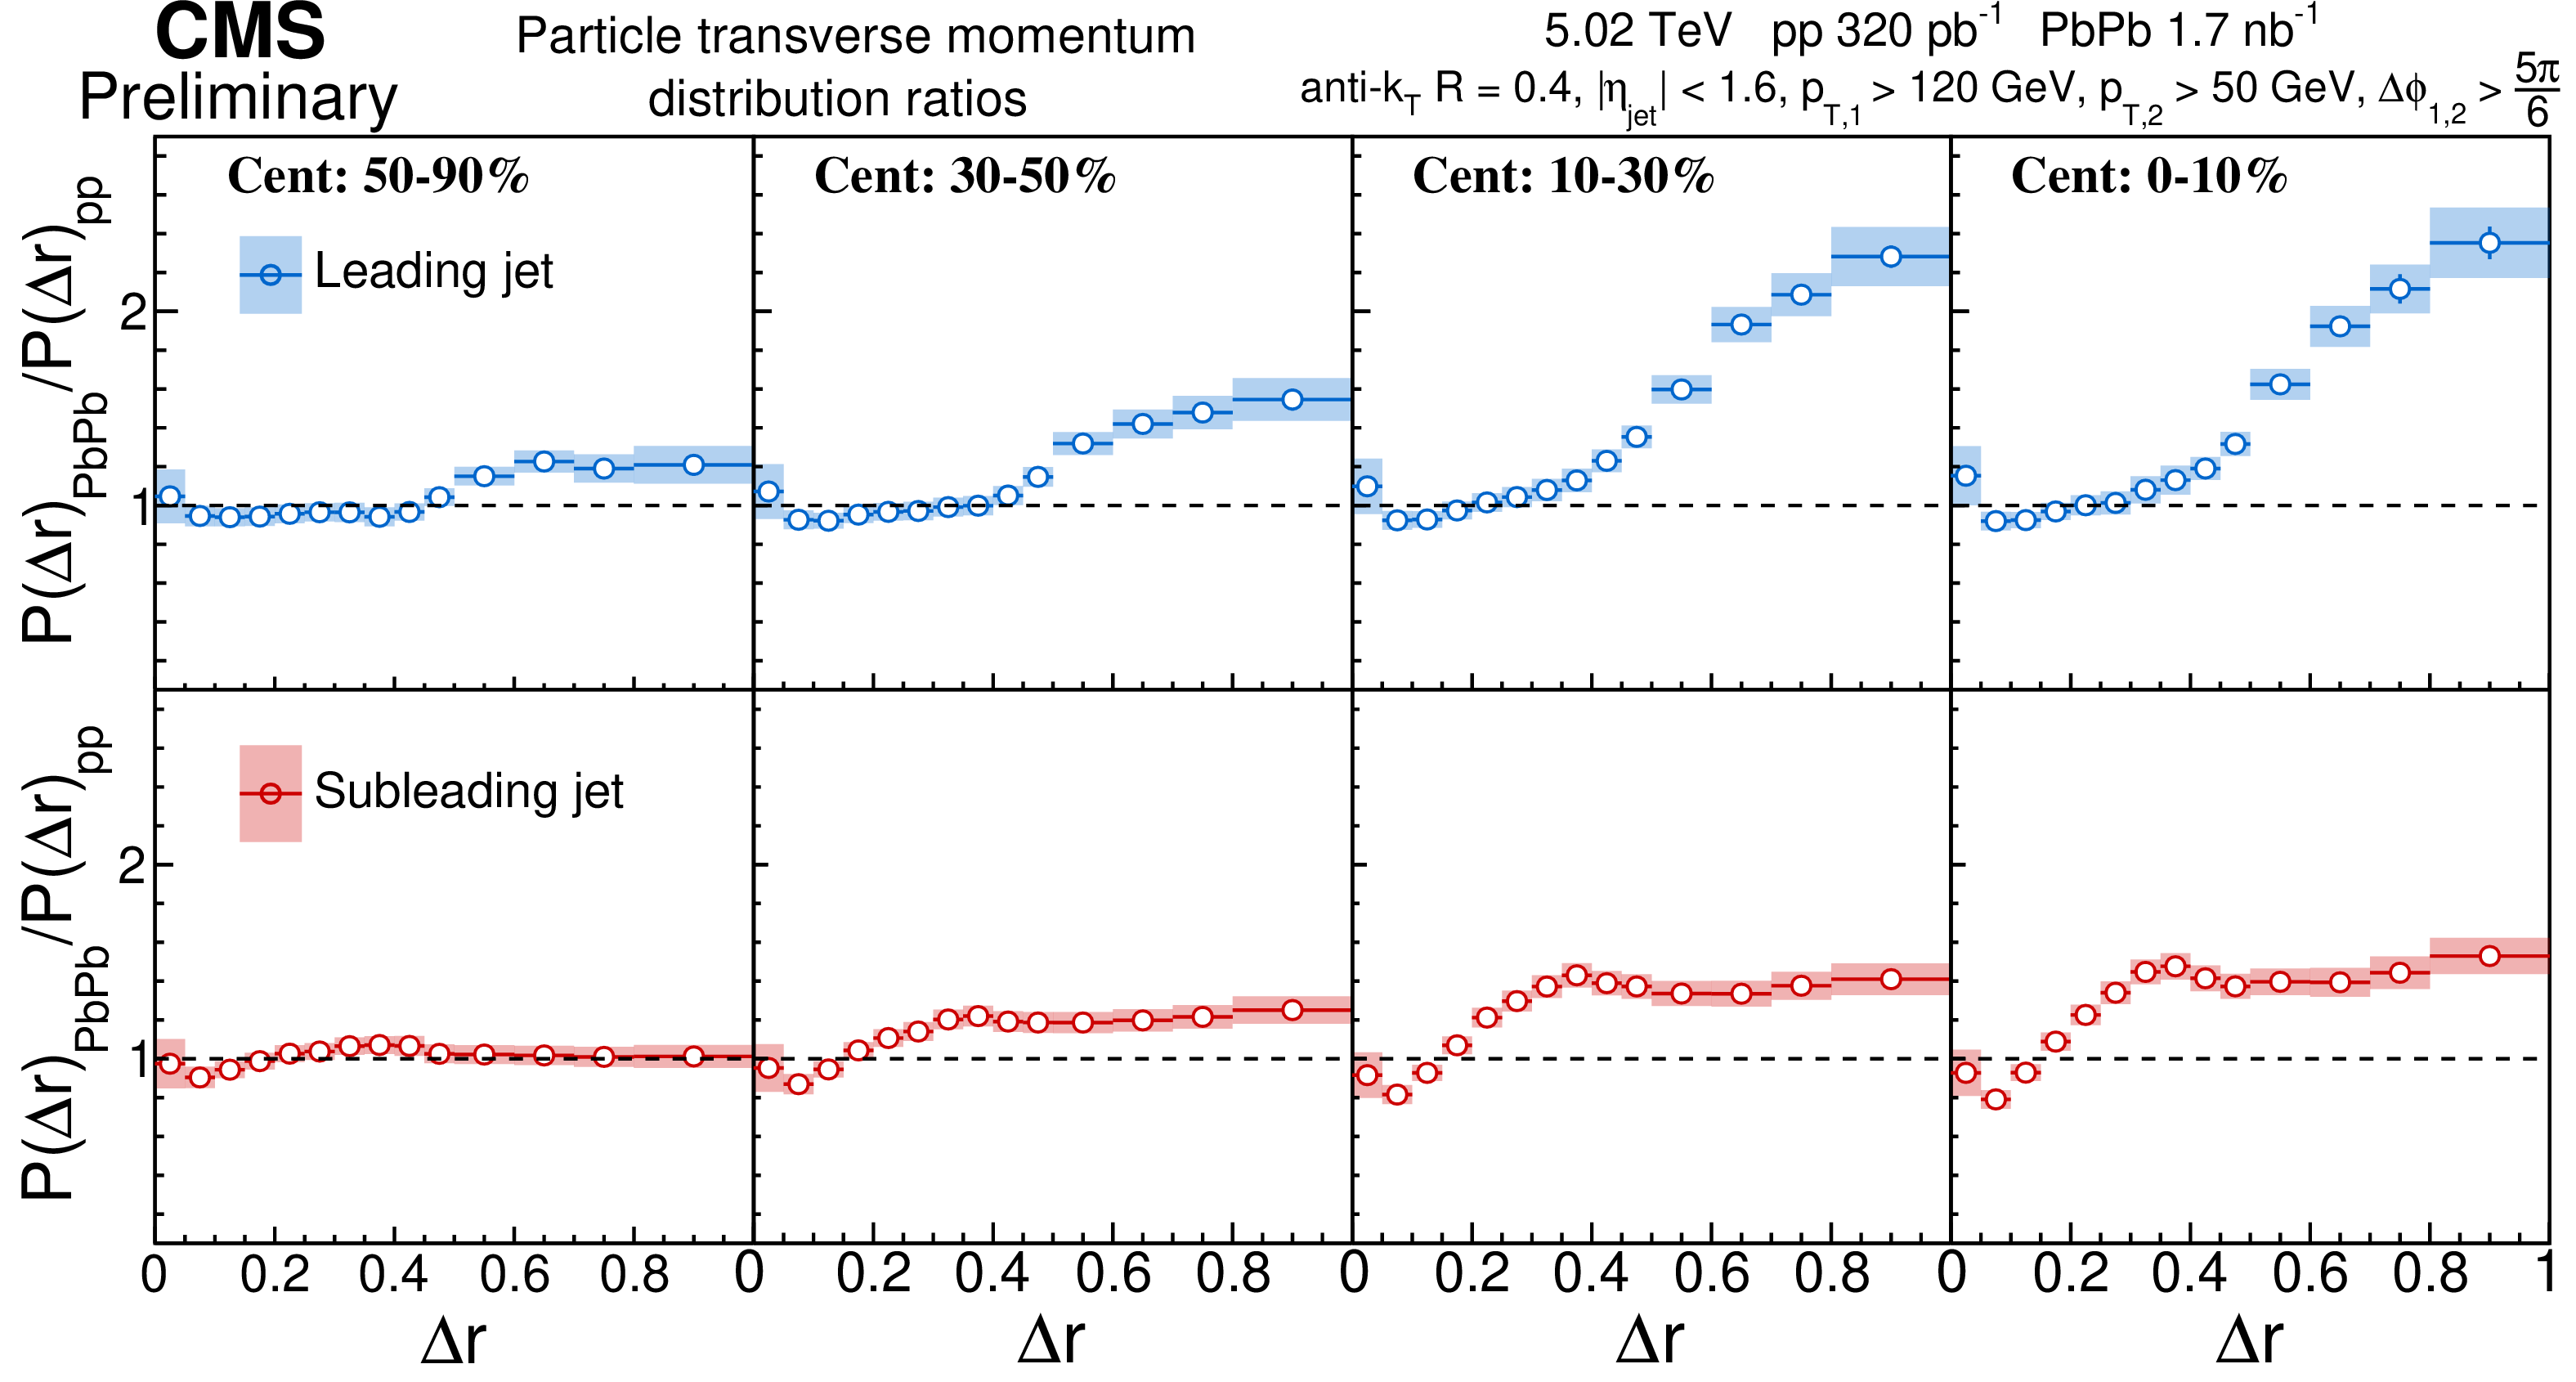
Figure 4:
PbPb to pp ratio of the jet radial momentum distributions, $\mathrm {P} (\Delta r)_{\rm PbPb}/\mathrm {P} (\Delta r)_{\rm pp}$, for different centrality bins for the leading jets (top row) and subleading jets (bottom row). |
png pdf |
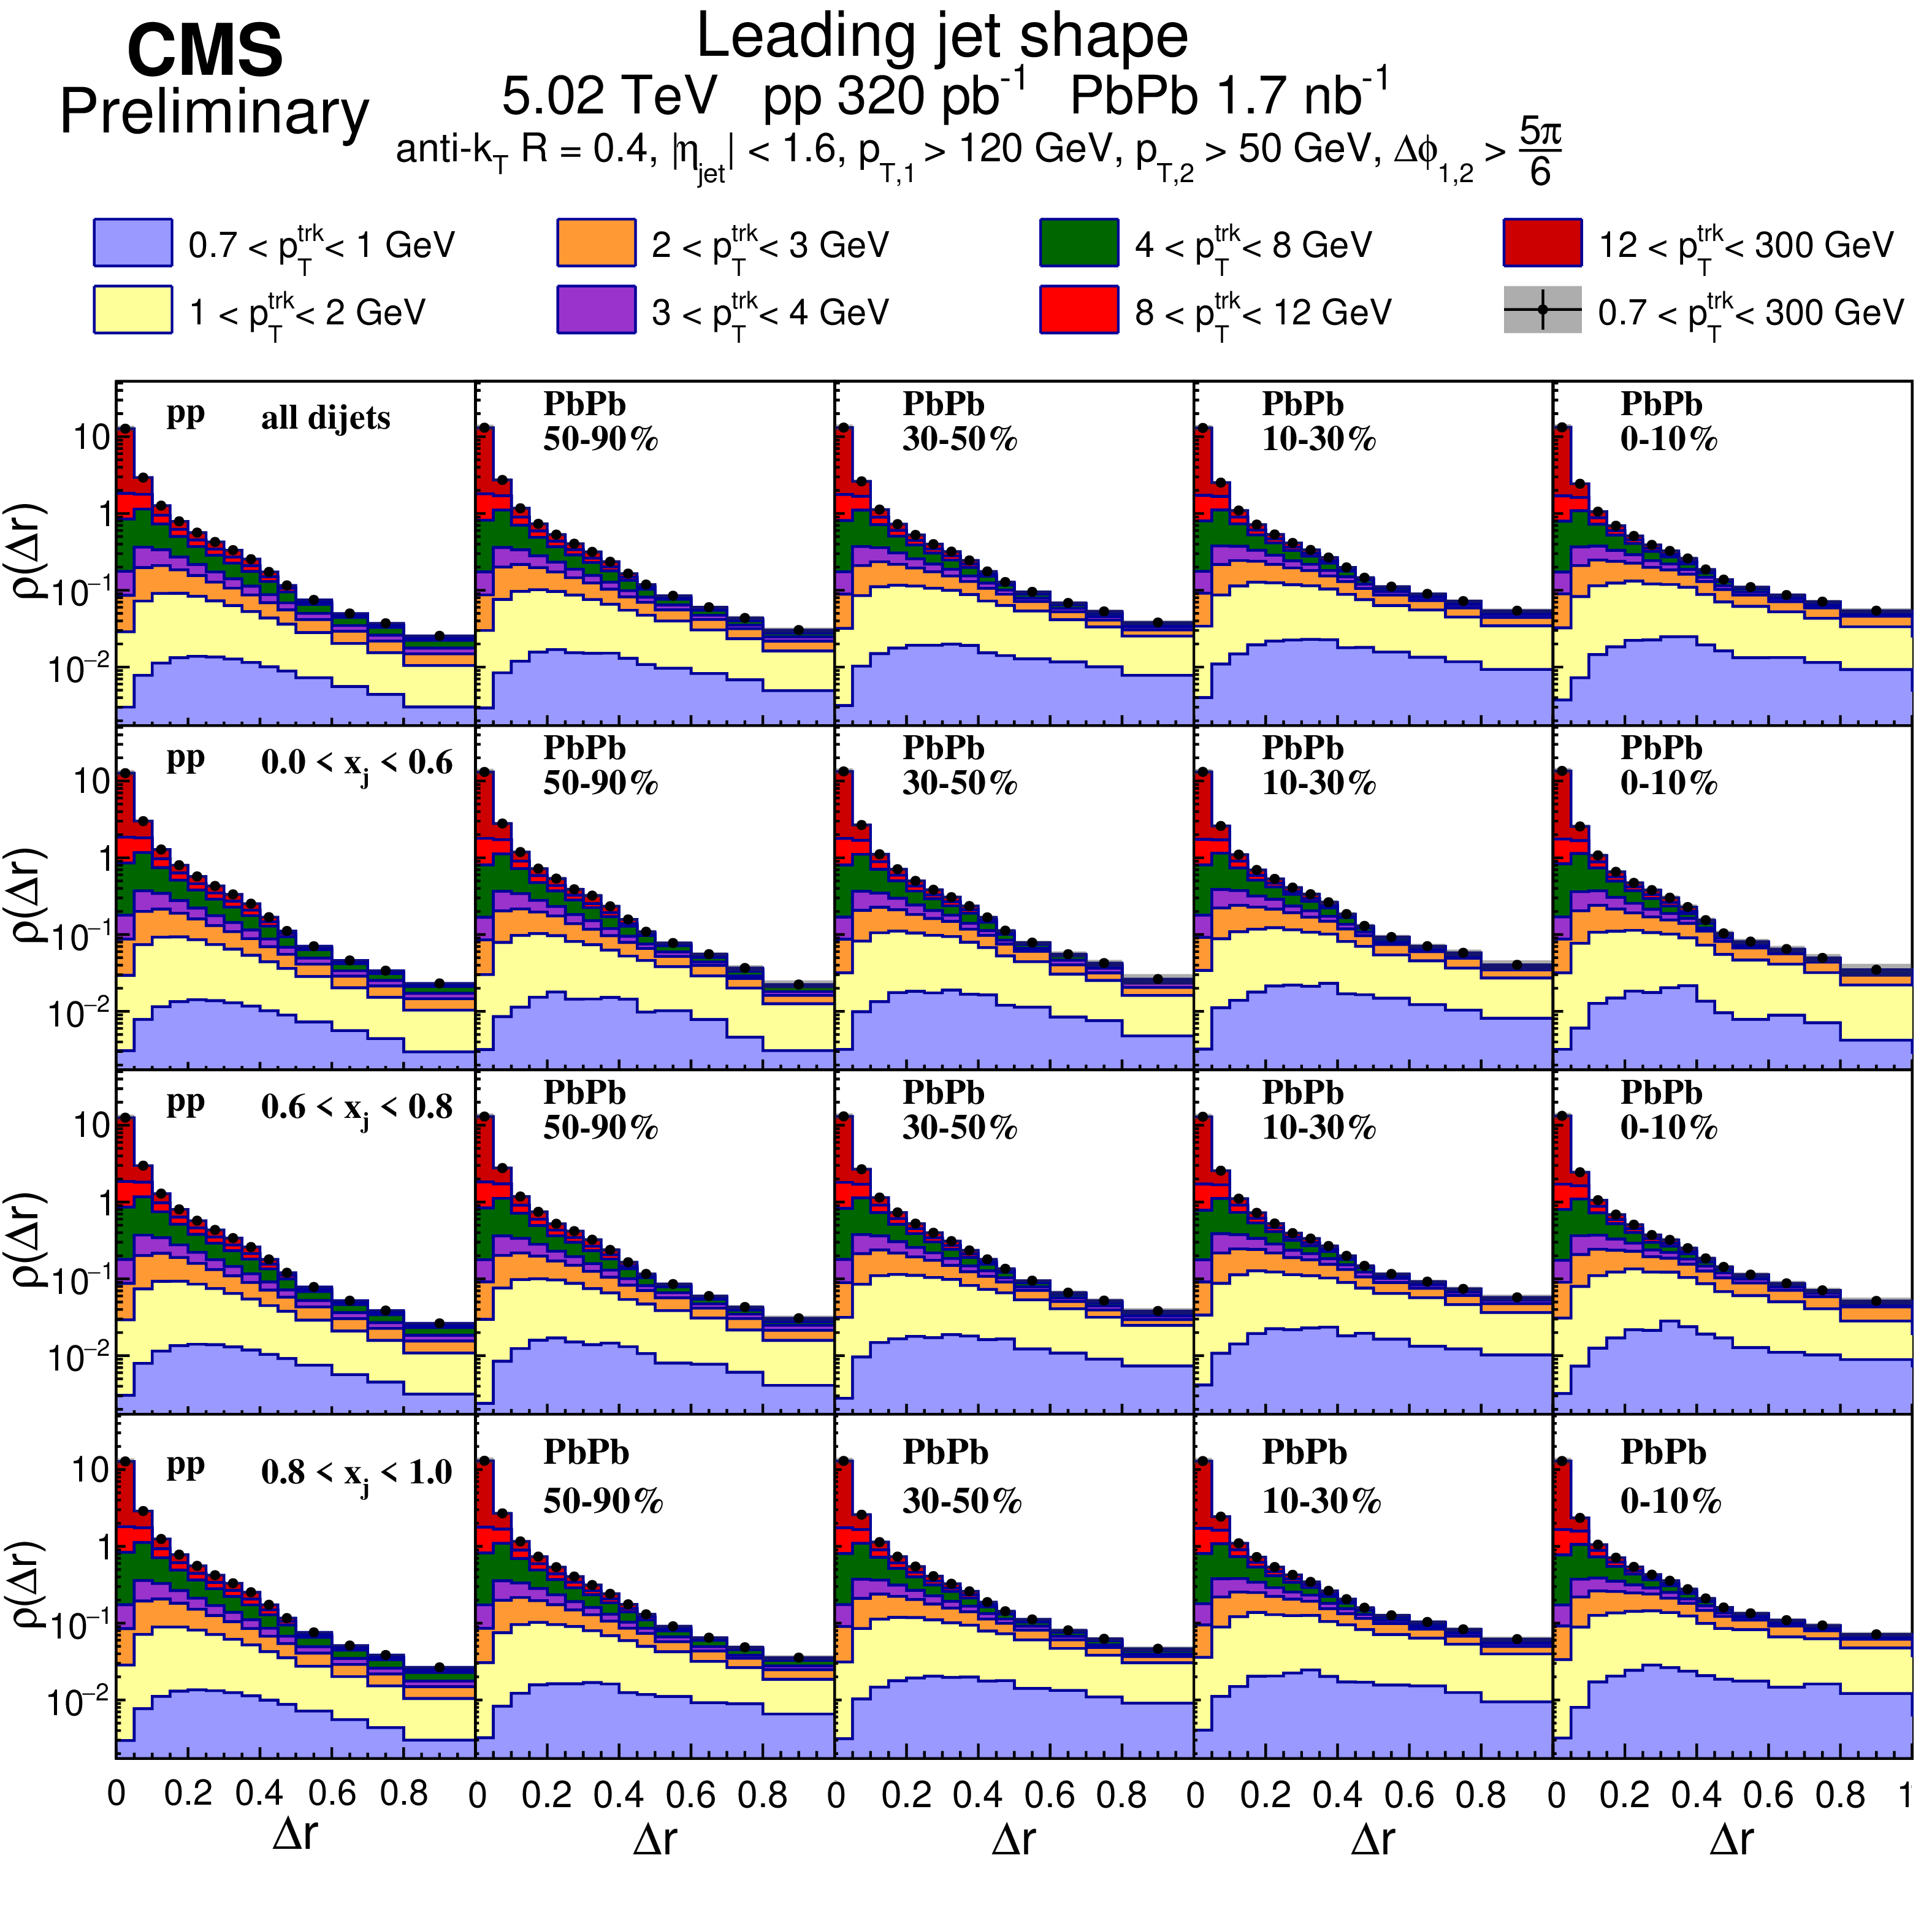
Figure 5:
Leading jet shapes $\rho (\Delta r)$ (normalized to unity over $\Delta r < $ 1) for pp (first column) and PbPb collisions in different centrality bins (second to fifth columns), shown differentially in $p_{\rm T}^{\rm trk}$ for inclusive $x_{j}$ bin (first row) and in differential bins 0 $ < x_{j} < $ 0.6 (second row), 0.6 $ < x_{j} < $ 0.8 (third row), and 0.8 $ < x_{j} < $ 1.0 (fourth row). |
png pdf |
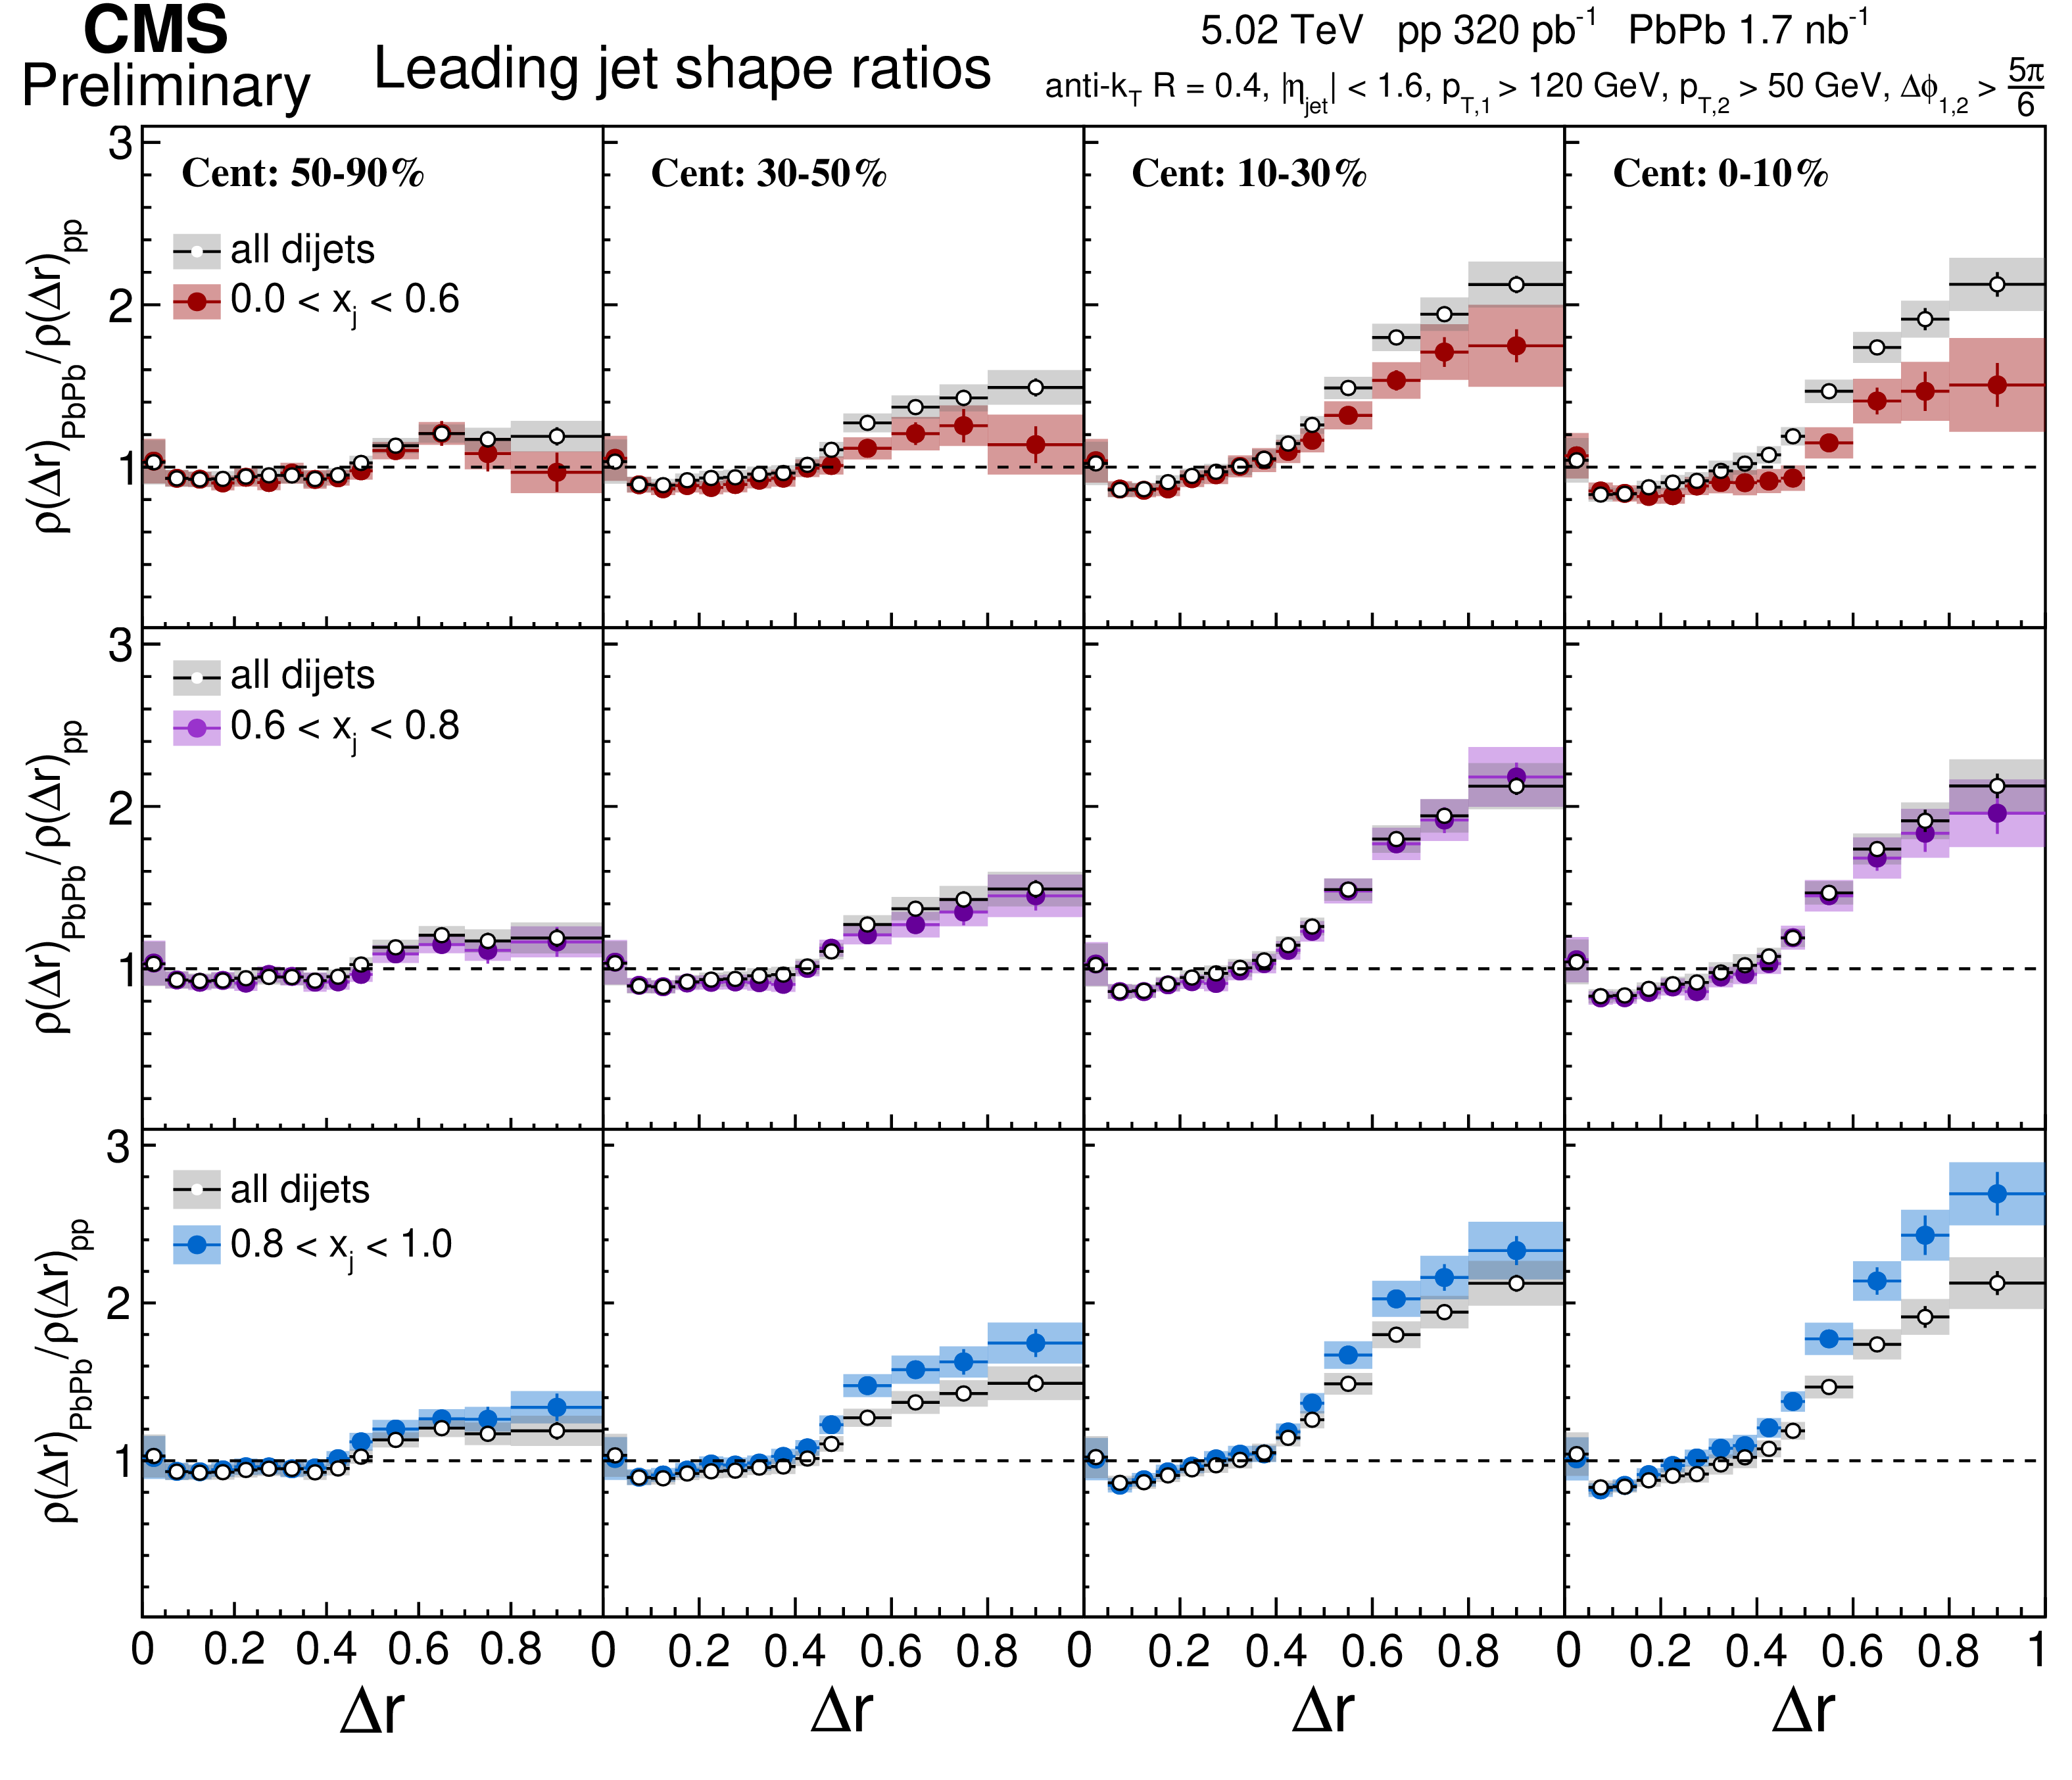
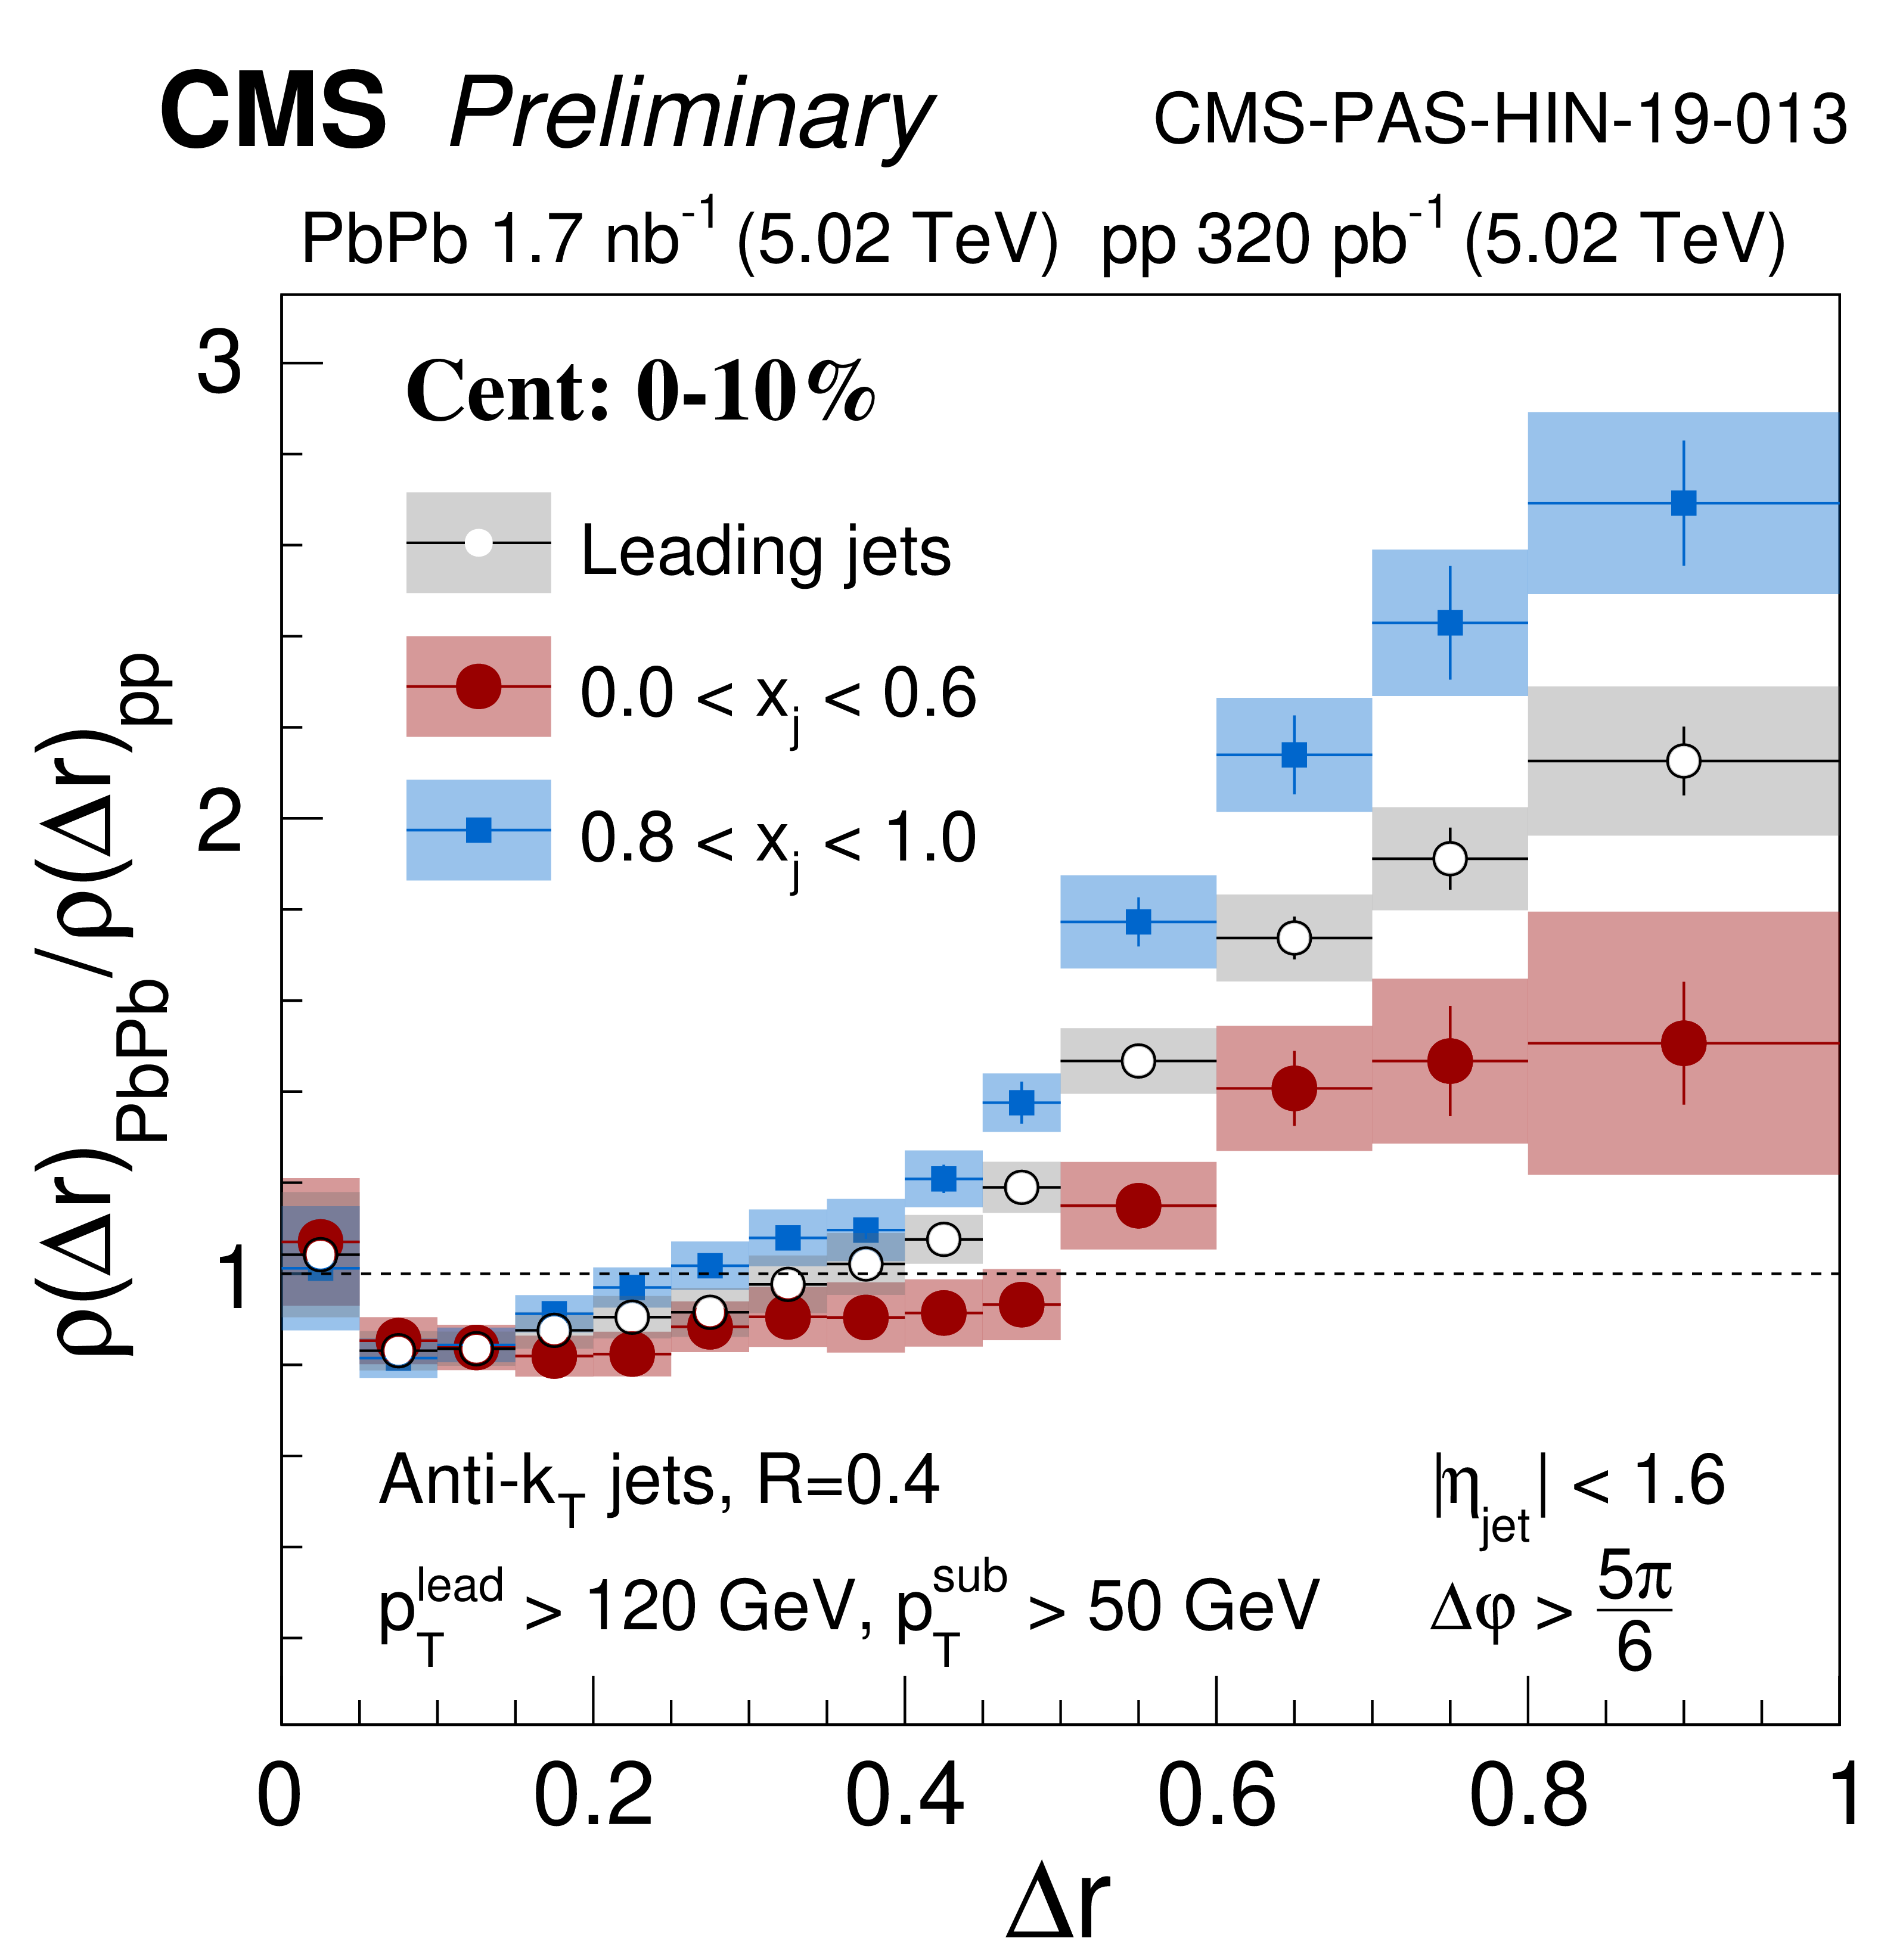
Figure 6:
PbPb to pp ratio for leading jet shapes $\rho (\Delta r)_{\rm PbPb} / \rho (\Delta r)_{\rm pp}$, in different centrality bins for 0 $ < x_{j} < $ 0.6 (top row), 0.6 $ < x_{j} < $ 0.8 (middle row) and 0.8 $ < x_{j} < $ 1.0 (bottom row) dijet selections. The leading jet shape ratio for all dijets, i.e. without any selection on the dijet momentum balance are also shown in each row for comparison. |
png pdf |
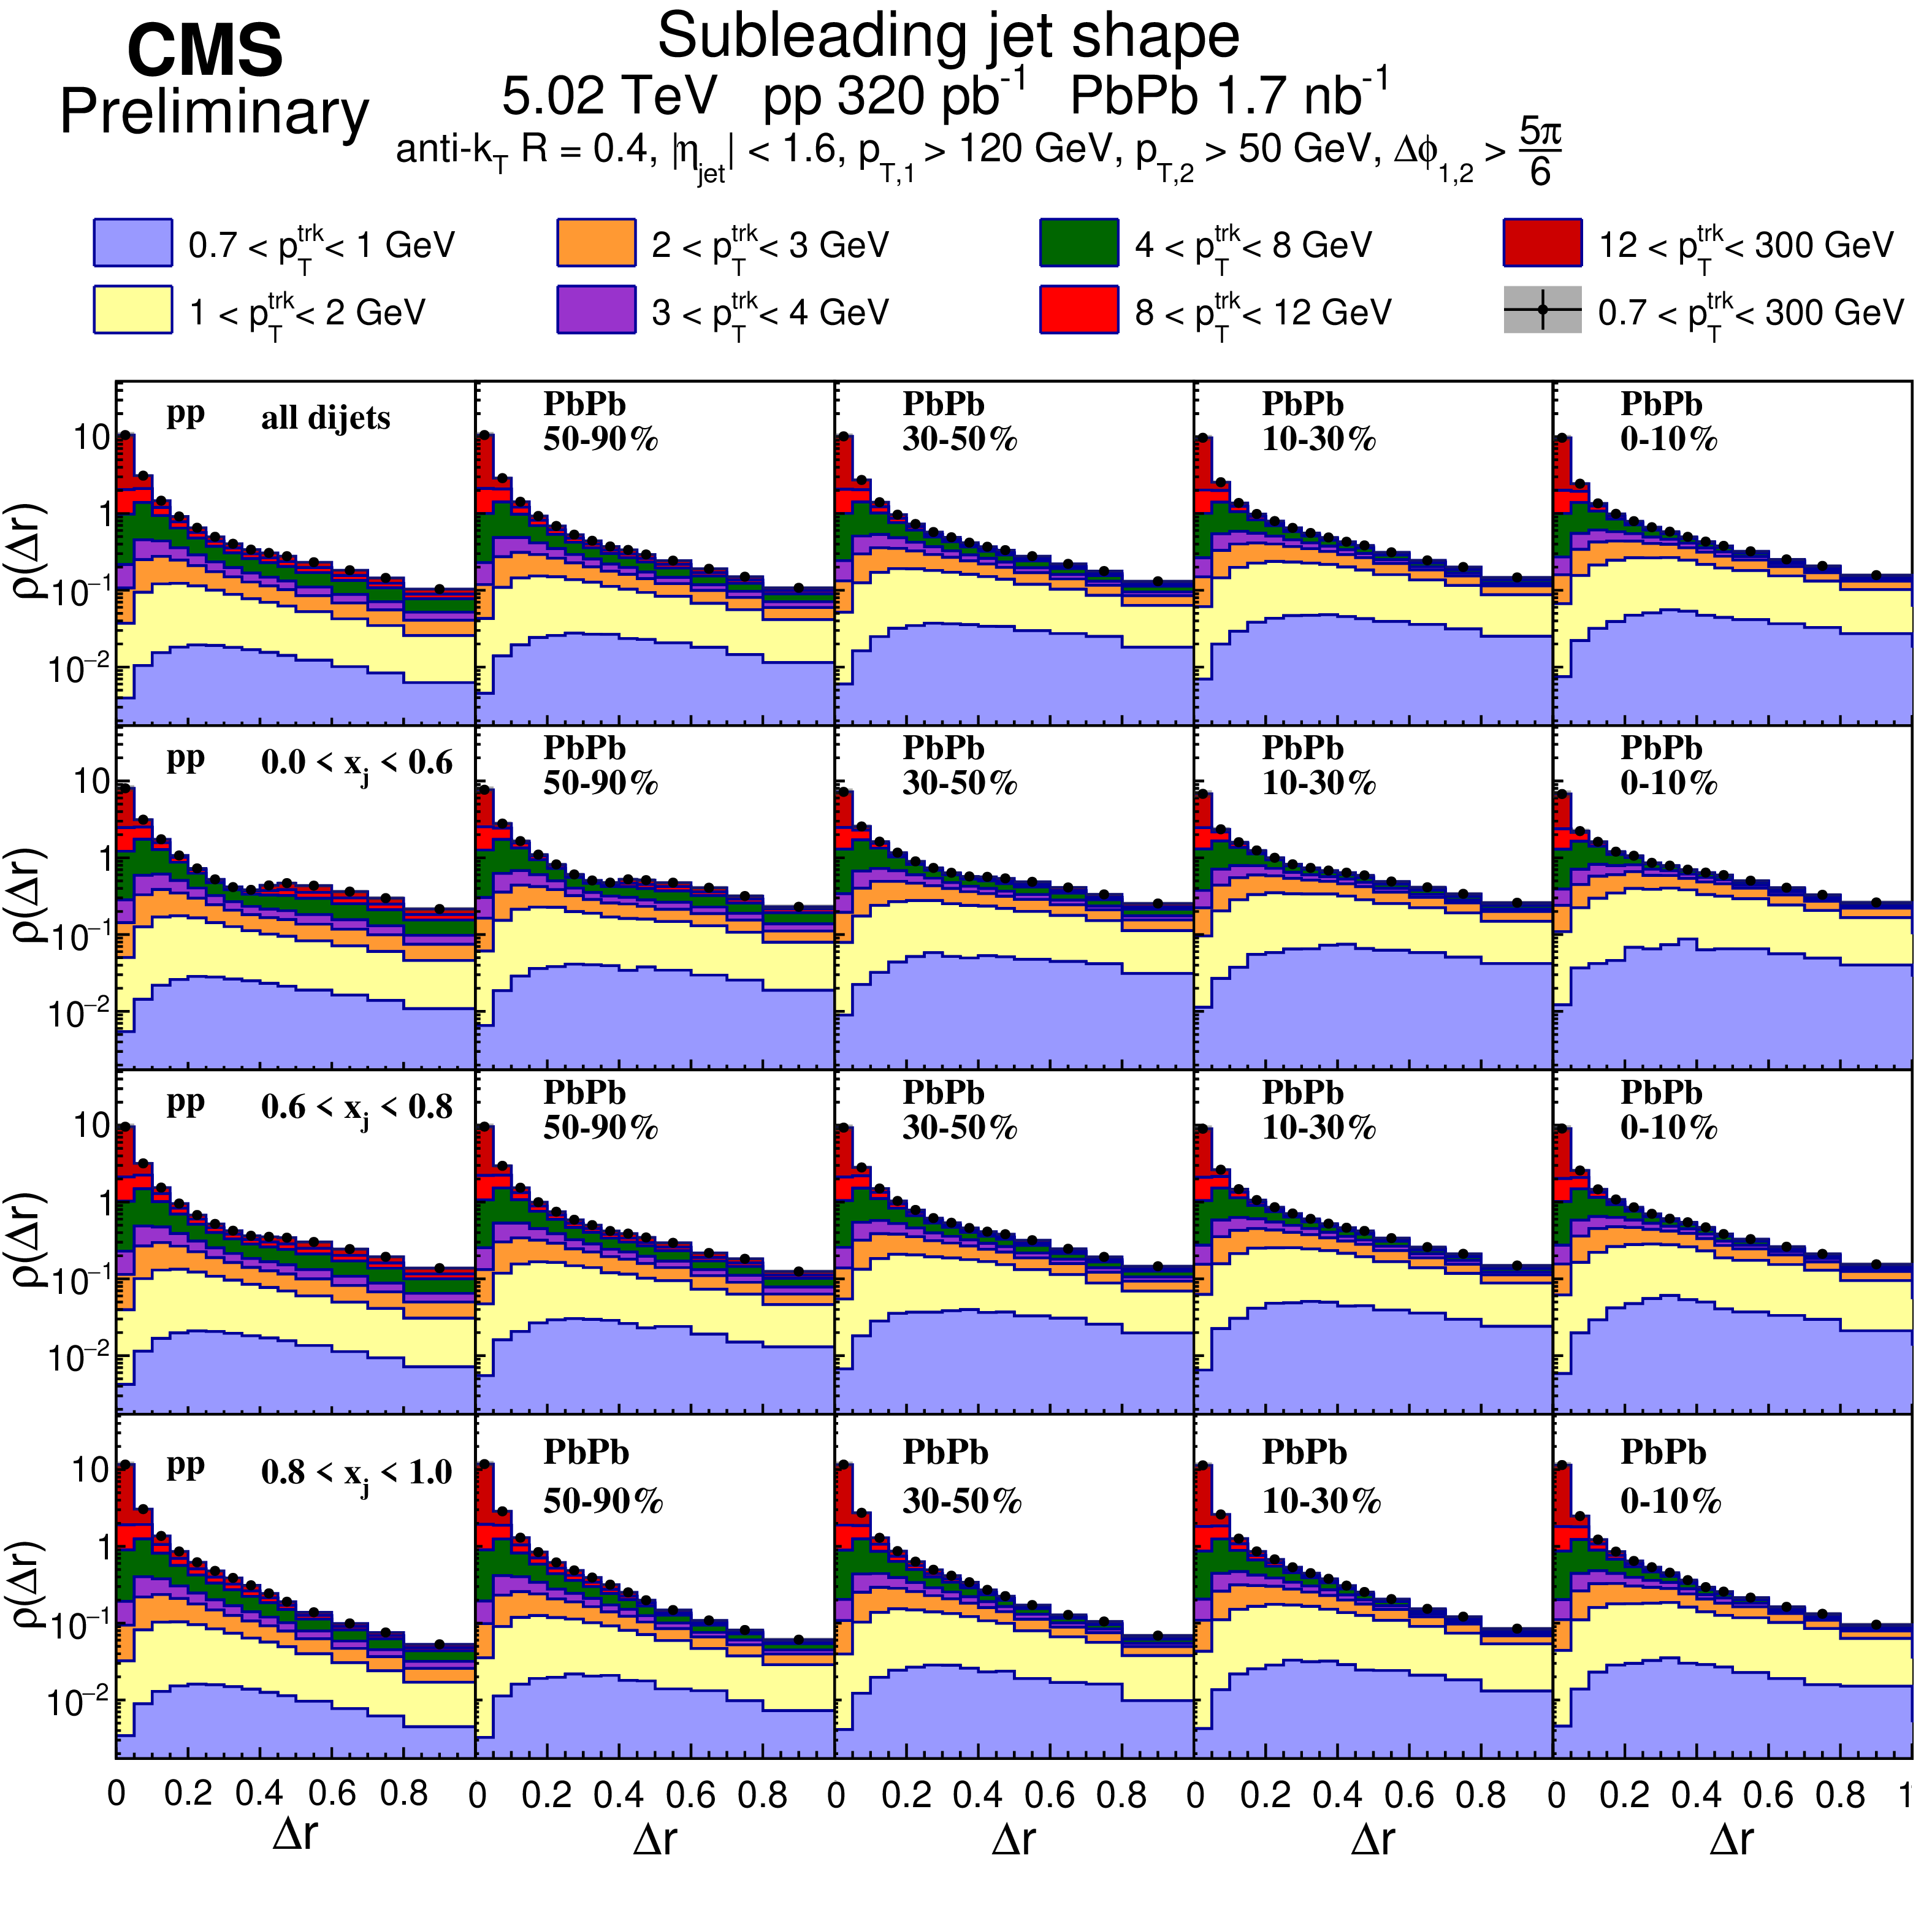
Figure 7:
Subleading jet shapes $\rho (\Delta r)$ (normalized to unity over $\Delta r < $ 1) for pp (first column) and PbPb collisions in different centrality bins (second to fifth columns), shown differentially in $p_{\rm T}^{\rm trk}$ for inclusive $x_{j}$ bin (first row) and in differential bins 0 $ < x_{j} < $ 0.6 (second row), 0.6 $ < x_{j} < $ 0.8 (third row), and 0.8 $ < x_{j} < $ 1.0 (fourth row). |

png pdf |
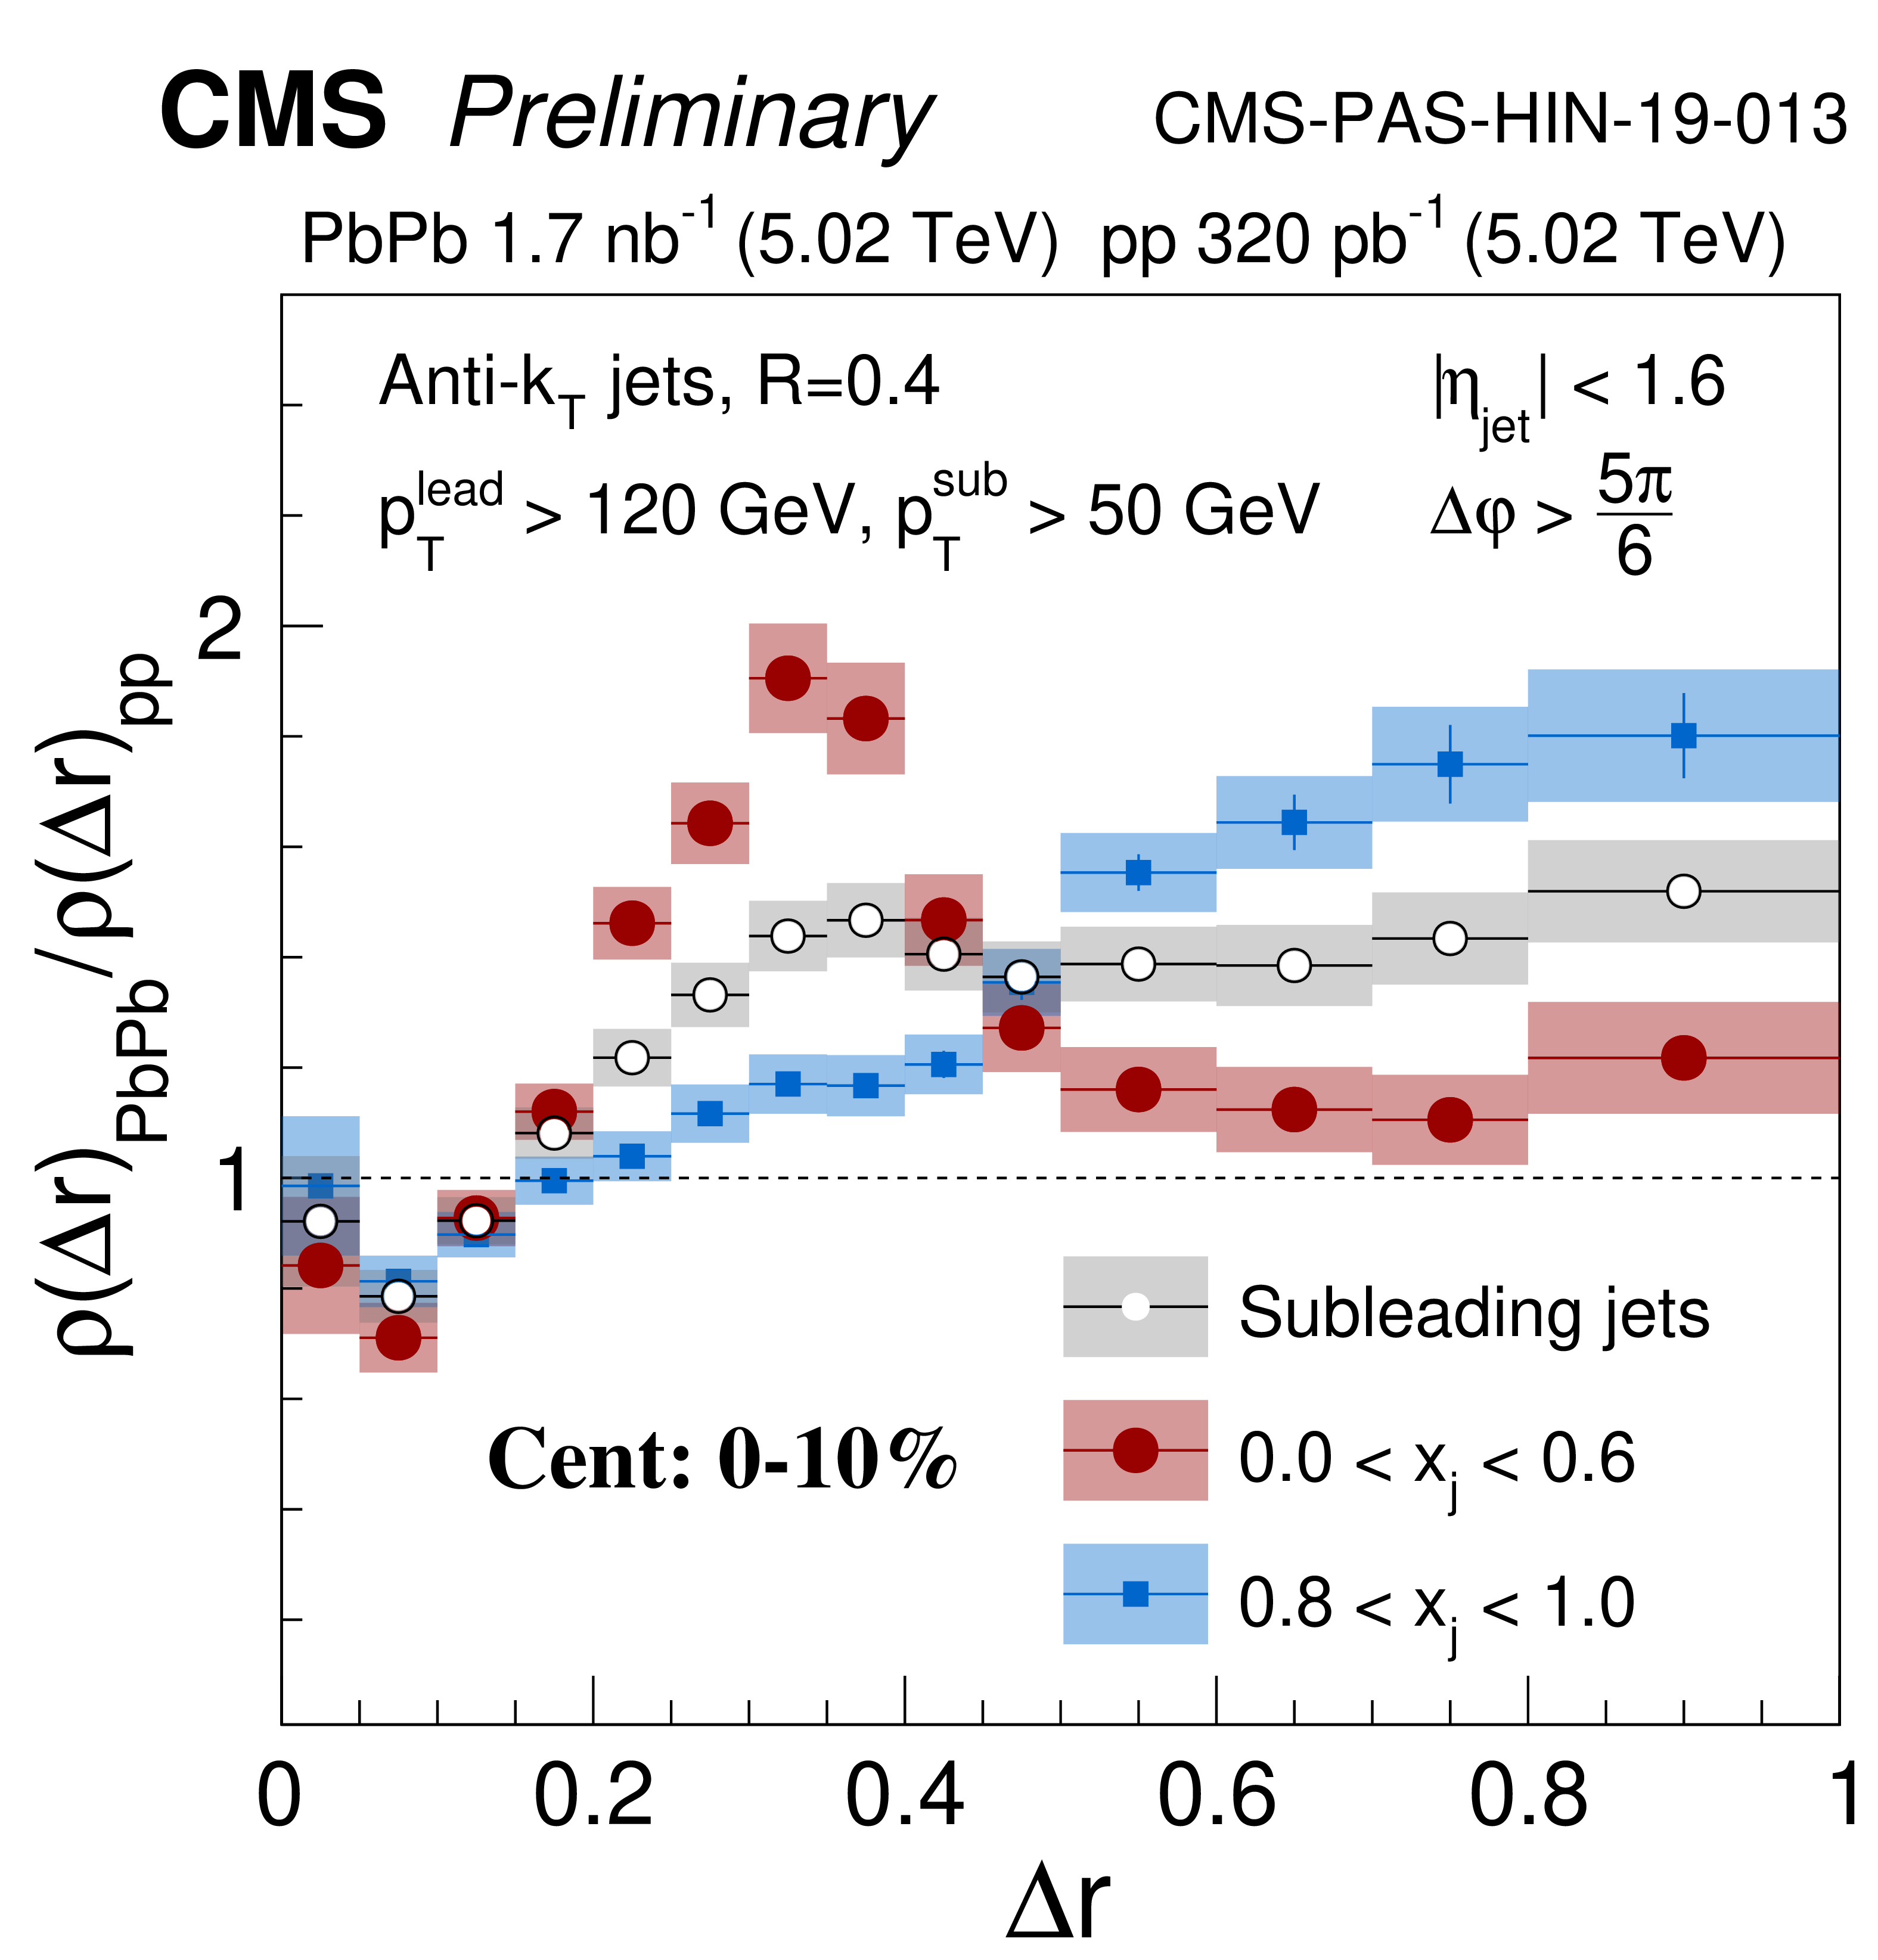
Figure 8:
PbPb to pp ratio for subleading jet shapes $\rho (\Delta r)_{\rm PbPb} / \rho (\Delta r)_{\rm pp}$, in different centrality bins for 0 $ < x_{j} < $ 0.6 (top row), 0.6 $ < x_{j} < $ 0.8 (middle row) and 0.8 $ < x_{j} < $ 1.0 (bottom row) dijet selections. The subleading jet shape ratio for all dijets, i.e. without any selection on the dijet momentum balance are also shown in each row for comparison. |
png pdf |
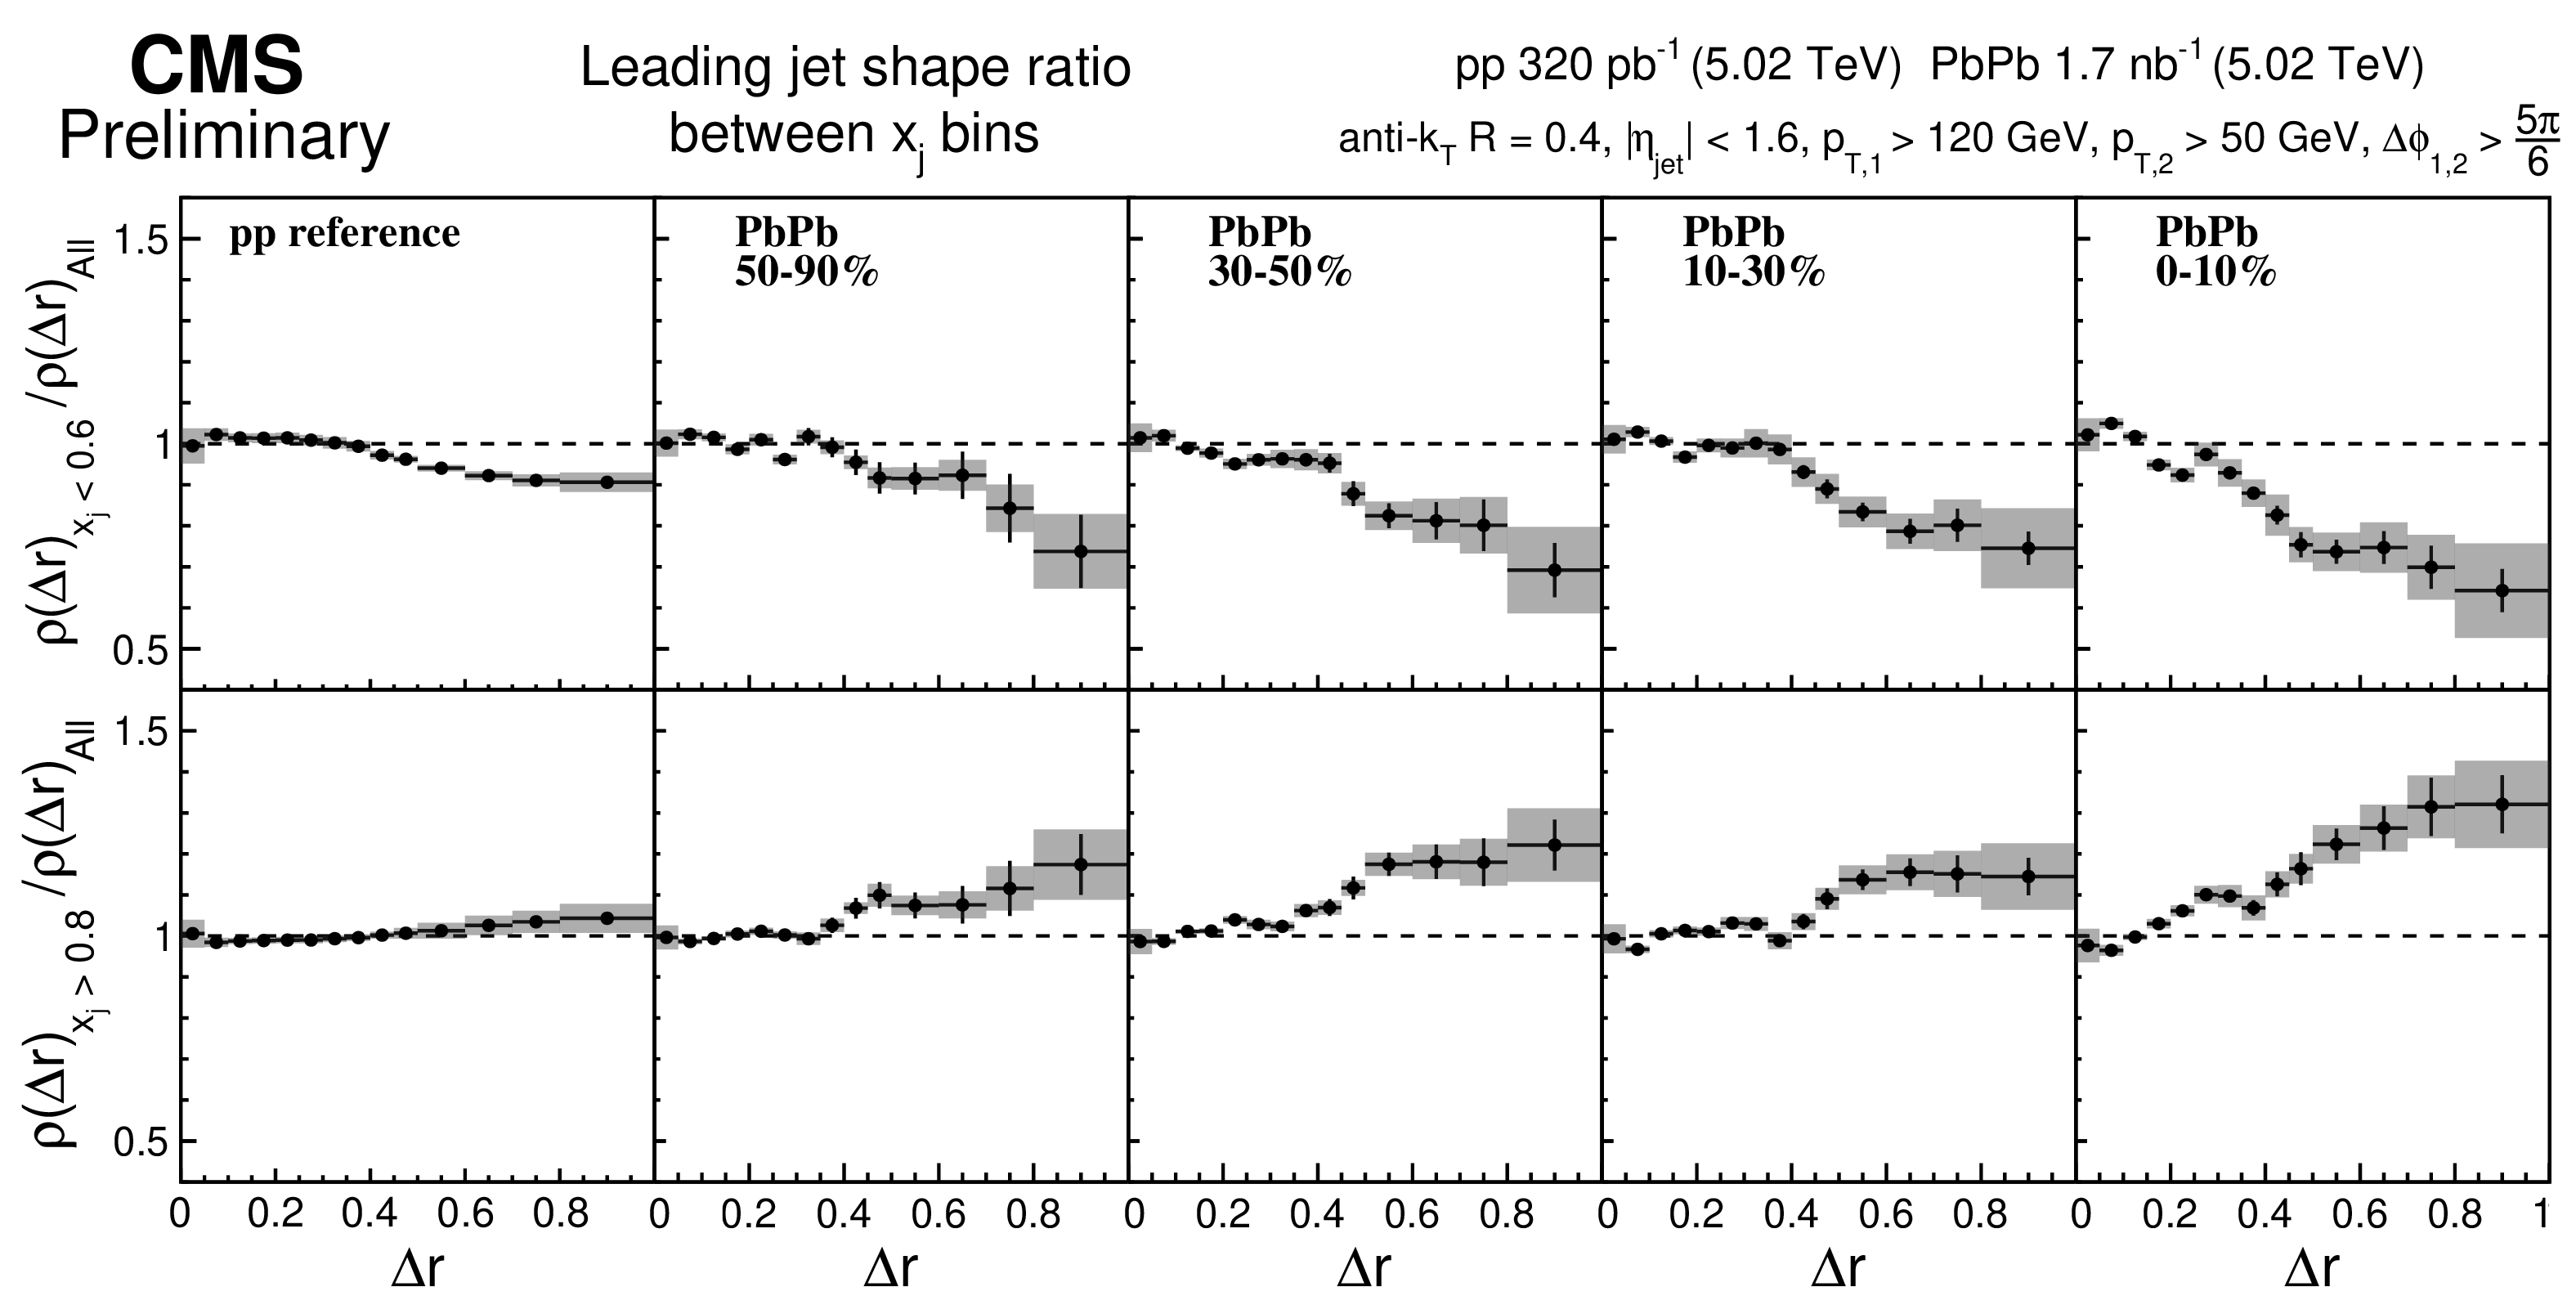
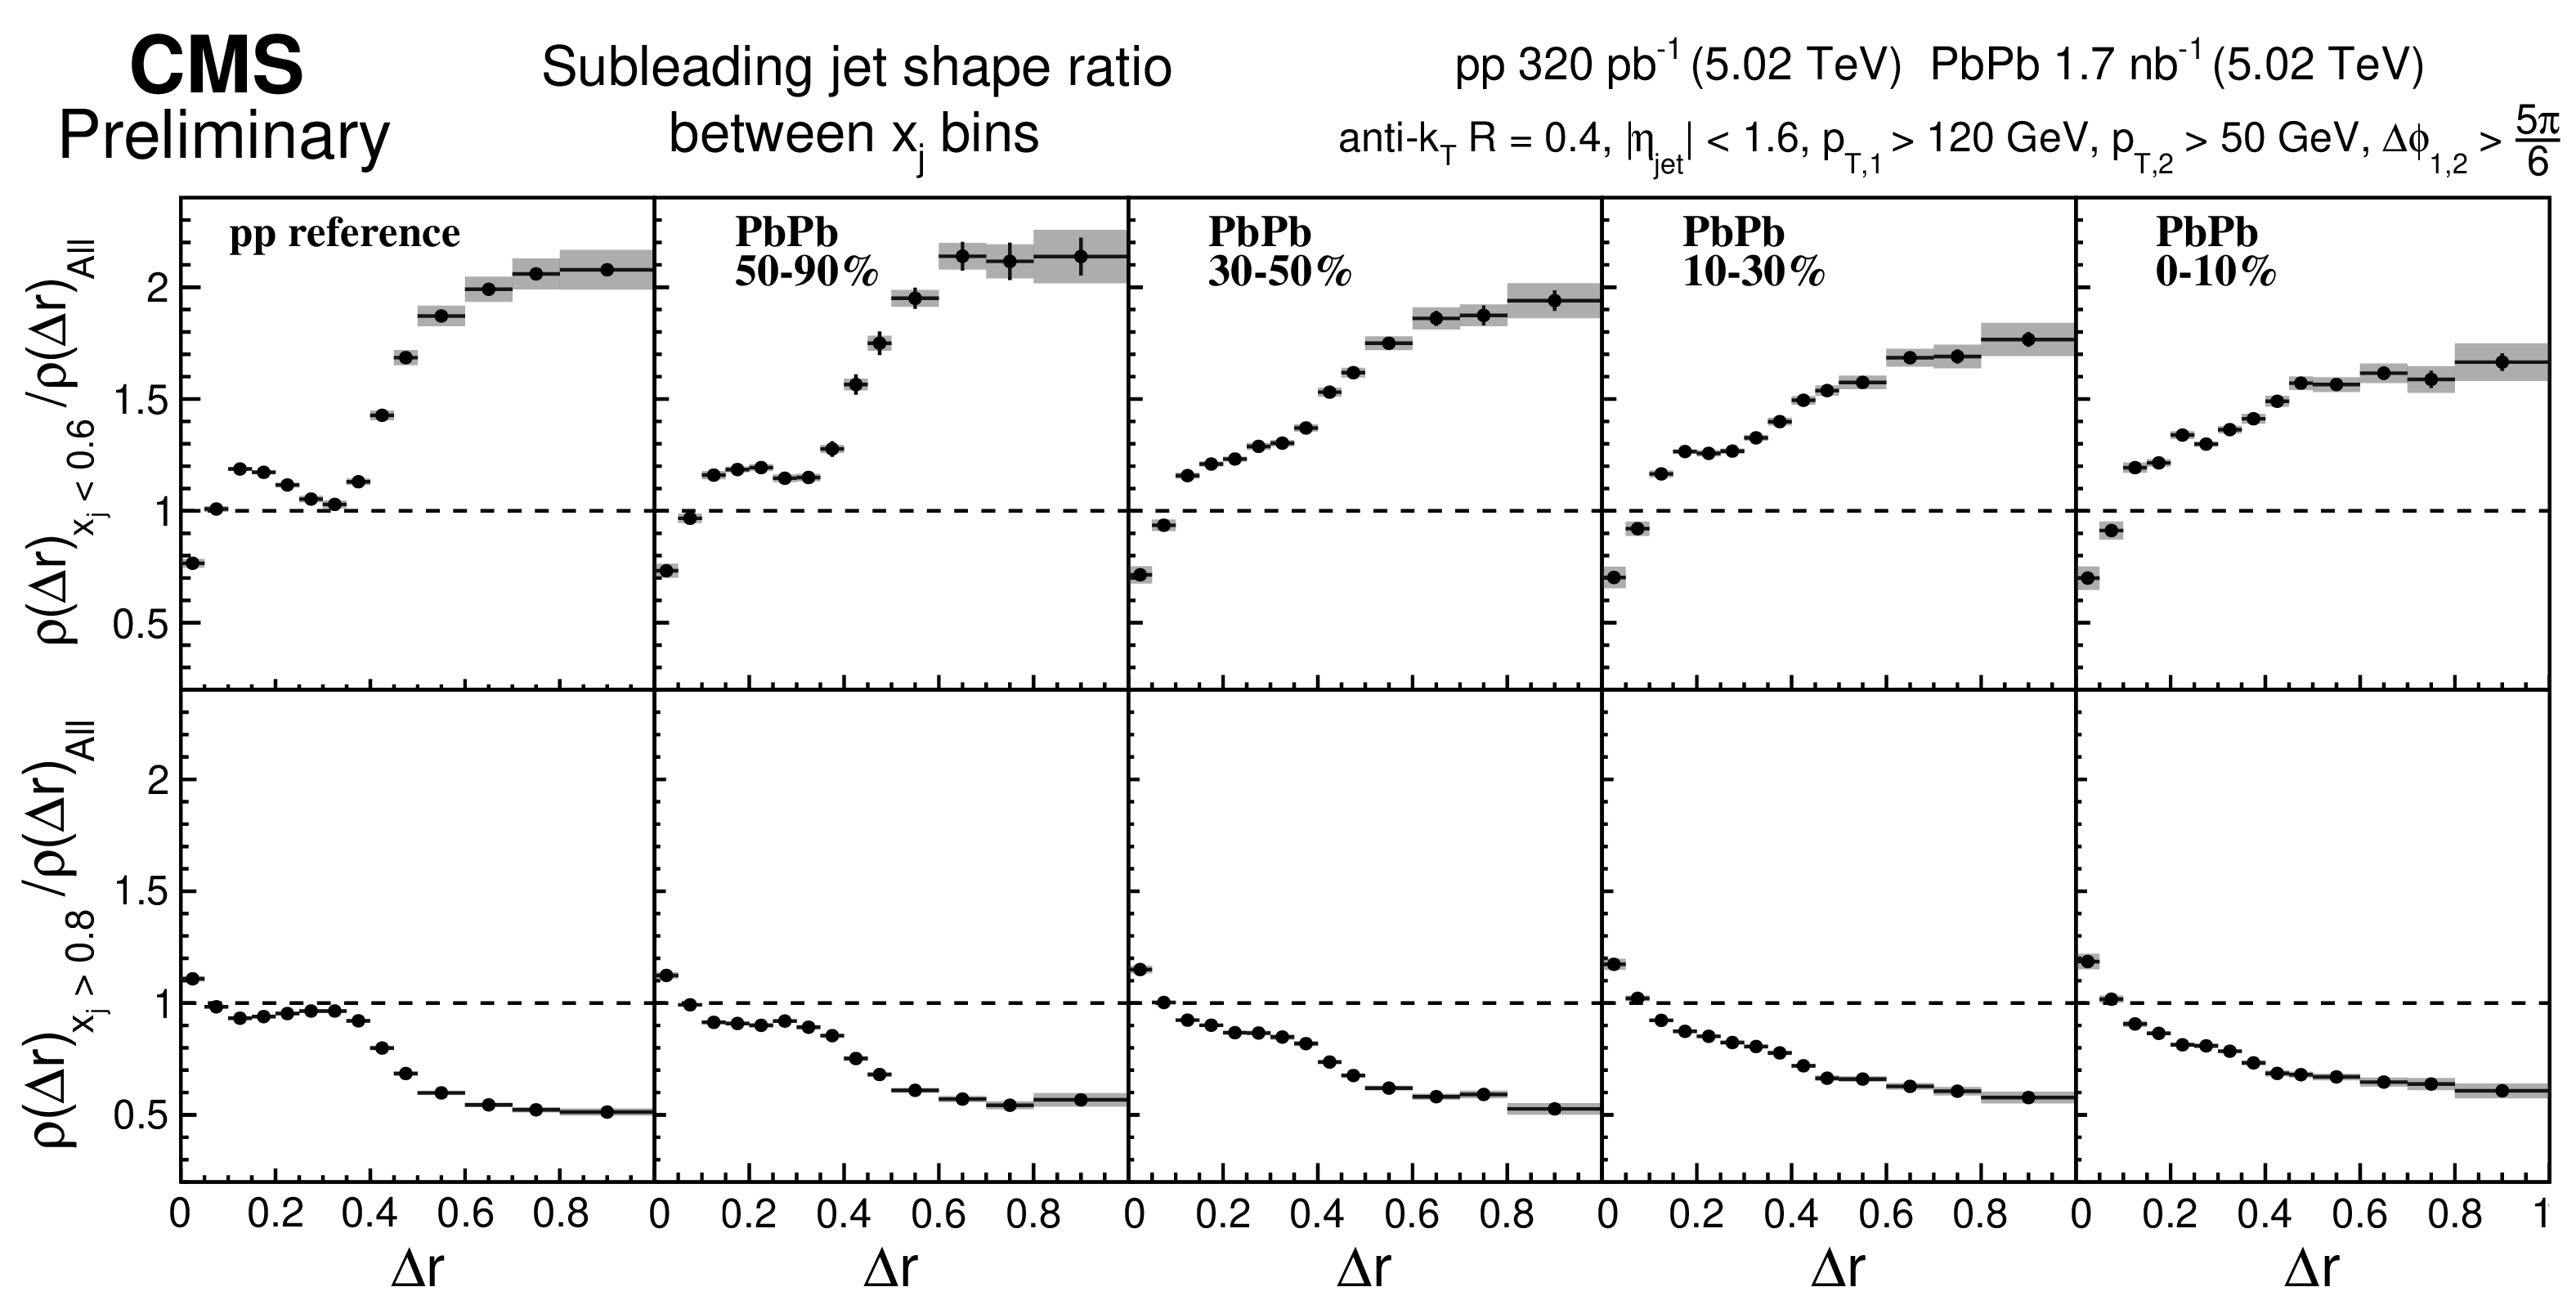
Figure 9:
Ratio of momentum unbalanced jet shapes 0.0 $ < x_{j} < $ 0.6 (top row) and balanced jet shapes 0.8 $ < x_{j} < $ 1.0 (bottom row) to $x_{j}$ integrated jet shapes for leading jets in pp collisions and different PbPb centrality bins. |
png pdf |
Figure 10:
Ratio of momentum unbalanced jet shapes 0.0 $ < x_{j} < $ 0.6 (top row) and balanced jet shapes 0.8 $ < x_{j} < $ 1.0 (bottom row) to $x_{j}$ integrated jet shape for subleading jets in pp collisions and different PbPb centrality bins. |
png pdf |
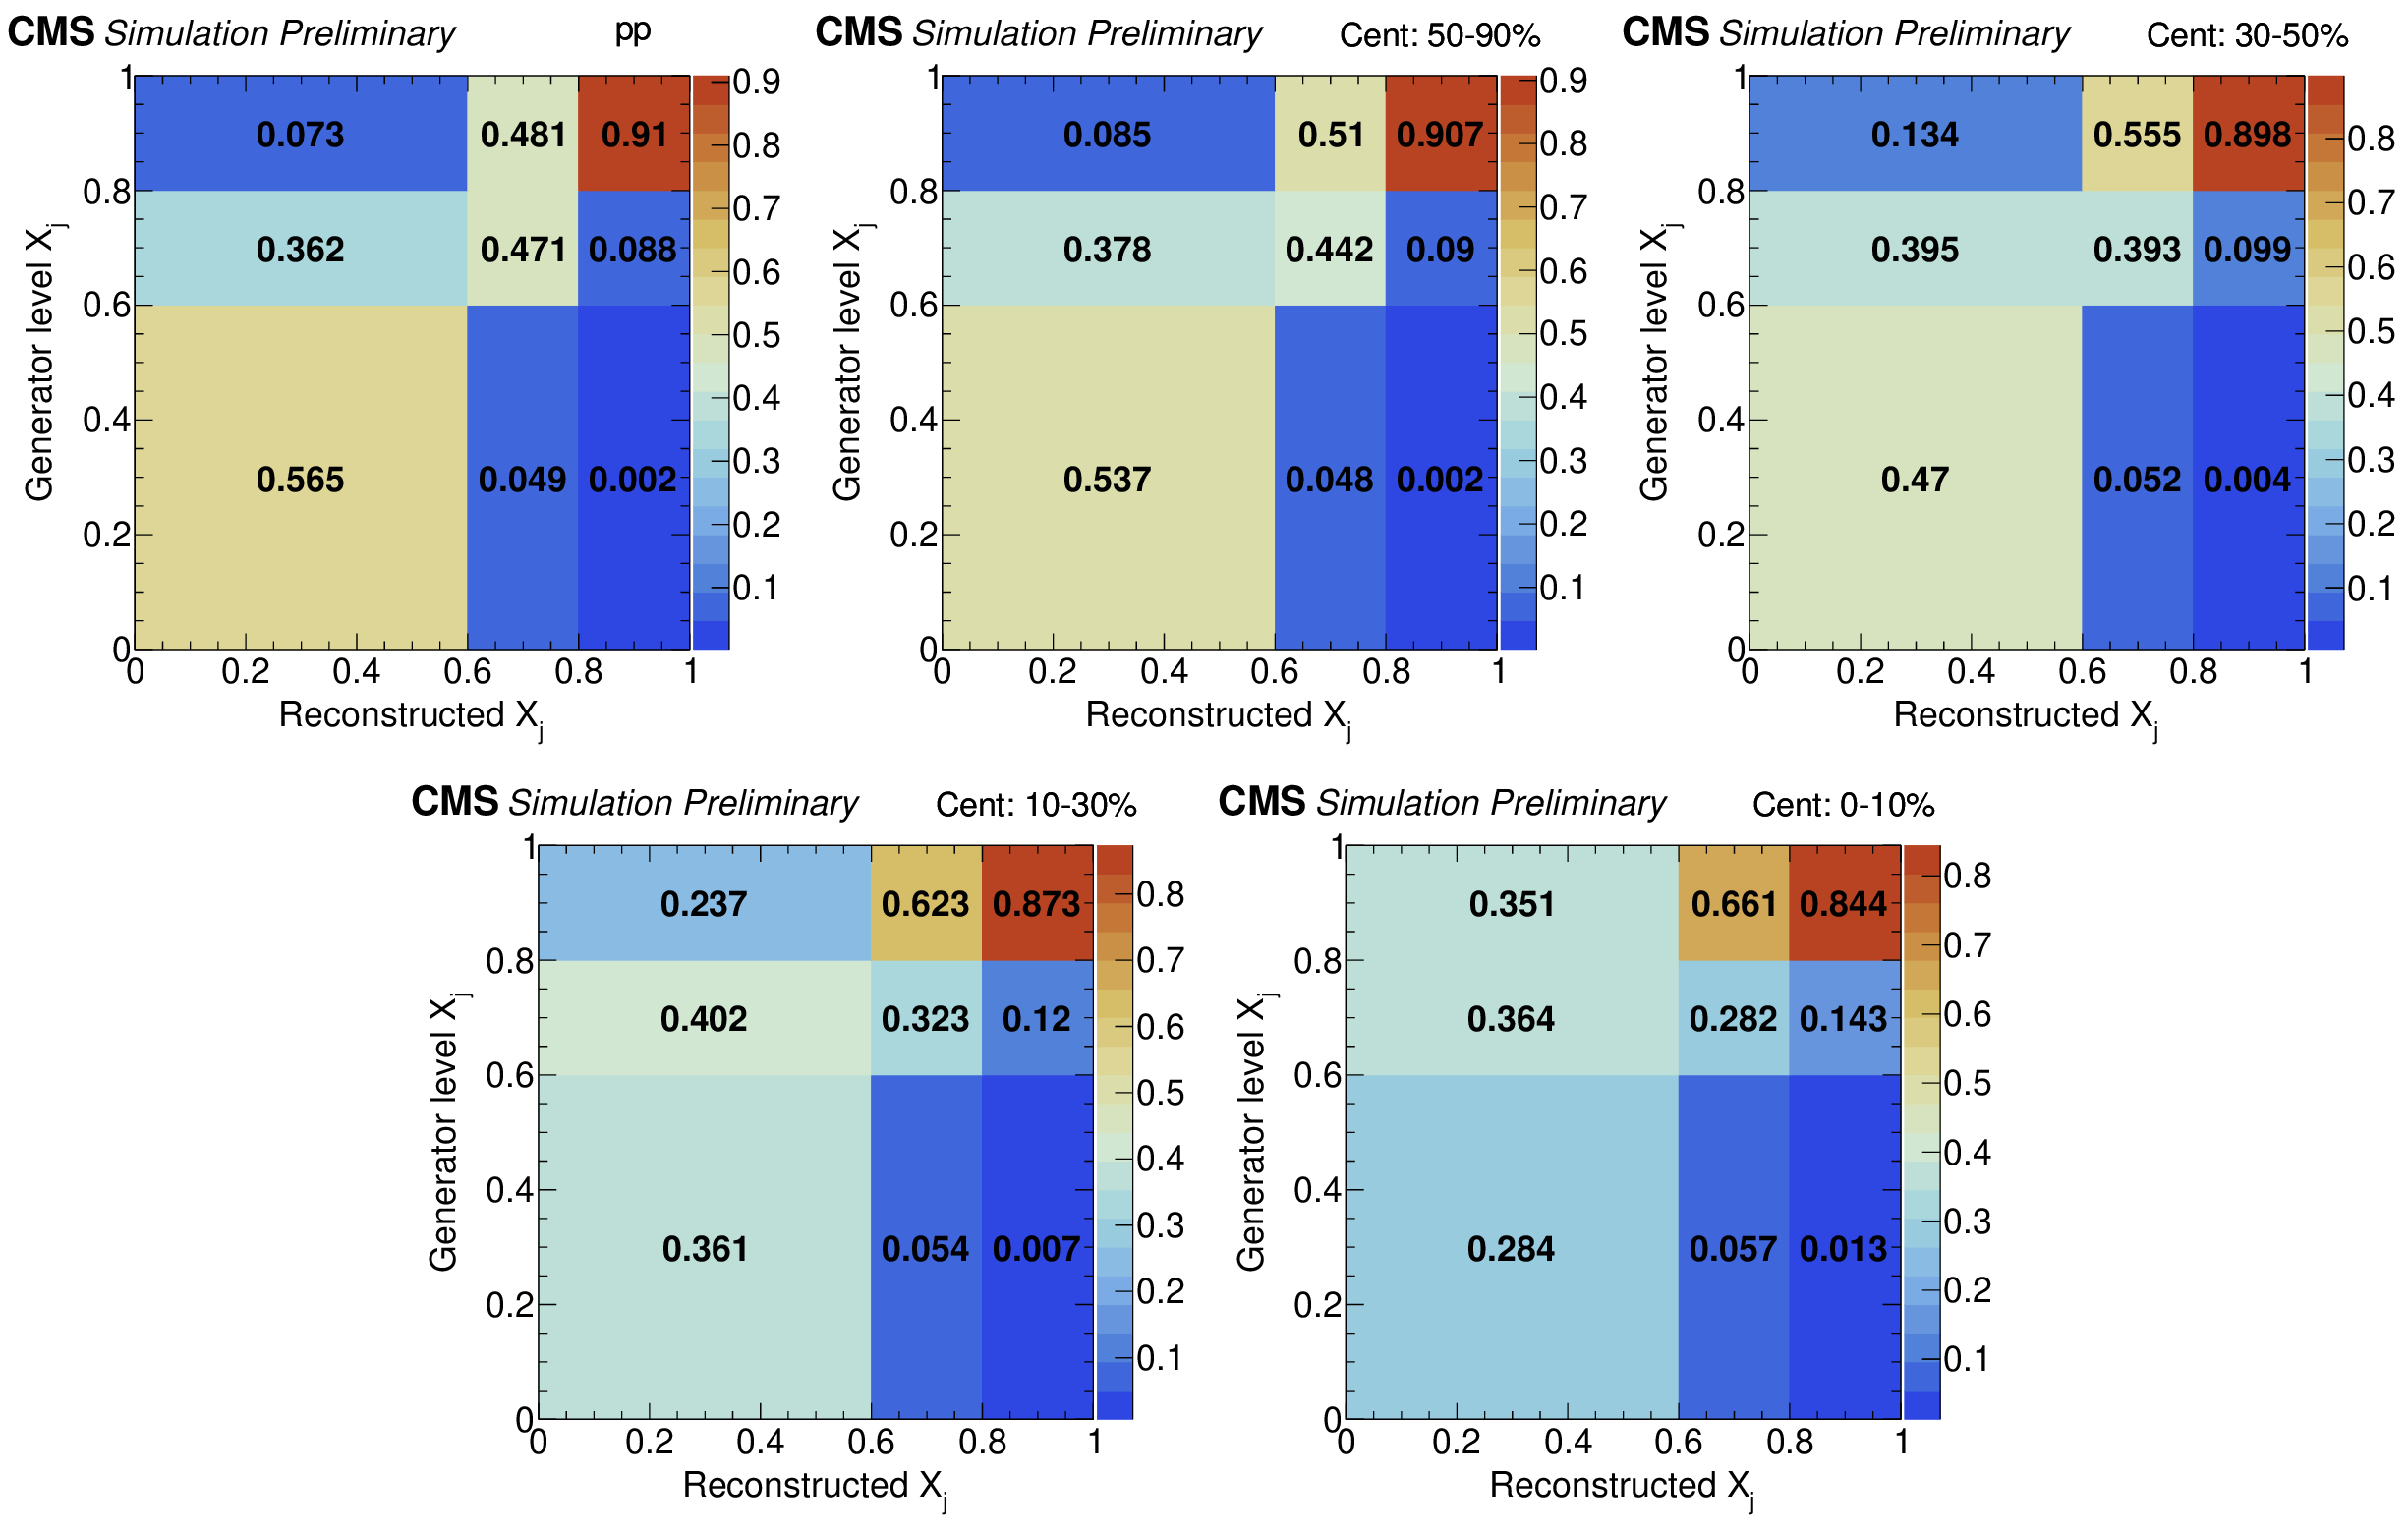
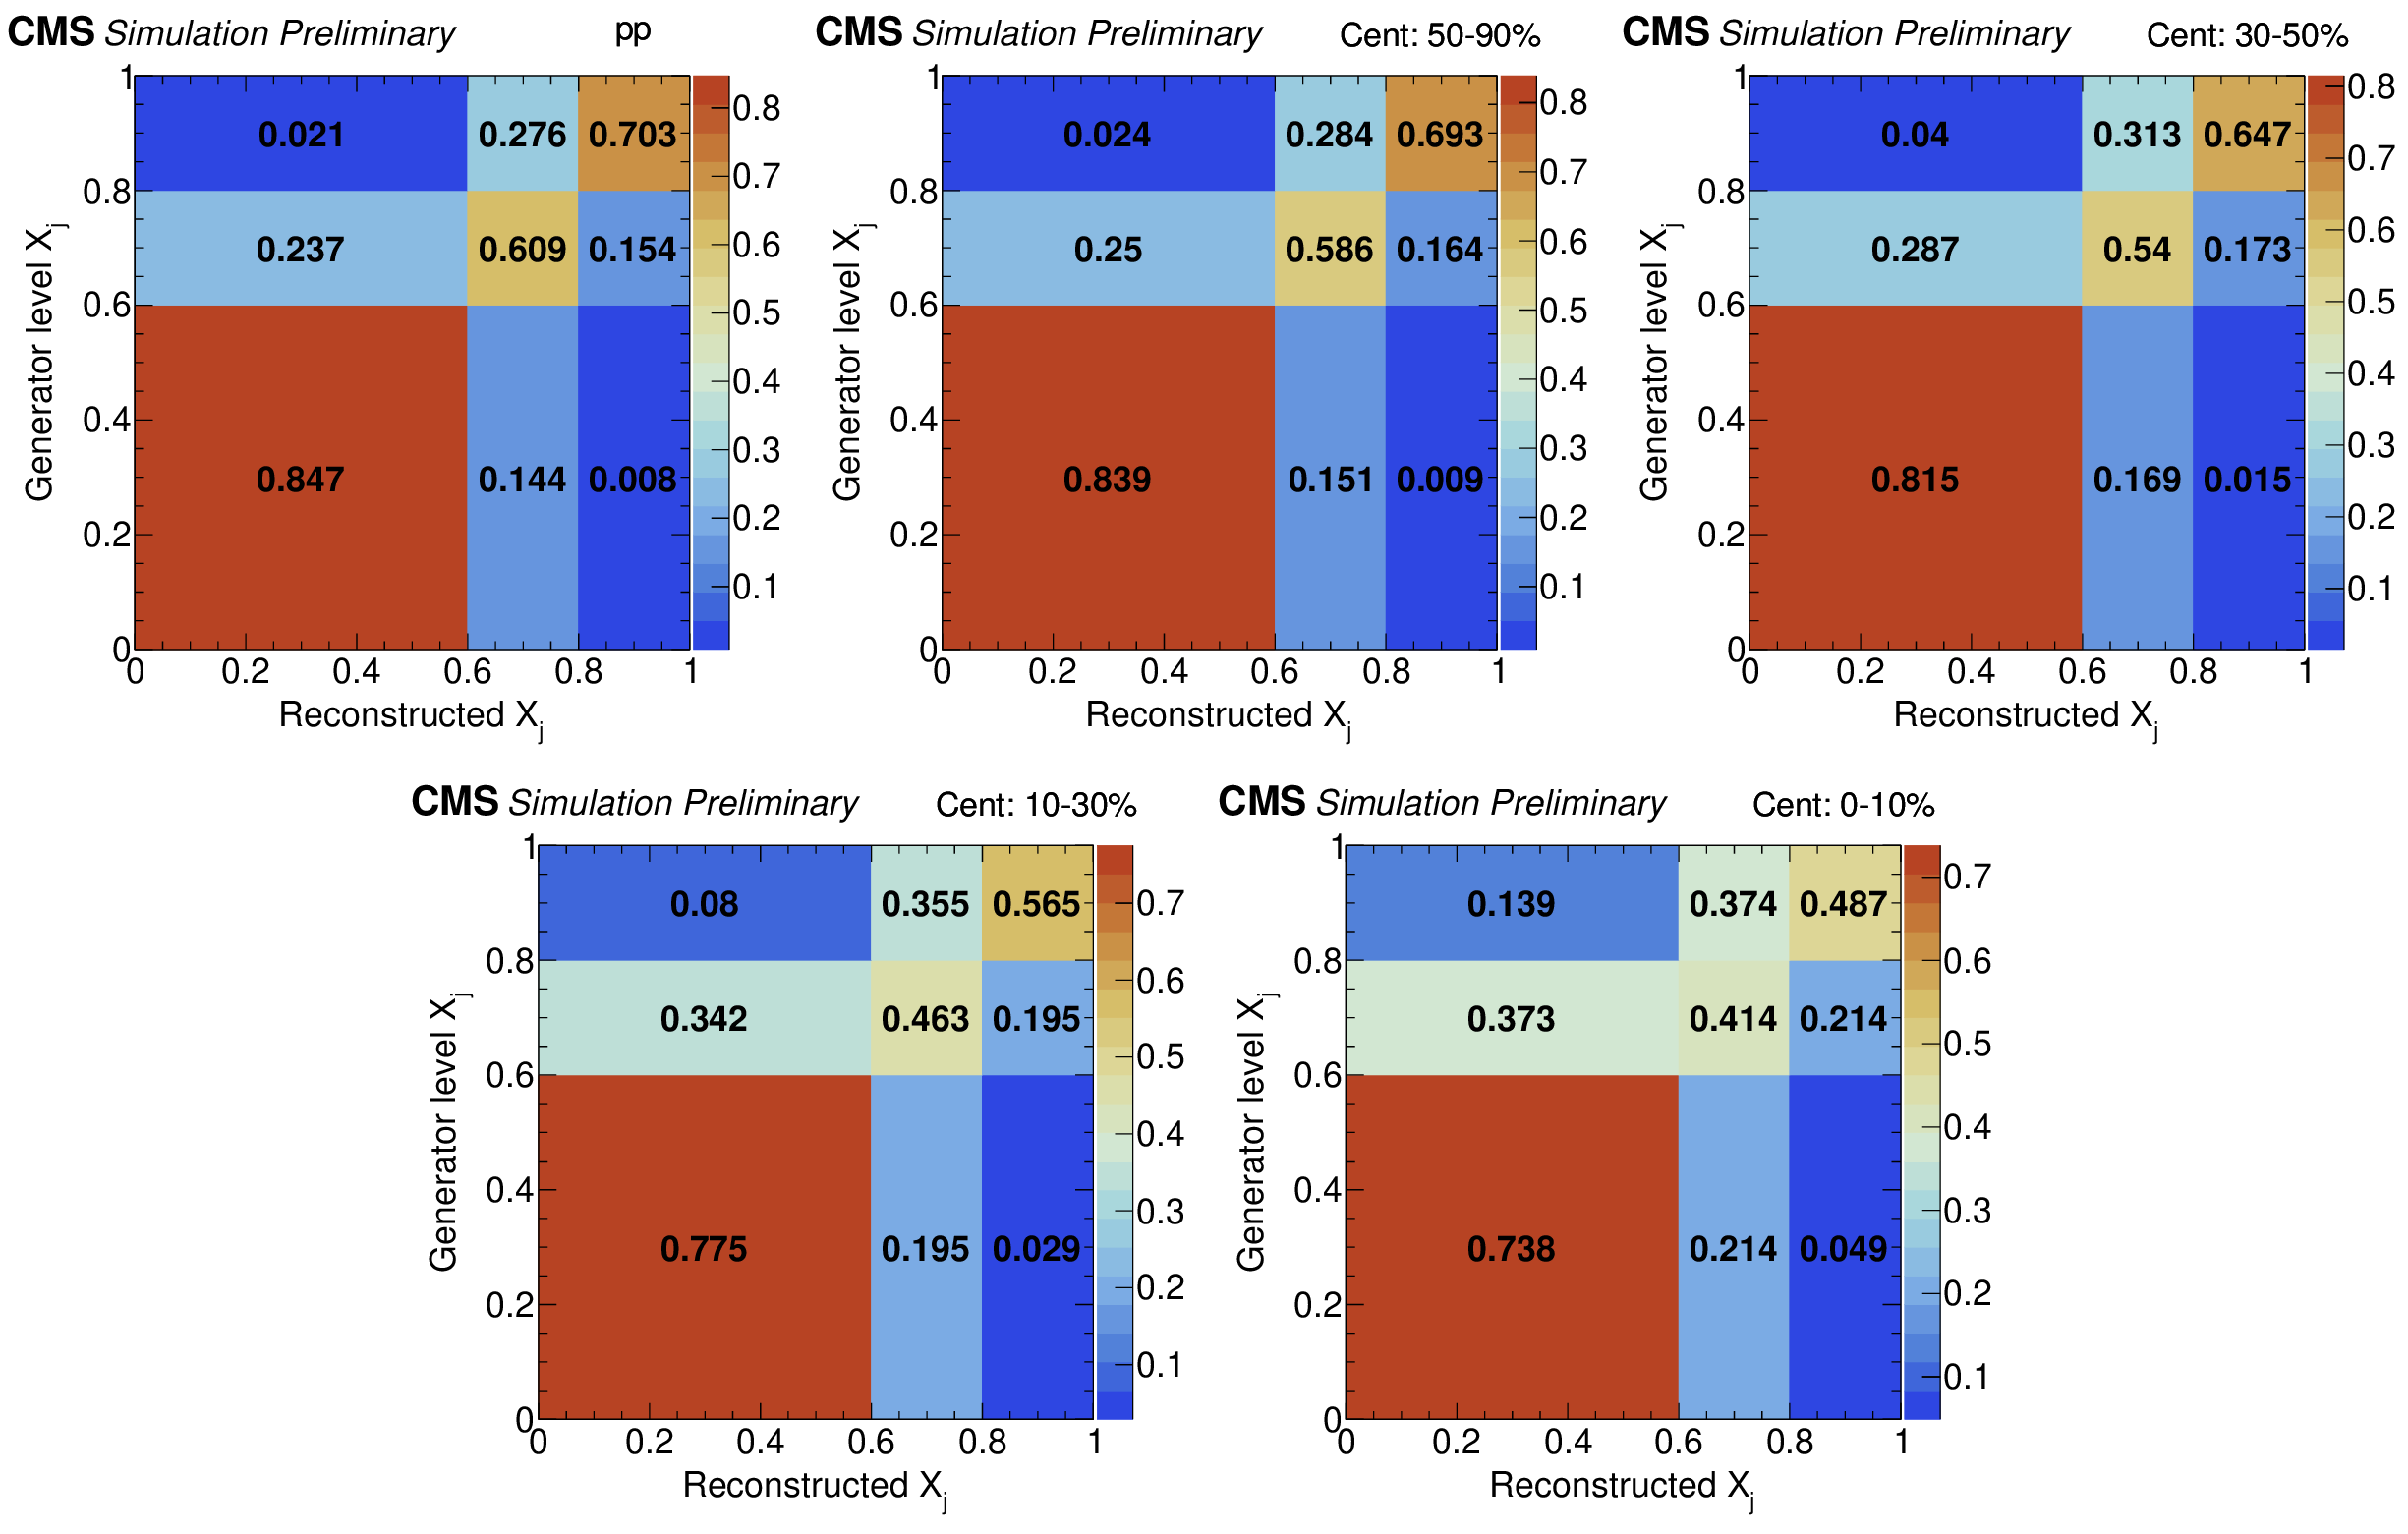
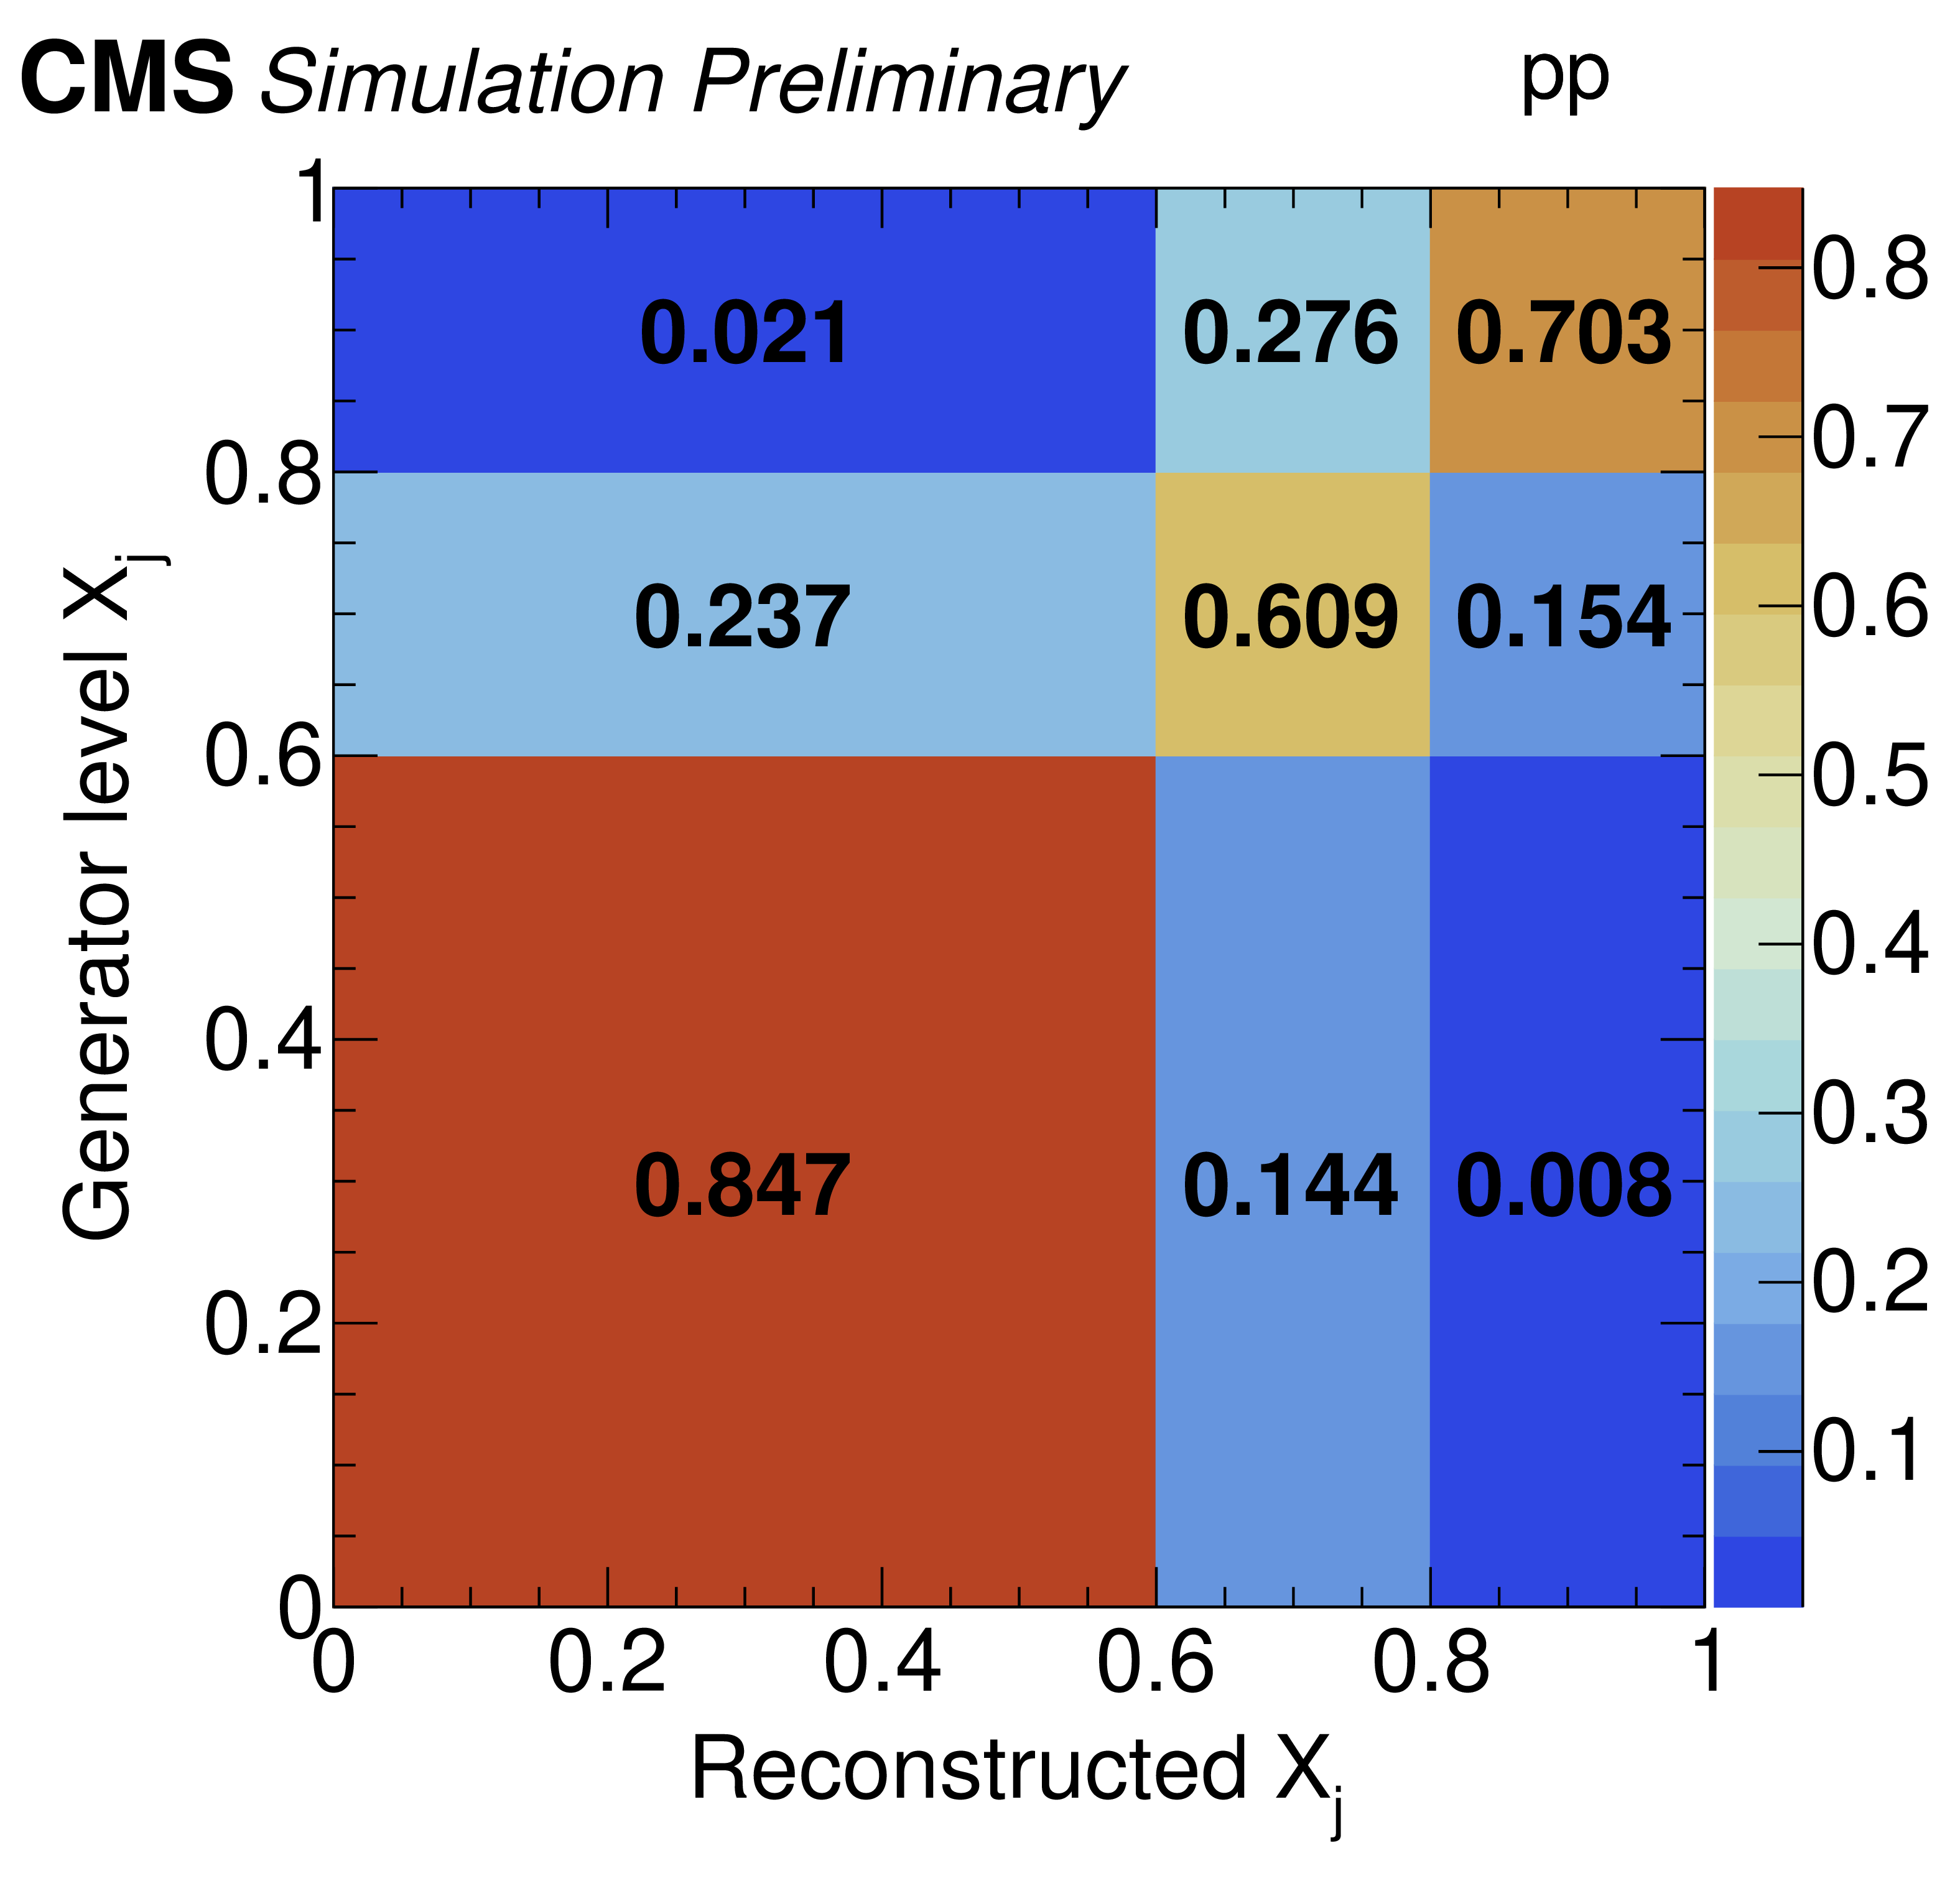
Figure 11:
Generator level $x_{j}$ versus reconstructed $x_{j}$ in the analysis $x_{j}$ bins. The plots show the probability to find a generator level $x_{j}$ for a given reconstructed $x_{j}$. Pythia8 simulation is on the leftmost column in the top row while the most central Pythia+Hydjet in on the right of the bottow row. |
png pdf |
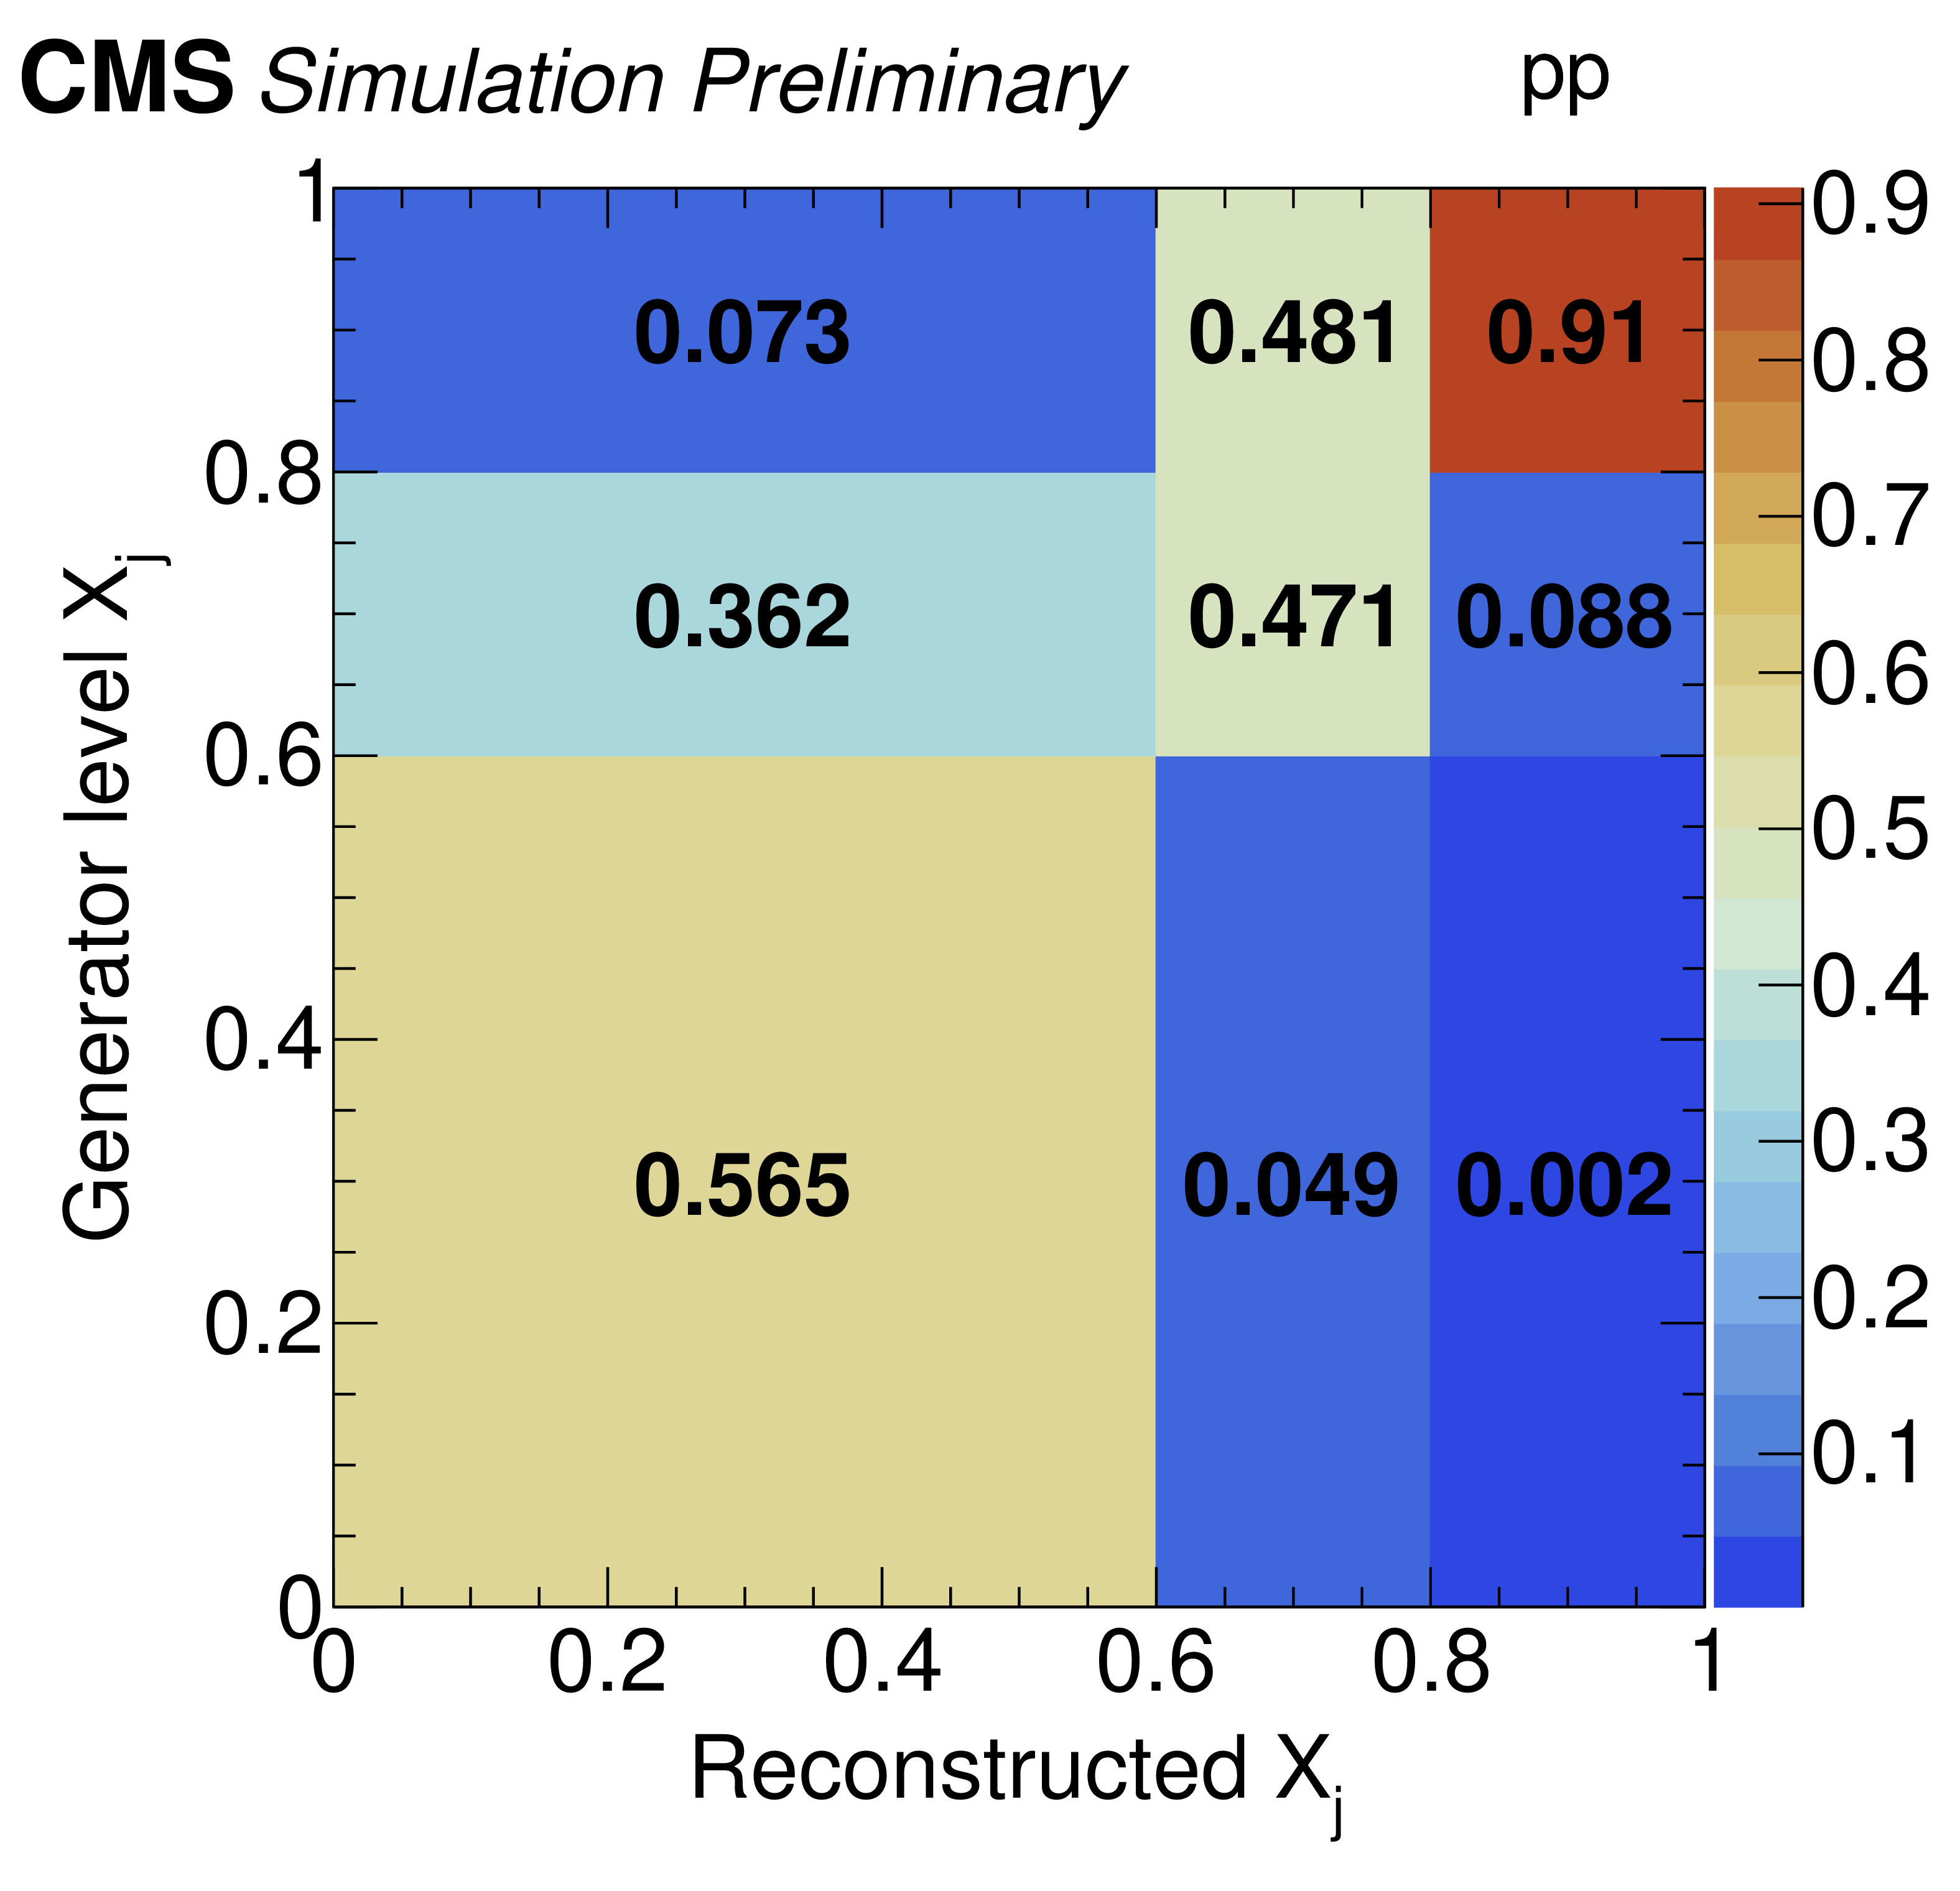
Figure 11-a:
Generator level $x_{j}$ versus reconstructed $x_{j}$ in the analysis $x_{j}$ bins. The plots show the probability to find a generator level $x_{j}$ for a given reconstructed $x_{j}$. Pythia8 simulation is on the leftmost column in the top row while the most central Pythia+Hydjet in on the right of the bottow row. |
png pdf |
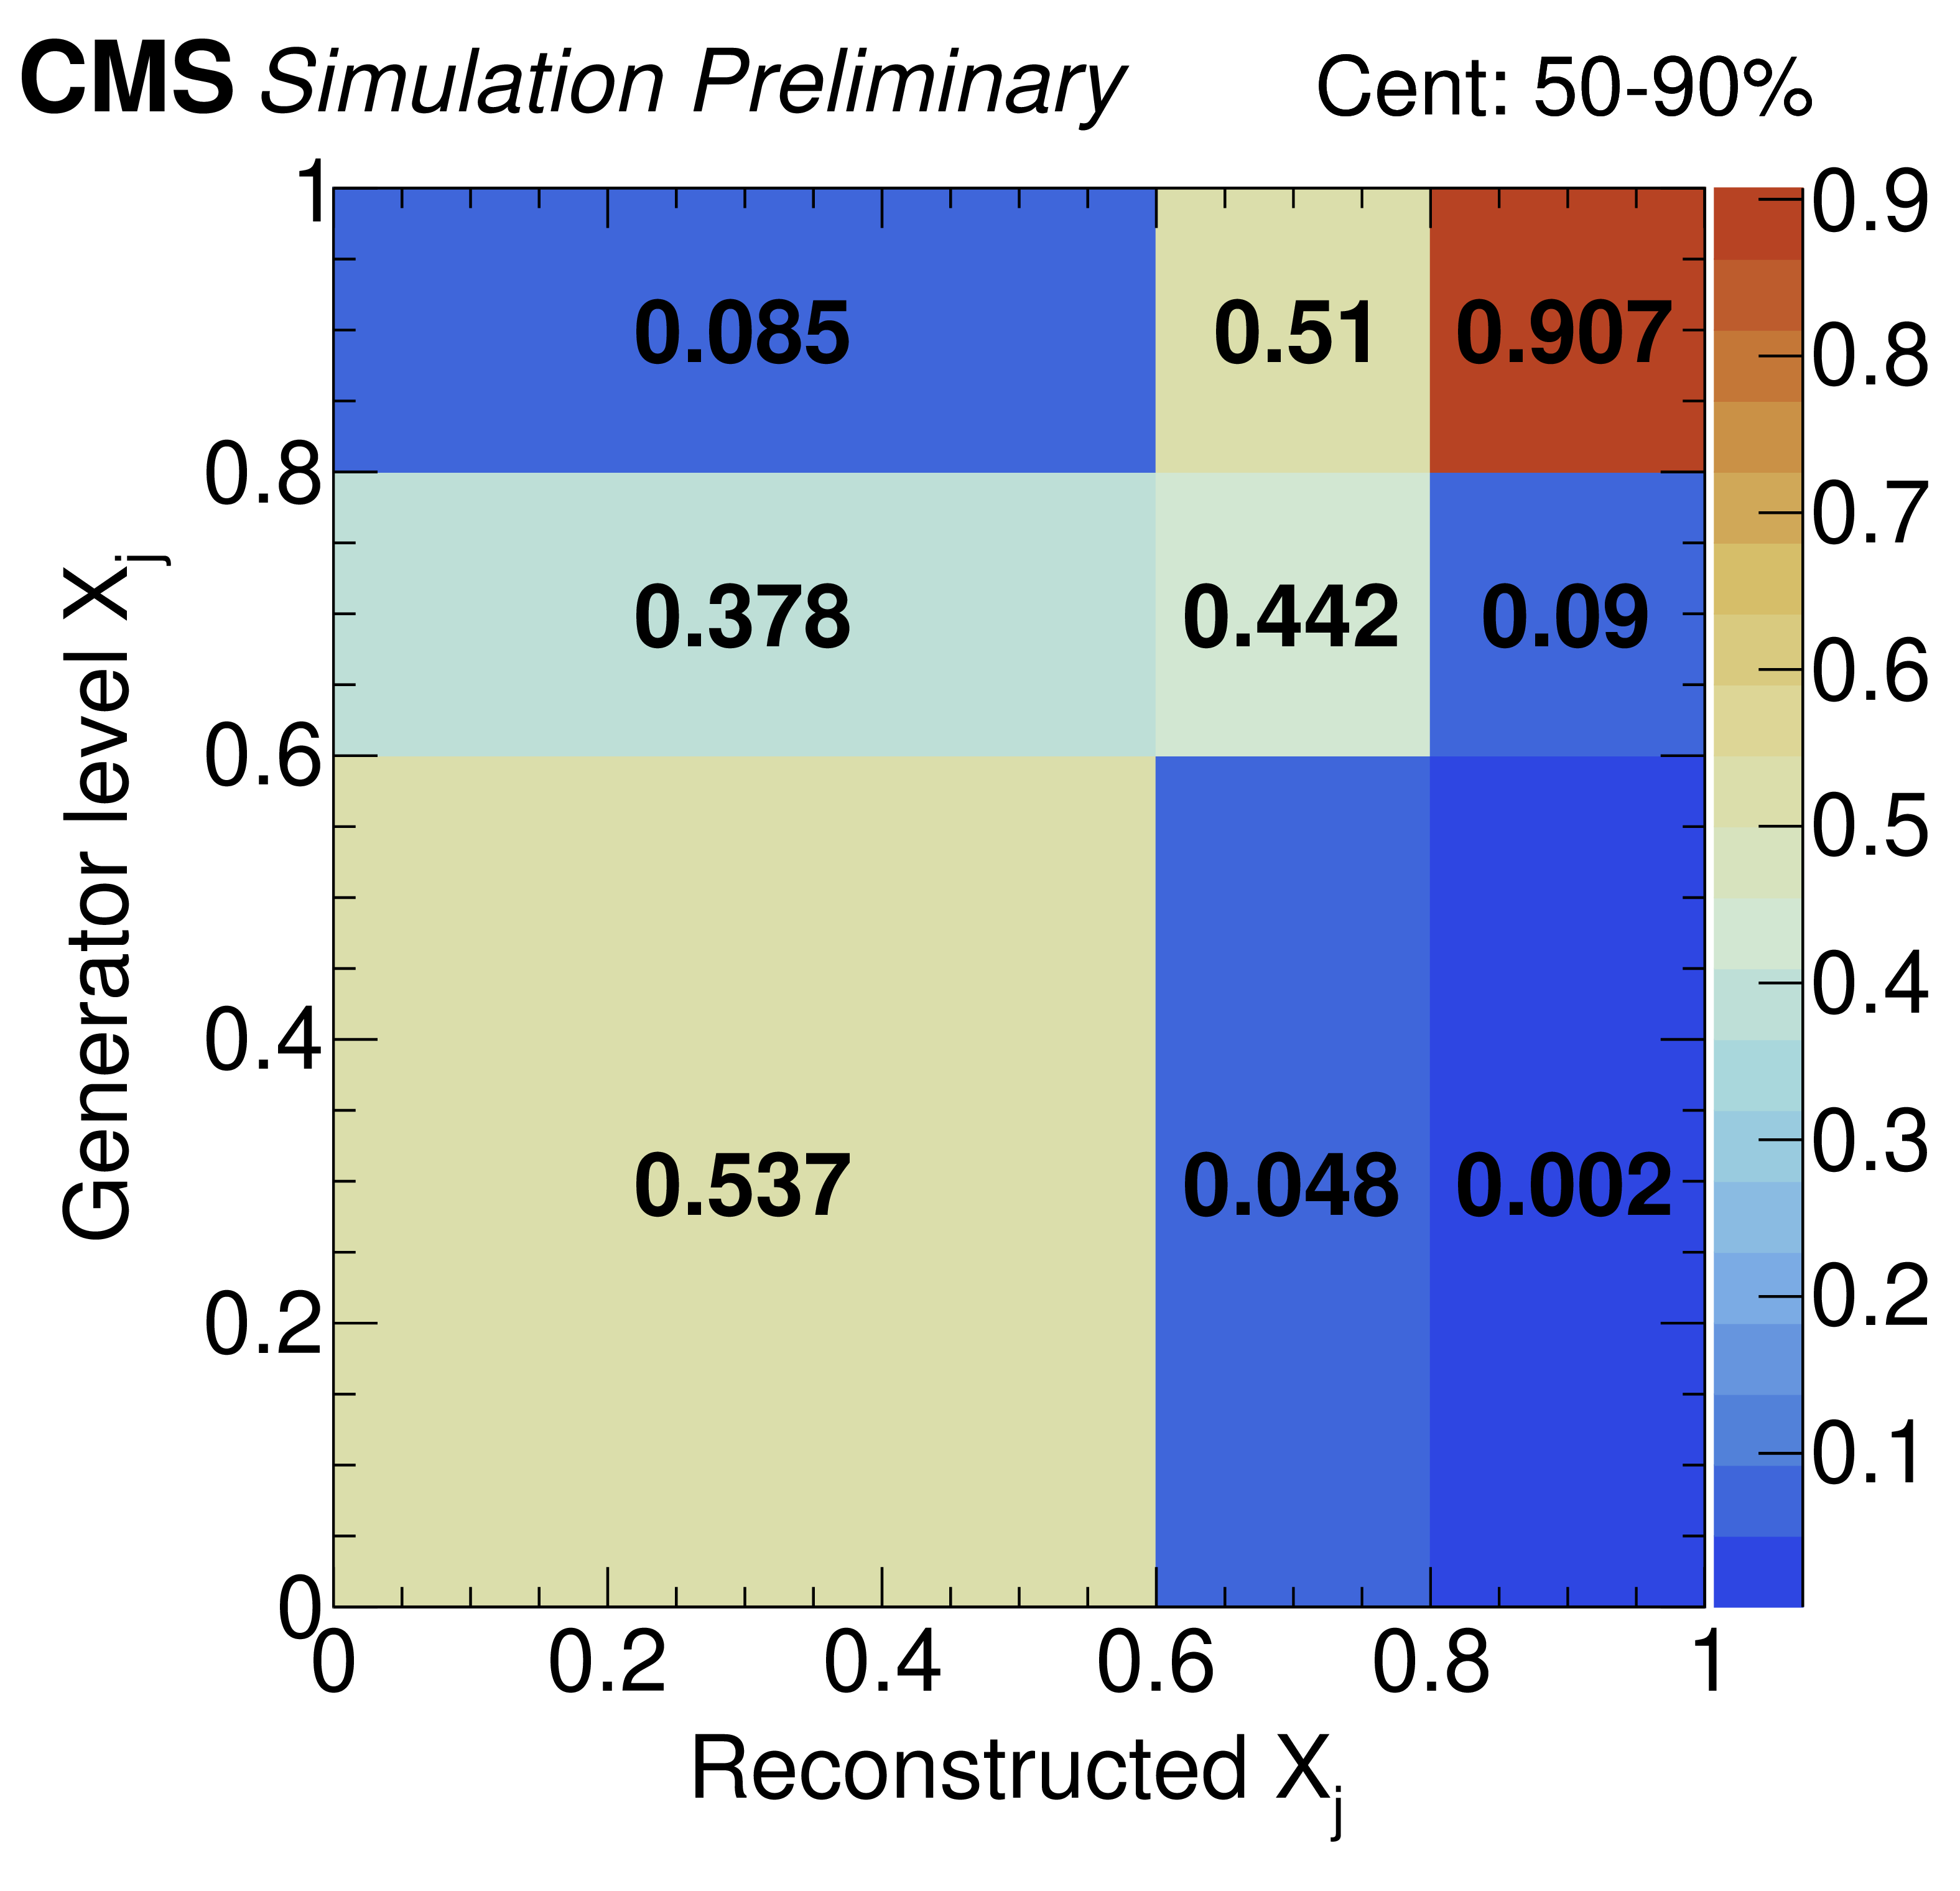
Figure 11-b:
Generator level $x_{j}$ versus reconstructed $x_{j}$ in the analysis $x_{j}$ bins. The plots show the probability to find a generator level $x_{j}$ for a given reconstructed $x_{j}$. Pythia8 simulation is on the leftmost column in the top row while the most central Pythia+Hydjet in on the right of the bottow row. |
png pdf |
Figure 11-c:
Generator level $x_{j}$ versus reconstructed $x_{j}$ in the analysis $x_{j}$ bins. The plots show the probability to find a generator level $x_{j}$ for a given reconstructed $x_{j}$. Pythia8 simulation is on the leftmost column in the top row while the most central Pythia+Hydjet in on the right of the bottow row. |
png pdf |
Figure 11-d:
Generator level $x_{j}$ versus reconstructed $x_{j}$ in the analysis $x_{j}$ bins. The plots show the probability to find a generator level $x_{j}$ for a given reconstructed $x_{j}$. Pythia8 simulation is on the leftmost column in the top row while the most central Pythia+Hydjet in on the right of the bottow row. |

png pdf |
Figure 11-e:
Generator level $x_{j}$ versus reconstructed $x_{j}$ in the analysis $x_{j}$ bins. The plots show the probability to find a generator level $x_{j}$ for a given reconstructed $x_{j}$. Pythia8 simulation is on the leftmost column in the top row while the most central Pythia+Hydjet in on the right of the bottow row. |
png pdf |
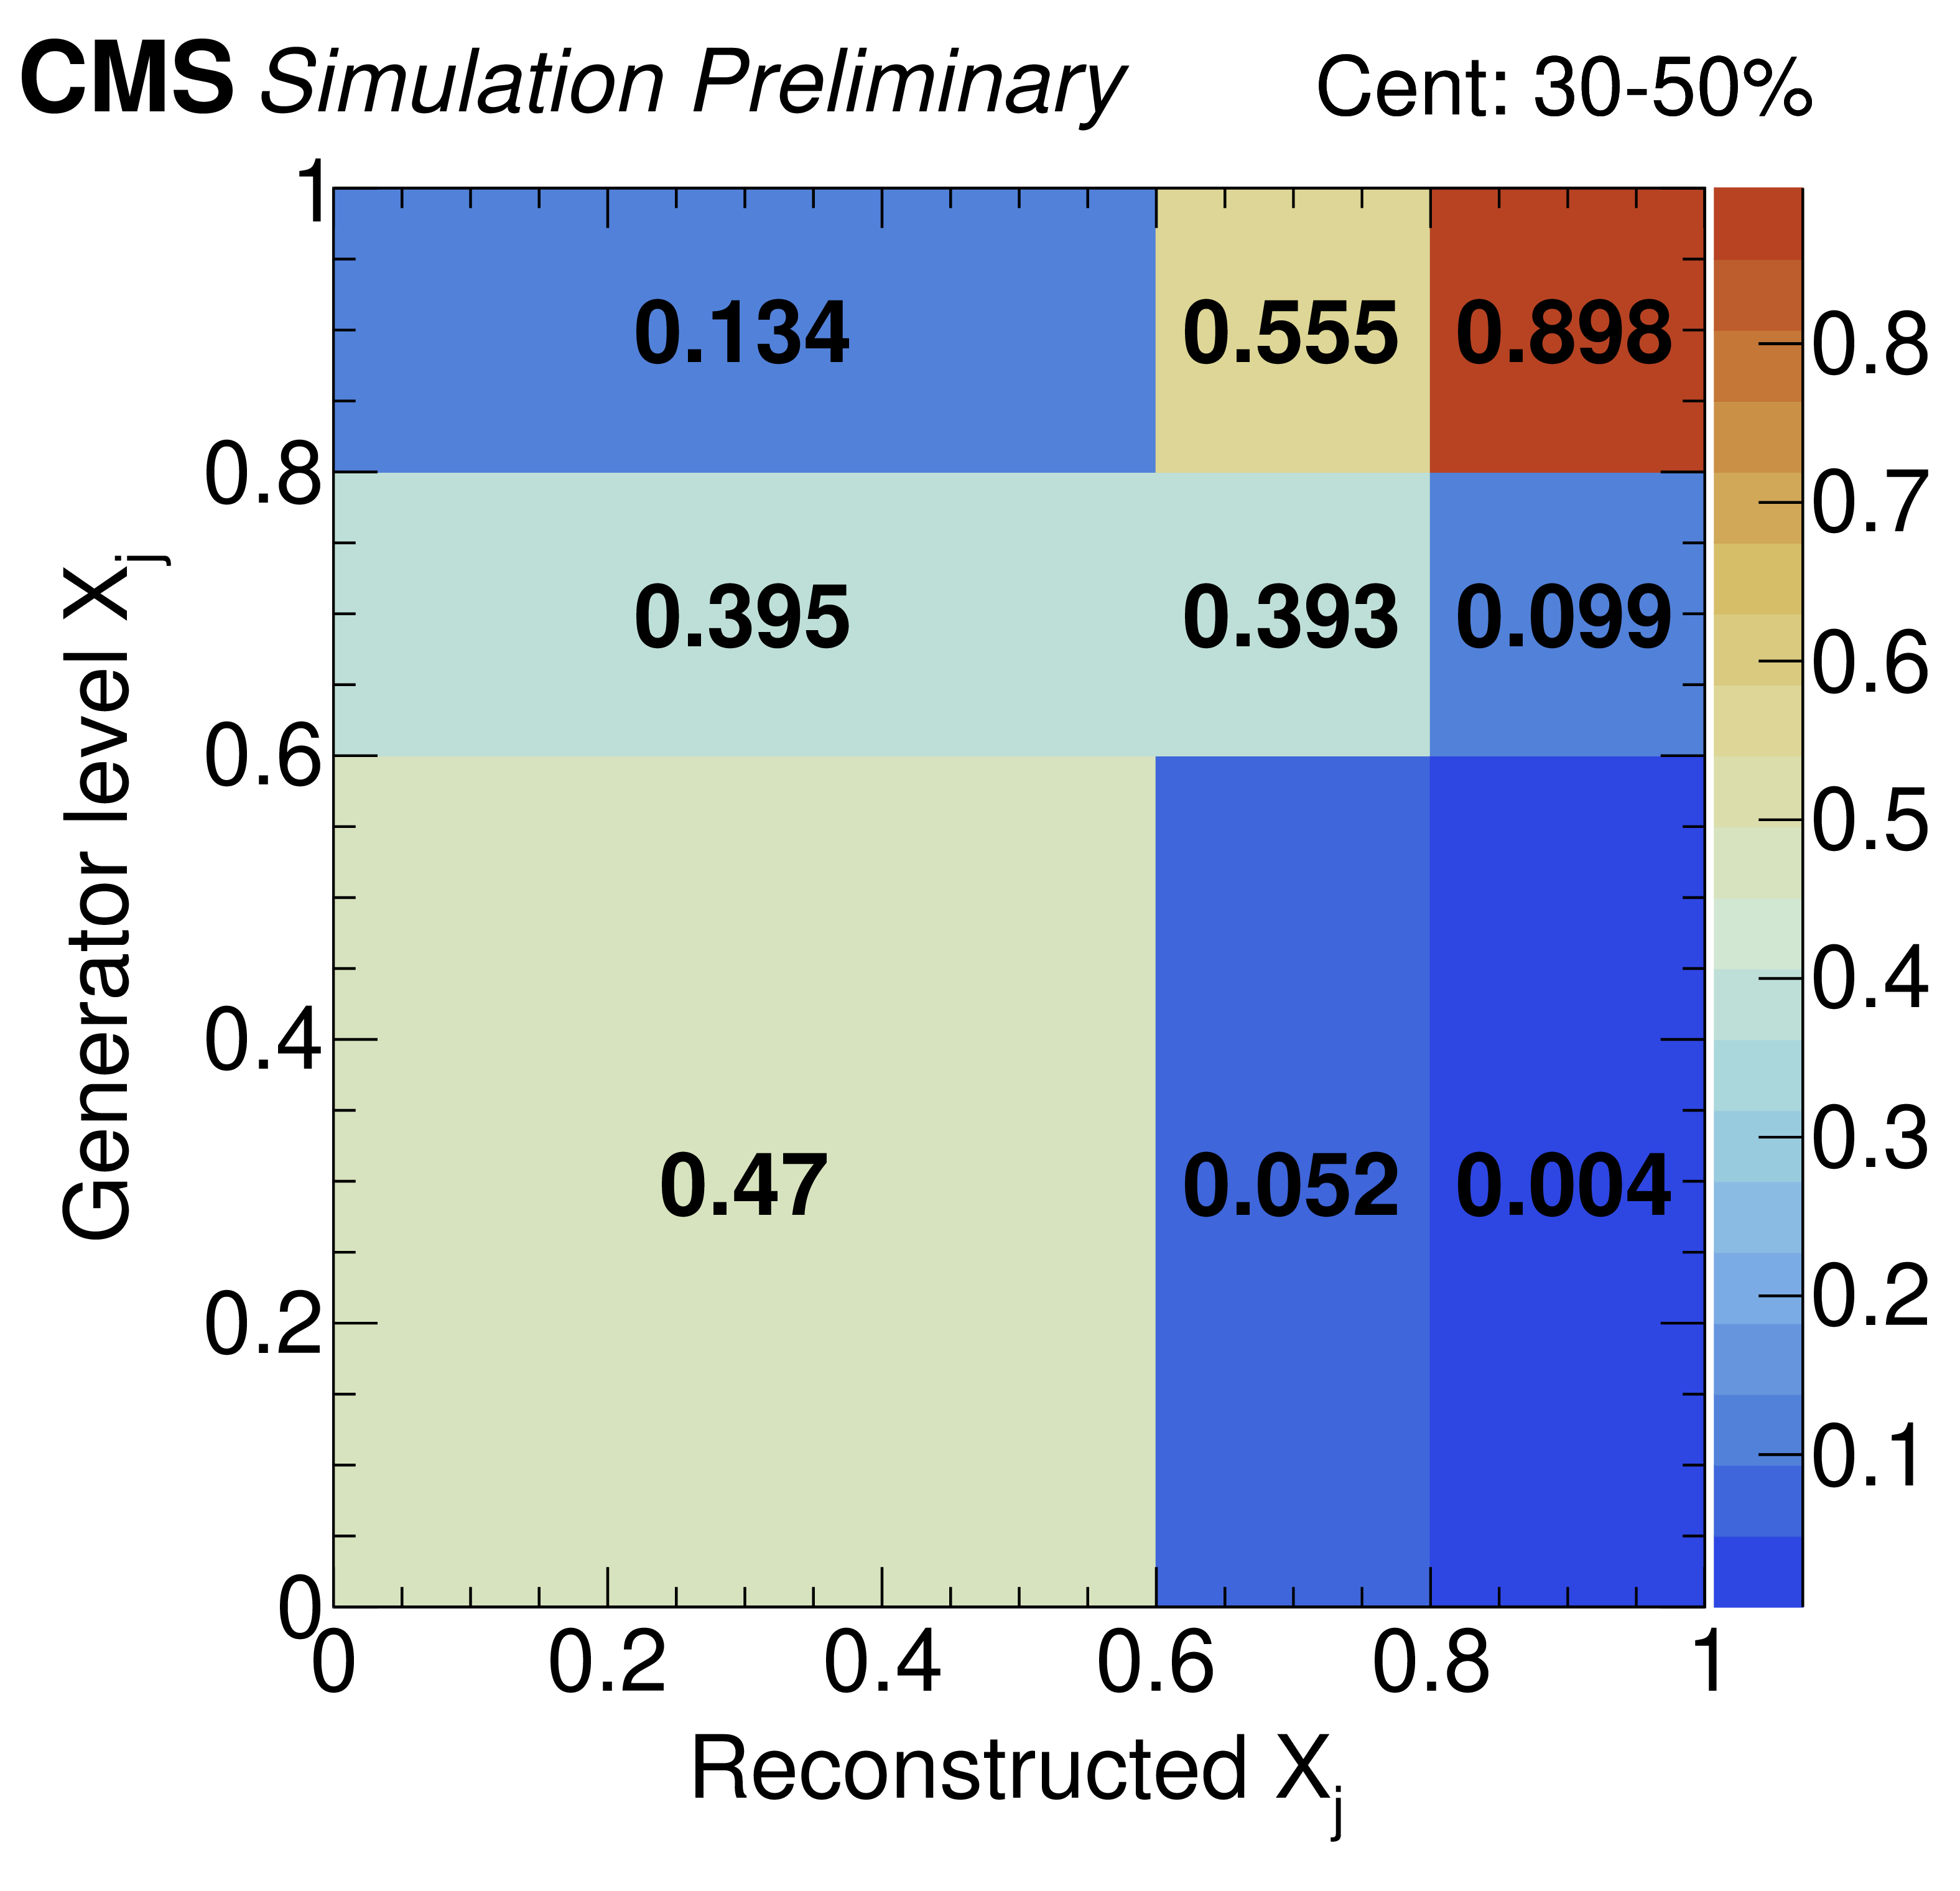
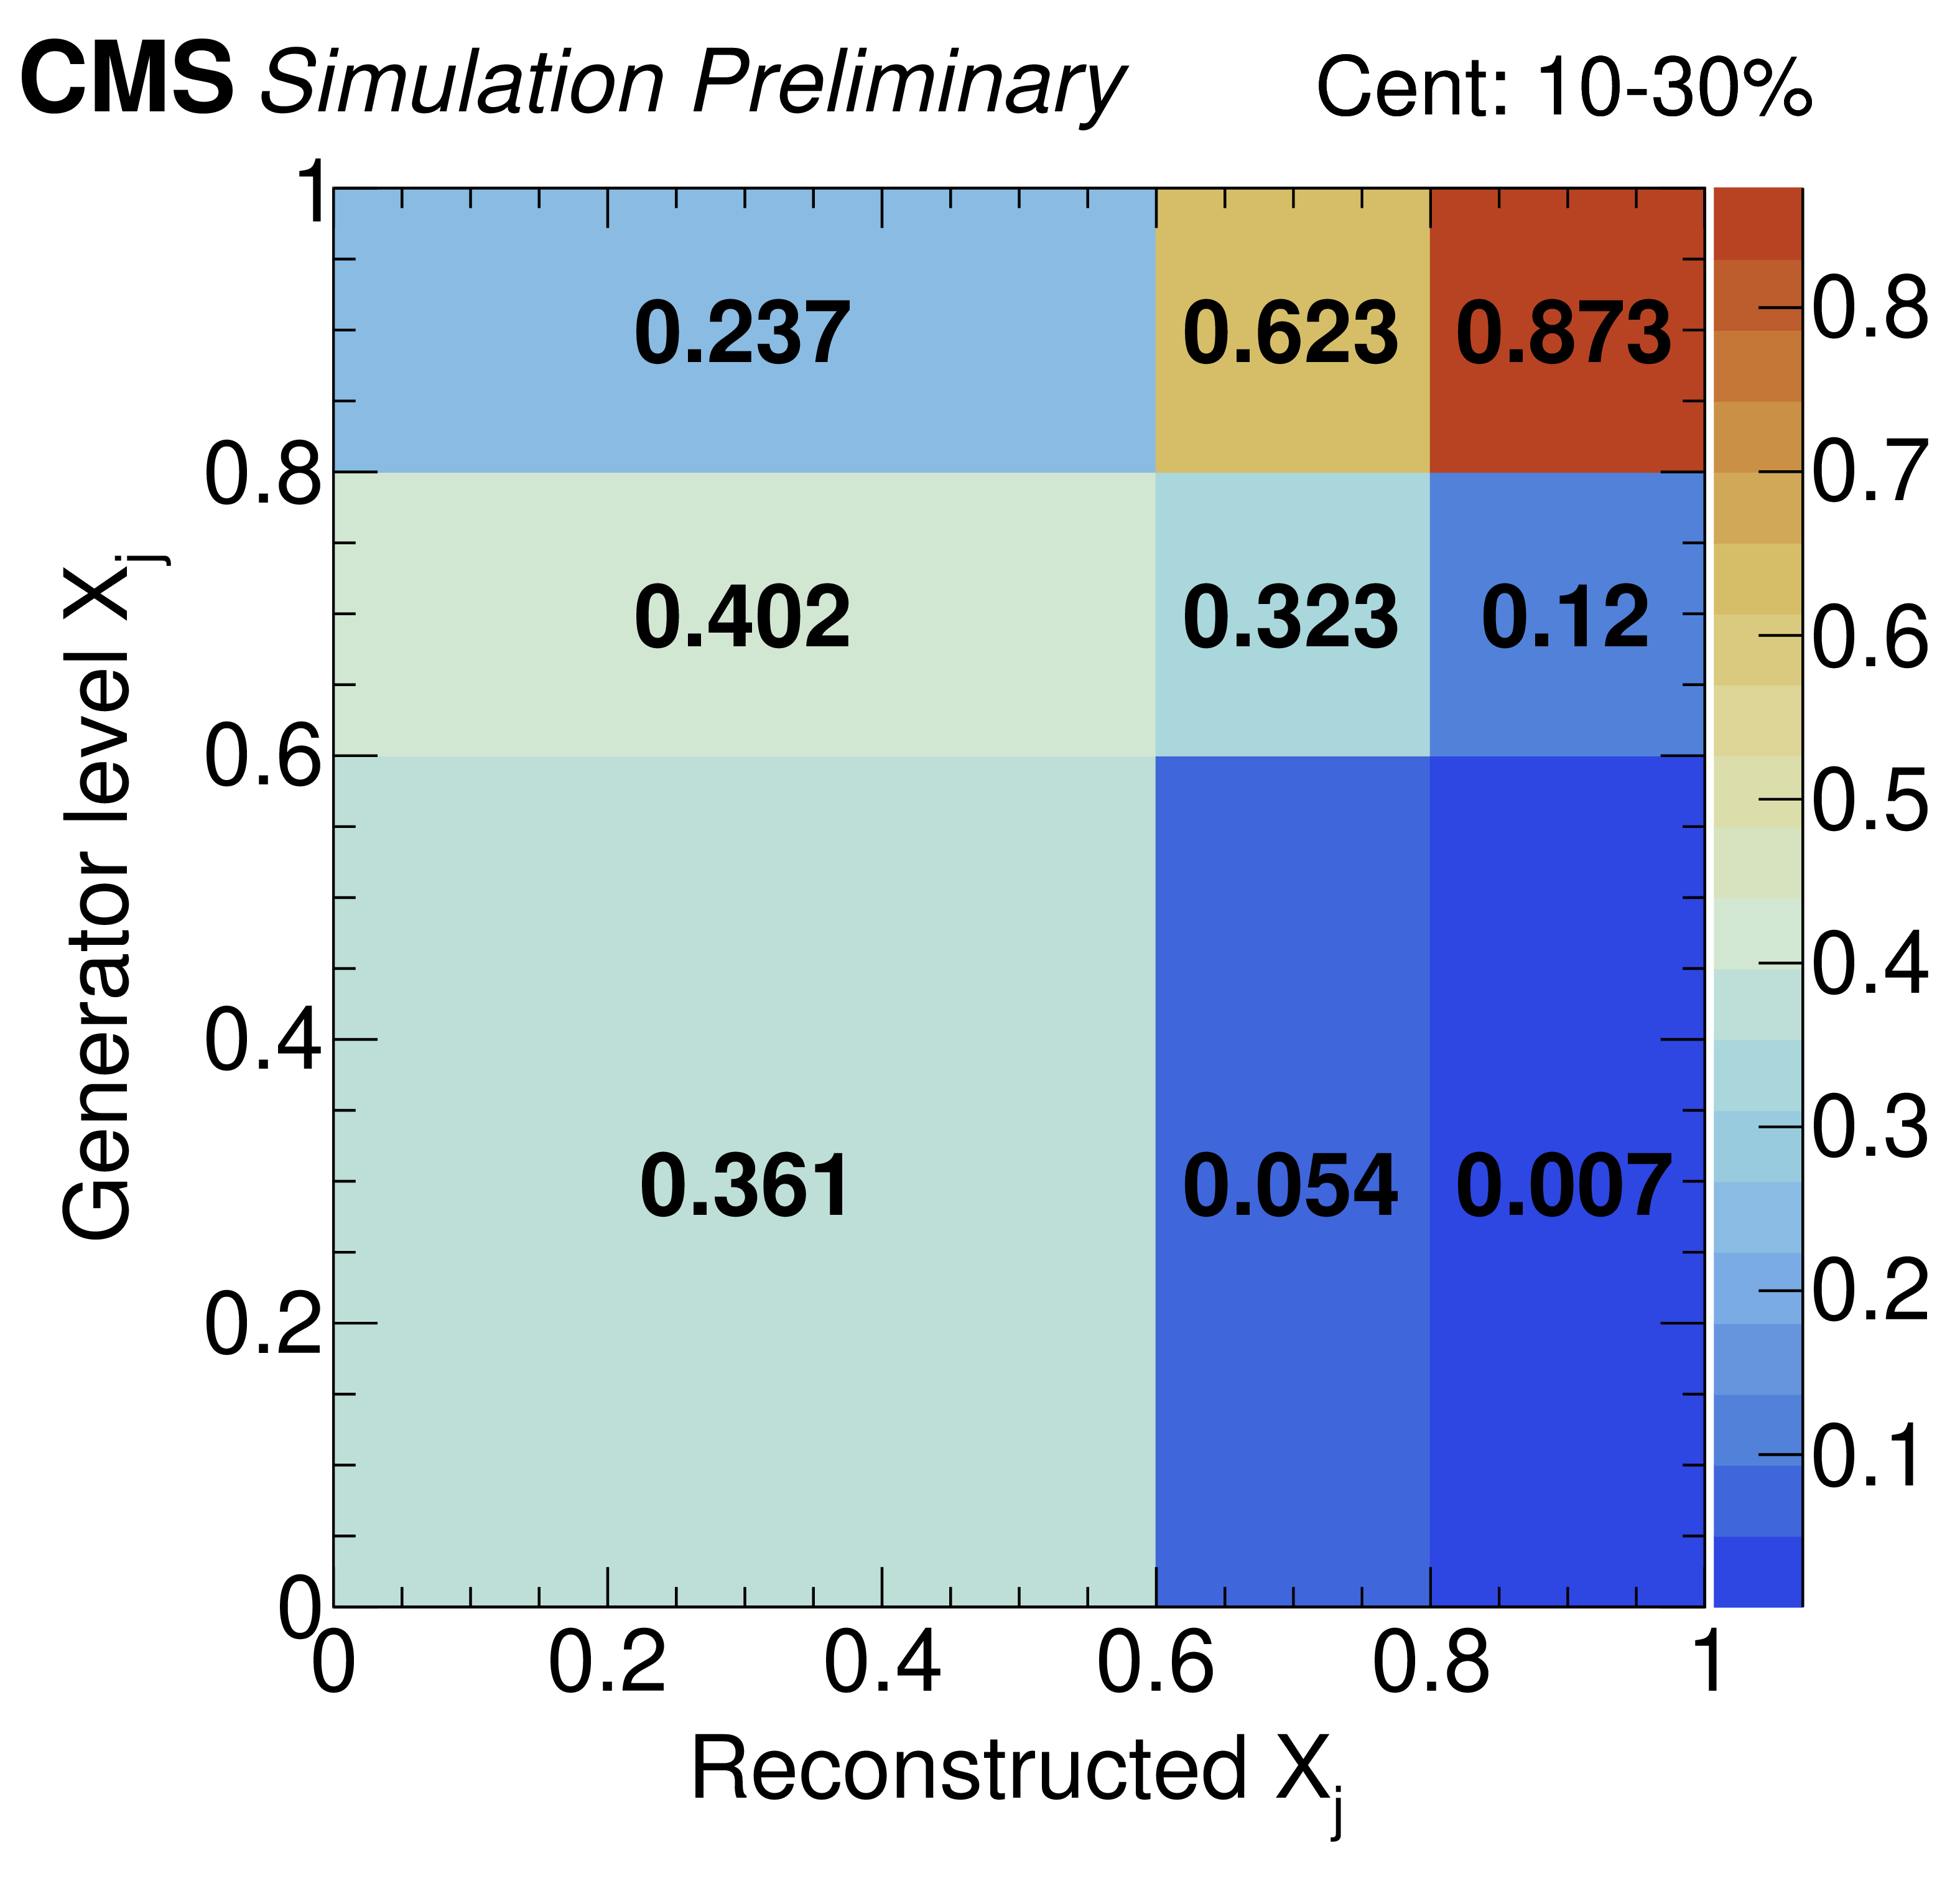
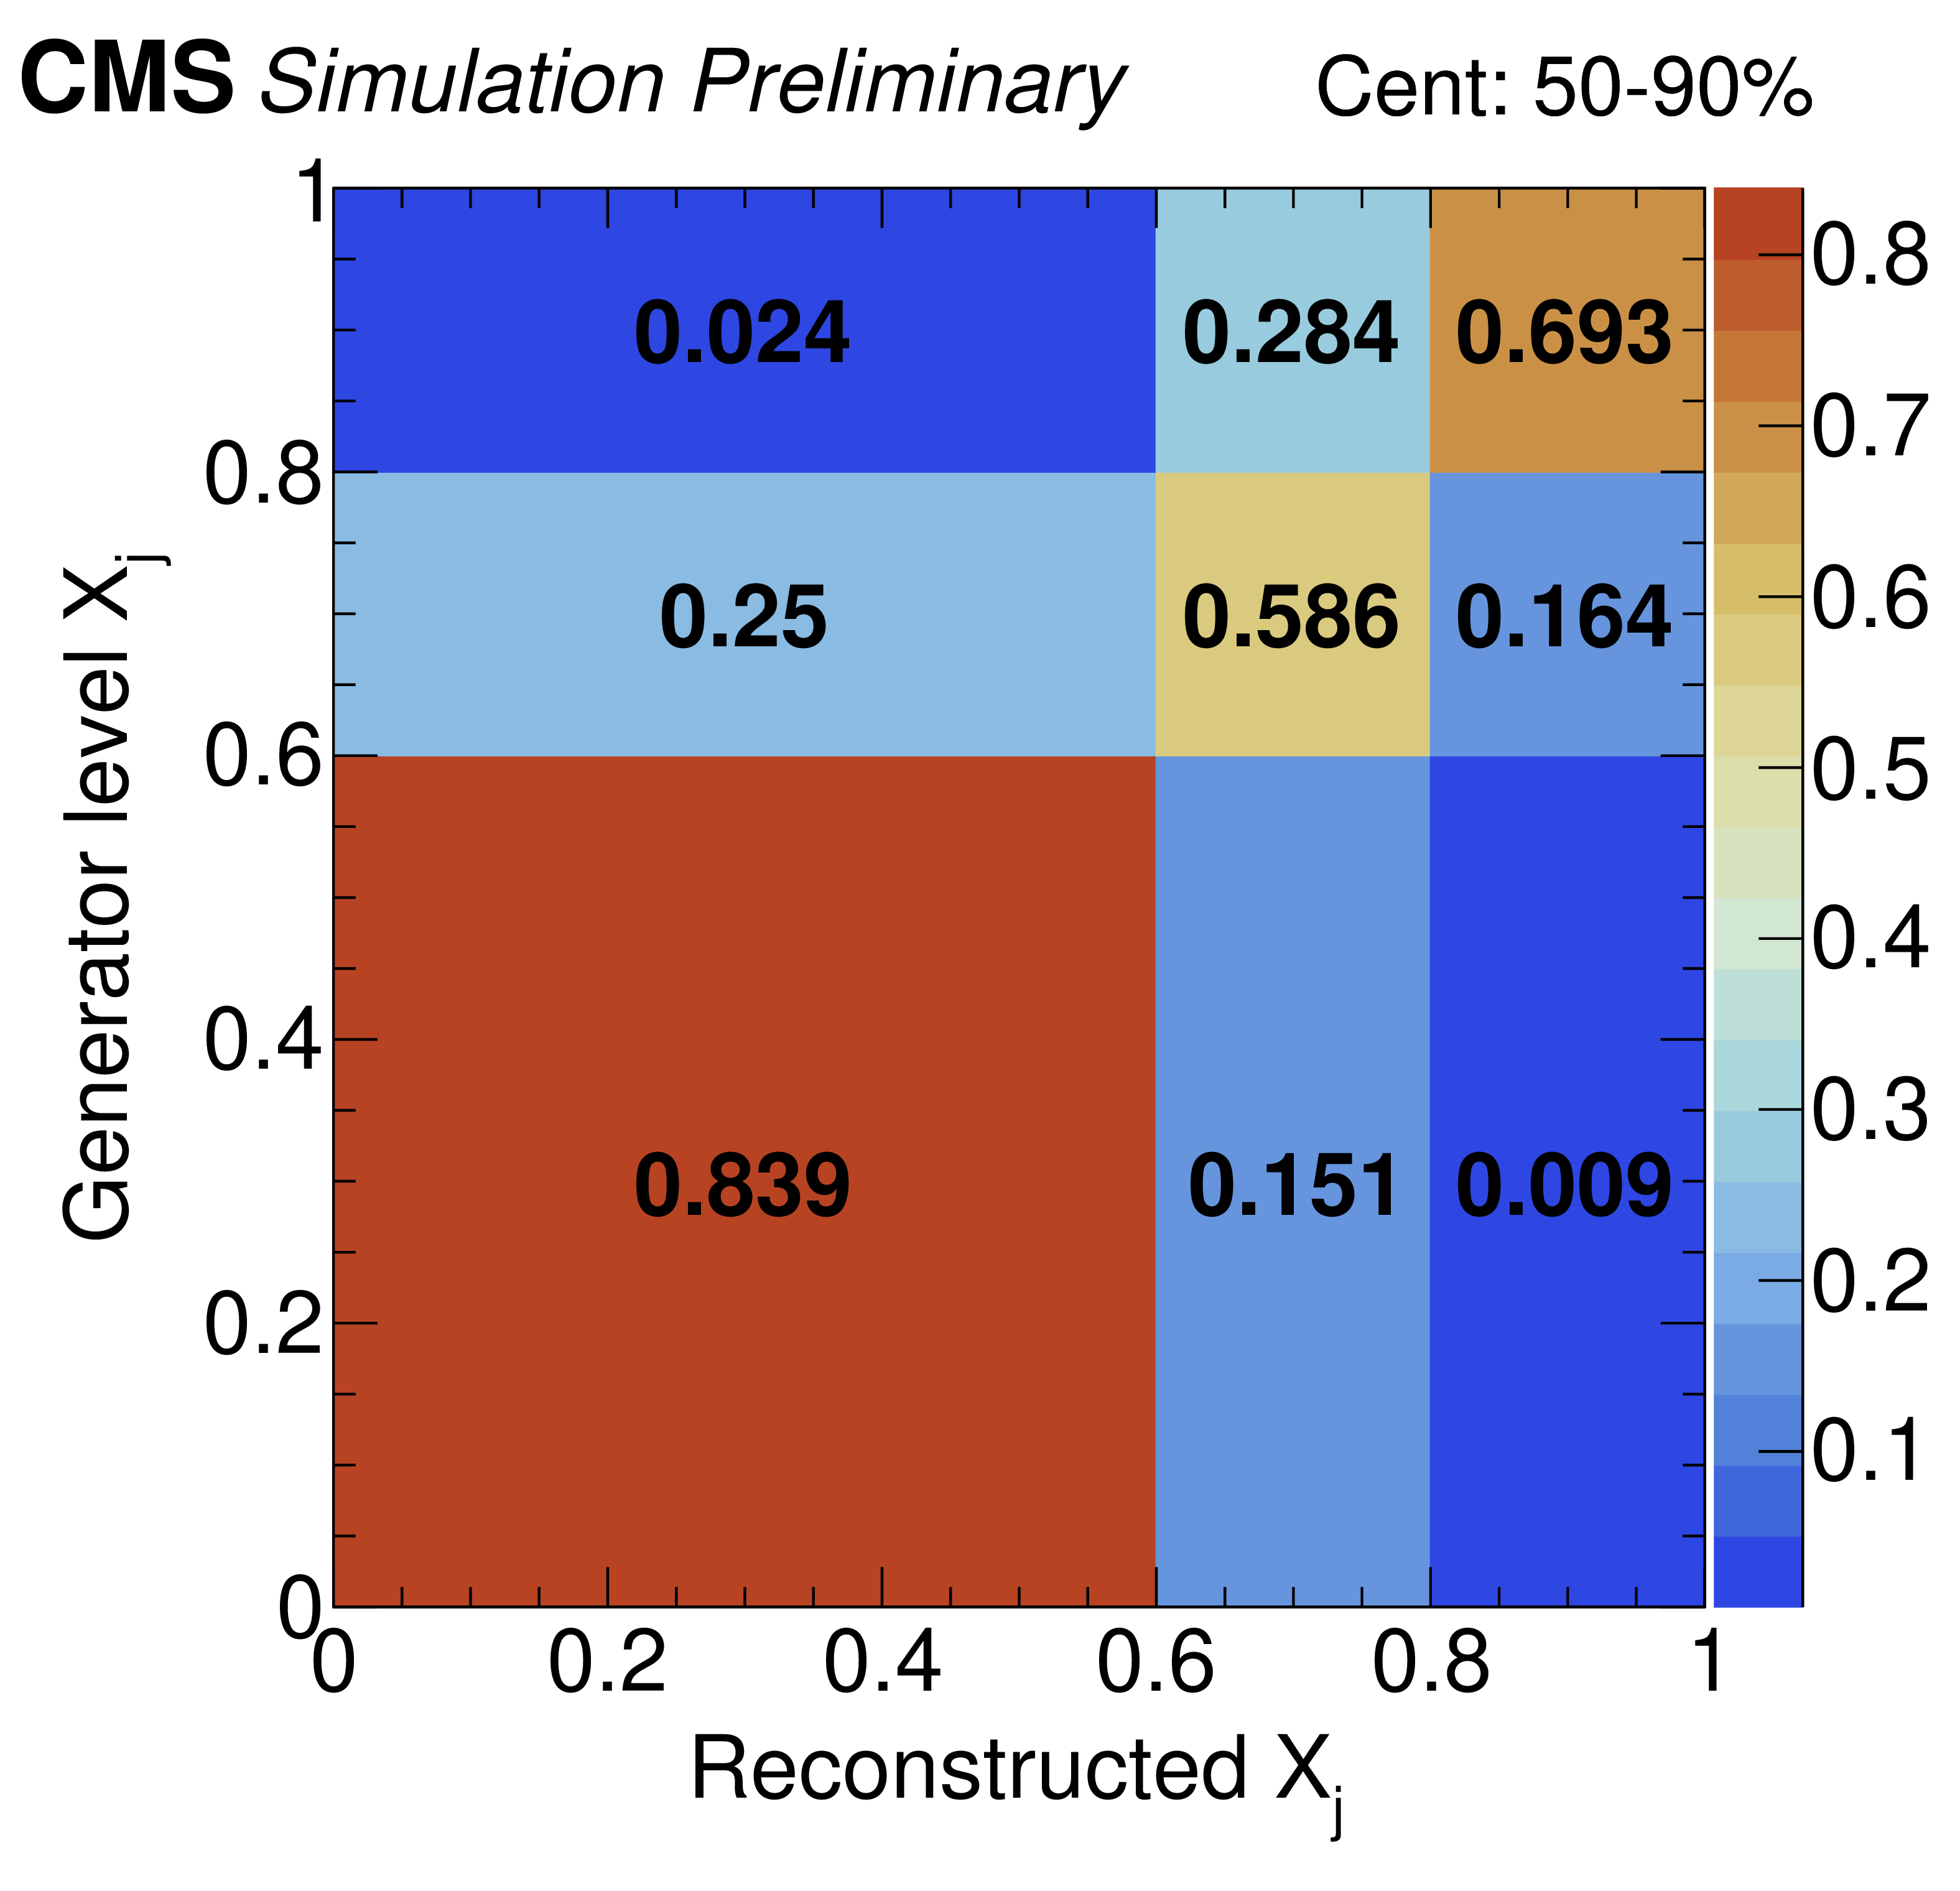
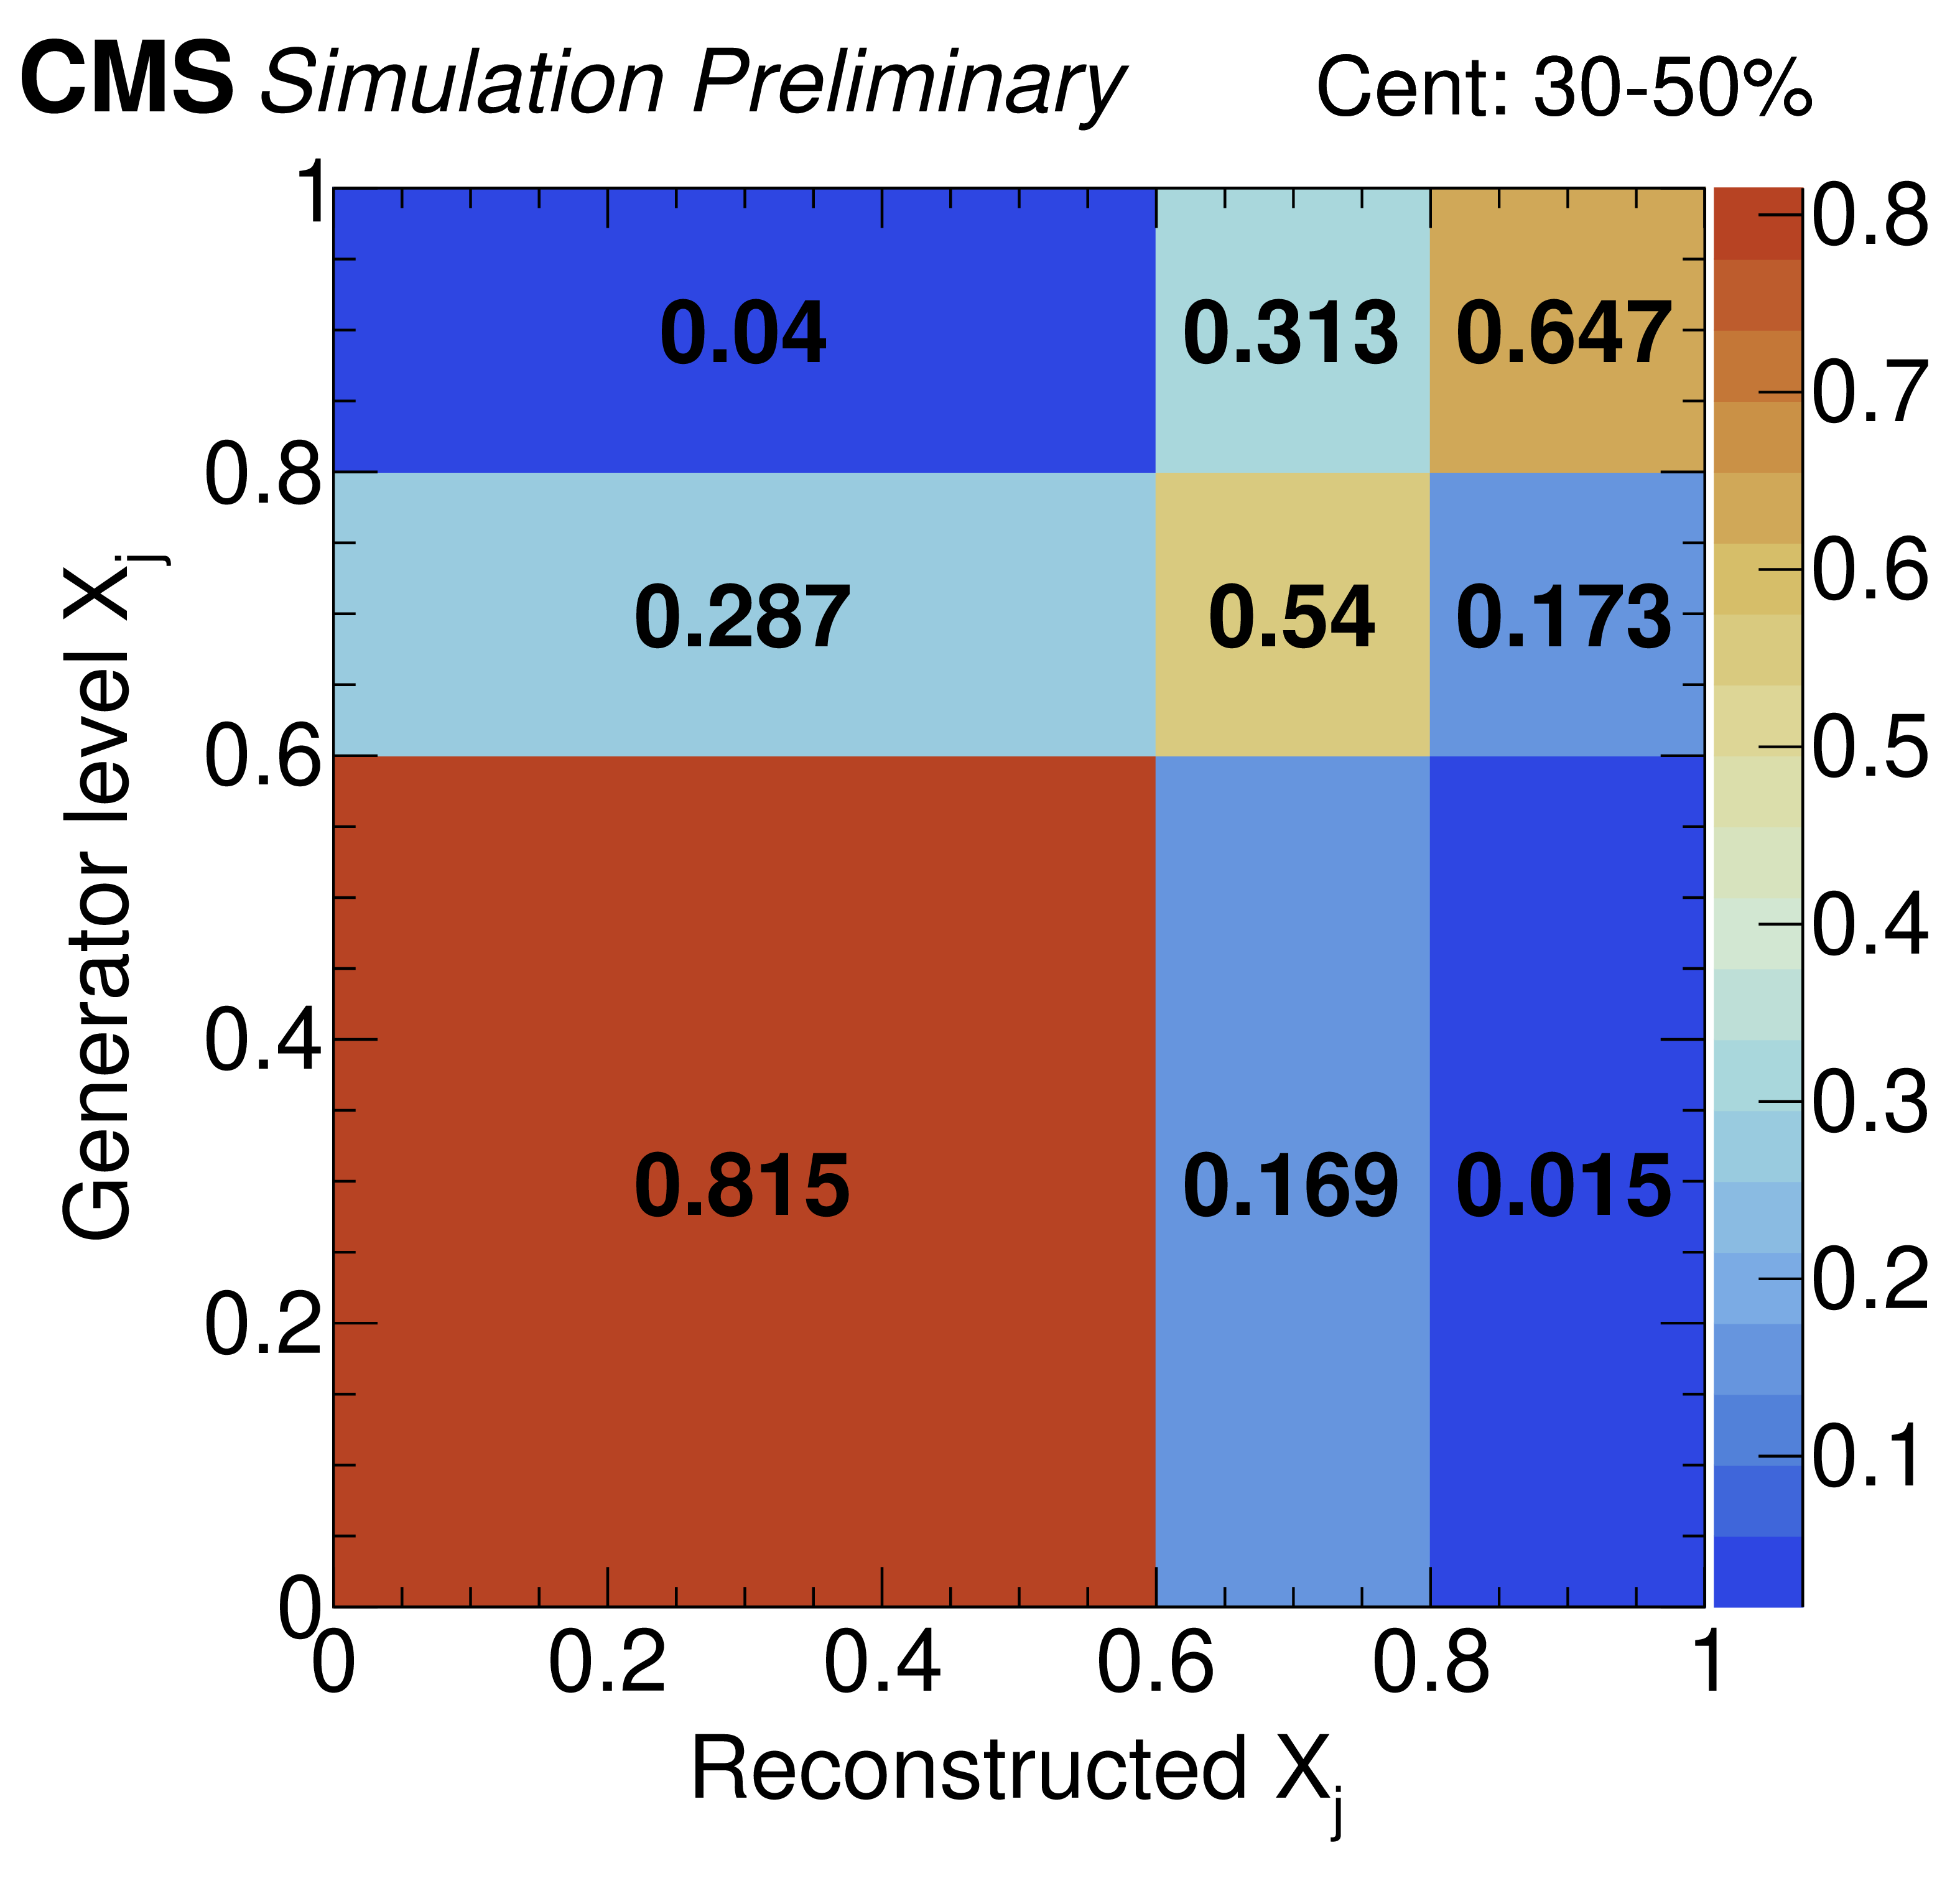
Figure 12:
Generator level $x_{j}$ versus reconstructed $x_{j}$ in the analysis $x_{j}$ bins. The plots show the probability to find a reconstructed $x_{j}$ for a given generator level $x_{j}$. Pythia8 simulation is on the leftmost column in the top row while the most central Pythia+Hydjet in on the right of the bottow row. |
png pdf |
Figure 12-a:
Generator level $x_{j}$ versus reconstructed $x_{j}$ in the analysis $x_{j}$ bins. The plots show the probability to find a reconstructed $x_{j}$ for a given generator level $x_{j}$. Pythia8 simulation is on the leftmost column in the top row while the most central Pythia+Hydjet in on the right of the bottow row. |
png pdf |
Figure 12-b:
Generator level $x_{j}$ versus reconstructed $x_{j}$ in the analysis $x_{j}$ bins. The plots show the probability to find a reconstructed $x_{j}$ for a given generator level $x_{j}$. Pythia8 simulation is on the leftmost column in the top row while the most central Pythia+Hydjet in on the right of the bottow row. |
png pdf |
Figure 12-c:
Generator level $x_{j}$ versus reconstructed $x_{j}$ in the analysis $x_{j}$ bins. The plots show the probability to find a reconstructed $x_{j}$ for a given generator level $x_{j}$. Pythia8 simulation is on the leftmost column in the top row while the most central Pythia+Hydjet in on the right of the bottow row. |

png pdf |
Figure 12-d:
Generator level $x_{j}$ versus reconstructed $x_{j}$ in the analysis $x_{j}$ bins. The plots show the probability to find a reconstructed $x_{j}$ for a given generator level $x_{j}$. Pythia8 simulation is on the leftmost column in the top row while the most central Pythia+Hydjet in on the right of the bottow row. |

png pdf |
Figure 12-e:
Generator level $x_{j}$ versus reconstructed $x_{j}$ in the analysis $x_{j}$ bins. The plots show the probability to find a reconstructed $x_{j}$ for a given generator level $x_{j}$. Pythia8 simulation is on the leftmost column in the top row while the most central Pythia+Hydjet in on the right of the bottow row. |
| Tables | |
png pdf |
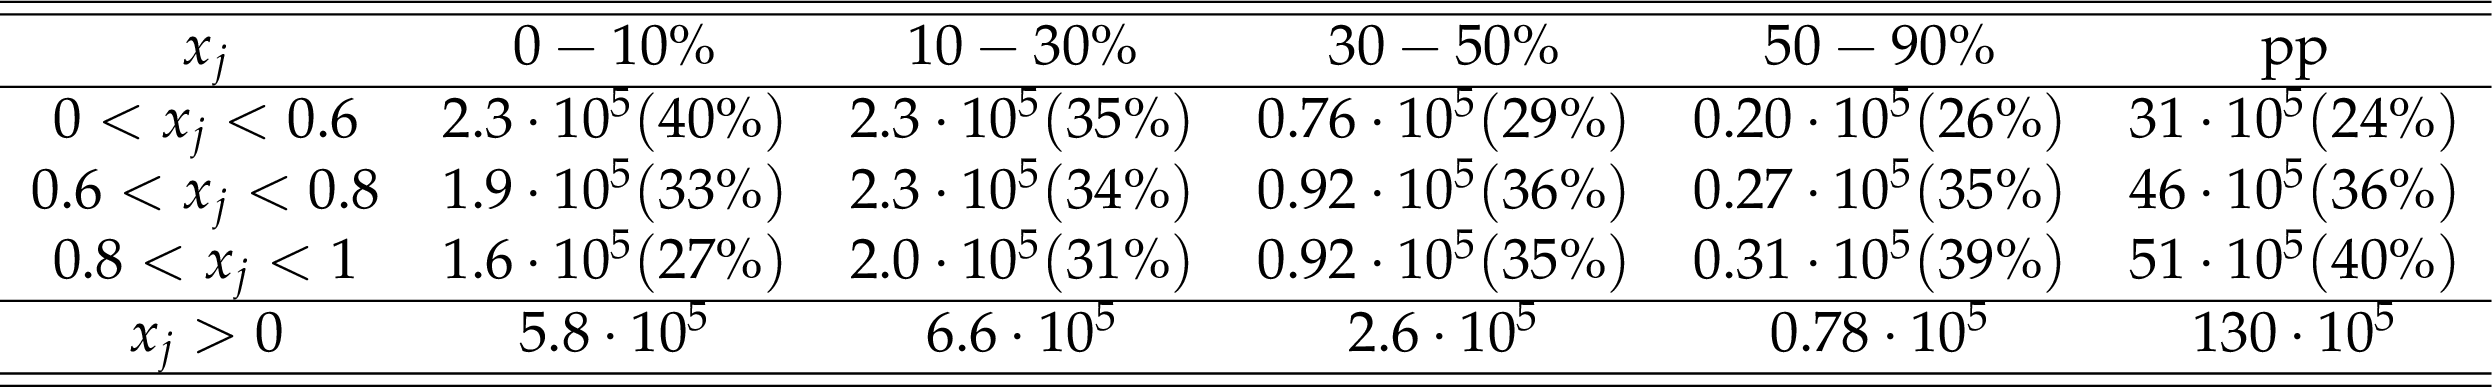
Table 1:
Number of events for pp and for different PbPb centrality bins within stated $x_{j}$ ranges. The numbers in parentheses show the fraction of events in each $x_{j}$ bin for a given centrality. |
png pdf |
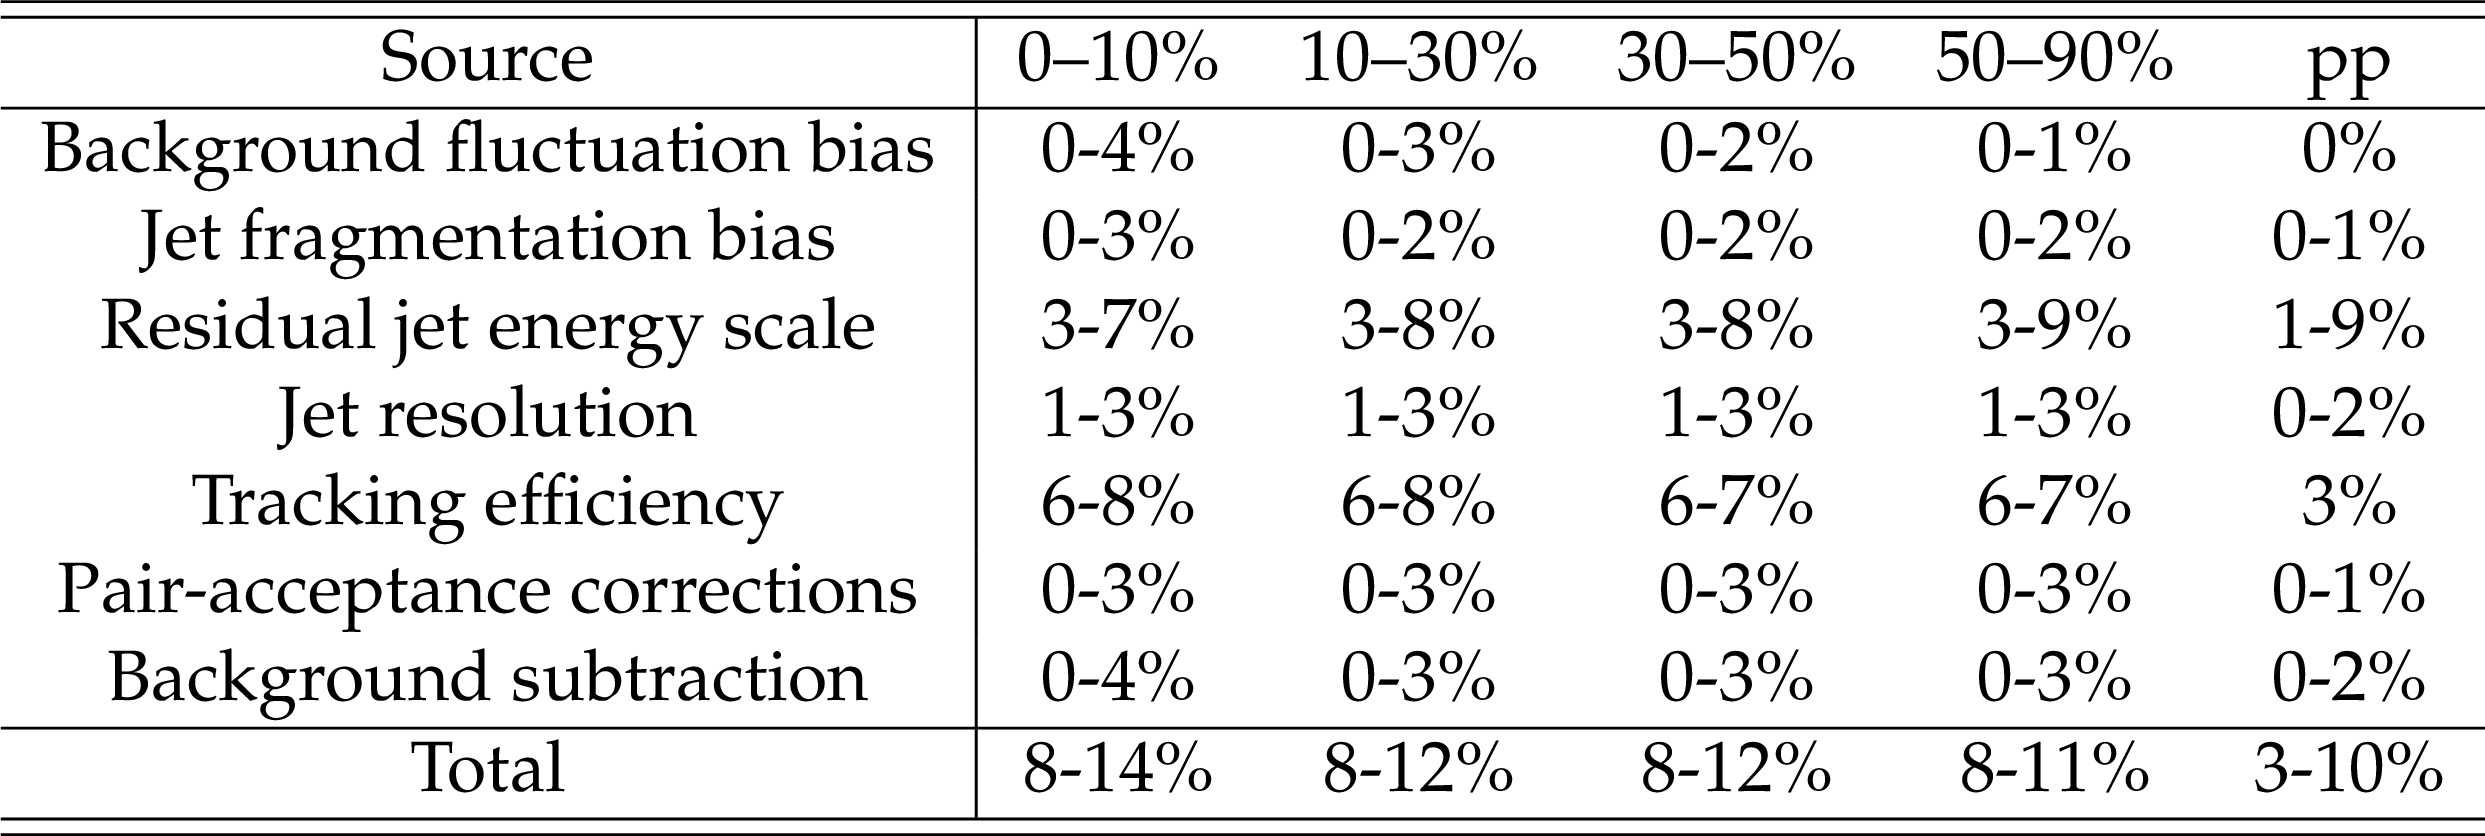
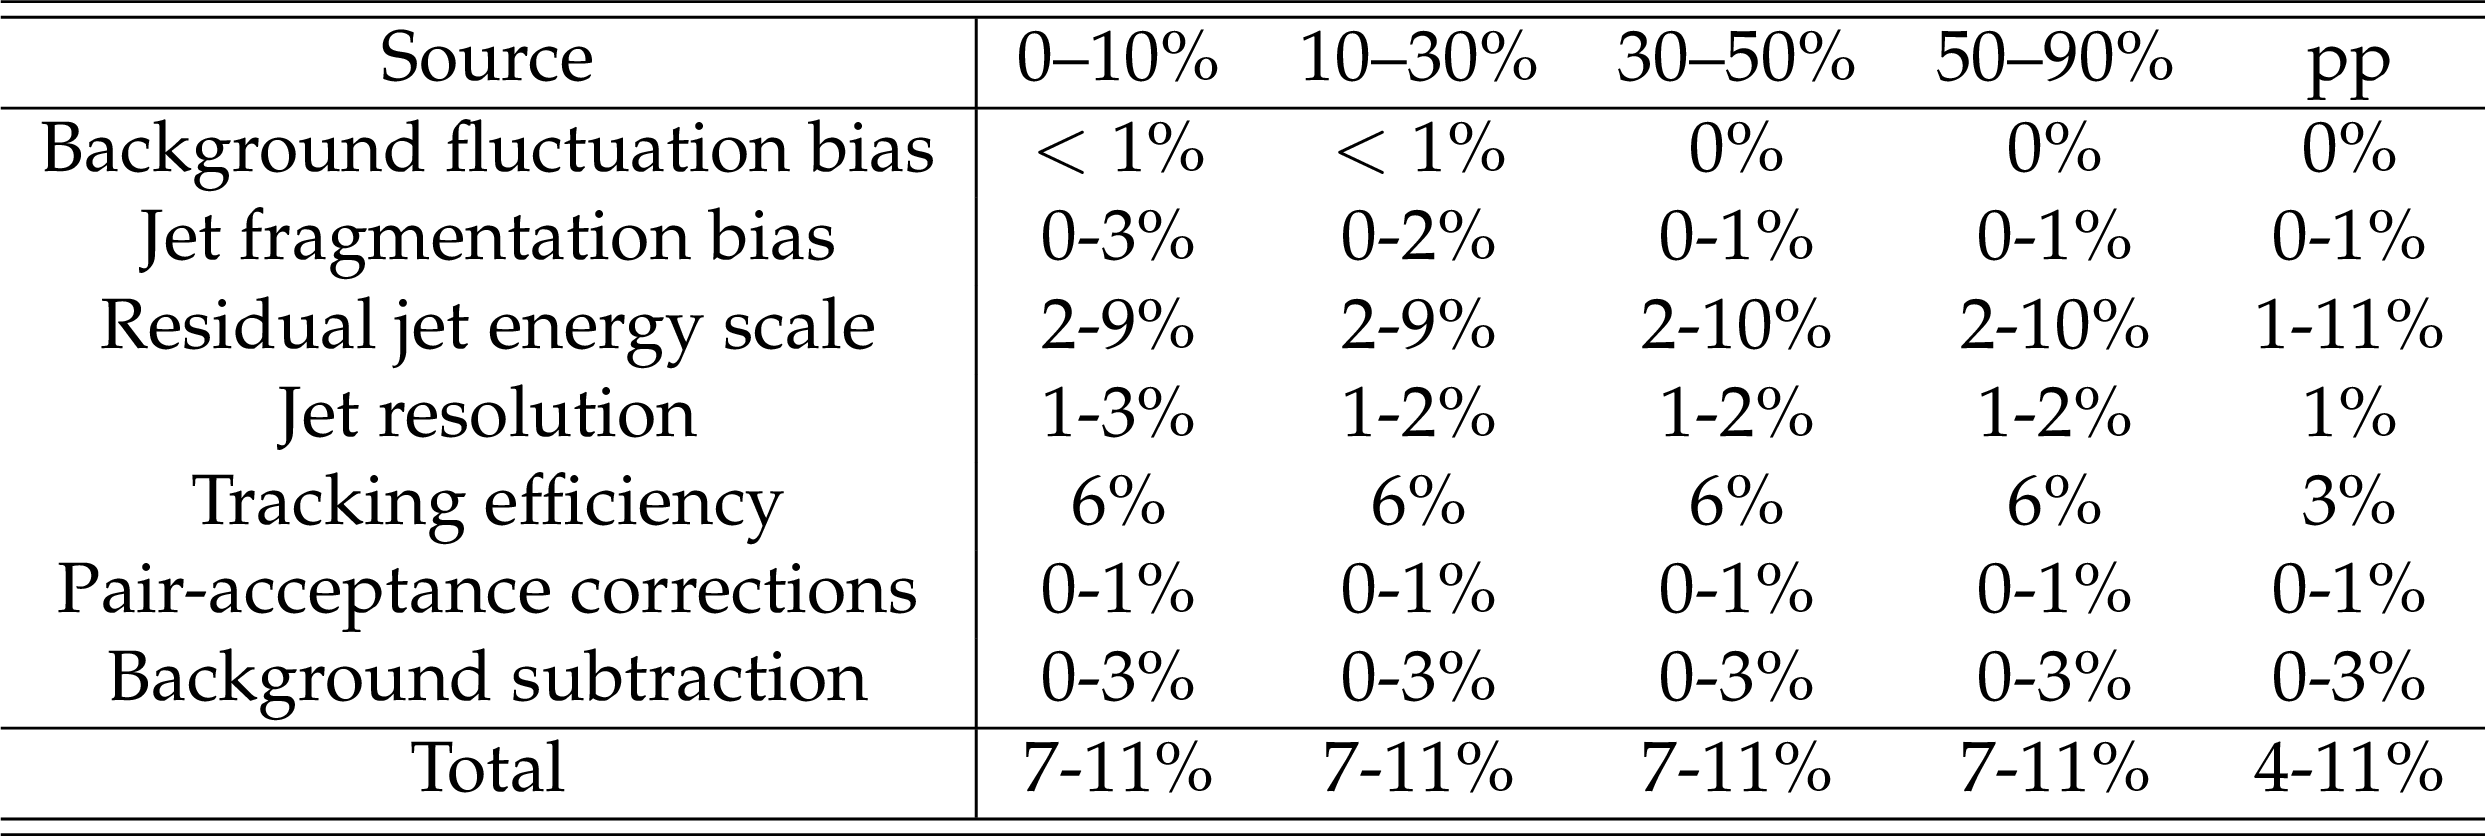
Table 2:
Systematic uncertainties for the leading jet shape components, integrated in $\eta $, and $\Delta r$, and shown for pp and centrality binned PbPb collisions. The ranges correspond to the $p_{\mathrm {T}}$ dependence of the uncertainty. |
png pdf |
Table 3:
Systematic uncertainties for the subleading jet shape components, integrated in $\eta $, and $\Delta r$, and shown for pp and centrality binned PbPb collisions. The ranges correspond to the $p_{\mathrm {T}}$ dependence of the uncertainty. |
| Summary |
|
CMS has measured charged particle yields in events containing back-to-back leading and subleading jet pairs around the respective jet axes using data from pp and PbPb collisions at ${\sqrt {\smash [b]{s_{_{\mathrm {NN}}}}}} = $ 5.02 TeV collected in 2017 and 2018. Using a momentum weighting, jet shapes are also determined. When comparing the charged particle yields around the jet axes, there is an excess of low ${p_{\mathrm{T}}}{}$ particles in PbPb collisions with respect to pp collisions. This excess is larger in the subleading side compared to leading side. The excess is also found to have a different $x_{j}$ dependence for the leading and subleading sides. The leading jets show the strongest modifications effects in balanced events, where the transverse momenta of the two jets are close to each other. However, subleading jets experience the greatest modifications in events with a large jet momentum imbalance between the leading and subleading jets. This indicates that in balanced events both jets lose a comparable amount of energy, while in events with a momentum imbalance the leading jet loses significantly less energy. A possible explanation for the imbalance is that the leading jet is produced near the surface of the plasma while the subleading jet needs to traverse a long distance through the plasma. For the jet shapes, a redistribution of energy is observed from small angles with respect to the jet axis to larger angles when comparing PbPb collisions to pp events. The difference between the PbPb and pp results is larger for the leading jet compared to the subleading jets, which can be explained by the fact that the subleading jet distribution in pp collisions is significantly wider than that for leading jets. When studying the $x_{j}$ bins for the subleading jet, there is a peak in the PbPb to pp ratio for unbalanced dijet momentum events that disappears for balanced events. This peak can be attributed to a third jet contribution that is needed in pp events to conserve momentum for events where there is a large dijet momentum imbalance. When comparing jet shape plots corresponding to different dijet momentum balance conditions, the distributions for leading jets are found to be broader for events with balanced jet momenta compared to those where there is a momentum imbalance. For subleading jets, the situation changes with the events with a significant momentum imbalance found to be broader. These observations are consistent with the previous hypothesis given to interpret the particle yield measurements, namely that the average path length inside the medium for leading jets is larger for momentum balanced events, while for subleading jets it is larger in unbalanced events. These data can be used to constrain models of the production point of the dijet within the quark-gluon plasma. |
| Additional Figures | |
png pdf |
Additional Figure 1:
Distributions of charged particle yields correlated to leading jets as a function of $|\Delta \eta |$ for pp (first column) and 0-10 % central PbPb collisions (second column), shown differentially for all charged particle transverse momentum $(p_{\rm T}^{\rm ch})$ bins. The first row shows the charged particle yields without any selection on $x_{j} = {{p_{\mathrm {T}}} {}^{\mathrm {subleading}}}/{{p_{\mathrm {T}}} {}^{\mathrm {leading}}}$, while other rows show the charged particle yields in different bins of $x_{j}$, starting with the most unbalanced 0 $ < x_{j} < $ 0.6 (second row) to the most balanced 0.8 $ < x_{j} < $ 1.0 (third row) dijet events. |
png pdf |
Additional Figure 2:
Distributions of charged particle yields correlated to subleading jets as a function of $|\Delta \eta |$ for pp (first column) and 0-10 % central PbPb collisions (second column), shown differentially for all charged particle transverse momentum $(p_{\rm T}^{\rm ch})$ bins. The first row shows the charged particle yields without any selection on $x_{j} = {{p_{\mathrm {T}}} {}^{\mathrm {subleading}}}/{{p_{\mathrm {T}}} {}^{\mathrm {leading}}}$, while other rows show the charged particle yields in different bins of $x_{j}$, starting with the most unbalanced 0 $ < x_{j} < $ 0.6 (second row) to the most balanced 0.8 $ < x_{j} < $ 1.0 (third row) dijet events. |

png pdf |
Additional Figure 3:
Leading jet shapes $\rho (\Delta r)$ (normalized to unity over $\Delta r < $ 1) for pp (first column) and 0-10 % central PbPb collisions (second column), shown differentially in charged particle transverse momentum $(p_{\rm T}^{\rm ch})$ for inclusive $x_{j} = {{p_{\mathrm {T}}} {}^{\mathrm {subleading}}}/{{p_{\mathrm {T}}} {}^{\mathrm {leading}}}$ bin (first row) and in $x_{j}$ bins 0 $ < x_{j} < $ 0.6 (second row) and 0.8 $ < x_{j} < $ 1.0 (third row). |
png pdf |
Additional Figure 4:
Subleading jet shapes $\rho (\Delta r)$ (normalized to unity over $\Delta r < $ 1) for pp (first column) and 0-10 % central PbPb collisions (second column), shown differentially in charged particle transverse momentum $(p_{\rm T}^{\rm ch})$ for inclusive $x_{j} = {{p_{\mathrm {T}}} {}^{\mathrm {subleading}}}/{{p_{\mathrm {T}}} {}^{\mathrm {leading}}}$ bin (first row) and in $x_{j}$ bins 0 $ < x_{j} < $ 0.6 (second row) and 0.8 $ < x_{j} < $ 1.0 (third row). |
png pdf |
Additional Figure 5:
PbPb to pp ratio for leading jet shapes $\rho (\Delta r)_{\rm PbPb} / \rho (\Delta r)_{\rm pp}$ for events in the 0-10 % centrality class. The gray points show $x_{j} = {{p_{\mathrm {T}}} {}^{\mathrm {subleading}}}/{{p_{\mathrm {T}}} {}^{\mathrm {leading}}}$ integrated ratio, while the red points are the ratio in 0 $ < x_{j} < $ 0.6 bin and blue points in 0.8 $ < x_{j} < $ 1.0 bin. Error bars are statistical uncertainties while the shaded areas show systematic uncertainties. |
png pdf |
Additional Figure 6:
PbPb to pp ratio for subleading jet shapes $\rho (\Delta r)_{\rm PbPb} / \rho (\Delta r)_{\rm pp}$ for events in the 0-10 % centrality class. The gray points show $x_{j} = {{p_{\mathrm {T}}} {}^{\mathrm {subleading}}}/{{p_{\mathrm {T}}} {}^{\mathrm {leading}}}$ integrated ratio, while the red points are the ratio in 0 $ < x_{j} < $ 0.6 bin and blue points in 0.8 $ < x_{j} < $ 1.0 bin. Error bars are statistical uncertainties while the shaded areas show systematic uncertainties. |
| References | ||||
| 1 | J. D. Bjorken | Energy loss of energetic partons in qgp: possible extinction of high $ p_{\rm t} $ jets in hadron-hadron collisions | FERMILAB-PUB-82-059-THY | |
| 2 | STAR Collaboration | Direct observation of dijets in central Au+Au collisions at $ {\sqrt {\smash [b]{s_{_{\mathrm {NN}}}}}} = $ 200 GeV | PRL 97 (2006) 162301 | nucl-ex/0604018 |
| 3 | PHENIX Collaboration | Transverse momentum and centrality dependence of dihadron correlations in Au+Au collisions at $ {\sqrt {\smash [b]{s_{_{\mathrm {NN}}}}}} = $ 200 GeV: Jet-quenching and the response of partonic matter | PRC 77 (2008) 011901 | 0705.3238 |
| 4 | ATLAS Collaboration | Observation of a Centrality-Dependent Dijet Asymmetry in Lead-Lead Collisions at $ {\sqrt {\smash [b]{s_{_{\mathrm {NN}}}}}} = $ 2.76 TeV with the ATLAS Detector at the LHC | PRL 105 (2010) 252303 | 1011.6182 |
| 5 | CMS Collaboration | Observation and studies of jet quenching in PbPb collisions at $ {\sqrt {\smash [b]{s_{_{\mathrm {NN}}}}}} = $ 2.76 TeV | PRC 84 (2011) 024906 | CMS-HIN-10-004 1102.1957 |
| 6 | CMS Collaboration | Jet momentum dependence of jet quenching in PbPb collisions at $ {\sqrt {\smash [b]{s_{_{\mathrm {NN}}}}}}= $ 2.76 TeV | PLB 712 (2012) 176 | CMS-HIN-11-013 1202.5022 |
| 7 | ALICE Collaboration | Measurement of jet suppression in central Pb-Pb collisions at $ {\sqrt {\smash [b]{s_{_{\mathrm {NN}}}}}} = $ 2.76 TeV | PLB 746 (2015) 1 | 1502.01689 |
| 8 | CMS Collaboration | Measurement of jet fragmentation in PbPb and pp collisions at $ {\sqrt {\smash [b]{s_{_{\mathrm {NN}}}}}}= $ 2.76 TeV | PRC 90 (2014) 024908 | CMS-HIN-12-013 1406.0932 |
| 9 | ATLAS Collaboration | Measurement of inclusive jet charged-particle fragmentation functions in Pb+Pb collisions at $ {\sqrt {\smash [b]{s_{_{\mathrm {NN}}}}}}= $ 2.76 TeV with the ATLAS detector | PLB739 (2014) 320--342 | 1406.2979 |
| 10 | CMS Collaboration | Modification of jet shapes in PbPb collisions at $ {\sqrt {\smash [b]{s_{_{\mathrm {NN}}}}}} = $ 2.76 TeV | PLB 730 (2014) 243 | CMS-HIN-12-002 1310.0878 |
| 11 | CMS Collaboration | Measurement of transverse momentum relative to dijet systems in PbPb and pp collisions at $ {\sqrt {\smash [b]{s_{_{\mathrm {NN}}}}}} = $ 2.76 TeV | JHEP 01 (2016) 6 | CMS-HIN-14-010 1509.09029 |
| 12 | CMS Collaboration | Correlations between jets and charged particles in PbPb and pp collisions at $ {\sqrt {\smash [b]{s_{_{\mathrm {NN}}}}}} = $ 2.76 TeV | JHEP 02 (2016) 156 | CMS-HIN-14-016 1601.00079 |
| 13 | CMS Collaboration | Decomposing transverse momentum balance contributions for quenched jets in PbPb collisions at $ {\sqrt {\smash [b]{s_{_{\mathrm {NN}}}}}}= $ 2.76 TeV | JHEP 11 (2016) 055 | CMS-HIN-15-011 1609.02466 |
| 14 | CMS Collaboration | Jet properties in PbPb and pp collisions at $ {\sqrt {\smash [b]{s_{_{\mathrm {NN}}}}}}= $ 5.02 TeV | JHEP 05 (2018) 006 | CMS-HIN-16-020 1803.00042 |
| 15 | L. Apolinario, N. Armesto, and L. Cunqueiro | An analysis of the influence of background subtraction and quenching on jet observables in heavy-ion collisions | JHEP 02 (2013) 022 | 1211.1161 |
| 16 | A. Ayala, I. Dominguez, J. Jalilian-Marian, and M. E. Tejeda-Yeomans | Jet asymmetry and momentum imbalance from $ 2 \to 2 $ and $ 2 \to 3 $ partonic processes in relativistic heavy-ion collisions | PRC92 (2015), no. 4, 044902 | 1503.06889 |
| 17 | J.-P. Blaizot, Y. Mehtar-Tani, and M. A. C. Torres | Angular structure of the in-medium QCD cascade | PRL 114 (2015), no. 22, 222002 | 1407.0326 |
| 18 | M. A. Escobedo and E. Iancu | Event-by-event fluctuations in the medium-induced jet evolution | JHEP 05 (2016) 008 | 1601.03629 |
| 19 | J. Casalderrey-Solana et al. | Angular Structure of Jet Quenching Within a Hybrid Strong/Weak Coupling Model | JHEP 03 (2017) 135 | 1609.05842 |
| 20 | Y. Tachibana, N.-B. Chang, and G.-Y. Qin | Full jet in quark-gluon plasma with hydrodynamic medium response | PRC95 (2017), no. 4, 044909 | 1701.07951 |
| 21 | CMS Collaboration | Jet momentum dependence of jet quenching in PbPb collisions at $ {\sqrt {\smash [b]{s_{_{\mathrm {NN}}}}}}= $ 2.76 TeV | PLB712 (2012) 176--197 | CMS-HIN-11-013 1202.5022 |
| 22 | CMS Collaboration | Description and performance of track and primary-vertex reconstruction with the CMS tracker | JINST 9 (2014), no. 10, P10009 | CMS-TRK-11-001 1405.6569 |
| 23 | CMS Collaboration | The CMS Experiment at the CERN LHC | JINST 3 (2008) S08004 | CMS-00-001 |
| 24 | M. Cacciari, G. P. Salam, and G. Soyez | The anti-$ k_t $ jet clustering algorithm | JHEP 04 (2008) 063 | 0802.1189 |
| 25 | O. Kodolova, I. Vardanyan, A. Nikitenko, and A. Oulianov | The performance of the jet identification and reconstruction in heavy ions collisions with CMS detector | EPJC50 (2007) 117--123 | |
| 26 | CMS Collaboration | Dependence on pseudorapidity and centrality of charged hadron production in PbPb collisions at a nucleon-nucleon centre-of-mass energy of 2.76 TeV | JHEP 08 (2011) 141 | CMS-HIN-10-001 1107.4800 |
| 27 | T. Sjostrand et al. | An Introduction to PYTHIA 8.2 | CPC 191 (2015) 159--177 | 1410.3012 |
| 28 | CMS Collaboration | Extraction and validation of a new set of CMS PYTHIA8 tunes from underlying-event measurements | CMS-GEN-17-001 1903.12179 |
|
| 29 | NNPDF Collaboration | Parton distributions from high-precision collider data | EPJC 77 (2017), no. 10, 663 | 1706.00428 |
| 30 | GEANT4 Collaboration | GEANT4: A Simulation toolkit | NIMA506 (2003) 250--303 | |
| 31 | I. P. Lokhtin et al. | Heavy ion event generator HYDJET++ (HYDrodynamics plus JETs) | CPC 180 (2009) 779--799 | 0809.2708 |
| 32 | M. Cacciari, G. P. Salam, and G. Soyez | FastJet User Manual | EPJC72 (2012) 1896 | 1111.6097 |
| 33 | CMS Collaboration | Particle-flow reconstruction and global event description with the CMS detector | JINST 12 (2017), no. 10, P10003 | CMS-PRF-14-001 1706.04965 |
| 34 | D. Bertolini, T. Chan, and J. Thaler | Jet Observables Without Jet Algorithms | JHEP 04 (2014) 013 | 1310.7584 |
| 35 | A. J. Larkoski, D. Neill, and J. Thaler | Jet Shapes with the Broadening Axis | JHEP 04 (2014) 017 | 1401.2158 |
| 36 | O. Kodolova, I. Vardanian, A. Nikitenko, and A. Oulianov | The performance of the jet identification and reconstruction in heavy ions collisions with CMS detector | EPJC 50 (2007) 117 | |
| 37 | CMS Collaboration | Measurement of the elliptic anisotropy of charged particles produced in PbPb collisions at $ {\sqrt {\smash [b]{s_{_{\mathrm {NN}}}}}} = $ 2.76 TeV | PRC87 (2013), no. 1, 014902 | CMS-HIN-10-002 1204.1409 |
| 38 | P. Berta, M. Spousta, D. W. Miller, and R. Leitner | Particle-level pileup subtraction for jets and jet shapes | JHEP 06 (2014) 092 | 1403.3108 |
| 39 | CMS Collaboration | Description and performance of track and primary-vertex reconstruction with the CMS tracker | JINST 9 (2014) P10009 | CMS-TRK-11-001 1405.6569 |
| 40 | CMS Collaboration | Charged-particle nuclear modification factors in PbPb and pPb collisions at $ {\sqrt {\smash [b]{s_{_{\mathrm {NN}}}}}}= $ 5.02 TeV | JHEP 04 (2017) 039 | CMS-HIN-15-015 1611.01664 |
| 41 | CMS Collaboration | Measurement of jet fragmentation into charged particles in pp and PbPb collisions at $ {\sqrt {\smash [b]{s_{_{\mathrm {NN}}}}}}= $ 2.76 ~TeV | JHEP 10 (2012) 087 | CMS-HIN-11-004 1205.5872 |
| 42 | CMS Collaboration | Jet energy scale and resolution in the CMS experiment in pp collisions at 8 TeV | JINST 12 (2017), no. 02, P02014 | CMS-JME-13-004 1607.03663 |
|
|
Compact Muon Solenoid LHC, CERN |
|

|

|

|

|

|