

Compact Muon Solenoid
LHC, CERN
| CMS-PAS-HIG-19-014 | ||
| Search for the Higgs boson decay to Z$ \gamma $ in proton-proton collisions at $\sqrt{s}= $ 13 TeV | ||
| CMS Collaboration | ||
| October 2021 | ||
| Abstract: Results are presented from a search for the Higgs boson decay $\mathrm{H}\to\mathrm{Z}\gamma$, where $\mathrm{Z}\to\ell^+\ell^-$ with $\ell= $ e or $\mu$. This search is performed using a sample of proton-proton collision data at a center-of-mass energy of 13 TeV, recorded by the CMS experiment at the LHC, corresponding to an integrated luminosity of 137 fb$^{-1}$. Events are assigned to mutually exclusive categories, which exploit differences in event topology and kinematics of distinct Higgs production modes to enhance signal sensitivity. To detect a potential signal, fits are performed to the distributions of $m_{\ell^+\ell^-\gamma}$ in each of these categories simultaneously. The observed (expected) upper limit at 95% confidence level on the signal strength $\mu$, defined as the product of the cross section and the branching fraction [$\sigma(\mathrm{pp}\to\mathrm{H})\times\,\mathcal{B}(\mathrm{H}\to\mathrm{Z}\gamma)$], relative to the standard model expectation, is 4.1 (1.8). The best fit value of the signal strength is found to be $\mu=$ 2.4 $\pm$ 0.9, corresponding to $\sigma(\mathrm{pp}\to\mathrm{H})\times\,\mathcal{B}(\mathrm{H}\to\mathrm{Z}\gamma)=$ 0.21 $\pm$ 0.08 pb. The statistical significance of the observed excess of events under the background-only hypothesis is 2.7 standard deviations at $m_\mathrm{H}= $ 125.38 GeV. | ||
|
Links:
CDS record (PDF) ;
CADI line (restricted) ;
These preliminary results are superseded in this paper, JHEP 05 (2023) 233. The superseded preliminary plots can be found here. |
||
| Figures | |

png pdf |
Figure 1:
Dominant Feynman diagrams contributing to the $\mathrm{H} \to \mathrm{Z} \gamma $ process. |
png pdf |
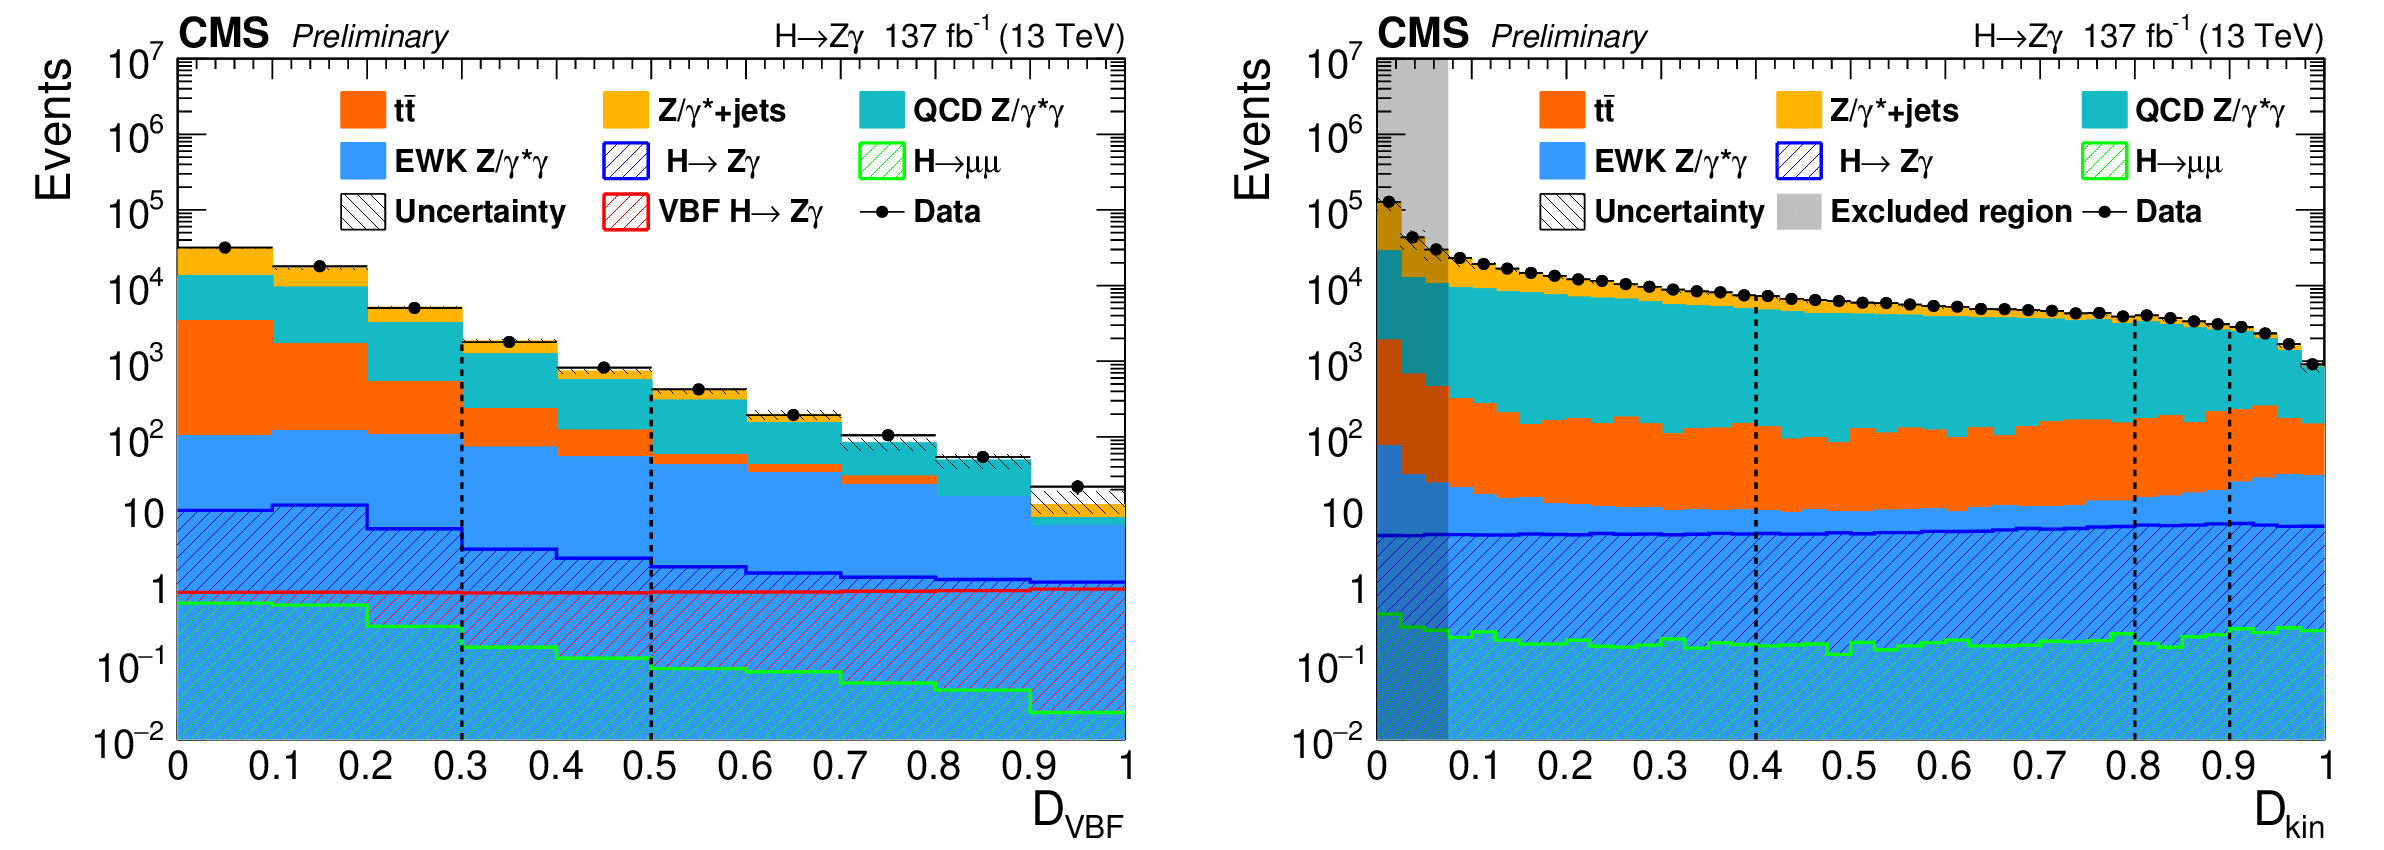
Figure 2:
$\mathcal {D}_{\mathrm {VBF}}$ (left) and $\mathcal {D}_{\mathrm {kin}}$ (right) for signal, simulated background, and data. The $\mathcal {D}_{\mathrm {VBF}}$ distribution includes only dijet-tagged events, and the $\mathcal {D}_{\mathrm {kin}}$ distribution includes only untagged events. The sum of contributions from all signal production modes is shown by the blue line, while the contribution from only the VBF mode is shown by the red line. The uncertainty band incorporates all statistical and systematic uncertainties on the expected background. The dashed lines indicate the boundaries for the dijet and untagged categories. The gray shaded region in the $\mathcal {D}_{\mathrm {kin}}$ distribution is excluded from the analysis. |
png pdf |
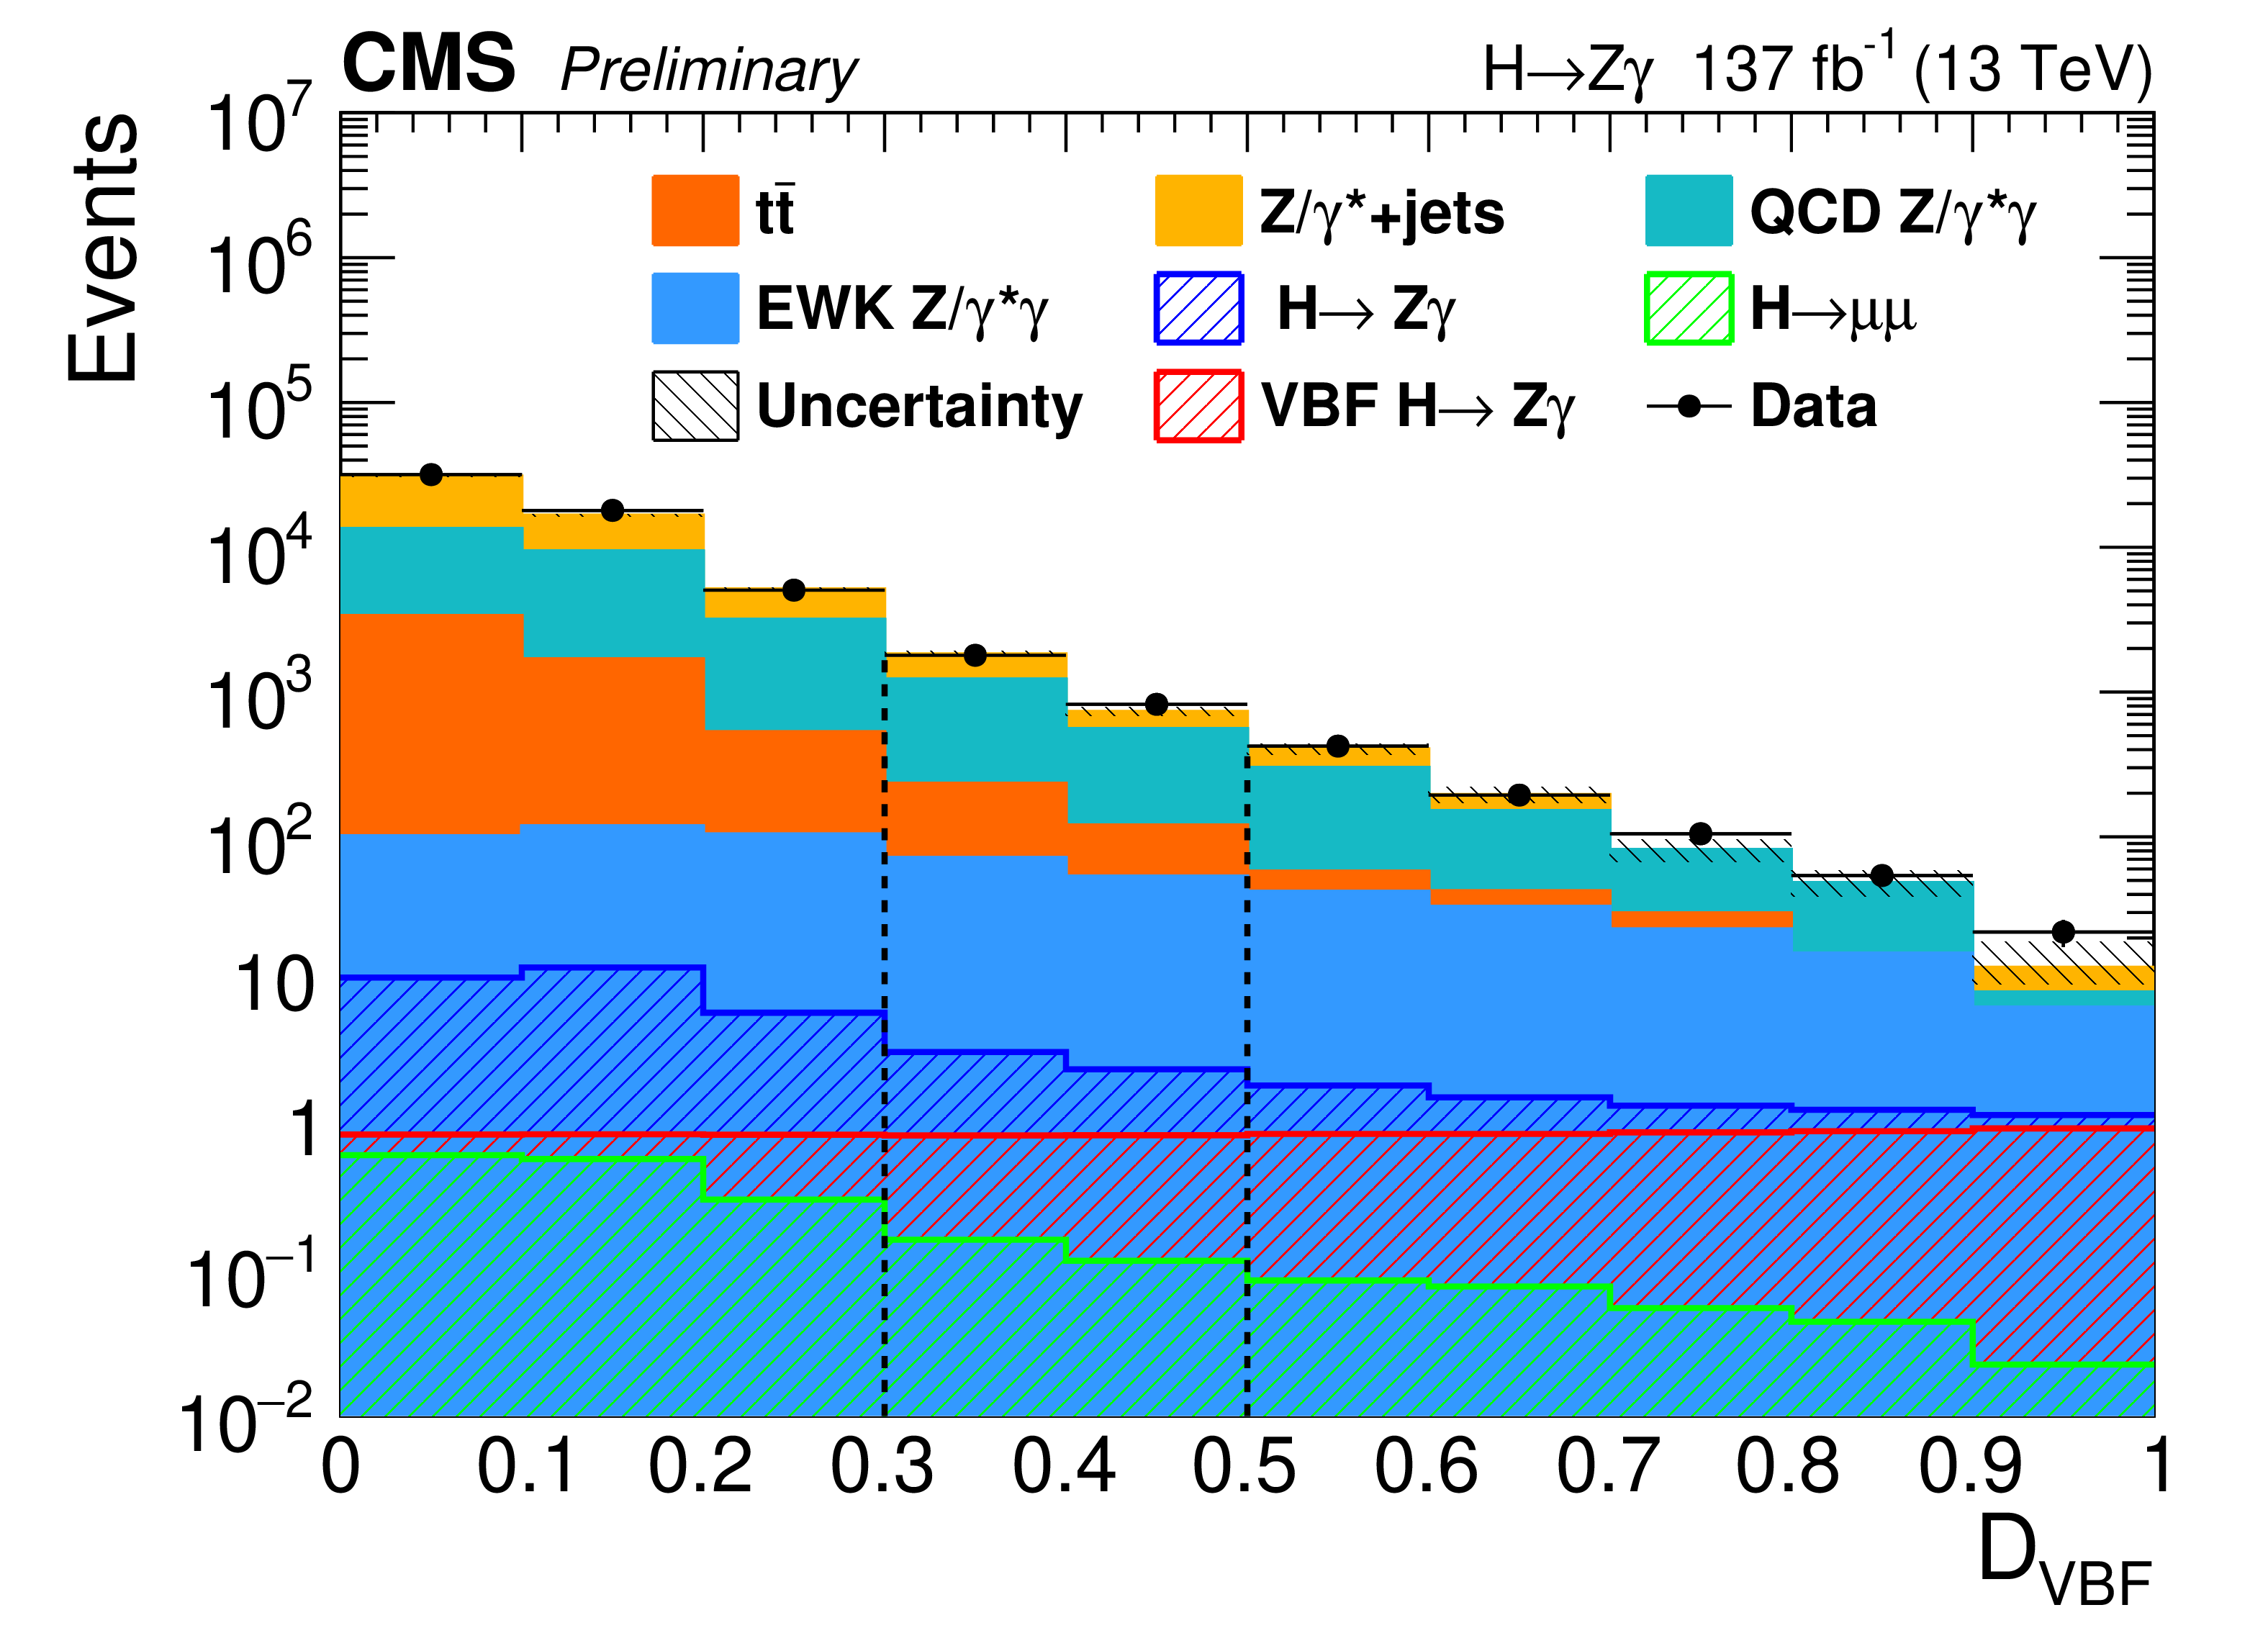
Figure 2-a:
$\mathcal {D}_{\mathrm {VBF}}$ (left) and $\mathcal {D}_{\mathrm {kin}}$ (right) for signal, simulated background, and data. The $\mathcal {D}_{\mathrm {VBF}}$ distribution includes only dijet-tagged events, and the $\mathcal {D}_{\mathrm {kin}}$ distribution includes only untagged events. The sum of contributions from all signal production modes is shown by the blue line, while the contribution from only the VBF mode is shown by the red line. The uncertainty band incorporates all statistical and systematic uncertainties on the expected background. The dashed lines indicate the boundaries for the dijet and untagged categories. The gray shaded region in the $\mathcal {D}_{\mathrm {kin}}$ distribution is excluded from the analysis. |
png pdf |
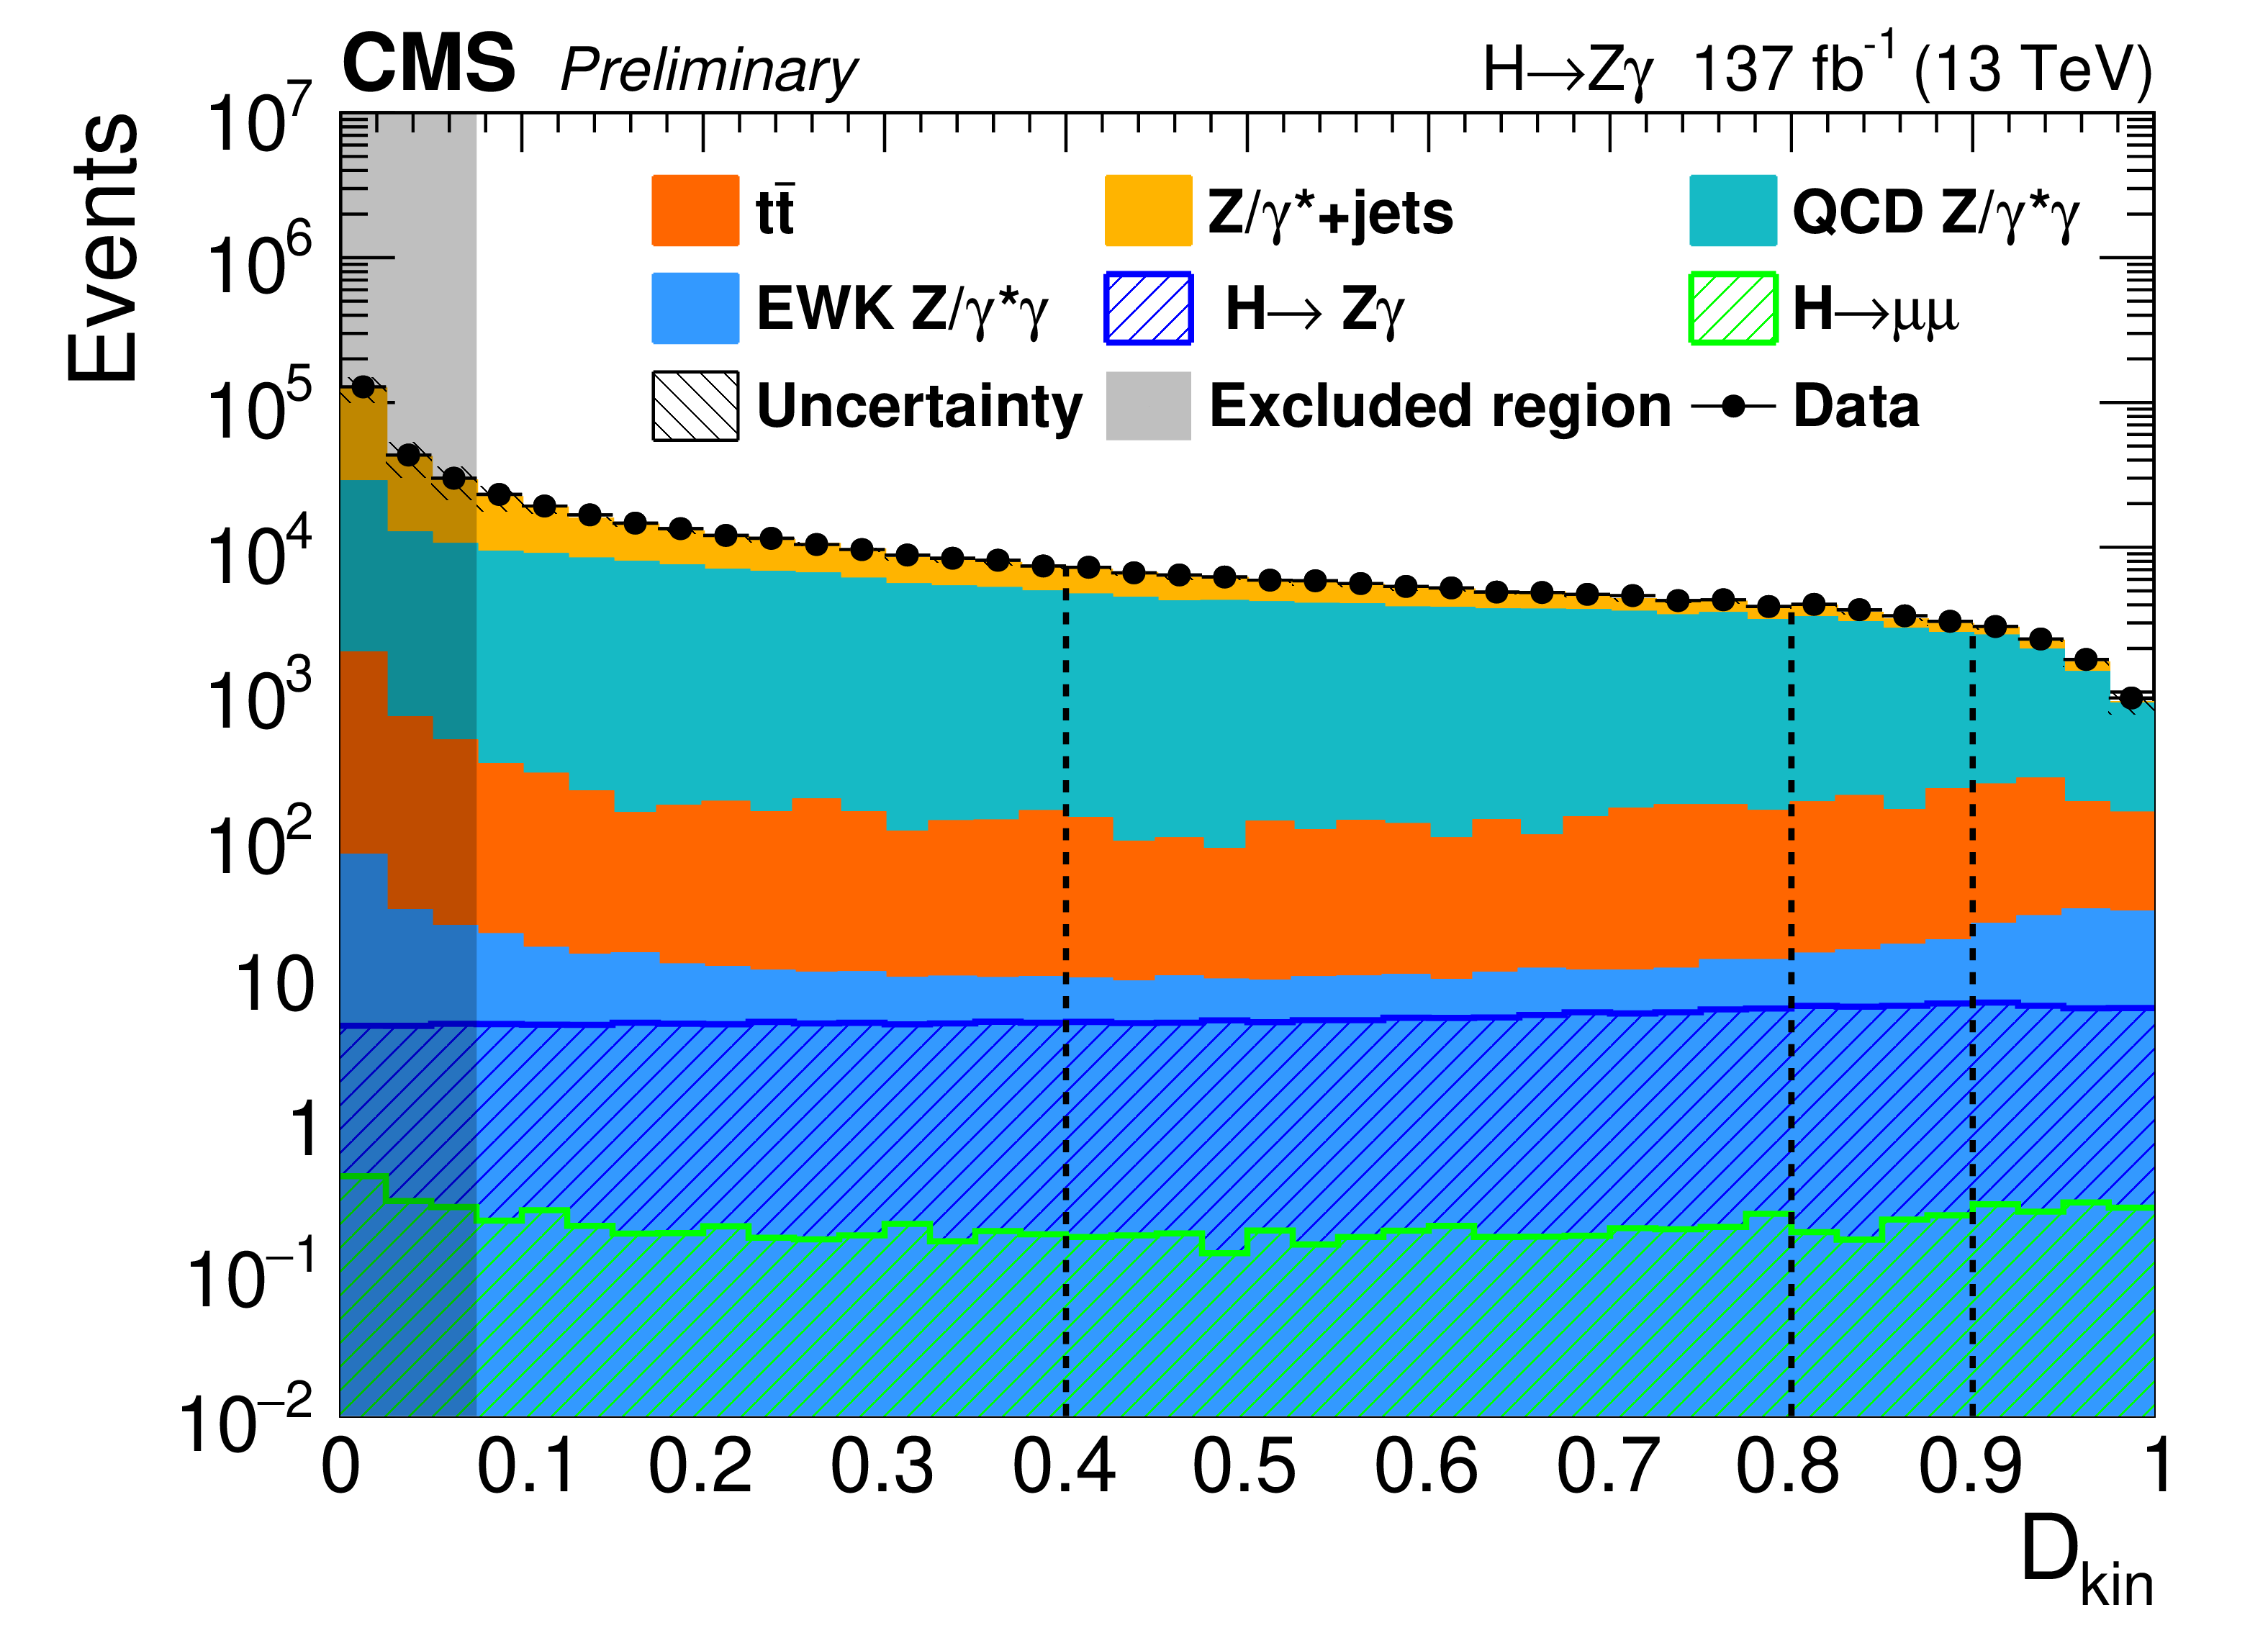
Figure 2-b:
$\mathcal {D}_{\mathrm {VBF}}$ (left) and $\mathcal {D}_{\mathrm {kin}}$ (right) for signal, simulated background, and data. The $\mathcal {D}_{\mathrm {VBF}}$ distribution includes only dijet-tagged events, and the $\mathcal {D}_{\mathrm {kin}}$ distribution includes only untagged events. The sum of contributions from all signal production modes is shown by the blue line, while the contribution from only the VBF mode is shown by the red line. The uncertainty band incorporates all statistical and systematic uncertainties on the expected background. The dashed lines indicate the boundaries for the dijet and untagged categories. The gray shaded region in the $\mathcal {D}_{\mathrm {kin}}$ distribution is excluded from the analysis. |

png pdf |
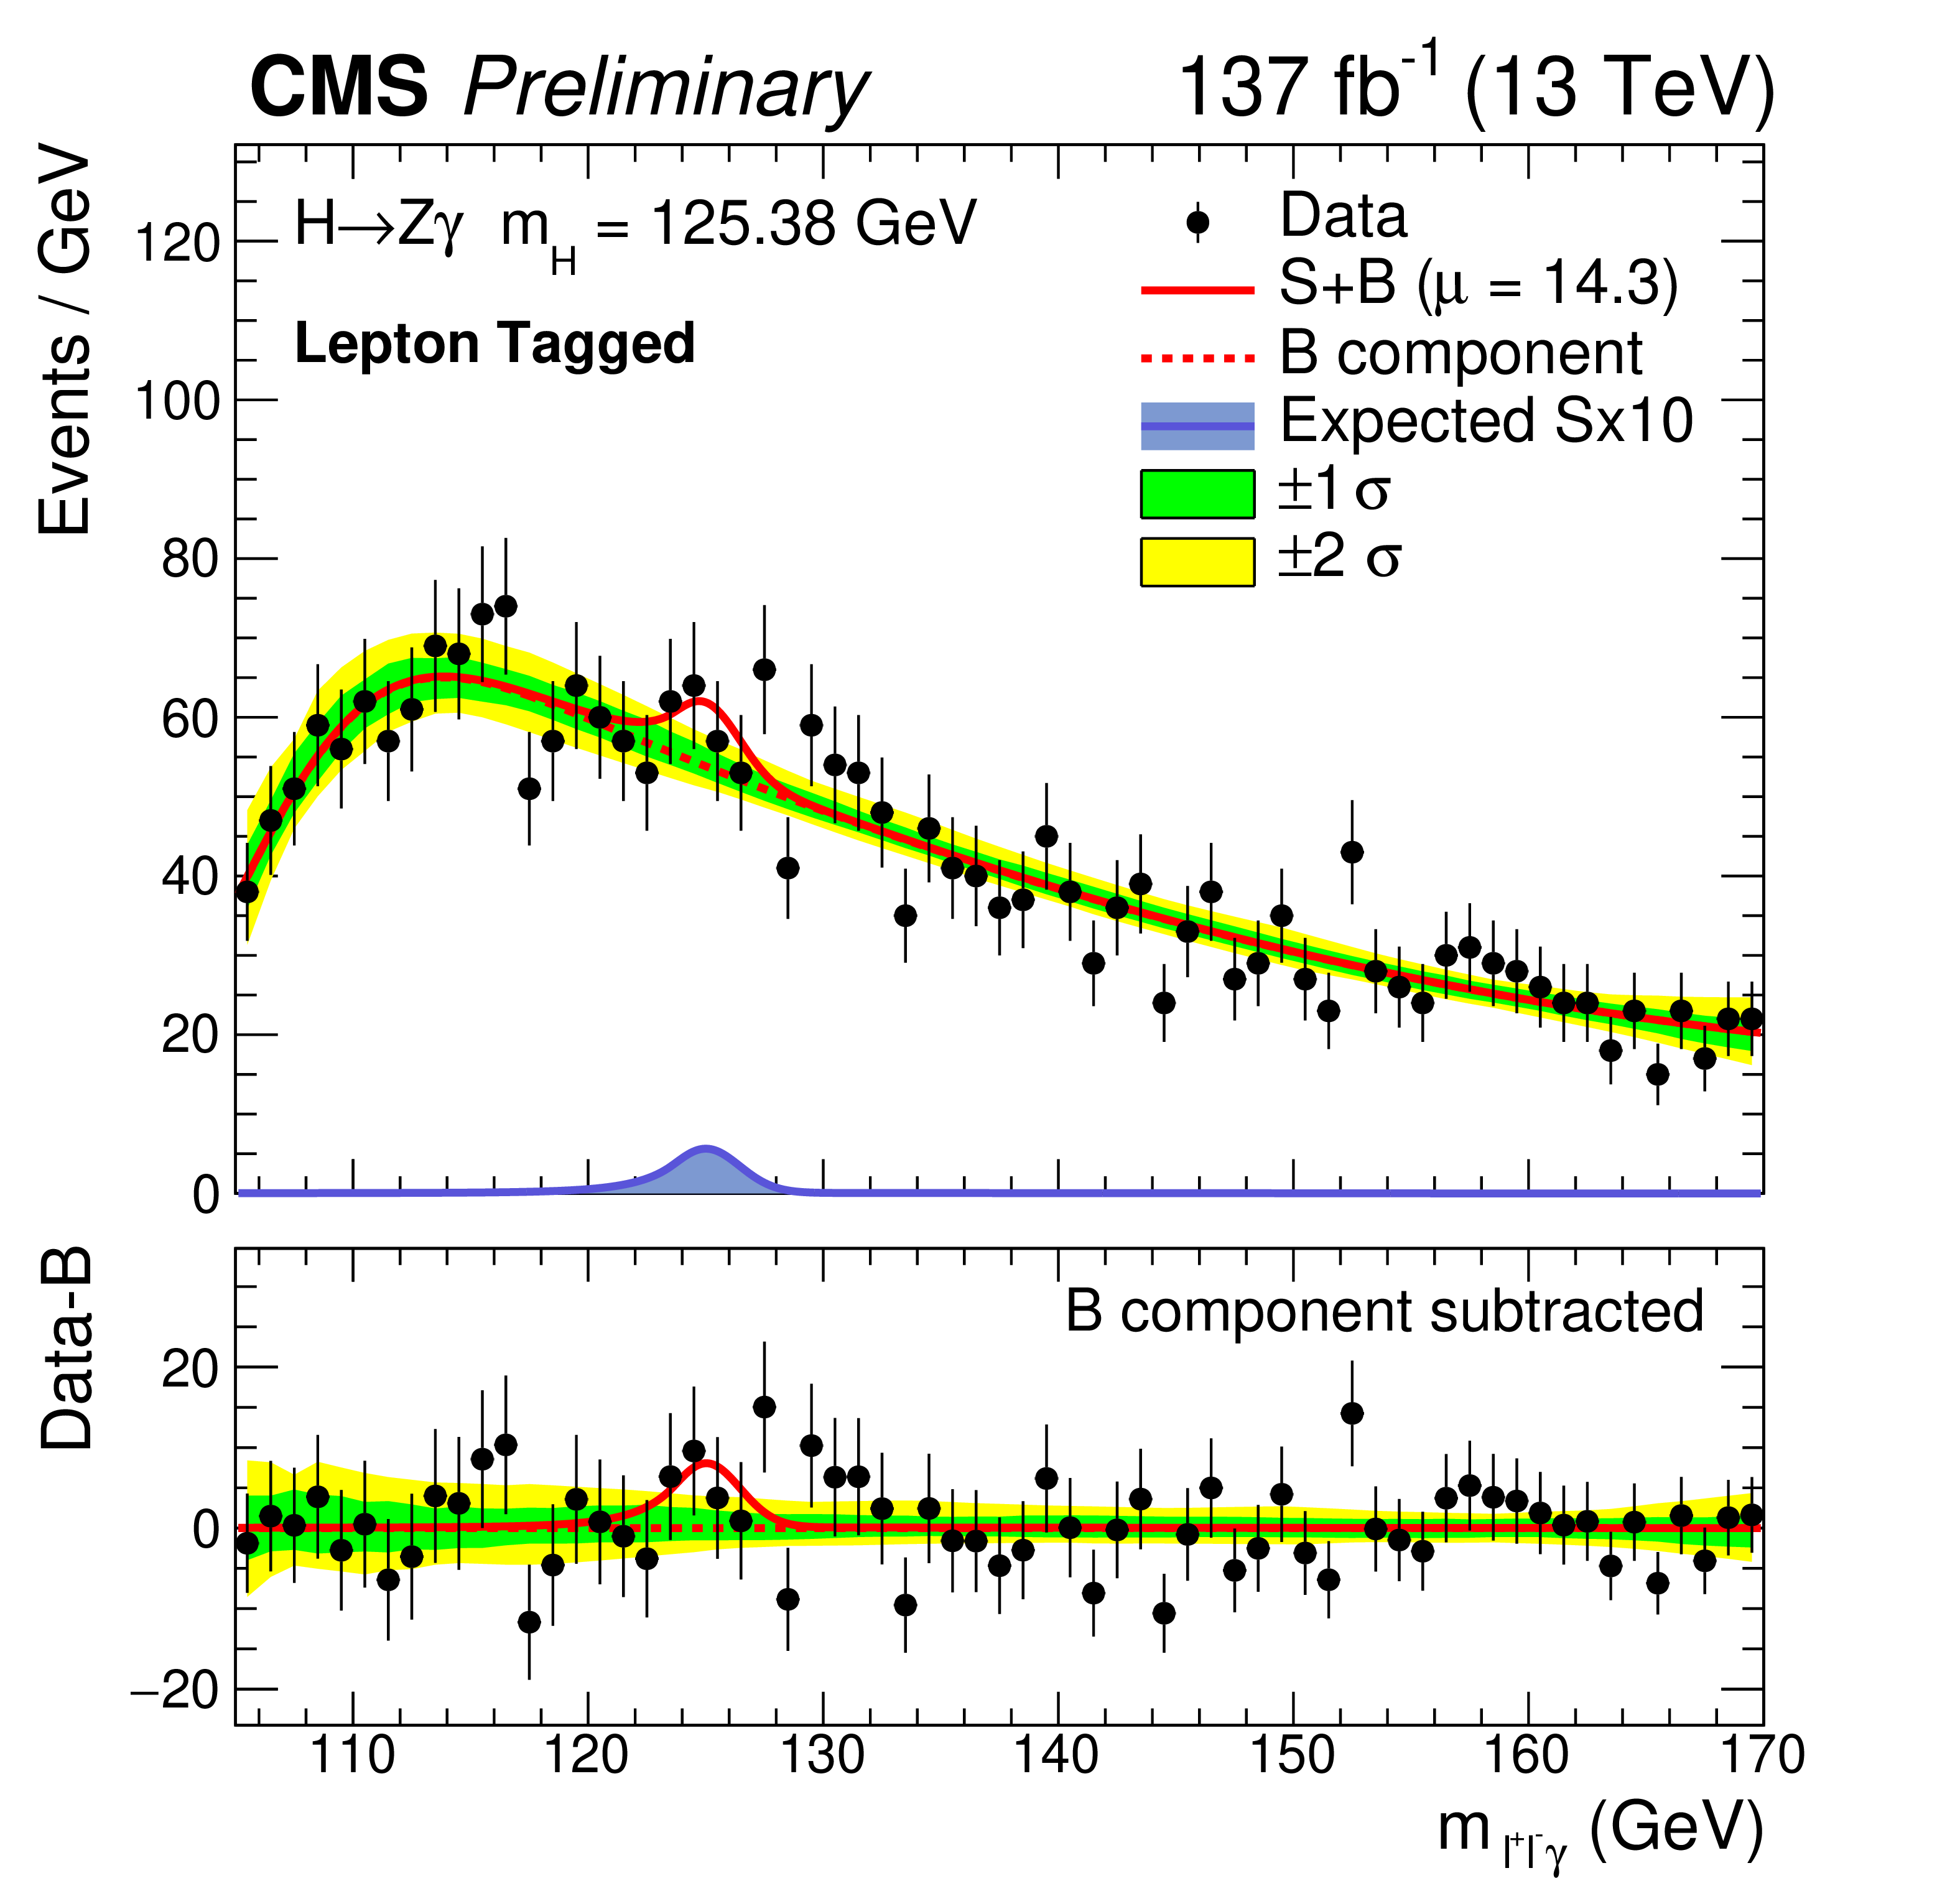
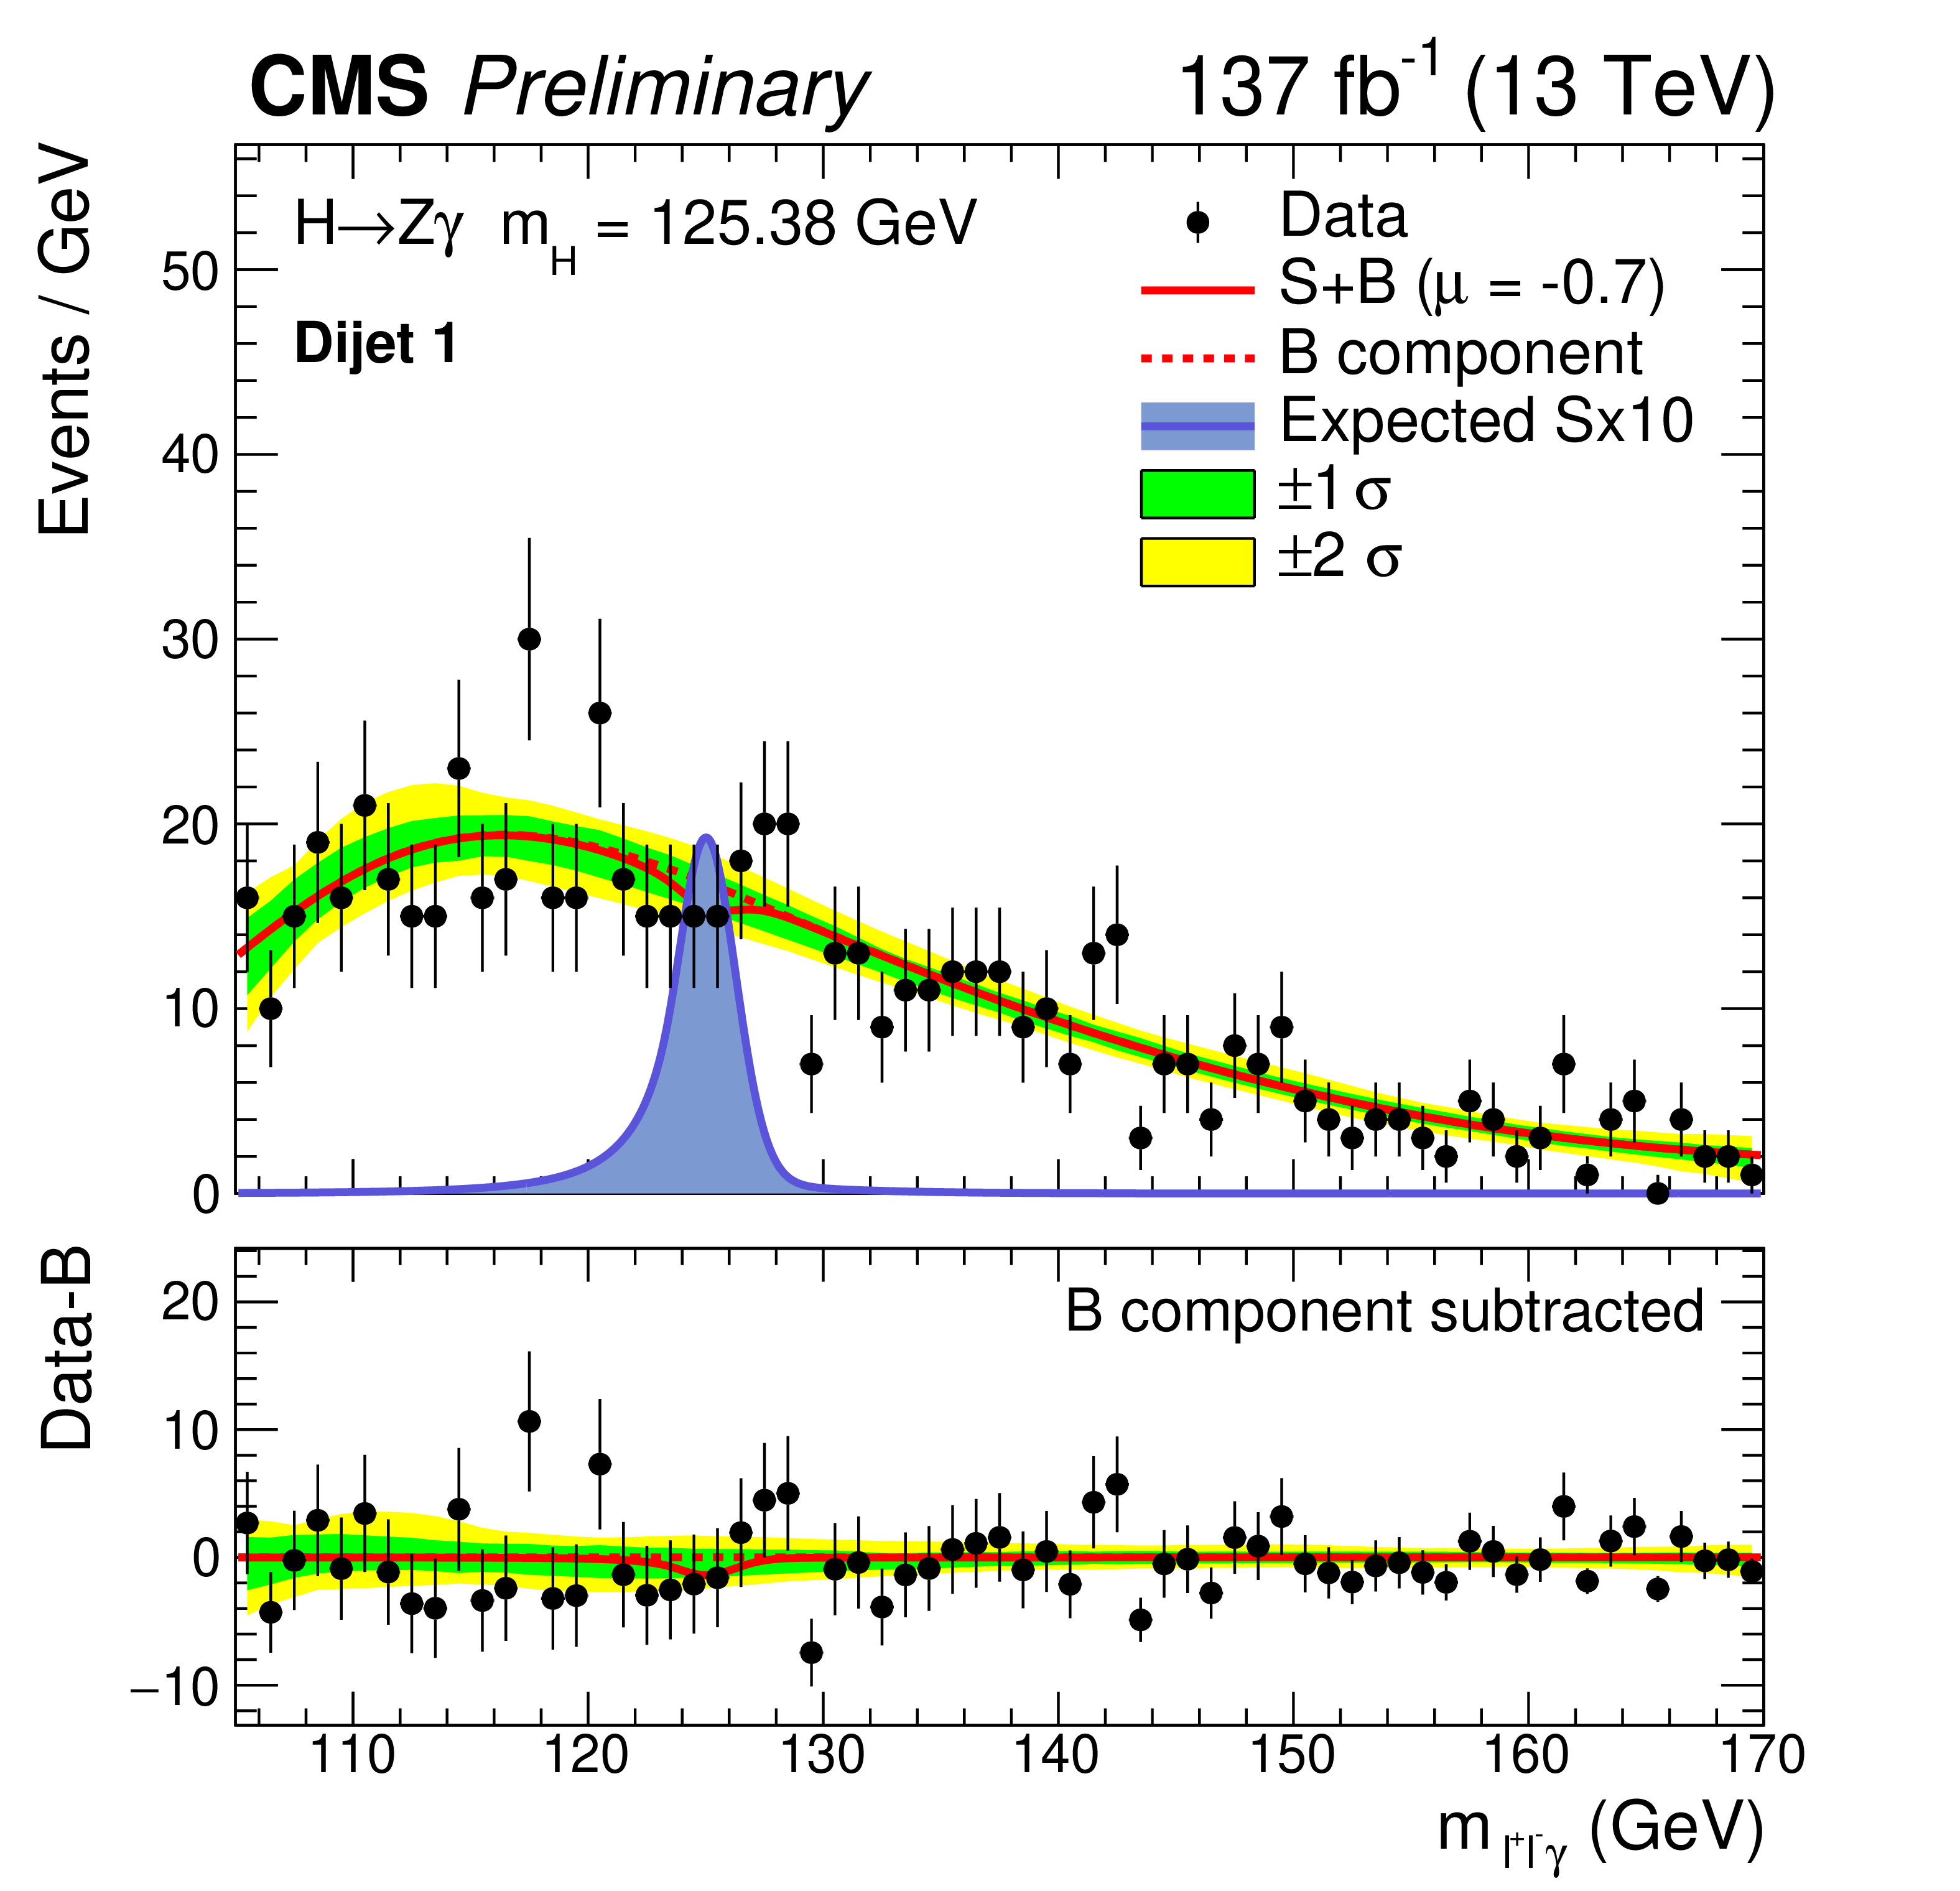
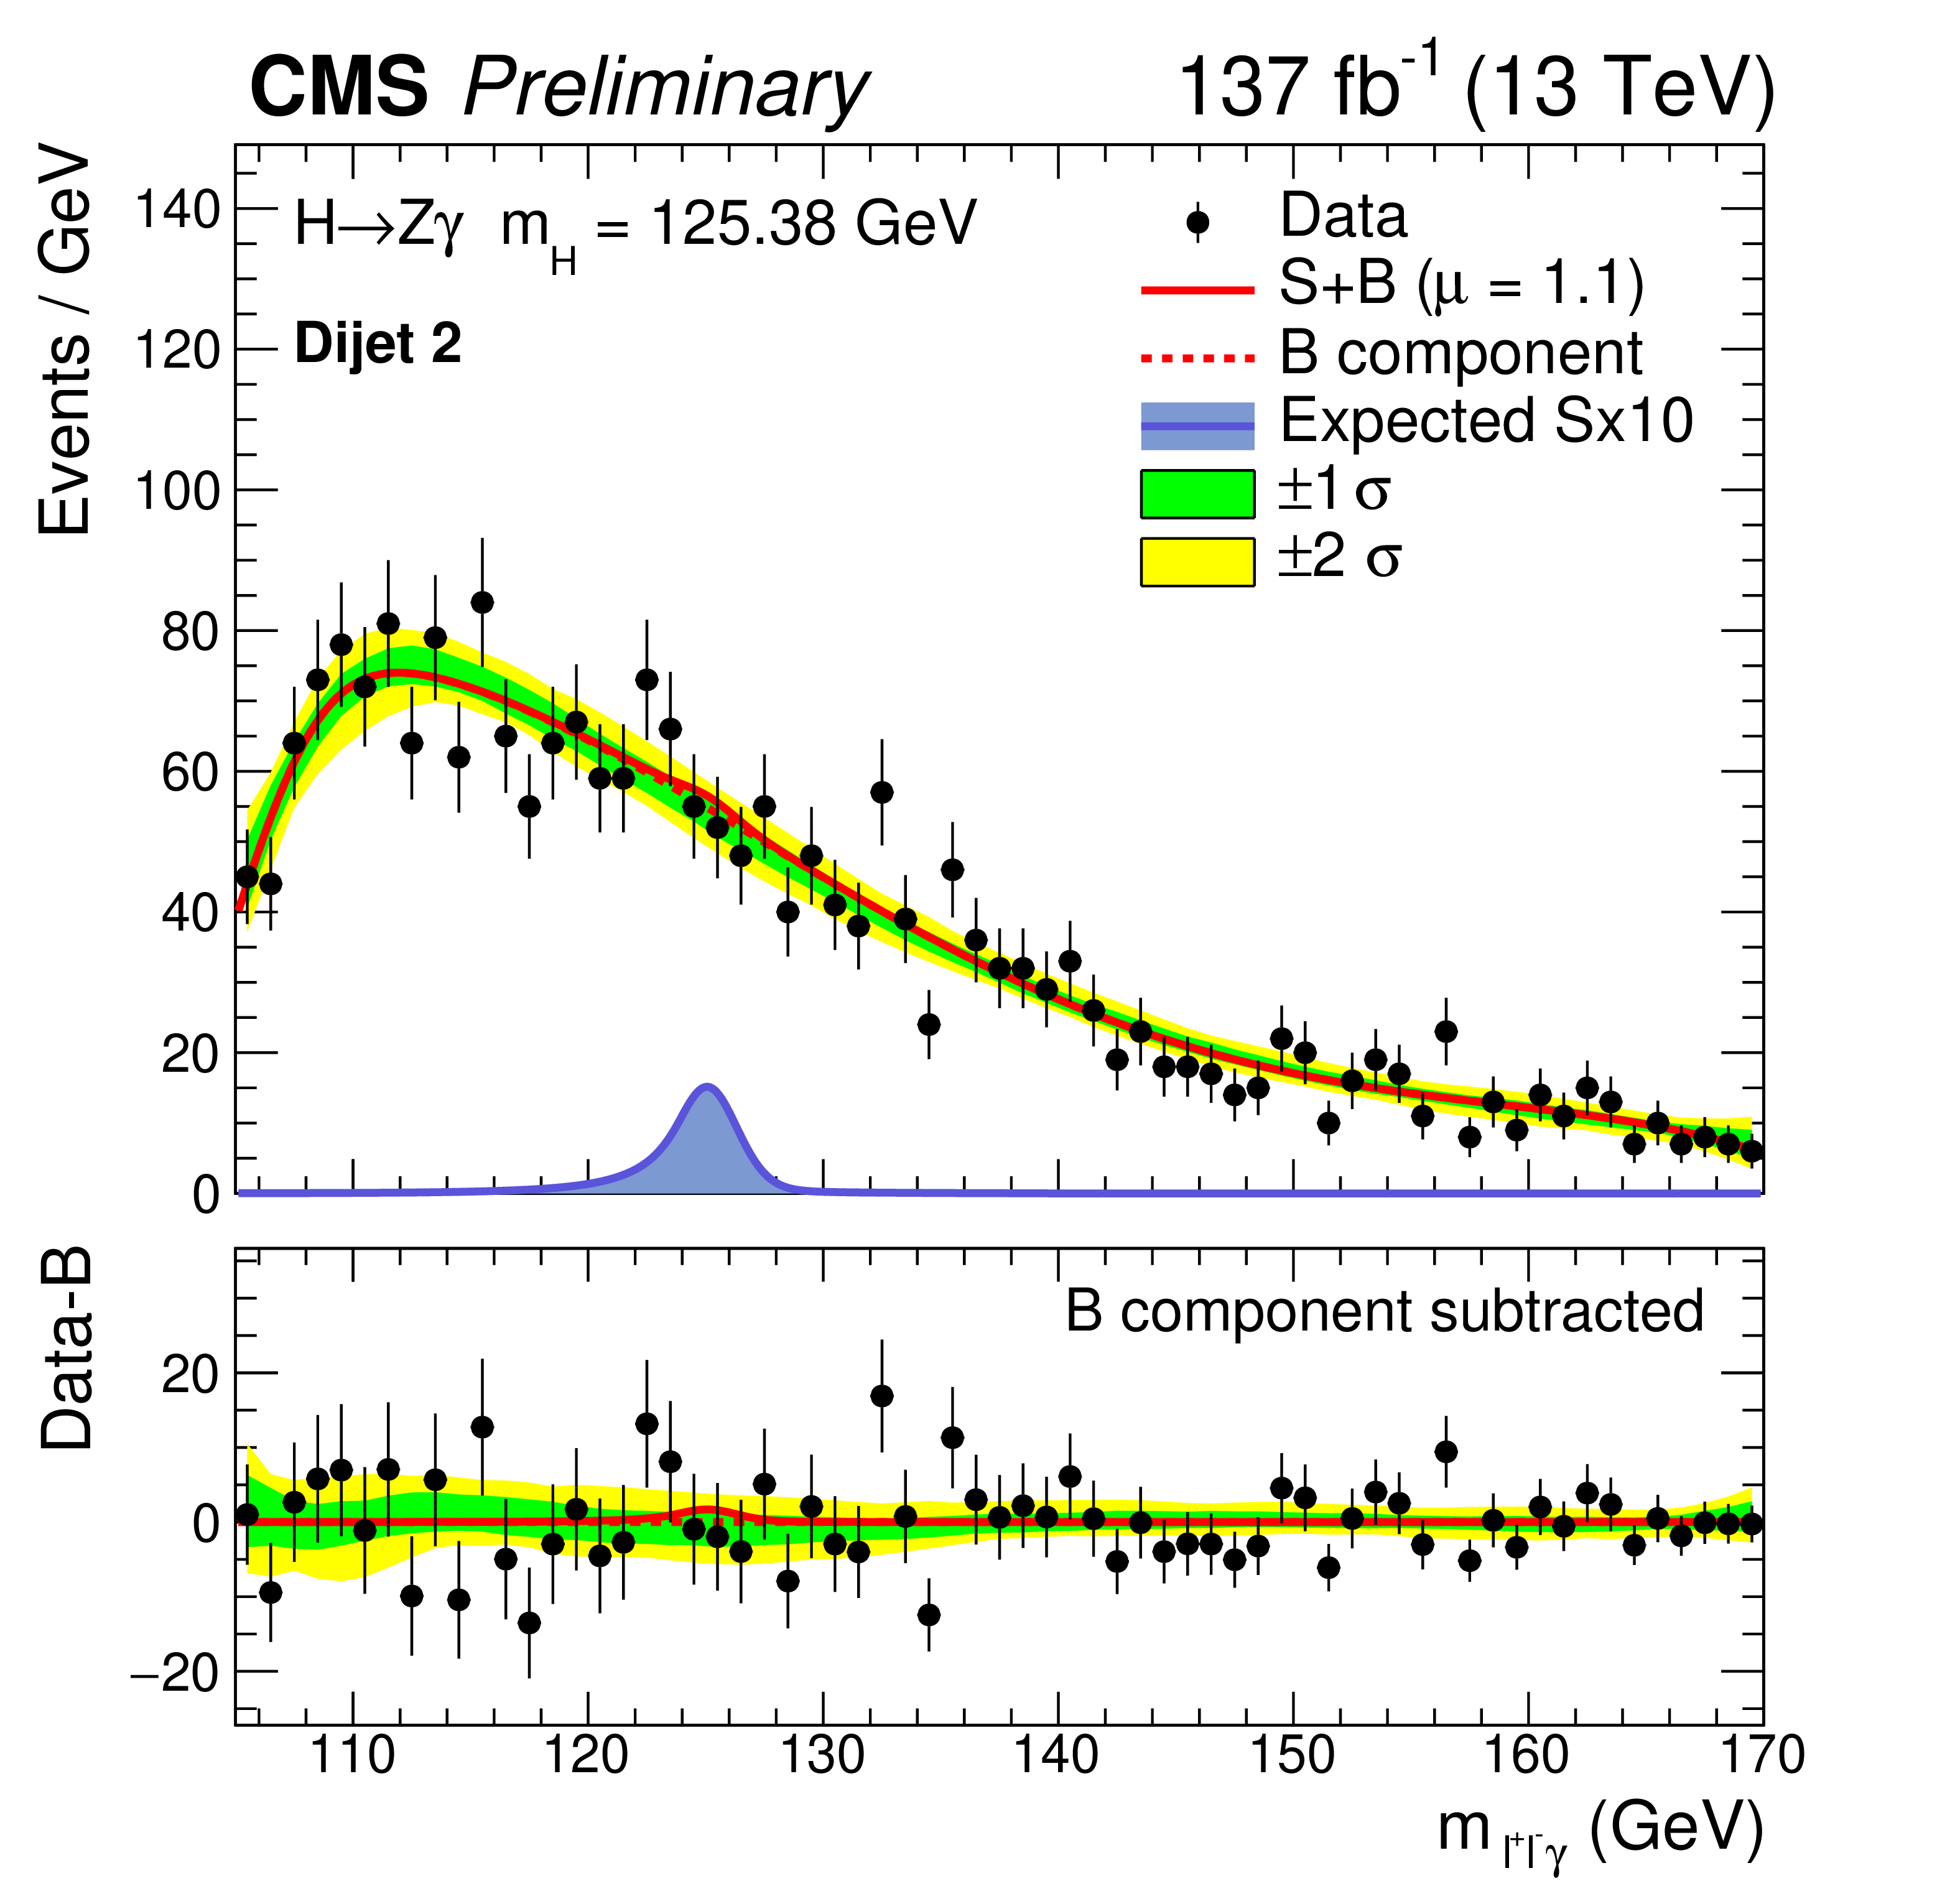
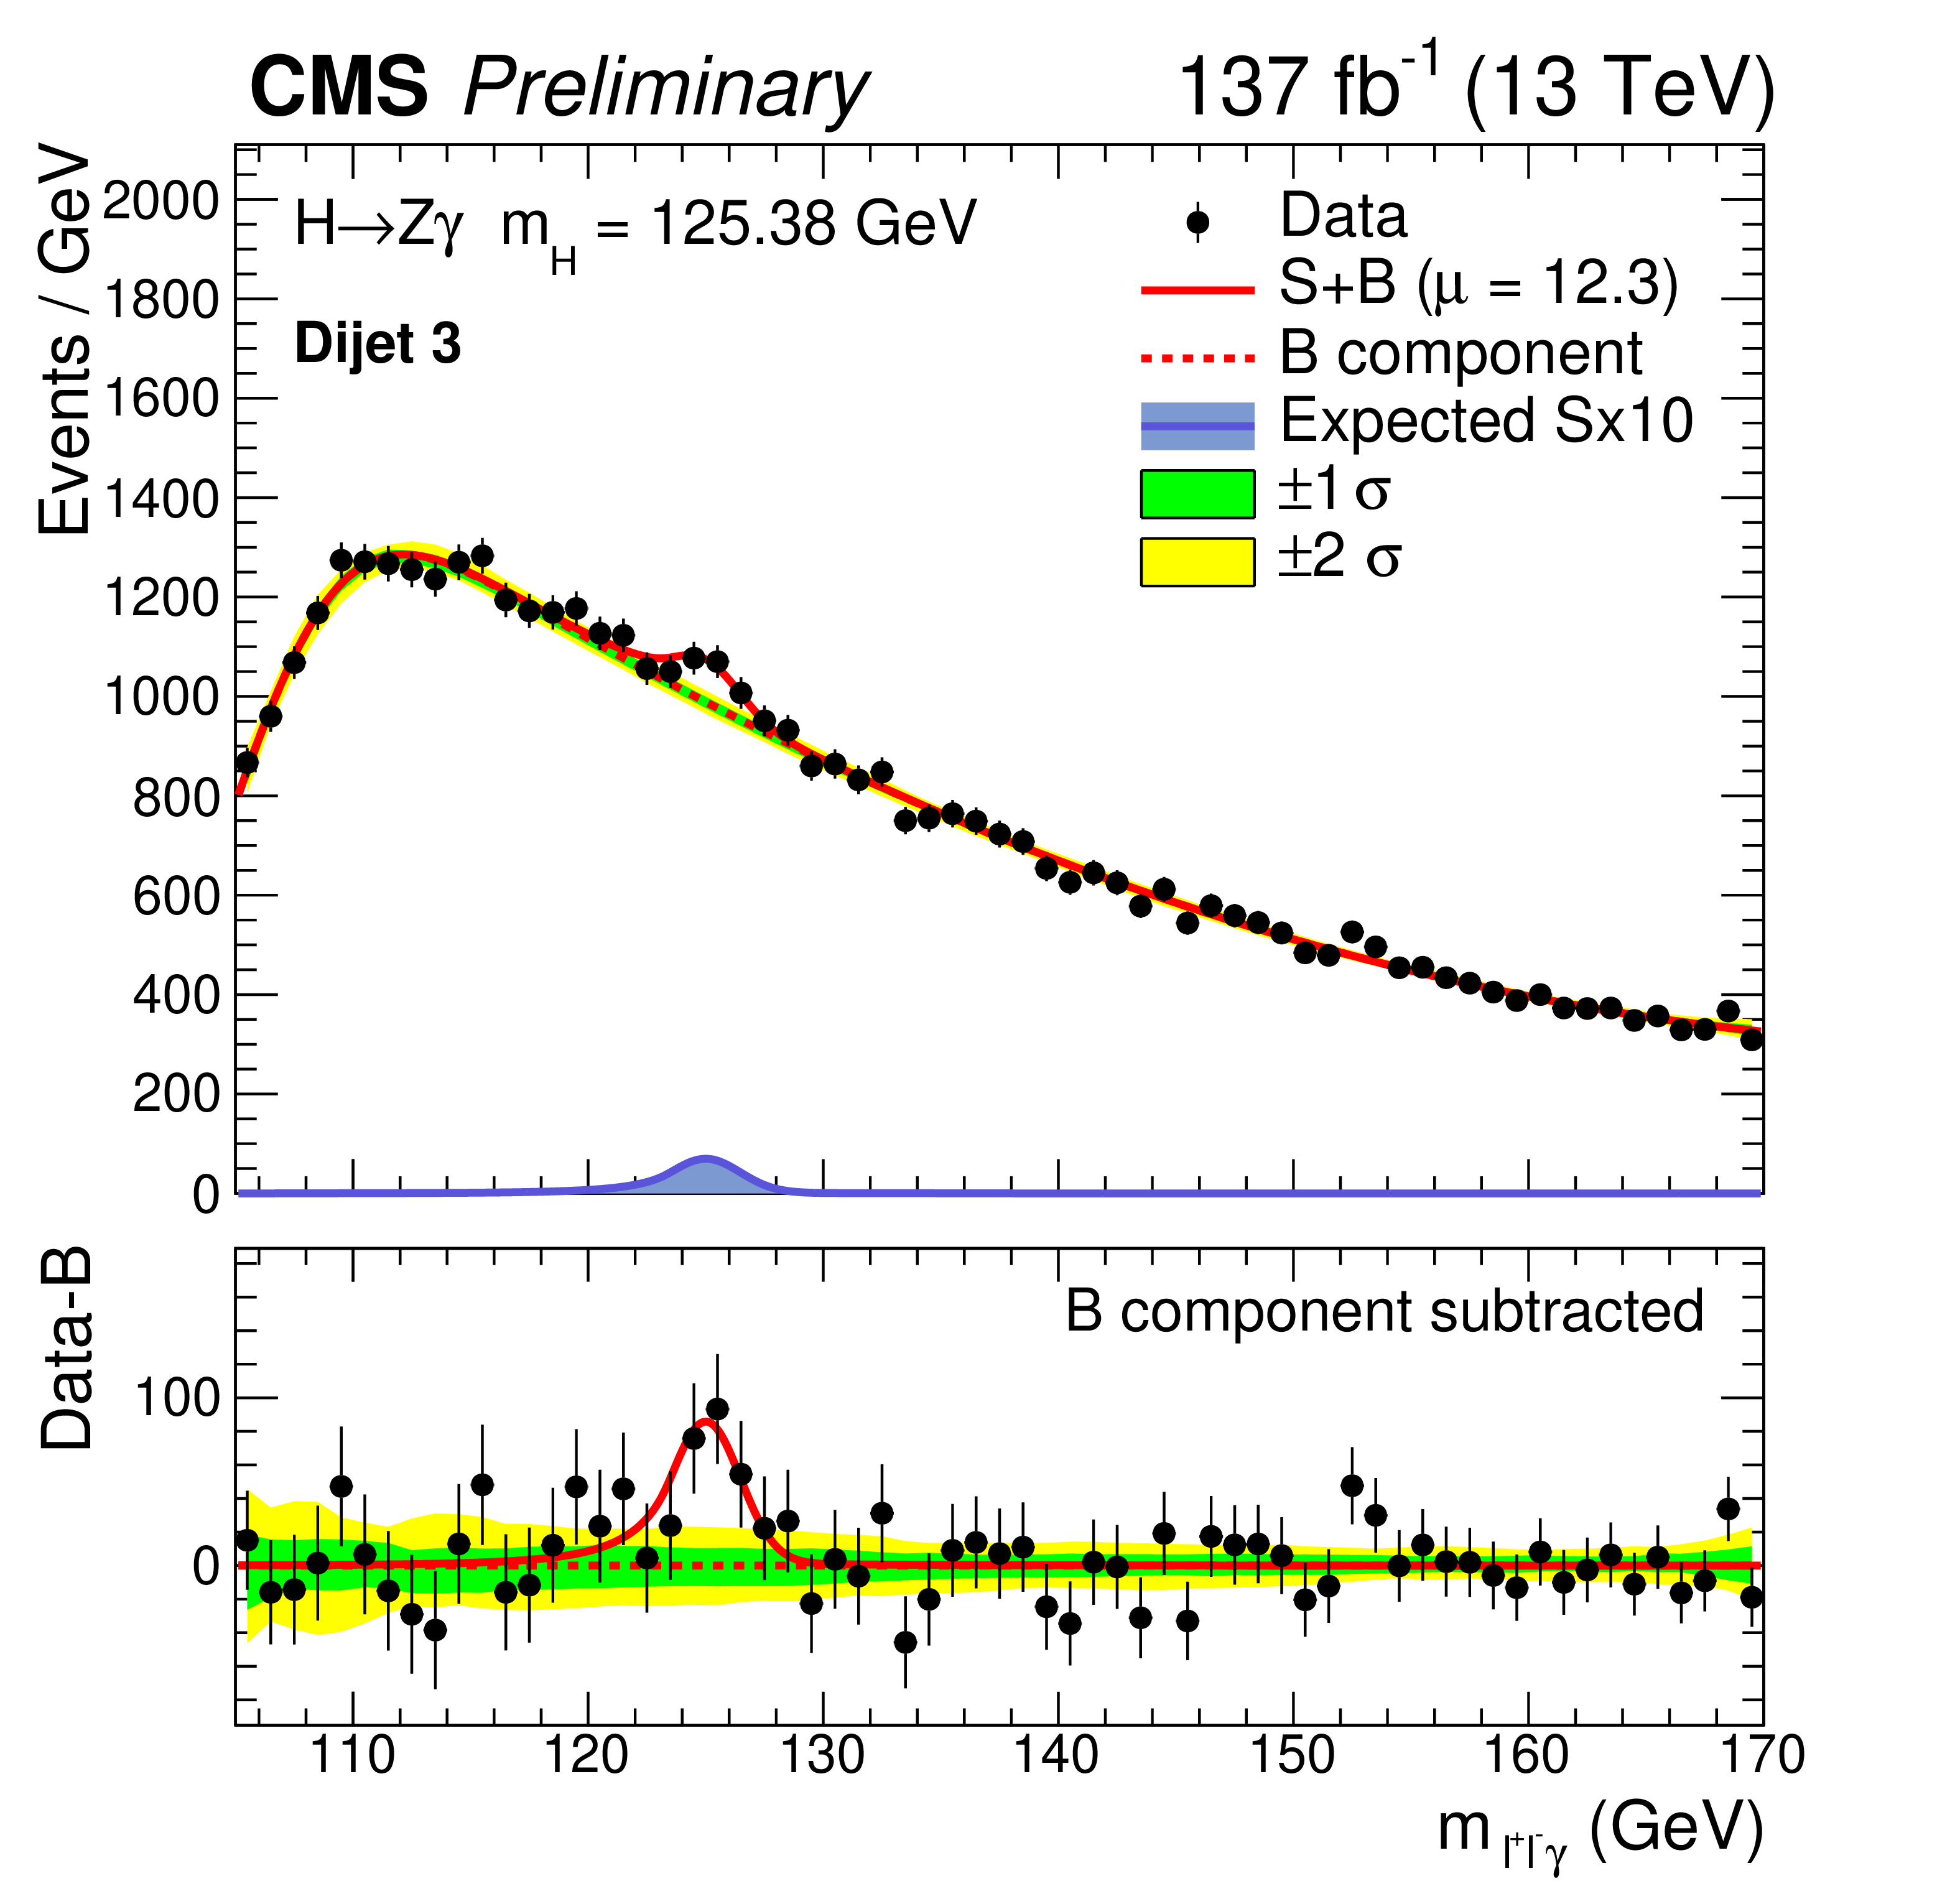
Figure 3:
Fits to the $m_{\ell ^+\ell ^-\gamma}$ data distribution in the lepton-tag (upper left), dijet 1 (upper right), dijet 2 (lower left), and dijet 3 (lower right) categories. The green and yellow bands represent the 68 and 95% CL \ uncertainties in the fit. The signal-plus-background fit shown as the solid red line. The dashed red line shows the background component of the fit. Also plotted is the expected SM signal scaled by a factor of 10. |
png pdf |
Figure 3-a:
Fits to the $m_{\ell ^+\ell ^-\gamma}$ data distribution in the lepton-tag (upper left), dijet 1 (upper right), dijet 2 (lower left), and dijet 3 (lower right) categories. The green and yellow bands represent the 68 and 95% CL \ uncertainties in the fit. The signal-plus-background fit shown as the solid red line. The dashed red line shows the background component of the fit. Also plotted is the expected SM signal scaled by a factor of 10. |
png pdf |
Figure 3-b:
Fits to the $m_{\ell ^+\ell ^-\gamma}$ data distribution in the lepton-tag (upper left), dijet 1 (upper right), dijet 2 (lower left), and dijet 3 (lower right) categories. The green and yellow bands represent the 68 and 95% CL \ uncertainties in the fit. The signal-plus-background fit shown as the solid red line. The dashed red line shows the background component of the fit. Also plotted is the expected SM signal scaled by a factor of 10. |
png pdf |
Figure 3-c:
Fits to the $m_{\ell ^+\ell ^-\gamma}$ data distribution in the lepton-tag (upper left), dijet 1 (upper right), dijet 2 (lower left), and dijet 3 (lower right) categories. The green and yellow bands represent the 68 and 95% CL \ uncertainties in the fit. The signal-plus-background fit shown as the solid red line. The dashed red line shows the background component of the fit. Also plotted is the expected SM signal scaled by a factor of 10. |
png pdf |
Figure 3-d:
Fits to the $m_{\ell ^+\ell ^-\gamma}$ data distribution in the lepton-tag (upper left), dijet 1 (upper right), dijet 2 (lower left), and dijet 3 (lower right) categories. The green and yellow bands represent the 68 and 95% CL \ uncertainties in the fit. The signal-plus-background fit shown as the solid red line. The dashed red line shows the background component of the fit. Also plotted is the expected SM signal scaled by a factor of 10. |
png pdf |
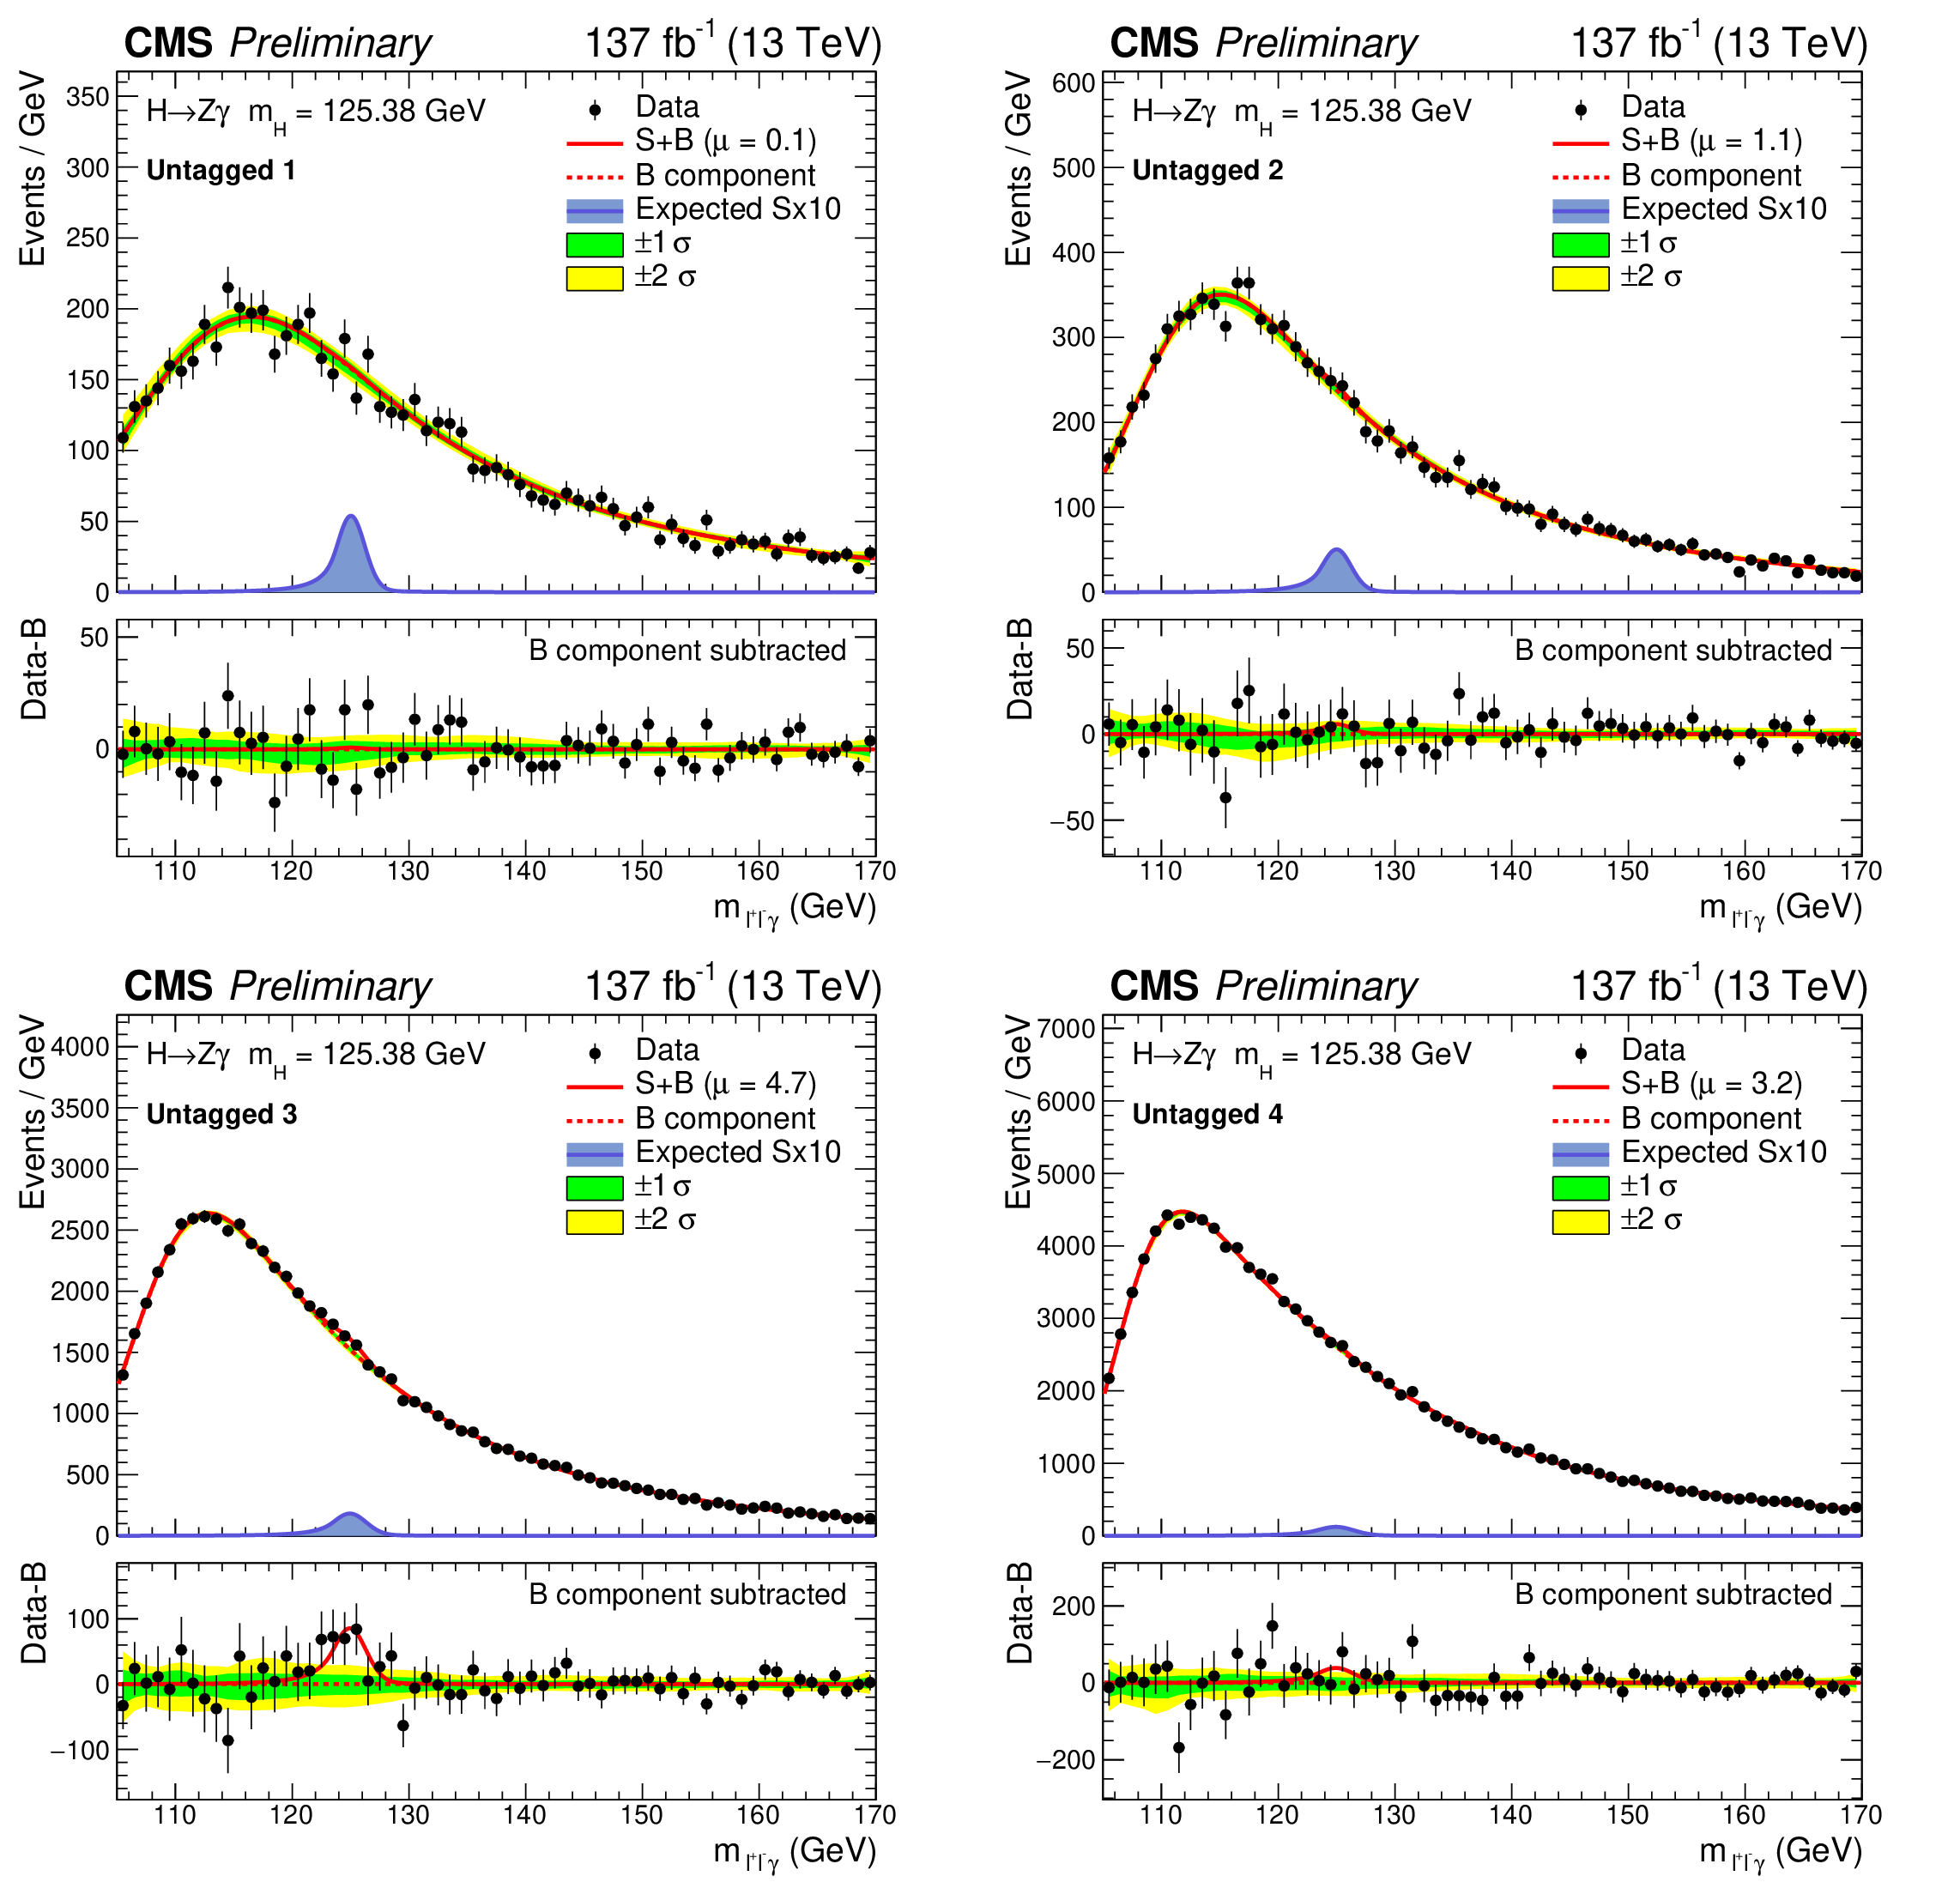
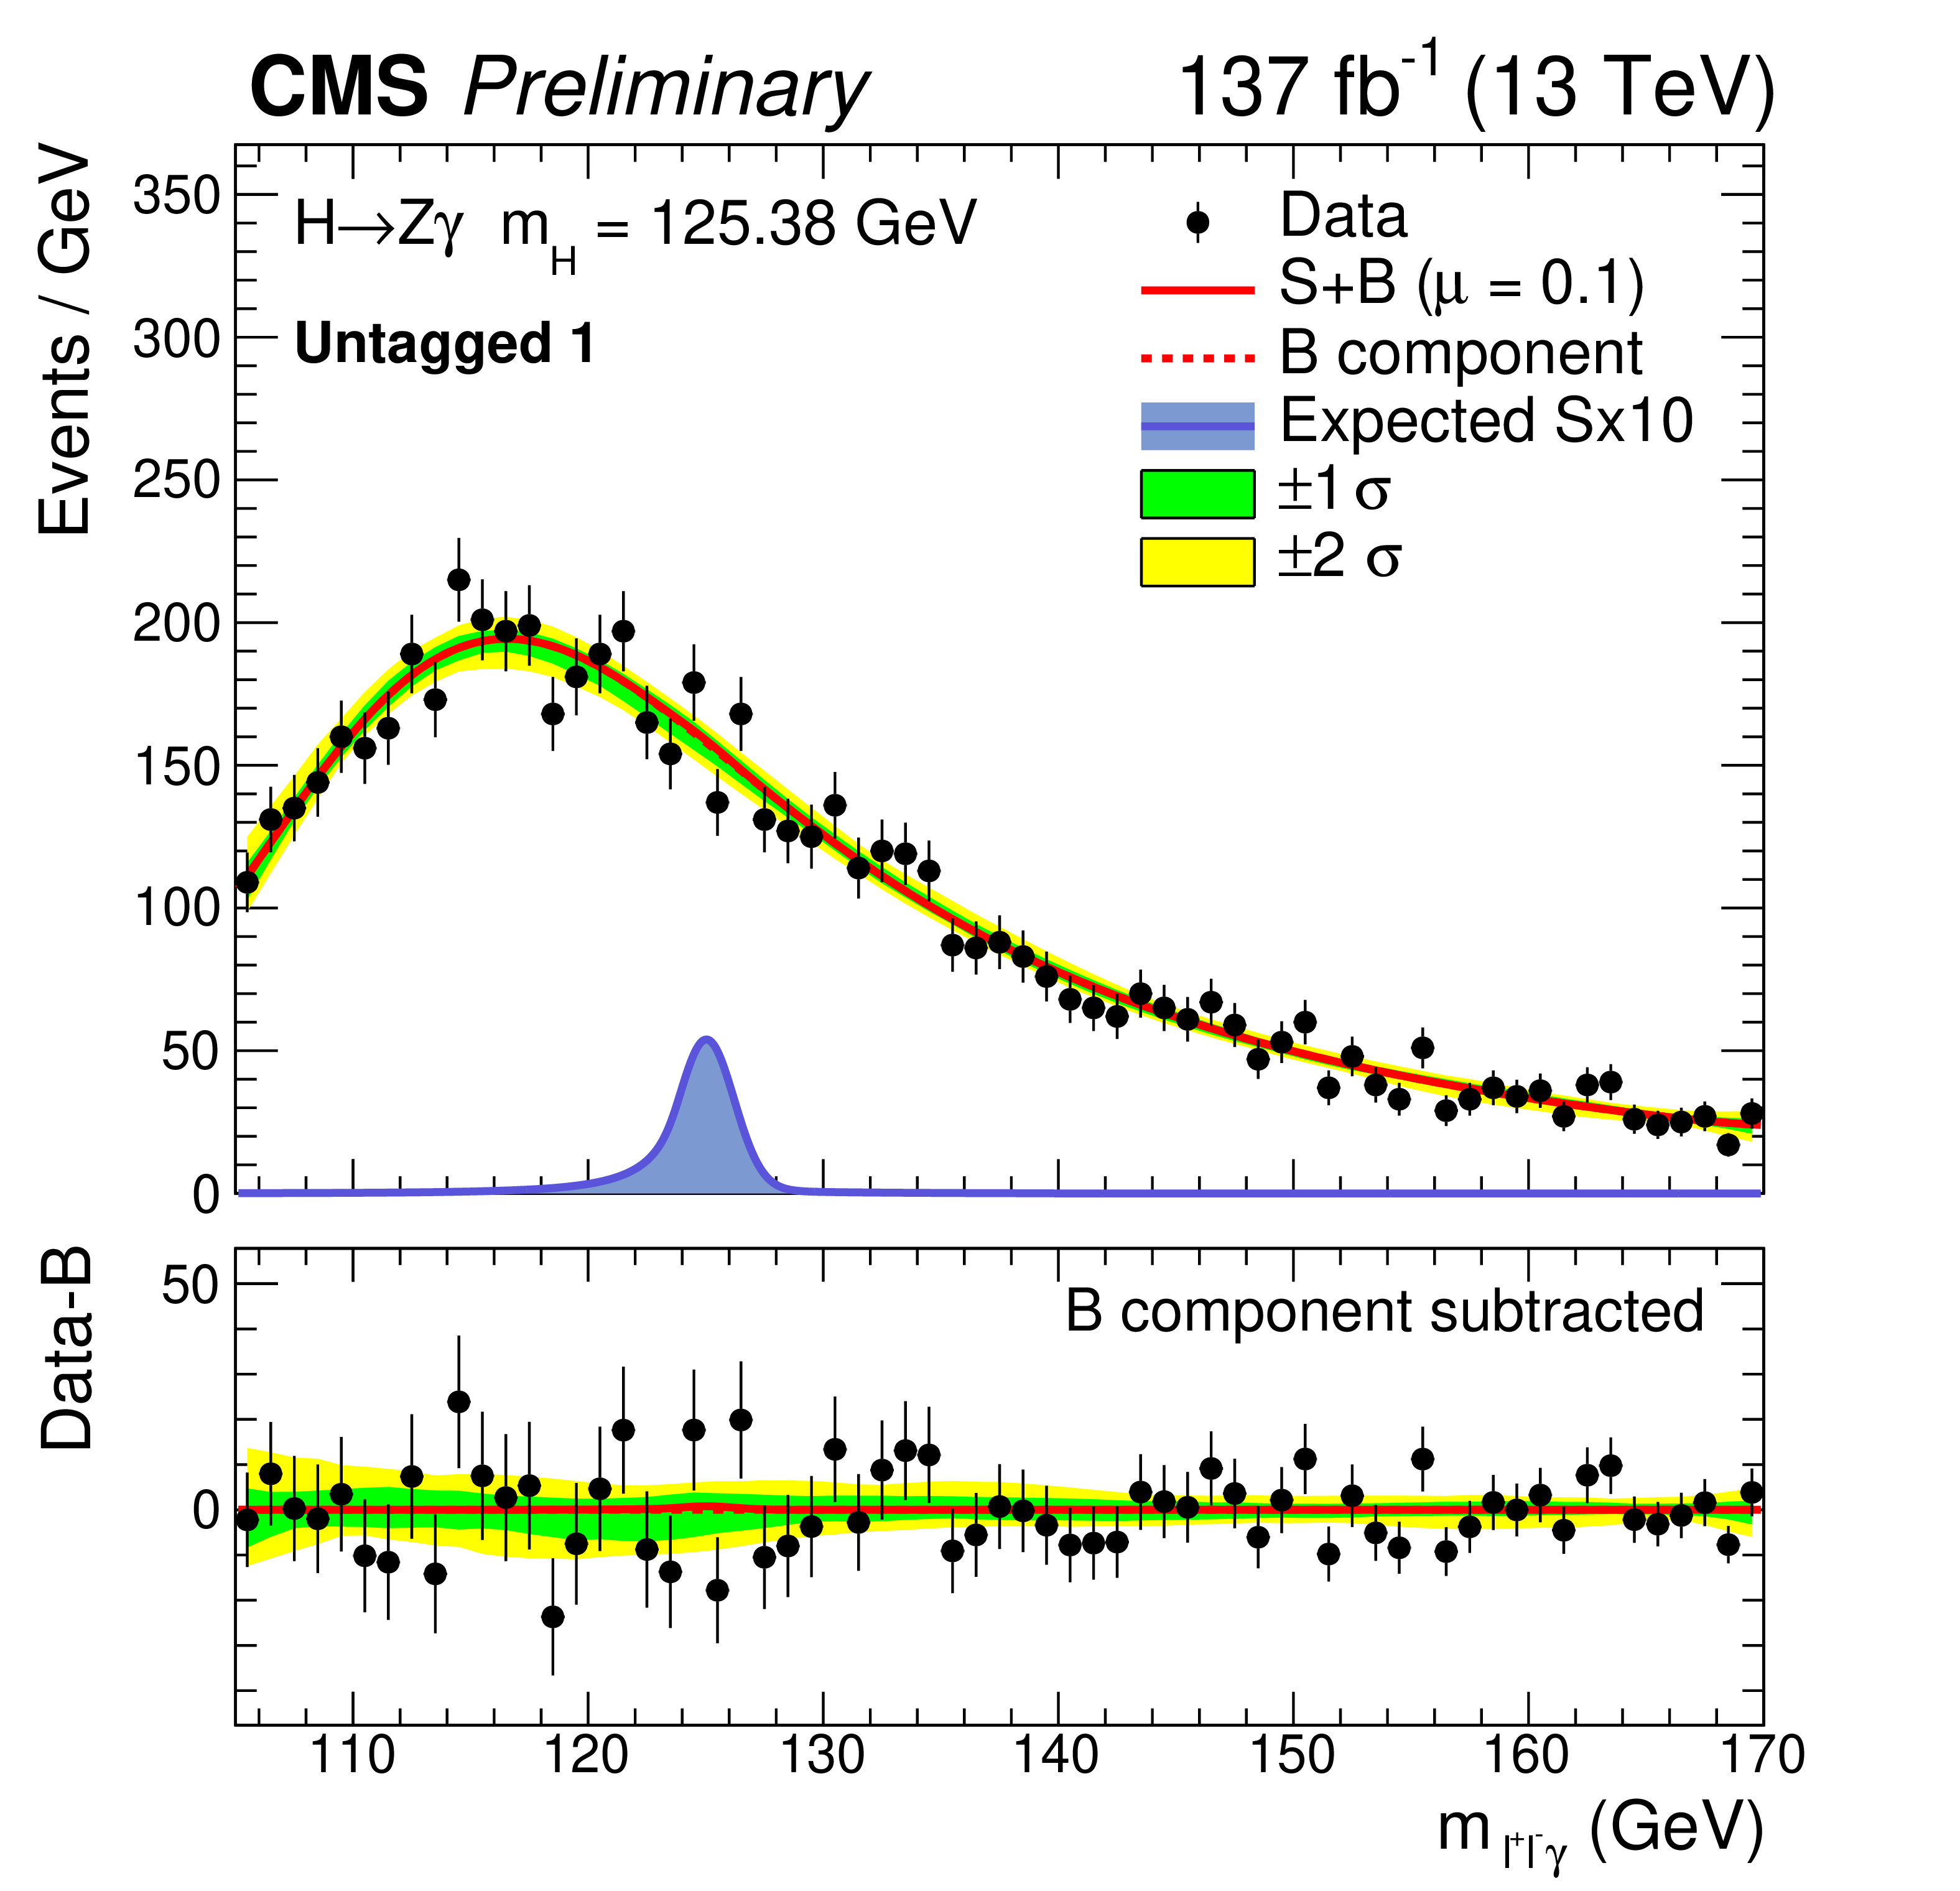
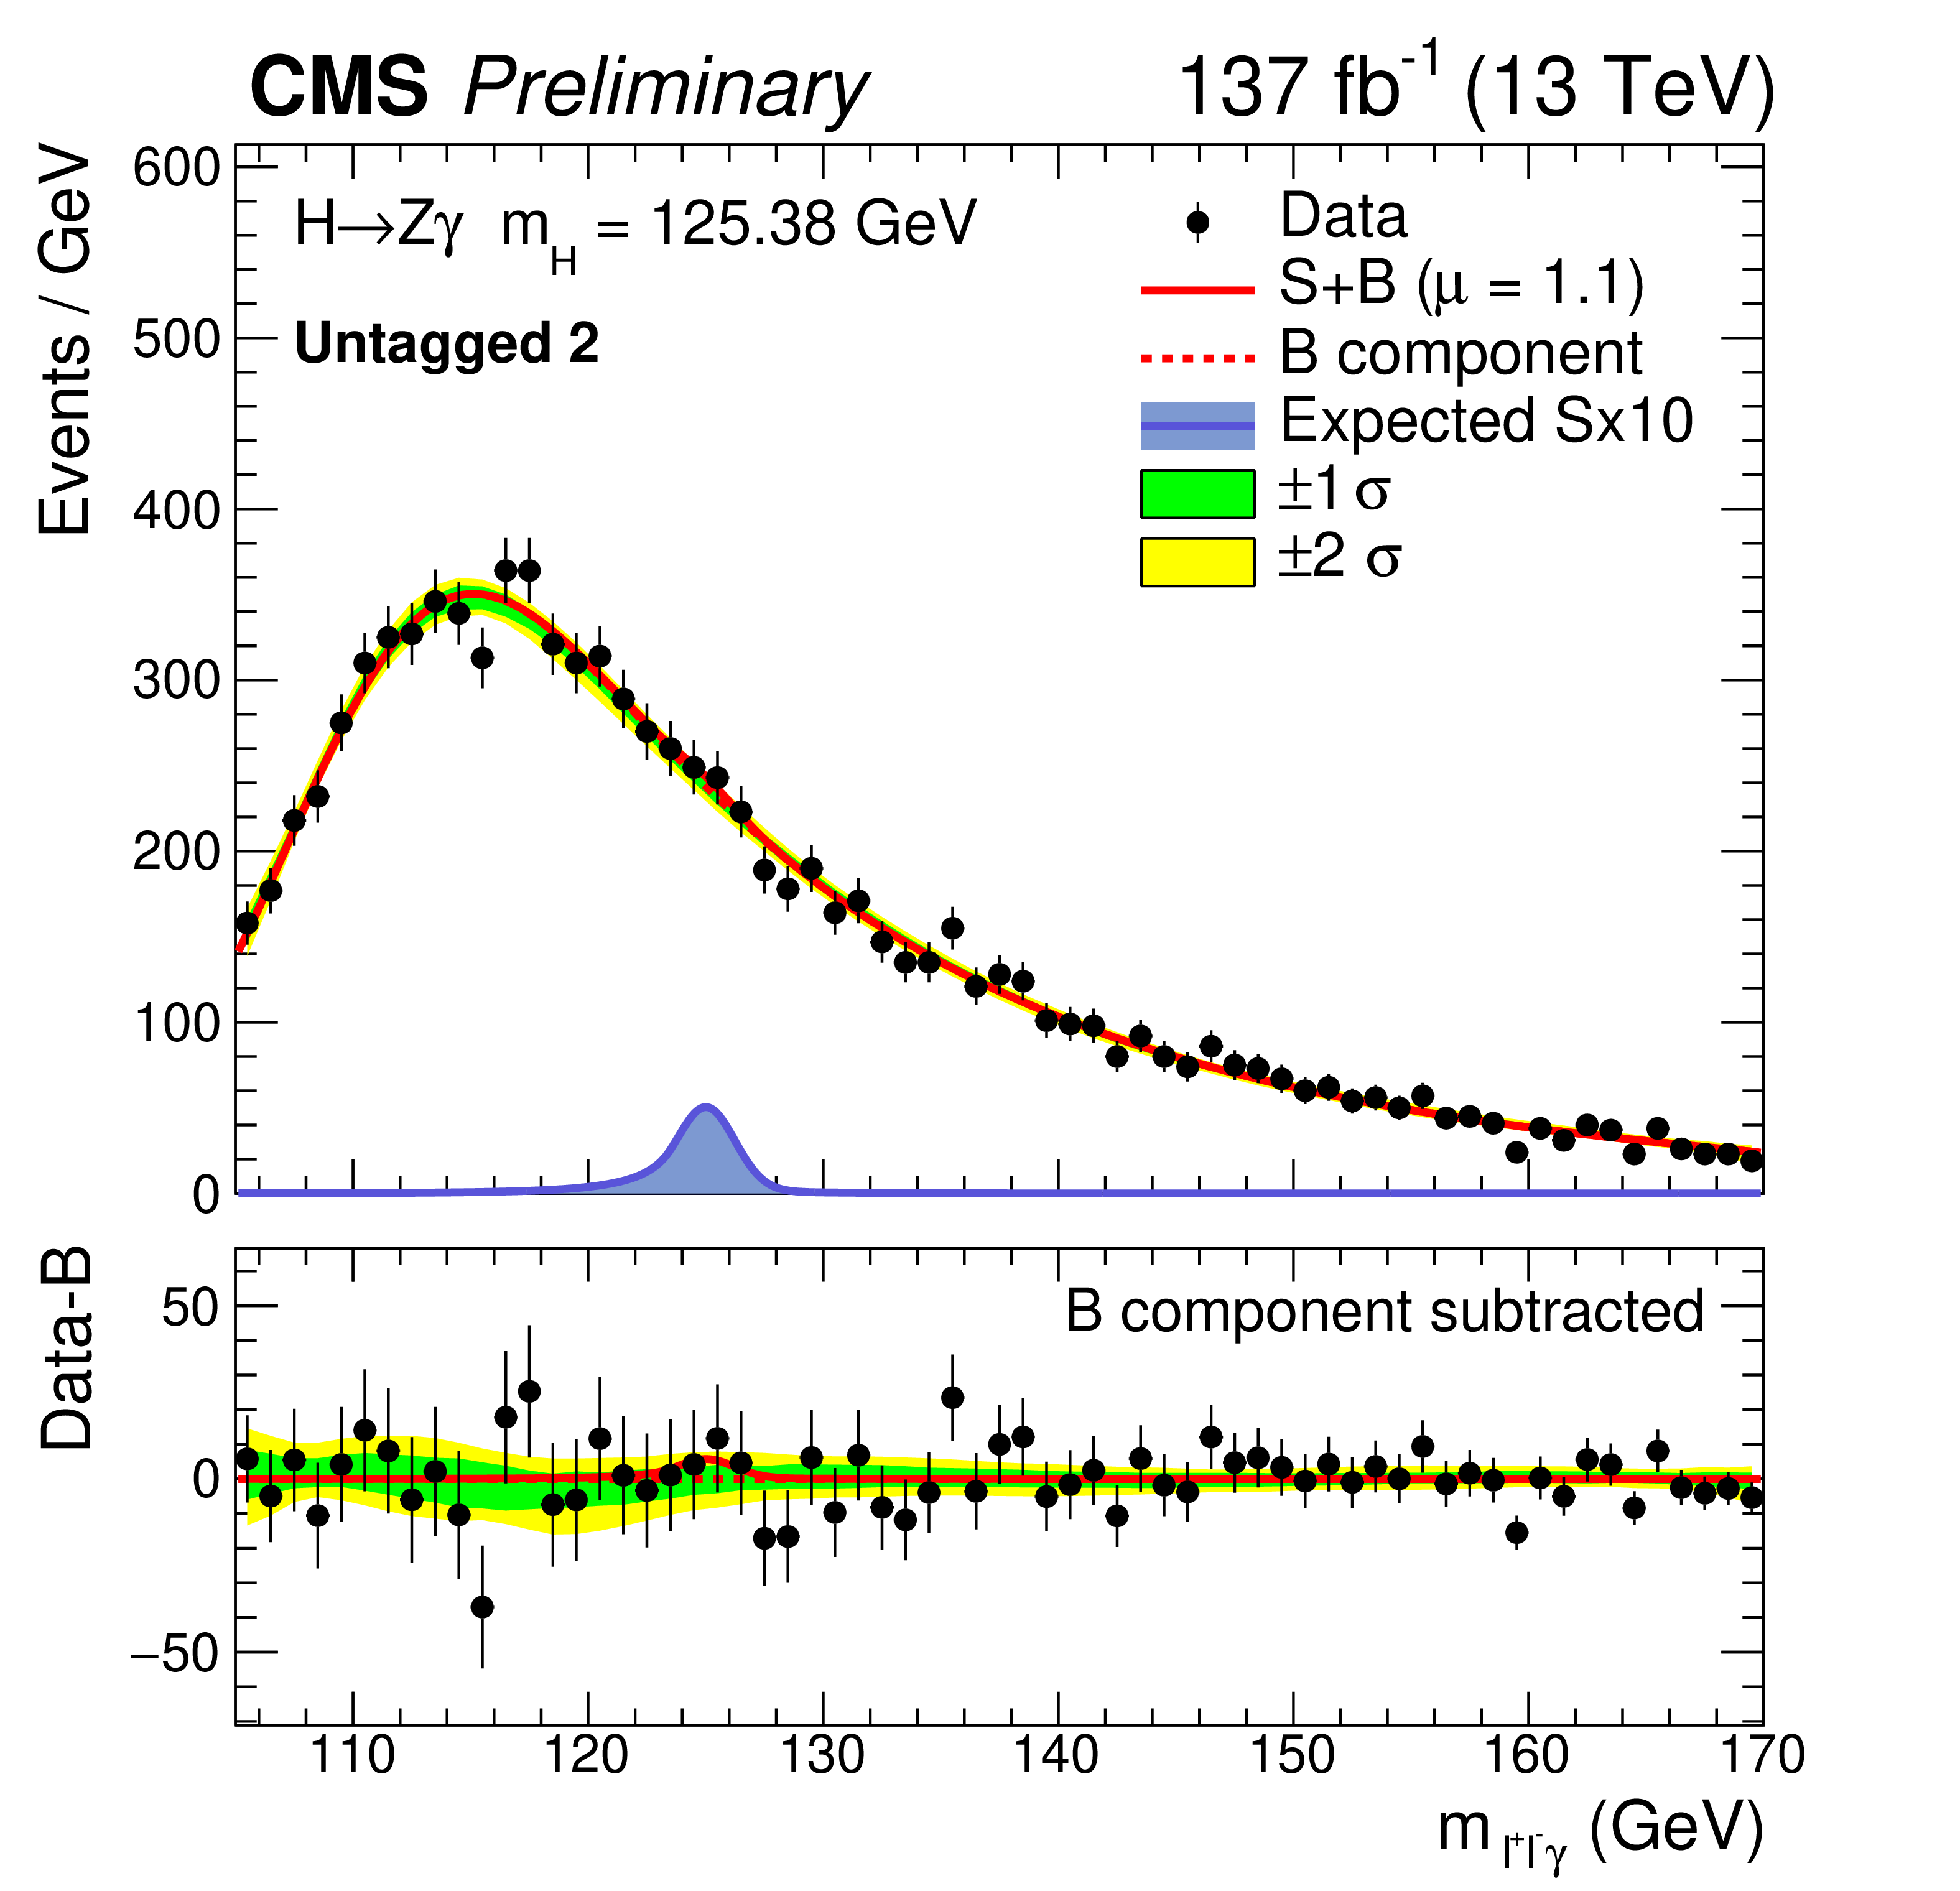
Figure 4:
Fits to the $m_{\ell ^+\ell ^-\gamma}$ data distribution in the untagged 1 (upper left), untagged 2 (upper right), untagged 3 (lower left), and untagged 4 (lower right) categories. The green and yellow bands represent the 68 and 95% CL uncertainties in the fit. The signal-plus-background fit shown as the solid red line. The dashed red line shows the background component of the fit. Also plotted is the expected SM signal scaled by a factor of 10. |
png pdf |
Figure 4-a:
Fits to the $m_{\ell ^+\ell ^-\gamma}$ data distribution in the untagged 1 (upper left), untagged 2 (upper right), untagged 3 (lower left), and untagged 4 (lower right) categories. The green and yellow bands represent the 68 and 95% CL uncertainties in the fit. The signal-plus-background fit shown as the solid red line. The dashed red line shows the background component of the fit. Also plotted is the expected SM signal scaled by a factor of 10. |
png pdf |
Figure 4-b:
Fits to the $m_{\ell ^+\ell ^-\gamma}$ data distribution in the untagged 1 (upper left), untagged 2 (upper right), untagged 3 (lower left), and untagged 4 (lower right) categories. The green and yellow bands represent the 68 and 95% CL uncertainties in the fit. The signal-plus-background fit shown as the solid red line. The dashed red line shows the background component of the fit. Also plotted is the expected SM signal scaled by a factor of 10. |

png pdf |
Figure 4-c:
Fits to the $m_{\ell ^+\ell ^-\gamma}$ data distribution in the untagged 1 (upper left), untagged 2 (upper right), untagged 3 (lower left), and untagged 4 (lower right) categories. The green and yellow bands represent the 68 and 95% CL uncertainties in the fit. The signal-plus-background fit shown as the solid red line. The dashed red line shows the background component of the fit. Also plotted is the expected SM signal scaled by a factor of 10. |

png pdf |
Figure 4-d:
Fits to the $m_{\ell ^+\ell ^-\gamma}$ data distribution in the untagged 1 (upper left), untagged 2 (upper right), untagged 3 (lower left), and untagged 4 (lower right) categories. The green and yellow bands represent the 68 and 95% CL uncertainties in the fit. The signal-plus-background fit shown as the solid red line. The dashed red line shows the background component of the fit. Also plotted is the expected SM signal scaled by a factor of 10. |
png pdf |
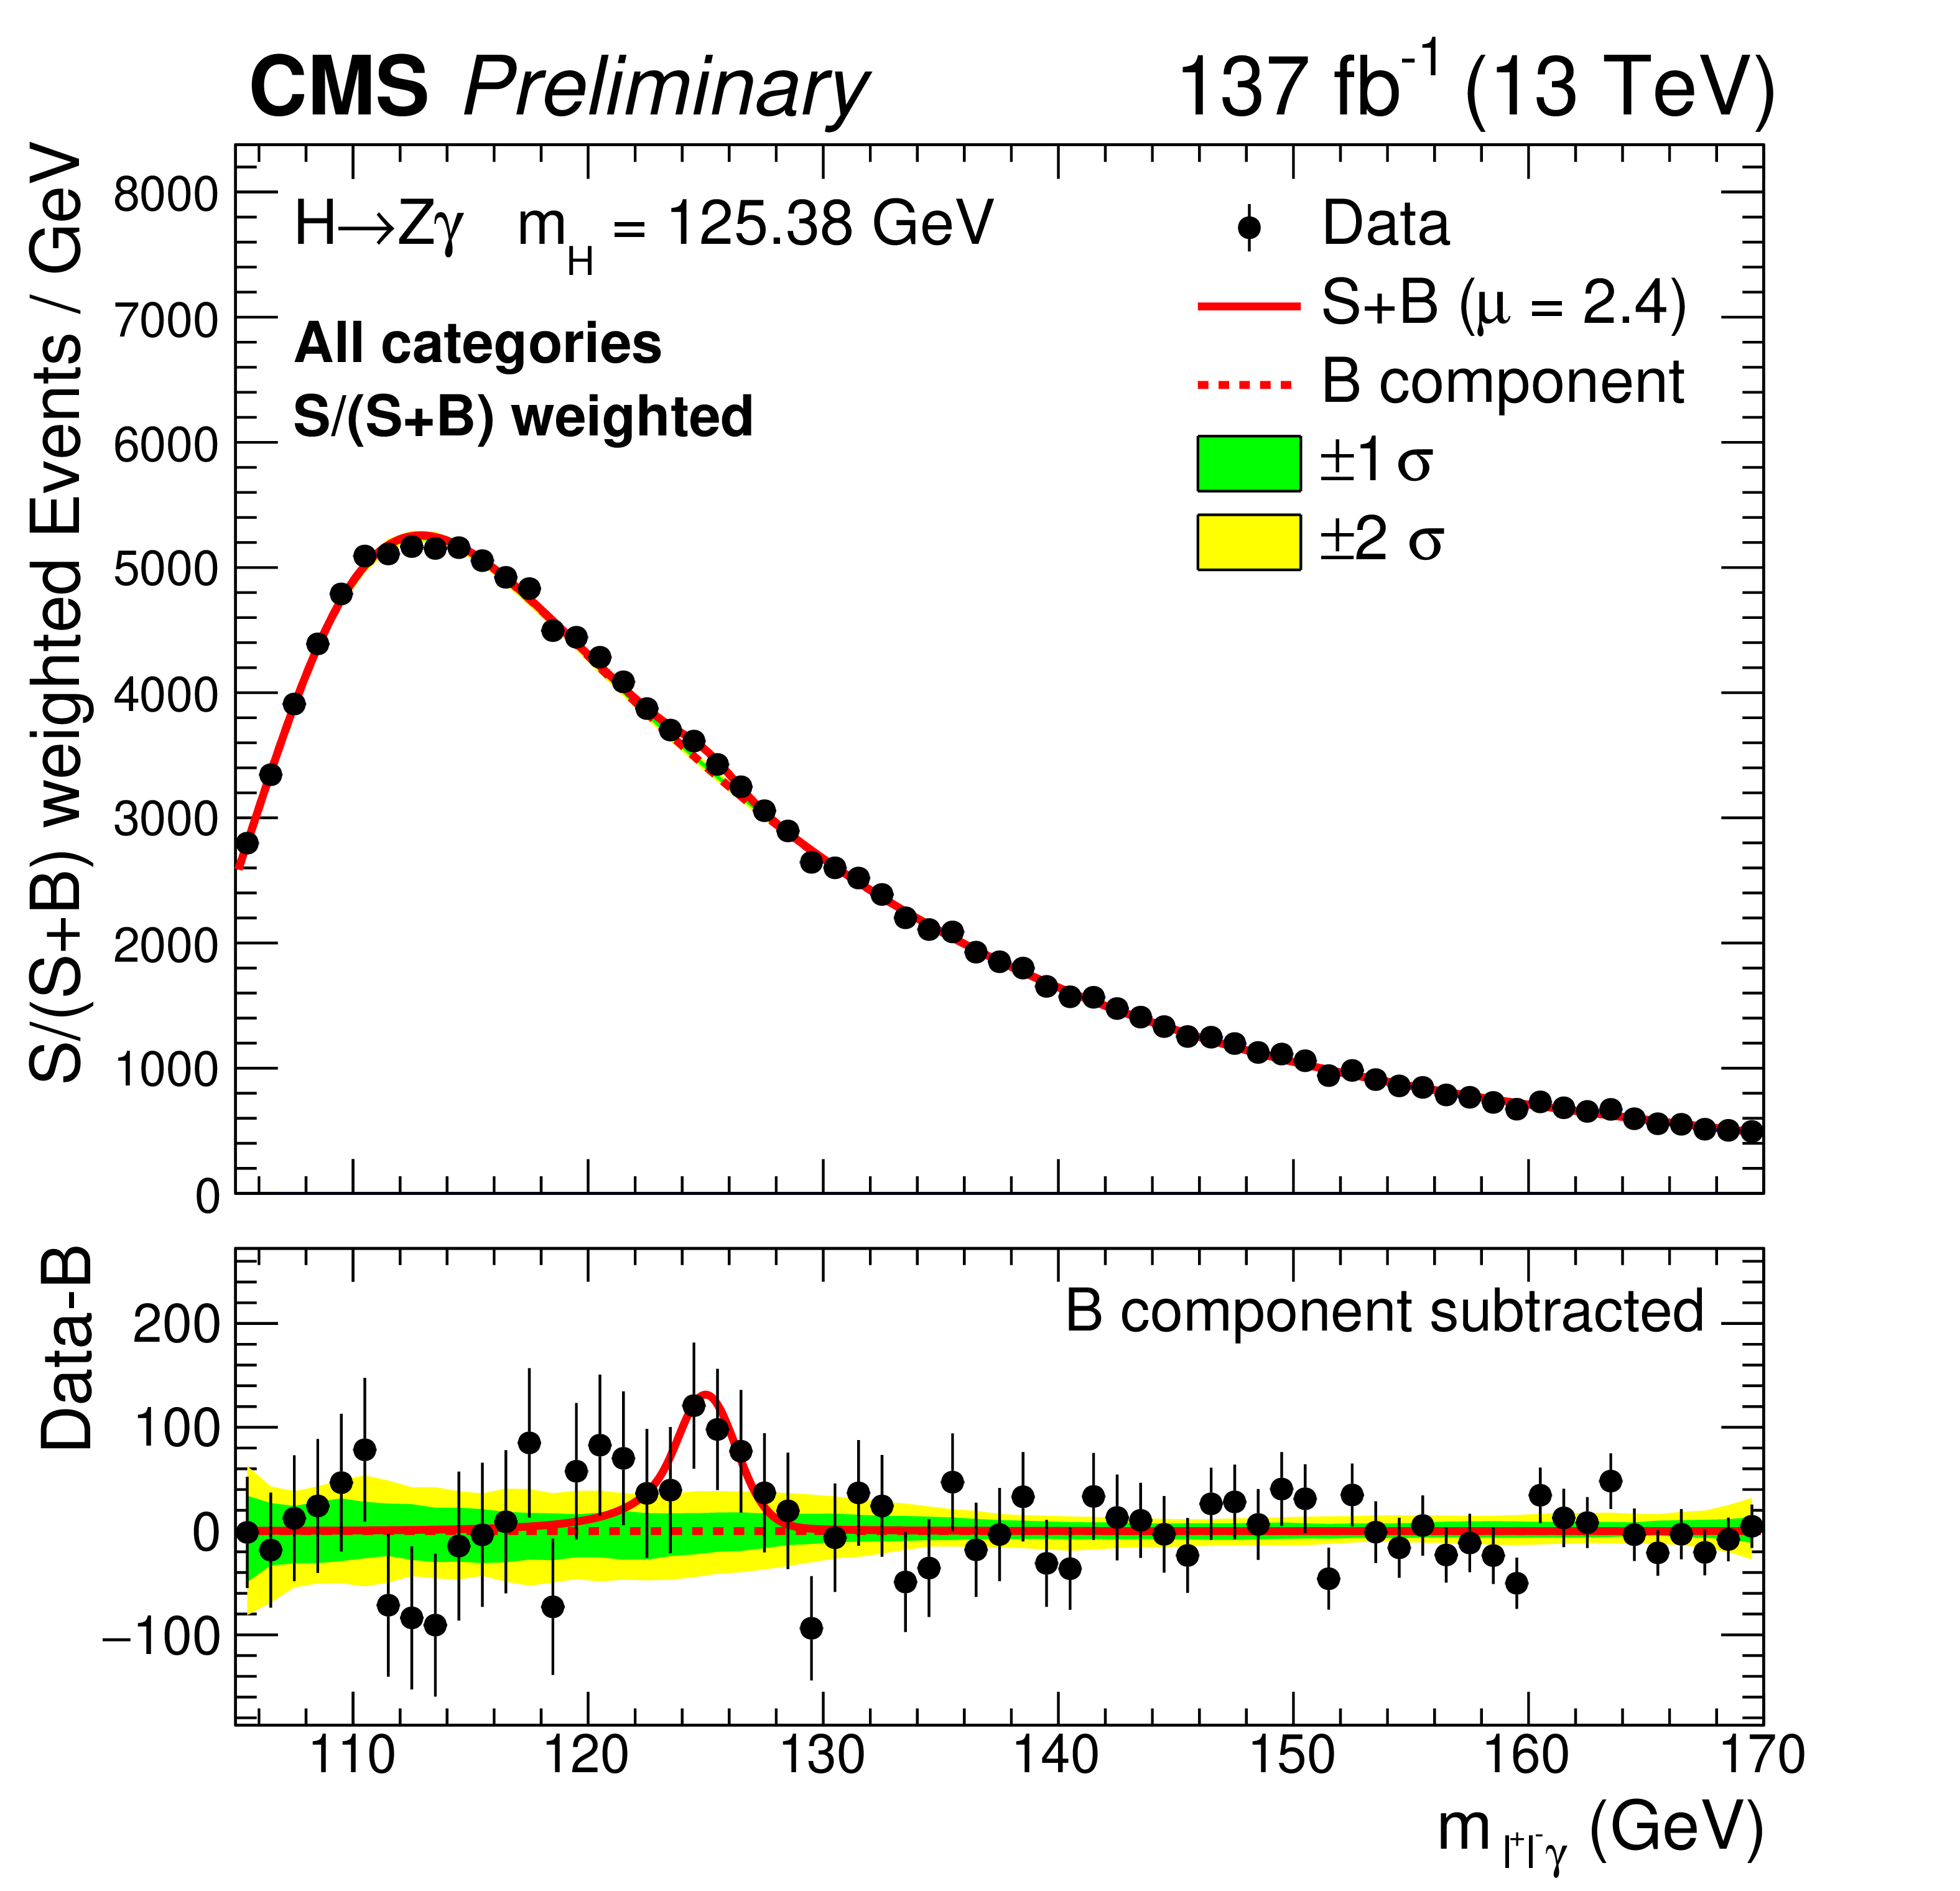
Figure 5:
Signal-plus-background fit to the $m_{\ell ^+\ell ^-\gamma}$ distribution in data for all categories, weighted by $S/(S+B)$, shown as the solid red line. The dashed red line shows the background component of the fit. Note that each category is fit separately, and the results are combined in the plot for easier visualization. The bottom panel shows the result with the background component subtracted. |
png pdf |
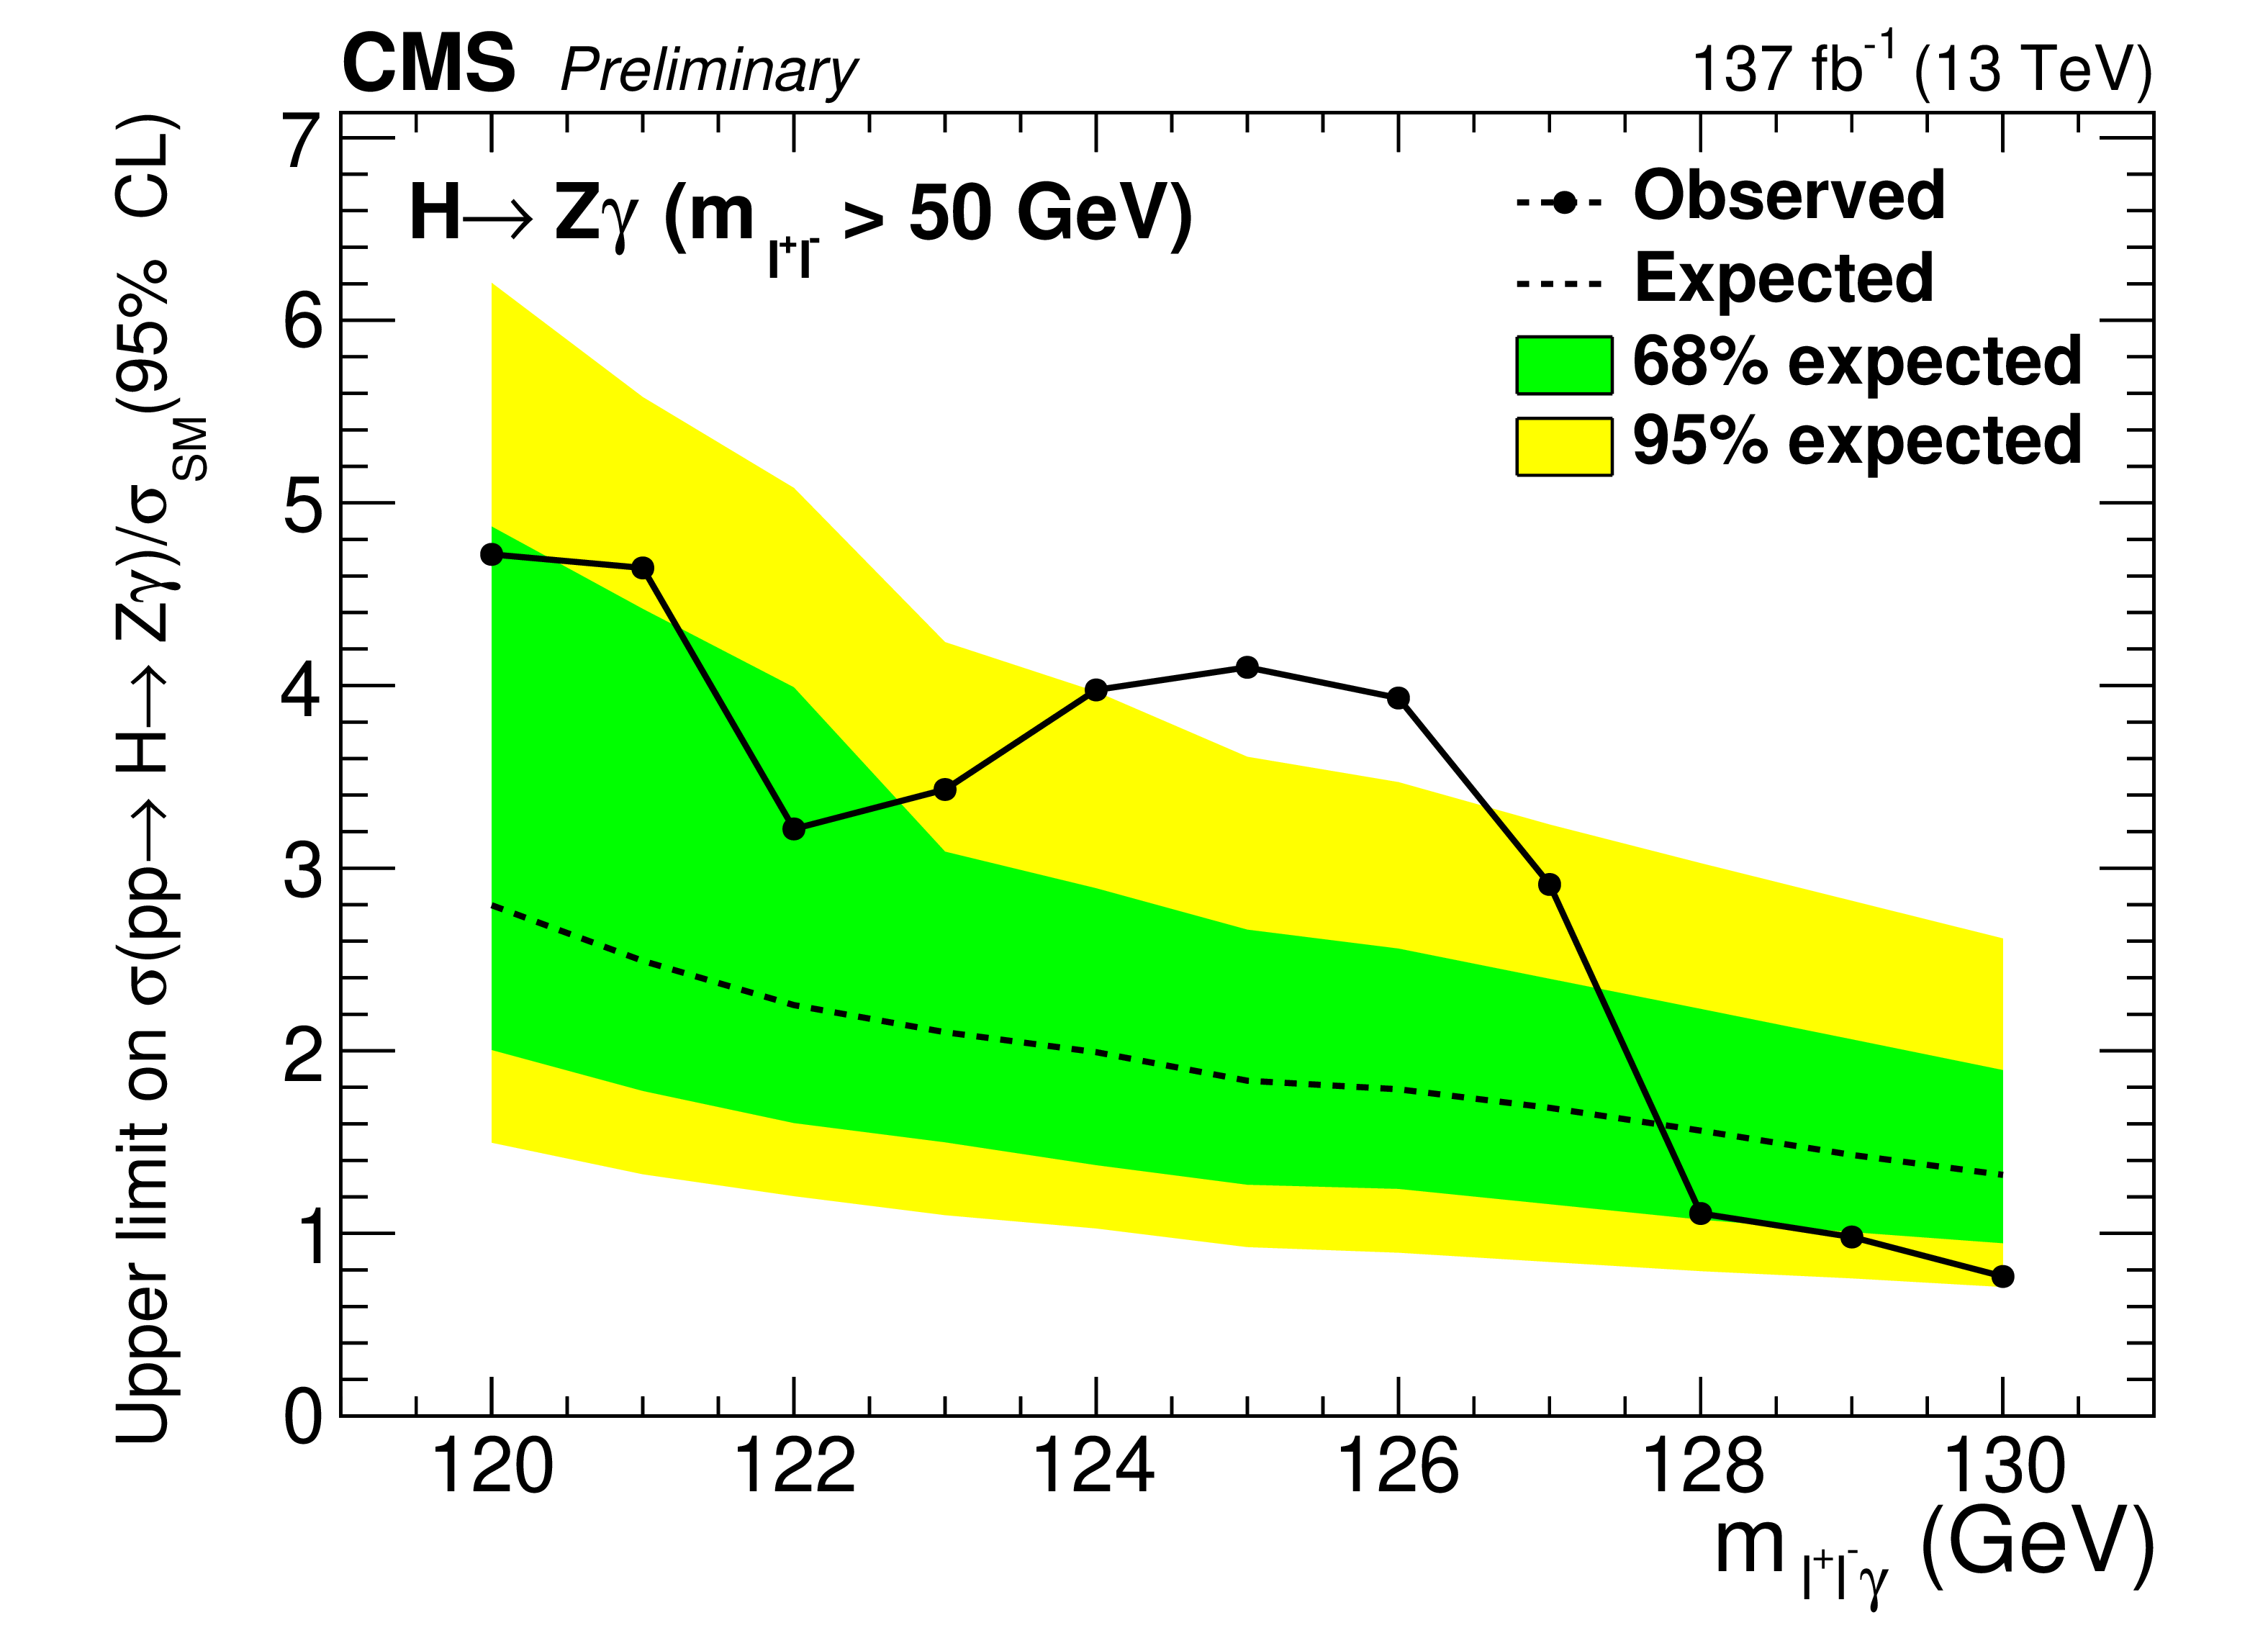
Figure 6:
Upper limit (95% CL) on $\sigma ({\mathrm{p}} {\mathrm{p}} \to \mathrm{H})\times \mathcal {B}(\mathrm{H} \to \mathrm{Z} \gamma)$ relative to the SM prediction, as a function of the assumed value of the Higgs boson mass used in the fit. |
png pdf |
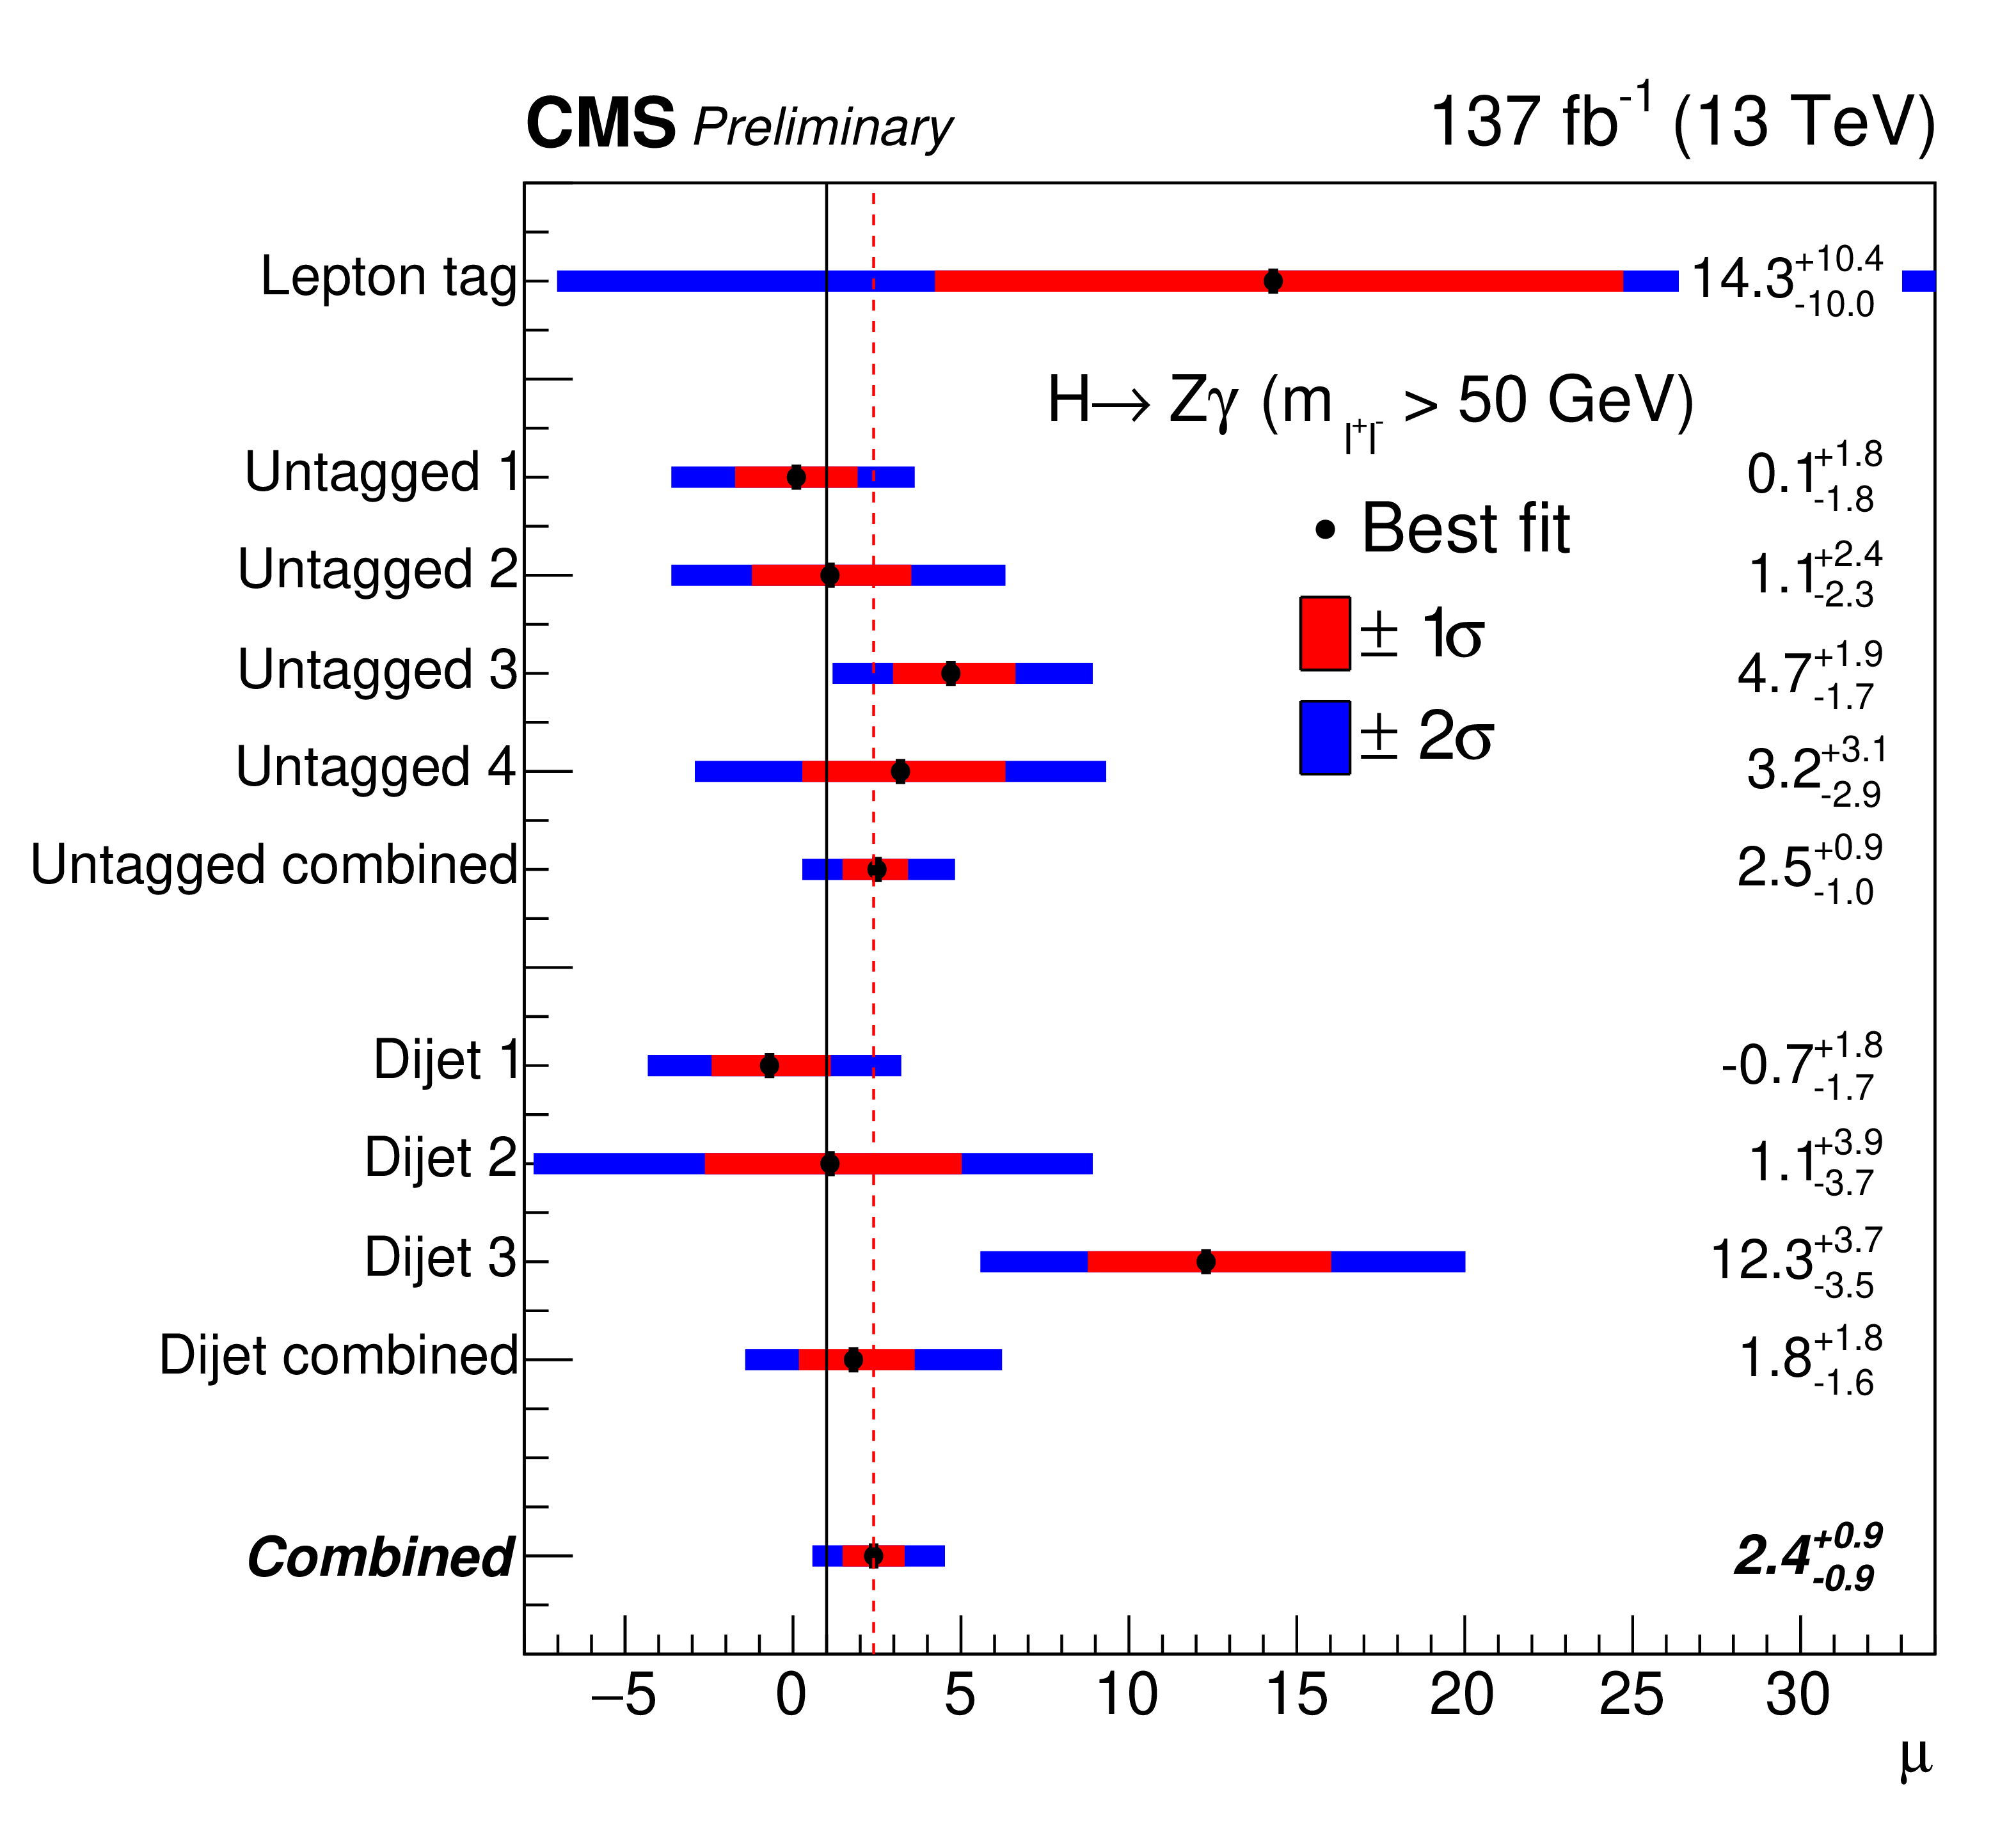
Figure 7:
Observed signal strength ($\mu $) for a SM Higgs boson with $m_{\ell ^+\ell ^-\gamma} = $ 125.38 GeV. The black solid line shows $\mu =$ 1, and the red dashed line shows the best fit value $\mu =$ 2.4 $\pm$ 0.9 of all categories combined. |
| Tables | |

png pdf |
Table 1:
Summary of the category definitions. Dijet categories are defined by regions of $\mathcal {D}_{\mathrm {VBF}}$ and untagged categories are defined by regions of $\mathcal {D}_{\mathrm {kin}}$. |
png pdf |
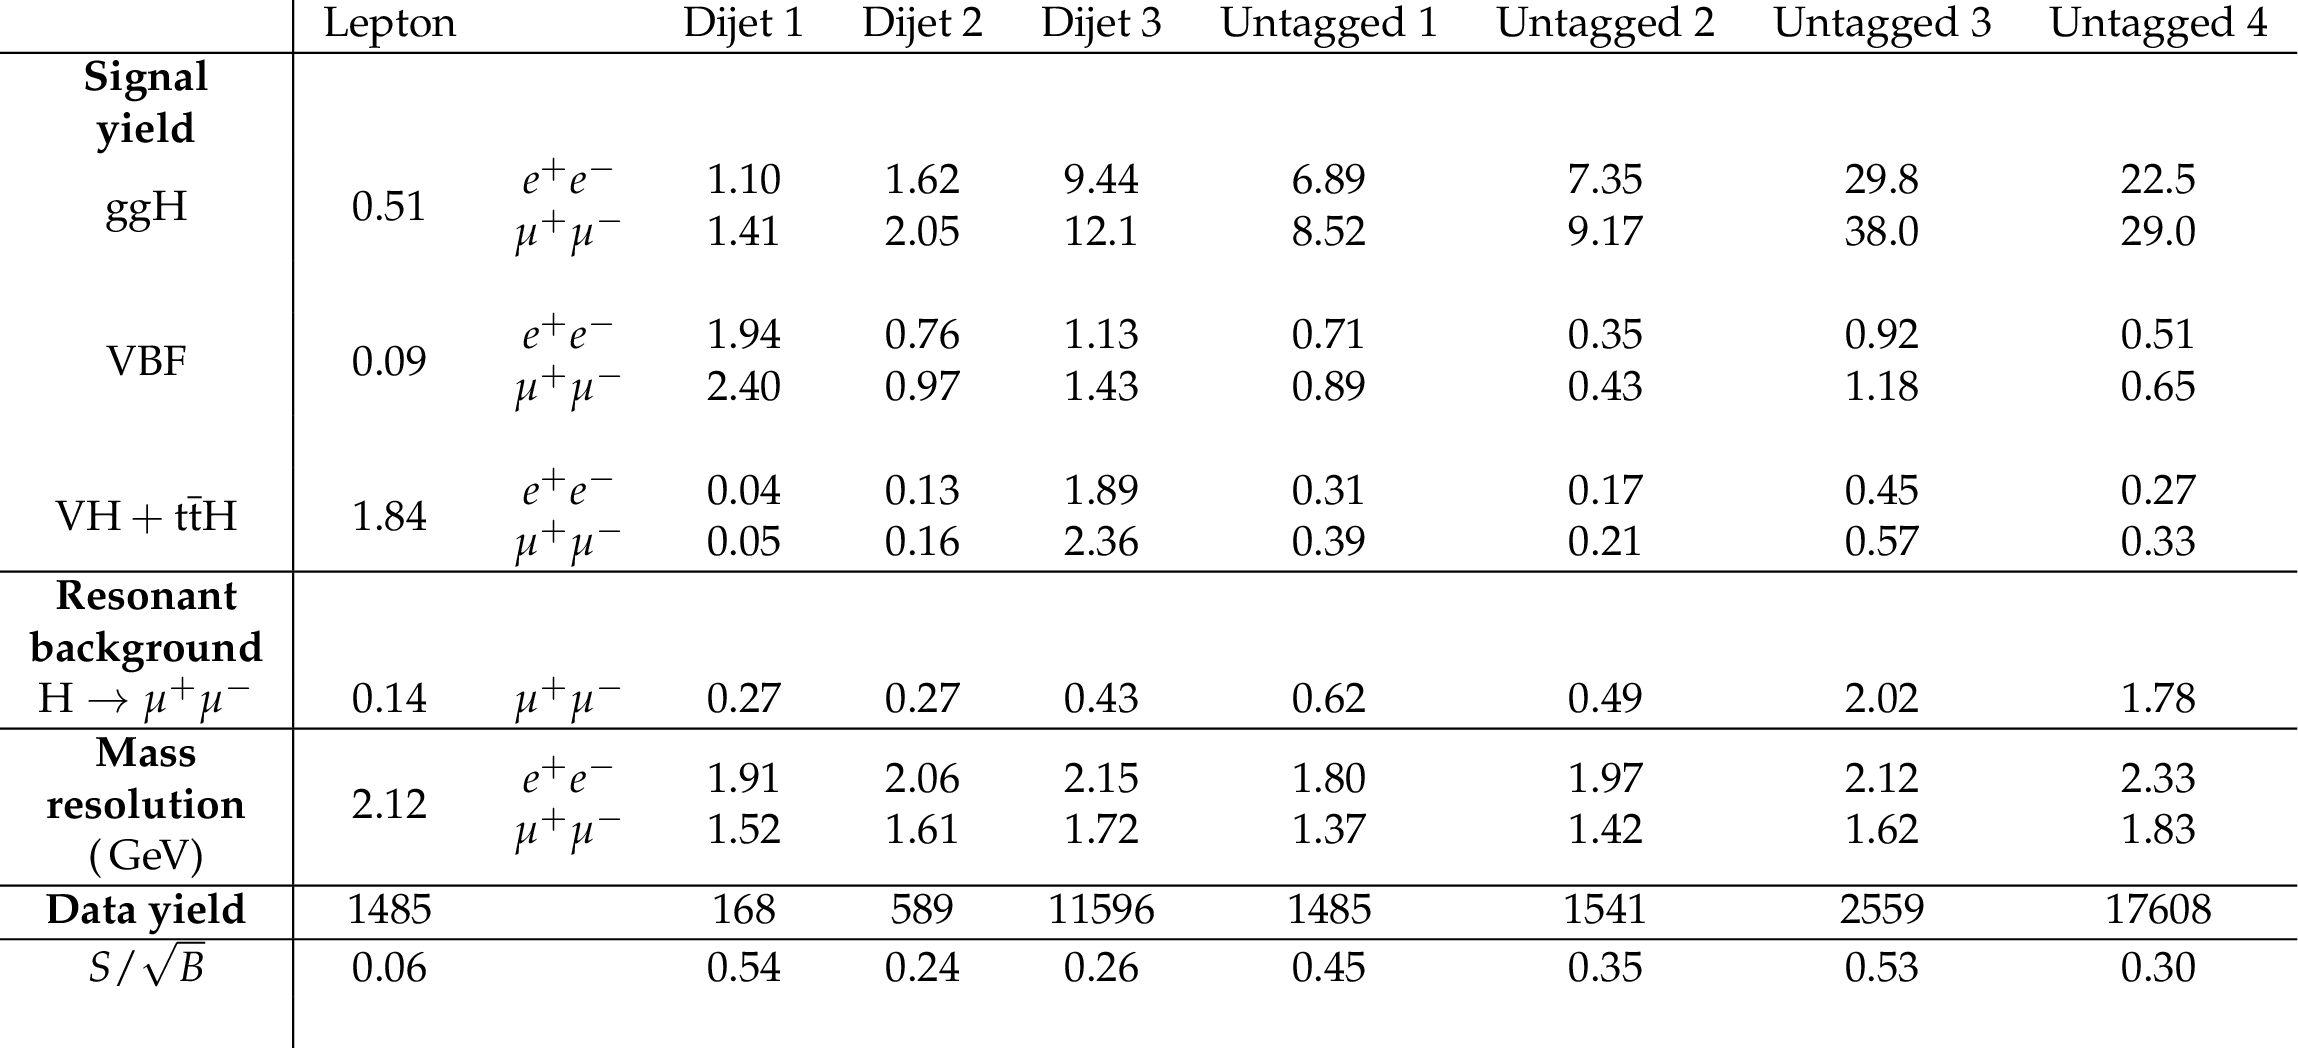
Table 2:
Yields and estimated significance ($S/\sqrt {B}$) for each category, where $S$ and $B$ are the expected number of signal and background events in the narrowest $m_{\ell ^+\ell ^-\gamma}$ interval containing 95% of the expected signal distribution. Also shown is the $m_{\ell ^{+}\ell ^{-}\gamma}$ resolution, computed using the narrowest interval containing 68% of the expected signal distribution. For rows with two values, the top value corresponds to the electron channel and the bottom value to the muon channel. |
| Summary |
| A search is performed for a SM Higgs boson decaying into a lepton pair and a photon with $m_{\ell^+\ell^-} > $ 50\, GeV. The main contribution to this final state is from Higgs boson decays to a $\mathrm{Z}$ boson and a photon ($\mathrm{H}\to\mathrm{Z}\gamma\to\ell^+\ell^-\gamma$, $\ell= $ e or $\mu$). The contributions from final-state radiation from Higgs boson decays into dimuons or ditaus are at the 6% level and below the 1% level respectively and are not included in the measured $\mathrm{H}\to\mathrm{Z}\gamma$ signal. The analysis is performed using a sample of pp collision data at $\sqrt{s}=$13 TeV, corresponding to an integrated luminosity of 137 fb$^{-1}$. The observed (expected) upper limit at 95% CL on the product of the cross section and the branching fraction, $\sigma({\mathrm{p}}{\mathrm{p}}\to\mathrm{H})\times\mathcal{B}(\mathrm{H}\to\mathrm{Z}\gamma)$, relative to the SM expectation, is 4.1 (1.8). This indicates an excess at $m_{\ell^+\ell^-\gamma}=$ 125.38 GeV, corresponding to a 2.7 standard deviations local significance under a background-only hypothesis. The best fit value of the signal strength is $\mu=$ 2.4 $\pm$ 0.9 $=$ 2.4$^{+0.8}_{-0.9}$ (stat) $^{+0.3}_{-0.2}$ (syst), corresponding to $\sigma({\mathrm{p}}{\mathrm{p}}\to\mathrm{H})\times\mathcal{B}(\mathrm{H}\to\mathrm{Z}\gamma)=$ 0.21 $\pm$ 0.08 pb. The measured value is 1.6 standard deviations higher than the SM prediction. In addition, a combined fit with the $\mathrm{H}\to\gamma\gamma$ analysis [12] is performed to measure the ratio $\mathcal{B}(\mathrm{H}\to\mathrm{Z}\gamma)/\mathcal{B}(\mathrm{H}\to\gamma\gamma)=$ 1.54$^{+0.65}_{-0.58}$, which is consistent with the predicted SM ratio $\mathcal{B}(\mathrm{H}\to\mathrm{Z}\gamma)/\mathcal{B}(\mathrm{H}\to\gamma\gamma)=$ 0.69 $\pm$ 0.04 at the 1.5 standard deviations level at $m_\mathrm{H}=$ 125.38 GeV. |
| References | ||||
| 1 | CMS Collaboration | Observation of a New Boson at a Mass of 125 GeV with the CMS Experiment at the LHC | PLB 716 (2012) 30 | CMS-HIG-12-028 1207.7235 |
| 2 | ATLAS Collaboration | Observation of a new particle in the search for the Standard Model Higgs boson with the ATLAS detector at the LHC | PLB 716 (2012) 1--29 | 1207.7214 |
| 3 | Particle Data Group Collaboration | Review of Particle Physics | PRD 98 (2018), no. 3, 030001 | |
| 4 | A. Abbasabadi, D. Bowser-Chao, D. A. Dicus, and W. W. Repko | Radiative Higgs boson decays $ \mathrm{H}\to ff\gamma $ | PRD 55 (1997) 5647 | hep-ph/9611209 |
| 5 | L. B. Chen, C. F. Qiao, and R. L. Zhu | Reconstructing the 125 GeV SM Higgs boson through $ \ell\bar{\ell}\gamma $ | PLB 726 (2013) 306 | 1211.6058 |
| 6 | Y. Sun, H. Chang, and D. Gao | Higgs decays to $ \gamma \ell^+\ell^- $ in the standard model | JHEP 05 (2013) 061 | 1303.2230 |
| 7 | G. Passarino | Higgs boson production and decay: Dalitz sector | PLB 727 (2013) 424 | 1308.0422 |
| 8 | J. M. Campbell, R. K. Ellis, W. T. Giele, and C. Williams | Finding the Higgs boson in decays to $ Z \gamma $ using the matrix element method at Next-to-Leading Order | PRD 87 (2013), no. 7, 073005 | 1301.7086 |
| 9 | G. Degrassi and M. Vitti | The effect of an anomalous Higgs trilinear self-coupling on the $ h \rightarrow \gamma Z $ decay | EPJC 80 (2020), no. 4, 307 | 1912.06429 |
| 10 | I. Low, J. Lykken, and G. Shaughnessy | Singlet scalars as Higgs imposters at the Large Hadron Collider | PRD 84 (2011) 035027 | 1105.4587 |
| 11 | LHC Higgs Cross Section Working Group Collaboration | Handbook of LHC Higgs Cross Sections: 4. Deciphering the Nature of the Higgs Sector | 1610.07922 | |
| 12 | CMS Collaboration | Measurements of Higgs boson production cross sections and couplings in the diphoton decay channel at $ \sqrt{\mathrm{s}} = $ 13 TeV | JHEP 07 (2021) 027 | CMS-HIG-19-015 2103.06956 |
| 13 | CMS Collaboration | A measurement of the Higgs boson mass in the diphoton decay channel | PLB 805 (2020) 135425 | CMS-HIG-19-004 2002.06398 |
| 14 | A. Djouadi, V. Driesen, W. Hollik, and A. Kraft | The Higgs photon - Z boson coupling revisited | EPJC 1 (1998) 163 | hep-ph/9701342 |
| 15 | C.-W. Chiang and K. Yagyu | Higgs boson decays to $ \gamma \gamma $ and Z$ \gamma $ in models with Higgs extensions | PRD 87 (2013), no. 3, 033003 | 1207.1065 |
| 16 | M. Carena, I. Low, and C. E. M. Wagner | Implications of a Modified Higgs to Diphoton Decay Width | JHEP 08 (2012) 060 | 1206.1082 |
| 17 | C.-S. Chen, C.-Q. Geng, D. Huang, and L.-H. Tsai | New Scalar Contributions to $ h\to Z\gamma $ | PRD 87 (2013) 075019 | 1301.4694 |
| 18 | ATLAS Collaboration | Search for Higgs boson decays to a photon and a Z boson in pp collisions at $ \sqrt{s} = $ 7 and 8 TeV with the ATLAS detector | PLB 732 (2014) 8 | 1402.3051 |
| 19 | CMS Collaboration | Search for a Higgs boson decaying into a Z and a photon in pp collisions at $ \sqrt{s} = $ 7 and 8 TeV | PLB 726 (2013) 587 | CMS-HIG-13-006 1307.5515 |
| 20 | CMS Collaboration | Search for the decay of a Higgs boson in the $ \ell\ell\gamma $ channel in proton-proton collisions at $ \sqrt{s} = $ 13 TeV | JHEP 11 (2018) 152 | CMS-HIG-17-007 1806.05996 |
| 21 | ATLAS Collaboration | A search for the $ Z\gamma $ decay mode of the Higgs boson in $ pp $ collisions at $ \sqrt{s} = $ 13 TeV with the ATLAS detector | PLB 809 (2020) 135754 | 2005.05382 |
| 22 | CMS Collaboration | Search for a Higgs boson decaying into $ \gamma^* \gamma \to \ell \ell \gamma $ with low dilepton mass in pp collisions at $ \sqrt s = $ 8 TeV | PLB 753 (2016) 341 | CMS-HIG-14-003 1507.03031 |
| 23 | ATLAS Collaboration | Evidence for Higgs boson decays to a low-mass dilepton system and a photon in pp collisions at s=13 TeV with the ATLAS detector | PLB 819 (2021) 136412 | 2103.10322 |
| 24 | CMS Collaboration | The CMS Experiment at the CERN LHC | JINST 3 (2008) S08004 | CMS-00-001 |
| 25 | S. Alioli, P. Nason, C. Oleari, and E. Re | NLO Higgs boson production via gluon fusion matched with shower in POWHEG | JHEP 04 (2009) 002 | 0812.0578 |
| 26 | P. Nason and C. Oleari | NLO Higgs boson production via vector-boson fusion matched with shower in POWHEG | JHEP 02 (2010) 037 | 0911.5299 |
| 27 | CMS Collaboration | Event generator tunes obtained from underlying event and multiparton scattering measurements | EPJC 76 (2016) 155 | CMS-GEN-14-001 1512.00815 |
| 28 | CMS Collaboration | Extraction and validation of a new set of CMS PYTHIA8 tunes from underlying-event measurements | EPJC 80 (2020), no. 1, 4 | CMS-GEN-17-001 1903.12179 |
| 29 | NNPDF Collaboration | Parton distributions for the LHC run II | JHEP 04 (2015) 040 | 1410.8849 |
| 30 | NNPDF Collaboration | Parton distributions from high-precision collider data | EPJC 77 (2017) 663 | 1706.00428 |
| 31 | J. Alwall et al. | The automated computation of tree-level and next-to-leading order differential cross sections, and their matching to parton shower simulations | JHEP 07 (2014) 079 | 1405.0301 |
| 32 | S. Frixione, P. Nason, and G. Ridolfi | A Positive-weight next-to-leading-order Monte Carlo for heavy flavour hadroproduction | JHEP 09 (2007) 126 | 0707.3088 |
| 33 | C. Anastasiou et al. | High precision determination of the gluon fusion Higgs boson cross-section at the LHC | JHEP 05 (2016) 058 | 1602.00695 |
| 34 | M. Cacciari et al. | Fully Differential Vector-Boson-Fusion Higgs Production at Next-to-Next-to-Leading Order | PRL 115 (2015), no. 8, 082002 | 1506.02660 |
| 35 | O. Brein, A. Djouadi, and R. Harlander | NNLO QCD corrections to the Higgs-strahlung processes at hadron colliders | PLB 579 (2004) 149 | hep-ph/0307206 |
| 36 | S. Dawson et al. | Associated Higgs production with top quarks at the large hadron collider: NLO QCD corrections | PRD 68 (2003) 034022 | hep-ph/0305087 |
| 37 | T. Sjostrand, S. Mrenna, and P. Z. Skands | A brief introduction to PYTHIA 8.1 | CPC 178 (2008) 852 | 0710.3820 |
| 38 | T. Sjostrand et al. | An introduction to PYTHIA 8.2 | CPC 191 (2015) 159 | 1410.3012 |
| 39 | CMS Collaboration | Particle-flow reconstruction and global event description with the CMS detector | JINST 12 (2017) P10003 | CMS-PRF-14-001 1706.04965 |
| 40 | CMS Collaboration | Performance of photon reconstruction and identification with the CMS detector in proton-proton collisions at $ \sqrt{s} = $ 8 TeV | JINST 10 (2015) P08010 | CMS-EGM-14-001 1502.02702 |
| 41 | M. Cacciari, G. P. Salam, and G. Soyez | The anti-$ k_t $ jet clustering algorithm | JHEP 04 (2008) 063 | 0802.1189 |
| 42 | M. Cacciari, G. P. Salam, and G. Soyez | FastJet user manual | EPJC 72 (2012) 1896 | 1111.6097 |
| 43 | CMS Collaboration | Jet energy scale and resolution in the CMS experiment in pp collisions at 8 TeV | JINST 12 (2017) P02014 | CMS-JME-13-004 1607.03663 |
| 44 | CMS Collaboration | The CMS trigger system | JINST 12 (2017) P01020 | CMS-TRG-12-001 1609.02366 |
| 45 | CMS Collaboration | Measurement of the inclusive $ W $ and $ Z $ production cross sections in $ pp $ collisions at $ \sqrt{s}= $ 7 TeV | JHEP 10 (2011) 132 | CMS-EWK-10-005 1107.4789 |
| 46 | CMS Collaboration | Measurements of properties of the Higgs boson decaying into the four-lepton final state in pp collisions at $ \sqrt{s}= $ 13 TeV | JHEP 11 (2017) 047 | CMS-HIG-16-041 1706.09936 |
| 47 | CMS Collaboration | Pileup mitigation at CMS in 13 TeV data | JINST 15 (2020), no. 09, P09018 | CMS-JME-18-001 2003.00503 |
| 48 | CMS Collaboration | CMS Electron and Photon Performance at 13 TeV | J. Phys. Conf. Ser. 1162 (2019), no. 1, 012008 | |
| 49 | Particle Data Group Collaboration | Review of Particle Physics | CPC 40 (2016), no. 10, 100001 | |
| 50 | D. L. Rainwater, R. Szalapski, and D. Zeppenfeld | Probing color singlet exchange in $ z $ + two jet events at the CERN LHC | PRD 54 (1996) 6680 | hep-ph/9605444 |
| 51 | OPAL Collaboration | Search for anomalous production of dilepton events with missing transverse momentum in e+ e- collisions at s**(1/2) = 161-GeV and 172-GeV | EPJC 4 (1998) 47 | hep-ex/9710010 |
| 52 | M. Vesterinen and T. R. Wyatt | A Novel Technique for Studying the Z Boson Transverse Momentum Distribution at Hadron Colliders | NIMA 602 (2009) 432 | 0807.4956 |
| 53 | J. S. Gainer, W.-Y. Keung, I. Low, and P. Schwaller | Looking for a light Higgs boson in the $ Z \gamma \to \ell \ell \gamma $ channel | PRD 86 (2012) 033010 | 1112.1405 |
| 54 | J. S. Gainer, K. Kumar, I. Low, and R. Vega-Morales | Improving the sensitivity of Higgs boson searches in the golden channel | JHEP 11 (2011) 027 | 1108.2274 |
| 55 | M. J. Oreglia | A study of the reactions $\psi' \to \gamma\gamma \psi$ | PhD thesis, Stanford University, 1980 SLAC Report SLAC-R-236, see Appendix D | |
| 56 | P. D. Dauncey, M. Kenzie, N. Wardle, and G. J. Davies | Handling uncertainties in background shapes | JINST 10 (2015), no. 04, P04015 | 1408.6865 |
| 57 | R. A. Fisher | On the Mathematical Foundations of Theoretical Statistics | Phil. Trans. Roy. Soc. Lond. A222 (1922) 309--368 | |
| 58 | A. L. Read | Presentation of search results: The CL$ _{s} $ technique | JPG 28 (2002) 2693 | |
| 59 | T. Junk | Confidence level computation for combining searches with small statistics | NIMA 434 (1999) 435 | hep-ex/9902006 |
| 60 | ATLAS and CMS Collaborations, The LHC Higgs combination group | Procedure for the LHC Higgs boson search combination in summer 2011 | CMS-NOTE-2011-005 | |
| 61 | G. Cowan, K. Cranmer, E. Gross, and O. Vitells | Asymptotic formulae for likelihood-based tests of new physics | EPJC 71 (2011) 1554 | 1007.1727 |
| 62 | A. D. Martin, W. J. Stirling, R. S. Thorne, and G. Watt | Parton distributions for the LHC | EPJC 63 (2009) 189 | 0901.0002 |
| 63 | H. Lai et al. | New parton distributions for collider physics | PRD 82 (2010) 74024 | 1007.2241 |
| 64 | J. Butterworth et al. | PDF4LHC recommendations for LHC run II | JPG 43 (2016) 023001 | 1510.03865 |
| 65 | CMS Collaboration | Precision luminosity measurement in proton-proton collisions at $ \sqrt{s} = $ 13 TeV in 2015 and 2016 at CMS | EPJC 81 (2021) 800 | CMS-LUM-17-003 2104.01927 |
| 66 | CMS Collaboration | CMS luminosity measurements for the 2016 data taking period | CMS-PAS-LUM-17-001 | CMS-PAS-LUM-17-001 |
| 67 | CMS Collaboration | CMS luminosity measurement for the 2017 data-taking period at $ \sqrt{s}= $ 13 TeV | CMS-PAS-LUM-17-004 | CMS-PAS-LUM-17-004 |
| 68 | CMS Collaboration | CMS luminosity measurement for the 2018 data-taking period at $ \sqrt{s}= $ 13 TeV | CMS-PAS-LUM-18-002 | CMS-PAS-LUM-18-002 |
| 69 | CMS Collaboration | Performance of the CMS Level-1 trigger in proton-proton collisions at $ \sqrt{s} = $ 13 TeV | JINST 15 (2020), no. 10, P10017 | CMS-TRG-17-001 2006.10165 |
| 70 | CMS Collaboration | Measurement of the inelastic proton-proton cross section at $ \sqrt{s}= $ 13 TeV | JHEP 07 (2018) 161 | CMS-FSQ-15-005 1802.02613 |
|
|
Compact Muon Solenoid LHC, CERN |
|

|

|

|

|

|