

Compact Muon Solenoid
LHC, CERN
| CMS-PAS-HIG-18-027 | ||
| A deep neural network for simultaneous estimation of b quark energy and resolution | ||
| CMS Collaboration | ||
| September 2019 | ||
| Abstract: We describe a method to obtain point and dispersion estimates for the energy of jets arising from bottom quarks (b jets) in proton-proton (pp) collisions at the CERN LHC. The algorithm is trained using a large simulated sample of b jets produced in pp collisions recorded at an energy of $\sqrt{s}= $ 13 TeV and validated on data recorded by the CMS detector in 2017 with an integrated luminosity of 41 fb$^{-1}$. A multivariate regression estimator employing jet composition and structure information and the properties of the associated reconstructed secondary vertices is implemented using a deep feed-forward neural network. The results of the algorithm are used to improve the experimental sensitivity of analyses that make use of b jets in the final state, such as the recently published observation of the Higgs boson decay to a bottom quark-antiquark pair. | ||
|
Links:
CDS record (PDF) ;
CADI line (restricted) ;
These preliminary results are superseded in this paper, CSBS 4 (2020) 10. The superseded preliminary plots can be found here. |
||
| Figures | |
png pdf |
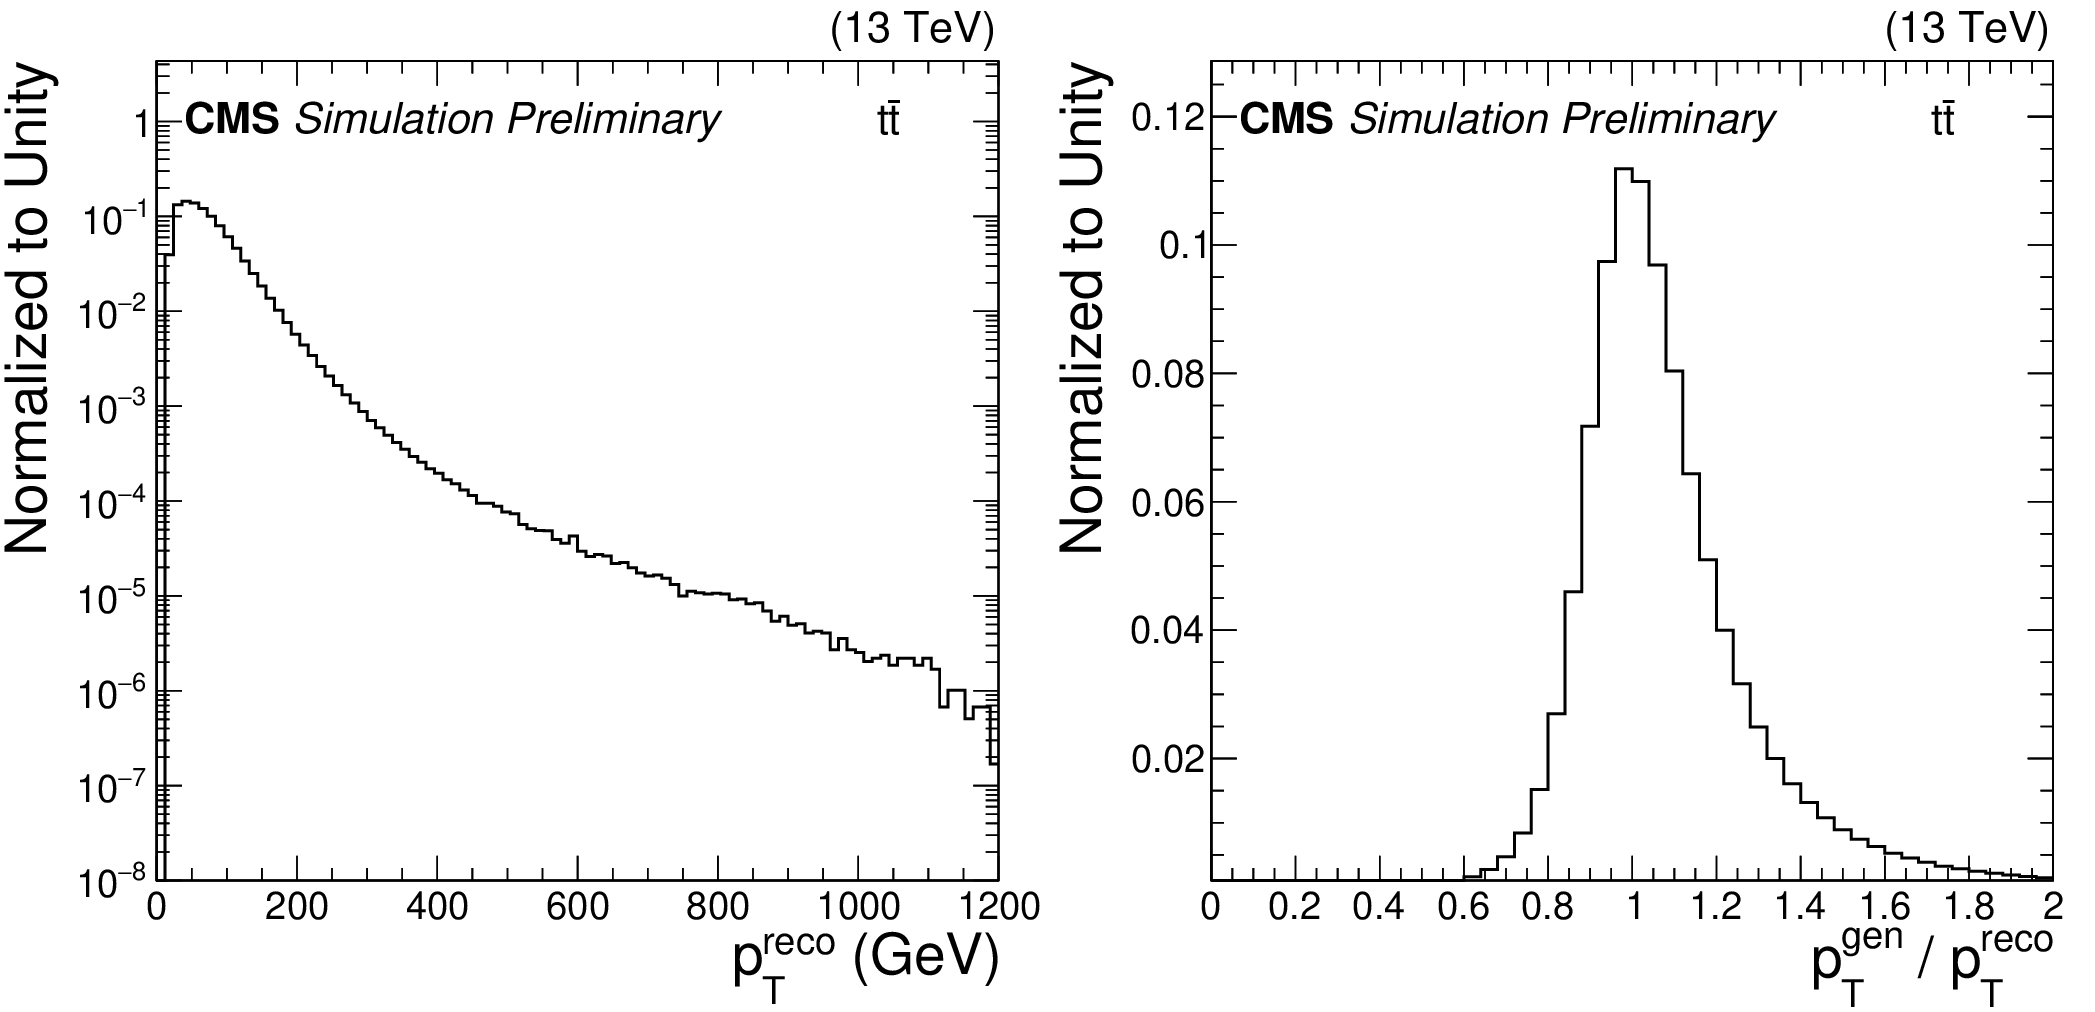
Figure 1:
(left) The $ {p_\text {T}}^{\text {reco}}$ distribution for reconstructed b jets in an MC ${\mathrm{t} \mathrm{\bar{t}}}$ sample. (right) Distribution of the regression target for the MC ${\mathrm{t} \mathrm{\bar{t}}}$ training sample. |

png pdf |
Figure 1-a:
The $ {p_\text {T}}^{\text {reco}}$ distribution for reconstructed b jets in an MC ${\mathrm{t} \mathrm{\bar{t}}}$ sample. |
png pdf |
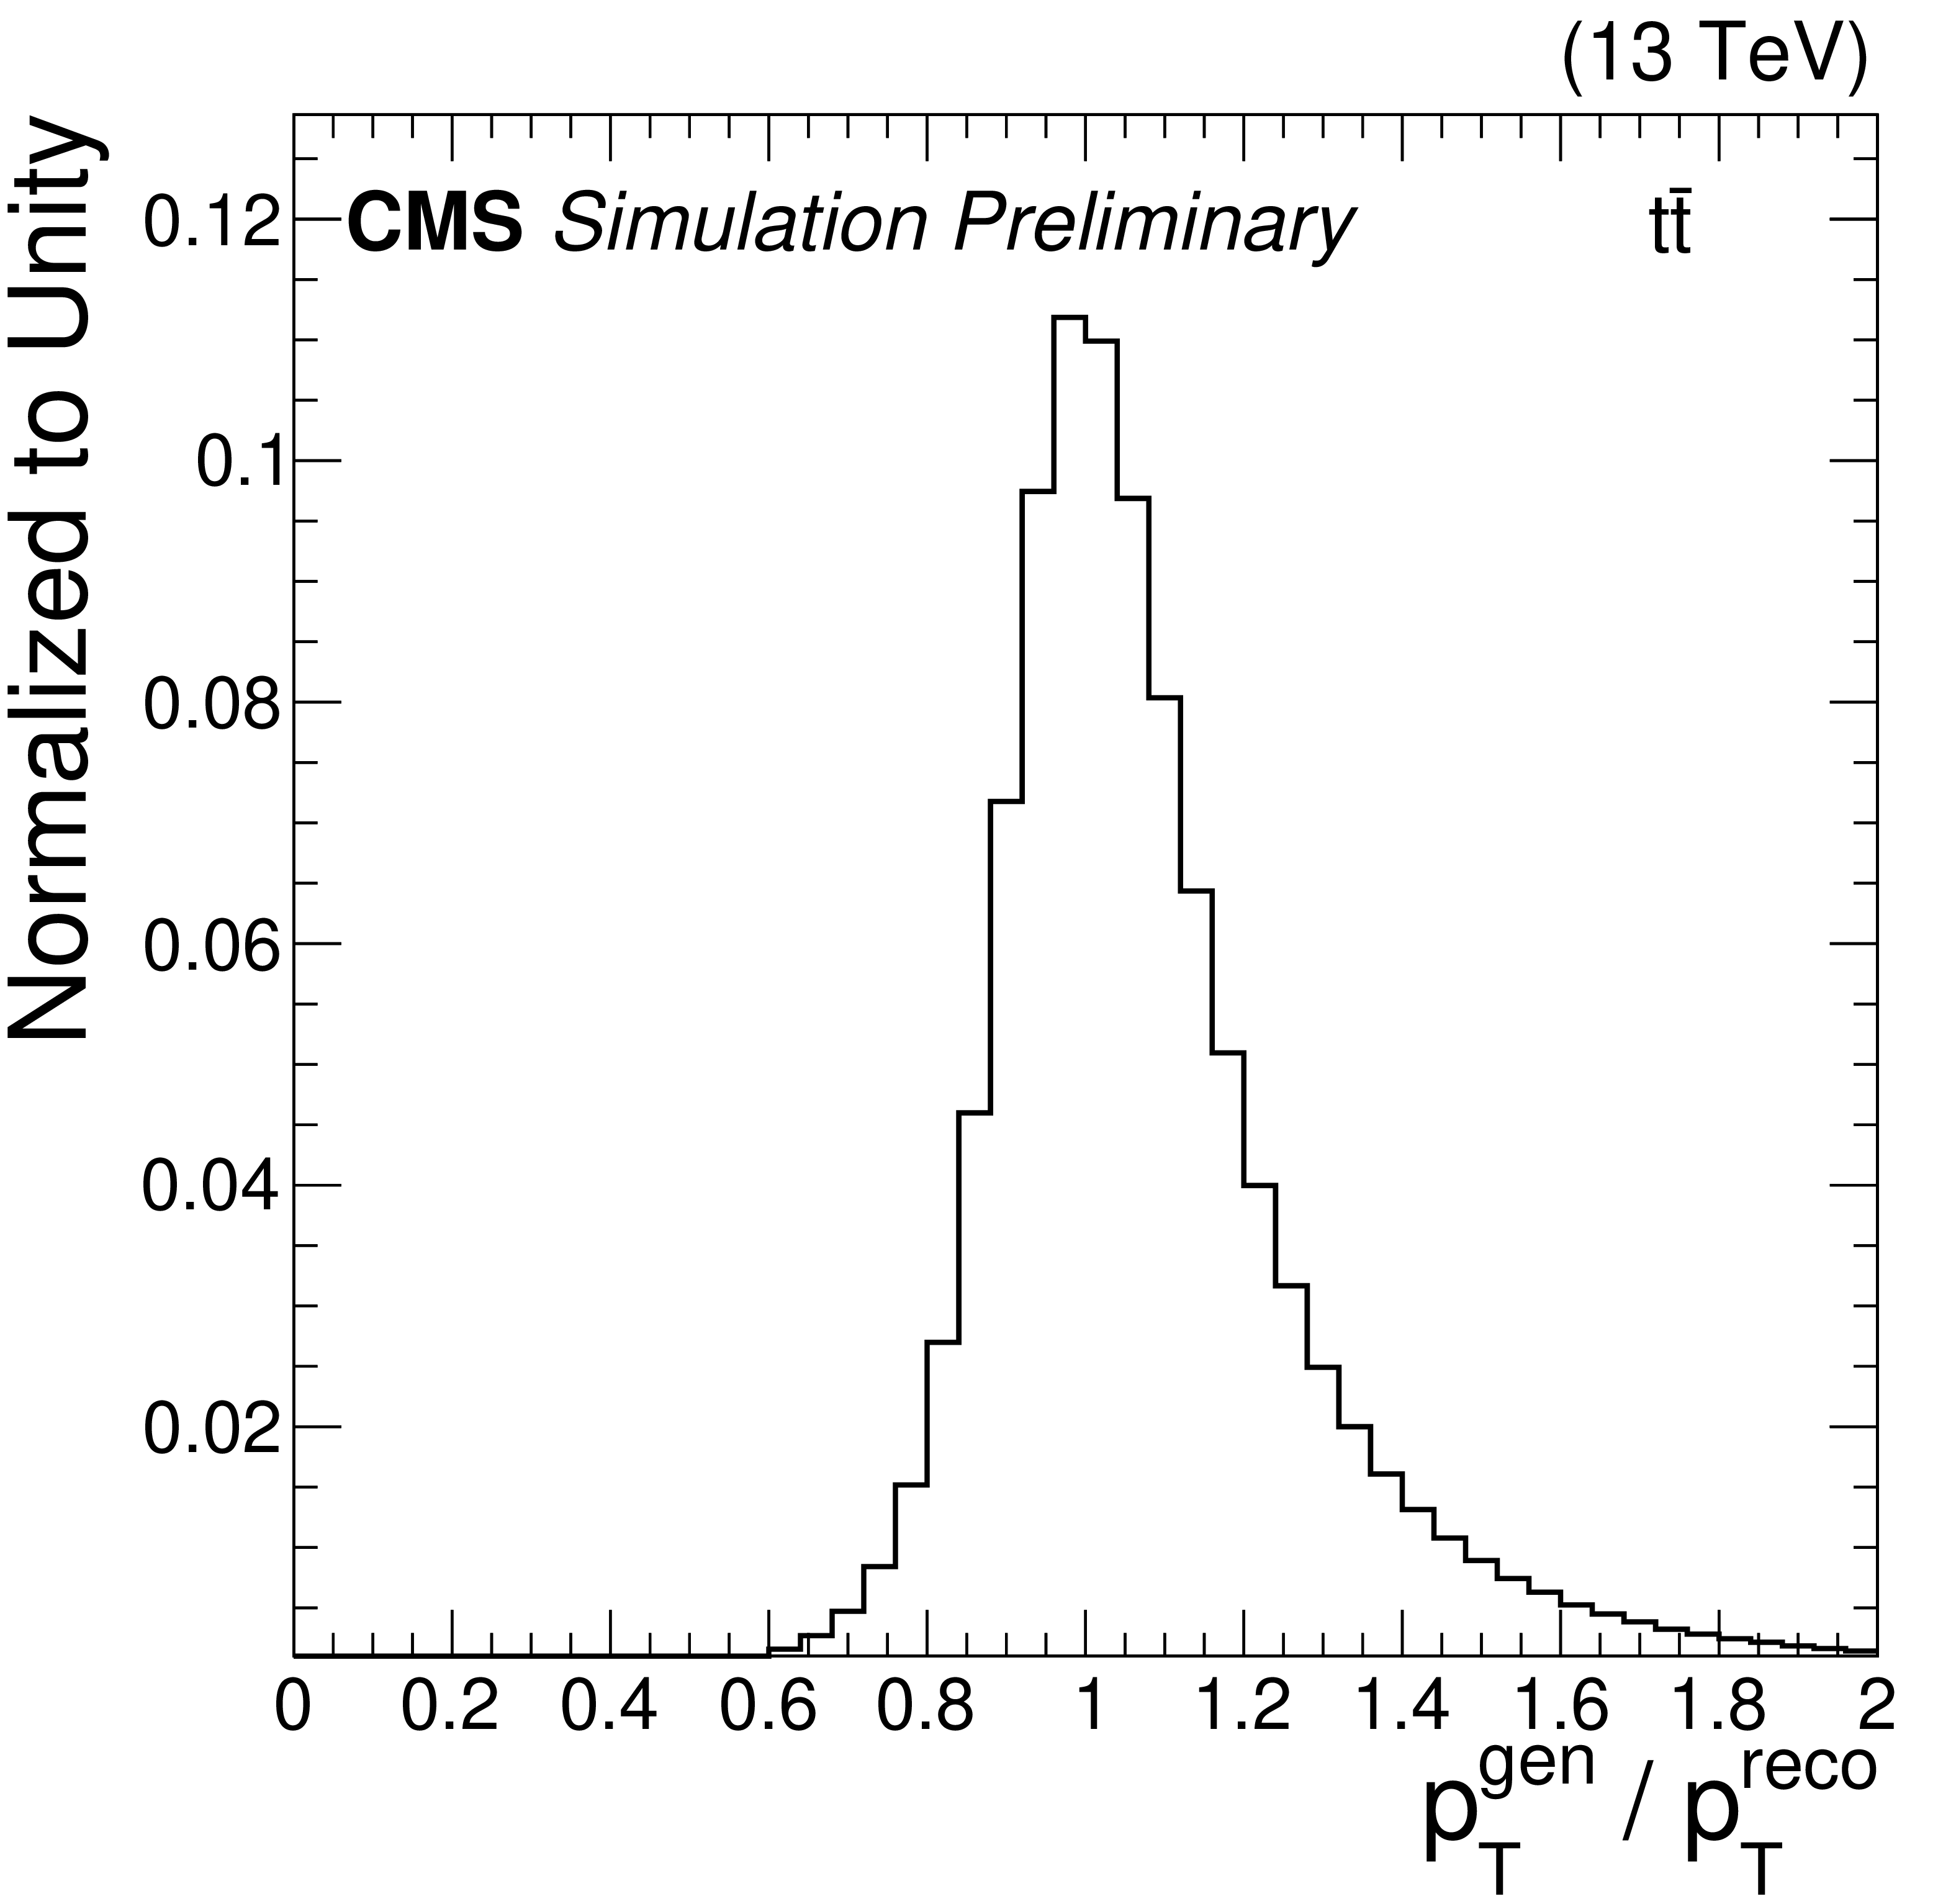
Figure 1-b:
Distribution of the regression target for the MC ${\mathrm{t} \mathrm{\bar{t}}}$ training sample. |
png pdf |
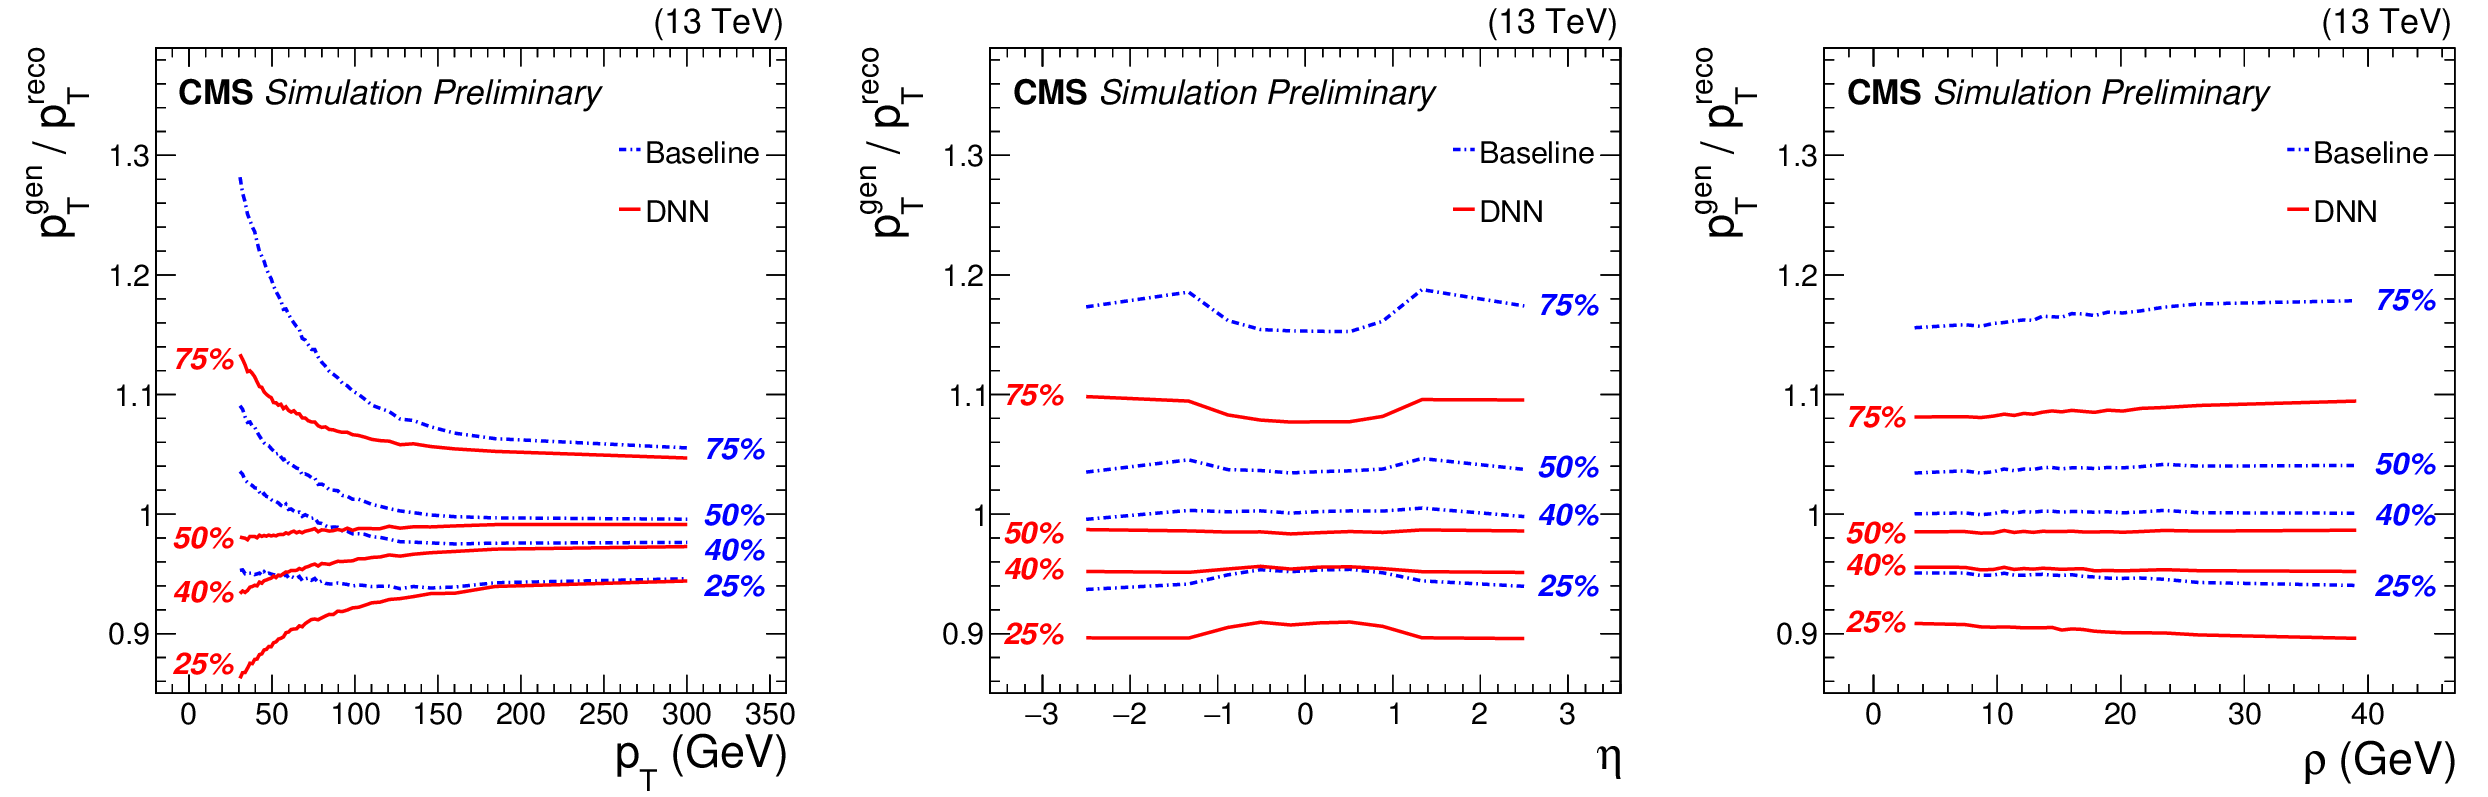
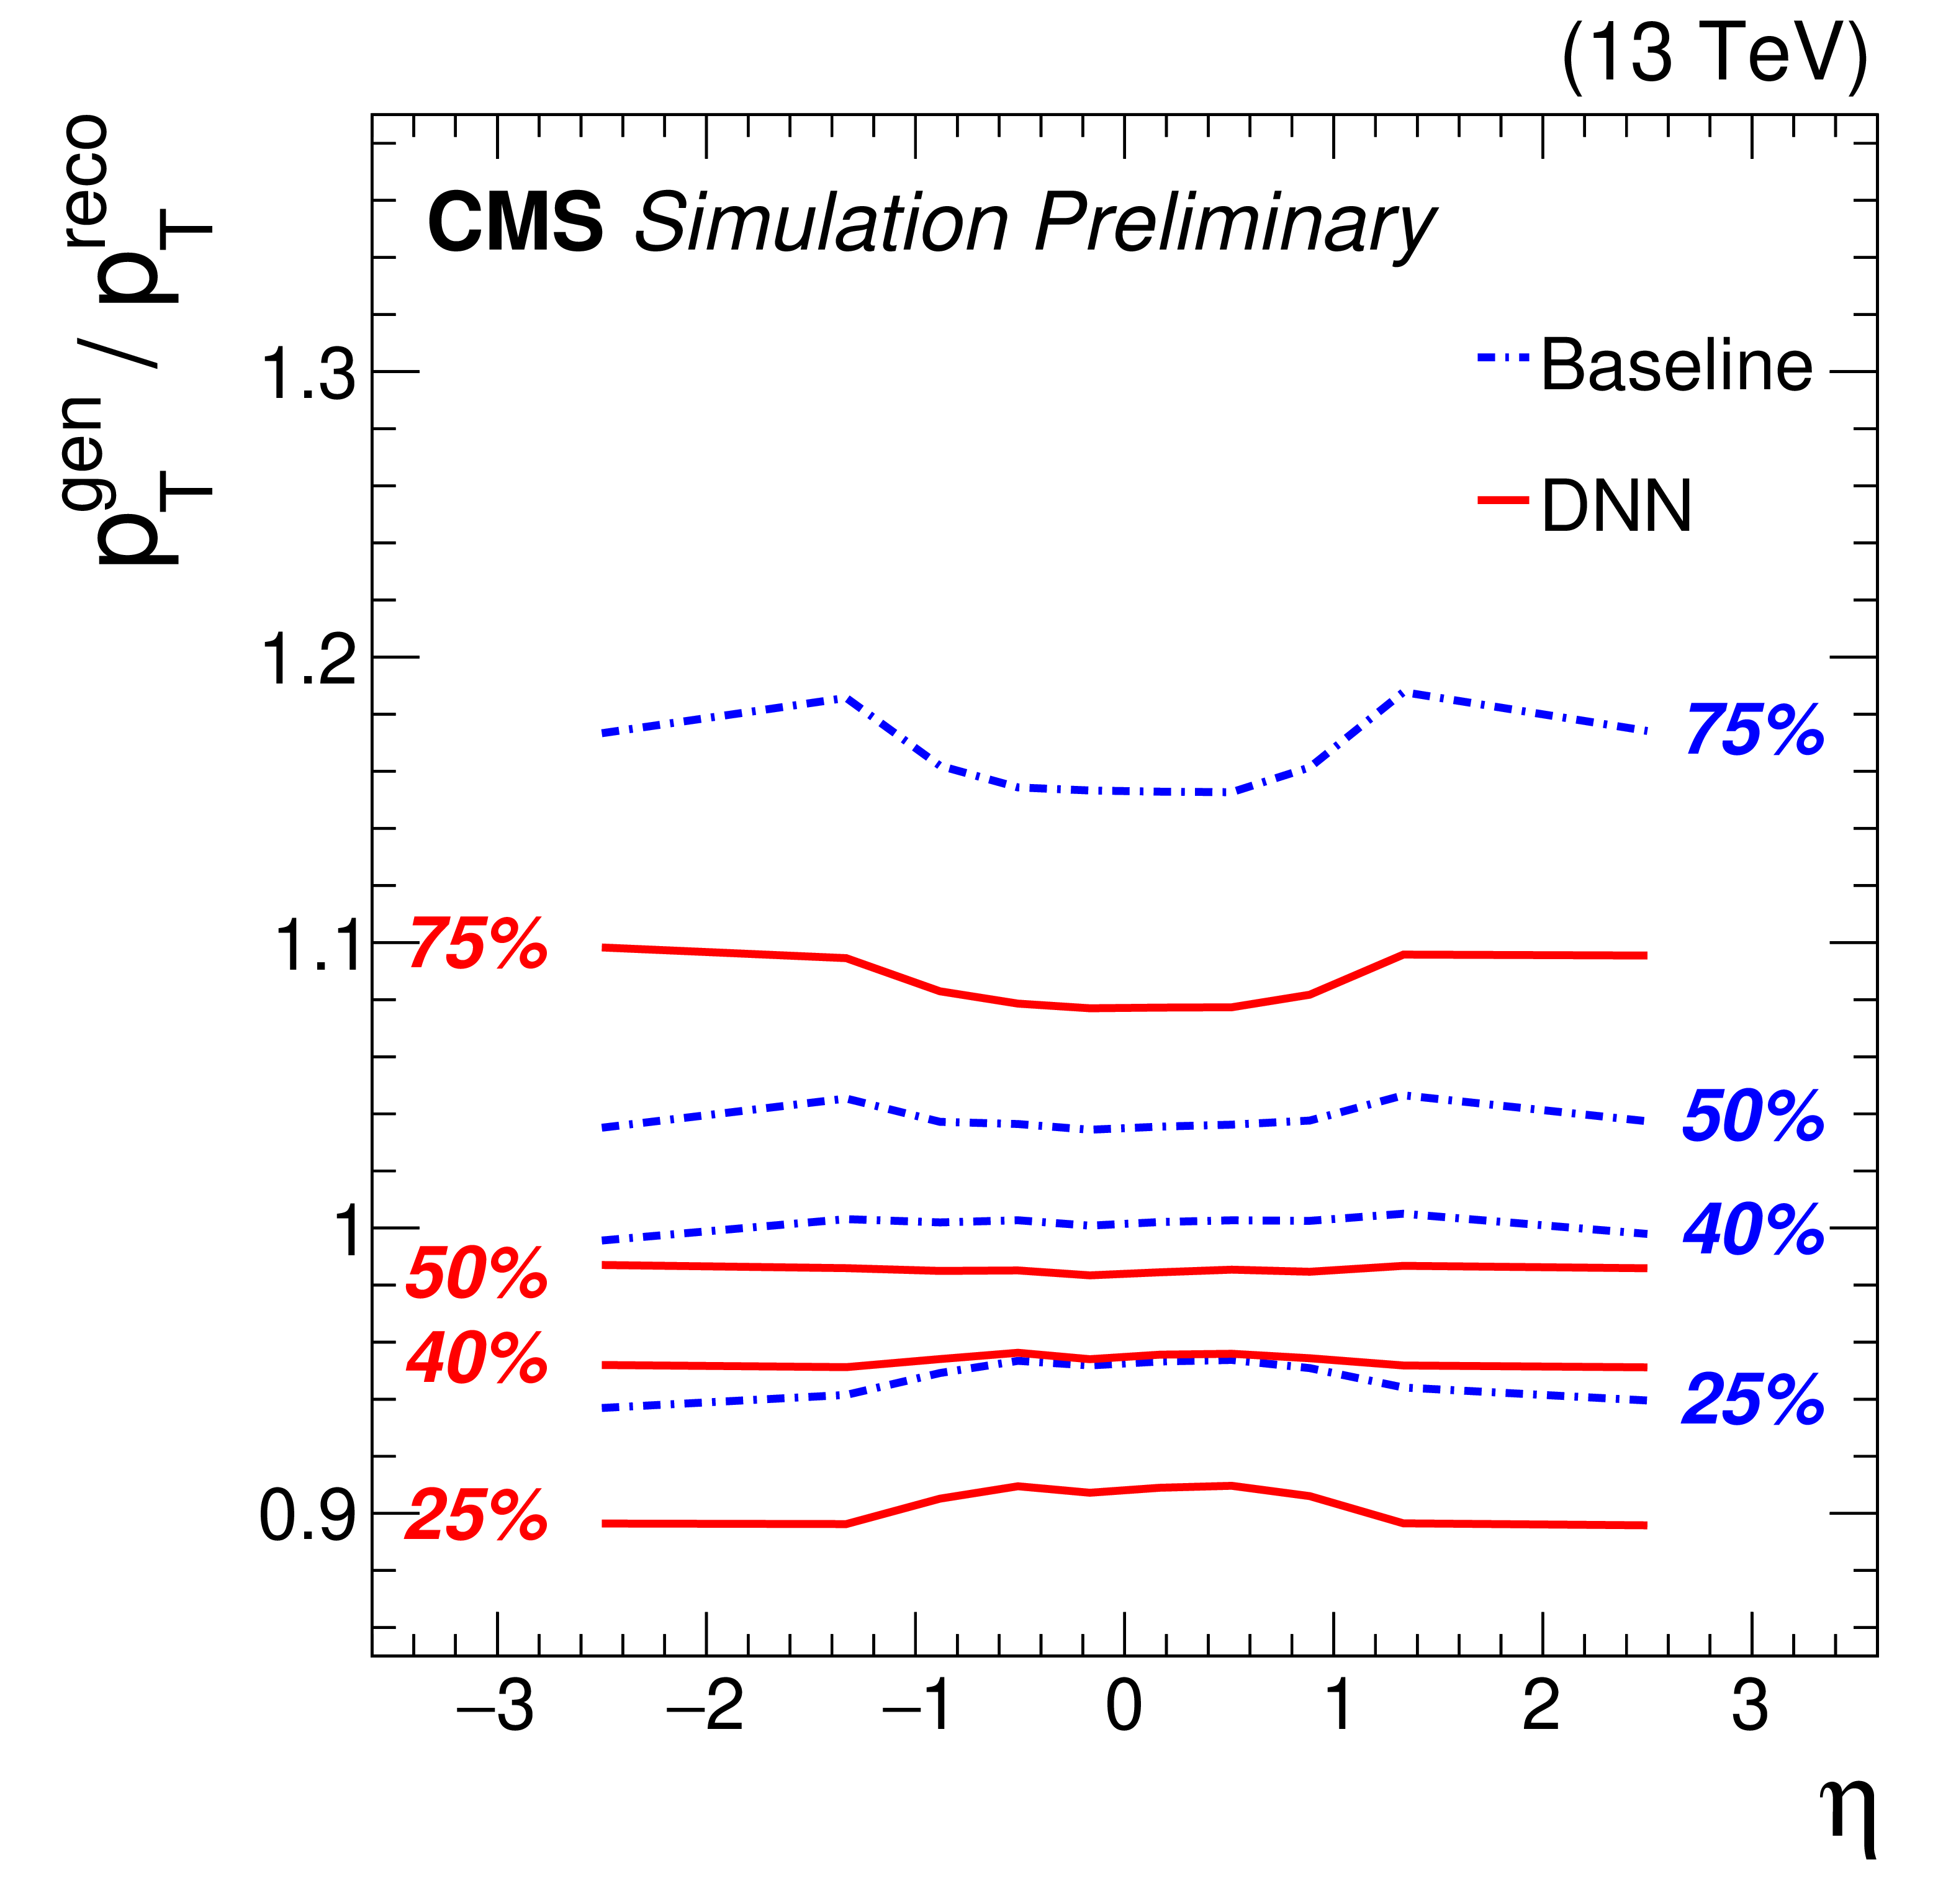
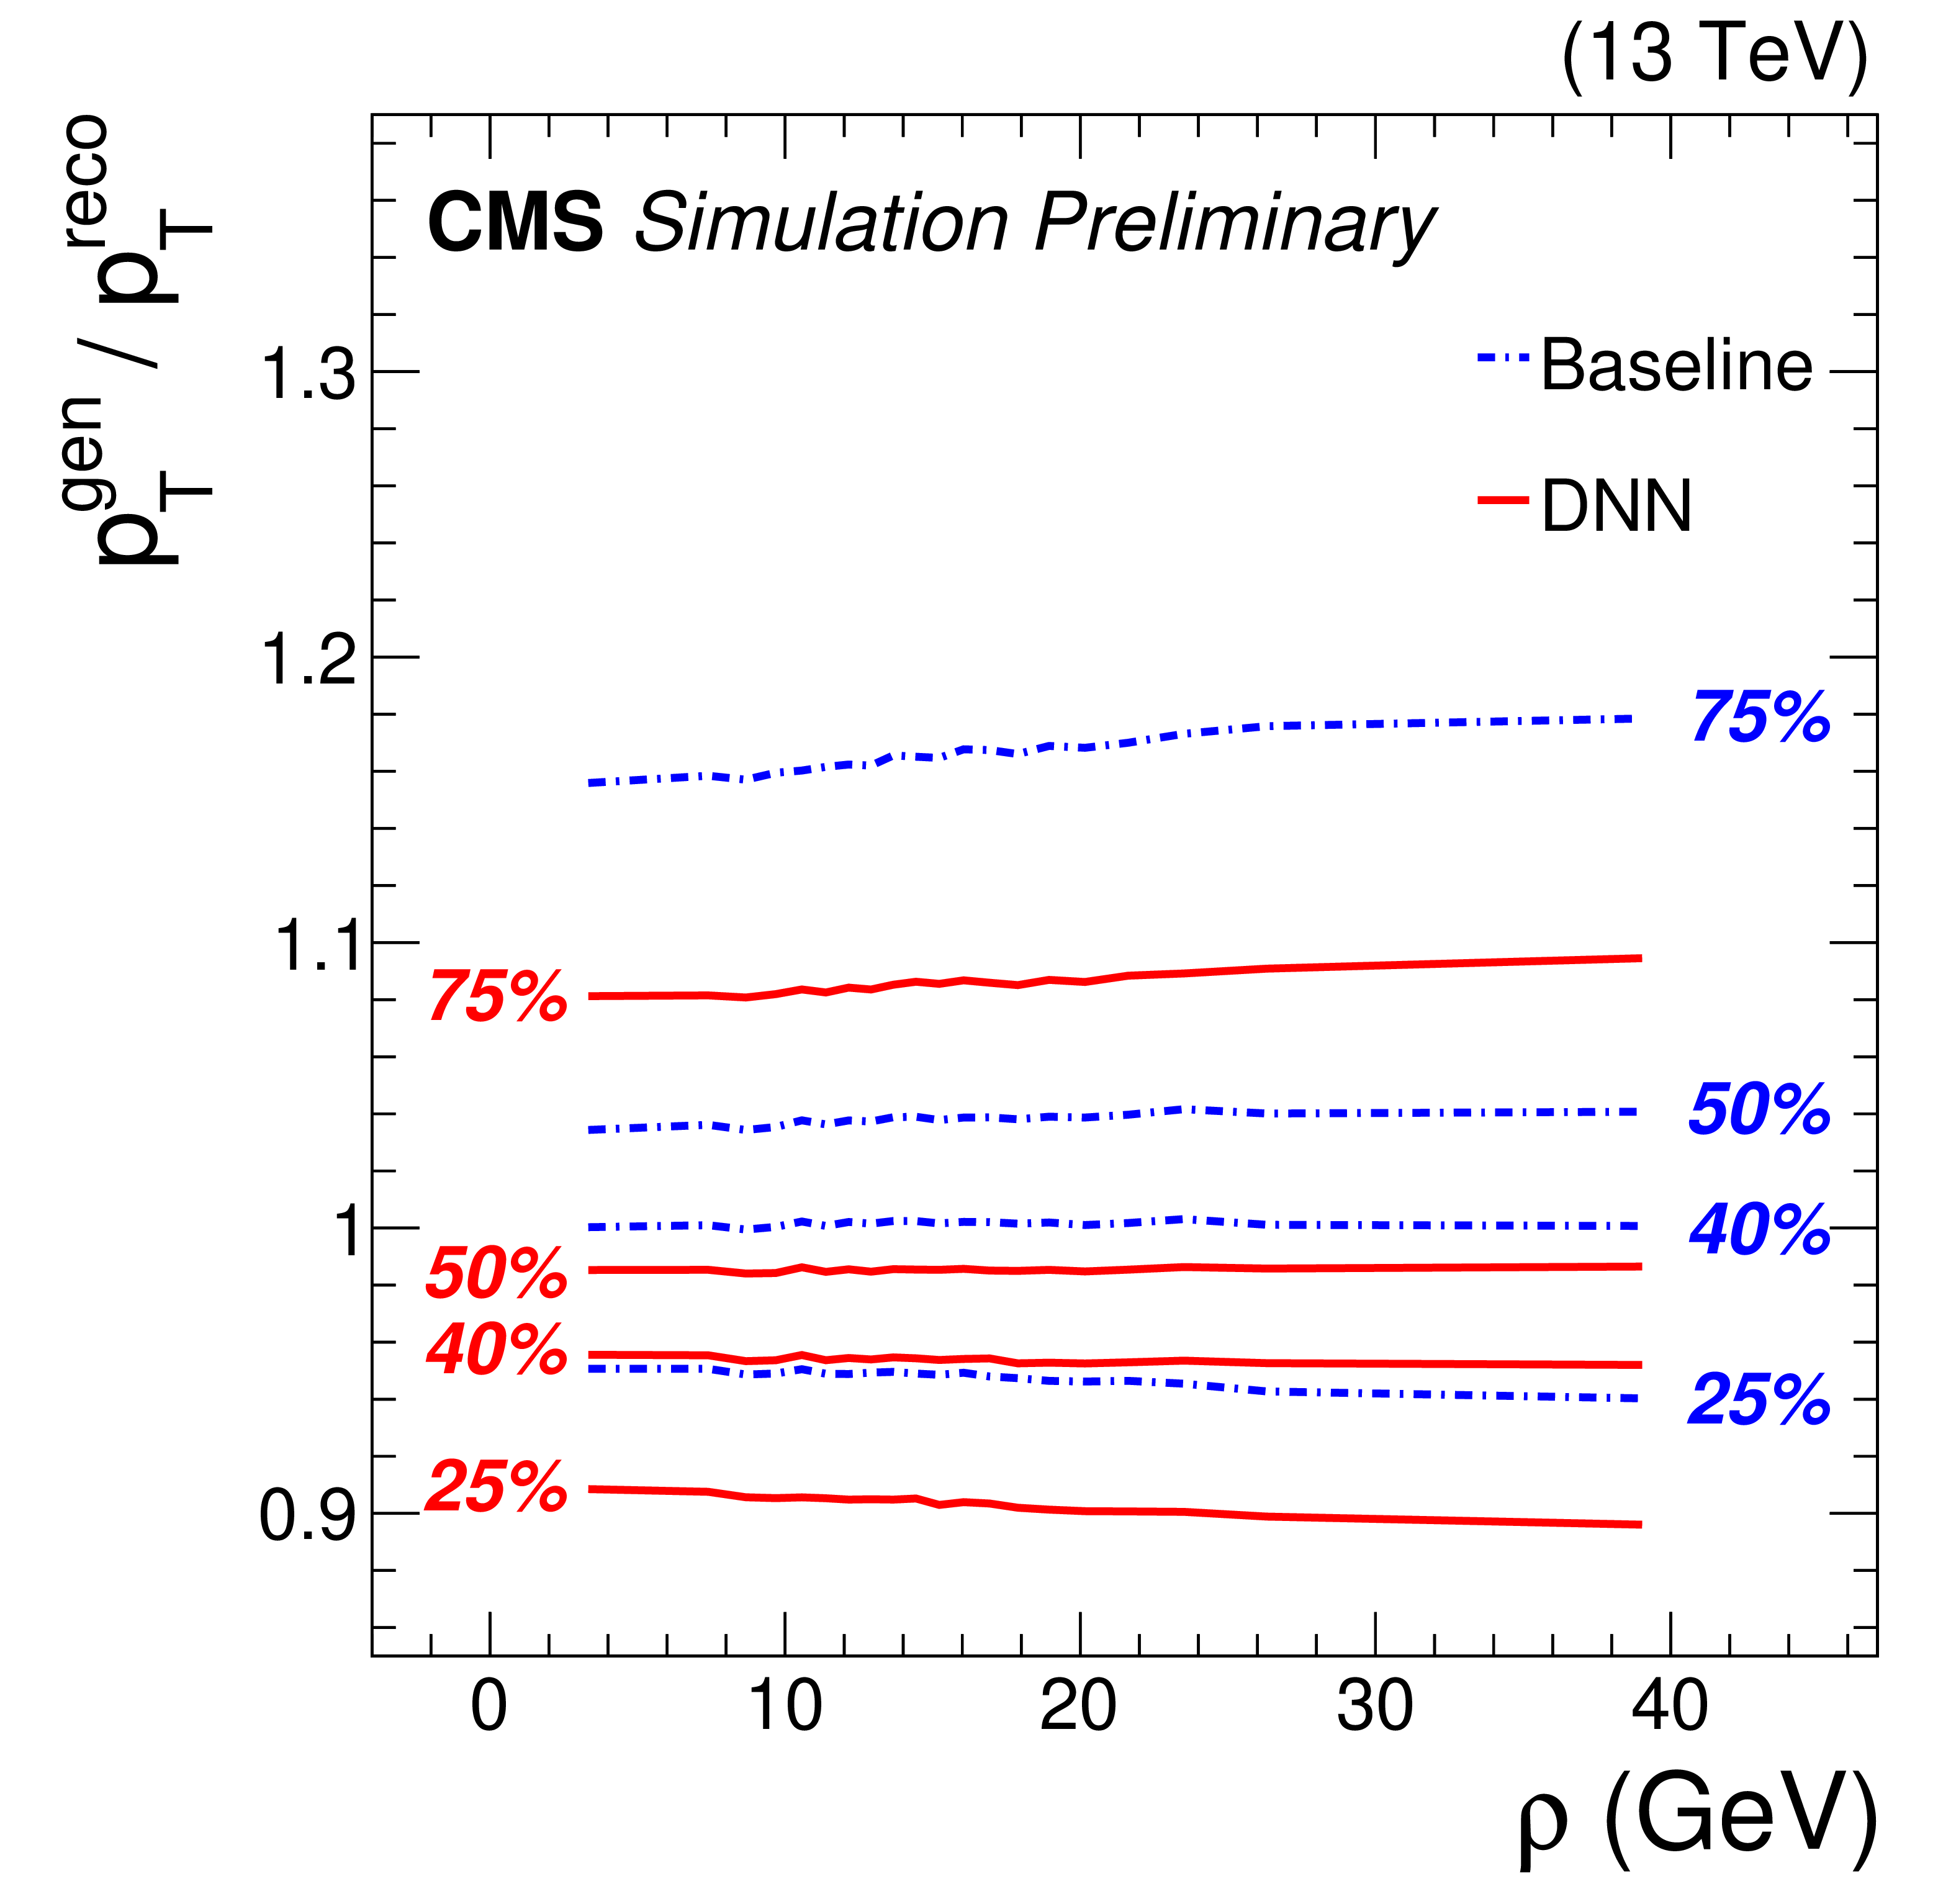
Figure 2:
25, 40, 50, and 75% quantiles are shown for b jet energy scale $ {p_\text {T}}^{\text {gen}}/ {p_\text {T}}^{\text {reco}}$ distribution before (blue) and after (red) applying the regression correction as a function of jet ${p_{\mathrm {T}}}$ (left), $\eta $ (center), and $\rho $ (right). |
png pdf |
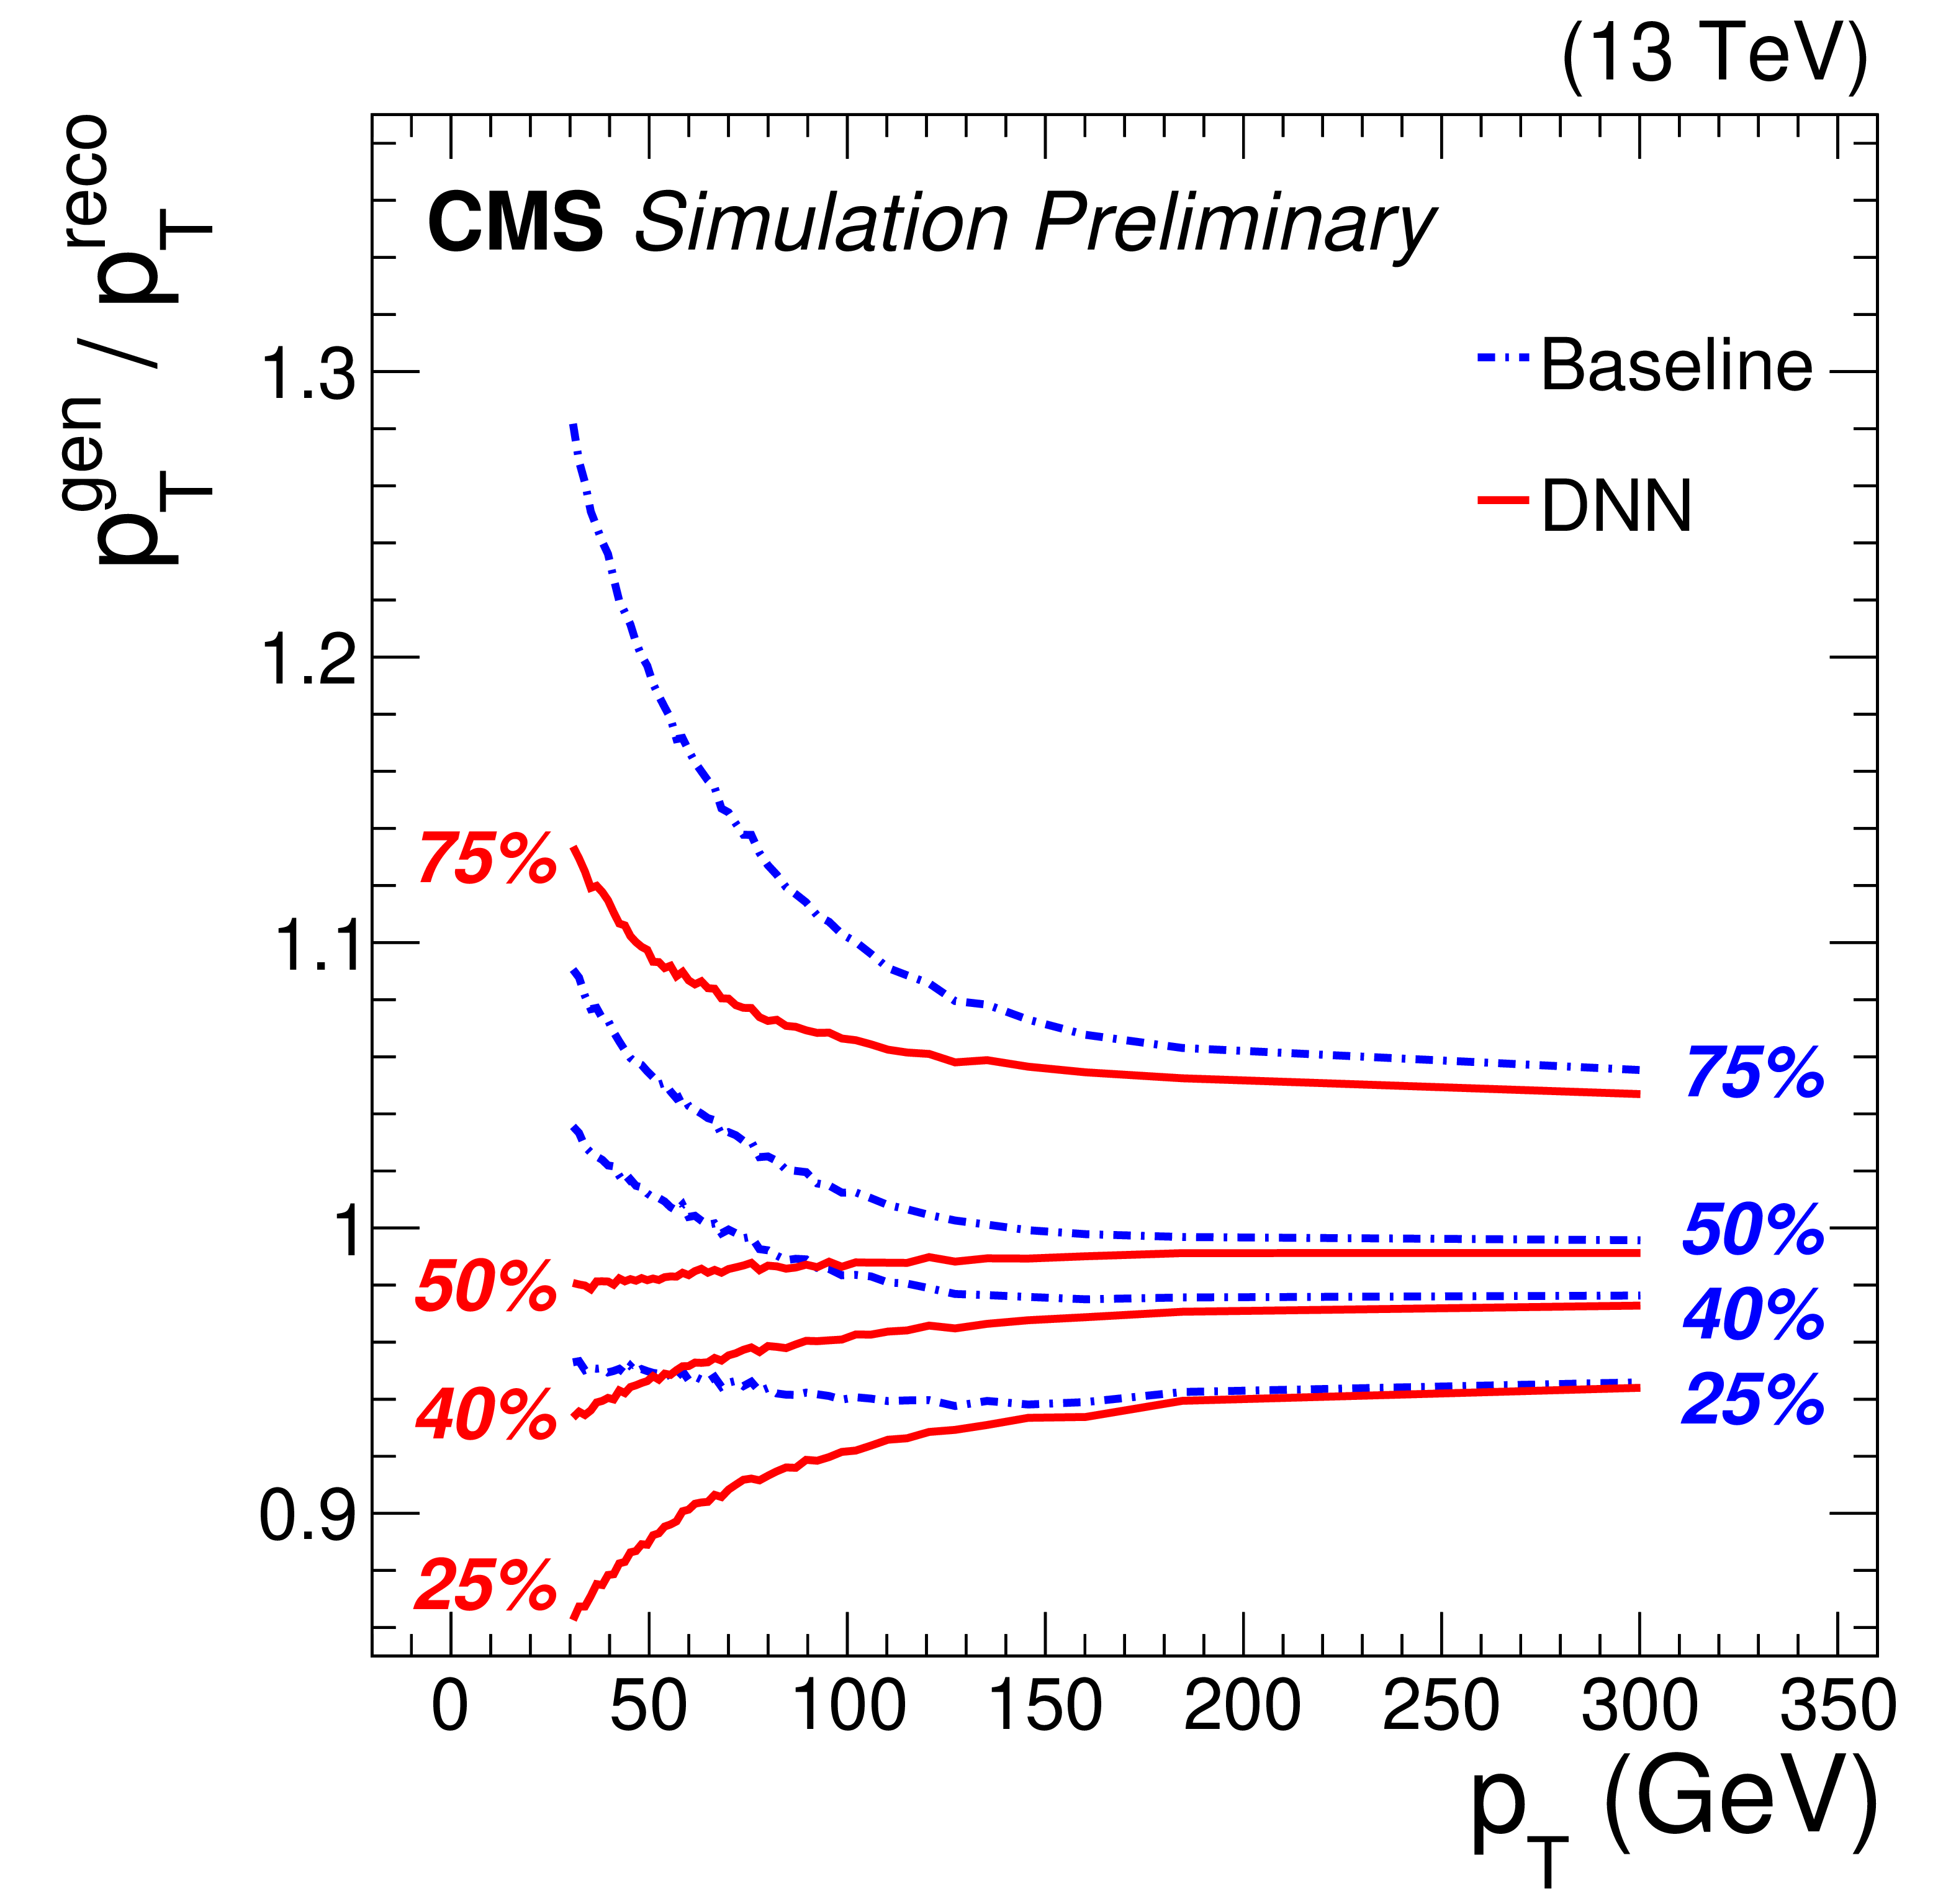
Figure 2-a:
25, 40, 50, and 75% quantiles are shown for b jet energy scale $ {p_\text {T}}^{\text {gen}}/ {p_\text {T}}^{\text {reco}}$ distribution before (blue) and after (red) applying the regression correction as a function of jet ${p_{\mathrm {T}}}$. |
png pdf |
Figure 2-b:
25, 40, 50, and 75% quantiles are shown for b jet energy scale $ {p_\text {T}}^{\text {gen}}/ {p_\text {T}}^{\text {reco}}$ distribution before (blue) and after (red) applying the regression correction as a function of jet $\eta $. |
png pdf |
Figure 2-c:
25, 40, 50, and 75% quantiles are shown for b jet energy scale $ {p_\text {T}}^{\text {gen}}/ {p_\text {T}}^{\text {reco}}$ distribution before (blue) and after (red) applying the regression correction as a function of jet $\rho $. |
png pdf |
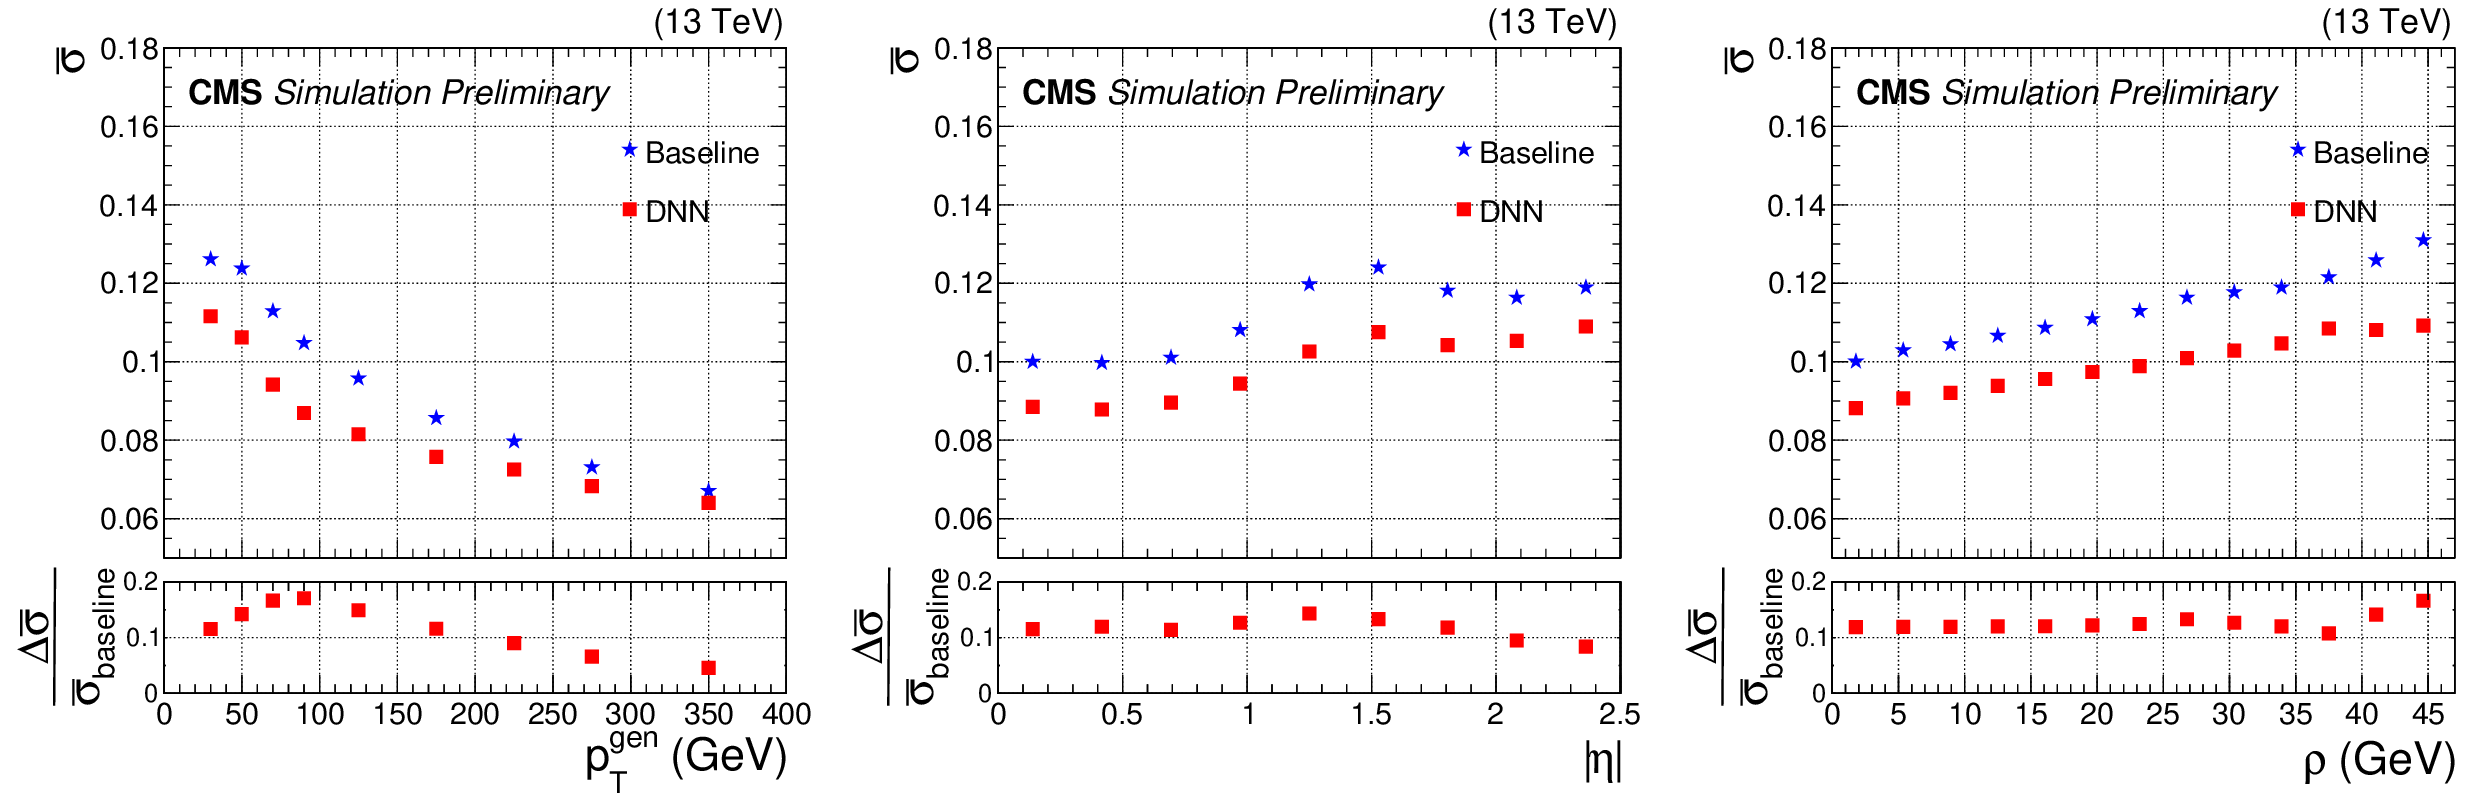
Figure 3:
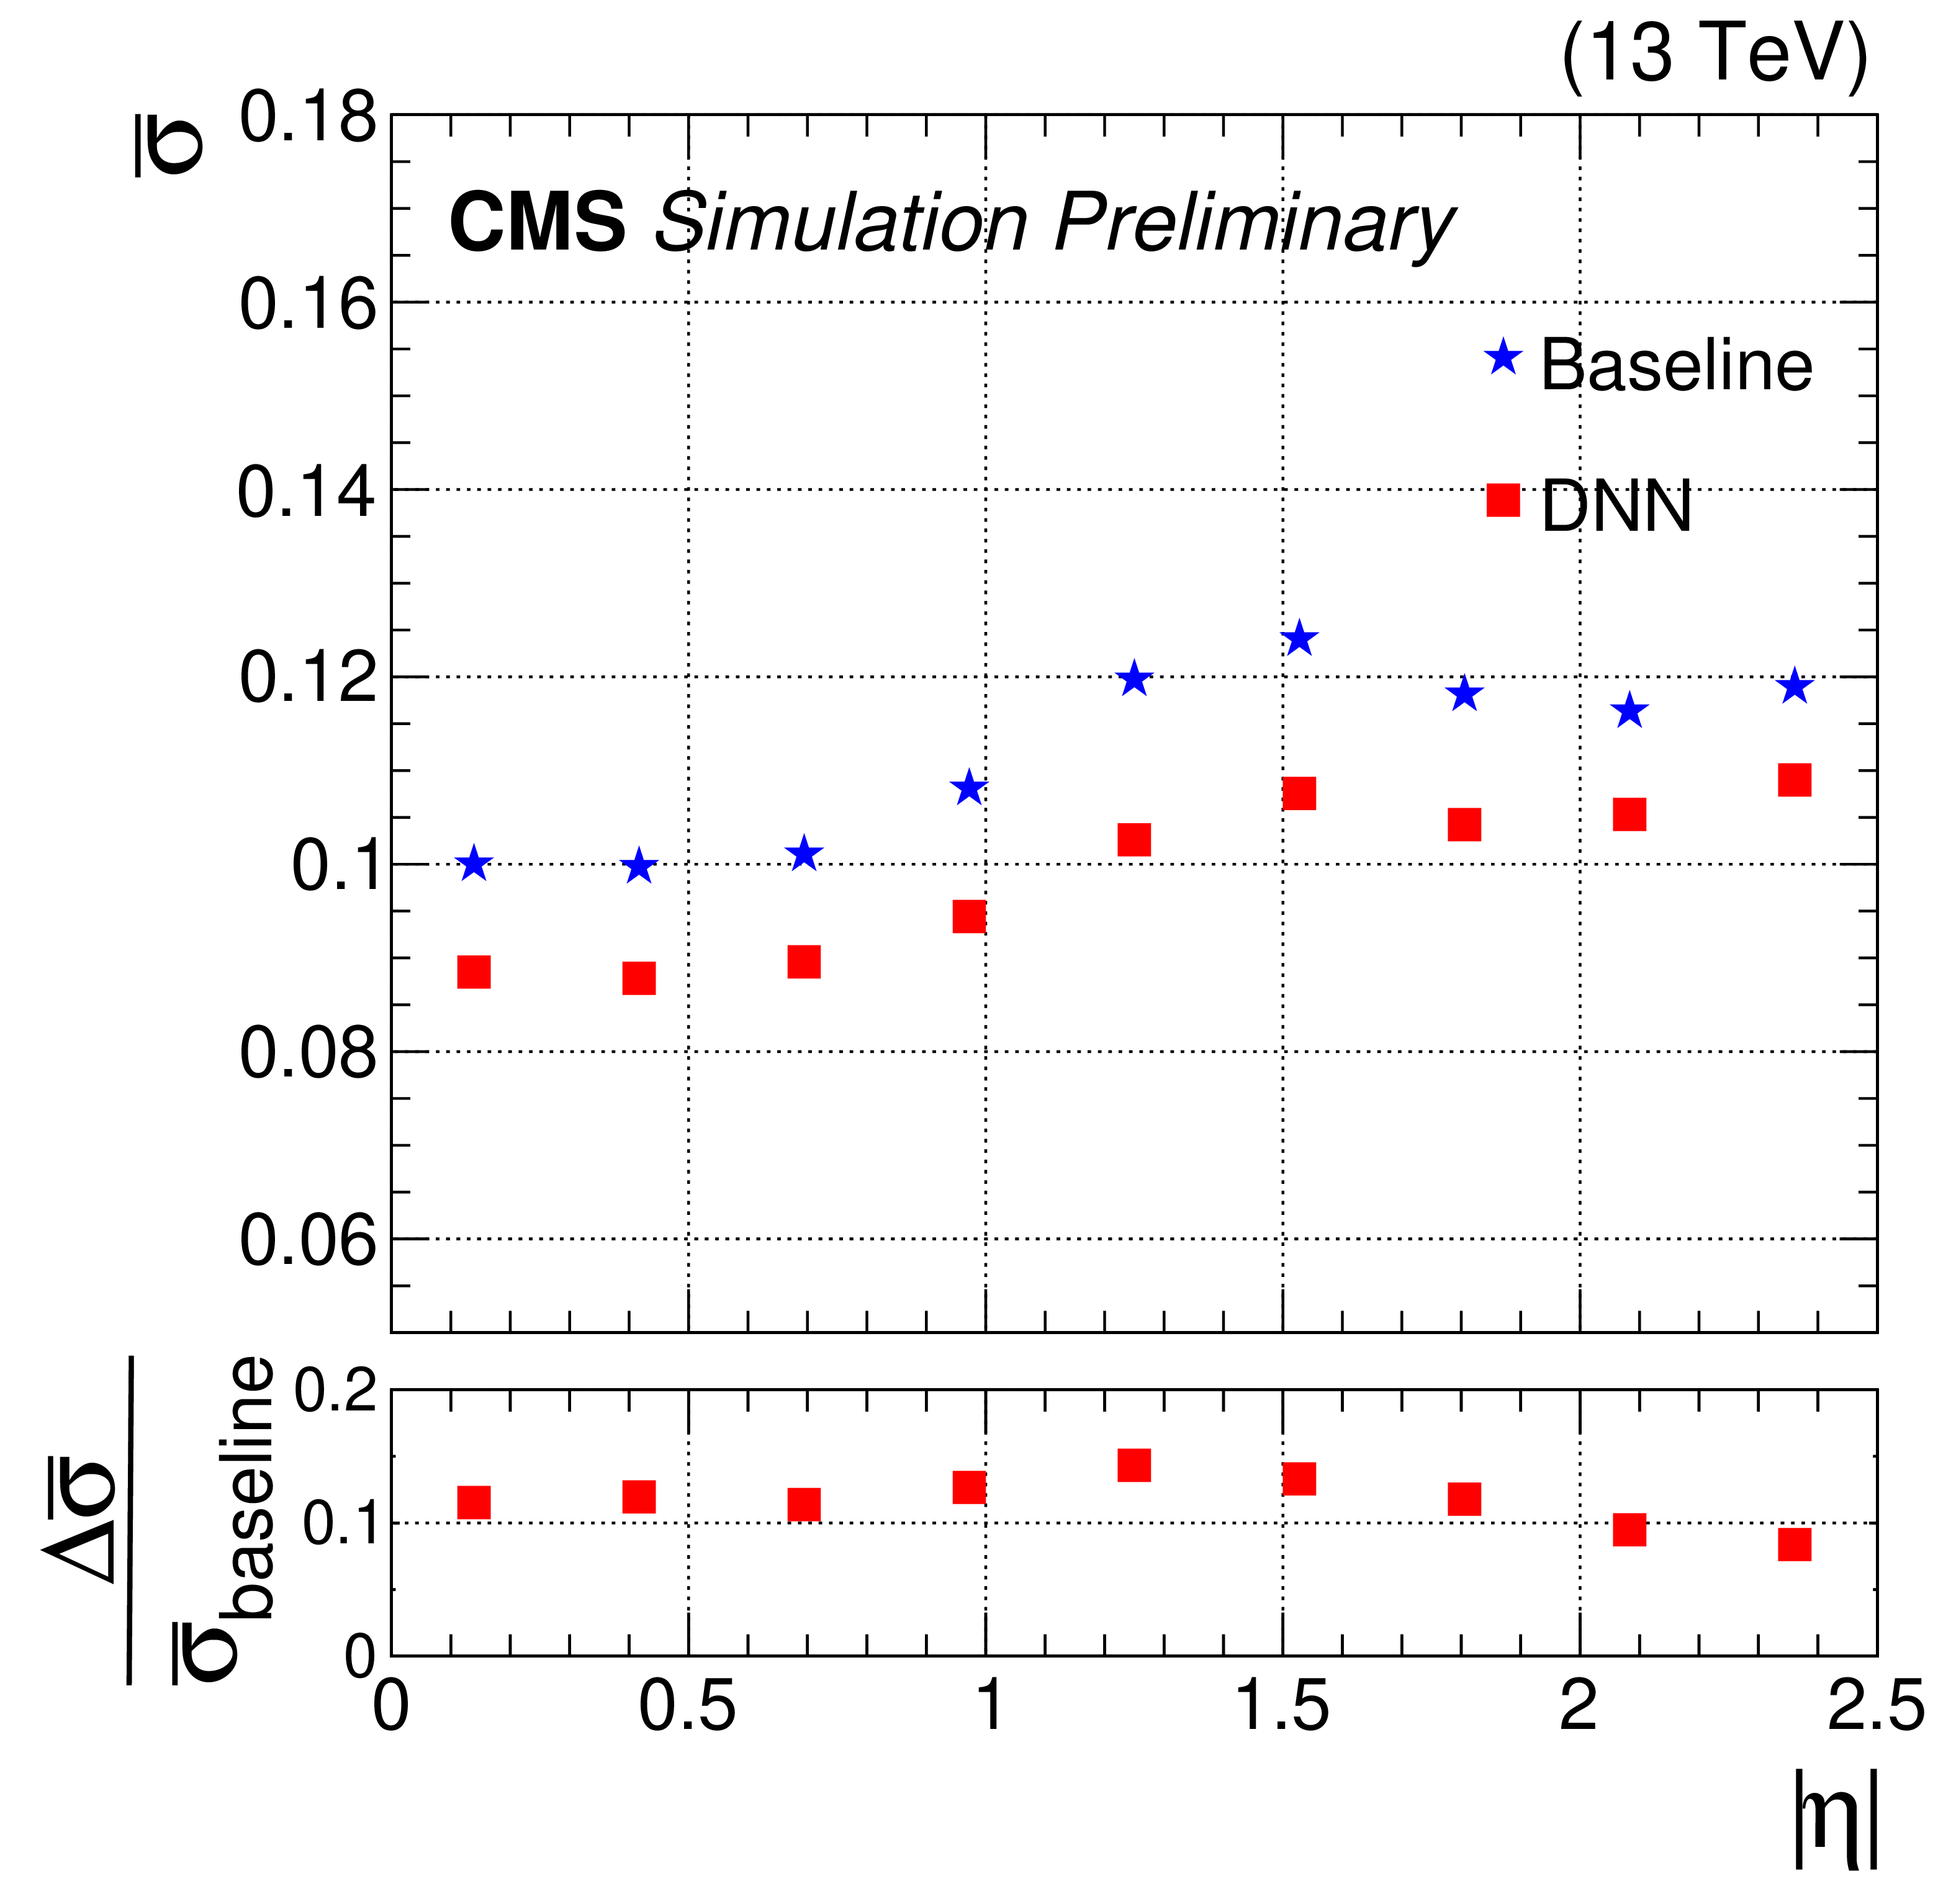
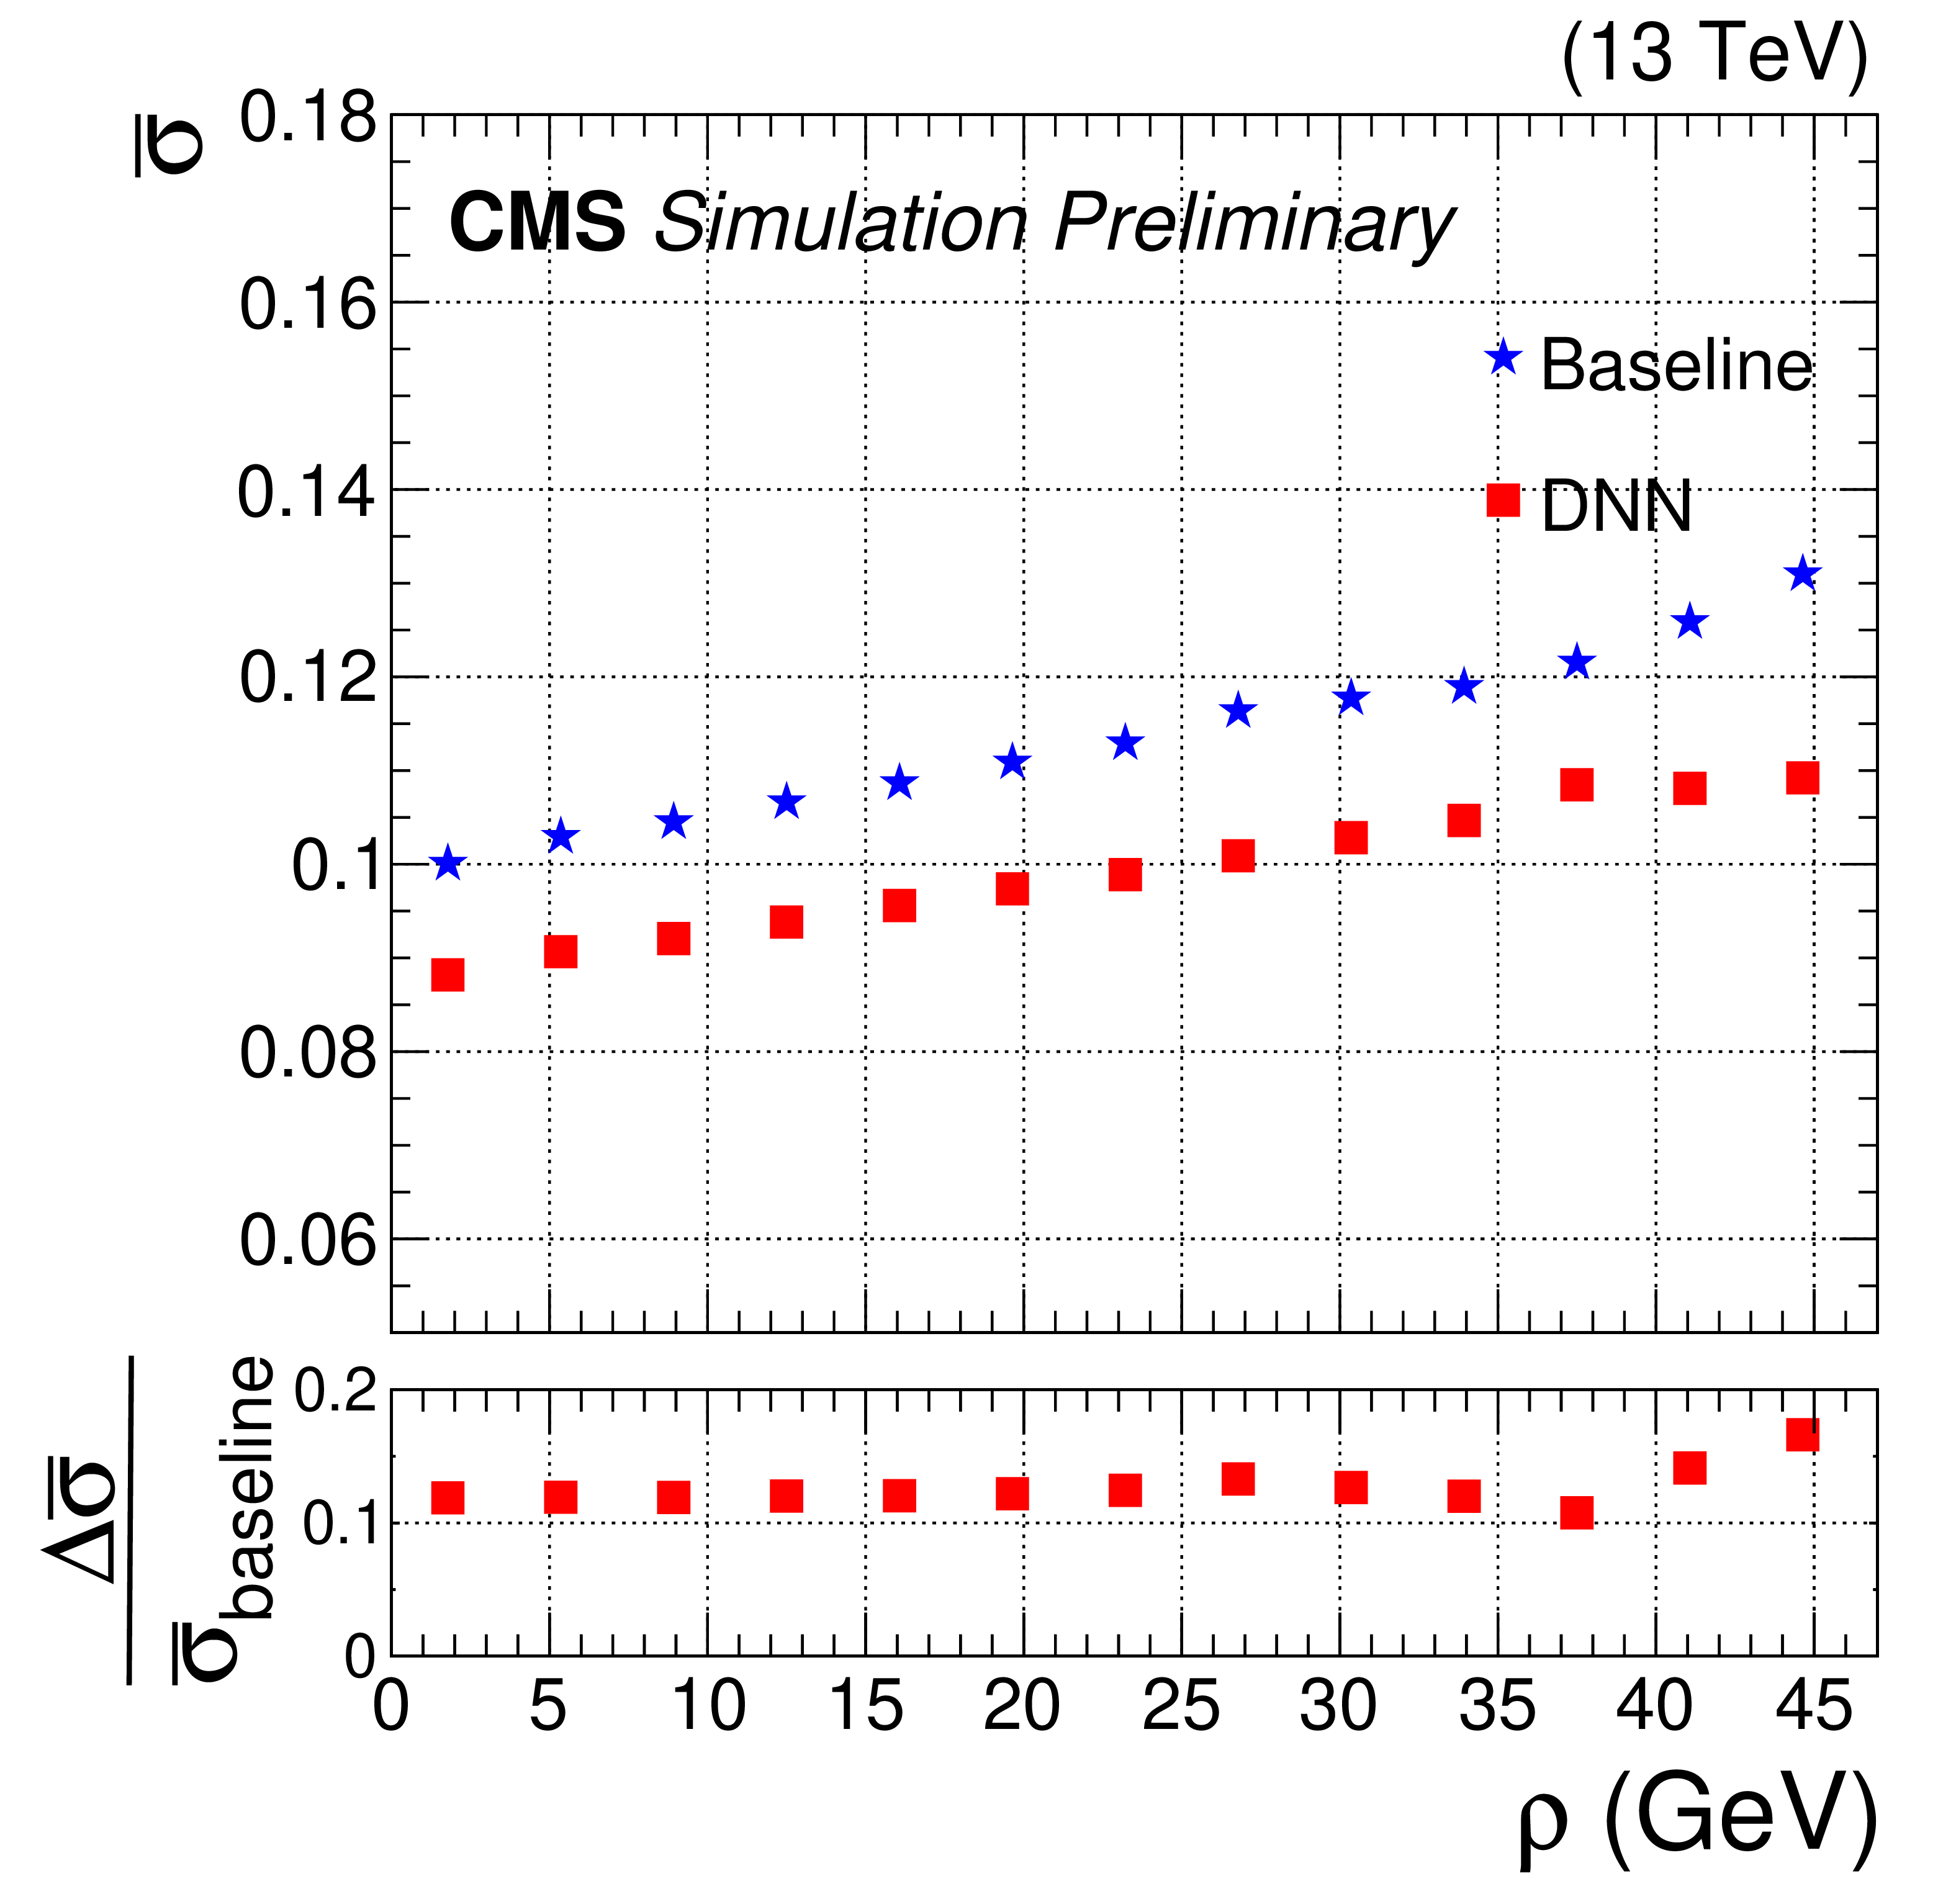
Relative jet energy resolution, $\bar{\sigma}$, as a function of generator-level jet $ {p_\text {T}}^{\text {gen}}$ (left), $\eta $ (center), and $\rho $ (right) for b jets from ${\mathrm{t} \mathrm{\bar{t}}}$ MC events. The average ${p_{\mathrm {T}}}$ of these b jets is 80 GeV. The blue stars and red squares represent $\bar{\sigma}$ before and after the DNN correction, respectively. The relative difference between the $\bar{\sigma}$ values before and after DNN corrections are shown in the lower panels. |
png pdf |
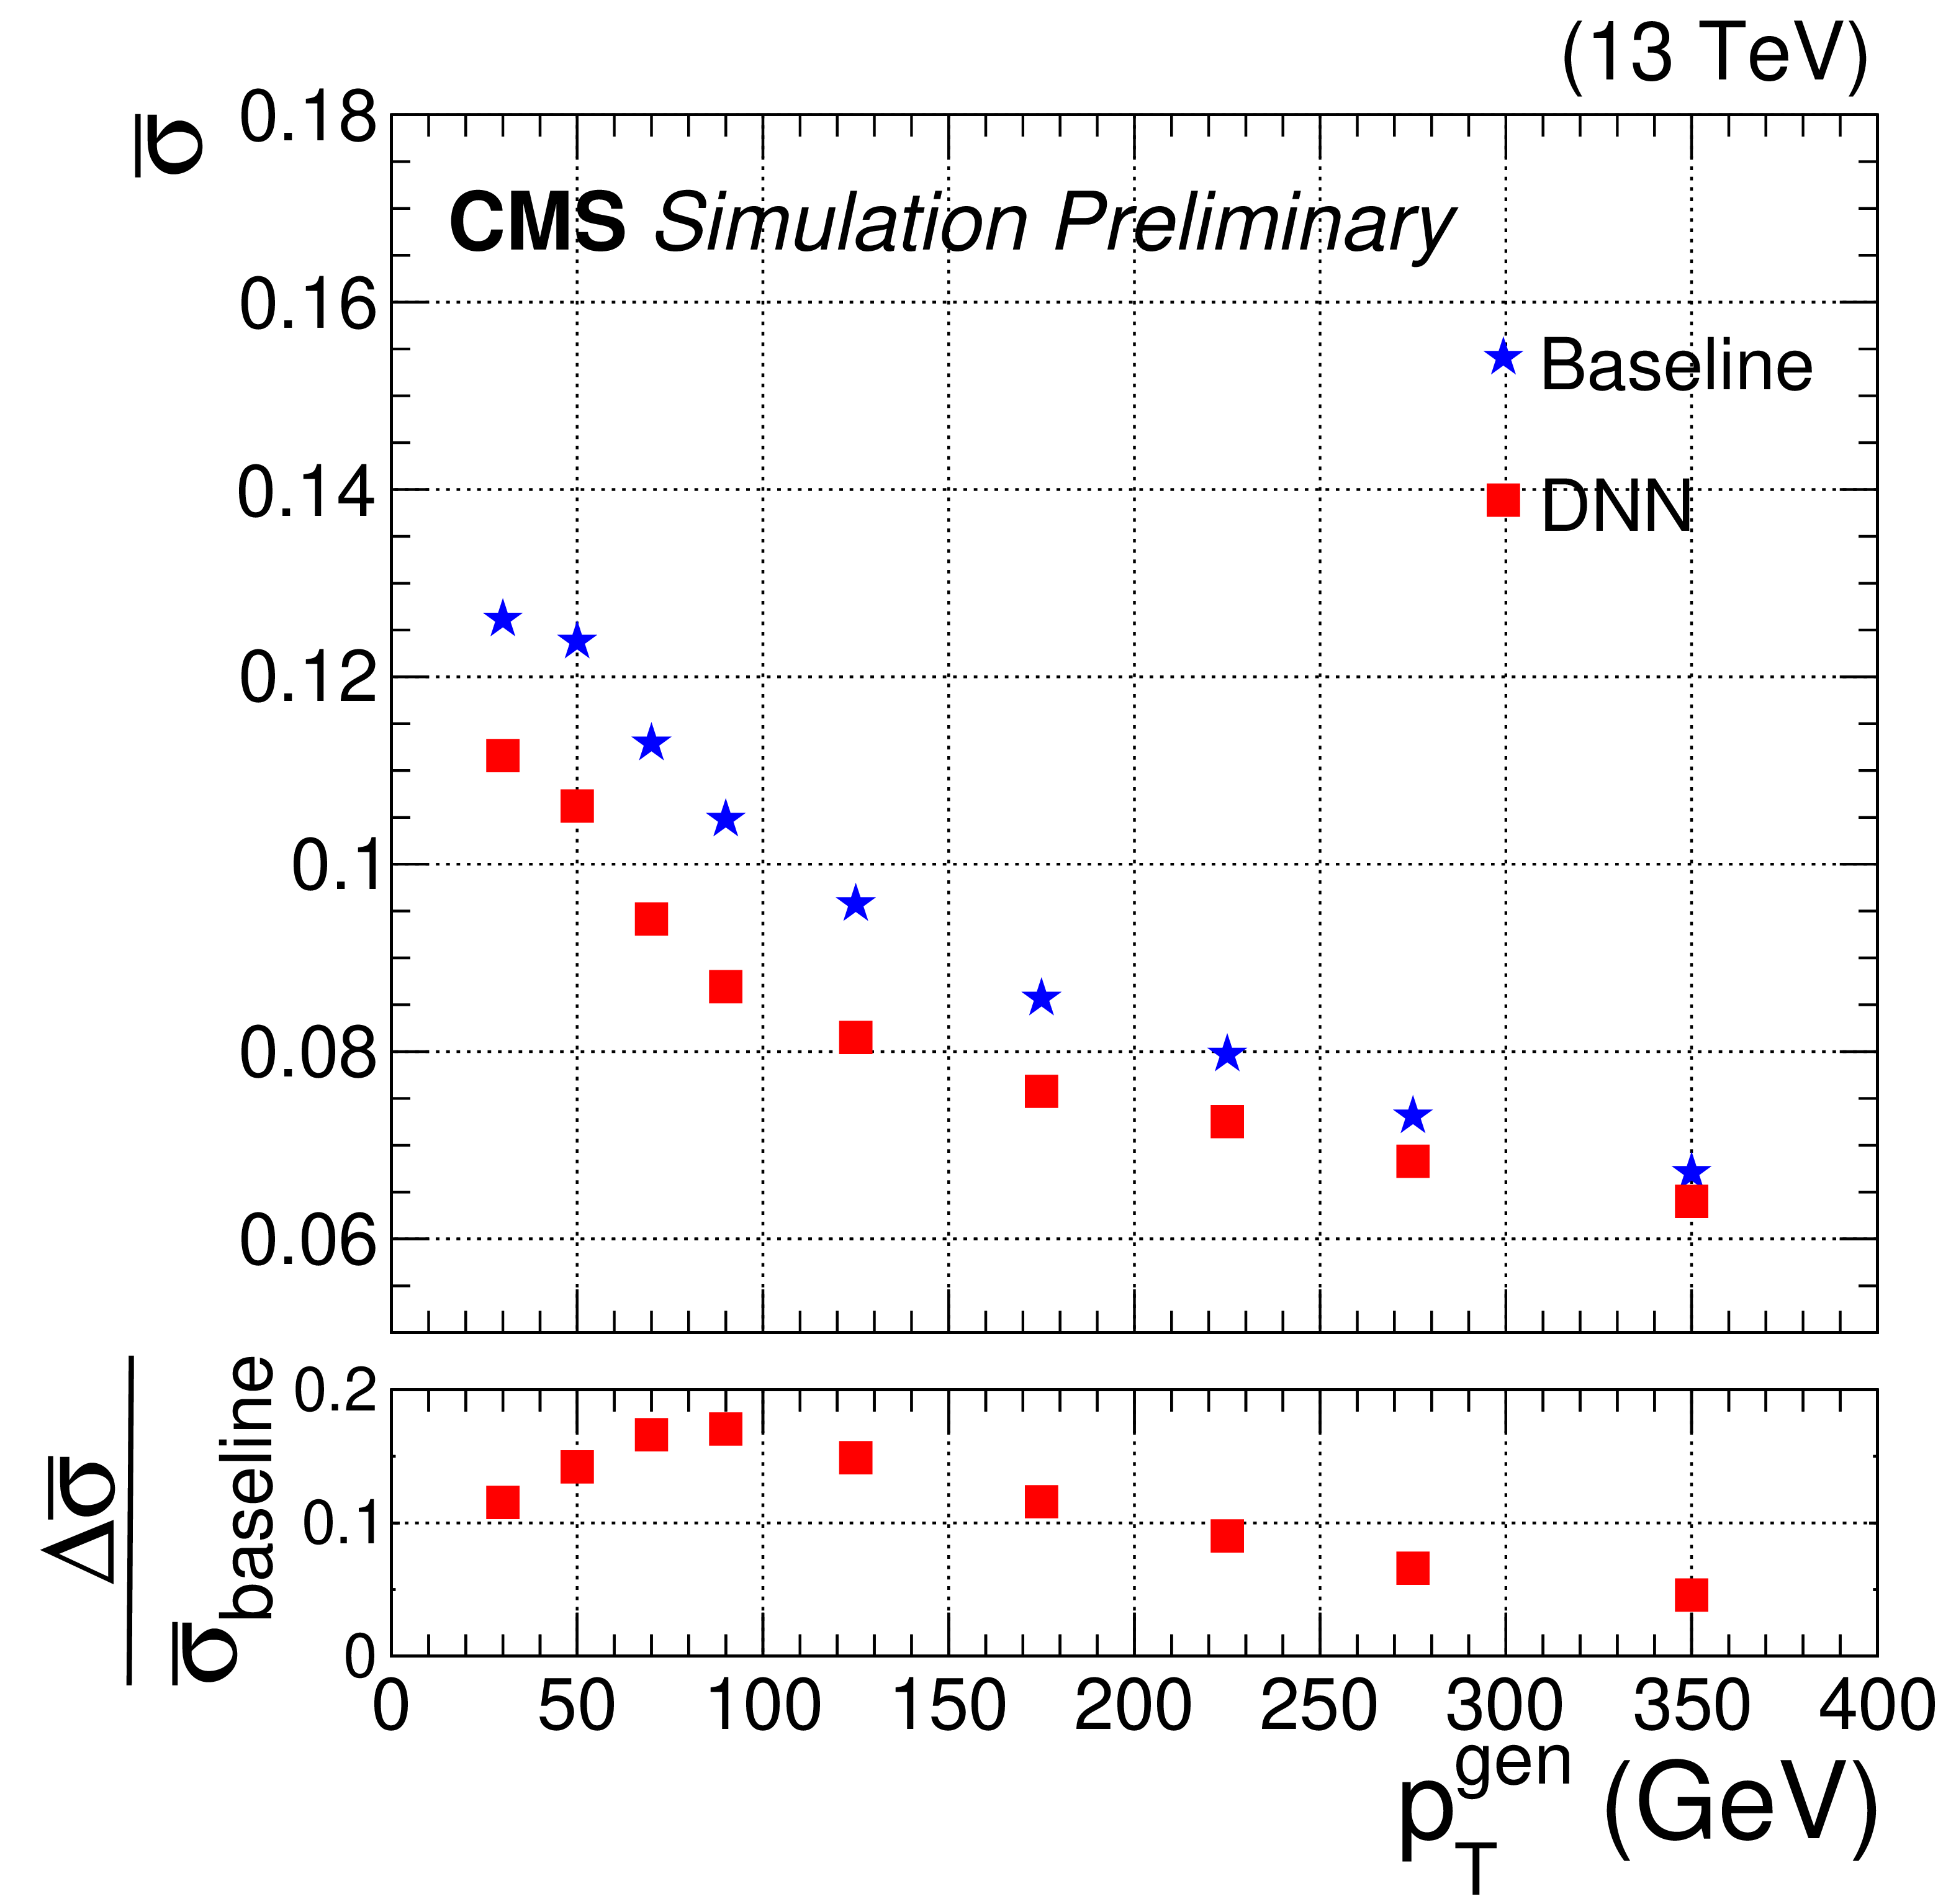
Figure 3-a:
Relative jet energy resolution, $\bar{\sigma}$, as a function of generator-level $ {p_\text {T}}^{\text {gen}}$ for b jets from ${\mathrm{t} \mathrm{\bar{t}}}$ MC events. The average ${p_{\mathrm {T}}}$ of these b jets is 80 GeV. The blue stars and red squares represent $\bar{\sigma}$ before and after the DNN correction, respectively. The relative difference between the $\bar{\sigma}$ values before and after DNN corrections are shown in the lower panel. |
png pdf |
Figure 3-b:
Relative jet energy resolution, $\bar{\sigma}$, as a function of generator-level $\eta $ for b jets from ${\mathrm{t} \mathrm{\bar{t}}}$ MC events. The average ${p_{\mathrm {T}}}$ of these b jets is 80 GeV. The blue stars and red squares represent $\bar{\sigma}$ before and after the DNN correction, respectively. The relative difference between the $\bar{\sigma}$ values before and after DNN corrections are shown in the lower panel. |
png pdf |
Figure 3-c:
Relative jet energy resolution, $\bar{\sigma}$, as a function of generator-level $\rho $ for b jets from ${\mathrm{t} \mathrm{\bar{t}}}$ MC events. The average ${p_{\mathrm {T}}}$ of these b jets is 80 GeV. The blue stars and red squares represent $\bar{\sigma}$ before and after the DNN correction, respectively. The relative difference between the $\bar{\sigma}$ values before and after DNN corrections are shown in the lower panel. |
png pdf |
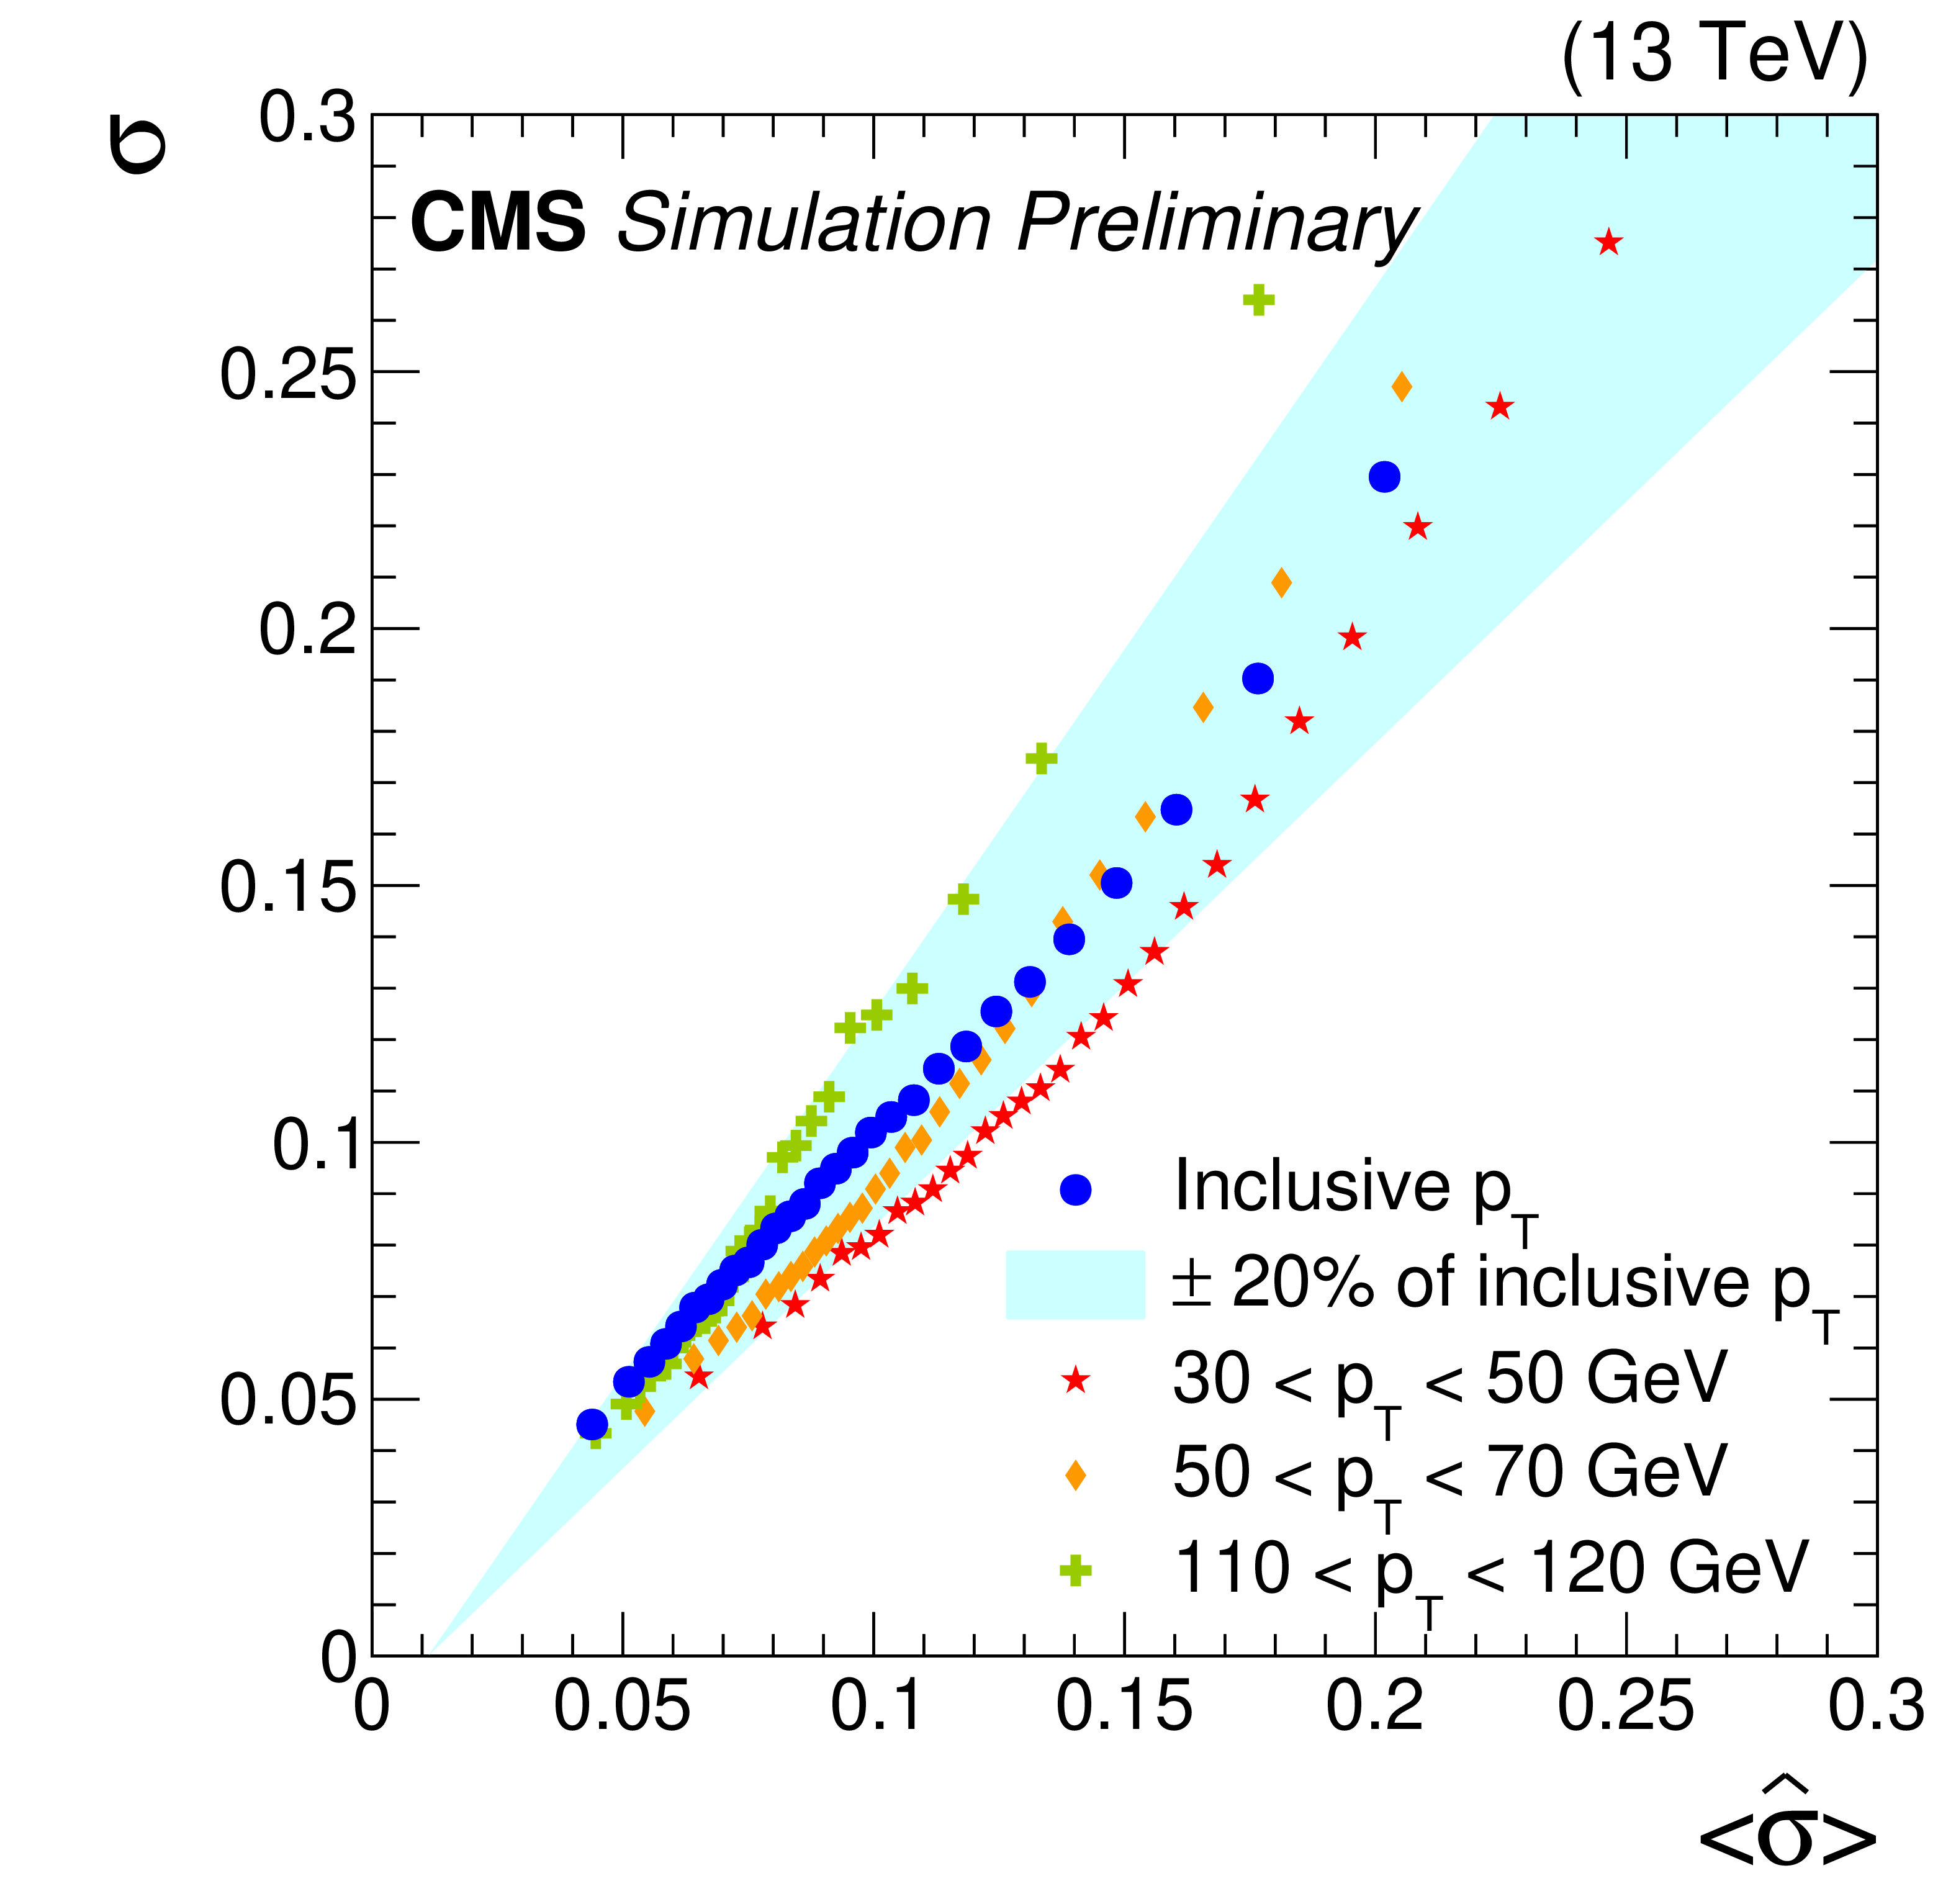
Figure 4:
Correlation between jet resolution $\sigma $ and the mean jet energy resolution estimator $\hat{\sigma}$ values for b jets from ${\mathrm{t} \mathrm{\bar{t}}}$ MC events. Blue circles correspond to the inclusive ${p_{\mathrm {T}}}$ spectrum, while the blue band represents 20% up and down variations of the $\hat{\sigma}$ value. Red stars correspond to jets with ${p_{\mathrm {T}}} \in $ [30, 50] GeV, orange diamonds to ${p_{\mathrm {T}}} \in $ [50, 70] GeV, and green crosses to ${p_{\mathrm {T}}} \in $ [110,120] GeV. |
png pdf |
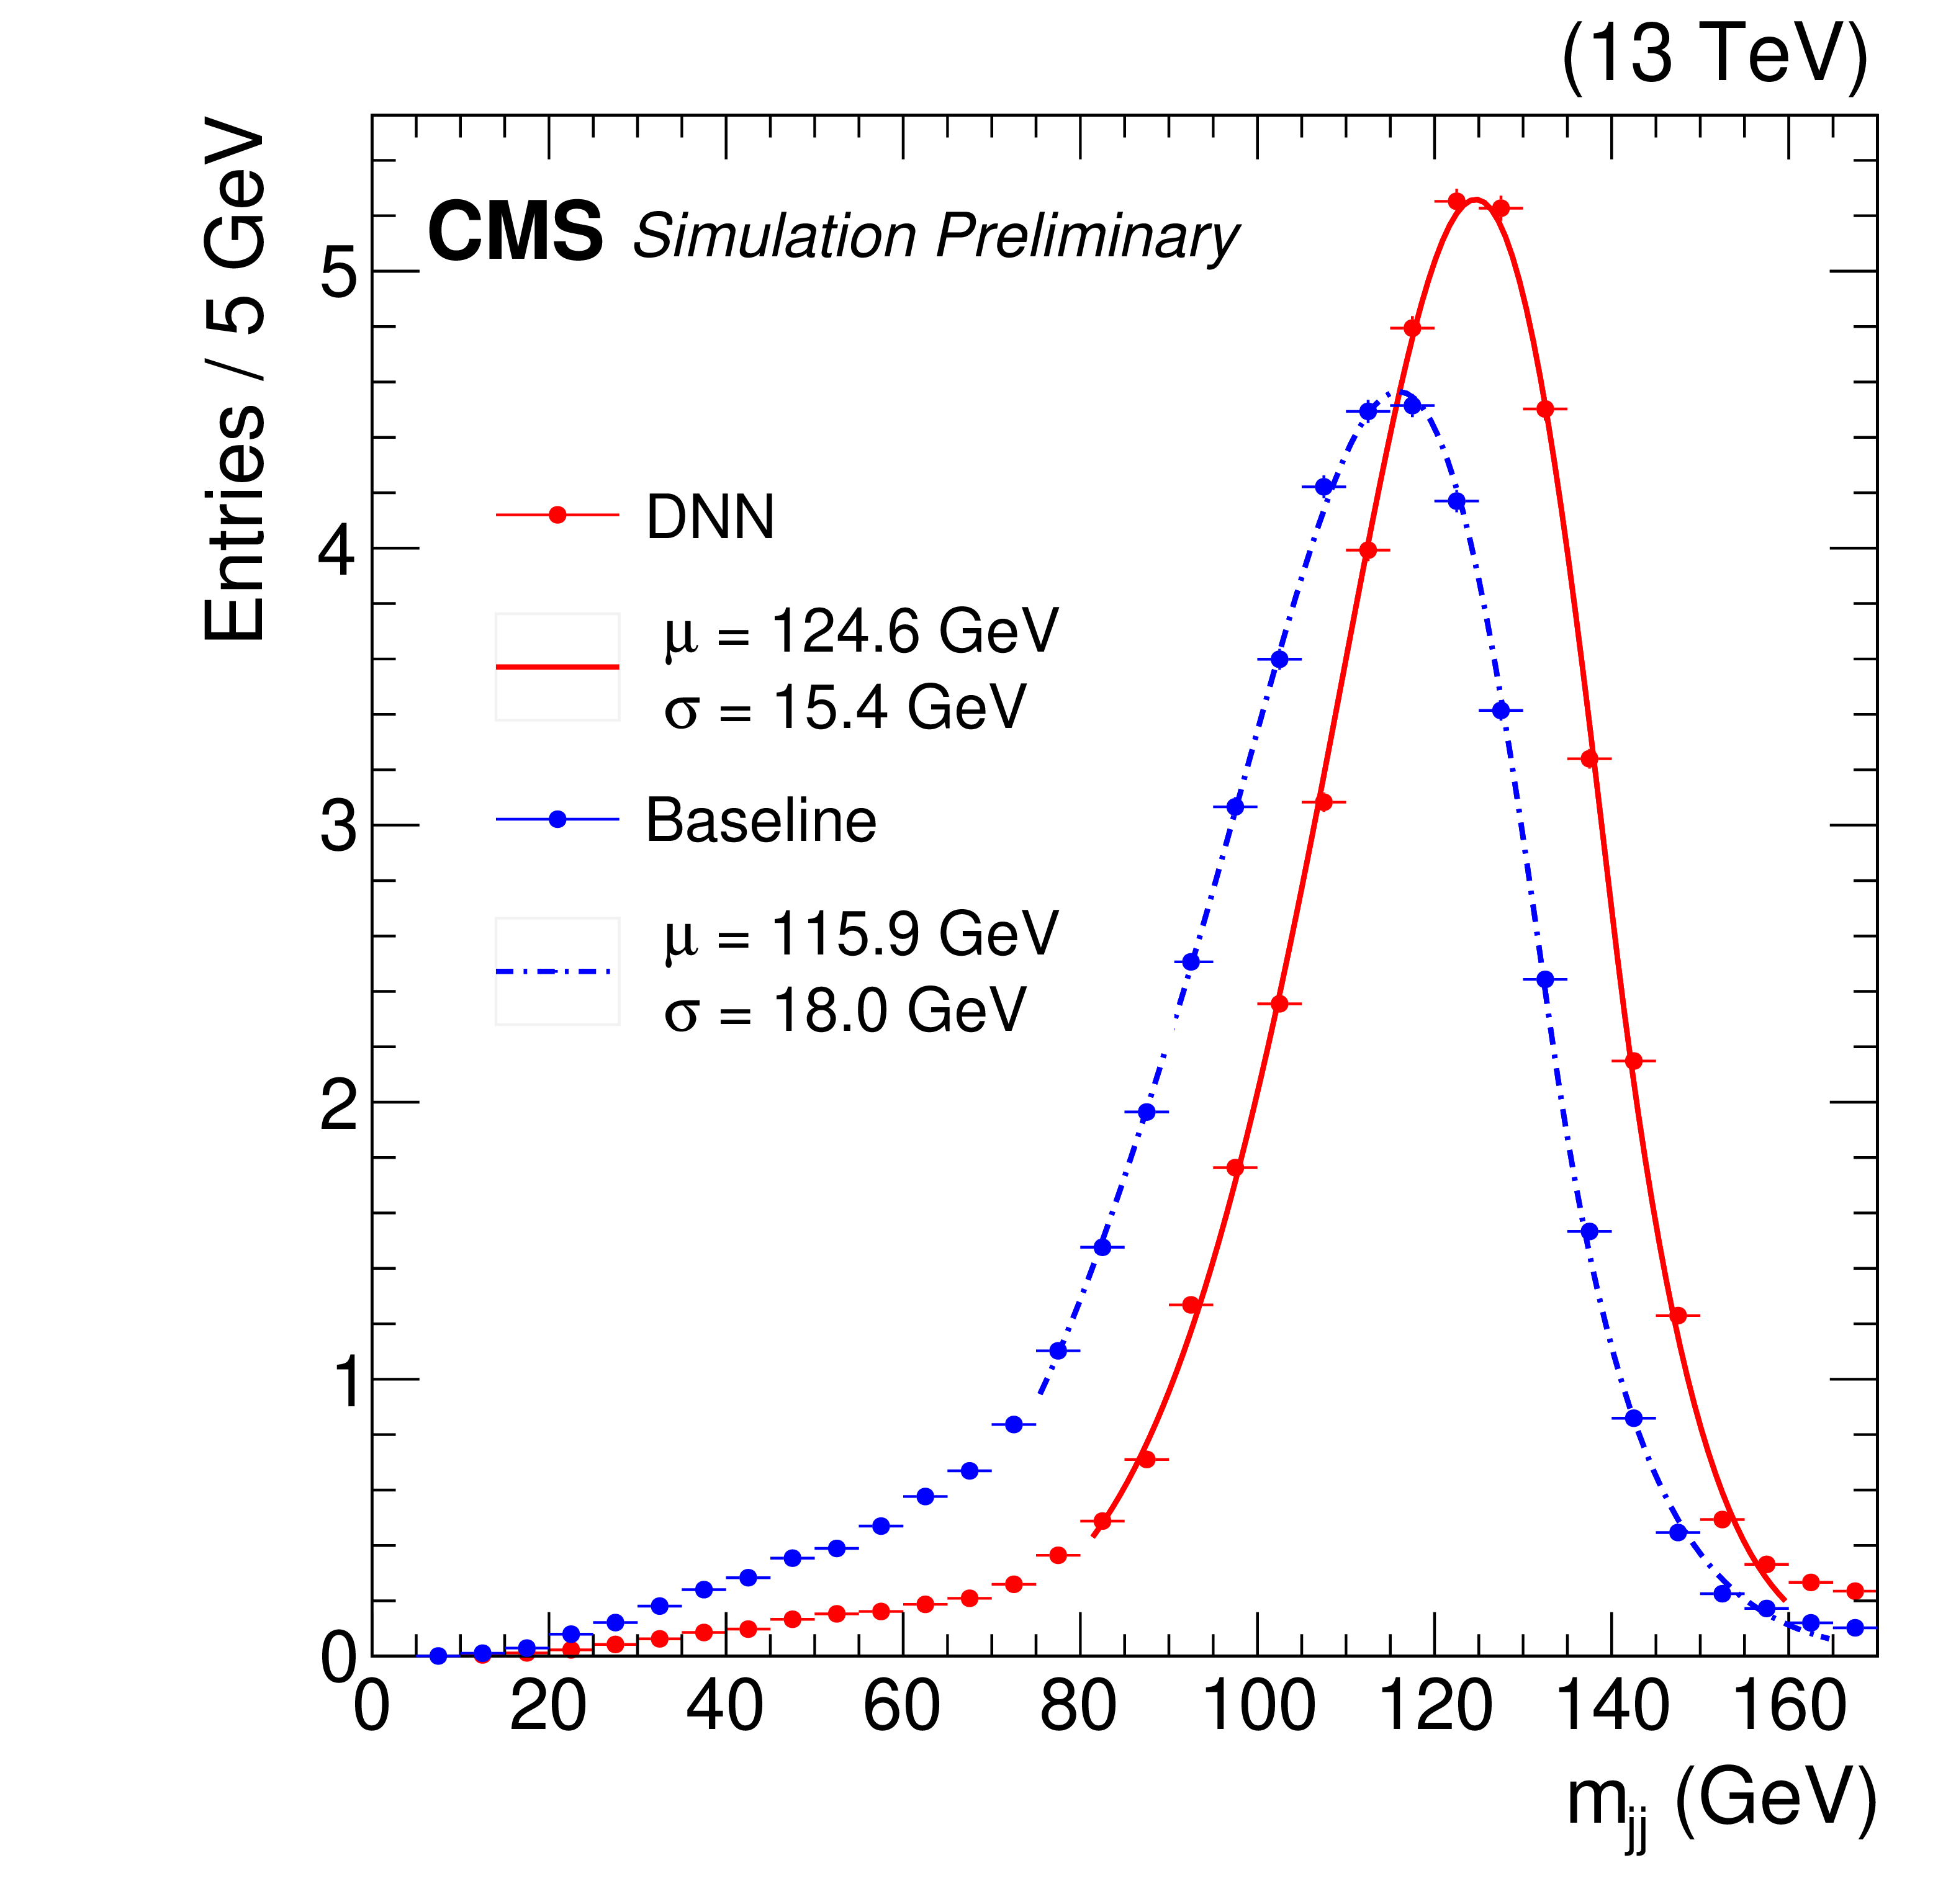
Figure 5:
Dijet invariant mass distributions for simulated samples of ${\mathrm{Z} (\to \ell ^+\ell ^-)\mathrm{H} (\to \mathrm{b} \mathrm{\bar{b}})}$ events, where two jets and two leptons were selected. Jets compatible with hadronization of b quarks were required to have ${p_{\mathrm {T}}} > $ 20 GeV and $ {| \eta |} < $ 2.4, leptons were required to have ${p_{\mathrm {T}}} > $ 20 GeV, and Z boson candidates constructed from lepton pairs were required to have ${p_{\mathrm {T}}} > $ 150 GeV. Distributions are shown before (dotted blue) and after (red line) applying the b jet energy corrections. A Bukin function [42] is used to fit the distribution. The fitted mean and width of the core of the distribution are displayed on the figure. |
png pdf |
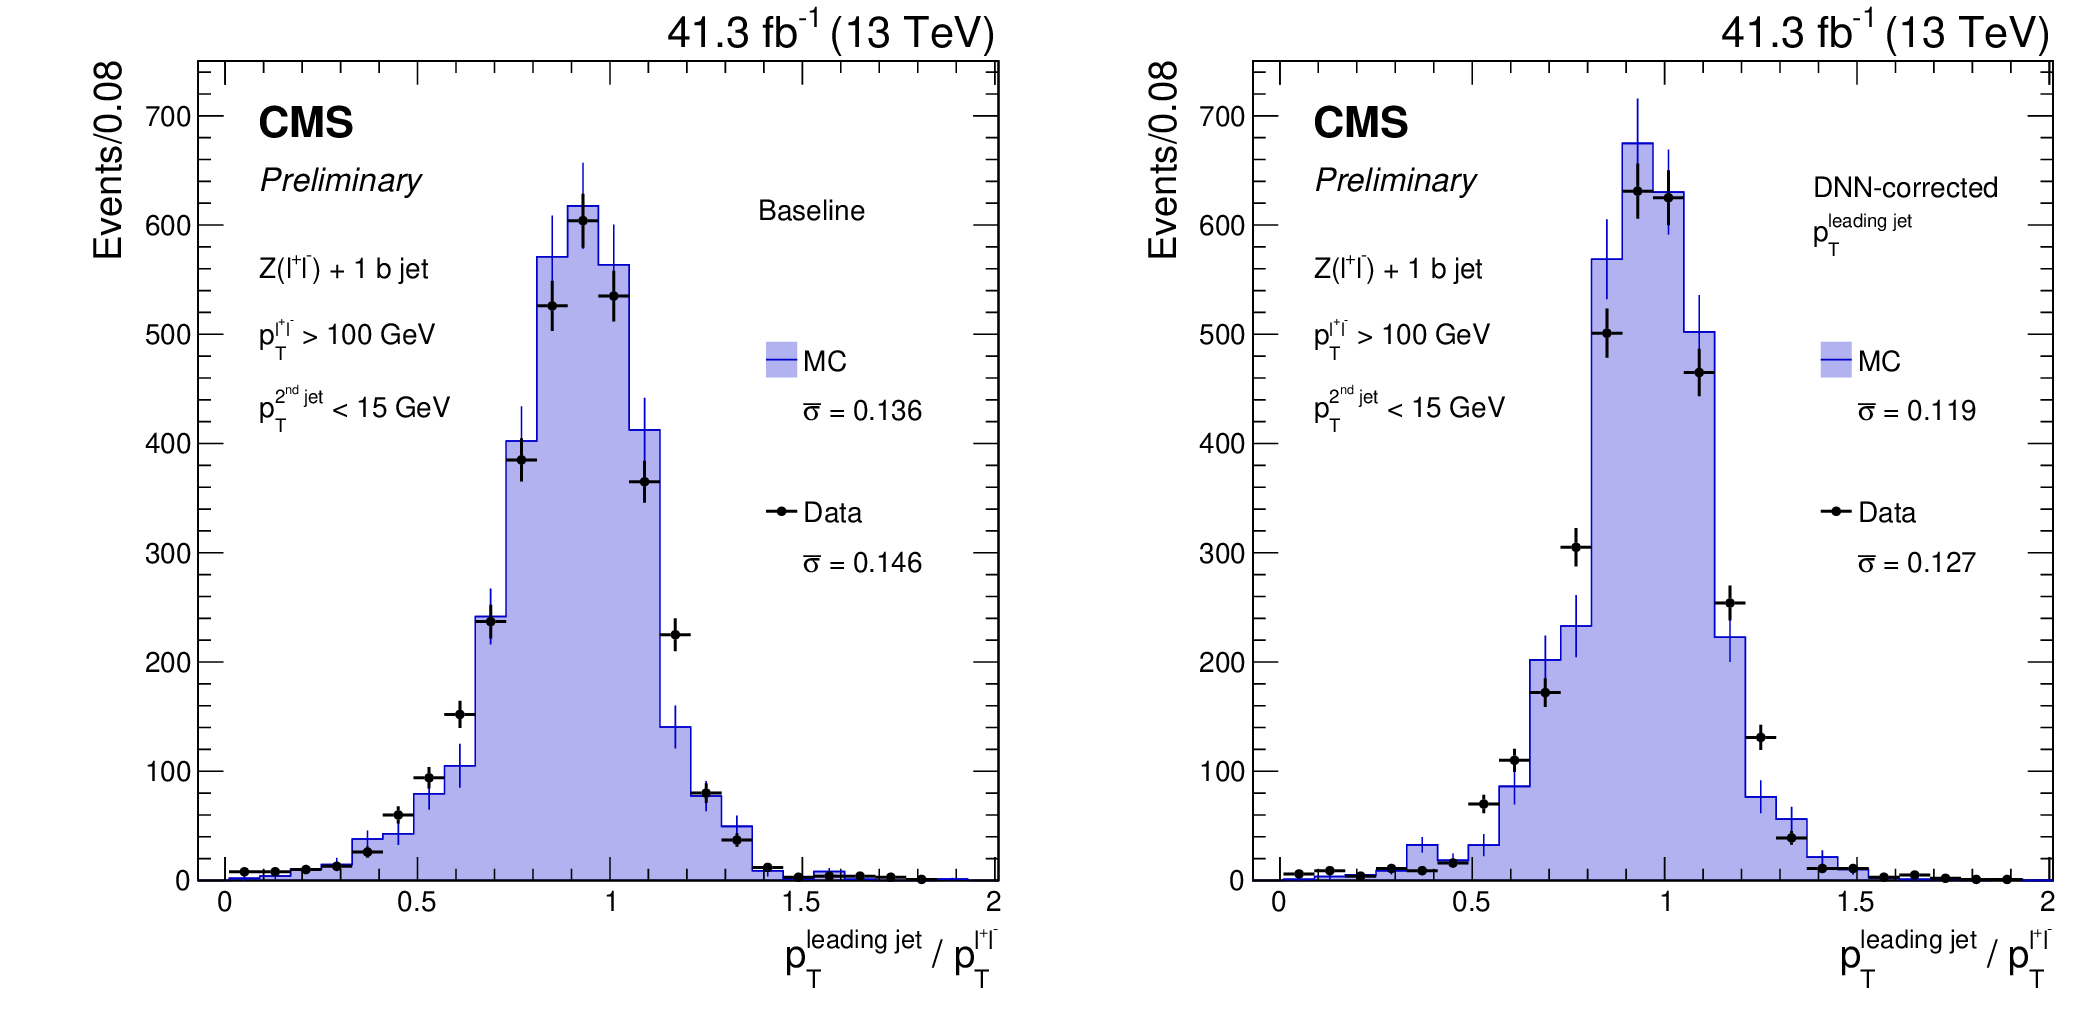
Figure 6:
Distribution of the ratio between the transverse momentum of the leading jet compatible with the hadronization of a b quark and that of the dilepton system from the Z boson decay. Distributions are shown before (left) and after (right) applying the b jet energy corrections. The mean and $\bar{\sigma}$ of the core of the distribution are displayed on the figures. The black points and histogram show the distributions for data and simulated events, respectively. |

png pdf |
Figure 6-a:
Distribution of the ratio between the transverse momentum of the leading jet compatible with the hadronization of a b quark and that of the dilepton system from the Z boson decay. Distributions are shown before applying the b jet energy corrections. The mean and $\bar{\sigma}$ of the core of the distribution are displayed on the figure. The black points and histogram show the distributions for data and simulated events, respectively. |

png pdf |
Figure 6-b:
Distribution of the ratio between the transverse momentum of the leading jet compatible with the hadronization of a b quark and that of the dilepton system from the Z boson decay. Distributions are shown after applying the b jet energy corrections. The mean and $\bar{\sigma}$ of the core of the distribution are displayed on the figure. The black points and histogram show the distributions for data and simulated events, respectively. |
| Tables | |
png pdf |
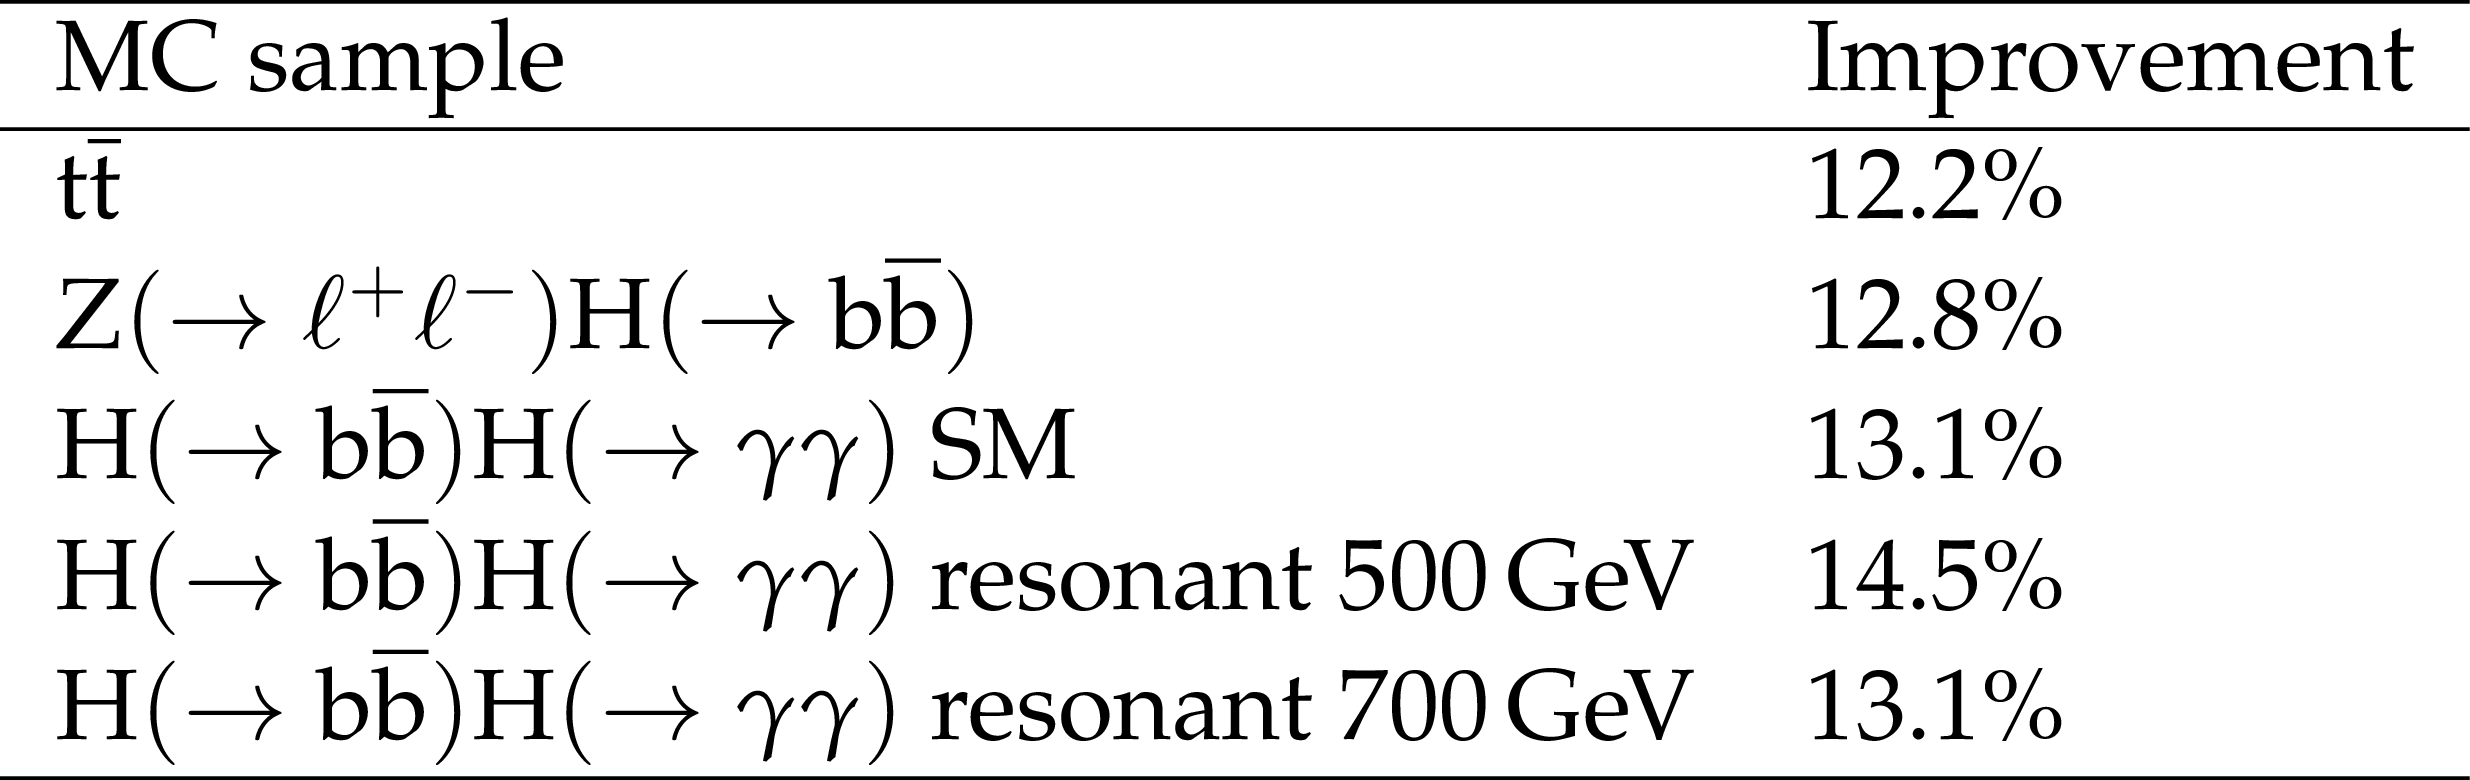
Table 1:
Relative differences between the $\bar{\sigma}$ values obtained before and after applying the DNN energy correction for b jets produced in the different physics processes indicated. |
| Summary |
|
We have described an algorithm that makes it possible to obtain point and dispersion estimates of the energy of jets arising from bottom quarks in proton-proton (pp) collisions at the LHC. We trained a deep feed-forward neural network, with inputs based on jet composition information and on properties of the associated reconstructed secondary vertices for a sample of simulated b jets arising from the decays of top quark-antiquark pairs. The neural network simultaneously finds a robust centroid estimator of the energy of a b jet, based on the Huber loss function, and estimators of the 25 and 75% quantiles. The algorithm leverages the information contained in a large training dataset consisting of nearly 100 million simulated b jets, and improves the b jet energy resolution by roughly 13% compared to baseline corrections. The improvement is also observed in samples of b jets coming from simulated Higgs boson decays. An improvement of about 20% is observed in the resolution of the invariant mass of b jet pairs resulting from the decay of a Higgs boson produced in association with a Z boson. Events containing a dilepton decay of a Z boson produced in association with a b jet are used to validate the performance of the algorithm based on proton-proton collision data recorded with the CMS detector. The jet energy resolution improvement observed in data is consistent with that found in simulation. The resolution estimator, defined as half the difference between the 75 and 25% quantiles of the target distribution, is further shown to predict the actual resolution of b jets with an accuracy better than 20% over a ${p_{\mathrm{T}}}$ range greater than an order of magnitude. The results of the algorithm described here are applied by the CMS Collaboration in several physics analyses targeting final states containing b jets, including the recently announced observation of the Higgs boson decay to a pair of b quarks [13]. |
| References | ||||
| 1 | ATLAS Collaboration | Observation of a new particle in the search for the standard model Higgs boson with the ATLAS detector at the LHC | PLB 716 (2012) 1 | 1207.7214 |
| 2 | CMS Collaboration | Observation of a new boson at a mass of 125 GeV with the CMS experiment at the LHC | PLB 716 (2012) 30 | CMS-HIG-12-028 1207.7235 |
| 3 | CMS Collaboration | A New Boson with a Mass of 125 GeV Observed with the CMS Experiment at the Large Hadron Collider | Science 338 (Sep, 2012) 1569 | |
| 4 | ATLAS Collaboration | Measurements of Higgs boson production and couplings in the four-lepton channel in pp collisions at center-of-mass energies of 7 and 8 TeV with the ATLAS detector | PRD 91 (2015) 012006 | 1408.5191 |
| 5 | ATLAS Collaboration | Observation and measurement of Higgs boson decays to WW$ ^* $ with the ATLAS detector | PRD 92 (2015) 012006 | 1412.2641 |
| 6 | ATLAS Collaboration | Measurement of Higgs boson production in the diphoton decay channel in pp collisions at center-of-mass energies of 7 and 8 TeV with the ATLAS detector | PRD 90 (2014) 112015 | 1408.7084 |
| 7 | CMS Collaboration | Measurement of the properties of a Higgs boson in the four-lepton final state | PRD 89 (2014) 092007 | CMS-HIG-13-002 1312.5353 |
| 8 | CMS Collaboration | Measurement of Higgs boson production and properties in the WW decay channel with leptonic final states | JHEP 01 (2014) 096 | CMS-HIG-13-023 1312.1129 |
| 9 | CMS Collaboration | Observation of the diphoton decay of the Higgs boson and measurement of its properties | EPJC 74 (2014) 3076 | CMS-HIG-13-001 1407.0558 |
| 10 | CMS Collaboration | Observation of the Higgs boson decay to a pair of $ \tau $ leptons with the CMS detector | PLB 779 (2018) 283 | CMS-HIG-16-043 1708.00373 |
| 11 | ATLAS Collaboration | Observation of Higgs boson production in association with a top quark pair at the LHC with the ATLAS detector | PLB 784 (2018) 173 | 1806.00425 |
| 12 | CMS Collaboration | Observation of $ \mathrm{t\overline{t}} $H production | PRL 120 (2018) 231801 | CMS-HIG-17-035 1804.02610 |
| 13 | CMS Collaboration | Observation of Higgs boson decay to bottom quarks | PRL 121 (2018) 121801 | CMS-HIG-18-016 1808.08242 |
| 14 | ATLAS Collaboration | Observation of $ \mathrm{H \rightarrow \mathrm{b\bar{b}}} $ decays and VH production with the ATLAS detector | PLB 786 (2018) 59 | 1808.08238 |
| 15 | CDF, D0 Collaboration | Improved b-jet energy correction for $ \mathrm{H \to \mathrm{b\bar{b}}} $ Searches at CDF | 1107.3026 | |
| 16 | CMS Collaboration | Performance of photon reconstruction and identification with the CMS Detector in proton-proton collisions at $ \sqrt{s} = $ 8 TeV | JINST 10 (2015) P08010 | CMS-EGM-14-001 1502.02702 |
| 17 | CMS Collaboration | Performance of electron reconstruction and selection with the CMS detector in proton-proton collisions at $ \sqrt{s} = $ 8 TeV | JINST 10 (2015) P06005 | CMS-EGM-13-001 1502.02701 |
| 18 | ATLAS Collaboration | Electron and photon energy calibration with the ATLAS detector using LHC Run 1 data | EPJC 74 (2014) 3071 | 1407.5063 |
| 19 | CMS Collaboration | Performance of missing transverse momentum reconstruction in proton-proton collisions at $ \sqrt{s} = $ 13 TeV using the CMS detector | JINST 14 (2019), no. 07, P07004 | CMS-JME-17-001 1903.06078 |
| 20 | CMS Collaboration | Search for the standard model Higgs boson produced through vector boson fusion and decaying to $ \mathrm{b\bar{b}} $ | PRD 92 (2015) 032008 | CMS-HIG-14-004 1506.01010 |
| 21 | P. J. Huber | Robust estimation of a location parameter | Ann. Math. Statist. 35 (1994) 731 | |
| 22 | R. W. Koenker and G. Bassett | Regression quantiles | Econometrica 46 (1978), no. 1, 3 | |
| 23 | CMS Collaboration | The CMS Experiment at the CERN LHC | JINST 3 (2008) S08004 | CMS-00-001 |
| 24 | CMS Collaboration | Particle-flow reconstruction and global event description with the CMS detector | JINST 12 (2017) P10003 | CMS-PRF-14-001 1706.04965 |
| 25 | M. Cacciari, G. P. Salam, and G. Soyez | The anti-$ {k_{\mathrm{T}}} $ jet clustering algorithm | JHEP 04 (2008) 063 | 0802.1189 |
| 26 | M. Cacciari, G. P. Salam, and G. Soyez | FastJet user Manual | EPJC 72 (2012) 1896 | 1111.6097 |
| 27 | CMS Collaboration | Determination of jet energy calibration and transverse momentum resolution in CMS | JINST 6 (2011) P11002 | CMS-JME-10-011 1107.4277 |
| 28 | J. M. Campbell, R. K. Ellis, P. Nason, and E. Re | Top-Pair production and decay at NLO matched with parton showers | JHEP 04 (2015) 114 | 1412.1828 |
| 29 | J. Alwall et al. | The automated computation of tree-level and next-to-leading order differential cross sections, and their matching to parton shower simulations | JHEP 07 (2014) 079 | 1405.0301 |
| 30 | T. Sjostrand et al. | An Introduction to PYTHIA 8.2 | CPC 191 (2015) 159 | 1410.3012 |
| 31 | CMS Collaboration | Event generator tunes obtained from underlying event and multiparton scattering measurements | EPJC 76 (2016) 155 | CMS-GEN-14-001 1512.00815 |
| 32 | GEANT4 Collaboration | GEANT4: A Simulation toolkit | NIM506 (2003) 250 | |
| 33 | M. Cacciari and G. P. Salam | Pileup subtraction using jet areas | PLB659 (2008) 119 | 0707.1378 |
| 34 | CMS Collaboration | Description and performance of track and primary-vertex reconstruction with the CMS tracker | JINST 9 (May, 2014) P10009 | |
| 35 | CMS Collaboration | Identification of heavy-flavour jets with the CMS detector in pp collisions at 13 TeV | JINST 13 (2018) P05011 | CMS-BTV-16-002 1712.07158 |
| 36 | S. Ioffe and C. Szegedy | Batch normalization: accelerating deep network training by reducing internal covariate shift | 1502.03167 | |
| 37 | A. L. Maas et al. | Rectifier nonlinearities improve neural network acoustic models | 2013 | |
| 38 | F. Chollet et al. | Keras | link | |
| 39 | M. Abadi et al. | TensorFlow: Large-scale machine learning on heterogeneous systems | 2015 Software available from tensorflow.org. \url http://tensorflow.org/ | |
| 40 | D. P. Kingma and J. Ba | Adam: A method for stochastic optimization | 1412.6980 | |
| 41 | J. F. Trevor Hastie, Robert Tibshirani | The Elements of Statistical Learning | Springer-Verlag New York, 2nd edition | |
| 42 | A. D. Bukin | Fitting function for asymmetric peaks | arXiv e-prints (November, 2007) | 0711.4449 |
| 43 | CMS Collaboration | Performance of the CMS missing transverse momentum reconstruction in pp data at $ \sqrt{s} = $ 8 TeV | JINST 10 (2015), no. 02, P02006 | CMS-JME-13-003 1411.0511 |
|
|
Compact Muon Solenoid LHC, CERN |
|

|

|

|

|

|