

Compact Muon Solenoid
LHC, CERN
| CMS-PAS-EXO-21-013 | ||
| Search for long-lived heavy neutral leptons with lepton flavour conserving or violating decays to a jet and an electron, muon, or tau lepton | ||
| CMS Collaboration | ||
| 18 March 2023 | ||
| Abstract: A search for long-lived heavy neutral leptons (HNLs) is presented, which considers coupling scenarios involving all three lepton generations. Events containing two leptons (electron or muon) and jets are analysed in a data sample of proton-proton collisions corresponding to an integrated luminosity of 138 fb$^{-1}$. A novel jet tagger, based on a deep neural network, has been developed to identify jets from a HNL decay using various features of the jet and its constituent particles. The network can be used as a powerful discriminant to probe a broad range of HNL lifetimes and masses. Contributions from background processes are determined from data in sideband regions. No excess of events in data over the expected background is observed. Limits on the HNL production cross section are derived as a function of the HNL mass and the three coupling strengths $ V_{l\textrm{N}} $ to each lepton generation $ l $. The best limit on the coupling strength is obtained for pure muon coupling scenarios excluding values of $ |V_{\mu\textrm{N}}|^{2} > $ 5 (4) $\times$ 10$^{-7} $ for Dirac (Majorana) HNLs with a mass of 10 GeV at 95% CL. | ||
|
Links:
CDS record (PDF) ;
CADI line (restricted) ;
These preliminary results are superseded in this paper, JHEP 03 (2024) 105. The superseded preliminary plots can be found here. |
||
| Figures | |
png pdf |
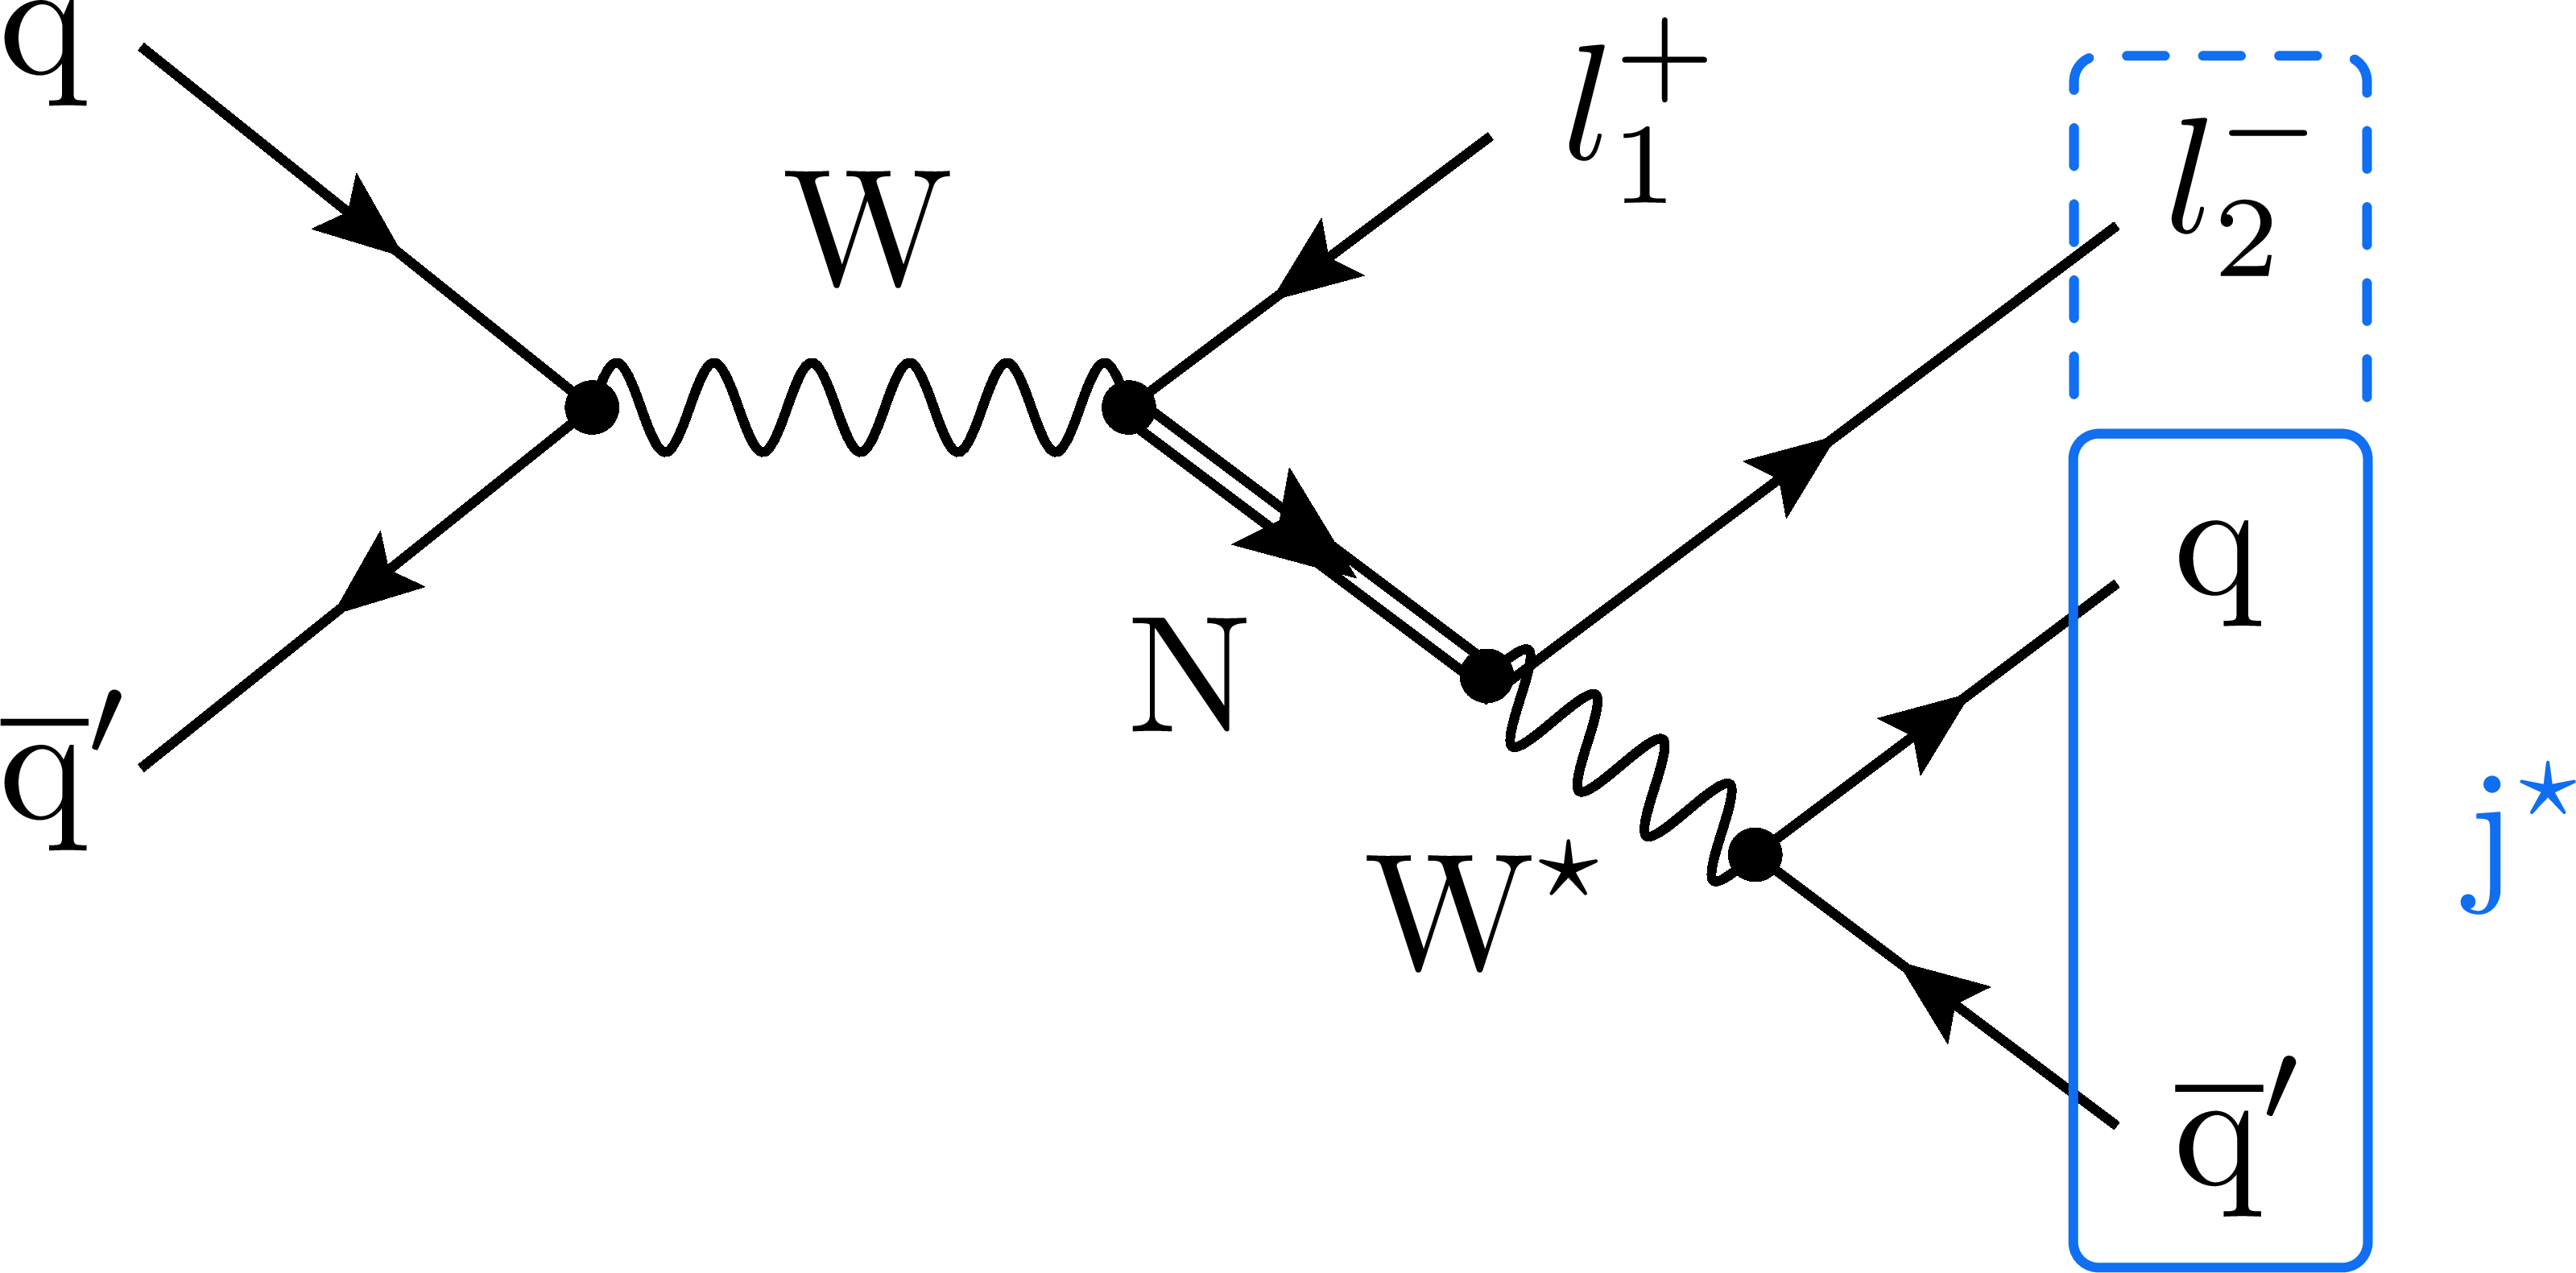
Figure 1:
Born-level Feynman diagram for Dirac HNL production and decay via charged currents. Corresponding diagrams exist also for Dirac anti-HNL and Majorana HNL productions and decays. |
png pdf |
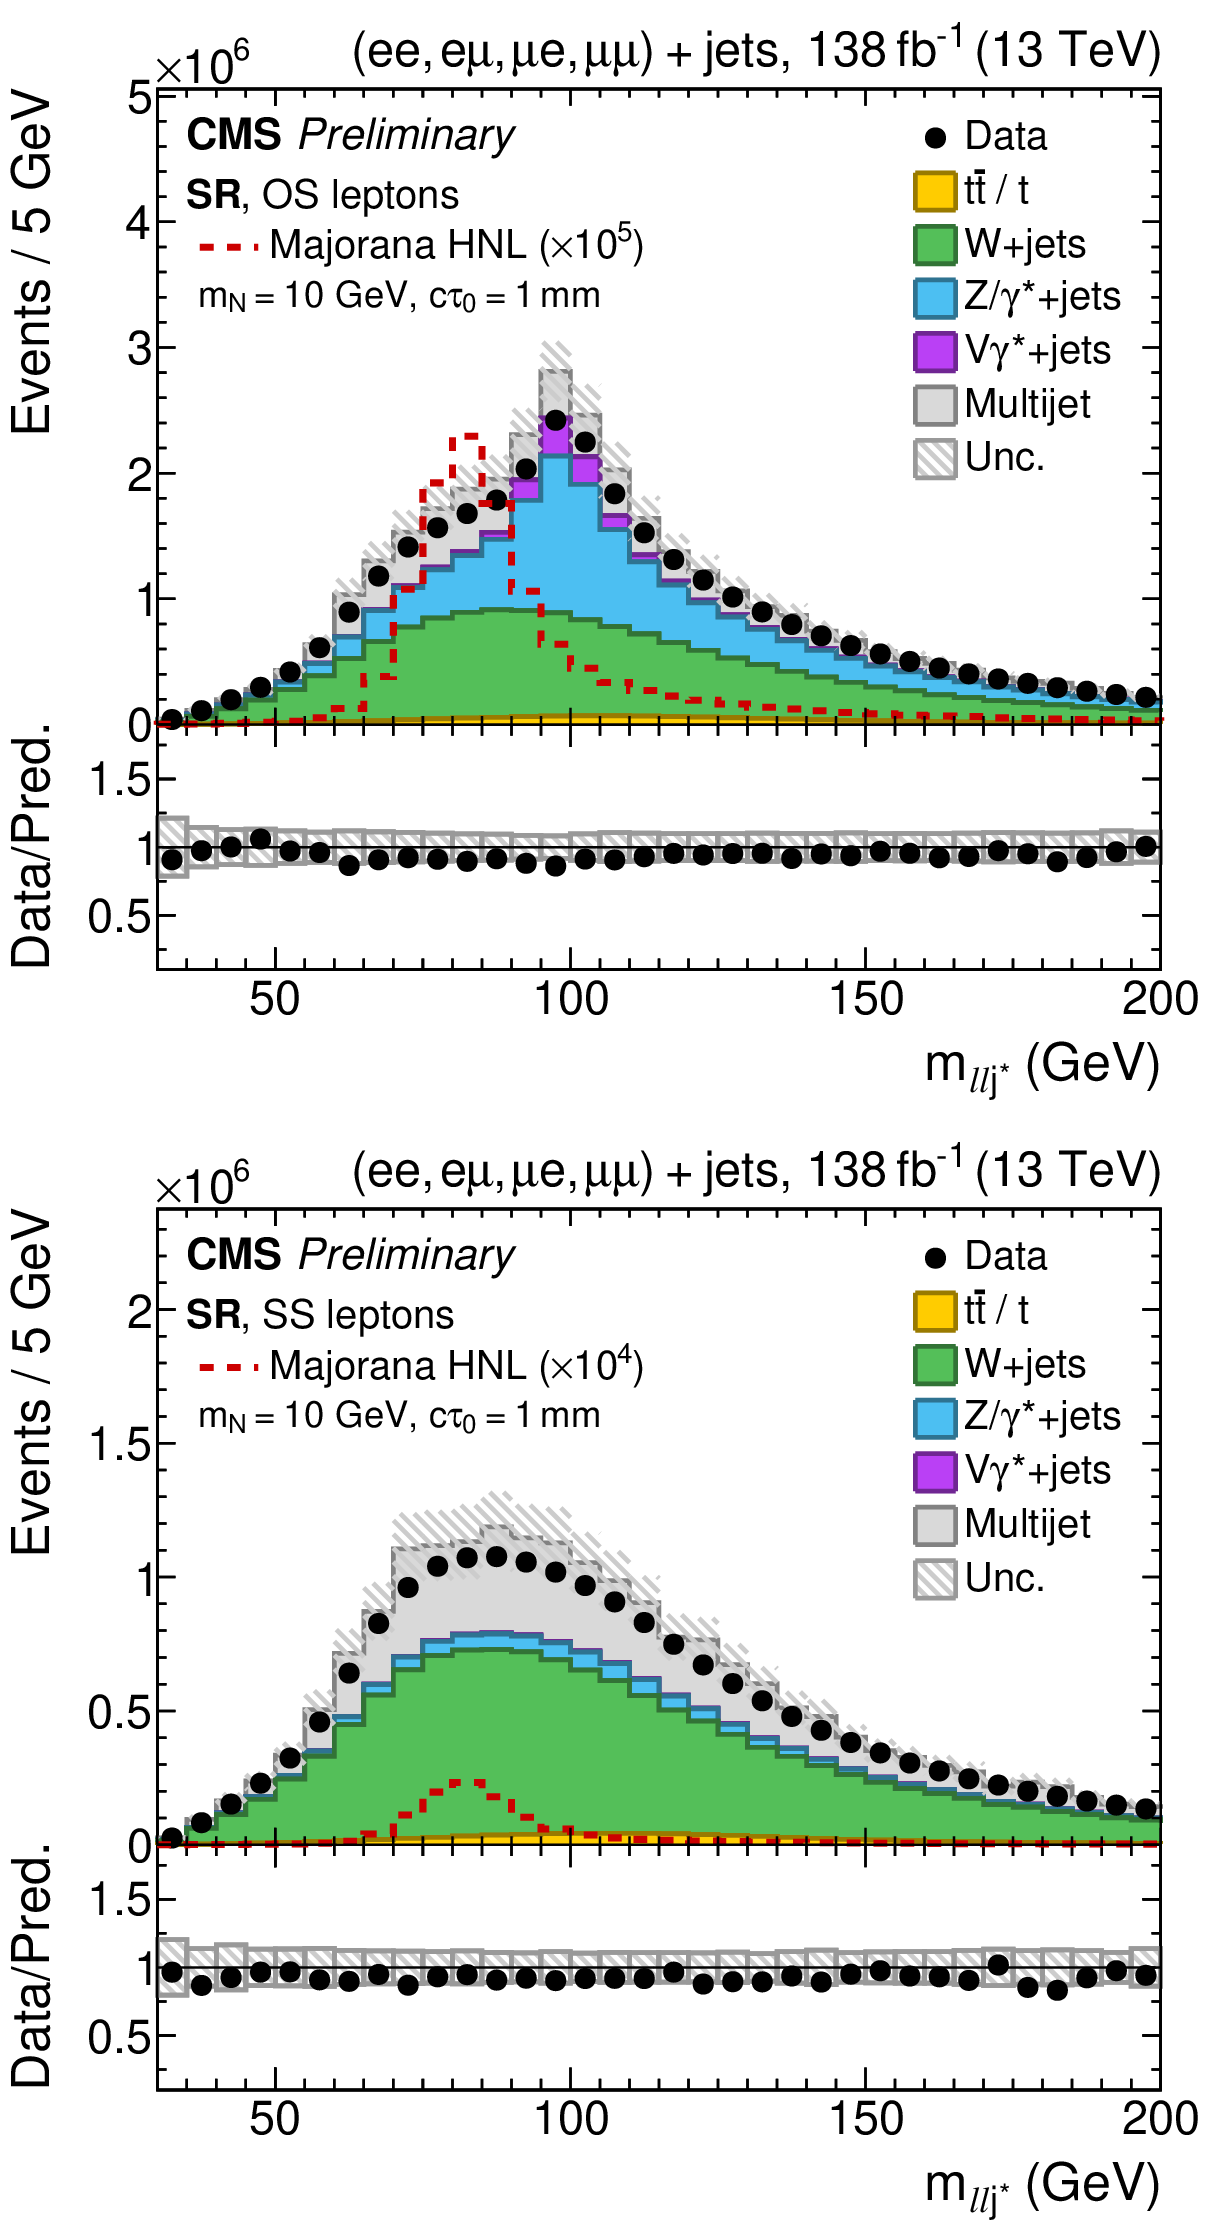
Figure 2:
Distributions of $ m_{ll\textrm{j}^{\star}} $ for events with (left) opposite-sign (OS) and (right) same-sign (SS) leptons in the signal region. A representative signal scenario for Majorana HNL production with equal coupling to all lepton generations is overlaid with its expected cross section scaled up as indicated. The hatched band shows the total experimental systematic uncertainty on the simulated samples. |
png pdf |
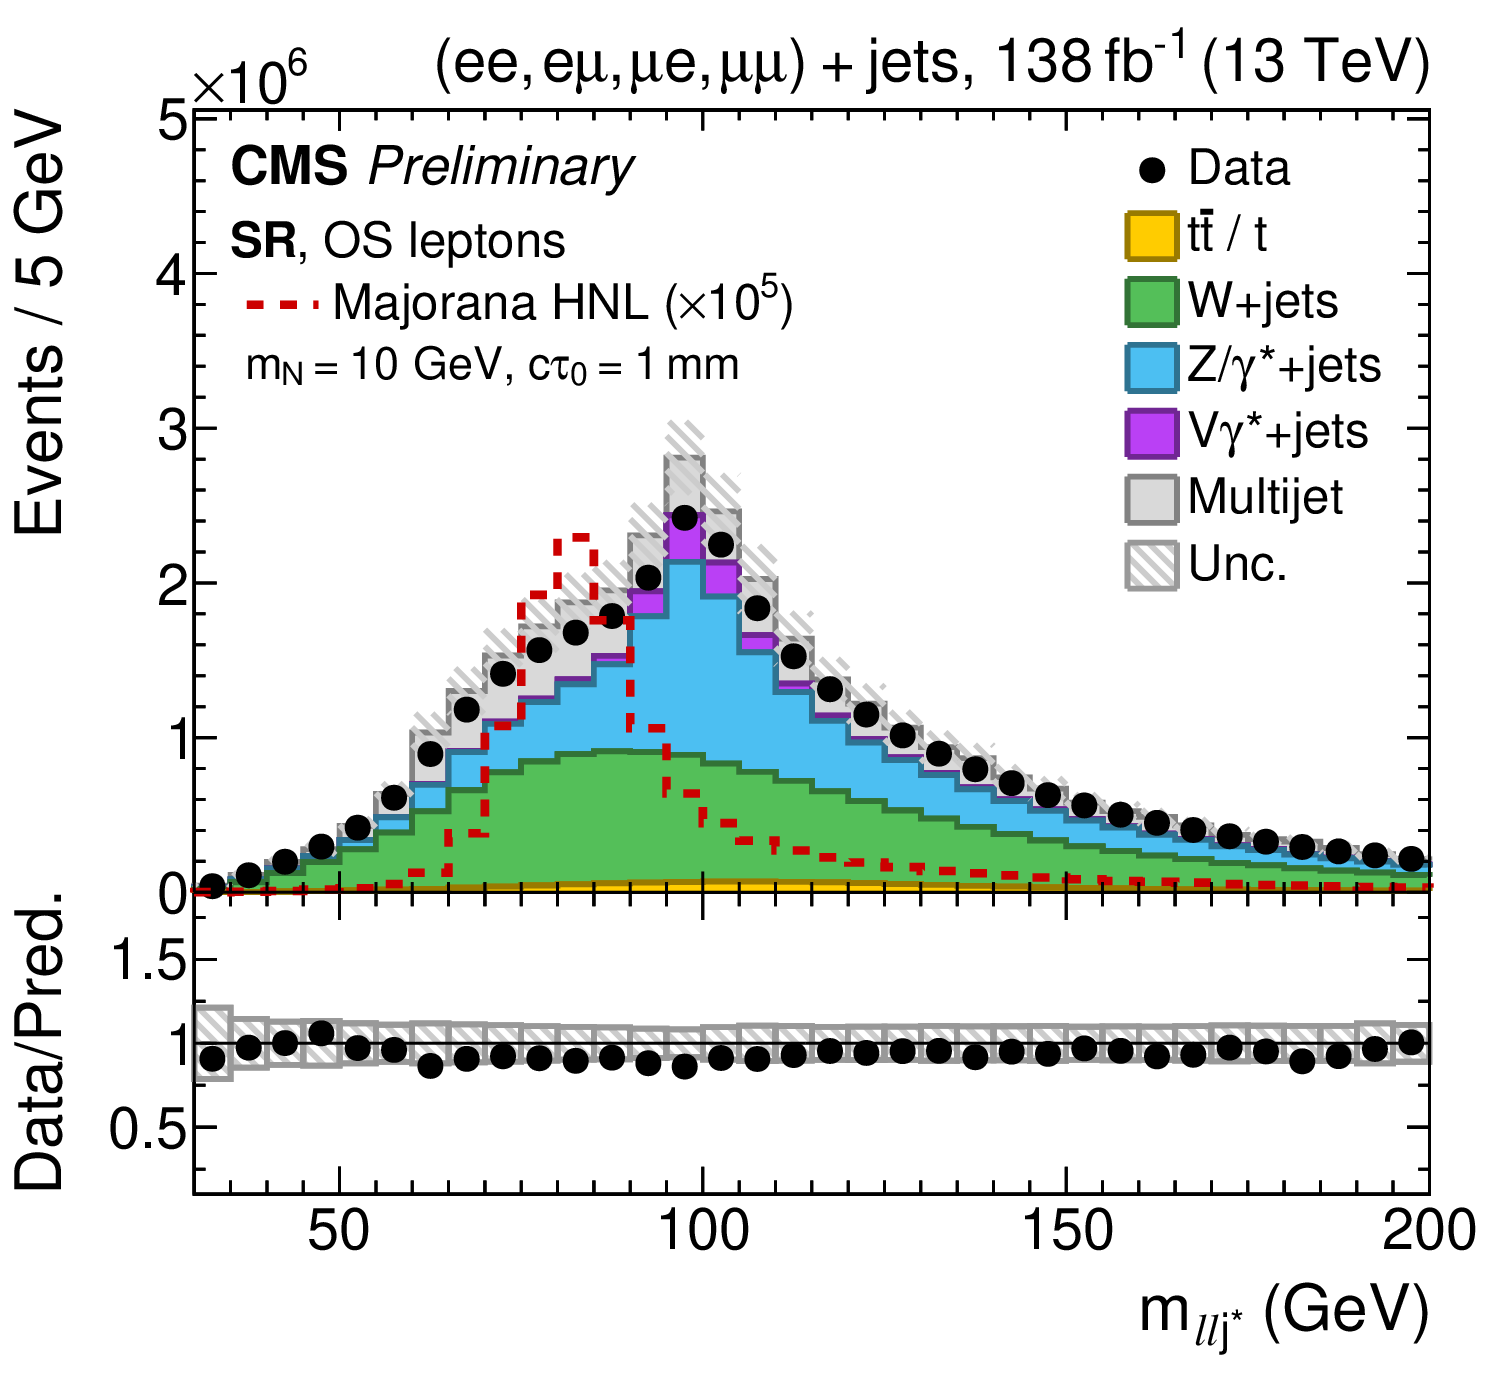
Figure 2-a:
Distributions of $ m_{ll\textrm{j}^{\star}} $ for events with (left) opposite-sign (OS) and (right) same-sign (SS) leptons in the signal region. A representative signal scenario for Majorana HNL production with equal coupling to all lepton generations is overlaid with its expected cross section scaled up as indicated. The hatched band shows the total experimental systematic uncertainty on the simulated samples. |
png pdf |
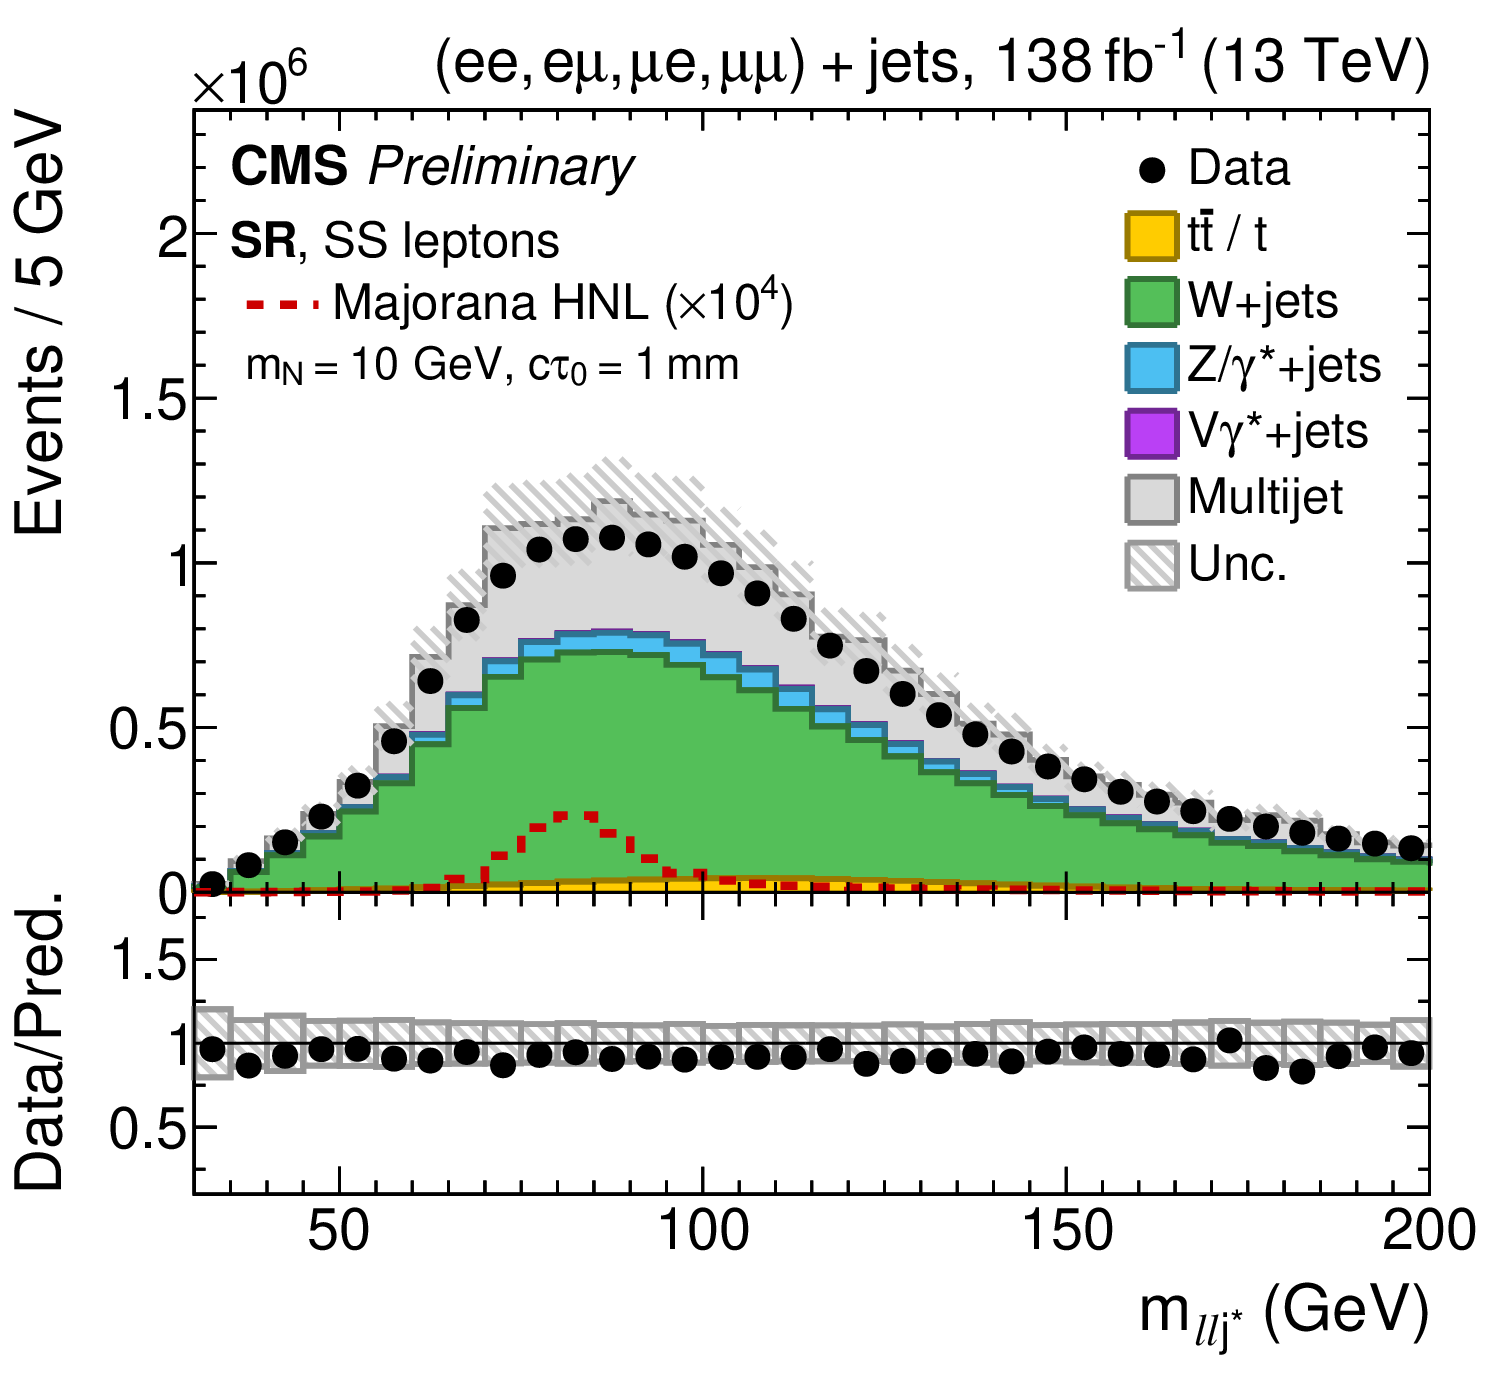
Figure 2-b:
Distributions of $ m_{ll\textrm{j}^{\star}} $ for events with (left) opposite-sign (OS) and (right) same-sign (SS) leptons in the signal region. A representative signal scenario for Majorana HNL production with equal coupling to all lepton generations is overlaid with its expected cross section scaled up as indicated. The hatched band shows the total experimental systematic uncertainty on the simulated samples. |
png pdf |
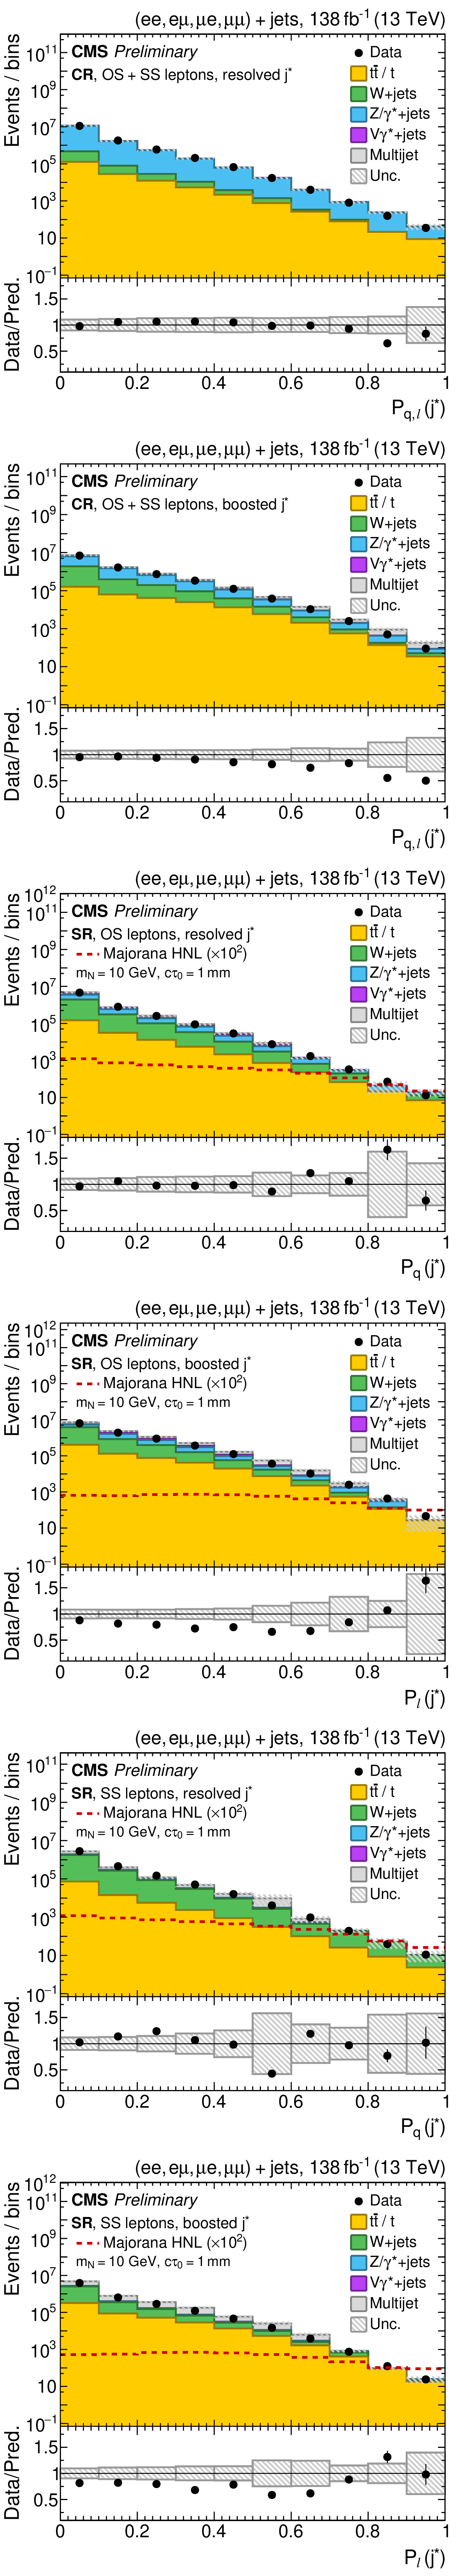
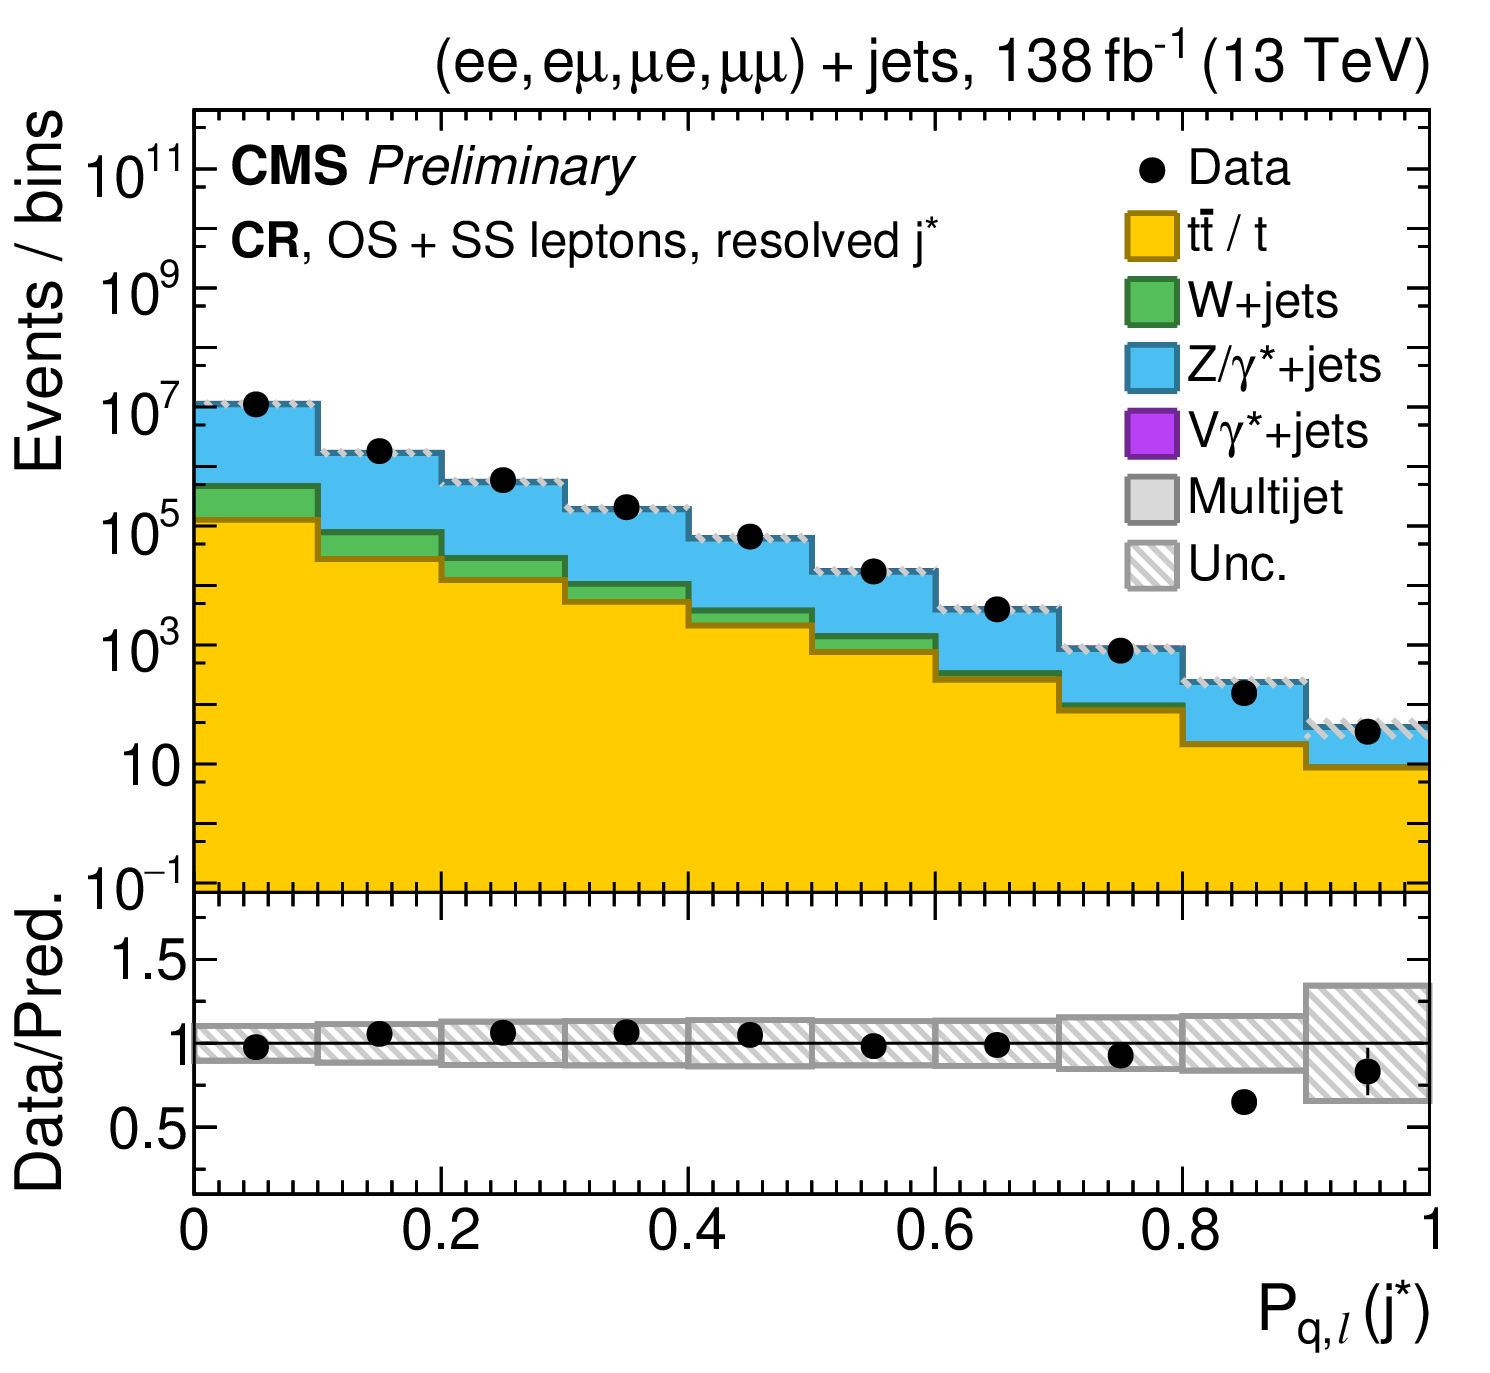
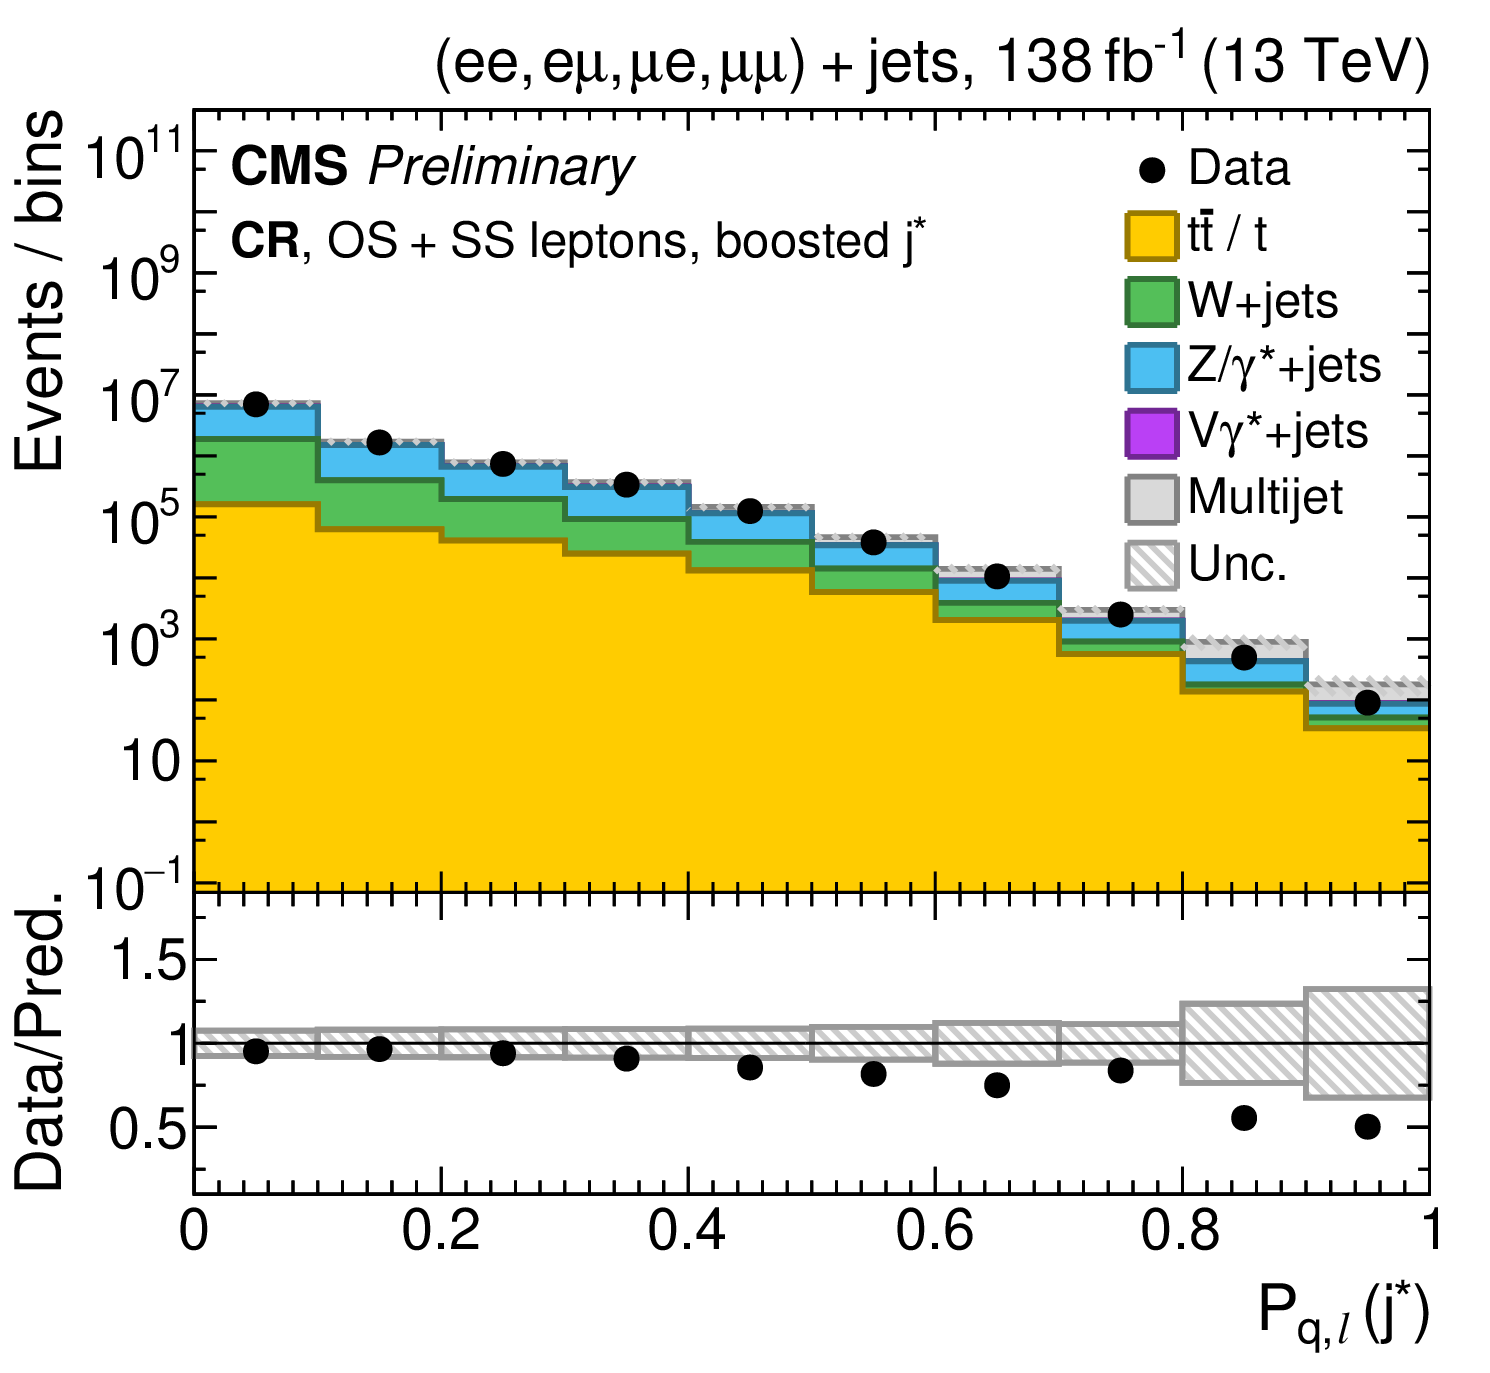
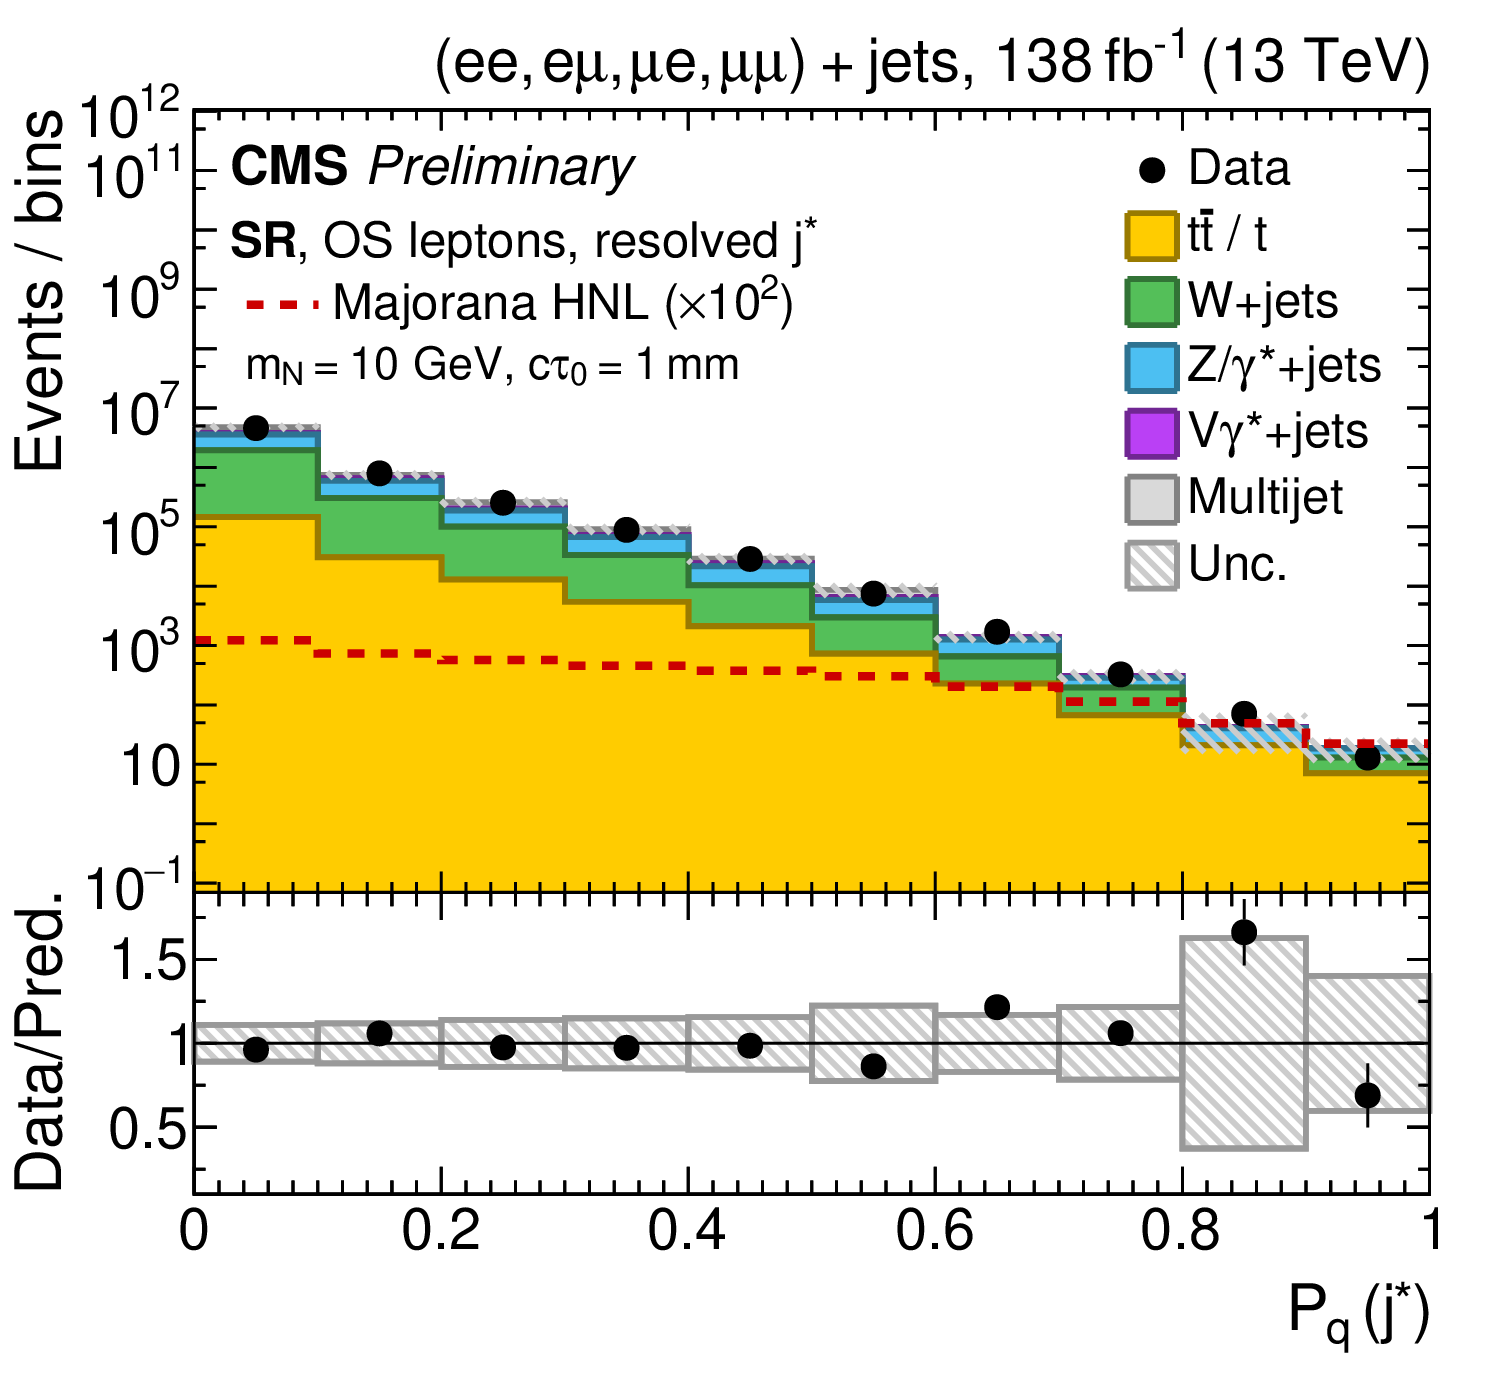
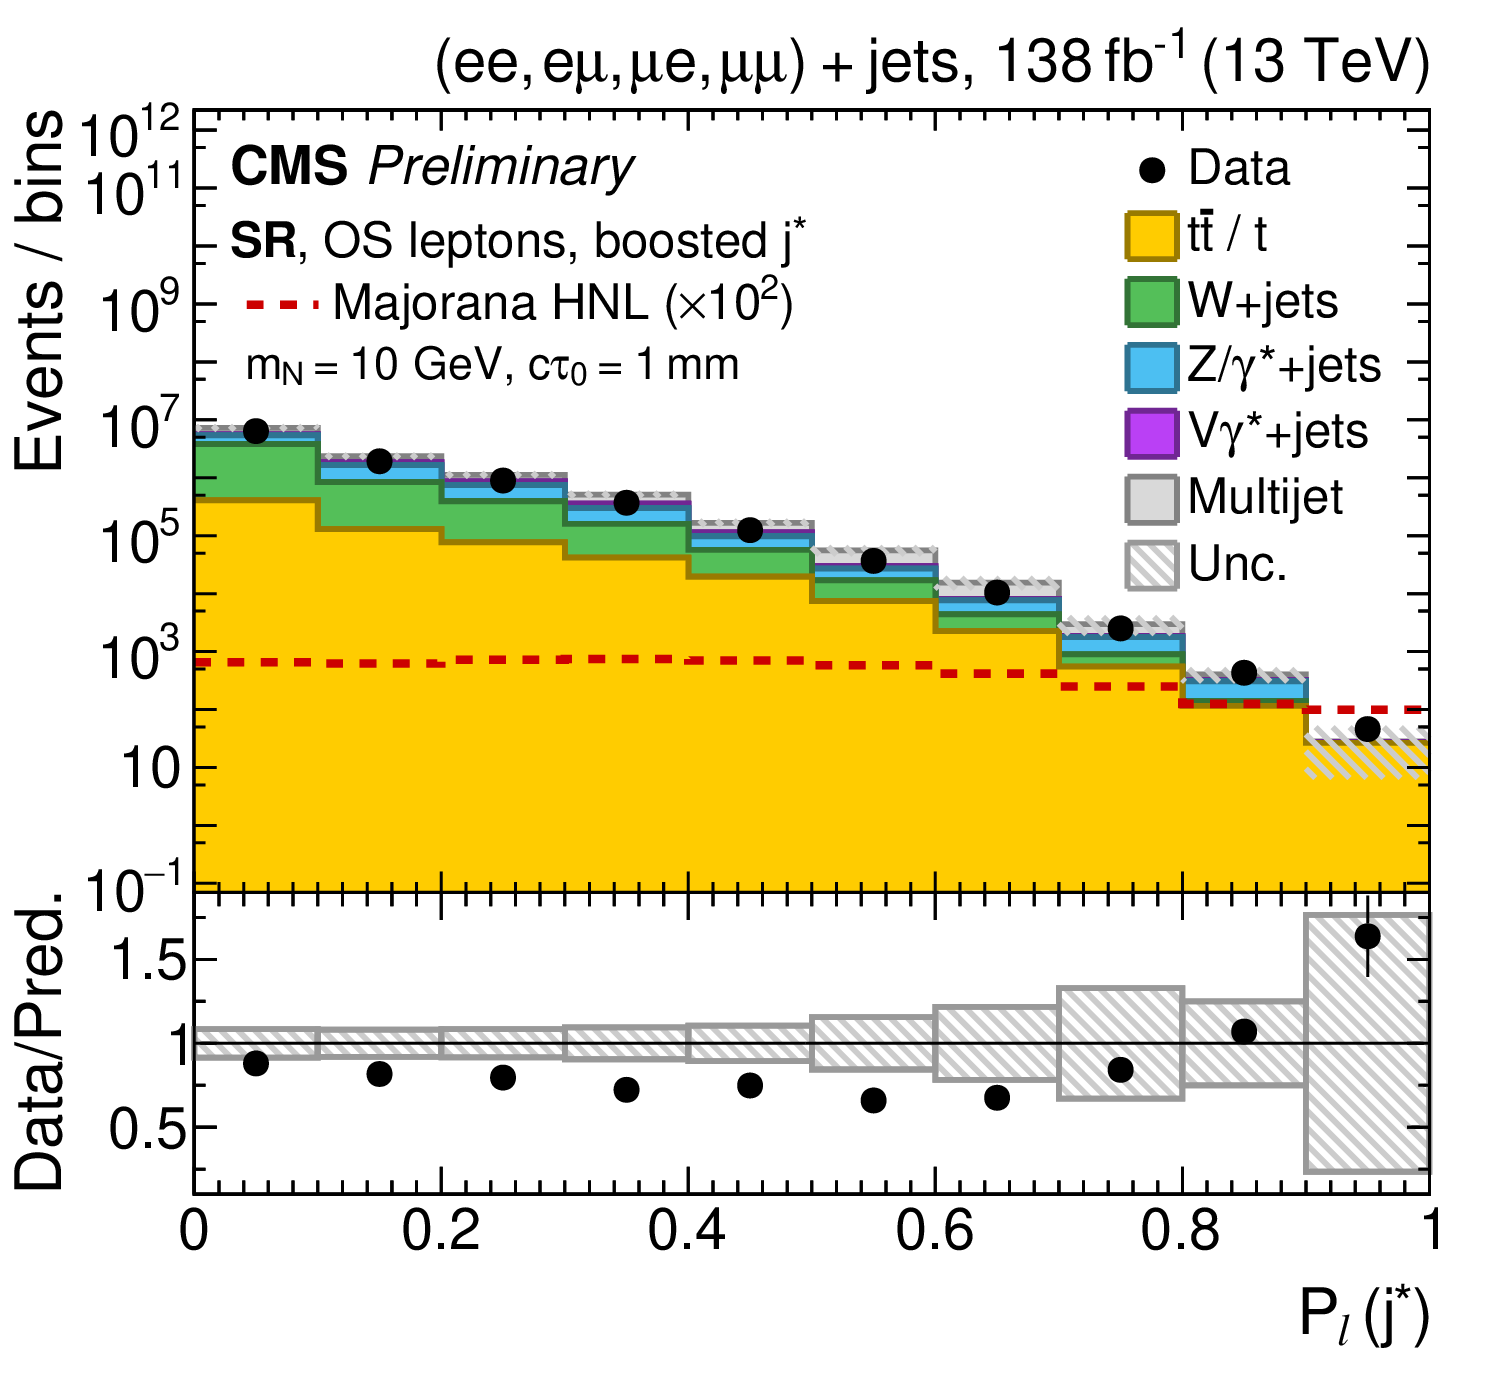
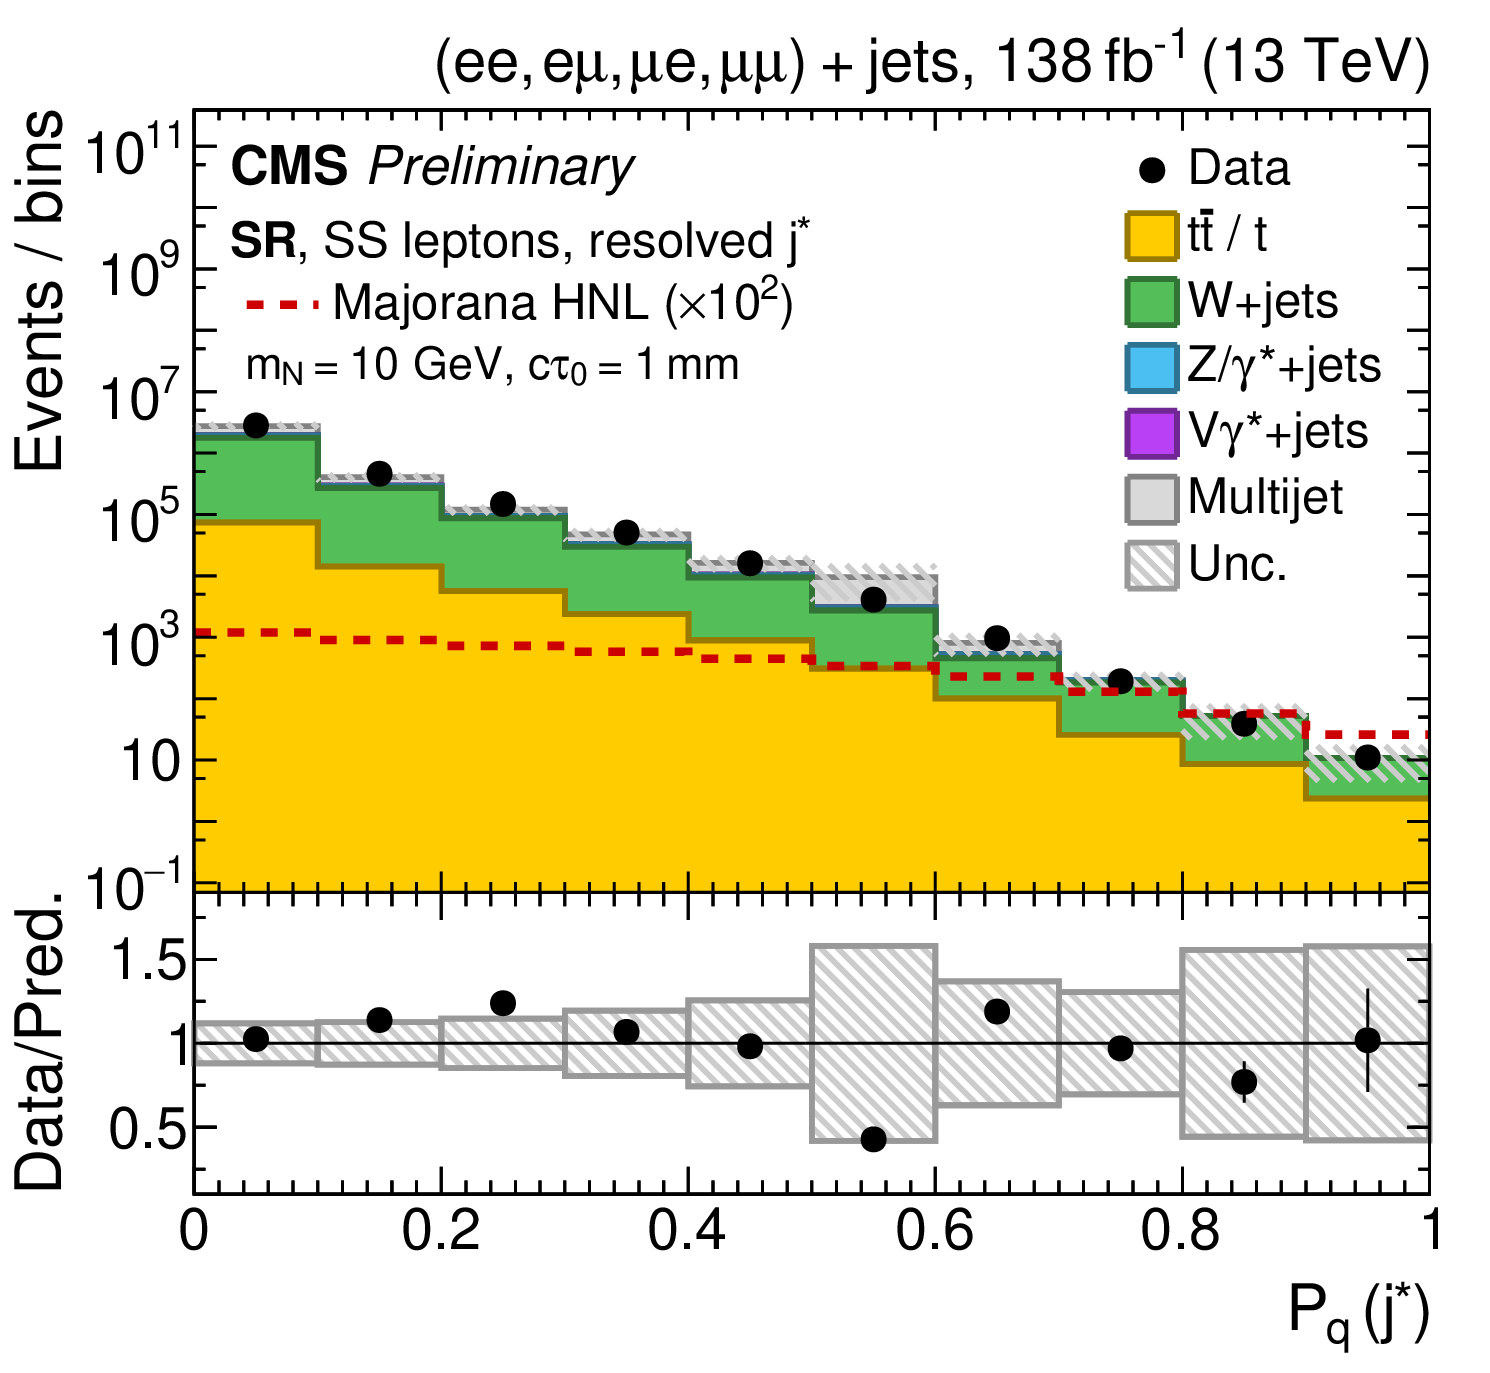
Figure 3:
Distributions of the displaced jet tagging score for (left) resolved and (right) boosted jets: (top row) control region; (middle row) signal region with opposite-sign (OS) leptons; (bottom row) signal region with same-sign (SS) leptons. A representative signal scenario for Majorana HNL production with equal coupling to all lepton generations is overlaid with its expected cross section scaled up as indicated. The hatched band shows the total experimental systematic uncertainty on the simulated samples. |
png pdf |
Figure 3-a:
Distributions of the displaced jet tagging score for (left) resolved and (right) boosted jets: (top row) control region; (middle row) signal region with opposite-sign (OS) leptons; (bottom row) signal region with same-sign (SS) leptons. A representative signal scenario for Majorana HNL production with equal coupling to all lepton generations is overlaid with its expected cross section scaled up as indicated. The hatched band shows the total experimental systematic uncertainty on the simulated samples. |
png pdf |
Figure 3-b:
Distributions of the displaced jet tagging score for (left) resolved and (right) boosted jets: (top row) control region; (middle row) signal region with opposite-sign (OS) leptons; (bottom row) signal region with same-sign (SS) leptons. A representative signal scenario for Majorana HNL production with equal coupling to all lepton generations is overlaid with its expected cross section scaled up as indicated. The hatched band shows the total experimental systematic uncertainty on the simulated samples. |
png pdf |
Figure 3-c:
Distributions of the displaced jet tagging score for (left) resolved and (right) boosted jets: (top row) control region; (middle row) signal region with opposite-sign (OS) leptons; (bottom row) signal region with same-sign (SS) leptons. A representative signal scenario for Majorana HNL production with equal coupling to all lepton generations is overlaid with its expected cross section scaled up as indicated. The hatched band shows the total experimental systematic uncertainty on the simulated samples. |
png pdf |
Figure 3-d:
Distributions of the displaced jet tagging score for (left) resolved and (right) boosted jets: (top row) control region; (middle row) signal region with opposite-sign (OS) leptons; (bottom row) signal region with same-sign (SS) leptons. A representative signal scenario for Majorana HNL production with equal coupling to all lepton generations is overlaid with its expected cross section scaled up as indicated. The hatched band shows the total experimental systematic uncertainty on the simulated samples. |
png pdf |
Figure 3-e:
Distributions of the displaced jet tagging score for (left) resolved and (right) boosted jets: (top row) control region; (middle row) signal region with opposite-sign (OS) leptons; (bottom row) signal region with same-sign (SS) leptons. A representative signal scenario for Majorana HNL production with equal coupling to all lepton generations is overlaid with its expected cross section scaled up as indicated. The hatched band shows the total experimental systematic uncertainty on the simulated samples. |

png pdf |
Figure 3-f:
Distributions of the displaced jet tagging score for (left) resolved and (right) boosted jets: (top row) control region; (middle row) signal region with opposite-sign (OS) leptons; (bottom row) signal region with same-sign (SS) leptons. A representative signal scenario for Majorana HNL production with equal coupling to all lepton generations is overlaid with its expected cross section scaled up as indicated. The hatched band shows the total experimental systematic uncertainty on the simulated samples. |
png pdf |
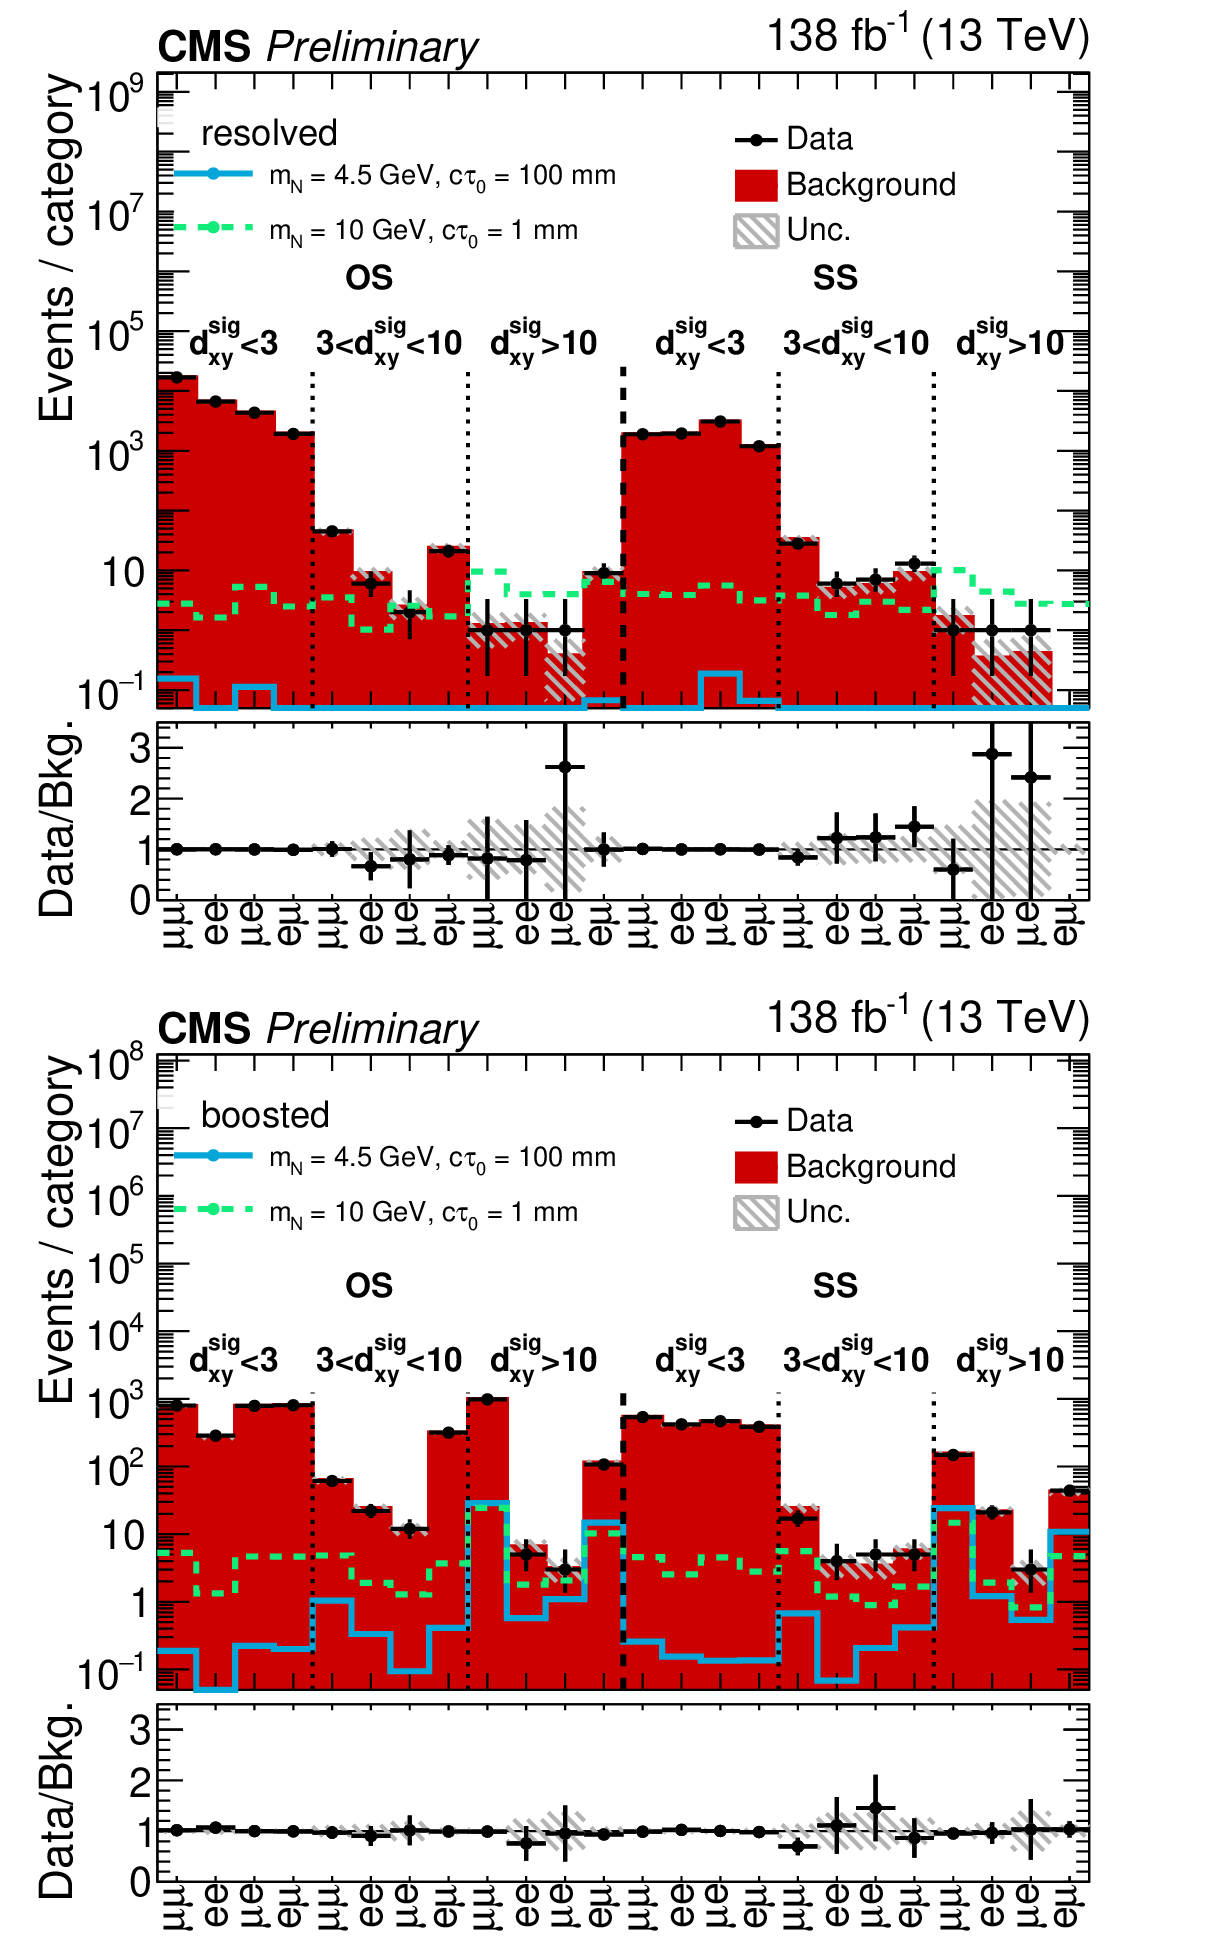
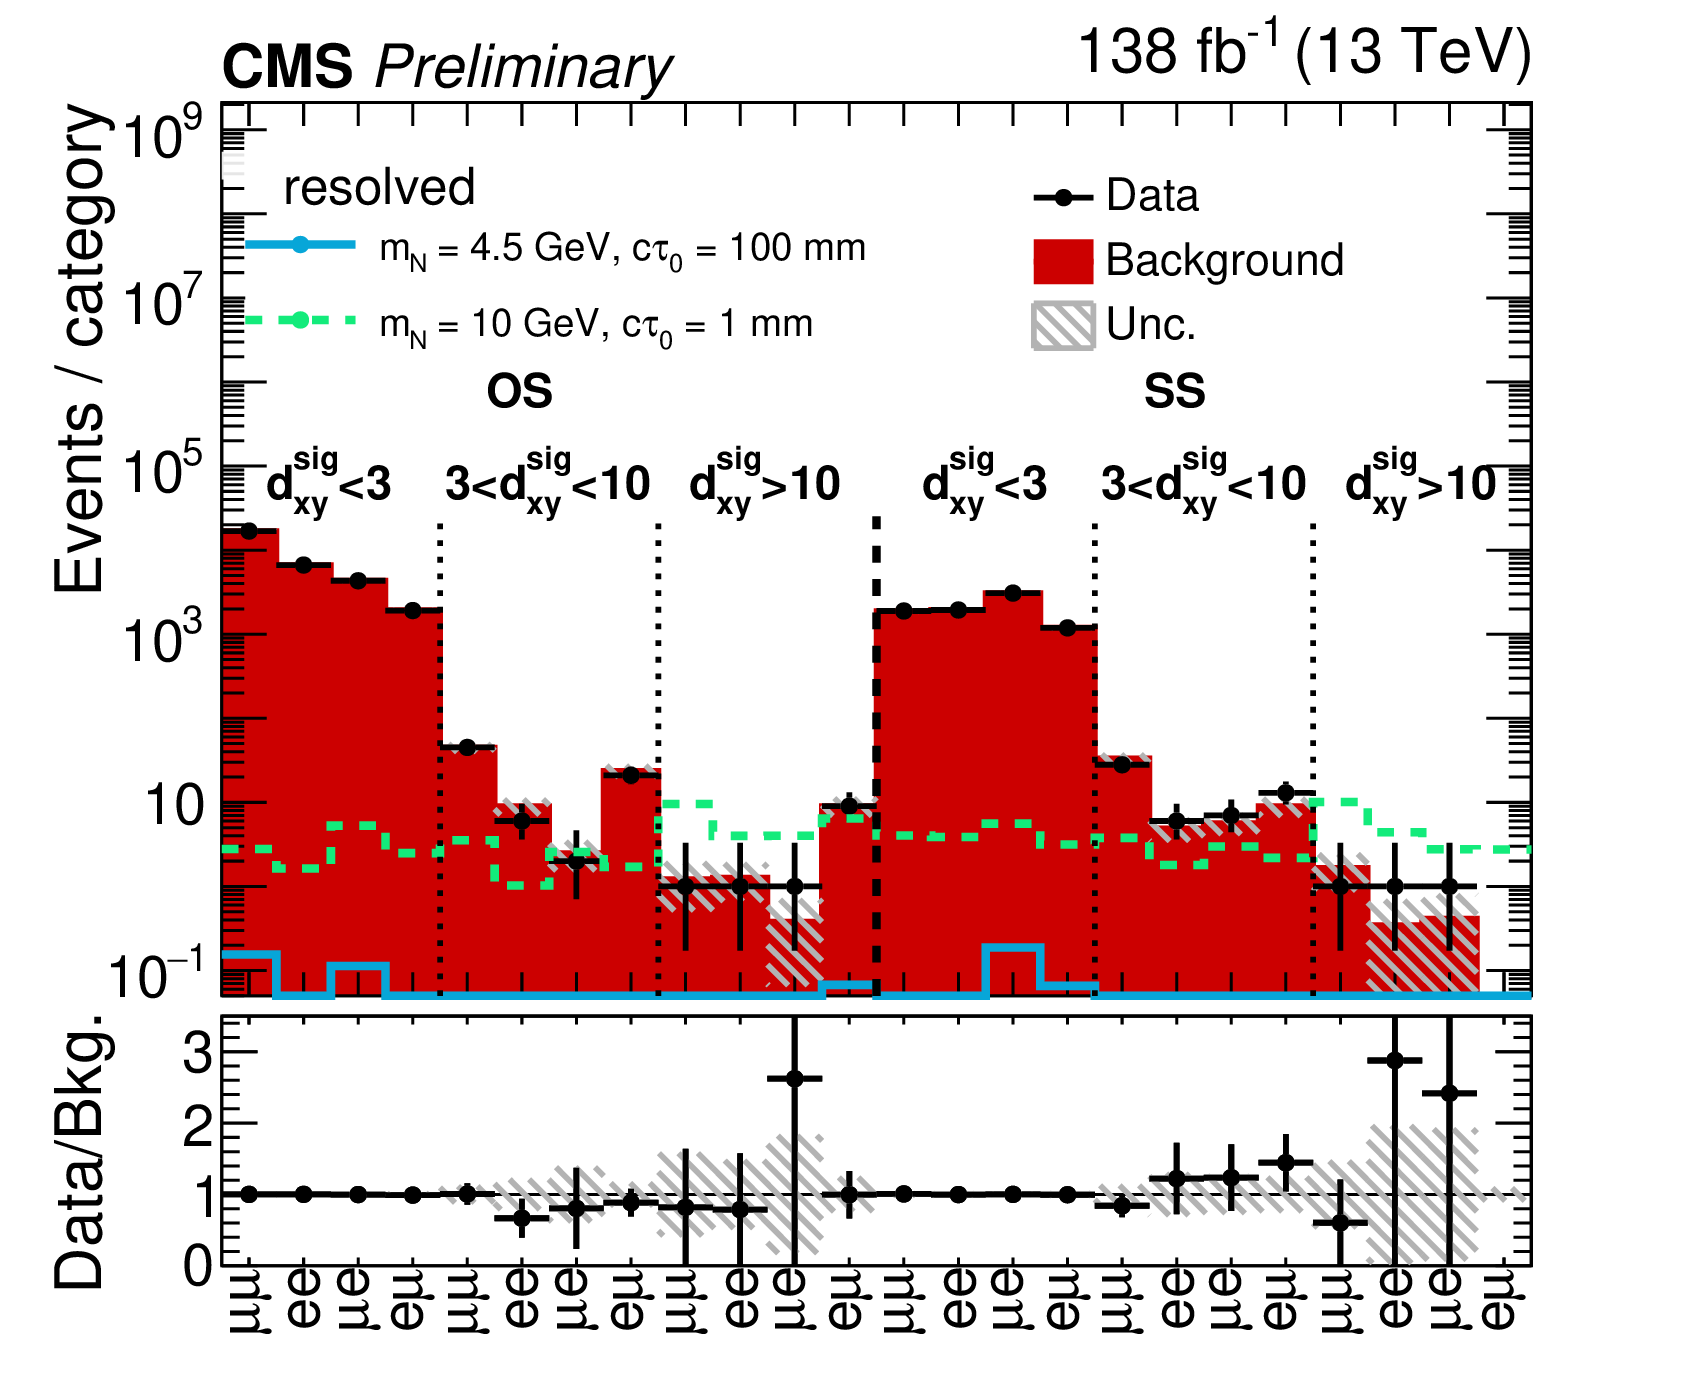
Figure 4:
Observed number of events and predicted number of background events per category for (left) resolved and (right) boosted categories. Two representative signal scenarios for Majorana HNL production with equal coupling to all lepton generations are overlaid. The bottom panel shows the ratio of the data over the predicted background. The hatched band shows the total systematic uncertainty on the predicted background. |
png pdf |
Figure 4-a:
Observed number of events and predicted number of background events per category for (left) resolved and (right) boosted categories. Two representative signal scenarios for Majorana HNL production with equal coupling to all lepton generations are overlaid. The bottom panel shows the ratio of the data over the predicted background. The hatched band shows the total systematic uncertainty on the predicted background. |

png pdf |
Figure 4-b:
Observed number of events and predicted number of background events per category for (left) resolved and (right) boosted categories. Two representative signal scenarios for Majorana HNL production with equal coupling to all lepton generations are overlaid. The bottom panel shows the ratio of the data over the predicted background. The hatched band shows the total systematic uncertainty on the predicted background. |
png pdf |
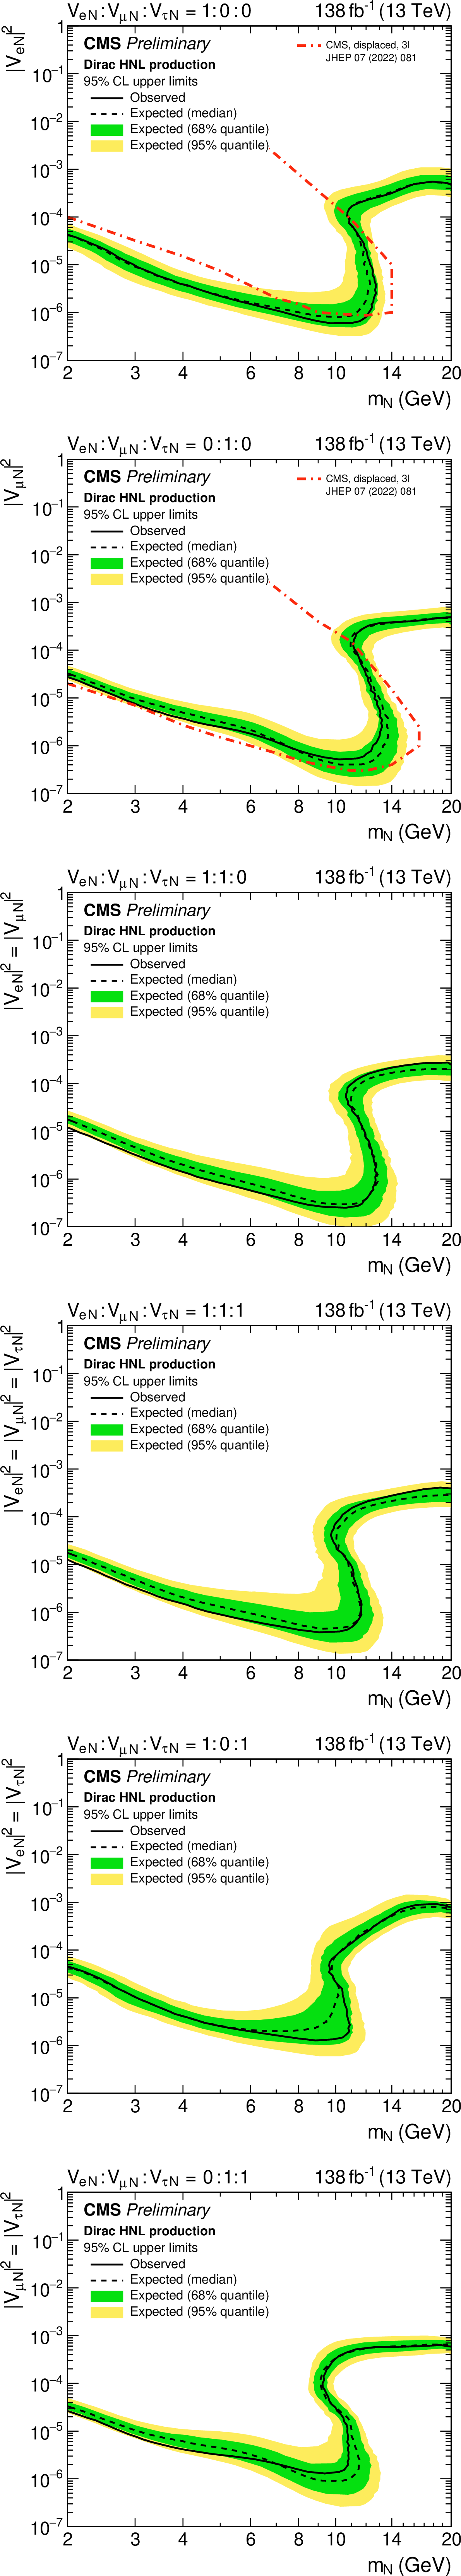
Figure 5:
Expected and observed 95% CL limits on Dirac HNL production for various coupling scenarios as a function of the HNL mass and coupling strengths: (top row) pure electron and muon couplings; (middle row) mixed electron-muon and electron-muon-tau couplings; (bottom row) mixed electron-tau and muon-tau couplings. The relative ratios of the coupling per lepton generation are indicated in the plots. |
png pdf |
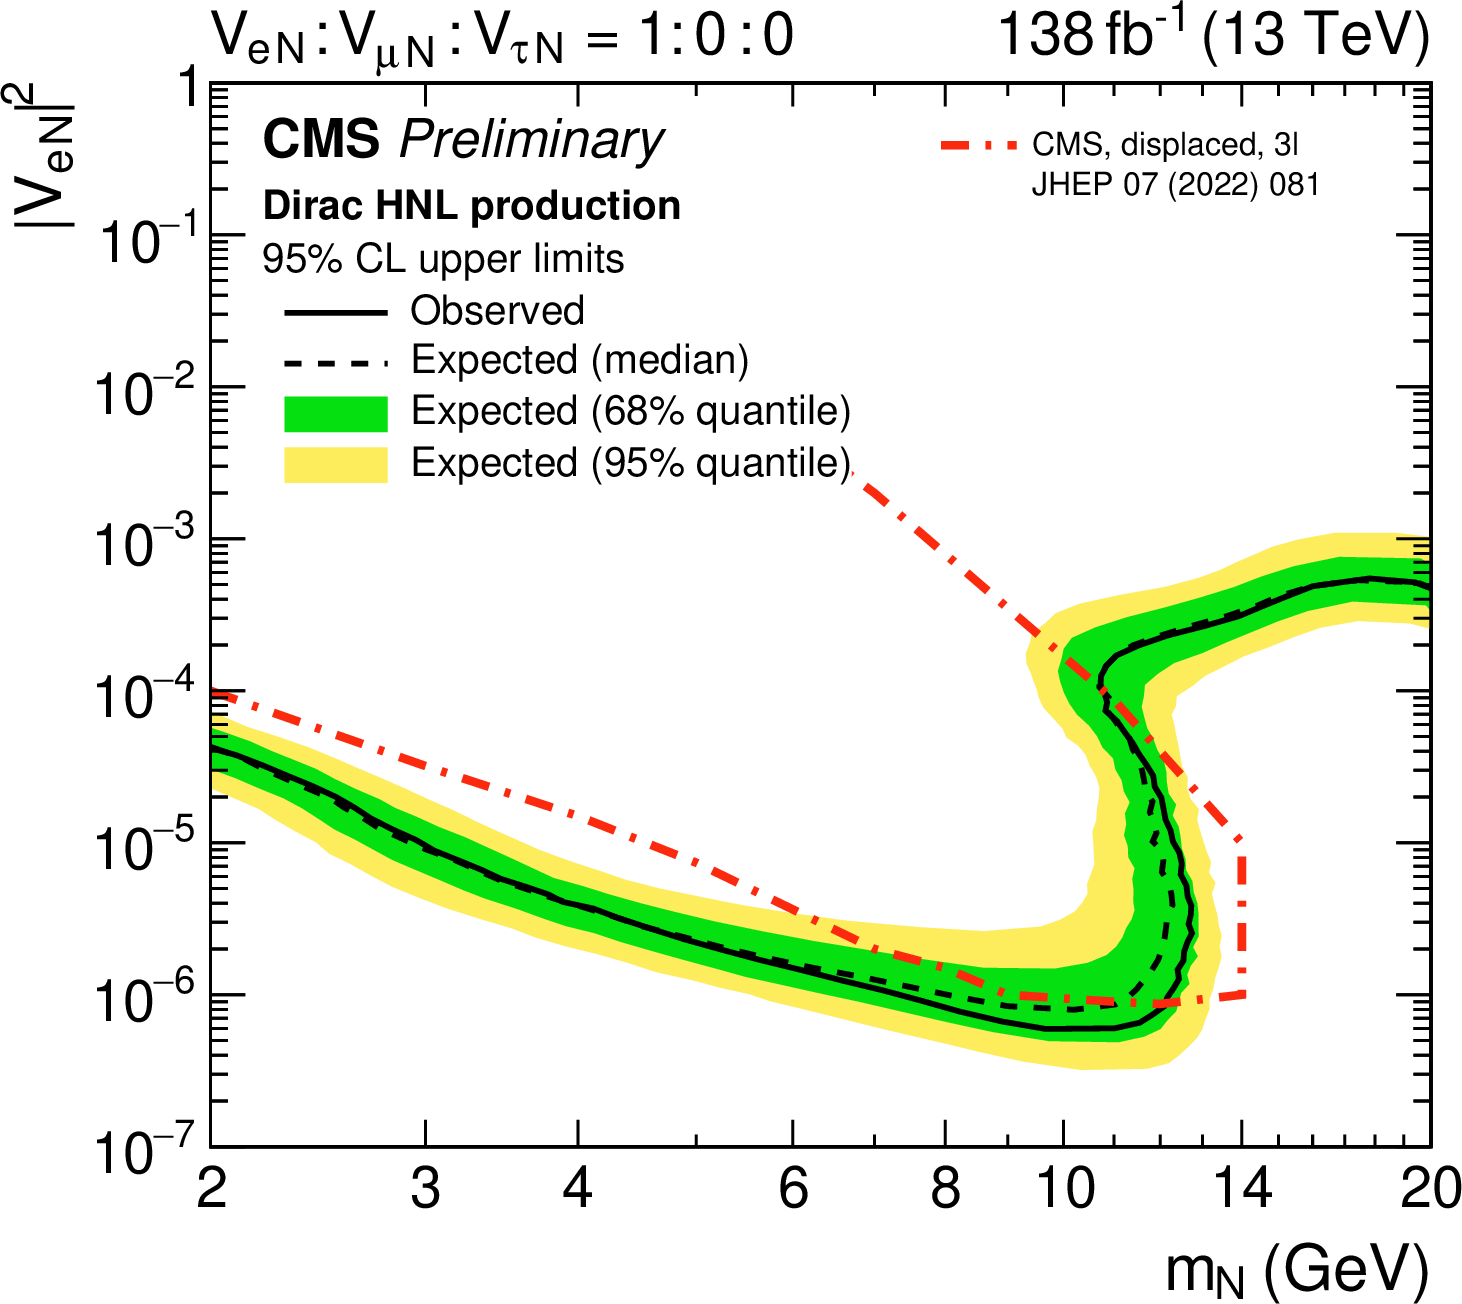
Figure 5-a:
Expected and observed 95% CL limits on Dirac HNL production for various coupling scenarios as a function of the HNL mass and coupling strengths: (top row) pure electron and muon couplings; (middle row) mixed electron-muon and electron-muon-tau couplings; (bottom row) mixed electron-tau and muon-tau couplings. The relative ratios of the coupling per lepton generation are indicated in the plots. |
png pdf |
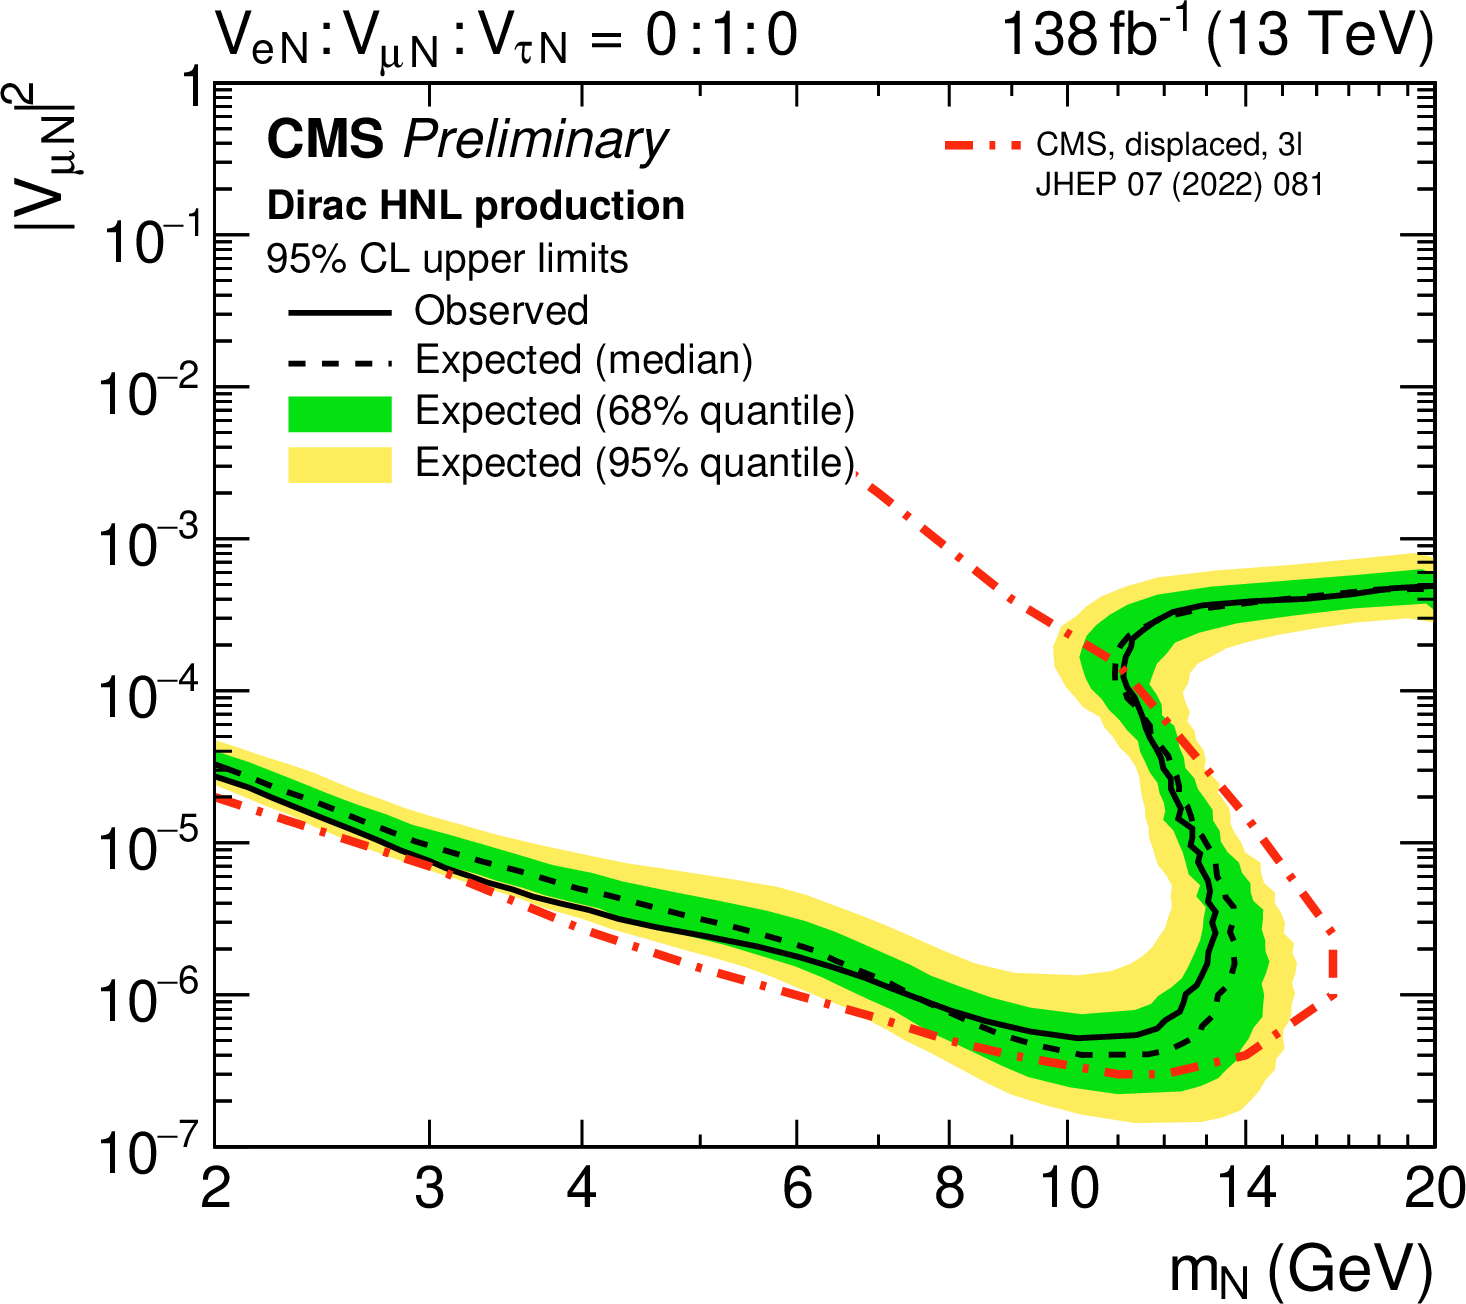
Figure 5-b:
Expected and observed 95% CL limits on Dirac HNL production for various coupling scenarios as a function of the HNL mass and coupling strengths: (top row) pure electron and muon couplings; (middle row) mixed electron-muon and electron-muon-tau couplings; (bottom row) mixed electron-tau and muon-tau couplings. The relative ratios of the coupling per lepton generation are indicated in the plots. |
png pdf |
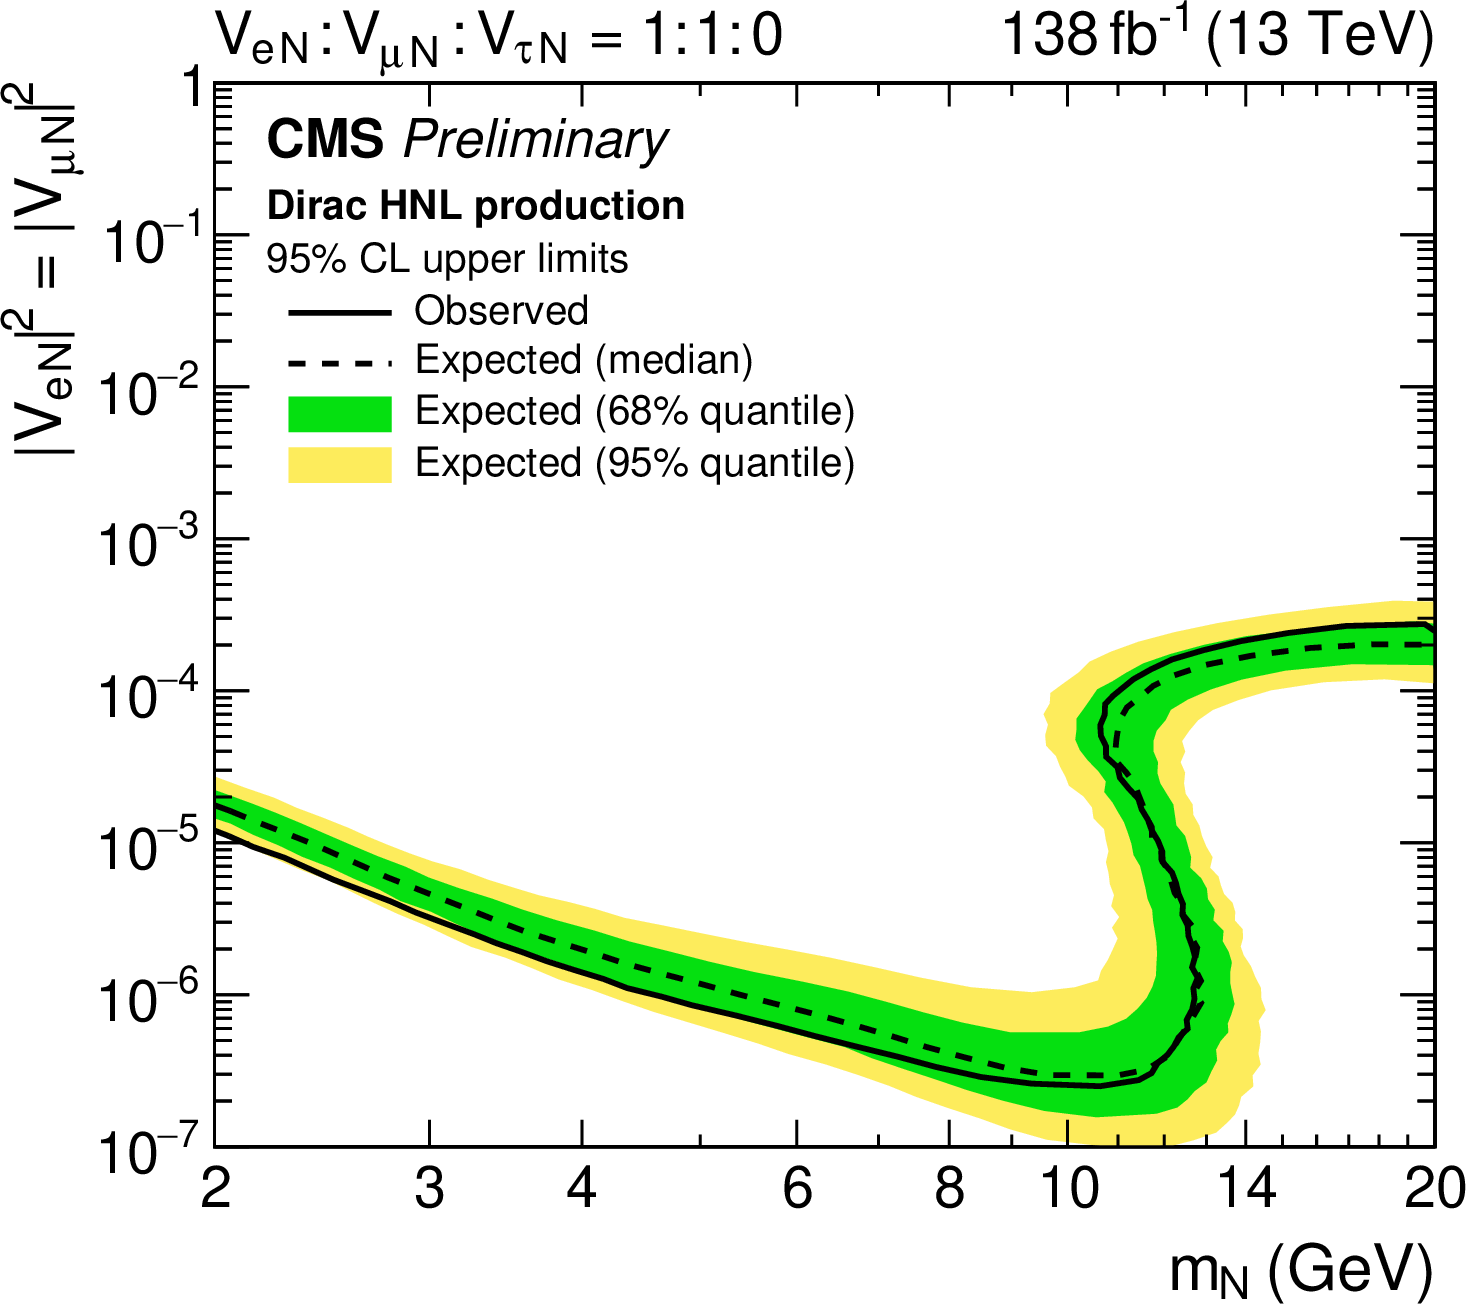
Figure 5-c:
Expected and observed 95% CL limits on Dirac HNL production for various coupling scenarios as a function of the HNL mass and coupling strengths: (top row) pure electron and muon couplings; (middle row) mixed electron-muon and electron-muon-tau couplings; (bottom row) mixed electron-tau and muon-tau couplings. The relative ratios of the coupling per lepton generation are indicated in the plots. |

png pdf |
Figure 5-d:
Expected and observed 95% CL limits on Dirac HNL production for various coupling scenarios as a function of the HNL mass and coupling strengths: (top row) pure electron and muon couplings; (middle row) mixed electron-muon and electron-muon-tau couplings; (bottom row) mixed electron-tau and muon-tau couplings. The relative ratios of the coupling per lepton generation are indicated in the plots. |

png pdf |
Figure 5-e:
Expected and observed 95% CL limits on Dirac HNL production for various coupling scenarios as a function of the HNL mass and coupling strengths: (top row) pure electron and muon couplings; (middle row) mixed electron-muon and electron-muon-tau couplings; (bottom row) mixed electron-tau and muon-tau couplings. The relative ratios of the coupling per lepton generation are indicated in the plots. |

png pdf |
Figure 5-f:
Expected and observed 95% CL limits on Dirac HNL production for various coupling scenarios as a function of the HNL mass and coupling strengths: (top row) pure electron and muon couplings; (middle row) mixed electron-muon and electron-muon-tau couplings; (bottom row) mixed electron-tau and muon-tau couplings. The relative ratios of the coupling per lepton generation are indicated in the plots. |
png pdf |
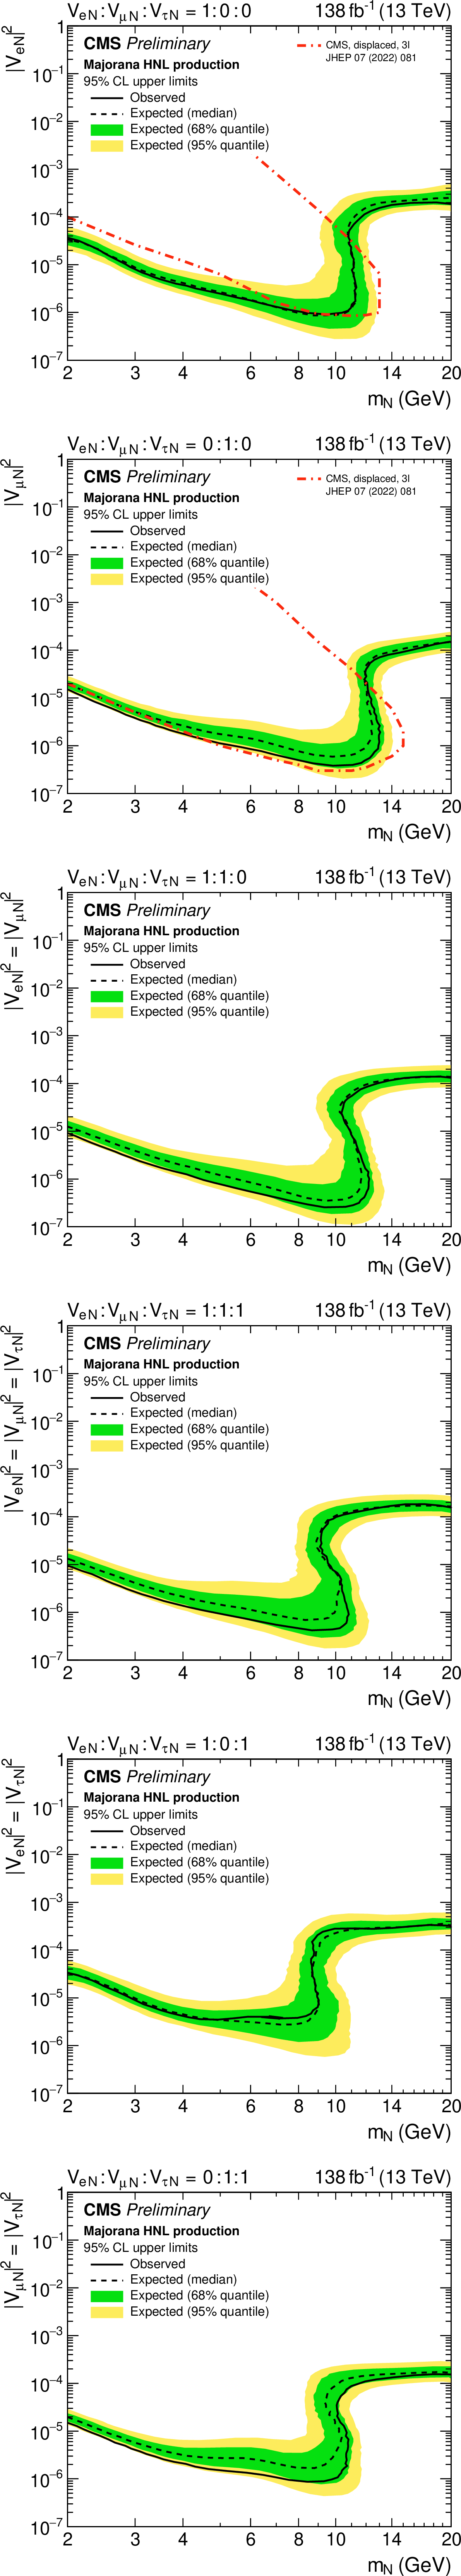
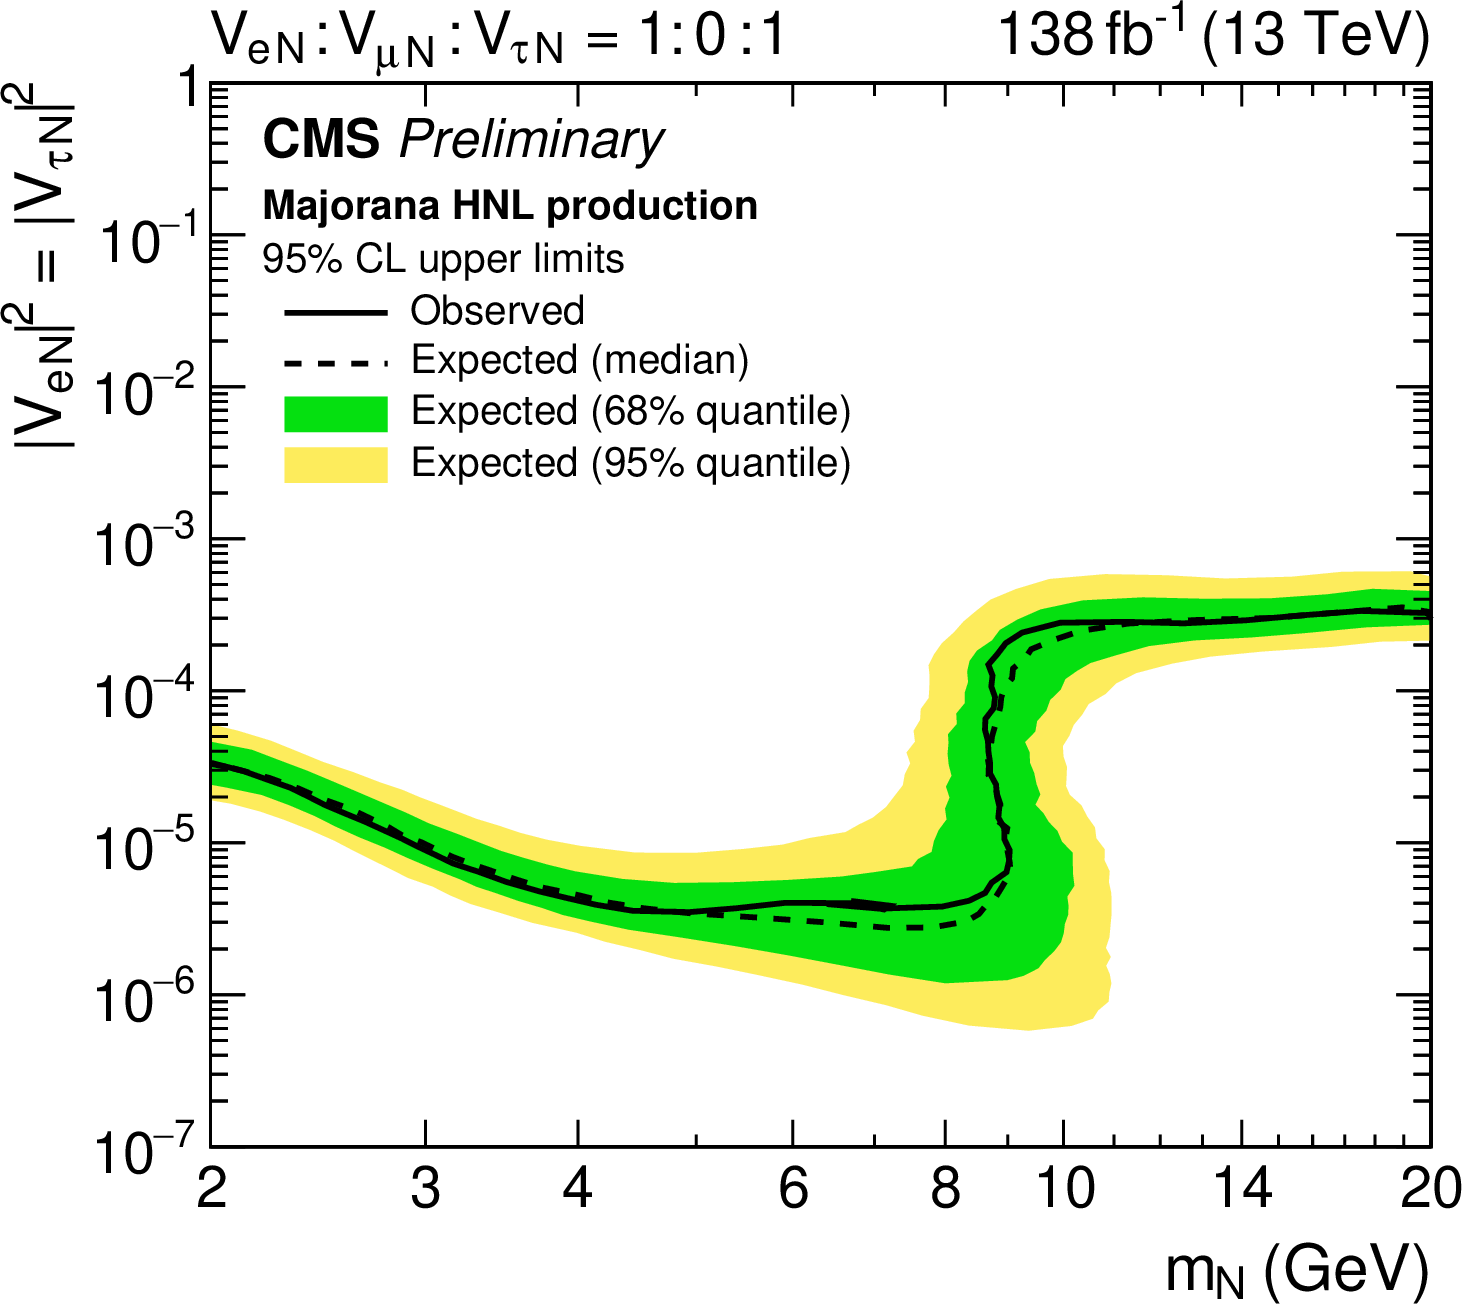
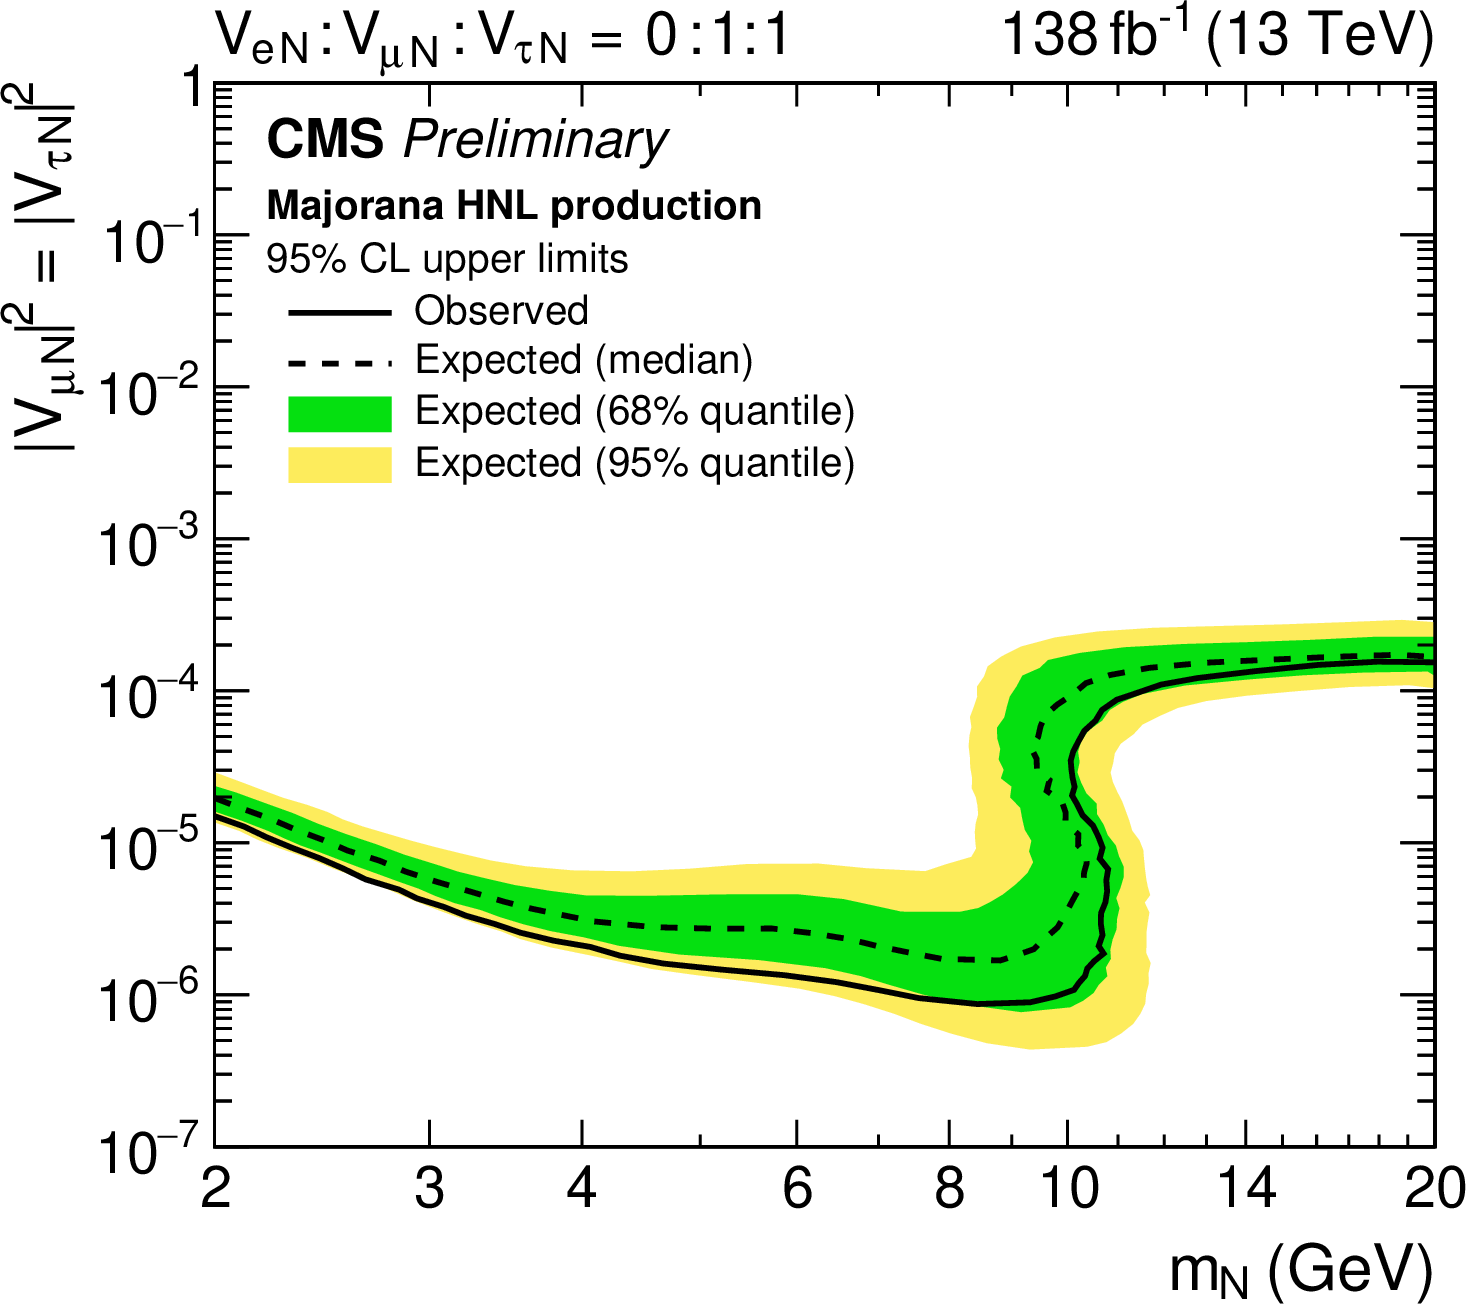
Figure 6:
Expected and observed 95% CL limits on Majorana HNL production for various coupling scenarios as a function of the HNL mass and coupling strengths: (top row) pure electron and muon couplings; (middle row) mixed electron-muon and electron-muon-tau couplings; (bottom row) mixed electron-tau and muon-tau couplings. The relative ratios of the coupling per lepton generation are indicated in the plots. |
png pdf |
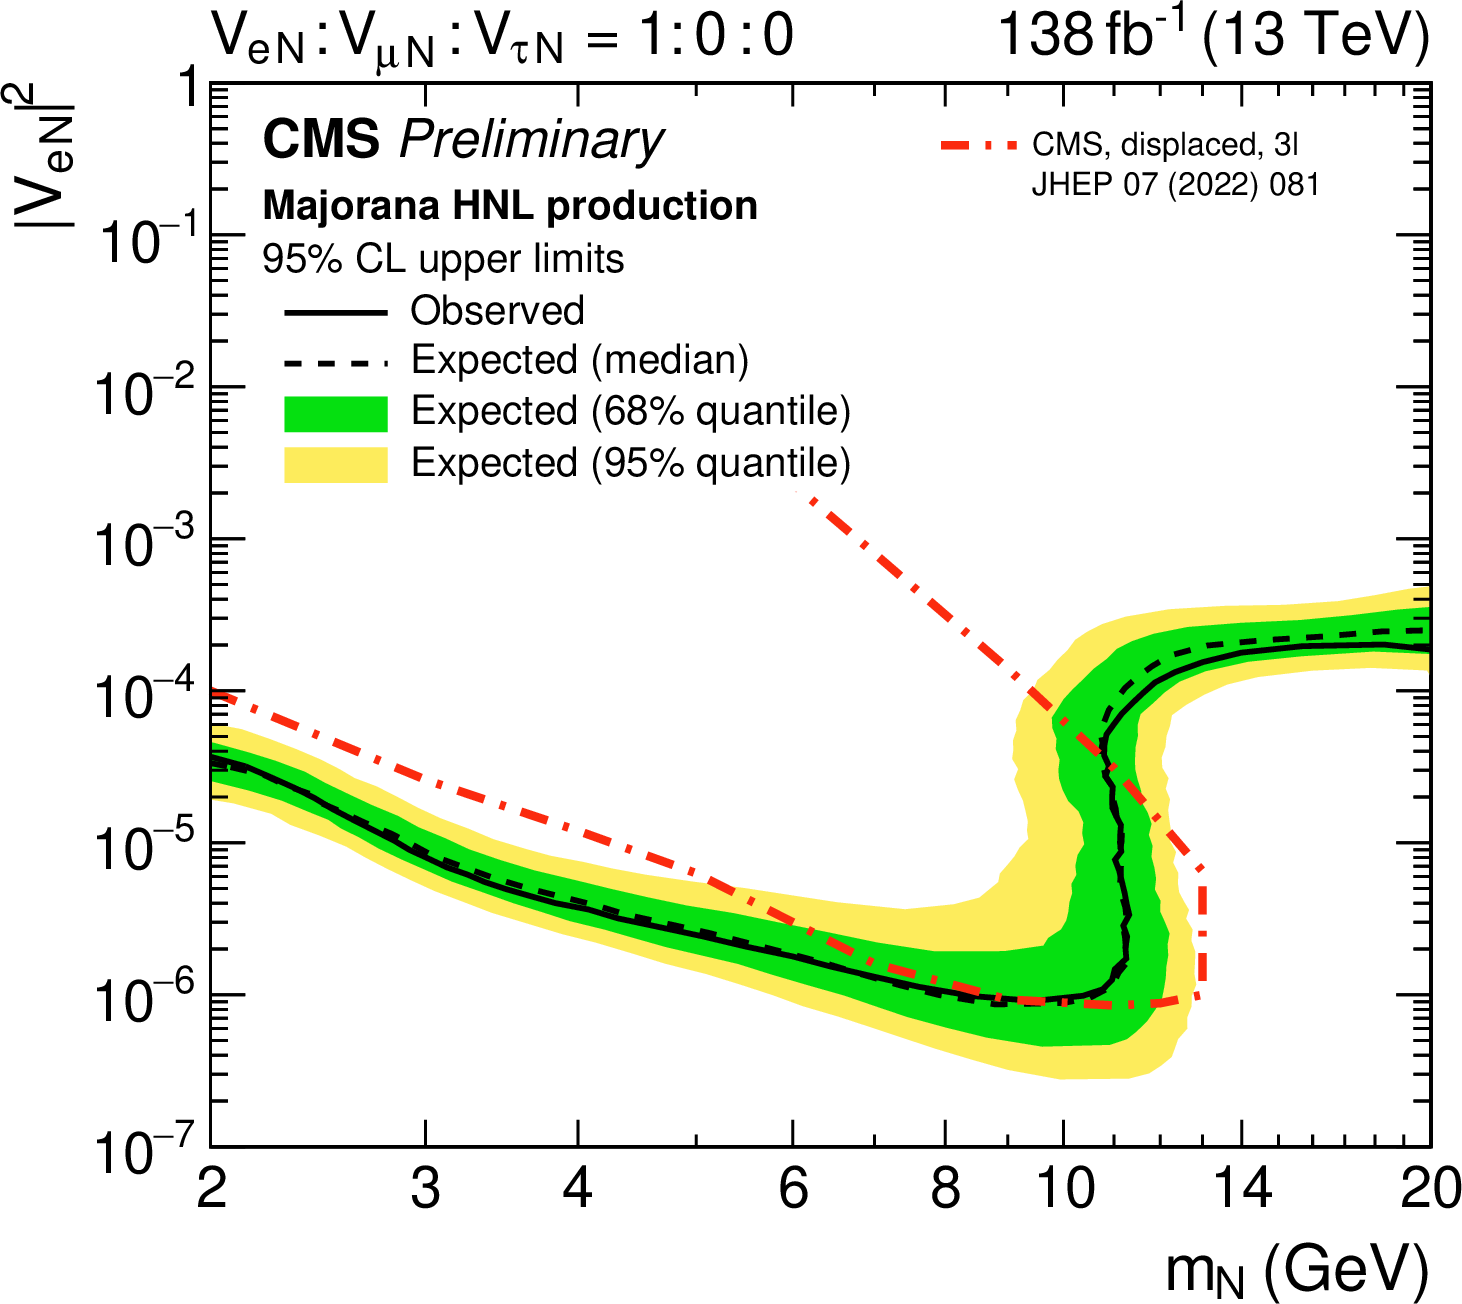
Figure 6-a:
Expected and observed 95% CL limits on Majorana HNL production for various coupling scenarios as a function of the HNL mass and coupling strengths: (top row) pure electron and muon couplings; (middle row) mixed electron-muon and electron-muon-tau couplings; (bottom row) mixed electron-tau and muon-tau couplings. The relative ratios of the coupling per lepton generation are indicated in the plots. |
png pdf |
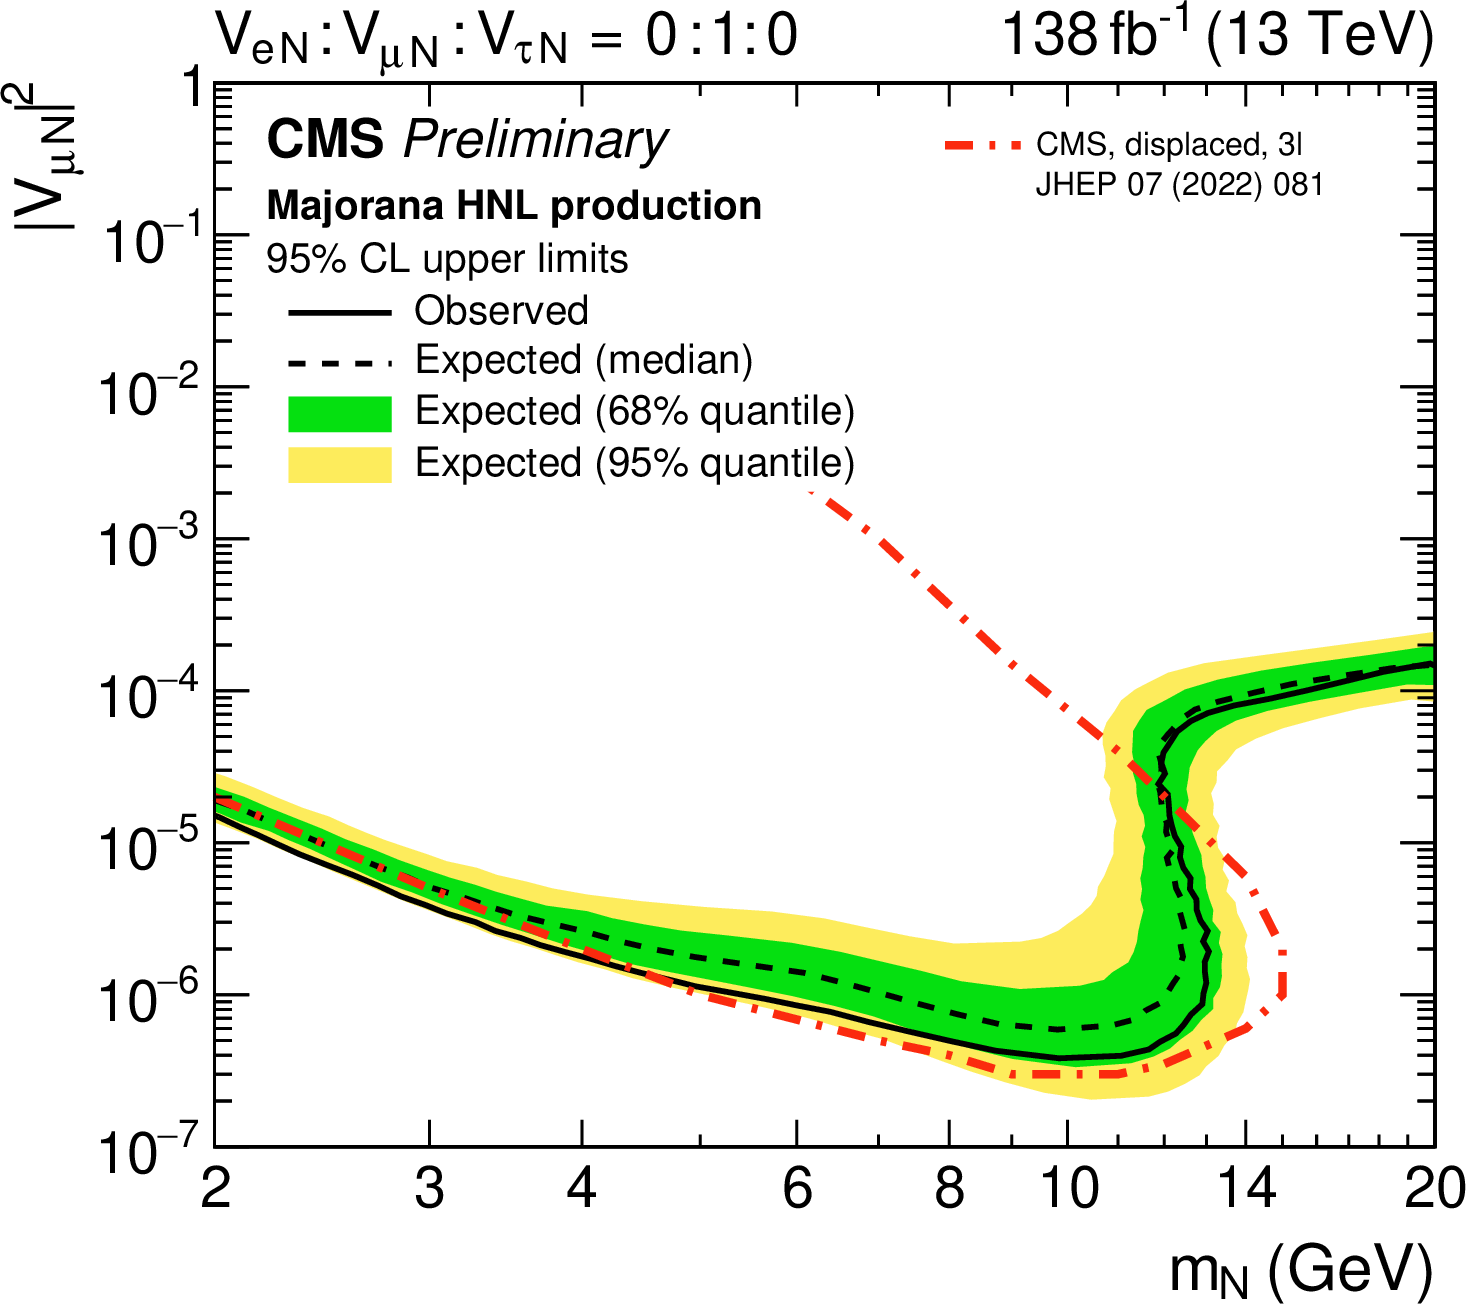
Figure 6-b:
Expected and observed 95% CL limits on Majorana HNL production for various coupling scenarios as a function of the HNL mass and coupling strengths: (top row) pure electron and muon couplings; (middle row) mixed electron-muon and electron-muon-tau couplings; (bottom row) mixed electron-tau and muon-tau couplings. The relative ratios of the coupling per lepton generation are indicated in the plots. |
png pdf |
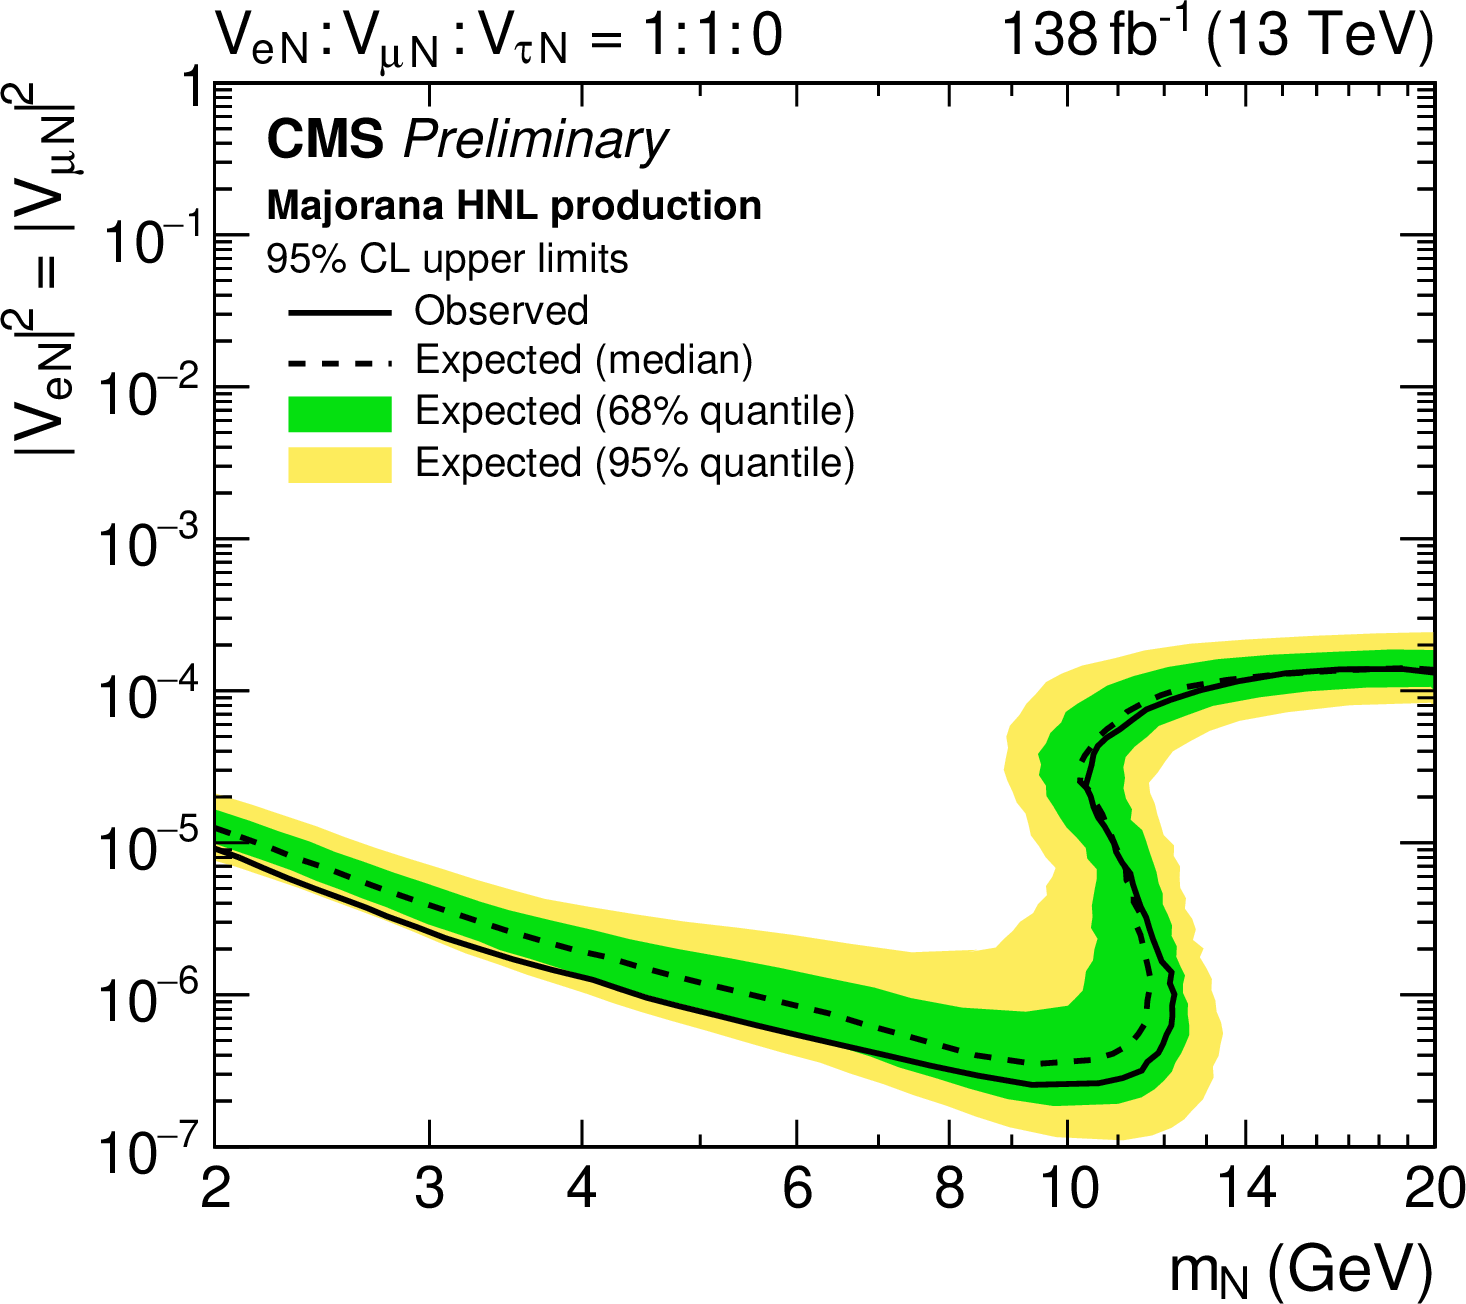
Figure 6-c:
Expected and observed 95% CL limits on Majorana HNL production for various coupling scenarios as a function of the HNL mass and coupling strengths: (top row) pure electron and muon couplings; (middle row) mixed electron-muon and electron-muon-tau couplings; (bottom row) mixed electron-tau and muon-tau couplings. The relative ratios of the coupling per lepton generation are indicated in the plots. |

png pdf |
Figure 6-d:
Expected and observed 95% CL limits on Majorana HNL production for various coupling scenarios as a function of the HNL mass and coupling strengths: (top row) pure electron and muon couplings; (middle row) mixed electron-muon and electron-muon-tau couplings; (bottom row) mixed electron-tau and muon-tau couplings. The relative ratios of the coupling per lepton generation are indicated in the plots. |
png pdf |
Figure 6-e:
Expected and observed 95% CL limits on Majorana HNL production for various coupling scenarios as a function of the HNL mass and coupling strengths: (top row) pure electron and muon couplings; (middle row) mixed electron-muon and electron-muon-tau couplings; (bottom row) mixed electron-tau and muon-tau couplings. The relative ratios of the coupling per lepton generation are indicated in the plots. |
png pdf |
Figure 6-f:
Expected and observed 95% CL limits on Majorana HNL production for various coupling scenarios as a function of the HNL mass and coupling strengths: (top row) pure electron and muon couplings; (middle row) mixed electron-muon and electron-muon-tau couplings; (bottom row) mixed electron-tau and muon-tau couplings. The relative ratios of the coupling per lepton generation are indicated in the plots. |
png pdf |
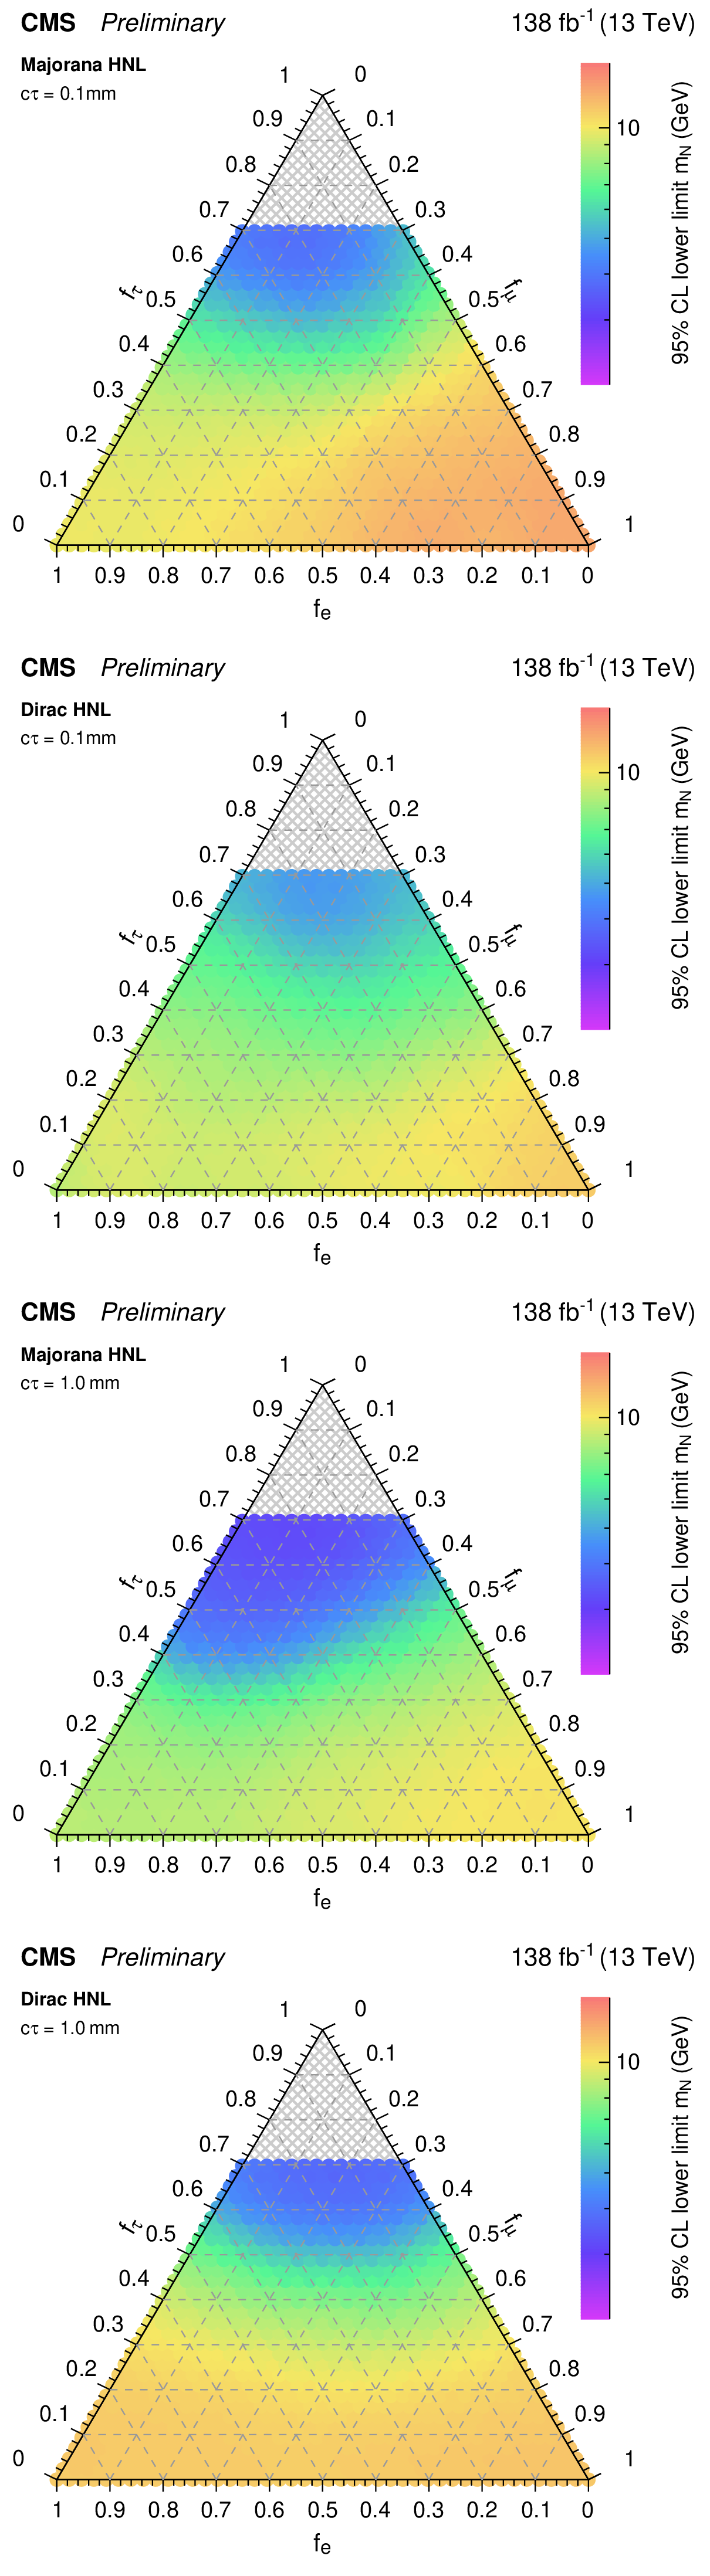
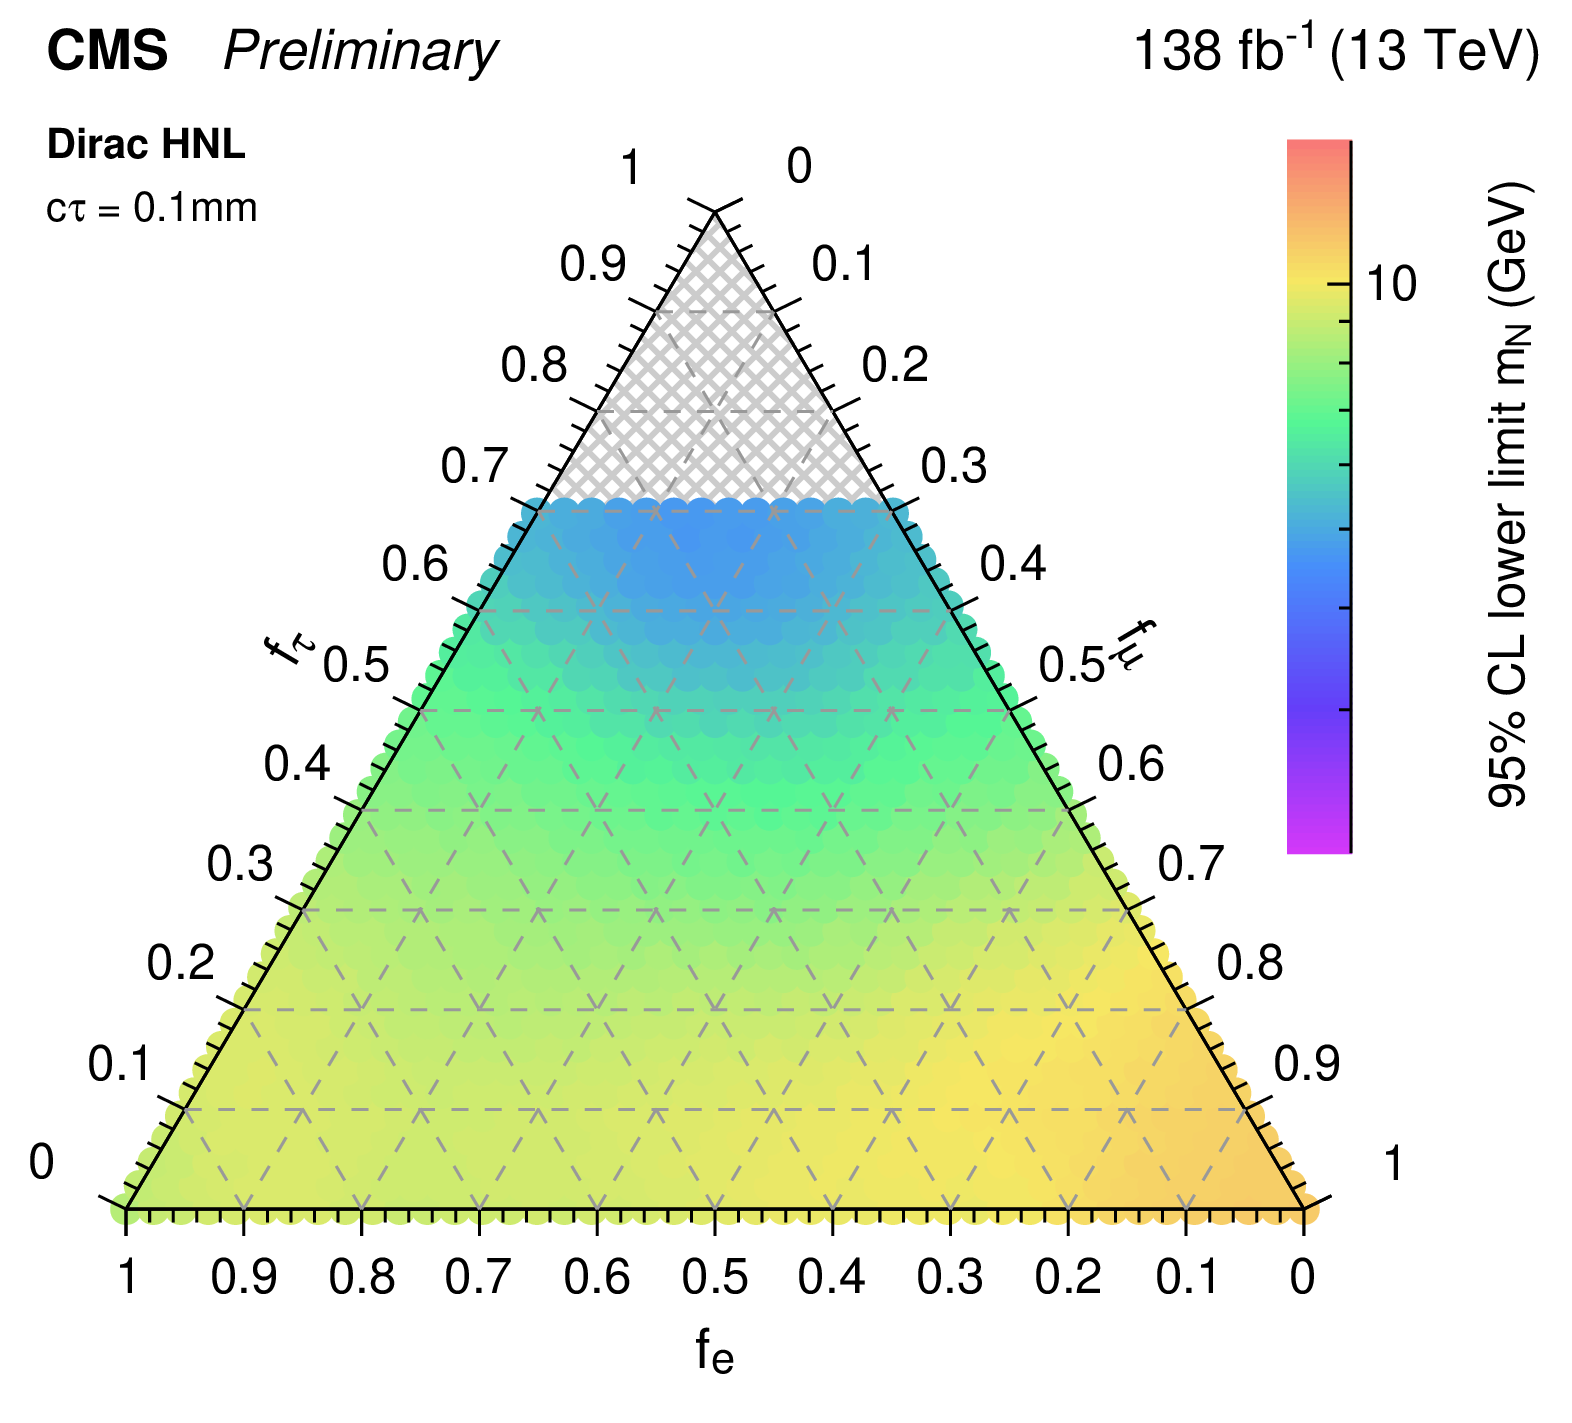
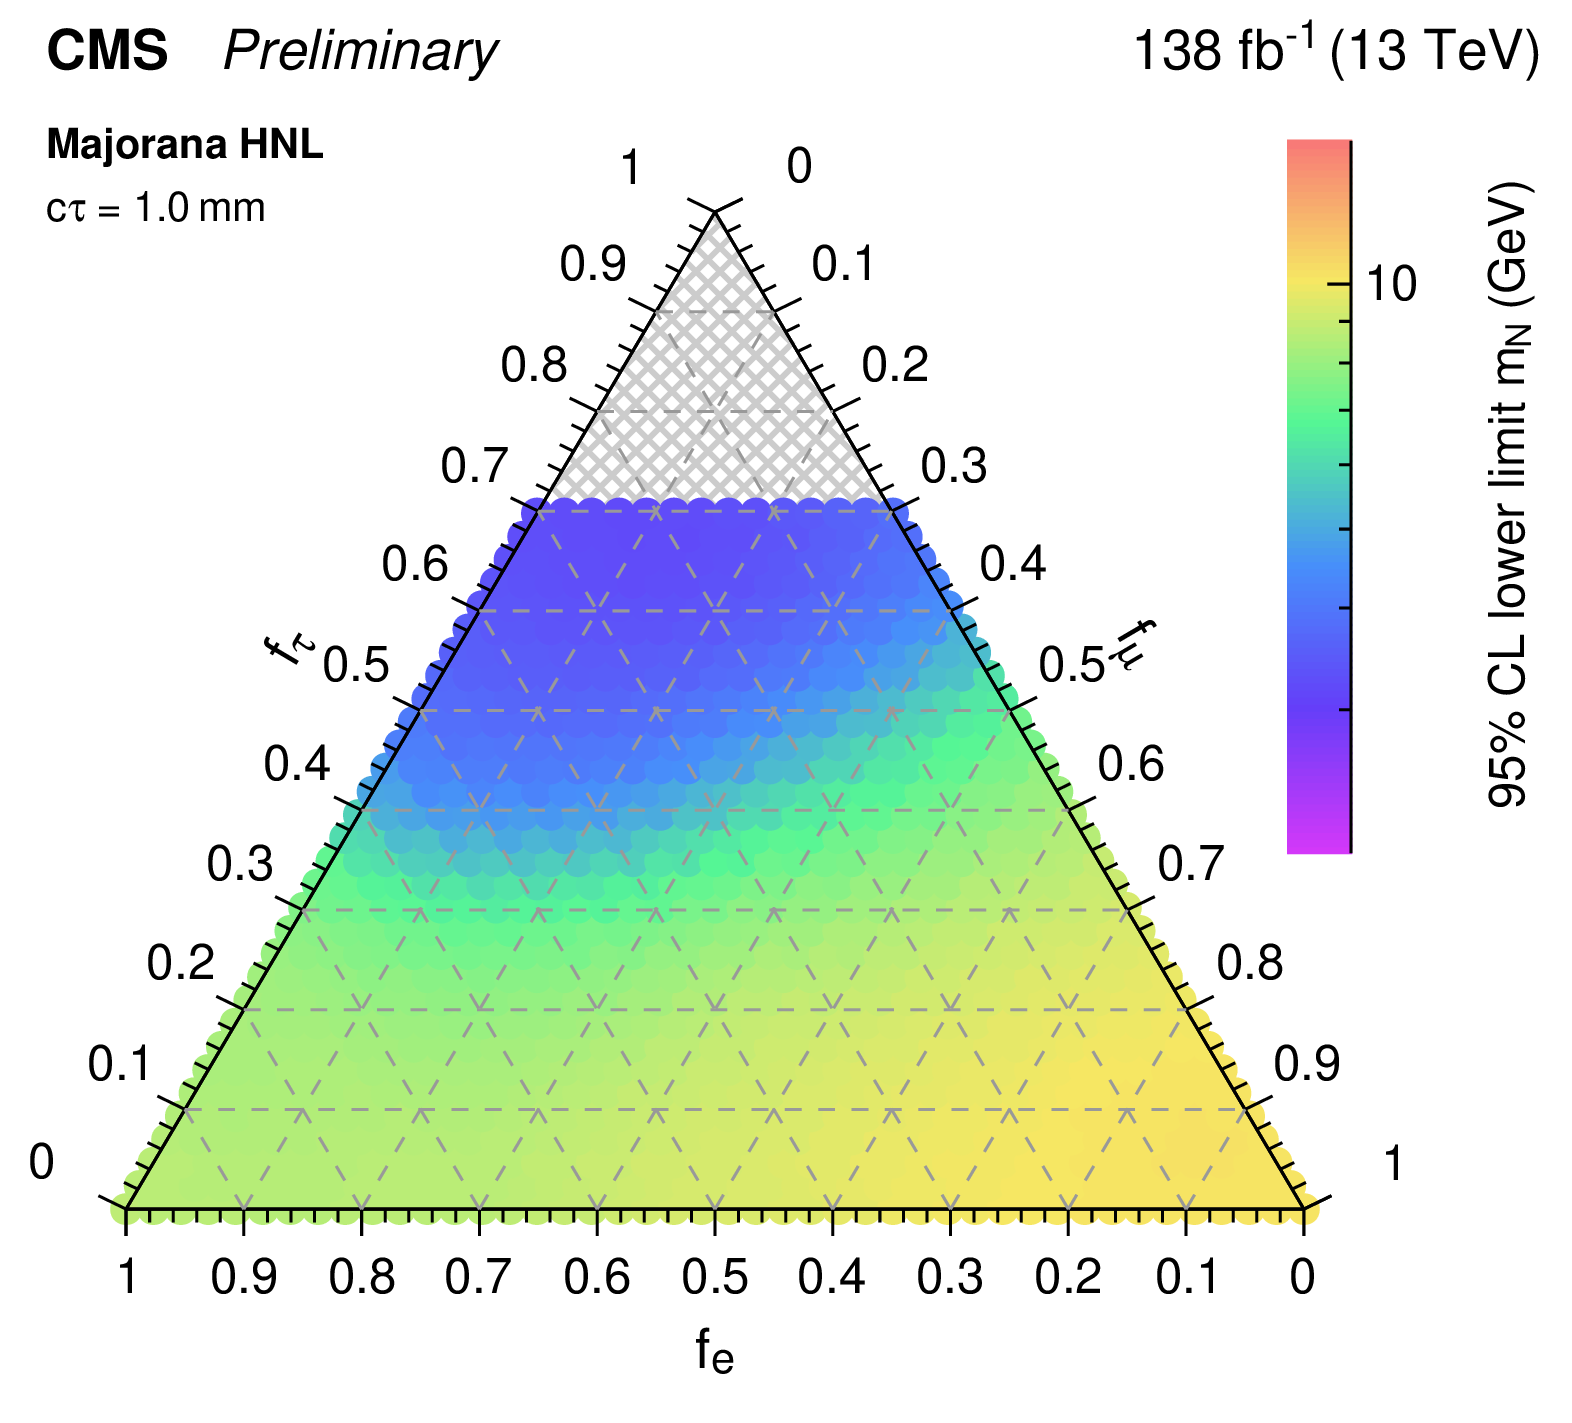
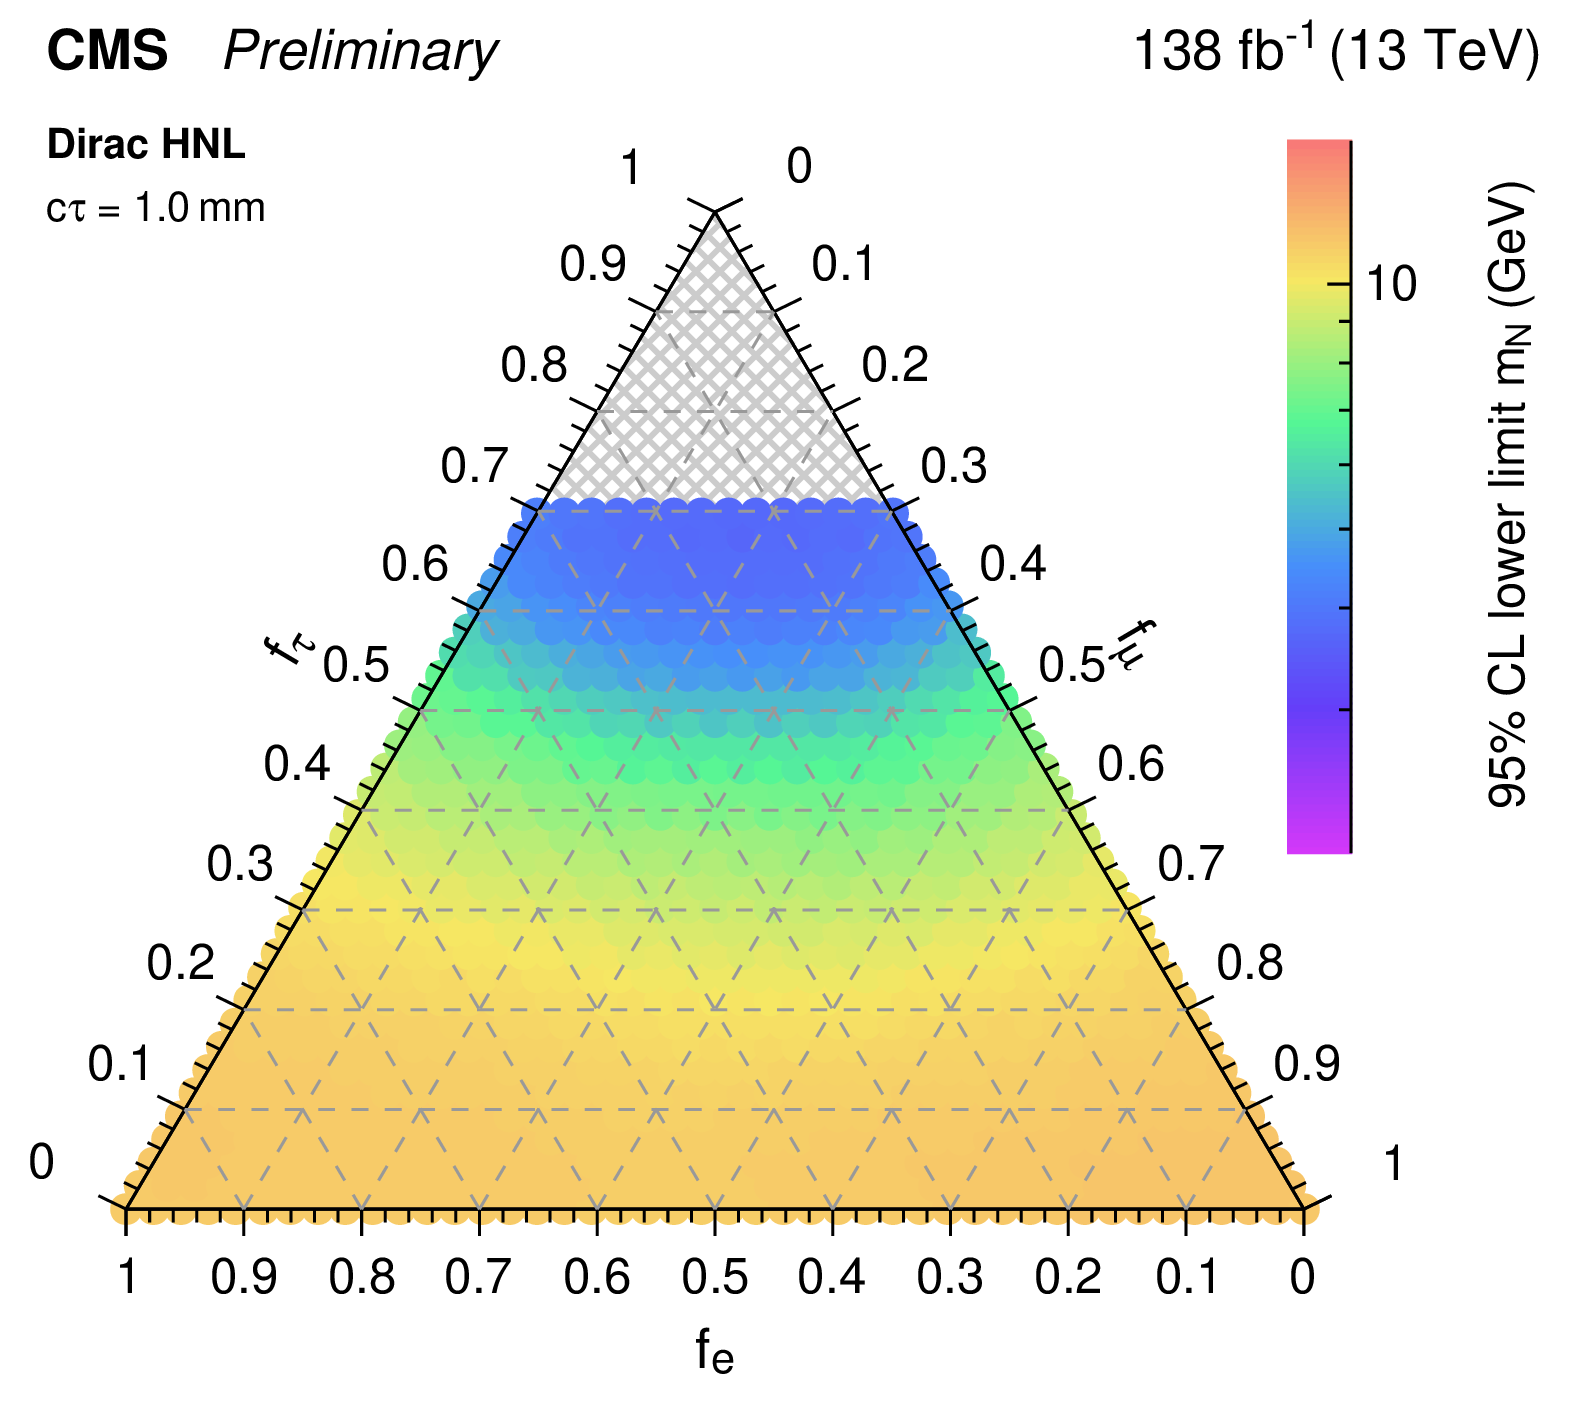
Figure 7:
Observed 95% CL lower limits on the (left column) Majorana and (right column) Dirac HNL mass as a function of the relative coupling to the three lepton generations considering a fixed proper lifetime of (top row) 0.1 mm and (bottom row) 1 mm. The limits are determined within 2 $ < m_{\textrm{N}} < $ 20 GeV. |

png pdf |
Figure 7-a:
Observed 95% CL lower limits on the (left column) Majorana and (right column) Dirac HNL mass as a function of the relative coupling to the three lepton generations considering a fixed proper lifetime of (top row) 0.1 mm and (bottom row) 1 mm. The limits are determined within 2 $ < m_{\textrm{N}} < $ 20 GeV. |
png pdf |
Figure 7-b:
Observed 95% CL lower limits on the (left column) Majorana and (right column) Dirac HNL mass as a function of the relative coupling to the three lepton generations considering a fixed proper lifetime of (top row) 0.1 mm and (bottom row) 1 mm. The limits are determined within 2 $ < m_{\textrm{N}} < $ 20 GeV. |
png pdf |
Figure 7-c:
Observed 95% CL lower limits on the (left column) Majorana and (right column) Dirac HNL mass as a function of the relative coupling to the three lepton generations considering a fixed proper lifetime of (top row) 0.1 mm and (bottom row) 1 mm. The limits are determined within 2 $ < m_{\textrm{N}} < $ 20 GeV. |
png pdf |
Figure 7-d:
Observed 95% CL lower limits on the (left column) Majorana and (right column) Dirac HNL mass as a function of the relative coupling to the three lepton generations considering a fixed proper lifetime of (top row) 0.1 mm and (bottom row) 1 mm. The limits are determined within 2 $ < m_{\textrm{N}} < $ 20 GeV. |
png pdf |
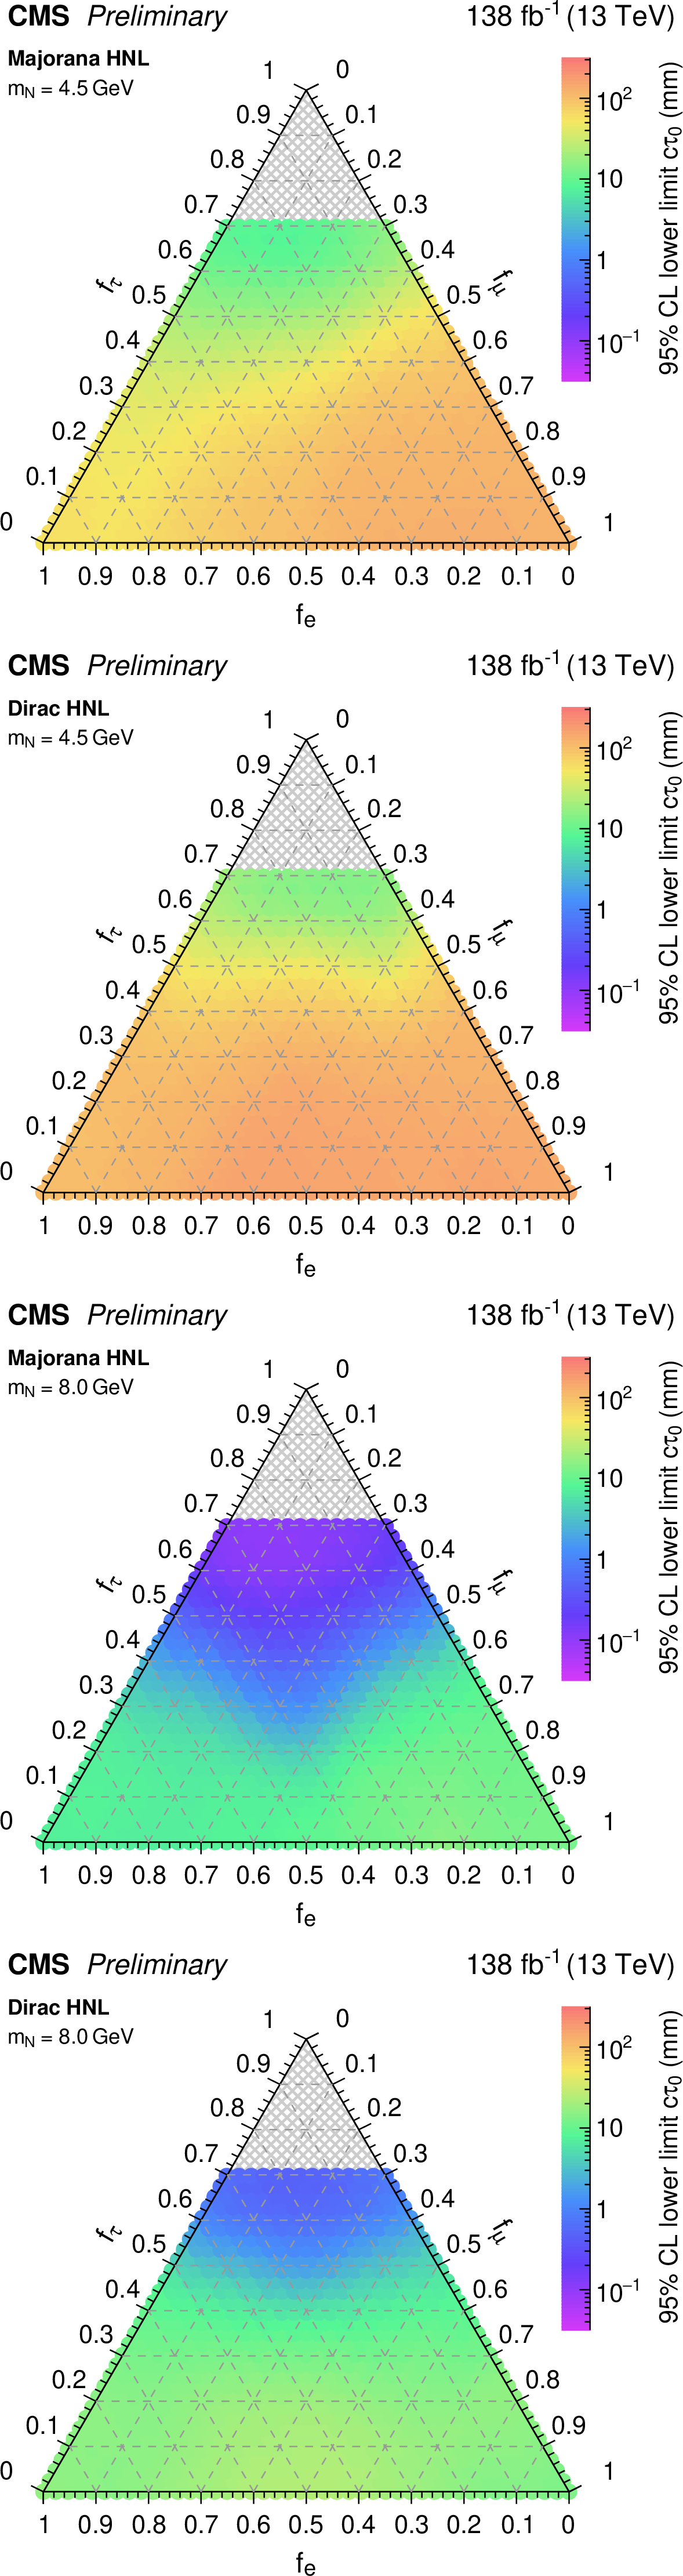
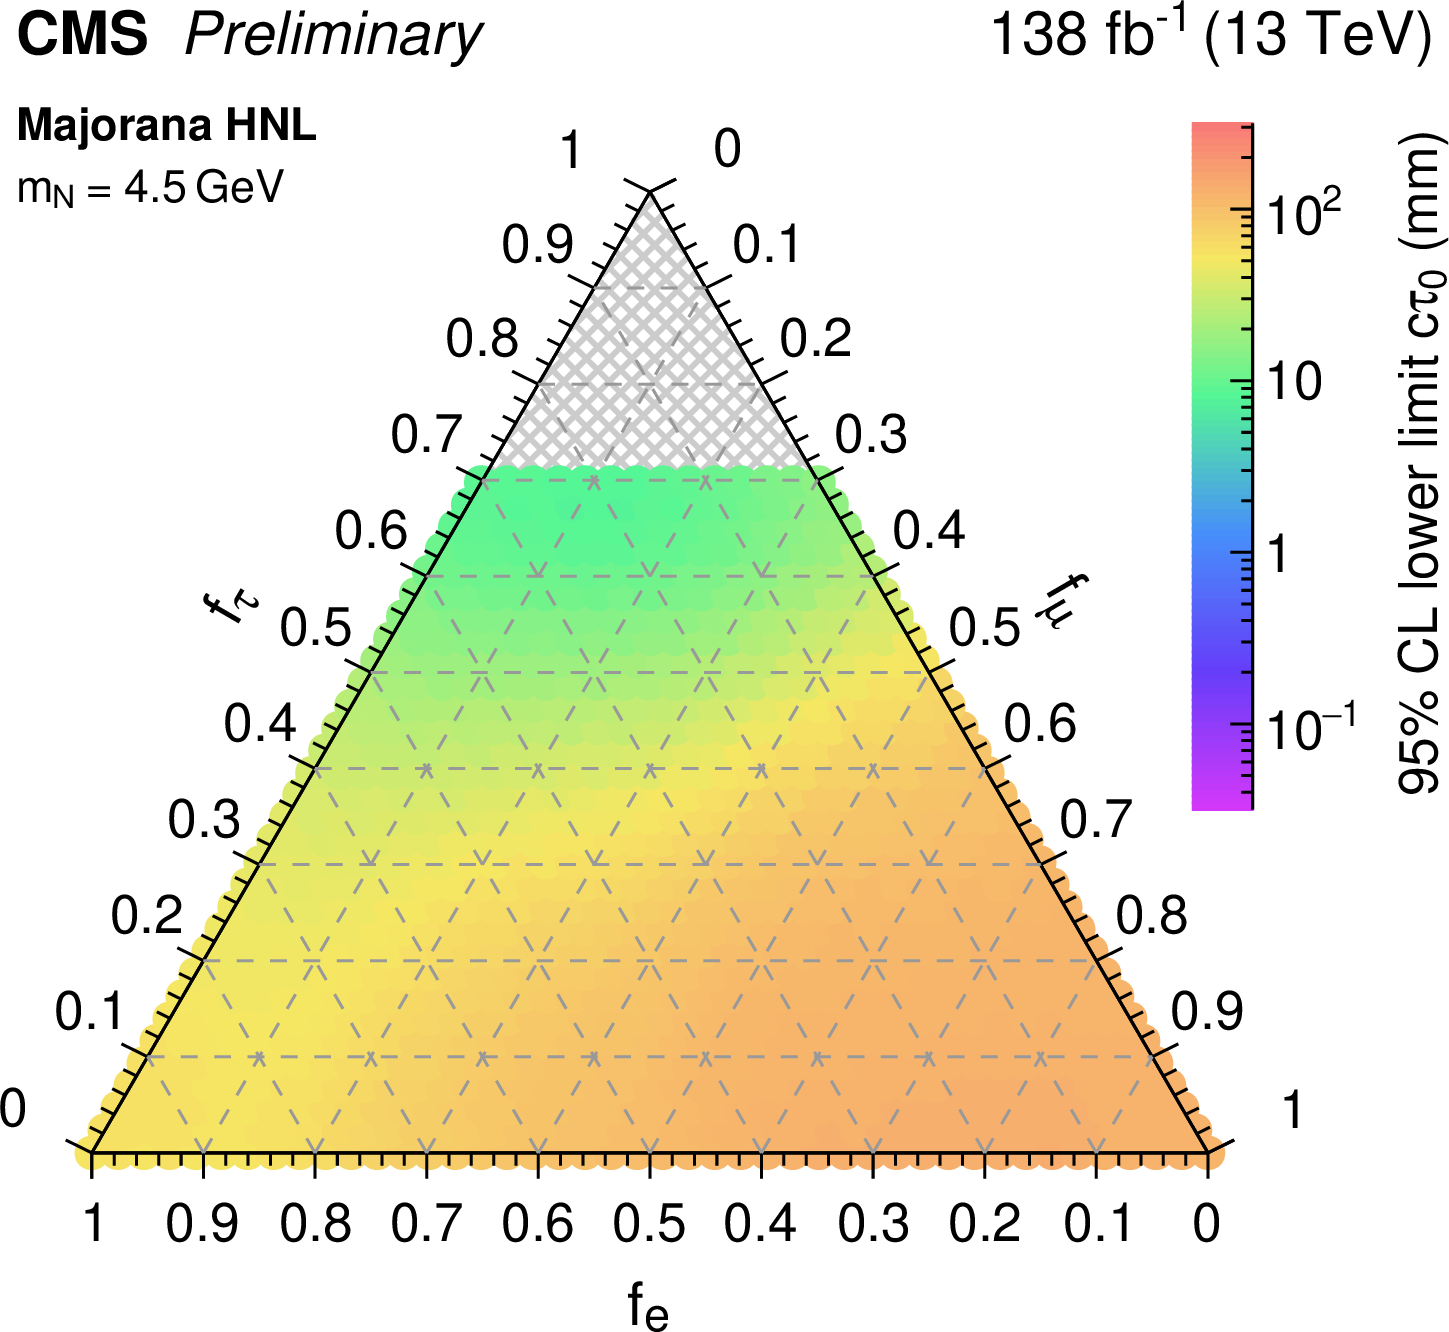
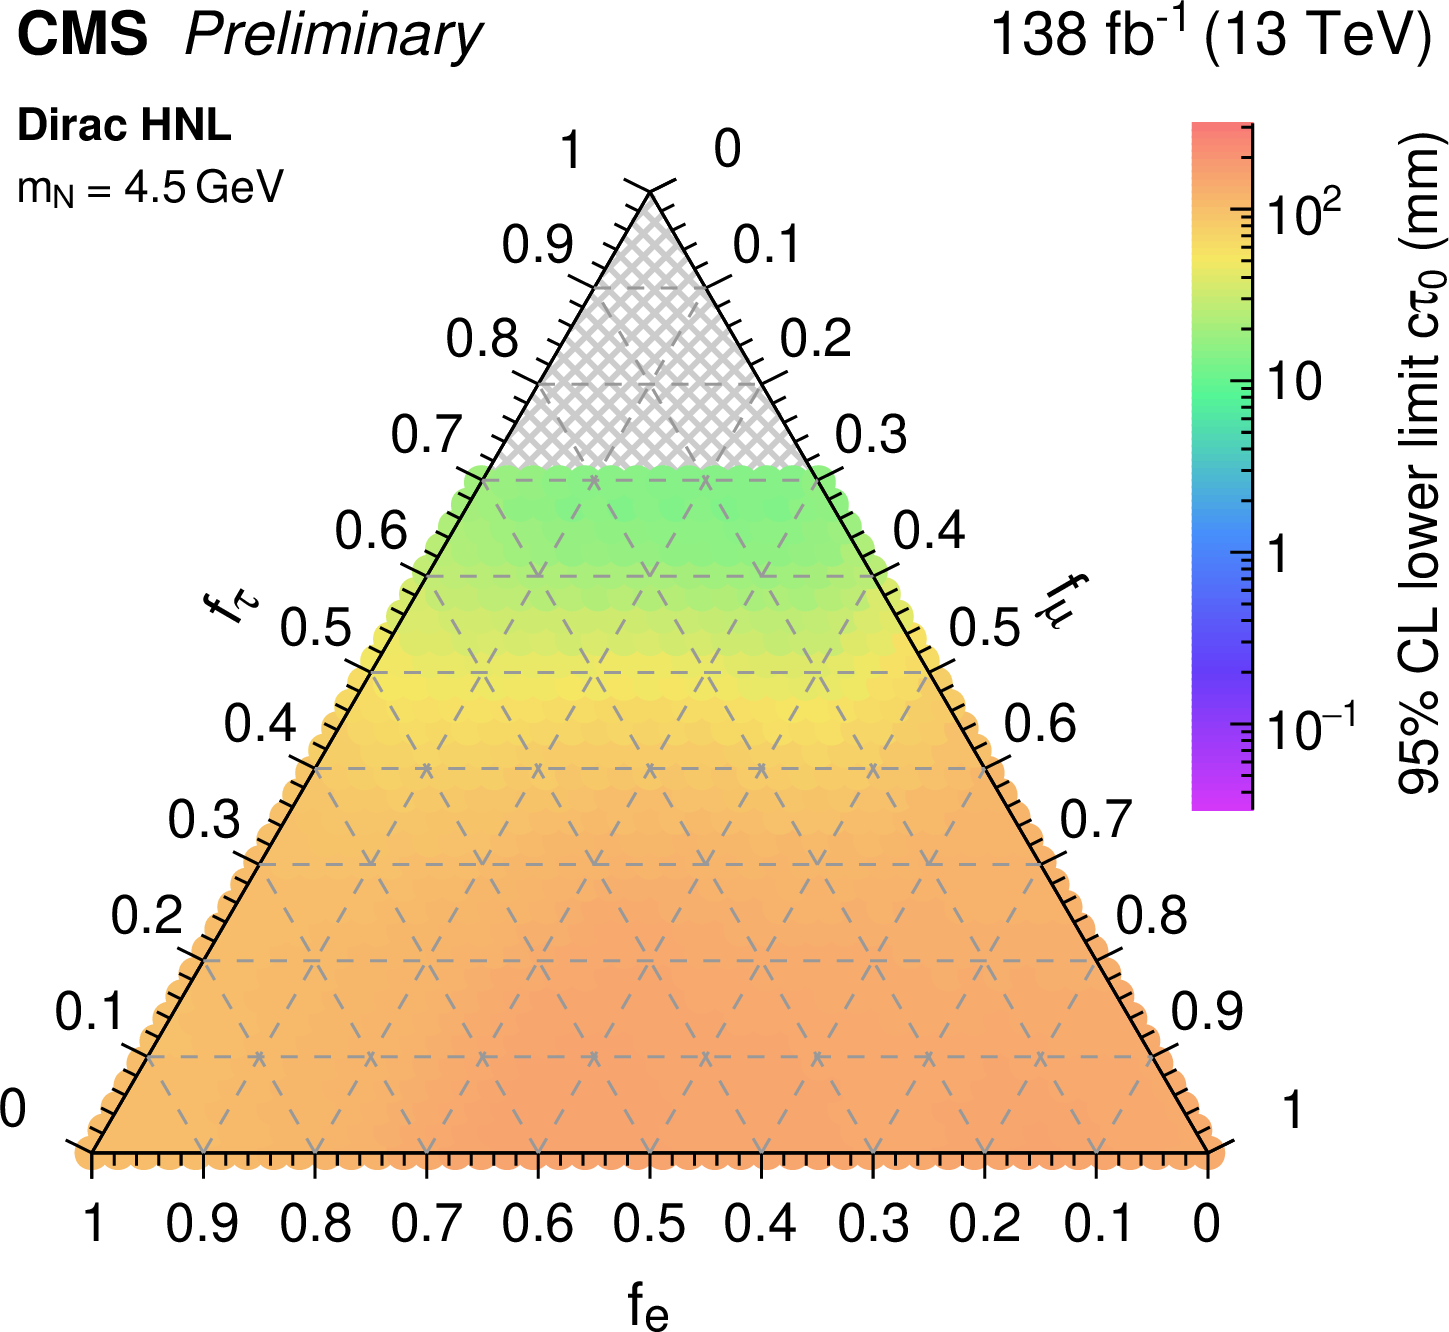
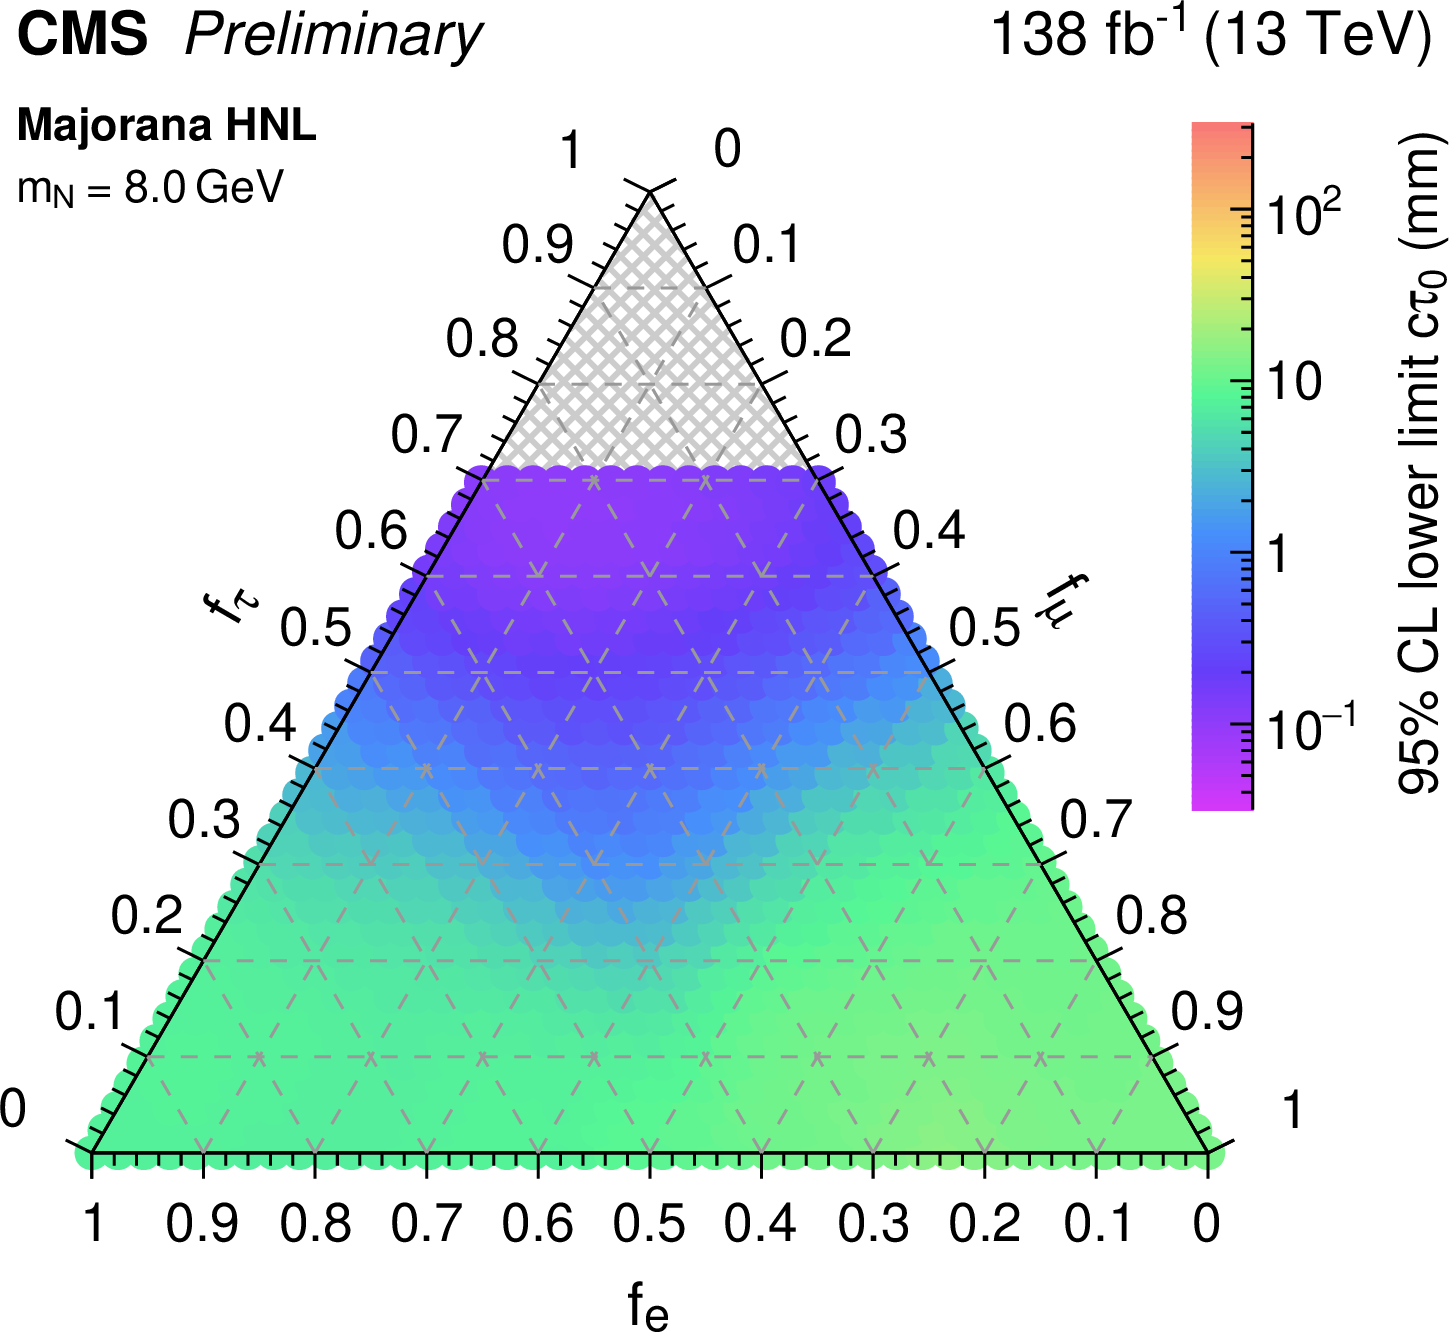
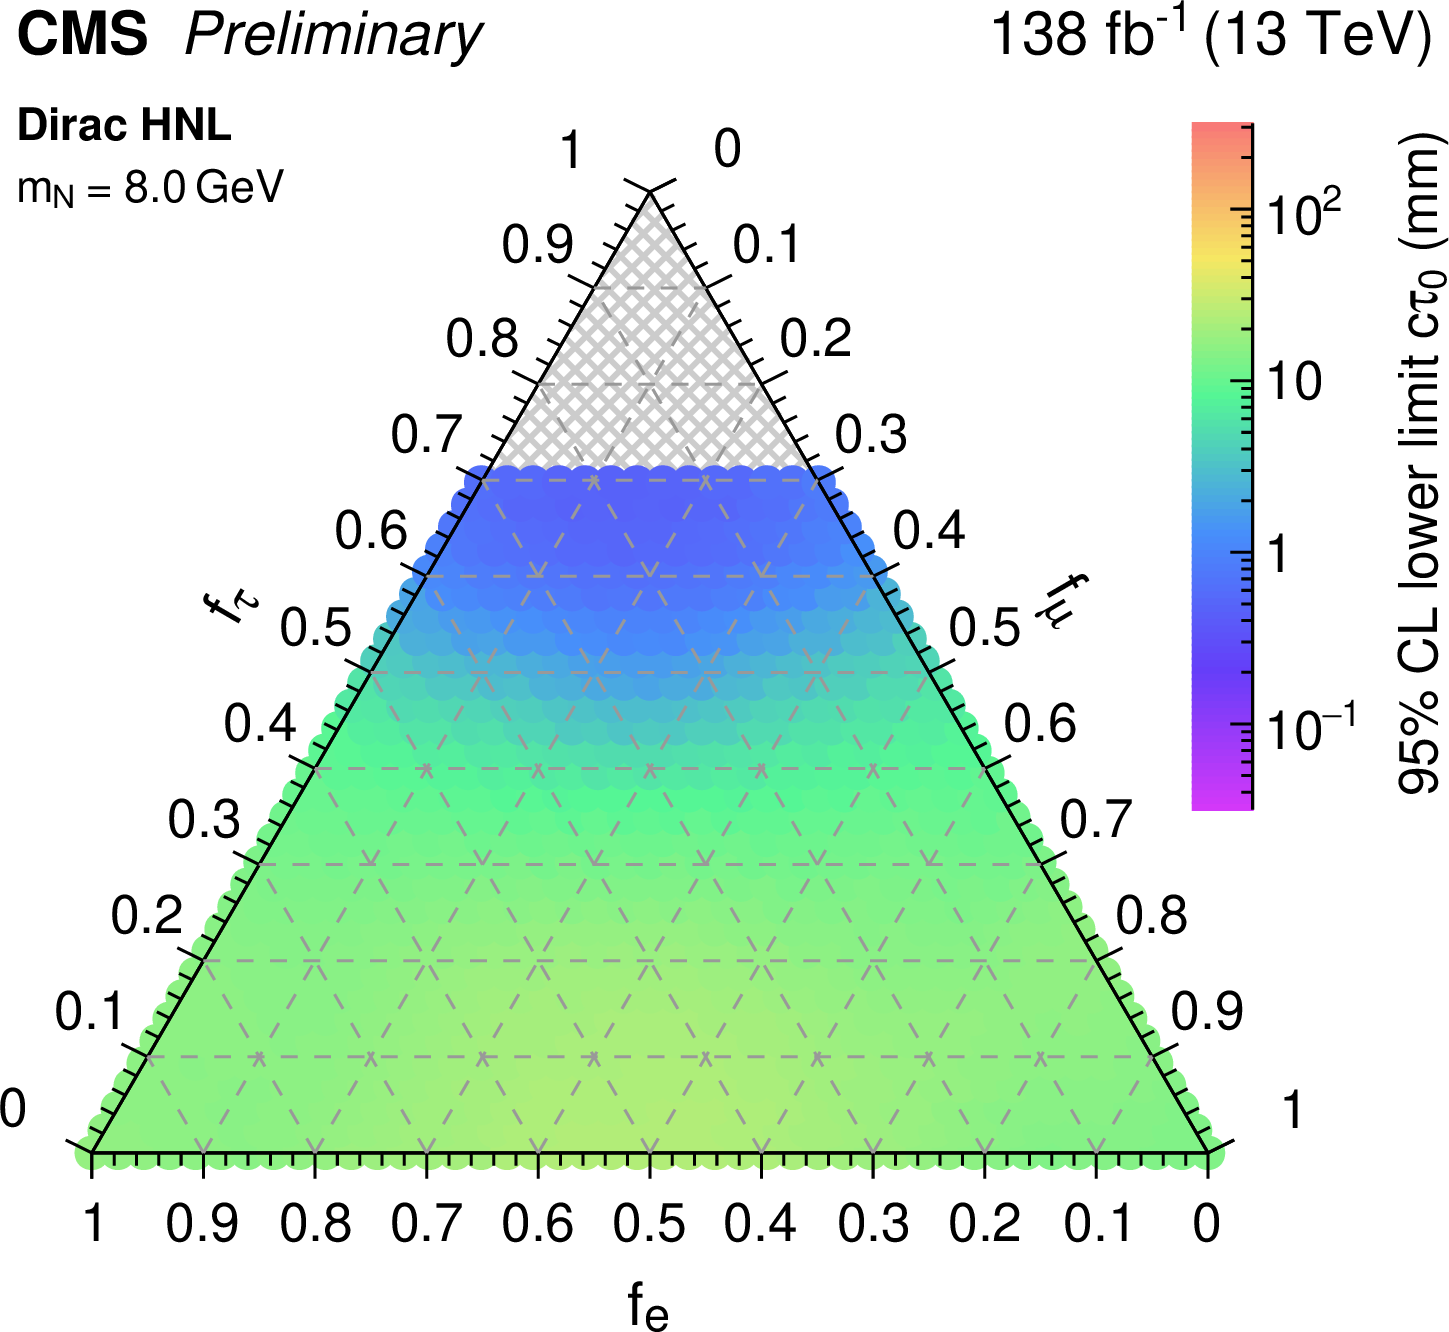
Figure 8:
Observed 95% CL lower limits on the (left column) Majorana and (right column) Dirac HNL proper lifetime as a function of the relative coupling to the three lepton generations considering a fixed mass of (top row) 4.5 GeV and (bottom row) 8.0 GeV. |
png pdf |
Figure 8-a:
Observed 95% CL lower limits on the (left column) Majorana and (right column) Dirac HNL proper lifetime as a function of the relative coupling to the three lepton generations considering a fixed mass of (top row) 4.5 GeV and (bottom row) 8.0 GeV. |
png pdf |
Figure 8-b:
Observed 95% CL lower limits on the (left column) Majorana and (right column) Dirac HNL proper lifetime as a function of the relative coupling to the three lepton generations considering a fixed mass of (top row) 4.5 GeV and (bottom row) 8.0 GeV. |
png pdf |
Figure 8-c:
Observed 95% CL lower limits on the (left column) Majorana and (right column) Dirac HNL proper lifetime as a function of the relative coupling to the three lepton generations considering a fixed mass of (top row) 4.5 GeV and (bottom row) 8.0 GeV. |
png pdf |
Figure 8-d:
Observed 95% CL lower limits on the (left column) Majorana and (right column) Dirac HNL proper lifetime as a function of the relative coupling to the three lepton generations considering a fixed mass of (top row) 4.5 GeV and (bottom row) 8.0 GeV. |
| Summary |
| A search for long-lived heavy neutral leptons (HNLs) is presented, which are predicted in extensions to the standard model of particle physics through the seesaw mechanism. Dirac or Majorana HNLs can mix with the three standard model lepton generations in a nontrivial way, resulting in lepton flavour number violation. Hence, a complete set of coupling scenarios involving all three lepton generations is considered. A data sample of proton-proton collision events, corresponding to an integrated luminosity of 138 fb$ ^{-1} $, is analyzed. Events containing two leptons (electron or muon) and jets are selected and categorized according to the lepton flavour and electrical charge, the displacement of the lower-momentum lepton, and whether the lepton is clustered in a nearby jet. Jets originating from the decay of a long-lived HNL are identified through a deep neural network using various features of the jet and its constituent particles. The network training relies on simulated event samples that cover a broad range of HNL masses and lifetimes, and thus acts as a powerful discriminant for jets that are spatially separated from the luminous region, even in the absence of reconstructed secondary vertices. Contributions from background processes are determined from data in sideband regions. No excess of events in the data over the expected background is observed. Upper limits on the HNL production cross section are determined as a function of the HNL mass and the three coupling strengths to each lepton generation. Results are given for Dirac and Majorana HNL production considering various coupling combinations. The best limit on the coupling strength is obtained for pure muon coupling scenarios excluding values of $ |V_{\mu\textrm{N}}|^{2} > $ 5 (4) $\times$ 10$^{-7} $ for Dirac (Majorana) HNLs with a mass of 10 GeV at 95% CL. |
| References | ||||
| 1 | Super-Kamiokande Collaboration | Evidence for oscillation of atmospheric neutrinos | PRL 81 (1998) 1562 | hep-ex/9807003 |
| 2 | SNO Collaboration | Direct evidence for neutrino flavor transformation from neutral current interactions in the Sudbury Neutrino Observatory | PRL 89 (2002) 011301 | nucl-ex/0204008 |
| 3 | I. Esteban et al. | Global analysis of three-flavour neutrino oscillations: Synergies and tensions in the determination of $ \theta_{23} $, $ \delta_{CP} $, and the mass ordering | JHEP 01 (2019) 106 | 1811.05487 |
| 4 | KATRIN Collaboration | Direct neutrino-mass measurement with sub-electronvolt sensitivity | Nature Phys. 18 (2022) 160 | 2105.08533 |
| 5 | Particle Data Group Collaboration | Review of particle physics | Prog. Theor. Exp. Phys. 2020 (2020) 083C01 | |
| 6 | P. Minkowski | $ \mu \to \mathrm{e} \gamma $ at a rate of one out of 1-billion muon decays? | PLB 67 (1977) 421 | |
| 7 | M. Gell-Mann, P. Ramond, and R. Slansky | Complex spinors and unified theories | in Supergravity: Proceedings of the supergravity workshop at Stony Brook, . North-Holland, Amsterdam, Netherlands, 1979 link |
|
| 8 | T. Yanagida | Horizontal gauge symmetry and masses of neutrinos | in Proceedings of the workshop on the unified theory and the baryon number in the universe, . National Laboratory for High Energy Physics (KEK), 1979 | |
| 9 | R. N. Mohapatra and G. Senjanovi\ifmmode \acute c \else \' c \fi | Neutrino mass and spontaneous parity violation | PRL 44 (1980) 912 | |
| 10 | J. Schechter and J. W. F. Valle | Neutrino masses in SU(2) \ensuremath\bigotimes U(1) theories | PRD 22 (1980) 2227 | |
| 11 | R. Foot, H. Lew, X.-G. He, and G. C. Joshi | See-saw neutrino masses induced by a triplet of leptons | Z. Phys. C 44 (1989) 441 | |
| 12 | T. Appelquist and R. Shrock | Neutrino masses in theories with dynamical electroweak symmetry breaking | PLB 548 (2002) 204 | hep-ph/0204141 |
| 13 | T. Asaka, S. Blanchet, and M. Shaposhnikov | The $ \nu $MSM, dark matter and neutrino masses | PLB 631 (2005) 151 | hep-ph/0503065 |
| 14 | T. Asaka and M. Shaposhnikov | The $ \nu $MSM, dark matter and baryon asymmetry of the universe | PLB 620 (2005) 17 | hep-ph/0505013 |
| 15 | K. Bondarenko, A. Boyarsky, D. Gorbunov, and O. Ruchayskiy | Phenomenology of GeV-scale heavy neutral leptons | JHEP 11 (2018) 032 | 1805.08567 |
| 16 | F. F. Deppisch, P. S. Bhupal Dev, and A. Pilaftsis | Neutrinos and collider physics | New J. Phys. 17 (2015) 075019 | 1502.06541 |
| 17 | J. Beacham et al. | Physics beyond colliders at CERN: Beyond the standard model working group report | no.~1, 01, 2020 JPG 47 (2020) |
1901.09966 |
| 18 | ATLAS Collaboration | Search for heavy neutral leptons in decays of W bosons produced in 13 TeV pp collisions using prompt and displaced signatures with the ATLAS detector | JHEP 10 (2019) 265 | 1905.09787 |
| 19 | ATLAS Collaboration | Search for heavy neutral leptons in decays of W bosons using a dilepton displaced vertex in $ \sqrt{s}= $ 13 TeV pp collisions with the ATLAS detector | submitted to Phys. Rev. Lett., 2022 | 2204.11988 |
| 20 | CMS Collaboration | Search for heavy neutral leptons in events with three charged leptons in proton-proton collisions at $ \sqrt{s} = $ 13 TeV | PRL 120 (2018) 221801 | CMS-EXO-17-012 1802.02965 |
| 21 | CMS Collaboration | Search for heavy Majorana neutrinos in same-sign dilepton channels in proton-proton collisions at $ \sqrt{s}= $ 13 TeV | JHEP 01 (2019) 122 | CMS-EXO-17-028 1806.10905 |
| 22 | LHCb Collaboration | Search for heavy neutral leptons in $ \textrm{W}^+\to\mu^{+}\mu^{\pm}\textrm{jet} $ decays | EPJC 81 (2021) 248 | 2011.05263 |
| 23 | LHCb Collaboration | Search for long-lived particles decaying to $ \textrm{e}^\pm \mu^\mp \nu $ | EPJC 81 (2021) 261 | 2012.02696 |
| 24 | M. Chrzaszcz et al. | A frequentist analysis of three right-handed neutrinos with GAMBIT | EPJC 80 (2020) 569 | 1908.02302 |
| 25 | CMS Collaboration | The CMS experiment at the CERN LHC | JINST 3 (2008) S08004 | |
| 26 | CMS Collaboration | Particle-flow reconstruction and global event description with the CMS detector | JINST 12 (2017) P10003 | CMS-PRF-14-001 1706.04965 |
| 27 | M. Cacciari, G. P. Salam, and G. Soyez | The anti-$ k_{\mathrm{T}} $ jet clustering algorithm | JHEP 04 (2008) 063 | 0802.1189 |
| 28 | CMS Collaboration | The CMS trigger system | JINST 12 (2017) P01020 | CMS-TRG-12-001 1609.02366 |
| 29 | CMS Collaboration | Electron and photon reconstruction and identification with the CMS experiment at the CERN LHC | JINST 16 (2021) P05014 | CMS-EGM-17-001 2012.06888 |
| 30 | J. Alwall et al. | The automated computation of tree-level and next-to-leading order differential cross sections, and their matching to parton shower simulations | JHEP 07 (2014) 079 | 1405.0301 |
| 31 | NNPDF Collaboration | Parton distributions from high-precision collider data | EPJC 77 (2017) 663 | 1706.00428 |
| 32 | T. Sjöstrand et al. | An introduction to PYTHIA 8.2 | Comput. Phys. Commun. 191 (2015) 159 | 1410.3012 |
| 33 | CMS Collaboration | Event generator tunes obtained from underlying event and multiparton scattering measurements | EPJC 76 (2016) 155 | CMS-GEN-14-001 1512.00815 |
| 34 | CMS Collaboration | Extraction and validation of a new set of CMS PYTHIA8 tunes from underlying-event measurements | Technical Report, 2019 | CMS-GEN-17-001 1903.12179 |
| 35 | O. Mattelaer | On the maximal use of Monte Carlo samples: Re-weighting events at NLO accuracy | EPJC 76 (2016) 674 | 1607.00763 |
| 36 | A. Atre, T. Han, S. Pascoli, and B. Zhang | The search for neavy Majorana neutrinos | JHEP 05 (2009) 030 | 0901.3589 |
| 37 | D. Alva, T. Han, and R. Ruiz | Heavy Majorana neutrinos from $ \textrm{W}\gamma $ fusion at hadron colliders | JHEP 02 (2015) 072 | 1411.7305 |
| 38 | C. Degrande, O. Mattelaer, R. Ruiz, and J. Turner | Fully-automated precision predictions for heavy neutrino production mechanisms at hadron colliders | PRD 94 (2016) 053002 | 1602.06957 |
| 39 | S. Pascoli, R. Ruiz, and C. Weiland | Heavy neutrinos with dynamic jet vetoes: Multilepton searches at $ \sqrt{s}= $ 14, 27, and 100 TeV | JHEP 06 (2019) 049 | 1812.08750 |
| 40 | S. Alioli, P. Nason, C. Oleari, and E. Re | A general framework for implementing NLO calculations in shower Monte Carlo programs: The POWHEG BOX | JHEP 06 (2010) 043 | 1002.2581 |
| 41 | R. Frederix, E. Re, and P. Torrielli | Single-top $ t $-channel hadroproduction in the four-flavour scheme with POWHEG and aMC@NLO | JHEP 09 (2012) 130 | 1207.5391 |
| 42 | S. Frixione, P. Nason, and G. Ridolfi | A positive-weight next-to-leading-order Monte Carlo for heavy flavour hadroproduction | JHEP 09 (2007) 126 | 0707.3088 |
| 43 | GEANT4 Collaboration | GEANT4 --- a simulation toolkit | NIM A 506 (2003) 250 | |
| 44 | M. Cacciari, G. P. Salam, and G. Soyez | FastJet user manual | EPJC 72 (2012) 1896 | 1111.6097 |
| 45 | CMS Collaboration | Performance of missing transverse momentum reconstruction in proton-proton collisions at $ \sqrt{s} = $ 13\,TeV using the CMS detector | JINST 14 (2019) P07004 | CMS-JME-17-001 1903.06078 |
| 46 | CMS Collaboration | Performance of the CMS muon detector and muon reconstruction with proton-proton collisions at $ \sqrt{s}= $ 13 TeV | JINST 13 (2018) P06015 | CMS-MUO-16-001 1804.04528 |
| 47 | CMS Collaboration | Jet energy scale and resolution in the CMS experiment in pp collisions at 8 TeV | JINST 12 (2017) P02014 | CMS-JME-13-004 1607.03663 |
| 48 | CMS Collaboration | Description and performance of track and primary-vertex reconstruction with the CMS tracker | JINST 9 (2014) P10009 | CMS-TRK-11-001 1405.6569 |
| 49 | CMS Collaboration | A deep neural network to search for new long-lived particles decaying to jets | Mach. Learn.:, 2020 Sci. Technol. 1 (2020) 035012 |
CMS-EXO-19-011 1912.12238 |
| 50 | CMS Collaboration | Identification of heavy-flavour jets with the CMS detector in pp collisions at 13 TeV | JINST 13 (2018) P05011 | CMS-BTV-16-002 1712.07158 |
| 51 | J. Thaler and K. Van Tilburg | Identifying boosted objects with N-subjettiness | JHEP 03 (2011) 015 | 1011.2268 |
| 52 | D. Bertolini, P. Harris, M. Low, and N. Tran | Pileup per particle identification | JHEP 10 (2014) 059 | 1407.6013 |
| 53 | CMS Collaboration | Measurement of $ \textrm{B}\overline{\textrm{B}} $ angular correlations based on secondary vertex reconstruction at $ \sqrt{s}= $ 7 TeV | JHEP 03 (2011) 136 | CMS-BPH-10-010 1102.3194 |
| 54 | W. Adam, R. Fruehwirth, A. Strandlie, and T. Todorov | Reconstruction of electrons with the Gaussian-sum filter in the CMS tracker at the LHC | J. Phys. G:, 2005 Nucl. Part. Phys. 31 (2005) N9 |
|
| 55 | P. Baldi et al. | Parameterized neural networks for high-energy physics | EPJC 76 (2016) 235 | 1601.07913 |
| 56 | Y. Ganin and V. Lempitsky | Unsupervised domain adaptation by backpropagation | 1409.7495 | |
| 57 | M. Arjovsky, S. Chintala, and L. Bottou | Wasserstein GAN | 1701.07875 | |
| 58 | CMS Collaboration | Measurement of the inelastic proton-proton cross section at $ \sqrt{s}= $ 13 TeV | JHEP 07 (2018) 161 | CMS-FSQ-15-005 1802.02613 |
| 59 | CMS Collaboration | Precision luminosity measurement in proton-proton collisions at $ \sqrt{s} = $ 13 TeV in 2015 and 2016 at CMS | CMS-LUM-17-003 2104.01927 |
|
| 60 | CMS Collaboration | CMS luminosity measurement for the 2017 data-taking period at $ \sqrt{s} = $ 13 TeV | Physics Analysis Summary, 2018 CMS-PAS-LUM-17-004 |
CMS-PAS-LUM-17-004 |
| 61 | CMS Collaboration | CMS luminosity measurement for the 2018 data-taking period at $ \sqrt{s} = $ 13 TeV | Physics Analysis Summary, 2019 CMS-PAS-LUM-18-002 |
CMS-PAS-LUM-18-002 |
| 62 | R. J. Barlow and C. Beeston | Fitting using finite Monte Carlo samples | Comput. Phys. Commun. 77 (1993) 219 | |
| 63 | A. Kalogeropoulos and J. Alwall | The SysCalc code: A tool to derive theoretical systematic uncertainties | 1801.08401 | |
| 64 | G. Cowan | Discovery sensitivity for a counting experiment with background uncertainty | Technical Report, . Royal Holloway, London, U.K., 2012 link |
|
| 65 | ATLAS and CMS Collaborations, and LHC Higgs Combination Group | Procedure for the LHC Higgs boson search combination in summer 2011 | Technical Report CMS-NOTE-2011-005, ATL-PHYS-PUB-2011-11, 2011 | |
| 66 | T. Junk | Confidence level computation for combining searches with small statistics | Nucl. Instr. Meth. A 434 (1999) 435 | hep-ex/9902006 |
| 67 | A. L. Read | Presentation of search results: The $ \text{CL}_\text{s} $ technique | JPG 28 (2002) 2693 | |
| 68 | G. Cowan, K. Cranmer, E. Gross, and O. Vitells | Asymptotic formulae for likelihood-based tests of new physics | [Erratum: Eur. Phys. J. C 73 () 2501, \DOI10.1140/epjc/s2-013-2501-z], 2011 EPJC 71 (2011) 1554 |
1007.1727 |
|
|
Compact Muon Solenoid LHC, CERN |
|

|

|

|

|

|