

Compact Muon Solenoid
LHC, CERN
| CMS-PAS-EXO-20-002 | ||
| Search for a right-handed W boson and heavy neutrino in proton-proton collisions at $\sqrt{s}=$ 13 TeV | ||
| CMS Collaboration | ||
| July 2021 | ||
| Abstract: A search for a right-handed $\mathrm{W}$ boson ($\mathrm{W_{R}}$) and a heavy neutrino, in a final state consisting of two same-flavor leptons (e or $\mu$) and two quarks, is presented. The search is performed by the CMS experiment at the CERN LHC using a data sample of proton-proton collisions at a center-of-mass energy of 13 TeV corresponding to an integrated luminosity of 137 fb$^{-1}$. The search covers both regions of phase space where the decay products of the heavy neutrino are merged into a single large-area jet and where the decay products are well-separated. The expected signal is characterized by an excess above the prediction from the standard model in the invariant mass distribution of the final-state objects. The observations are interpreted as upper limits on the products of $\mathrm{W_{R}}$ production cross sections and branching fractions assuming that couplings are identical to those of the standard model for the $\mathrm{W}$ boson. For $m_\mathrm{N}=1/2m_{\mathrm{W_{R}}}$ ($m_\mathrm{N}=$ 200), the mass of the $\mathrm{W_{R}}$ is excluded at 95% confidence level up to 4.7 (4.8) and 5.0 (5.4) TeV for the electron and muon channel, respectively. The maximum observed local significance is in the electron channel and is 2.95 standard deviations for a signal with $(m_{\mathrm{W_{R}}}, m_\mathrm{N}) = $ (6000, 800) GeV, corresponding to a global significance of 2.78$\sigma$. This analysis provides the most stringent limits on the $\mathrm{W_{R}}$ mass to date. | ||
|
Links:
CDS record (PDF) ;
CADI line (restricted) ;
These preliminary results are superseded in this paper, Submitted to JHEP. The superseded preliminary plots can be found here. |
||
| Figures | |
png pdf |
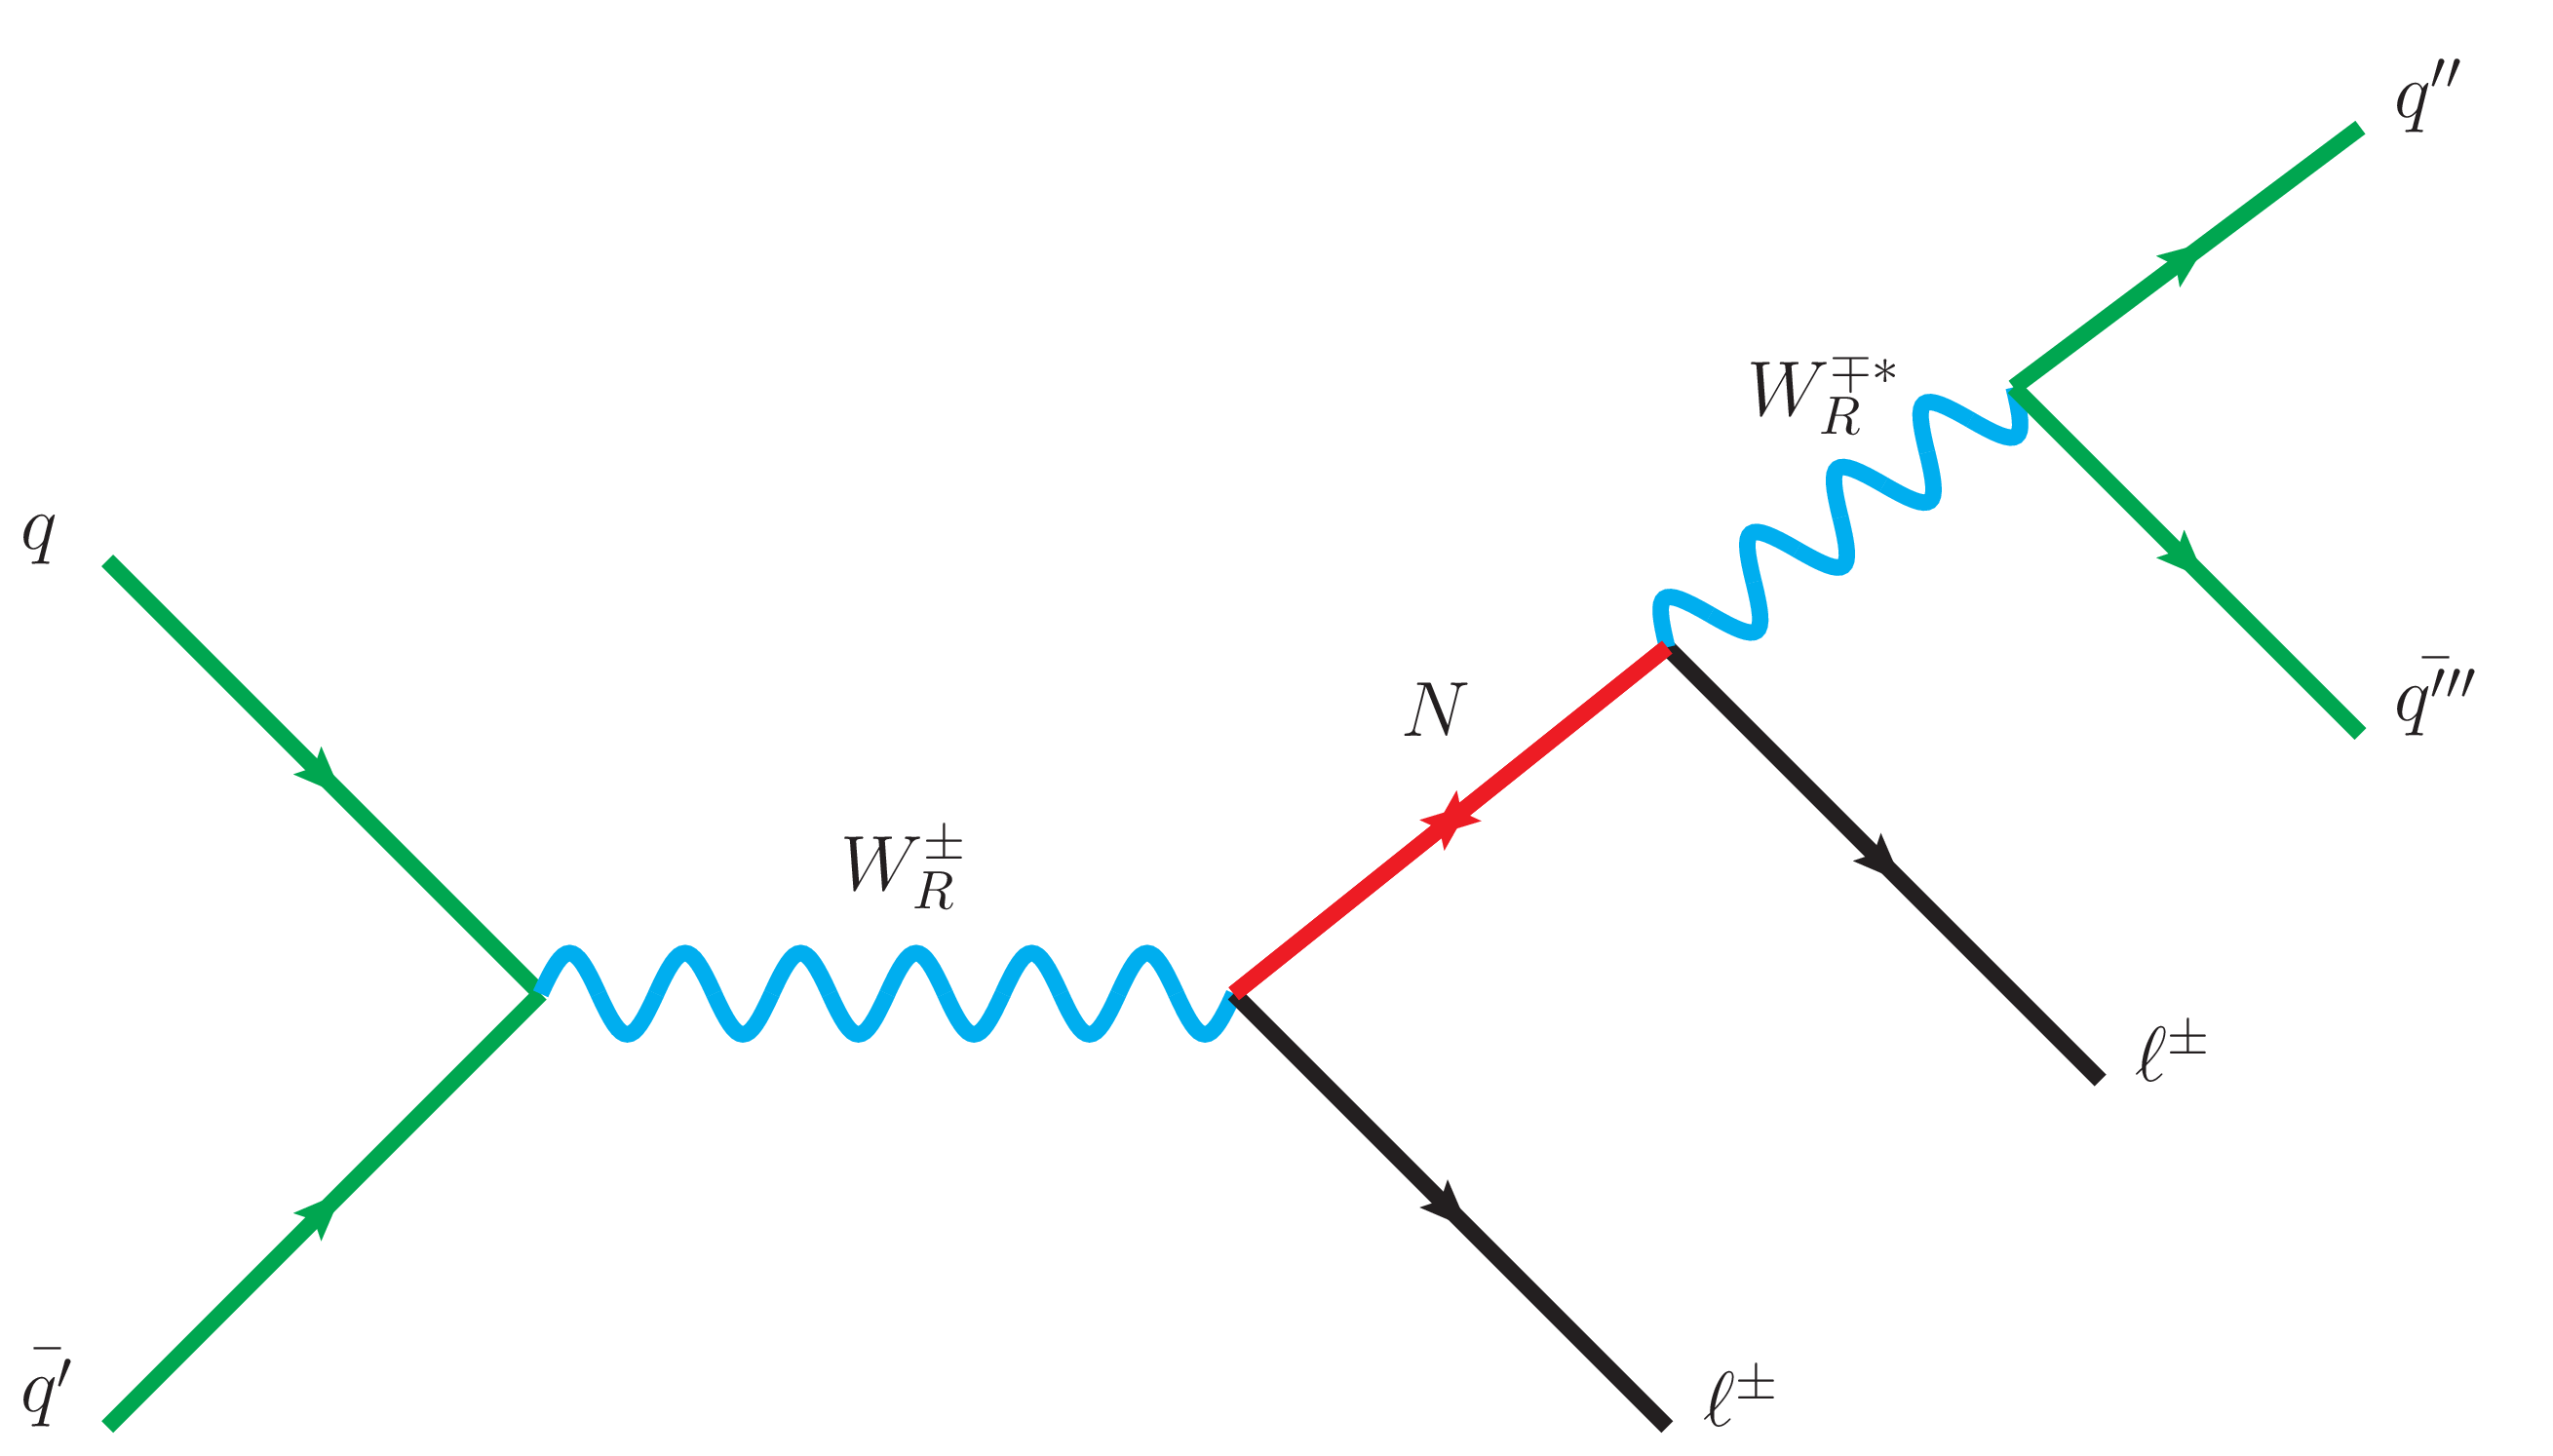
Figure 1:
Feynman diagram for the production of the heavy neutrino via the decay of a $\mathrm{W}_{R} $ boson. |
png pdf |
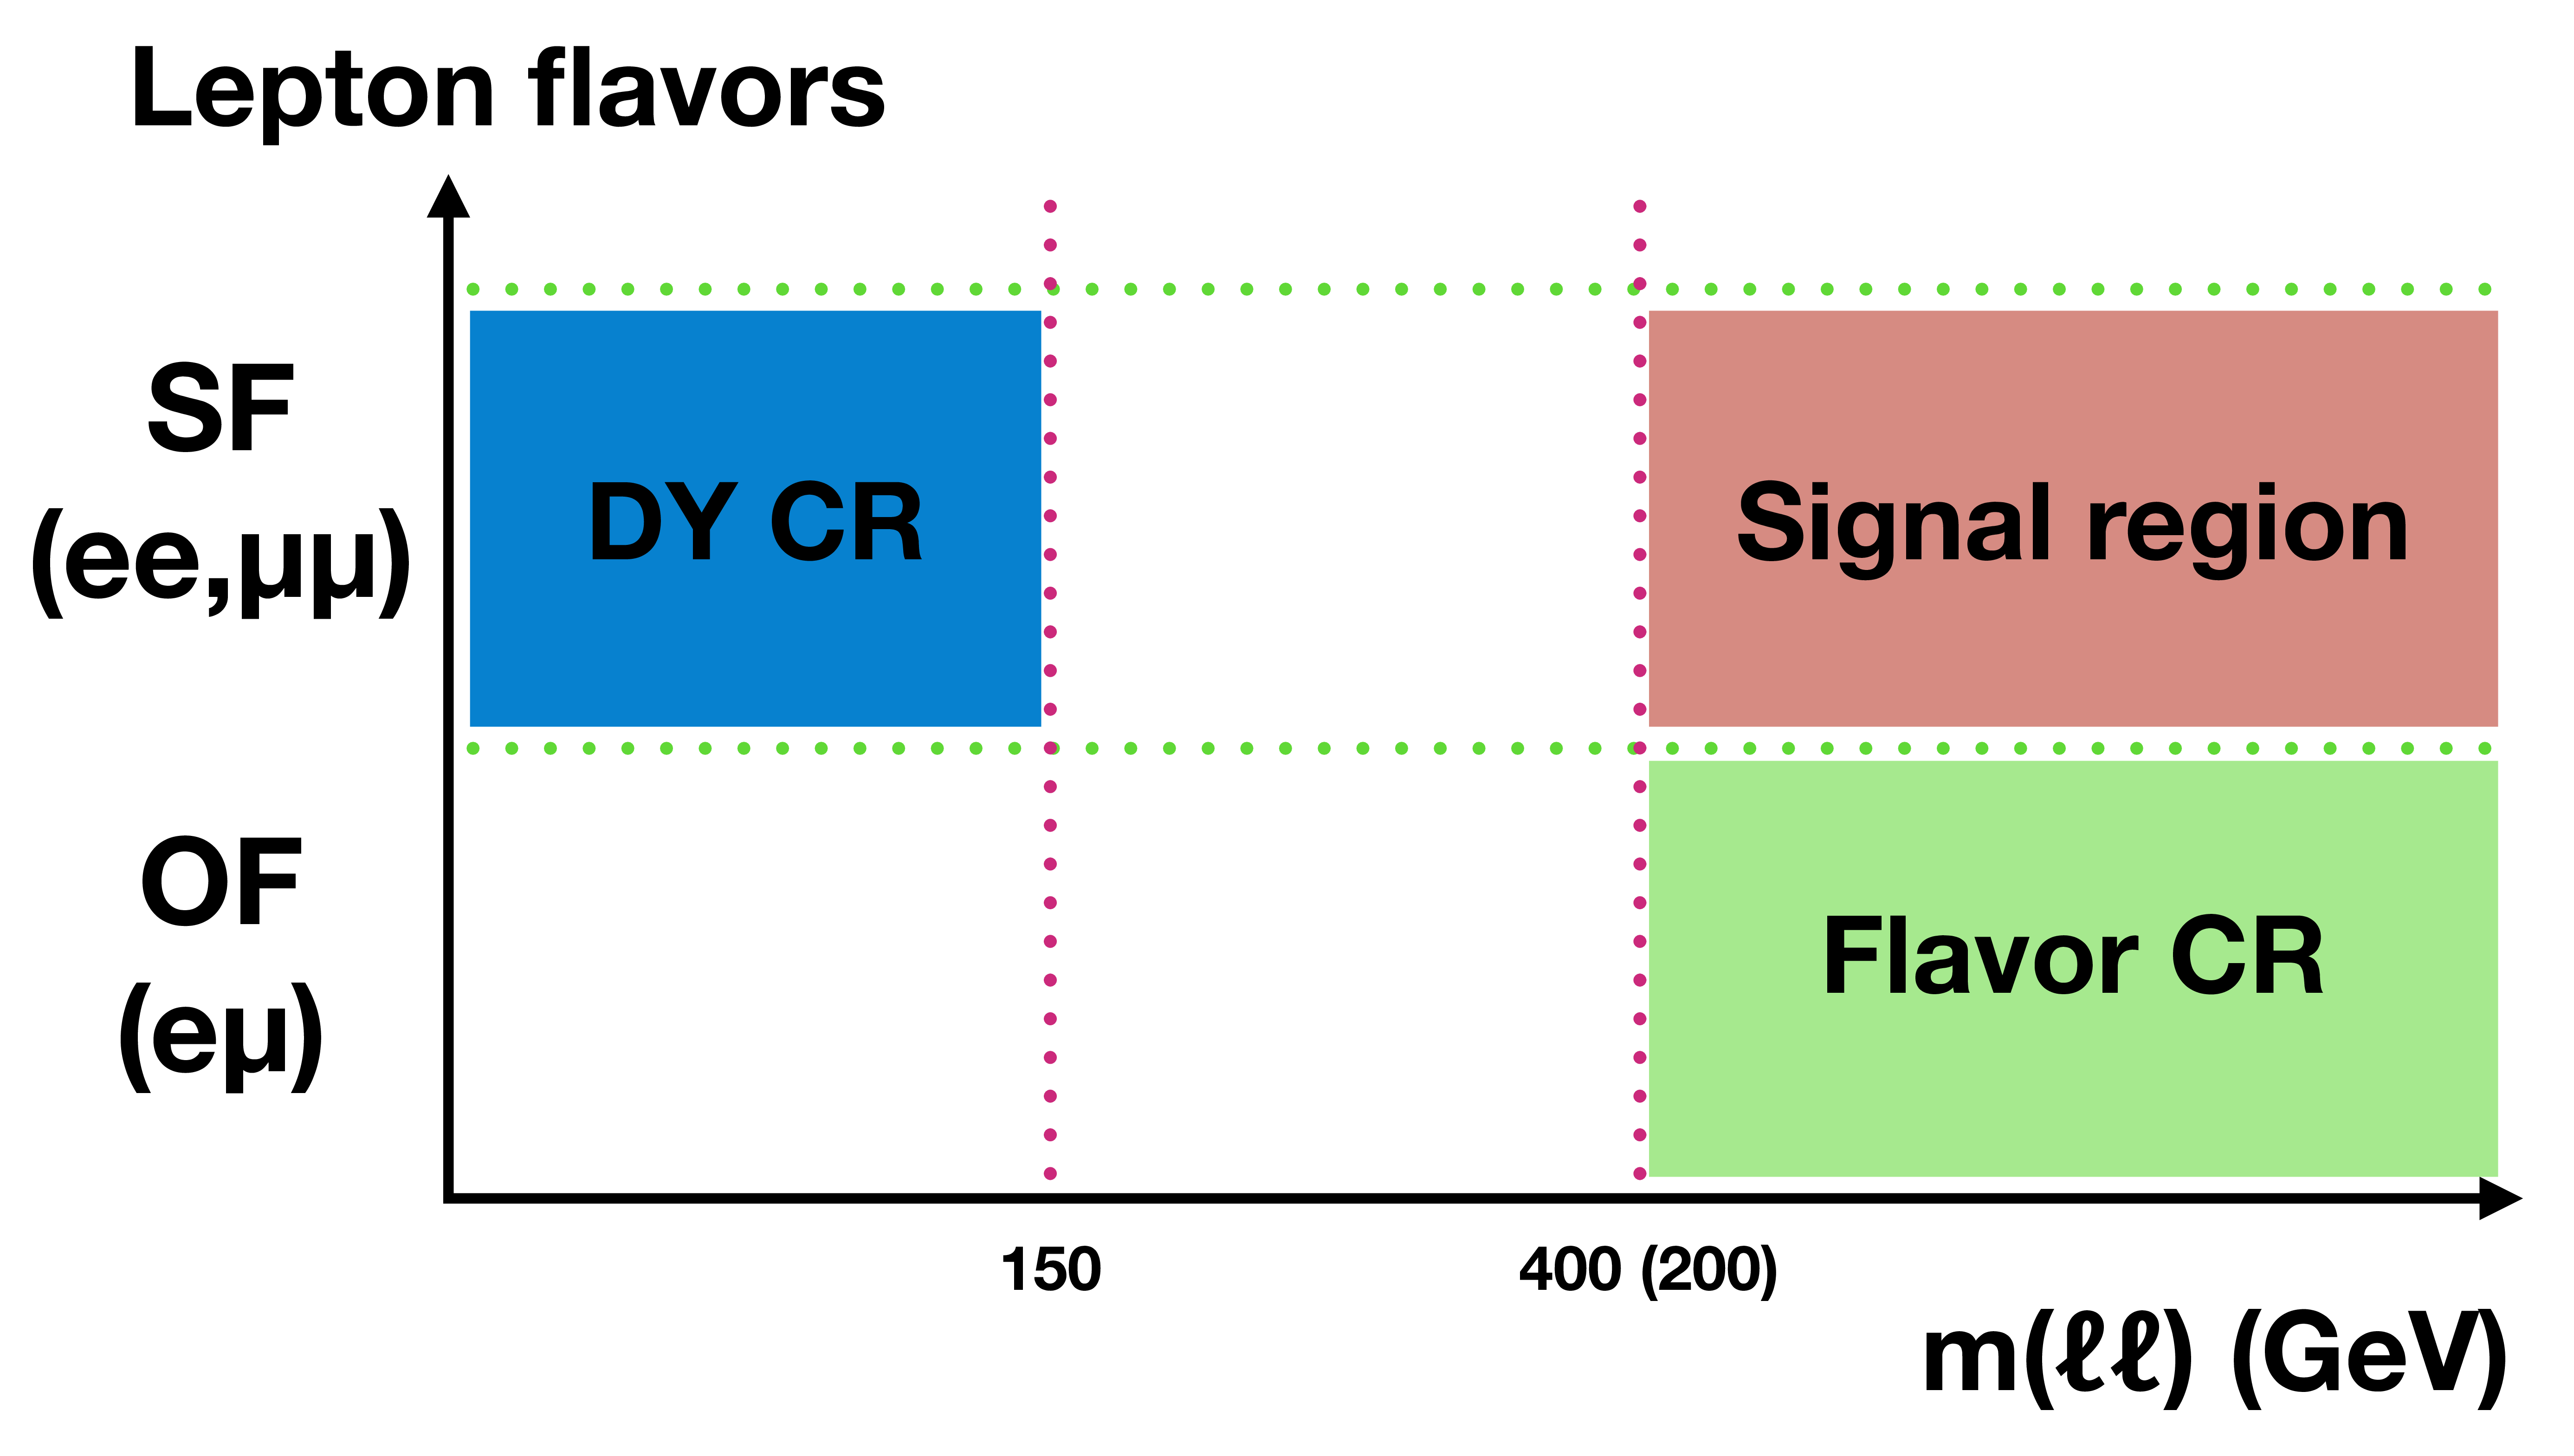
Figure 2:
A schematic diagram of the analysis region. The minimum values of the dilepton mass in the signal region and the flavor CR are 400 (200) GeV for the resolved (boosted) regions. The ${\mathrm{t} {}\mathrm{\bar{t}}}$ and the single top production with an associated $\mathrm{W} $ boson backgrounds are estimated from the flavor CR (green). The Drell-Yan background is estimated from the DY CR (blue). |
png pdf |
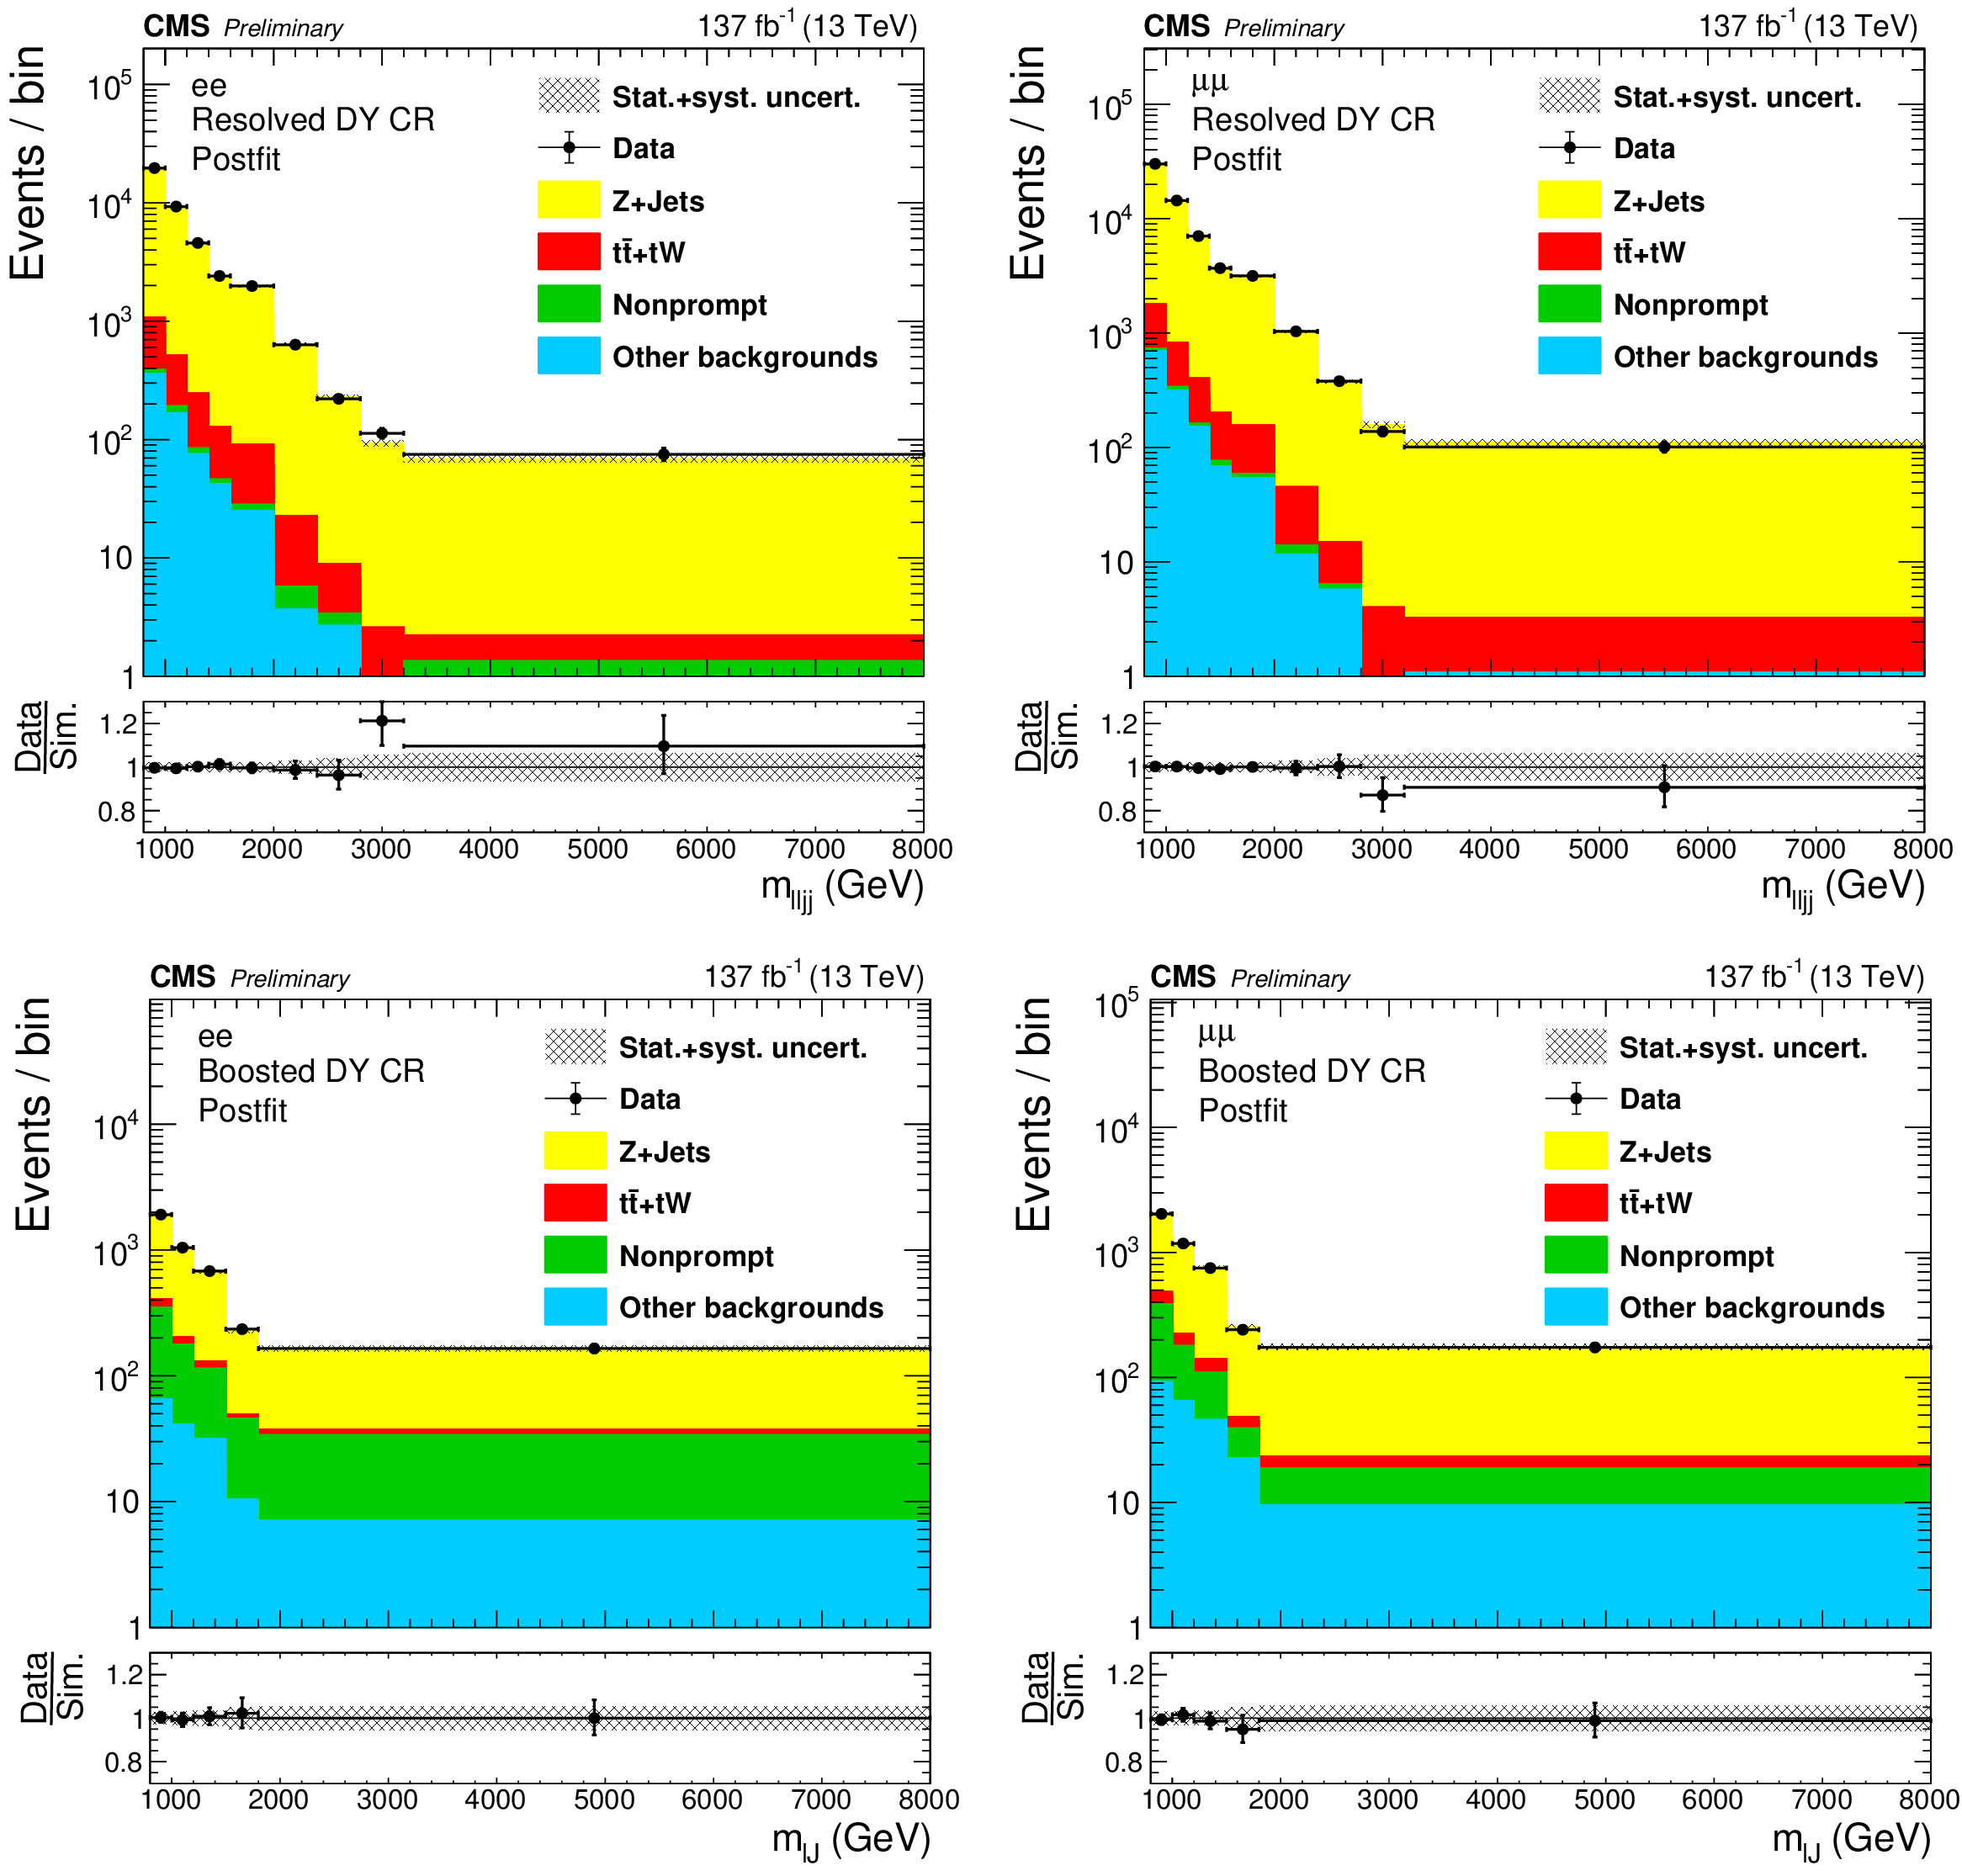
Figure 3:
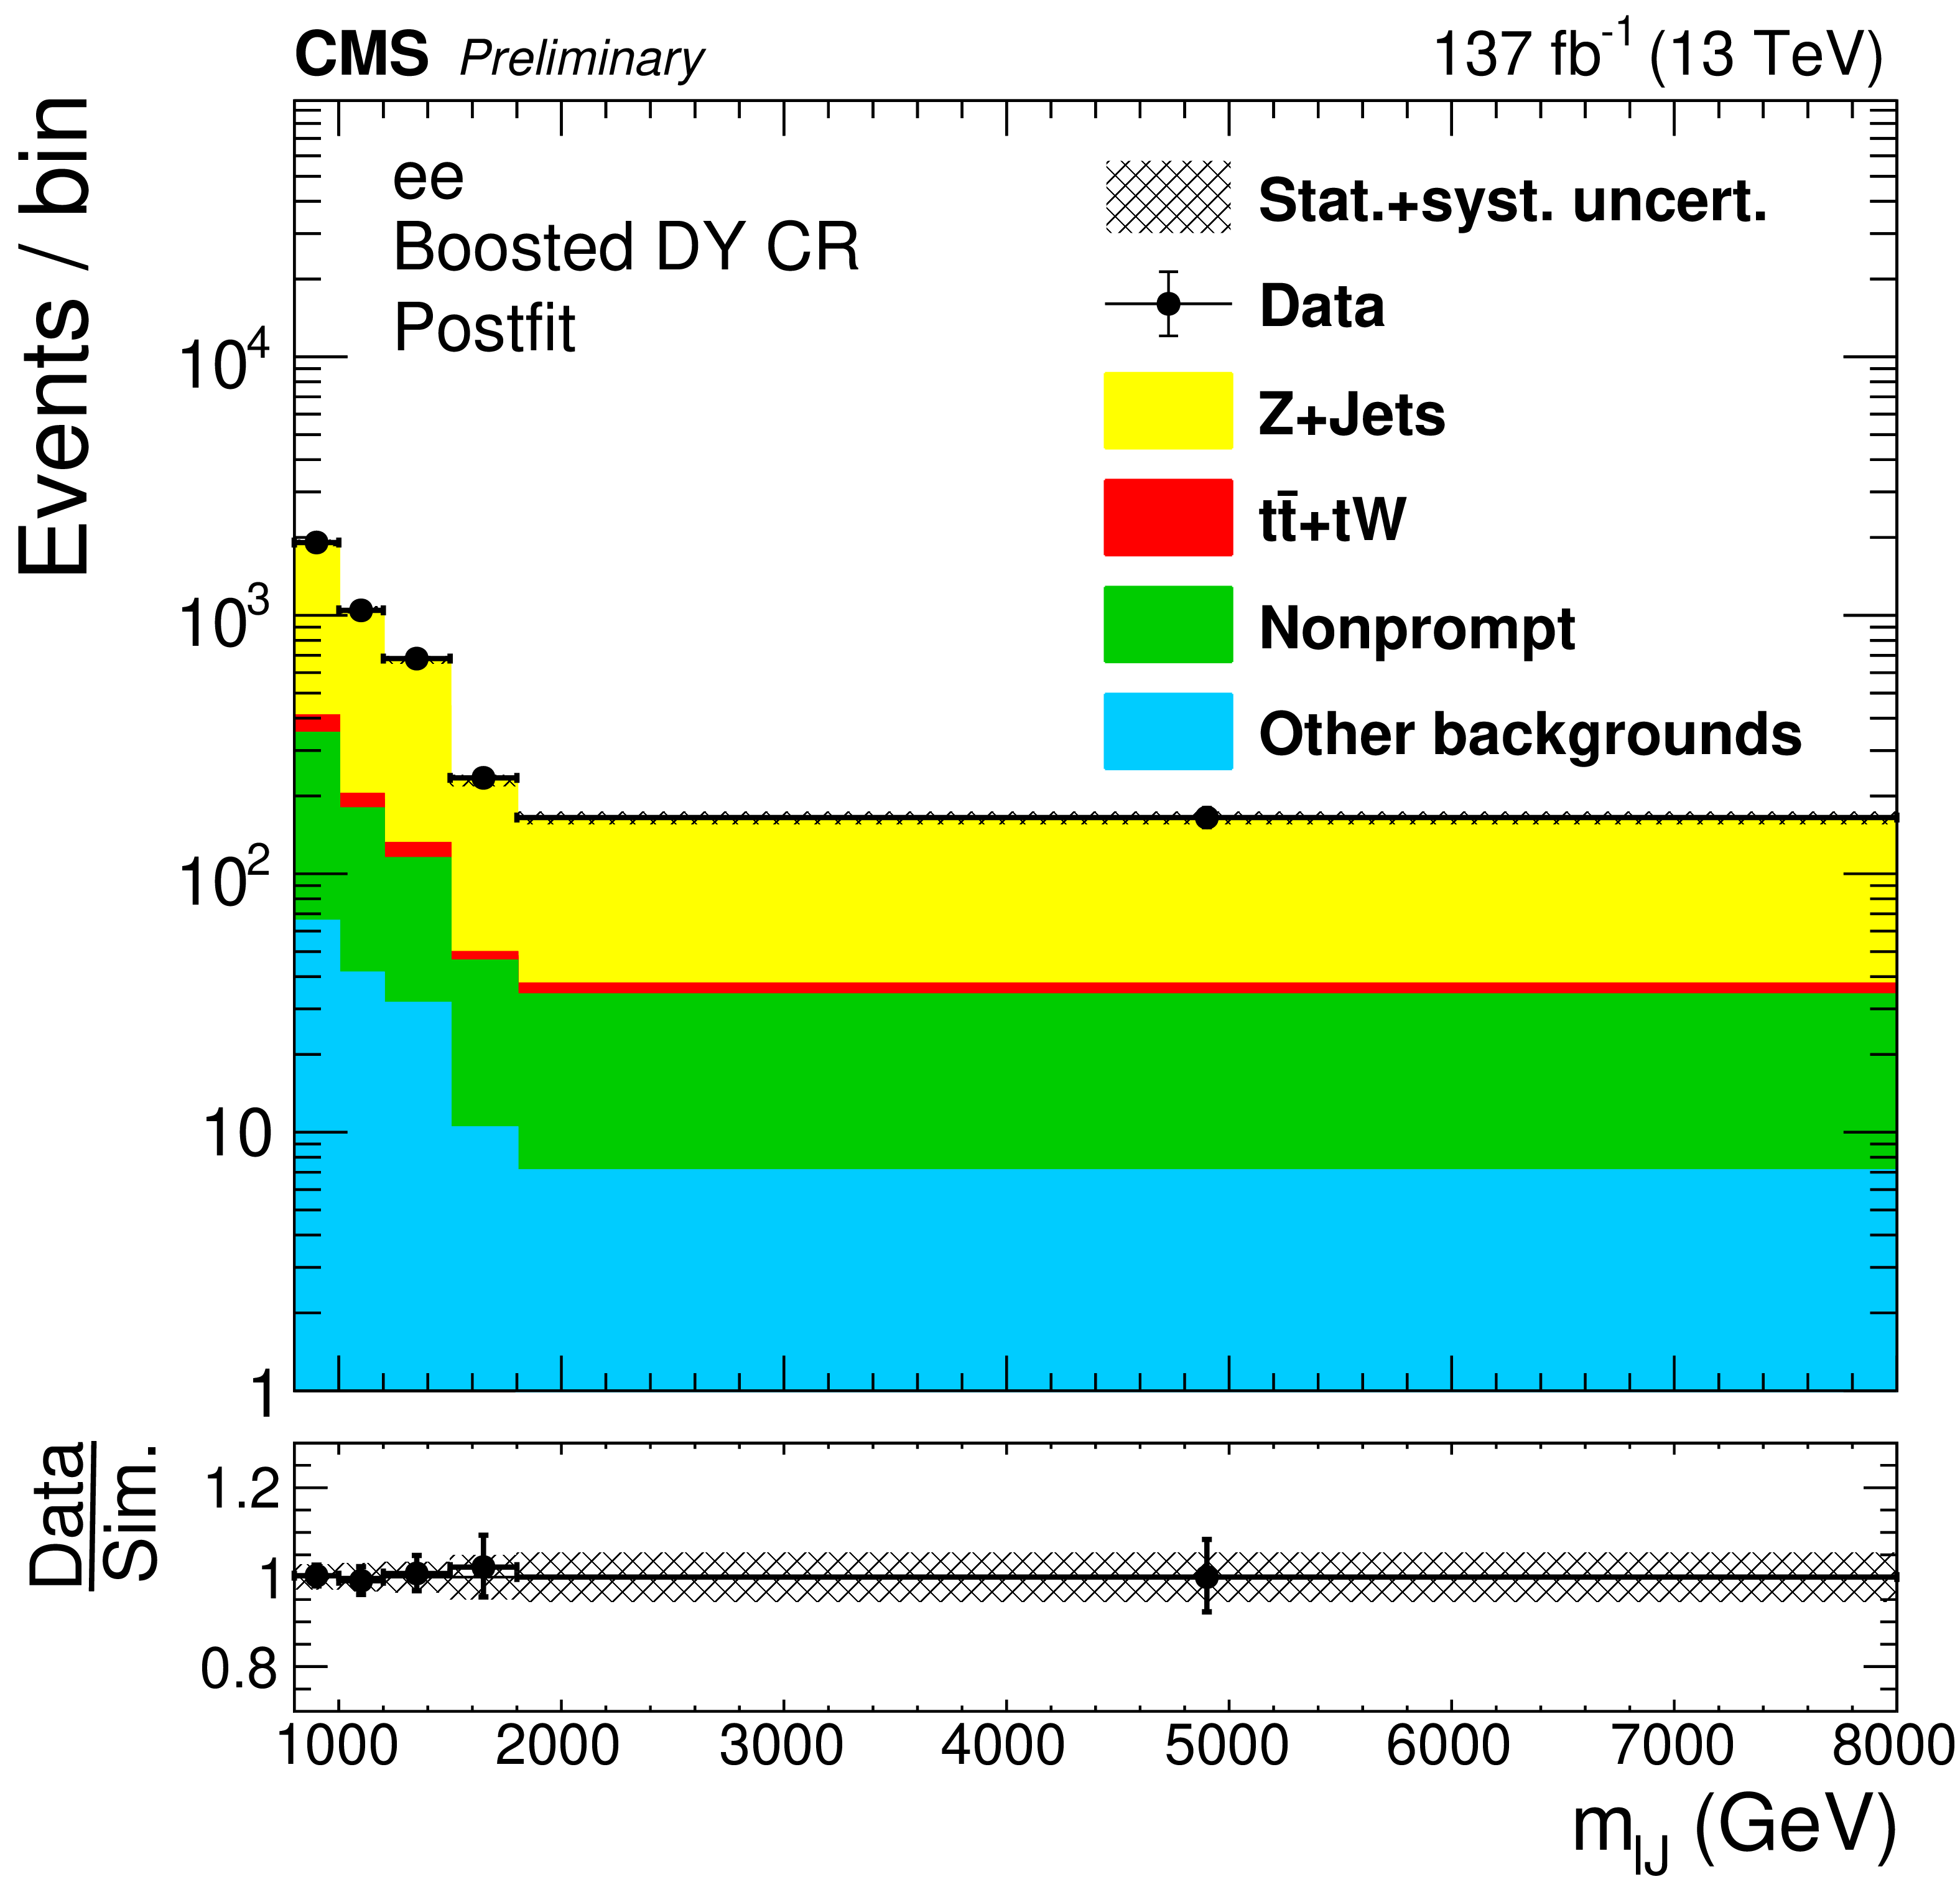
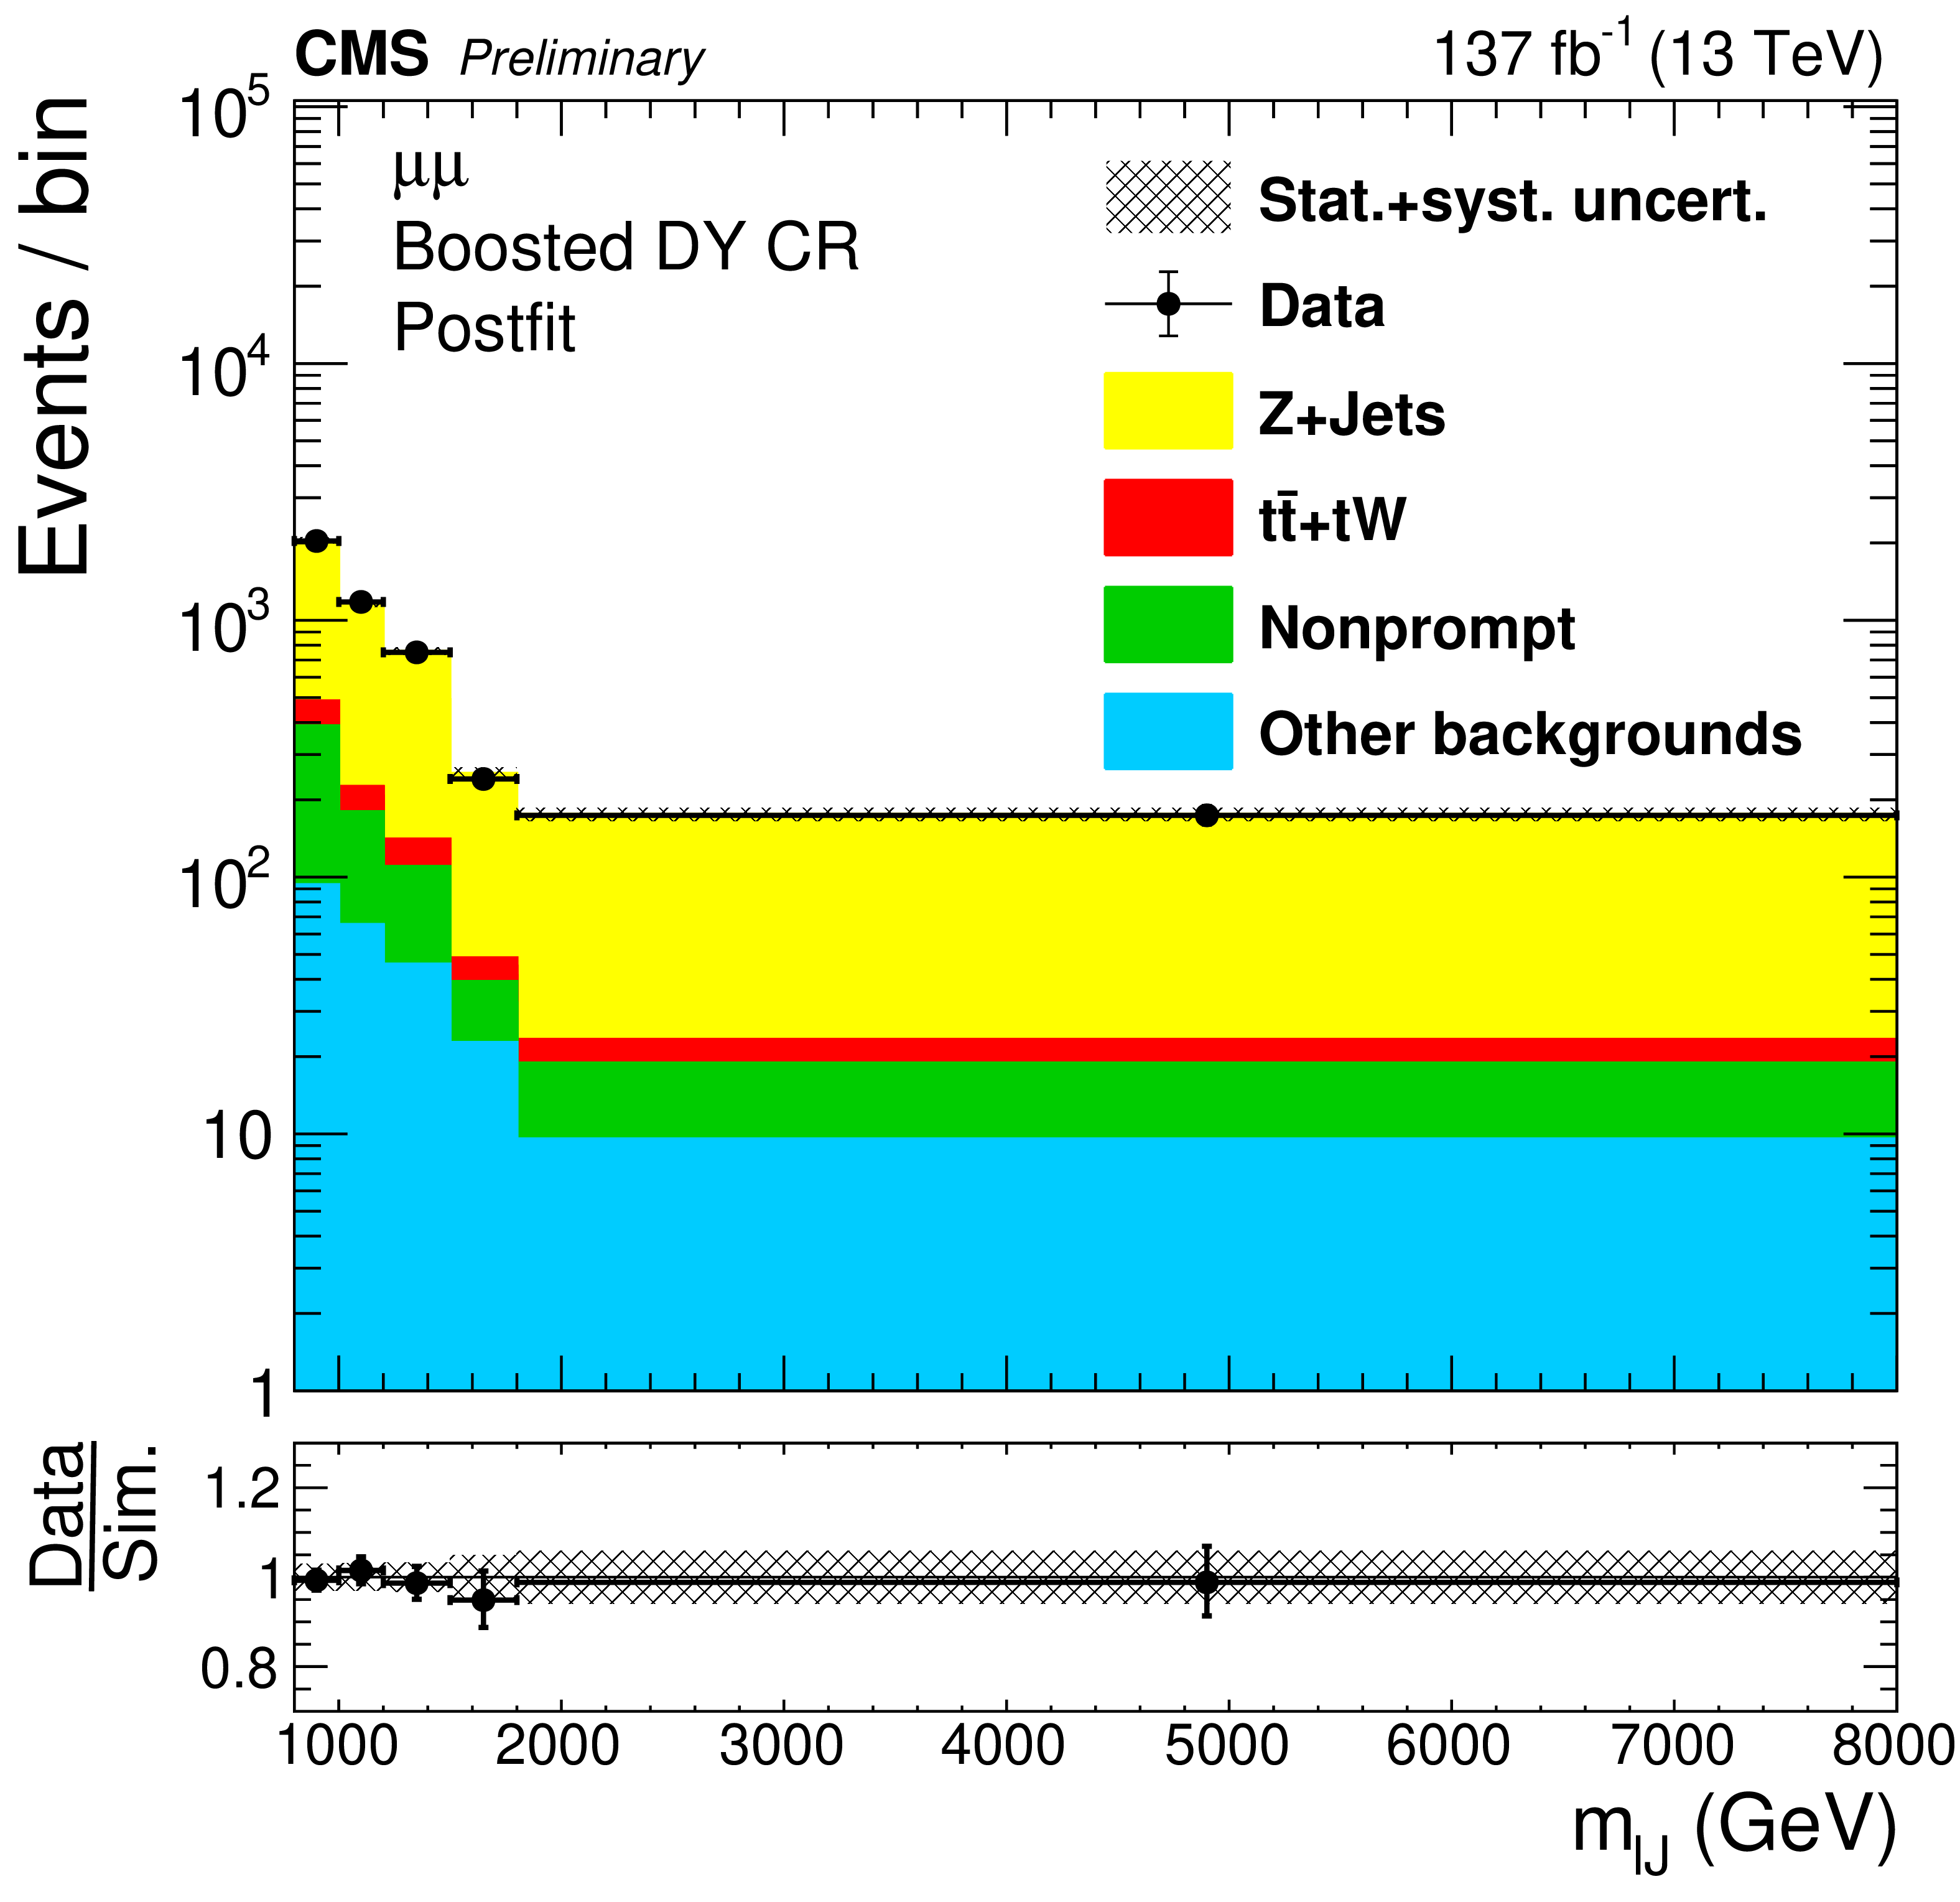
The four(two)-object invariant mass $m_{\ell \ell {\mathrm {j}} {\mathrm {j}}}$ ($m_{\ell {\mathrm {J}}}$) distributions in the resolved (boosted) DY CR are shown in the top (bottom) plots. Results in the ee ($\mu \mu $) channels are shown in the left (right) plots. The hatched uncertainty bands on the simulated background histograms include statistical and systematic uncertainties. |
png pdf |
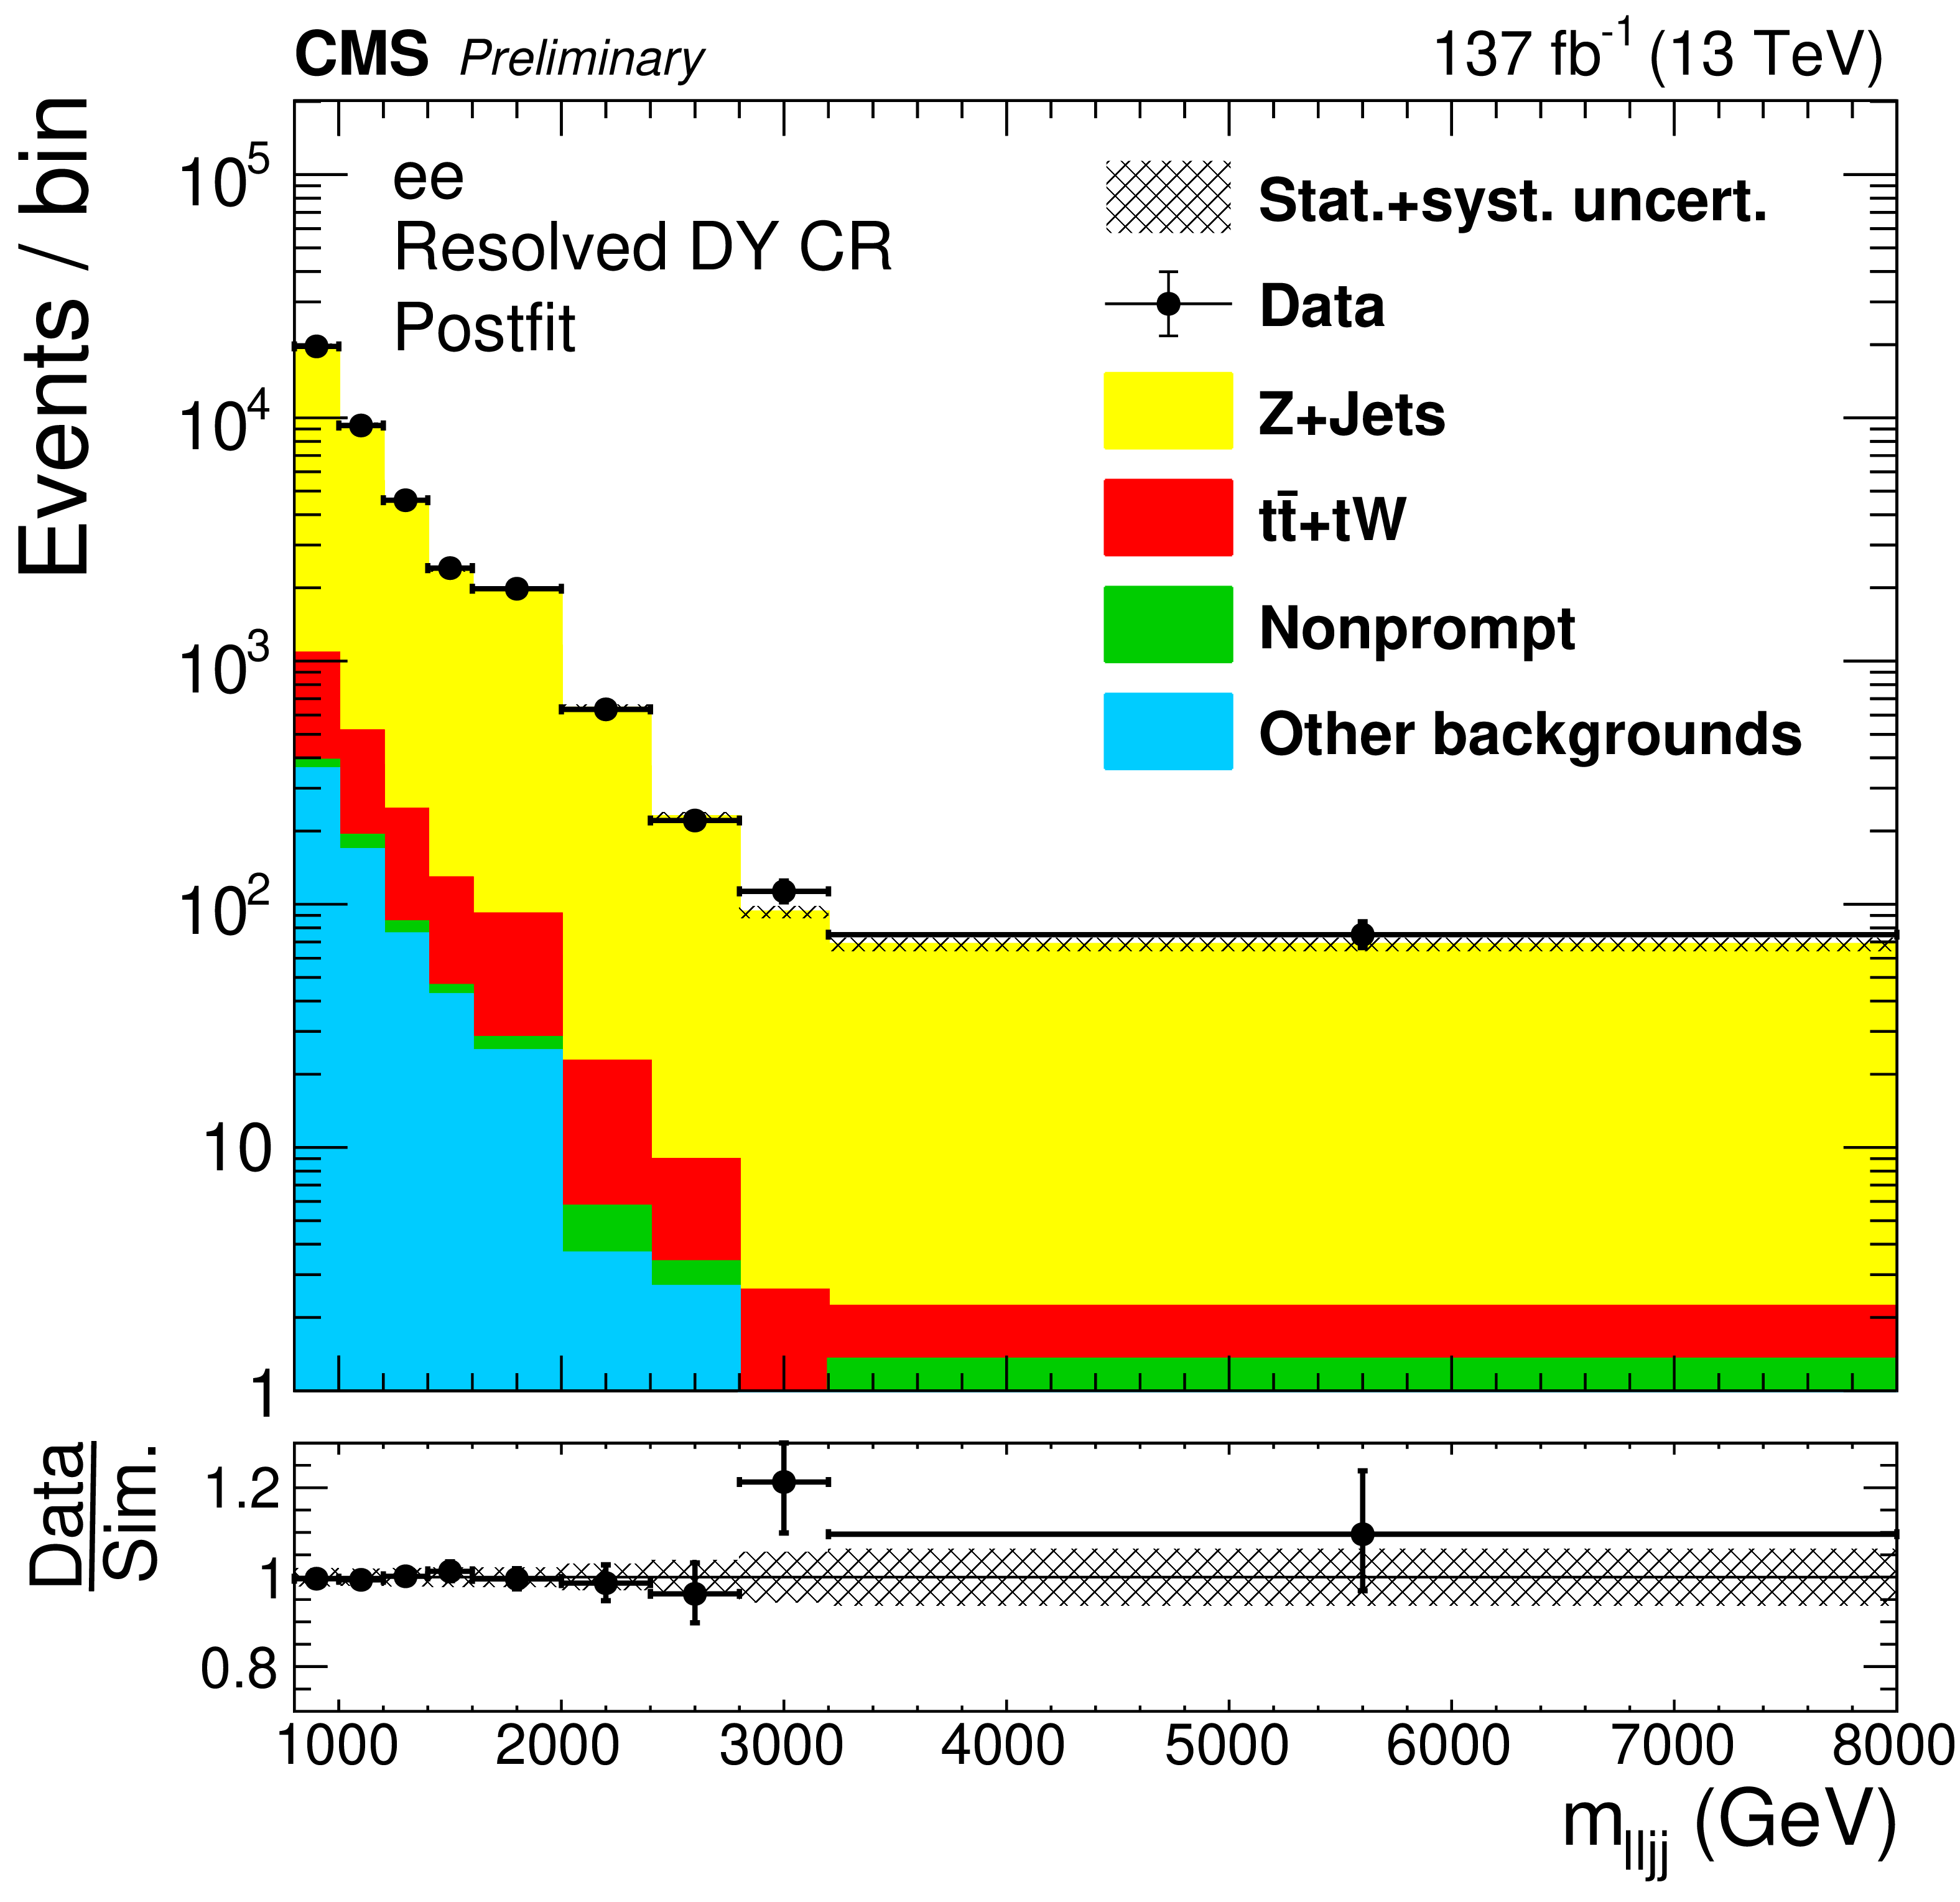
Figure 3-a:
The four(two)-object invariant mass $m_{\ell \ell {\mathrm {j}} {\mathrm {j}}}$ ($m_{\ell {\mathrm {J}}}$) distributions in the resolved (boosted) DY CR are shown in the top (bottom) plots. Results in the ee ($\mu \mu $) channels are shown in the left (right) plots. The hatched uncertainty bands on the simulated background histograms include statistical and systematic uncertainties. |

png pdf |
Figure 3-b:
The four(two)-object invariant mass $m_{\ell \ell {\mathrm {j}} {\mathrm {j}}}$ ($m_{\ell {\mathrm {J}}}$) distributions in the resolved (boosted) DY CR are shown in the top (bottom) plots. Results in the ee ($\mu \mu $) channels are shown in the left (right) plots. The hatched uncertainty bands on the simulated background histograms include statistical and systematic uncertainties. |
png pdf |
Figure 3-c:
The four(two)-object invariant mass $m_{\ell \ell {\mathrm {j}} {\mathrm {j}}}$ ($m_{\ell {\mathrm {J}}}$) distributions in the resolved (boosted) DY CR are shown in the top (bottom) plots. Results in the ee ($\mu \mu $) channels are shown in the left (right) plots. The hatched uncertainty bands on the simulated background histograms include statistical and systematic uncertainties. |
png pdf |
Figure 3-d:
The four(two)-object invariant mass $m_{\ell \ell {\mathrm {j}} {\mathrm {j}}}$ ($m_{\ell {\mathrm {J}}}$) distributions in the resolved (boosted) DY CR are shown in the top (bottom) plots. Results in the ee ($\mu \mu $) channels are shown in the left (right) plots. The hatched uncertainty bands on the simulated background histograms include statistical and systematic uncertainties. |
png pdf |
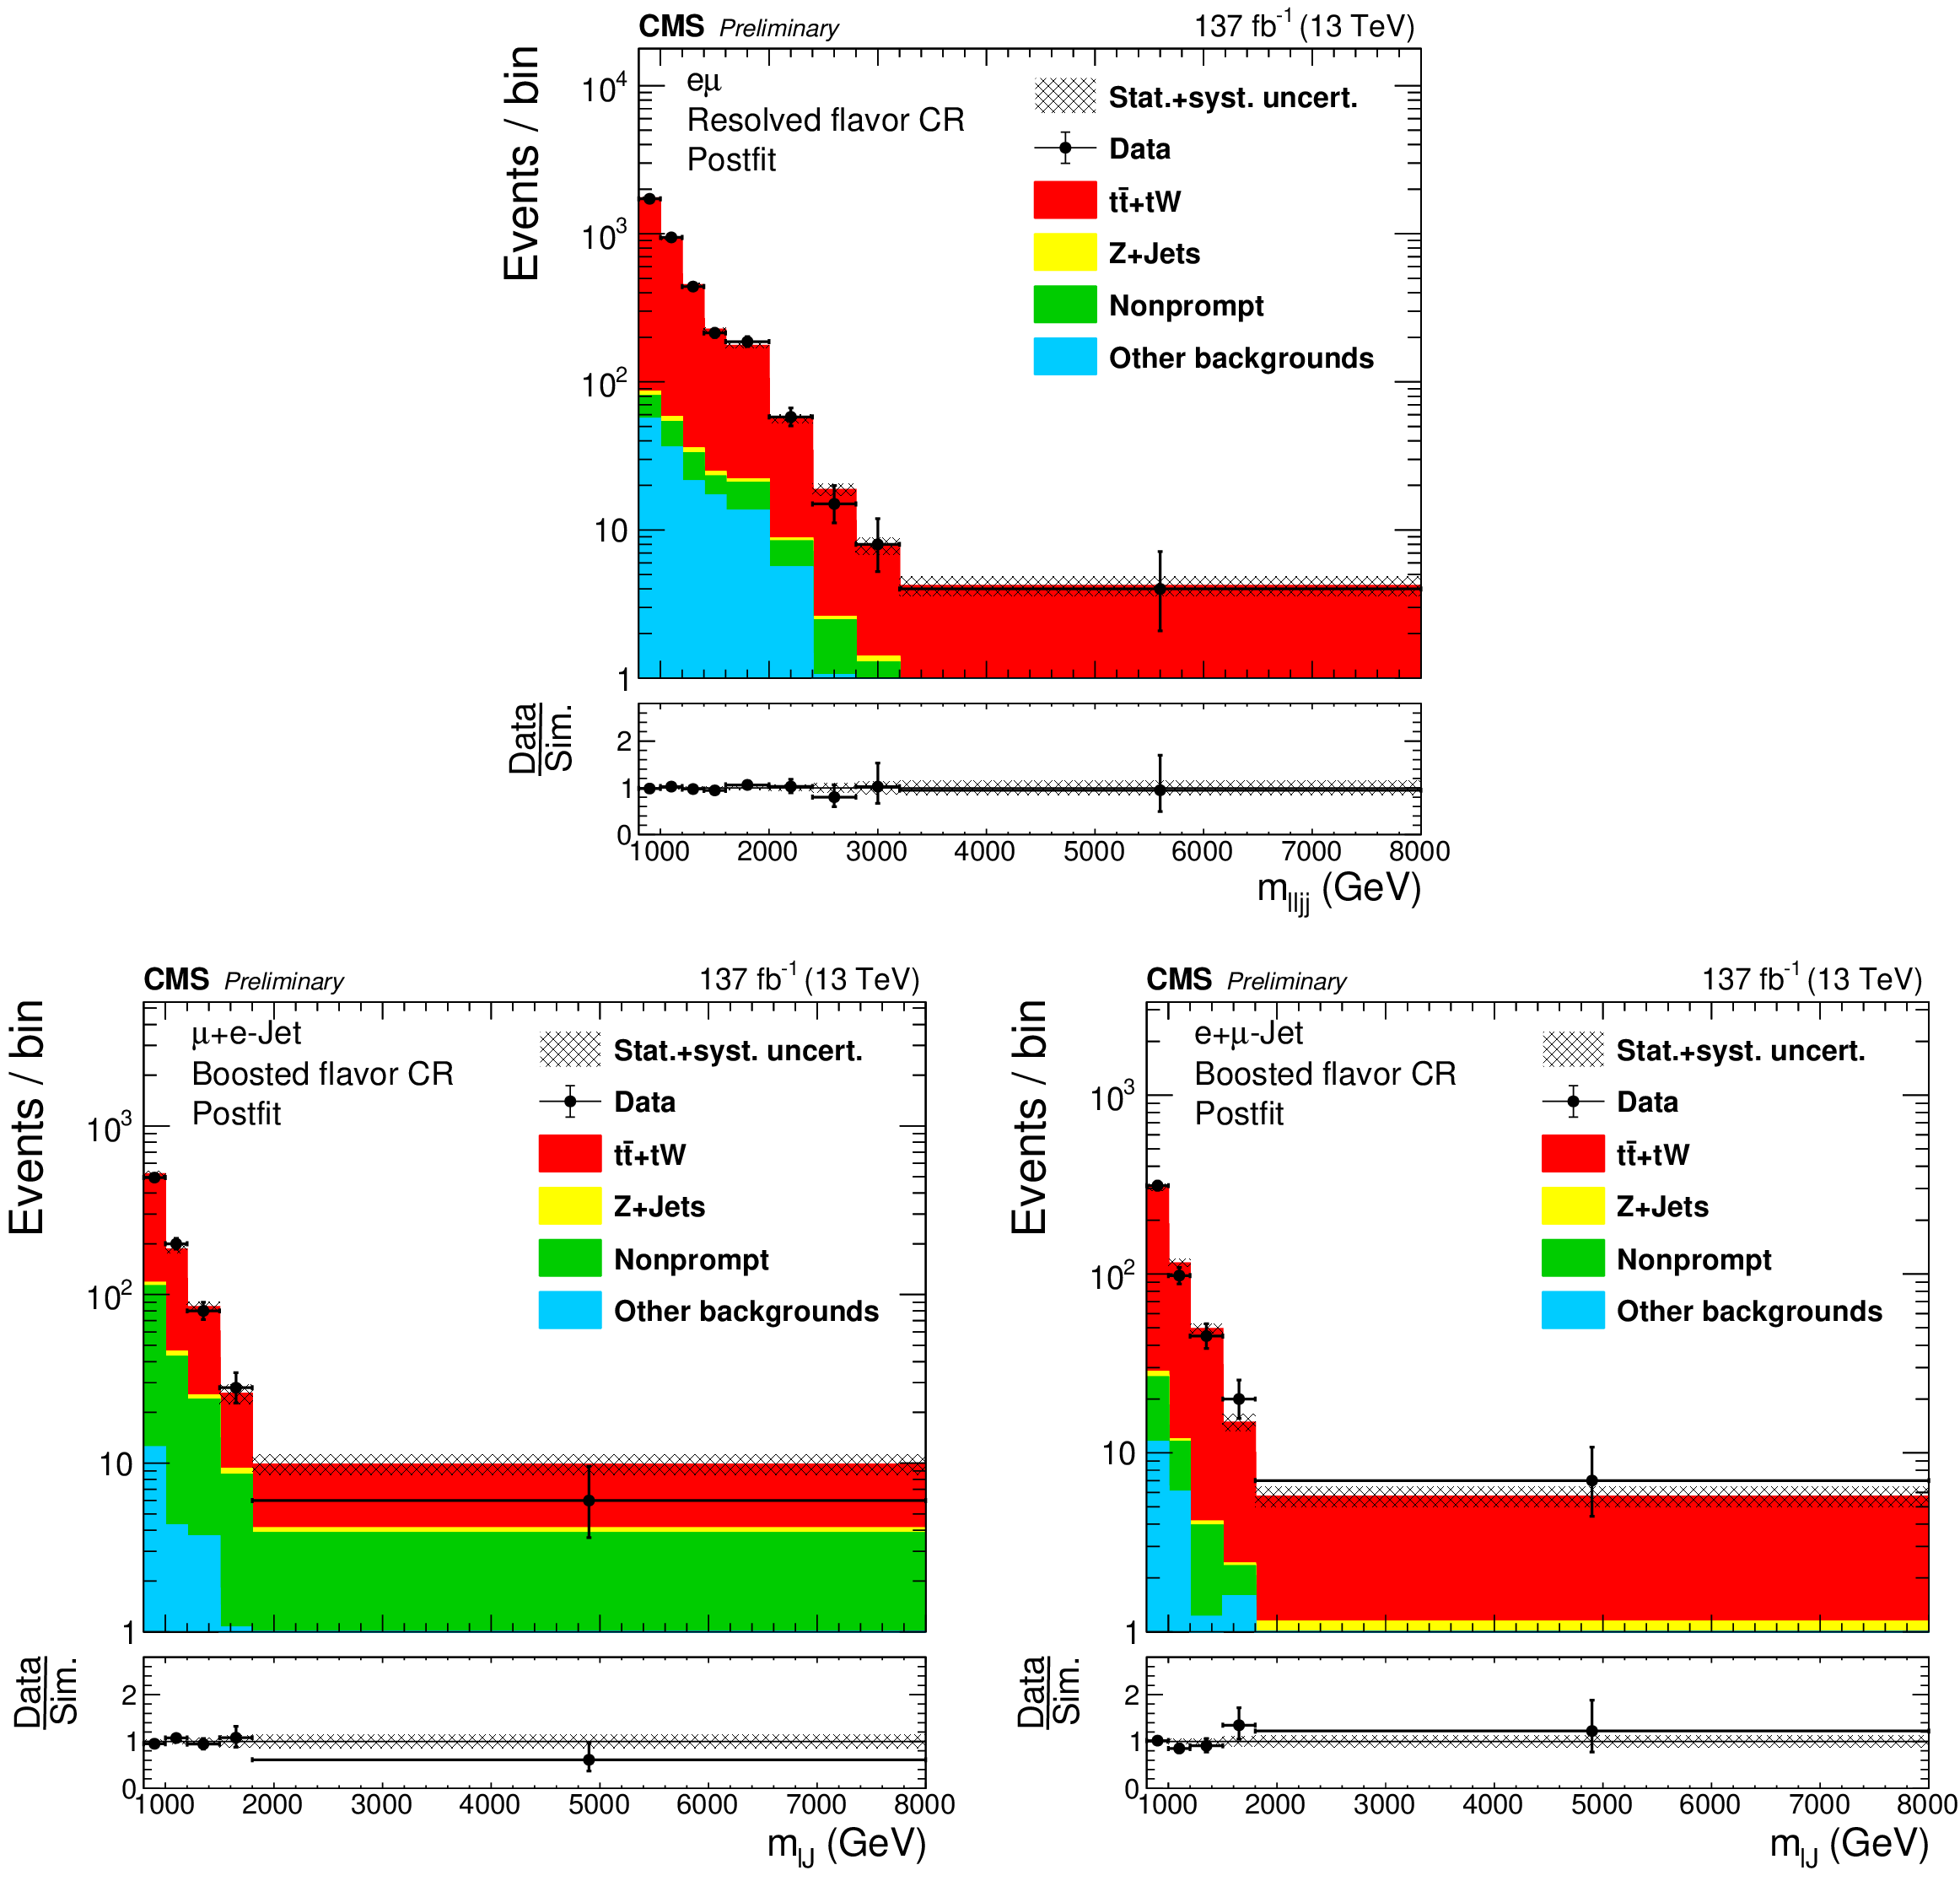
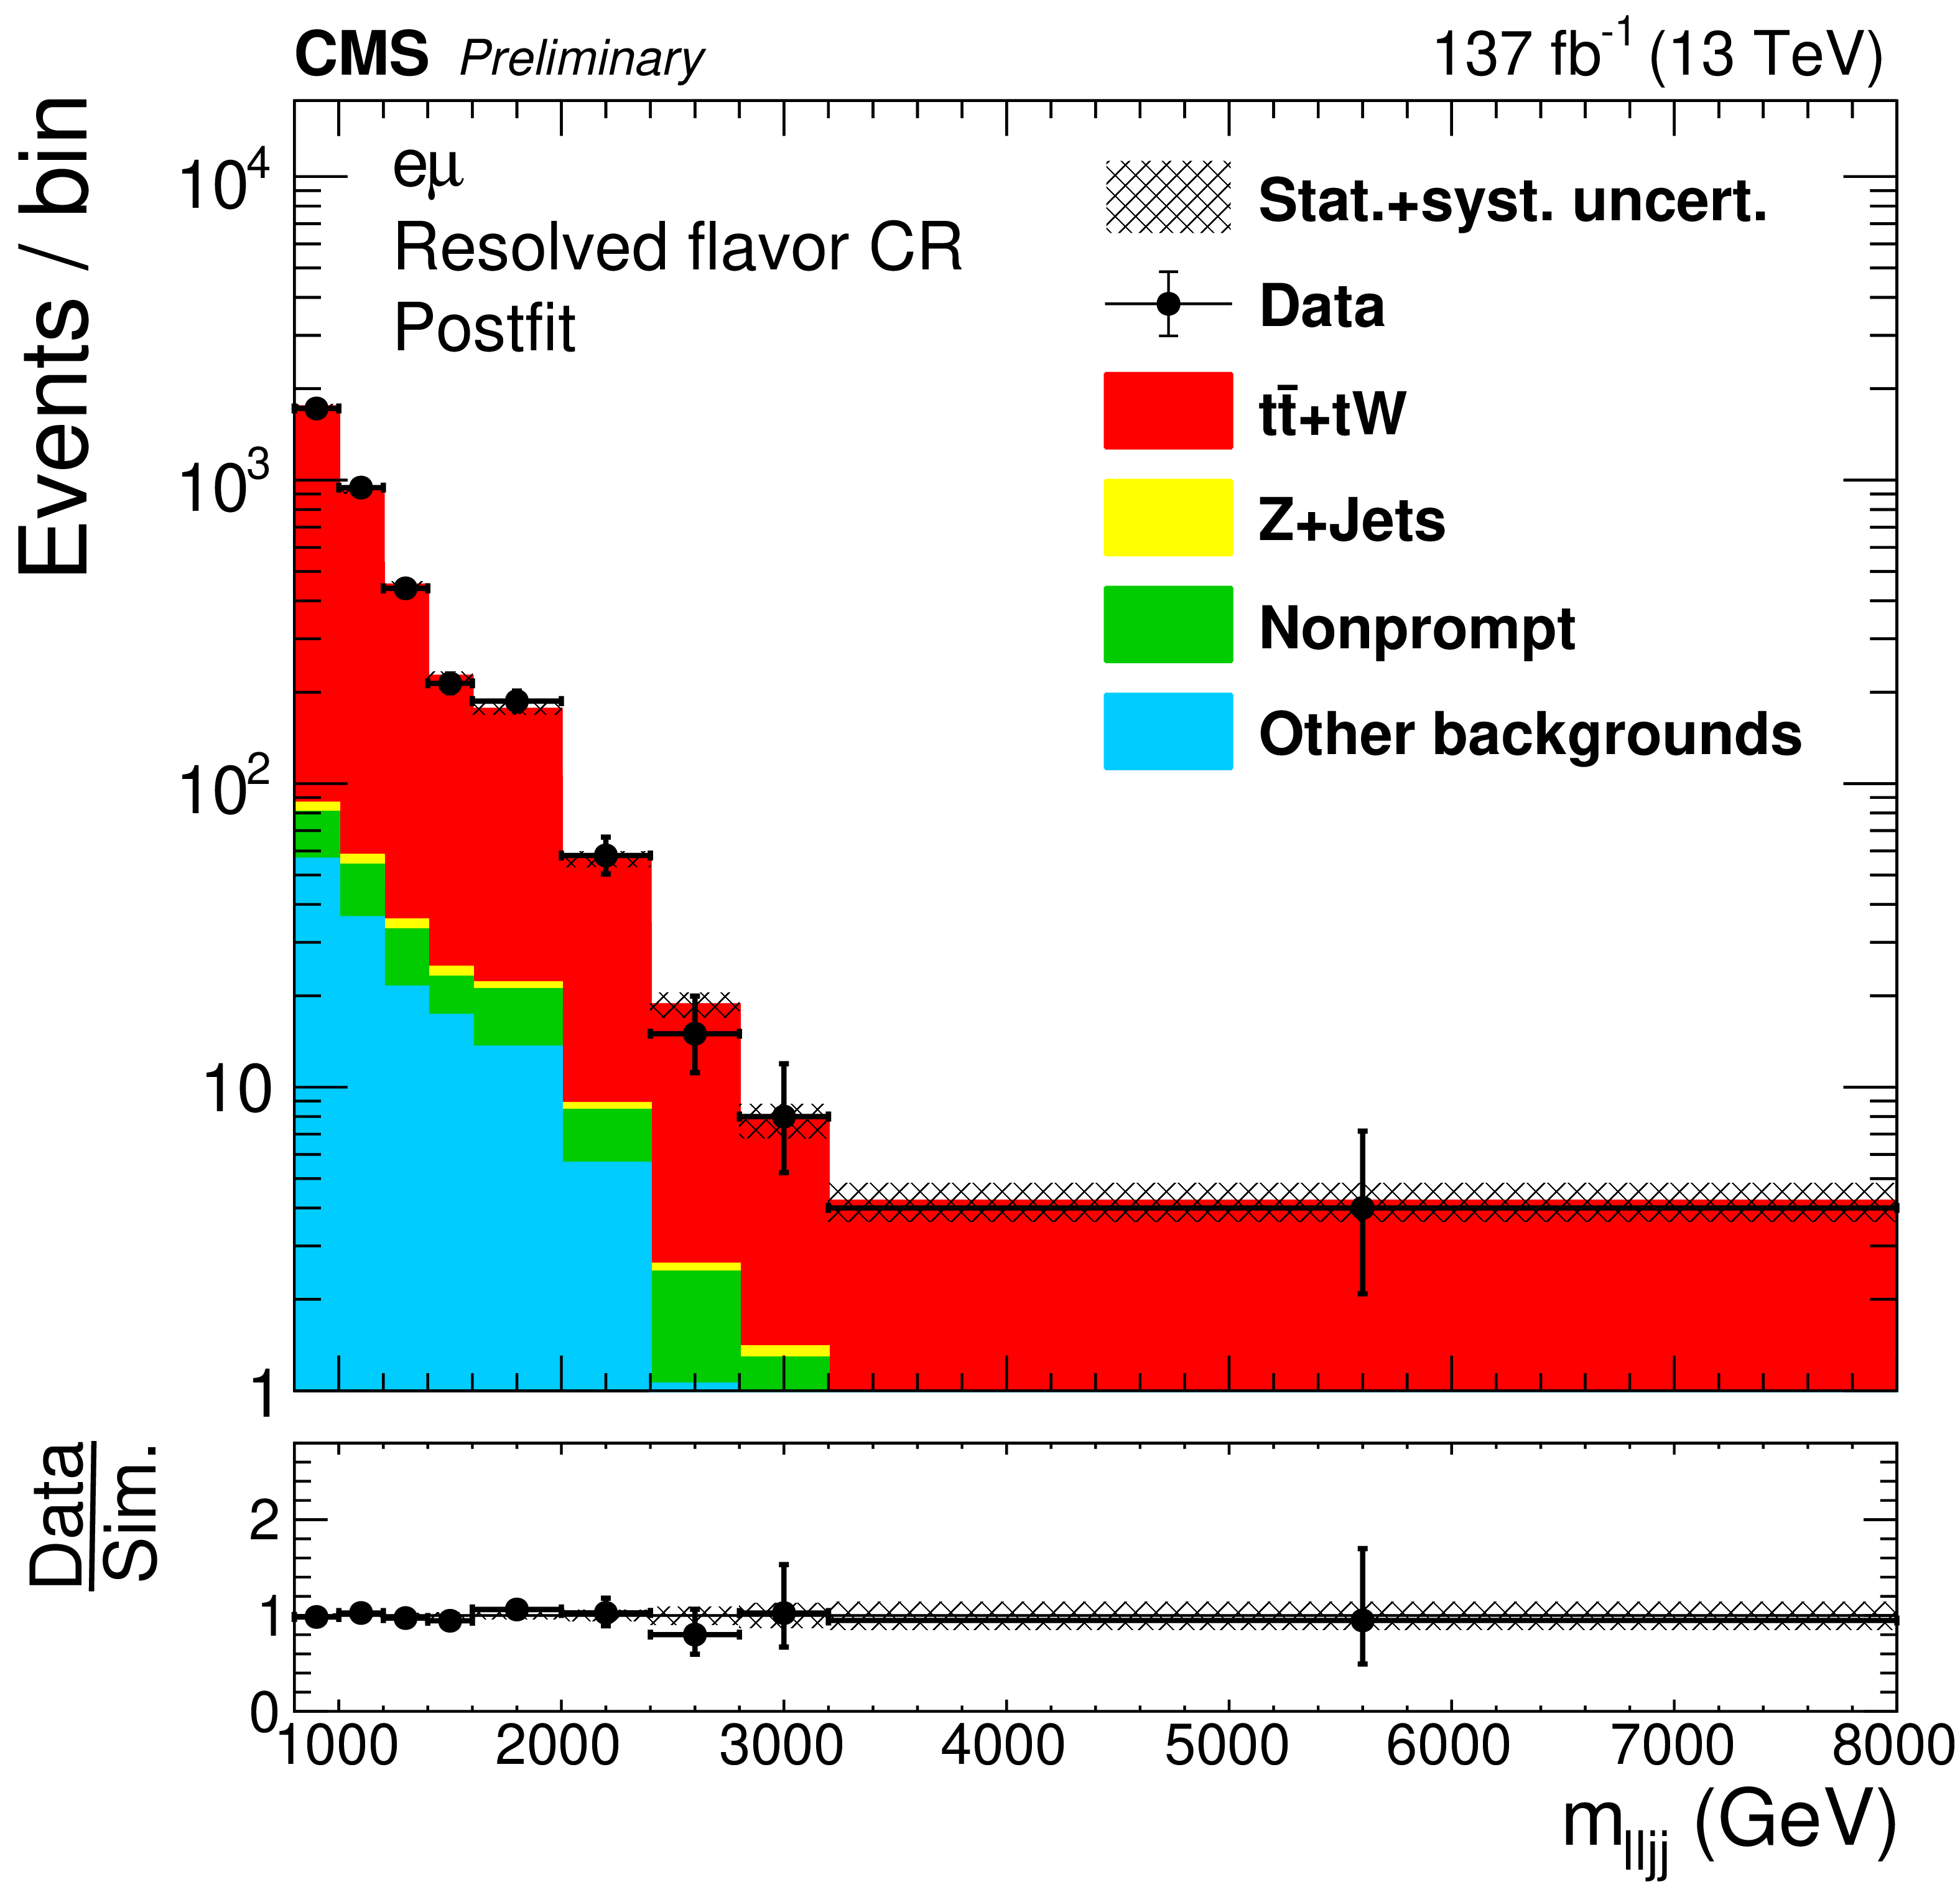
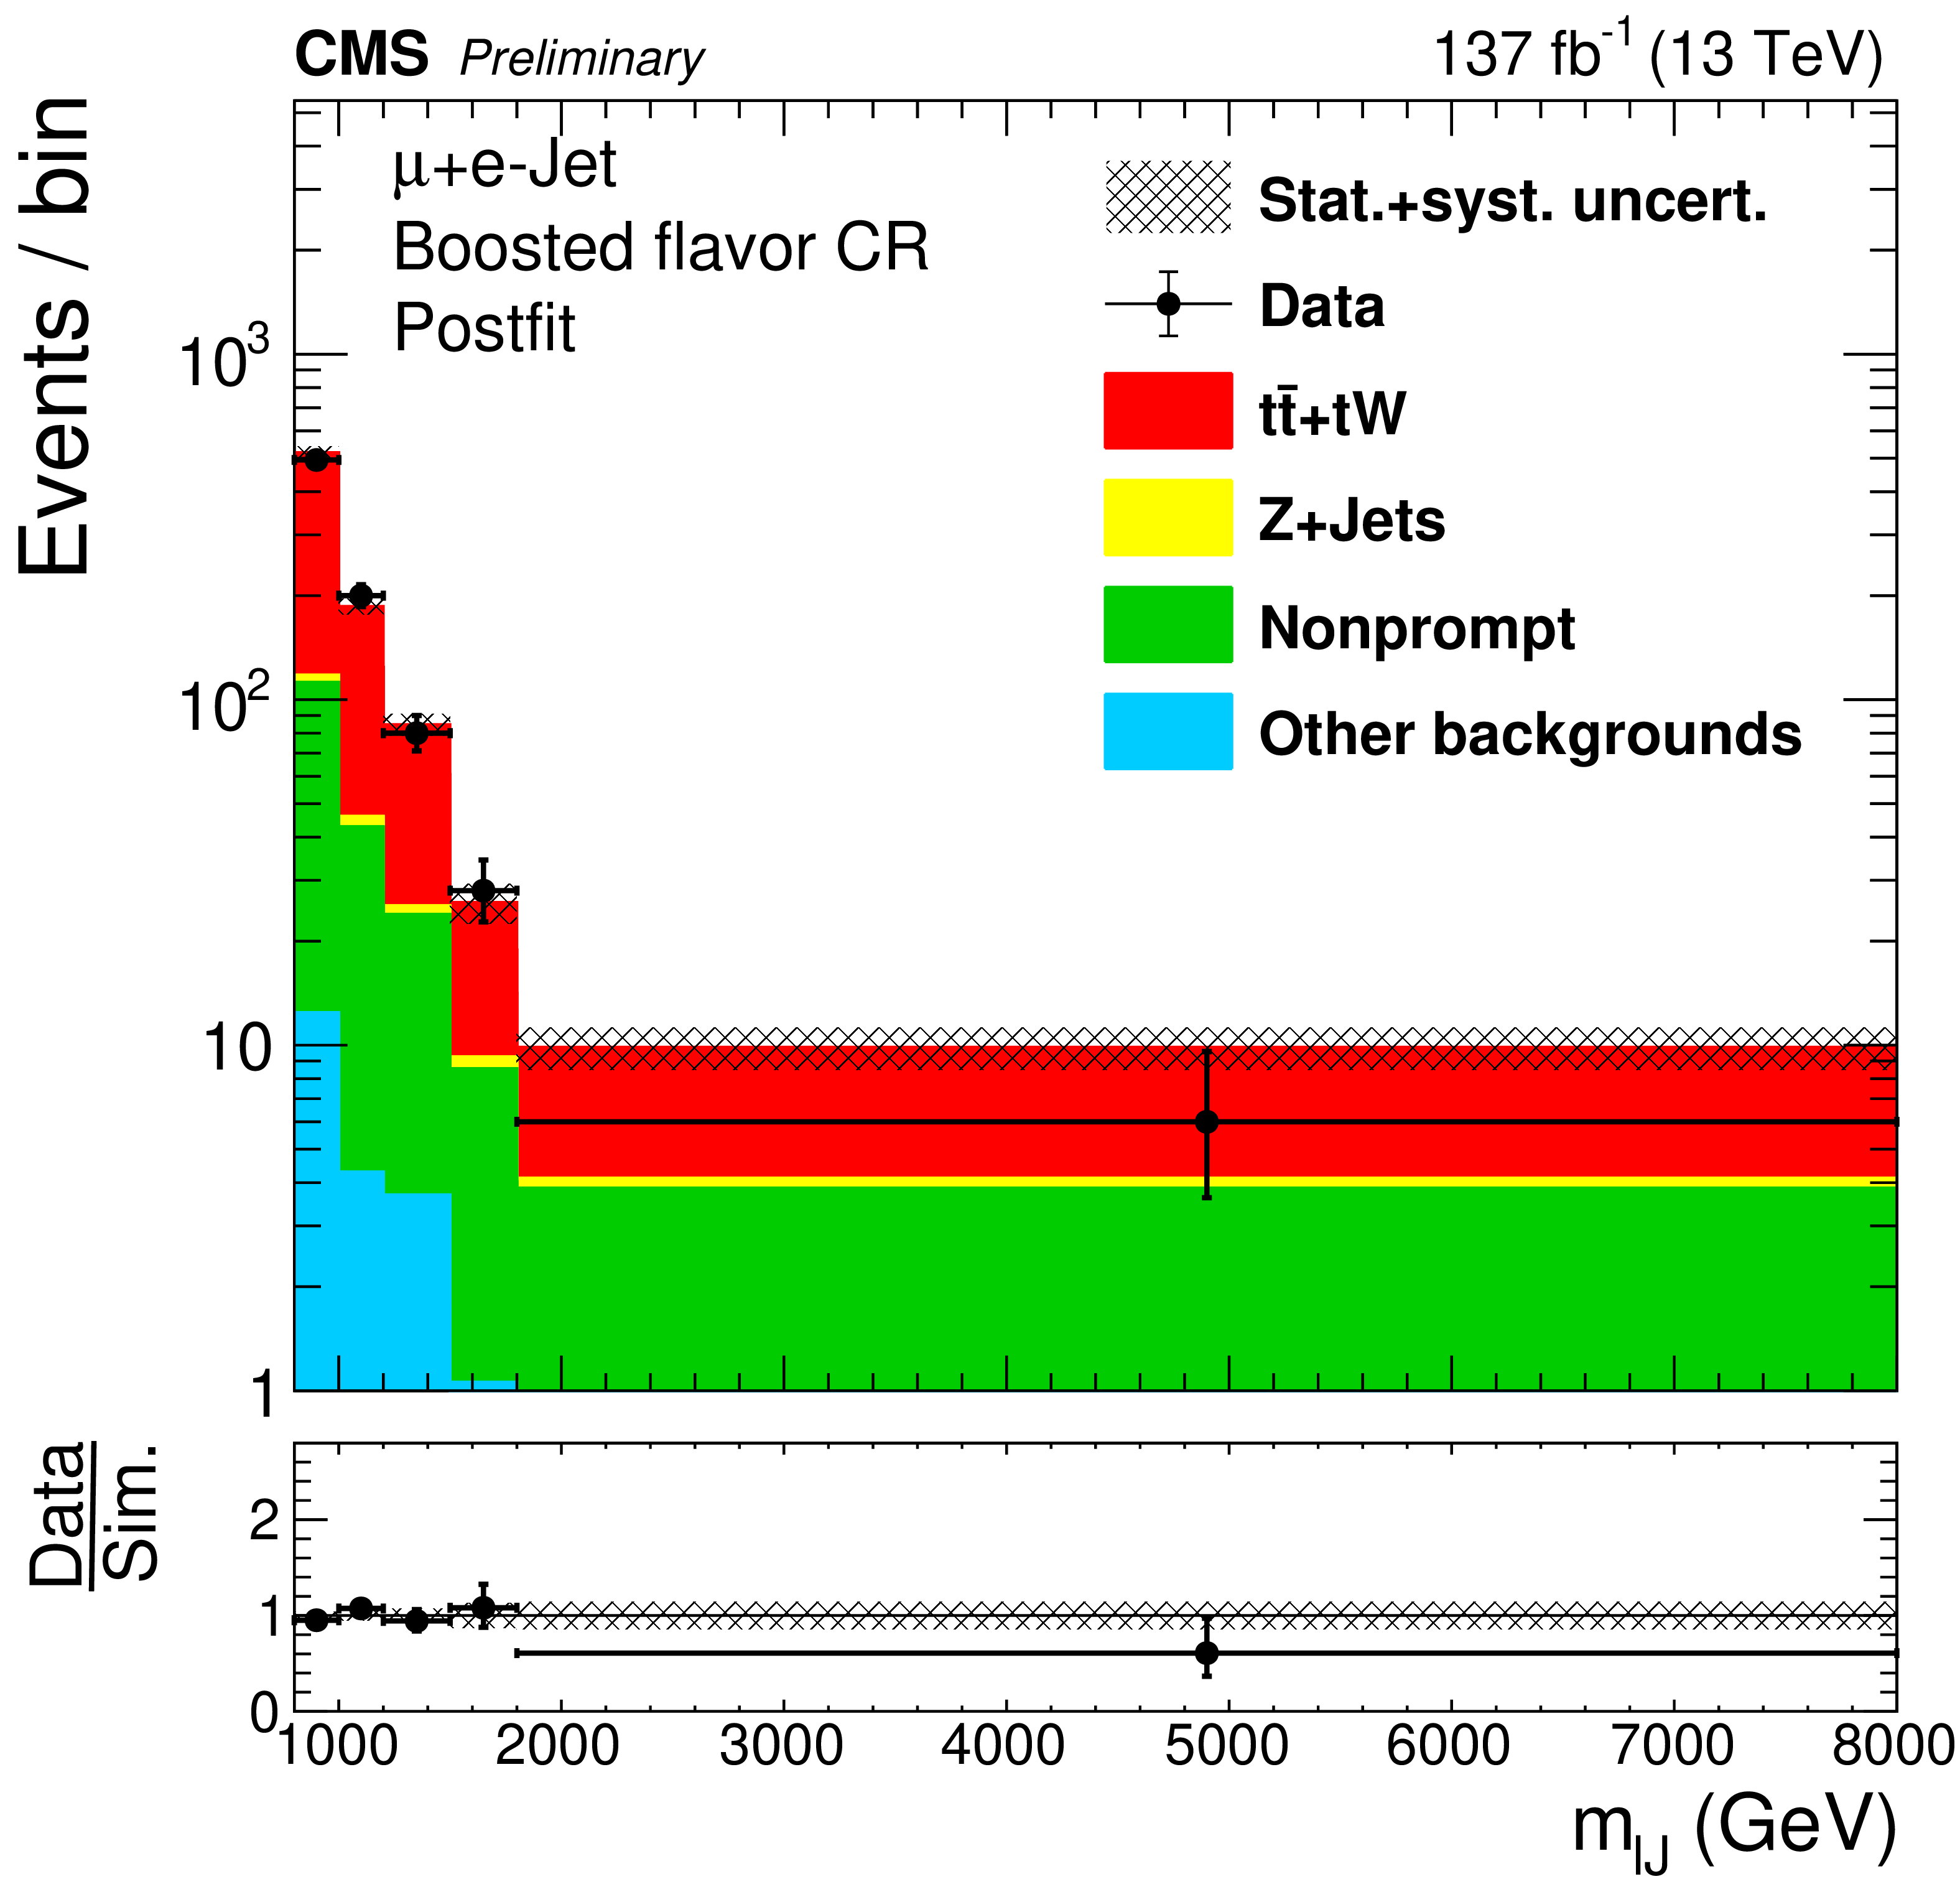
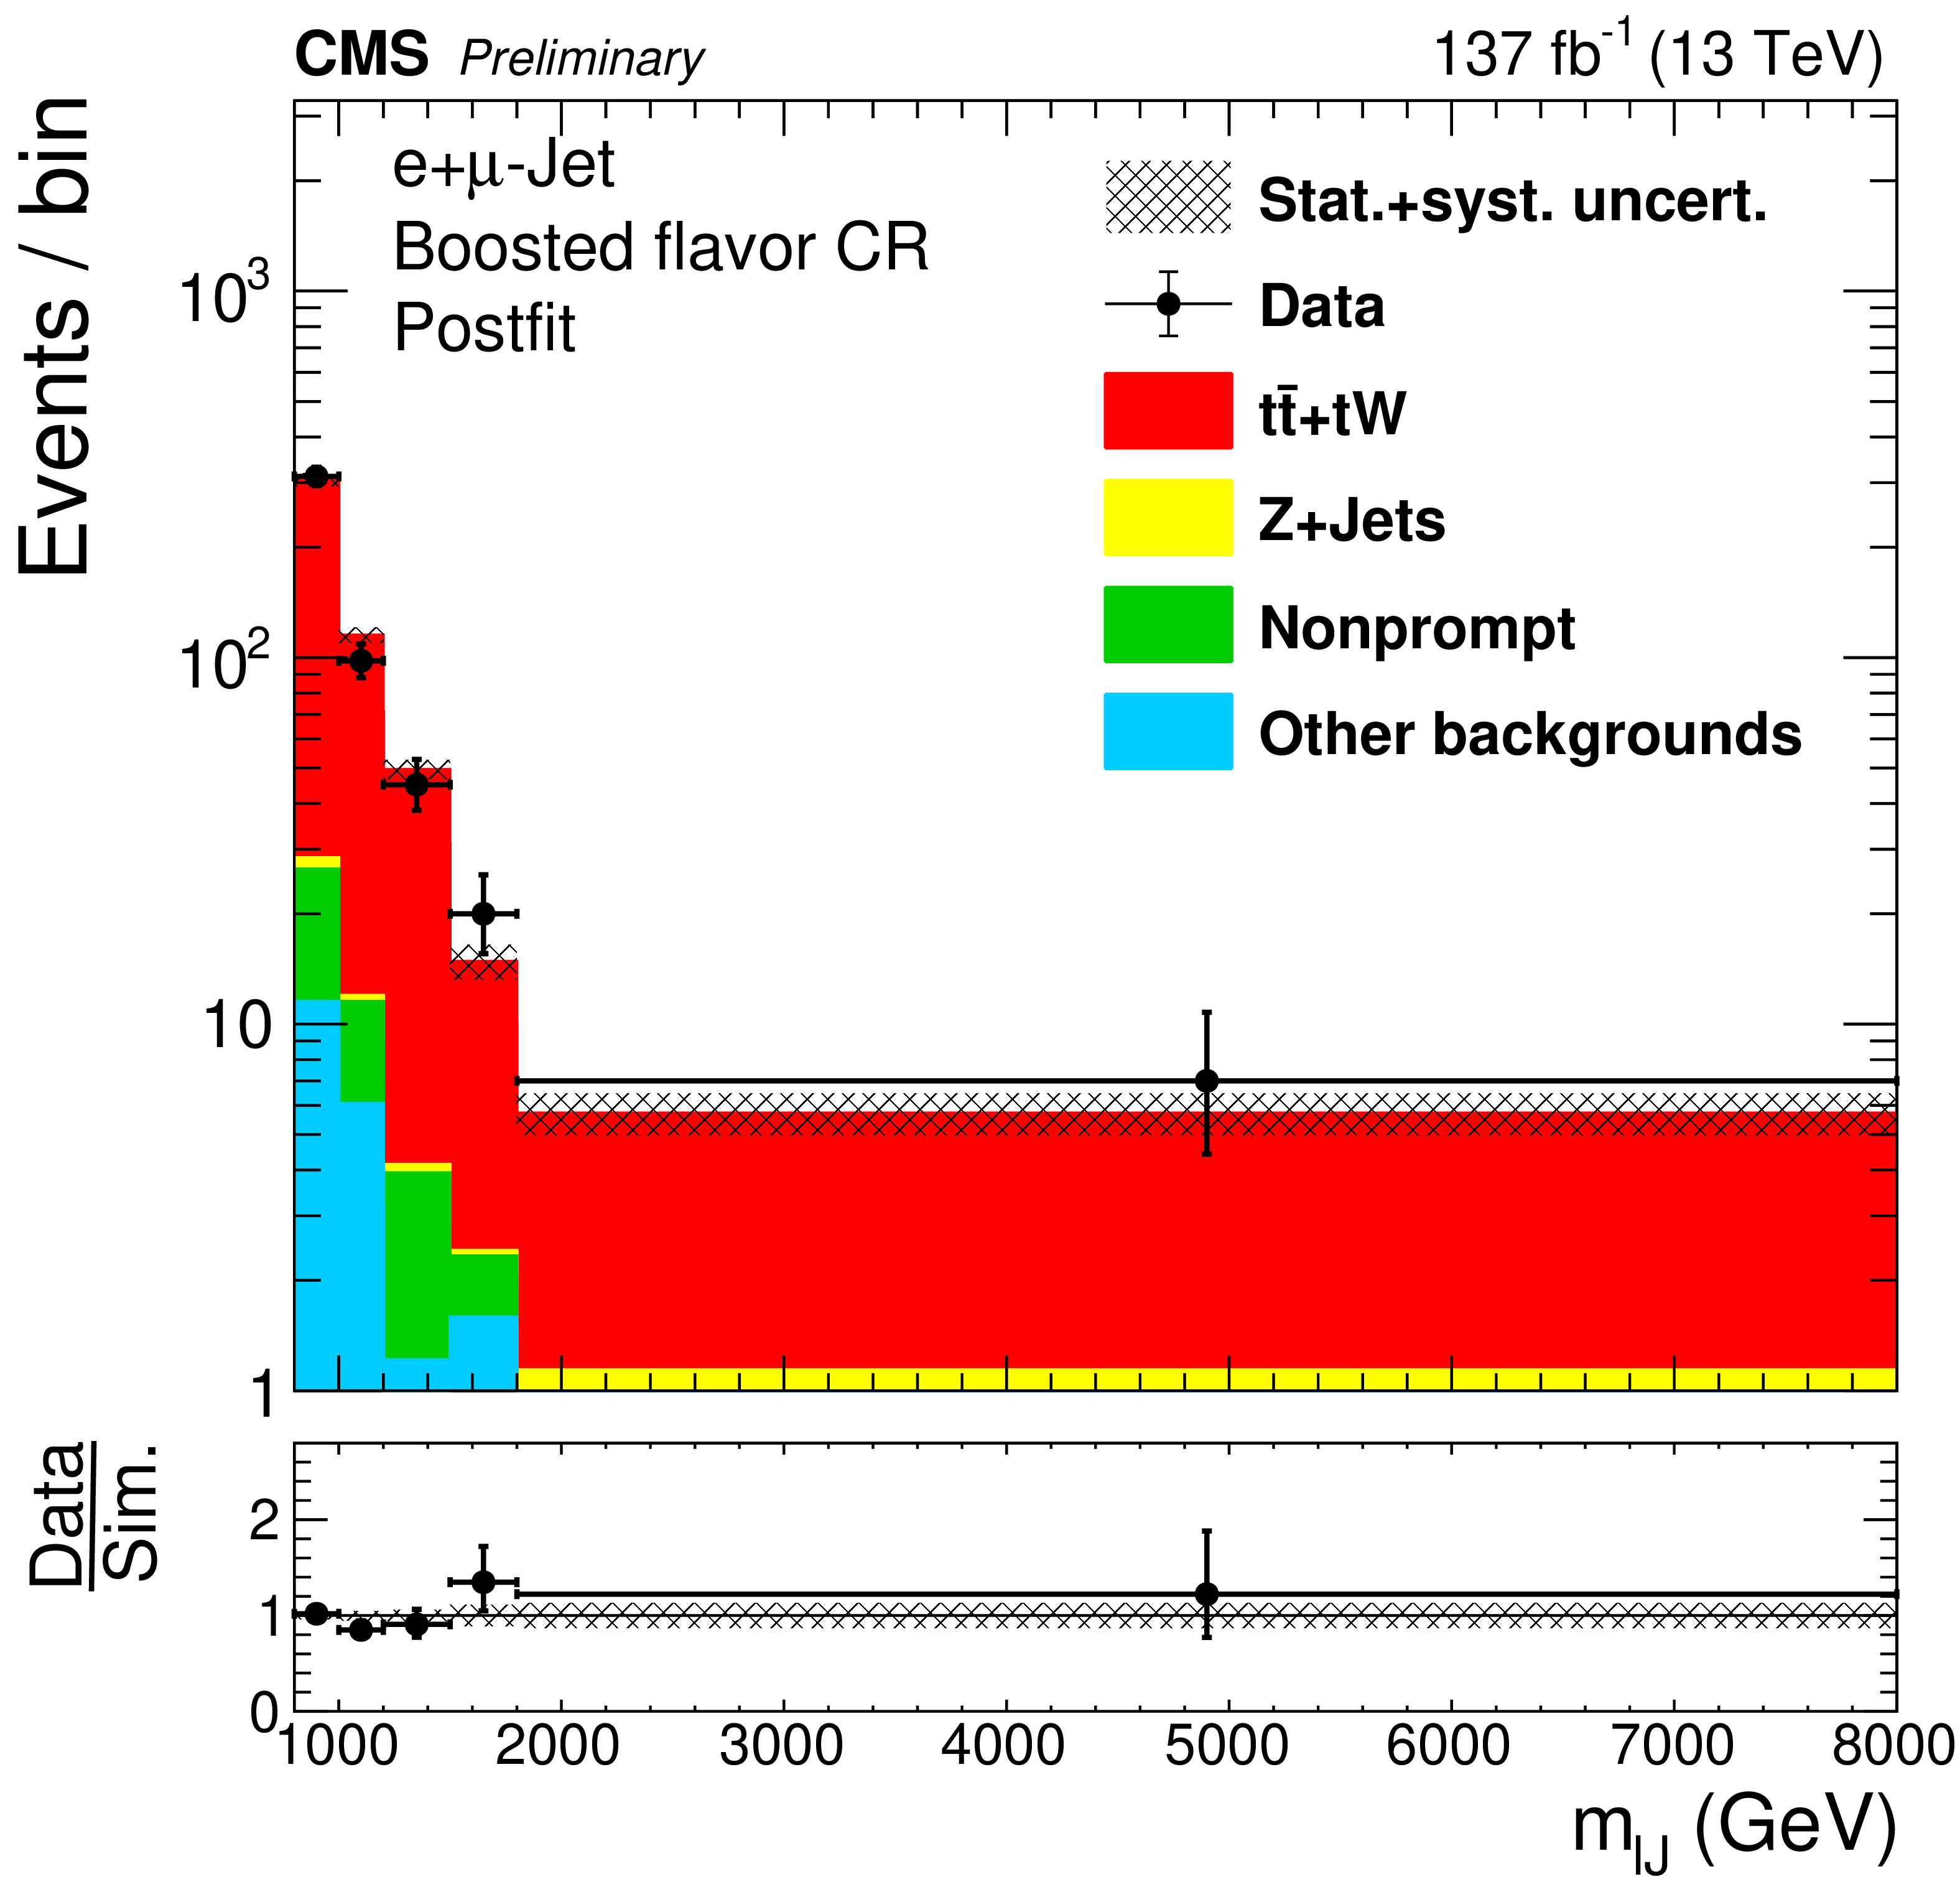
Figure 4:
The reconstructed mass of $\mathrm{W}_{R} $ in the resolved flavor CRs, for resolved (upper), boosted with e-jet (lower left) and boosted with $\mu $-jet (lower right) topologies. |
png pdf |
Figure 4-a:
The reconstructed mass of $\mathrm{W}_{R} $ in the resolved flavor CRs, for resolved (upper), boosted with e-jet (lower left) and boosted with $\mu $-jet (lower right) topologies. |
png pdf |
Figure 4-b:
The reconstructed mass of $\mathrm{W}_{R} $ in the resolved flavor CRs, for resolved (upper), boosted with e-jet (lower left) and boosted with $\mu $-jet (lower right) topologies. |
png pdf |
Figure 4-c:
The reconstructed mass of $\mathrm{W}_{R} $ in the resolved flavor CRs, for resolved (upper), boosted with e-jet (lower left) and boosted with $\mu $-jet (lower right) topologies. |

png pdf |
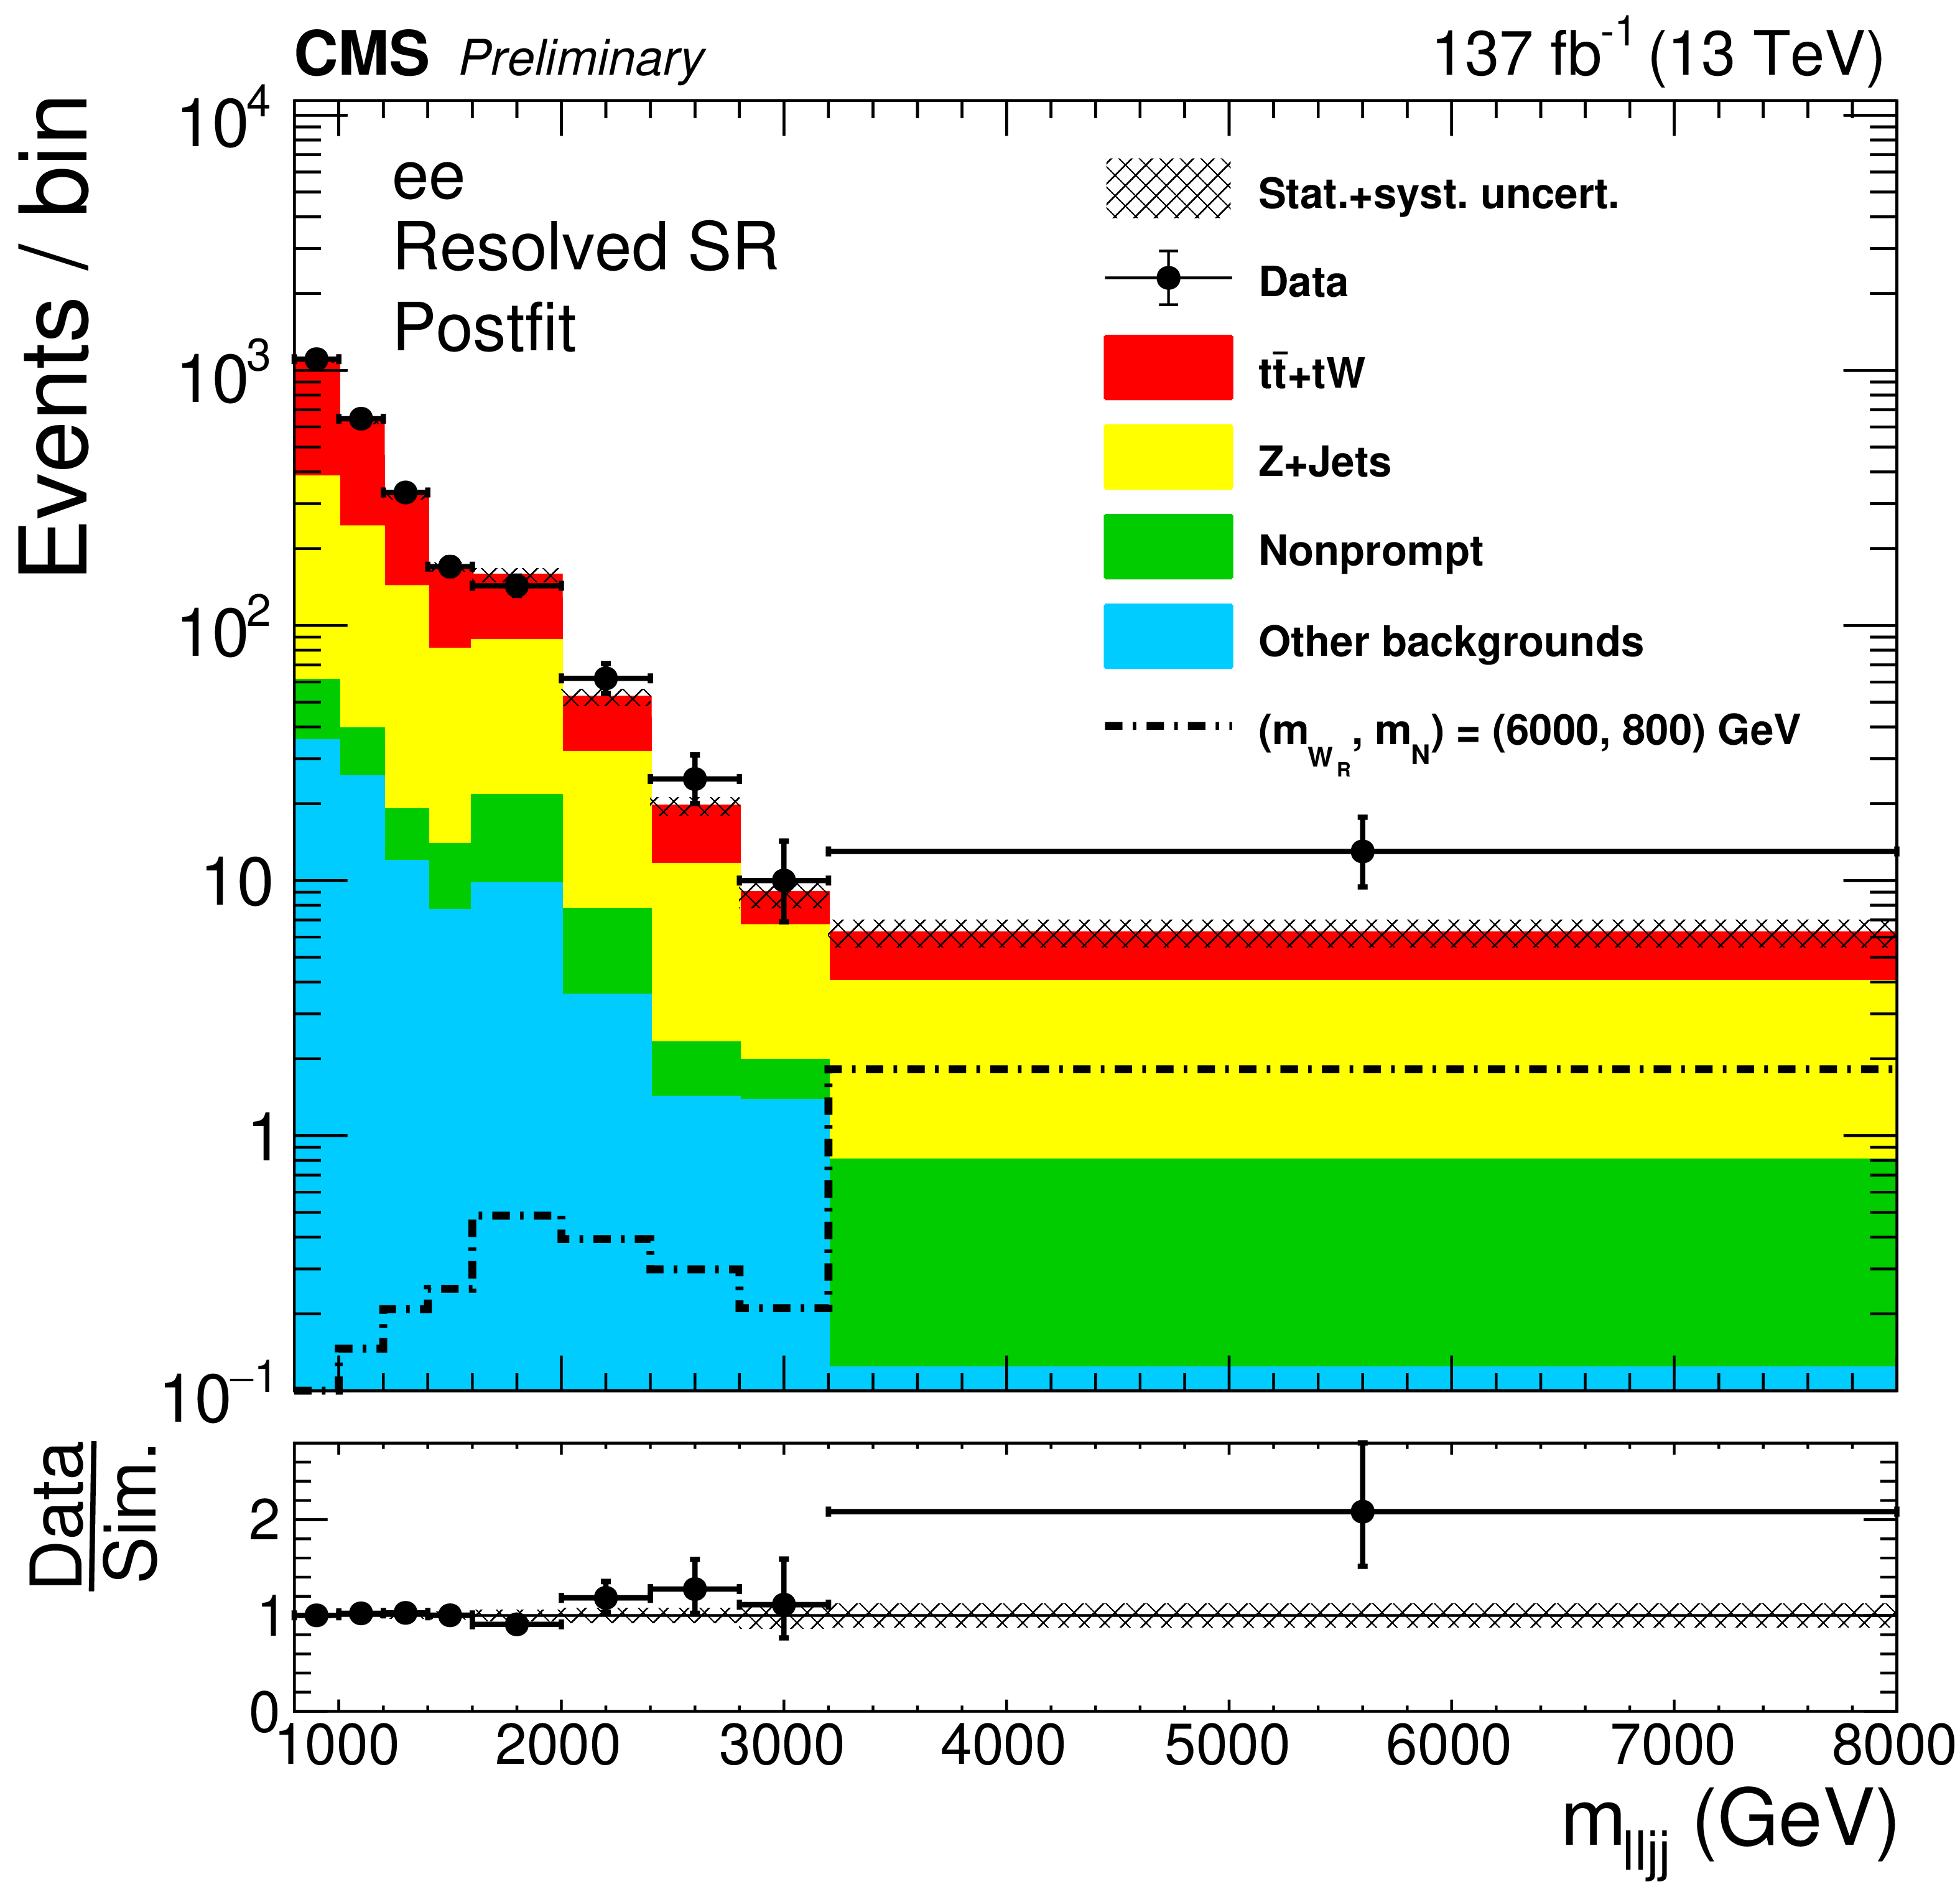
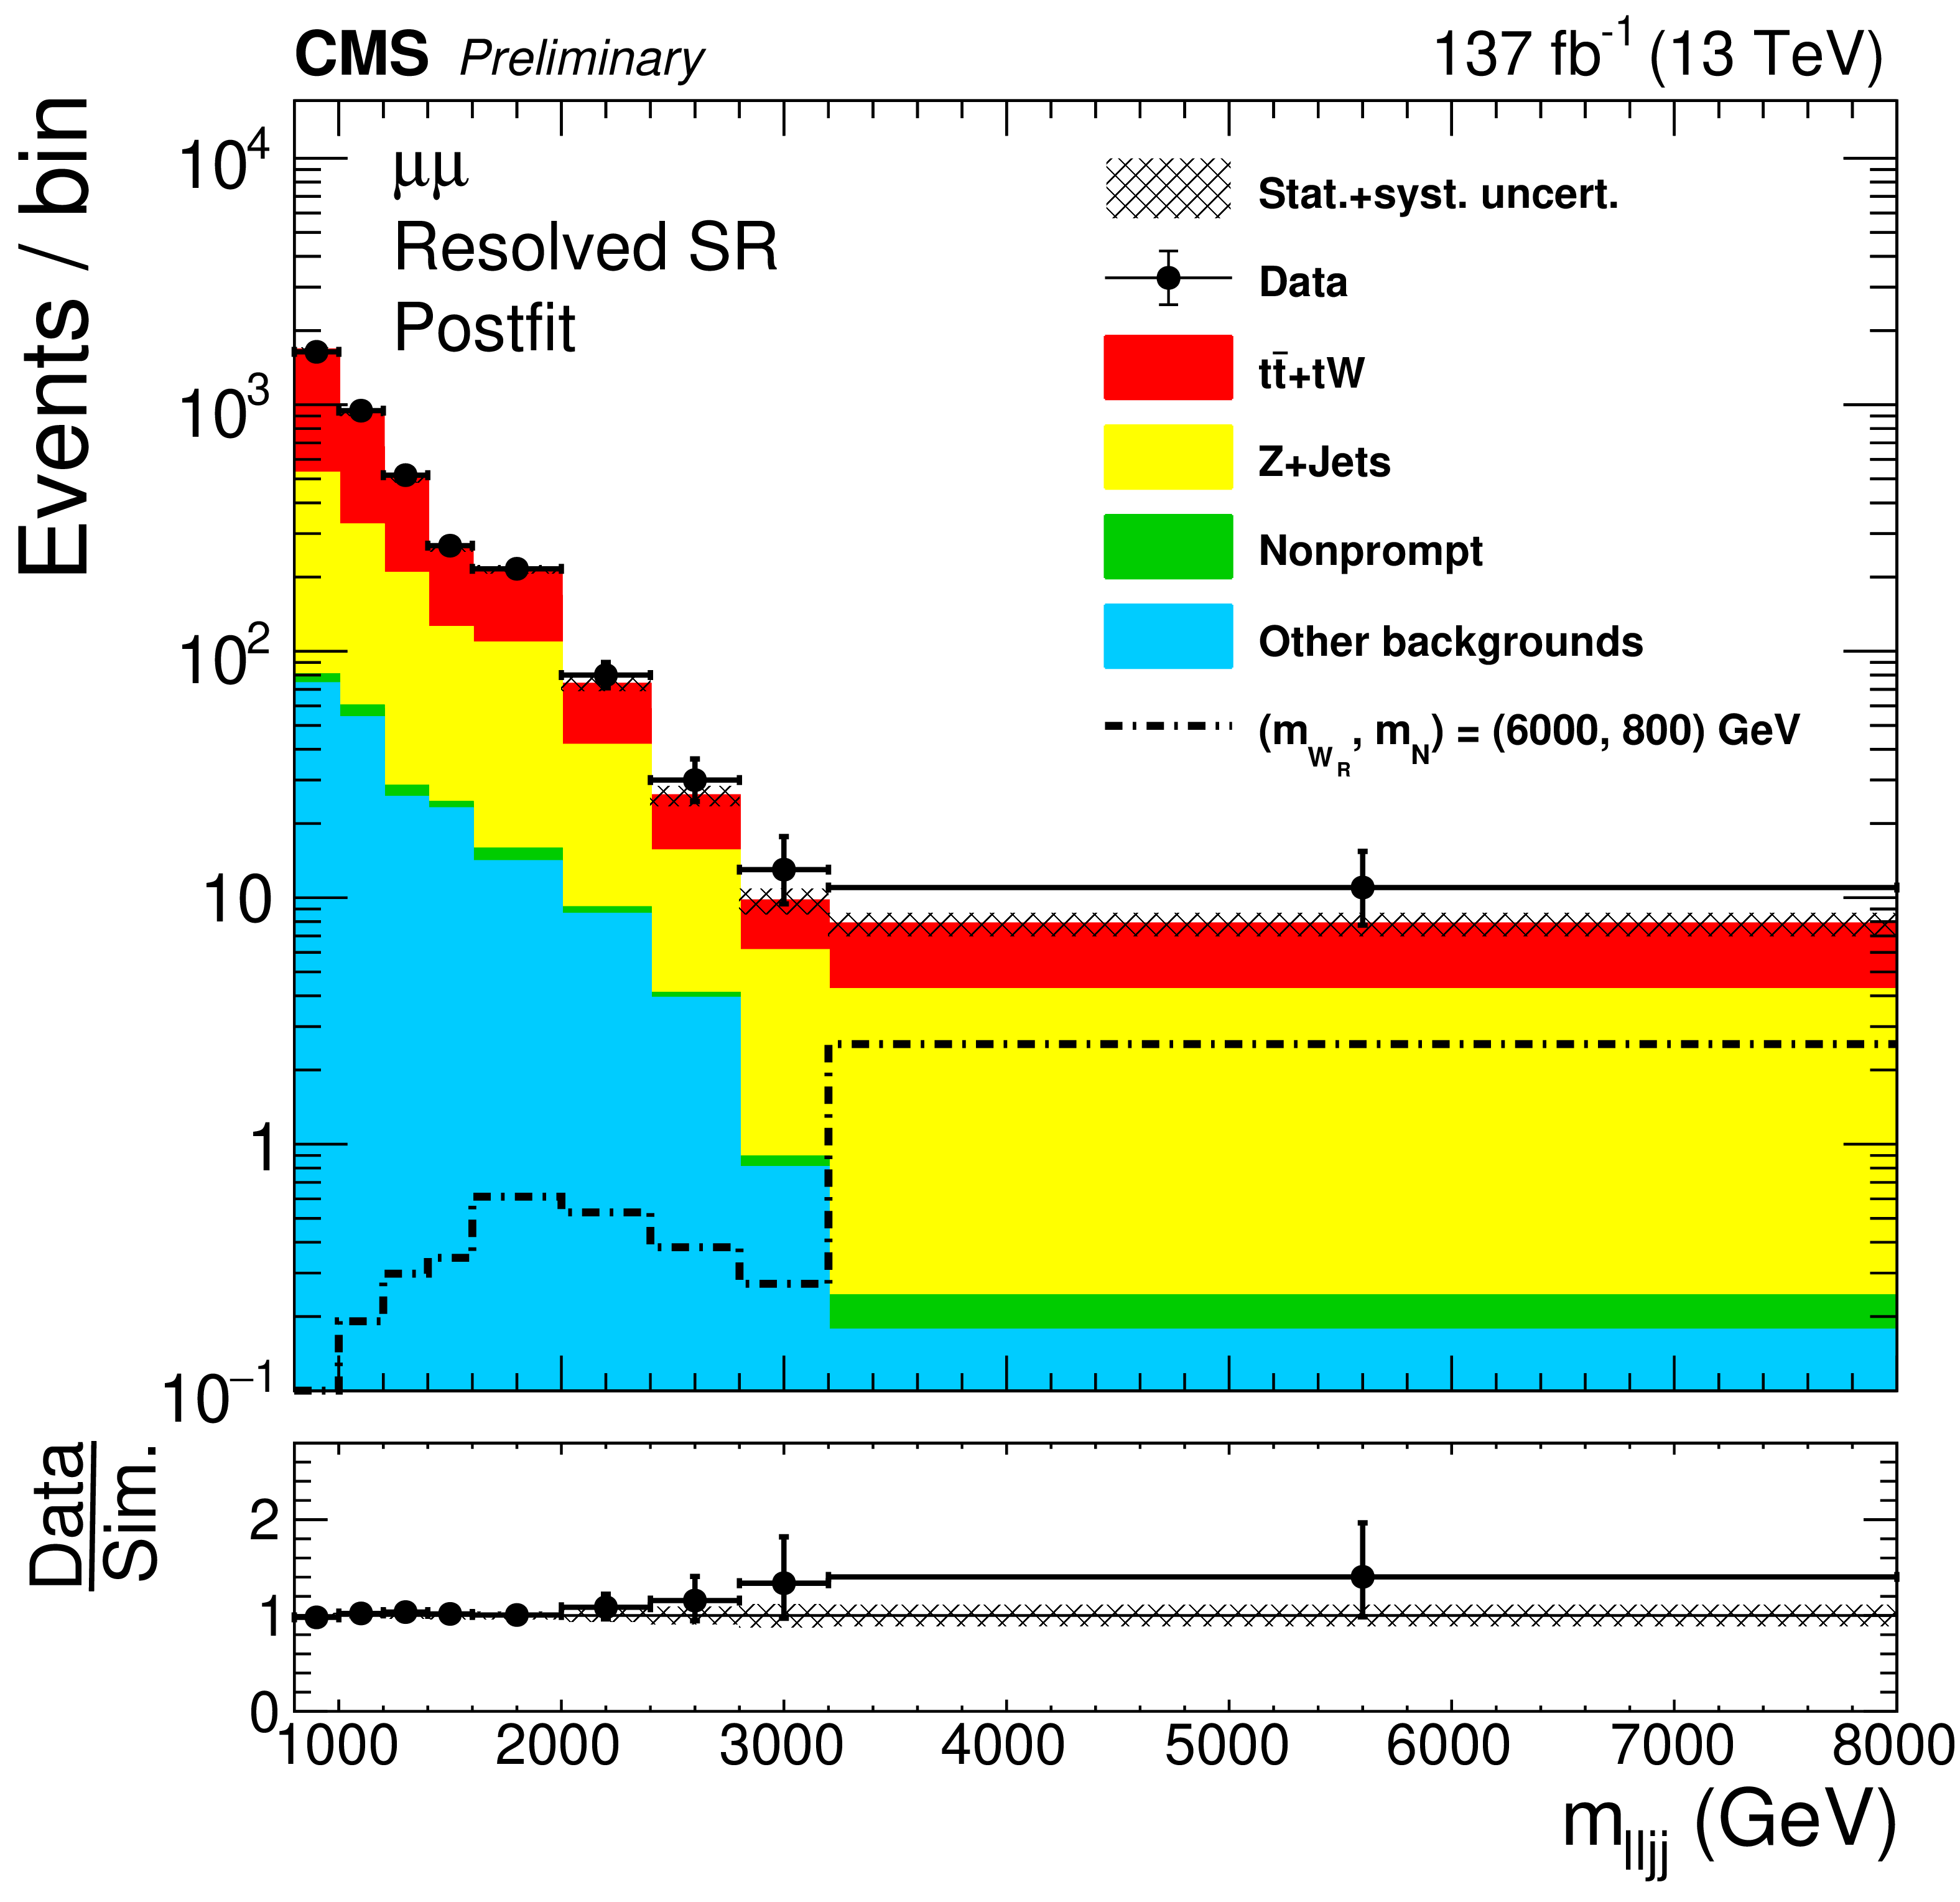
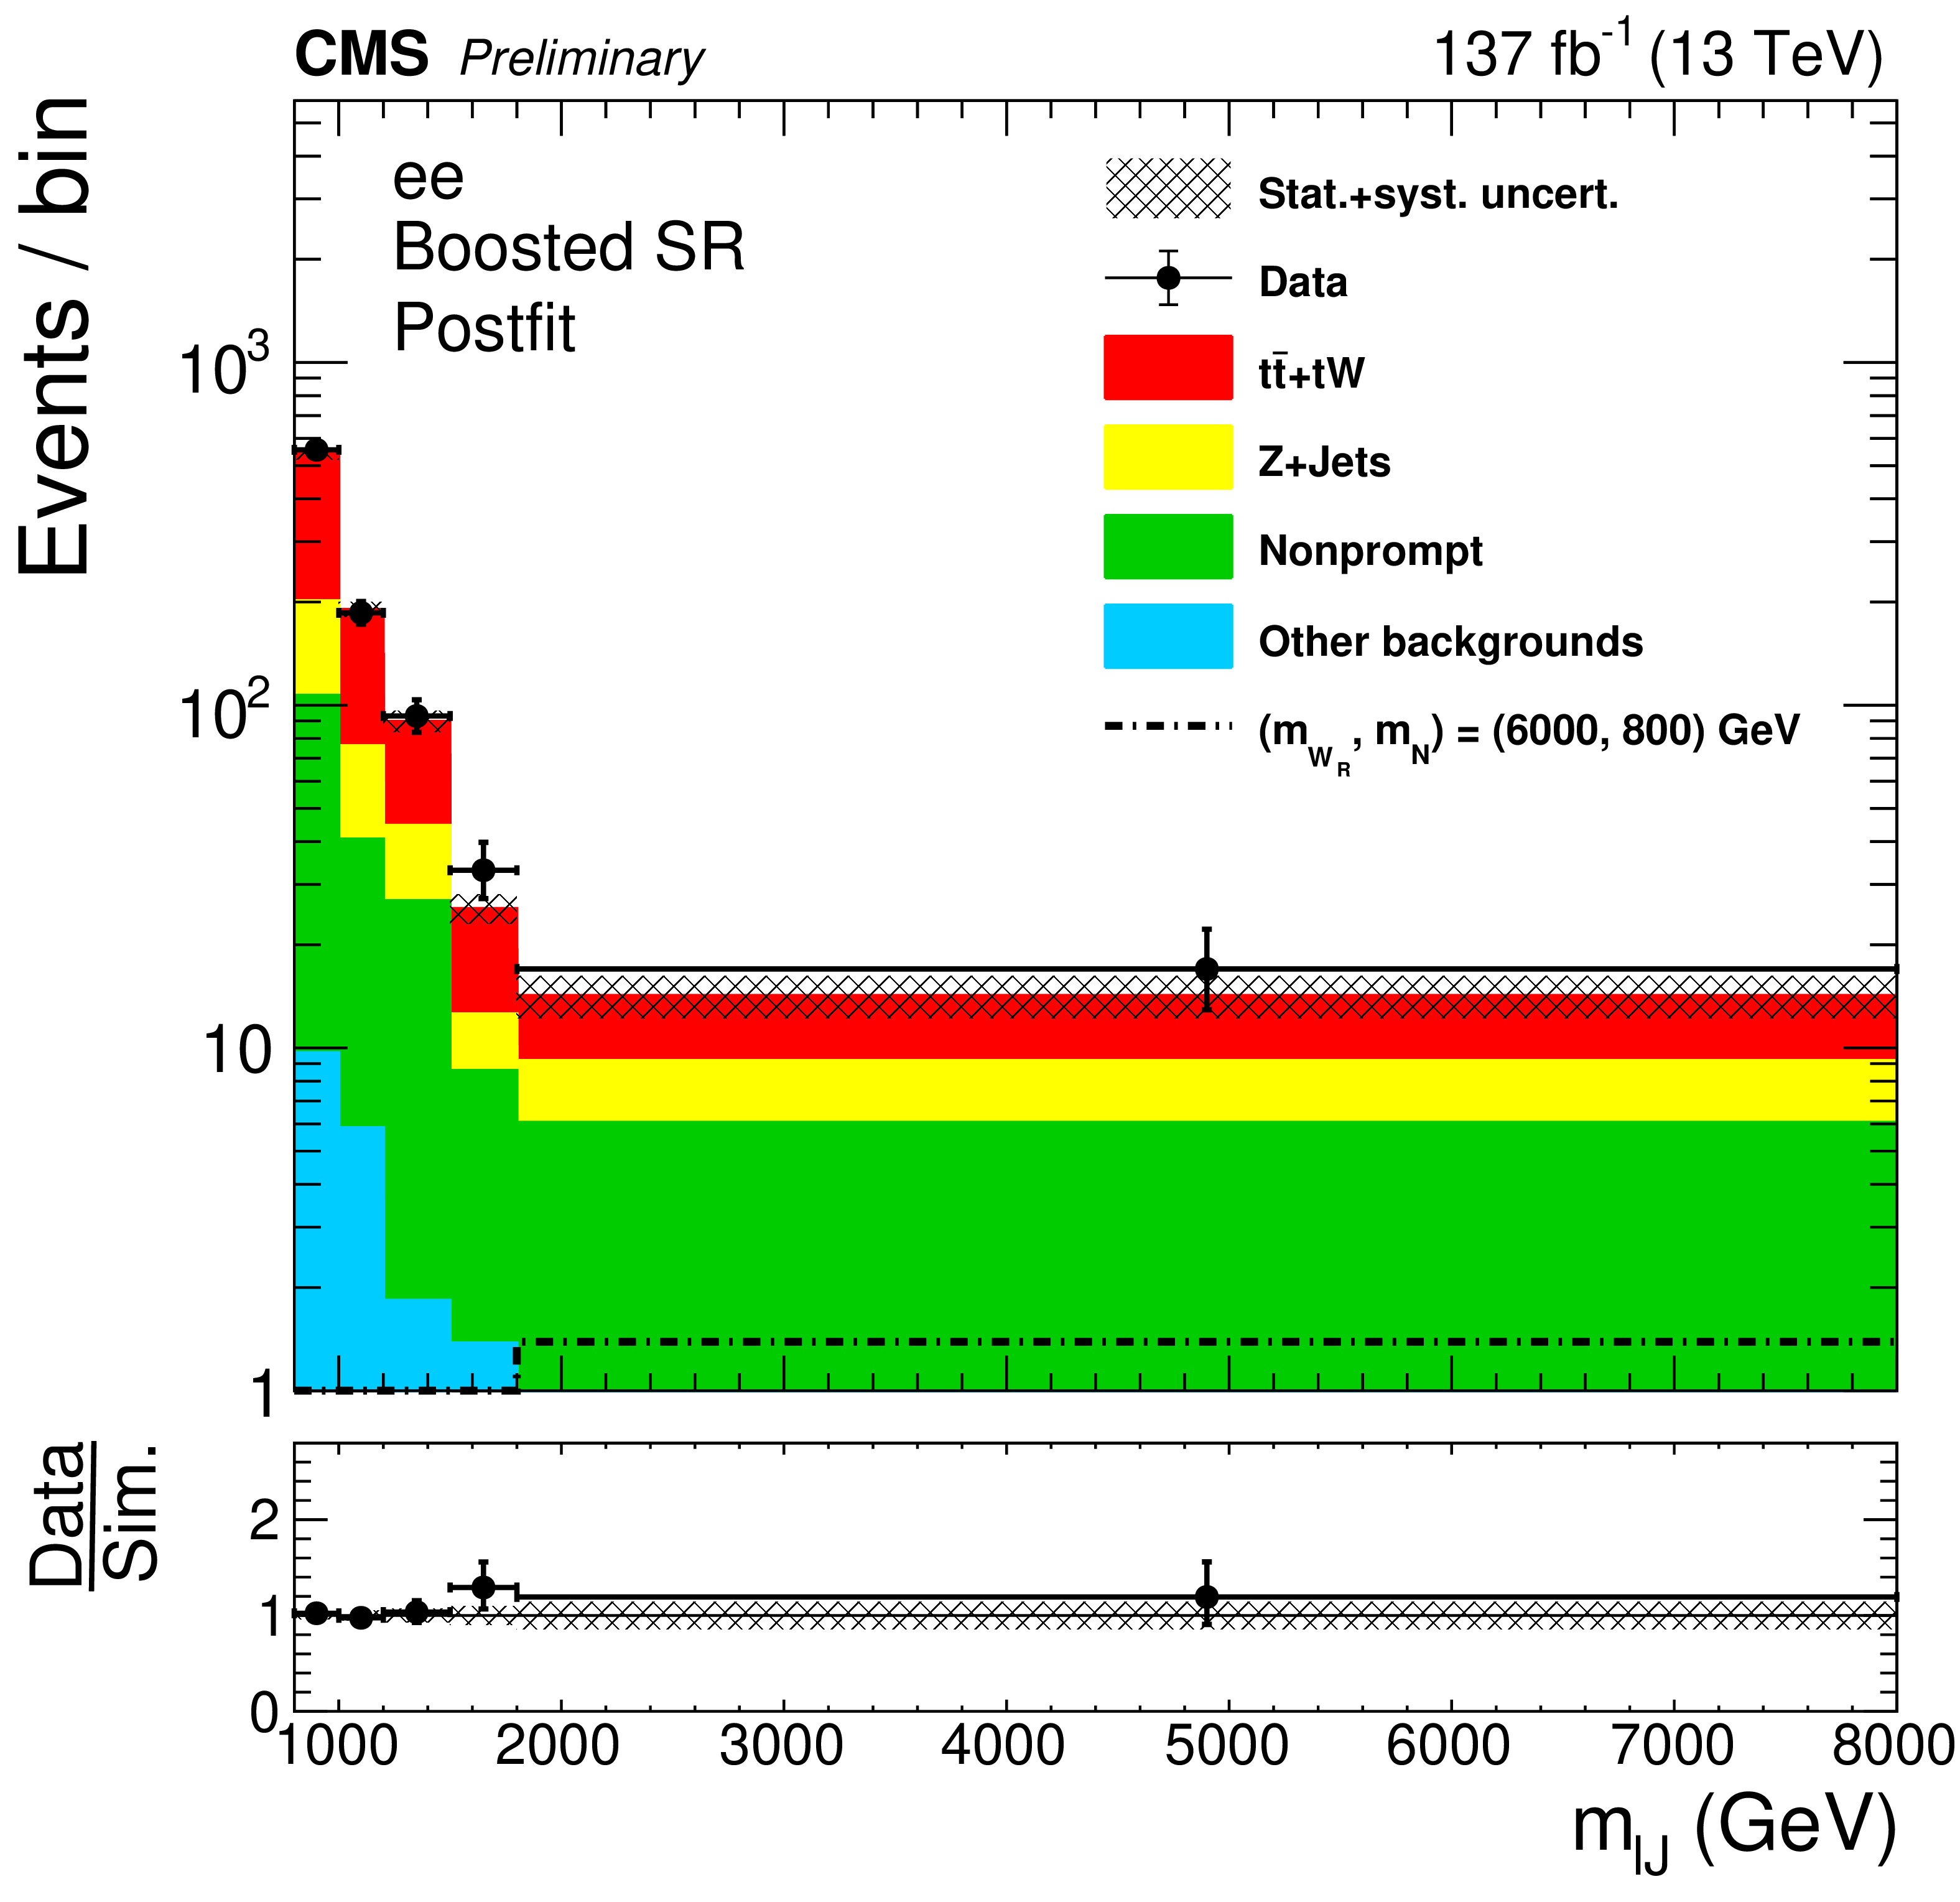
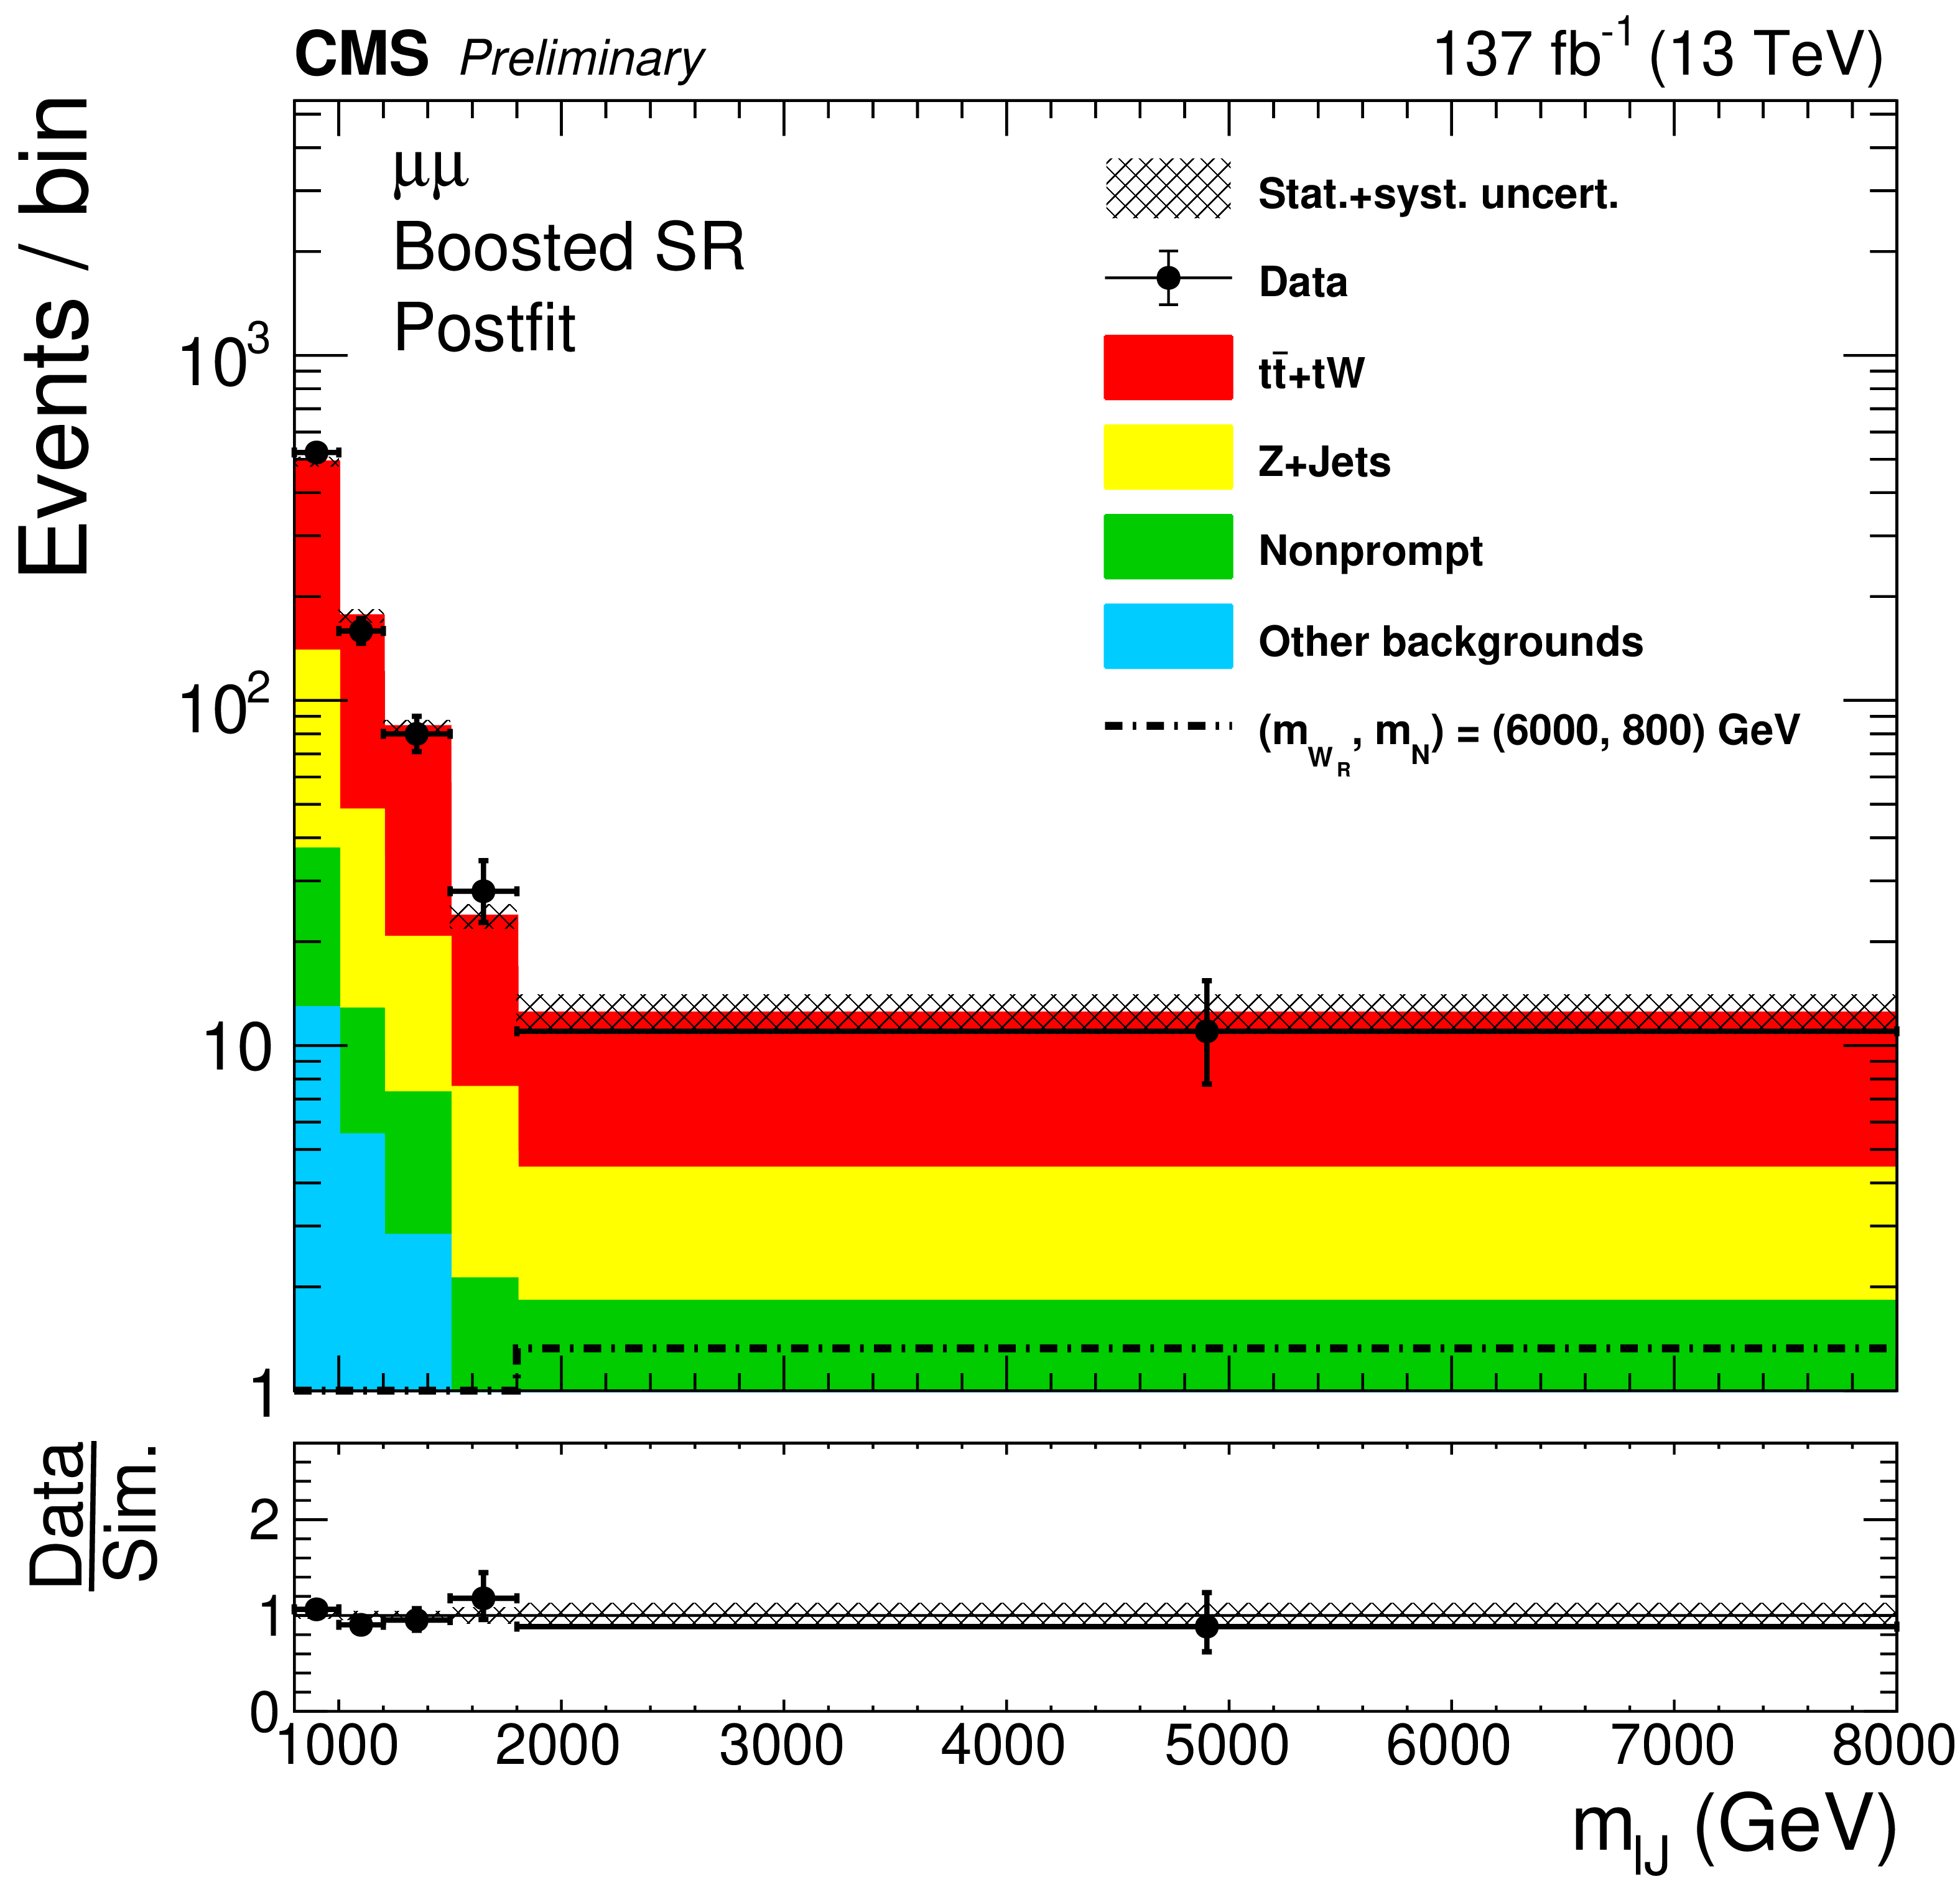
Figure 5:
The postfit $m_{\ell \ell {\mathrm {j}} {\mathrm {j}}}$ ($m_{\ell {\mathrm {J}}}$) distributions in the resolved (boosted) SR are shown in the top (bottom) plot. Results for the dielectron (dimuon) channel are shown on the left (right). Statistical and systematic uncertainties in the expected background yields are represented by the hatched band. |
png pdf |
Figure 5-a:
The postfit $m_{\ell \ell {\mathrm {j}} {\mathrm {j}}}$ ($m_{\ell {\mathrm {J}}}$) distributions in the resolved (boosted) SR are shown in the top (bottom) plot. Results for the dielectron (dimuon) channel are shown on the left (right). Statistical and systematic uncertainties in the expected background yields are represented by the hatched band. |
png pdf |
Figure 5-b:
The postfit $m_{\ell \ell {\mathrm {j}} {\mathrm {j}}}$ ($m_{\ell {\mathrm {J}}}$) distributions in the resolved (boosted) SR are shown in the top (bottom) plot. Results for the dielectron (dimuon) channel are shown on the left (right). Statistical and systematic uncertainties in the expected background yields are represented by the hatched band. |
png pdf |
Figure 5-c:
The postfit $m_{\ell \ell {\mathrm {j}} {\mathrm {j}}}$ ($m_{\ell {\mathrm {J}}}$) distributions in the resolved (boosted) SR are shown in the top (bottom) plot. Results for the dielectron (dimuon) channel are shown on the left (right). Statistical and systematic uncertainties in the expected background yields are represented by the hatched band. |
png pdf |
Figure 5-d:
The postfit $m_{\ell \ell {\mathrm {j}} {\mathrm {j}}}$ ($m_{\ell {\mathrm {J}}}$) distributions in the resolved (boosted) SR are shown in the top (bottom) plot. Results for the dielectron (dimuon) channel are shown on the left (right). Statistical and systematic uncertainties in the expected background yields are represented by the hatched band. |
png pdf |
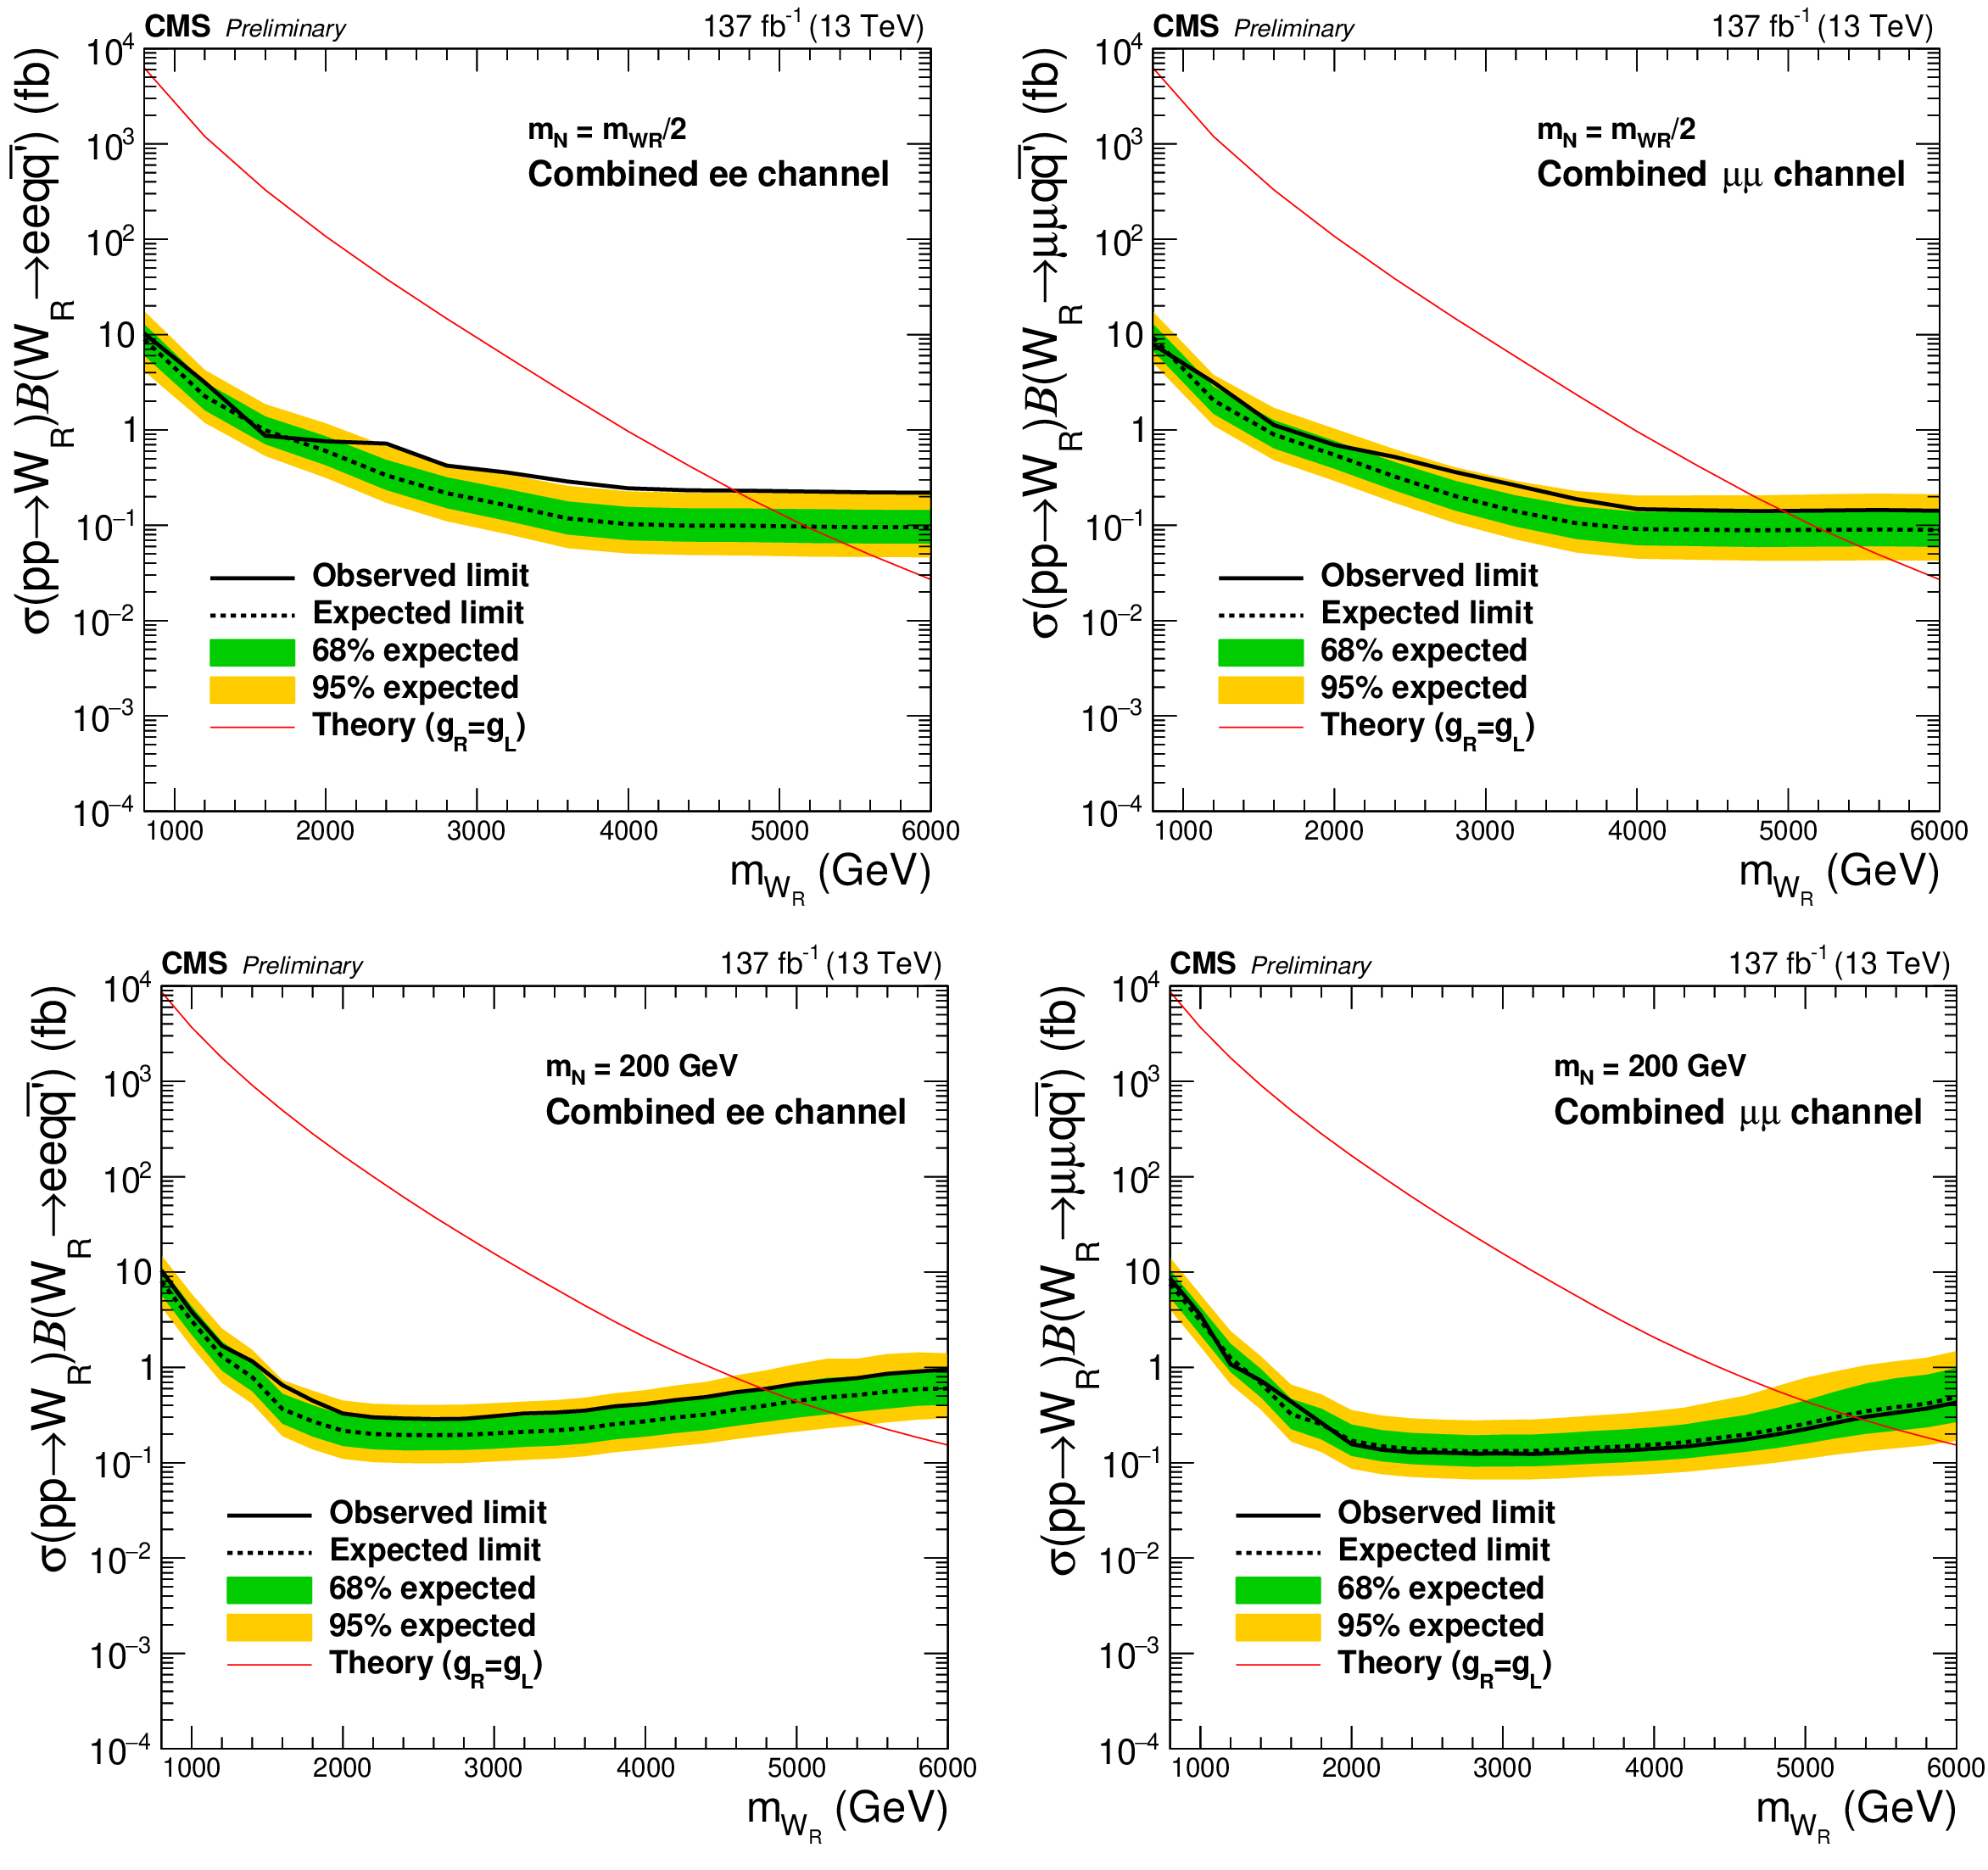
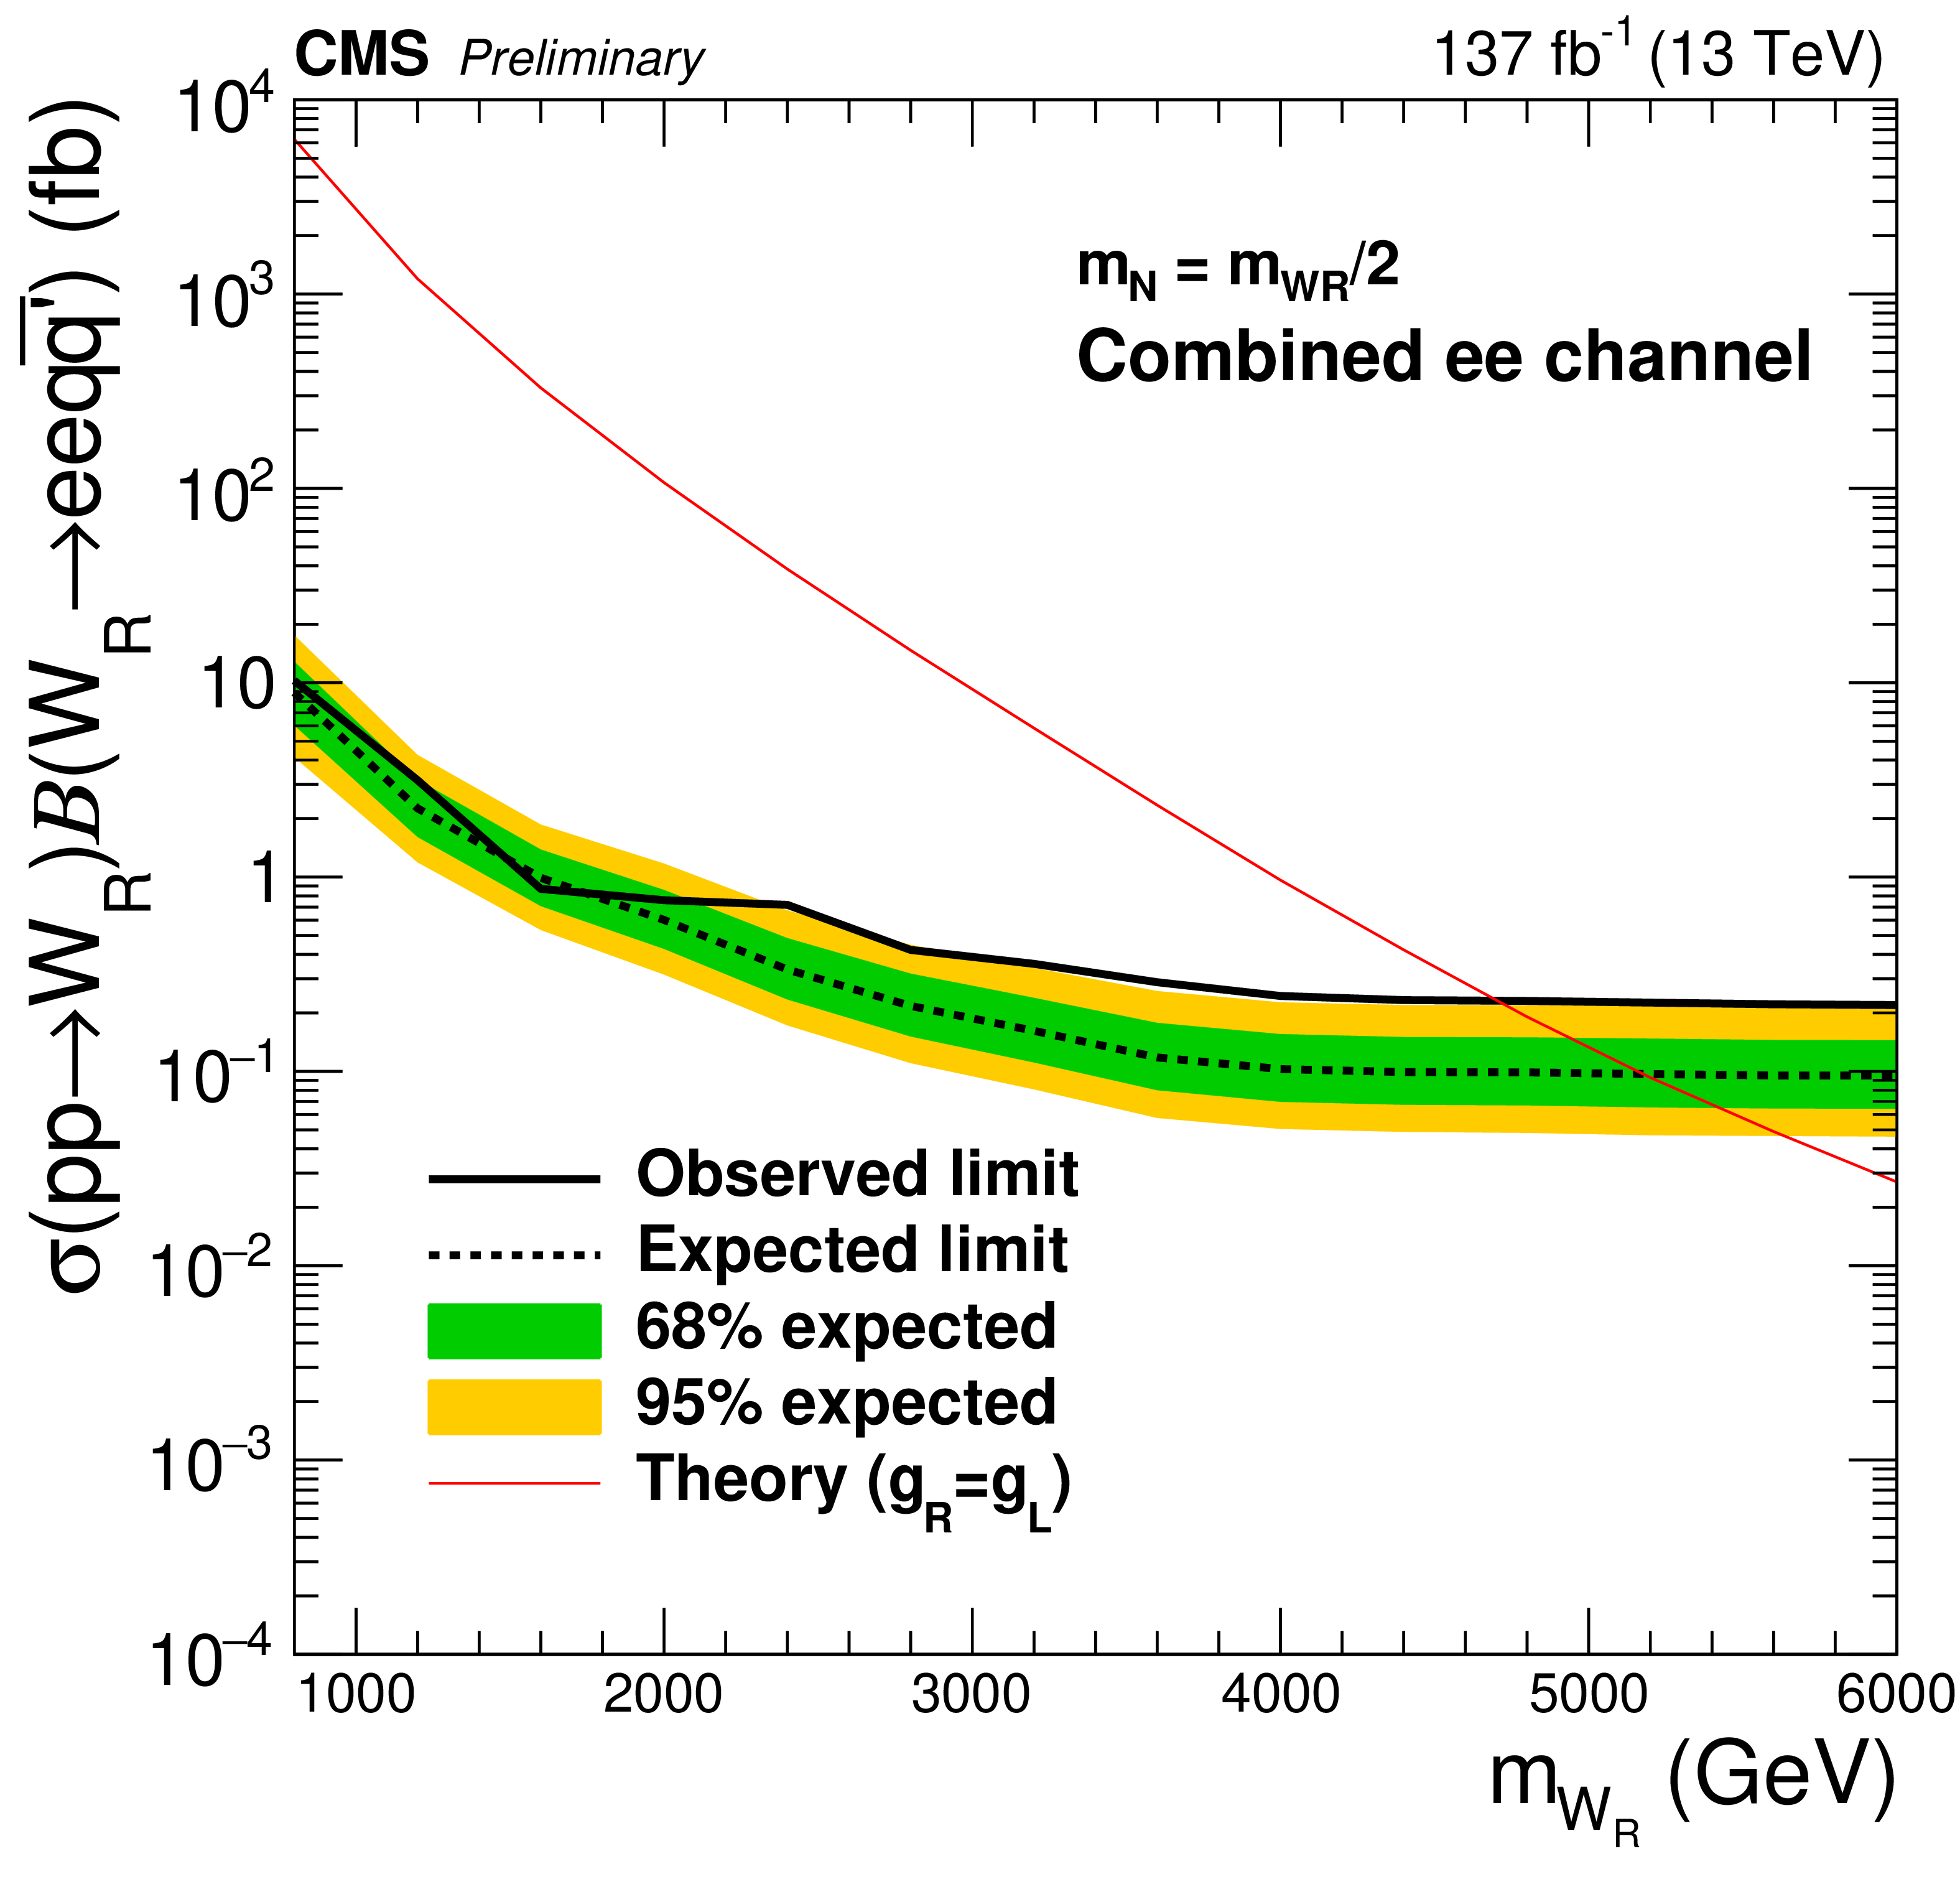
Figure 6:
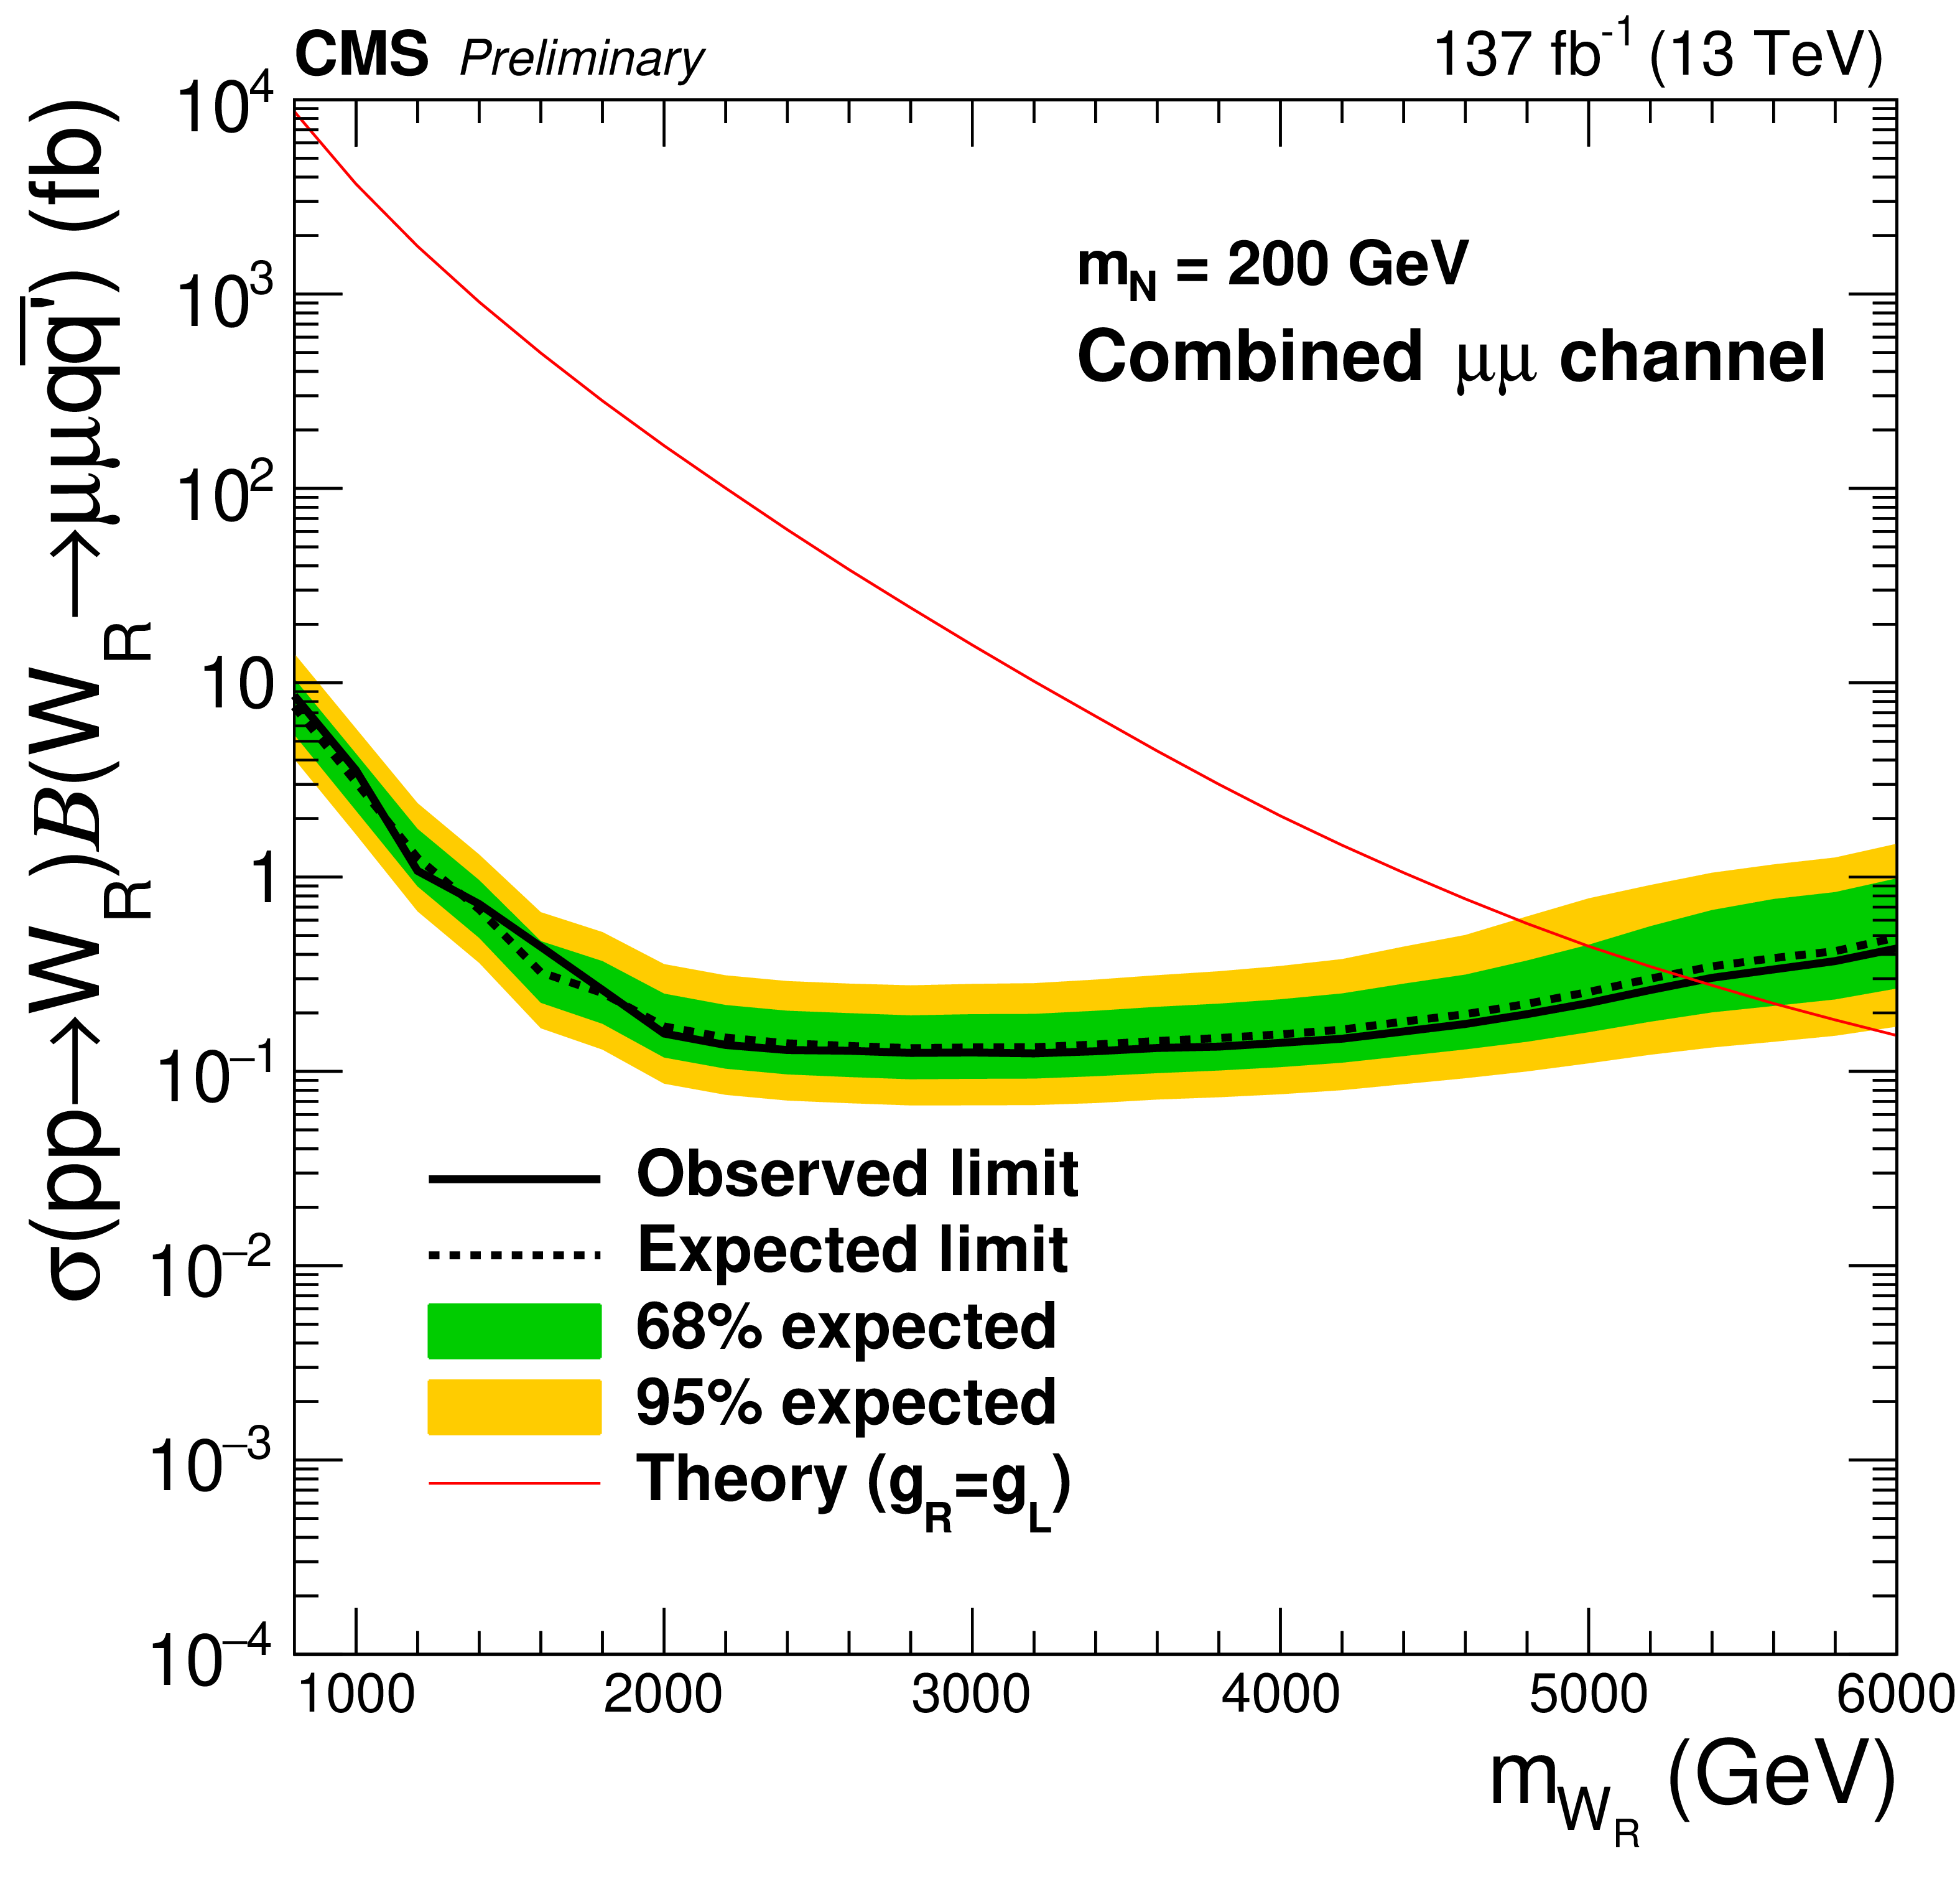
The expected (black dashed line) and the observed (black solid line) 95% CL upper limits on the product of the production cross sections and the branching fractions for the electron channel (left) and muon channel (right). The plots in the top (bottom) row are the results for the $ {m_\mathrm {N}} = {m_{\mathrm{W}_{R}}} /2$ ($ {m_\mathrm {N}} = $ 200 GeV) mass point. The green and yellow bands indicate the one and two standard-deviation of the expected upper limits. The red solid lines represent the values expected from the theory [19], which are compared with the upper limits to extract the excluded phase spaces in Fig. xxxxx. |
png pdf |
Figure 6-a:
The expected (black dashed line) and the observed (black solid line) 95% CL upper limits on the product of the production cross sections and the branching fractions for the electron channel (left) and muon channel (right). The plots in the top (bottom) row are the results for the $ {m_\mathrm {N}} = {m_{\mathrm{W}_{R}}} /2$ ($ {m_\mathrm {N}} = $ 200 GeV) mass point. The green and yellow bands indicate the one and two standard-deviation of the expected upper limits. The red solid lines represent the values expected from the theory [19], which are compared with the upper limits to extract the excluded phase spaces in Fig. xxxxx. |

png pdf |
Figure 6-b:
The expected (black dashed line) and the observed (black solid line) 95% CL upper limits on the product of the production cross sections and the branching fractions for the electron channel (left) and muon channel (right). The plots in the top (bottom) row are the results for the $ {m_\mathrm {N}} = {m_{\mathrm{W}_{R}}} /2$ ($ {m_\mathrm {N}} = $ 200 GeV) mass point. The green and yellow bands indicate the one and two standard-deviation of the expected upper limits. The red solid lines represent the values expected from the theory [19], which are compared with the upper limits to extract the excluded phase spaces in Fig. xxxxx. |

png pdf |
Figure 6-c:
The expected (black dashed line) and the observed (black solid line) 95% CL upper limits on the product of the production cross sections and the branching fractions for the electron channel (left) and muon channel (right). The plots in the top (bottom) row are the results for the $ {m_\mathrm {N}} = {m_{\mathrm{W}_{R}}} /2$ ($ {m_\mathrm {N}} = $ 200 GeV) mass point. The green and yellow bands indicate the one and two standard-deviation of the expected upper limits. The red solid lines represent the values expected from the theory [19], which are compared with the upper limits to extract the excluded phase spaces in Fig. xxxxx. |
png pdf |
Figure 6-d:
The expected (black dashed line) and the observed (black solid line) 95% CL upper limits on the product of the production cross sections and the branching fractions for the electron channel (left) and muon channel (right). The plots in the top (bottom) row are the results for the $ {m_\mathrm {N}} = {m_{\mathrm{W}_{R}}} /2$ ($ {m_\mathrm {N}} = $ 200 GeV) mass point. The green and yellow bands indicate the one and two standard-deviation of the expected upper limits. The red solid lines represent the values expected from the theory [19], which are compared with the upper limits to extract the excluded phase spaces in Fig. xxxxx. |
png pdf |
Figure 7:
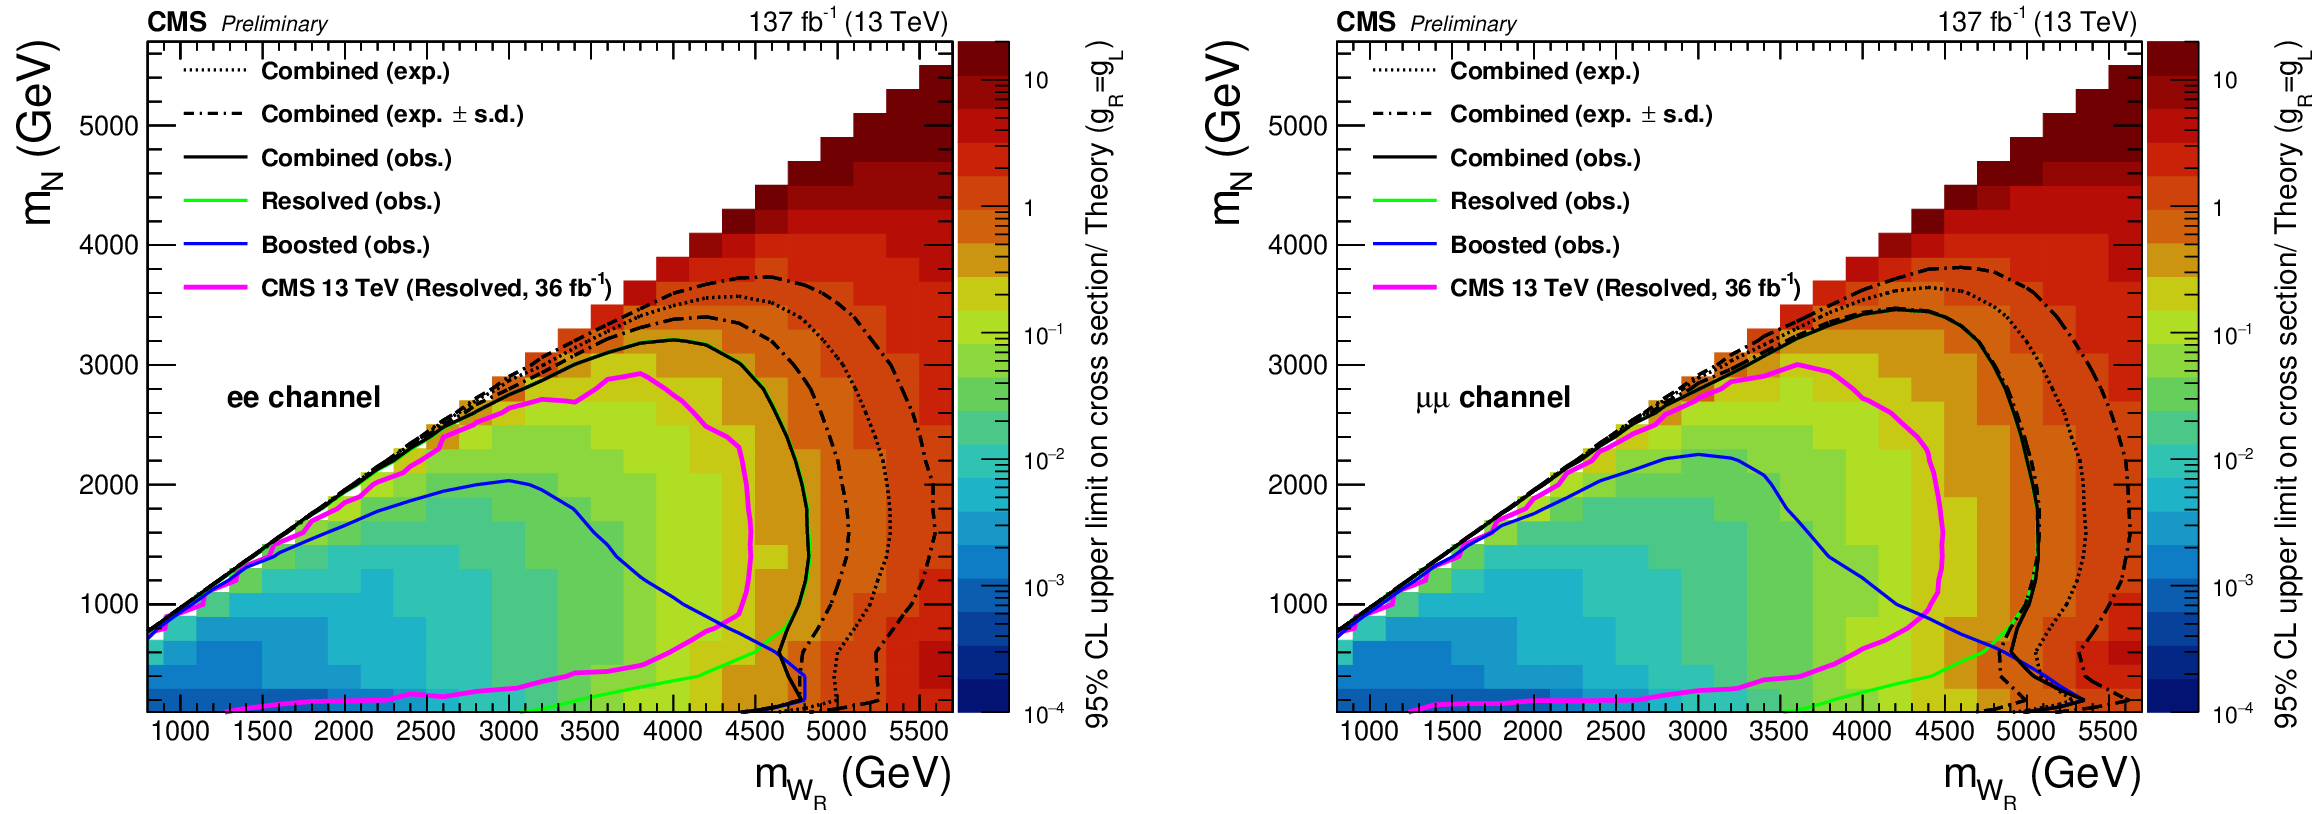
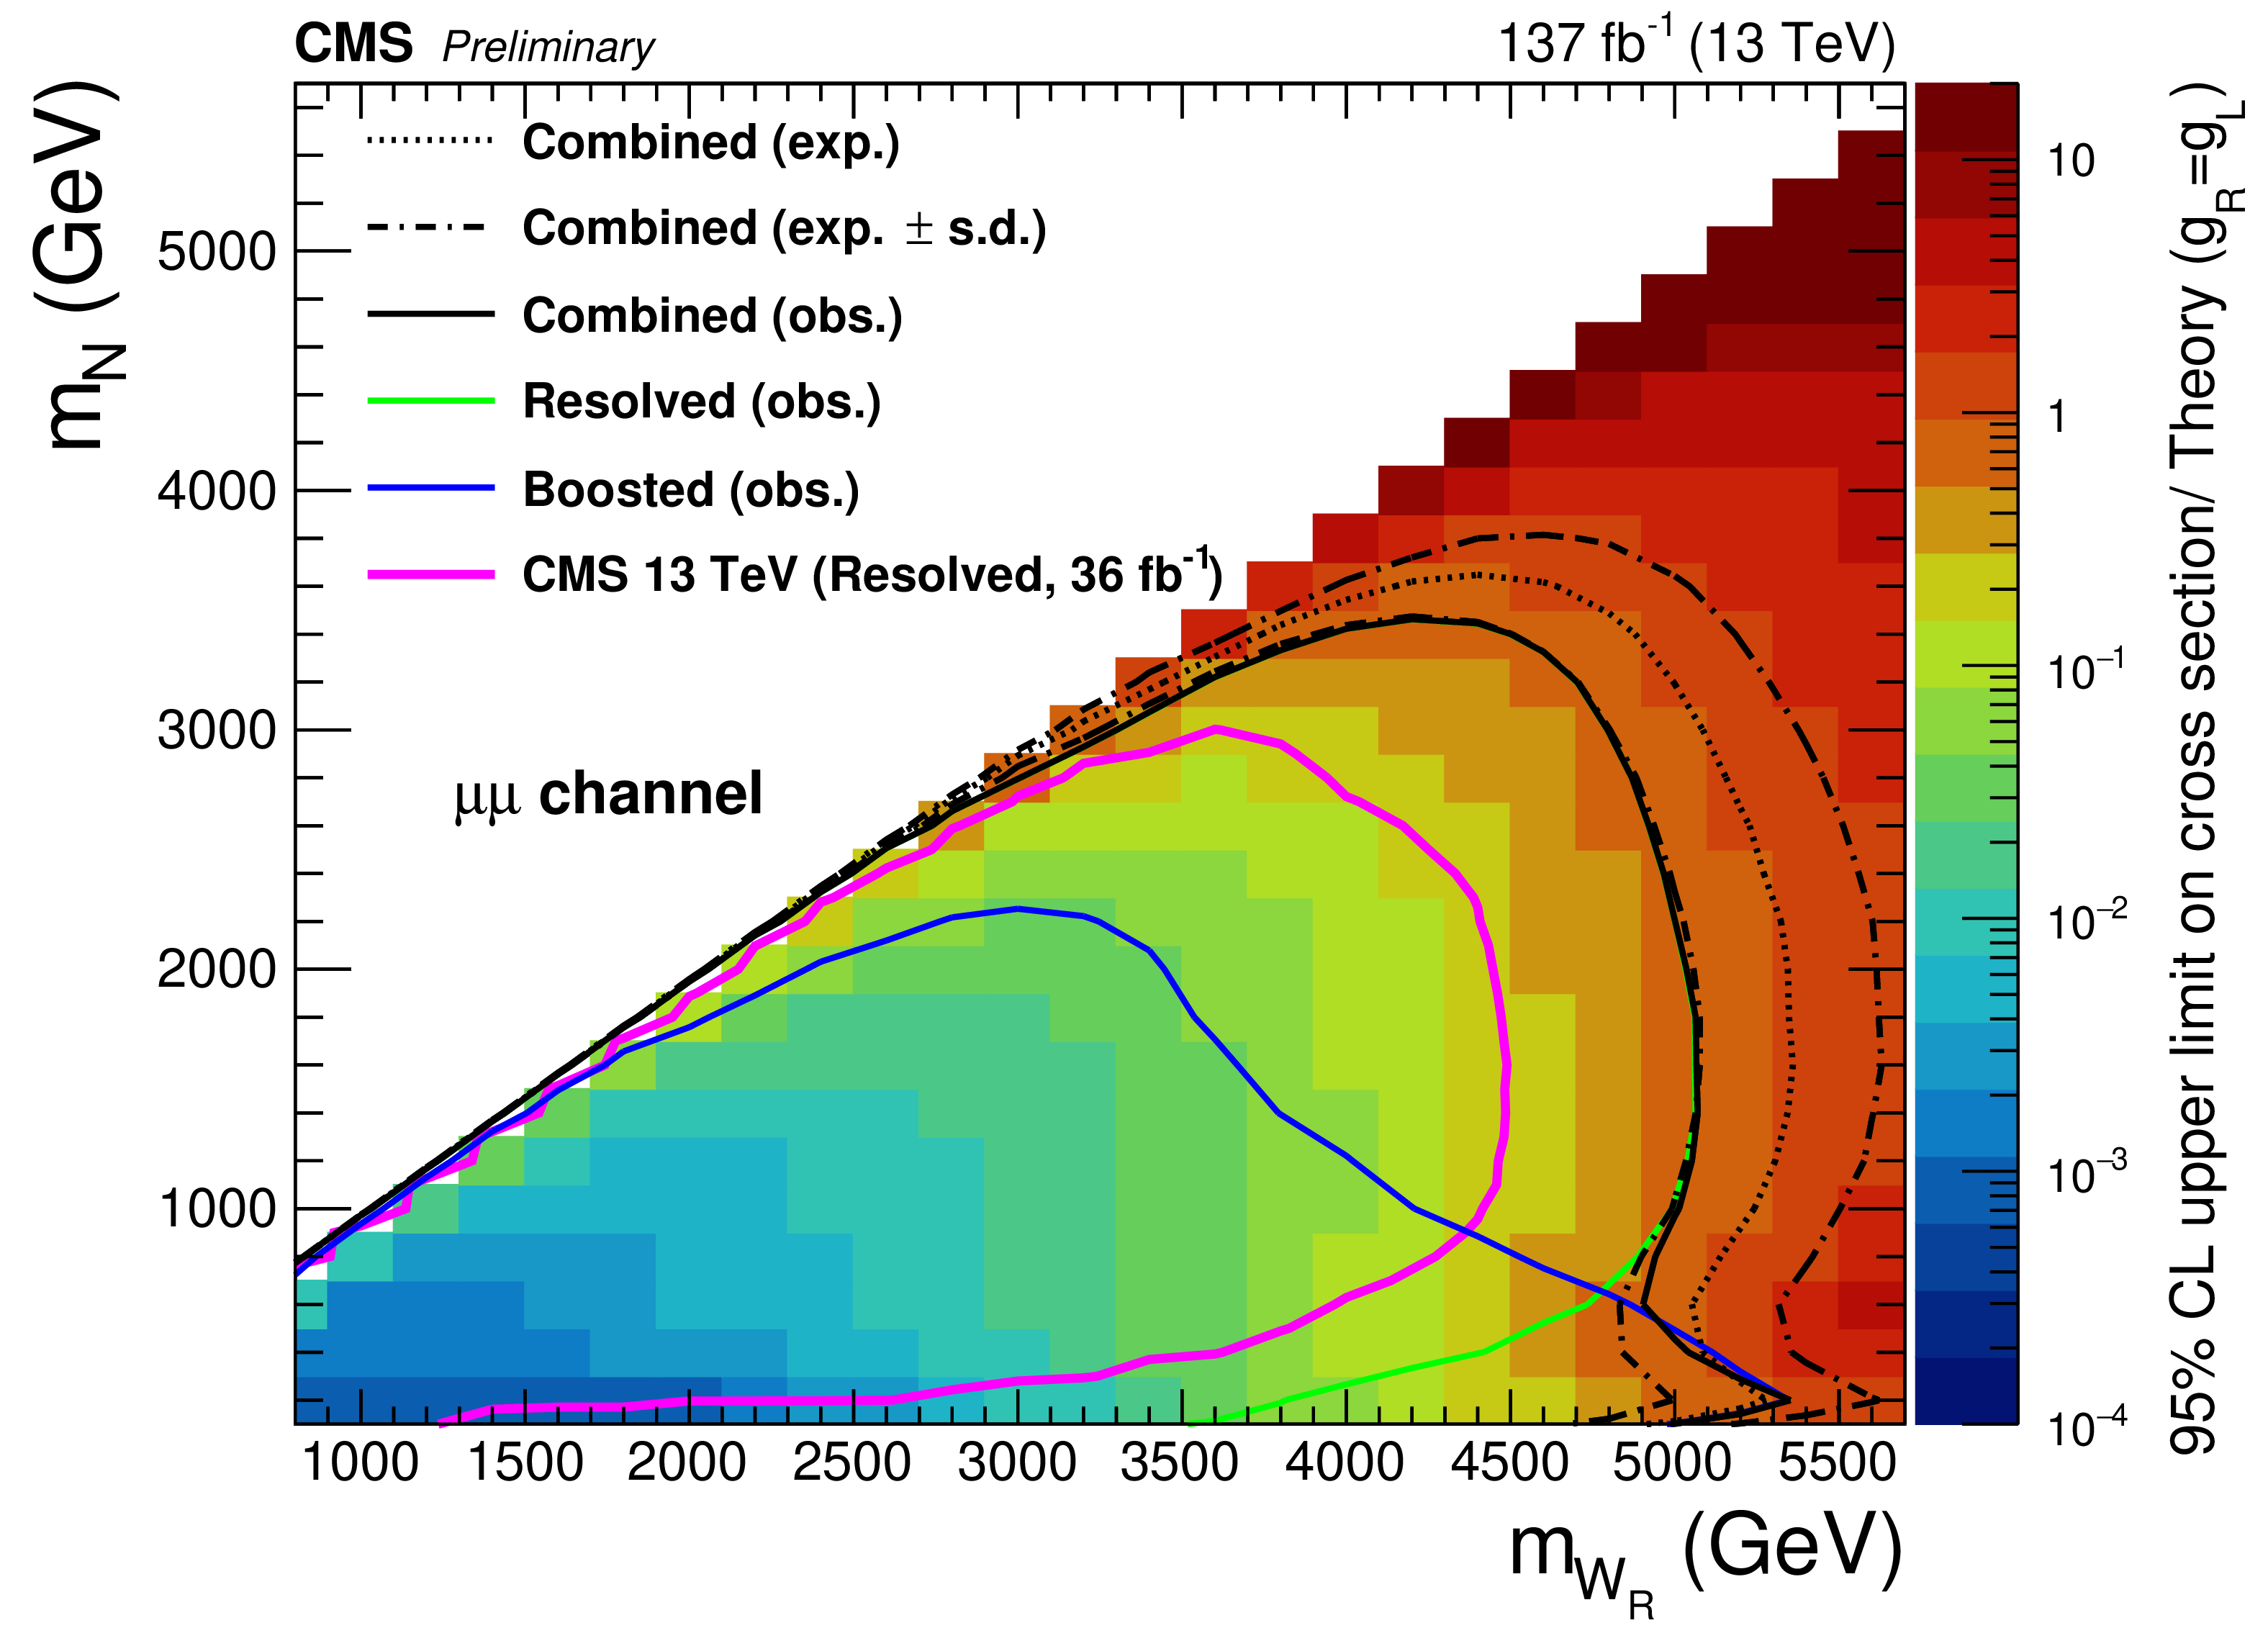
The observed 95% CL upper limits on the product of the production cross sections and the branching fractions for the electron channel (left) and muon channel (right). The observed exclusions are shown for the resolved result (solid green), boosted result (solid blue), and combined results (solid black) along with the expected exclusion for the combined result (dotted black). The dash-dotted lines represent the one standard-deviation (s.d.) of the expected exclusion. The observed exclusions from previous searches performed by the CMS [12] (magenta) Collaborations are also shown. |

png pdf |
Figure 7-a:
The observed 95% CL upper limits on the product of the production cross sections and the branching fractions for the electron channel (left) and muon channel (right). The observed exclusions are shown for the resolved result (solid green), boosted result (solid blue), and combined results (solid black) along with the expected exclusion for the combined result (dotted black). The dash-dotted lines represent the one standard-deviation (s.d.) of the expected exclusion. The observed exclusions from previous searches performed by the CMS [12] (magenta) Collaborations are also shown. |
png pdf |
Figure 7-b:
The observed 95% CL upper limits on the product of the production cross sections and the branching fractions for the electron channel (left) and muon channel (right). The observed exclusions are shown for the resolved result (solid green), boosted result (solid blue), and combined results (solid black) along with the expected exclusion for the combined result (dotted black). The dash-dotted lines represent the one standard-deviation (s.d.) of the expected exclusion. The observed exclusions from previous searches performed by the CMS [12] (magenta) Collaborations are also shown. |
| Tables | |
png pdf |
Table 1:
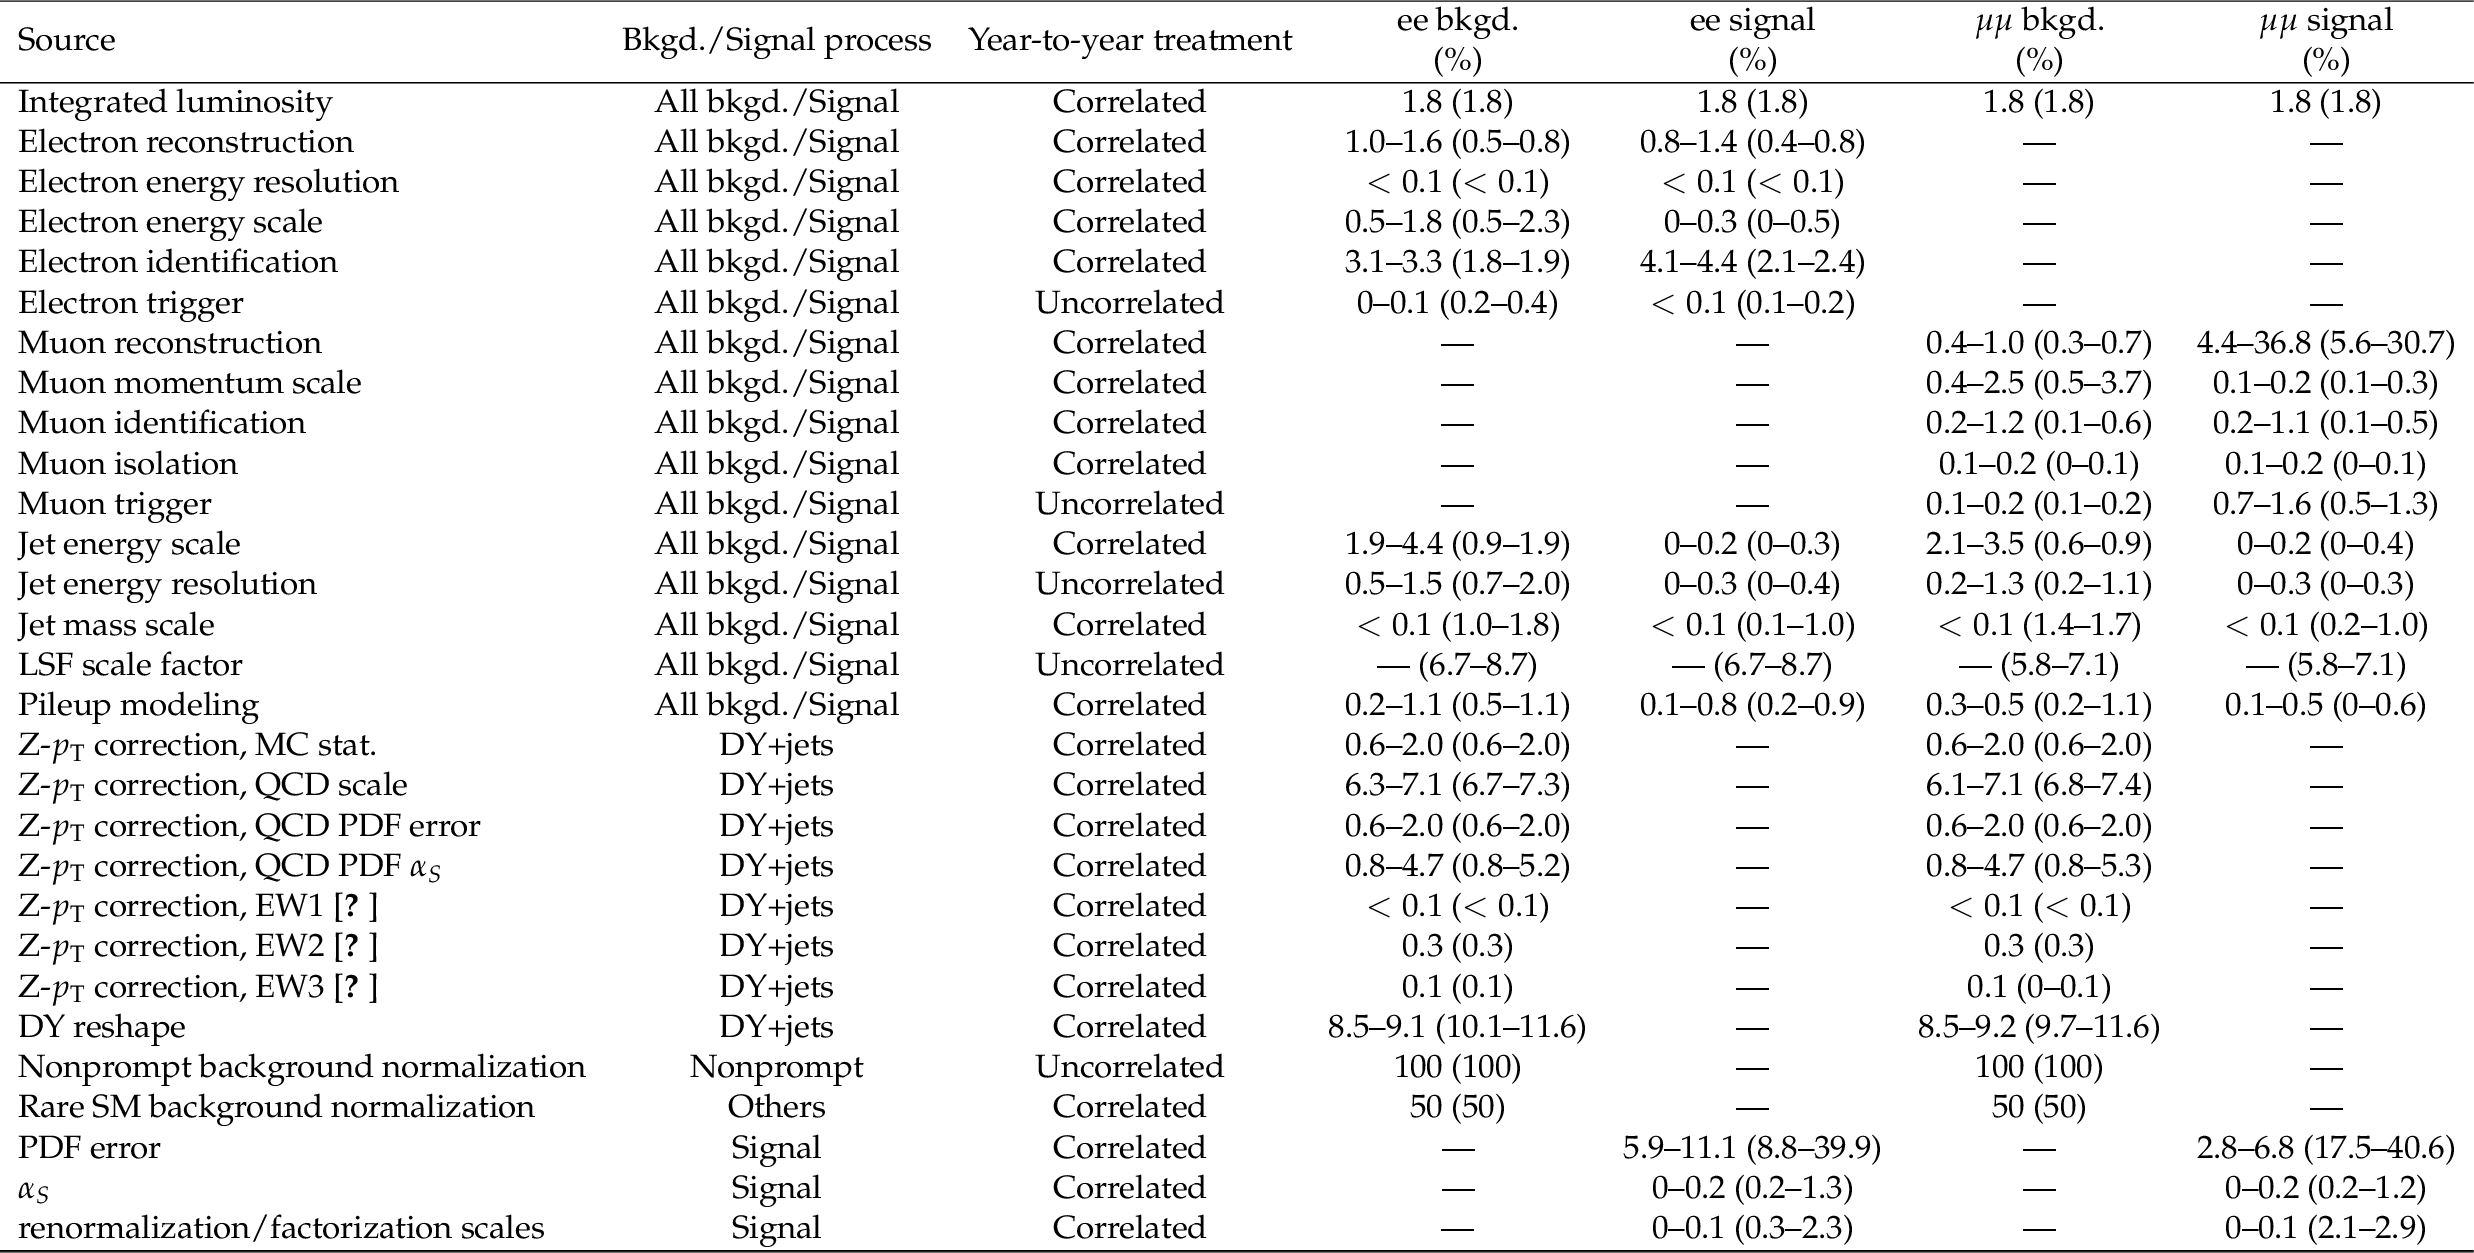
Summary of the relative uncertainties on the total yields of the signal and background predictions. The uncertainties are given for the resolved (boosted) SR. The numbers for signal is obtained for $m_{\mathrm{W}_{R}} = $ 5 TeV. The range given for each systematic uncertainty source covers the variation across the years. |
| Summary |
| A search for right-handed bosons ($\mathrm{W}_{R}$) and heavy right-handed neutrinos (${\mathrm{N}} $) in the left-right symmetric extension of the standard model has been presented. The analysis is based on proton-proton collision data collected at $\sqrt{s} = $ 13 TeV by the CMS detector, and corresponding to an integrated luminosity of 137 fb$^{-1}$ . The final state consists of events with two same-flavor leptons (ee or $\mu\mu$) and two quarks, and was identified through two regions: the resolved region, where all four objects were well isolated, and the boosted region, where the heavy neutrino decay was identified using jet substructure techniques applied to large area jets. No significant excess over the standard model background expectations is observed in the invariant mass distributions. Upper limits are set on the products of the $\mathrm{W}_{R}$ and ${\mathrm{N}} $ production cross sections and their branching fraction to two leptons and two quarks assuming that couplings are identical to those of the standard model. For $m_{{\mathrm{N}} }=1/2m_{\mathrm{W}_{R}}$ (${m_\mathrm{N}} = $ 200 GeV), the mass of the $\mathrm{W}_{R}$ is excluded at 95% confidence level up to 4.7 (4.8) and 5.0 (5.4) TeV for the electron and muon channel, respectively. The maximum observed local significance is in the electron channel and is 2.95 standard deviations for LR symmetric models with $(m_{\mathrm{W}_{R}}, m_{{\mathrm{N}} }) = $ (6000, 800) GeV, corresponding to a global significance of 2.78$\sigma$. |
| References | ||||
| 1 | J. C. Pati and A. Salam | Lepton number as the fourth ``color'' | PRD 10 (1974) 275 | |
| 2 | R. N. Mohapatra and J. C. Pati | A natural left-right symmetry | PRD 11 (1975) 2558 | |
| 3 | G. Senjanović and R. N. Mohapatra | Exact left-right symmetry and spontaneous violation of parity | PRD 12 (1975) 1502 | |
| 4 | W.-Y. Keung and G. Senjanovi\'c | Majorana neutrinos and the production of the right-handed charged gauge boson | PRL 50 (1983) 1427 | |
| 5 | R. N. Mohapatra and G. Senjanović | Neutrino mass and spontaneous parity nonconservation | PRL 44 (1980) 912 | |
| 6 | A. Das, P. S. B. Dev, and R. N. Mohapatra | Same sign versus opposite sign dileptons as a probe of low scale seesaw mechanisms | PRD 97 (2018) 015018 | 1709.06553 |
| 7 | M. Gell-Mann, P. Ramond, and R. Slansky | Complex spinors and unified theories | Conf. Proc. C 790927 (1979) 315 | 1306.4669 |
| 8 | ATLAS Collaboration | Search for heavy majorana neutrinos with the ATLAS detector in pp collisions at $ \sqrt{s}= $ 8 TeV | JHEP 07 (2015) 162 | 1506.06020 |
| 9 | ATLAS Collaboration | Search for heavy majorana or dirac neutrinos and right-handed W gauge bosons in final states with two charged leptons and two jets at $ \sqrt{s}= $ 13 TeV with the ATLAS detector | JHEP 01 (2019) 016 | 1809.11105 |
| 10 | ATLAS Collaboration | Search for a right-handed gauge boson decaying into a high-momentum heavy neutrino and a charged lepton in $ pp $ collisions with the atlas detector at $ \sqrt{s}= $ 13 TeV | PLB 798 (2019) 134942 | 1904.12679 |
| 11 | CMS Collaboration | Search for heavy neutrinos and $ \mathrm {W} $ bosons with right-handed couplings in proton-proton collisions at $ \sqrt{s} = $ 8 TeV | EPJC 74 (2014) 3149 | CMS-EXO-13-008 1407.3683 |
| 12 | CMS Collaboration | Search for a heavy right-handed W boson and a heavy neutrino in events with two same-flavor leptons and two jets at $ \sqrt{s}= $ 13 TeV | JHEP 05 (2018) 148 | CMS-EXO-17-011 1803.11116 |
| 13 | CMS Collaboration | Search for heavy majorana neutrinos in same-sign dilepton channels in proton-proton collisions at $ \sqrt{s}= $ 13 TeV | JHEP 01 (2019) 122 | CMS-EXO-17-028 1806.10905 |
| 14 | CMS Collaboration | Search for heavy neutrinos or third-generation leptoquarks in final states with two hadronically decaying $ \tau $ leptons and two jets in proton-proton collisions at $ \sqrt{s}= $ 13 TeV | JHEP 03 (2017) 077 | CMS-EXO-16-016 1612.01190 |
| 15 | CMS Collaboration | Search for third-generation scalar leptoquarks and heavy right-handed neutrinos in final states with two tau leptons and two jets in proton-proton collisions at $ \sqrt{s}= $ 13 TeV | JHEP 07 (2017) 121 | CMS-EXO-16-023 1703.03995 |
| 16 | CMS Collaboration | The CMS experiment at the CERN LHC | JINST 3 (2008) S08004 | CMS-00-001 |
| 17 | CMS Collaboration | The CMS trigger system | JINST 12 (2017) P01020 | CMS-TRG-12-001 1609.02366 |
| 18 | J. Alwall et al. | The automated computation of tree-level and next-to-leading order differential cross sections, and their matching to parton shower simulations | JHEP 07 (2014) 079 | 1405.0301 |
| 19 | O. Mattelaer, M. Mitra, and R. Ruiz | Automated neutrino jet and top jet predictions at next-to-leading-order with parton shower matching in effective left-right symmetric models | 2016 | |
| 20 | M. Mitra, R. Ruiz, D. J. Scott, and M. Spannowsky | Neutrino jets from high-mass $ {W}_{R} $ gauge bosons in TeV-scale left-right symmetric models | PRD 94 (2016) 095016 | 1607.03504 |
| 21 | J. Alwall et al. | Comparative study of various algorithms for the merging of parton showers and matrix elements in hadronic collisions | EPJC 53 (2008) 473 | 0706.2569 |
| 22 | S. Frixione, P. Nason, and C. Oleari | Matching NLO QCD computations with parton shower simulations: the POWHEG method | JHEP 11 (2007) 070 | 0709.2092 |
| 23 | E. Re | Single-top Wt-channel production matched with parton showers using the POWHEG method | EPJC 71 (2011) 1547 | 1009.2450 |
| 24 | S. Alioli, P. Nason, C. Oleari, and E. Re | NLO single-top production matched with shower in POWHEG: s- and t-channel contributions | JHEP 09 (2009) 111 | 0907.4076 |
| 25 | T. Sjostrand et al. | An introduction to PYTHIA 8.2 | CPC 191 (2015) 159 | 1410.3012 |
| 26 | CMS Collaboration | Event generator tunes obtained from underlying event and multiparton scattering measurements | EPJC 76 (2016) 155 | CMS-GEN-14-001 1512.00815 |
| 27 | CMS Collaboration | Extraction and validation of a new set of CMS PYTHIA8 tunes from underlying-event measurements | EPJC 80 (2020) 4 | CMS-GEN-17-001 1903.12179 |
| 28 | NNPDF Collaboration | Parton distributions for the LHC Run II | JHEP 04 (2015) 040 | 1410.8849 |
| 29 | NNPDF Collaboration | Parton distributions from high-precision collider data | EPJC 77 (2017) 663 | 1706.00428 |
| 30 | GEANT4 Collaboration | GEANT4--a simulation toolkit | NIMA 506 (2003) 250 | |
| 31 | CMS Collaboration | Measurement of the inelastic proton-proton cross section at $ \sqrt{s}= $ 13 TeV | JHEP 07 (2018) 161 | CMS-FSQ-15-005 1802.02613 |
| 32 | M. Cacciari, G. P. Salam, and G. Soyez | The anti-$ {k_{\mathrm{T}}} $ jet clustering algorithm | JHEP 04 (2008) 063 | 0802.1189 |
| 33 | M. Cacciari, G. P. Salam, and G. Soyez | FastJet user manual | EPJC 72 (2012) 1896 | 1111.6097 |
| 34 | CMS Collaboration | Particle-flow reconstruction and global event description with the CMS detector | JINST 12 (2017) P10003 | CMS-PRF-14-001 1706.04965 |
| 35 | CMS Collaboration | Jet energy scale and resolution in the CMS experiment in pp collisions at 8 TeV | JINST 12 (2017) P02014 | CMS-JME-13-004 1607.03663 |
| 36 | CMS Collaboration | Pileup mitigation at CMS in 13 TeV data | JINST 15 (2020) P09018 | CMS-JME-18-001 2003.00503 |
| 37 | CMS Collaboration | Jet algorithms performance in 13 TeV data | CMS-PAS-JME-16-003 | CMS-PAS-JME-16-003 |
| 38 | CMS Collaboration | Performance of electron reconstruction and selection with the CMS detector in proton-proton collisions at $ \sqrt{s} = $ 8 TeV | JINST 10 (2015) P06005 | CMS-EGM-13-001 1502.02701 |
| 39 | CMS Collaboration | Performance of the CMS muon detector and muon reconstruction with proton-proton collisions at $ \sqrt{s}= $ 13 TeV | JINST 13 (2018) P06015 | CMS-MUO-16-001 1804.04528 |
| 40 | CMS Collaboration | Performance of CMS muon reconstruction in $ pp $ collision events at $ \sqrt{s}= $ 7 TeV | JINST 7 (2012) P10002 | CMS-MUO-10-004 1206.4071 |
| 41 | G. P. Salam | Towards jetography | EPJC 67 (2010) 637 | 0906.1833 |
| 42 | M. Dasgupta, A. Fregoso, S. Marzani, and G. P. Salam | Towards an understanding of jet substructure | JHEP 09 (2013) 029 | 1307.0007 |
| 43 | A. J. Larkoski, S. Marzani, G. Soyez, and J. Thaler | Soft drop | JHEP 05 (2014) 146 | 1402.2657 |
| 44 | C. Brust et al. | Identifying boosted new physics with non-isolated leptons | JHEP 04 (2015) 079 | 1410.0362 |
| 45 | CMS Collaboration | Measurements of differential Z boson production cross sections in proton-proton collisions at $ \sqrt{s} = $ 13 TeV | JHEP 12 (2019) 061 | CMS-SMP-17-010 1909.04133 |
| 46 | J. M. Lindert et al. | Precise predictions for $ V+ $ jets dark matter backgrounds | EPJC 77 (2017) 829 | 1705.04664 |
| 47 | CMS Collaboration | CMS luminosity measurements for the 2016 data taking period | CMS-PAS-LUM-17-001 | CMS-PAS-LUM-17-001 |
| 48 | CMS Collaboration | CMS luminosity measurement for the 2017 data-taking period at $ \sqrt{s} = $ 13 TeV | CMS-PAS-LUM-17-004 | CMS-PAS-LUM-17-004 |
| 49 | CMS Collaboration | CMS luminosity measurement for the 2018 data taking period at $ \sqrt{s} = $ 13 TeV | CMS-PAS-LUM-18-002 | CMS-PAS-LUM-18-002 |
| 50 | J. Butterworth et al. | PDF4LHC recommendations for LHC Run II | JPG 43 (2016) 023001 | 1510.03865 |
| 51 | G. Cowan, K. Cranmer, E. Gross, and O. Vitells | Asymptotic formulae for likelihood-based tests of new physics | EPJC 71 (2011) 1554 | 1007.1727 |
| 52 | A. L. Read | Presentation of search results: the CLs technique | Journal of Physics G: Nuclear and Particle Physics 28 (2002) 2693 | |
| 53 | T. Junk | Confidence level computation for combining searches with small statistics | NIMA 434 (1999) 435 | hep-ex/9902006 |
| 54 | E. Gross and O. Vitells | Trial factors for the look elsewhere effect in high energy physics | The European Physical Journal C 70 (2010) 525 | 1005.1891 |
|
|
Compact Muon Solenoid LHC, CERN |
|

|

|

|

|

|