

Compact Muon Solenoid
LHC, CERN
| CMS-PAS-B2G-20-003 | ||
| Search for new particles in an extended Higgs sector in the four b quark final state at $\sqrt{s}= $ 13 TeV | ||
| CMS Collaboration | ||
| July 2021 | ||
| Abstract: A search for new particles in an extended Higgs sector, characterized by a massive resonance $X$ decaying to a pair of scalar bosons $a$, which themselves decay to pairs of b quarks, is presented. The analysis is restricted to the mass ranges $m_a$ from 25 to 100 GeV and $m_X$ from 1 to 3 TeV. For these mass ranges, the decay products of each $a$ are expected to merge into a single large radius jet. Jet substructure and flavor identification techniques are used to identify these jets from background jets. The search is based on LHC proton-proton collision data at $\sqrt{s}= $ 13 TeV, collected with the CMS detector in 2016-2018, corresponding to an integrated luminosity of 138 fb$^{-1}$. Model-specific limits at 95% confidence level on the production cross section times branching fraction as a function of mass for $X\rightarrow aa\rightarrow (\mathrm{b}\bar{\mathrm{b}})(\mathrm{b}\bar{\mathrm{b}})$ are set, where both the $X \rightarrow a a $ and $ a \rightarrow \mathrm{b}\bar{\mathrm{b}}$ branching fractions are assumed to be 100%. These are the first such limits on this process, and range between 1 and 30 fb for the considered mass ranges. | ||
|
Links:
CDS record (PDF) ;
Physics Briefing ;
CADI line (restricted) ;
These preliminary results are superseded in this paper, PLB 835 (2022) 137566. The superseded preliminary plots can be found here. |
||
| Figures & Tables | Summary | Additional Figures | References | CMS Publications |
|---|
| Figures | |
png pdf |
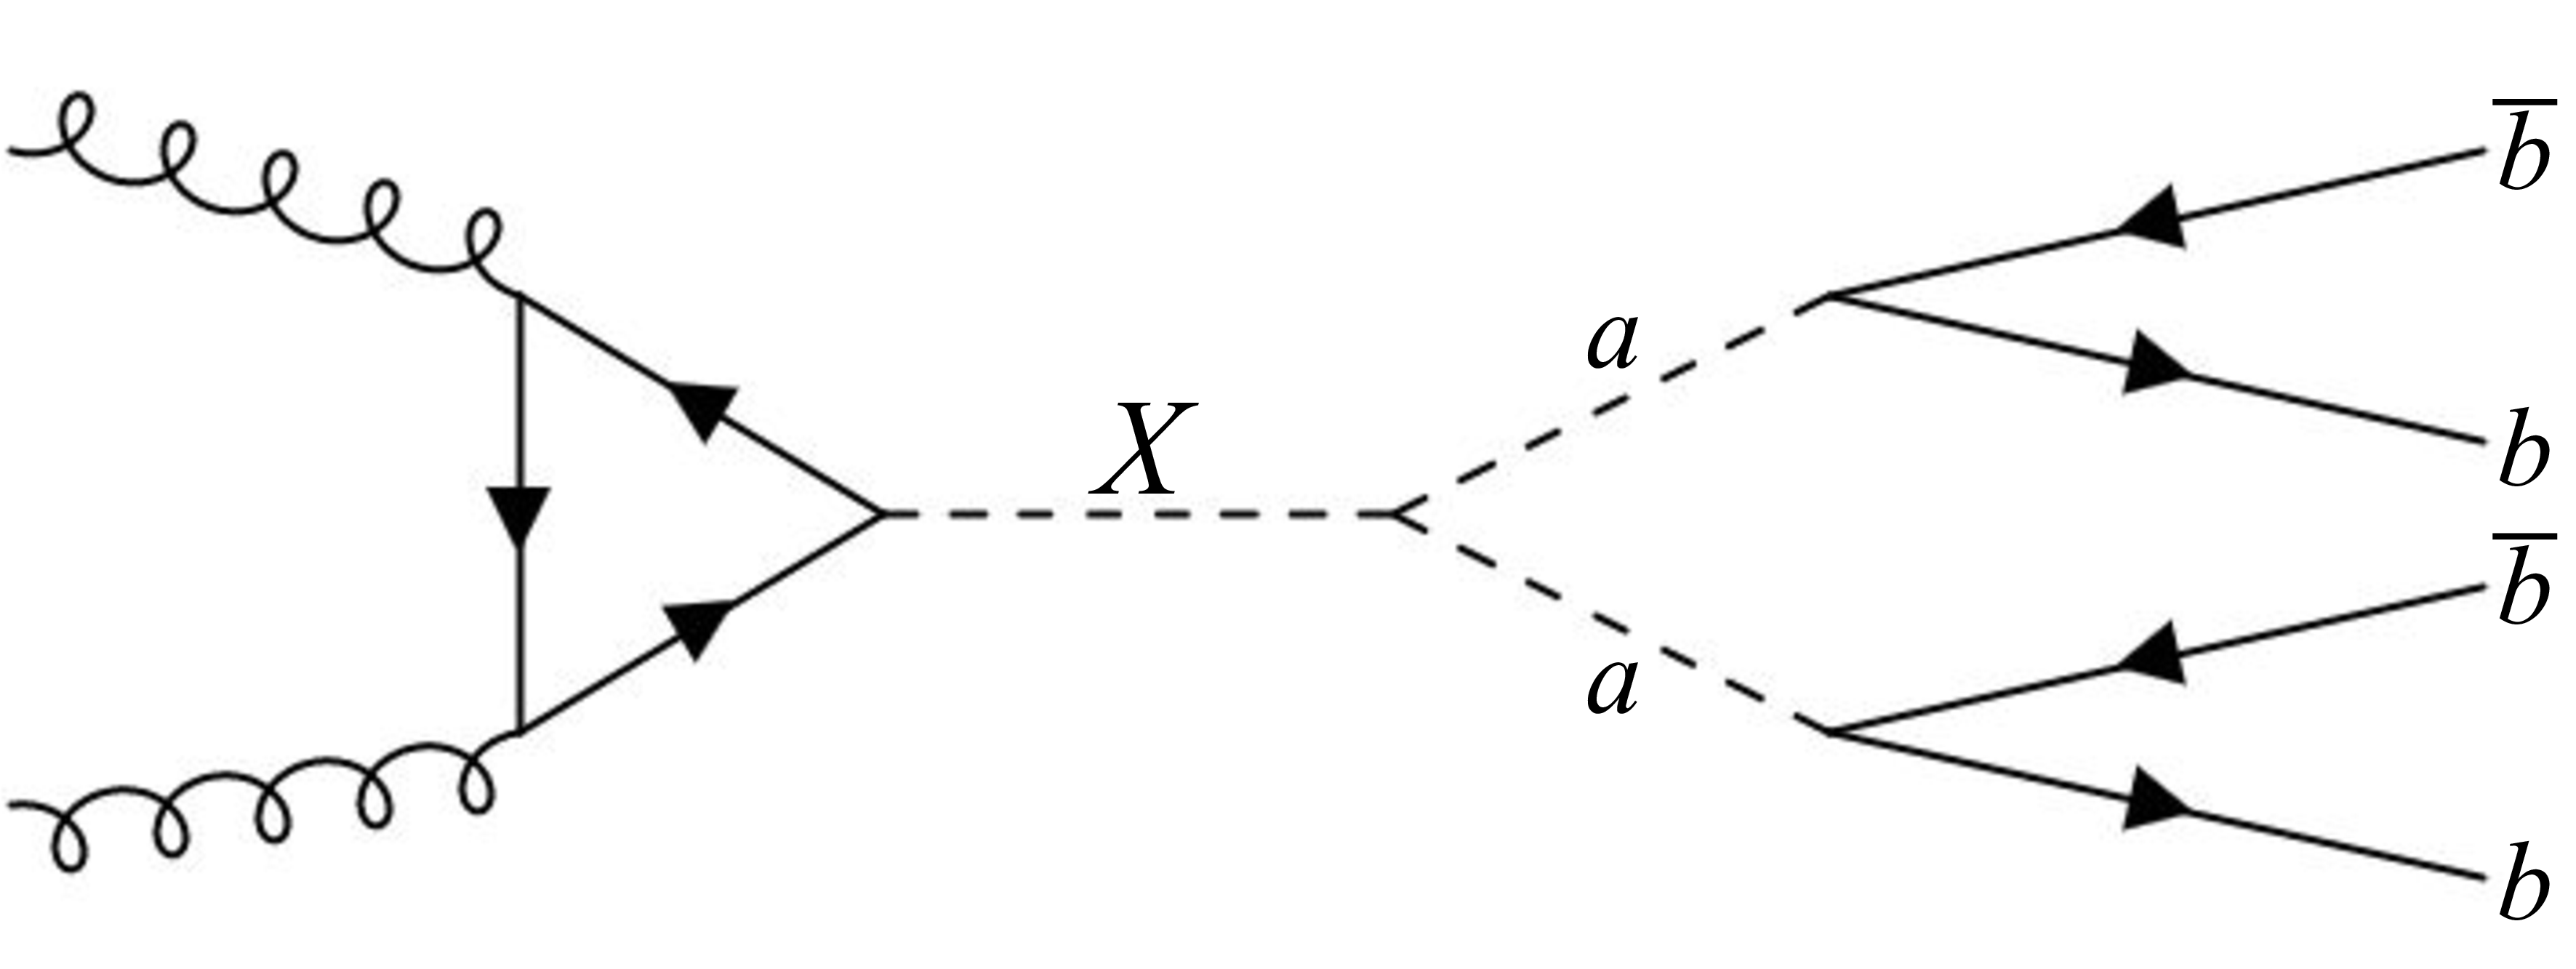
Figure 1:
Feynman diagram of the benchmark signal production and decay of $X \rightarrow aa \rightarrow (\mathrm{b} \mathrm{\bar{b}})(\mathrm{b} \mathrm{\bar{b}})$. The dominant production mechanism occurs via a fermion loop as shown in the diagram. Additional partons are possible from either initial state or final state radiation. |
png pdf |
Figure 2:
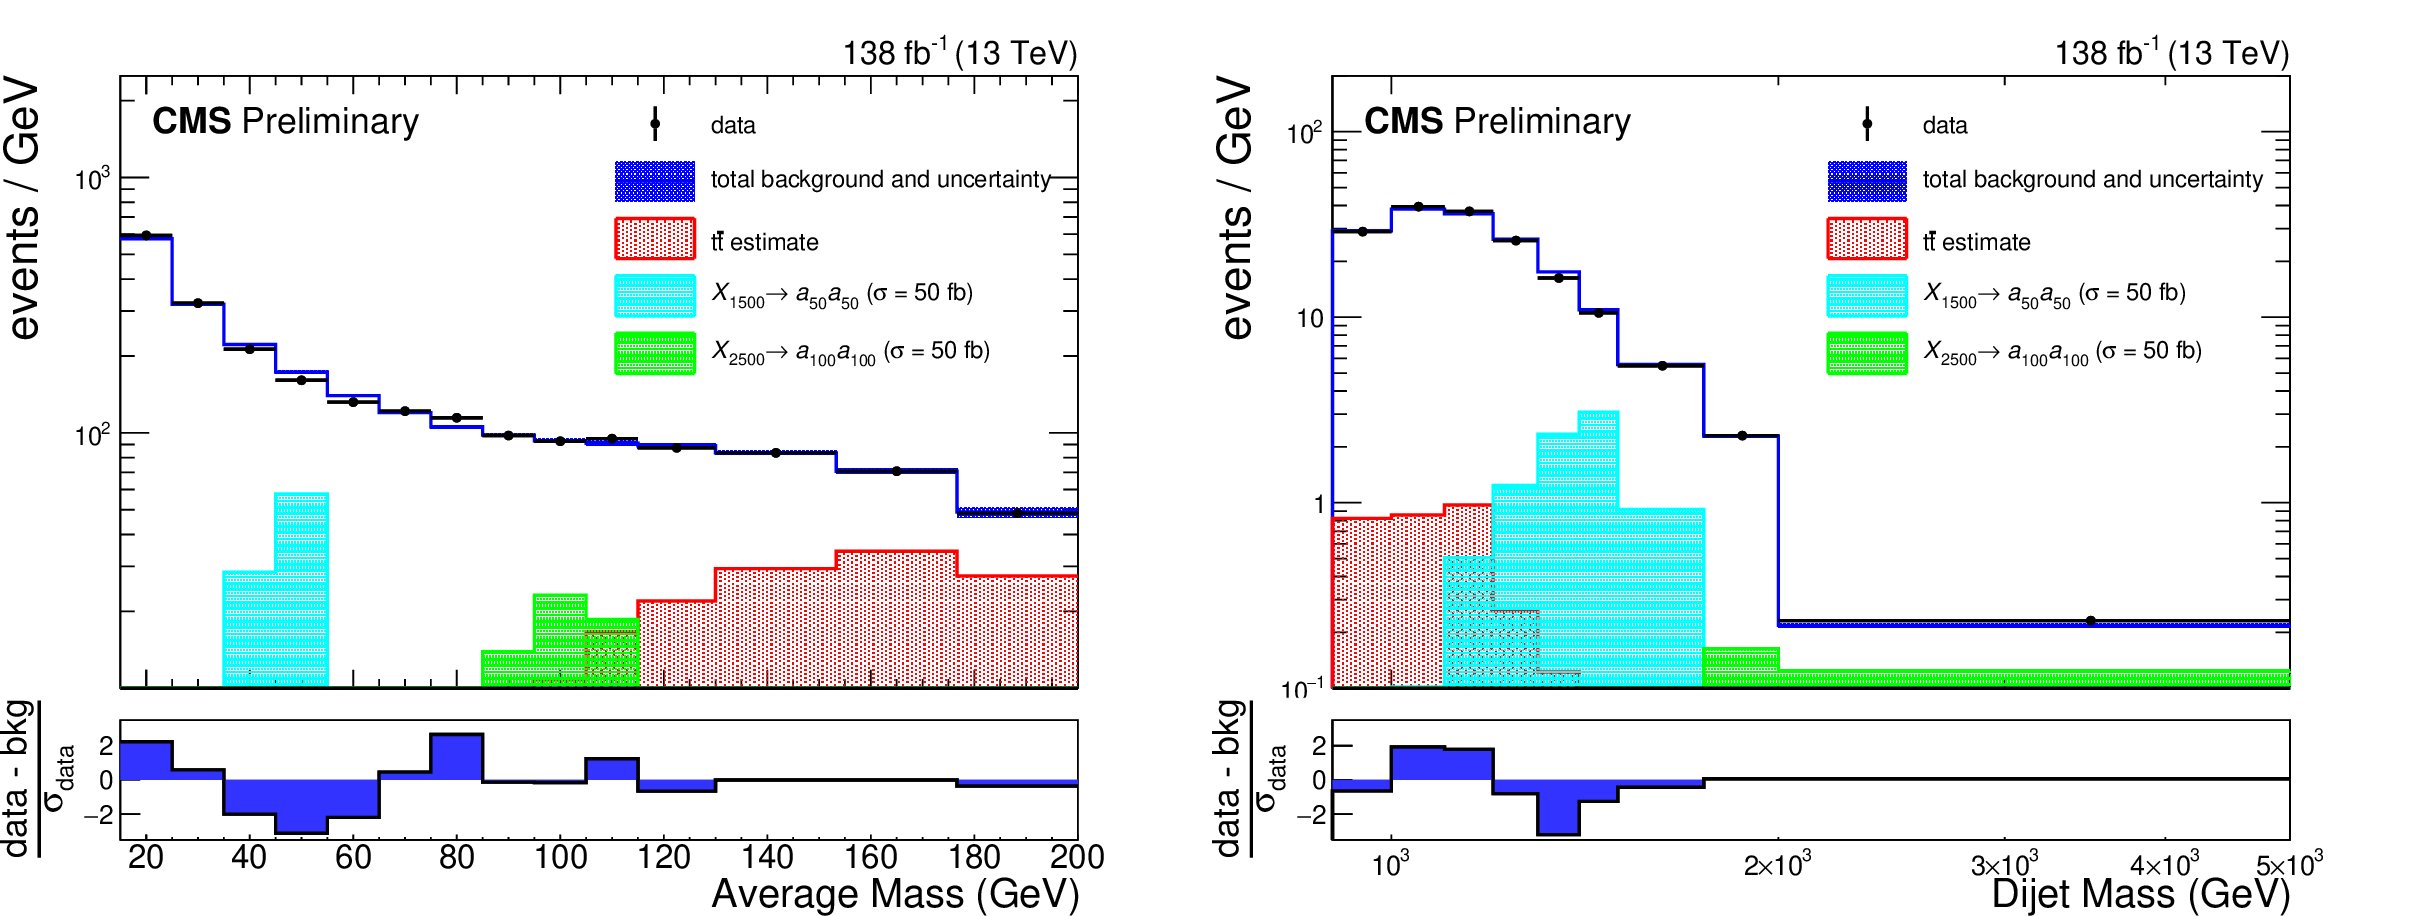
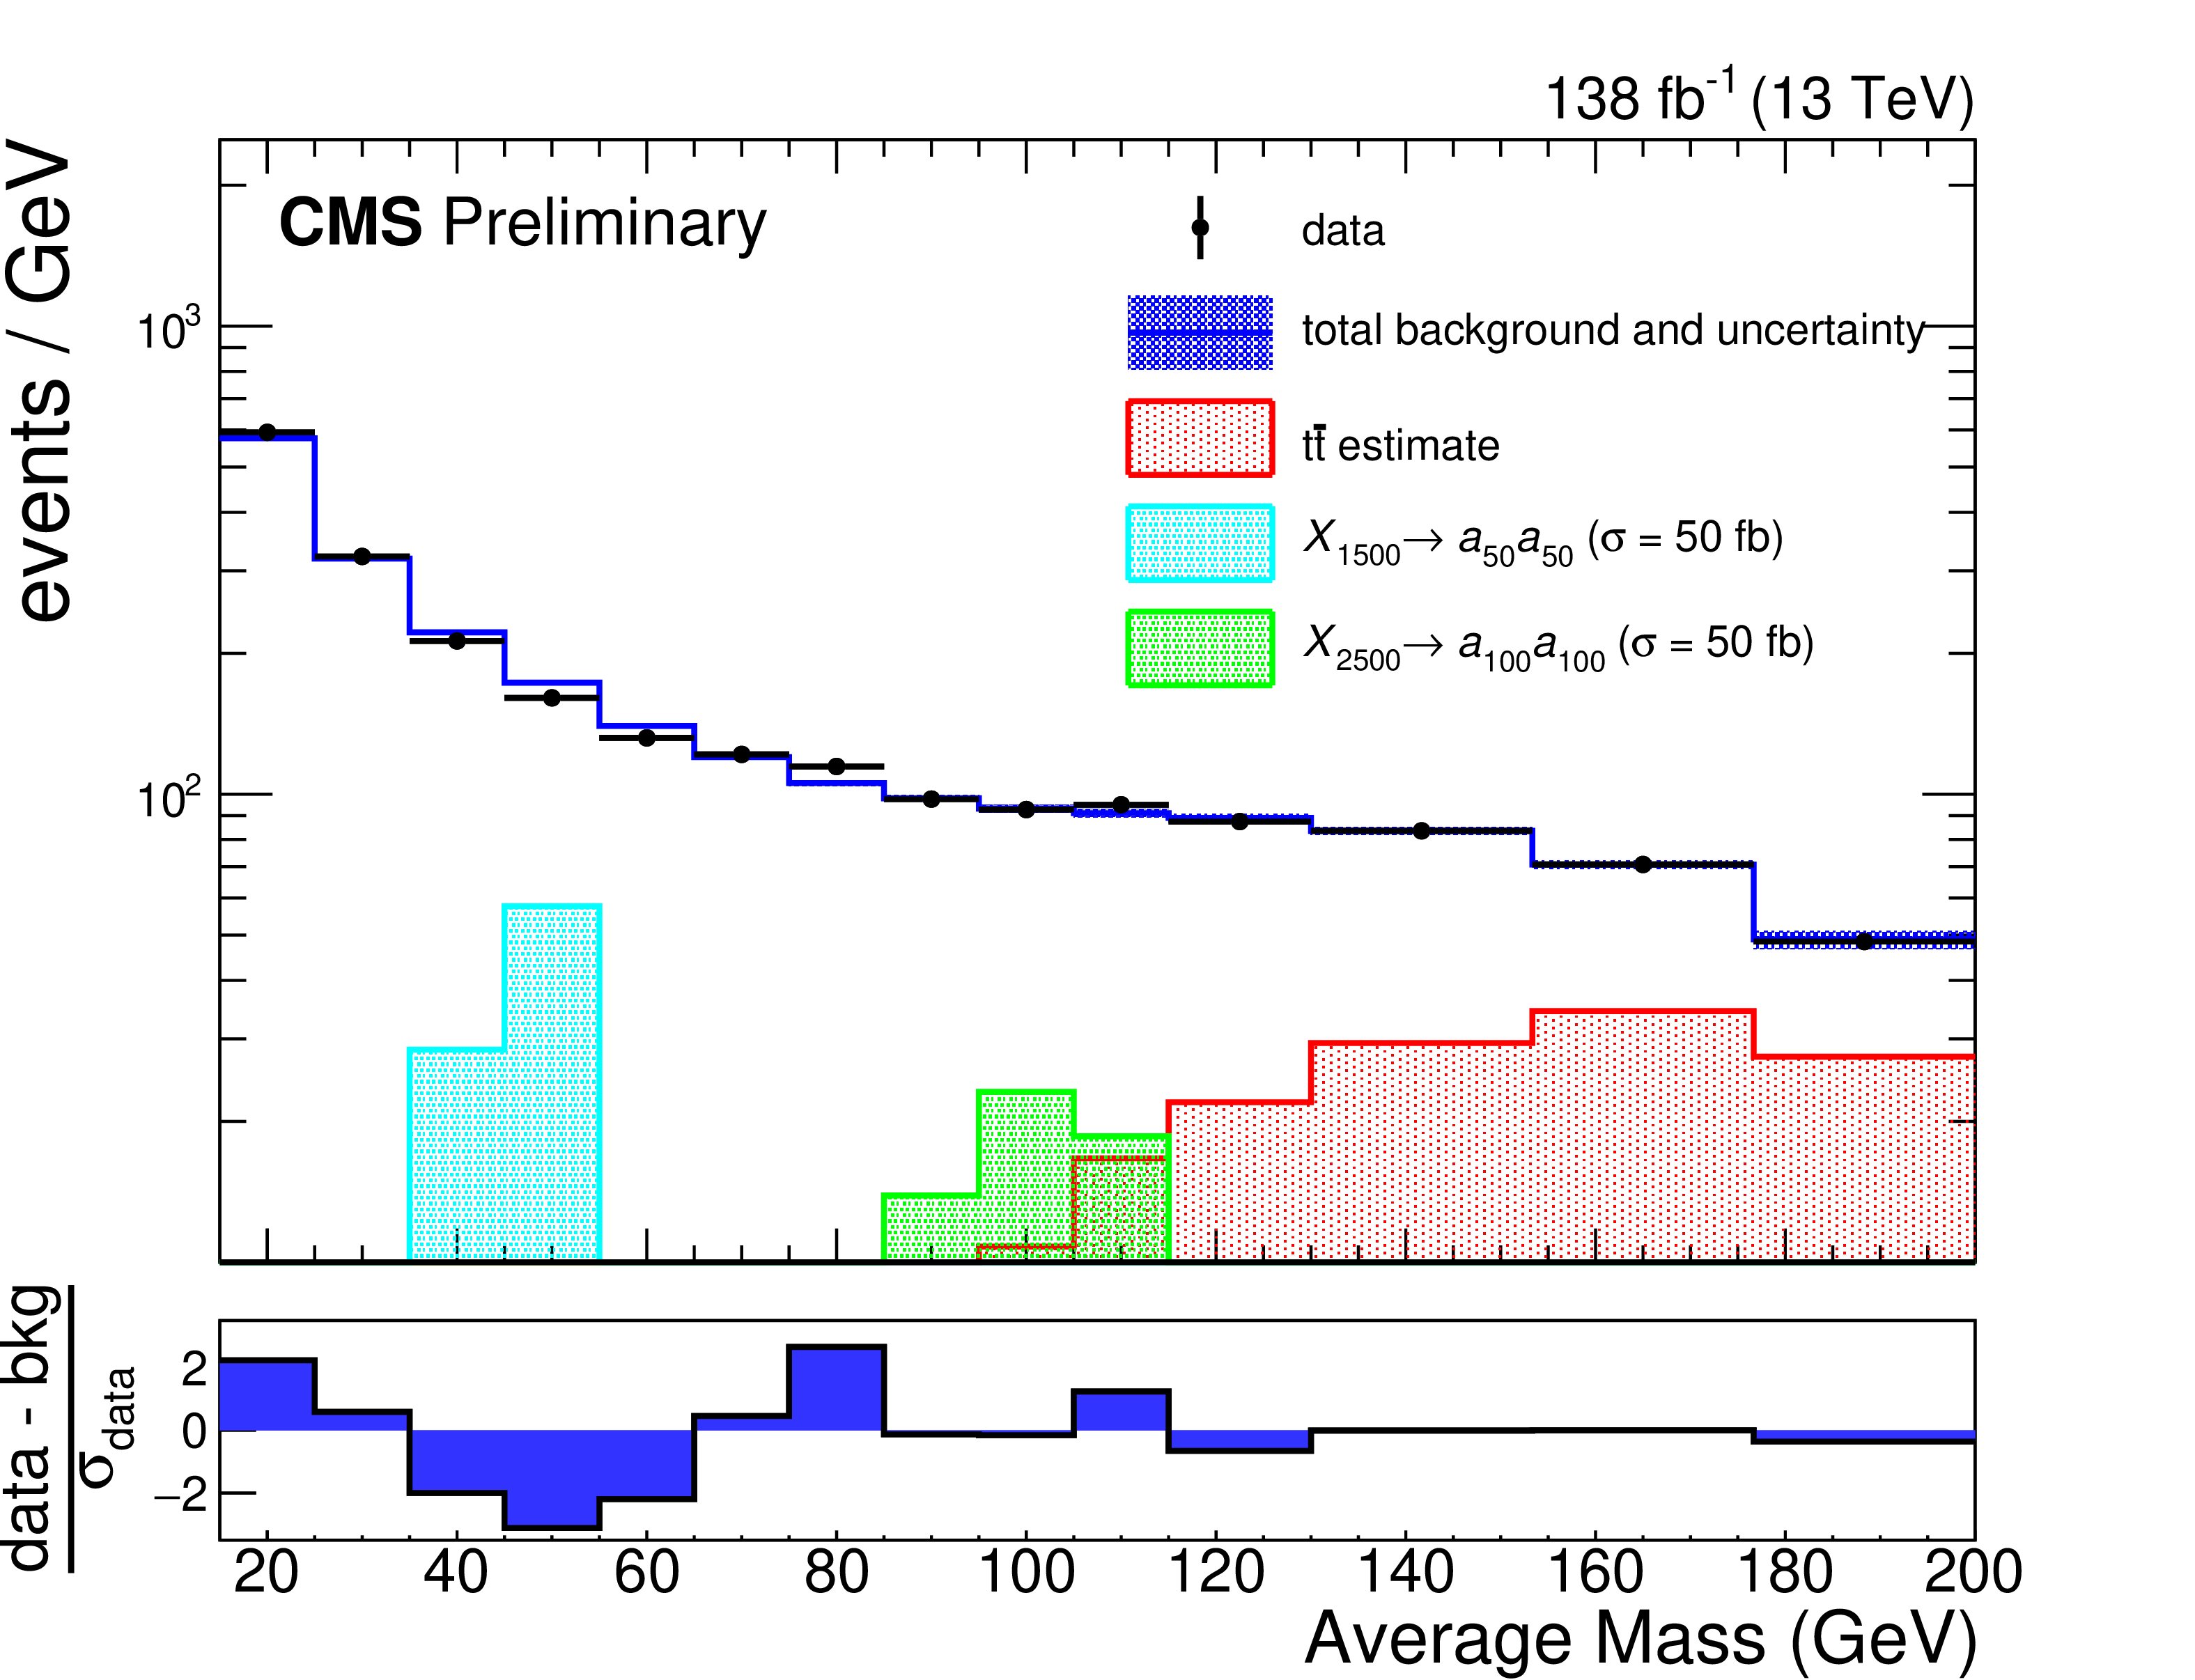
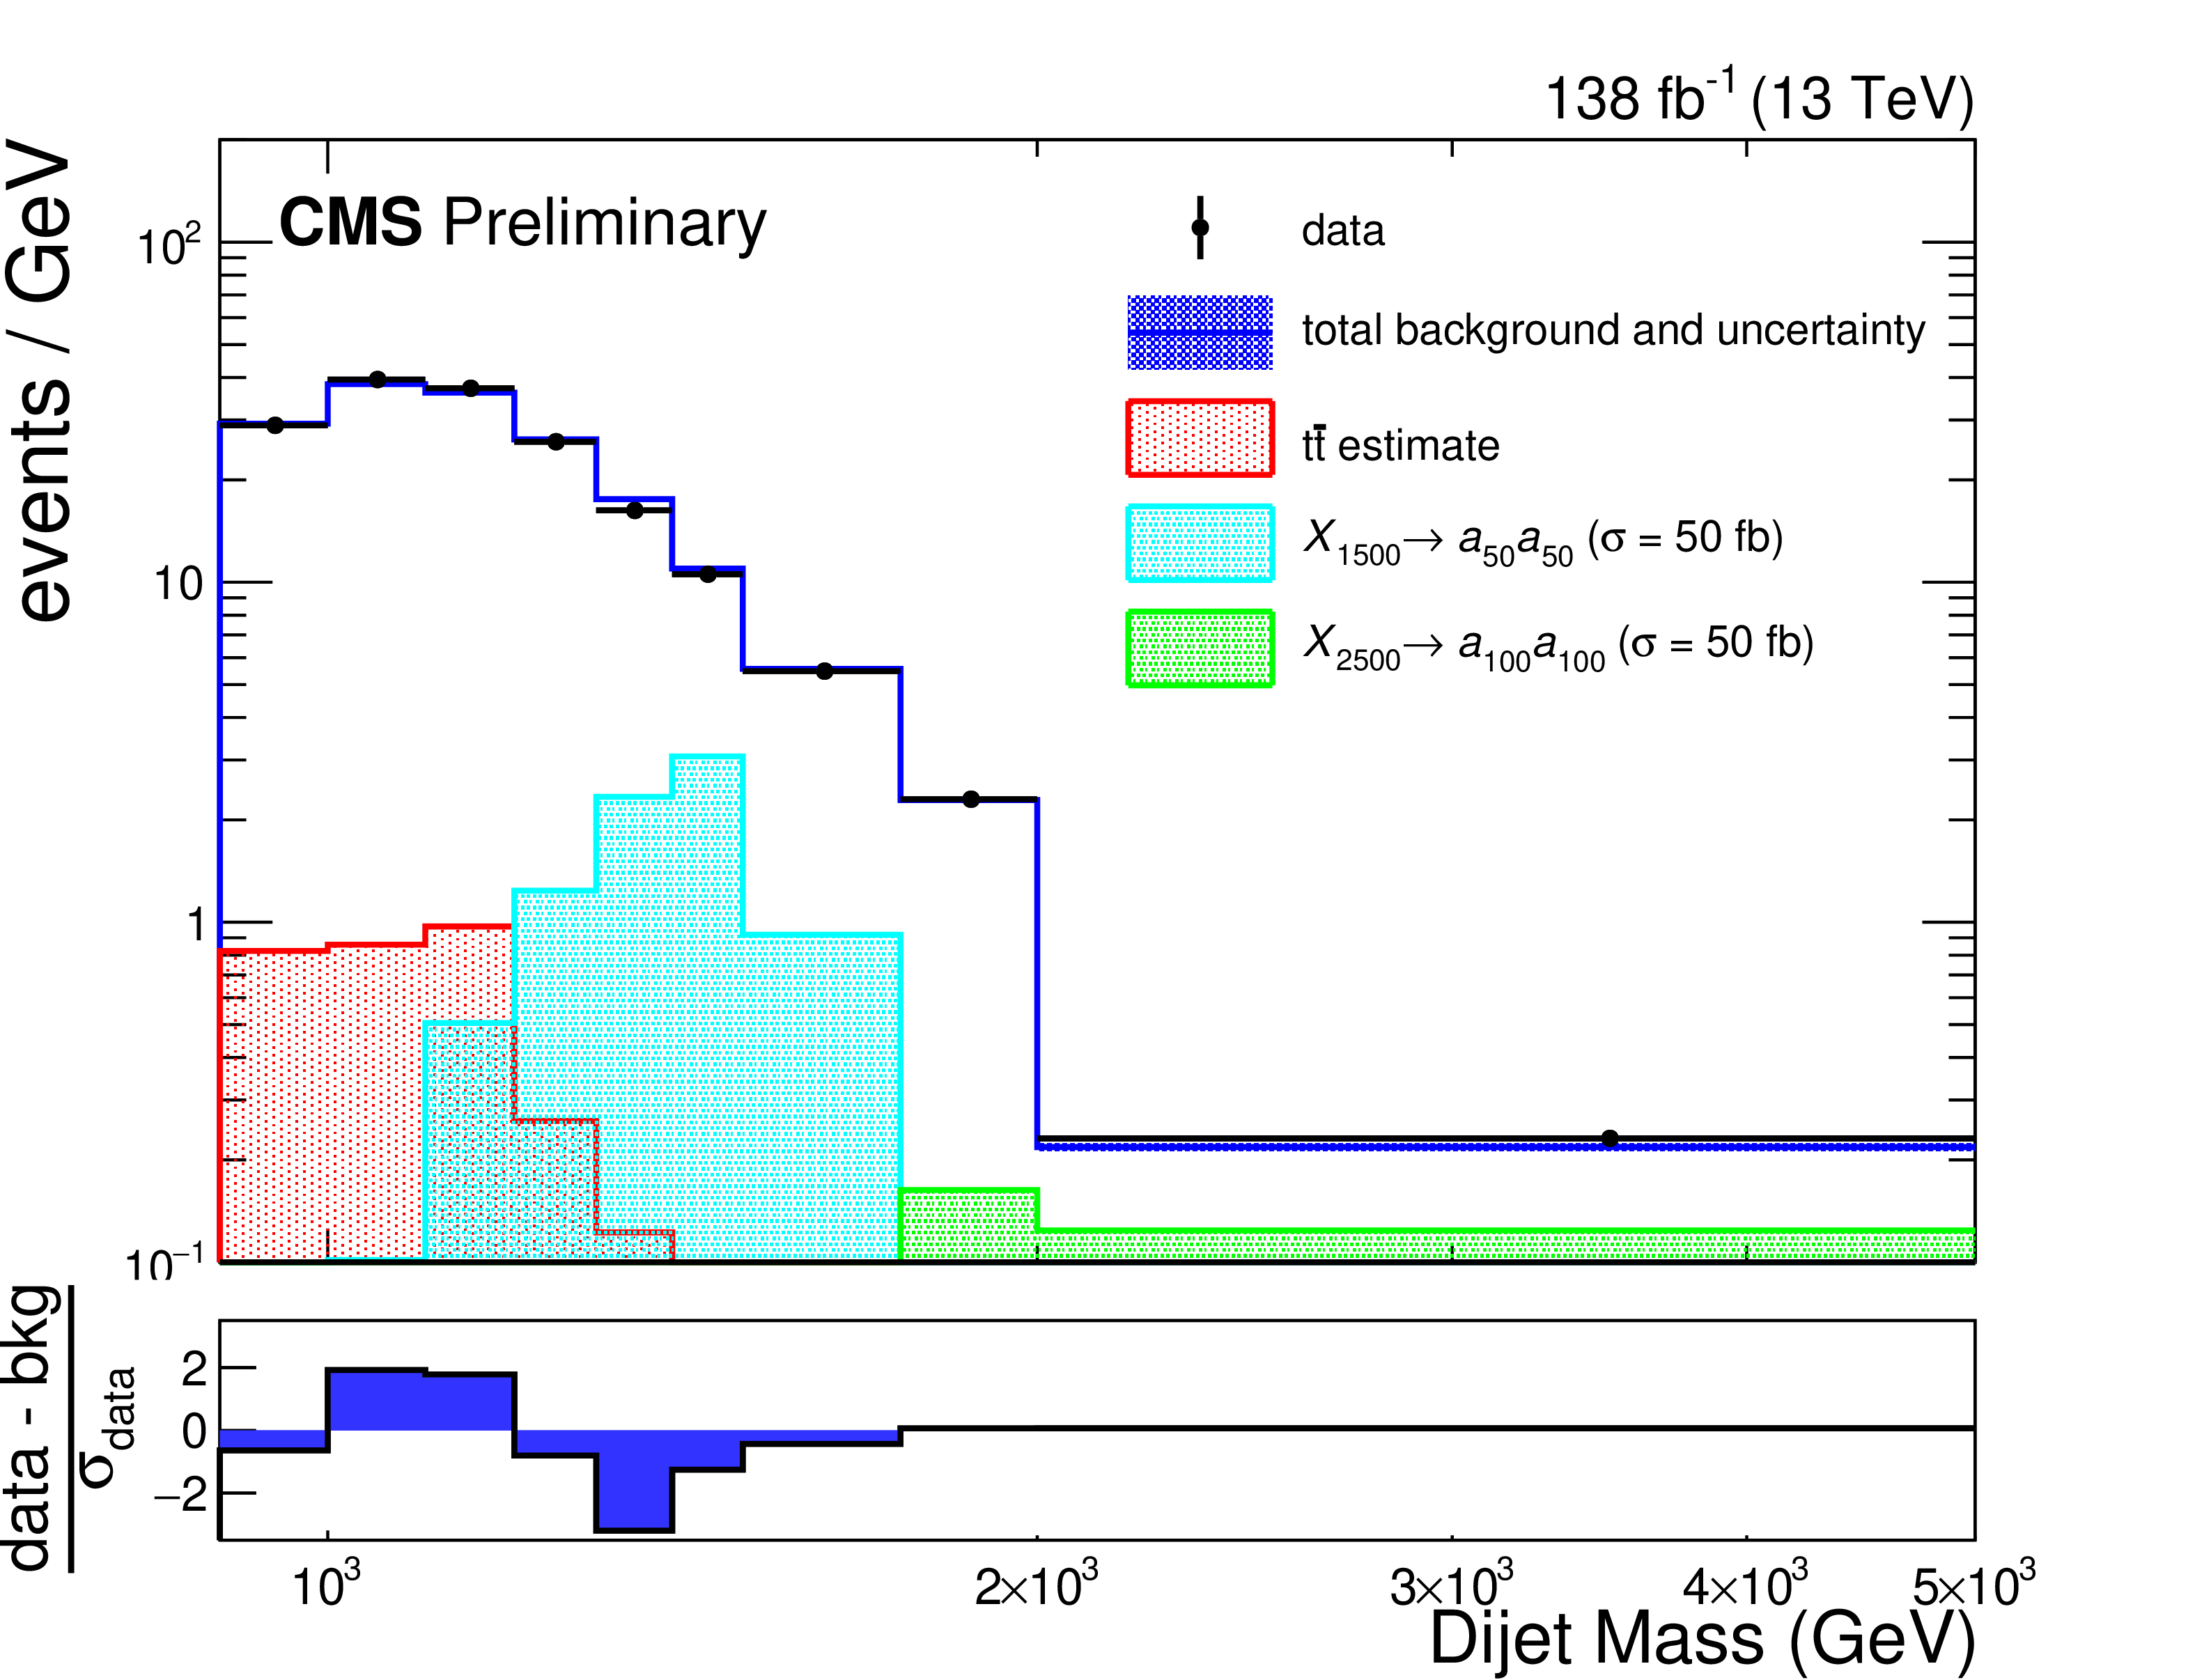
The average jet mass (left) and dijet mass (right) distributions and background estimate of the combined search regions after the final fit is performed. The shaded areas around the background estimate in the top panels represent the total uncertainty on the background estimate in that bin. The bottom panel shows the difference between the observed data and the background prediction, divided by the statistical uncertainty of the data in each bin. |
png pdf |
Figure 2-a:
The average jet mass distribution and background estimate of the combined search regions after the final fit is performed. The shaded areas around the background estimate in the top panel represents the total uncertainty on the background estimate in that bin. The bottom panel shows the difference between the observed data and the background prediction, divided by the statistical uncertainty of the data in each bin. |
png pdf |
Figure 2-b:
The average dijet mass distribution and background estimate of the combined search regions after the final fit is performed. The shaded areas around the background estimate in the top panel represents the total uncertainty on the background estimate in that bin. The bottom panel shows the difference between the observed data and the background prediction, divided by the statistical uncertainty of the data in each bin. |
png pdf |
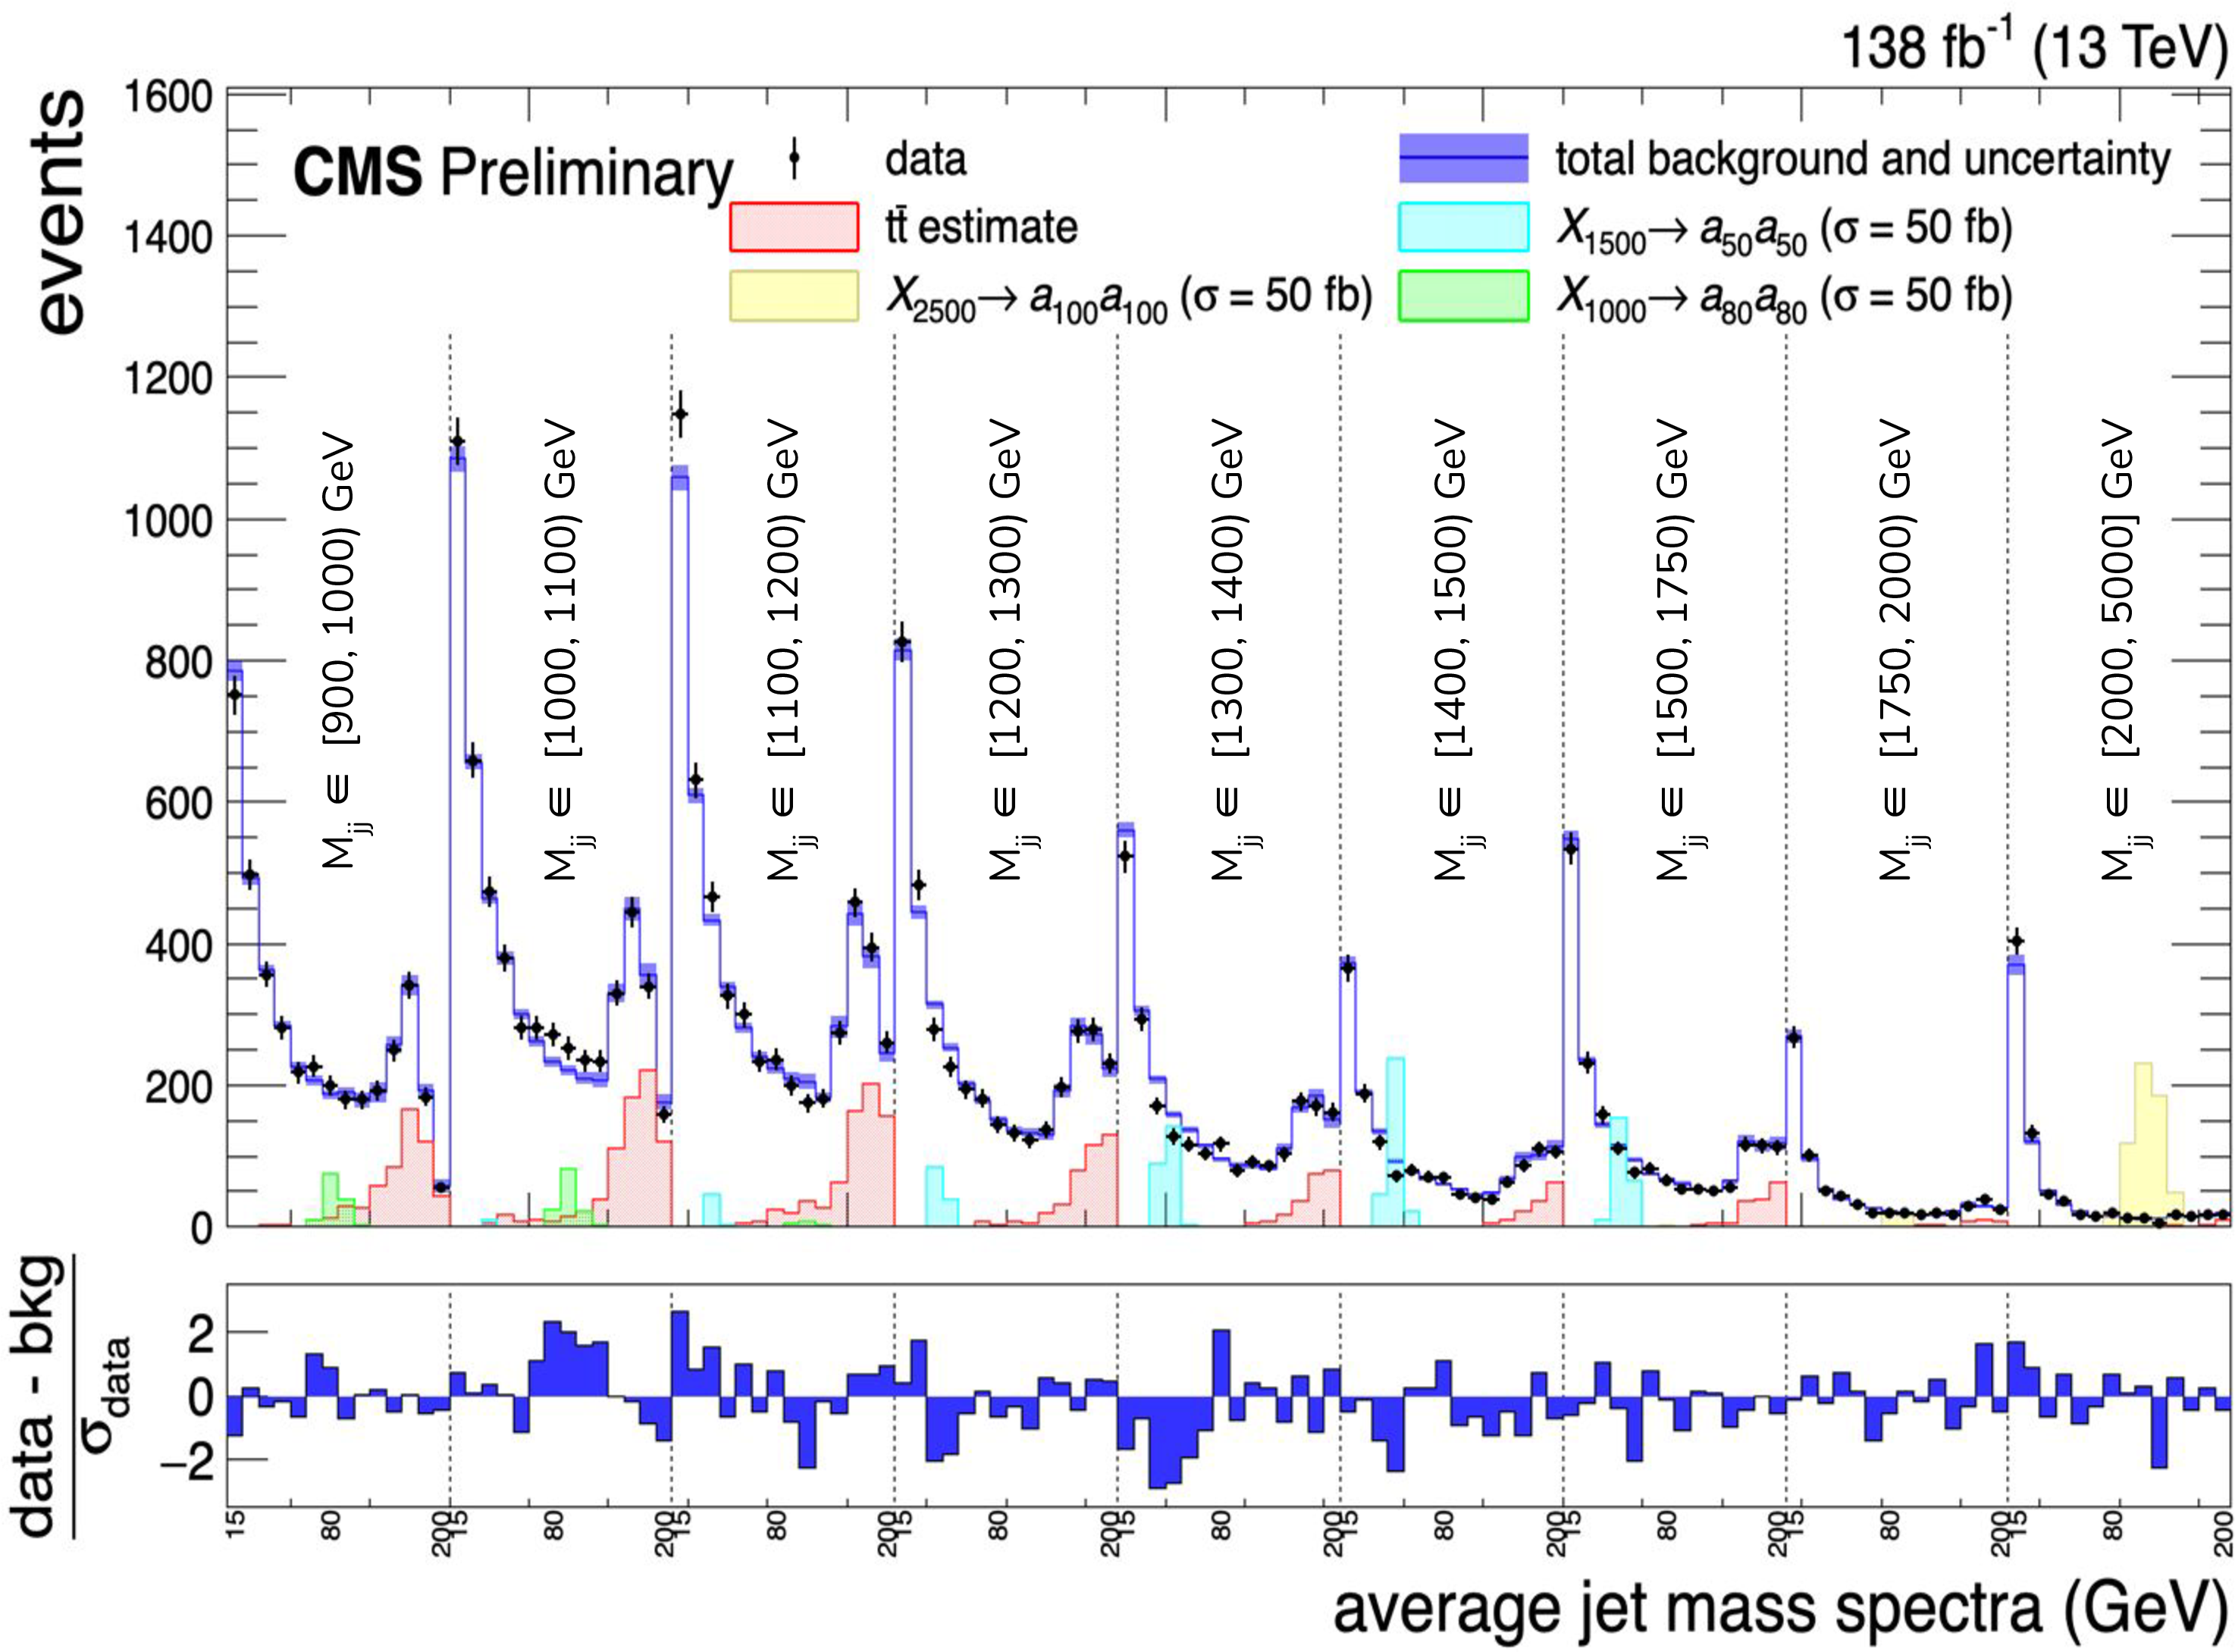
Figure 3:
The unrolled average jet mass distributions in consecutive dijet mass intervals. The vertical dashed grey lines separate the average jet mass distributions in each bin of dijet mass. The individual bins within such subdivisions correspond to the average jet mass spectrum (from 15 to 200 GeV), as seen in Fig. xxxxx (left). Representative signal shapes are also shown; note that they peak in the average jet mass spectrum within subdivisions, and may appear in multiple dijet mass bins. The shaded areas around the background estimate in the top panel represents the total uncertainty on the background estimate in that bin. The bottom panel shows the difference between the observed data and the background prediction, divided by the statistical uncertainty of the data in each bin. |
png pdf |
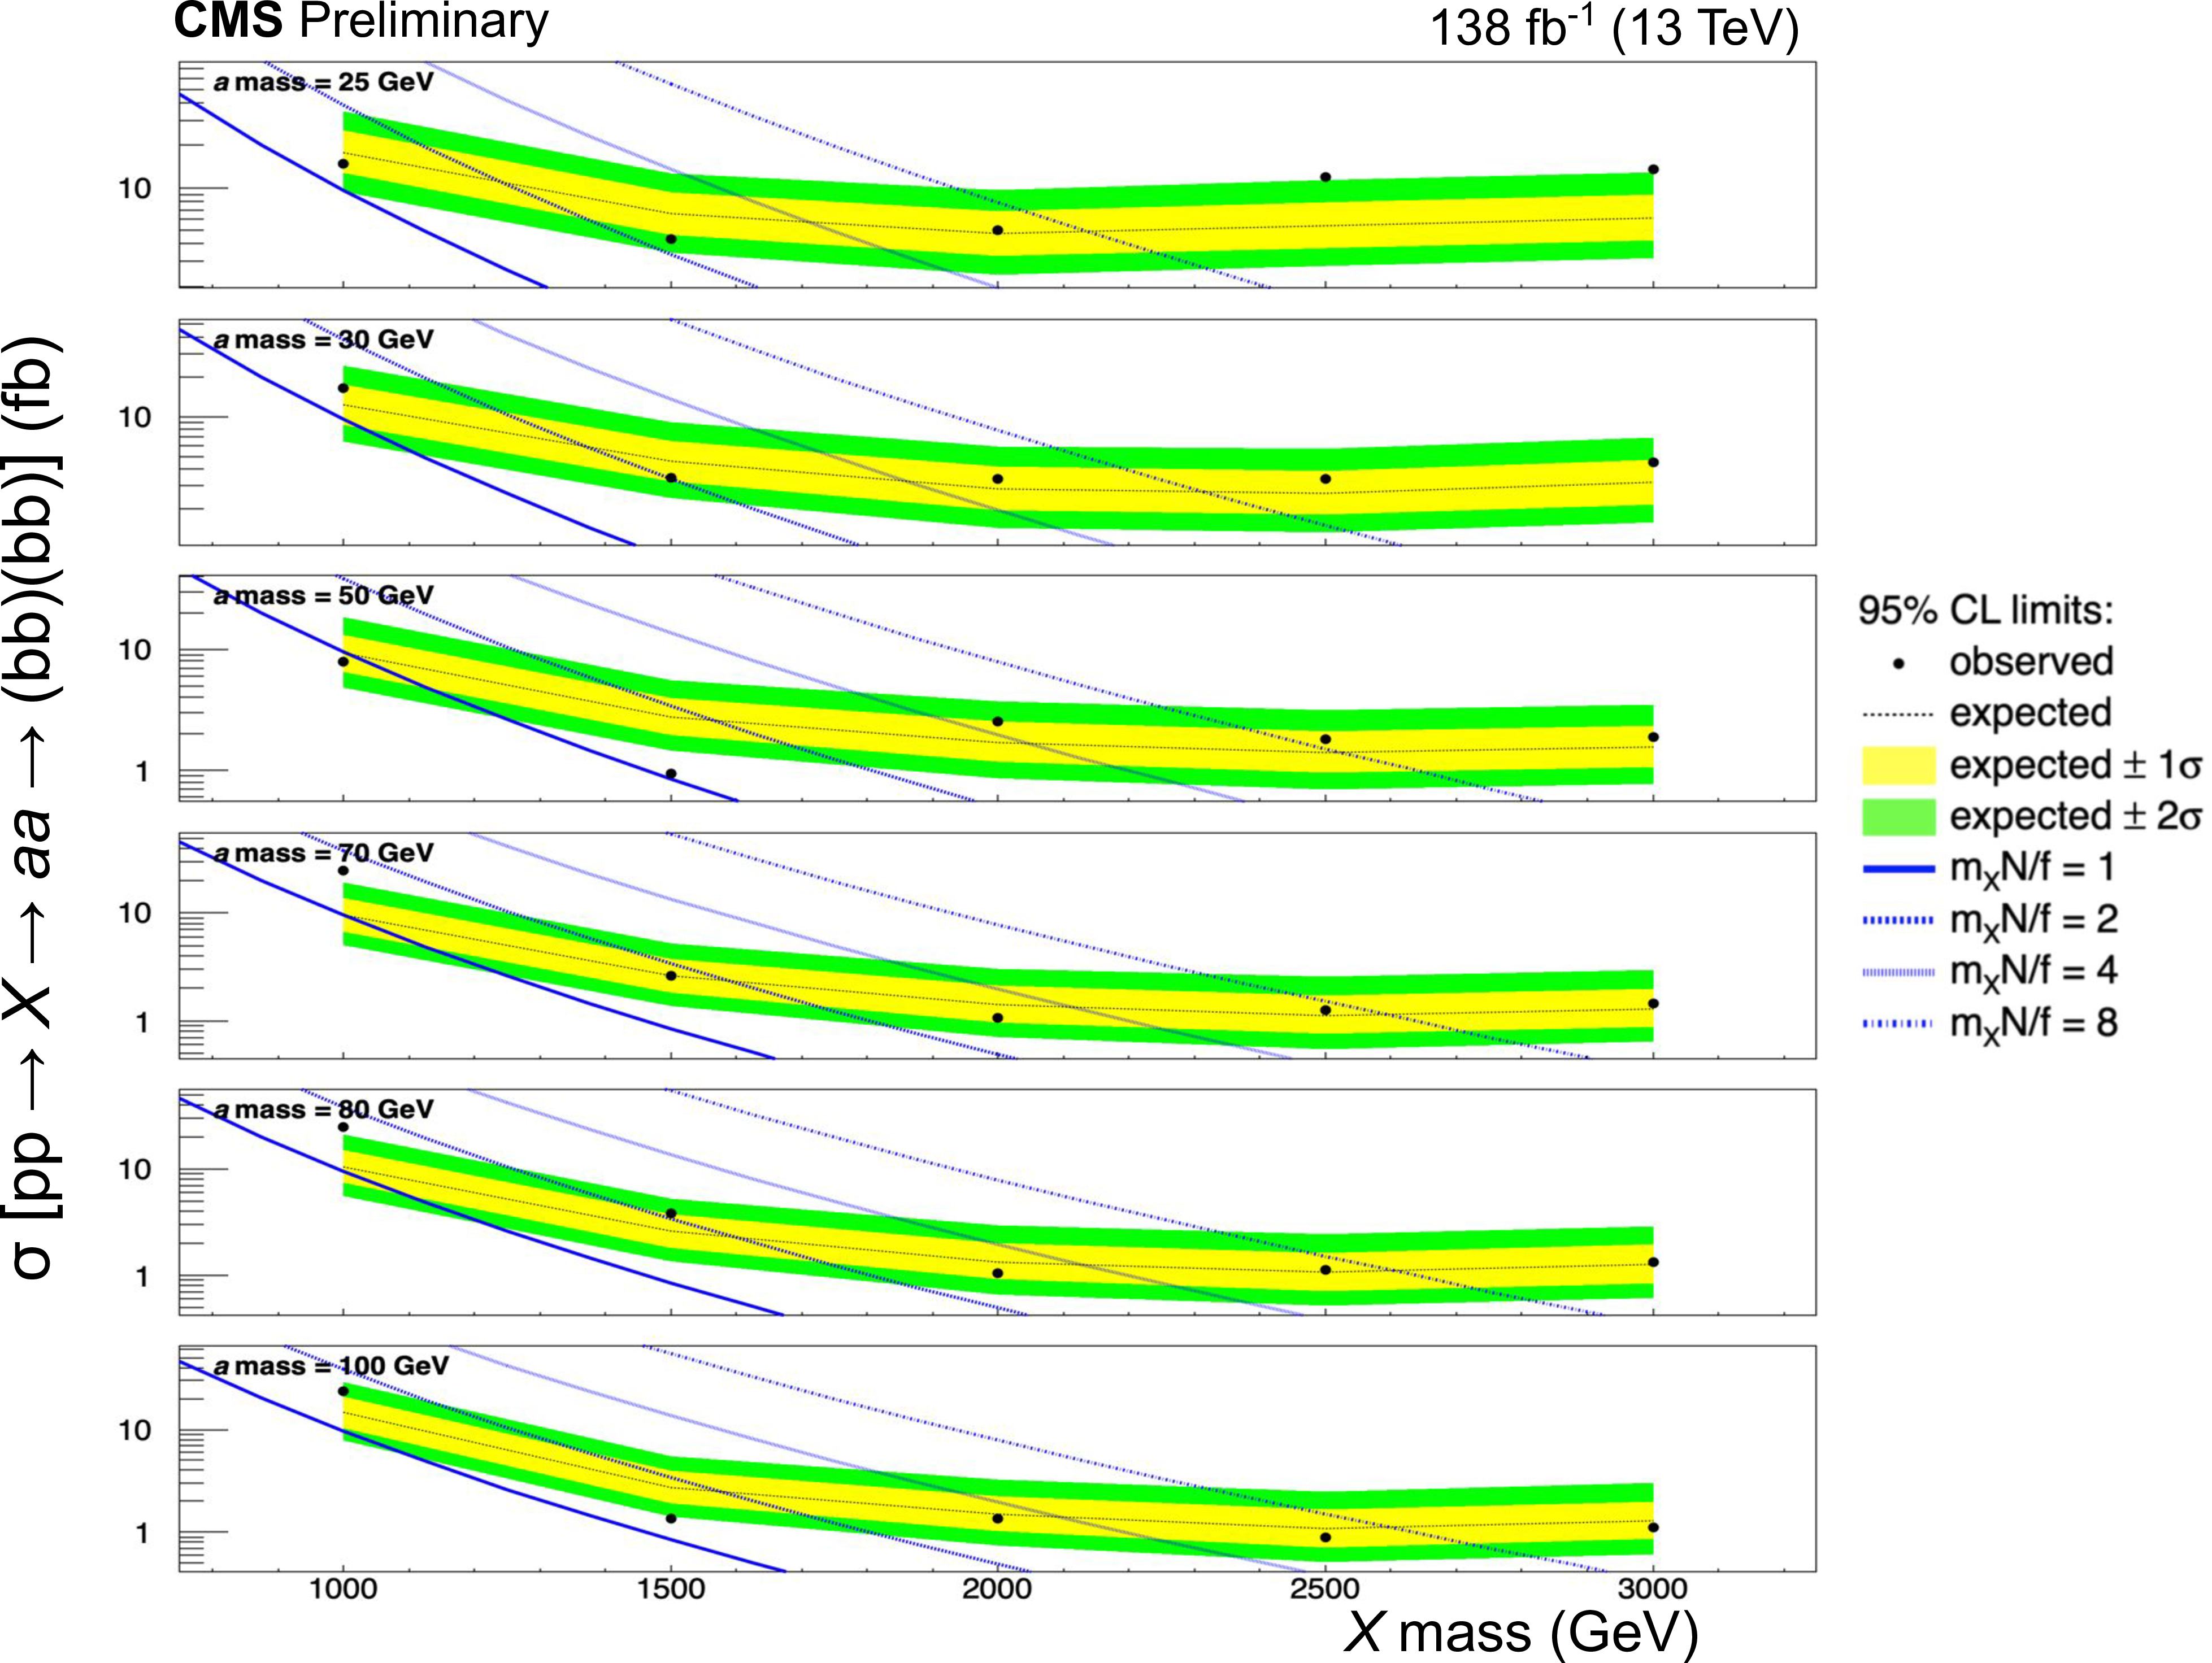
Figure 4:
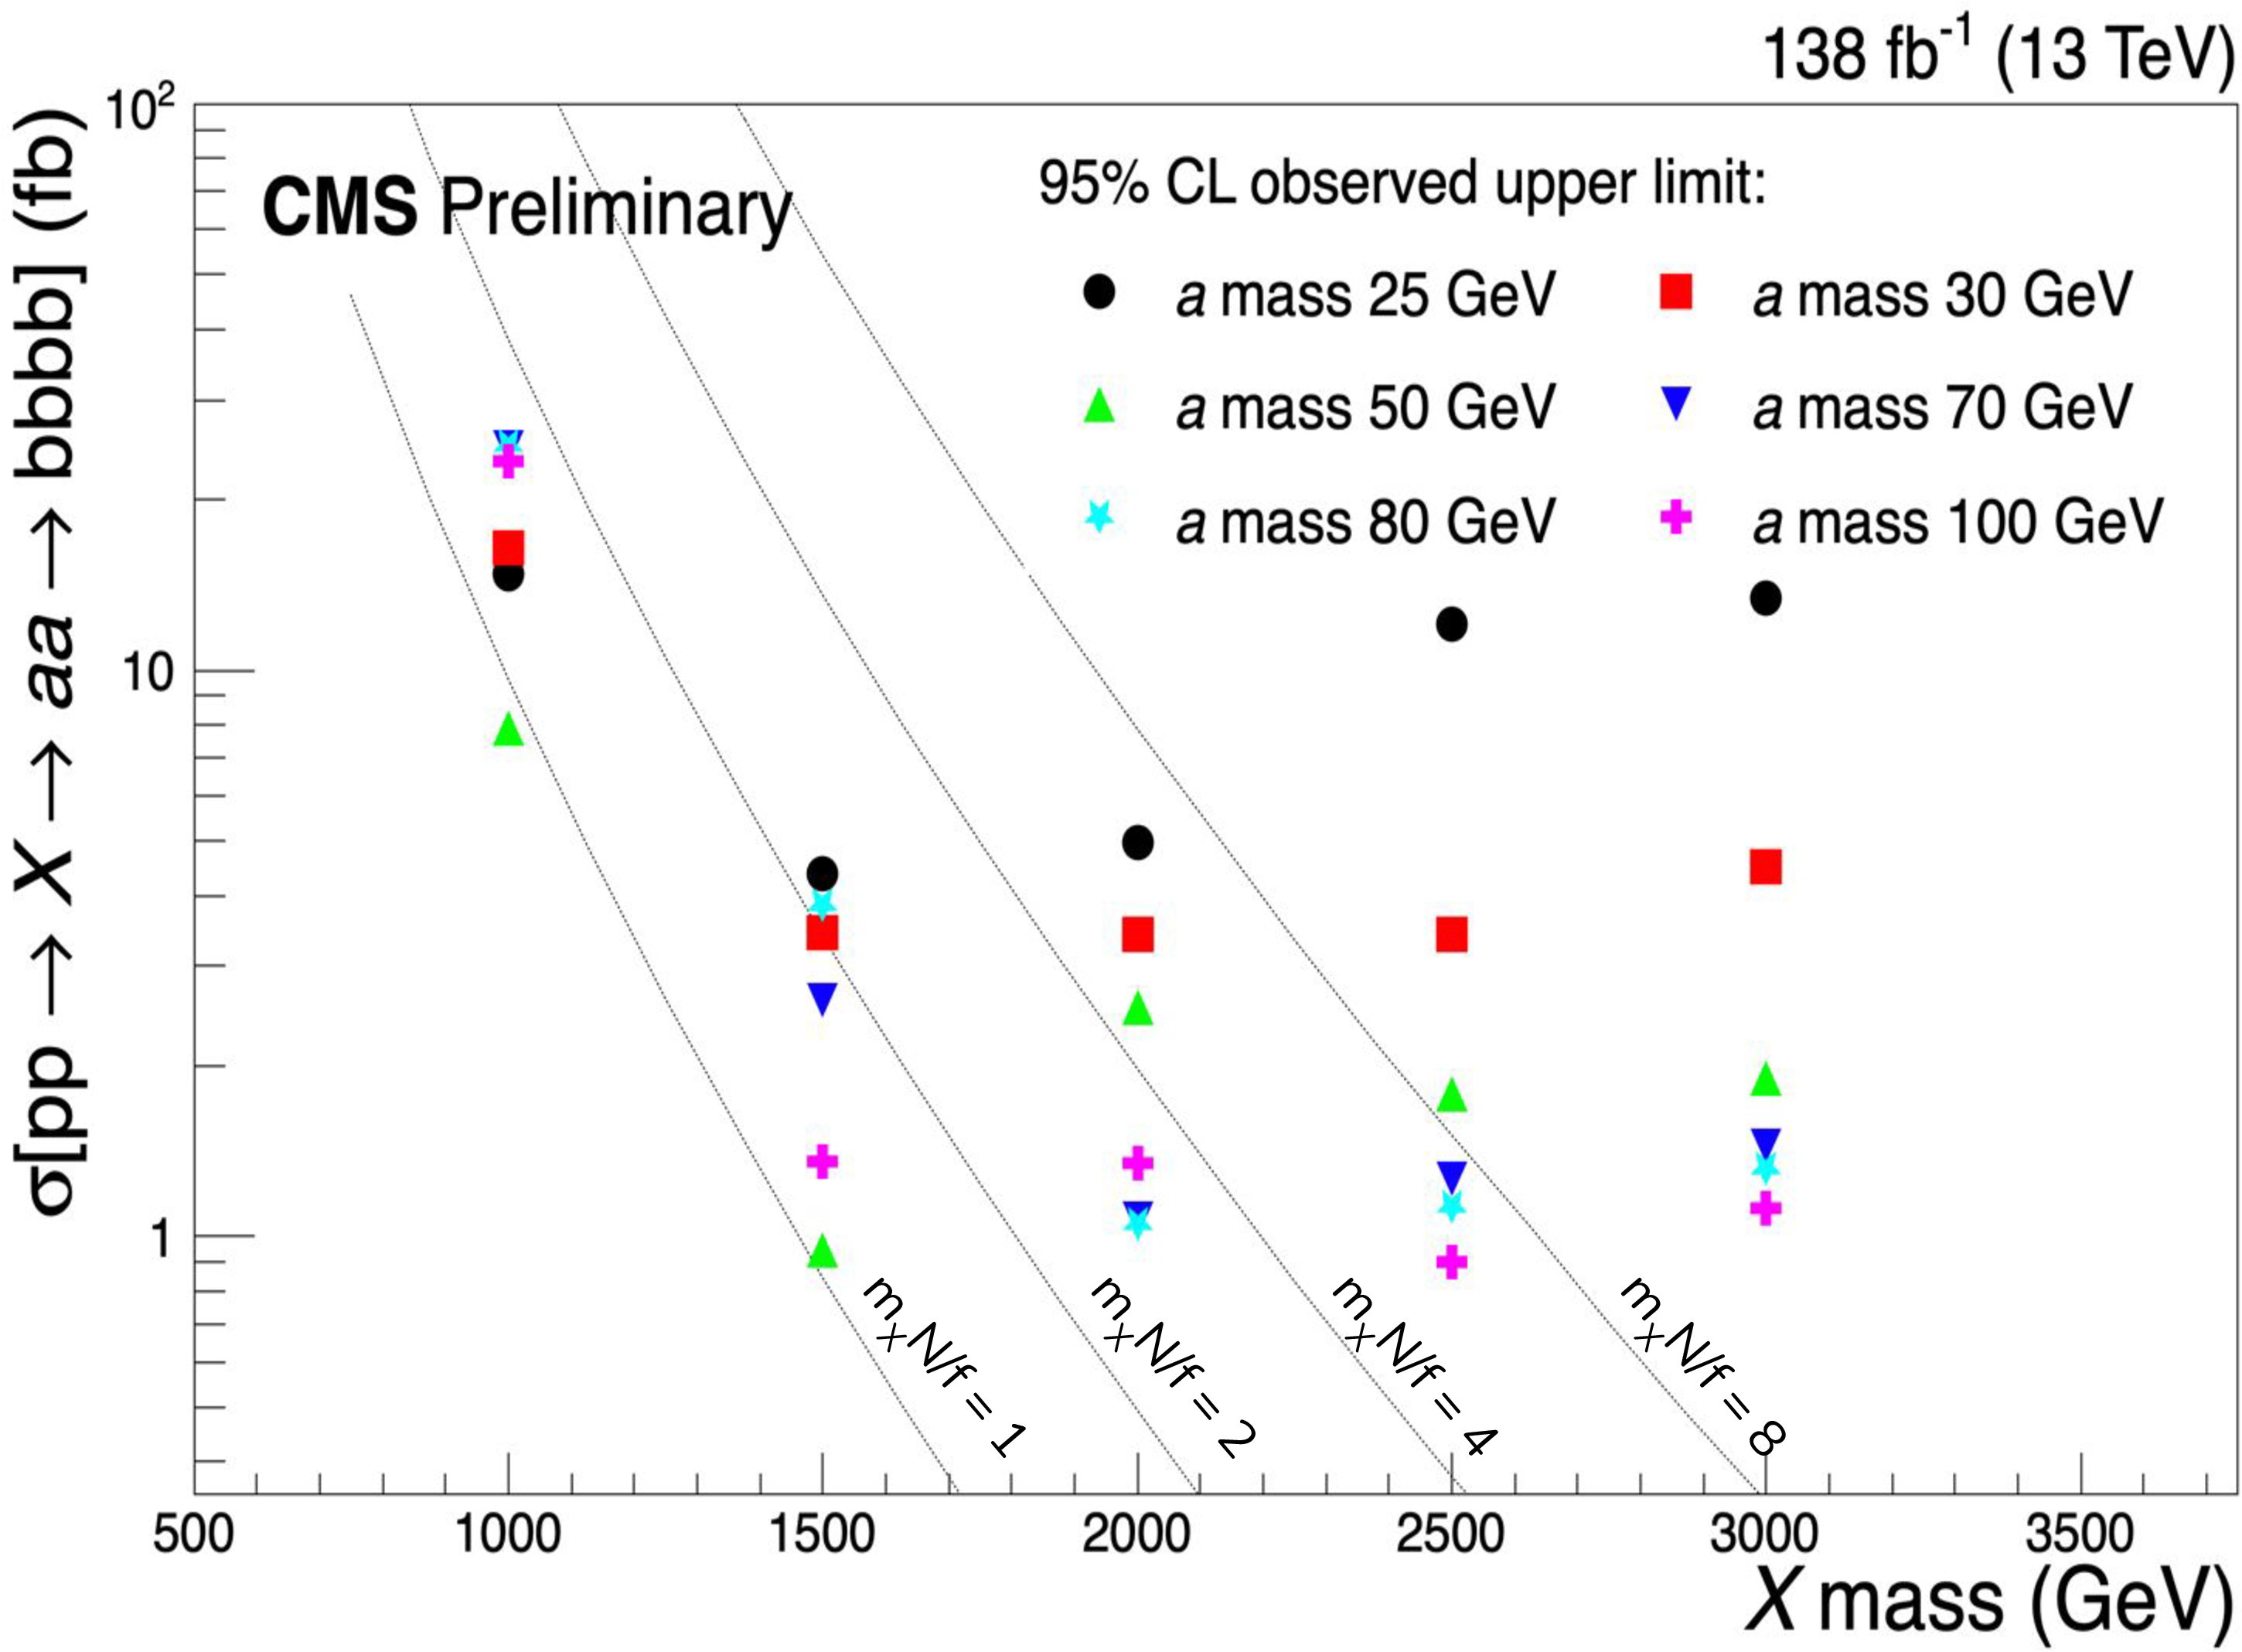
Upper limits at 95% CL on the cross section of the process ${\mathrm{p}} {\mathrm{p}} \rightarrow X \rightarrow aa \rightarrow (\mathrm{b} \mathrm{\bar{b}})(\mathrm{b} \mathrm{\bar{b}})$, as a function of the mass of the $X$ resonance, for different values of the $a$ boson mass. Both the $X \rightarrow a a$ and $a \rightarrow b \mathrm{\bar{b}} $ branching fractions are assumed to be 100%. Each sub-panel shows the limits for a fixed choice of $a$ mass. The observed limits are shown as solid black lines with markers, while the expected limits are dotted. The green (dark) and yellow (light) bands represent 1 and 2 standard deviation intervals. The theoretical cross section for different values of the parameter $(m_{X} N)/\textrm {f}$ are shown with dotted and dashed curves. |
| Tables | |
png pdf |
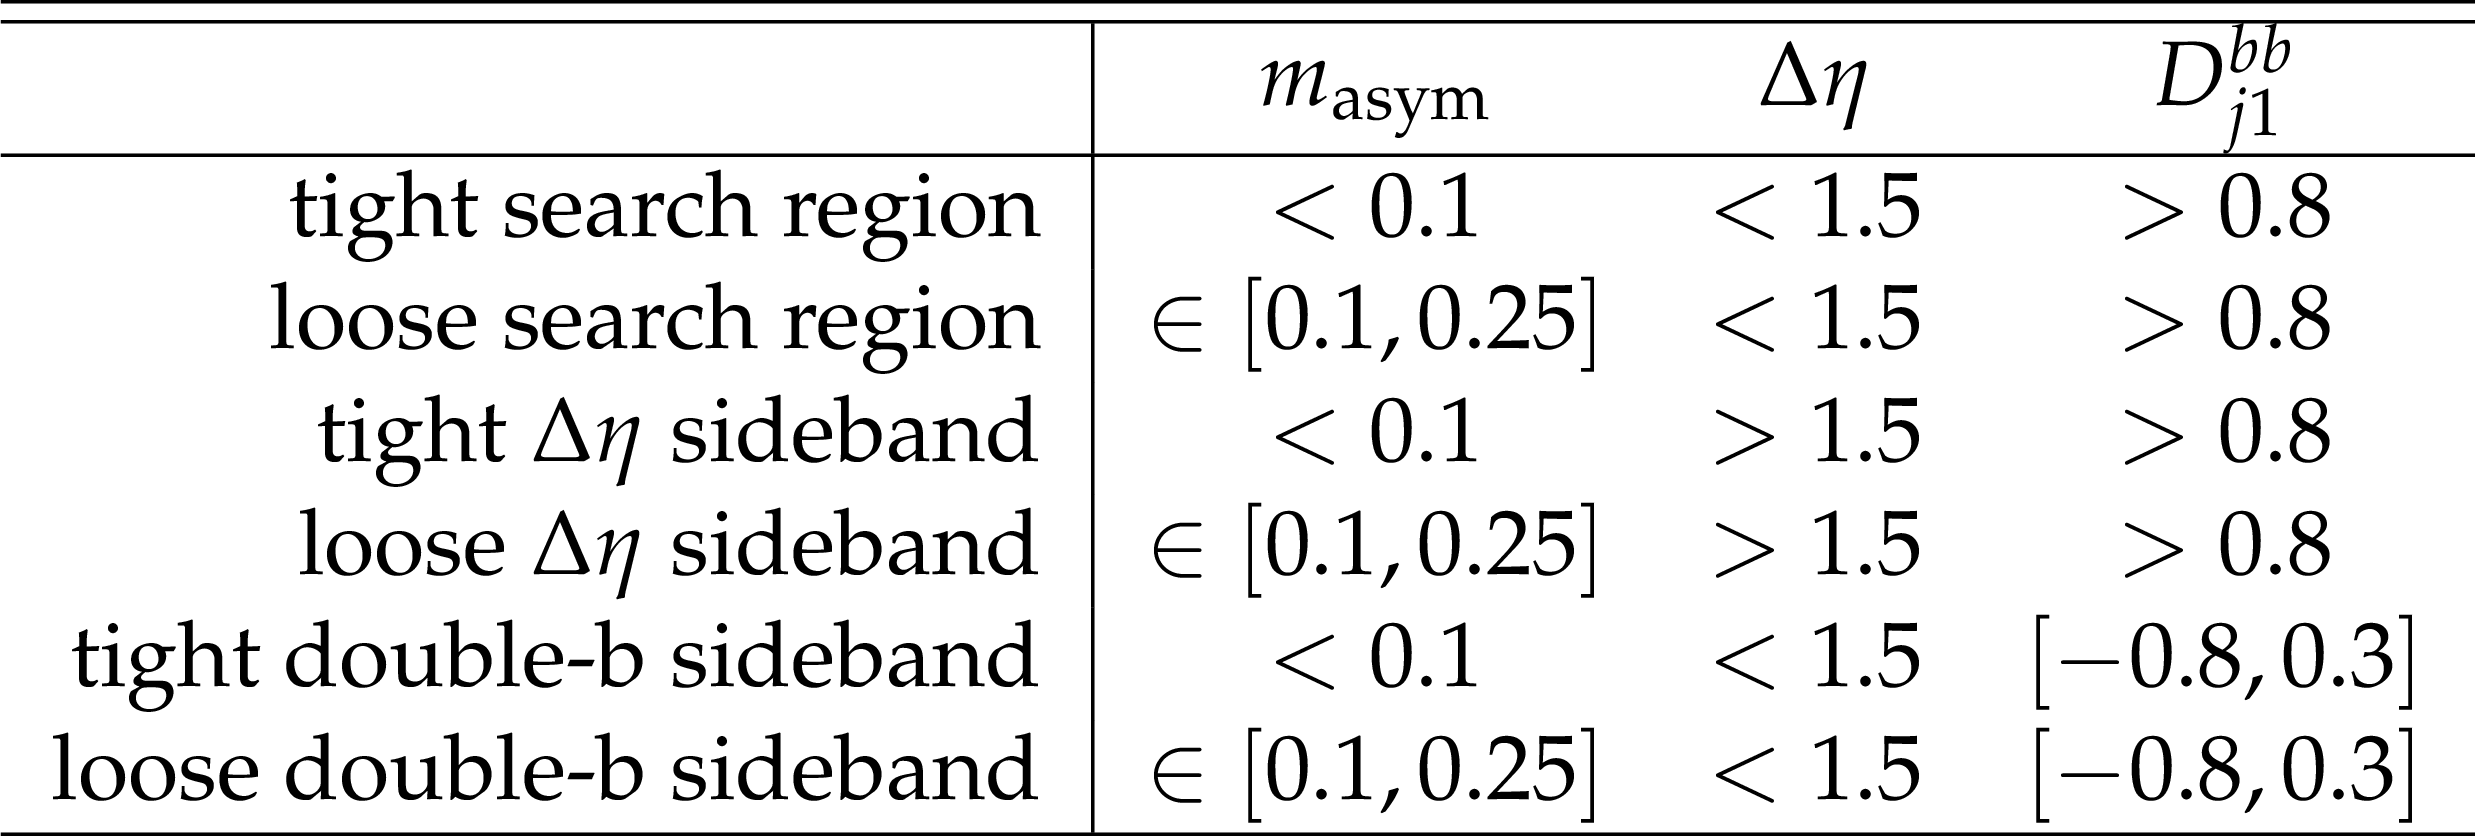
Table 1:
Search and control regions used in the analysis. A selection on the subleading jet double-b -tagger discriminant $D^{bb}_{j2} > $ 0.6 further separates each region into the passing and failing categories. |
png pdf |
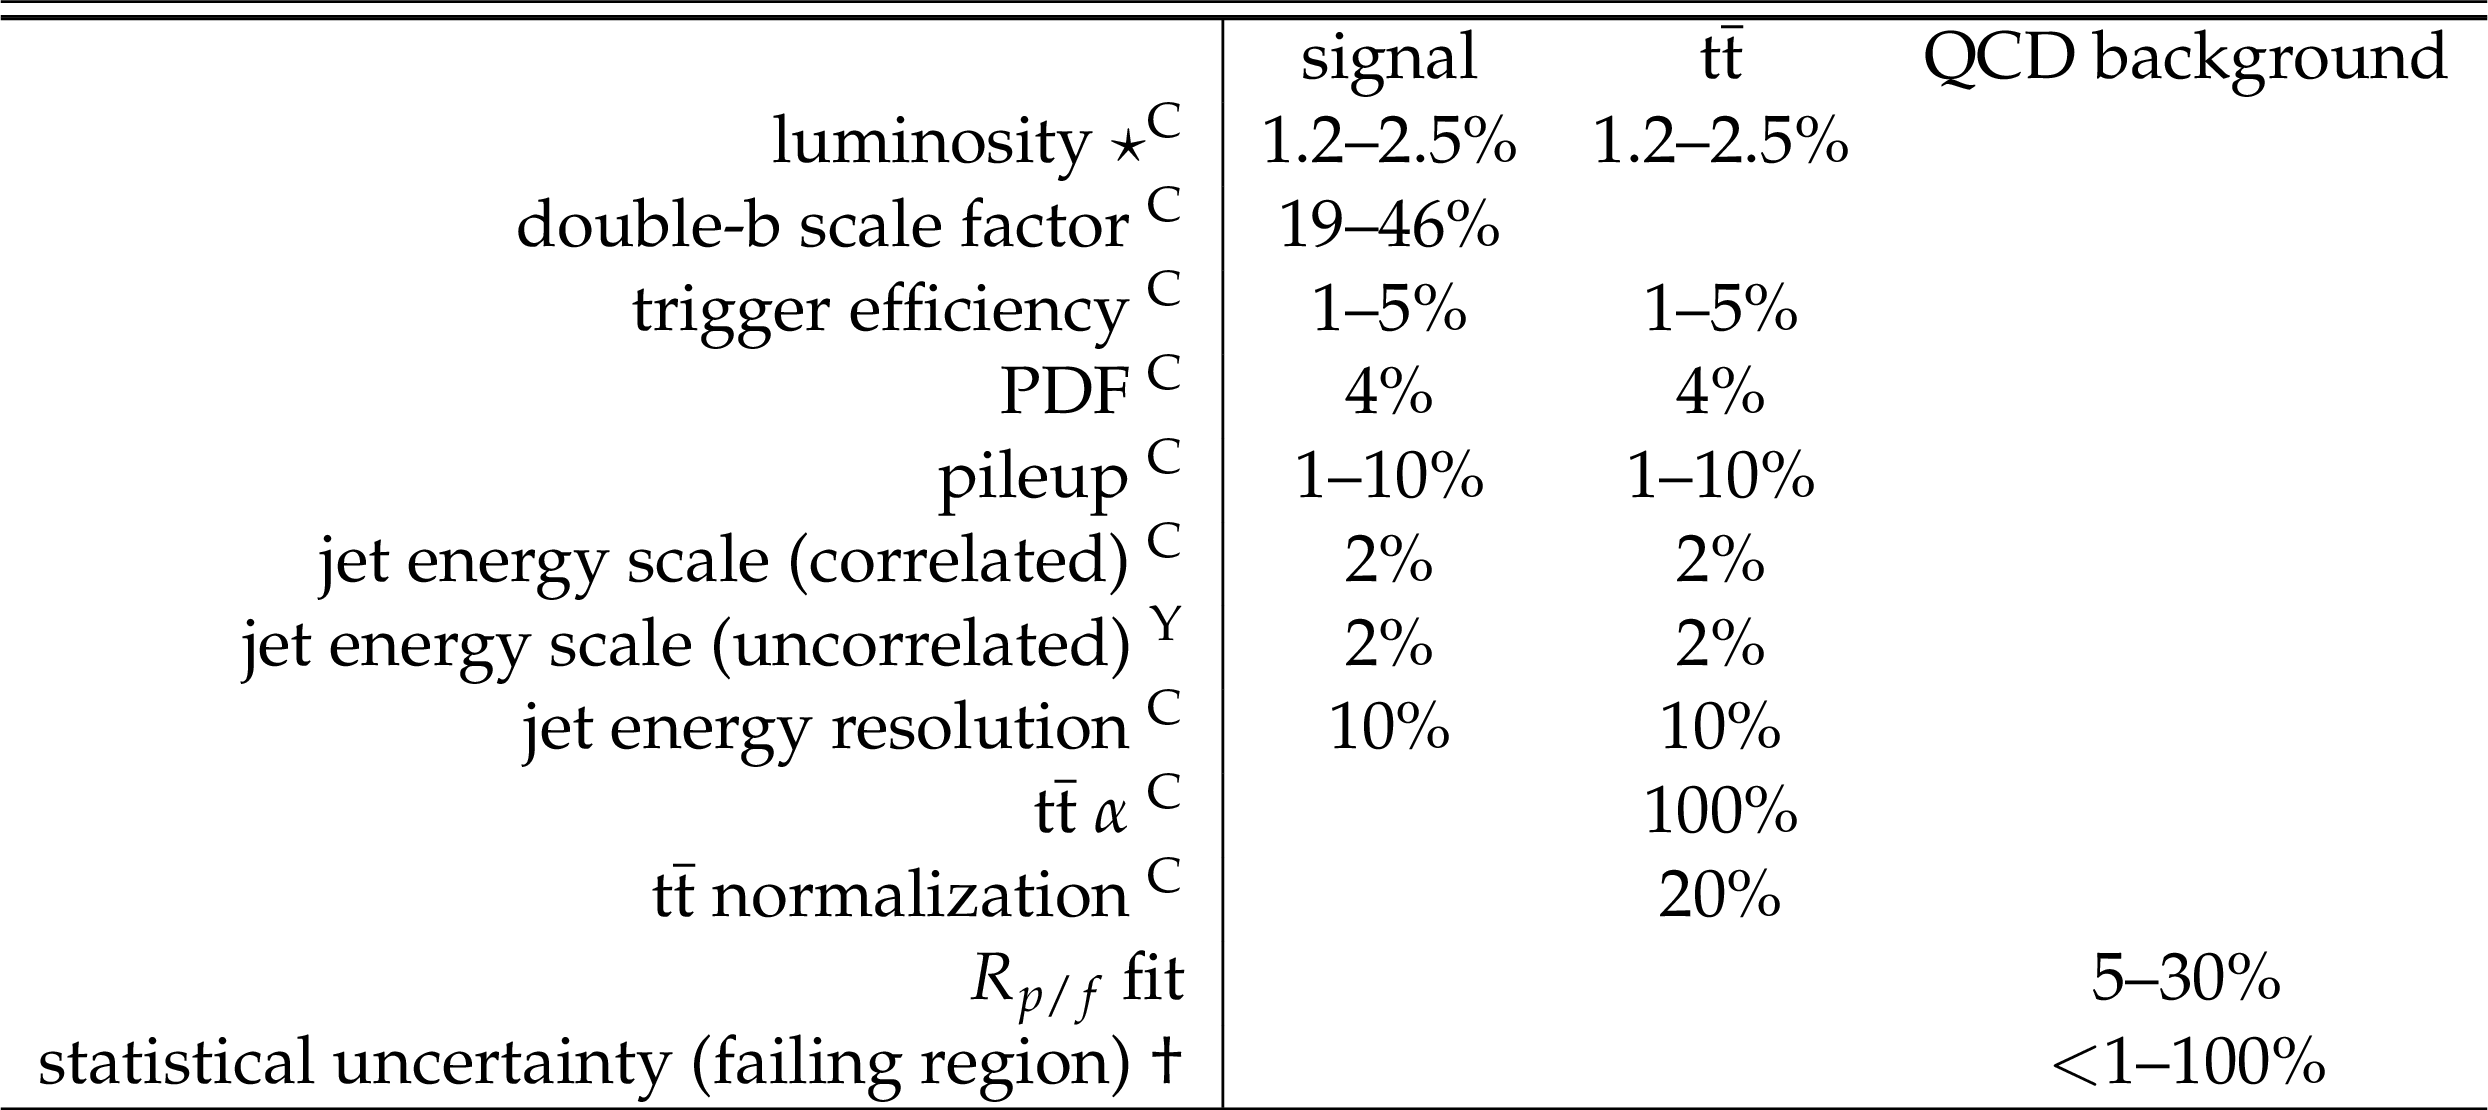
Table 2:
Sources of systematic uncertainties considered in the analysis. Parameters denoted by the $\star $ symbol affect only the normalization; otherwise both the shape and normalization of the process are affected. The parameters affecting the normalization have log-normal priors, and those affecting the shape have Gaussian priors, unless marked with the $\dagger $ symbol, which denotes that this parameter was sampled from a $\Gamma $-distribution. Uncertainties marked with $^{\textrm {C}}$ are correlated between the LR and SR for a given year of data-taking, and those marked with $^{\textrm {Y}}$ are correlated between both search regions in all three years. All other uncertainties are uncorrelated between search regions. The values indicated in the table represent the pre-fit values of the uncertainty on the parameter. When a range is given, it indicates the variation of the size of the uncertainty over the average jet mass and dijet mass distribution. Note that all ${\mathrm{t} {}\mathrm{\bar{t}}}$ uncertainties are propagated to the QCD estimate. |
| Summary |
| A search for massive resonances decaying to pairs of scalar bosons which themselves decay to b quark-antiquark pairs is presented. The analysis is restricted to the case where the mass ratio of the resonance and the scalar bosons is such that each pair of b quarks is reconstructed as a single large-radius jet. Data from proton-proton collisions at the LHC at $\sqrt{s} = $ 13 TeV collected in 2016-2018 with the CMS detector, corresponding to an integrated luminosity of 138 fb$^{-1}$, have been analyzed. Upper limits are set at 95% confidence level on the production cross section times branching fraction as a function of mass for $X\rightarrow aa\rightarrow (\mathrm{b}\mathrm{\bar{b}})(\mathrm{b}\mathrm{\bar{b}})$, where both the $X \rightarrow a a$ and $a \rightarrow b \mathrm{\bar{b}}$ branching fractions are assumed to be 100%. These are the first such limits on this process, and range between 1 and 30 fb for $a$ mass between 25 and 100 GeV and $X$ mass between 1 and 3 TeV. |
| Additional Figures | |
png pdf |
Additional Figure 1:
Observed upper limits at 95% CL on the cross section of the process $ {\mathrm {p}} {\mathrm {p}}\rightarrow X \rightarrow aa \rightarrow ({\mathrm {b}} {\overline {\mathrm {b}}})({\mathrm {b}} {\overline {\mathrm {b}}})$, as a function of the mass of $X$, for different values of the $a$ mass. Both the $X \rightarrow a a$ and $a \rightarrow {\mathrm {b}} {\overline {\mathrm {b}}} $ branching fractions are assumed to be 100%. The theoretical cross section for different values of the parameter $m_{X} N/\textrm {f}$ are shown with dotted curves, where $m_{X}$ is the mass of the particle $X$, $N$ is the number of fermions in the production diagram, and $\textrm {f}$ is the expectation value of $X$. |
png pdf |
Additional Figure 2:
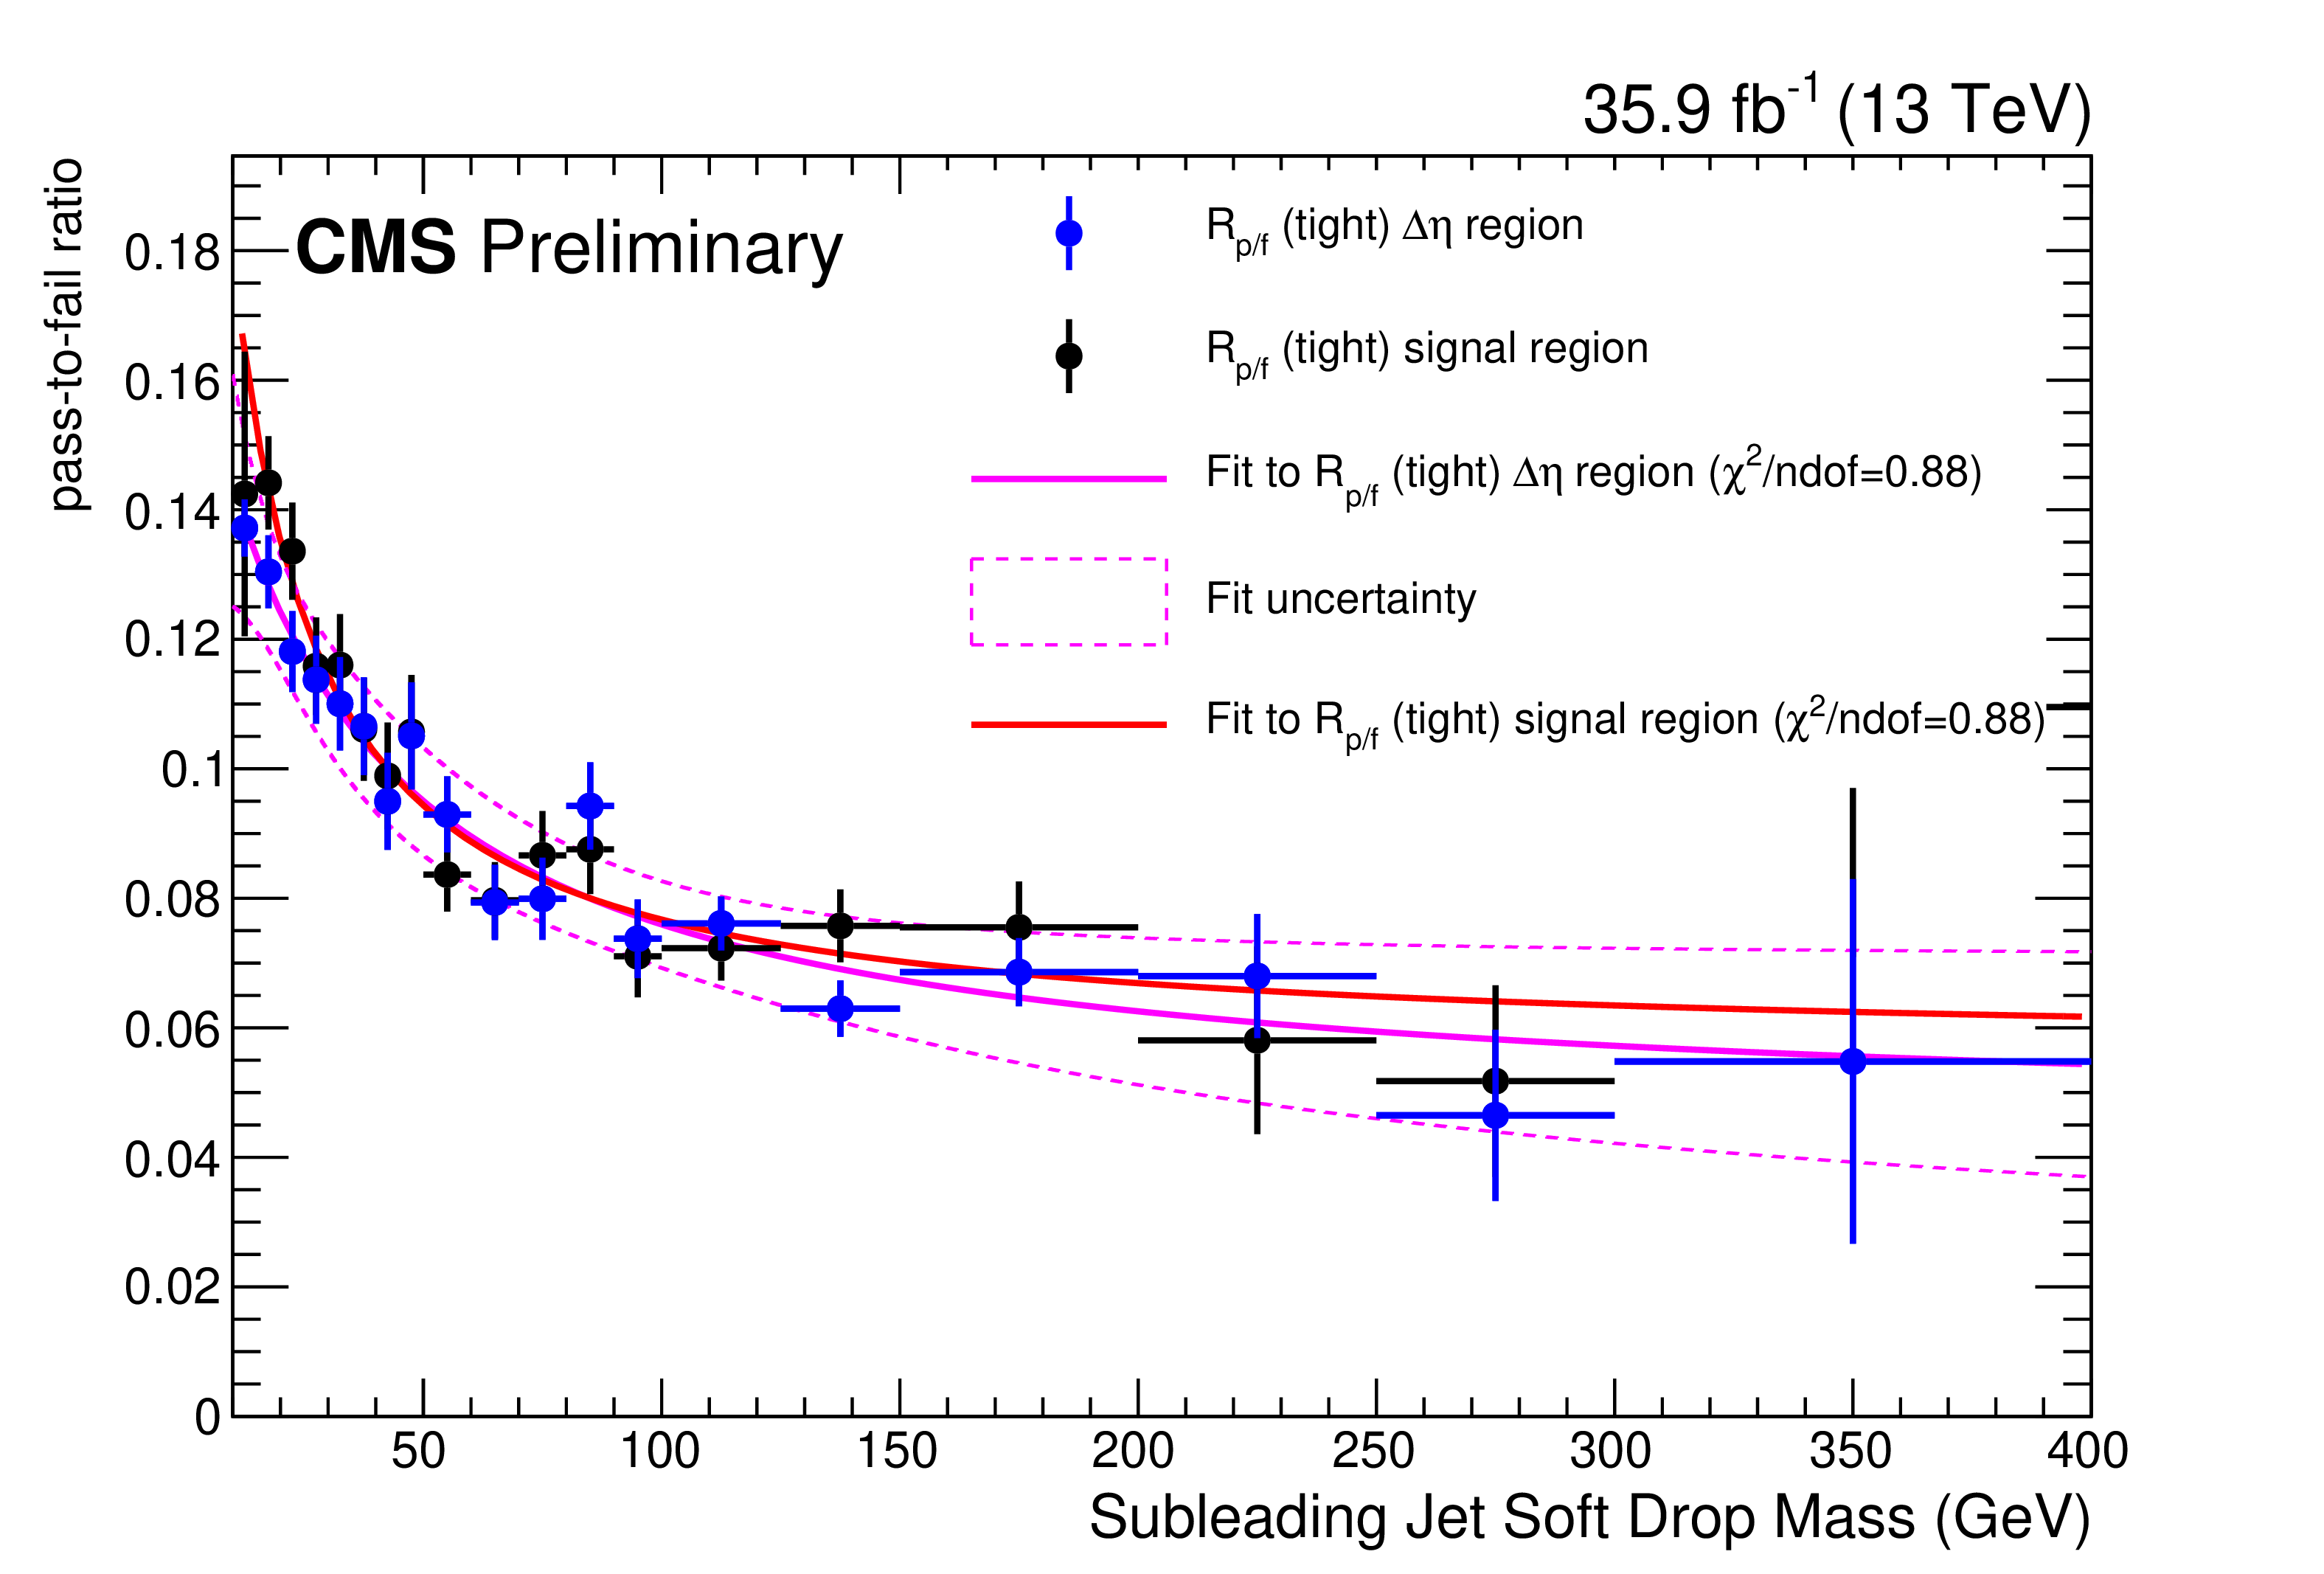
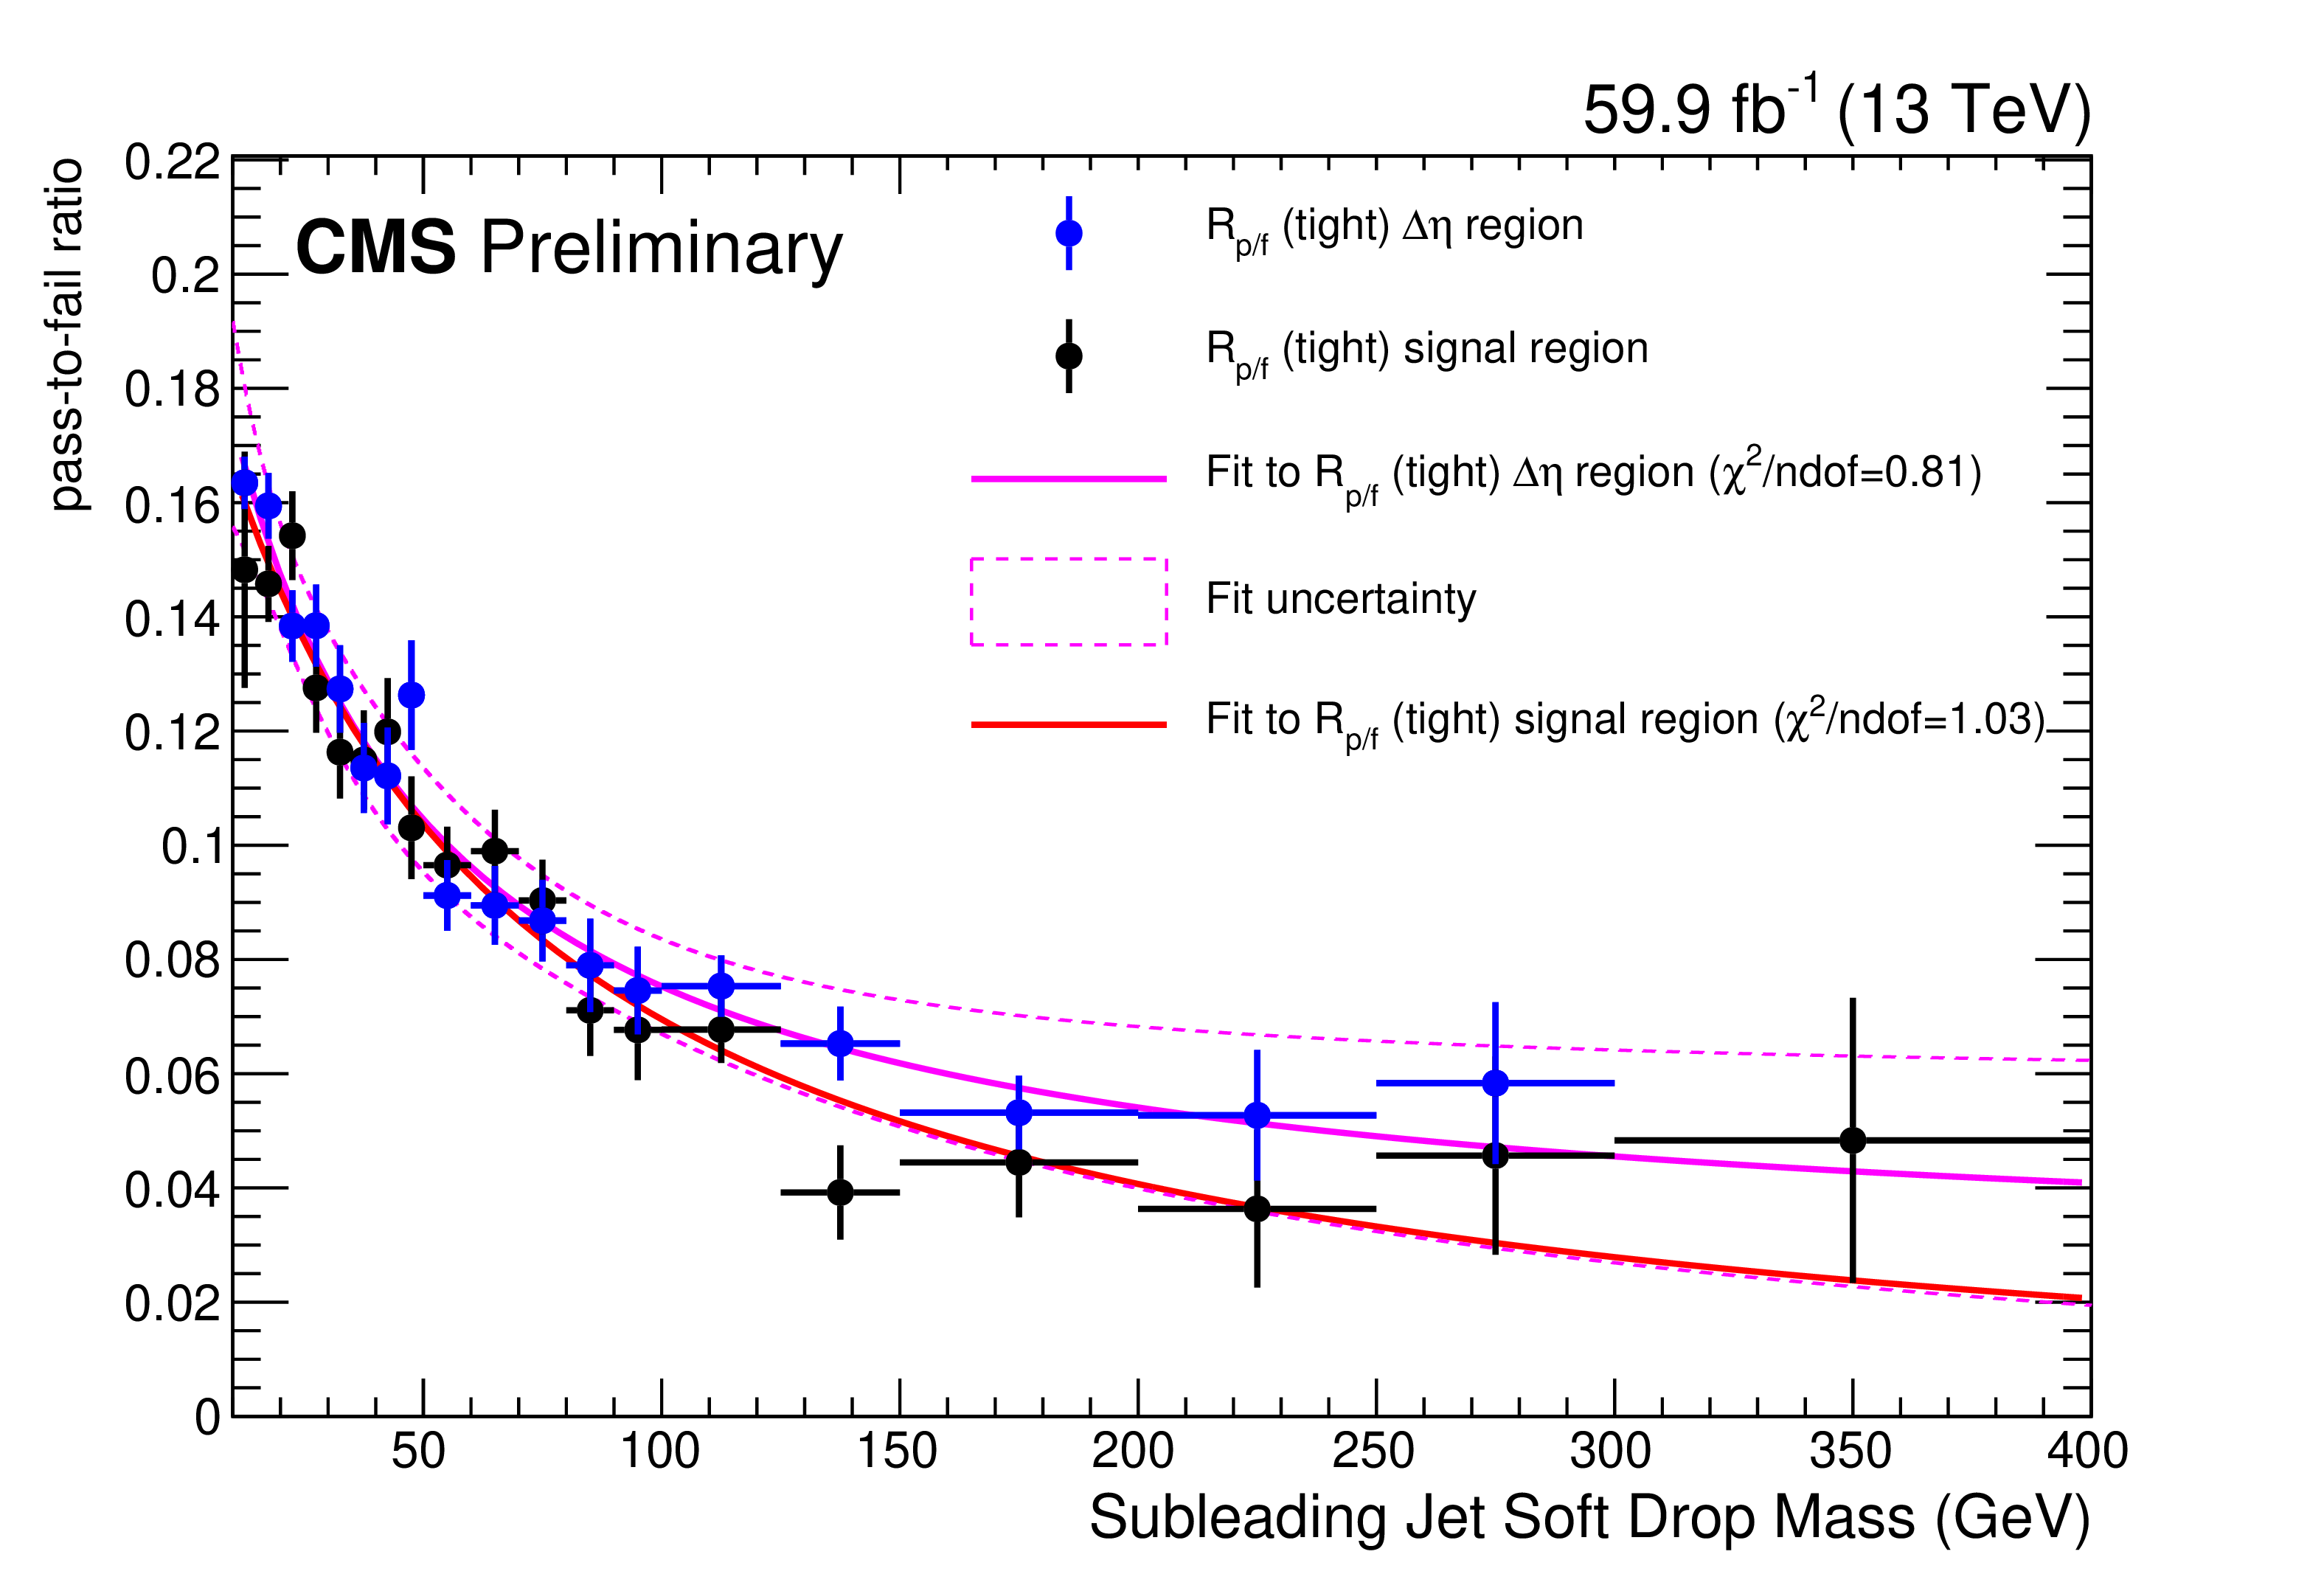
The pass-to-fail ratio vs. the soft drop mass of the subleading jet. The black (blue) points show the tight search region (control region) and the red (pink) is a fit to that region, in the 2016 data. The fit uncertainty in the control region is also shown as the dashed pink lines. |
png pdf |
Additional Figure 3:
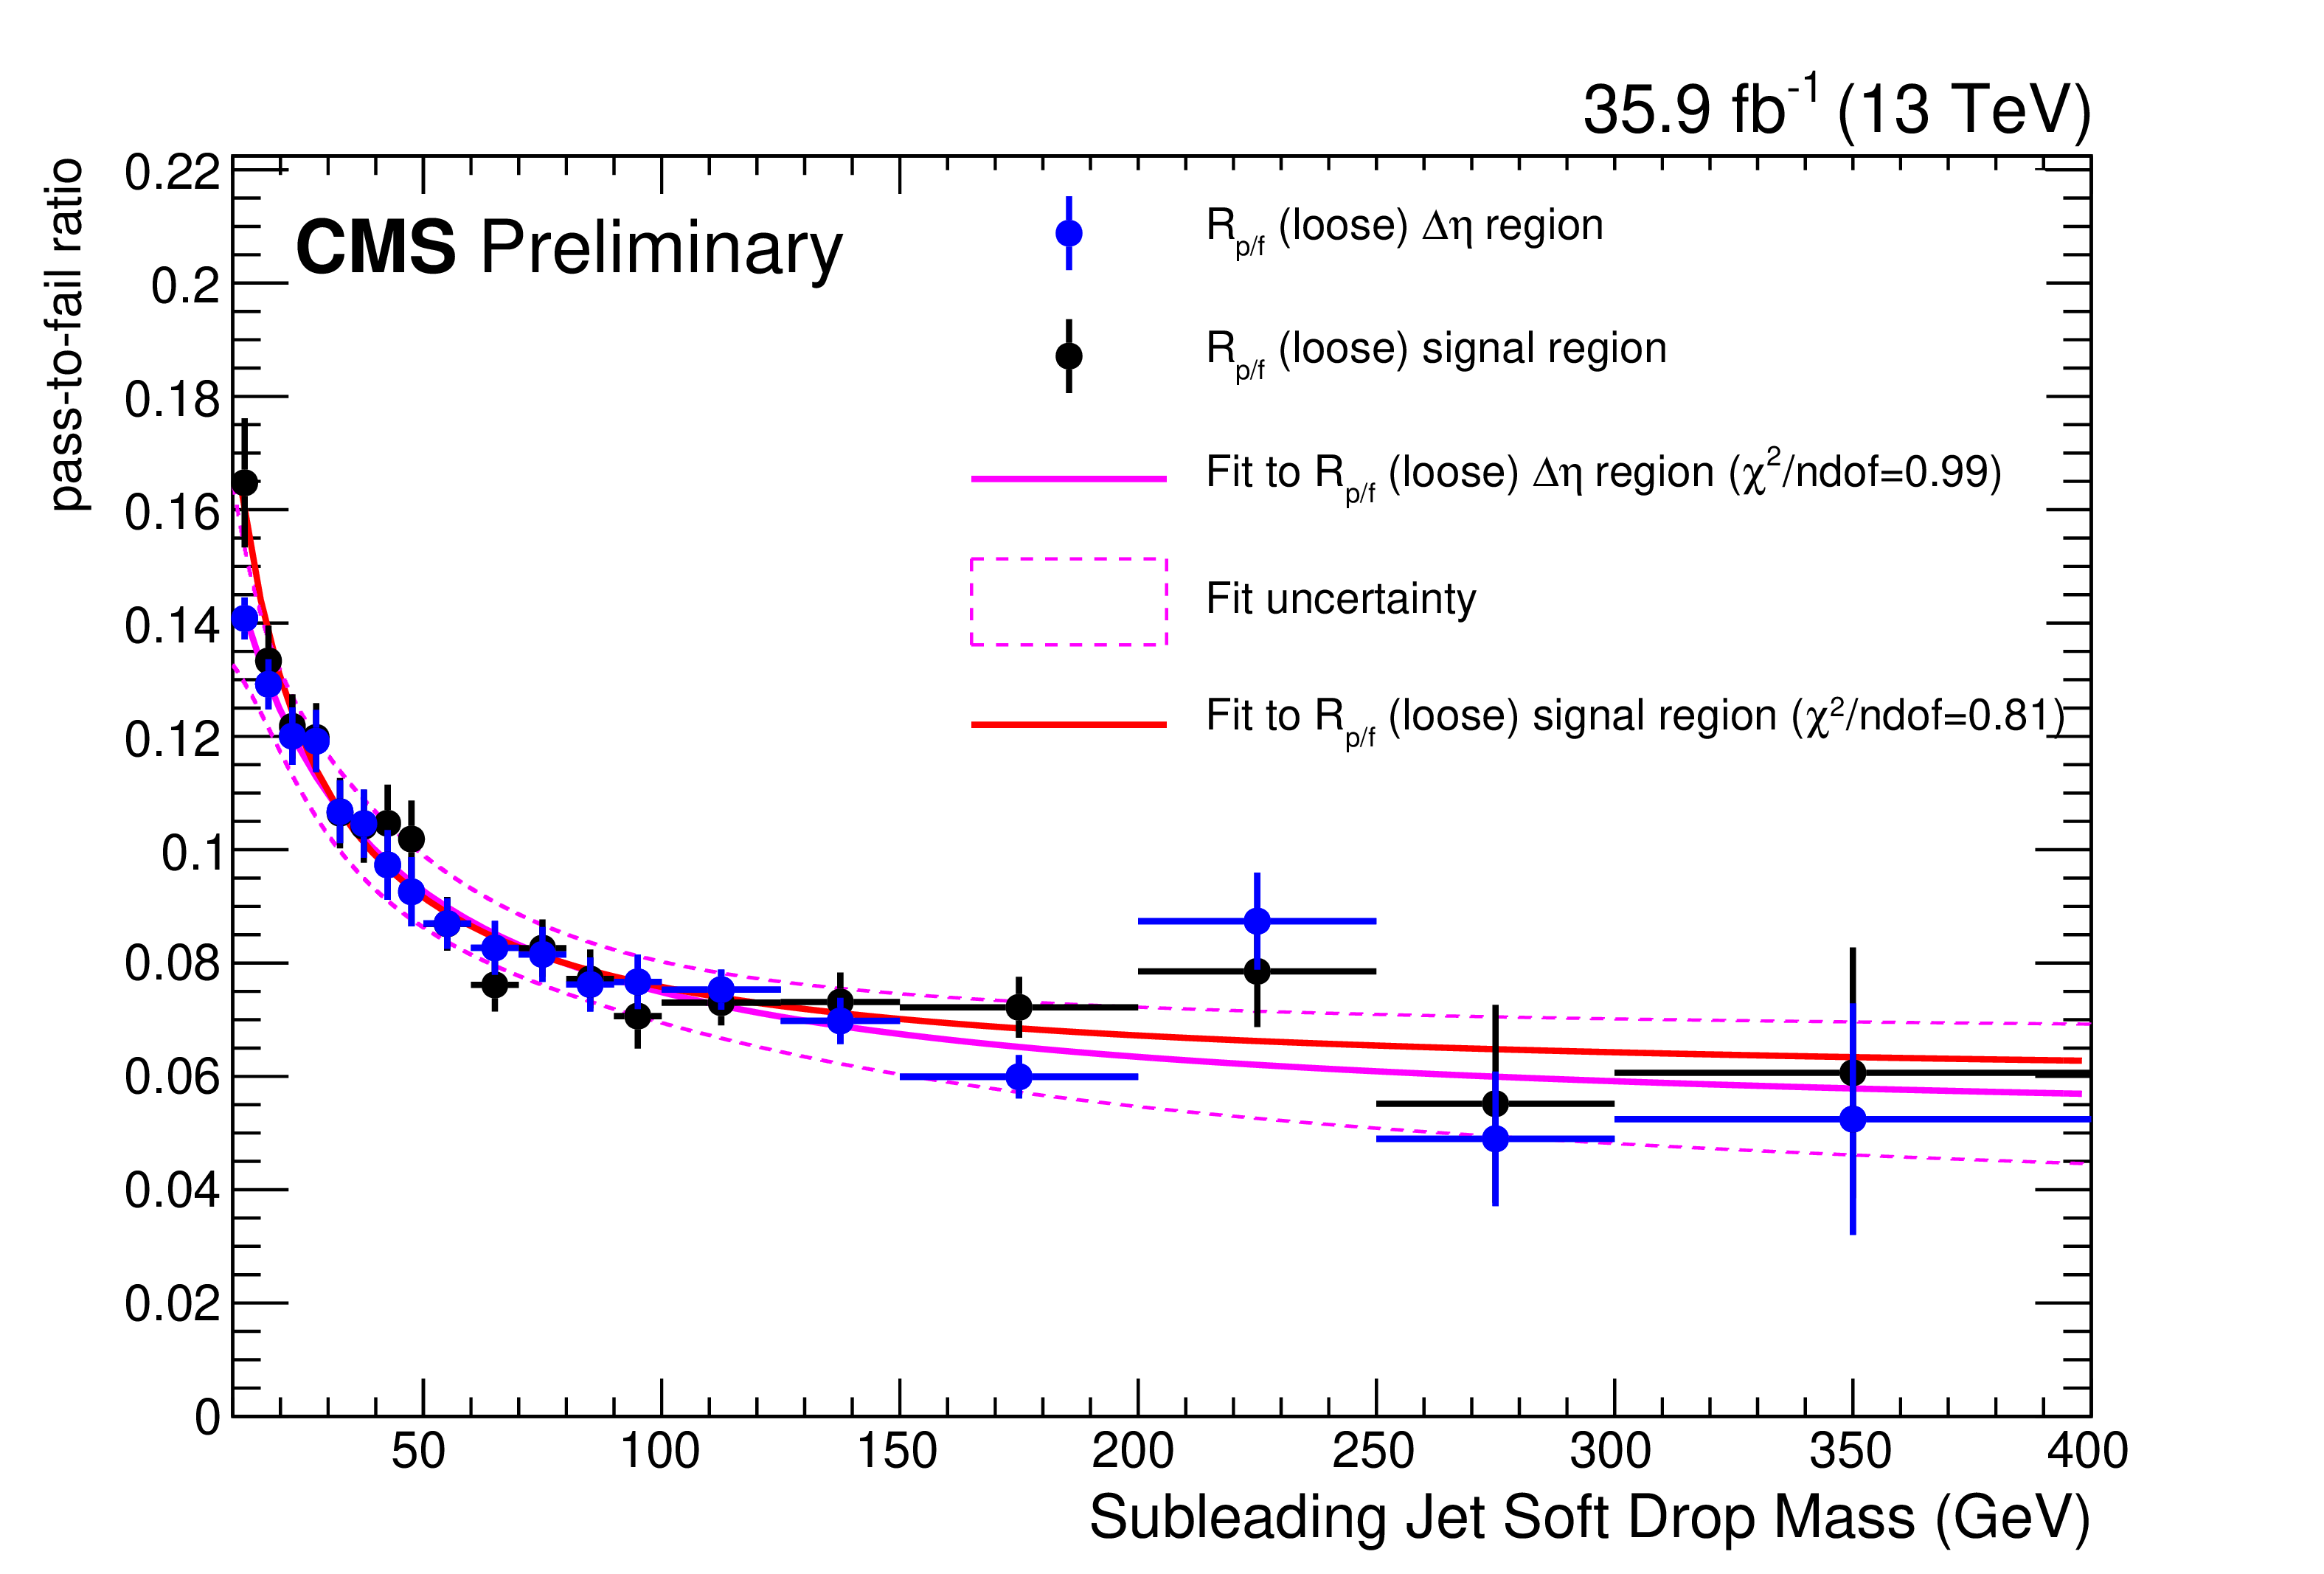
The pass-to-fail ratio vs. the soft drop mass of the subleading jet. The black (blue) points show the loose search region (control region) and the red (pink) is a fit to that region, in the 2016 data. The fit uncertainty in the control region is also shown as the dashed pink lines. |

png pdf |
Additional Figure 4:
The pass-to-fail ratio vs. the soft drop mass of the subleading jet. The black (blue) points show the tight search region (control region) and the red (pink) is a fit to that region, in the 2017 data. The fit uncertainty in the control region is also shown as the dashed pink lines. |
png pdf |
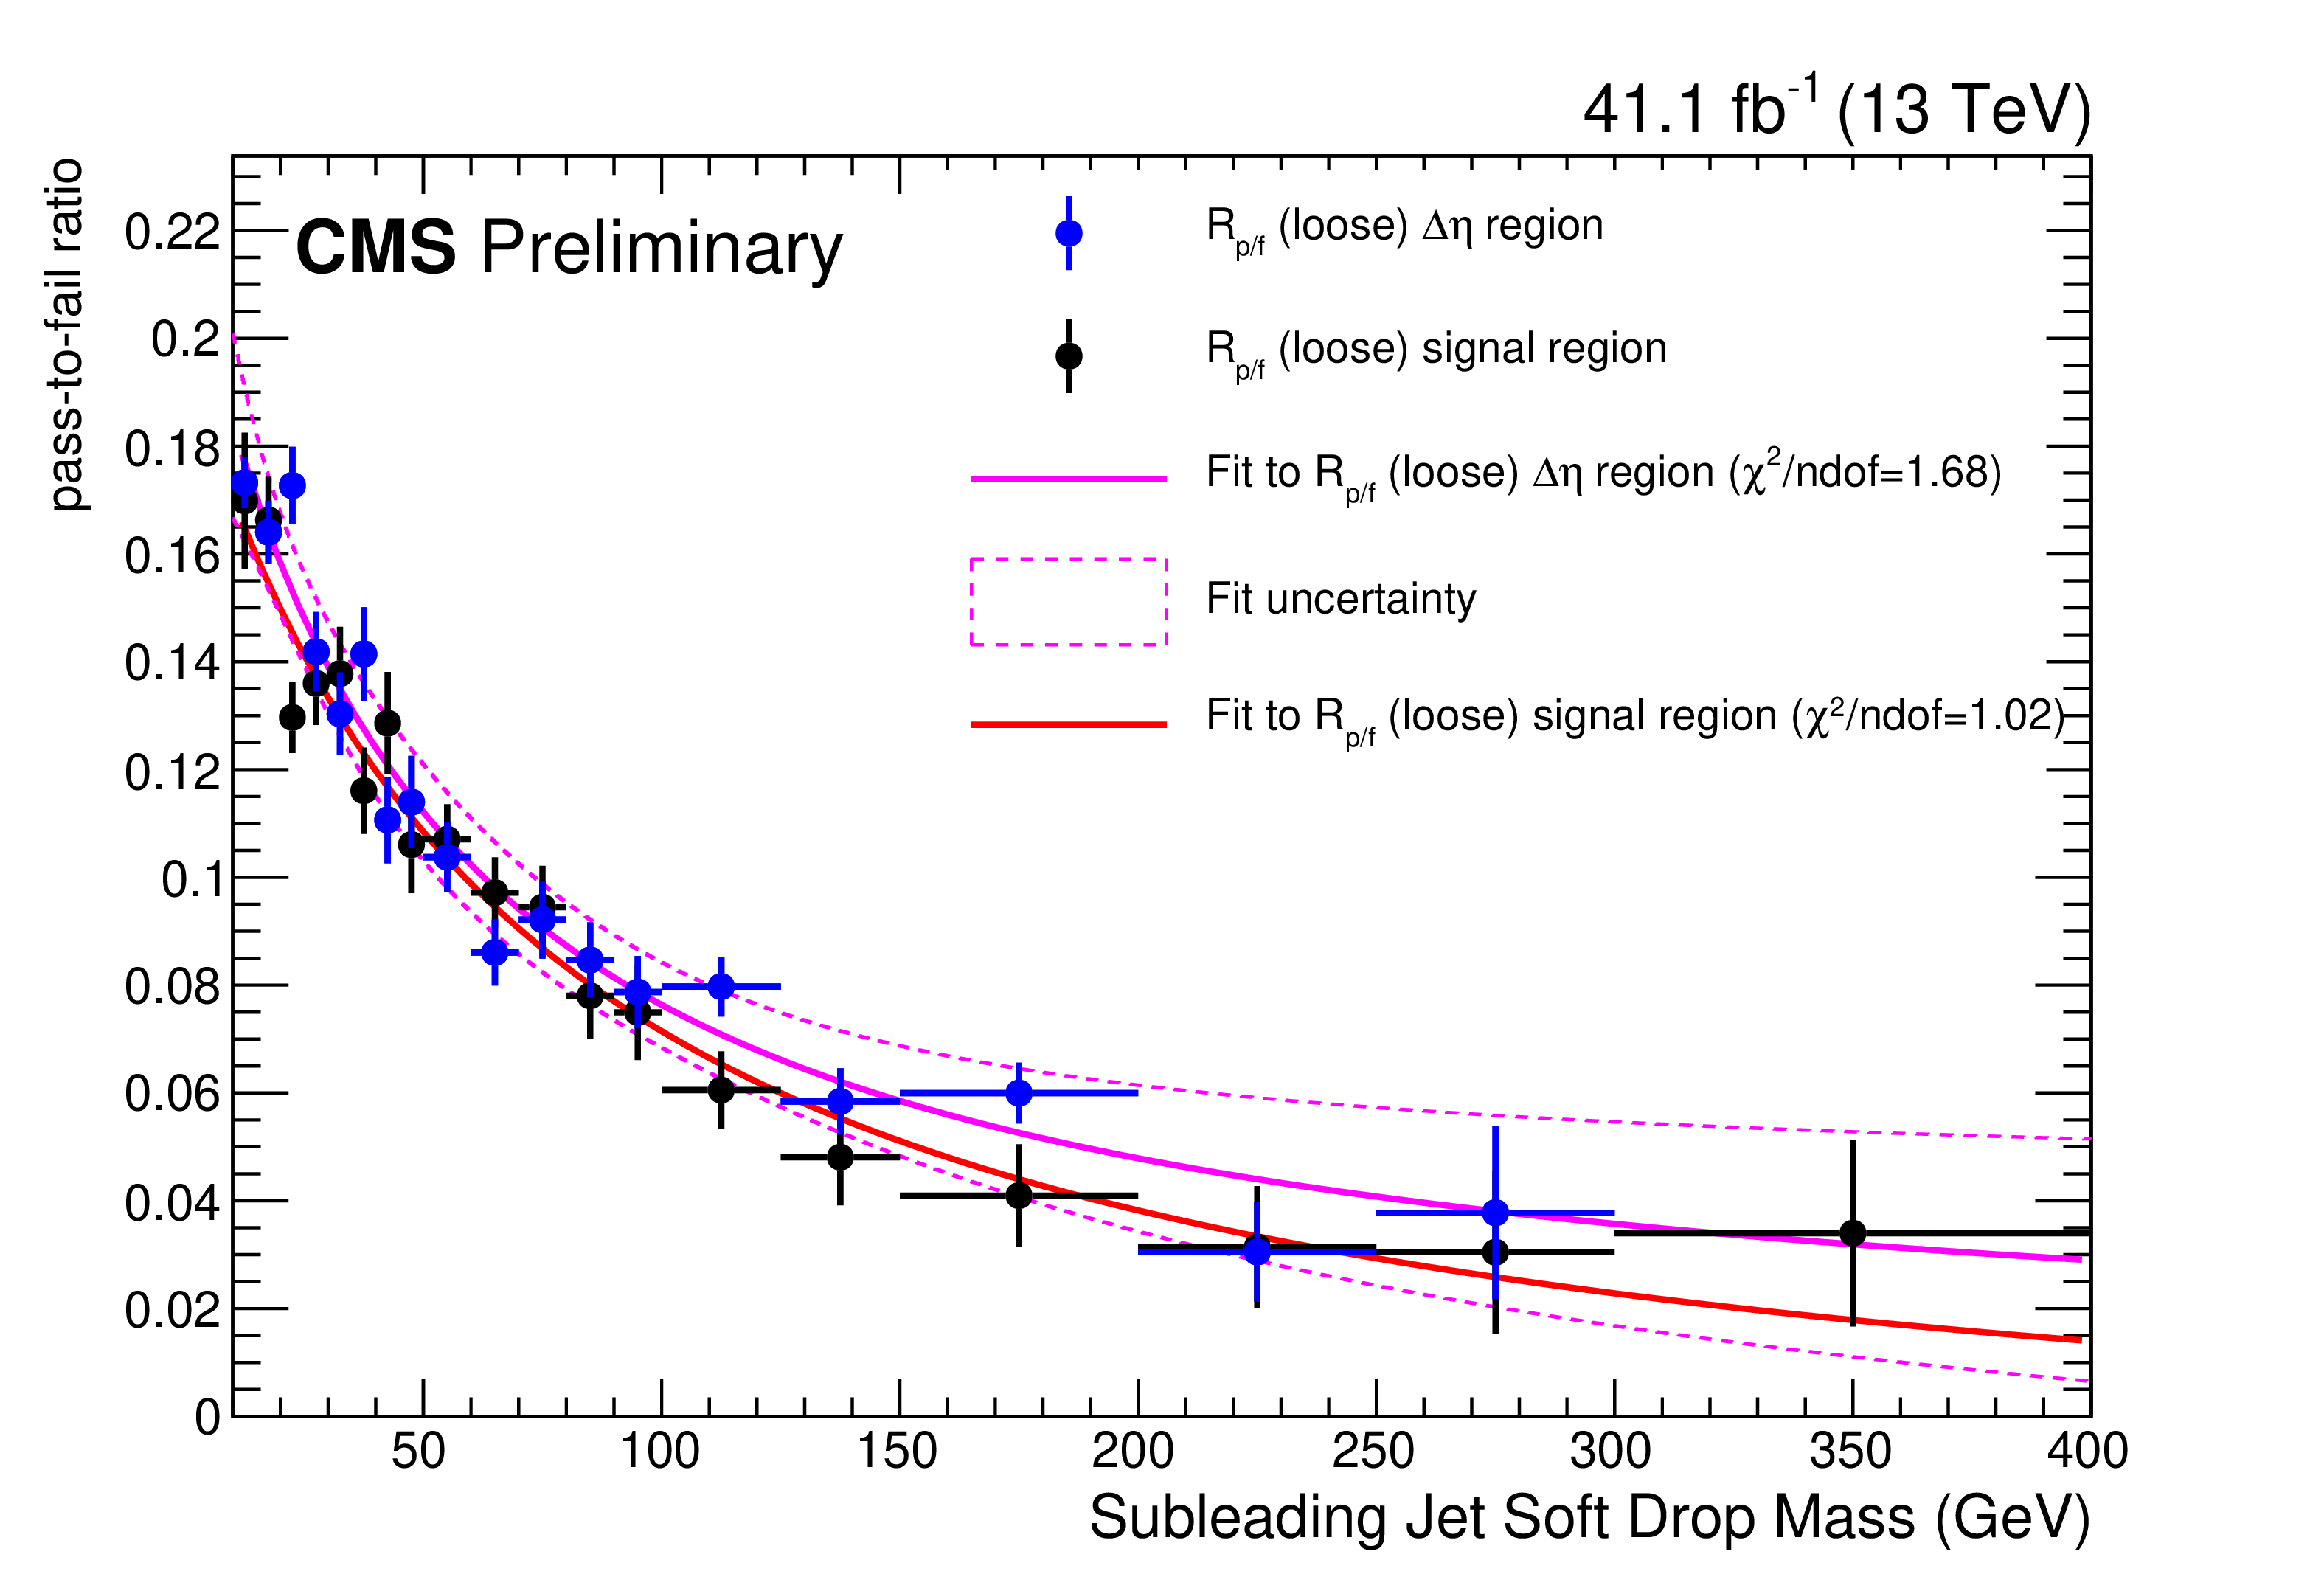
Additional Figure 5:
The pass-to-fail ratio vs. the soft drop mass of the subleading jet. The black (blue) points show the loose search region (control region) and the red (pink) is a fit to that region, in the 2017 data. The fit uncertainty in the control region is also shown as the dashed pink lines. |
png pdf |
Additional Figure 6:
The pass-to-fail ratio vs. the soft drop mass of the subleading jet. The black (blue) points show the tight search region (control region) and the red (pink) is a fit to that region, in the 2018 data. The fit uncertainty in the control region is also shown as the dashed pink lines. |

png pdf |
Additional Figure 7:
The pass-to-fail ratio vs. the soft drop mass of the subleading jet. The black (blue) points show the loose search region (control region) and the red (pink) is a fit to that region, in the 2018 data. The fit uncertainty in the control region is also shown as the dashed pink lines. |
png pdf |
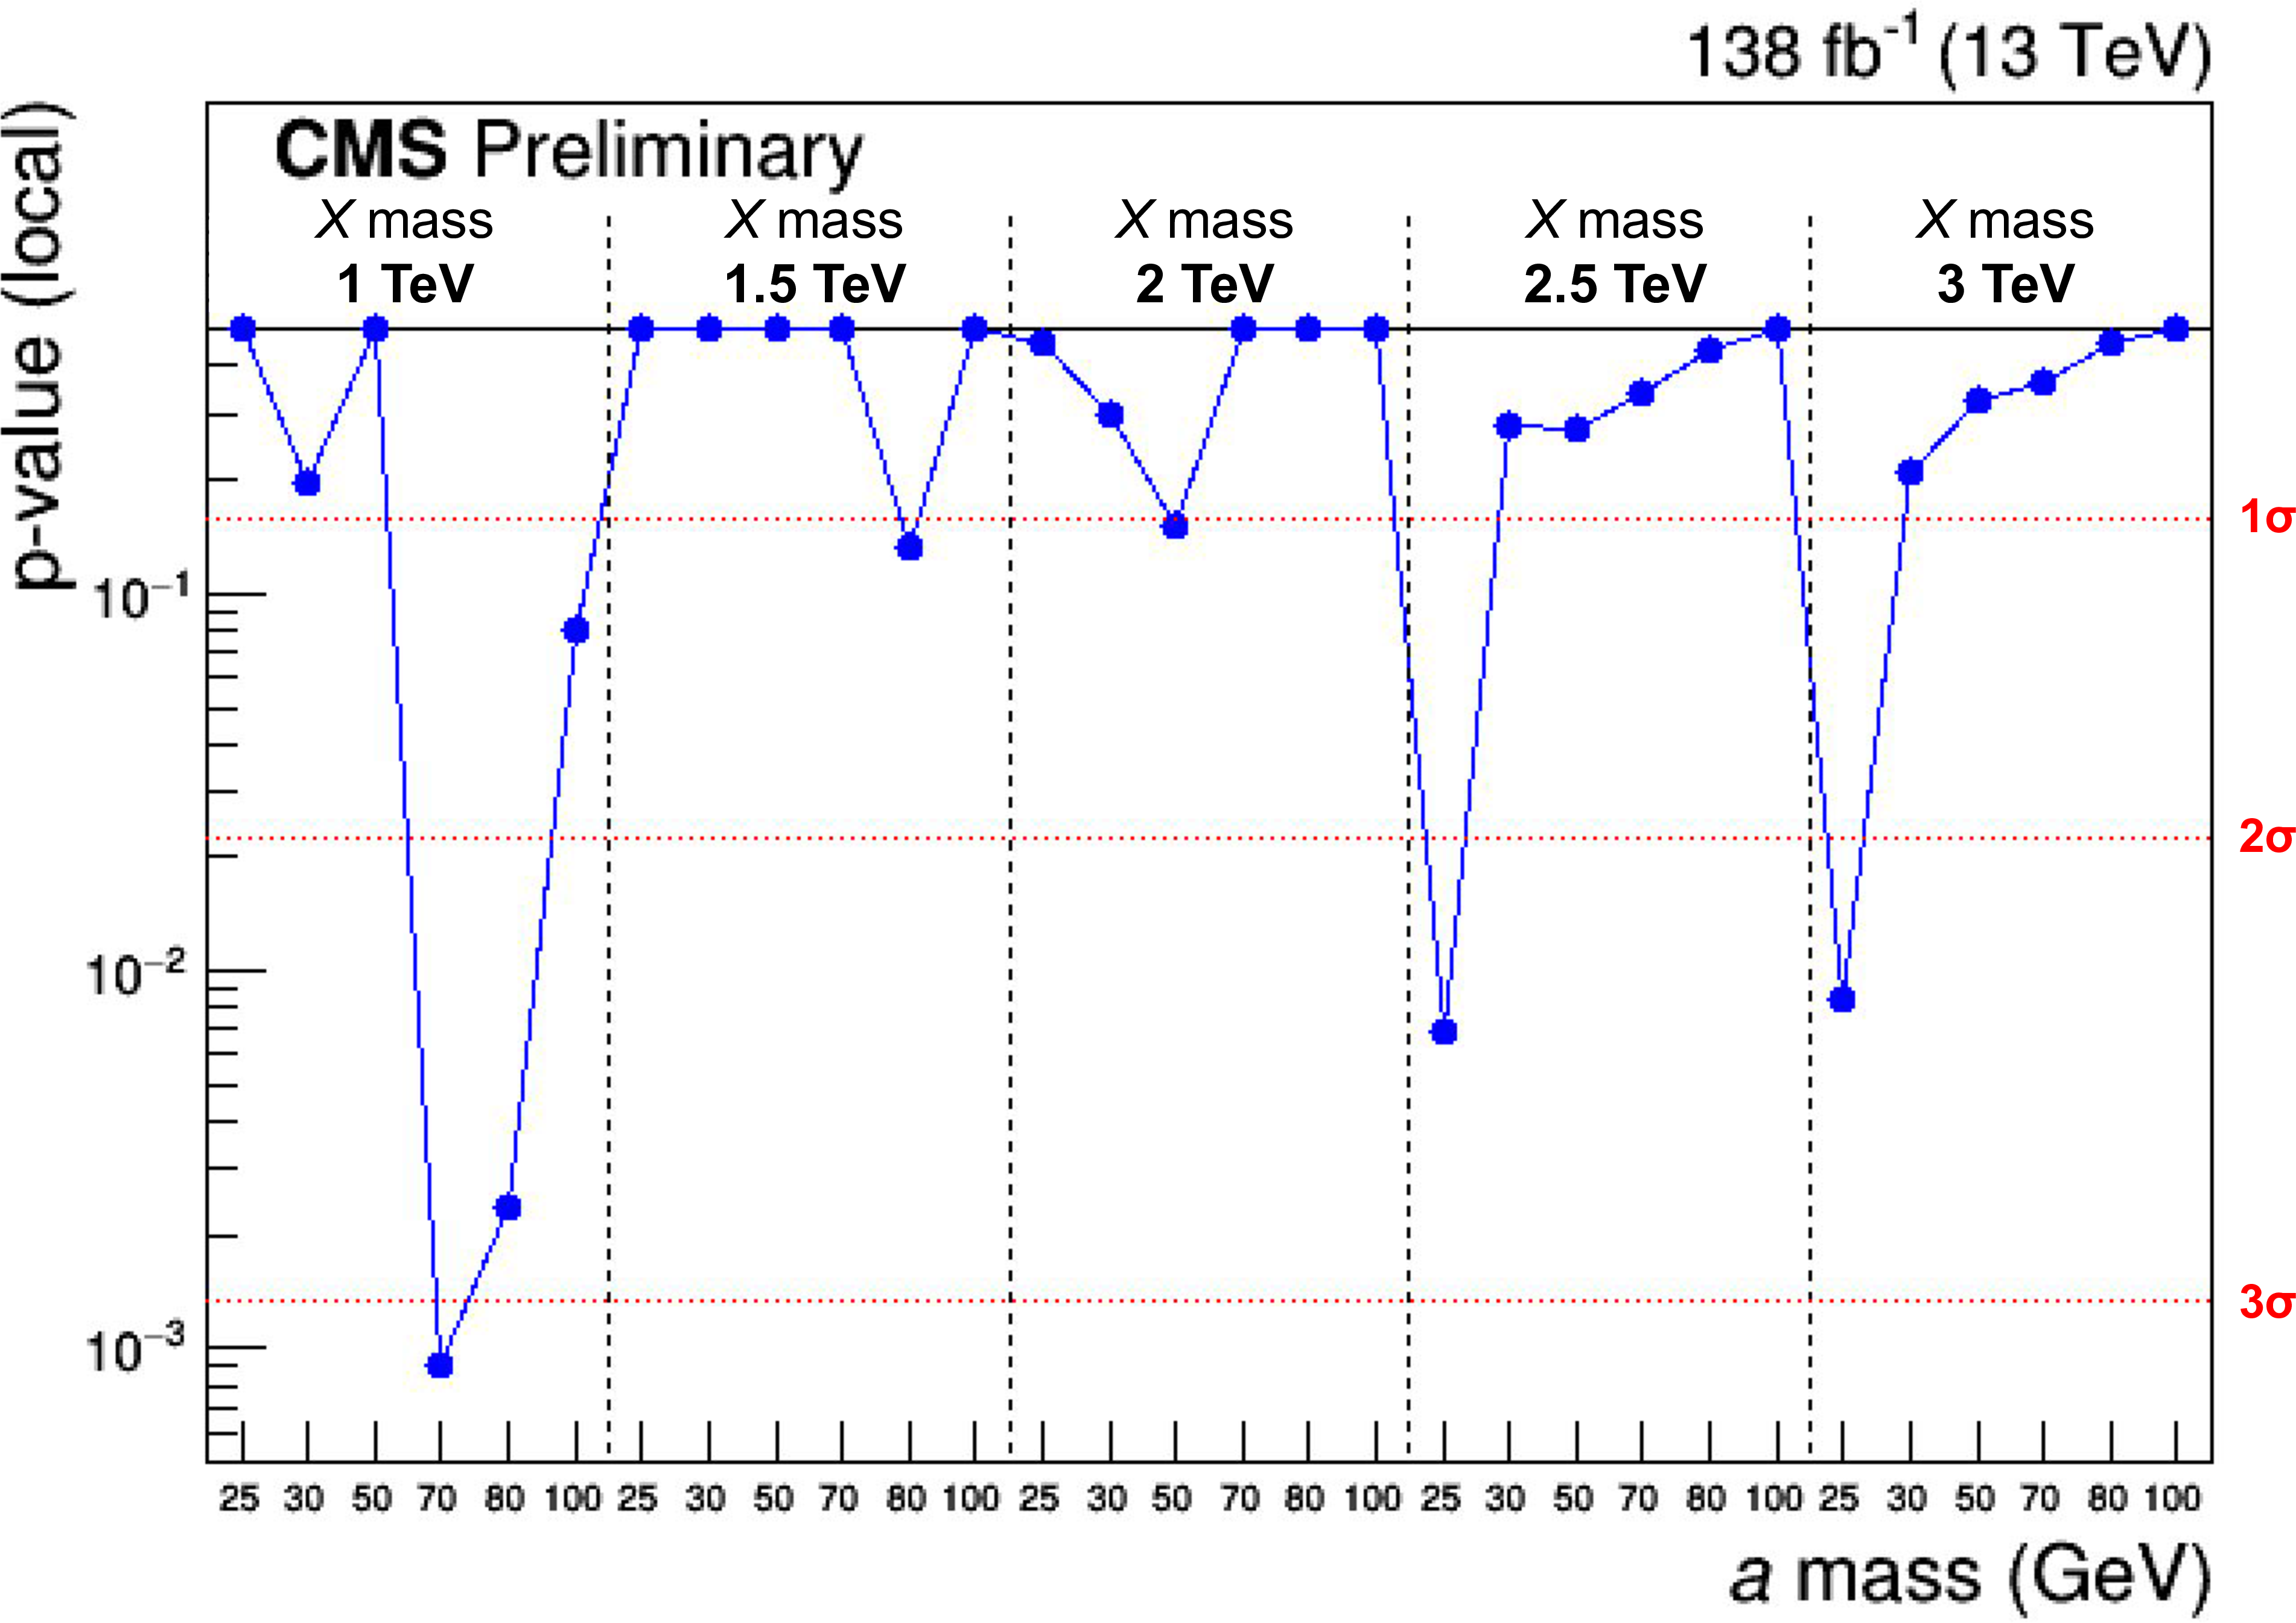
Additional Figure 8:
Local p-values for each signal mass considered in the analysis. The minimum p-value, for the 1 TeV $X$, 70 GeV $a$ signal point is 0.0008, corresponding to a local significance of 3.12$\sigma $. |
png pdf |
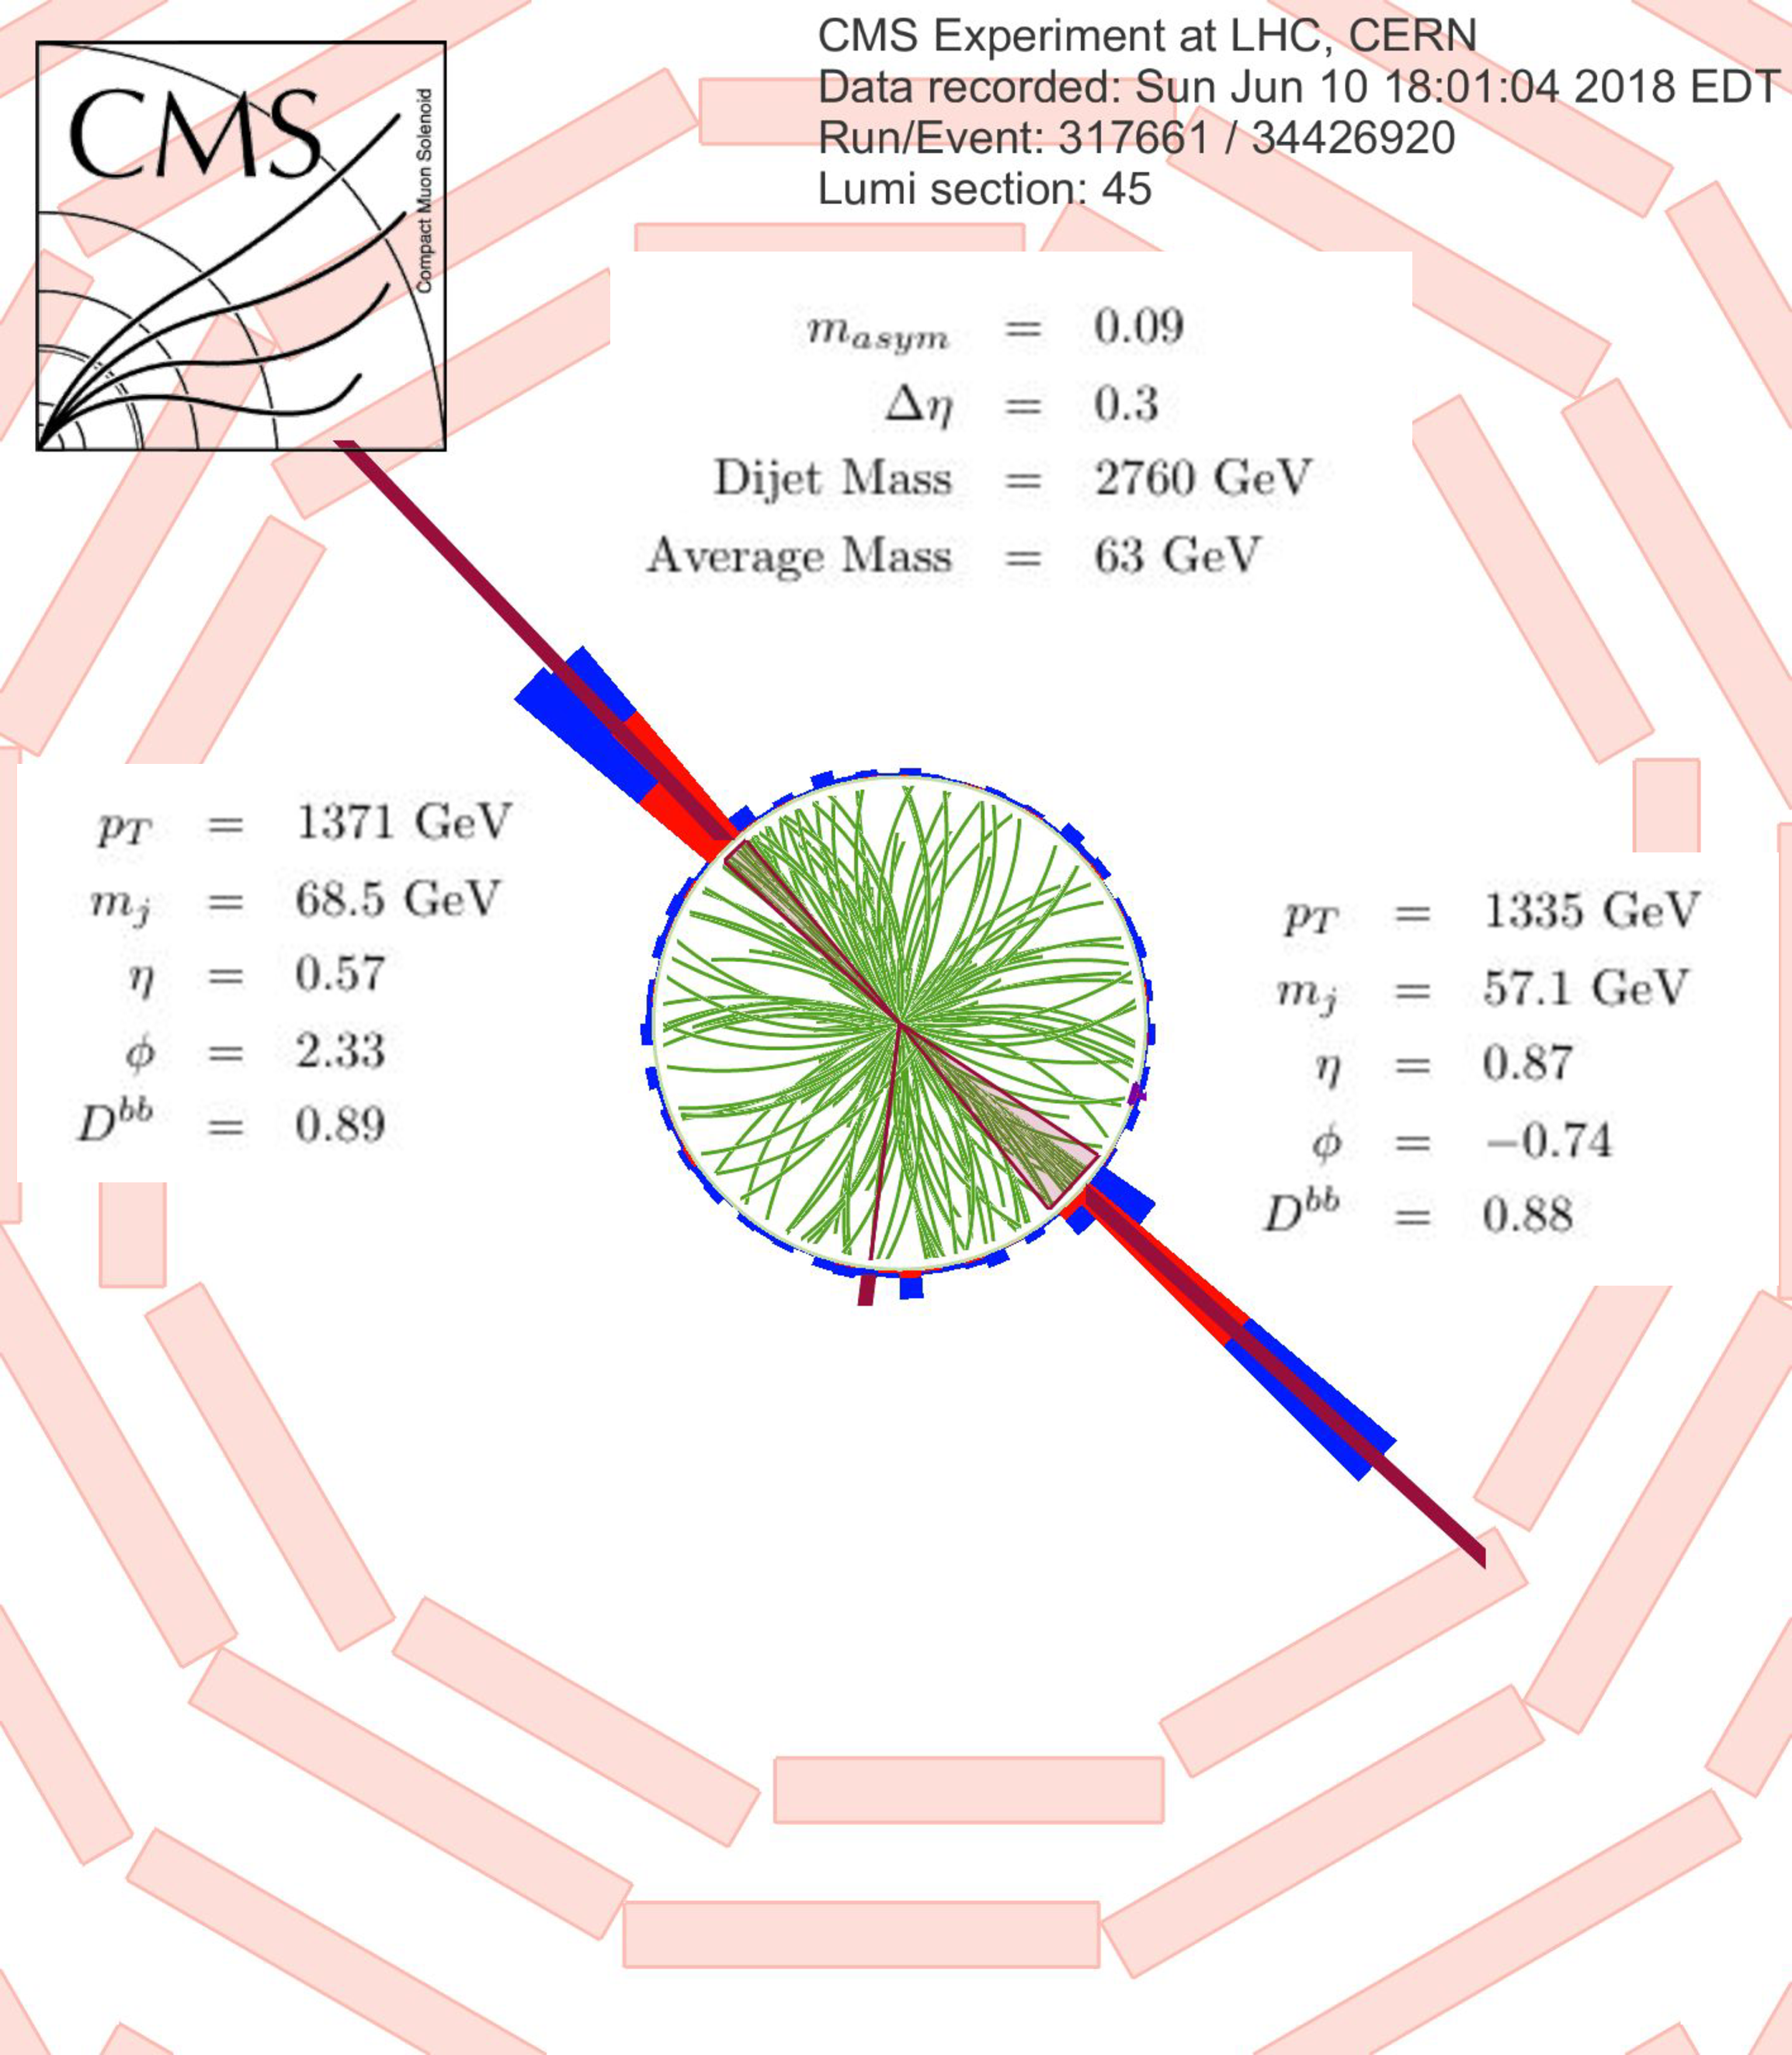
Additional Figure 9:
Candidate event display 1. |
png pdf |
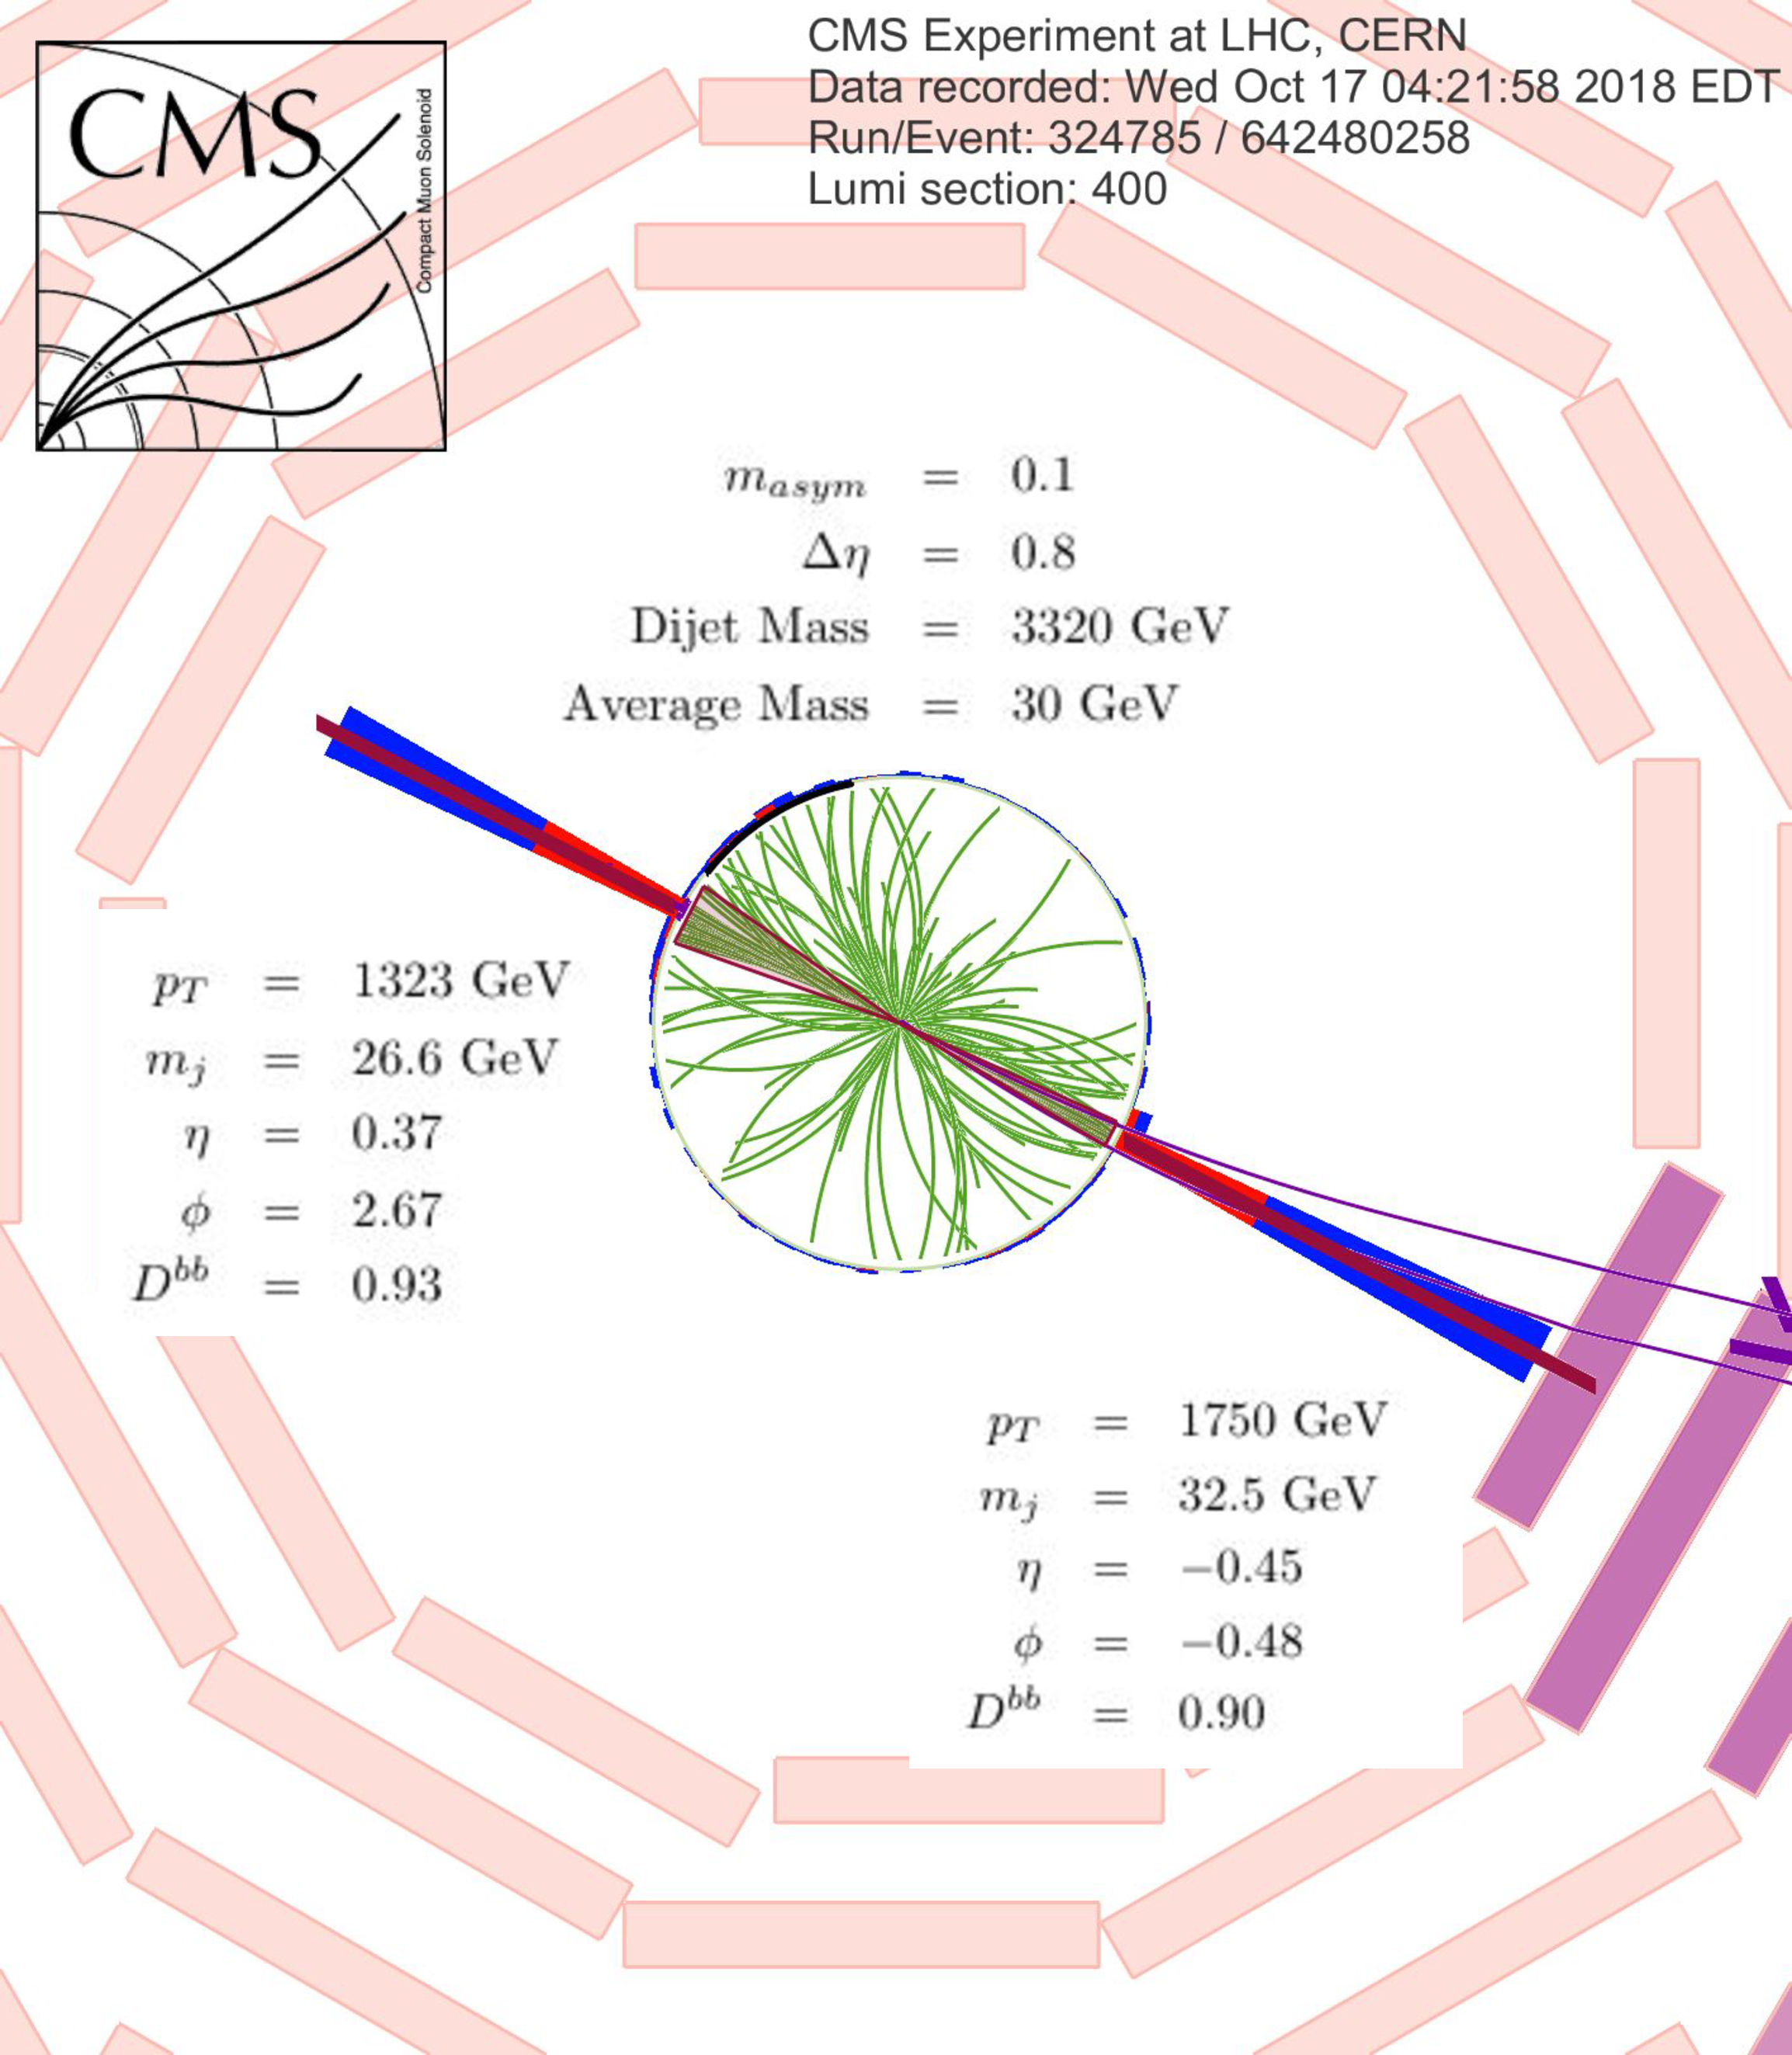
Additional Figure 10:
Candidate event display 2. |
| References | ||||
| 1 | G. Aad et al. | Measurements of the Higgs boson production and decay rates and constraints on its couplings from a combined ATLAS and CMS analysis of the LHC pp collision data at $ \sqrt{s} = $ 7 and 8 TeV | JHEP 2016 (2016) 45 | |
| 2 | G. C. Dorsch, S. J. Huber, K. Mimasu, and J. M. No | Hierarchical versus degenerate 2HDM: The LHC Run 1 legacy at the onset of Run 2 | PRD 93 (Jun, 2016) 115033 | |
| 3 | F. Kling, J. M. No, and S. Su | Anatomy of exotic Higgs decays in 2HDM | JHEP 2016 (2016) 93 | |
| 4 | S. Baum and N. R. Shah | Two Higgs doublets and a complex singlet: disentangling the decay topologies and associated phenomenology | JHEP 2018 (2018) 44 | |
| 5 | D. Barducci, G. Bélanger, C. Hugonie, and A. Pukhov | Status and prospects of the nMSSM after LHC Run-1 | JHEP 2016 (2016) 50 | |
| 6 | U. Ellwanger and M. Rodríguez-Vázquez | Simultaneous search for extra light and heavy Higgs bosons via cascade decays | JHEP 2017 (2017) 8 | |
| 7 | S. Baum, N. R. Shah, and K. Freese | The NMSSM is within reach of the LHC: mass correlations & decay signatures | JHEP 2019 (2019) 11 | |
| 8 | T. Robens, T. Stefaniak, and J. Wittbrodt | Two-real-scalar-singlet extension of the SM: LHC phenomenology and benchmark scenarios | EPJC 80 (2020) 151 | |
| 9 | CMS Collaboration | The CMS experiment at the CERN LHC | JINST 3 (2008) S08004 | CMS-00-001 |
| 10 | CMS Collaboration | Precision luminosity measurement in proton-proton collisions at $ \sqrt{s} = $ 13 TeV in 2015 and 2016 at CMS | 2021. Submitted to EPJC | CMS-LUM-17-003 2104.01927 |
| 11 | CMS Collaboration | CMS luminosity measurement for the 2017 data-taking period at $ \sqrt{s} = $ 13 TeV | CMS-PAS-LUM-17-004 | CMS-PAS-LUM-17-004 |
| 12 | CMS Collaboration | CMS luminosity measurement for the 2018 data-taking period at $ \sqrt{s} = $ 13 TeV | CMS-PAS-LUM-18-002 | CMS-PAS-LUM-18-002 |
| 13 | ATLAS Collaboration | Search for Higgs boson pair production in the $ \mathrm{b\bar{b}}\mathrm{b\bar{b}} $ final state from pp collisions at $ \sqrt{s} = $ 8 TeV with the ATLAS detector | EPJC 75 (2015) 412 | 1506.00285 |
| 14 | ATLAS Collaboration | Search for pair production of Higgs bosons in the $ \mathrm{b\bar{b}}\mathrm{b\bar{b}} $ final state using proton--proton collisions at $ \sqrt{s} = $ 13 TeV with the ATLAS detector | PRD 94 (2016) 052002 | 1606.04782 |
| 15 | ATLAS Collaboration | Search for pair production of Higgs bosons in the $ b\bar{b}b\bar{b} $ final state using proton-proton collisions at $ \sqrt{s} = $ 13 TeV with the ATLAS detector | JHEP 01 (2019) 030 | 1804.06174 |
| 16 | CMS Collaboration | Search for a massive resonance decaying to a pair of Higgs bosons in the four b quark final state in proton-proton collisions at $ \sqrt{s}= $ 13 TeV | PLB 781 (2018) 244 | 1710.04960 |
| 17 | CMS Collaboration | Search for production of Higgs boson pairs in the four b quark final state using large-area jets in proton-proton collisions at $ \sqrt{s}= $ 13 TeV | JHEP 01 (2019) 040 | CMS-B2G-17-019 1808.01473 |
| 18 | CMS Collaboration | The CMS trigger system | JINST 12 (2017) P01020 | CMS-TRG-12-001 1609.02366 |
| 19 | J. Alwall et al. | The automated computation of tree-level and next-to-leading order differential cross sections, and their matching to parton shower simulations | JHEP 07 (2014) 079 | 1405.0301 |
| 20 | G. Bozzi, S. Catani, D. de Florian, and M. Grazzini | The q(T) spectrum of the Higgs boson at the LHC in QCD perturbation theory | PLB564 (2003) 65 | hep-ph/0302104 |
| 21 | G. Bozzi, S. Catani, D. de Florian, and M. Grazzini | Transverse-momentum resummation and the spectrum of the Higgs boson at the LHC | NPB737 (2006) 73 | hep-ph/0508068 |
| 22 | D. de Florian, G. Ferrera, M. Grazzini, and D. Tommasini | Transverse-momentum resummation: Higgs boson production at the Tevatron and the LHC | JHEP 11 (2011) 064 | 1109.2109 |
| 23 | P. Nason | A New Method for Combining NLO QCD with Shower Monte Carlo Algorithms | JHEP 11 (2004) 040 | hep-ph/0409146 |
| 24 | S. Frixione, P. Nason, and C. Oleari | Matching NLO QCD computations with Parton Shower simulations: the POWHEG method | JHEP 11 (2007) 070 | 0709.2092 |
| 25 | S. Alioli, P. Nason, C. Oleari, and E. Re | A general framework for implementing NLO calculations in shower Monte Carlo programs: the POWHEG BOX | JHEP 06 (2010) 043 | 1002.2581 |
| 26 | T. Sjostrand et al. | An introduction to PYTHIA 8.2 | CPC 191 (2015) 159--177 | 1410.3012 |
| 27 | J. Alwall et al. | Comparative study of various algorithms for the merging of parton showers and matrix elements in hadronic collisions | EPJC 53 (2008) 473 | 0706.2569 |
| 28 | CMS Collaboration | Event generator tunes obtained from underlying event and multiparton scattering measurements | EPJC 76 (2016) 155 | CMS-GEN-14-001 1512.00815 |
| 29 | NNPDF Collaboration | Parton distributions for the LHC Run II | JHEP 04 (2015) 040 | 1410.8849 |
| 30 | GEANT4 Collaboration | GEANT4--a simulation toolkit | NIMA 506 (2003) 250--303 | |
| 31 | CMS Collaboration | Particle-flow reconstruction and global event description with the CMS detector | JINST 12 (2017) P10003 | CMS-PRF-14-001 1706.04965 |
| 32 | M. Cacciari, G. P. Salam, and G. Soyez | FastJet User Manual | EPJC72 (2012) 1896 | 1111.6097 |
| 33 | M. Cacciari, G. P. Salam, and G. Soyez | The anti-$ {k_{\mathrm{T}}} $ clustering algorithm | JHEP 04 (2008) 063 | 0802.1189 |
| 34 | D. Bertolini, P. Harris, M. Low, and N. Tran | Pileup Per Particle Identification | JHEP 10 (2014) 059 | 1407.6013 |
| 35 | CMS Collaboration | Pileup mitigation at CMS in 13 TeV data | JINST 15 (2020) P09018 | CMS-JME-18-001 2003.00503 |
| 36 | CMS Collaboration | Determination of jet energy calibration and transverse momentum resolution in CMS | JINST 6 (2011) 11002 | CMS-JME-10-011 1107.4277 |
| 37 | CMS Collaboration | Identification of heavy-flavour jets with the CMS detector in pp collisions at 13 TeV | JINST 13 (2018) P05011 | CMS-BTV-16-002 1712.07158 |
| 38 | M. Dasgupta, A. Fregoso, S. Marzani, and G. P. Salam | Towards an understanding of jet substructure | JHEP 09 (2013) 029 | 1307.0007 |
| 39 | A. J. Larkoski, S. Marzani, G. Soyez, and J. Thaler | Soft drop | JHEP 05 (2014) 146 | 1402.2657 |
| 40 | CMS Collaboration | Measurement of differential cross sections for top quark pair production using the lepton+jets final state in proton-proton collisions at 13 TeV | PRD 95 (May, 2017) 092001 | |
| 41 | A. L. Read | Presentation of search results: the CL$ _s $ technique | JPG 28 (2002) 2693 | |
| 42 | T. Junk | Confidence level computation for combining searches with small statistics | NIMA 434 (1999) 435 | hep-ex/9902006 |
|
|
Compact Muon Solenoid LHC, CERN |
|

|

|

|

|

|