

Compact Muon Solenoid
LHC, CERN
| CMS-TOP-22-008 ; CERN-EP-2023-146 | ||
| Evidence for tWZ production in proton-proton collisions at $ \sqrt{s} = $ 13 TeV in multilepton final states | ||
| CMS Collaboration | ||
| 19 December 2023 | ||
| Phys. Lett. B 855 (2024) 138815 | ||
| Abstract: The first evidence for the standard model production of a top quark in association with a W boson and a Z boson is reported. The measurement is performed in multilepton final states, where the Z boson is reconstructed via its decays to electron or muon pairs and the W boson decays either to leptons or hadrons. The analysed data were recorded by the CMS experiment at the CERN LHC in 2016-2018 in proton-proton collisions at $ \sqrt{s}= $ 13 TeV, and correspond to an integrated luminosity of 138 fb$ ^{-1} $. The measured cross section is 354 $ \pm $ 54 (stat) $ \pm $ 95 (syst) fb, and corresponds to a statistical significance of 3.4 standard deviations. | ||
| Links: e-print arXiv:2312.11668 [hep-ex] (PDF) ; CDS record ; inSPIRE record ; HepData record ; Physics Briefing ; CADI line (restricted) ; | ||
| Figures | |

png pdf |
Figure 1:
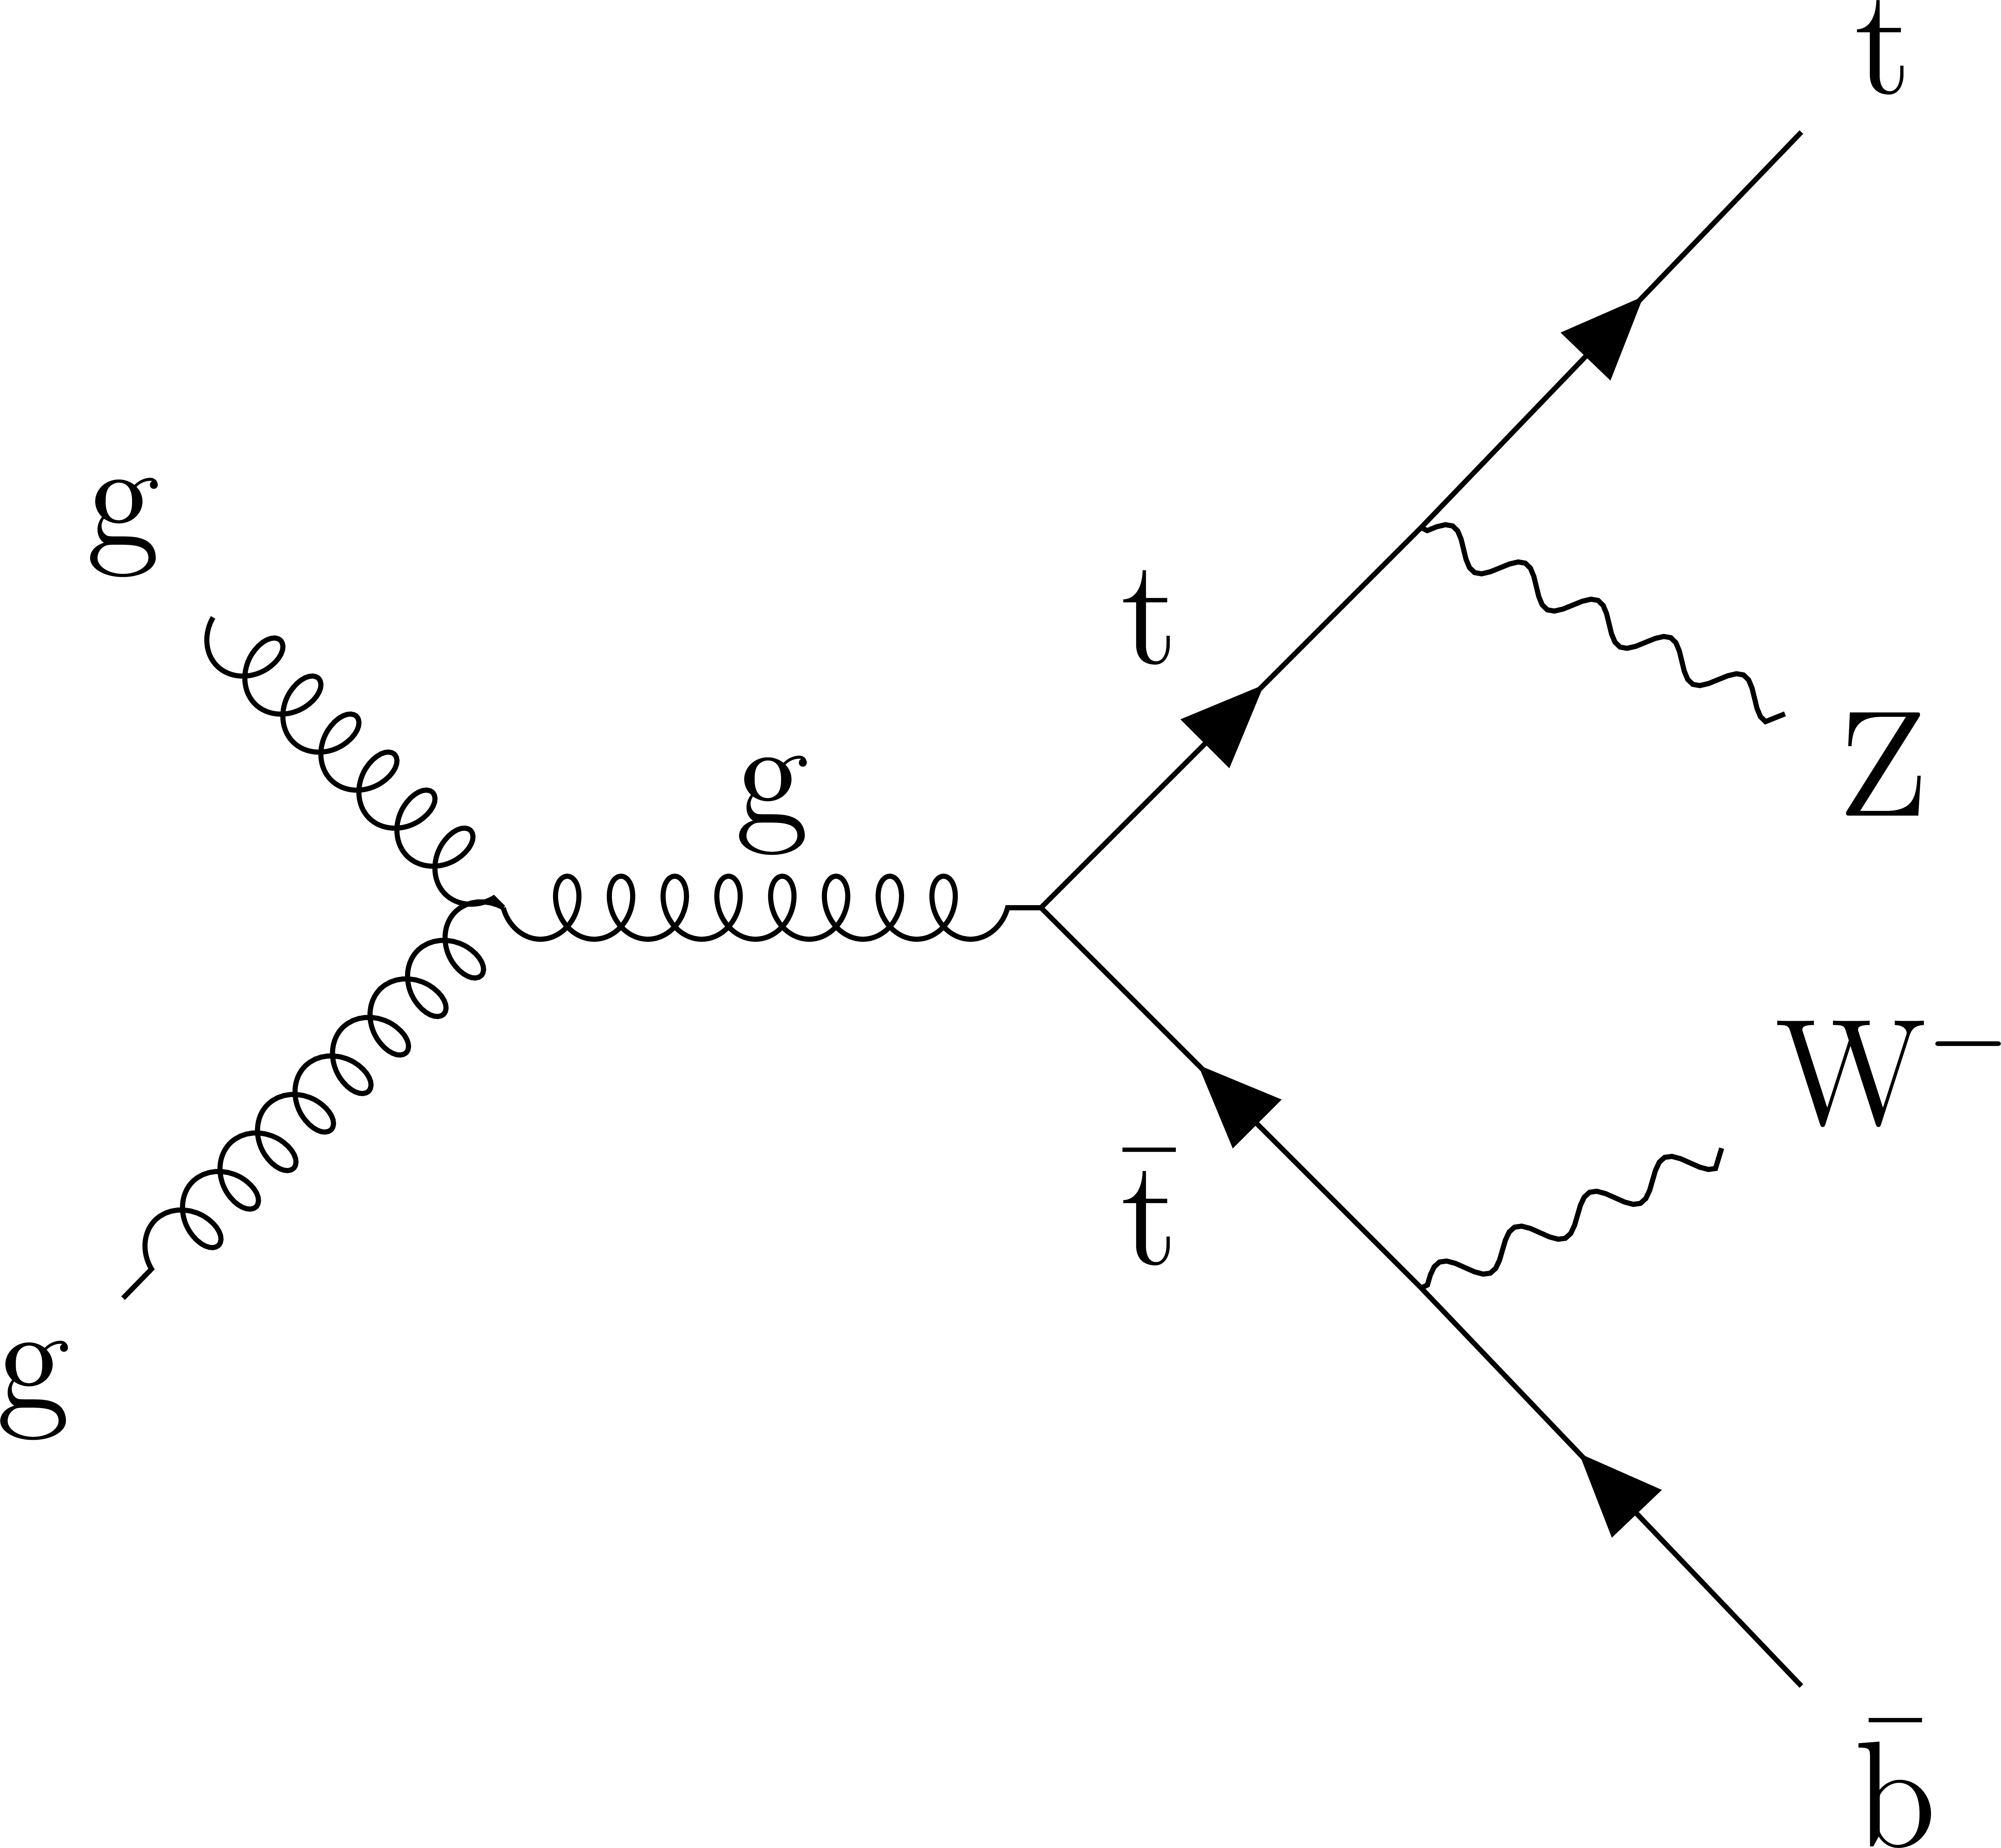
Feynman diagrams for the $ \mathrm{t}\mathrm{W}\mathrm{Z} $ production at LO (left) and NLO (middle) accuracy in QCD, and for the $ {\mathrm{t}\overline{\mathrm{t}}} \mathrm{Z} $ production at the lowest order in perturbative QCD (right). The $ {\mathrm{t}\overline{\mathrm{t}}} \mathrm{Z} $ diagram can also arise when simulating the $ \mathrm{t}\mathrm{W}\mathrm{Z} $ process at NLO accuracy in QCD. The middle and right diagrams share the same final state, and are different in the number of resonant top quarks. |

png pdf |
Figure 1-a:
Feynman diagram for the $ \mathrm{t}\mathrm{W}\mathrm{Z} $ production at LO accuracy in QCD. |
png pdf |
Figure 1-b:
Feynman diagram for the $ \mathrm{t}\mathrm{W}\mathrm{Z} $ production at NLO accuracy in QCD. |

png pdf |
Figure 1-c:
Feynman diagram for the $ {\mathrm{t}\overline{\mathrm{t}}} \mathrm{Z} $ production arising when simulating the $ \mathrm{t}\mathrm{W}\mathrm{Z} $ process at NLO accuracy in QCD. |

png pdf |
Figure 2:
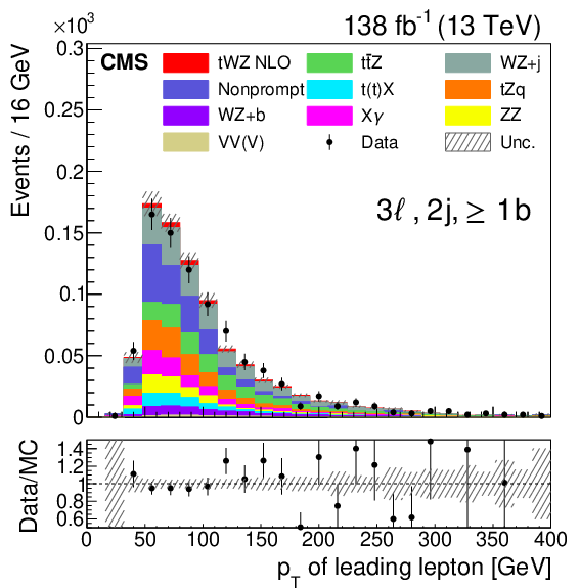
Pre-fit examples of the input features for the two DNN trainings: the $ {p_{\mathrm{T}}}_{\ell{\mathrm{j}} }^{\text{max}} $ (upper left) and $ m_{\text{sys}} $ (upper right) observables in $ \text{SR}_{3\ell,3{\mathrm{j}} } $, as well as the $ p_{\mathrm{T}} $ of the leading lepton (lower left) and leading jet (lower right) in $ \text{SR}_{3\ell,2{\mathrm{j}} } $. The VV(V) group in the legend denotes the VVV, WW, and W in association with jets backgrounds. The dashed band shows the total uncertainty (statistical and systematic) before the fit. |

png pdf |
Figure 2-a:
Pre-fit distribution for $ {p_{\mathrm{T}}}_{\ell{\mathrm{j}} }^{\text{max}} $ in $ \text{SR}_{3\ell,3{\mathrm{j}} } $. The VV(V) group in the legend denotes the VVV, WW, and W in association with jets backgrounds. The dashed band shows the total uncertainty (statistical and systematic) before the fit. |

png pdf |
Figure 2-b:
Pre-fit distribution for $ m_{\text{sys}} $ in $ \text{SR}_{3\ell,3{\mathrm{j}} } $. The VV(V) group in the legend denotes the VVV, WW, and W in association with jets backgrounds. The dashed band shows the total uncertainty (statistical and systematic) before the fit. |
png pdf |
Figure 2-c:
Pre-fit distribution for the $ p_{\mathrm{T}} $ of the leading lepton in $ \text{SR}_{3\ell,2{\mathrm{j}} } $. The VV(V) group in the legend denotes the VVV, WW, and W in association with jets backgrounds. The dashed band shows the total uncertainty (statistical and systematic) before the fit. |

png pdf |
Figure 2-d:
Pre-fit distribution for the $ p_{\mathrm{T}} $ of the leading jet in $ \text{SR}_{3\ell,2{\mathrm{j}} } $. The VV(V) group in the legend denotes the VVV, WW, and W in association with jets backgrounds. The dashed band shows the total uncertainty (statistical and systematic) before the fit. |

png pdf |
Figure 3:
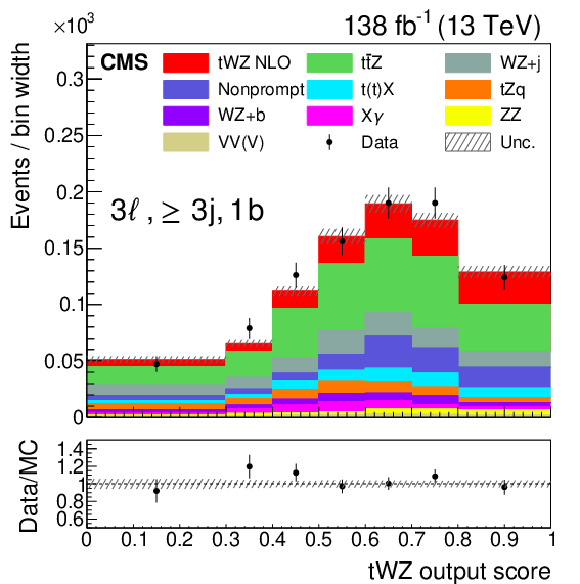
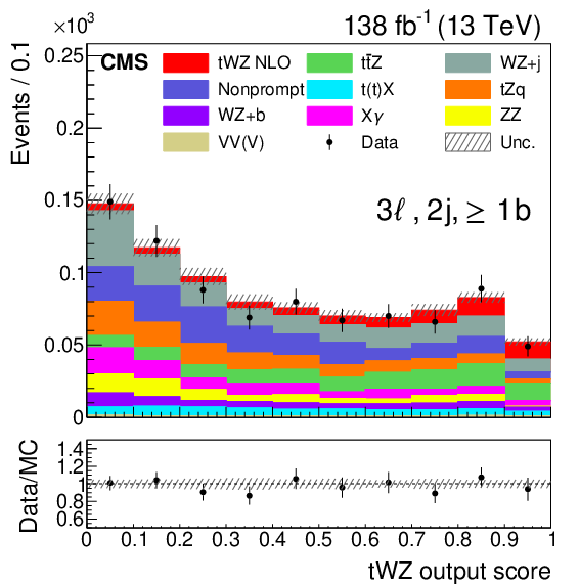
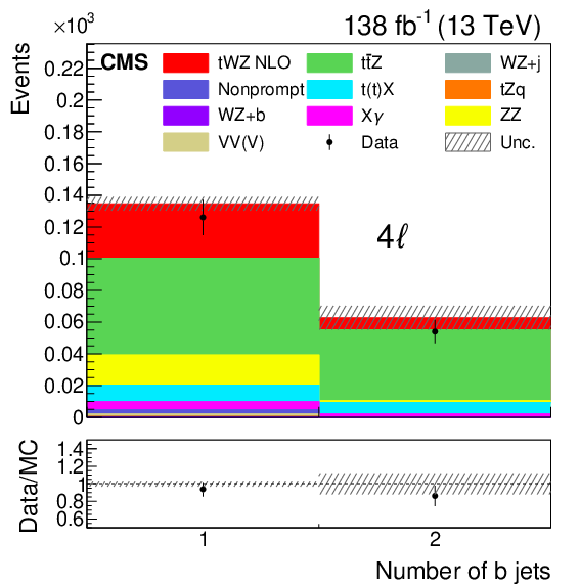
Score of the tWZ output node from the multiclass classifier in $ \text{SR}_{3\ell,3{\mathrm{j}} } $ for events with exactly one b jet (upper left), and of the $ {\mathrm{t}\overline{\mathrm{t}}} \mathrm{Z} $ output node in $ \text{SR}_{3\ell,3{\mathrm{j}} } $ for events with more than one b jet (upper right); score of the tWZ output node of the binary classifier in $ \text{SR}_{3\ell,2{\mathrm{j}} } $ (lower left), and the b jet multiplicity in $ \text{SR}_{4\ell} $ (lower right). The VV(V) group in the legend denotes the VVV, WW, and W in association with jets backgrounds. The dashed band shows the total uncertainty (statistical and systematic) after the fit. |
png pdf |
Figure 3-a:
Score of the tWZ output node from the multiclass classifier in $ \text{SR}_{3\ell,3{\mathrm{j}} } $ for events with exactly one b jet. The VV(V) group in the legend denotes the VVV, WW, and W in association with jets backgrounds. The dashed band shows the total uncertainty (statistical and systematic) after the fit. |

png pdf |
Figure 3-b:
Score of the $ {\mathrm{t}\overline{\mathrm{t}}} \mathrm{Z} $ output node in $ \text{SR}_{3\ell,3{\mathrm{j}} } $ for events with more than one b jet. The VV(V) group in the legend denotes the VVV, WW, and W in association with jets backgrounds. The dashed band shows the total uncertainty (statistical and systematic) after the fit. |
png pdf |
Figure 3-c:
Score of the tWZ output node of the binary classifier in $ \text{SR}_{3\ell,2{\mathrm{j}} } $. The VV(V) group in the legend denotes the VVV, WW, and W in association with jets backgrounds. The dashed band shows the total uncertainty (statistical and systematic) after the fit. |
png pdf |
Figure 3-d:
b jet multiplicity in $ \text{SR}_{4\ell} $. The VV(V) group in the legend denotes the VVV, WW, and W in association with jets backgrounds. The dashed band shows the total uncertainty (statistical and systematic) after the fit. |
png pdf |
Figure 4:
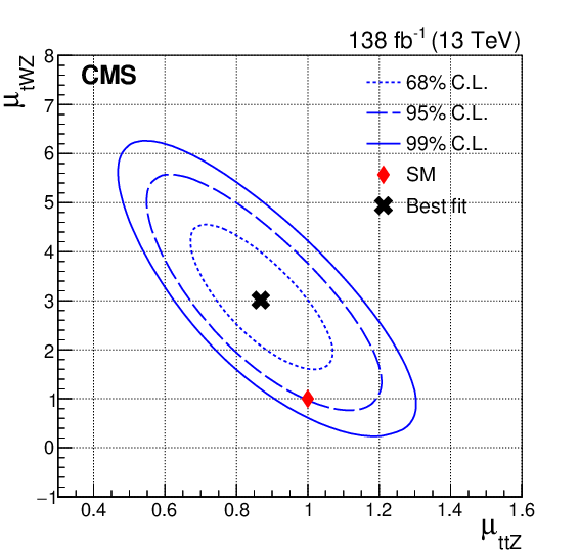
Two-dimensional likelihood scan of the signal strenghts of tWZ ($ \mu_{\mathrm{t}\mathrm{W}\mathrm{Z}} $) vs. $ {\mathrm{t}\overline{\mathrm{t}}} \mathrm{Z} $ ($ \mu_{{\mathrm{t}\overline{\mathrm{t}}} \mathrm{Z}} $). The blue lines show the 68%, 95%, and 99% confidence level contours. The black cross represents the best-fit value, while the red diamond the SM expectation. |
| Tables | |

png pdf |
Table 1:
Expected yields for signal and background processes and observed number of events in the signal regions. |
png pdf |
Table 2:
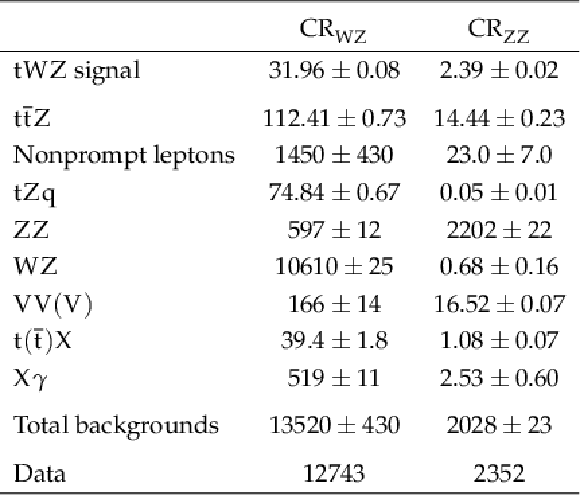
Expected yields for signal and background processes and observed number of events in the control regions. |
| Summary |
| A measurement of the tWZ process is performed in final states with three or four leptons, using the data collected by the CMS experiment at the LHC in 2016-2018, at a center-of-mass energy of 13 TeV, corresponding to an integrated luminosity of 138 fb$ ^{-1} $. To assess backgrounds and establish the signal, the measurement heavily relies on multivariate techniques and the data are exploited in multiple regions and categories. The challenge of the tWZ signal overlapping with the $ {\mathrm{t}\overline{\mathrm{t}}} \mathrm{Z} $ background is overcome using the latest advancements in the tWZ modeling. We find the signal to have an observed statistical significance of 3.4 standard deviations, corresponding to a measured cross section of 354 $ \pm $ 54 (stat) $ \pm $ 95 (syst) fb that is two standard deviations above the standard model prediction. This is the first evidence of the tWZ process. |
| References | ||||
| 1 | F. Maltoni, L. Mantani, and K. Mimasu | Top-quark electroweak interactions at high energy | JHEP 10 (2019) 004 | 1904.05637 |
| 2 | H. El Faham, F. Maltoni, K. Mimasu, and M. Zaro | Single top production in association with a $ {\mathrm{W}\mathrm{Z}} $ pair at the LHC in the SMEFT | JHEP 01 (2022) 100 | 2111.03080 |
| 3 | J. Alwall et al. | The automated computation of tree-level and next-to-leading order differential cross sections, and their matching to parton shower simulations | JHEP 07 (2014) 079 | 1405.0301 |
| 4 | R. Frederix and S. Frixione | Merging meets matching in MC@NLO | JHEP 12 (2012) 061 | 1209.6215 |
| 5 | A. Kulesza et al. | Associated top quark pair production with a heavy boson: differential cross sections at NLO+NNLL accuracy | EPJC 80 (2020) 428 | 2001.03031 |
| 6 | J. Keaveney | Constraining the SMEFT with a differential cross section measurement of $ {\mathrm{t}\mathrm{W}\mathrm{Z}} $ production at the HL-LHC | PRD 107 (2023) 036021 | 2107.01053 |
| 7 | CMS Collaboration | HEPData record for this analysis | link | |
| 8 | CMS Collaboration | The CMS experiment at the CERN LHC | JINST 3 (2008) S08004 | |
| 9 | CMS Collaboration | Development of the CMS detector for the CERN LHC Run 3 | Accepted by JINST, 2023 | CMS-PRF-21-001 2309.05466 |
| 10 | CMS Collaboration | Performance of the CMS Level-1 trigger in proton-proton collisions at $ \sqrt{s}= $ 13 TeV | JINST 15 (2020) P10017 | CMS-TRG-17-001 2006.10165 |
| 11 | CMS Collaboration | The CMS trigger system | JINST 12 (2017) P01020 | CMS-TRG-12-001 1609.02366 |
| 12 | CMS Collaboration | Inclusive and differential cross section measurements of single top quark production in association with a Z boson in proton-proton collisions at $ \sqrt{s}= $ 13 TeV | JHEP 02 (2022) 107 | CMS-TOP-20-010 2111.02860 |
| 13 | T. Sjöstrand et al. | An introduction to PYTHIA8.2 | Comput. Phys. Commun. 191 (2015) 159 | 1410.3012 |
| 14 | NNPDF Collaboration | Parton distributions from high-precision collider data | EPJC 77 (2017) 663 | 1706.00428 |
| 15 | S. Frixione et al. | Automated simulations beyond the standard model: supersymmetry | JHEP 12 (2019) 008 | 1907.04898 |
| 16 | F. Demartin et al. | $ {\mathrm{t}\mathrm{W}\mathrm{H}} $ associated production at the LHC | EPJC 77 (2017) 34 | 1607.05862 |
| 17 | J. M. Campbell and R. K. Ellis | MCFM for the Tevatron and the LHC | in 10th DESY Workshop on Elementary Particle Theory: Loops and Legs in Quantum Field Theory (LL): Wörlitz, Germany, 2010 NPB Proc. Suppl. 205-206 (2010) 10 |
1007.3492 |
| 18 | P. Nason | A new method for combining NLO QCD with shower Monte Carlo algorithms | JHEP 11 (2004) 040 | hep-ph/0409146 |
| 19 | S. Frixione, P. Nason, and C. Oleari | Matching NLO QCD computations with parton shower simulations: the POWHEG method | JHEP 11 (2007) 070 | 0709.2092 |
| 20 | S. Alioli, P. Nason, C. Oleari, and E. Re | A general framework for implementing NLO calculations in shower Monte Carlo programs: the POWHEG \textscbox | JHEP 06 (2010) 043 | 1002.2581 |
| 21 | H. B. Hartanto, B. J ä ger, L. Reina, and D. Wackeroth | Higgs boson production in association with top quarks in the POWHEG \textscbox | PRD 91 (2015) 094003 | 1501.04498 |
| 22 | CMS Collaboration | Extraction and validation of a new set of CMS PYTHIA8 tunes from underlying-event measurements | EPJC 80 (2020) 4 | CMS-GEN-17-001 1903.12179 |
| 23 | J. Alwall et al. | Comparative study of various algorithms for the merging of parton showers and matrix elements in hadronic collisions | EPJC 53 (2008) 473 | 0706.2569 |
| 24 | GEANT4 Collaboration | GEANT 4---a simulation toolkit | NIM A 506 (2003) 250 | |
| 25 | M. Czakon, P. Fiedler, and A. Mitov | Total top-quark pair-production cross section at hadron colliders through $ \mathcal{O}({\alpha_\mathrm{S}}^4) $ | PRL 110 (2013) 252004 | 1303.6254 |
| 26 | D. Pagani, I. Tsinikos, and E. Vryonidou | NLO QCD+EW predictions for $ {\mathrm{t}\mathrm{H}\mathrm{j}} $ and $ {\mathrm{t}\mathrm{Z}\mathrm{j}} $ production at the LHC | JHEP 08 (2020) 082 | 2006.10086 |
| 27 | M. Grazzini et al. | NNLO QCD + NLO EW with \textscmatrix+\textscOpenLoops: precise predictions for vector-boson pair production | JHEP 02 (2020) 087 | 1912.00068 |
| 28 | R. Frederix and I. Tsinikos | On improving NLO merging for $ {{\mathrm{t}\overline{\mathrm{t}}} \mathrm{W}} $ production | JHEP 11 (2021) 029 | 2108.07826 |
| 29 | CMS Collaboration | Particle-flow reconstruction and global event description with the CMS detector | JINST 12 (2017) P10003 | CMS-PRF-14-001 1706.04965 |
| 30 | CMS Collaboration | Technical proposal for the Phase-II upgrade of the Compact Muon Solenoid | CMS Technical Proposal CERN-LHCC-2015-010, CMS-TDR-15-02, 2015 CDS |
|
| 31 | CMS Collaboration | Observation of four top quark production in proton-proton collisions at $ \sqrt{s}= $ 13 TeV | PLB 847 (2023) 138290 | CMS-TOP-22-013 2305.13439 |
| 32 | CMS Collaboration | Muon identification using multivariate techniques in the CMS experiment in proton-proton collisions at $ \sqrt{s}= $ 13 TeV | Accepted by JINST, 2023 | CMS-MUO-22-001 2310.03844 |
| 33 | M. Cacciari, G. P. Salam, and G. Soyez | The anti-$ k_{\mathrm{T}} $ jet clustering algorithm | JHEP 04 (2008) 063 | 0802.1189 |
| 34 | M. Cacciari, G. P. Salam, and G. Soyez | FASTJET user manual | EPJC 72 (2012) 1896 | 1111.6097 |
| 35 | CMS Collaboration | Performance of the CMS missing transverse momentum reconstruction in $ {\mathrm{p}\mathrm{p}} $ data at $ \sqrt{s}= $ 8 TeV | JINST 10 (2015) P02006 | CMS-JME-13-003 1411.0511 |
| 36 | CMS Collaboration | Identification of heavy-flavour jets with the CMS detector in $ {\mathrm{p}\mathrm{p}} $ collisions at 13 TeV | JINST 13 (2018) P05011 | CMS-BTV-16-002 1712.07158 |
| 37 | E. Bols et al. | Jet flavour classification using DEEPJET | JINST 15 (2020) P12012 | 2008.10519 |
| 38 | CMS Collaboration | Performance summary of AK4 jet b tagging with data from proton-proton collisions at 13 TeV with the CMS detector | CMS Detector Performance Note CMS-DP-2023-005, 2023 CDS |
|
| 39 | Particle Data Group , R. L. Workman et al. | Review of particle physics | Prog. Theor. Exp. Phys. 2022 (2022) 083C01 | |
| 40 | A. J. Larkoski, S. Marzani, G. Soyez, and J. Thaler | Soft drop | JHEP 05 (2014) 146 | 1402.2657 |
| 41 | A. Krizhevsky, I. Sutskever, and G. E. Hinton | ImageNet classification with deep convolutional neural networks | in 25th Conf. on Neural Information Processing Systems (NIPS ): Lake Tahoe NV, USA, 2012 link |
|
| 42 | M. Abadi et al. | TensorFlow: large-scale machine learning on heterogeneous distributed systems | Software available from link |
|
| 43 | CMS Collaboration | Measurement of the $ t $-channel single top quark production cross section in $ {\mathrm{p}\mathrm{p}} $ collisions at $ \sqrt{s}= $ 7 TeV | PRL 107 (2011) 091802 | CMS-TOP-10-008 1106.3052 |
| 44 | CMS Collaboration | The CMS statistical analysis and combination tool: Combine | Submitted to Comput. Softw. Big Sci, 2024 | CMS-CAT-23-001 2404.06614 |
| 45 | CMS Collaboration | Measurement of top quark pair production in association with a Z boson in proton-proton collisions at $ \sqrt{s}= $ 13 TeV | JHEP 03 (2020) 056 | CMS-TOP-18-009 1907.11270 |
| 46 | CMS Collaboration | Precision luminosity measurement in proton-proton collisions at $ \sqrt{s}= $ 13 TeV in 2015 and 2016 at CMS | EPJC 81 (2021) 800 | CMS-LUM-17-003 2104.01927 |
| 47 | CMS Collaboration | CMS luminosity measurement for the 2017 data-taking period at $ \sqrt{s}= $ 13 TeV | CMS Physics Analysis Summary, 2018 CMS-PAS-LUM-17-004 |
CMS-PAS-LUM-17-004 |
| 48 | CMS Collaboration | CMS luminosity measurement for the 2018 data-taking period at $ \sqrt{s}= $ 13 TeV | CMS Physics Analysis Summary, 2019 CMS-PAS-LUM-18-002 |
CMS-PAS-LUM-18-002 |
| 49 | R. Barlow and C. Beeston | Fitting using finite Monte Carlo samples | Comput. Phys. Commun. 77 (1993) 219 | |

|
Compact Muon Solenoid LHC, CERN |

|

|

|

|

|

|