

Compact Muon Solenoid
LHC, CERN
 Visit us: CMS Public Website, CMS Physics ;
Contact us: CMS Publications Committee
Visit us: CMS Public Website, CMS Physics ;
Contact us: CMS Publications Committee
| CMS-HIN-24-015 ; CERN-EP-2026-155 | ||
| Exploring the origin of $ \mathrm{D^0} $ meson elliptic flow in PbPb collisions at $ \sqrt{\smash[b]{s_{_{\mathrm{NN}}}}}= $ 5.02 TeV using event shape engineering | ||
| CMS Collaboration | ||
| 10 July 2026 | ||
| Submitted to Physics Letters B | ||
| Abstract: The influence of the initial-state geometry on the elliptic flow of prompt $ \mathrm{D^0} $ mesons in high-energy heavy ion collisions is explored. A lead-lead (PbPb) data sample at a center-of-mass energy per nucleon pair of 5.02 TeV and with an integrated luminosity of 0.607$ \text{nb}^{-1}$ was collected in 2018 with the CMS detector at the CERN LHC. Based on these data, an event-shape engineering technique is used to isolate collisions with similar geometrical properties. An asymmetry parameter, $ q_2 $, is first determined from the distribution of transverse energy in the forward region of the detector. This parameter is shown to be linearly correlated with the elliptic anisotropy of inclusive charged particles measured near mid-rapidity, as characterized by the second-order Fourier coefficients, $ v_2 $. Taking the charged particle $ v_2 $ coefficients as proxies for the initial-state eccentricity, the correlation of $ \mathrm{D^0} $ meson $ v_2 $ values near mid-rapidity with those of inclusive charged particles is then studied. For $ \mathrm{D^0} $ mesons with transverse momenta in the range of 2--30 GeV and for different degrees of collision overlap, the $ v_2 $ values are found strongly correlated with those for charged particles when selected based on similar $ q_2 $ intervals. This correlation suggests that the initial-state geometry substantially impacts the development of charm-hadron flow in heavy ion collisions. A model calculation that explores the thermalization and collective motion of $ \mathrm{D^0} $ mesons and charged particles is compared to the experimental results. | ||
| Links: e-print arXiv:2607.11017 [hep-ex] (PDF) ; CDS record ; inSPIRE record ; HepData record ; CADI line (restricted) ; | ||
| Figures | |
png pdf |
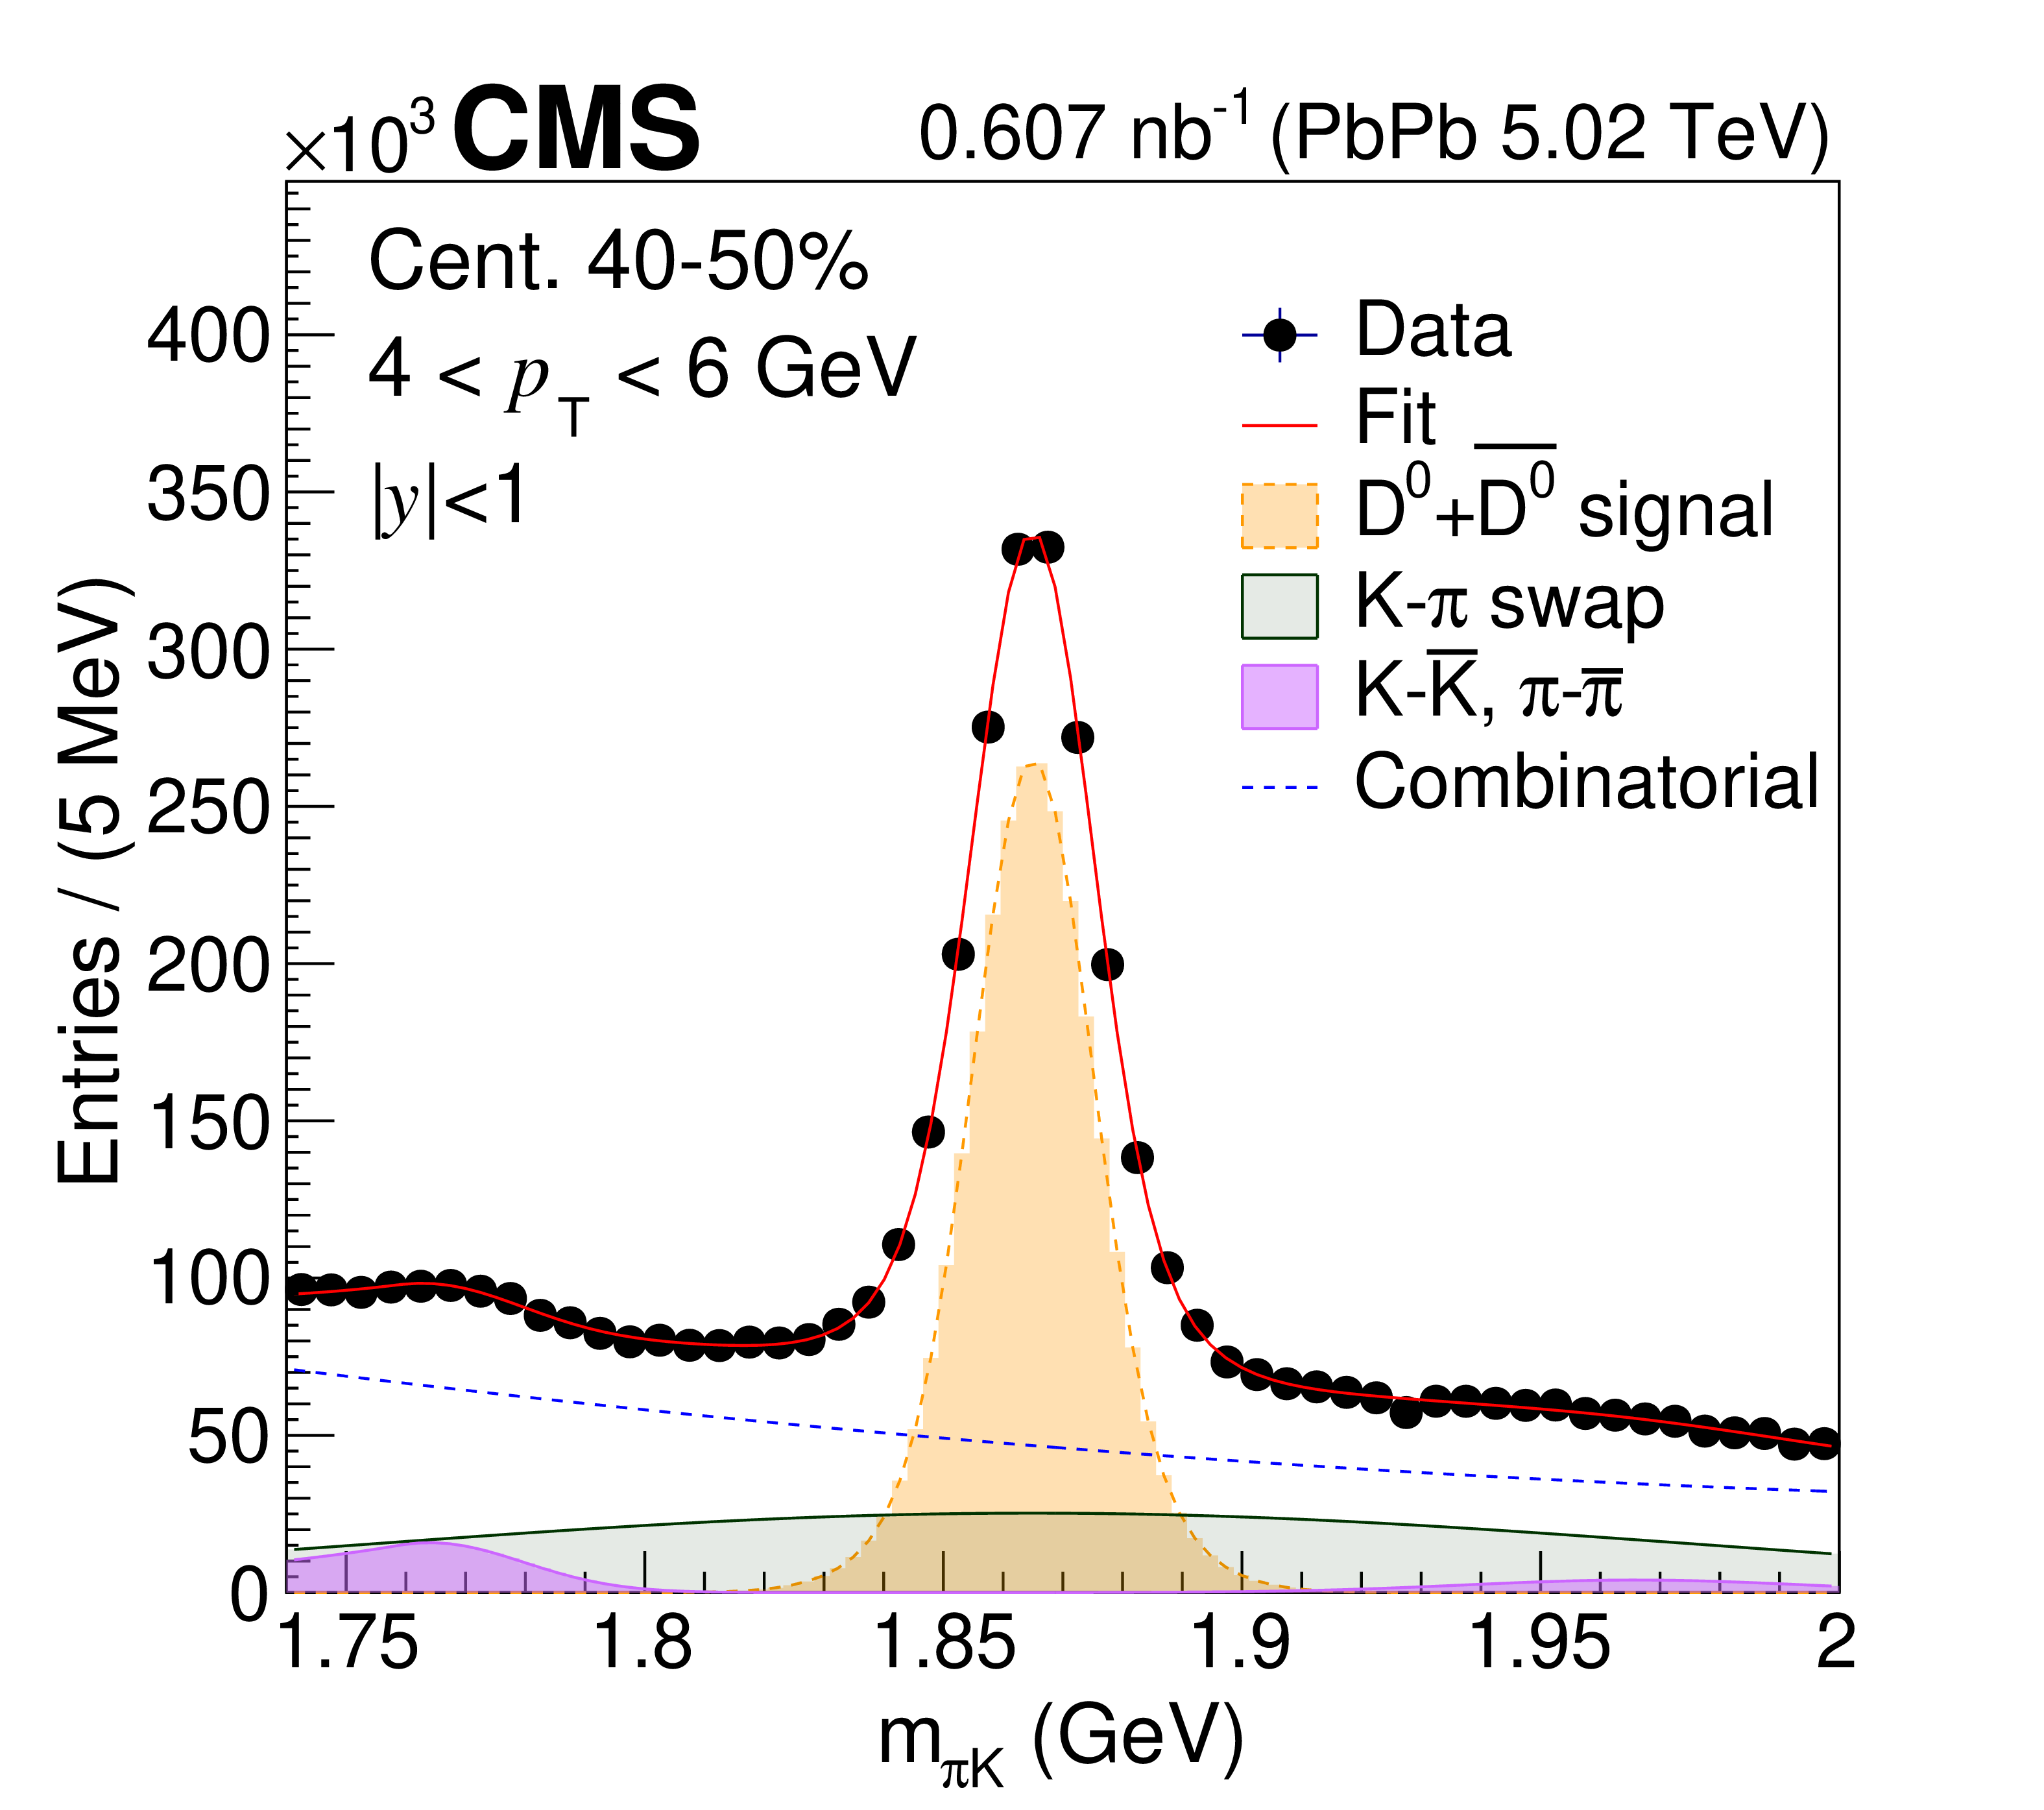
Figure 1:
An example of the fit to the invariant mass spectrum in the centrality class 40--50% and for the $ \mathrm{D^0} p_{\mathrm{T}} $ range 4--6 GeV. |
png pdf |
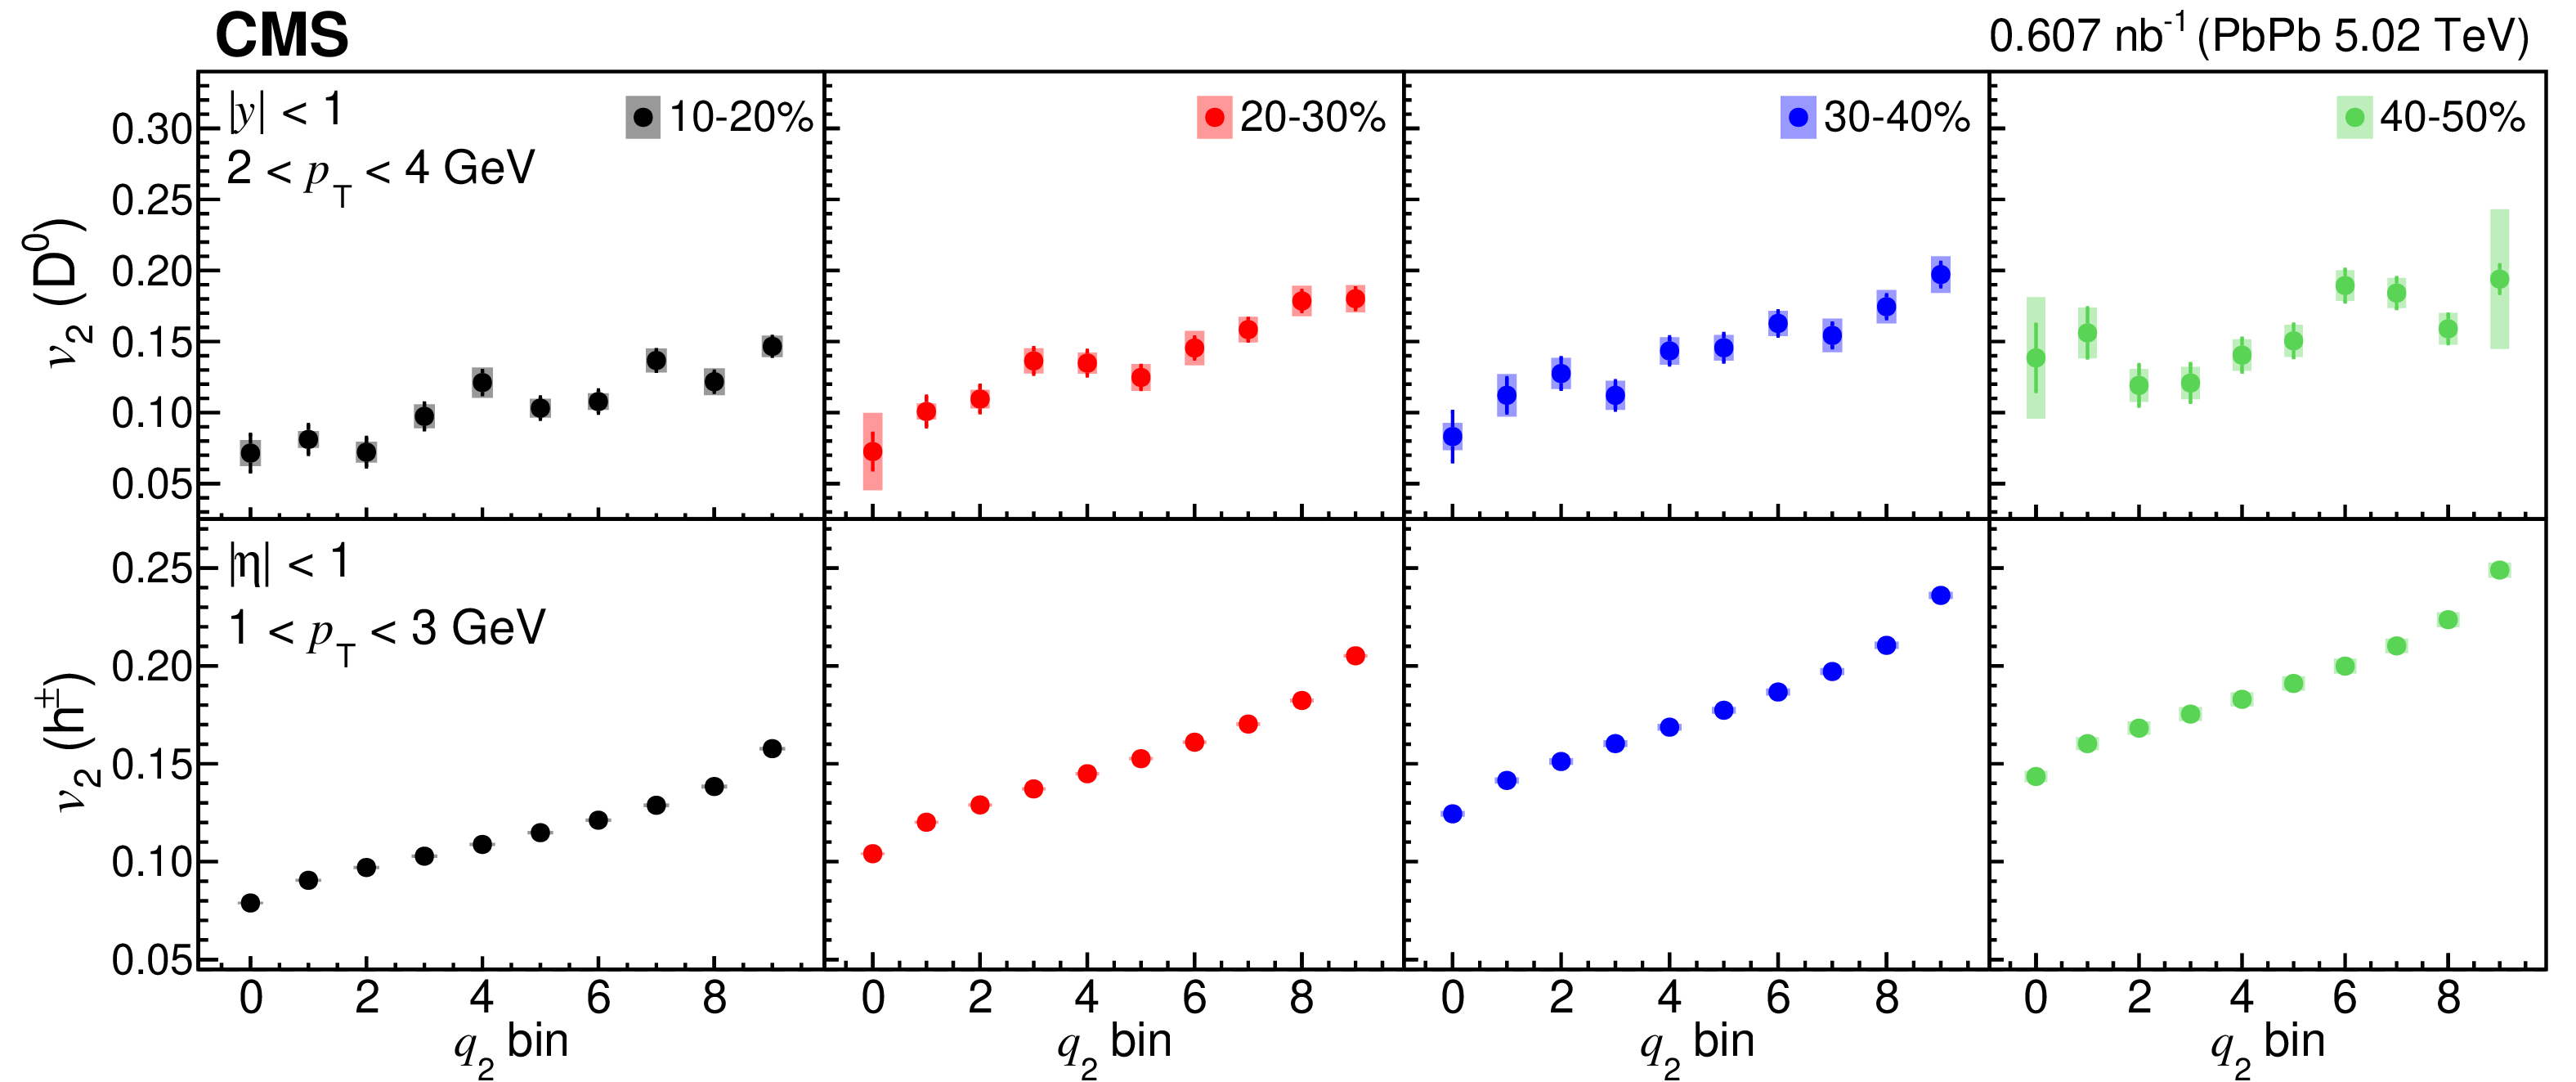
Figure 2:
Dependence of the $ \mathrm{D^0} $ meson (upper row) and the charged particle (lower row) $ v_2 $ values on $ q_2 $. The $ \mathrm{D^0} $ mesons have 2 $ < p_{\mathrm{T}} < $ 4 GeV and $ |y| < $ 1. The inclusive charged particles have 1 $ < p_{\mathrm{T}} < $ 3 GeV and $ |\eta| < $ 1. The plots are shown for events in the centrality ranges of 10--20, 20--30, 30--40 and 40--50%. The vertical lines represent the statistical uncertainties and the boxes represent the systematic uncertainties. |
png pdf |
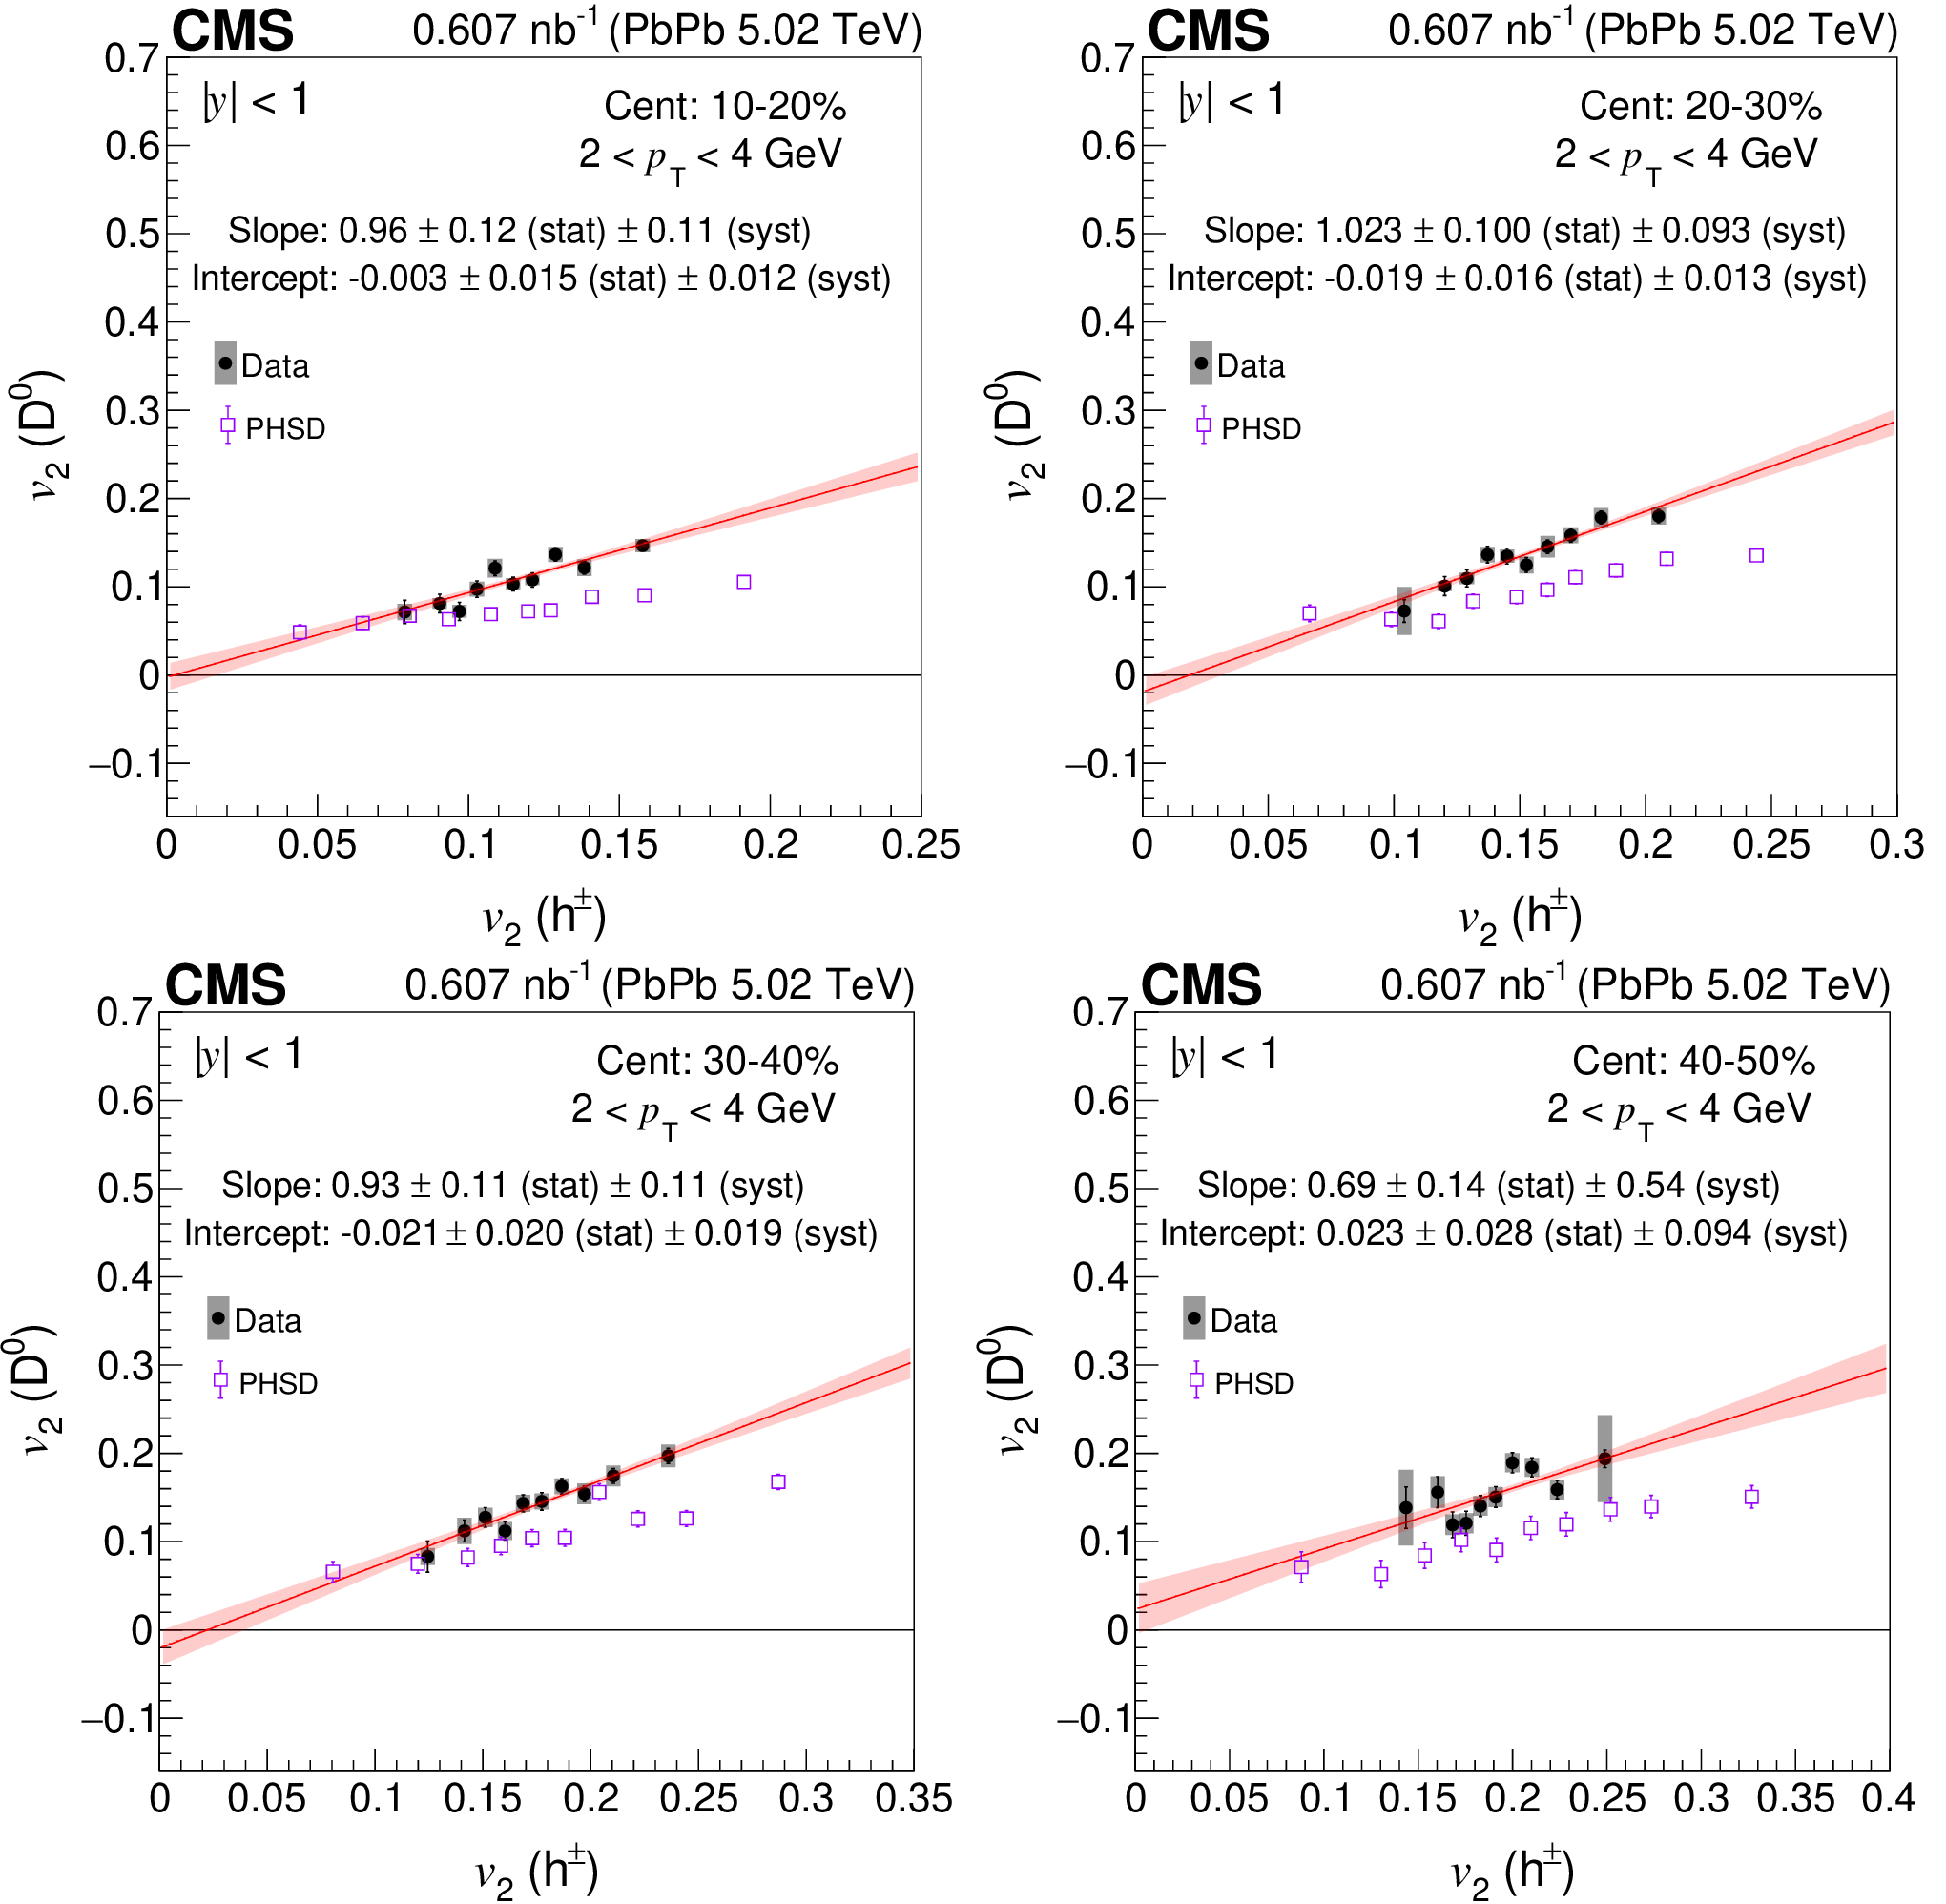
Figure 3:
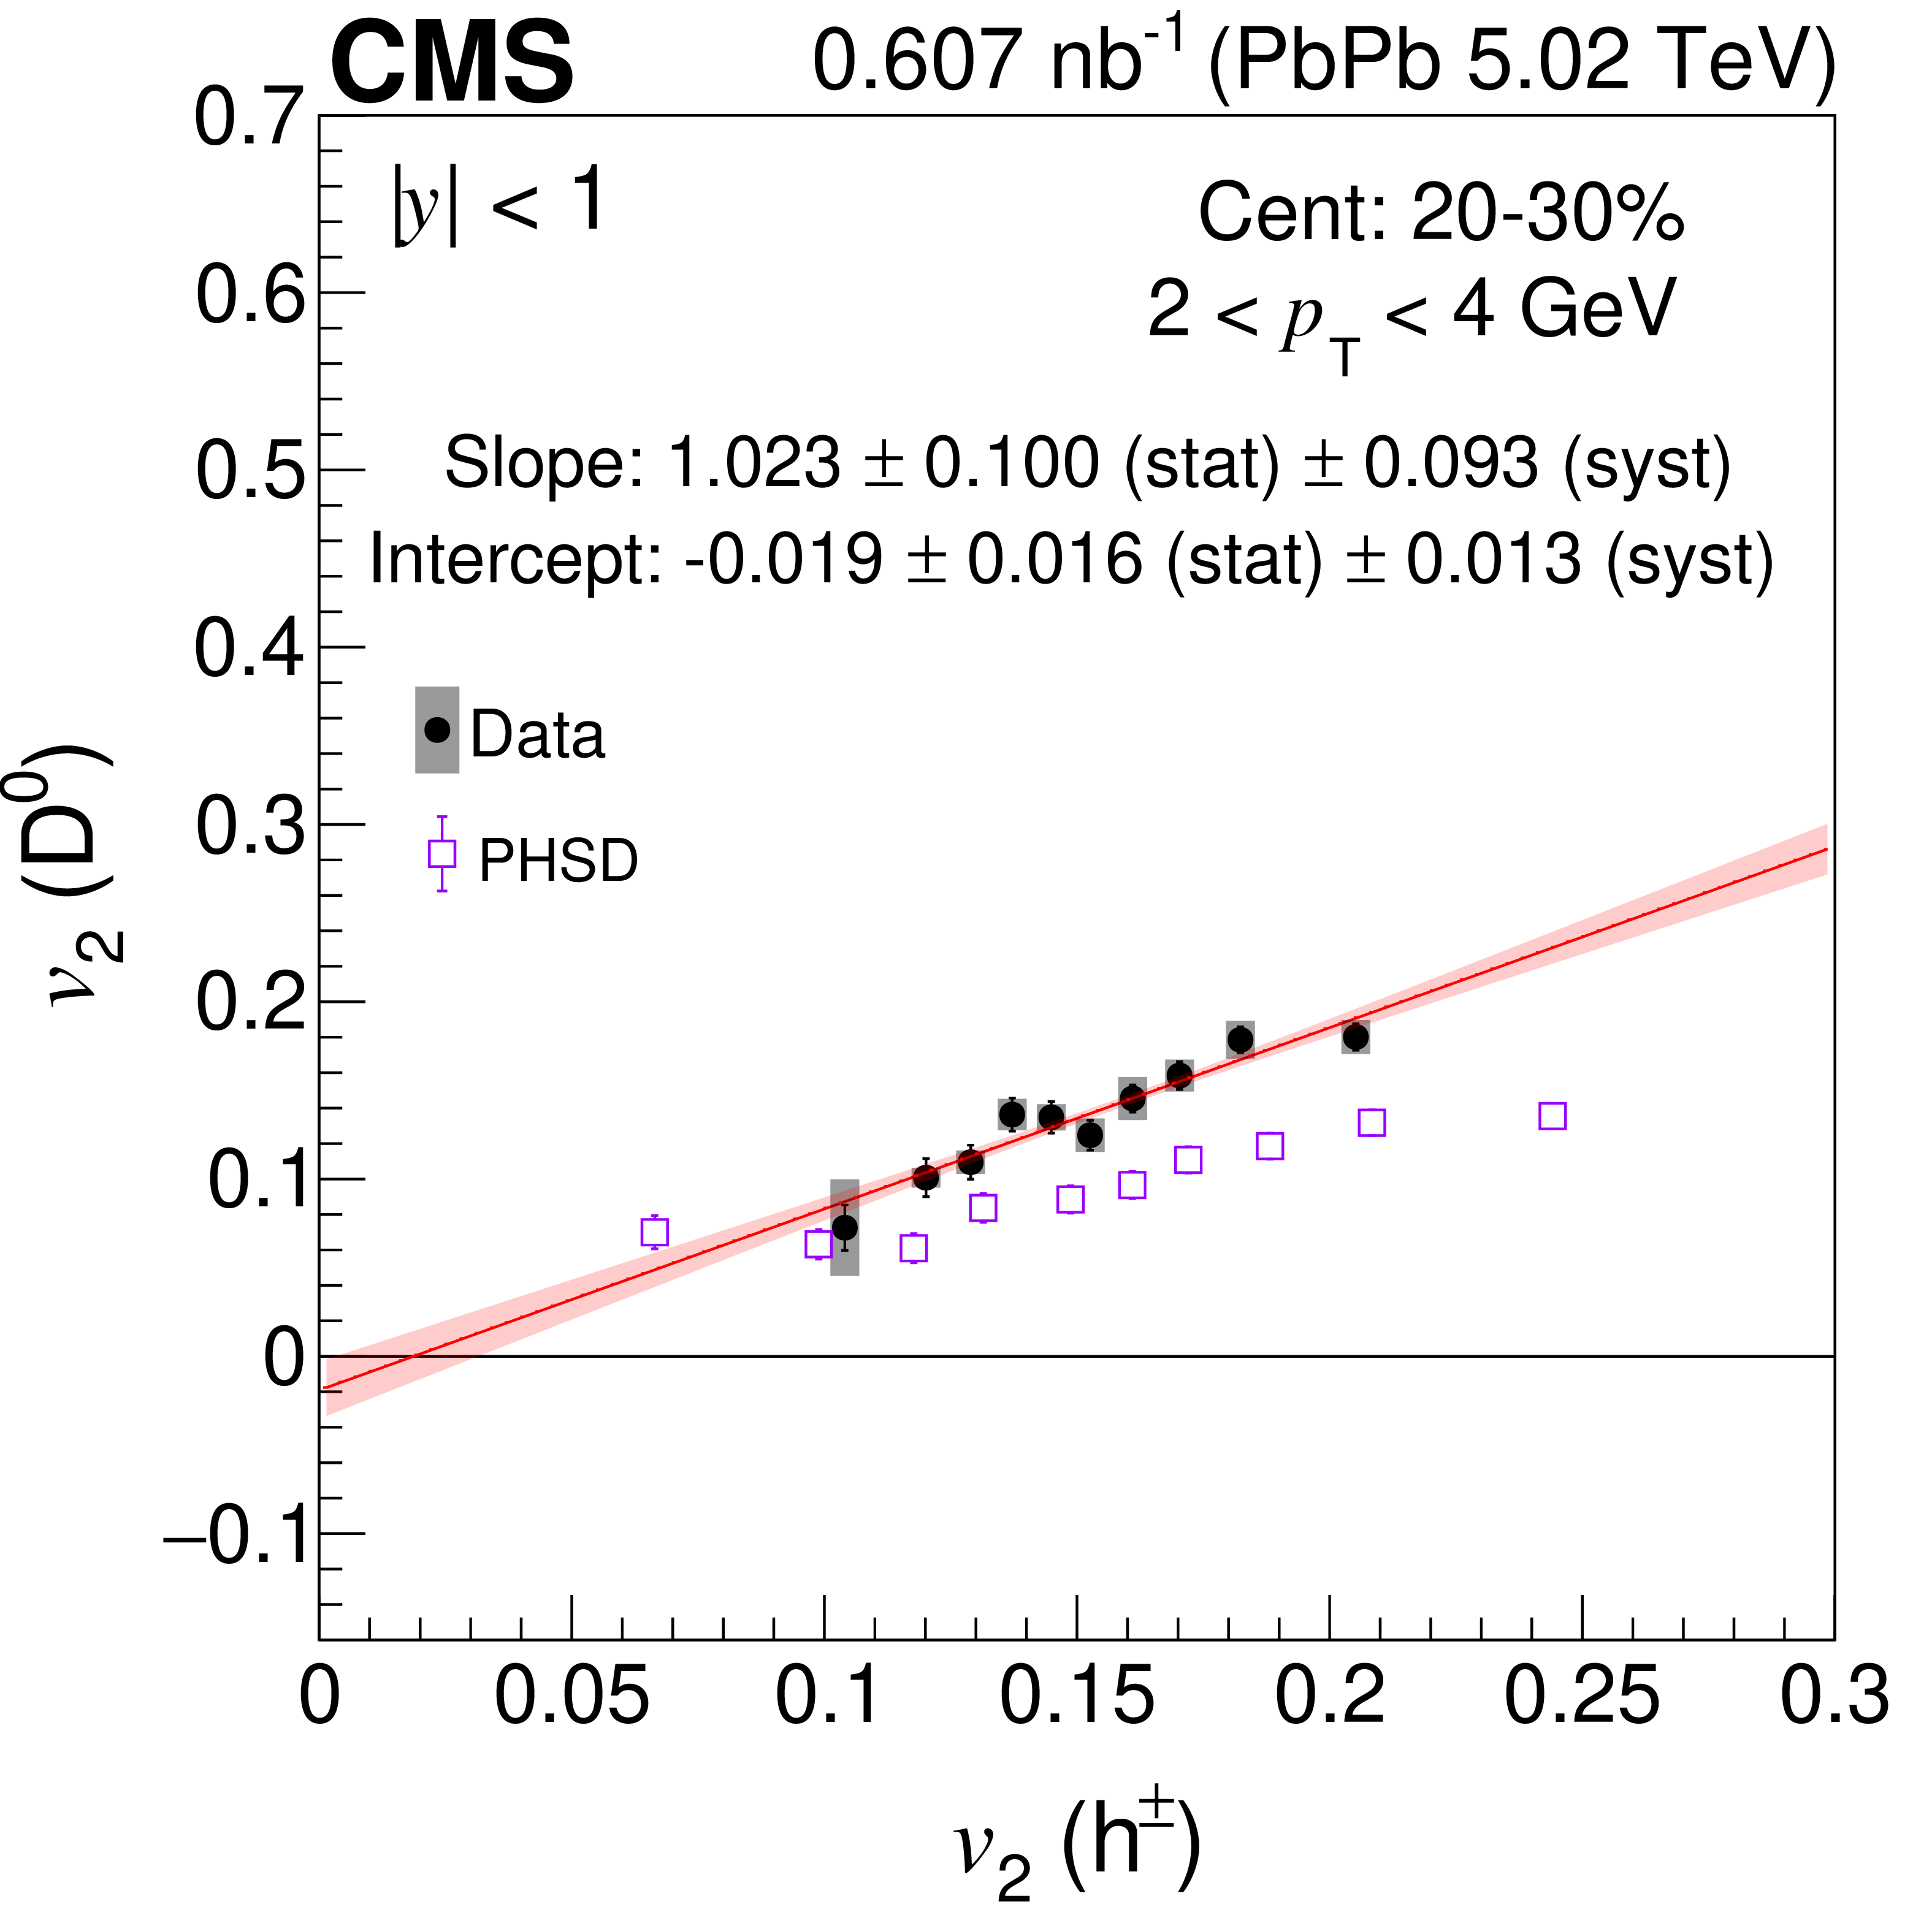
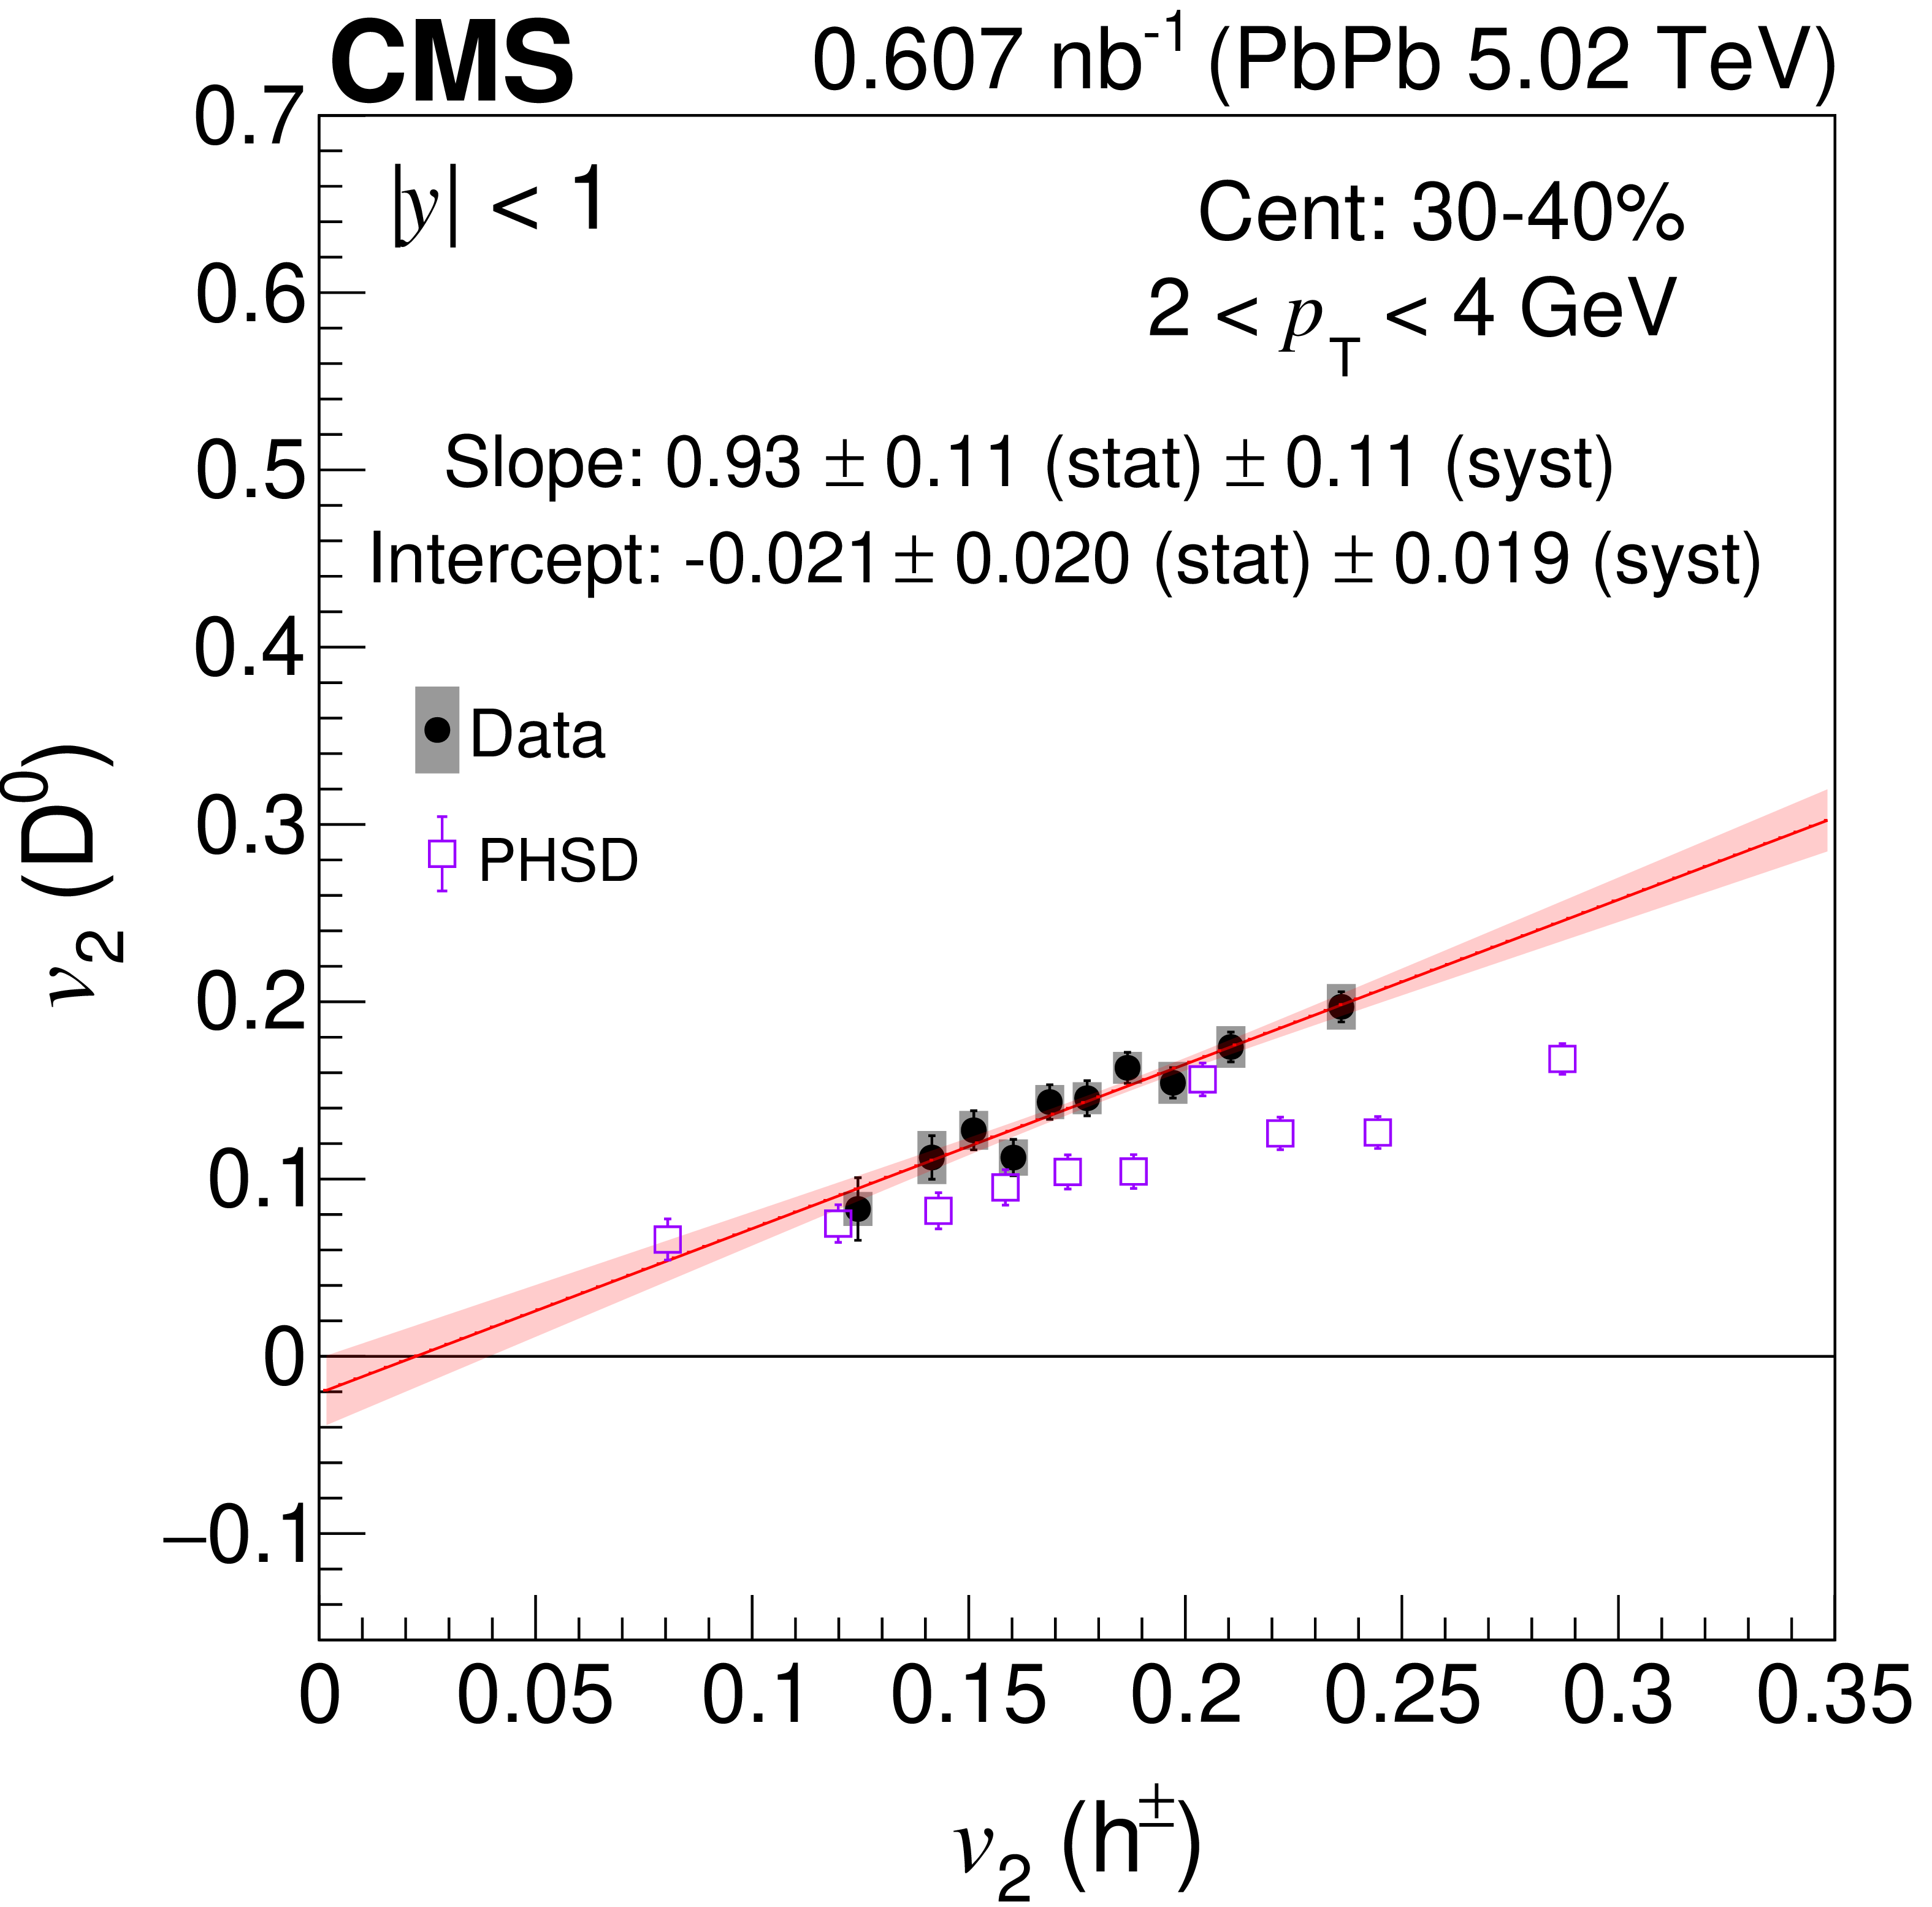
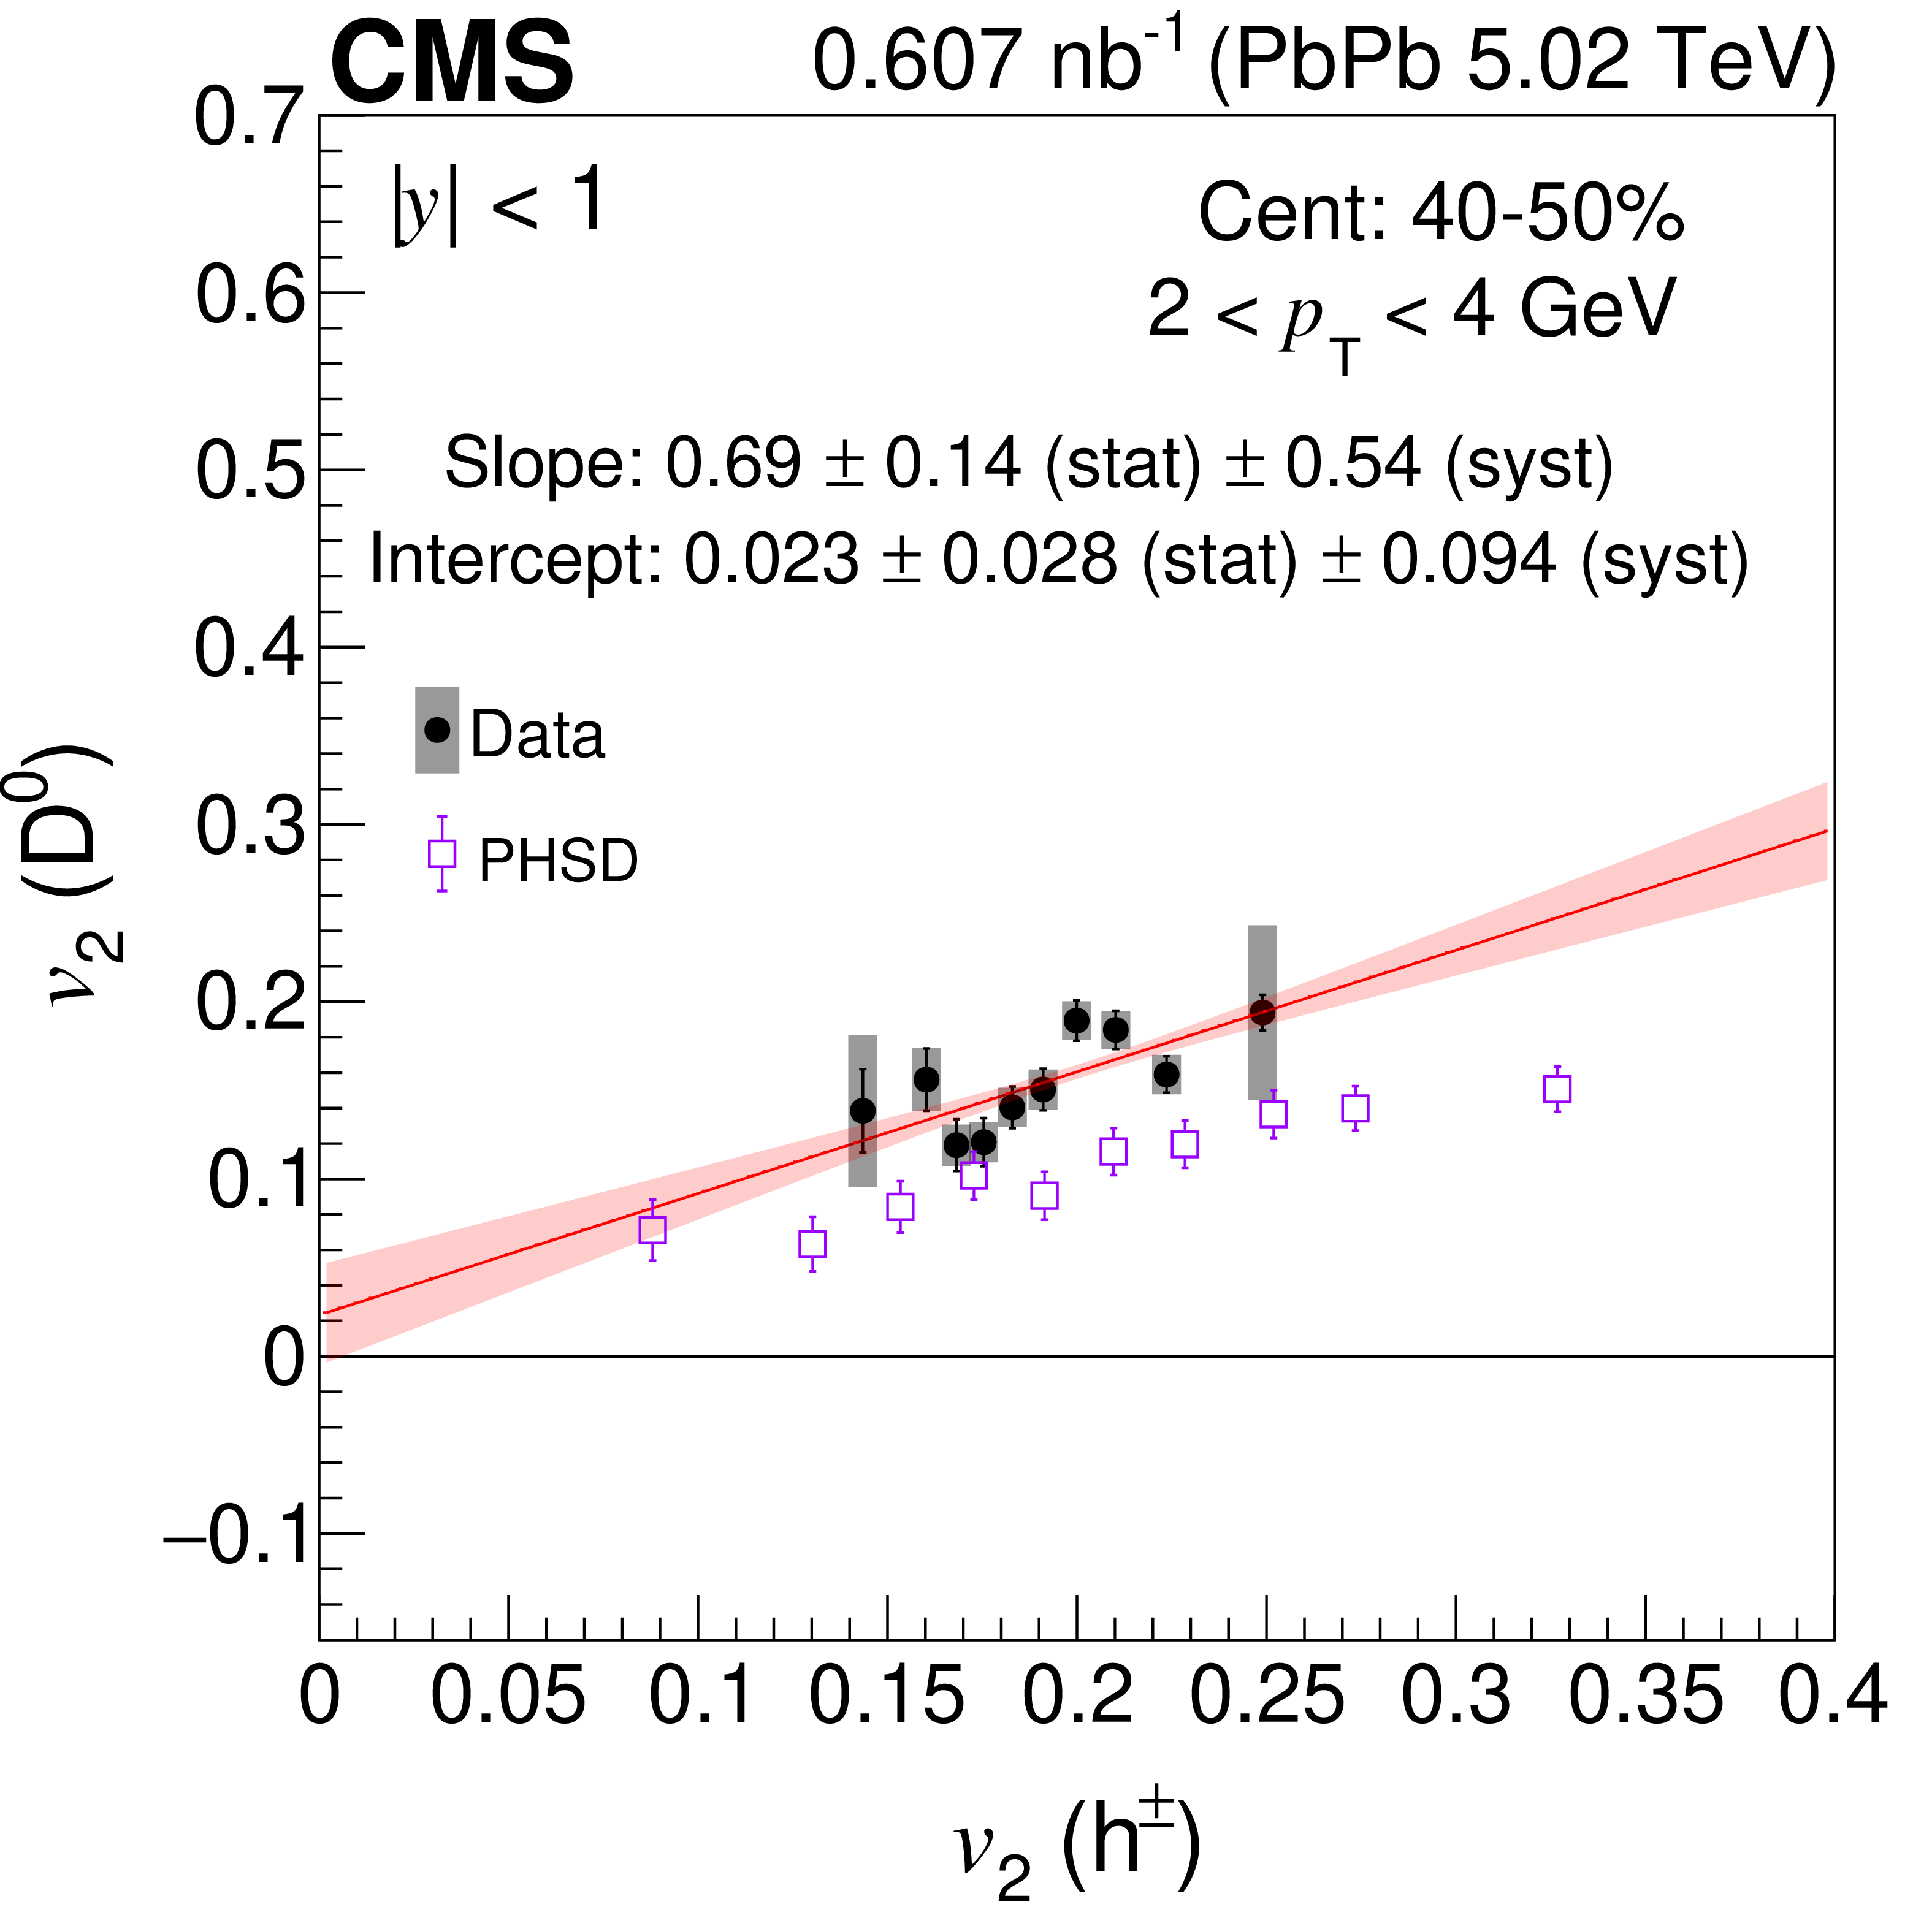
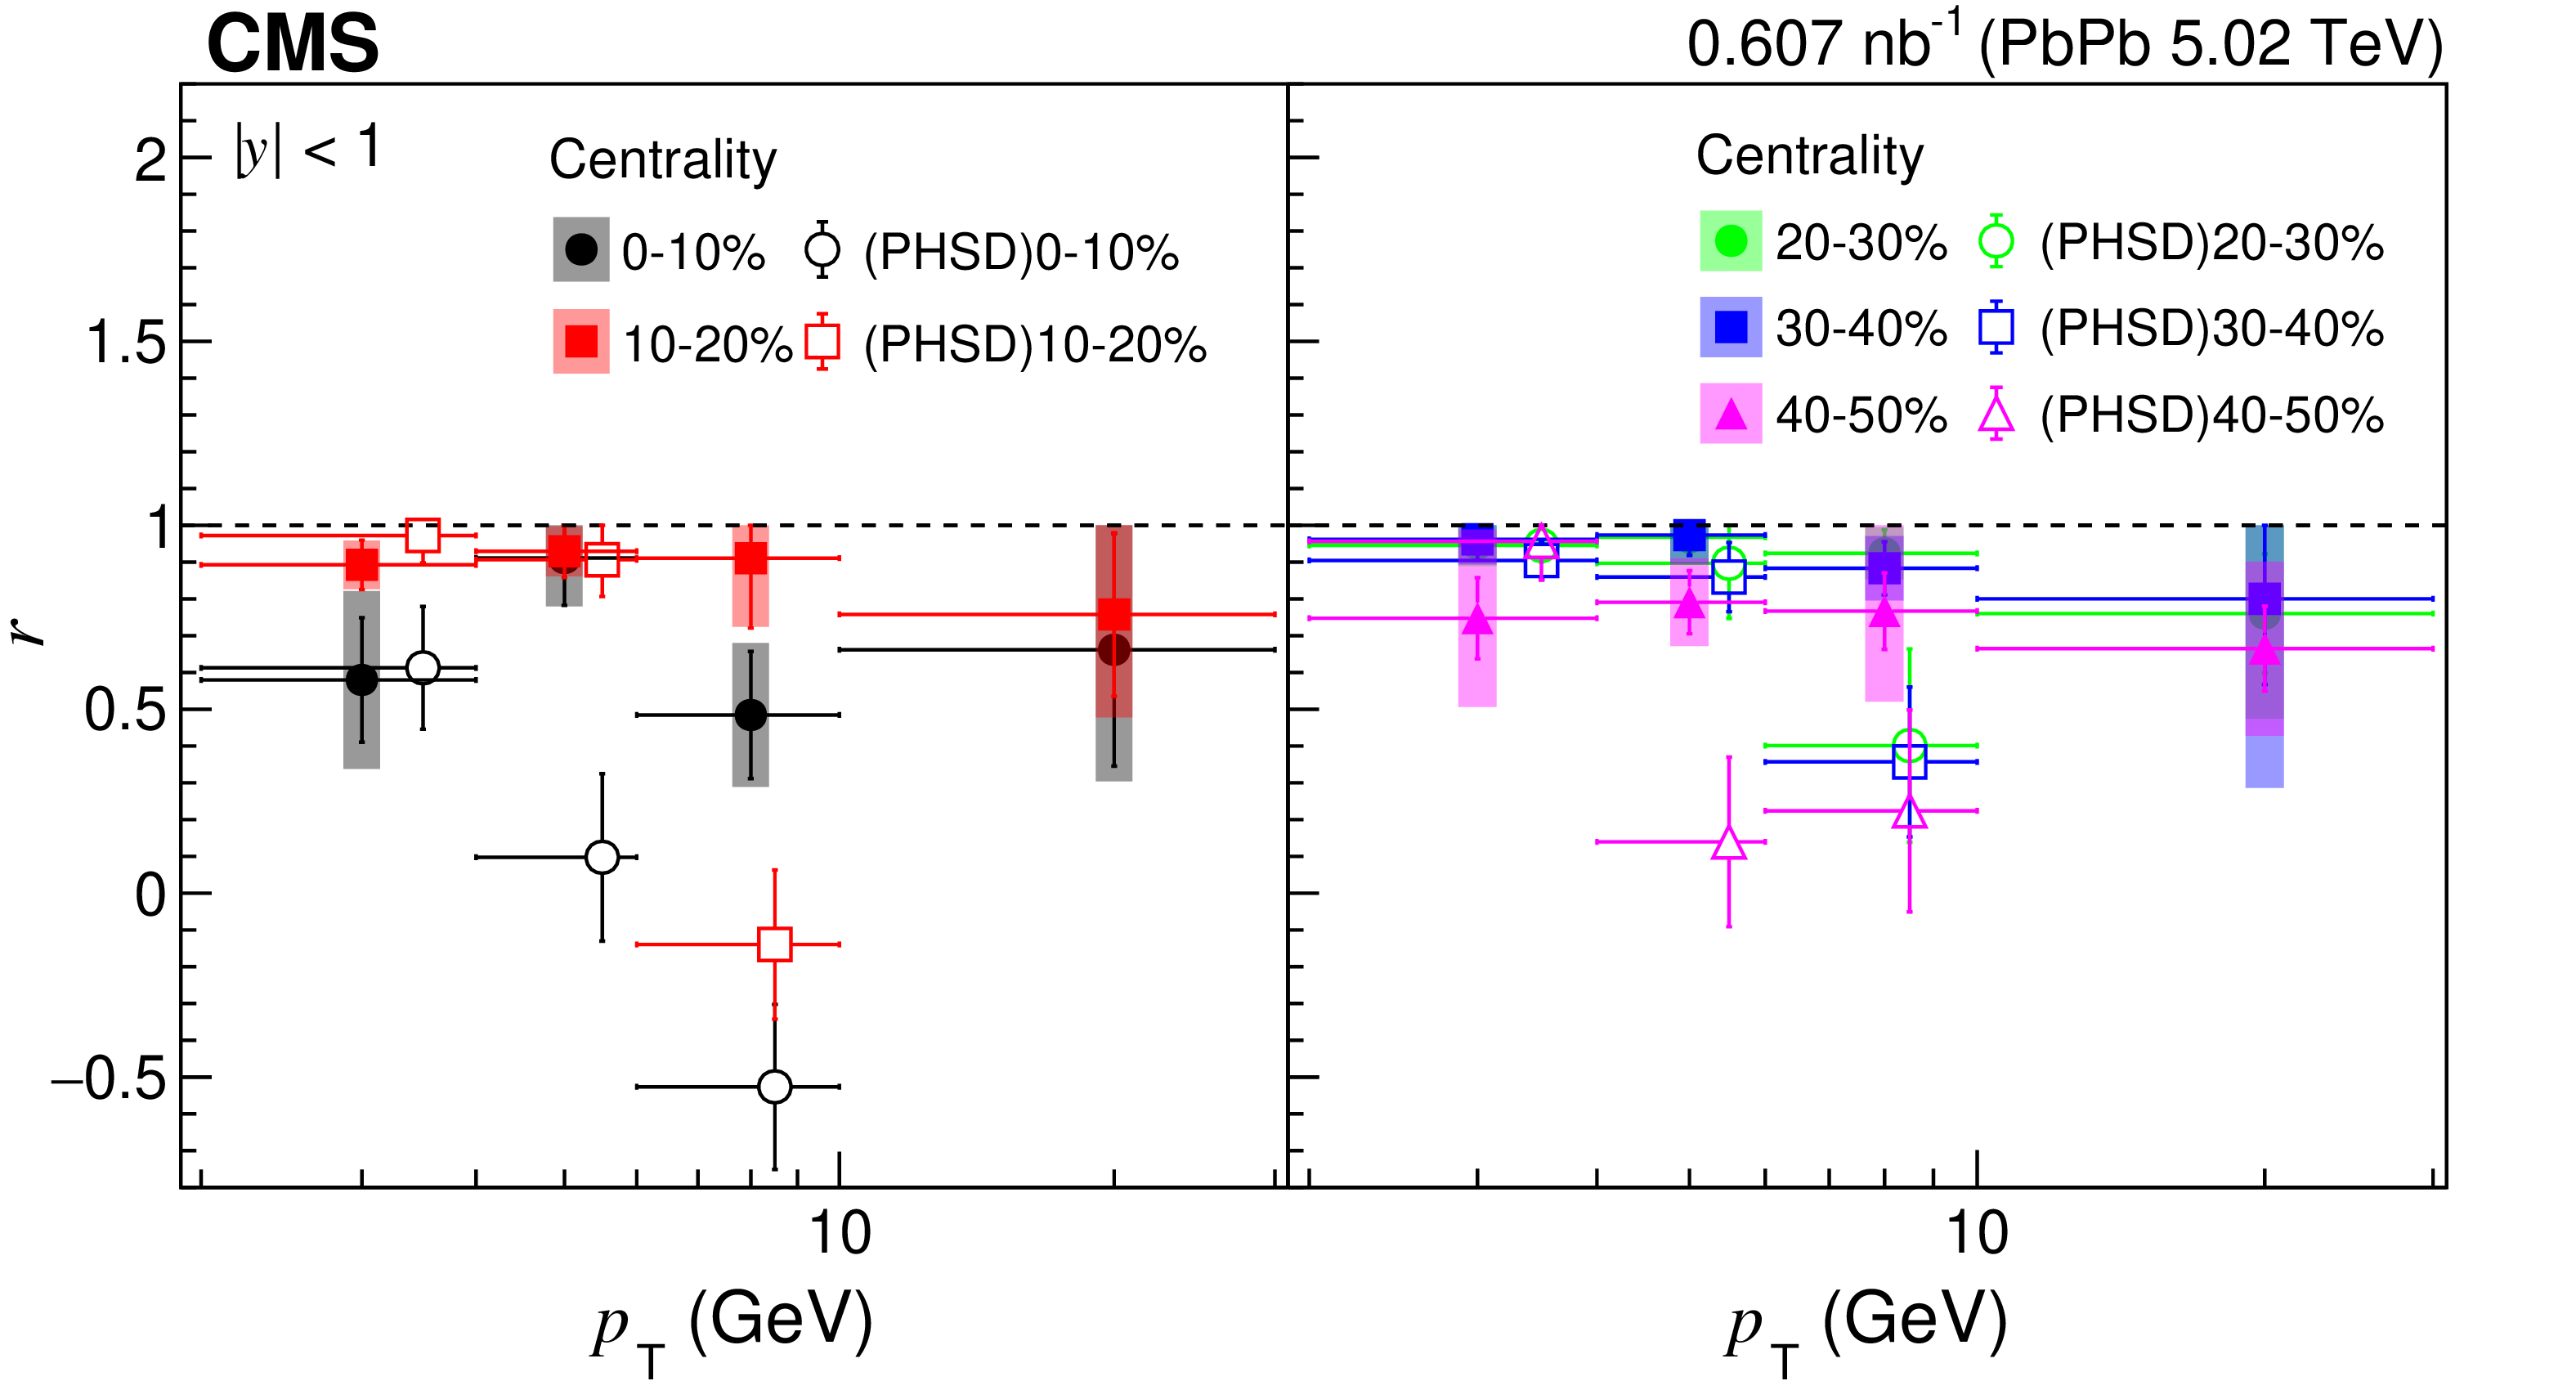
Scatter plots of the $ \mathrm{D^0} $ meson $ v_2 $ vs. charged particle $ v_2 $ values measured in common $ q_2 $ intervals. The $ \mathrm{D^0} $ mesons have 2 $ < p_{\mathrm{T}} < $ 4 GeV and $ |y| < $ 1. The inclusive charged particles have 1 $ < p_{\mathrm{T}} < $ 3 GeV and $ |\eta| < $ 1. The vertical lines represent the statistical uncertainties, and the boxes represent the systematic uncertainties associated with the $ \mathrm{D^0} $ meson $ v_2 $. The errors associated with the charged particle $ v_2 $ are smaller than the markers. The centrality classes 10--20% (upper left), 20--30% (upper right), 30--40% (lower left), and 40--50% (lower right) are shown. The red lines are linear fits to the experimental results based on the statistical uncertainties of the data, with the shaded red band corresponding to a one standard deviation uncertainty. The PHSD model [46,47] predictions are also shown in the plots. |
png pdf |
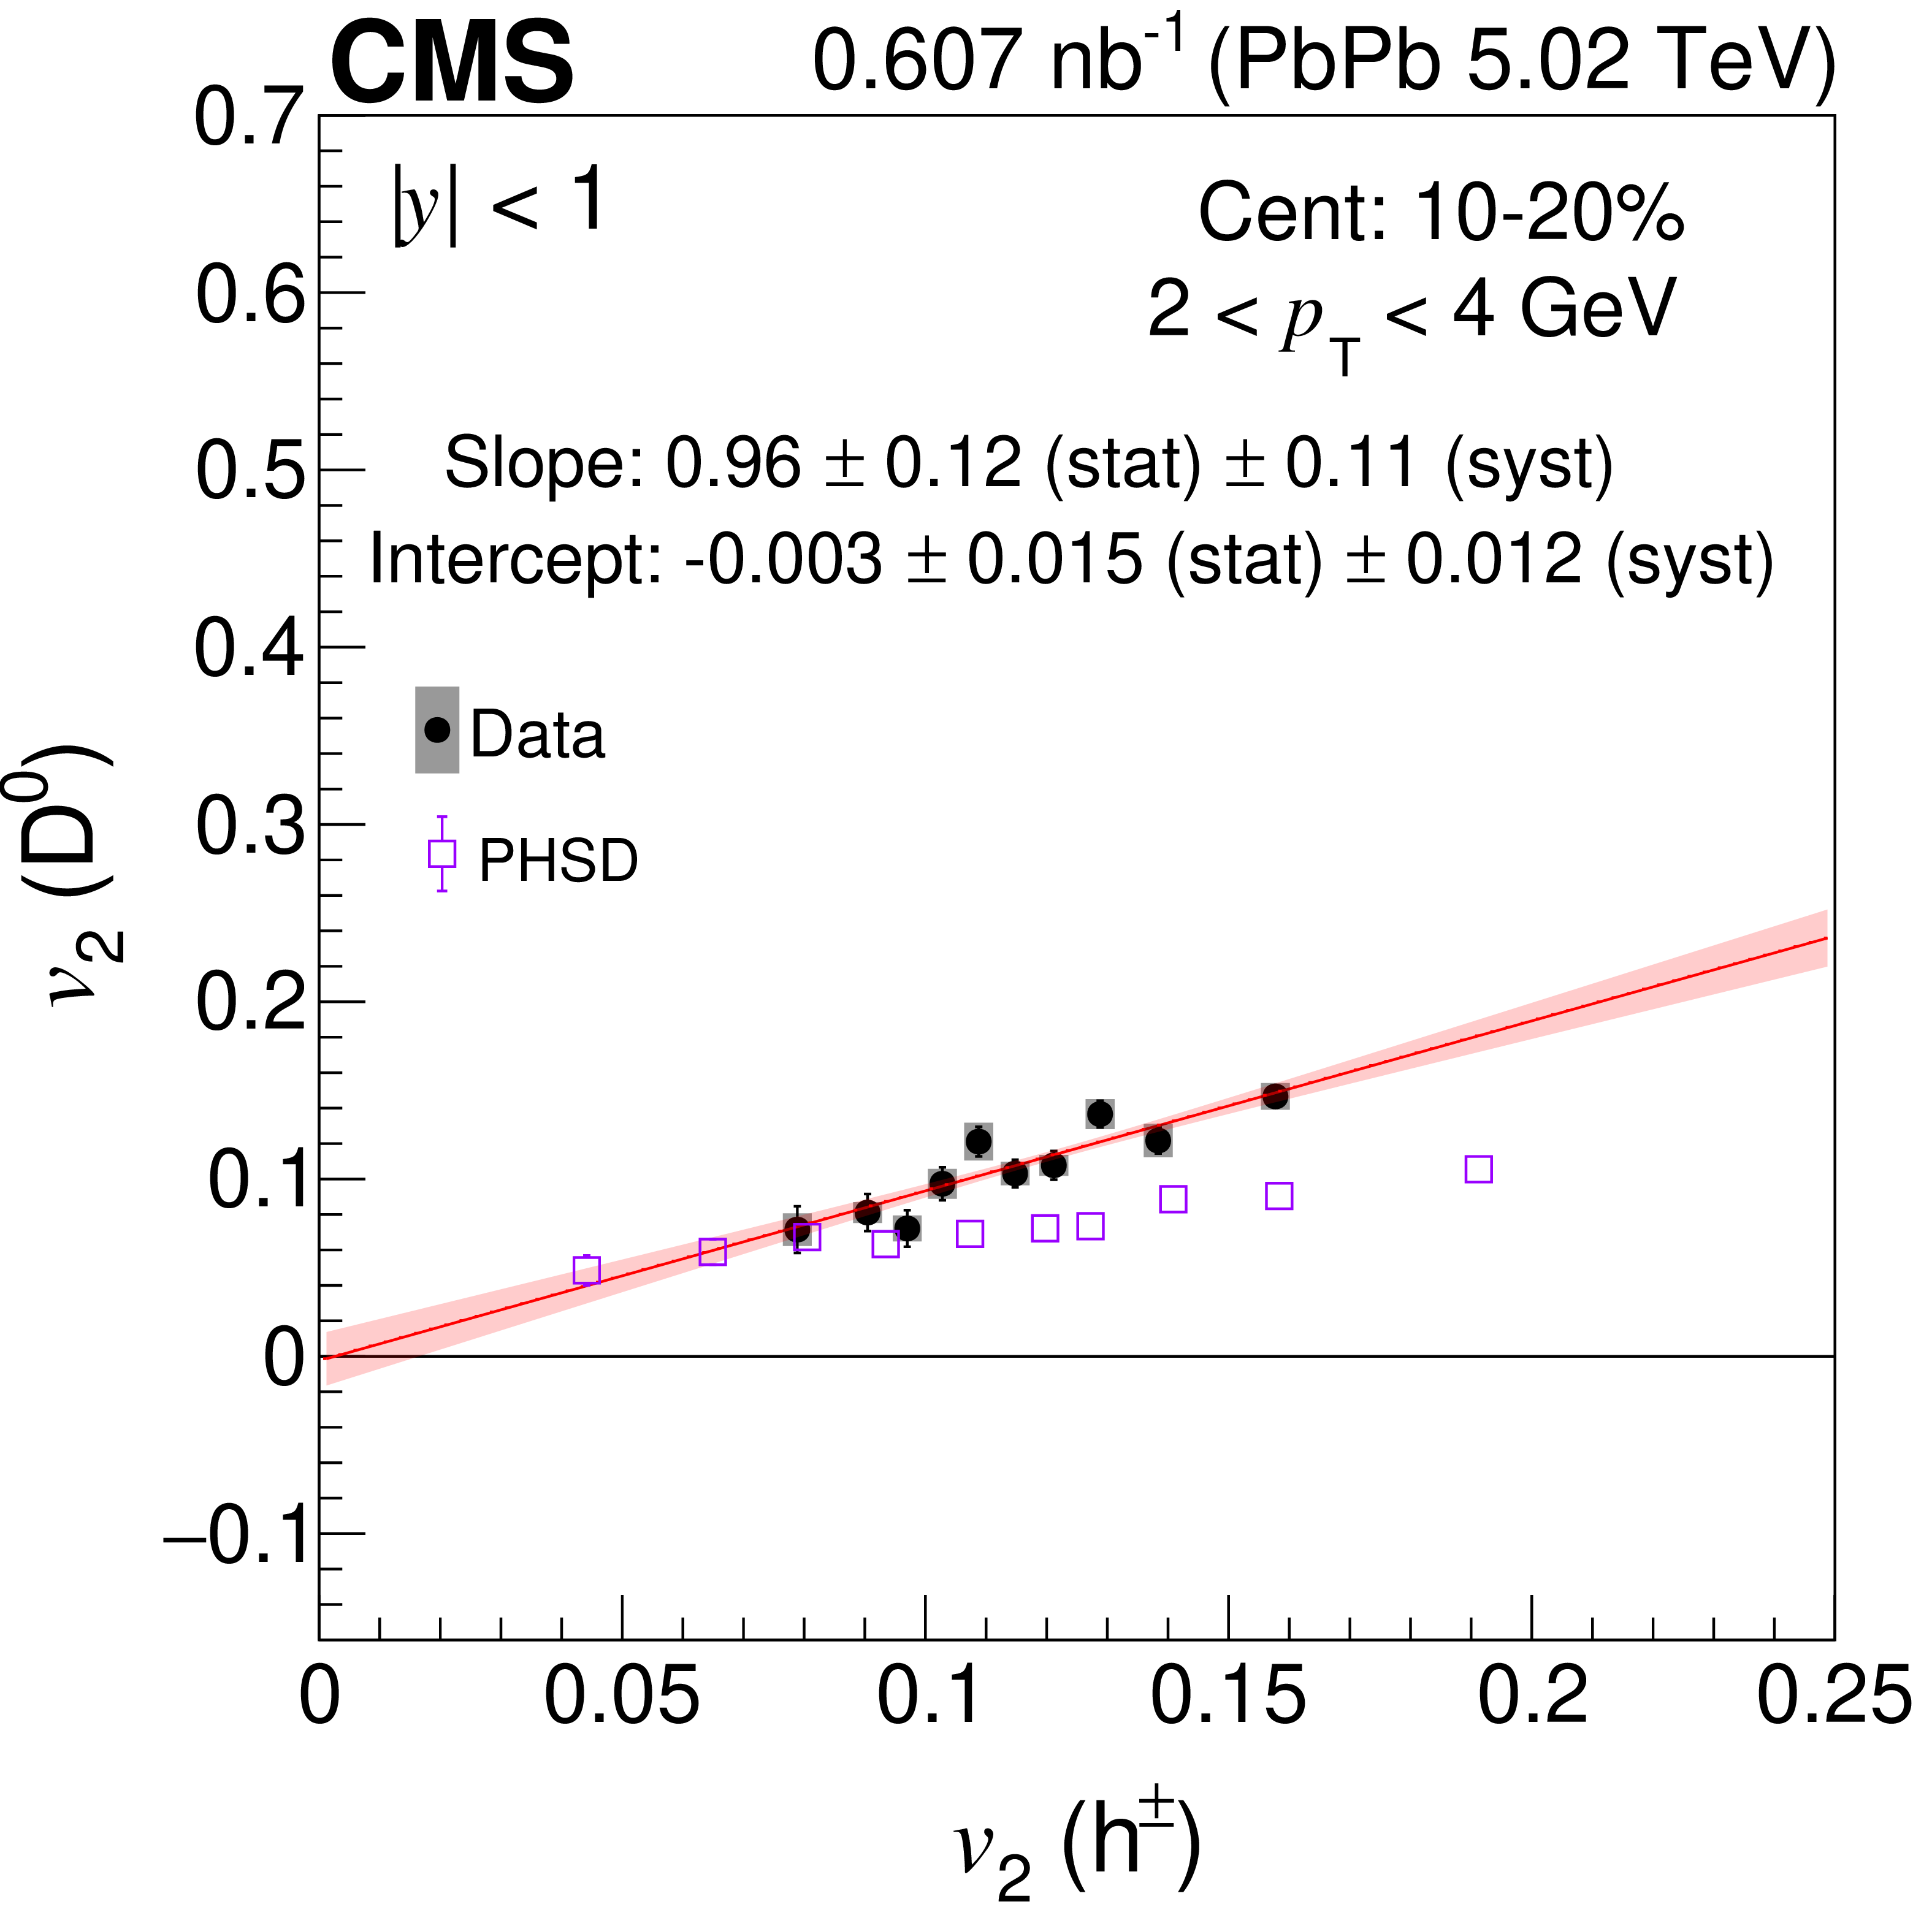
Figure 3-a:
Scatter plots of the $ \mathrm{D^0} $ meson $ v_2 $ vs. charged particle $ v_2 $ values measured in common $ q_2 $ intervals. The $ \mathrm{D^0} $ mesons have 2 $ < p_{\mathrm{T}} < $ 4 GeV and $ |y| < $ 1. The inclusive charged particles have 1 $ < p_{\mathrm{T}} < $ 3 GeV and $ |\eta| < $ 1. The vertical lines represent the statistical uncertainties, and the boxes represent the systematic uncertainties associated with the $ \mathrm{D^0} $ meson $ v_2 $. The errors associated with the charged particle $ v_2 $ are smaller than the markers. The centrality classes 10--20% (upper left), 20--30% (upper right), 30--40% (lower left), and 40--50% (lower right) are shown. The red lines are linear fits to the experimental results based on the statistical uncertainties of the data, with the shaded red band corresponding to a one standard deviation uncertainty. The PHSD model [46,47] predictions are also shown in the plots. |
png pdf |
Figure 3-b:
Scatter plots of the $ \mathrm{D^0} $ meson $ v_2 $ vs. charged particle $ v_2 $ values measured in common $ q_2 $ intervals. The $ \mathrm{D^0} $ mesons have 2 $ < p_{\mathrm{T}} < $ 4 GeV and $ |y| < $ 1. The inclusive charged particles have 1 $ < p_{\mathrm{T}} < $ 3 GeV and $ |\eta| < $ 1. The vertical lines represent the statistical uncertainties, and the boxes represent the systematic uncertainties associated with the $ \mathrm{D^0} $ meson $ v_2 $. The errors associated with the charged particle $ v_2 $ are smaller than the markers. The centrality classes 10--20% (upper left), 20--30% (upper right), 30--40% (lower left), and 40--50% (lower right) are shown. The red lines are linear fits to the experimental results based on the statistical uncertainties of the data, with the shaded red band corresponding to a one standard deviation uncertainty. The PHSD model [46,47] predictions are also shown in the plots. |
png pdf |
Figure 3-c:
Scatter plots of the $ \mathrm{D^0} $ meson $ v_2 $ vs. charged particle $ v_2 $ values measured in common $ q_2 $ intervals. The $ \mathrm{D^0} $ mesons have 2 $ < p_{\mathrm{T}} < $ 4 GeV and $ |y| < $ 1. The inclusive charged particles have 1 $ < p_{\mathrm{T}} < $ 3 GeV and $ |\eta| < $ 1. The vertical lines represent the statistical uncertainties, and the boxes represent the systematic uncertainties associated with the $ \mathrm{D^0} $ meson $ v_2 $. The errors associated with the charged particle $ v_2 $ are smaller than the markers. The centrality classes 10--20% (upper left), 20--30% (upper right), 30--40% (lower left), and 40--50% (lower right) are shown. The red lines are linear fits to the experimental results based on the statistical uncertainties of the data, with the shaded red band corresponding to a one standard deviation uncertainty. The PHSD model [46,47] predictions are also shown in the plots. |
png pdf |
Figure 3-d:
Scatter plots of the $ \mathrm{D^0} $ meson $ v_2 $ vs. charged particle $ v_2 $ values measured in common $ q_2 $ intervals. The $ \mathrm{D^0} $ mesons have 2 $ < p_{\mathrm{T}} < $ 4 GeV and $ |y| < $ 1. The inclusive charged particles have 1 $ < p_{\mathrm{T}} < $ 3 GeV and $ |\eta| < $ 1. The vertical lines represent the statistical uncertainties, and the boxes represent the systematic uncertainties associated with the $ \mathrm{D^0} $ meson $ v_2 $. The errors associated with the charged particle $ v_2 $ are smaller than the markers. The centrality classes 10--20% (upper left), 20--30% (upper right), 30--40% (lower left), and 40--50% (lower right) are shown. The red lines are linear fits to the experimental results based on the statistical uncertainties of the data, with the shaded red band corresponding to a one standard deviation uncertainty. The PHSD model [46,47] predictions are also shown in the plots. |
png pdf |
Figure 4:
The Pearson correlation coefficients ($ r $) obtained from the scatter plots of the prompt $ \mathrm{D^0} $ meson $ v_2 $ vs. charged particle $ v_2 $ values for the indicated $ p_{\mathrm{T}} $ and centrality classes. The vertical lines correspond to the statistical uncertainties and the vertical bands correspond to the systematic uncertainties added in quadrature. The open symbols show the PHSD predictions in the $ \mathrm{D^0} $ meson $ p_{\mathrm{T}} $ range 2--10 GeV, with the symbols shifted along the $ p_{\mathrm{T}} $ axis for better visibility. |
png pdf |
Figure 5:
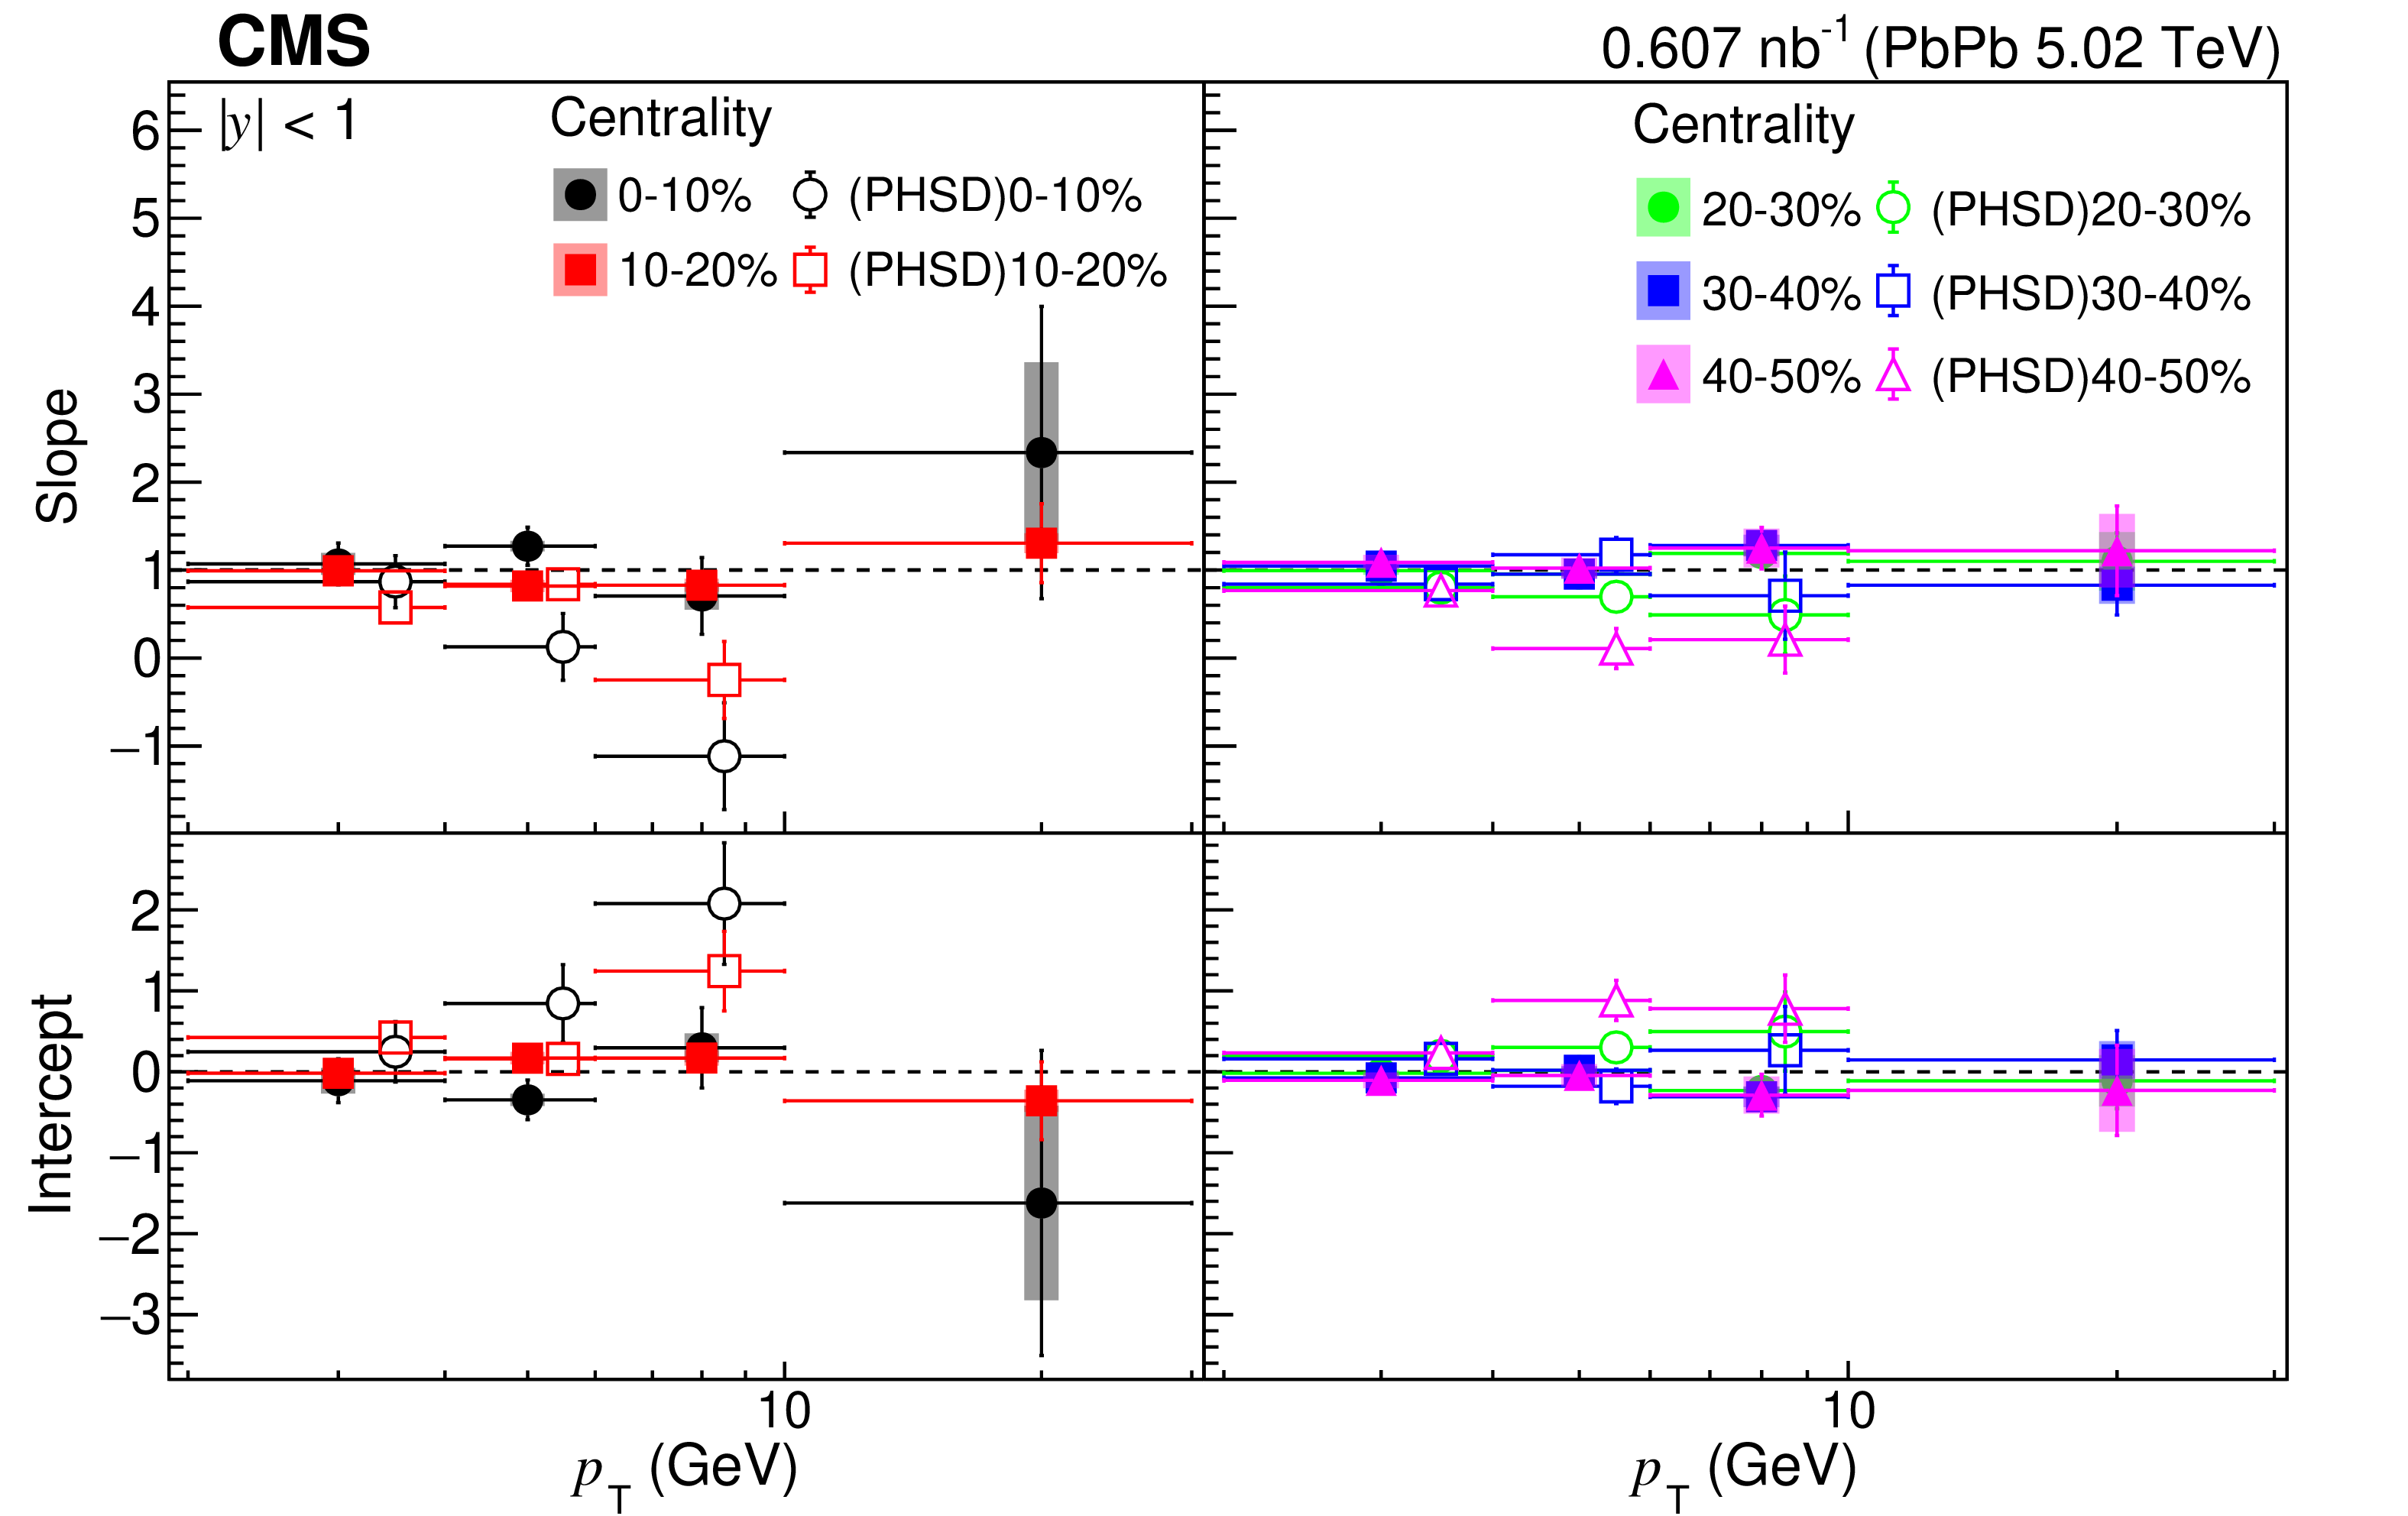
Slopes (upper row) and intercepts (lower row) obtained from the fits of the prompt $ \mathrm{D^0} $ meson $ \mbox{\textsl{vs.}} $ charged particle $ v_2 $ values for each $ p_{\mathrm{T}} $ and centrality class. The $ \mathrm{D^0} $ meson and charged particle $ v_2 $ values in each $ q_2 $ interval are normalized by the corresponding $ q_2 $-inclusive $ v_2 $ value in the same $ p_{\mathrm{T}} $ and centrality class. The vertical lines correspond to the statistical uncertainties and the vertical bands correspond to the systematic uncertainties added in quadrature. The open symbols show the PHSD predictions in the $ \mathrm{D^0} $ meson $ p_{\mathrm{T}} $ range 2--10 GeV, with the symbols shifted along the $ p_{\mathrm{T}} $ axis for better visibility. |
png pdf |
Figure 6:
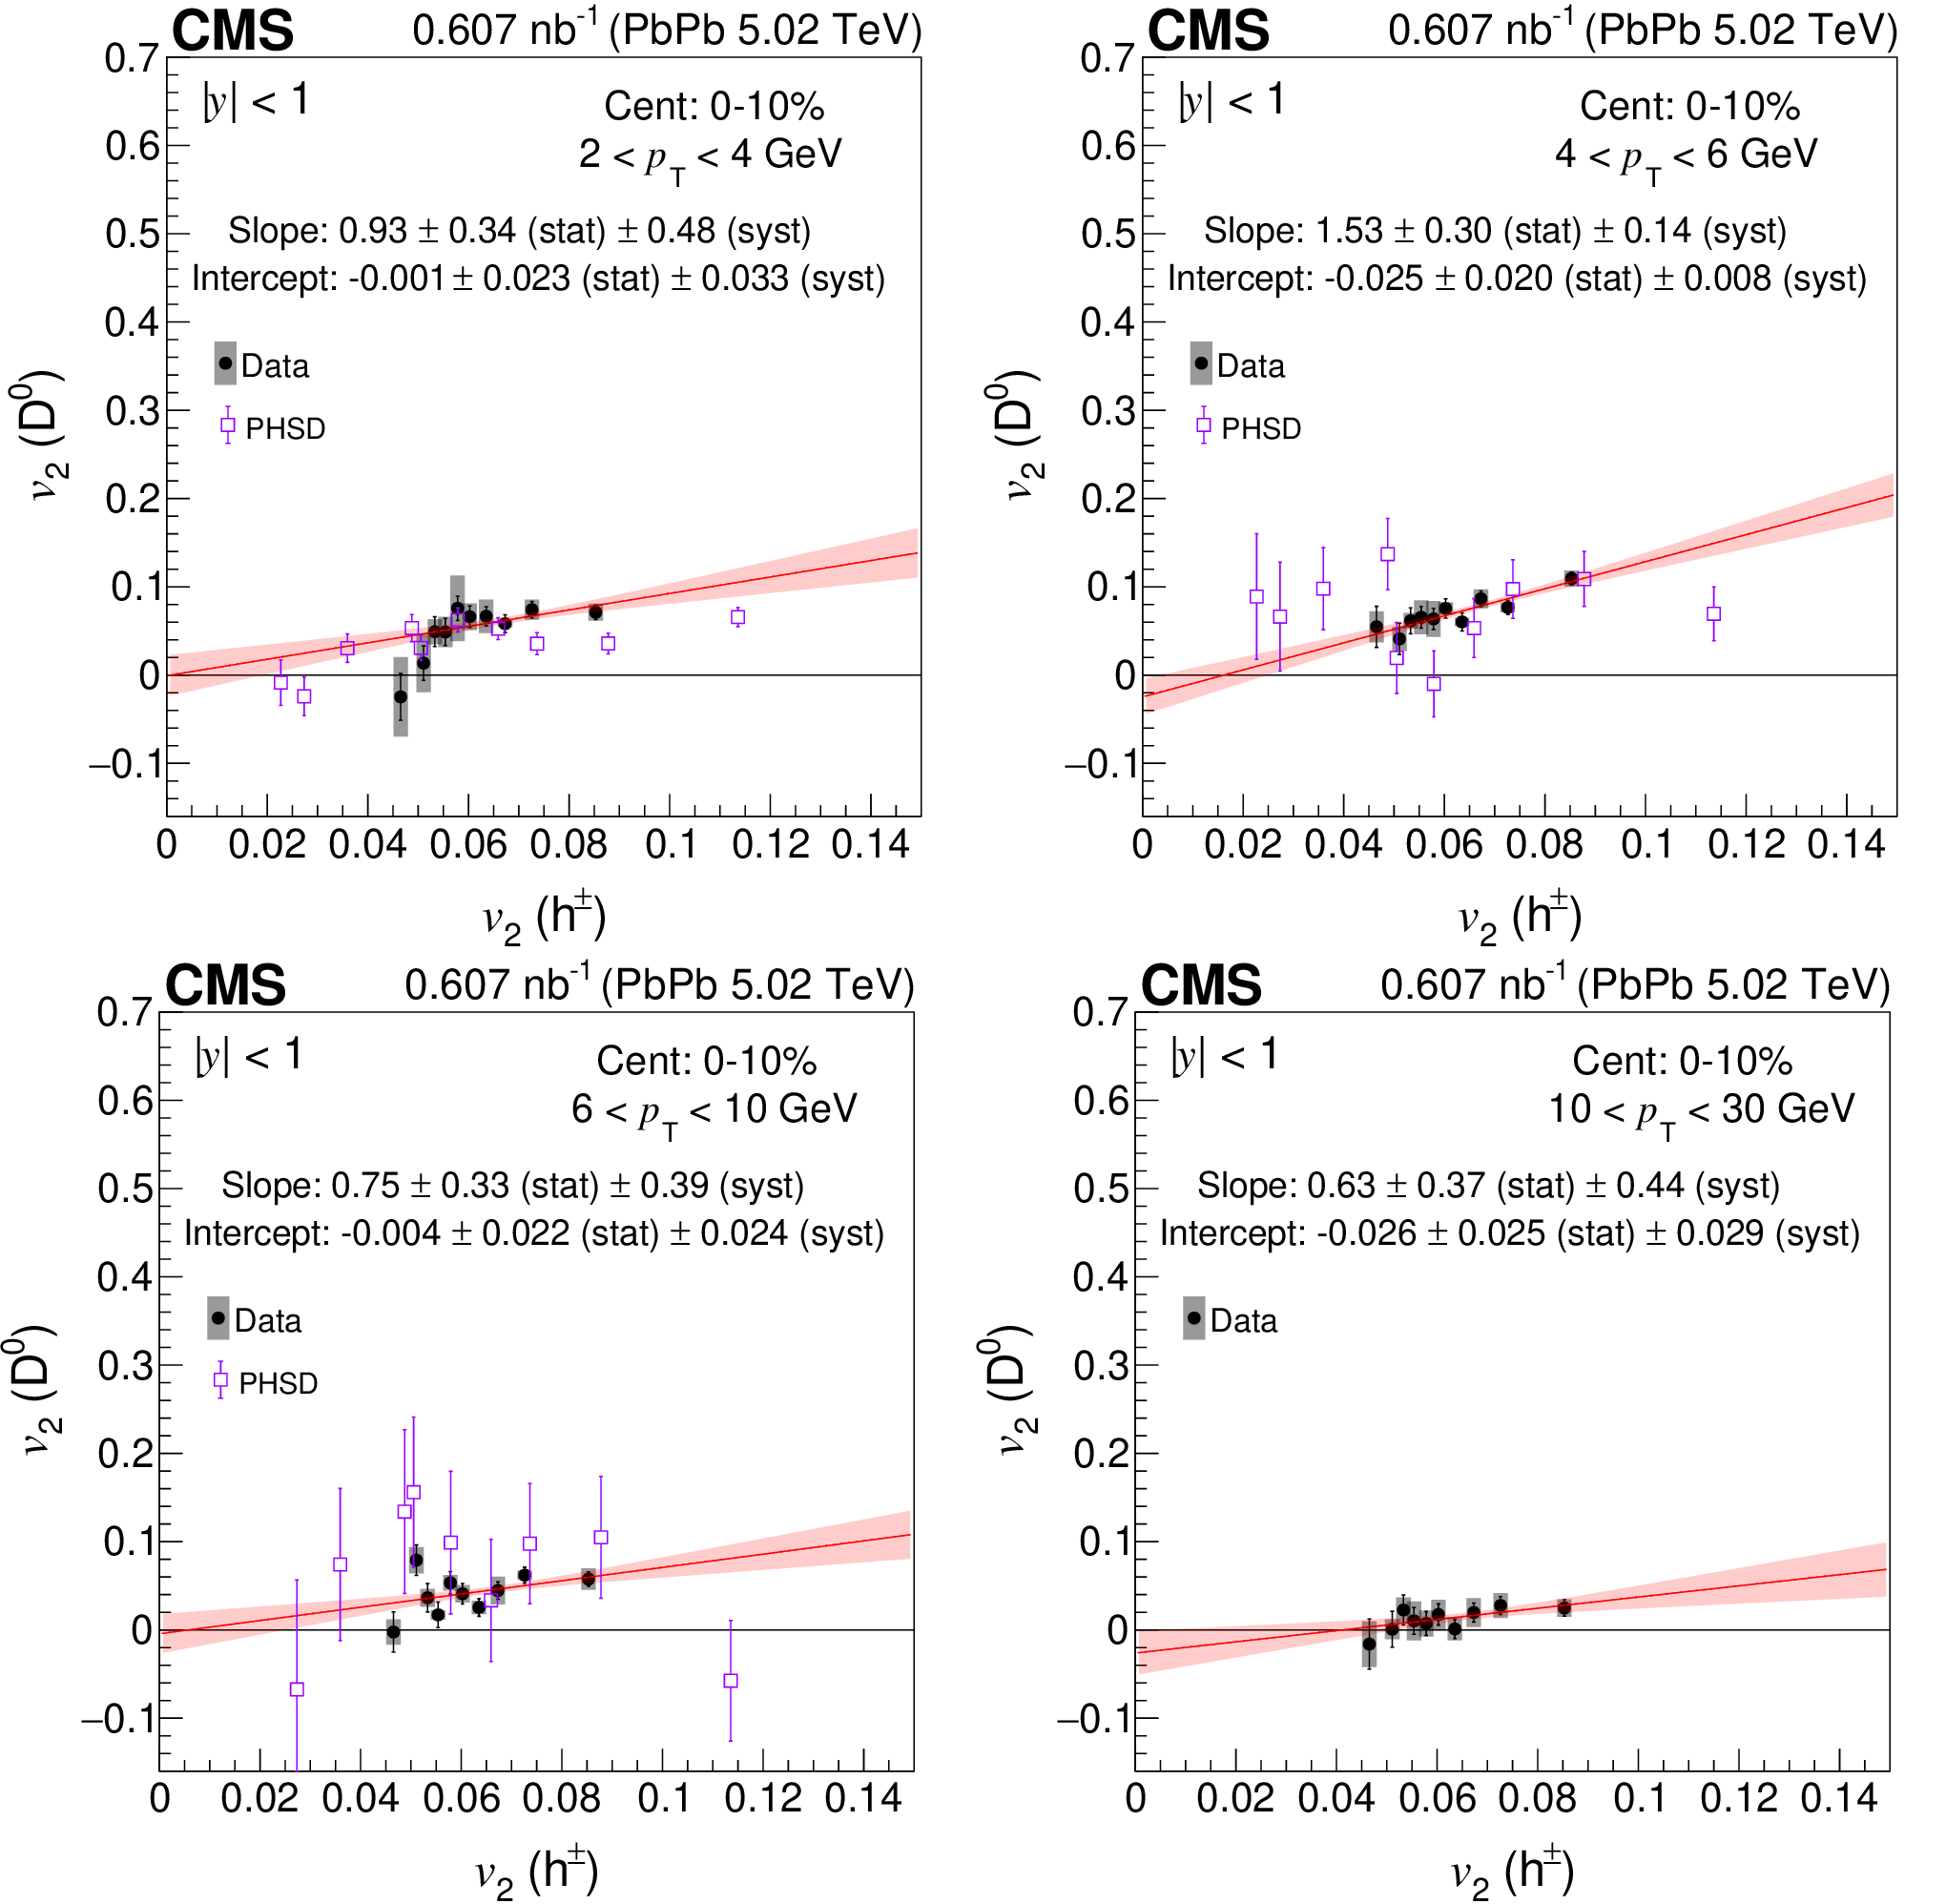
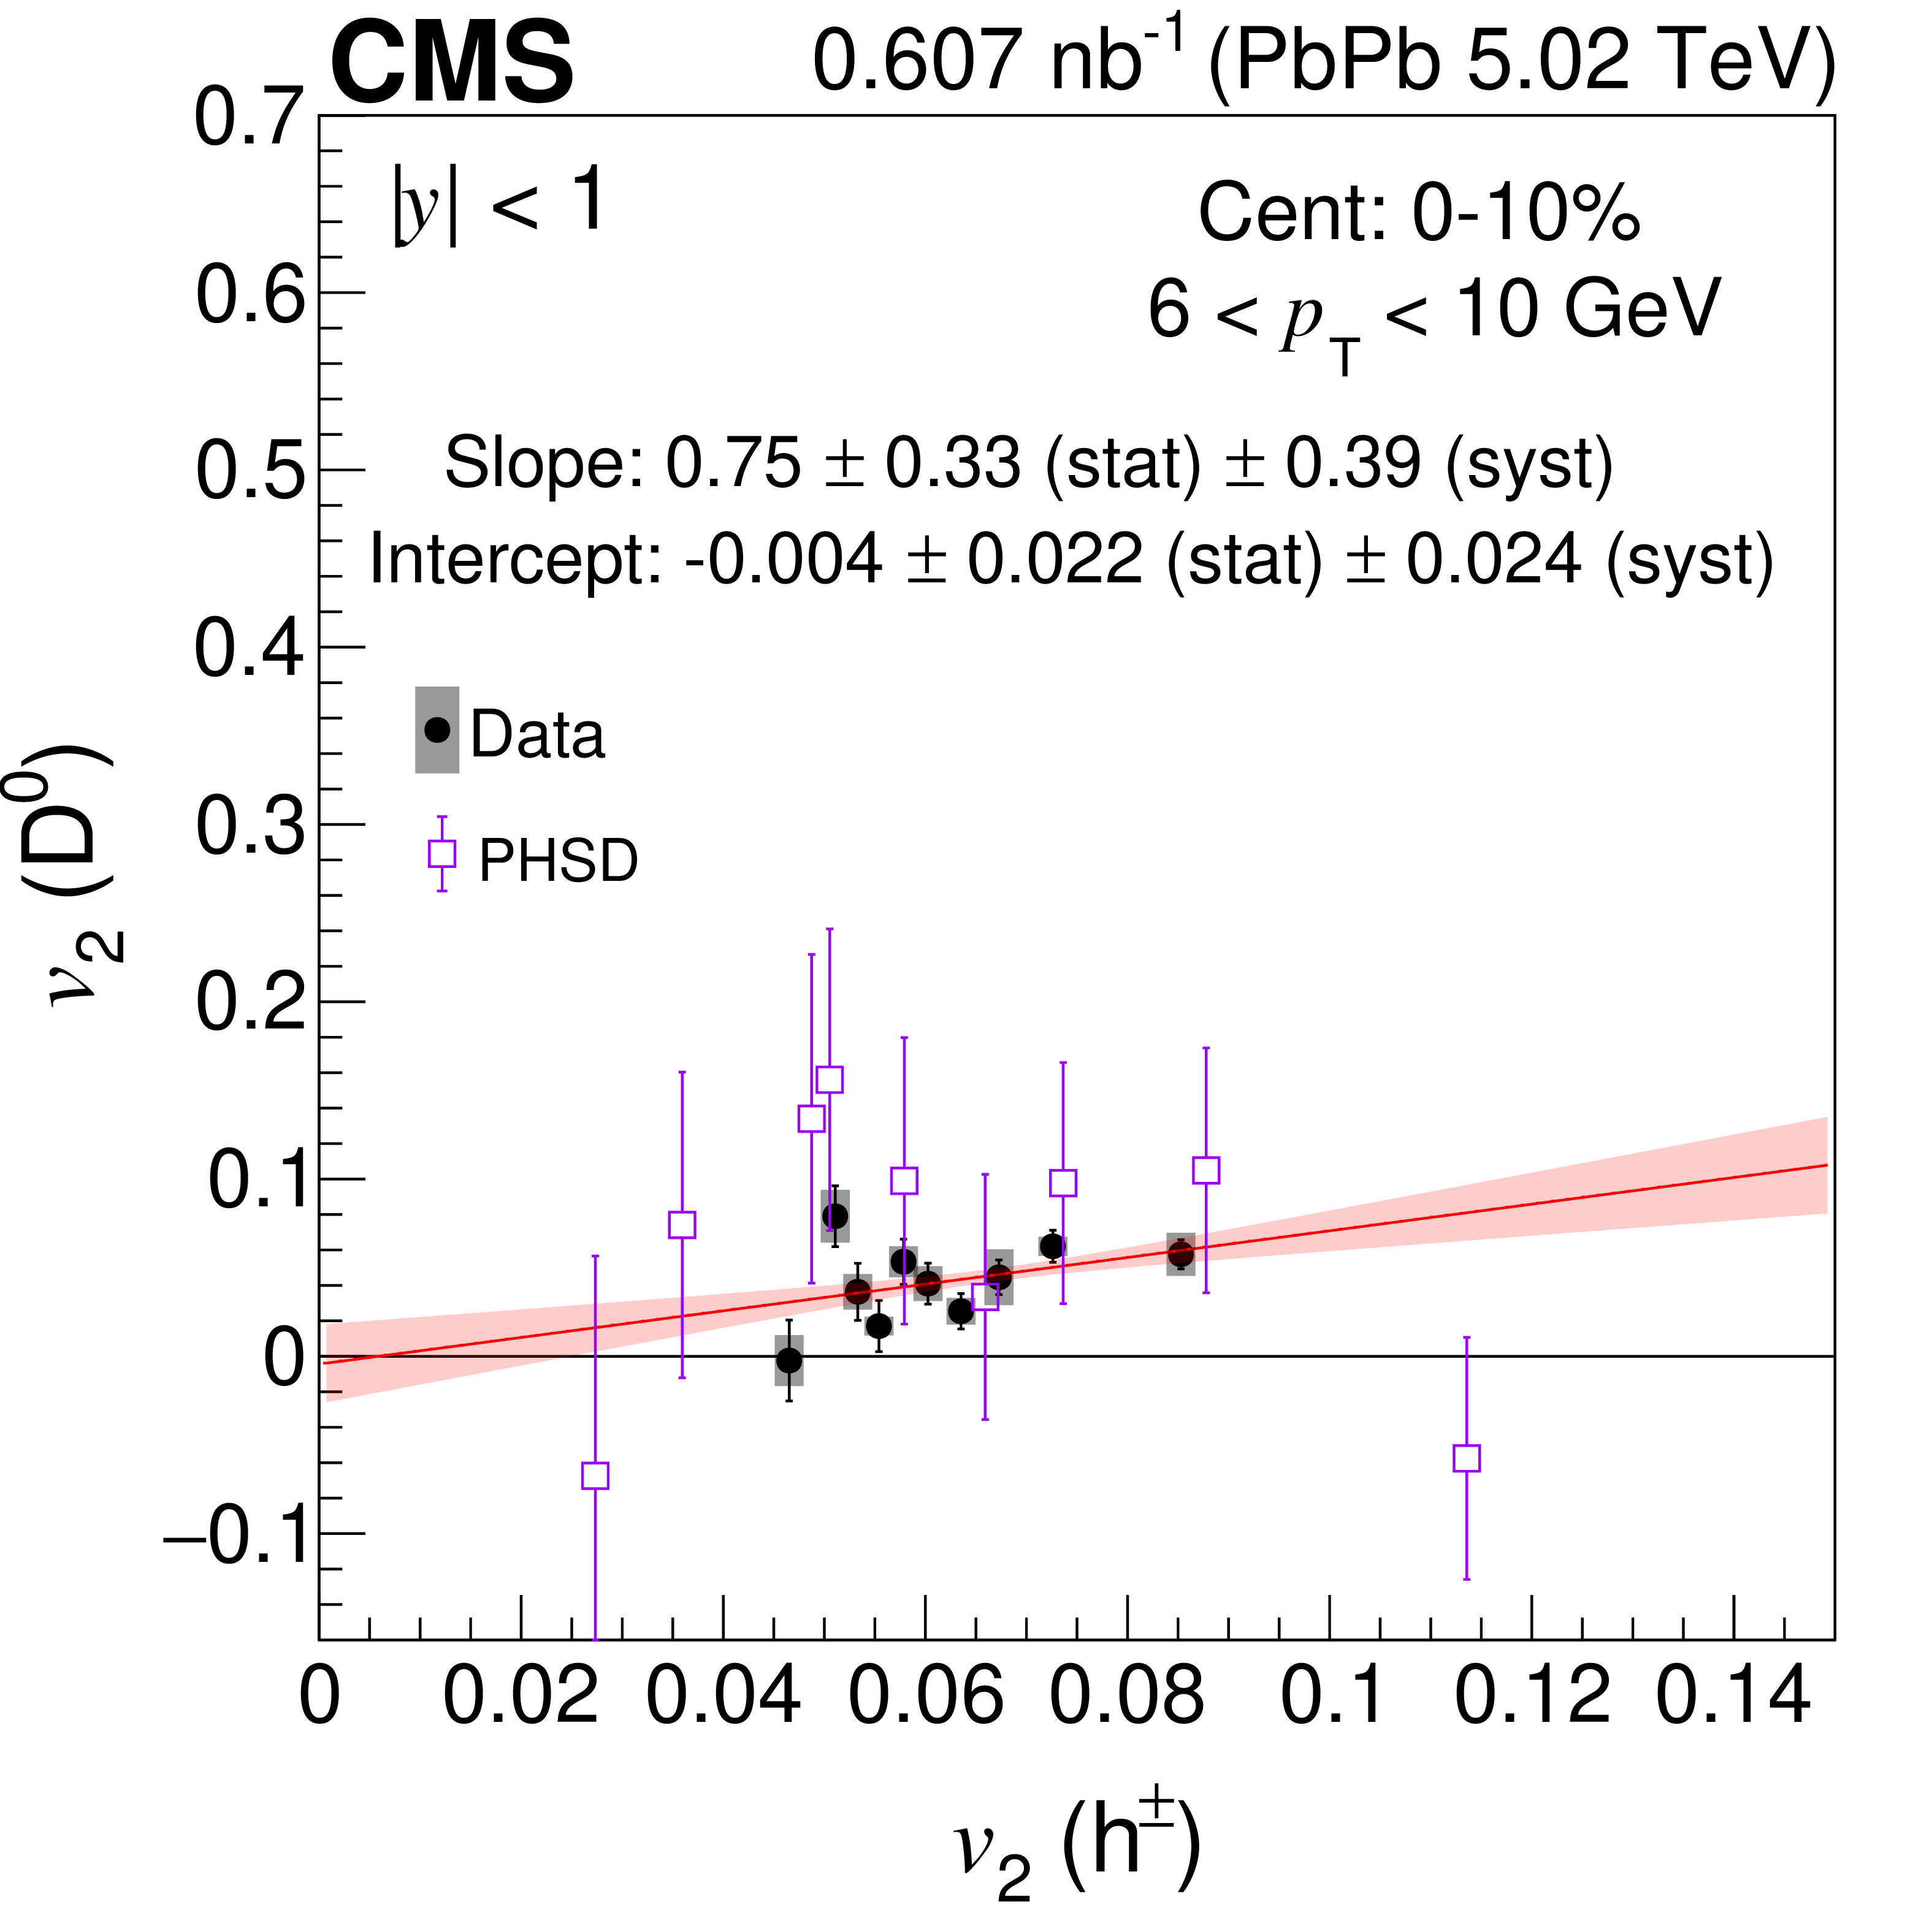
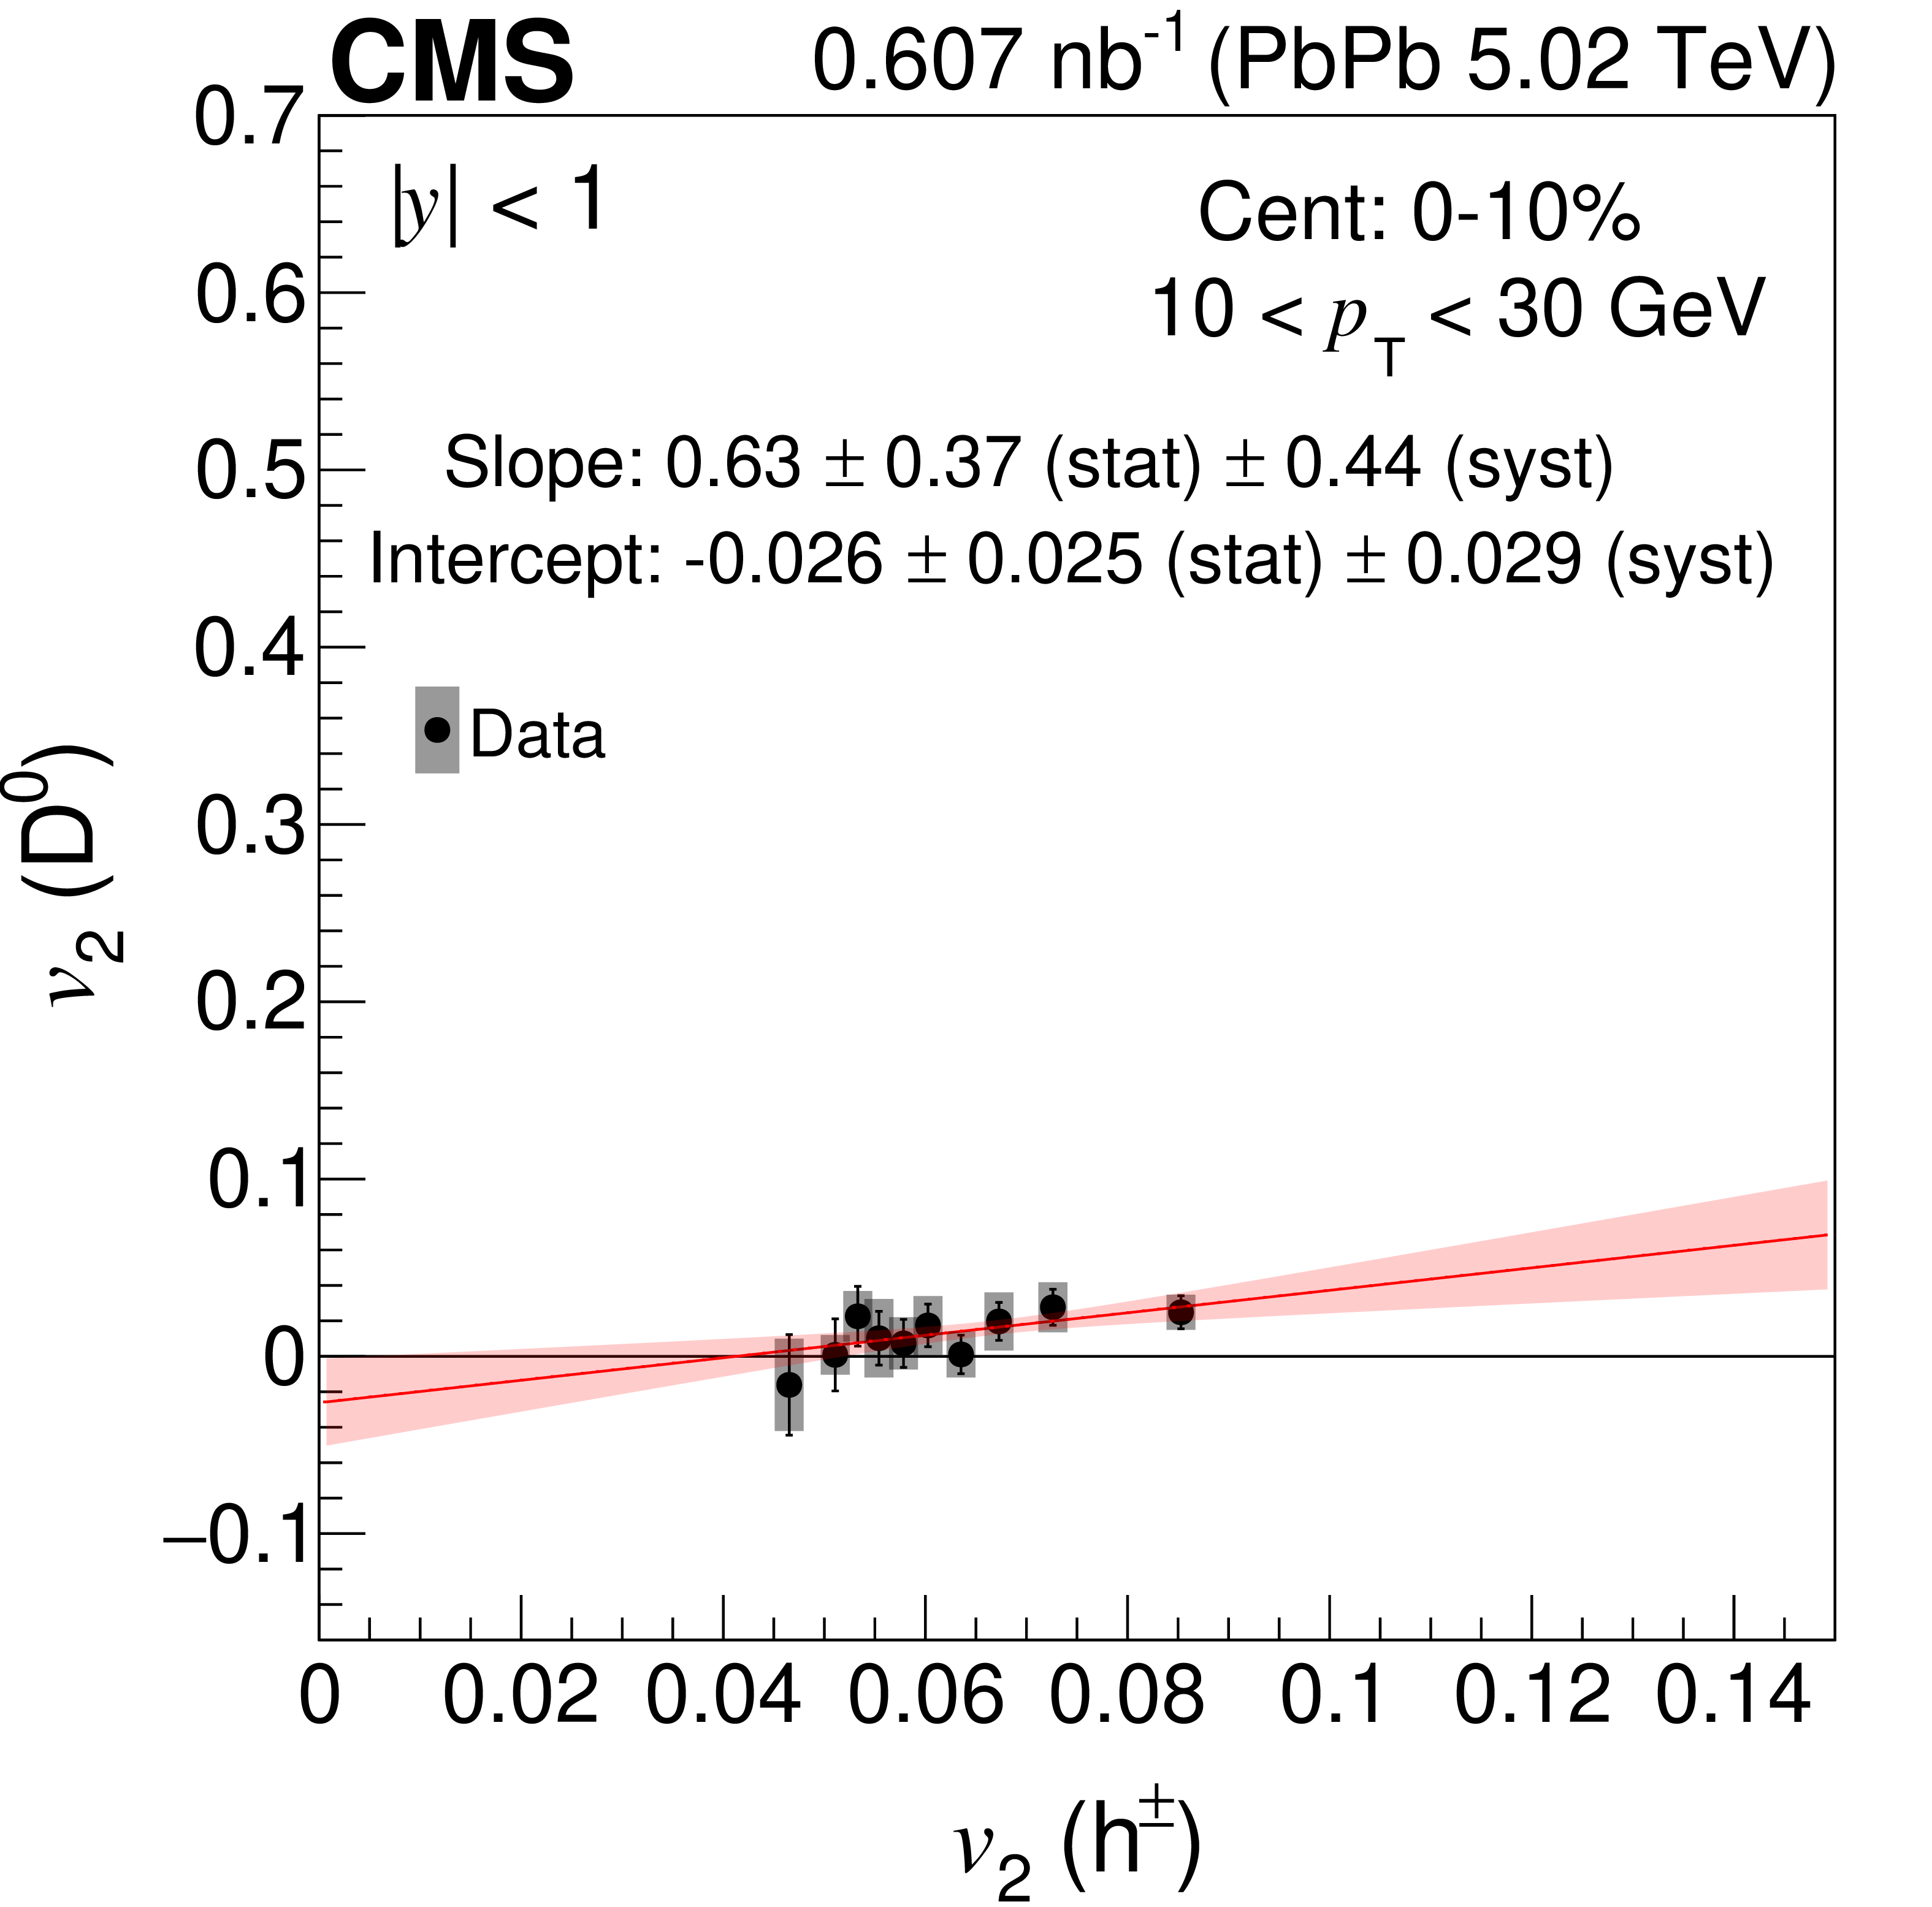
Scatter plots of the $ \mathrm{D^0} $ meson $ v_2 $ vs. charged particle $ v_2 $ values measured in common $ q_2 $ intervals. The inclusive charged particles have 1 $ < p_{\mathrm{T}} < $ 3 GeV and $ |\eta| < $ 1. The vertical lines represent the statistical uncertainties, and the boxes represent the systematic uncertainties associated with the $ \mathrm{D^0} $ meson $ v_2 $ values. The uncertainties associated with the inclusive charged particle $ v_2 $ values are smaller than the markers. The $ \mathrm{D^0} $ meson $ p_{\mathrm{T}} $ ranges 2--4 GeV (upper left), 4--6 GeV (upper right), 6--10 GeV (lower left), and 10--30 GeV (lower right) for the 0--10% centrality class are shown. The red lines are linear fits to the experimental results based on the statistical uncertainties of the data, with the shaded red band corresponding to a one standard deviation uncertainty. The PHSD model [46,47] predictions are also shown in the plots. |
png pdf |
Figure 6-a:
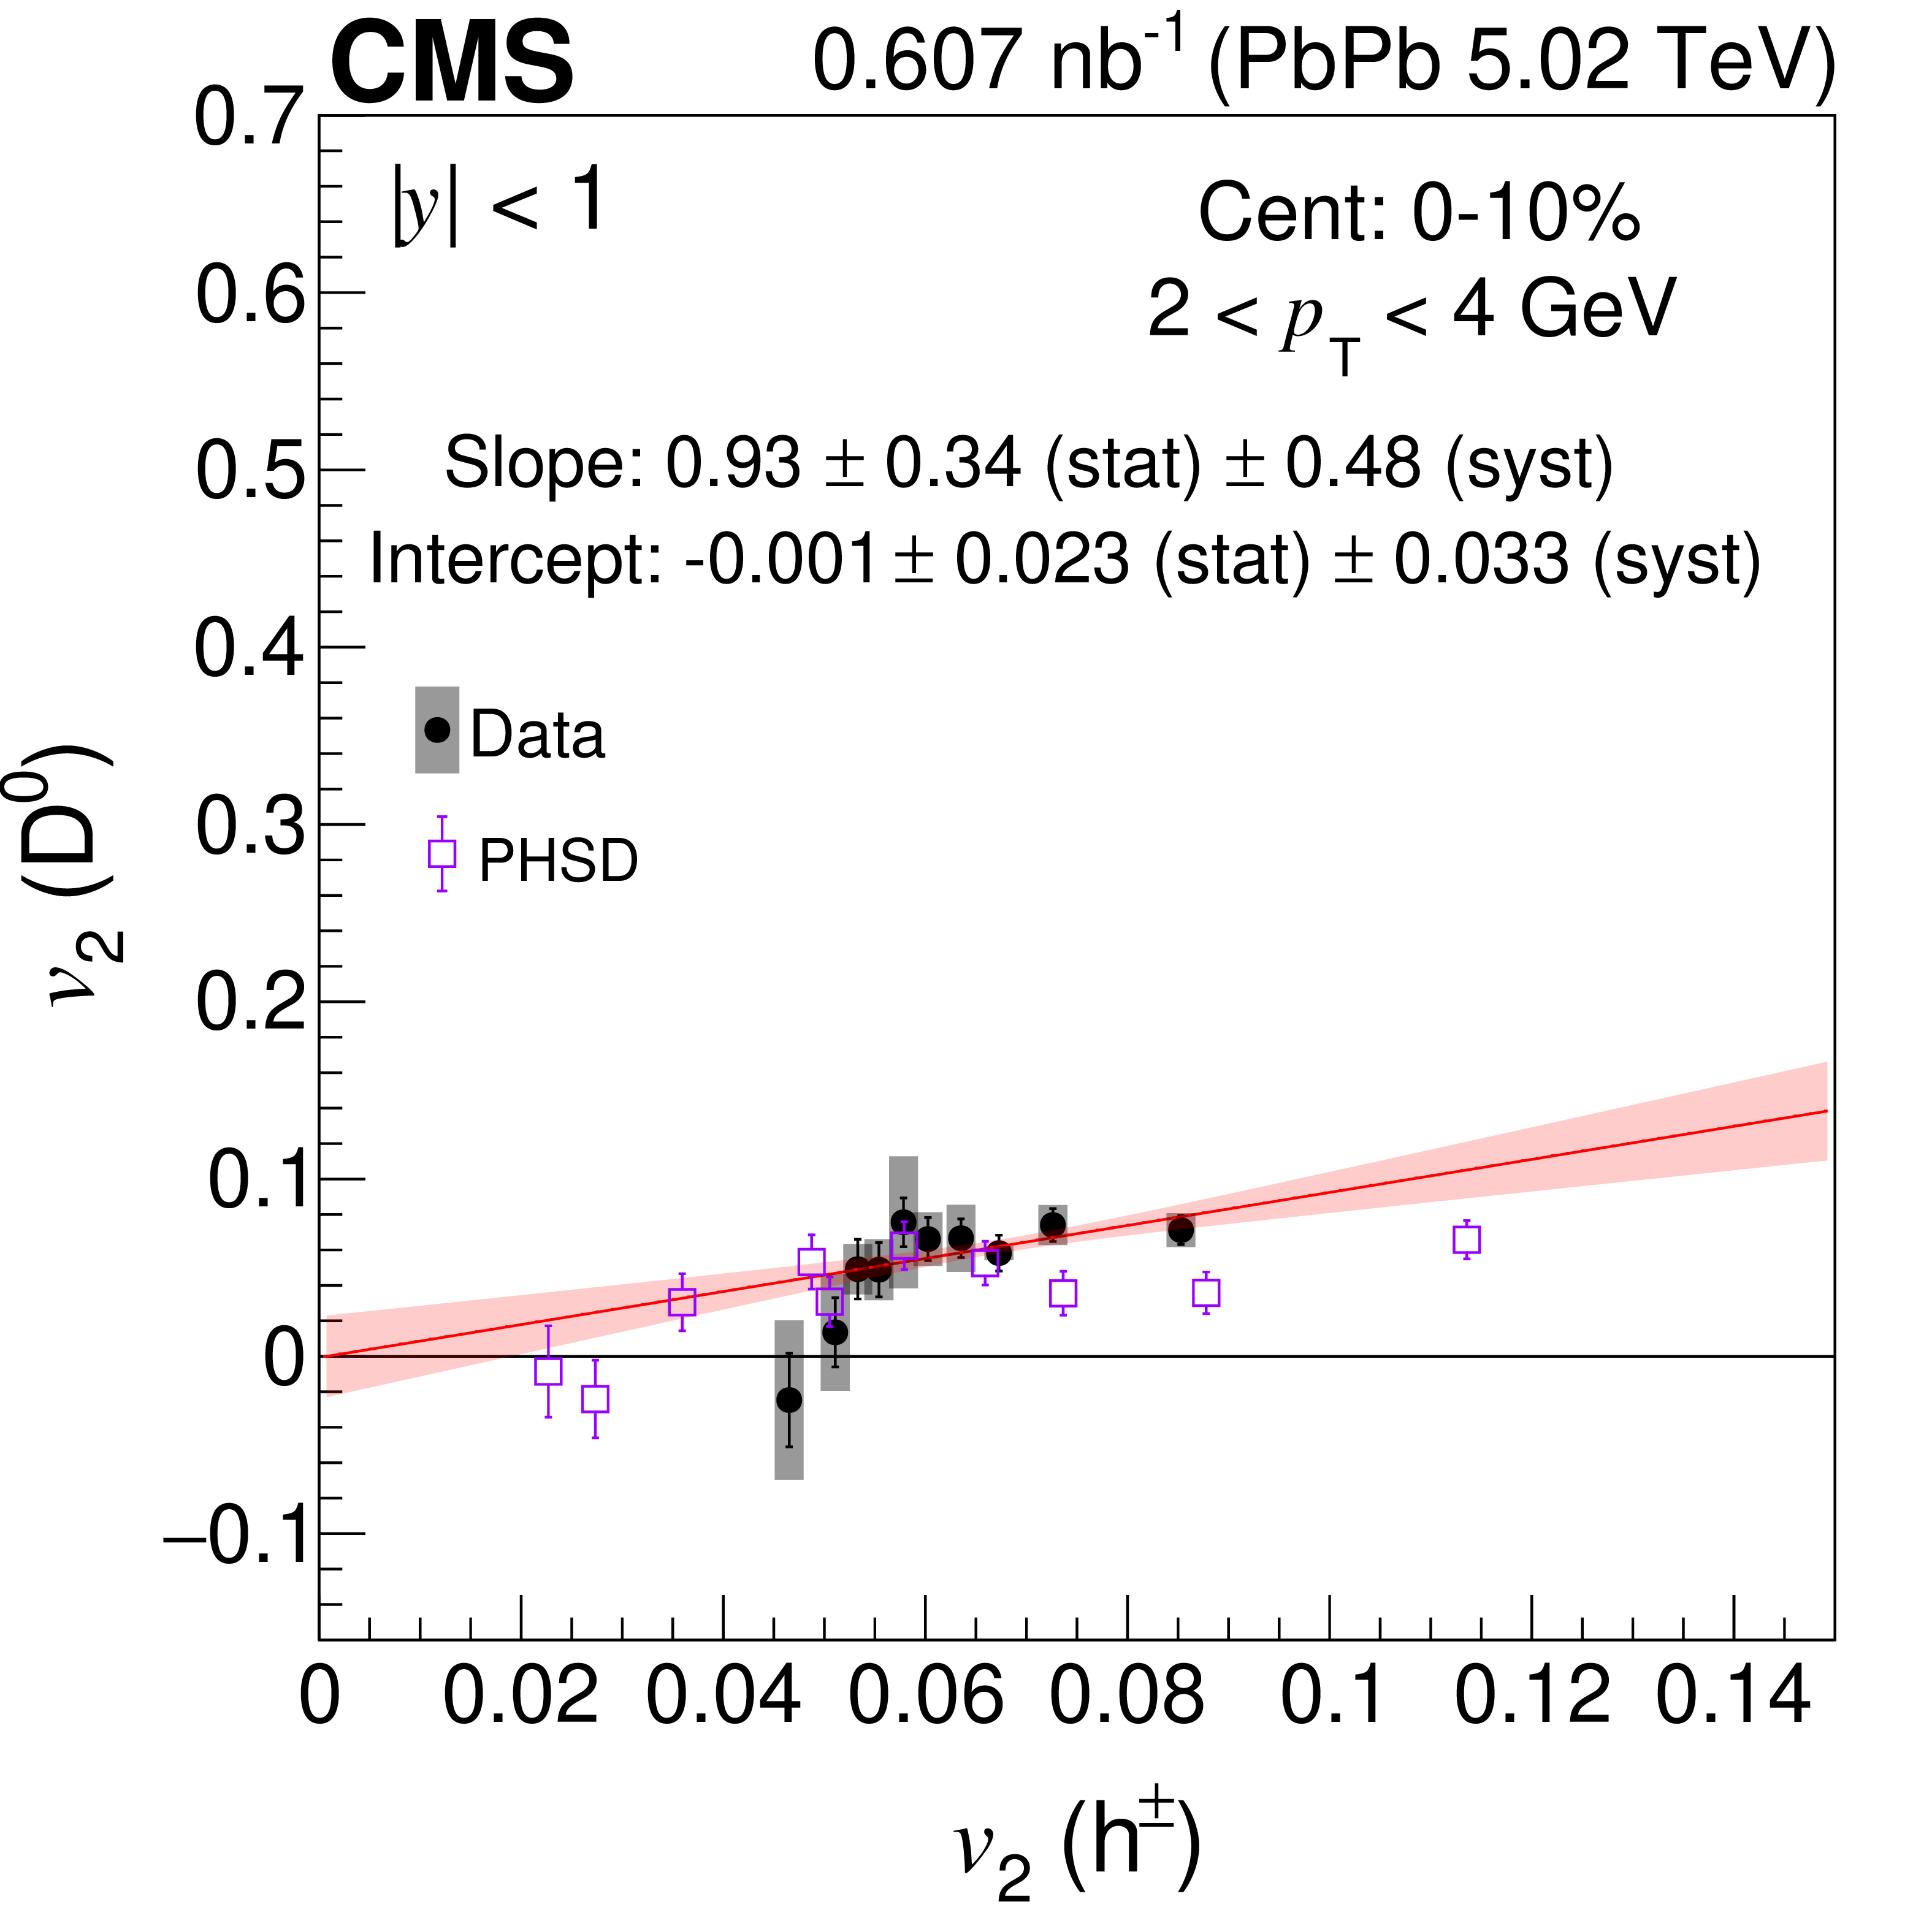
Scatter plots of the $ \mathrm{D^0} $ meson $ v_2 $ vs. charged particle $ v_2 $ values measured in common $ q_2 $ intervals. The inclusive charged particles have 1 $ < p_{\mathrm{T}} < $ 3 GeV and $ |\eta| < $ 1. The vertical lines represent the statistical uncertainties, and the boxes represent the systematic uncertainties associated with the $ \mathrm{D^0} $ meson $ v_2 $ values. The uncertainties associated with the inclusive charged particle $ v_2 $ values are smaller than the markers. The $ \mathrm{D^0} $ meson $ p_{\mathrm{T}} $ ranges 2--4 GeV (upper left), 4--6 GeV (upper right), 6--10 GeV (lower left), and 10--30 GeV (lower right) for the 0--10% centrality class are shown. The red lines are linear fits to the experimental results based on the statistical uncertainties of the data, with the shaded red band corresponding to a one standard deviation uncertainty. The PHSD model [46,47] predictions are also shown in the plots. |
png pdf |
Figure 6-b:
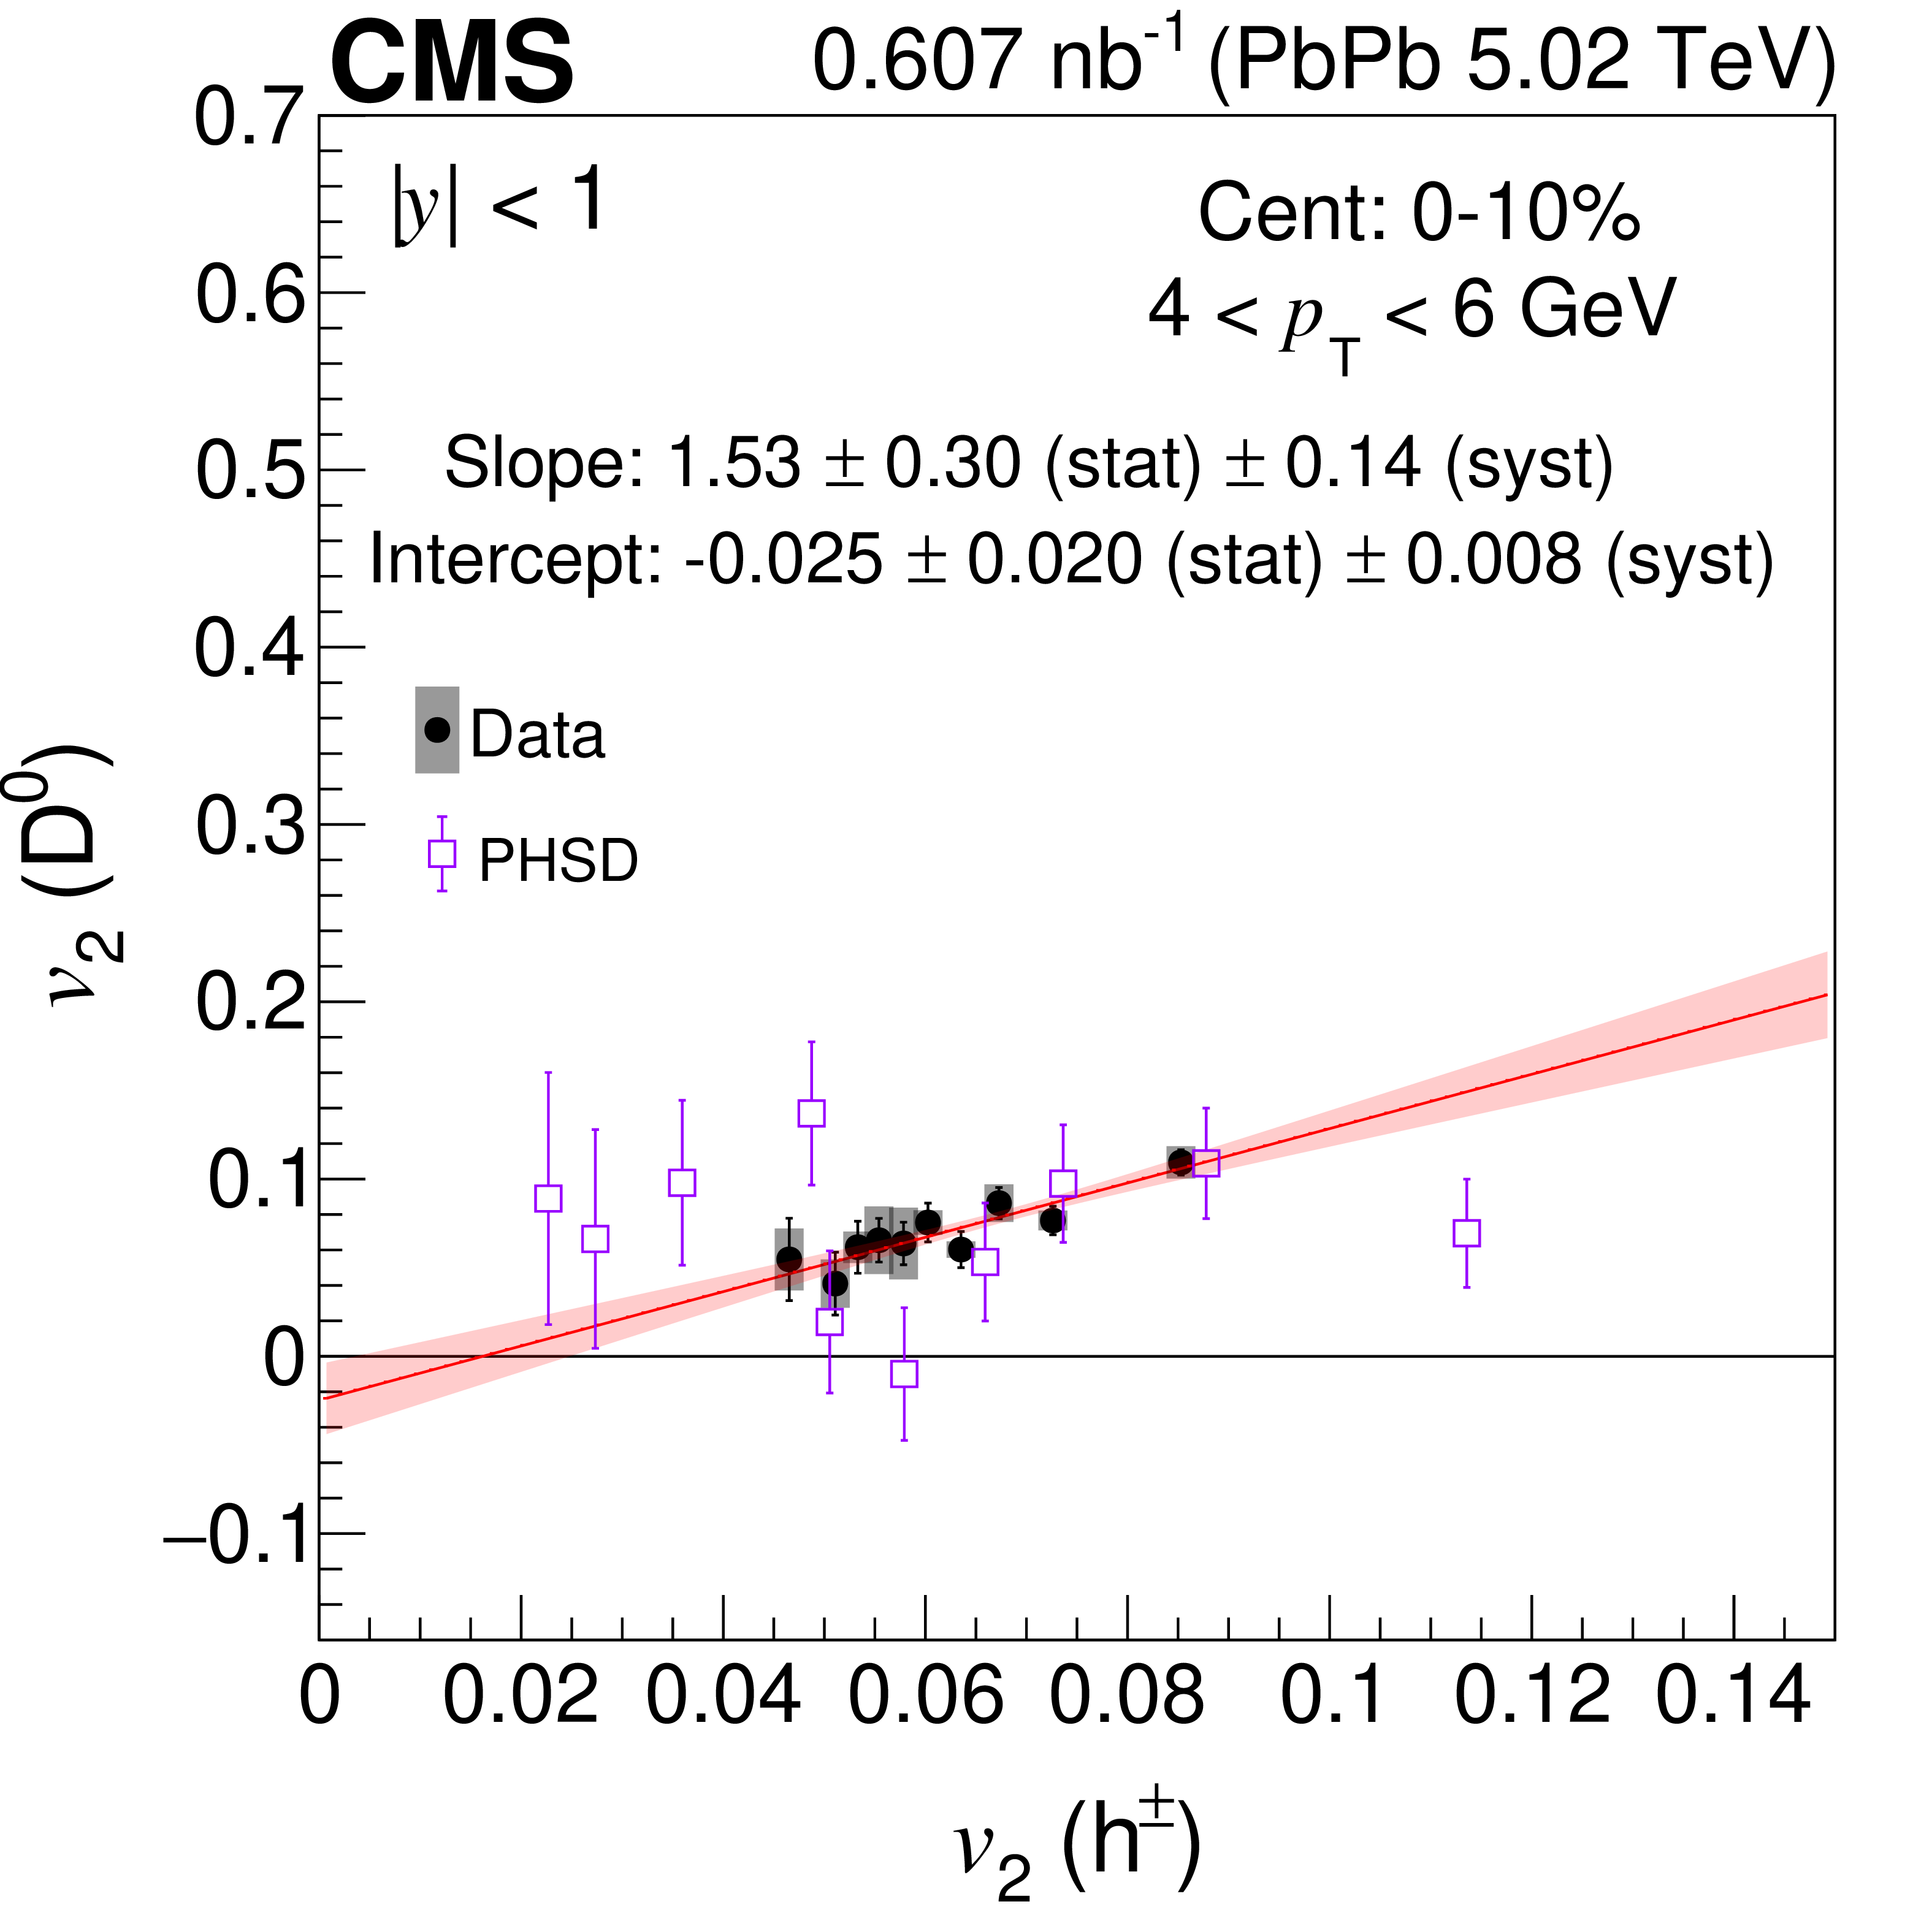
Scatter plots of the $ \mathrm{D^0} $ meson $ v_2 $ vs. charged particle $ v_2 $ values measured in common $ q_2 $ intervals. The inclusive charged particles have 1 $ < p_{\mathrm{T}} < $ 3 GeV and $ |\eta| < $ 1. The vertical lines represent the statistical uncertainties, and the boxes represent the systematic uncertainties associated with the $ \mathrm{D^0} $ meson $ v_2 $ values. The uncertainties associated with the inclusive charged particle $ v_2 $ values are smaller than the markers. The $ \mathrm{D^0} $ meson $ p_{\mathrm{T}} $ ranges 2--4 GeV (upper left), 4--6 GeV (upper right), 6--10 GeV (lower left), and 10--30 GeV (lower right) for the 0--10% centrality class are shown. The red lines are linear fits to the experimental results based on the statistical uncertainties of the data, with the shaded red band corresponding to a one standard deviation uncertainty. The PHSD model [46,47] predictions are also shown in the plots. |
png pdf |
Figure 6-c:
Scatter plots of the $ \mathrm{D^0} $ meson $ v_2 $ vs. charged particle $ v_2 $ values measured in common $ q_2 $ intervals. The inclusive charged particles have 1 $ < p_{\mathrm{T}} < $ 3 GeV and $ |\eta| < $ 1. The vertical lines represent the statistical uncertainties, and the boxes represent the systematic uncertainties associated with the $ \mathrm{D^0} $ meson $ v_2 $ values. The uncertainties associated with the inclusive charged particle $ v_2 $ values are smaller than the markers. The $ \mathrm{D^0} $ meson $ p_{\mathrm{T}} $ ranges 2--4 GeV (upper left), 4--6 GeV (upper right), 6--10 GeV (lower left), and 10--30 GeV (lower right) for the 0--10% centrality class are shown. The red lines are linear fits to the experimental results based on the statistical uncertainties of the data, with the shaded red band corresponding to a one standard deviation uncertainty. The PHSD model [46,47] predictions are also shown in the plots. |
png pdf |
Figure 6-d:
Scatter plots of the $ \mathrm{D^0} $ meson $ v_2 $ vs. charged particle $ v_2 $ values measured in common $ q_2 $ intervals. The inclusive charged particles have 1 $ < p_{\mathrm{T}} < $ 3 GeV and $ |\eta| < $ 1. The vertical lines represent the statistical uncertainties, and the boxes represent the systematic uncertainties associated with the $ \mathrm{D^0} $ meson $ v_2 $ values. The uncertainties associated with the inclusive charged particle $ v_2 $ values are smaller than the markers. The $ \mathrm{D^0} $ meson $ p_{\mathrm{T}} $ ranges 2--4 GeV (upper left), 4--6 GeV (upper right), 6--10 GeV (lower left), and 10--30 GeV (lower right) for the 0--10% centrality class are shown. The red lines are linear fits to the experimental results based on the statistical uncertainties of the data, with the shaded red band corresponding to a one standard deviation uncertainty. The PHSD model [46,47] predictions are also shown in the plots. |
png pdf |
Figure 7:
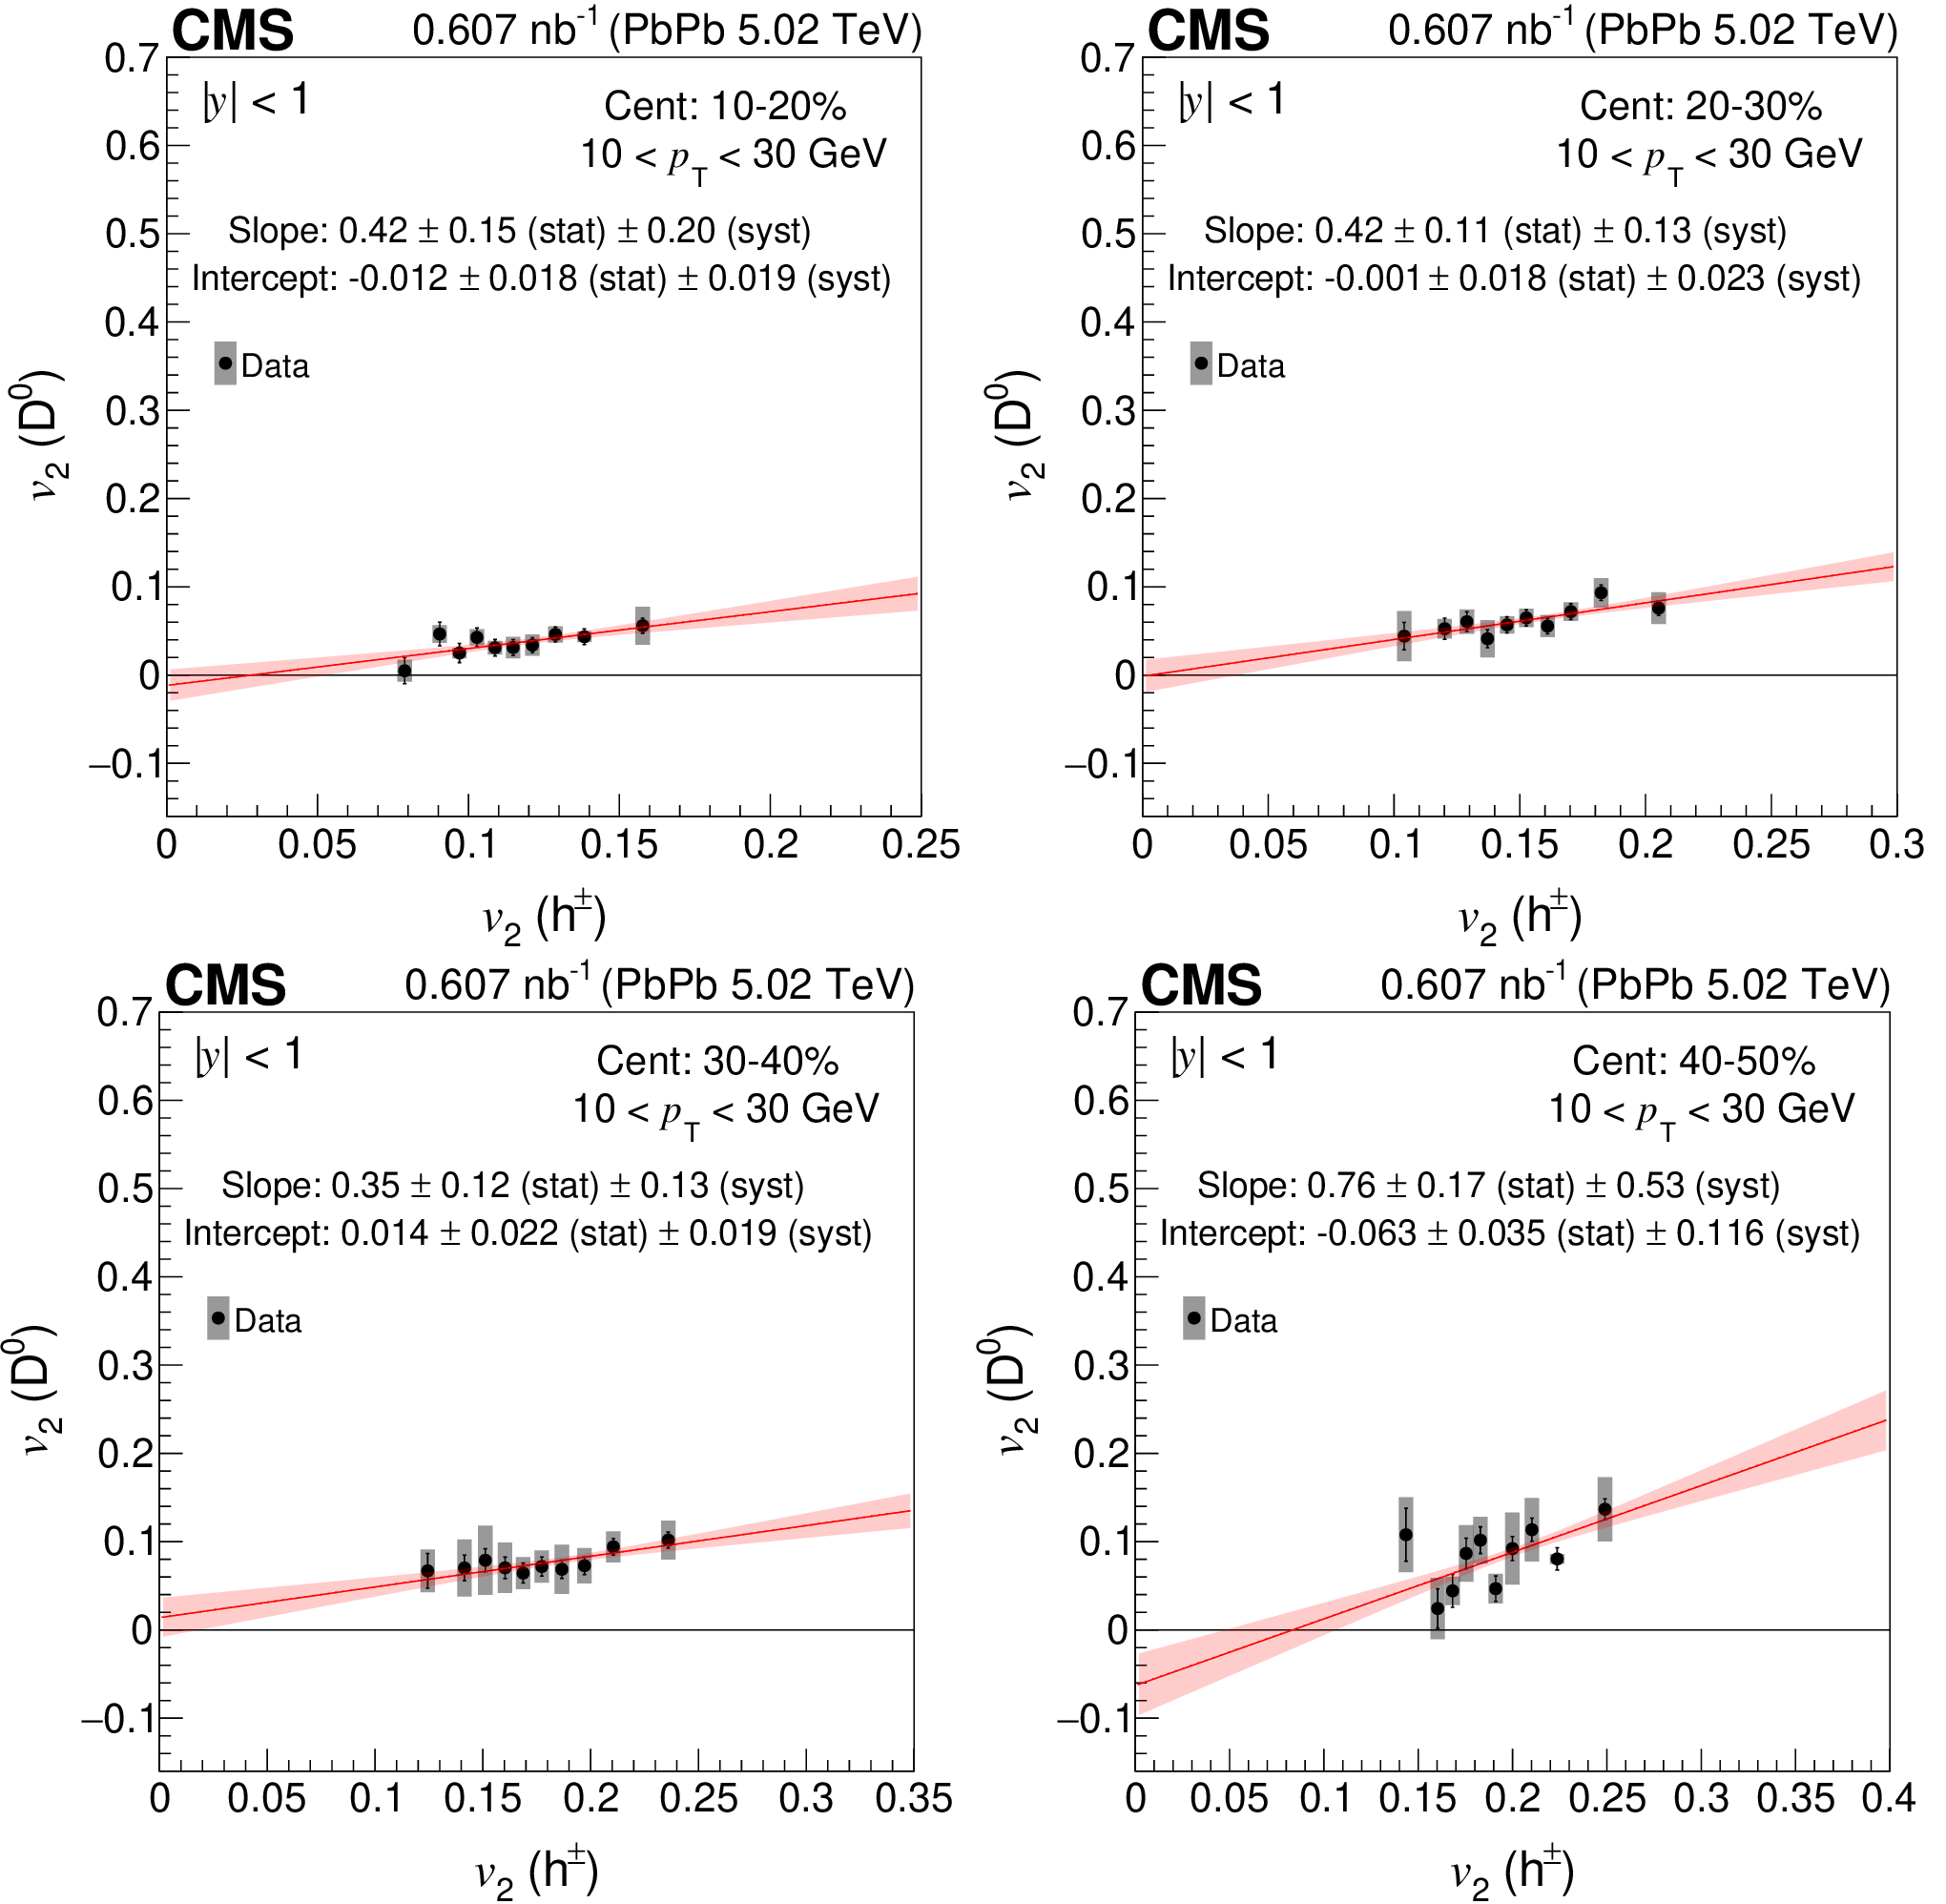
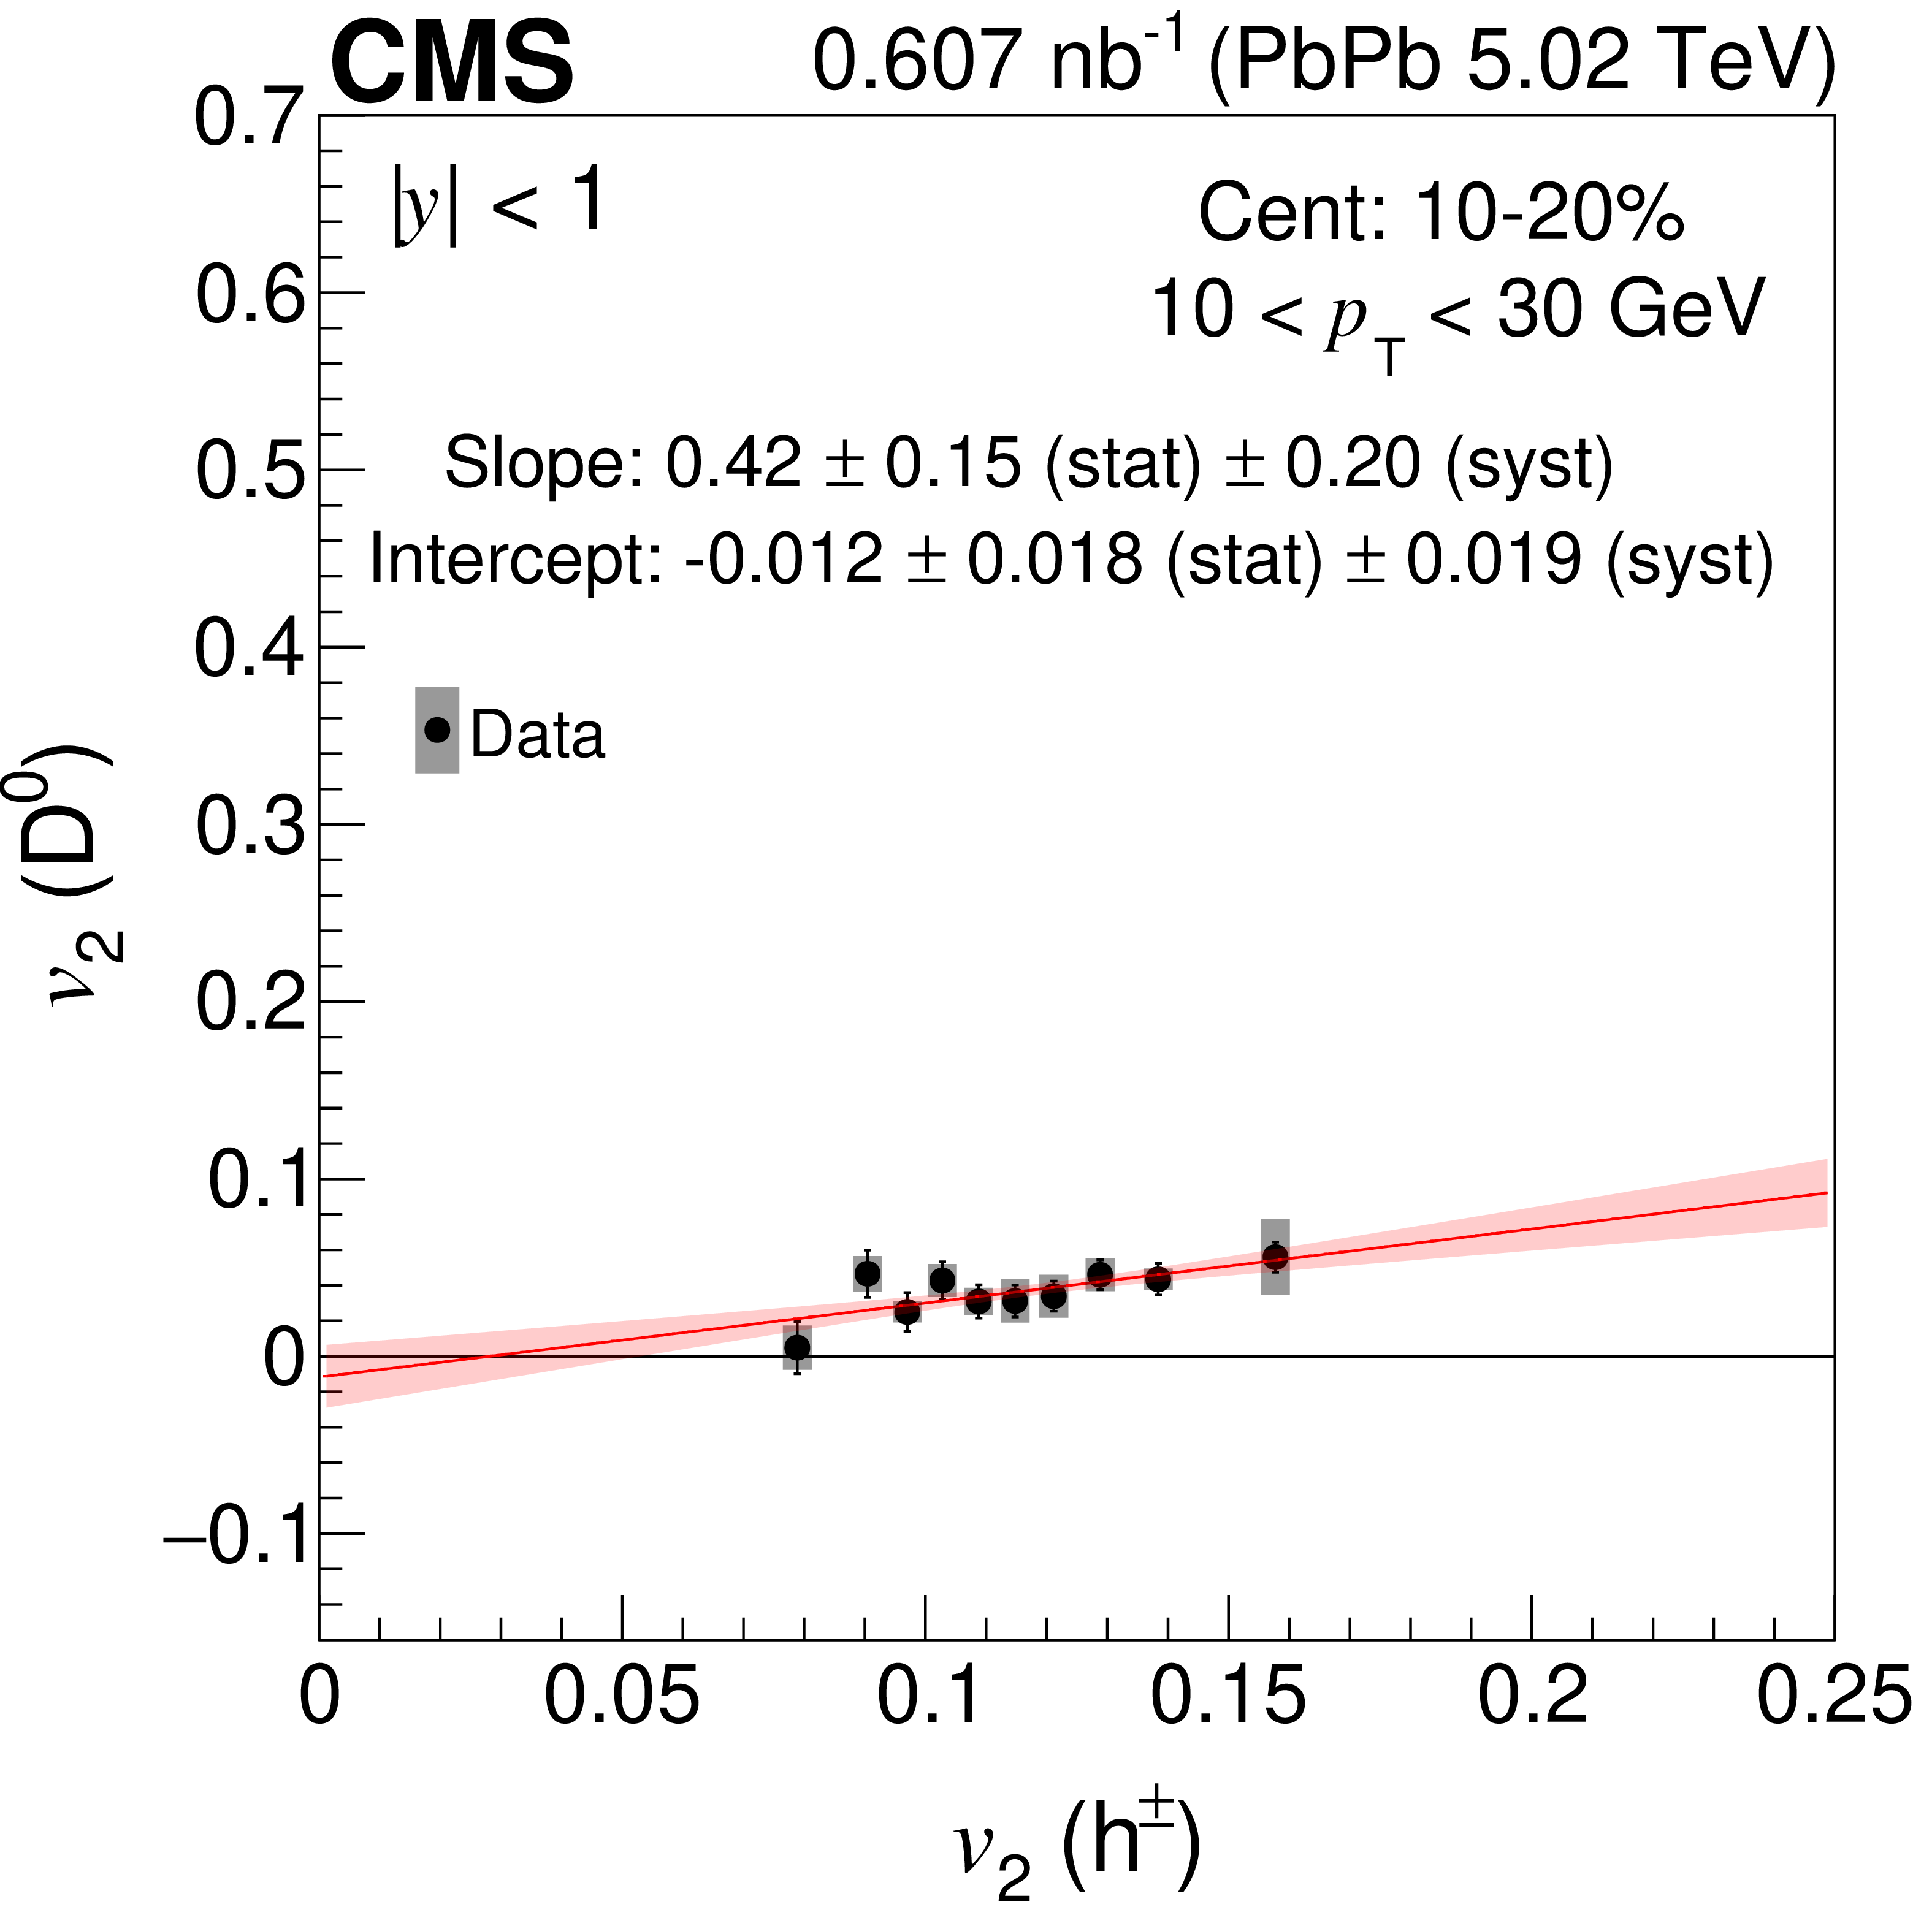
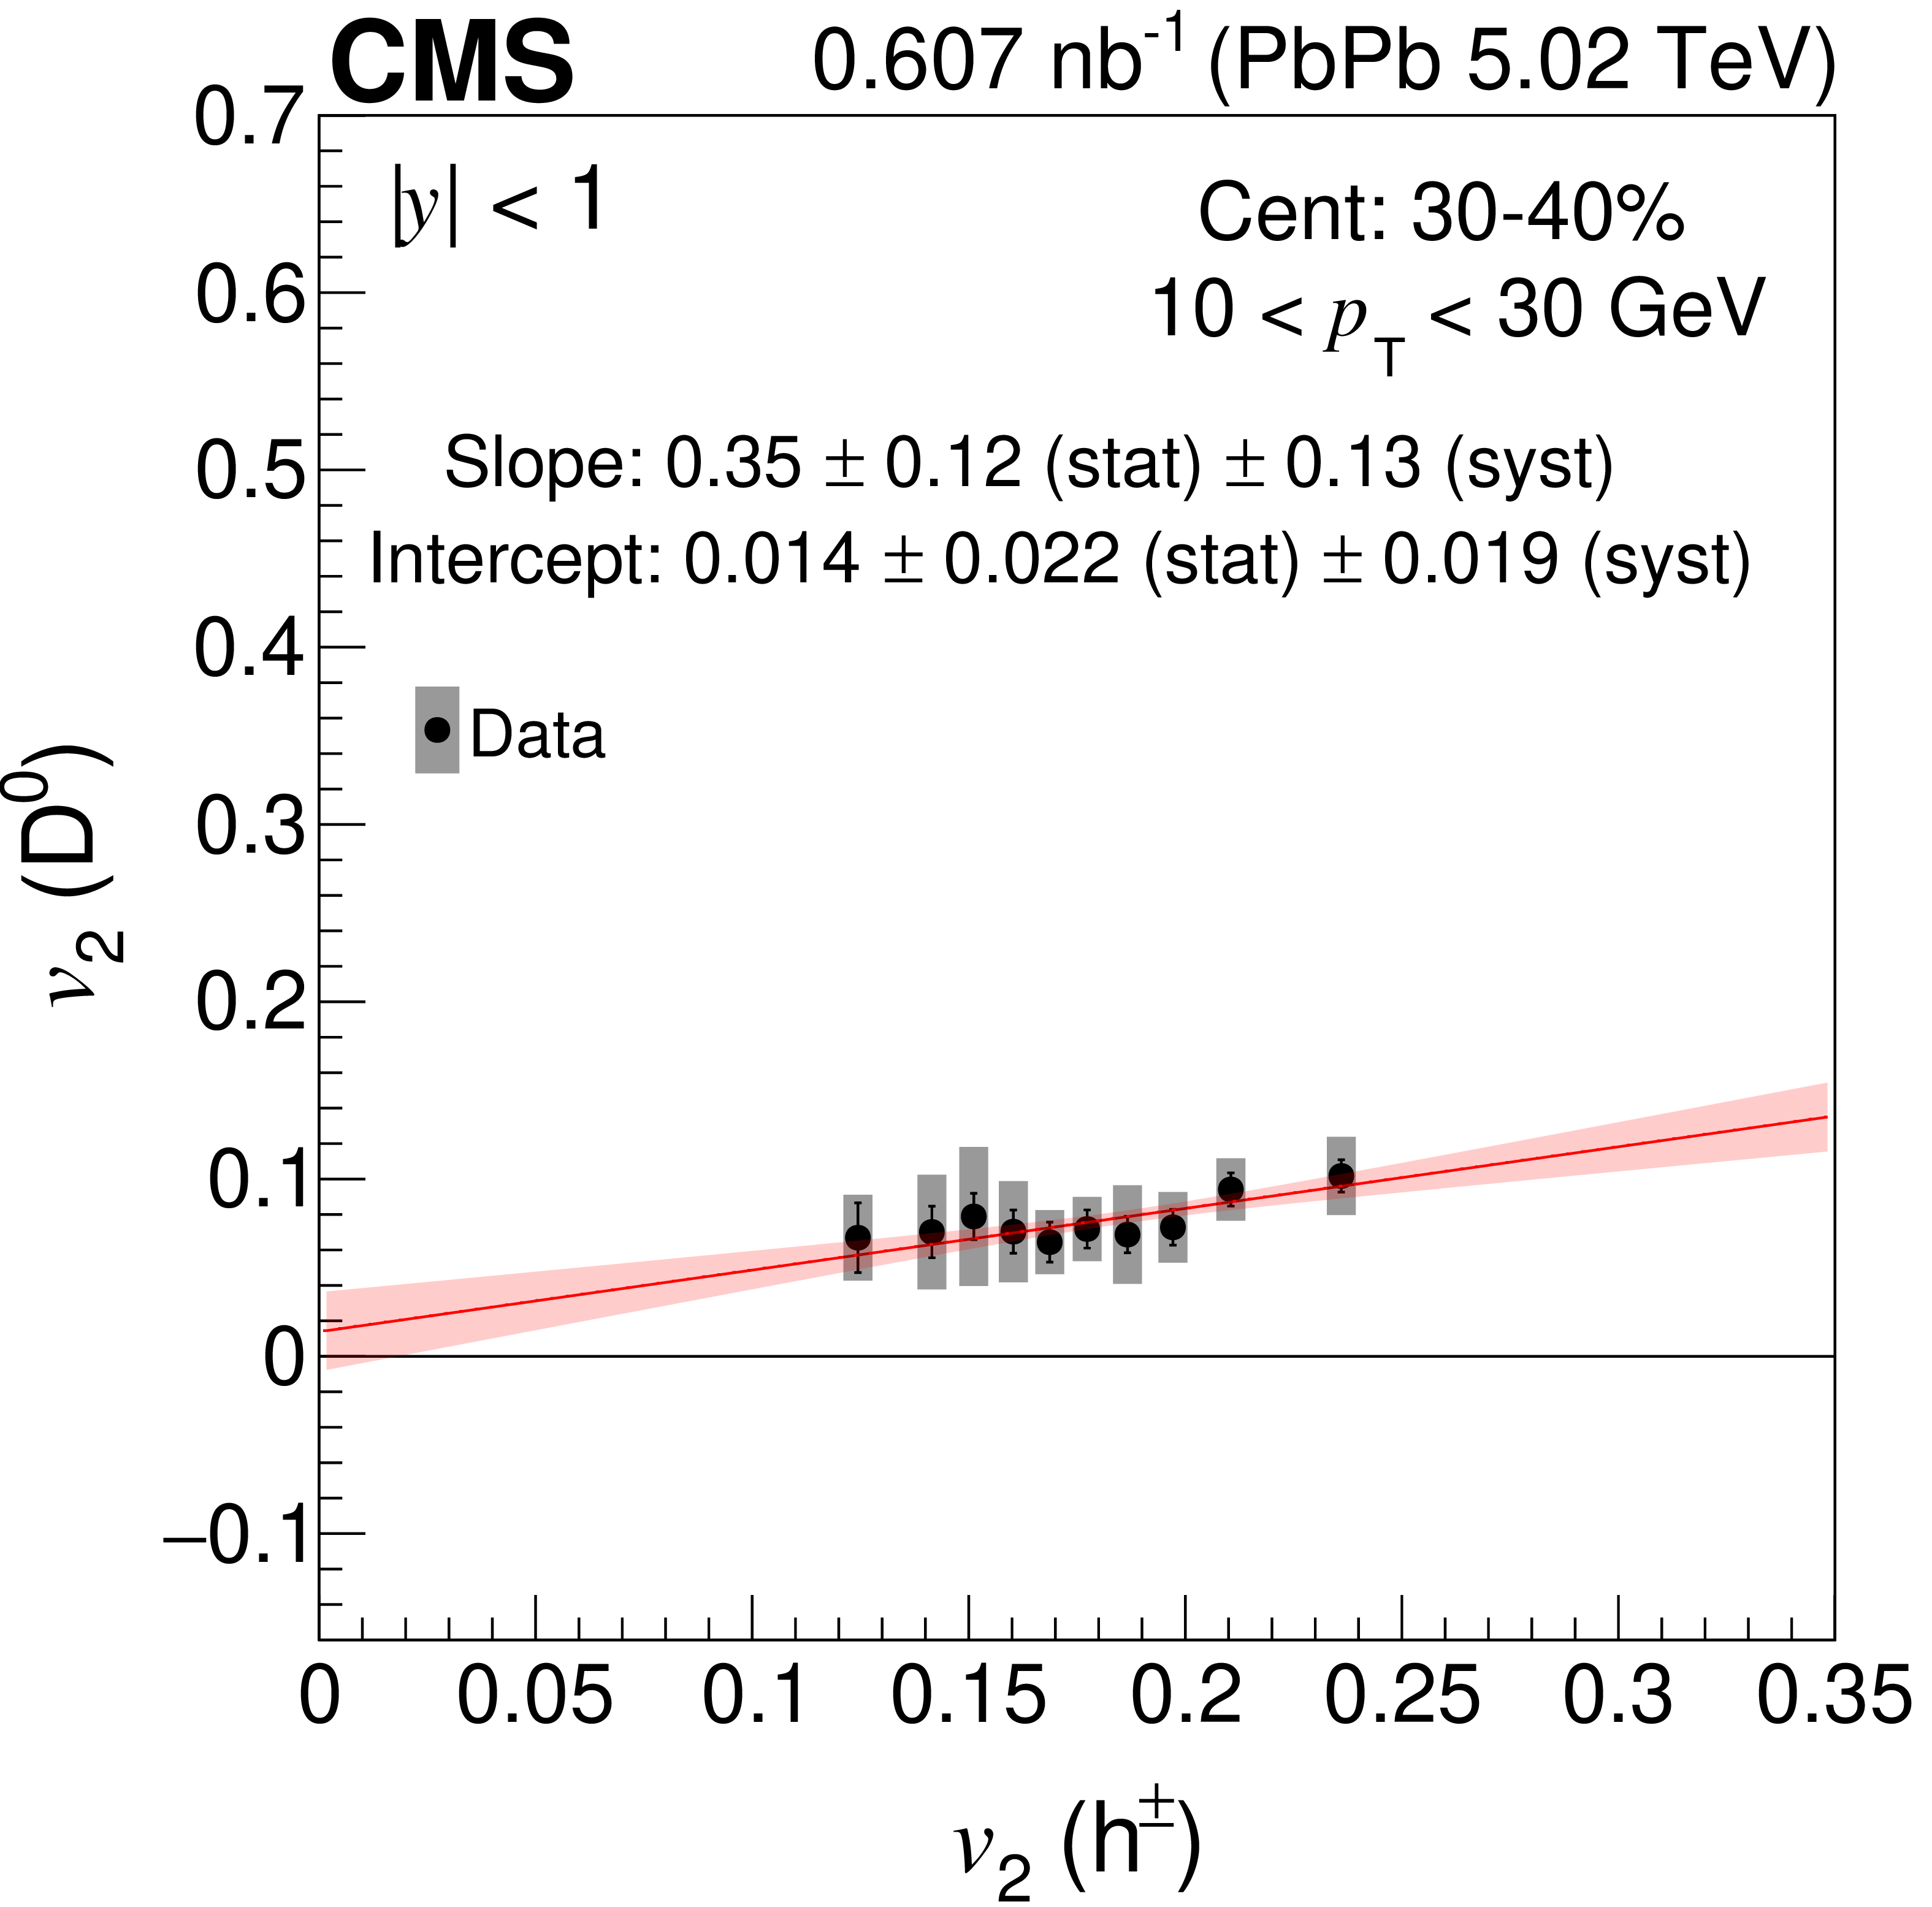
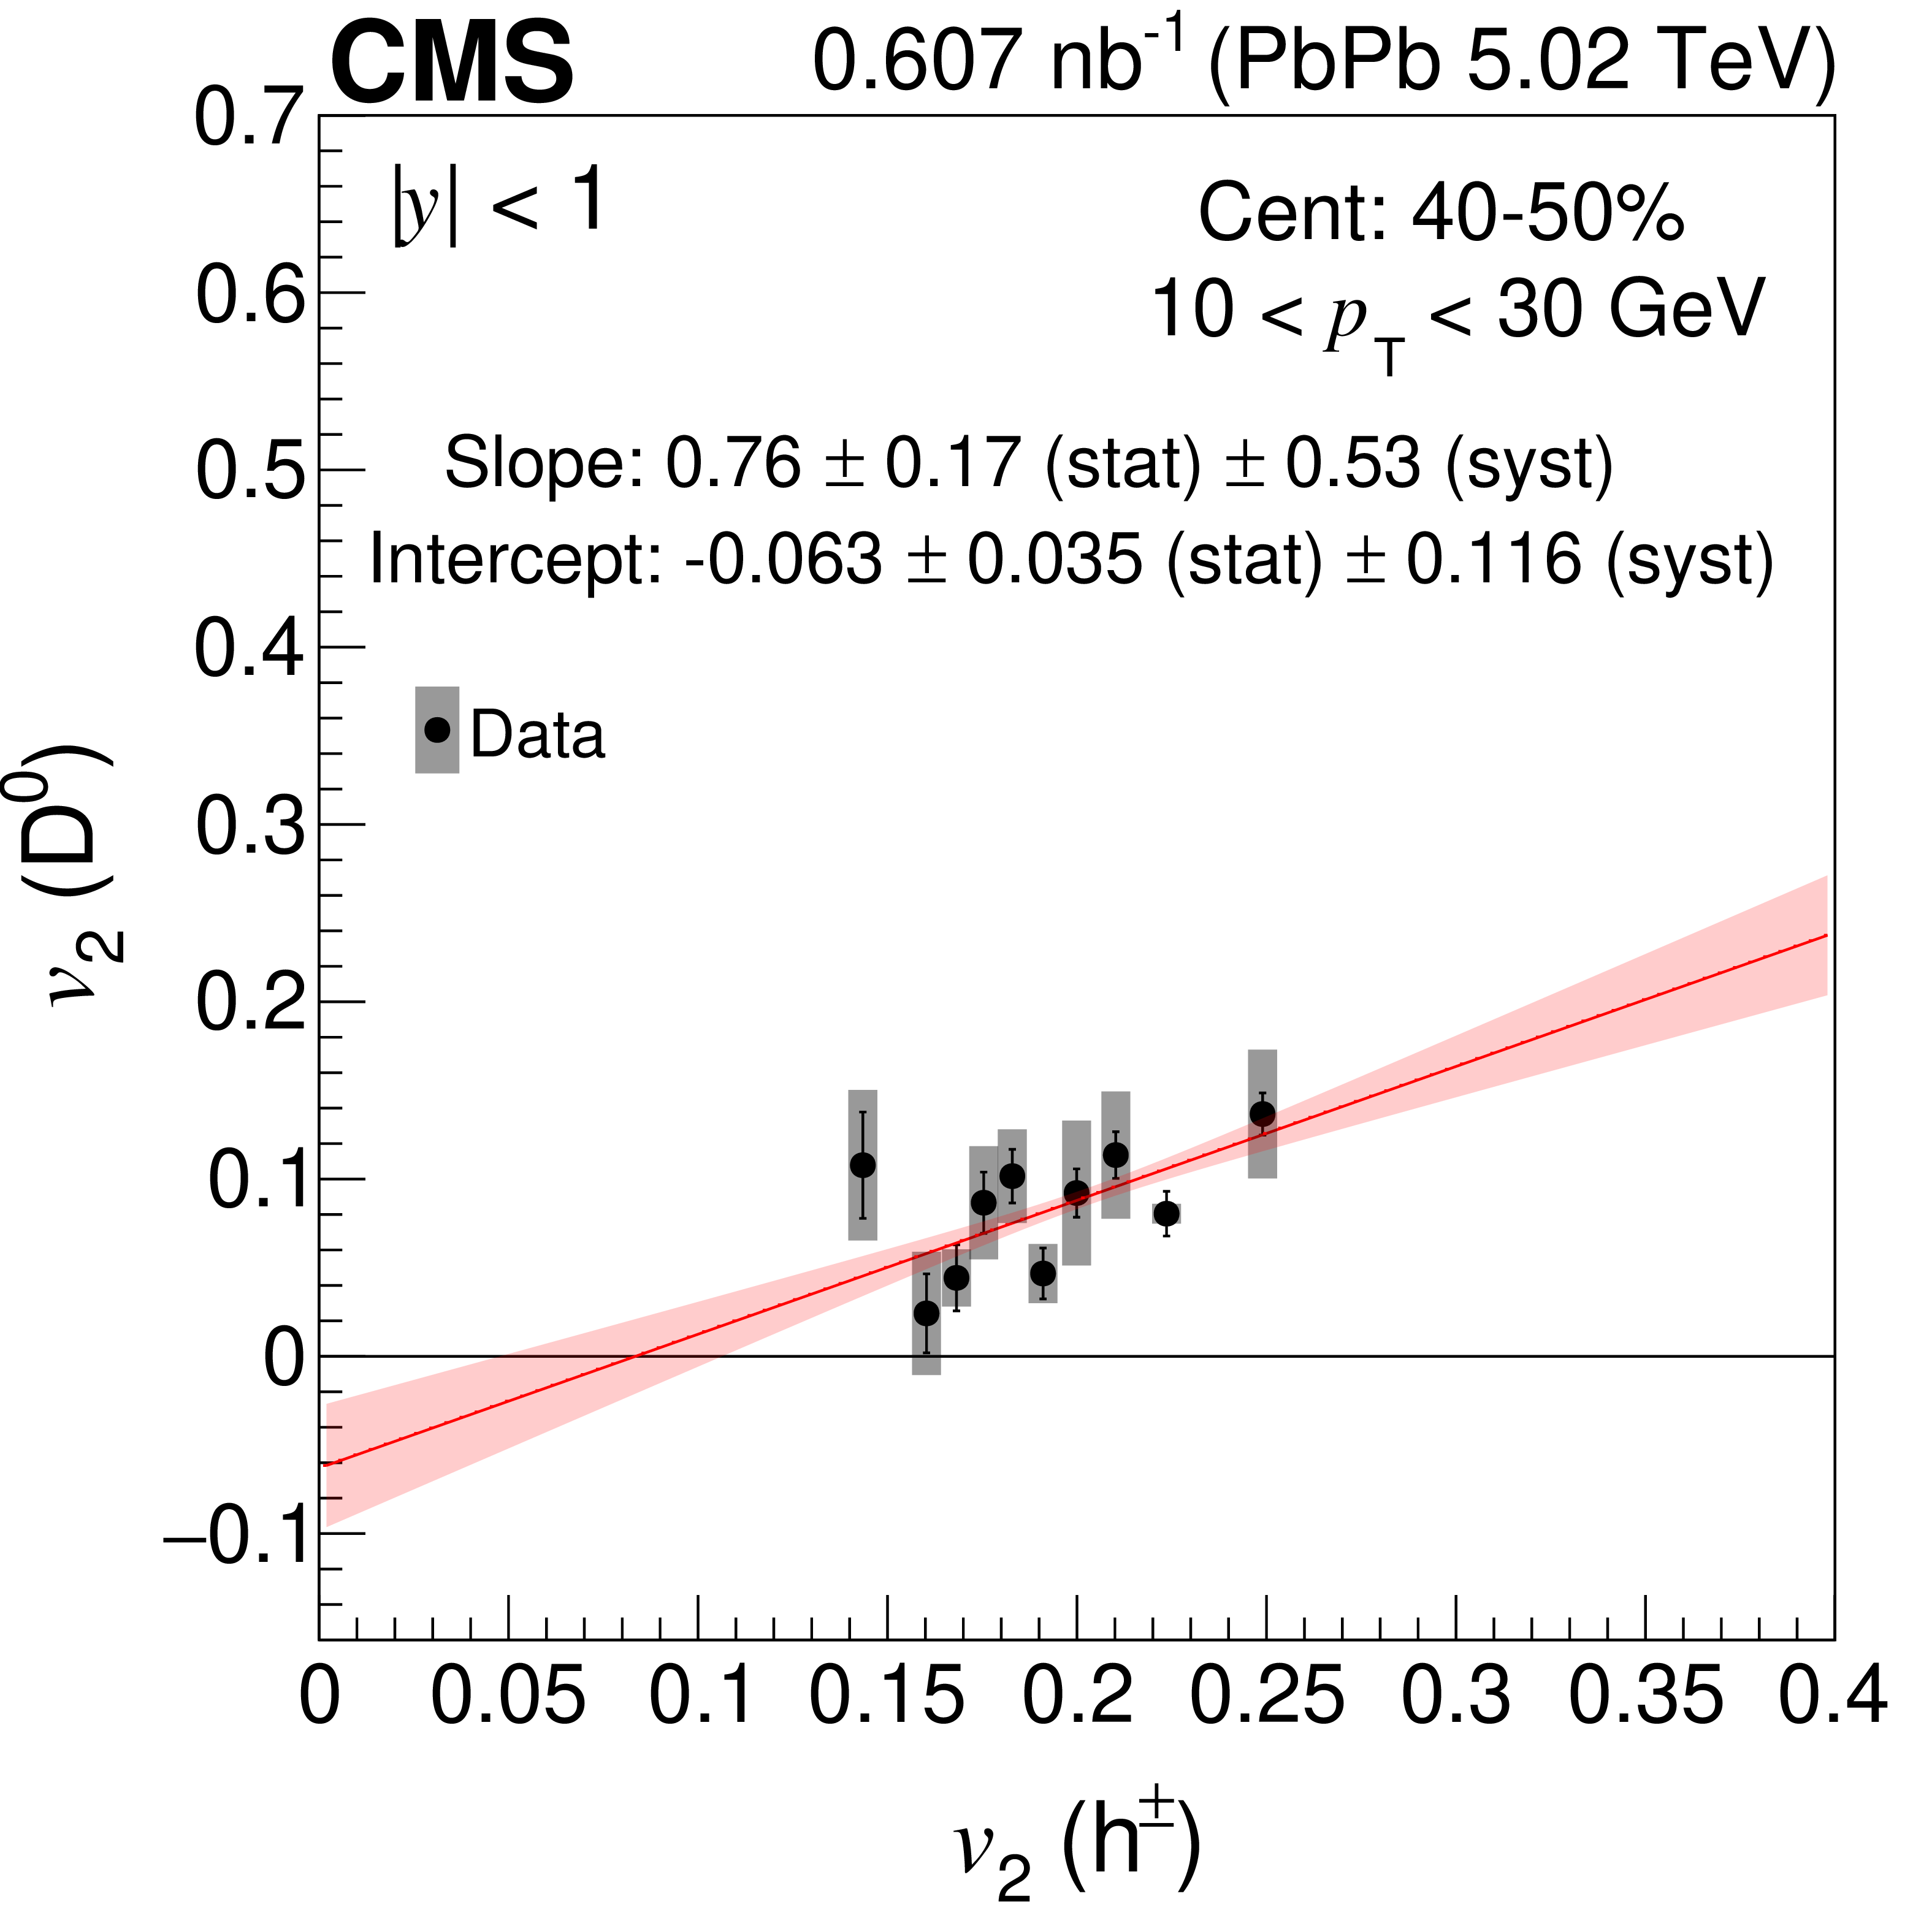
The same scatter plots as Fig. 6, but for the $ \mathrm{D^0} $ mesons with 10 $ < p_{\mathrm{T}} < $ 30 GeV in the 10--20, 20--30, 30--40, and 40--50% centrality classes. All other explanation for the plots are the same as in Fig. 6. |
png pdf |
Figure 7-a:
The same scatter plots as Fig. 6, but for the $ \mathrm{D^0} $ mesons with 10 $ < p_{\mathrm{T}} < $ 30 GeV in the 10--20, 20--30, 30--40, and 40--50% centrality classes. All other explanation for the plots are the same as in Fig. 6. |
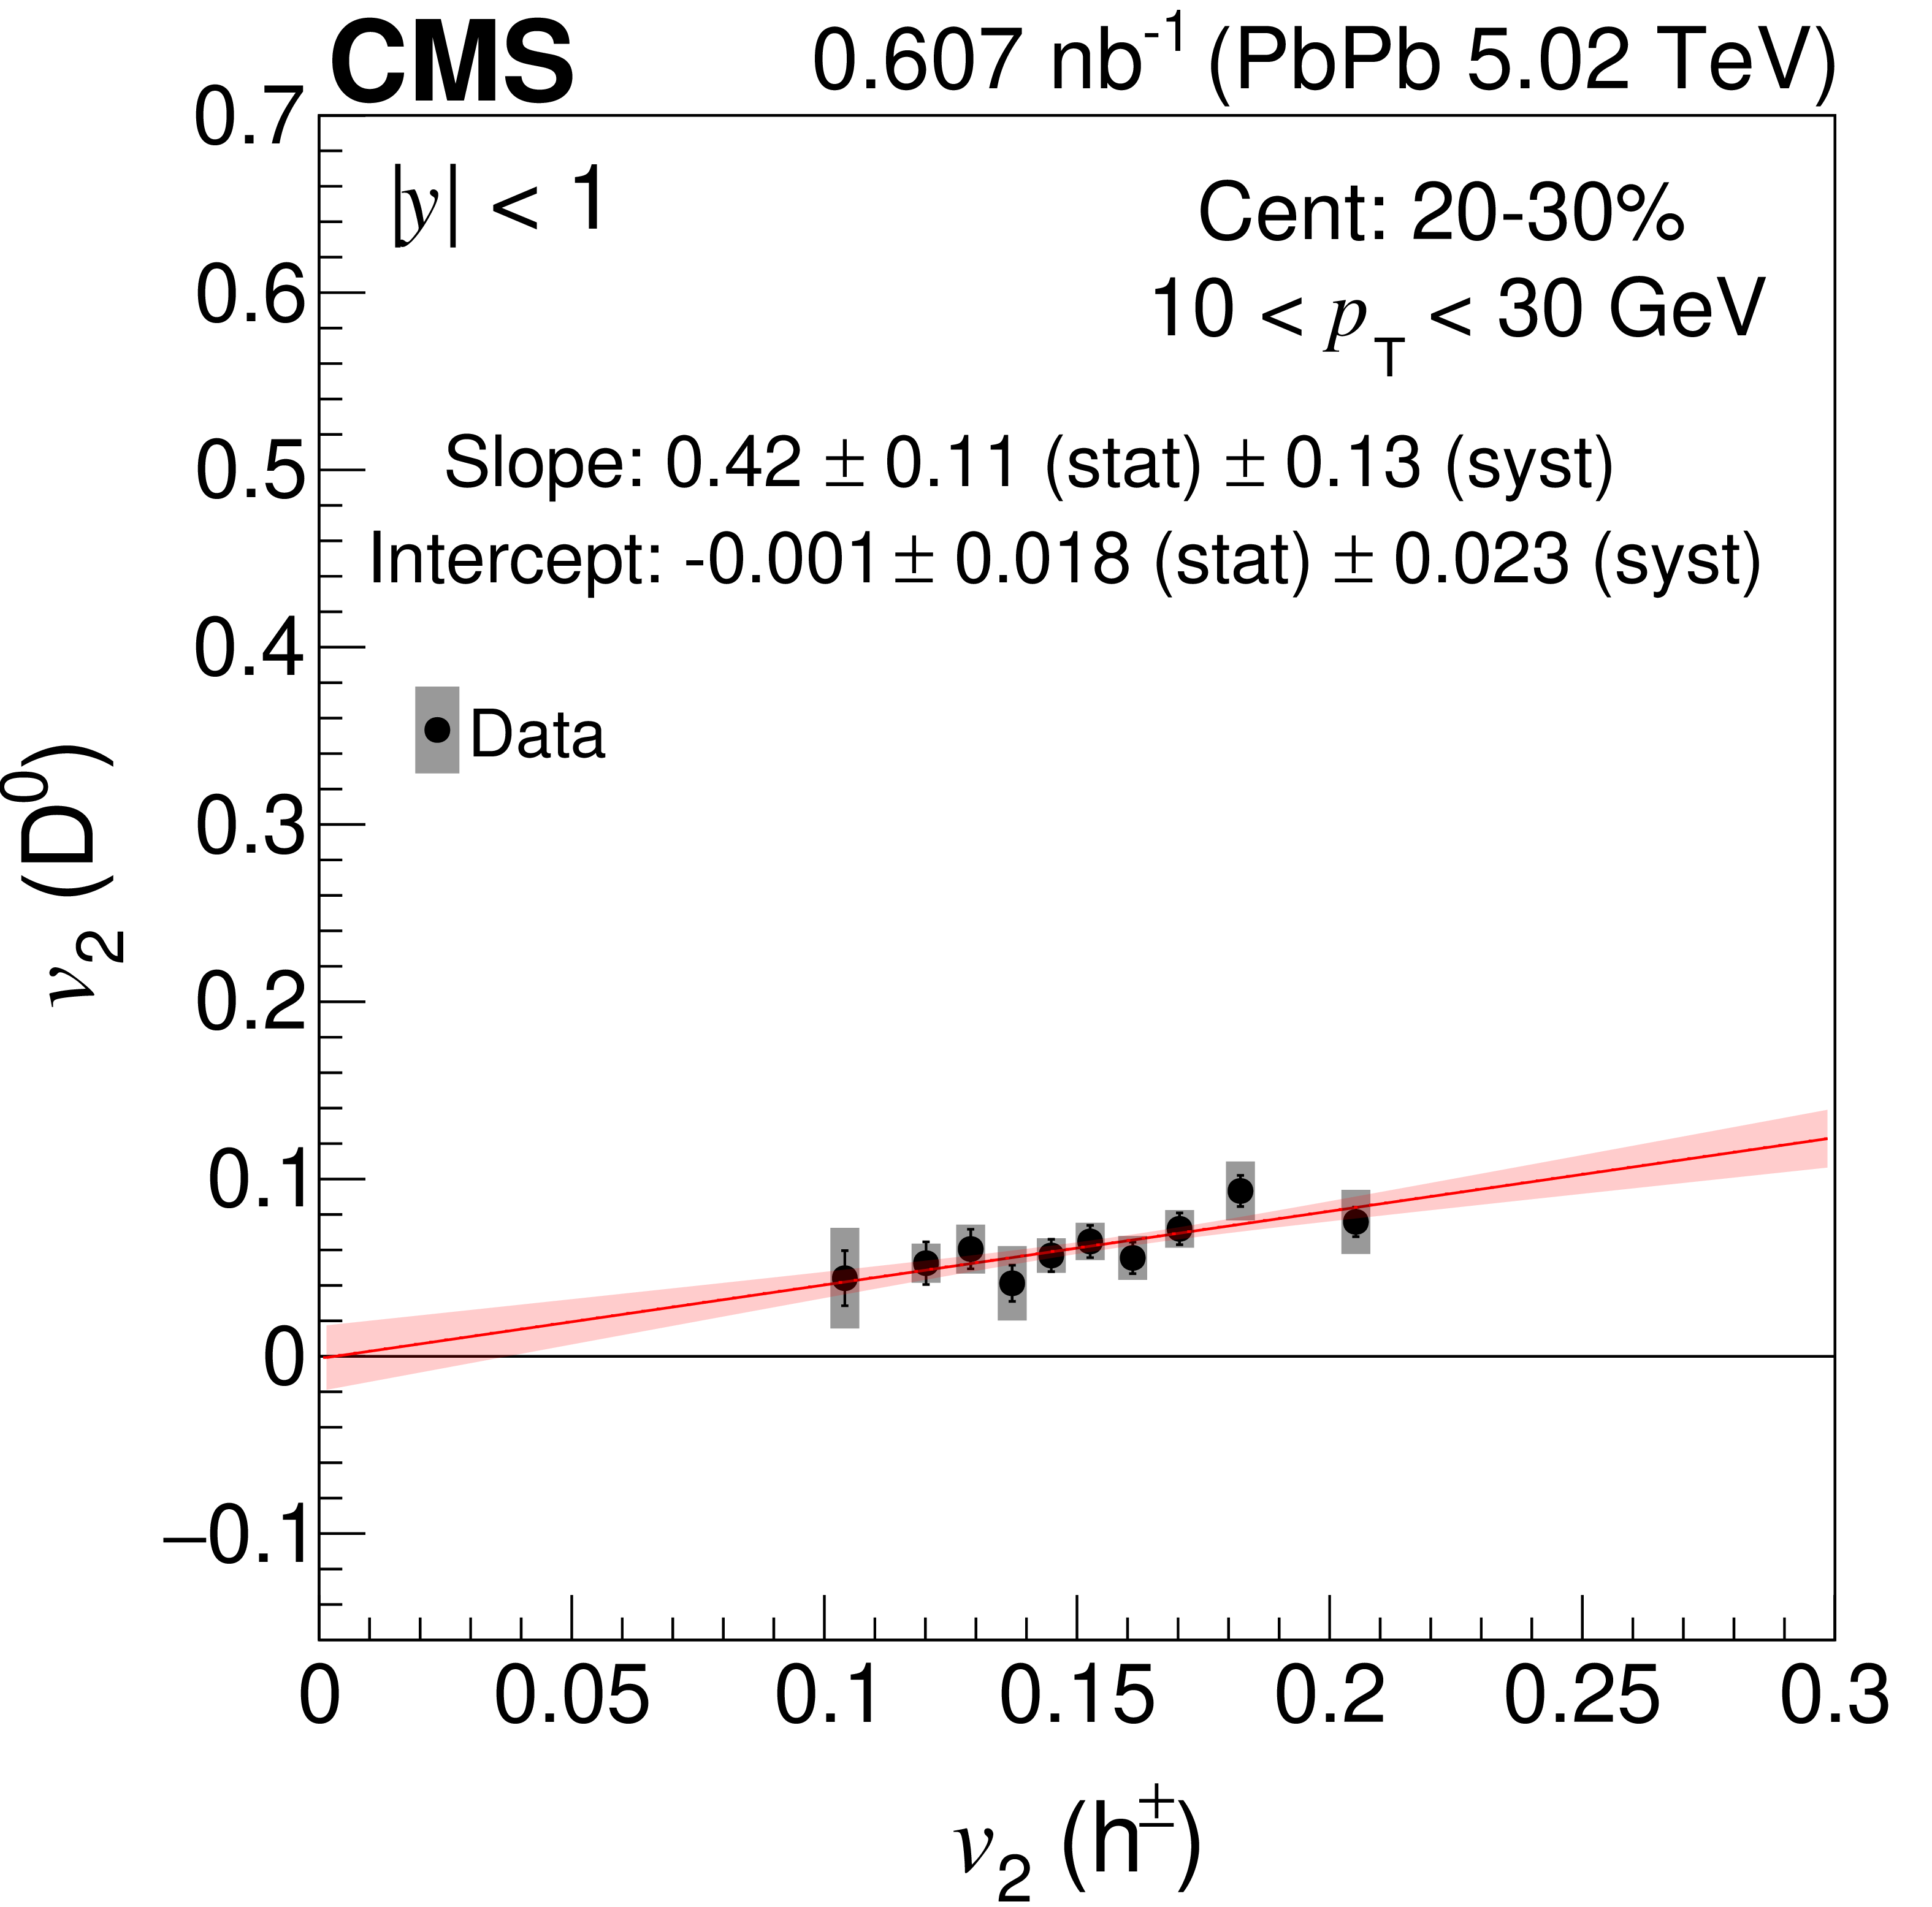
png pdf |
Figure 7-b:
The same scatter plots as Fig. 6, but for the $ \mathrm{D^0} $ mesons with 10 $ < p_{\mathrm{T}} < $ 30 GeV in the 10--20, 20--30, 30--40, and 40--50% centrality classes. All other explanation for the plots are the same as in Fig. 6. |
png pdf |
Figure 7-c:
The same scatter plots as Fig. 6, but for the $ \mathrm{D^0} $ mesons with 10 $ < p_{\mathrm{T}} < $ 30 GeV in the 10--20, 20--30, 30--40, and 40--50% centrality classes. All other explanation for the plots are the same as in Fig. 6. |
png pdf |
Figure 7-d:
The same scatter plots as Fig. 6, but for the $ \mathrm{D^0} $ mesons with 10 $ < p_{\mathrm{T}} < $ 30 GeV in the 10--20, 20--30, 30--40, and 40--50% centrality classes. All other explanation for the plots are the same as in Fig. 6. |
| Tables | |
png pdf |
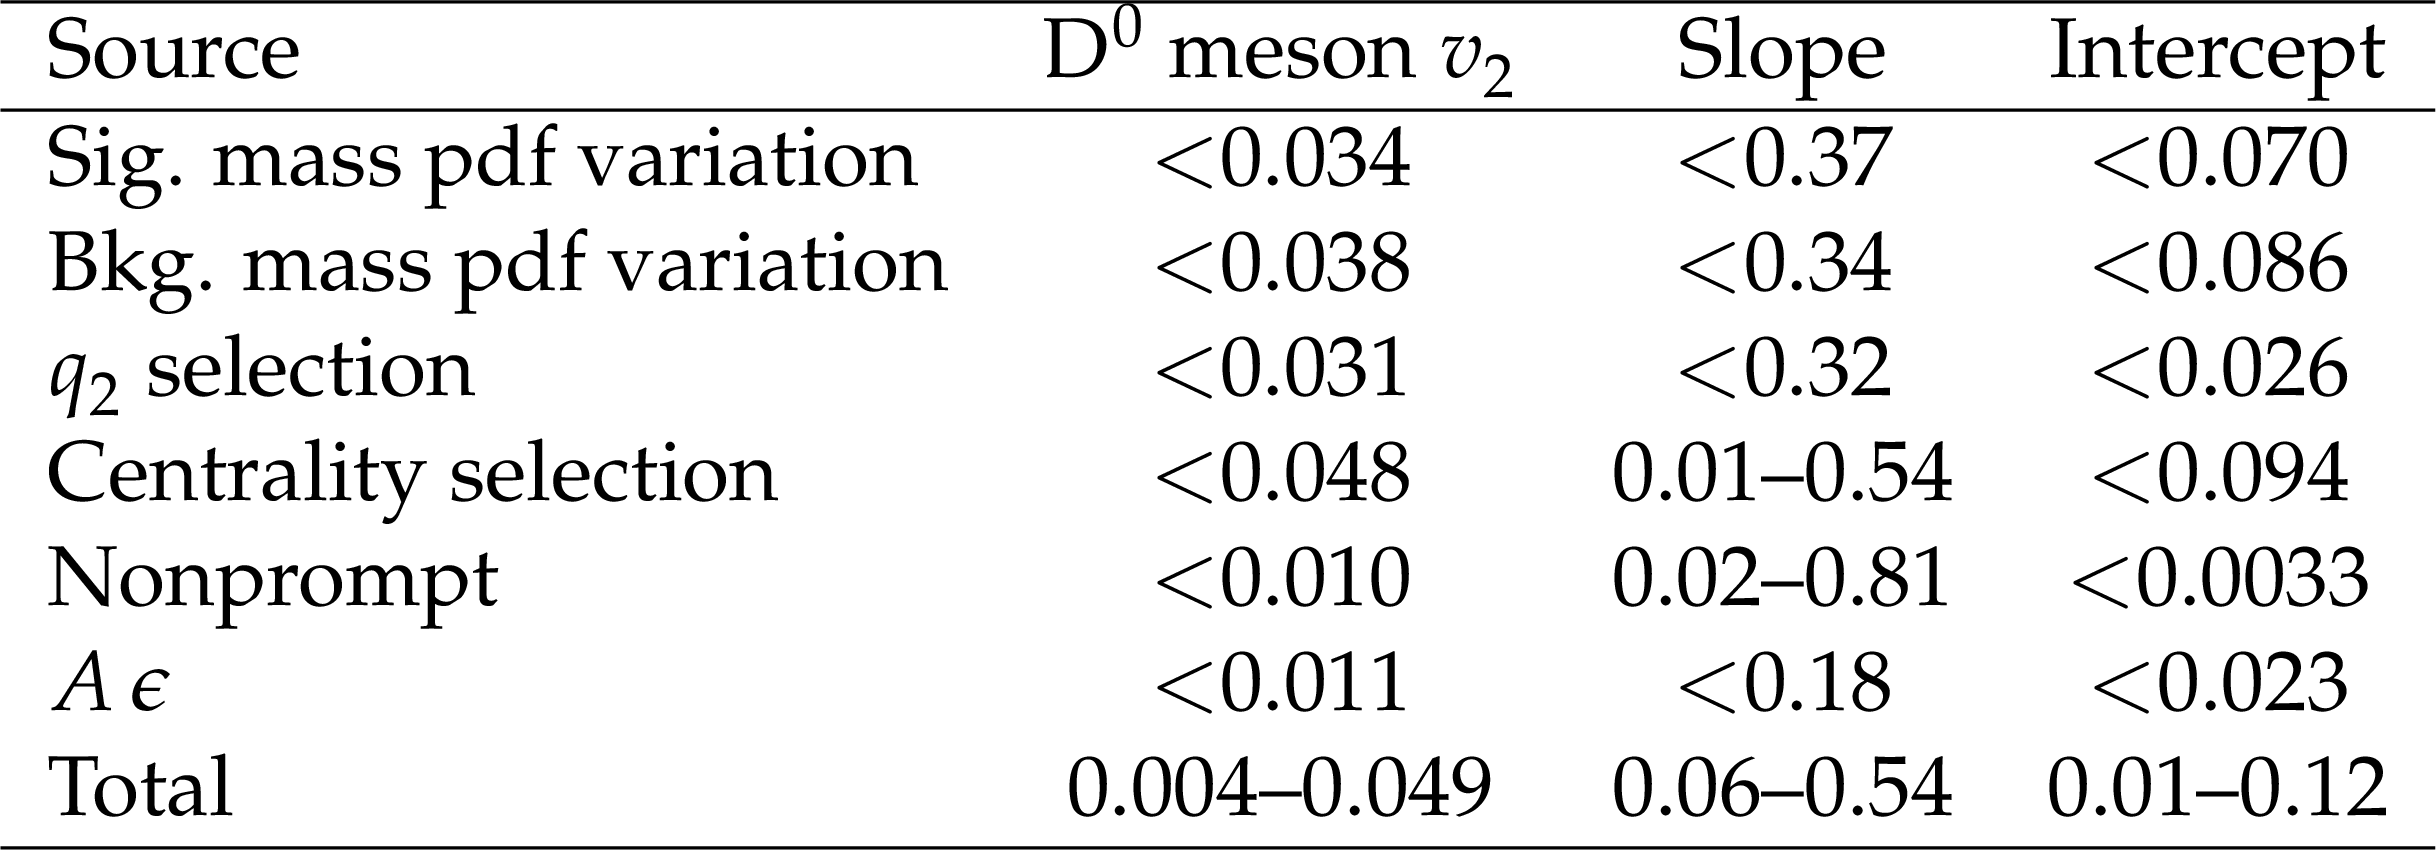
Table 1:
Summary of systematic uncertainties in the absolute differences between the nominal and the alternative analyses for the $ \mathrm{D^0} $ meson $ v_2 $ values, slope, and intercept of the scatter plots. |
| Summary |
| The elliptic-flow $ v_2 $ Fourier coefficient is measured for $ \mathrm{D^0} $ mesons using an event-shape engineering technique. The data sample consists of lead-lead collisions measured with the CMS detector at the CERN LHC at a center-of-mass energy per nucleon pair of 5.02 TeV and with an integrated luminosity of 0.607$ \text{nb}^{-1}$. The azimuthal asymmetry of energy deposits in a forward-rapidity calorimeter is characterized by a $ q_2 $ parameter that can be related to the initial collision geometry. A strong linear correlation is found between this parameter and the corresponding $ v_2 $ values for inclusive charged particles measured in the pseudorapidity ($ \eta $) and transverse momentum ($ p_{\mathrm{T}} $) ranges of $ |\eta| < $ 1 and 1 $ < p_{\mathrm{T}} < $ 3 GeV, respectively. The variation between $ \mathrm{D^0} $ meson and inclusive charged particle $ v_2 $ values obtained at common $ q_2 $ intervals is then explored. A strong linear correlation is found over the centrality range of 10--40%, as binned in 10% classes, for $ \mathrm{D^0} $ mesons at low $ p_{\mathrm{T}} $ (2--10 GeV). A weaker linear correlation is observed for centrality ranges of 0--10 and 40--50%. The parton-hadron-string-dynamics model is compared to the experimental results and found to underestimate the degree of charm quark thermalization in the quark-gluon plasma at $ p_{\mathrm{T}} < $ 4 GeV. These findings provide compelling evidence for the importance of the initial-state geometry in determining the collective flow of heavy quarks within the quark-gluon plasma created in heavy ion collisions. |
| References | ||||
| 1 | E. V. Shuryak | Theory of hadronic plasma | Sov. Phys. JETP 47 (1978) 212 | |
| 2 | U. Heinz and R. Snellings | Collective flow and viscosity in relativistic heavy-ion collisions | Ann. Rev. Nucl. Part. Sci. 63 (2013) 123 | 1301.2826 |
| 3 | J. Takahashi et al. | Topology studies of hydrodynamics using two particle correlation analysis | PRL 103 (2009) 242301 | 0902.4870 |
| 4 | B. Alver and G. Roland | Collision geometry fluctuations and triangular flow in heavy-ion collisions | Phys. Rev. C 81 (2010) 054905 | 1003.0194 |
| 5 | S. Voloshin and Y. Zhang | Flow study in relativistic nuclear collisions by Fourier expansion of azimuthal particle distributions | Z. Phys. C 70 (1996) 665 | hep-ph/9407282 |
| 6 | W. Busza, K. Rajagopal, and W. van der Schee | Heavy ion collisions: The big picture, and the big questions | Ann. Rev. Nucl. Part. Sci. 68 (2018) 339 | 1802.04801 |
| 7 | F. G. Gardim, F. Grassi, M. Luzum, and J.-Y. Ollitrault | Mapping the hydrodynamic response to the initial geometry in heavy-ion collisions | Phys. Rev. C 85 (2012) 024908 | 1111.6538 |
| 8 | H. Niemi, G. S. Denicol, H. Holopainen, and P. Huovinen | Event-by-event distributions of azimuthal asymmetries in ultrarelativistic heavy-ion collisions | Phys. Rev. C 87 (2013) 054901 | 1212.1008 |
| 9 | F. G. Gardim, J. Noronha-Hostler, M. Luzum, and F. Grassi | Effects of viscosity on the mapping of initial to final state in heavy ion collisions | Phys. Rev. C 91 (2015) 034902 | 1411.2574 |
| 10 | J. Noronha-Hostler, L. Yan, F. G. Gardim, and J.-Y. Ollitrault | Linear and cubic response to the initial eccentricity in heavy-ion collisions | Phys. Rev. C 93 (2016) 014909 | 1511.03896 |
| 11 | PHENIX Collaboration | Heavy quark production in $ p $+$ p $ and energy loss and flow of heavy quarks in Au+Au collisions at $ \sqrt{\smash[b]{s_{_{\mathrm{NN}}}}}= $ 200 GeV | Phys. Rev. C 84 (2011) 044905 | 1005.1627 |
| 12 | STAR Collaboration | Elliptic flow of electrons from heavy-flavor hadron decays in Au+Au collisions at $ \sqrt{\smash[b]{s_{_{\mathrm{NN}}}}} = $ 200, 62.4, and 39 GeV | Phys. Rev. C 95 (2017) 034907 | 1405.6348 |
| 13 | STAR Collaboration | Measurement of $ \mathrm{D}^0 $ azimuthal anisotropy at midrapidity in Au+Au collisions at $ \sqrt{\smash[b]{s_{_{\mathrm{NN}}}}}= $ 200 GeV | PRL 118 (2017) 212301 | 1701.06060 |
| 14 | ALICE Collaboration | Azimuthal anisotropy of D-meson production in Pb-Pb collisions at $ \sqrt{\smash[b]{s_{_{\mathrm{NN}}}}}= $ 2.76 TeV | Phys. Rev. C 90 (2014) 034904 | 1405.2001 |
| 15 | ALICE Collaboration | D-meson azimuthal anisotropy in midcentral Pb-Pb collisions at $ \sqrt{\smash[b]{s_{_{\mathrm{NN}}}}}= $ 5.02 TeV | PRL 120 (2018) 102301 | 1707.01005 |
| 16 | CMS Collaboration | Probing charm quark dynamics via multiparticle correlations in Pb-Pb collisions at $ \sqrt{\smash[b]{s_{_{\mathrm{NN}}}}} = $ 5.02 TeV | PRL 129 (2022) 022001 | CMS-HIN-20-001 2112.12236 |
| 17 | CMS Collaboration | Measurement of prompt $ \mathrm{D}^0 $ meson azimuthal anisotropy in Pb-Pb collisions at $ \sqrt{\smash[b]{s_{_{\mathrm{NN}}}}} = $ 5.02 TeV | PRL 120 (2018) 202301 | CMS-HIN-16-007 1708.03497 |
| 18 | CMS Collaboration | Measurement of prompt $ \mathrm{D^0} $ and $ \mathrm{\overline{D}}^{0} $ meson azimuthal anisotropy and search for strong electric fields in PbPb collisions at $ \sqrt{\smash[b]{s_{_{\mathrm{NN}}}}} = $ 5.02 TeV | PLB 816 (2021) 136253 | CMS-HIN-19-008 2009.12628 |
| 19 | CMS Collaboration | Overview of high-density QCD studies with the CMS experiment at the LHC | Phys. Rept. 1115 (2025) 219 | CMS-HIN-23-011 2405.10785 |
| 20 | ALICE Collaboration | Event-shape engineering for the D-meson elliptic flow in mid-central Pb-Pb collisions at $ \sqrt{\smash[b]{s_{_{\mathrm{NN}}}}} = $ 5.02 TeV | JHEP 02 (2019) 150 | 1809.09371 |
| 21 | ALICE Collaboration | Transverse-momentum and event-shape dependence of D-meson flow harmonics in Pb-Pb collisions at $ \sqrt{\smash[b]{s_{_{\mathrm{NN}}}}} = $ 5.02 TeV | PLB 813 (2021) 136054 | 2005.11131 |
| 22 | CMS Collaboration | Influence of strangeness on the anisotropic flow of prompt D$ ^\pm_\mathrm{s} $ mesons in PbPb collisions at $ \sqrt{\smash[b]{s_{_{\mathrm{NN}}}}} = $ 5.02 TeV | Submitted to Phys. Lett. B, 2026 | CMS-HIN-24-006 2602.14221 |
| 23 | ALICE Collaboration | Evidence of different $ \Lambda_{\rm c} $-baryon and D-meson elliptic flow in PbPb collisions at $ \sqrt{\smash[b]{s_{_{\mathrm{NN}}}}} = $ 5.36 TeV with ALICE at the LHC | Submitted to Phys. Rev. Lett, 2026 | 2603.18966 |
| 24 | CMS Collaboration | HEPData record for this analysis | link | |
| 25 | CMS Collaboration | Description and performance of track and primary-vertex reconstruction with the CMS tracker | JINST 9 (2014) P10009 | CMS-TRK-11-001 1405.6569 |
| 26 | CMS Collaboration | The CMS experiment at the CERN LHC | JINST 3 (2008) S08004 | |
| 27 | CMS Collaboration | Performance of the CMS high-level trigger during LHC Run 2 | JINST 19 (2024) P11021 | CMS-TRG-19-001 2410.17038 |
| 28 | CMS Collaboration | Performance of the CMS Level-1 trigger in proton-proton collisions at $ \sqrt{s} = $ 13 TeV | JINST 15 (2020) P10017 | CMS-TRG-17-001 2006.10165 |
| 29 | CMS Collaboration | The CMS trigger system | JINST 12 (2017) P01020 | CMS-TRG-12-001 1609.02366 |
| 30 | CMS Collaboration | CMS luminosity measurement using nucleus-nucleus collisions at $ \sqrt{\smash[b]{s_{_{\mathrm{NN}}}}} = $ 5.02 TeV in 2018 | CMS Physics Analysis Summary, 2022 CMS-PAS-LUM-18-001 |
CMS-PAS-LUM-18-001 |
| 31 | CMS Collaboration | Charged-particle nuclear modification factors in PbPb and pPb collisions at $ \sqrt{\smash[b]{s_{_{\mathrm{NN}}}}} = $ 5.02 TeV | JHEP 04 (2017) 039 | CMS-HIN-15-015 1611.01664 |
| 32 | T. Sjöstrand et al. | An introduction to PYTHIA 8.2 | Comput. Phys. Commun. 191 (2015) 159 | 1410.3012 |
| 33 | CMS Collaboration | Event generator tunes obtained from underlying event and multiparton scattering measurements | EPJC 76 (2016) 155 | CMS-GEN-14-001 1512.00815 |
| 34 | D. J. Lange | The EvtGen particle decay simulation package | NIM A 462 (2001) 152 | |
| 35 | GEANT4 Collaboration | GEANT 4---a simulation toolkit | NIM A 506 (2003) 250 | |
| 36 | Particle Data Group , S. Navas et al. | Review of particle physics | PRD 110 (2024) 030001 | |
| 37 | A. Hoecker et al. | TMVA, the Toolkit for Multivariate Data Analysis with ROOT | PoS ACAT 04 (2009) 0 | |
| 38 | M. J. Oreglia | A study of the reactions $ \psi^\prime \to \gamma \gamma \psi $ | PhD thesis, Stanford University, SLAC Report SLAC-R-236, 1980 link |
|
| 39 | STAR Collaboration | Elliptic flow from two- and four-particle correlations in Au+Au collisions at $ \sqrt{\smash[b]{s_{_{\mathrm{NN}}}}}= $ 130 GeV | Phys. Rev. C 66 (2002) 034904 | nucl-ex/0206001 |
| 40 | M. Luzum and J.-Y. Ollitrault | Eliminating experimental bias in anisotropic-flow measurements of high-energy nuclear collisions | Phys. Rev. C 87 (2013) 044907 | 1209.2323 |
| 41 | A. M. Poskanzer and S. A. Voloshin | Methods for analyzing anisotropic flow in relativistic nuclear collisions | Phys. Rev. C 58 (1998) 1671 | nucl-ex/9805001 |
| 42 | NA49 Collaboration | Directed and elliptic flow of charged pions and protons in Pb+Pb collisions at 40 $ A $ and 158 $ A\mathrm{GeV} $ | Phys. Rev. C 68 (2003) 034903 | nucl-ex/0303001 |
| 43 | CMS Collaboration | Measurements of azimuthal anisotropy of nonprompt $ \mathrm{D}^0 $ mesons in PbPb collisions at $ \sqrt{\smash[b]{s_{_{\mathrm{NN}}}}} = $ 5.02 TeV | PLB 850 (2024) 138389 | CMS-HIN-21-003 2212.01636 |
| 44 | J. Noronha-Hostler et al. | Cumulants and nonlinear response of high $ {p}_{T} $ harmonic flow at $ \sqrt{\smash[b]{s_{_{\mathrm{NN}}}}} = $ 5.02 TeV | Phys. Rev. C 95 (2017) 044901 | 1609.05171 |
| 45 | C. A. G. Prado et al. | Event-by-event correlations between soft hadrons and $ \mathrm{D}^{0} $ mesons in 5.02 TeV PbPb collisions at the CERN Large Hadron Collider | Phys. Rev. C 96 (2017) 064903 | 1611.02965 |
| 46 | T. Song et al. | Tomography of the quark-gluon plasma by charm quarks | Phys. Rev. C 92 (2015) 014910 | 1503.03039 |
| 47 | T. Song et al. | Charm production in Pb+Pb collisions at energies available at the CERN Large Hadron Collider | Phys. Rev. C 93 (2016) 034906 | 1512.00891 |
| 48 | K. J. Eskola, H. Paukkunen, and C. A. Salgado | EPS09 - A new generation of NLO and LO nuclear parton distribution functions | JHEP 04 (2009) 065 | 0902.4154 |
|
|
Compact Muon Solenoid LHC, CERN |

|

|

|

|

|

|