

Compact Muon Solenoid
LHC, CERN
| CMS-EXO-21-017 ; CERN-EP-2024-143 | ||
| Search for a resonance decaying to a W boson and a photon in proton-proton collisions at $ \sqrt{s} = $ 13 TeV using leptonic W boson decays | ||
| CMS Collaboration | ||
| 7 June 2024 | ||
| JHEP 09 (2024) 186 | ||
| Abstract: A search for a new charged particle X with mass between 0.3 and 2.0 TeV decaying to a W boson and a photon is presented, using proton-proton collision data at a center-of-mass energy of 13 TeV, collected by the CMS experiment and corresponding to an integrated luminosity of 138 fb$ ^{-1} $. Particle X has electric charge $ \pm $1 and is assumed to have spin 0. The search is performed using the electron and muon decays of the W boson. No significant excess above the predicted background is observed. The upper limit at 95% confidence level on the product of the production cross section of the X and its branching fraction to a W boson and a photon is found to be 94 (137) fb for a 0.3 TeV resonance and 0.75 (0.81) fb for a 2.0 TeV resonance, for an X width-to-mass ratio of 0.01% (5%). This search presents the most stringent constraints to date on the existence of such resonances across the probed mass range. A statistical combination with an earlier study based on the hadronic decay mode of the W boson is also performed, and the upper limit at 95% confidence level for a 2.0 TeV resonance is reduced to 0.50 (0.63) fb for an X width-to-mass ratio of 0.01% (5%). | ||
| Links: e-print arXiv:2406.05737 [hep-ex] (PDF) ; CDS record ; inSPIRE record ; HepData record ; CADI line (restricted) ; | ||
| Figures | |
png pdf |
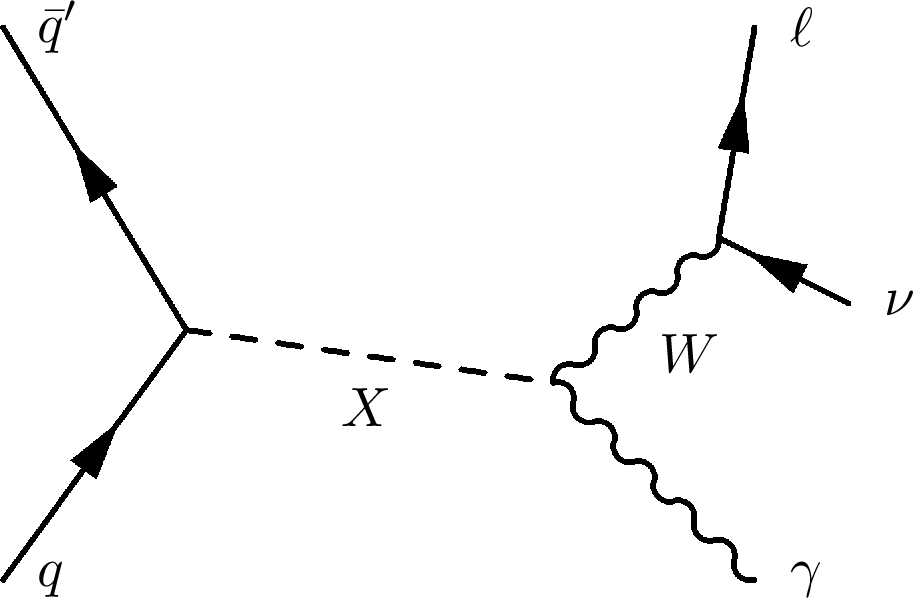
Figure 1:
Leading order Feynman diagram for a heavy particle X decaying to a W boson and a photon; the W boson subsequentially decays leptonically. |
png pdf |
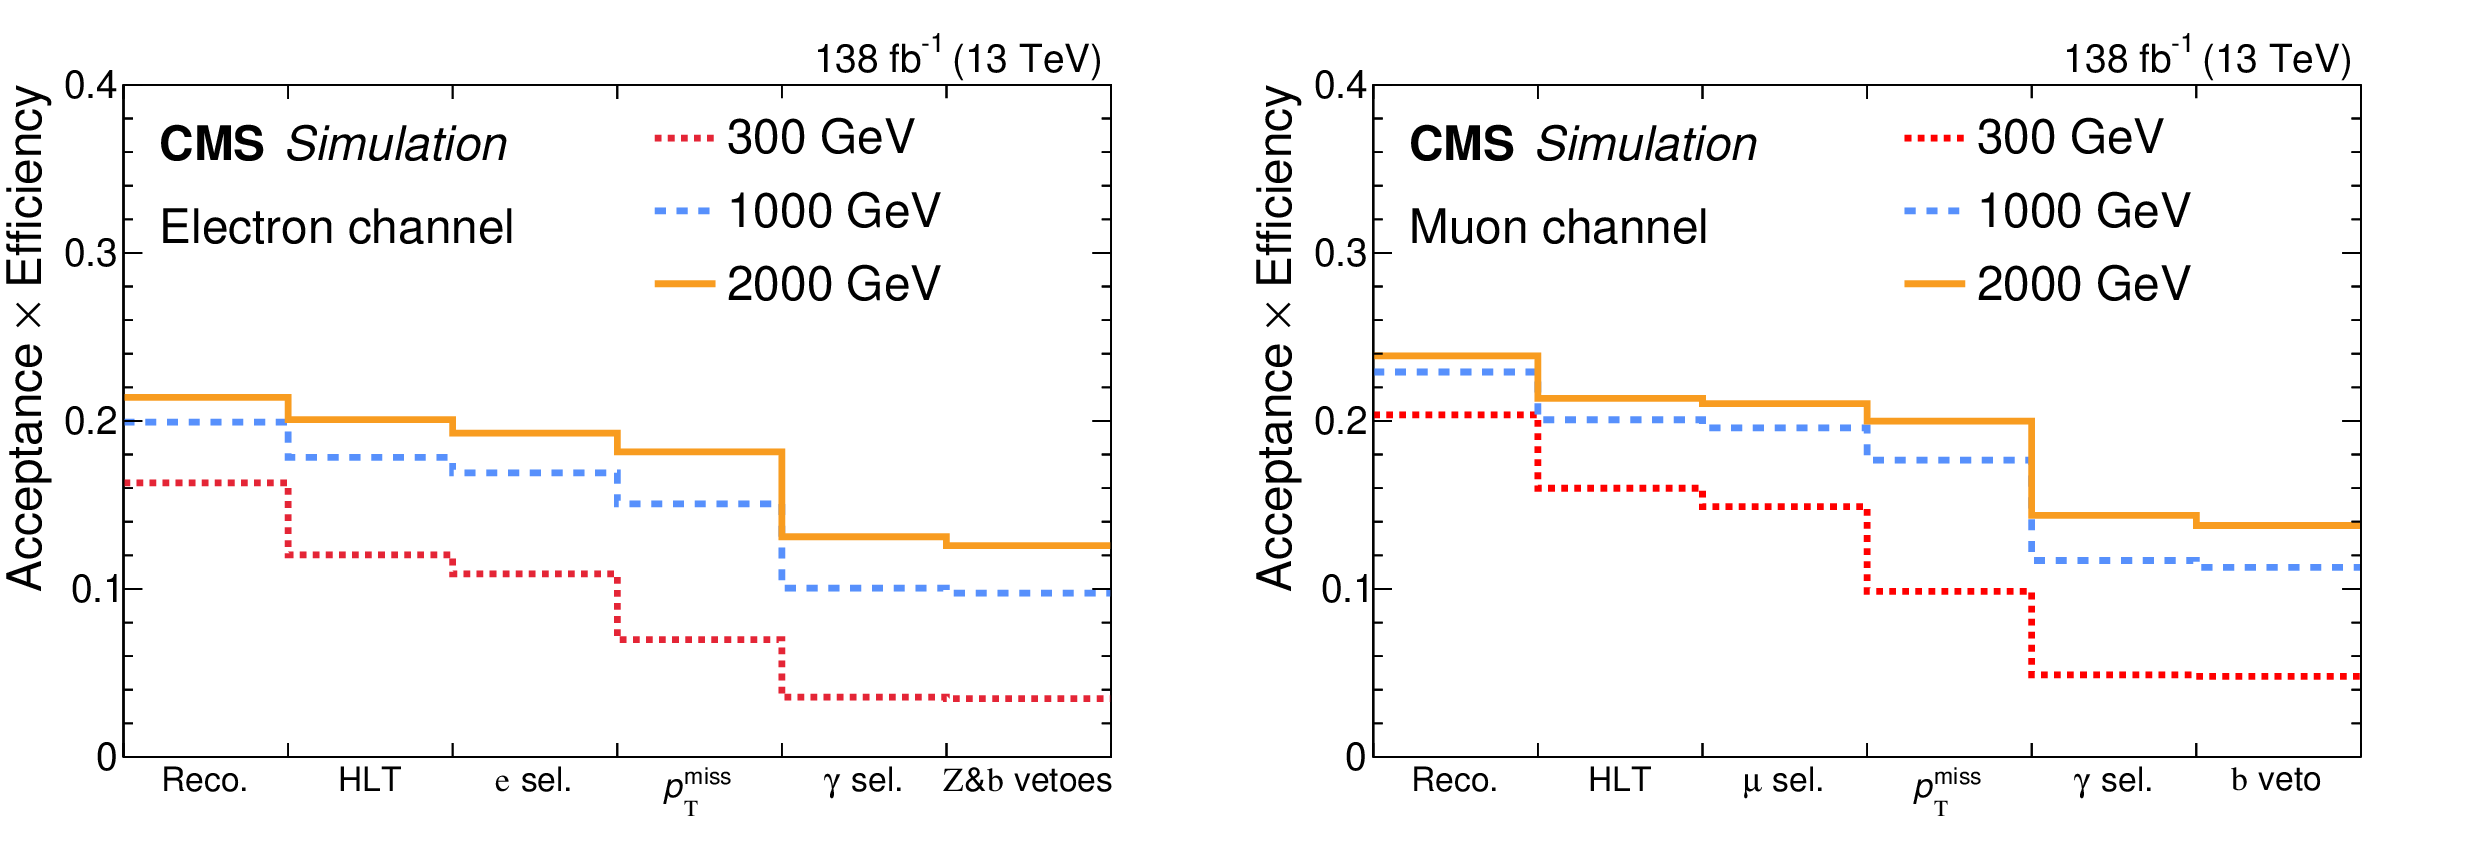
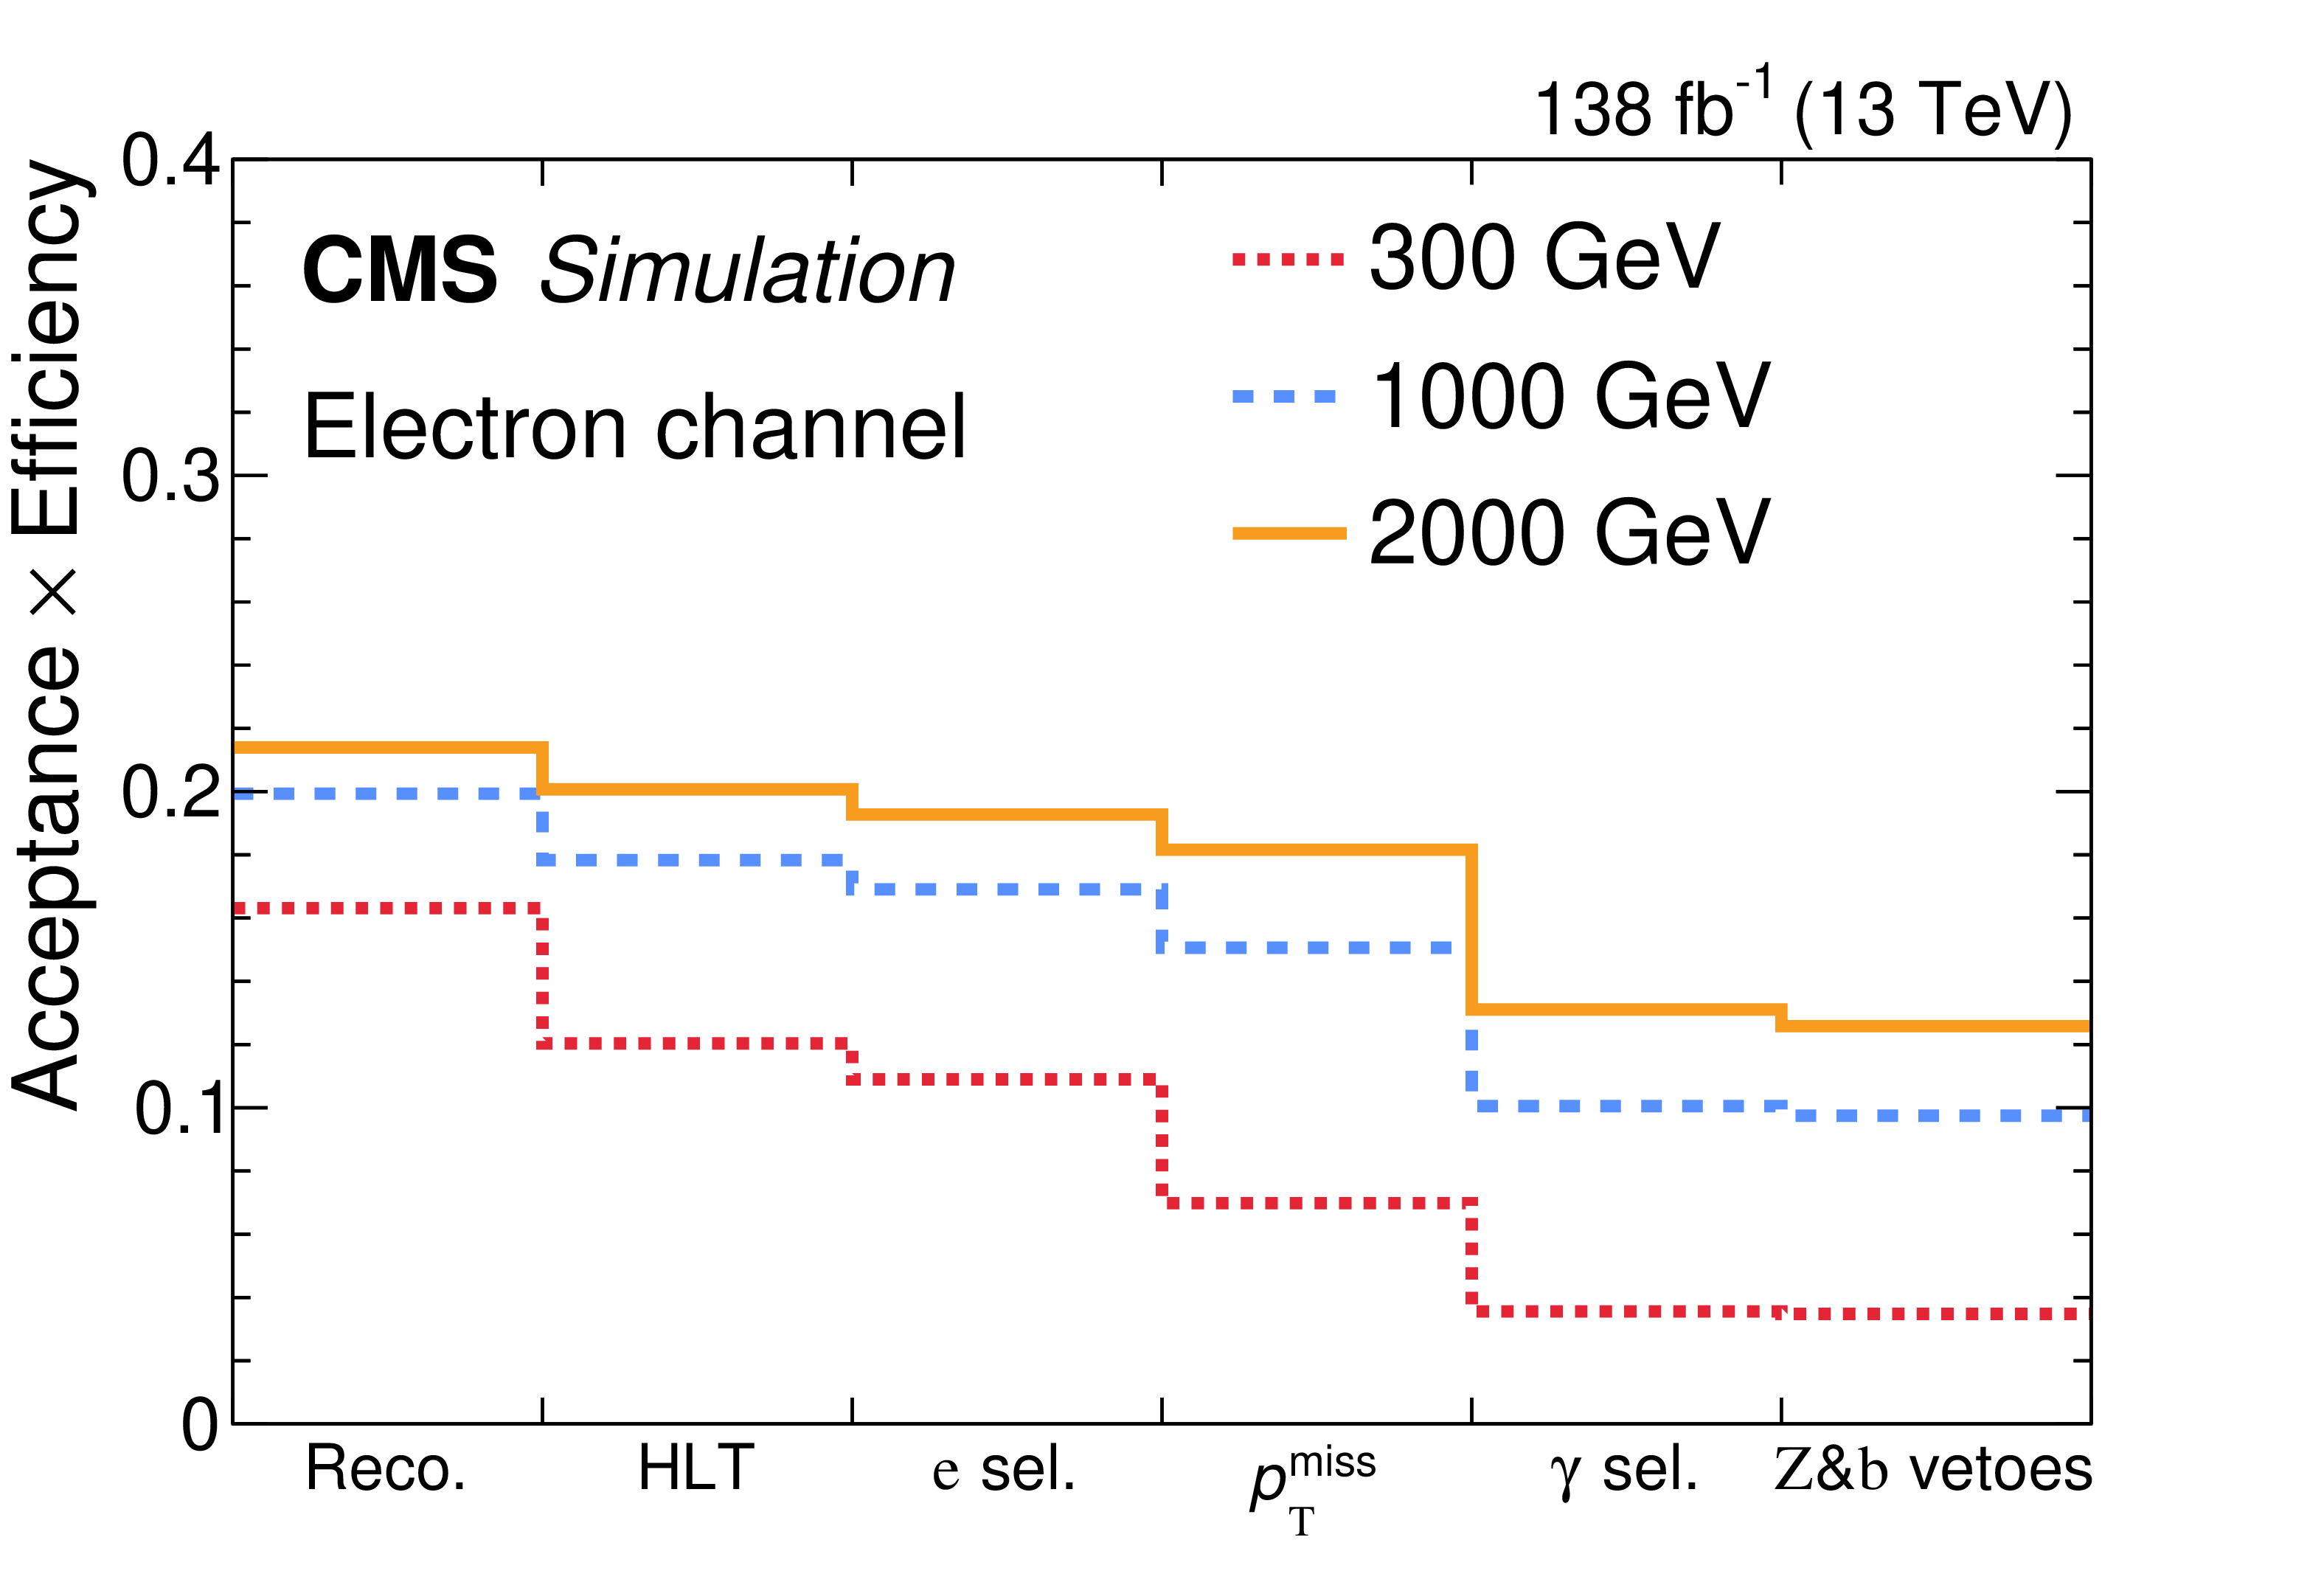
Figure 2:
Product of detector acceptance and analysis selections efficiency for different particle mass assumptions---300, 1000, and 2000 GeV, in red, blue, and orange, respectively---to pass sequential requirements in the broad-width case. The narrow-width case is similar. The first bin represents selecting events with exactly one reconstructed basic electron or muon and one photon, satisfying the selection criteria reported in Table 1. The next bin contains events satisfying the HLT, and the subsequent bins have the selections listed in Table 2 applied sequentially. The left (right) plot is for the electron (muon) channel. |
png pdf |
Figure 2-a:
Product of detector acceptance and analysis selections efficiency for different particle mass assumptions---300, 1000, and 2000 GeV, in red, blue, and orange, respectively---to pass sequential requirements in the broad-width case. The narrow-width case is similar. The first bin represents selecting events with exactly one reconstructed basic electron or muon and one photon, satisfying the selection criteria reported in Table 1. The next bin contains events satisfying the HLT, and the subsequent bins have the selections listed in Table 2 applied sequentially. The left (right) plot is for the electron (muon) channel. |
png pdf |
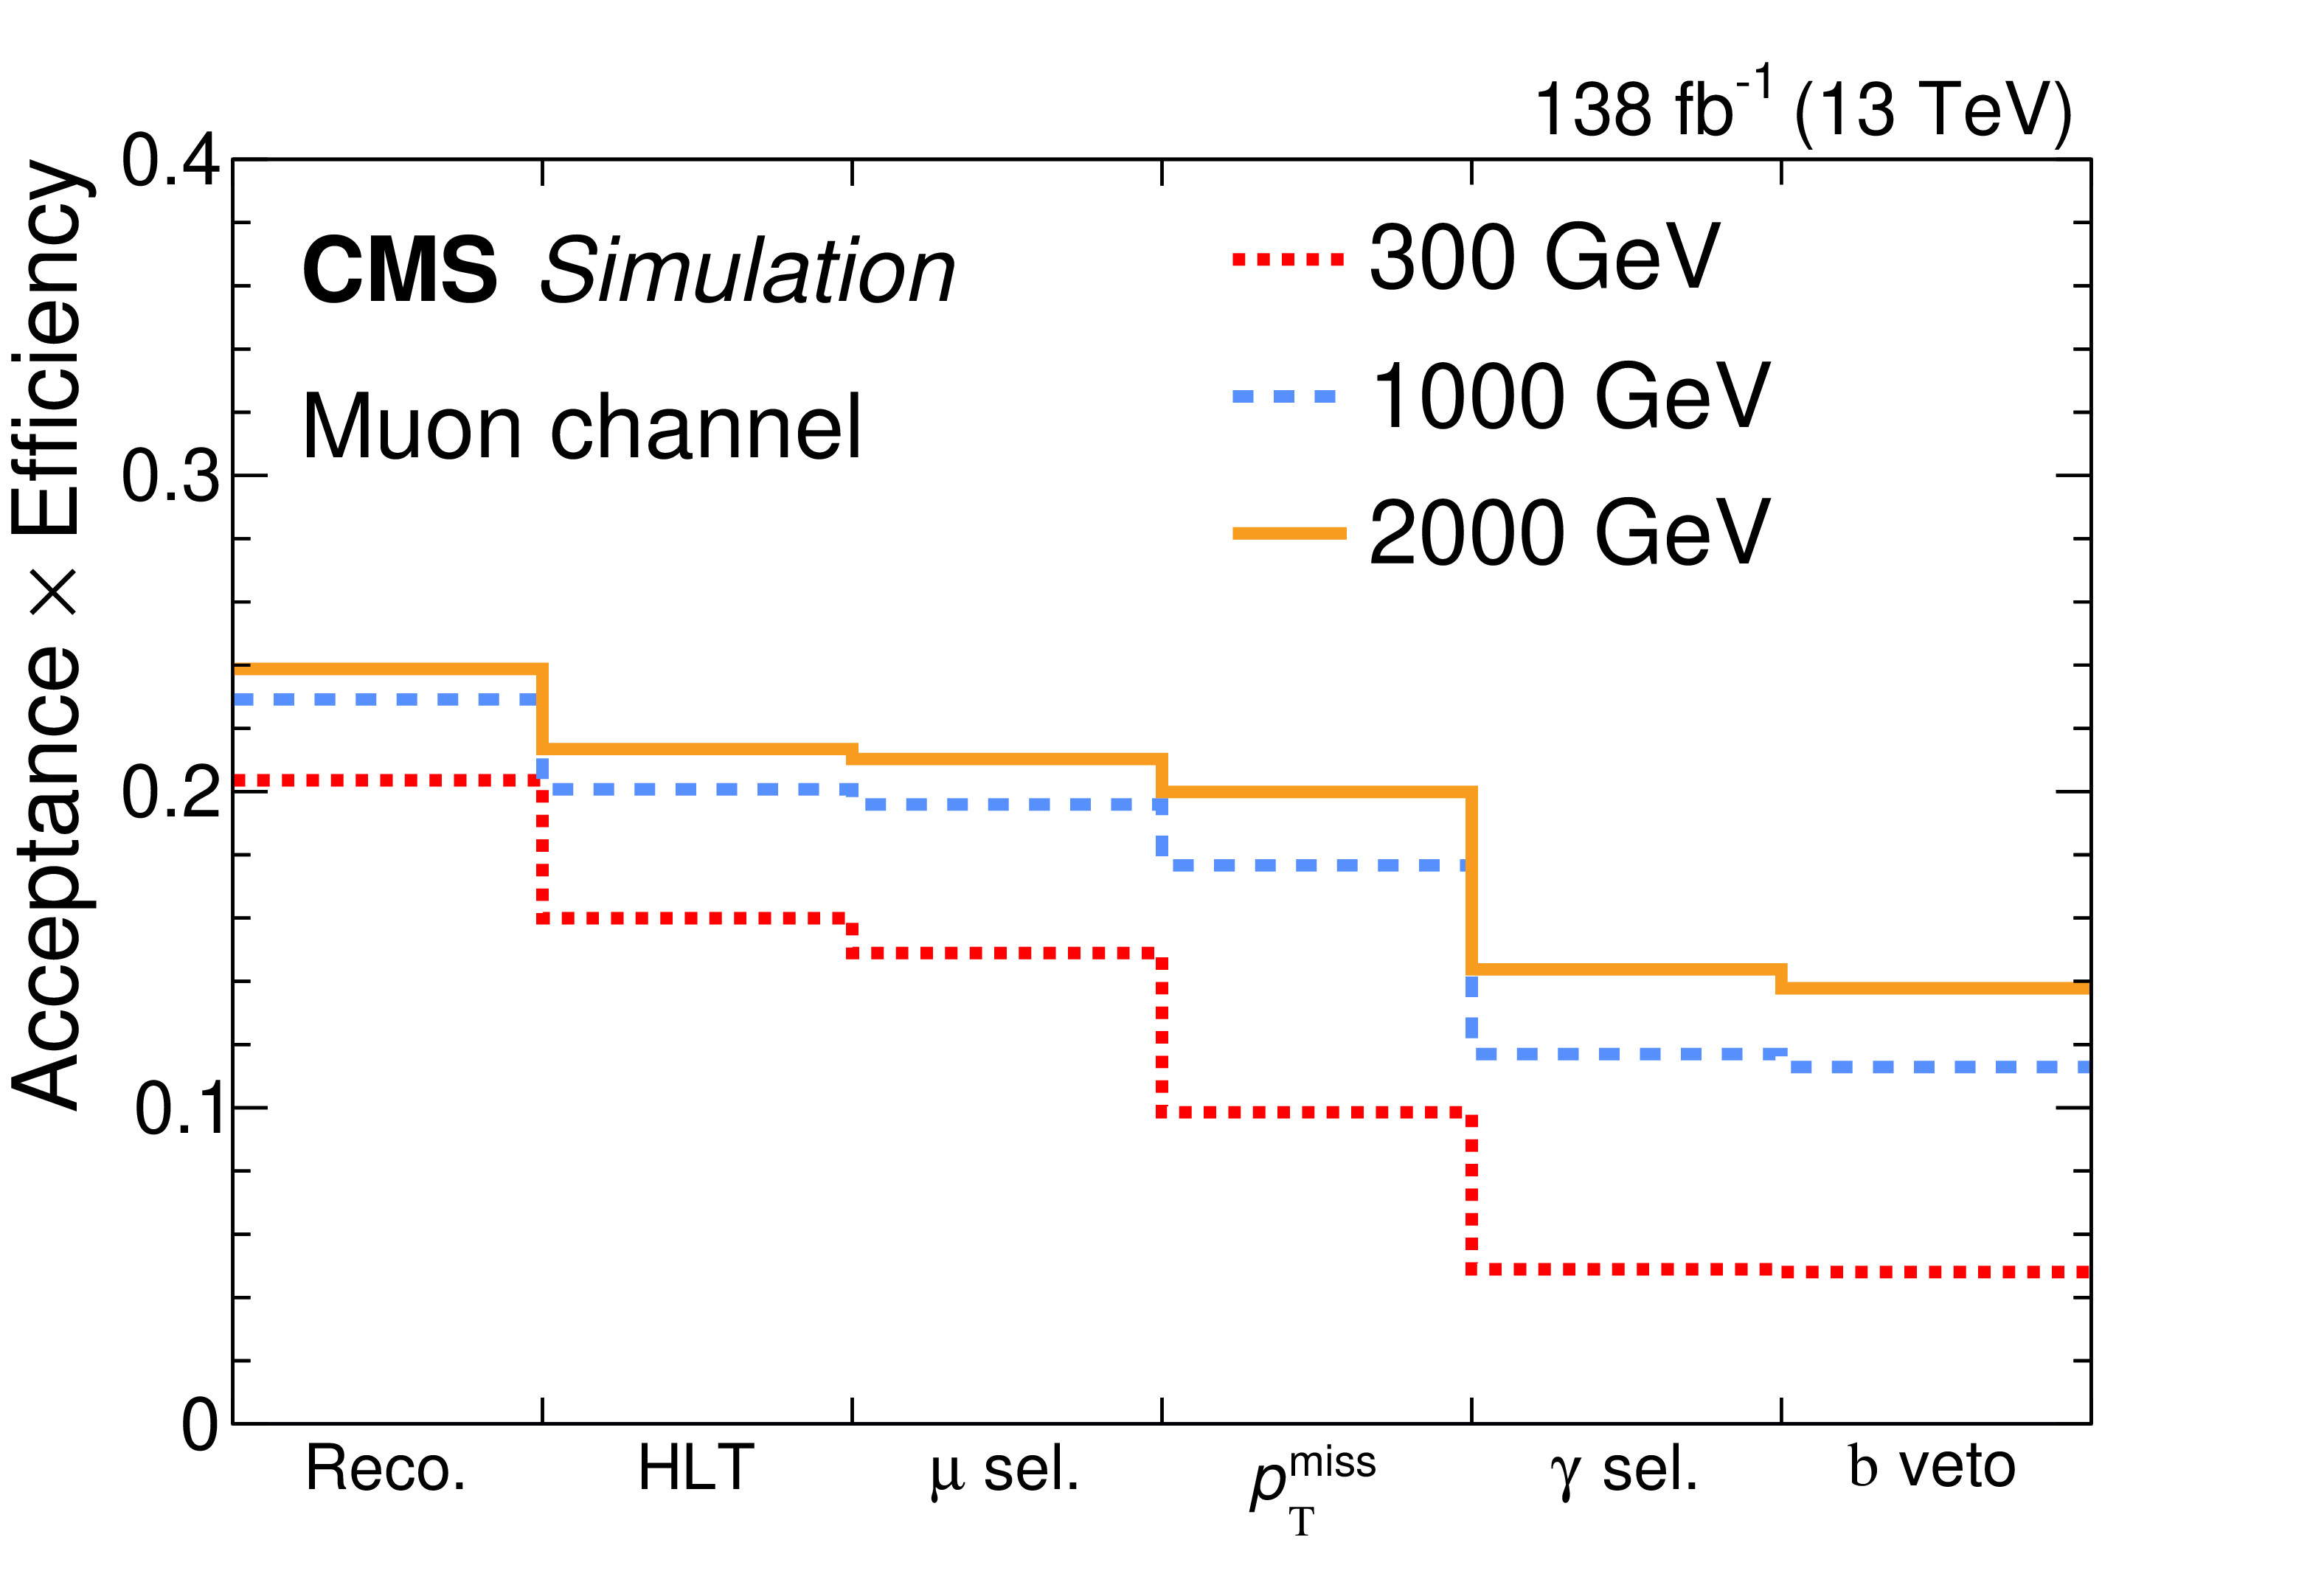
Figure 2-b:
Product of detector acceptance and analysis selections efficiency for different particle mass assumptions---300, 1000, and 2000 GeV, in red, blue, and orange, respectively---to pass sequential requirements in the broad-width case. The narrow-width case is similar. The first bin represents selecting events with exactly one reconstructed basic electron or muon and one photon, satisfying the selection criteria reported in Table 1. The next bin contains events satisfying the HLT, and the subsequent bins have the selections listed in Table 2 applied sequentially. The left (right) plot is for the electron (muon) channel. |
png pdf |
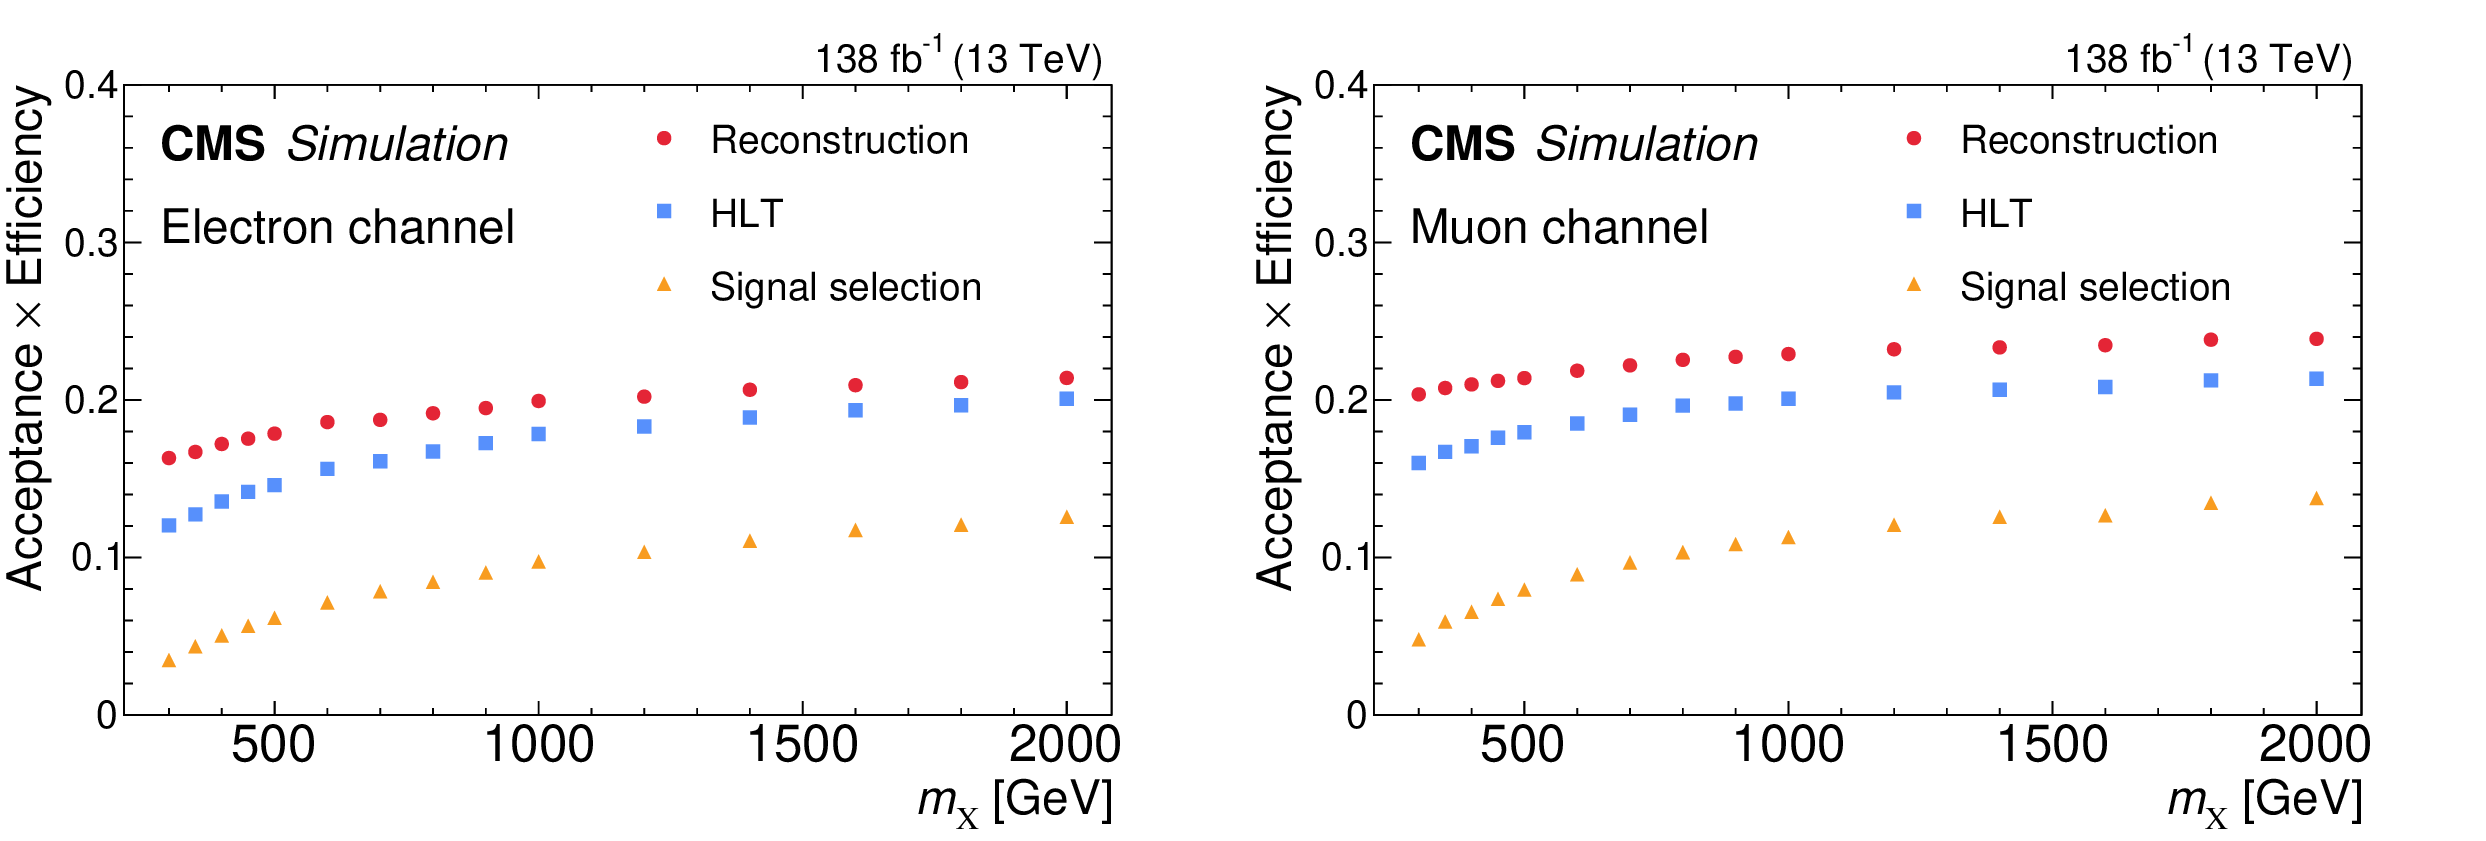
Figure 3:
Product of detector acceptance and analysis selection efficiency in the electron (left) and muon (right) channel as functions of the particle X mass in the broad-width case. The narrow-width case is similar. Three analysis requirements are applied consecutively: event reconstruction, HLT, and final signal selection. The product of detector acceptance and analysis selection efficiencies are shown at each stage in red, blue, and orange, respectively. |
png pdf |
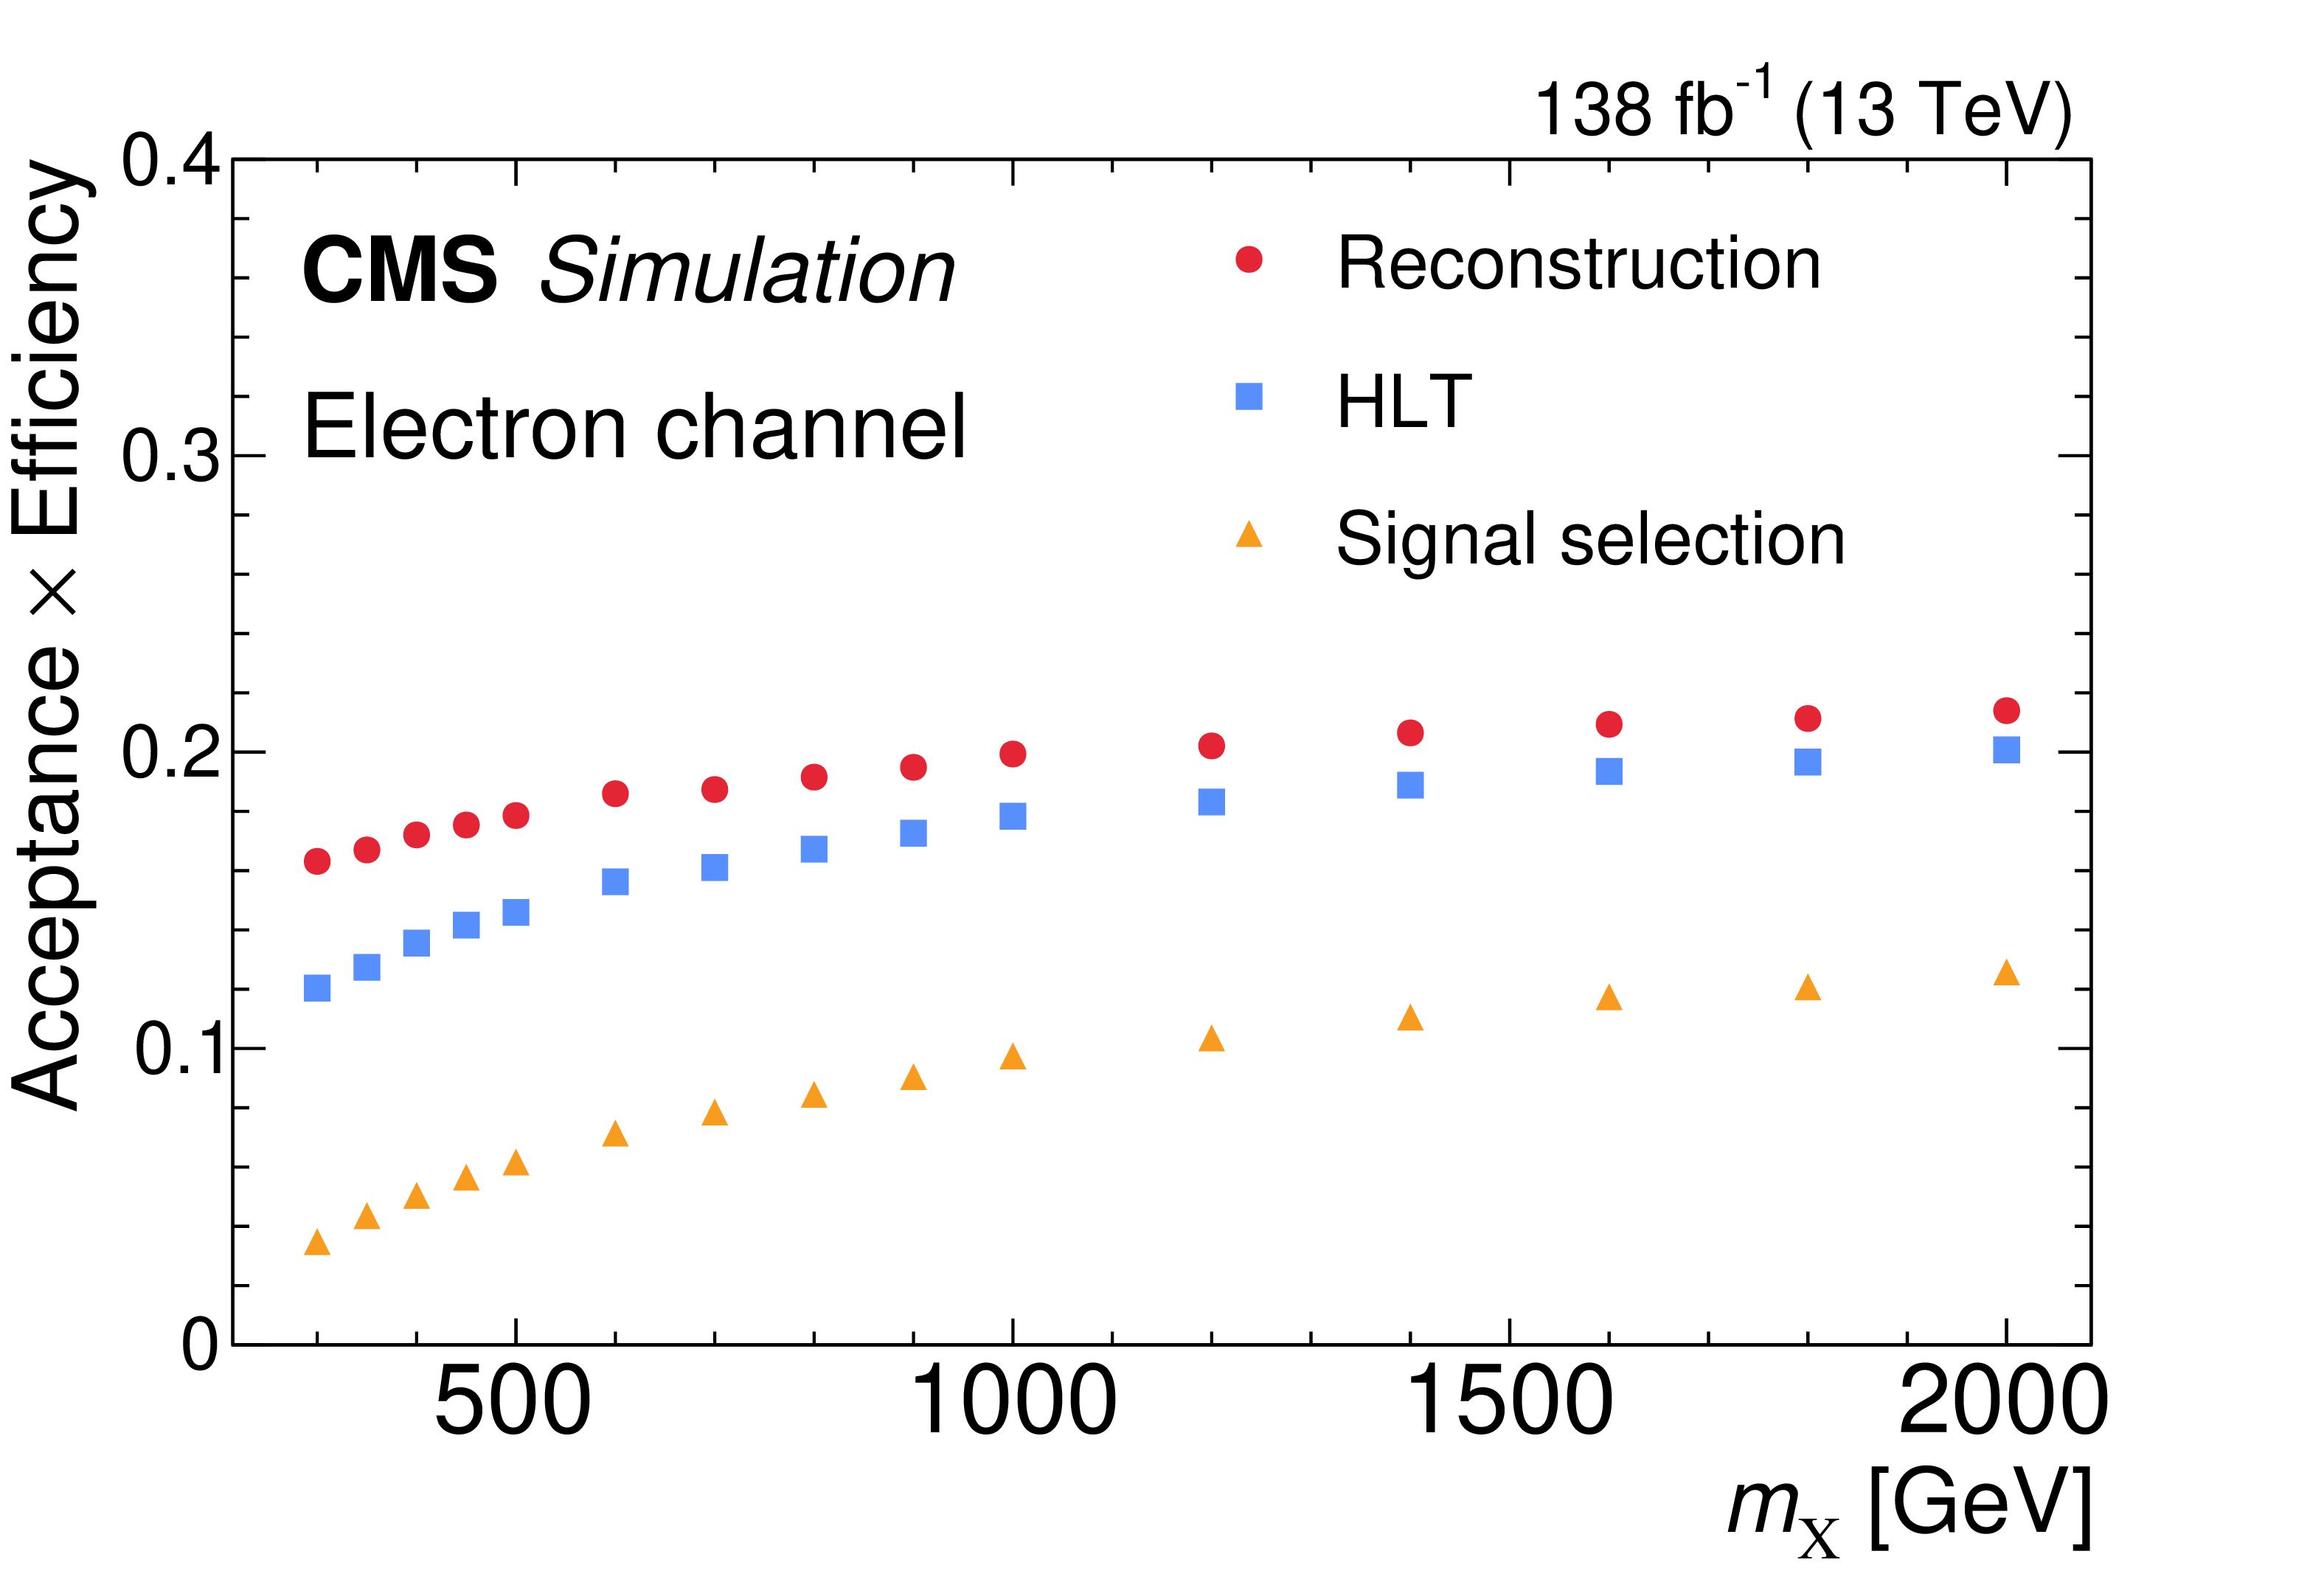
Figure 3-a:
Product of detector acceptance and analysis selection efficiency in the electron (left) and muon (right) channel as functions of the particle X mass in the broad-width case. The narrow-width case is similar. Three analysis requirements are applied consecutively: event reconstruction, HLT, and final signal selection. The product of detector acceptance and analysis selection efficiencies are shown at each stage in red, blue, and orange, respectively. |
png pdf |
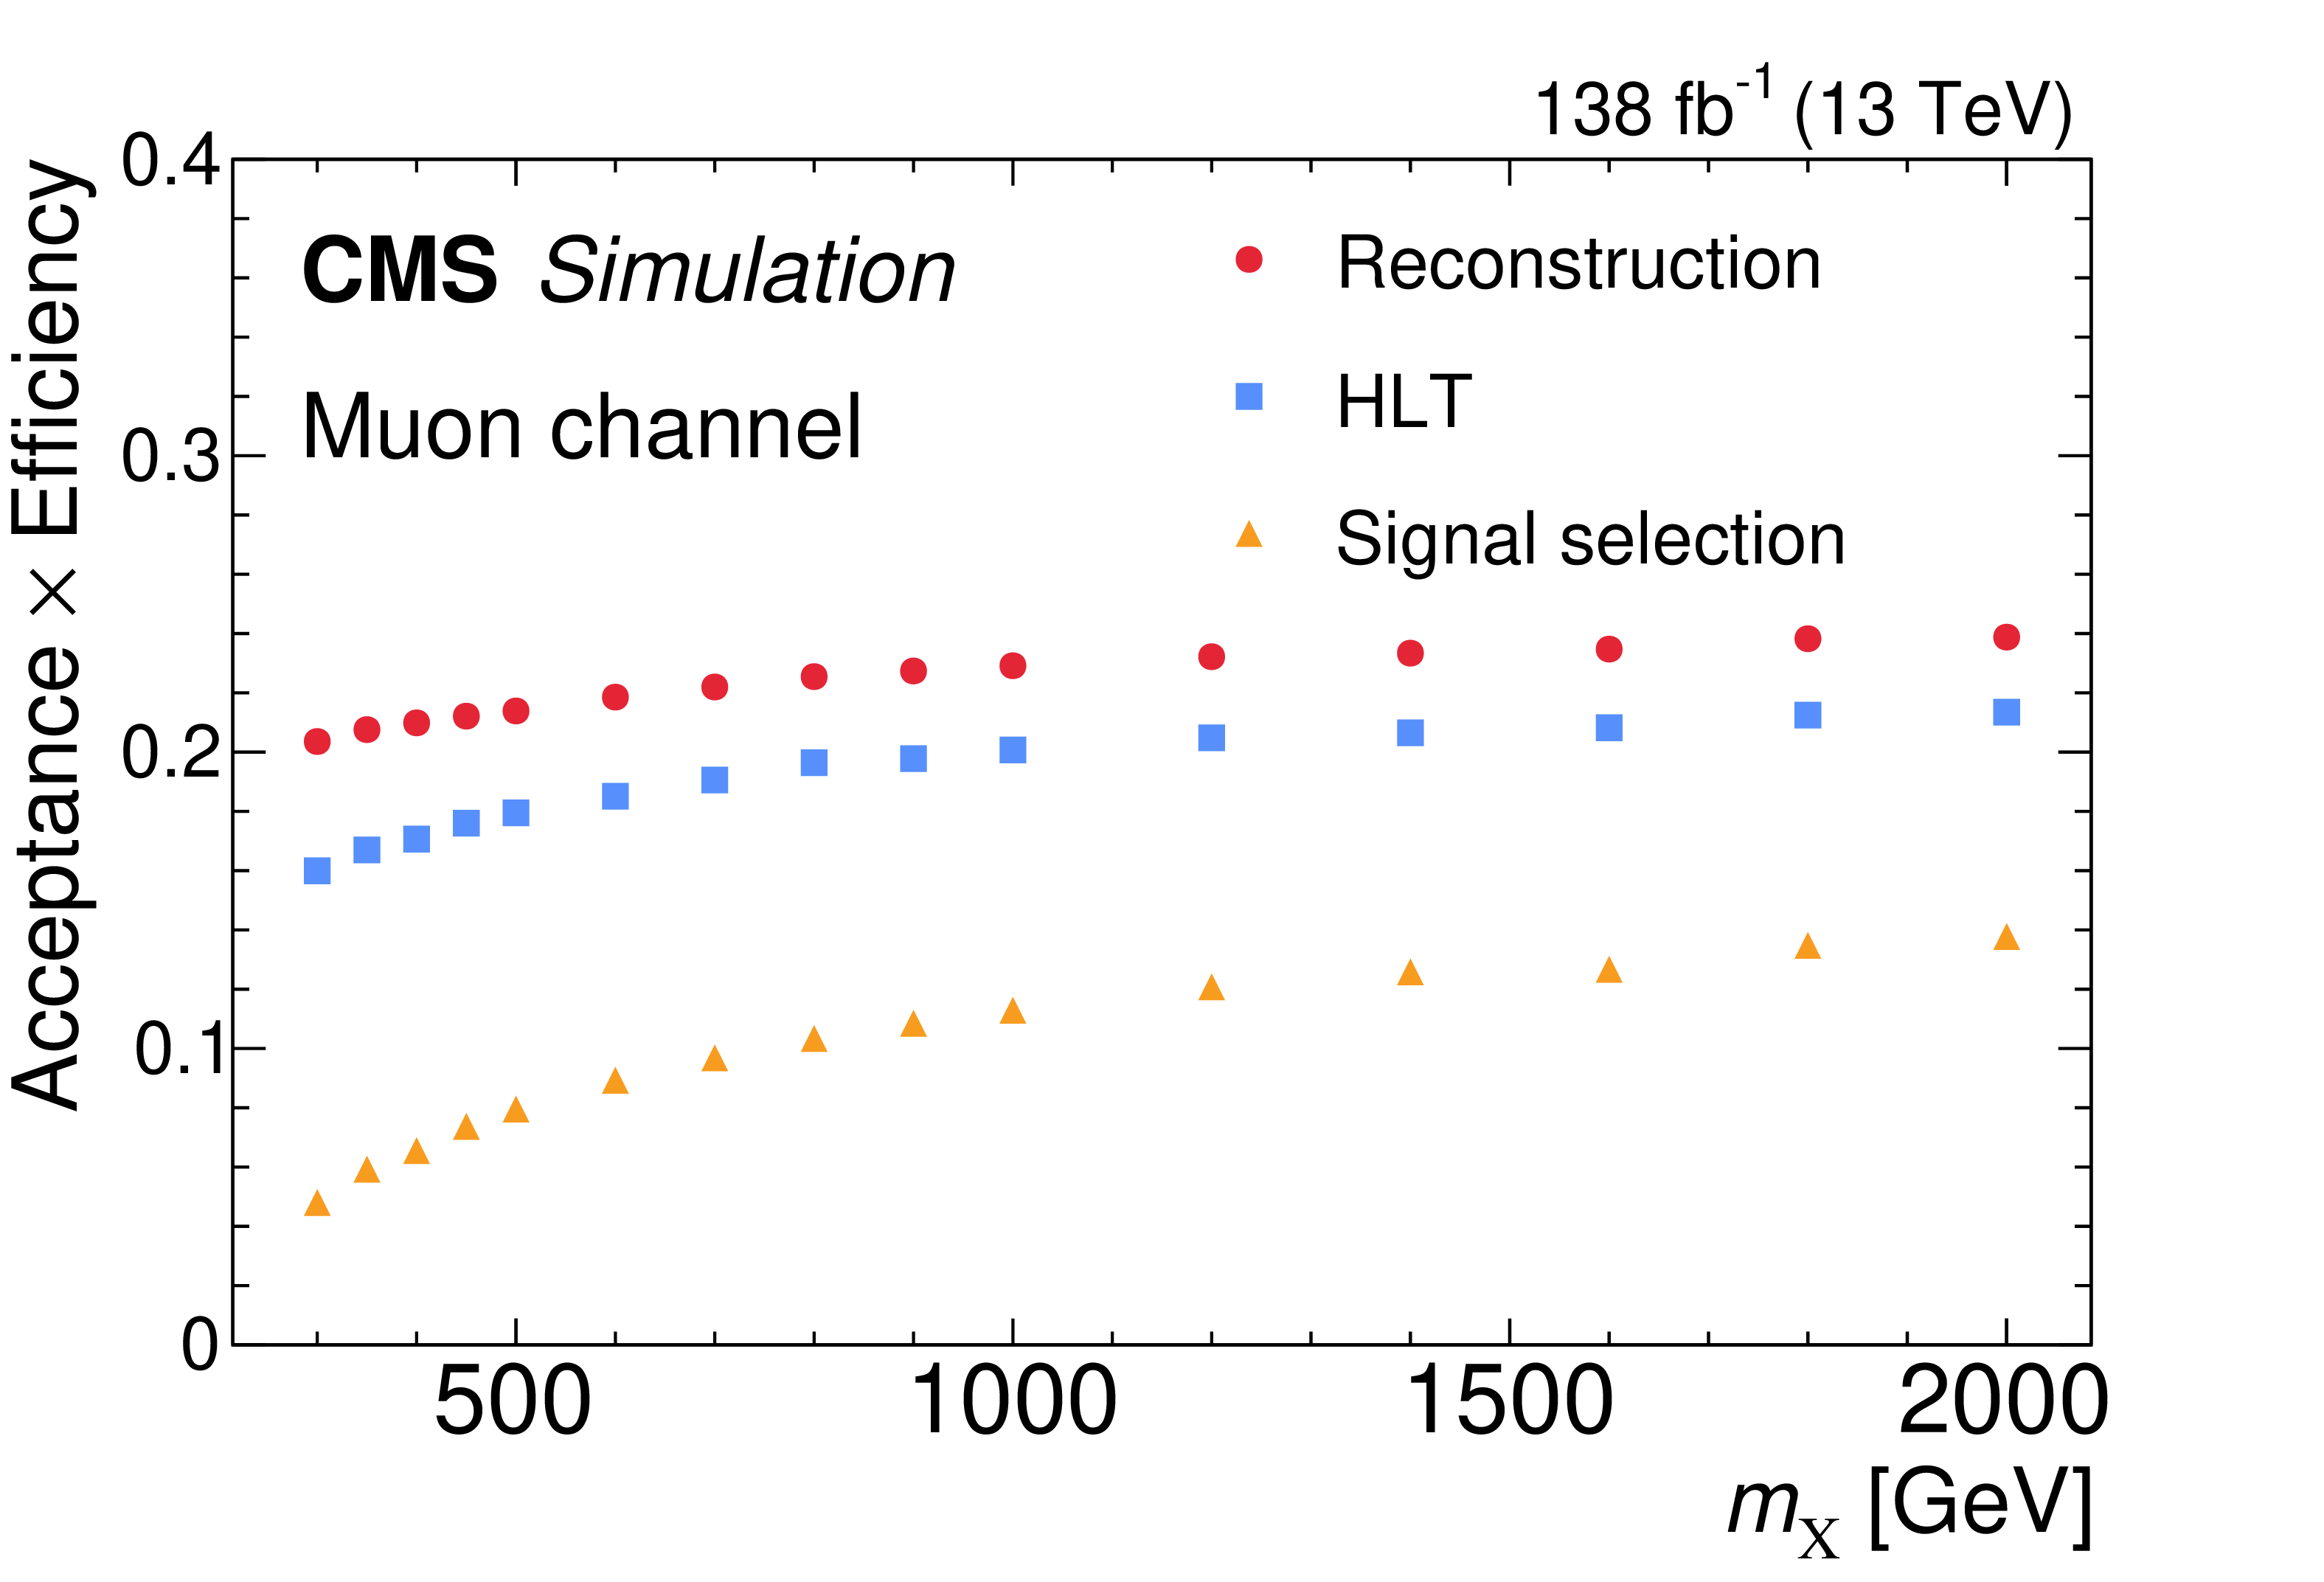
Figure 3-b:
Product of detector acceptance and analysis selection efficiency in the electron (left) and muon (right) channel as functions of the particle X mass in the broad-width case. The narrow-width case is similar. Three analysis requirements are applied consecutively: event reconstruction, HLT, and final signal selection. The product of detector acceptance and analysis selection efficiencies are shown at each stage in red, blue, and orange, respectively. |
png pdf |
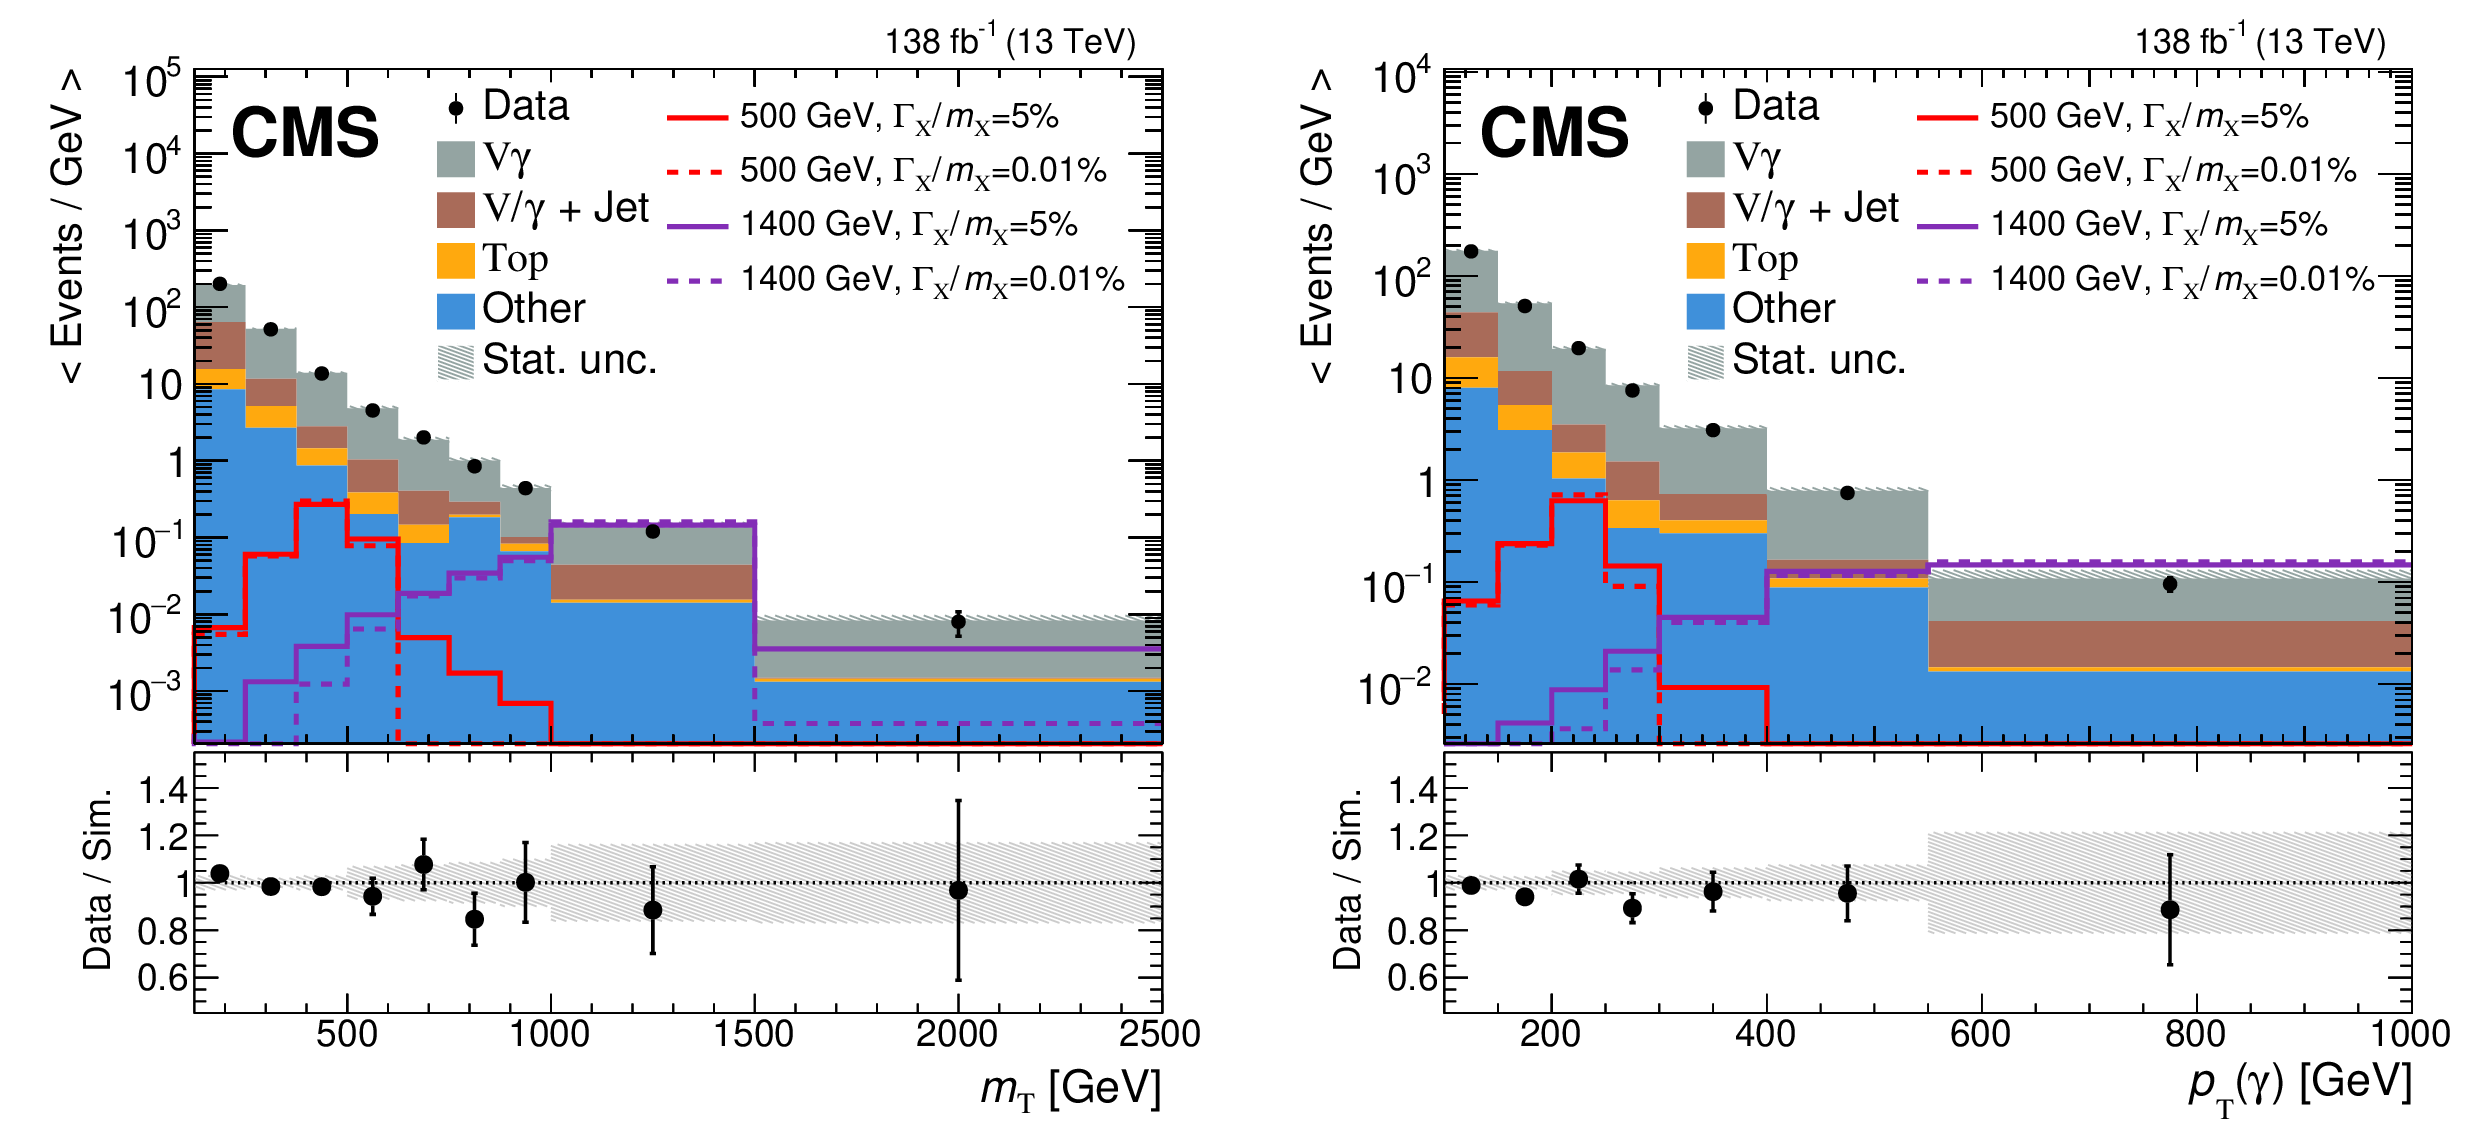
Figure 4:
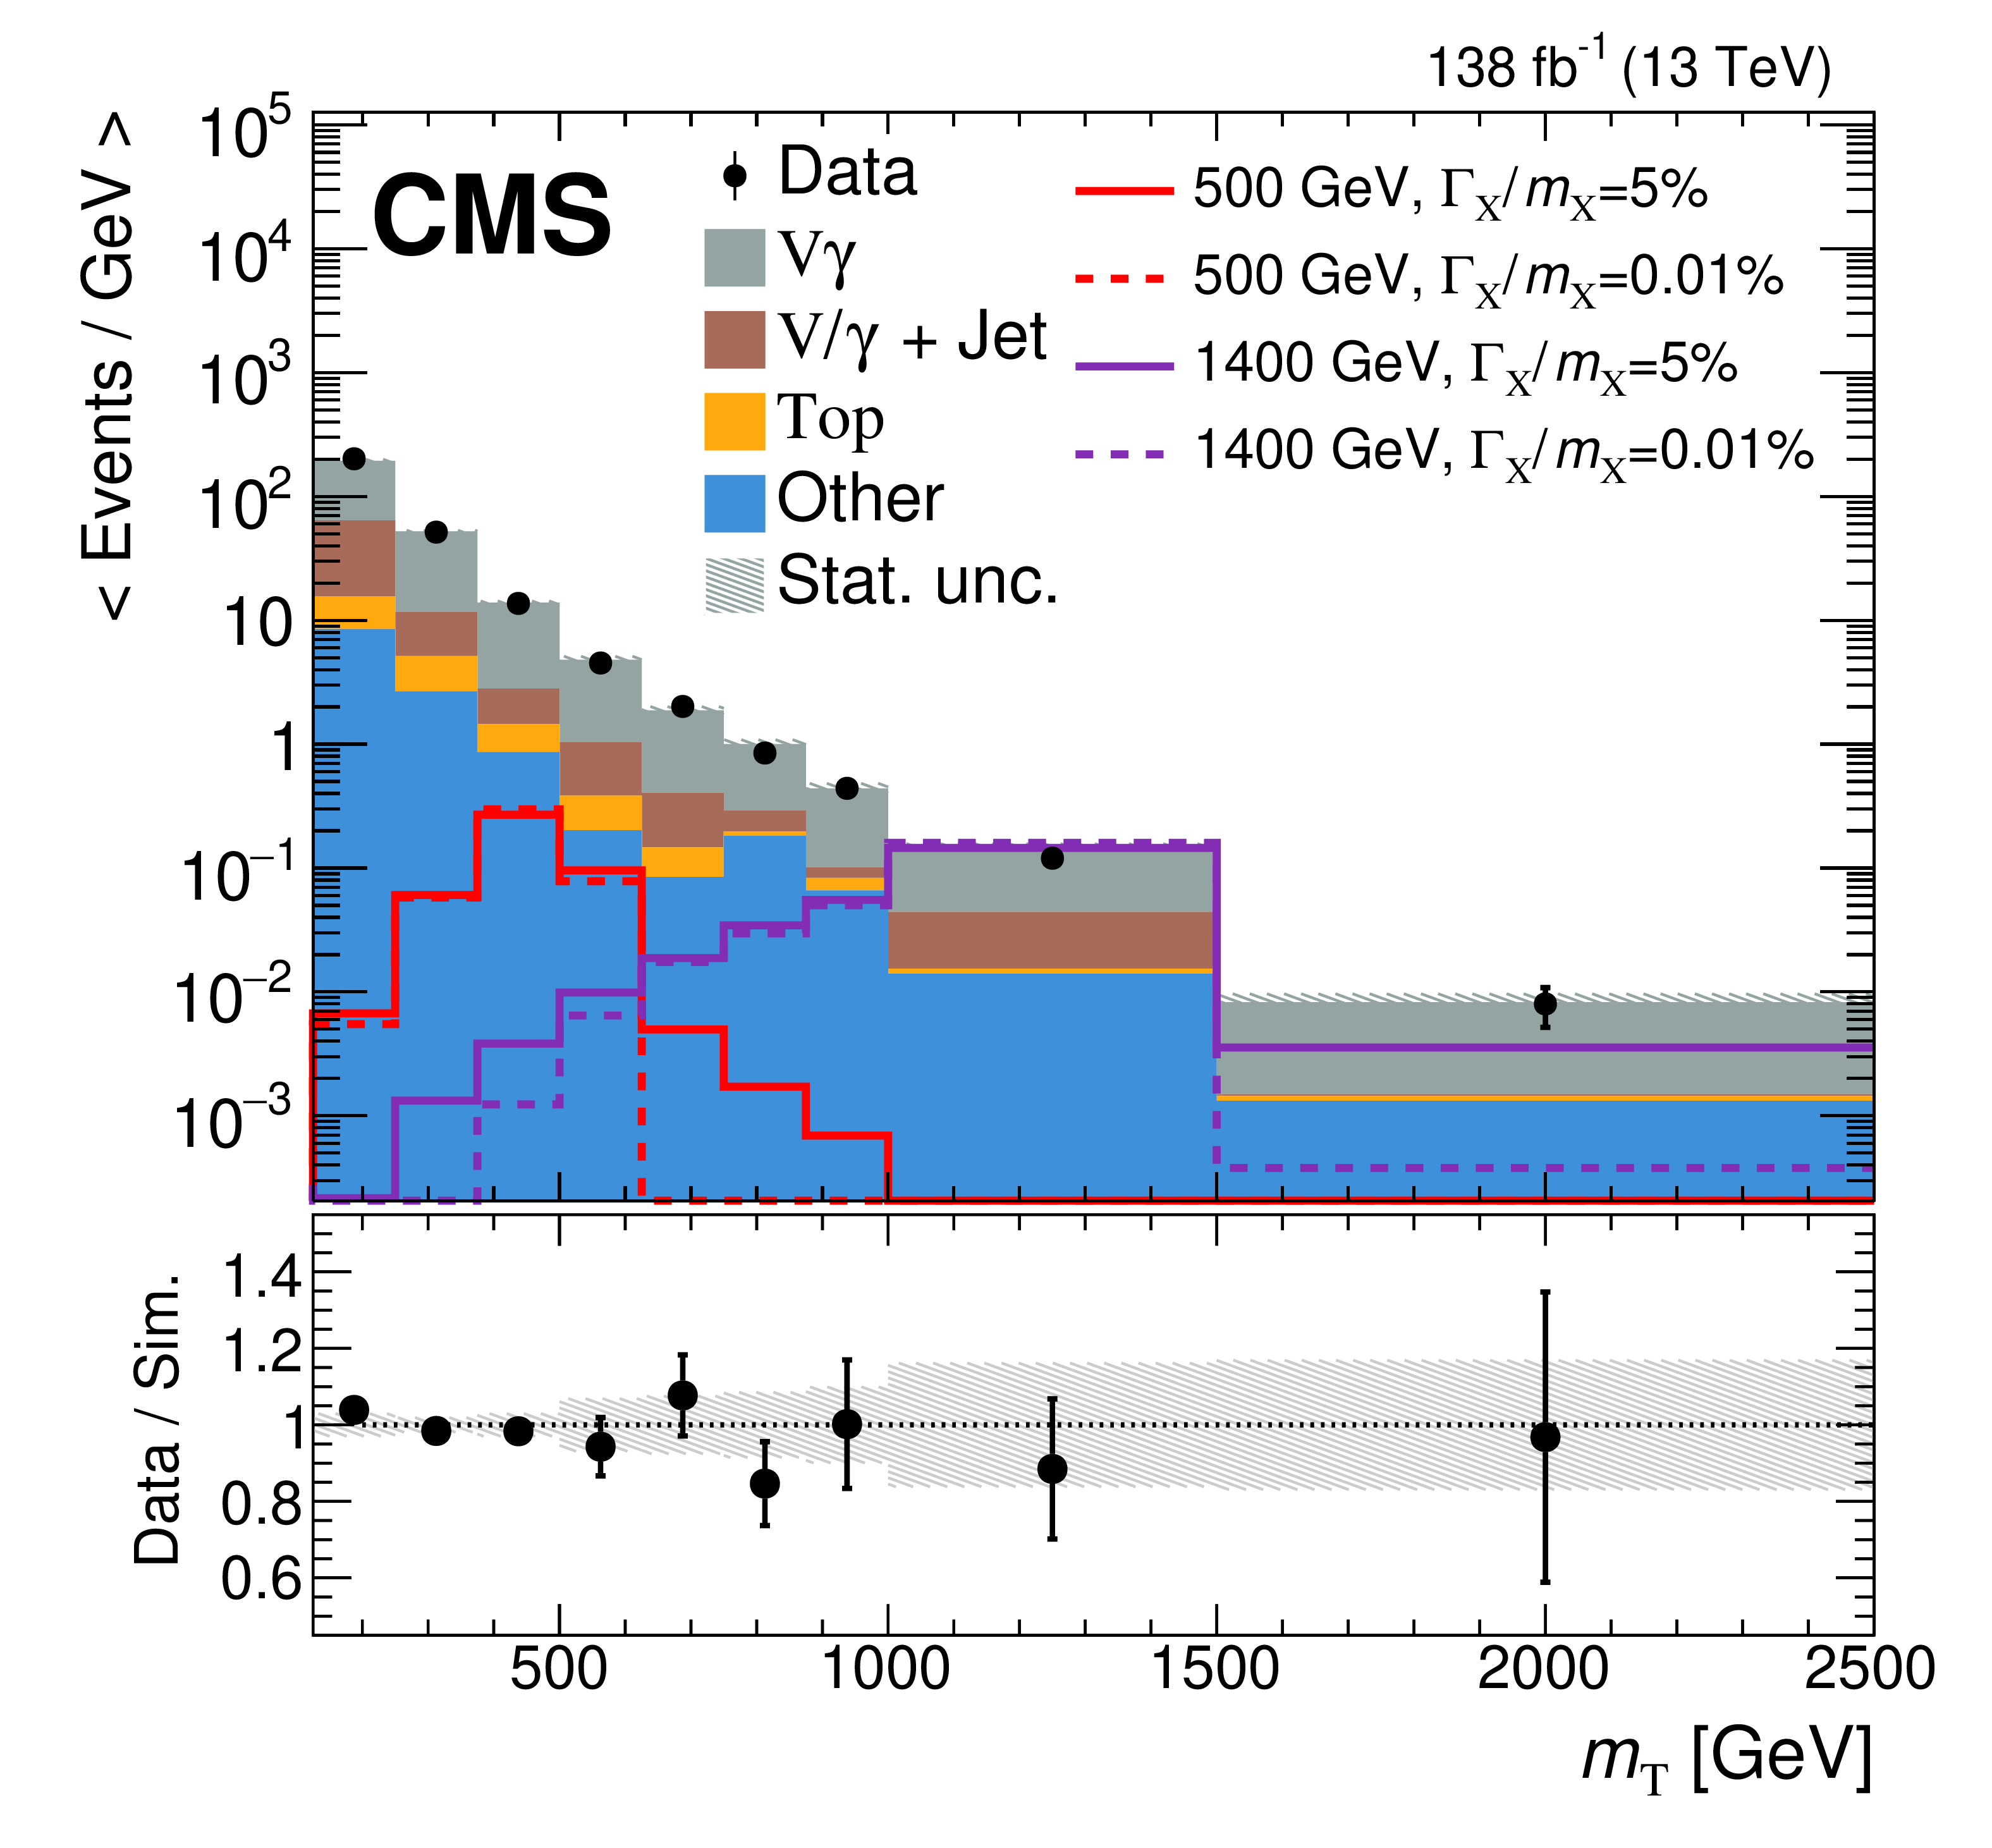
Distributions of $ m_{\mathrm{T}} $ (left) and $ p_{\mathrm{T}}\left(\gamma\right) $ (right) from simulation (stacked histograms) and data events (black points) passing all analysis selections. The number of events is divided by the width of each individual bin. The simulation distributions agree with data within statistical uncertainty. Four signal distributions, with two mass assumptions and two width assumptions, are also overlaid (dashed and solid lines). Each signal is plotted with a total cross section of 3 fb. Because of the limited number of simulated events, in the high mass region, progressively larger bin sizes are used. The last bin includes the overflow events. The lower panel shows the ratio of data to simulation. |
png pdf |
Figure 4-a:
Distributions of $ m_{\mathrm{T}} $ (left) and $ p_{\mathrm{T}}\left(\gamma\right) $ (right) from simulation (stacked histograms) and data events (black points) passing all analysis selections. The number of events is divided by the width of each individual bin. The simulation distributions agree with data within statistical uncertainty. Four signal distributions, with two mass assumptions and two width assumptions, are also overlaid (dashed and solid lines). Each signal is plotted with a total cross section of 3 fb. Because of the limited number of simulated events, in the high mass region, progressively larger bin sizes are used. The last bin includes the overflow events. The lower panel shows the ratio of data to simulation. |

png pdf |
Figure 4-b:
Distributions of $ m_{\mathrm{T}} $ (left) and $ p_{\mathrm{T}}\left(\gamma\right) $ (right) from simulation (stacked histograms) and data events (black points) passing all analysis selections. The number of events is divided by the width of each individual bin. The simulation distributions agree with data within statistical uncertainty. Four signal distributions, with two mass assumptions and two width assumptions, are also overlaid (dashed and solid lines). Each signal is plotted with a total cross section of 3 fb. Because of the limited number of simulated events, in the high mass region, progressively larger bin sizes are used. The last bin includes the overflow events. The lower panel shows the ratio of data to simulation. |
png pdf |
Figure 5:
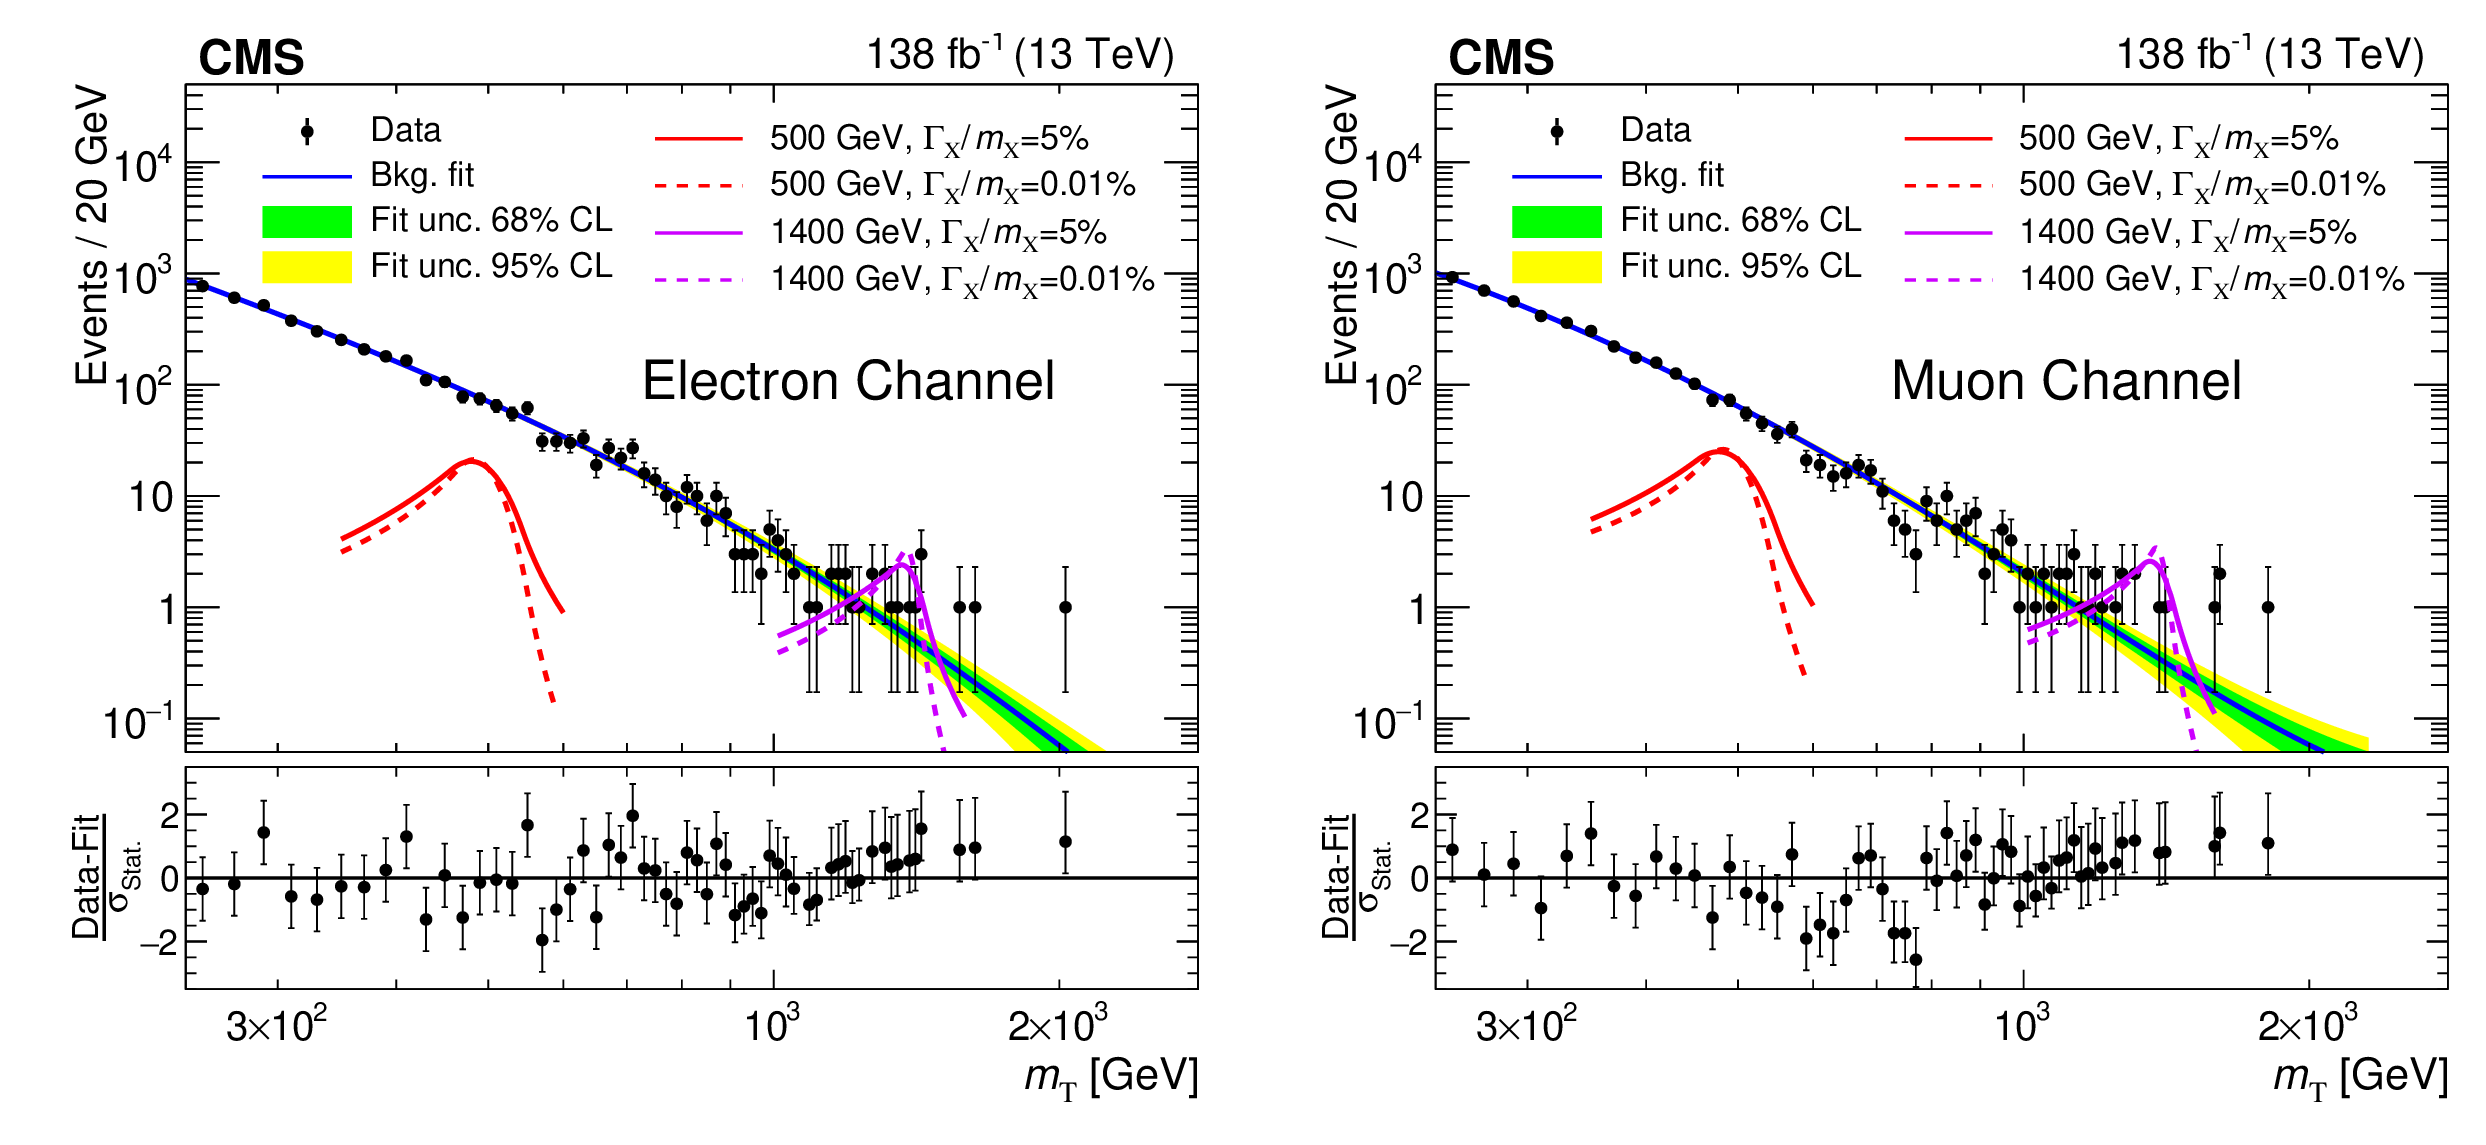
Background-only fit to data (black points) with the fitted background model shown as a blue line. The green (inner) and yellow (outer) bands show, respectively, the 68% and 95% confidence level statistical uncertainties in the fitted model. Four signal models are also overlaid. Their total cross sections are set to the expected limits at 95% confidence level from this search with leptonic decays of the W boson. There are two mass assumptions---500 and 1400 GeV, in red and magenta, respectively---and two width assumptions---narrow (solid curves) and broad (dashed curves). The lower panel contains the pull distribution, defined as the difference between the data yield and the background prediction divided by their combined uncertainty. The left (right) panel is the electron (muon) channel with all three years' data combined. |
png pdf |
Figure 5-a:
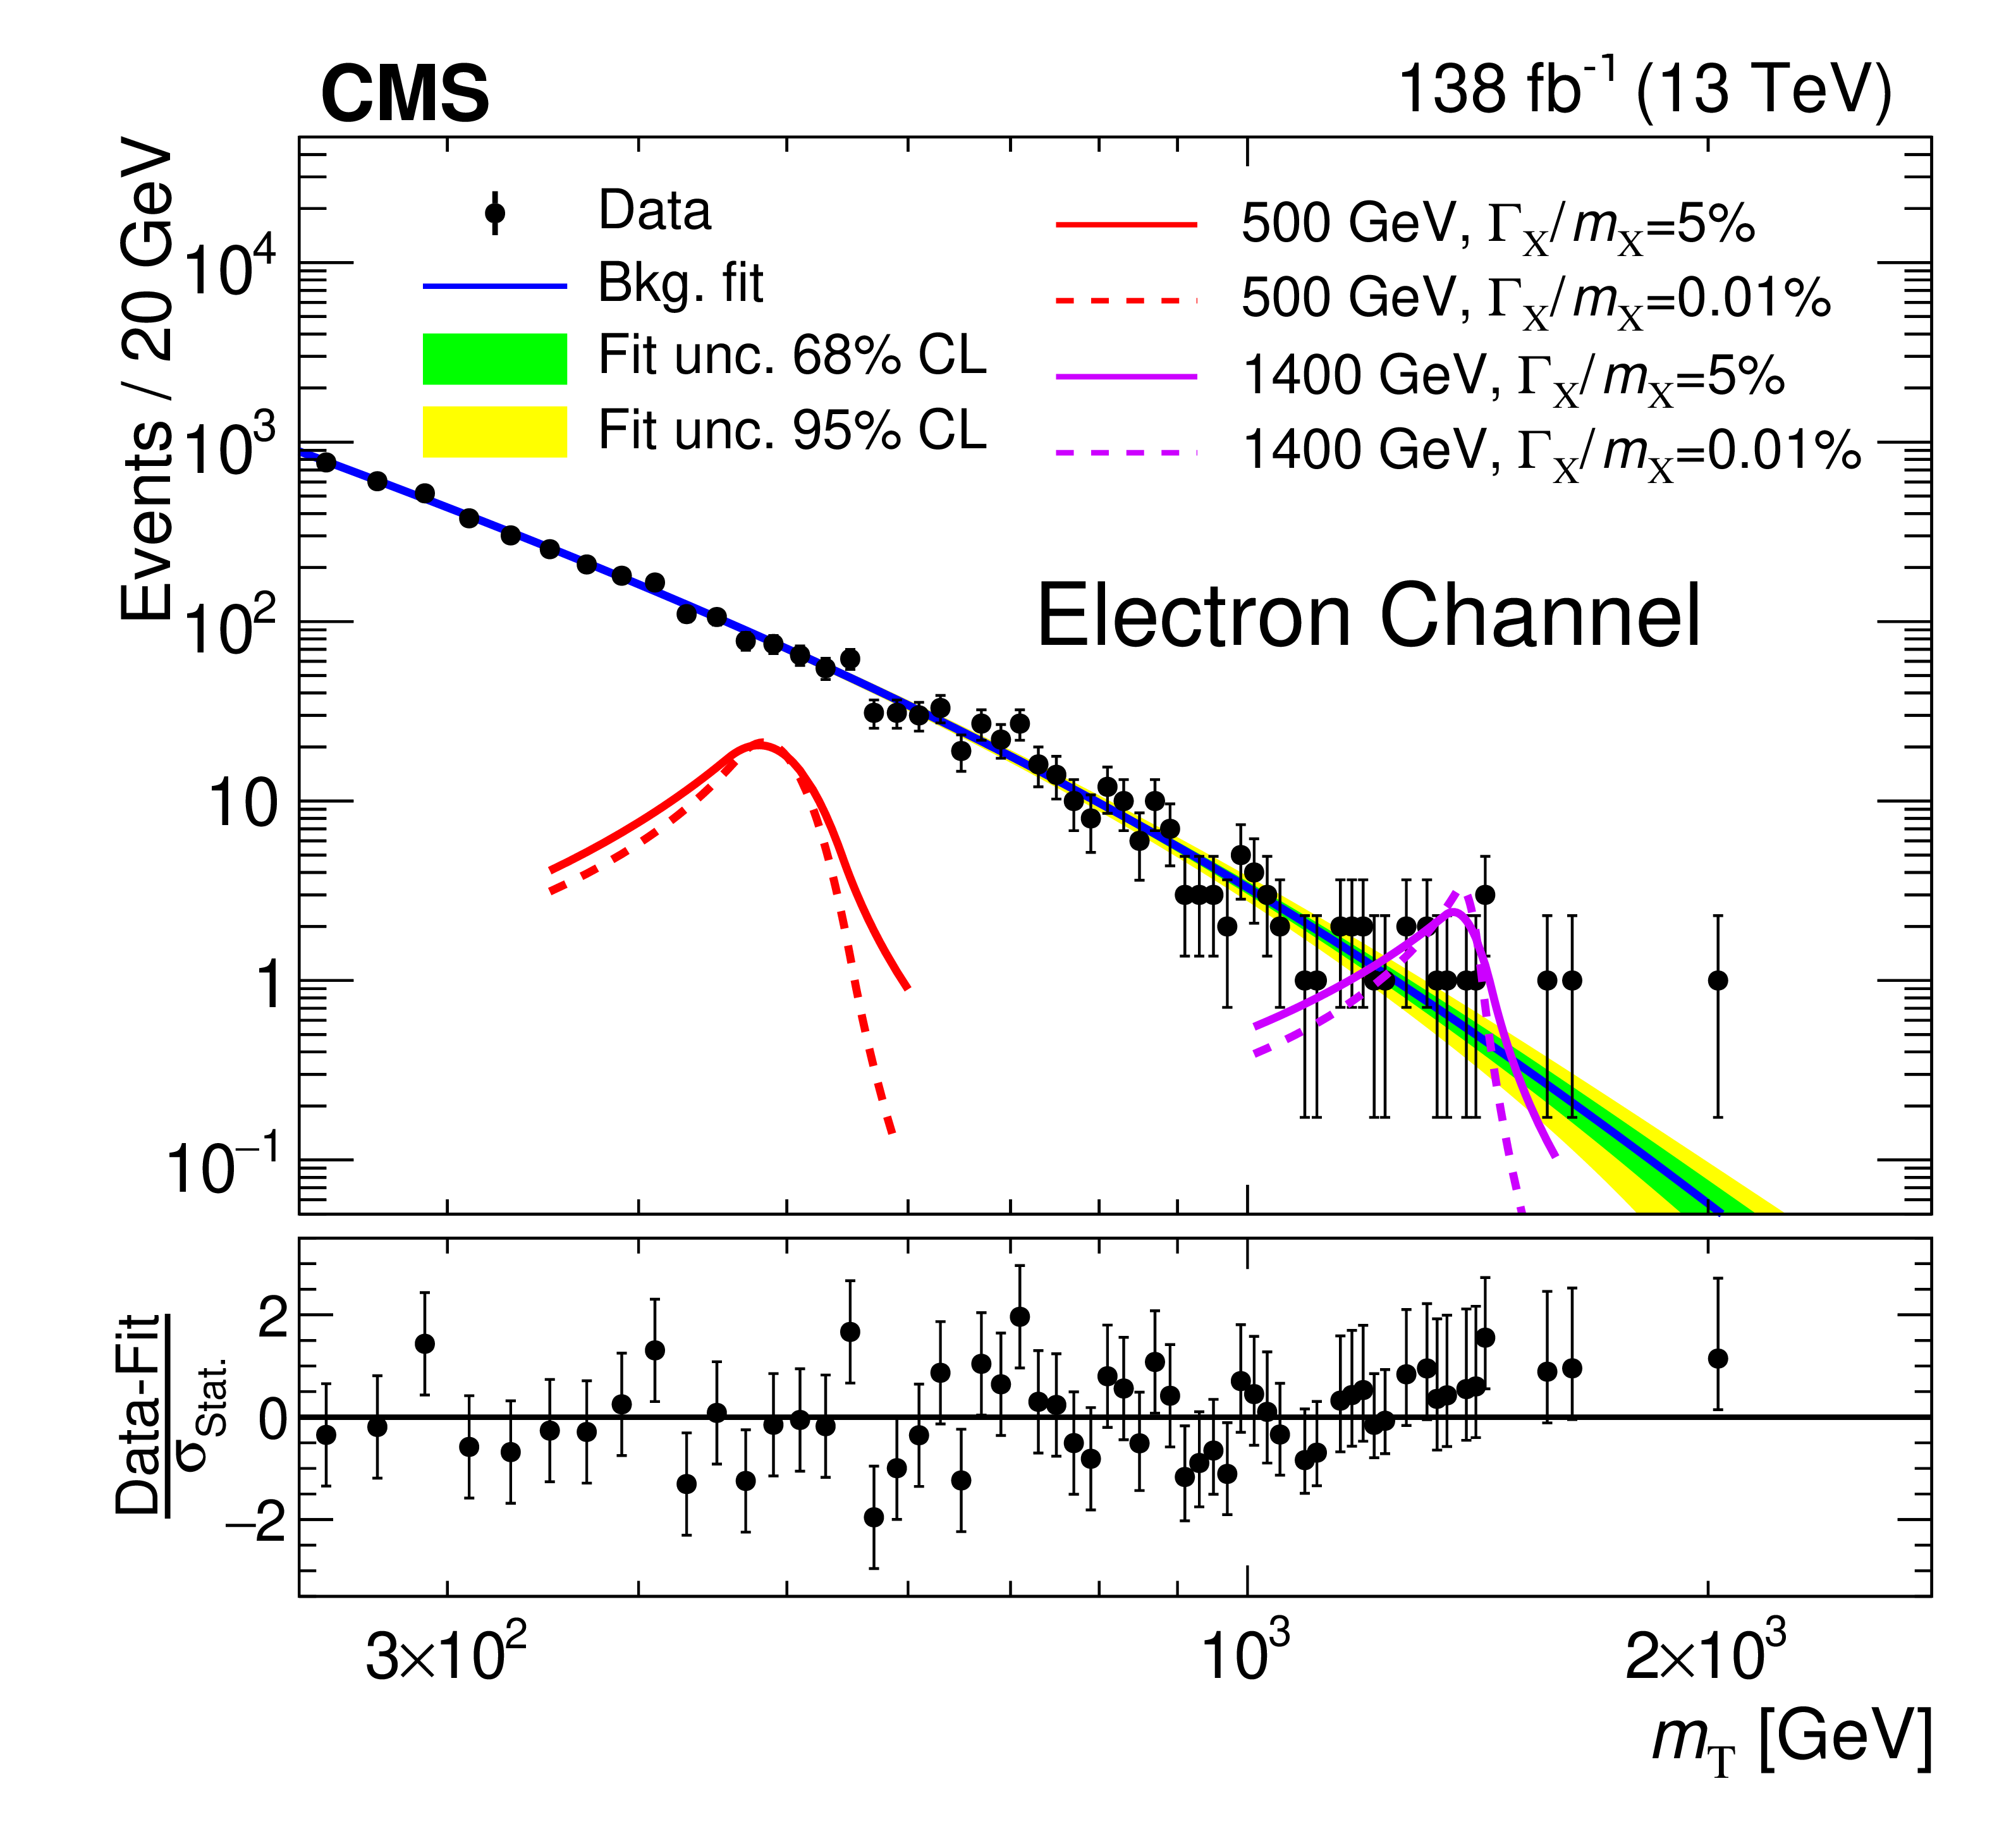
Background-only fit to data (black points) with the fitted background model shown as a blue line. The green (inner) and yellow (outer) bands show, respectively, the 68% and 95% confidence level statistical uncertainties in the fitted model. Four signal models are also overlaid. Their total cross sections are set to the expected limits at 95% confidence level from this search with leptonic decays of the W boson. There are two mass assumptions---500 and 1400 GeV, in red and magenta, respectively---and two width assumptions---narrow (solid curves) and broad (dashed curves). The lower panel contains the pull distribution, defined as the difference between the data yield and the background prediction divided by their combined uncertainty. The left (right) panel is the electron (muon) channel with all three years' data combined. |
png pdf |
Figure 5-b:
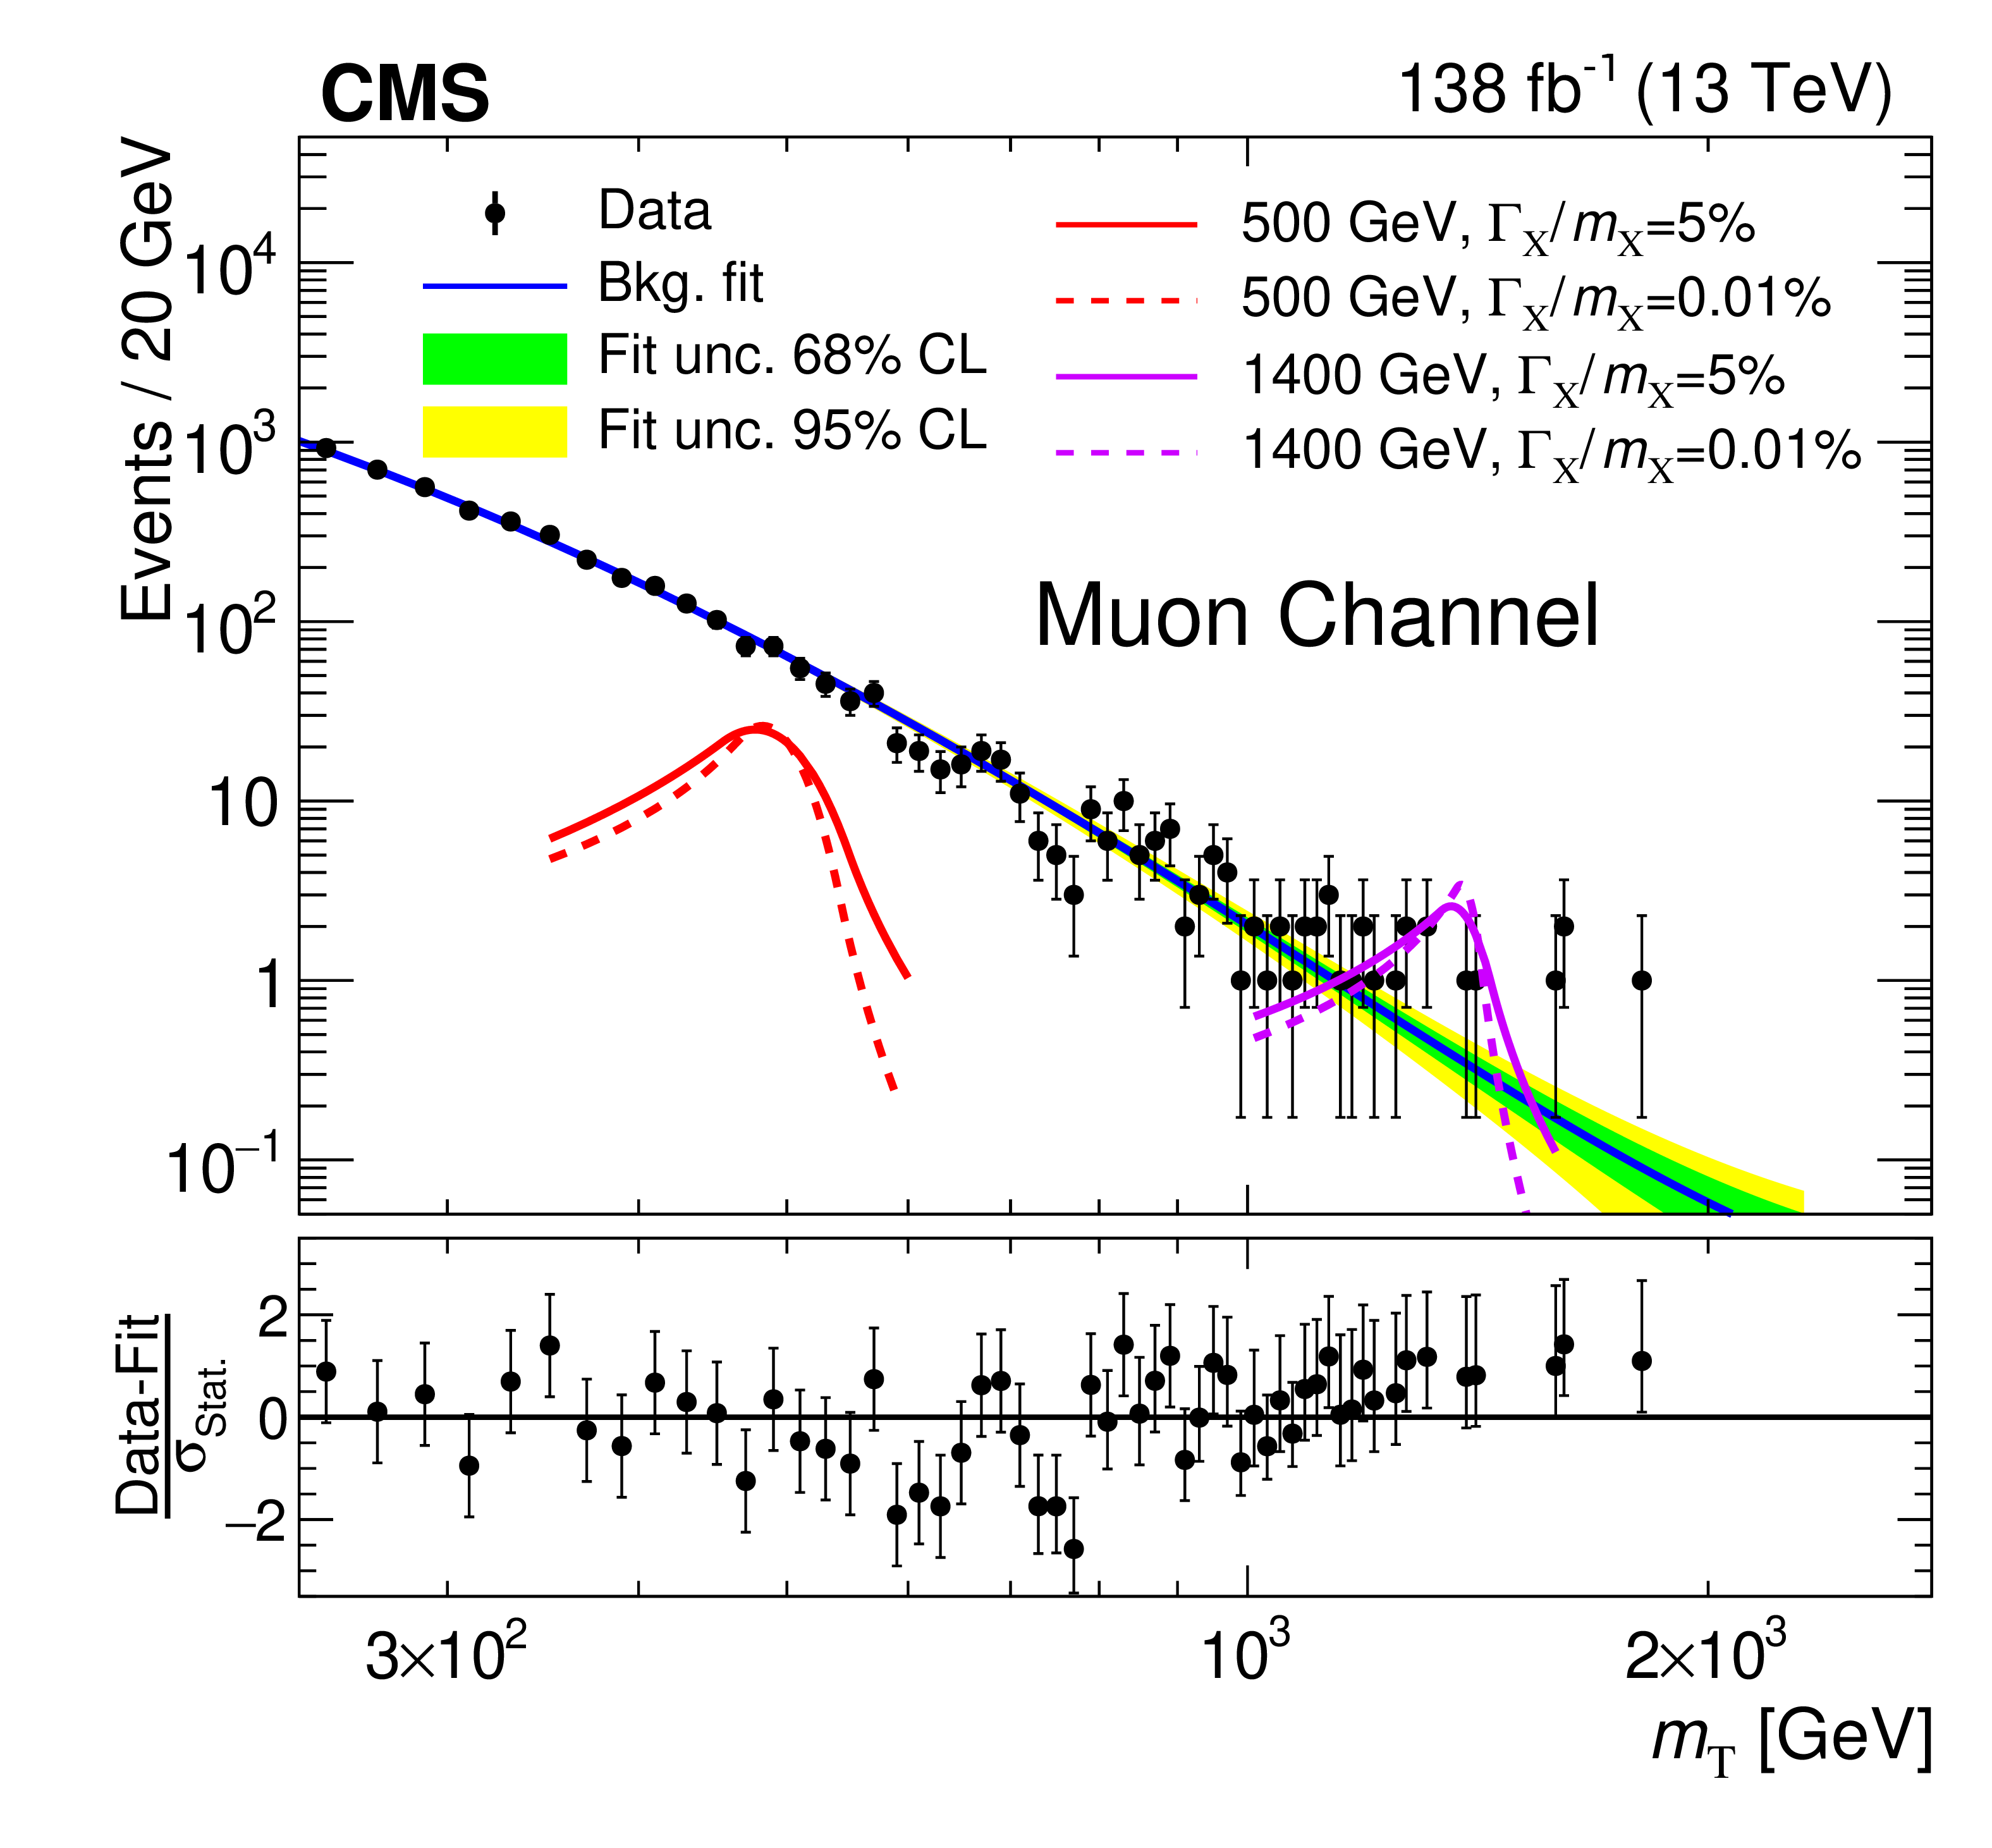
Background-only fit to data (black points) with the fitted background model shown as a blue line. The green (inner) and yellow (outer) bands show, respectively, the 68% and 95% confidence level statistical uncertainties in the fitted model. Four signal models are also overlaid. Their total cross sections are set to the expected limits at 95% confidence level from this search with leptonic decays of the W boson. There are two mass assumptions---500 and 1400 GeV, in red and magenta, respectively---and two width assumptions---narrow (solid curves) and broad (dashed curves). The lower panel contains the pull distribution, defined as the difference between the data yield and the background prediction divided by their combined uncertainty. The left (right) panel is the electron (muon) channel with all three years' data combined. |
png pdf |
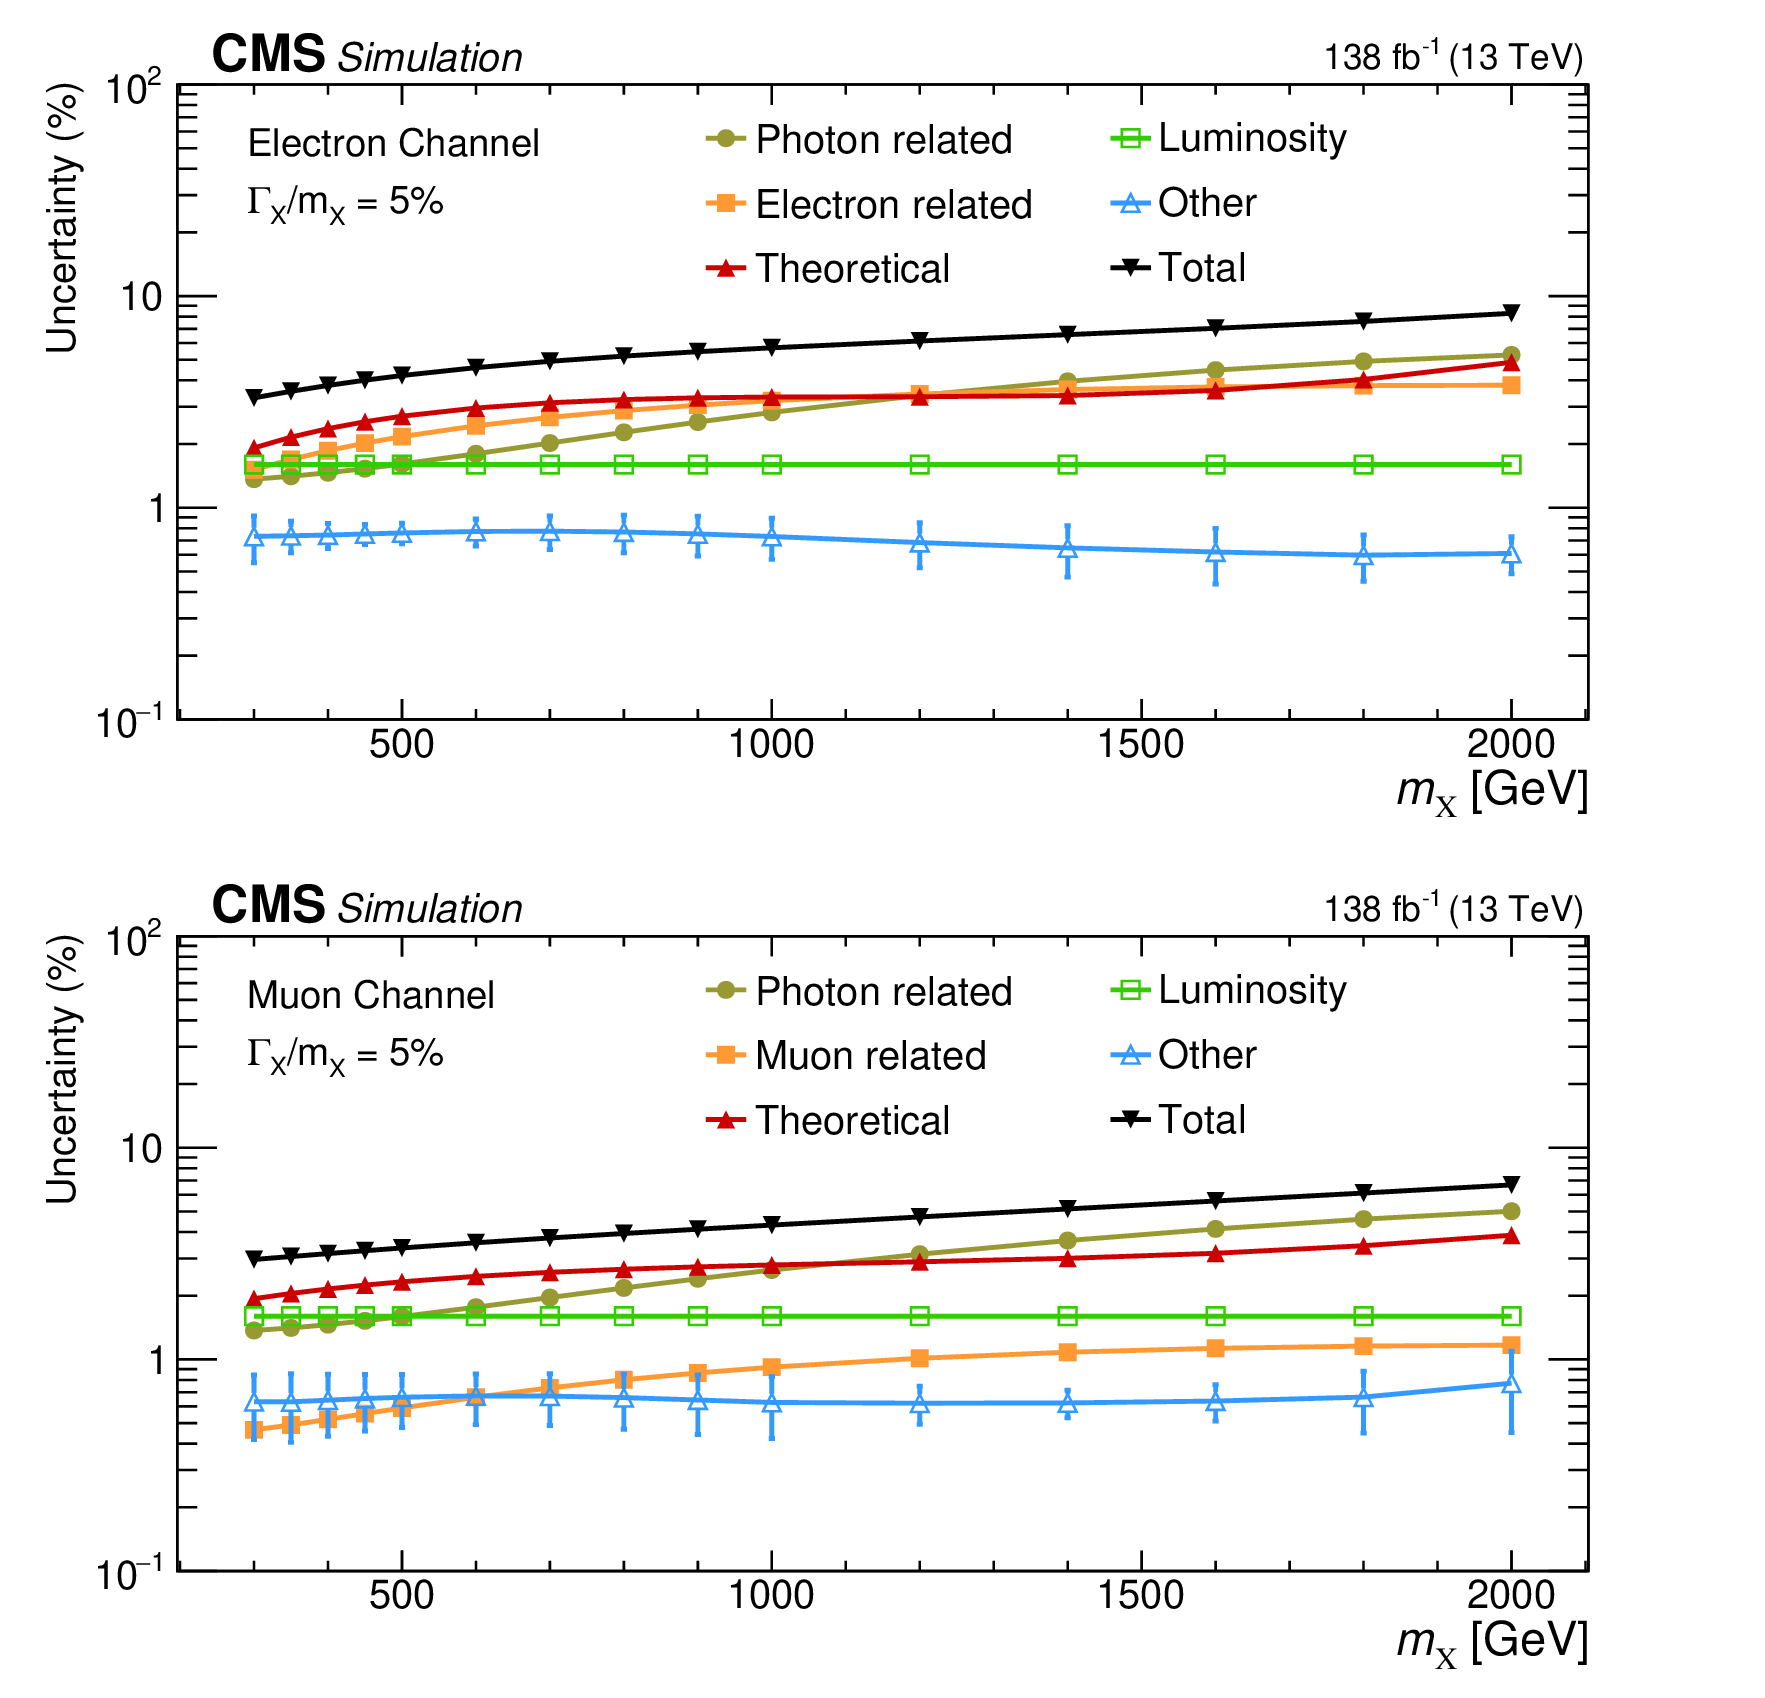
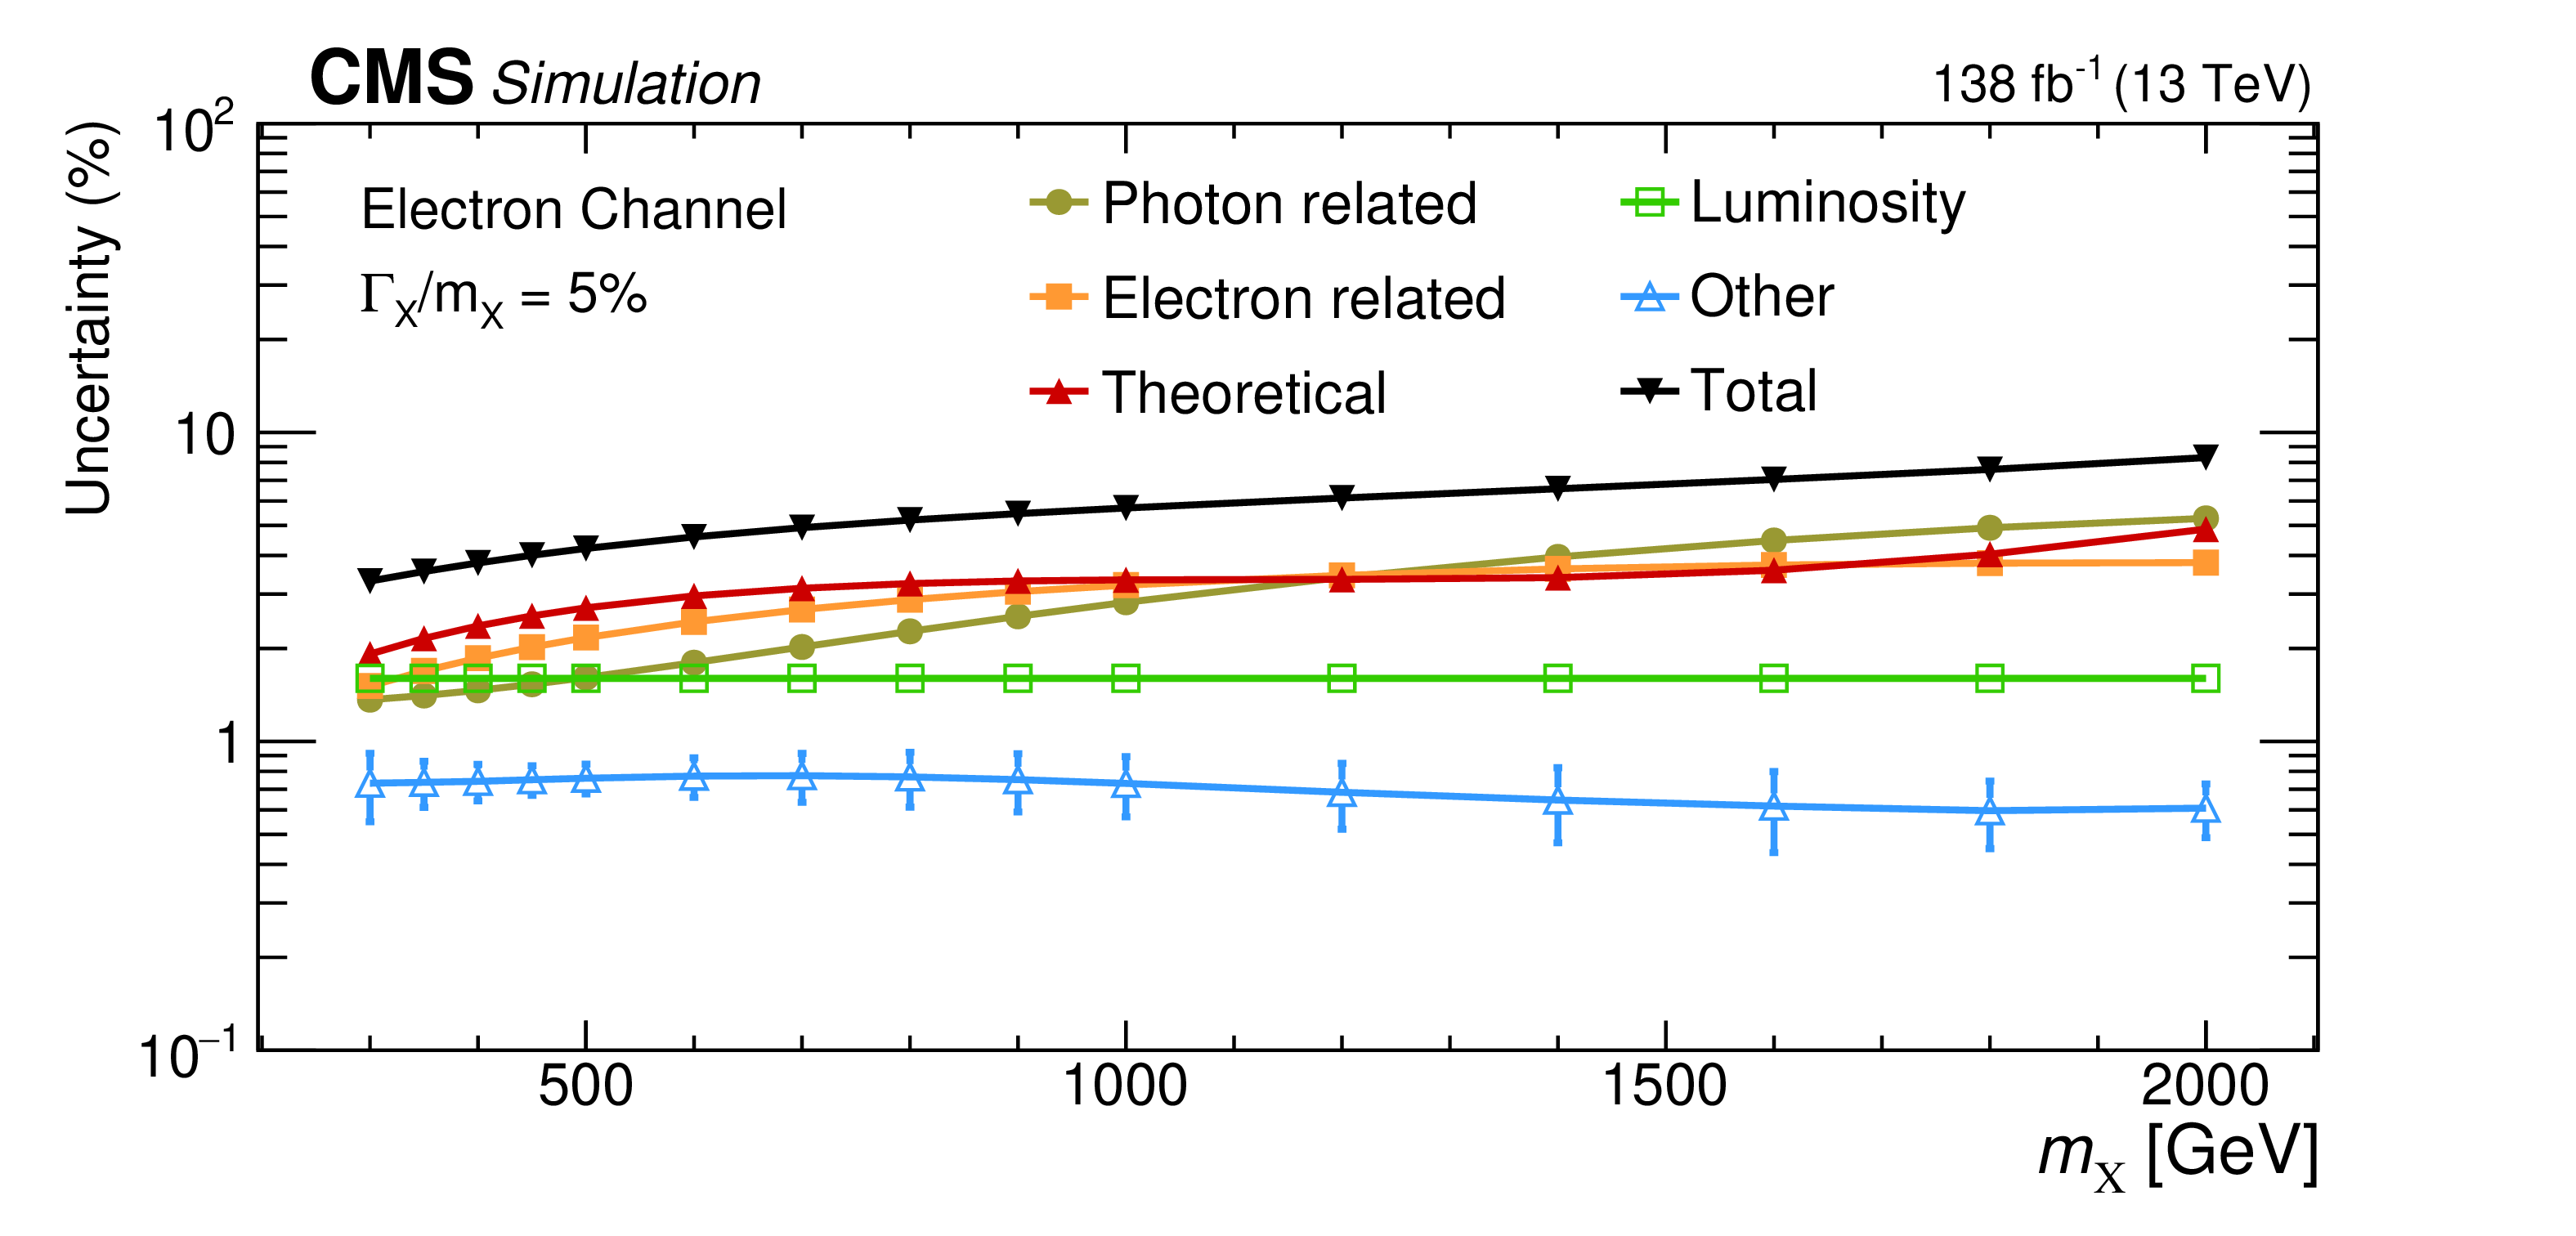
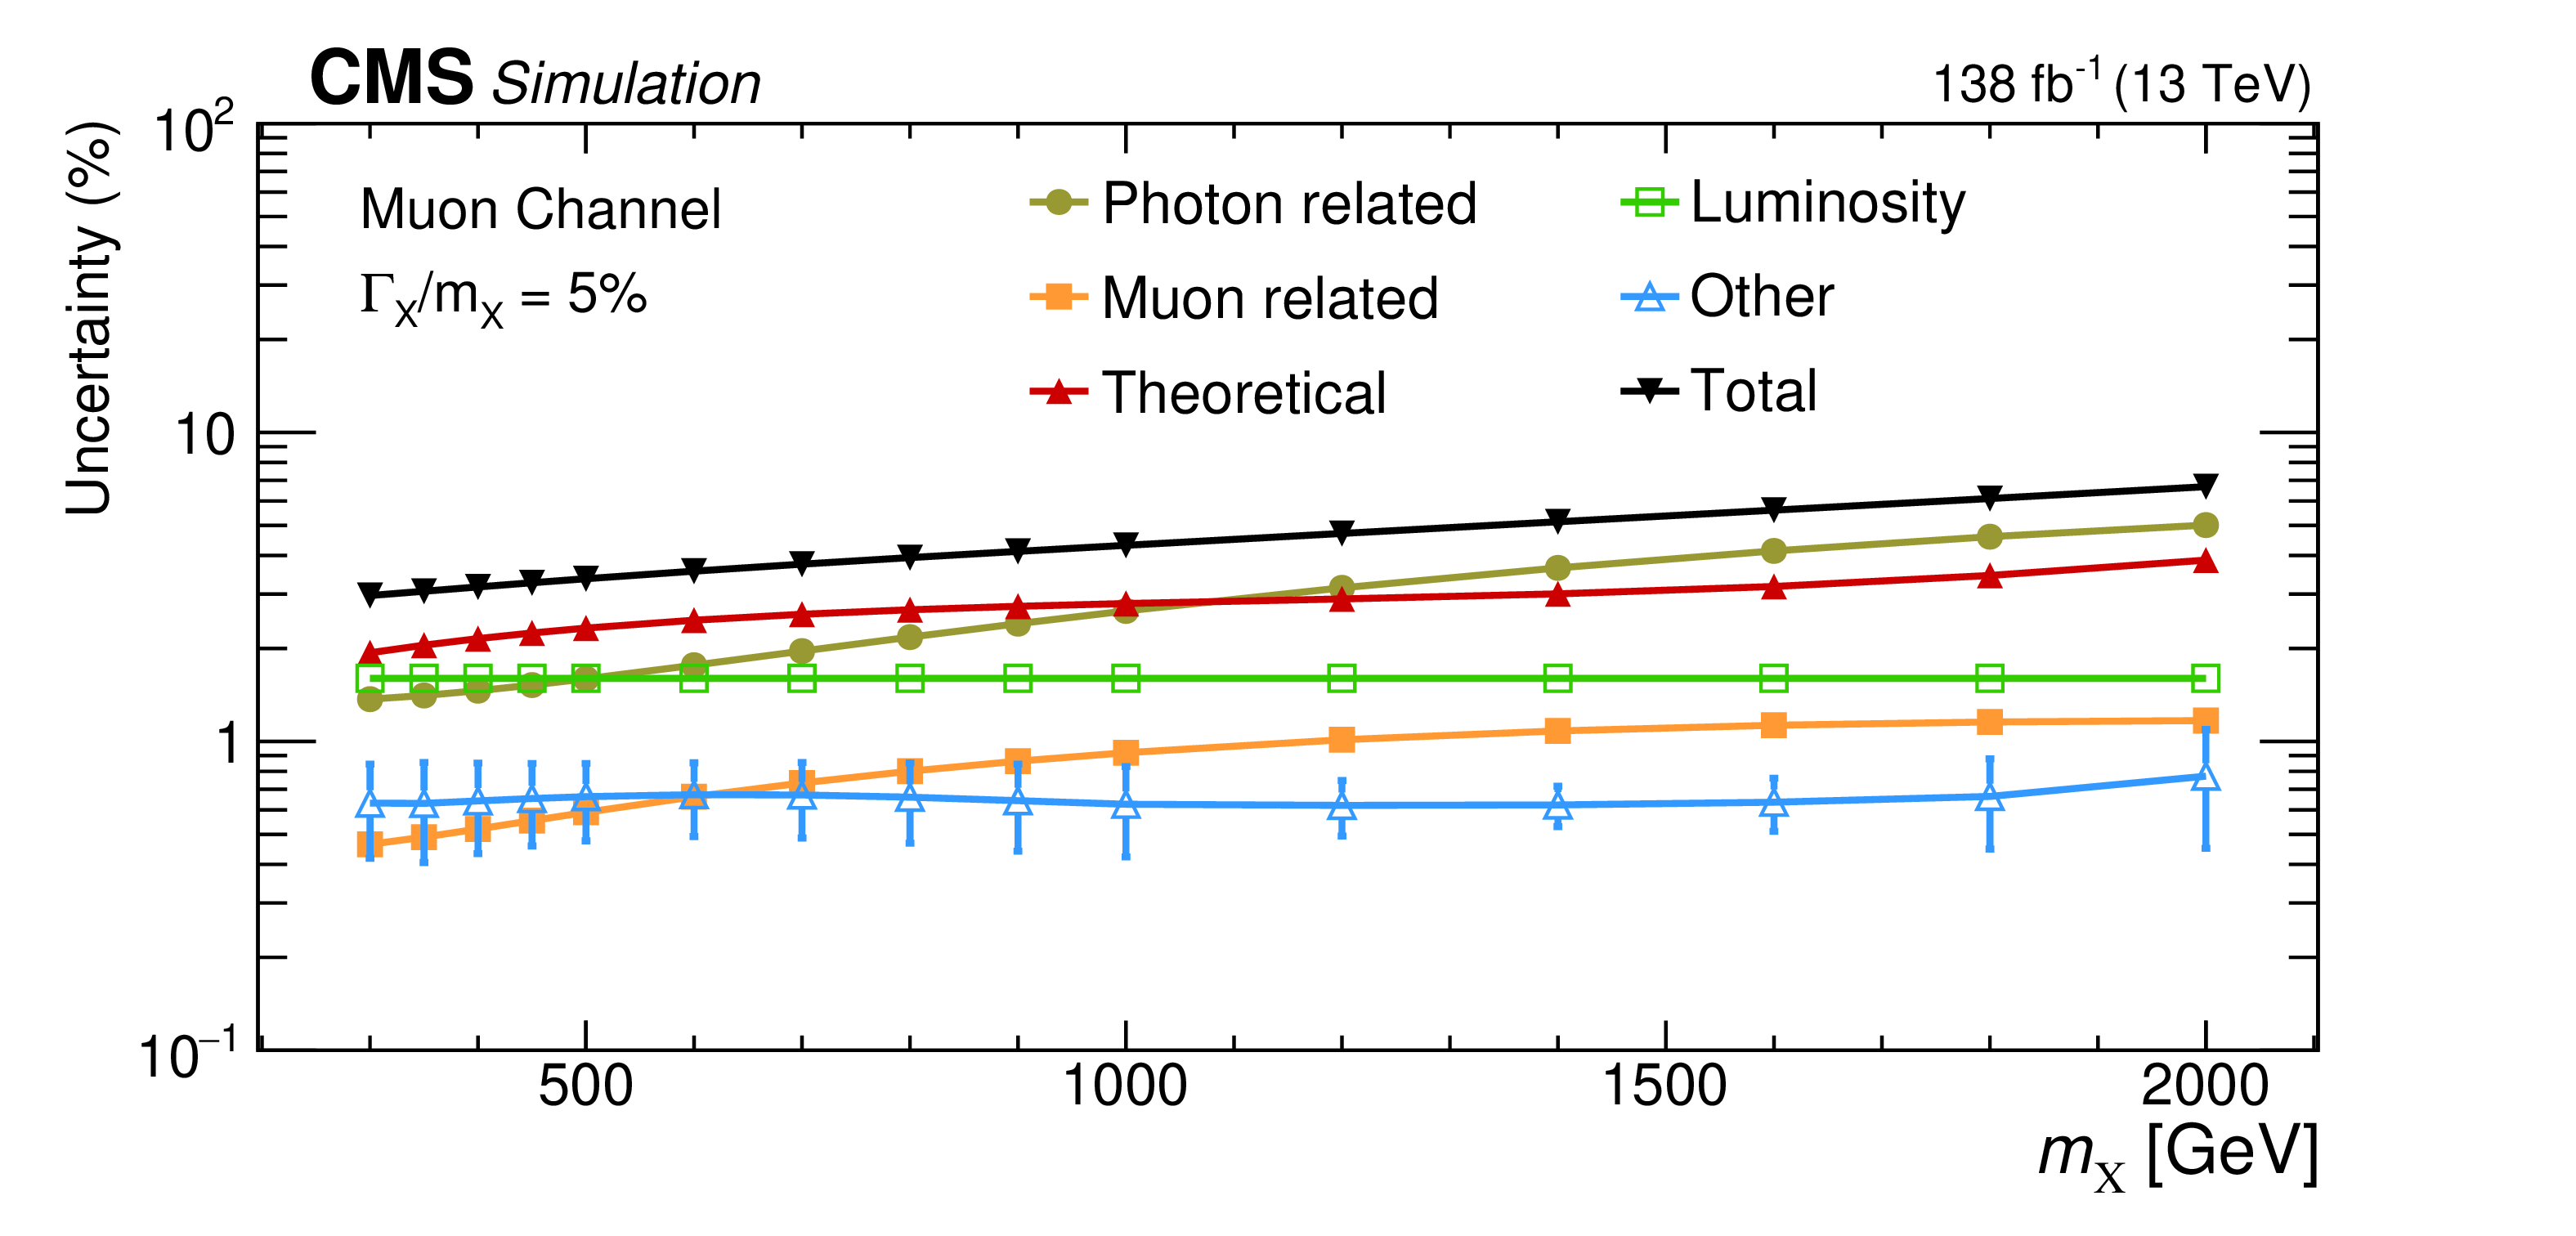
Figure 6:
Systematic uncertainties affecting the signal normalization in the electron (upper) and muon (lower) channels for the broad resonance are shown. Error bars represent the asymmetric uncertainties (downward and upward variations), with the central value representing the average uncertainty. The total systematic uncertainty (black) increases steadily with the resonant mass assumption. The uncertainties for the narrow-width case are nearly identical. |
png pdf |
Figure 6-a:
Systematic uncertainties affecting the signal normalization in the electron (upper) and muon (lower) channels for the broad resonance are shown. Error bars represent the asymmetric uncertainties (downward and upward variations), with the central value representing the average uncertainty. The total systematic uncertainty (black) increases steadily with the resonant mass assumption. The uncertainties for the narrow-width case are nearly identical. |
png pdf |
Figure 6-b:
Systematic uncertainties affecting the signal normalization in the electron (upper) and muon (lower) channels for the broad resonance are shown. Error bars represent the asymmetric uncertainties (downward and upward variations), with the central value representing the average uncertainty. The total systematic uncertainty (black) increases steadily with the resonant mass assumption. The uncertainties for the narrow-width case are nearly identical. |
png pdf |
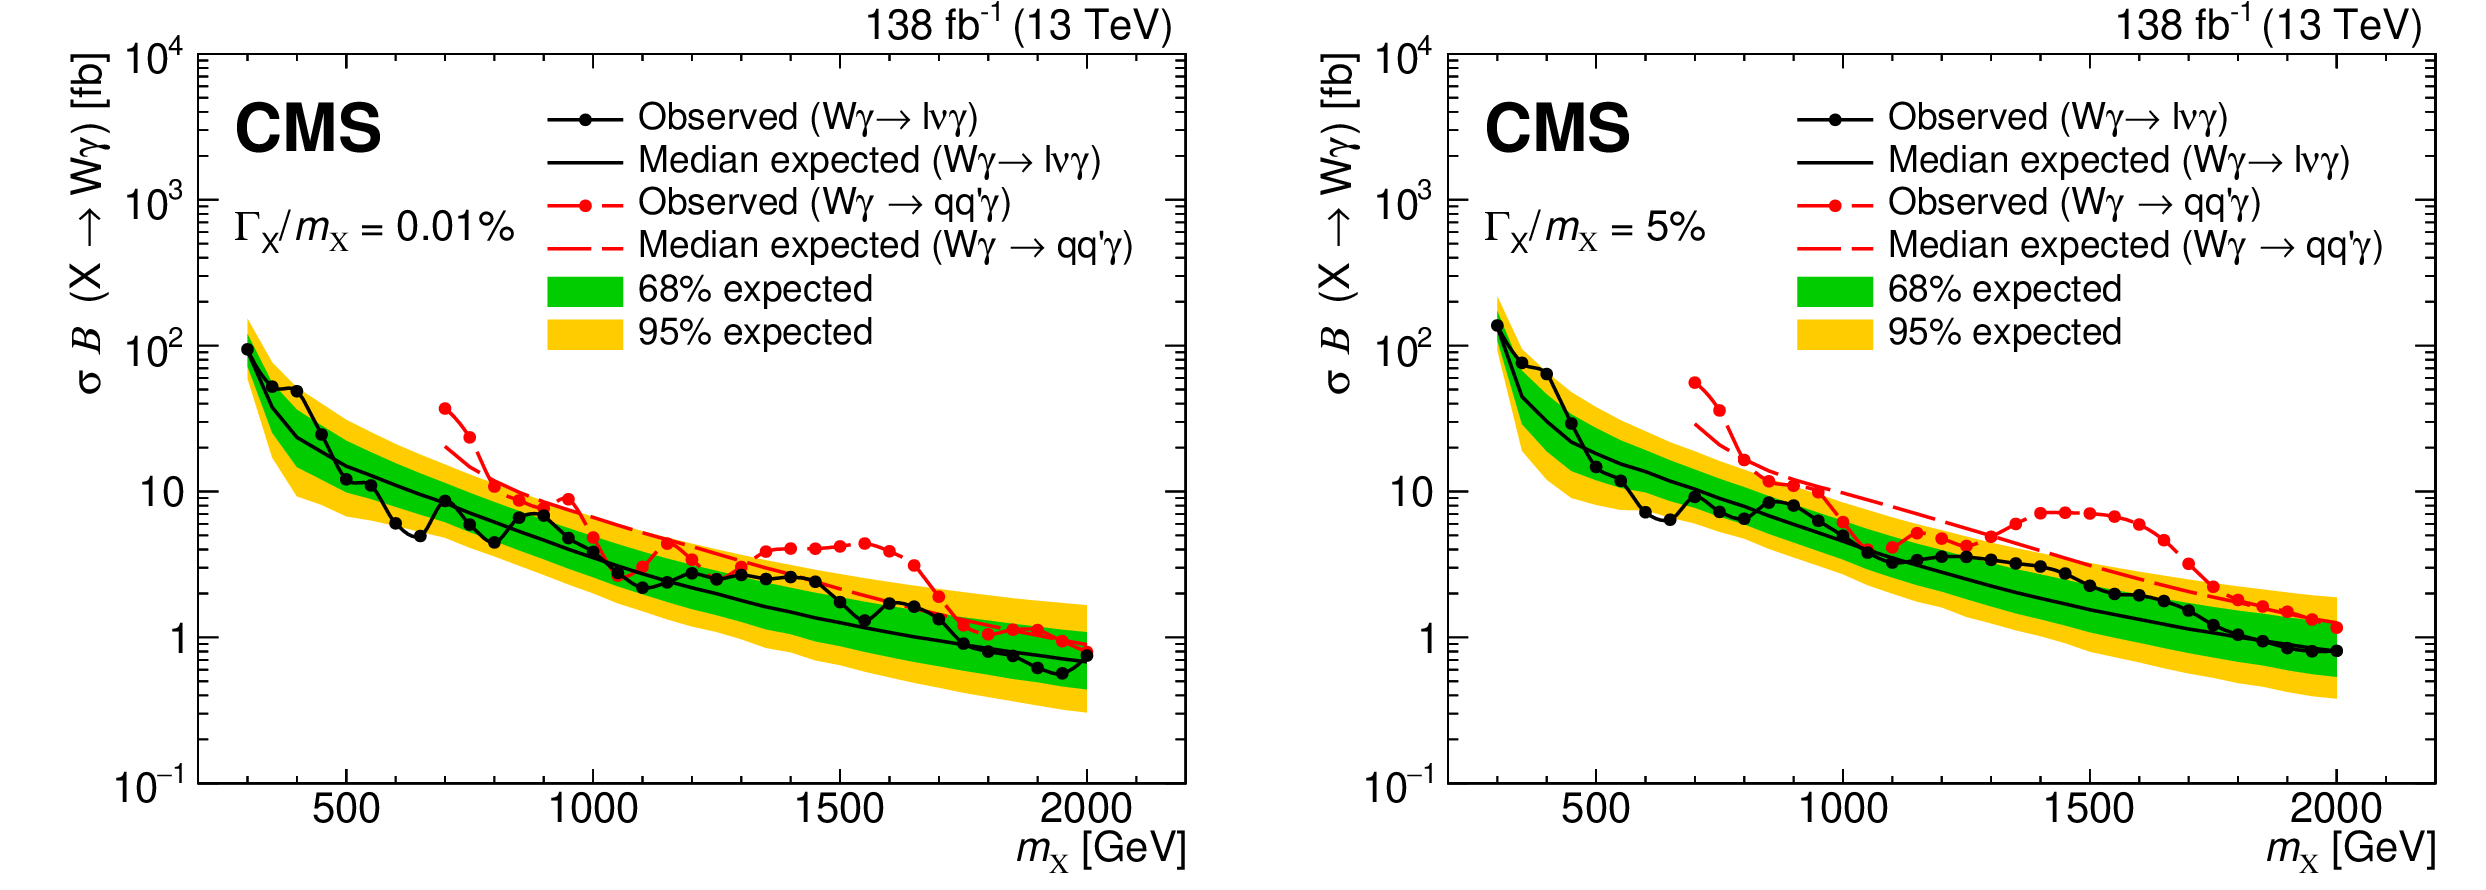
Figure 7:
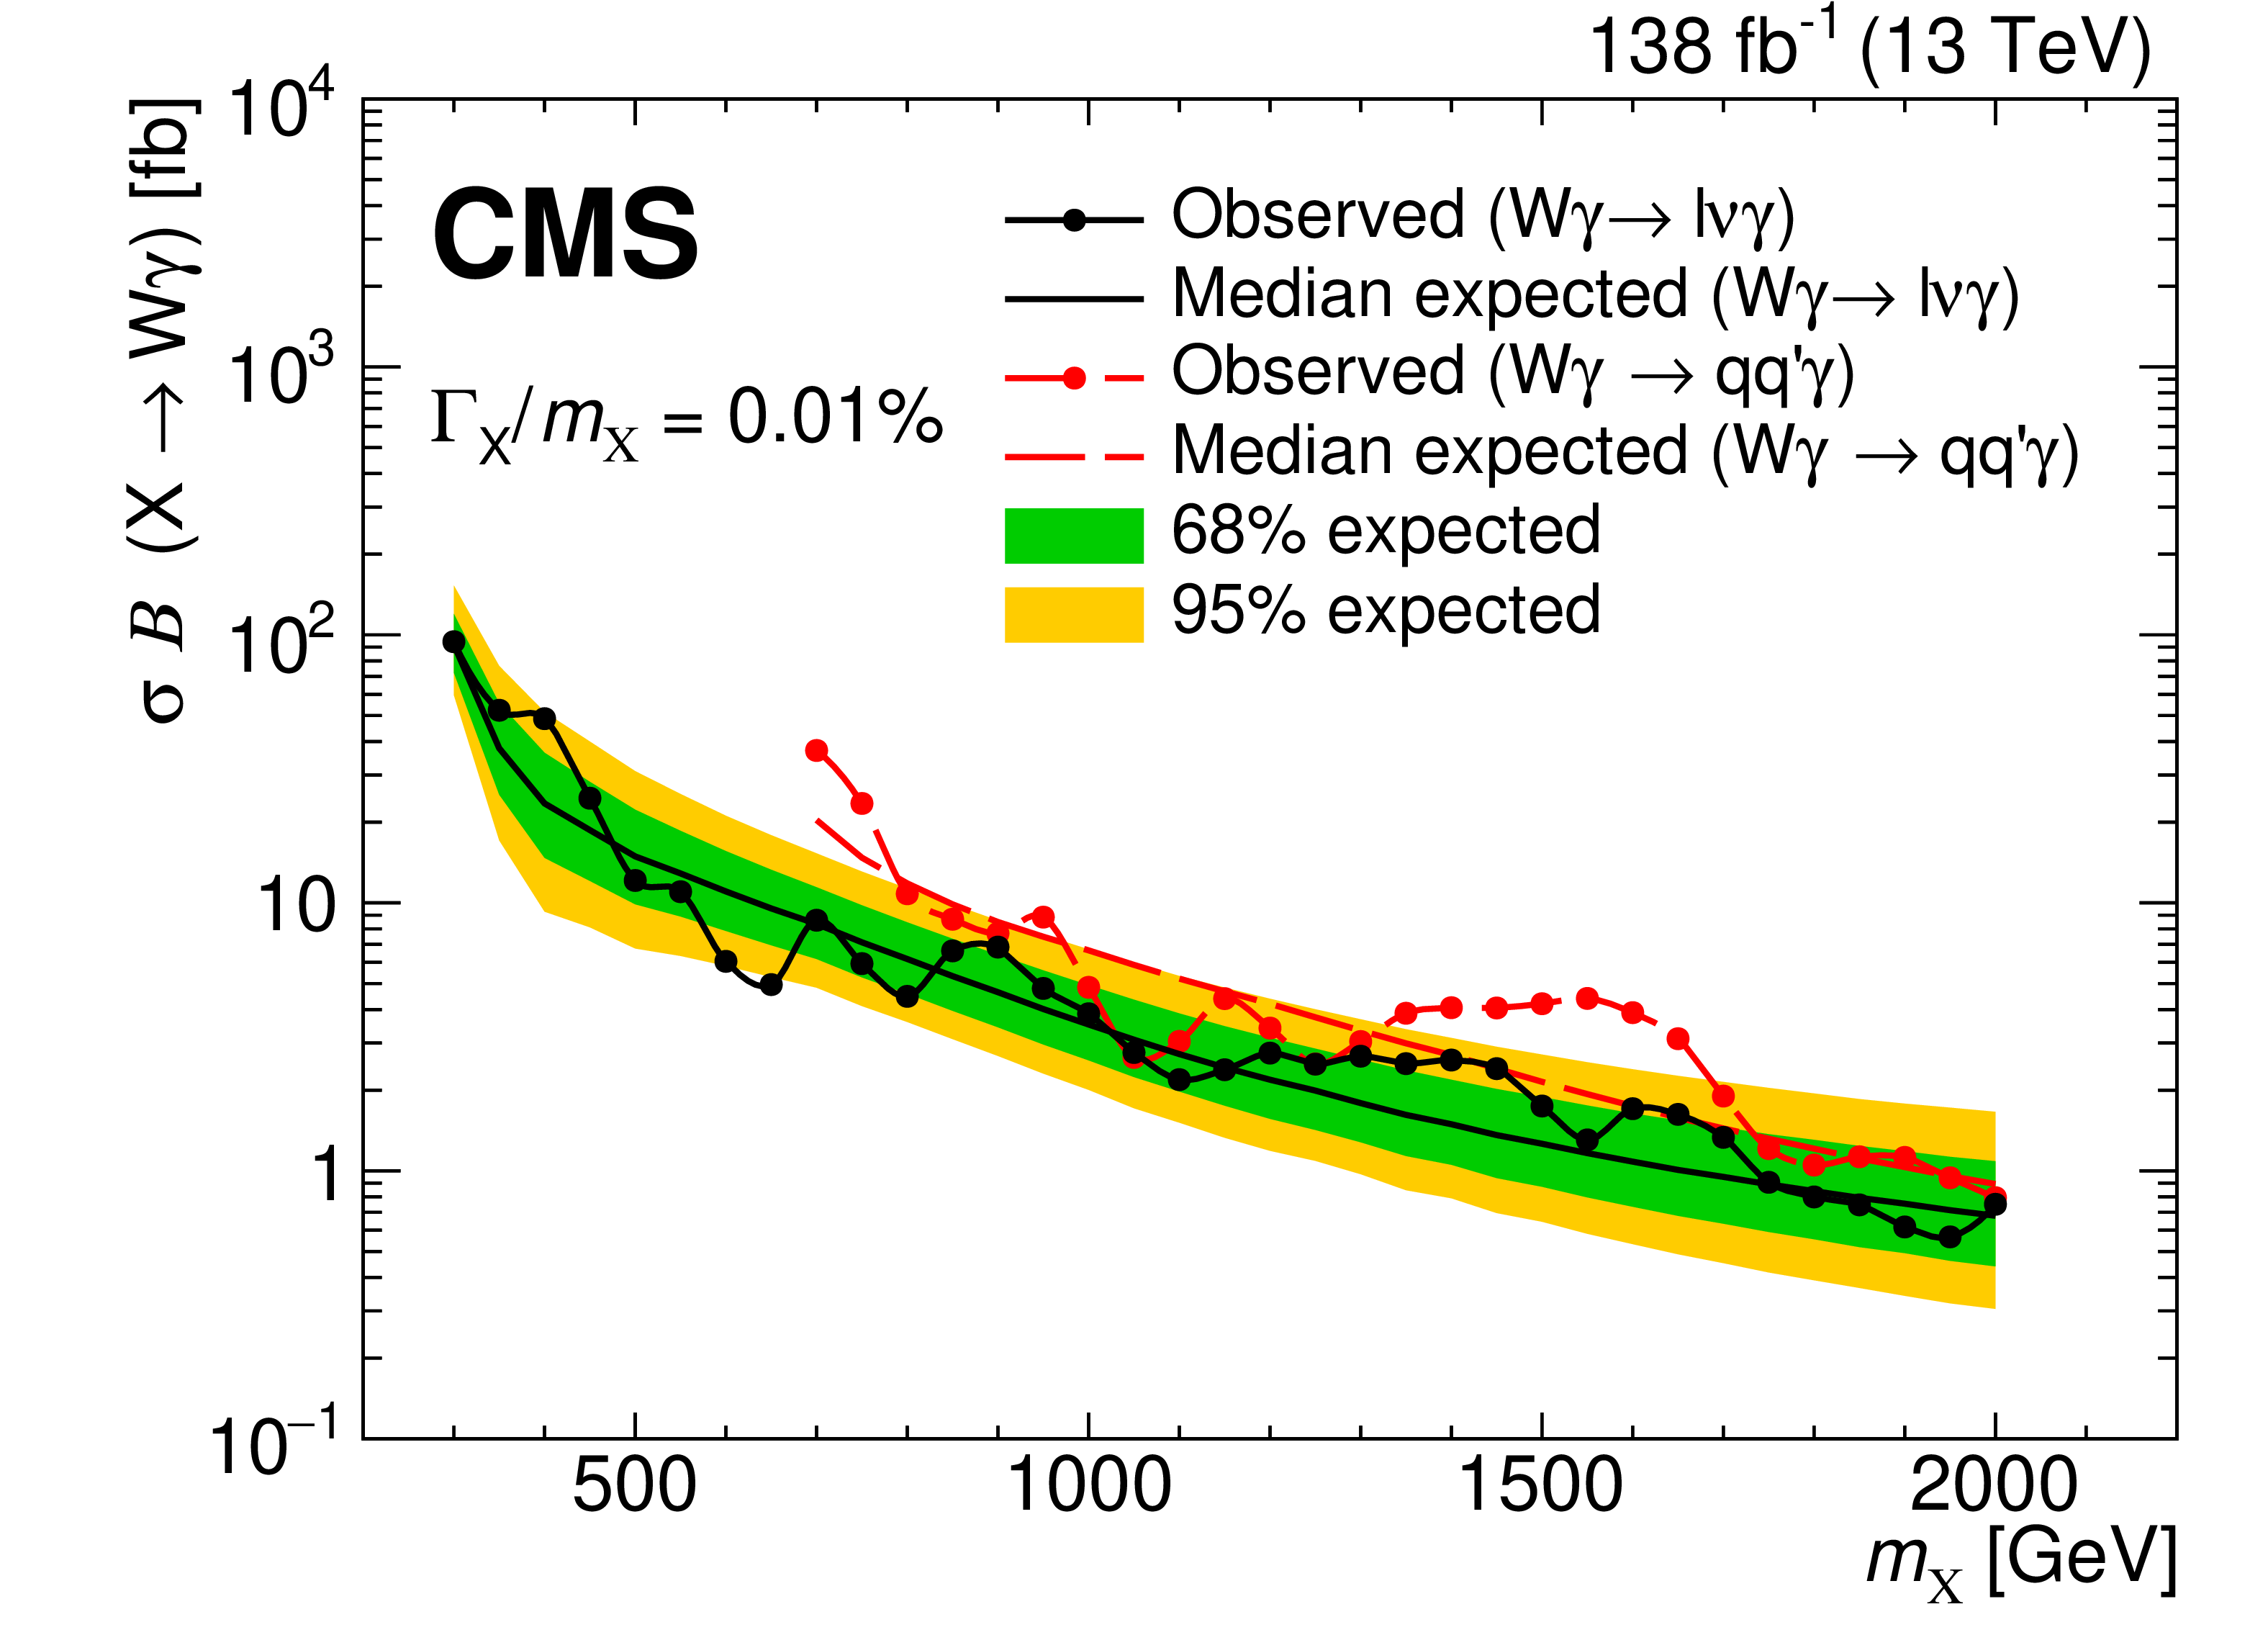
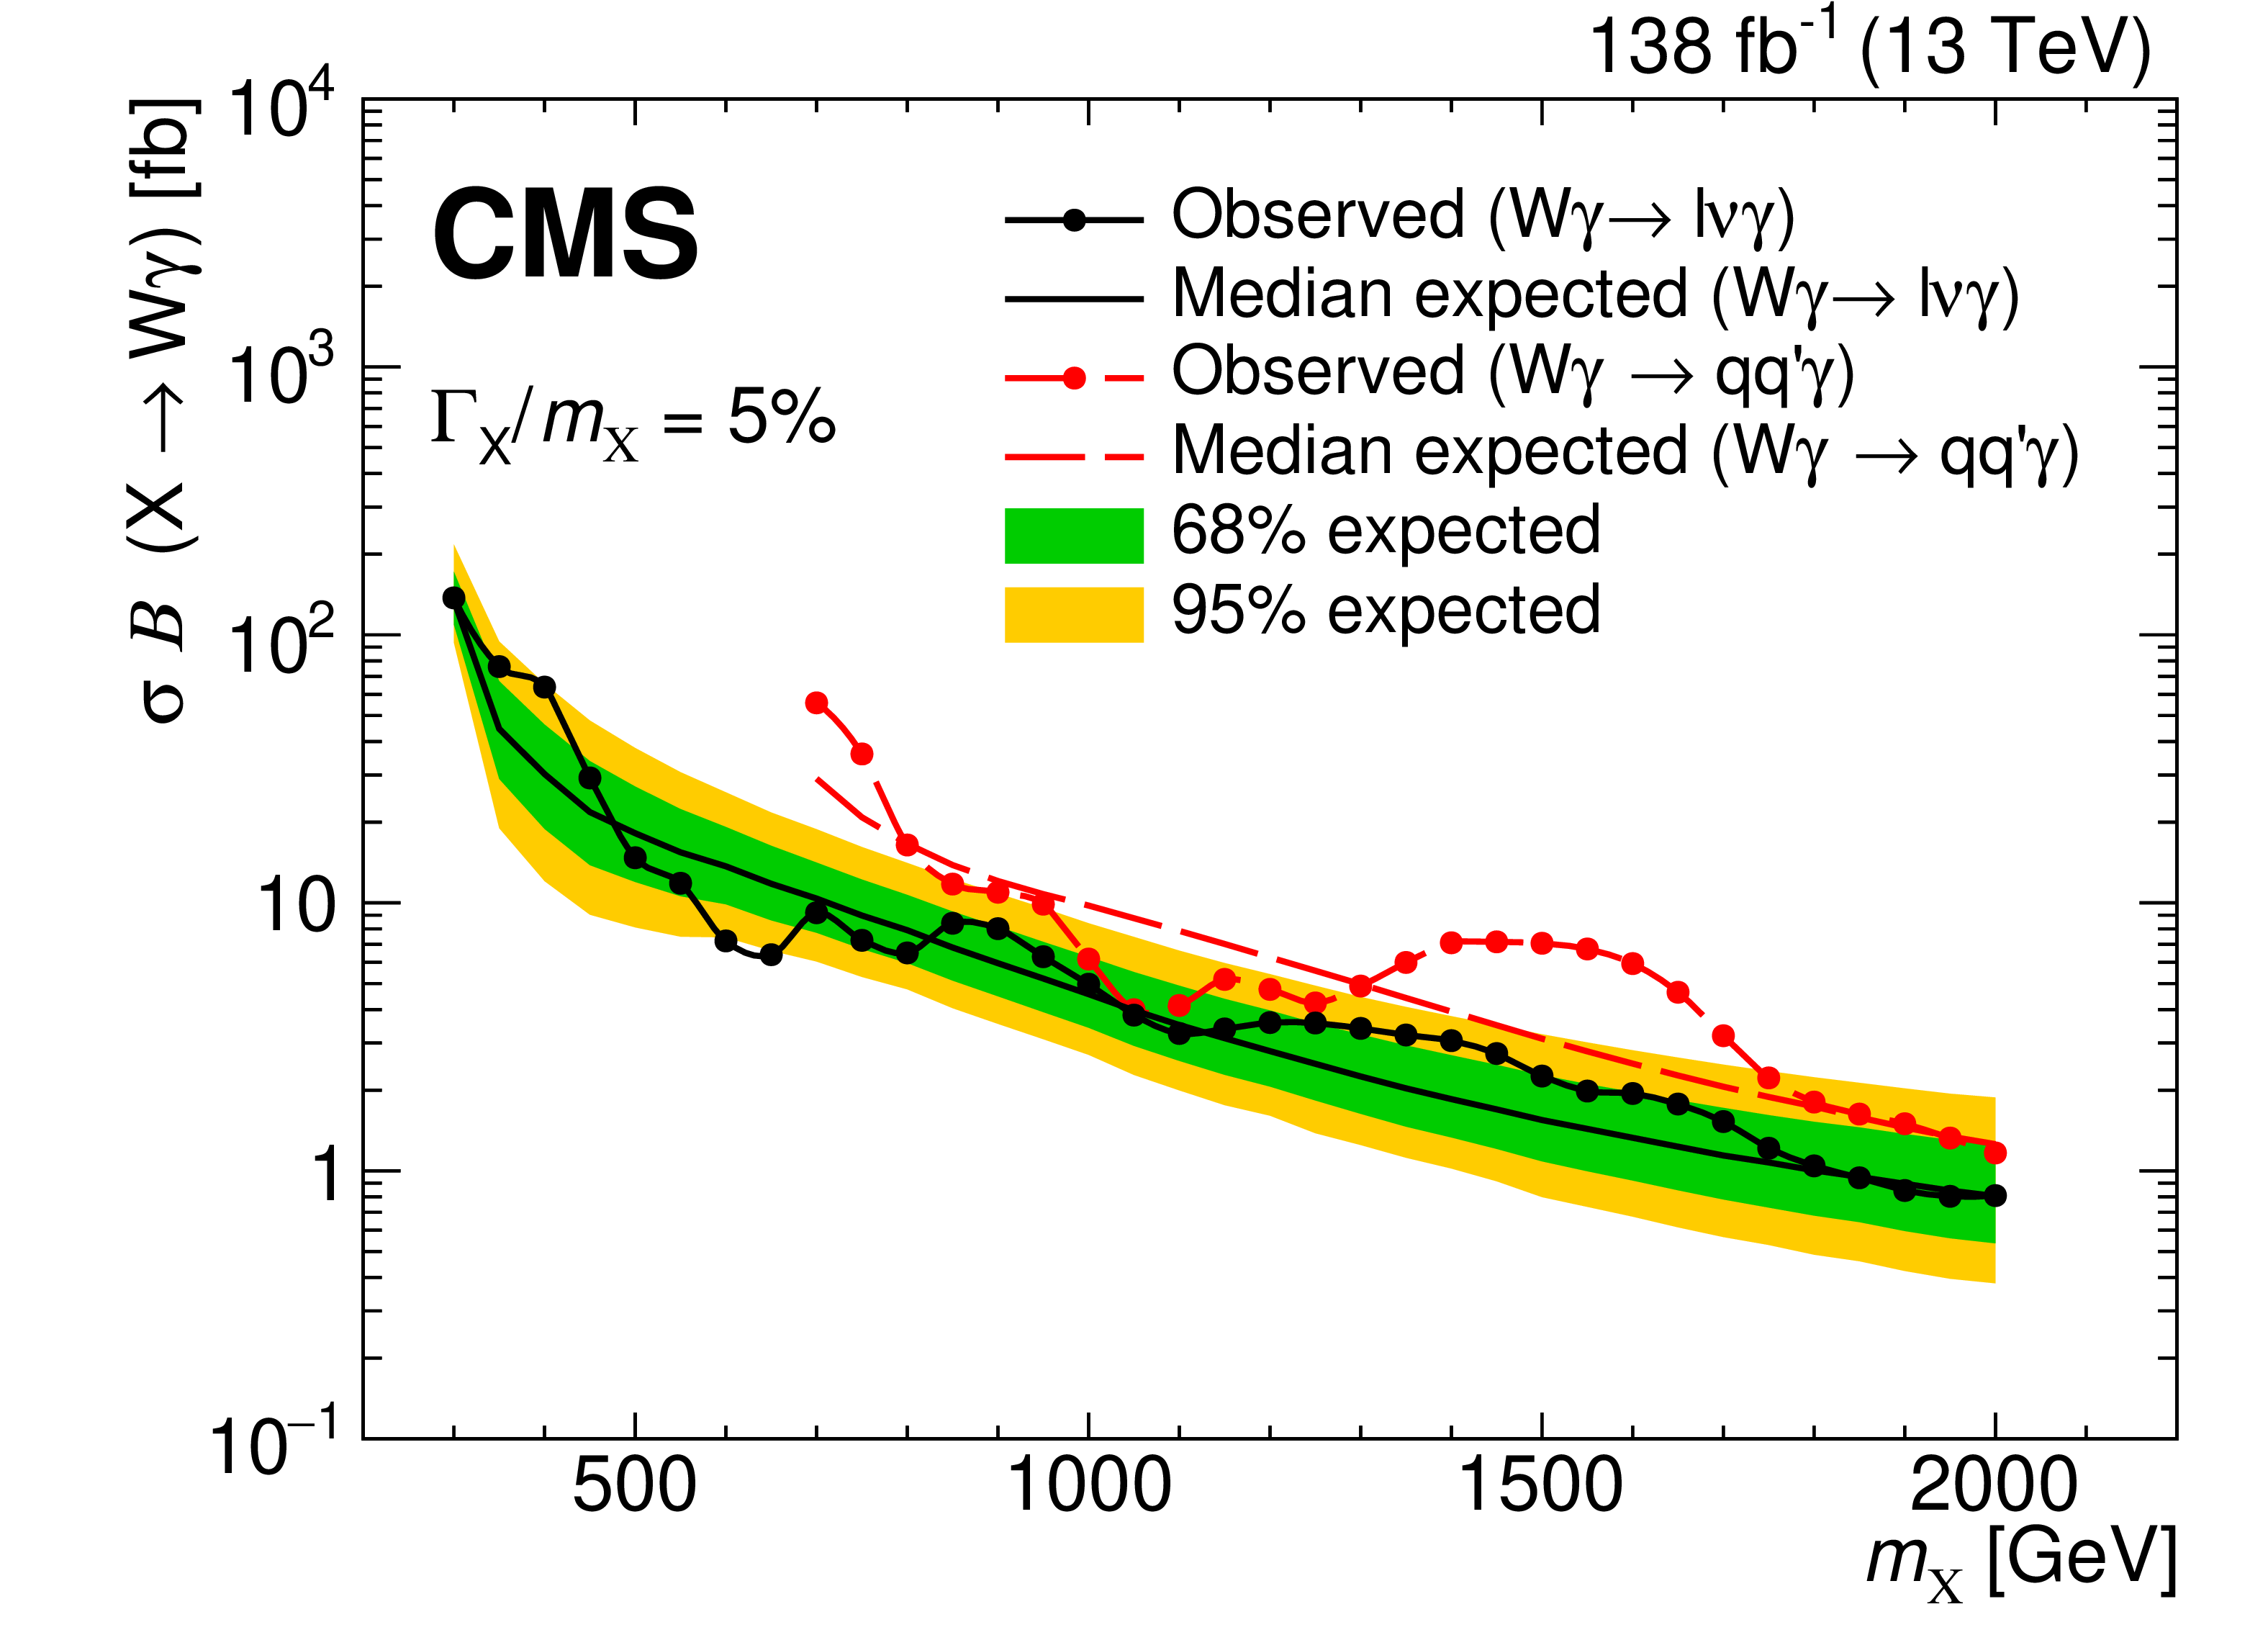
Expected and observed limits at 95% CL on $ \sigma\mathcal{B}(X\to\mathrm{W}\gamma) $ from events with leptonic decays (solid black lines) of the W boson as a function of the X resonant mass. The limits from the hadronic decays (dashed red lines) of the W boson are taken from [7] and included for comparison. The results for the narrow (broad) width assumption are shown on the left (right). |
png pdf |
Figure 7-a:
Expected and observed limits at 95% CL on $ \sigma\mathcal{B}(X\to\mathrm{W}\gamma) $ from events with leptonic decays (solid black lines) of the W boson as a function of the X resonant mass. The limits from the hadronic decays (dashed red lines) of the W boson are taken from [7] and included for comparison. The results for the narrow (broad) width assumption are shown on the left (right). |
png pdf |
Figure 7-b:
Expected and observed limits at 95% CL on $ \sigma\mathcal{B}(X\to\mathrm{W}\gamma) $ from events with leptonic decays (solid black lines) of the W boson as a function of the X resonant mass. The limits from the hadronic decays (dashed red lines) of the W boson are taken from [7] and included for comparison. The results for the narrow (broad) width assumption are shown on the left (right). |
png pdf |
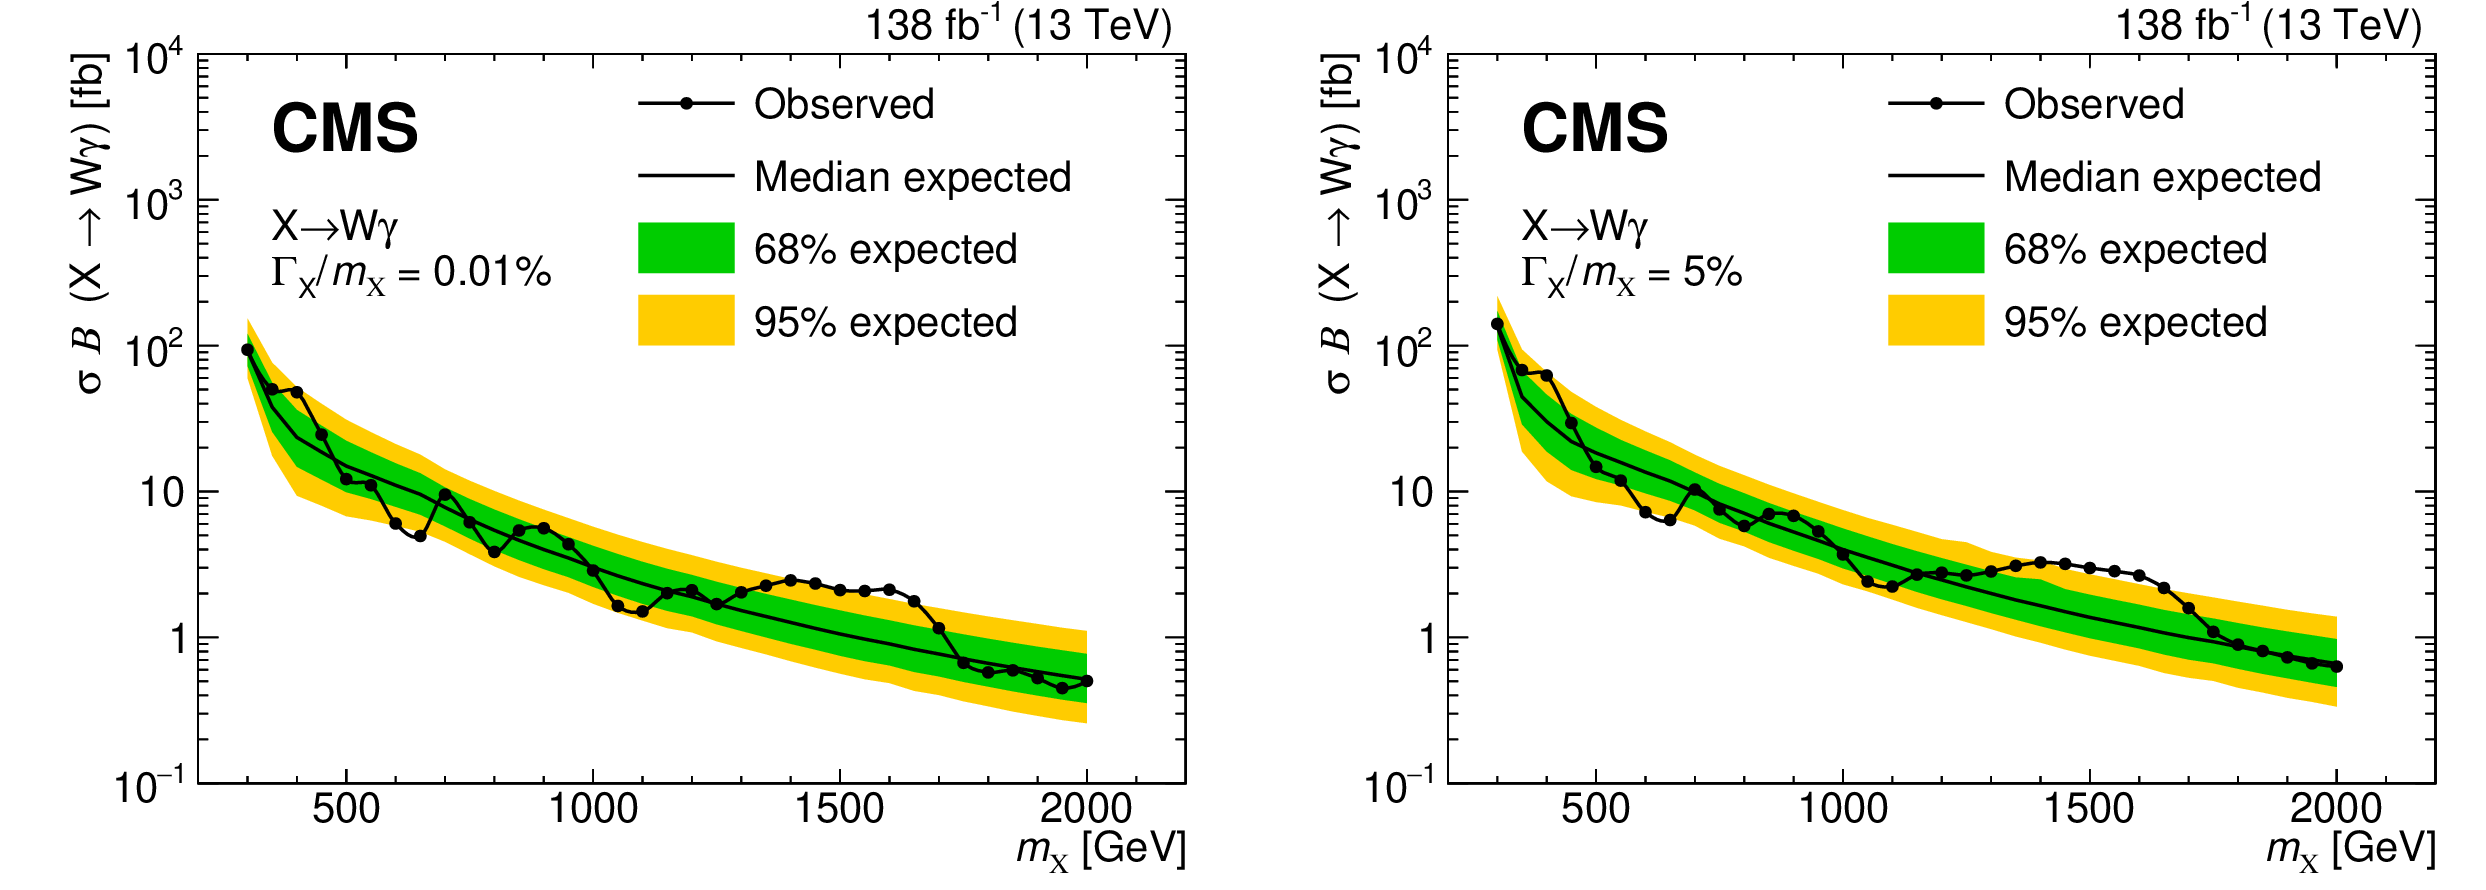
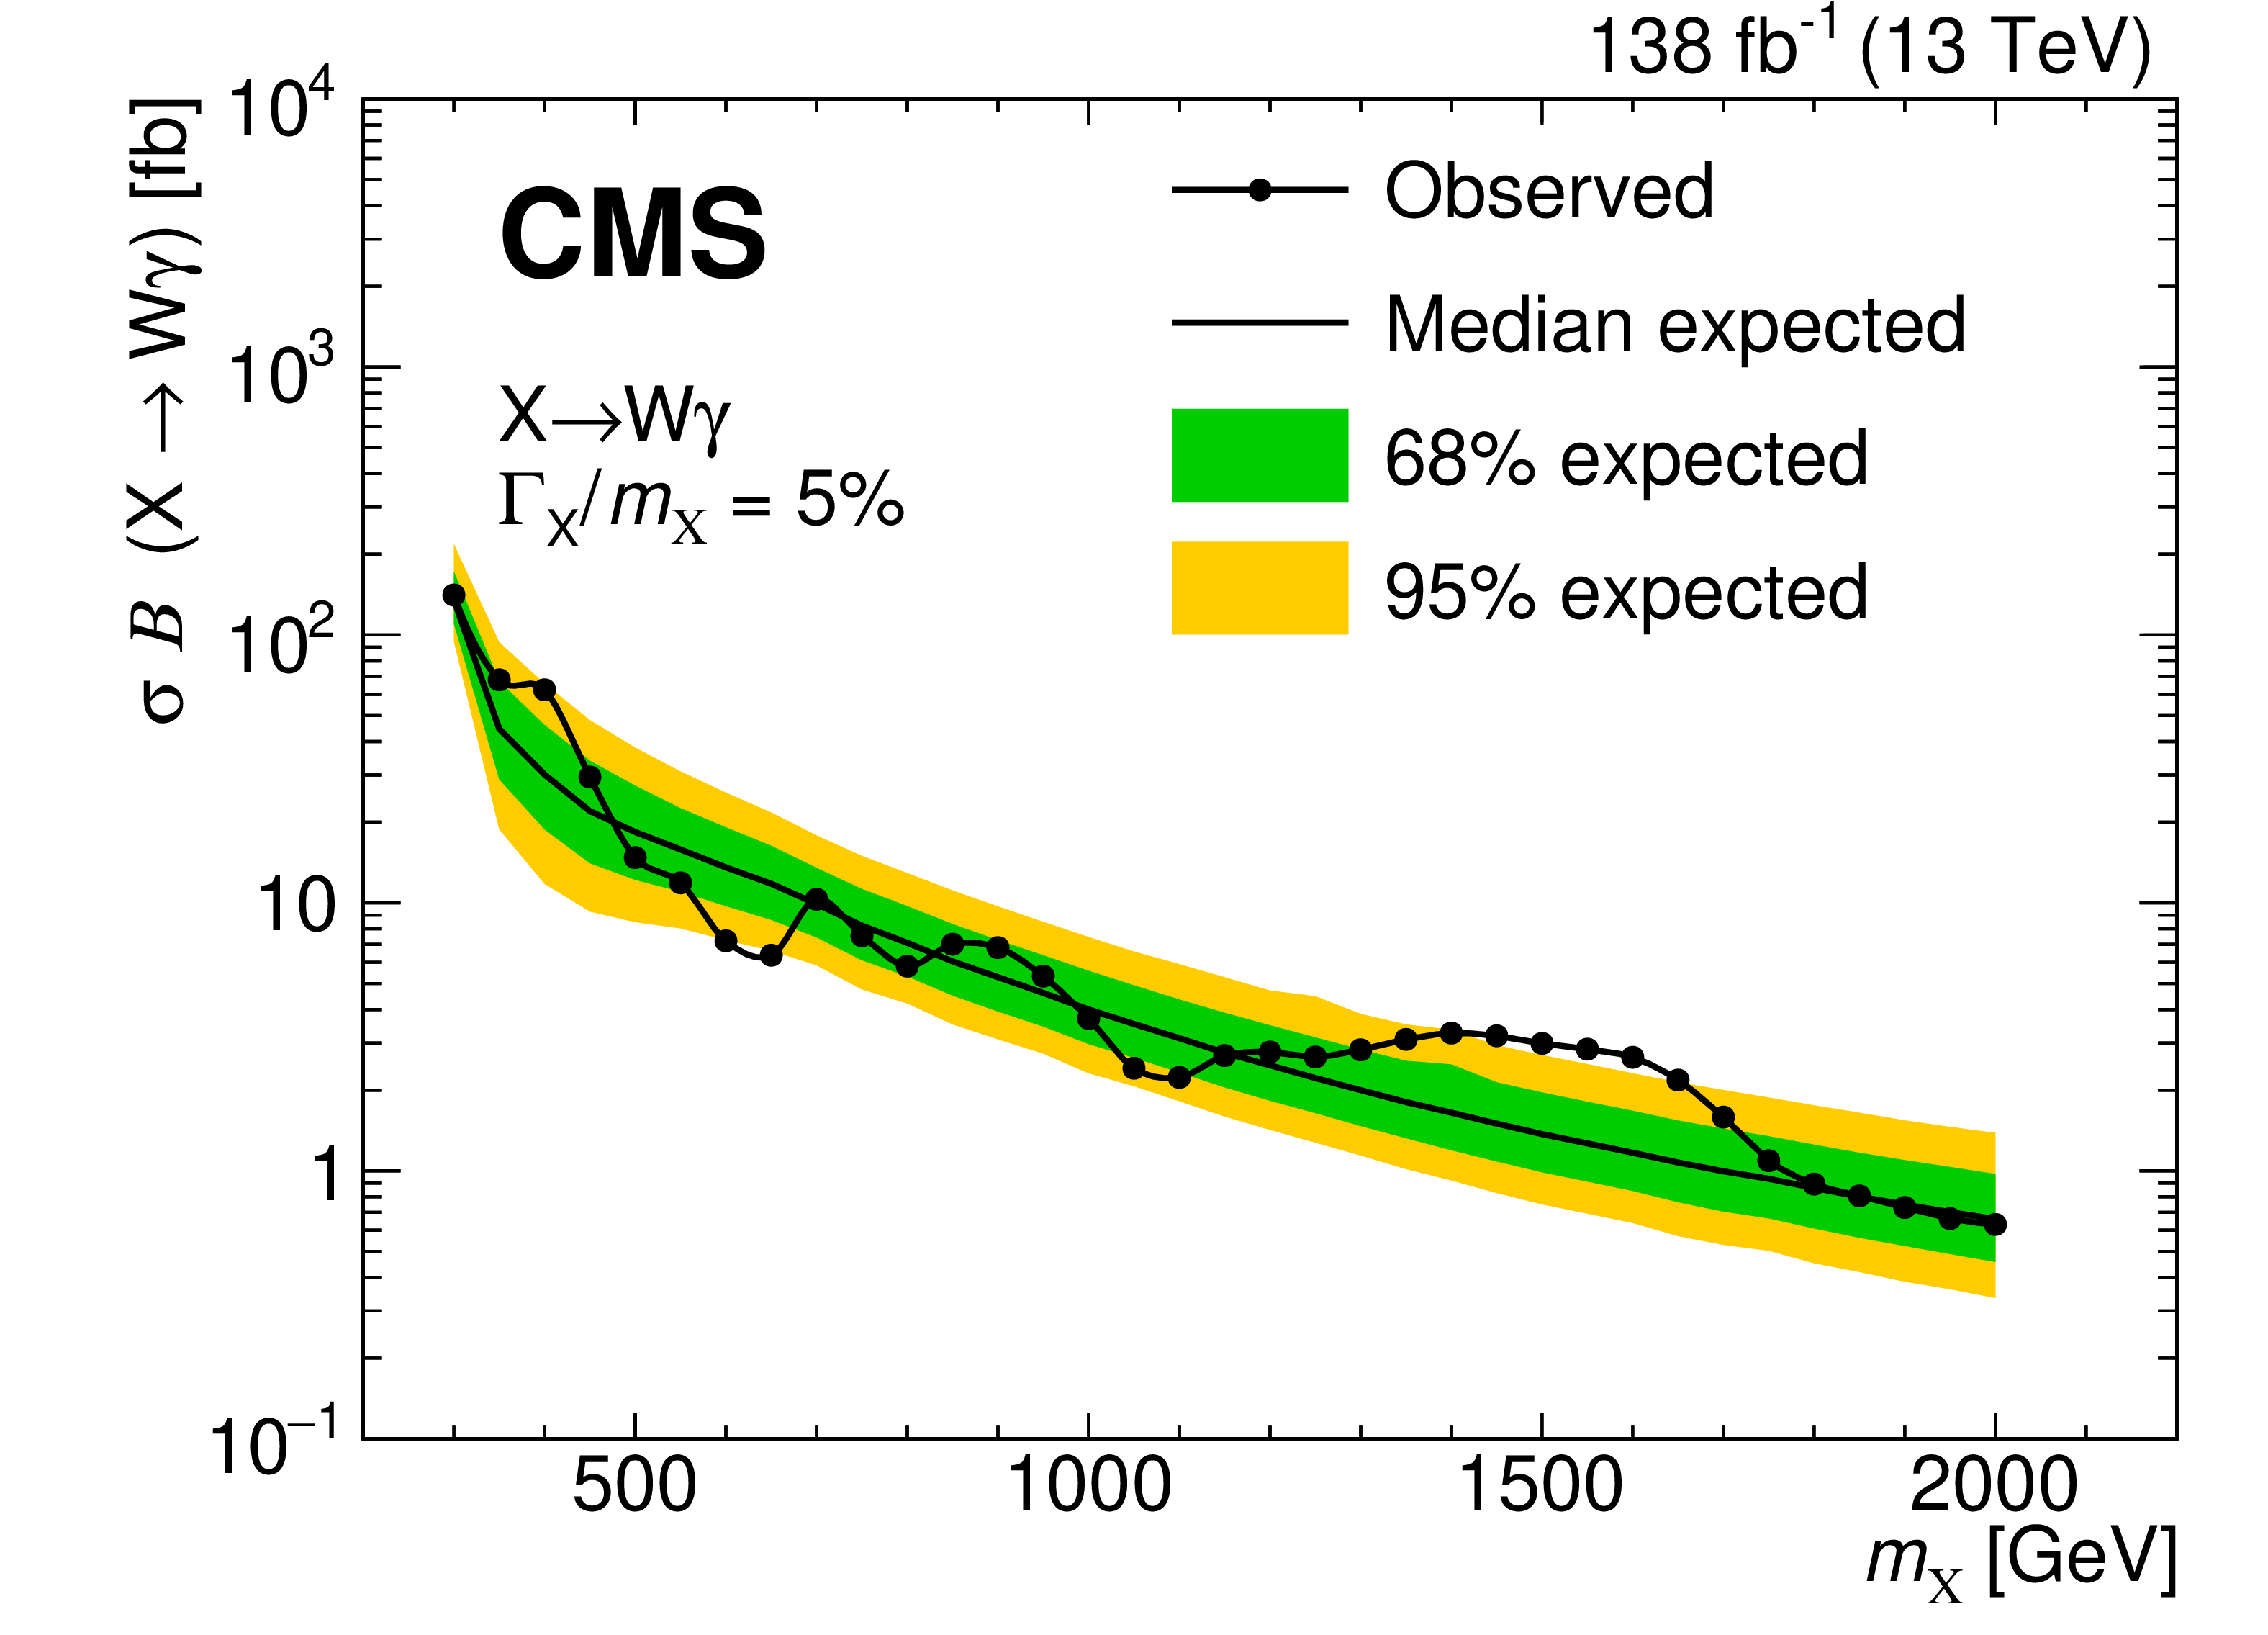
Figure 8:
Expected and observed limits at 95% CL on $ \sigma\mathcal{B}(X\to\mathrm{W}\gamma) $ utilizing both hadronic (from [7]) and leptonic (this analysis) W decays as a function of the X resonant mass. The results for the narrow (broad) width assumption are shown on the left (right). |

png pdf |
Figure 8-a:
Expected and observed limits at 95% CL on $ \sigma\mathcal{B}(X\to\mathrm{W}\gamma) $ utilizing both hadronic (from [7]) and leptonic (this analysis) W decays as a function of the X resonant mass. The results for the narrow (broad) width assumption are shown on the left (right). |
png pdf |
Figure 8-b:
Expected and observed limits at 95% CL on $ \sigma\mathcal{B}(X\to\mathrm{W}\gamma) $ utilizing both hadronic (from [7]) and leptonic (this analysis) W decays as a function of the X resonant mass. The results for the narrow (broad) width assumption are shown on the left (right). |
png pdf |
Figure 9:
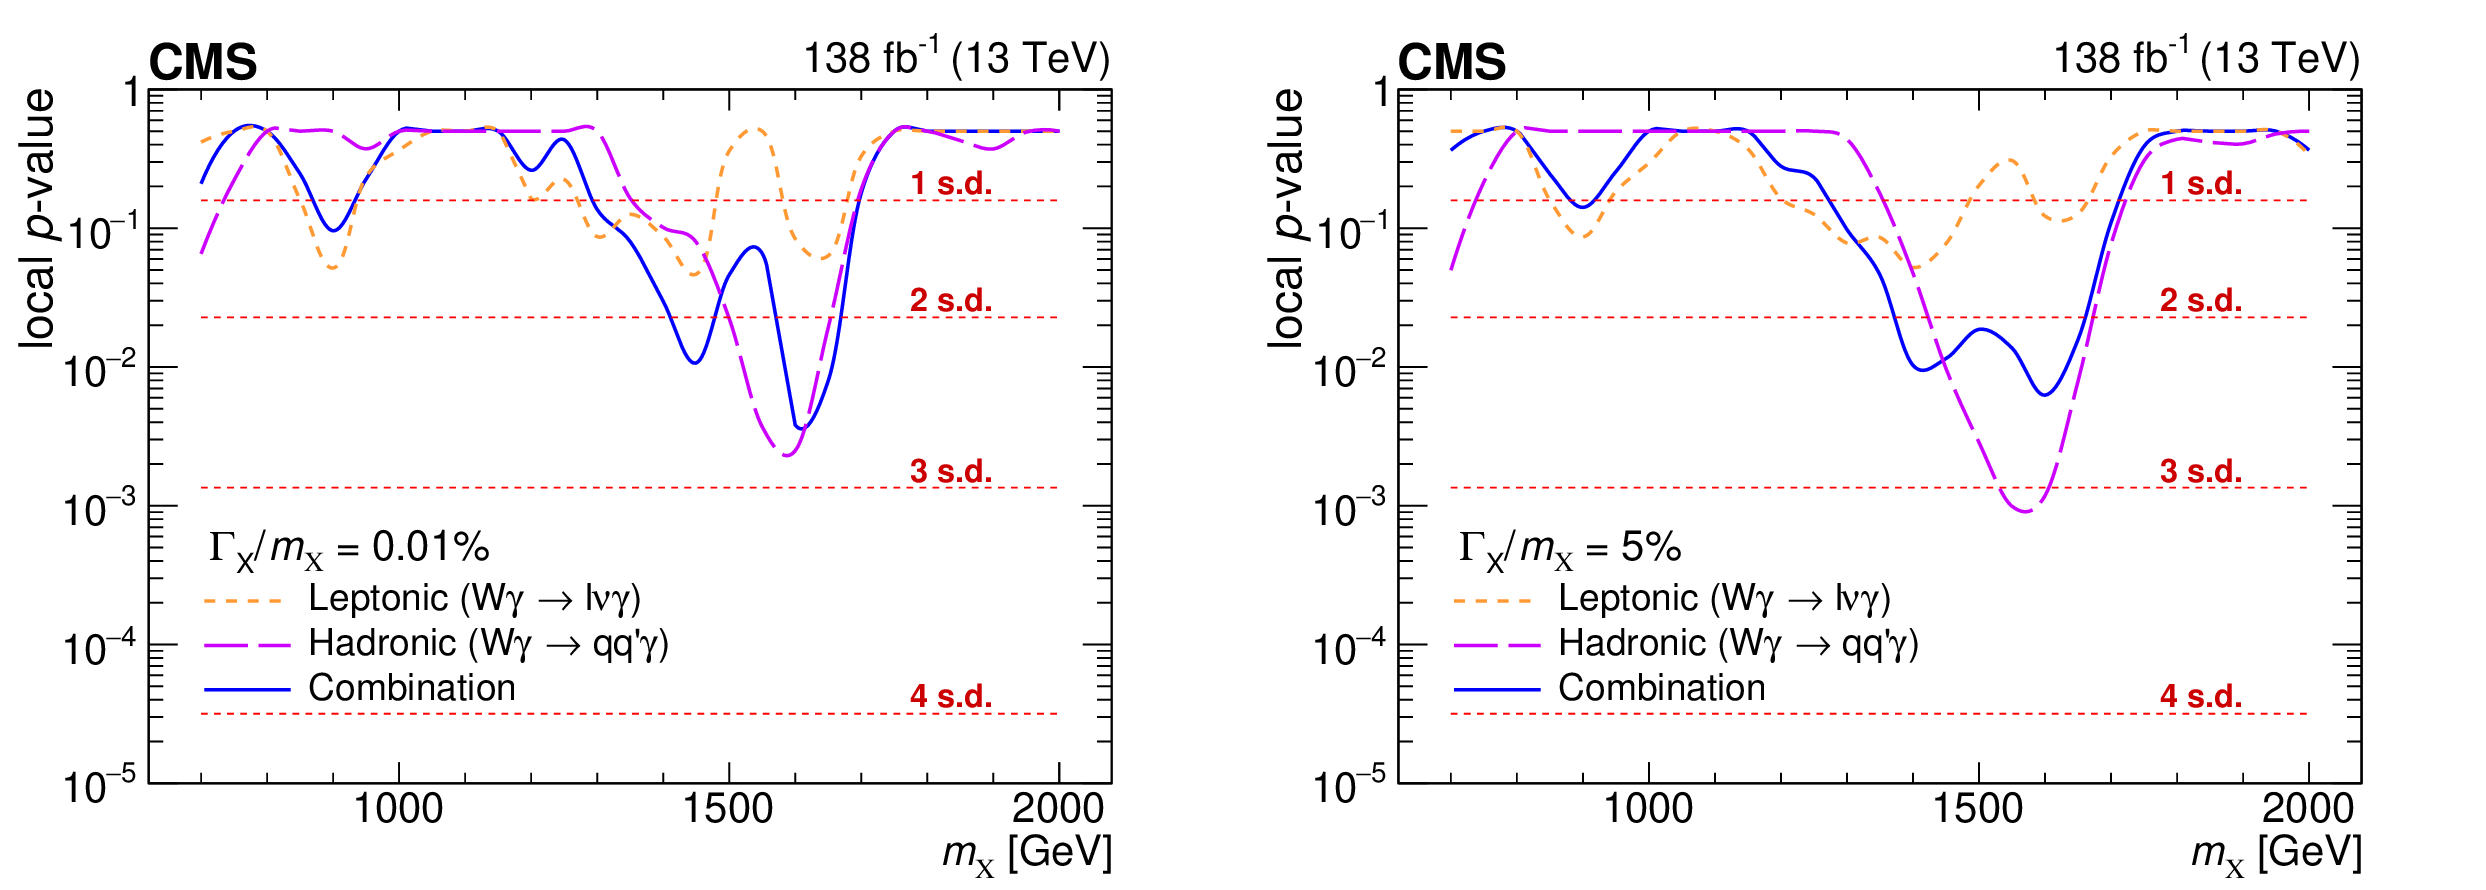
Observed local $ p $-values for narrow (left) and broad (right) resonance width hypotheses with the background-only fit in the hadronic (from [7]) and leptonic (this analysis) channels. The blue line shows the observed local $ \it{p} $-values after their combination. In the hadronic channel (violet line), the largest excess corresponds to a local significance of 2.8 (3.1) standard deviations (s.d.) for narrow (broad) signals. In the leptonic channel (orange line), the largest local significance is 1.7 (1.6) standard deviations. After combining with the leptonic channel, the largest excess is 2.7 (2.5) standard deviations. |

png pdf |
Figure 9-a:
Observed local $ p $-values for narrow (left) and broad (right) resonance width hypotheses with the background-only fit in the hadronic (from [7]) and leptonic (this analysis) channels. The blue line shows the observed local $ \it{p} $-values after their combination. In the hadronic channel (violet line), the largest excess corresponds to a local significance of 2.8 (3.1) standard deviations (s.d.) for narrow (broad) signals. In the leptonic channel (orange line), the largest local significance is 1.7 (1.6) standard deviations. After combining with the leptonic channel, the largest excess is 2.7 (2.5) standard deviations. |
png pdf |
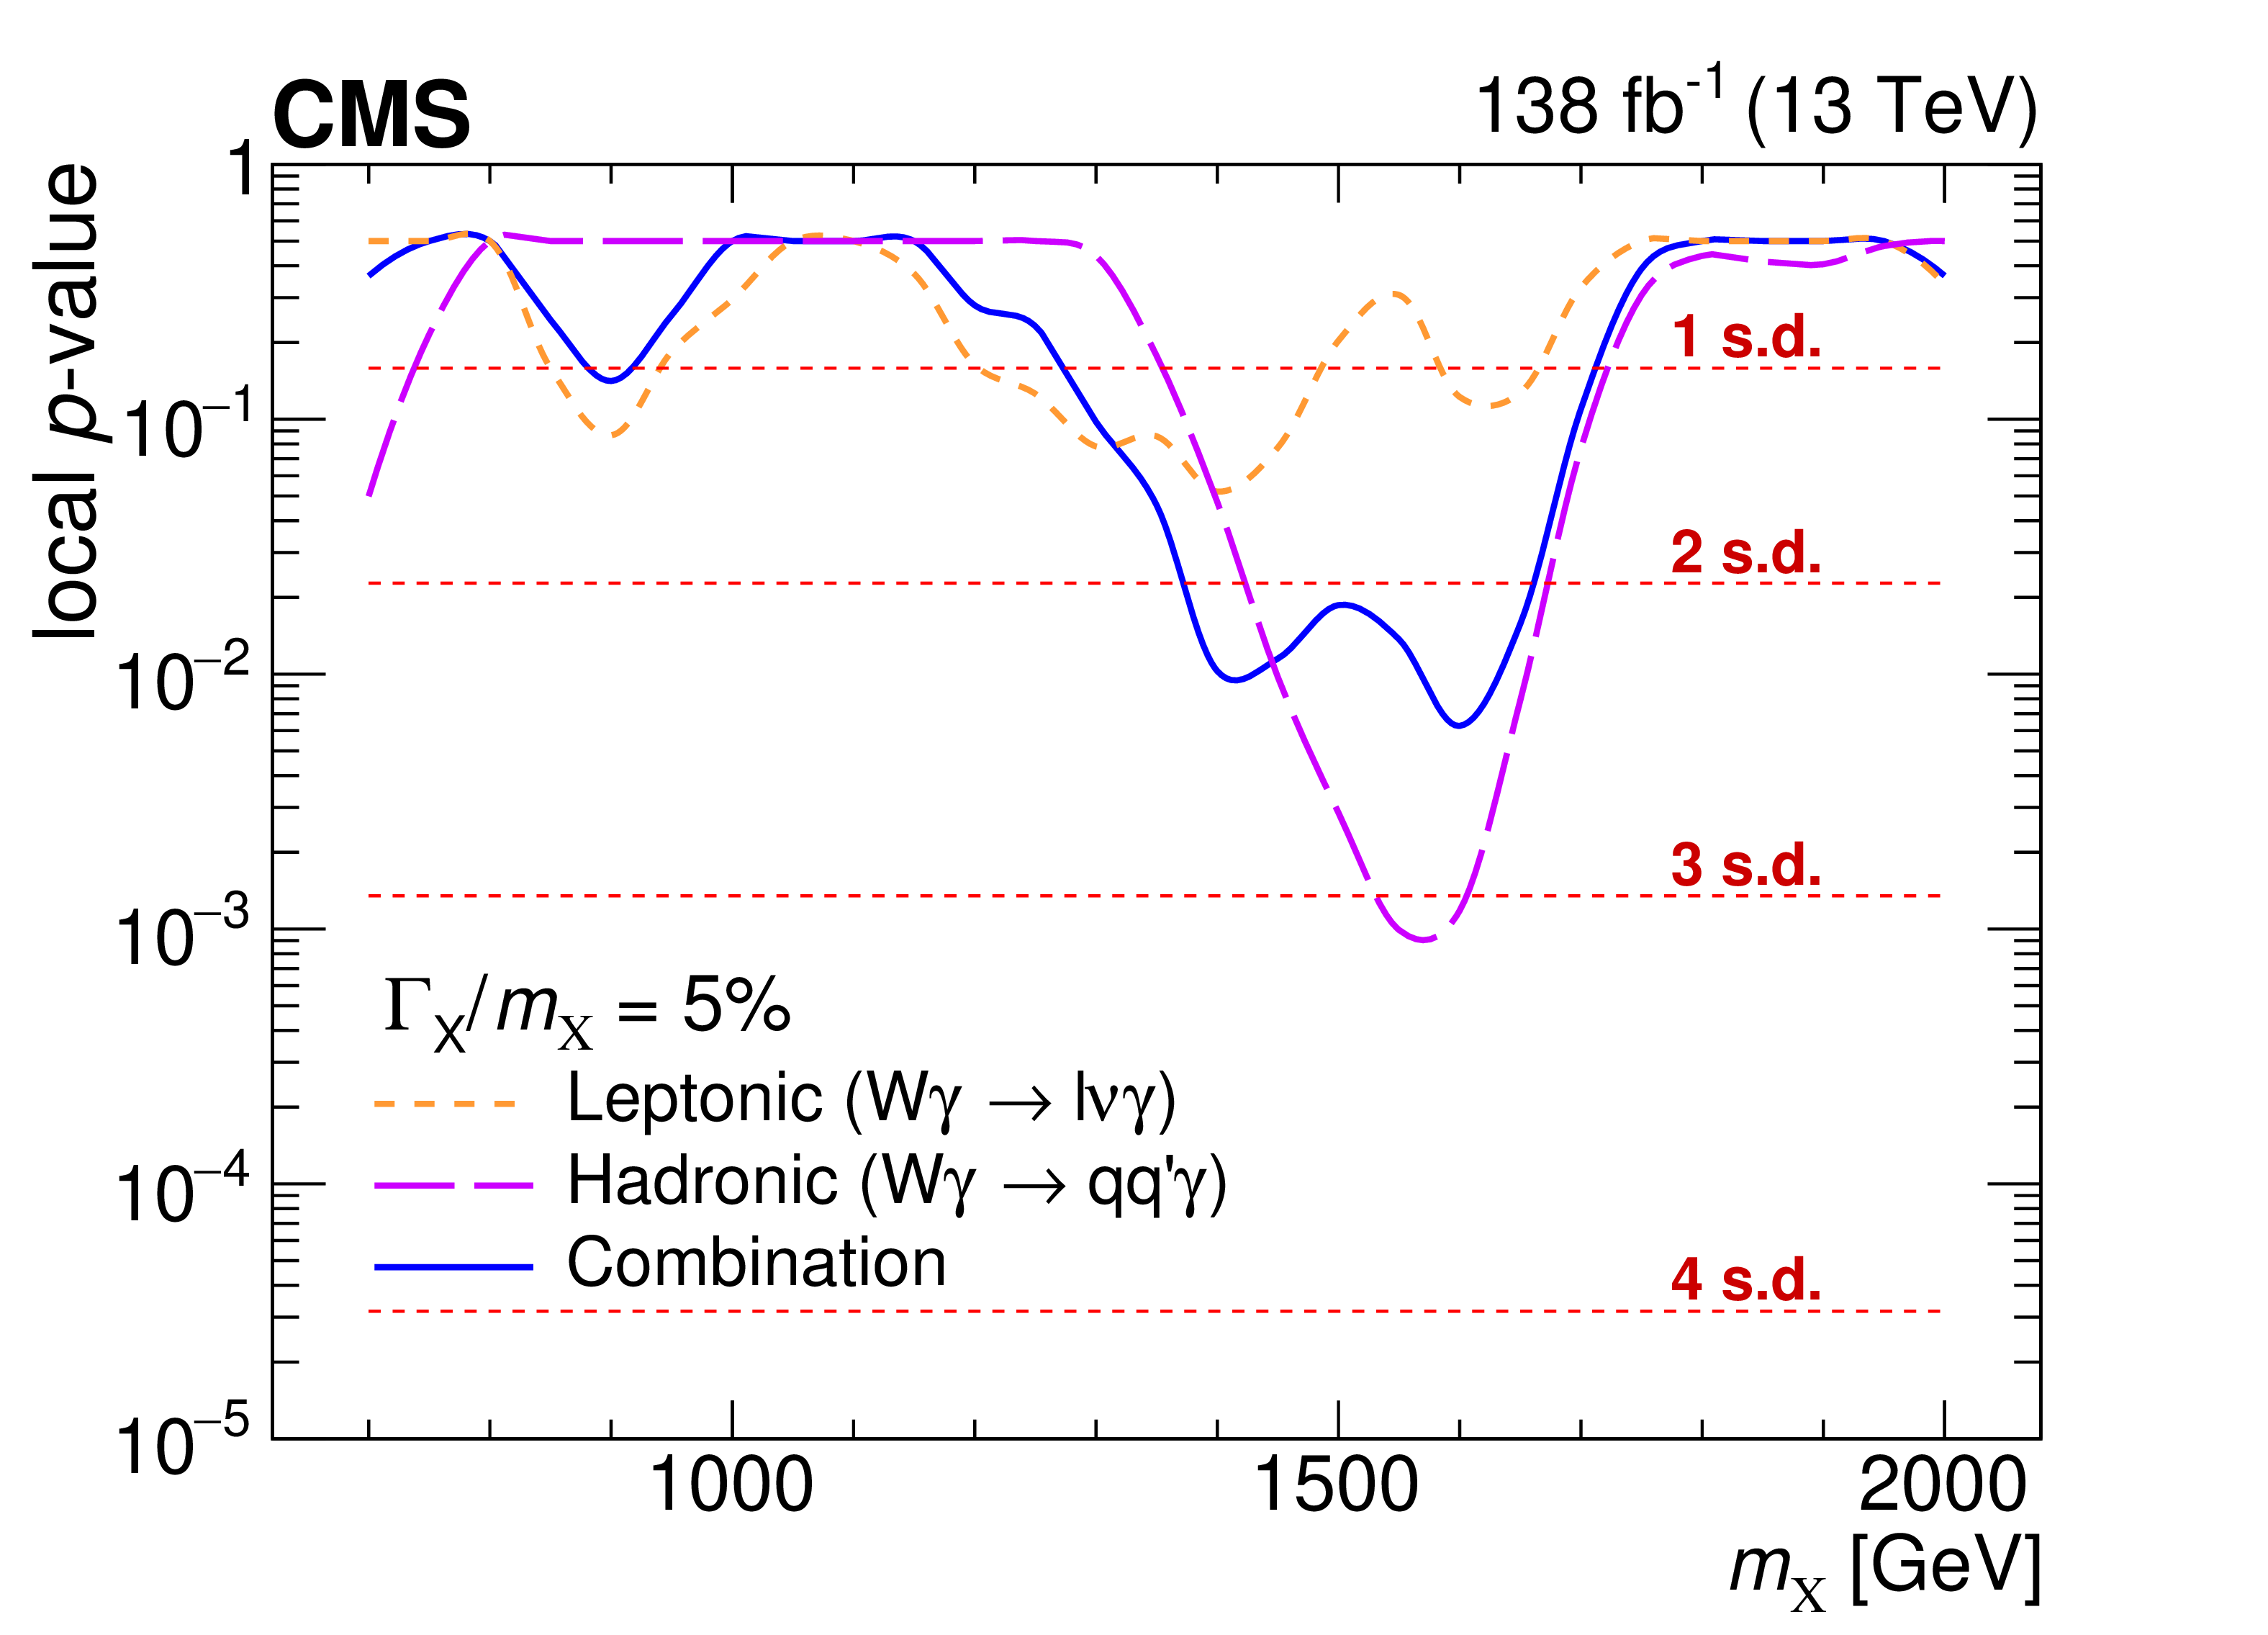
Figure 9-b:
Observed local $ p $-values for narrow (left) and broad (right) resonance width hypotheses with the background-only fit in the hadronic (from [7]) and leptonic (this analysis) channels. The blue line shows the observed local $ \it{p} $-values after their combination. In the hadronic channel (violet line), the largest excess corresponds to a local significance of 2.8 (3.1) standard deviations (s.d.) for narrow (broad) signals. In the leptonic channel (orange line), the largest local significance is 1.7 (1.6) standard deviations. After combining with the leptonic channel, the largest excess is 2.7 (2.5) standard deviations. |
| Tables | |
png pdf |
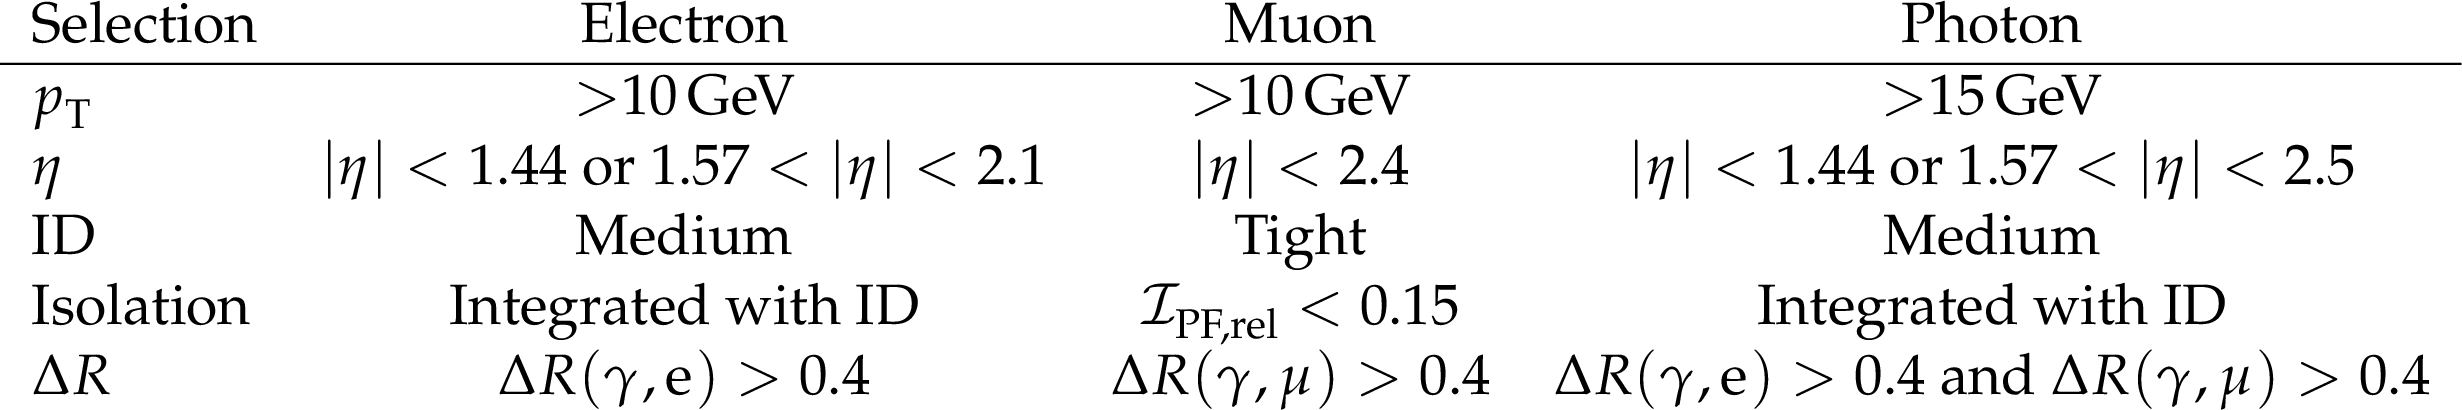
Table 1:
Basic object selection requirements. Definitions are described in more detail in the text. |
png pdf |
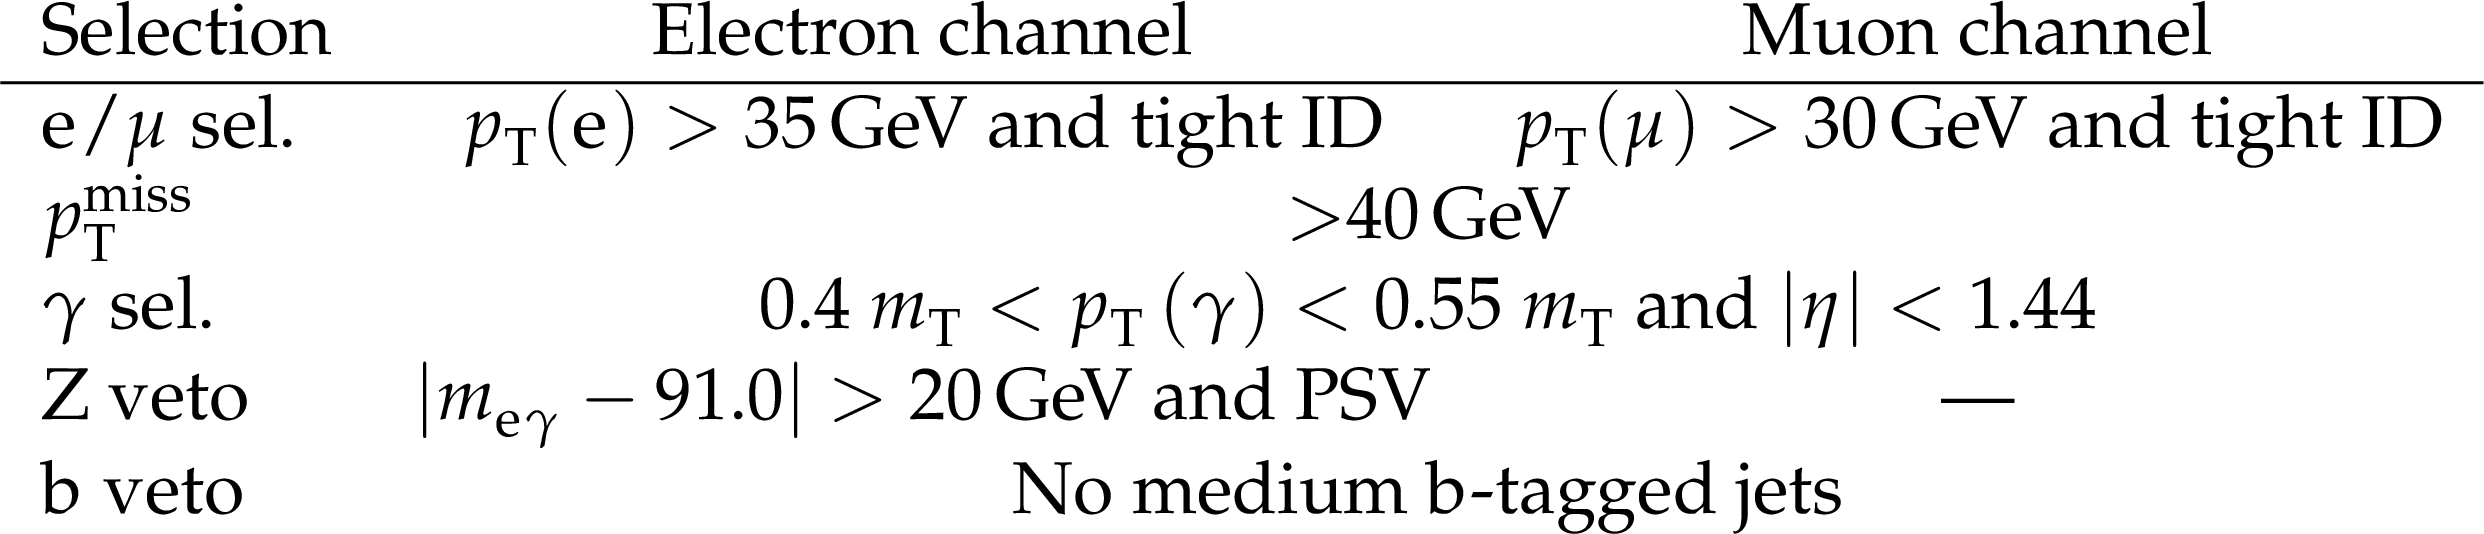
Table 2:
Event selection requirements for the electron and the muon channels. Definitions are described in more detail in the text. |
| Summary |
| This study presents a search for a new particle X decaying into a W boson and a photon with mass hypotheses from 0.3 to 2.0 TeV and X width-to-mass ratio hypotheses of 0.01% (narrow) and 5% (broad). Events with a muon or an electron, large $ p_{\mathrm{T}}^\text{miss} $, and a high-$ p_{\mathrm{T}} $ photon are analyzed. The transverse mass of the lepton, photon, and $ p_{\mathrm{T}}^\text{miss} $ is the primary kinematic observable. The search utilizes proton-proton collision data collected at a center-of-mass energy of 13 TeV with the CMS detector at the LHC throughout 2016--2018, corresponding to an integrated luminosity of 138 fb$ ^{-1} $. This search reveals no statistically significant excess of events above the background. Upper limits at the 95% confidence level on the product of the cross section and branching fraction for W$ \gamma $ resonances are set. These limits span a range from 94 (137) to 0.75 (0.81) fb for the narrow (broad) resonance hypothesis. These findings represent the most stringent constraints to date on the existence of such resonances across the probed mass range. This search complements an earlier study based on the hadronic decay mode of the W boson using the full 13 TeV data sample [7]. By combining searches for both leptonic and hadronic decays of W bosons, the largest local excess seen in the hadronic channel is reduced from 3.1 to 2.5 standard deviations for the broad signal-width hypothesis. The upper limit at the 95% confidence level at 2 TeV is reduced from 0.75 (0.81) to 0.50 (0.63) fb for the narrow (broad) resonance hypothesis. |
| References | ||||
| 1 | N. Arkani-Hamed, R. T. D'Agnolo, M. Low, and D. Pinner | Unification and new particles at the LHC | JHEP 11 (2016) 082 | 1608.01675 |
| 2 | H. E. Logan and Y. Wu | Searching for the $ \mathrm{W}\gamma $ decay of a charged Higgs boson | JHEP 11 (2018) 121 | 1809.09127 |
| 3 | G. Burdman et al. | Colorless top partners, a 125 GeV Higgs boson, and the limits on naturalness | PRD 91 (2015) 055007 | 1411.3310 |
| 4 | ATLAS Collaboration | Search for new resonances in $ \mathrm{W}\gamma $ and $ \mathrm{Z}\gamma $ final states in $ pp $ collisions at $ \sqrt s= $ 8 TeV with the ATLAS detector | PLB 738 (2014) 428 | 1407.8150 |
| 5 | ATLAS Collaboration | Search for heavy resonances decaying to a photon and a hadronically decaying $ \mathrm{Z}/\mathrm{W}/\mathrm{H} $ boson in $ pp $ collisions at $ \sqrt{s}= $ 13 TeV with the ATLAS detector | PRD 98 (2018) 032015 | 1805.01908 |
| 6 | ATLAS Collaboration | Search for high-mass $ \mathrm{W}\gamma $ and $ \mathrm{Z}\gamma $ resonances using hadronic $ \mathrm{W}/\mathrm{Z} $ boson decays from 139 fb$ ^{-1} $ of pp collisions at $ \sqrt{s} $ = 13 TeV with the ATLAS detector | JHEP 07 (2023) 125 | 2304.11962 |
| 7 | CMS Collaboration | Search for $ \mathrm{W}\gamma $ resonances in proton-proton collisions at $ \sqrt{s} = $ 13 TeV using hadronic decays of Lorentz-boosted W bosons | PLB 826 (2022) 136888 | CMS-EXO-20-001 2106.10509 |
| 8 | Particle Data Group , R. L. Workman et al. | Review of Particle Physics | PTEP 2022 (2022) 083C01 | |
| 9 | CMSnoop | HEPData record for this analysis | \href,, 2024 link |
|
| 10 | CMS Collaboration | The CMS experiment at the CERN LHC | JINST 3 (2008) S08004 | |
| 11 | CMS Collaboration | Development of the CMS detector for the CERN LHC Run 3 | Accepted by JINST, 2023 | CMS-PRF-21-001 2309.05466 |
| 12 | CMS Collaboration | The CMS trigger system | JINST 12 (2017) P01020 | CMS-TRG-12-001 1609.02366 |
| 13 | CMS Collaboration | Performance of the CMS level-1 trigger in proton-proton collisions at $ \sqrt{s} = $ 13 TeV | JINST 15 (2020) P10017 | CMS-TRG-17-001 2006.10165 |
| 14 | CMS Collaboration | Electron and photon reconstruction and identification with the CMS experiment at the CERN LHC | JINST 16 (2021) P05014 | CMS-EGM-17-001 2012.06888 |
| 15 | CMS Collaboration | Performance of the CMS muon detector and muon reconstruction with proton-proton collisions at $ \sqrt{s}= $ 13 TeV | JINST 13 (2018) P06015 | CMS-MUO-16-001 1804.04528 |
| 16 | CMS Collaboration | Description and performance of track and primary-vertex reconstruction with the CMS tracker | JINST 9 (2014) P10009 | CMS-TRK-11-001 1405.6569 |
| 17 | CMS Collaboration | Precision luminosity measurement in proton-proton collisions at $ \sqrt{s} = $ 13 TeV in 2015 and 2016 at CMS | EPJC 81 (2021) 800 | CMS-LUM-17-003 2104.01927 |
| 18 | CMS Collaboration | CMS luminosity measurement for the 2017 data-taking period at $ \sqrt{s} $ = 13 TeV | CMS Physics Analysis Summary, 2018 link |
CMS-PAS-LUM-17-004 |
| 19 | CMS Collaboration | CMS luminosity measurement for the 2018 data-taking period at $ \sqrt{s} $ = 13 TeV | CMS Physics Analysis Summary, 2019 link |
CMS-PAS-LUM-18-002 |
| 20 | P. Nason | A new method for combining NLO QCD with shower Monte Carlo algorithms | JHEP 11 (2004) 040 | hep-ph/0409146 |
| 21 | S. Frixione, P. Nason, and C. Oleari | Matching NLO QCD computations with parton shower simulations: the POWHEG method | JHEP 11 (2007) 070 | 0709.2092 |
| 22 | S. Alioli, P. Nason, C. Oleari, and E. Re | A general framework for implementing NLO calculations in shower Monte Carlo programs: the POWHEG \textscbox | JHEP 06 (2010) 043 | 1002.2581 |
| 23 | T. Je \v z o and P. Nason | On the treatment of resonances in next-to-leading order calculations matched to a parton shower | JHEP 12 (2015) 065 | 1509.09071 |
| 24 | J. Alwall et al. | The automated computation of tree-level and next-to-leading order differential cross sections, and their matching to parton shower simulations | JHEP 07 (2014) 079 | 1405.0301 |
| 25 | NNPDF Collaboration | Parton distributions for the LHC Run II | JHEP 04 (2015) 040 | 1410.8849 |
| 26 | NNPDF Collaboration | Parton distributions from high-precision collider data | EPJC 77 (2017) 663 | 1706.00428 |
| 27 | T. Sjöstrand et al. | An introduction to PYTHIA8.2 | Comput. Phys. Commun. 191 (2015) 159 | 1410.3012 |
| 28 | P. Skands, S. Carrazza, and J. Rojo | Tuning PYTHIA 8.1: the Monash 2013 tune | EPJC 74 (2014) 3024 | 1404.5630 |
| 29 | CMS Collaboration | Event generator tunes obtained from underlying event and multiparton scattering measurements | EPJC 76 (2016) 155 | CMS-GEN-14-001 1512.00815 |
| 30 | CMS Collaboration | Extraction and validation of a new set of CMS PYTHIA8 tunes from underlying-event measurements | EPJC 80 (2020) 4 | CMS-GEN-17-001 1903.12179 |
| 31 | GEANT4 Collaboration | GEANT 4---a simulation toolkit | NIM A 506 (2003) 250 | |
| 32 | CMS Collaboration | Measurement of the inelastic proton-proton cross section at $ \sqrt{s}= $ 13 TeV | JHEP 07 (2018) 161 | CMS-FSQ-15-005 1802.02613 |
| 33 | CMS Collaboration | Particle-flow reconstruction and global event description with the CMS detector | JINST 12 (2017) P10003 | CMS-PRF-14-001 1706.04965 |
| 34 | CMS Collaboration | Performance of photon reconstruction and identification with the CMS detector in proton-proton collisions at $ \sqrt{s} = $ 8 TeV | JINST 10 (2015) P08010 | CMS-EGM-14-001 1502.02702 |
| 35 | M. Cacciari, G. P. Salam, and G. Soyez | The anti-$ k_{\mathrm{T}} $ jet clustering algorithm | JHEP 04 (2008) 063 | 0802.1189 |
| 36 | M. Cacciari, G. P. Salam, and G. Soyez | FastJet user manual | EPJC 72 (2012) 1896 | 1111.6097 |
| 37 | E. Bols et al. | Jet flavour classification using DeepJet | JINST 15 (2020) P12012 | 2008.10519 |
| 38 | CMS Collaboration | Performance summary of AK4 jet b tagging with data from proton-proton collisions at 13 TeV with the CMS detector | CMS Detector Performance Note CMS-DP-2023-005, 2023 CDS |
|
| 39 | CMS Collaboration | Performance of missing transverse momentum reconstruction in proton-proton collisions at $ \sqrt{s} = $ 13 TeV using the CMS detector | JINST 14 (2019) P07004 | CMS-JME-17-001 1903.06078 |
| 40 | CMS Collaboration | Technical proposal for the Phase-II upgrade of the Compact Muon Solenoid | CMS Technical Proposal CERN-LHCC-2015-010, CMS-TDR-15-02, 2015 CDS |
|
| 41 | M. J. Oreglia | A study of the reactions $ {\psi^\prime\to\gamma\gamma\psi} $ | PhD thesis, Stanford University, . SLAC-R-236, 1980 link |
|
| 42 | J. E. Gaiser | Charmonium Spectroscopy from Radiative Decays of the $ \mathrm{J}/\psi $ and $ {\psi^\prime} $ | PhD thesis, Stanford University, . SLAC-R-255, 1982 link |
|
| 43 | R. A. Fisher | On the interpretation of $ \chi^{2} $ from contingency tables, and the calculation of P | J. R. Stat. Soc. 85 (1922) 87 | |
| 44 | P. D. Dauncey, M. Kenzie, N. Wardle, and G. J. Davies | Handling uncertainties in background shapes: the discrete profiling method | JINST 10 (2015) P04015 | 1408.6865 |
| 45 | T. Junk | Confidence level computation for combining searches with small statistics | NIM A 434 (1999) 435 | hep-ex/9902006 |
| 46 | A. L. Read | Presentation of search results: the $ \text{CL}_\text{s} $ technique | JPG 28 (2002) 2693 | |
| 47 | ATLAS and CMS Collaborations, and LHC Higgs Combination Group | Procedure for the LHC Higgs boson search combination in Summer 2011 | Technical Report CMS-NOTE-2011-005, ATL-PHYS-PUB-2011-11, 2011 | |
| 48 | G. Cowan, K. Cranmer, E. Gross, and O. Vitells | Asymptotic formulae for likelihood-based tests of new physics | EPJC 71 (2011) 1554 | 1007.1727 |
| 49 | CMS Collaboration | The CMS statistical analysis and combination tool: \textscCombine | Submitted to Comput. Softw. Big Sci, 2024 | CMS-CAT-23-001 2404.06614 |
|
|
Compact Muon Solenoid LHC, CERN |
|

|

|

|

|

|