

Compact Muon Solenoid
LHC, CERN
| CMS-B2G-16-028 ; CERN-EP-2018-019 | ||
| Search for third-generation scalar leptoquarks decaying to a top quark and a $\tau$ lepton at $\sqrt{s} = $ 13 TeV | ||
| CMS Collaboration | ||
| 8 March 2018 | ||
| Eur. Phys. J. C 78 (2018) 707 | ||
| Abstract: A search for pair production of heavy scalar leptoquarks (LQs), each decaying into a top quark and a $\tau$ lepton, is presented. The search considers final states with an electron or a muon, one or two $\tau$ leptons that decayed to hadrons, and additional jets. The data were collected in 2016 in proton-proton collisions at $\sqrt{s} = $ 13 TeV with the CMS detector at the LHC, and correspond to an integrated luminosity of 35.9 fb$^{-1}$. No evidence for pair production of LQs is found. Assuming a branching fraction of unity for the decay $\mathrm{LQ} \to \mathrm{t} \tau$, upper limits on the production cross section are set as a function of LQ mass, excluding masses below 900 GeV at 95% confidence level. These results provide the most stringent limits to date on the production of scalar LQs that decay to a top quark and a $\tau$ lepton. | ||
| Links: e-print arXiv:1803.02864 [hep-ex] (PDF) ; CDS record ; inSPIRE record ; CADI line (restricted) ; | ||
| Figures | |
png pdf |
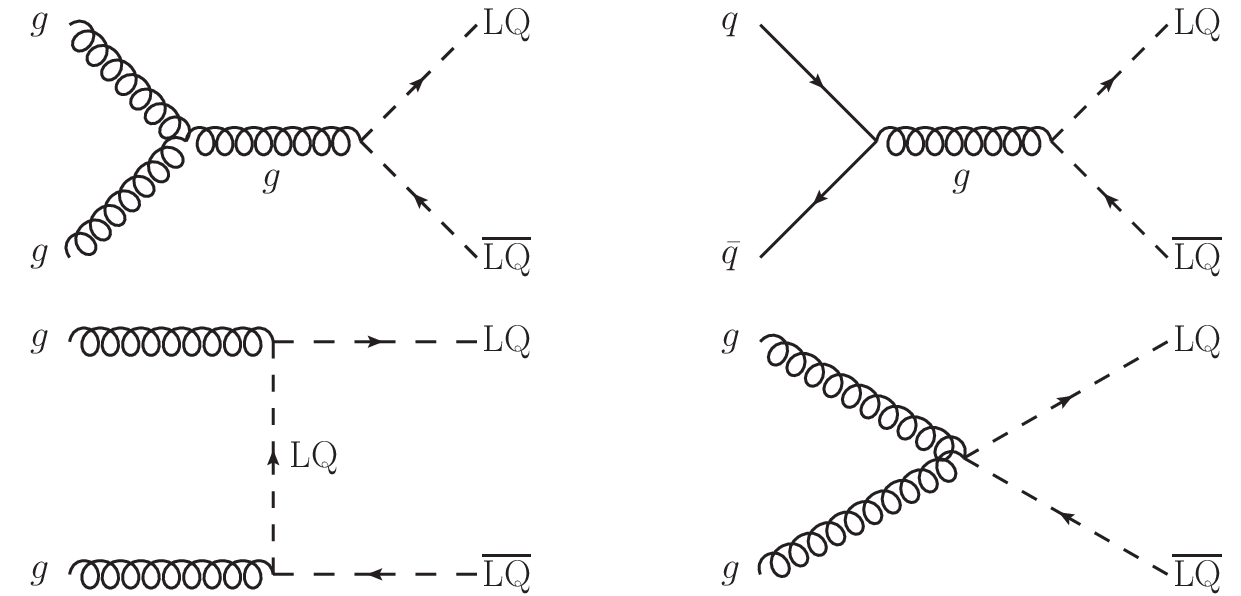
Figure 1:
Dominant leading order Feynman diagrams for the production of leptoquark pairs in proton-proton collisions. |

png pdf |
Figure 1-a:
Dominant leading order Feynman diagram for the production of leptoquark pairs in proton-proton collisions. |
png pdf |
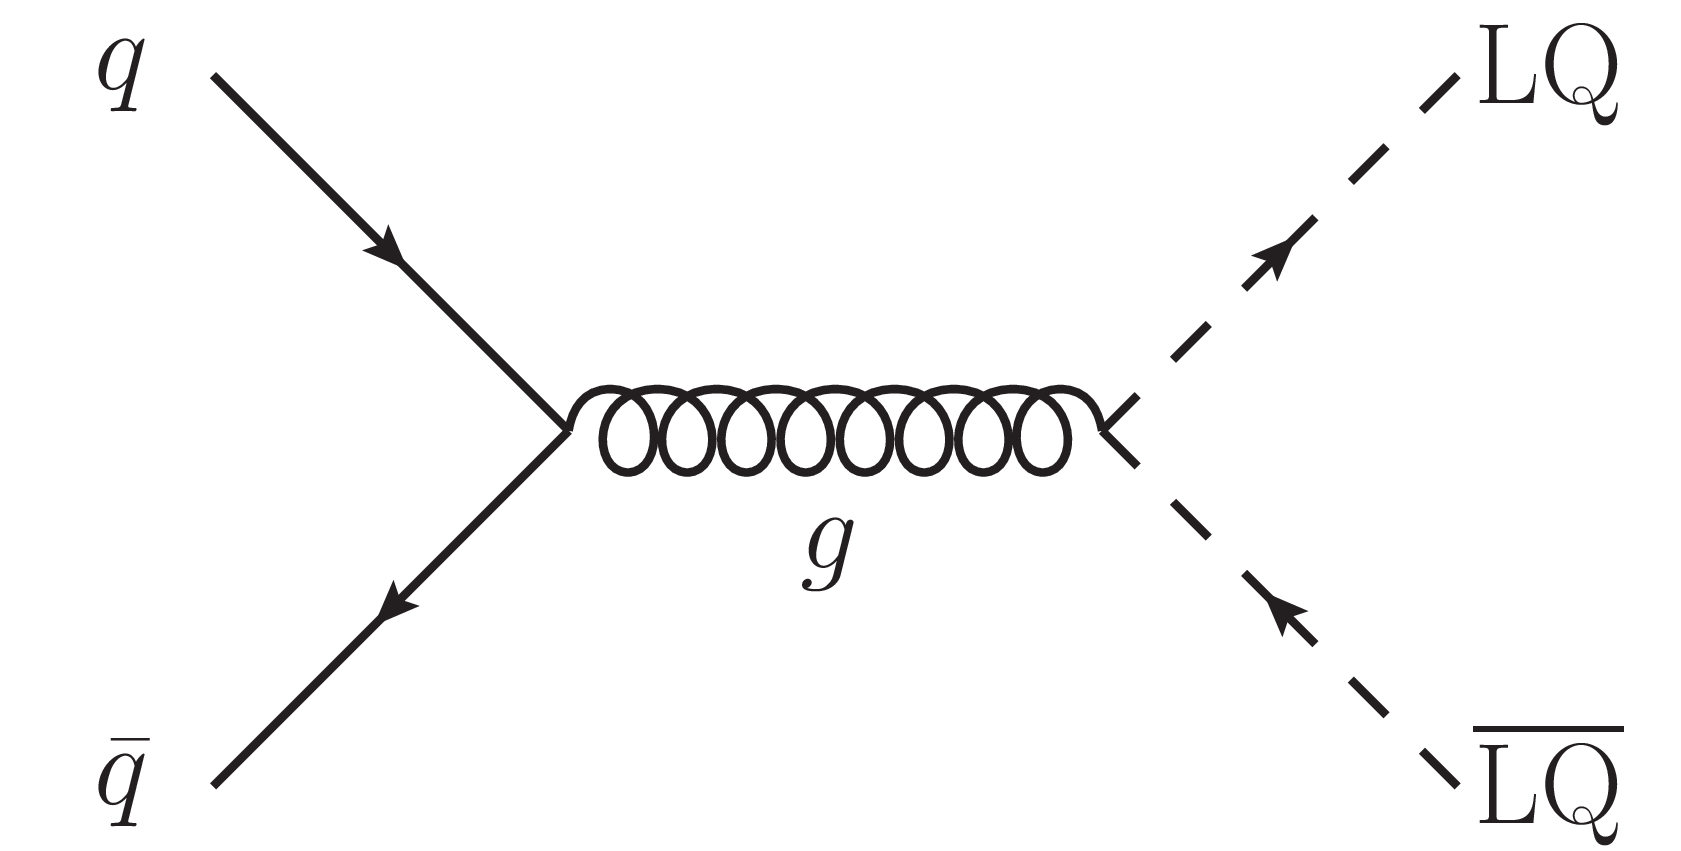
Figure 1-b:
Dominant leading order Feynman diagram for the production of leptoquark pairs in proton-proton collisions. |
png pdf |
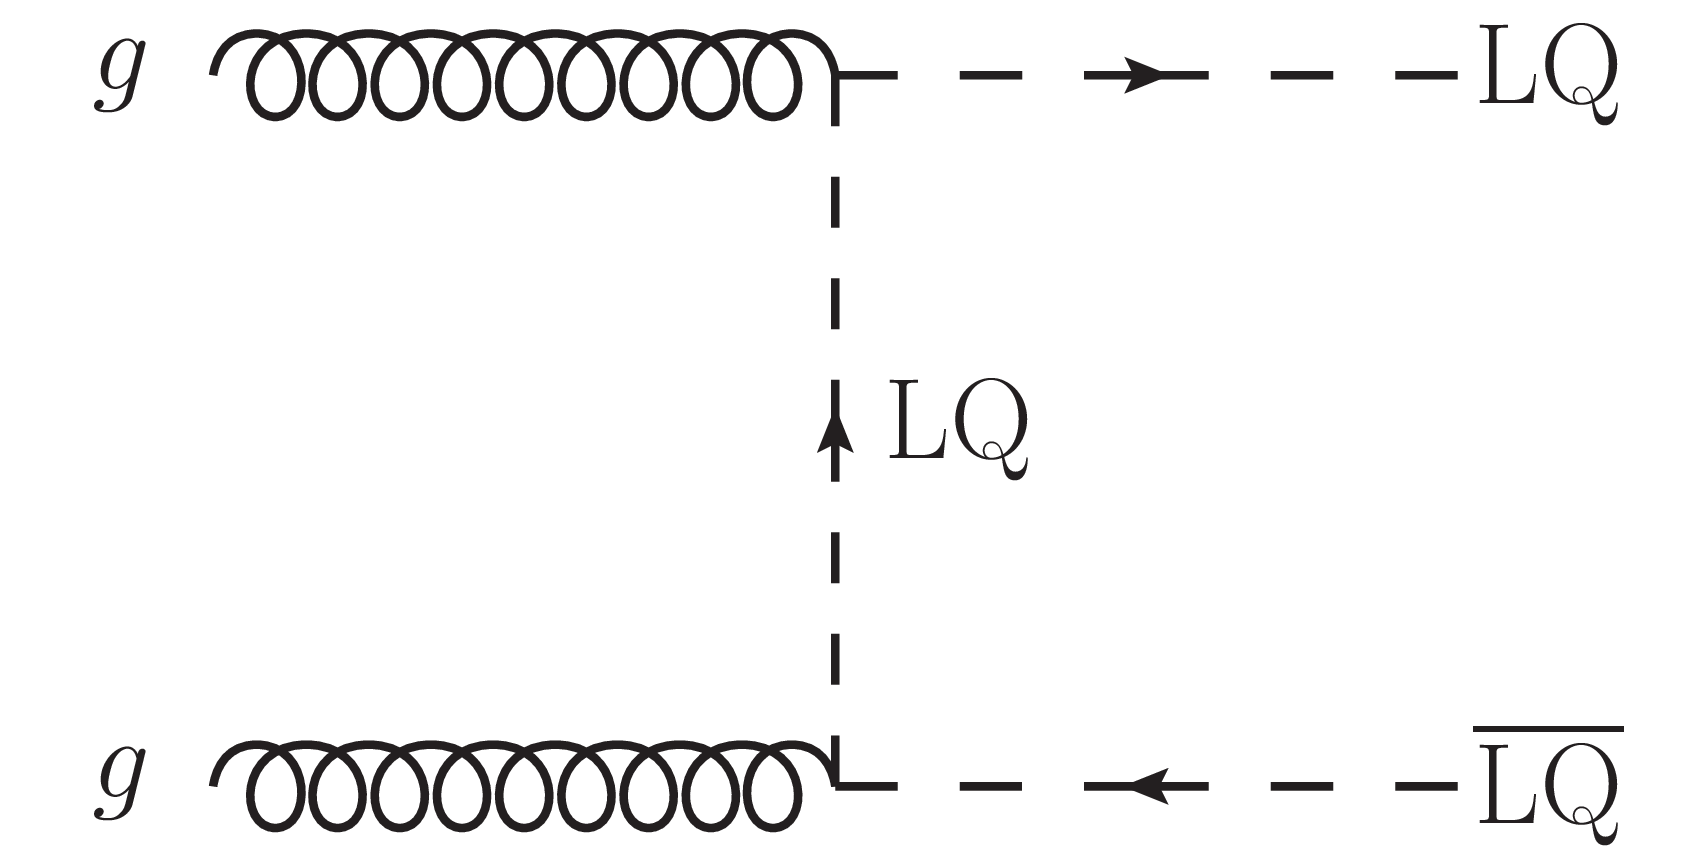
Figure 1-c:
Dominant leading order Feynman diagram for the production of leptoquark pairs in proton-proton collisions. |

png pdf |
Figure 1-d:
Dominant leading order Feynman diagram for the production of leptoquark pairs in proton-proton collisions. |
png pdf |
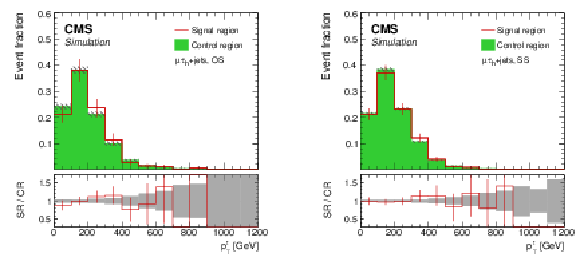
Figure 2:
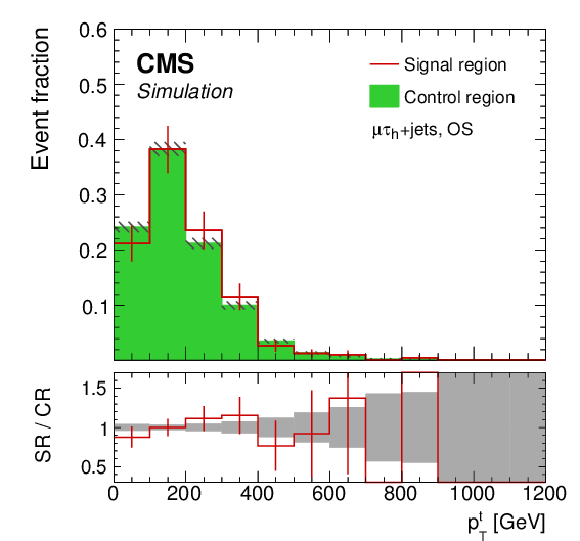
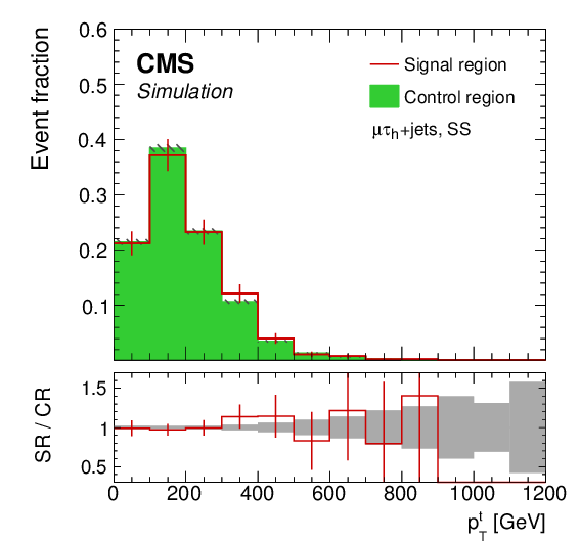
Shape comparison between the signal region A and the corresponding control region, as a function of $ {p_{\mathrm {T}}^{{\mathrm {t}}}} $, for simulated $ {{\mathrm {t}\overline {\mathrm {t}}}} $ and $ {\mathrm {W}}$+jets events. Events with an opposite-sign $\mu {{\tau} _\mathrm {h}} $ pair are shown on the left, while those with a same-sign $\mu {{\tau} _\mathrm {h}} $ pair are shown on the right. The full selection is applied and the $ {S_{\mathrm {T}}} $ categories are combined. All histograms are normalized to the total number of entries. Uncertainties of the signal region and control region are indicated by red error bars and gray hatched areas, respectively. The gray band in the ratio plot corresponds to the statistical uncertainty in the simulated samples. |
png pdf |
Figure 2-a:
Shape comparison between the signal region A and the corresponding control region, as a function of $ {p_{\mathrm {T}}^{{\mathrm {t}}}} $, for simulated $ {{\mathrm {t}\overline {\mathrm {t}}}} $ and $ {\mathrm {W}}$+jets events. Events with an opposite-sign $\mu {{\tau} _\mathrm {h}} $ pair are shown. The full selection is applied and the $ {S_{\mathrm {T}}} $ categories are combined. Histograms are normalized to the total number of entries. Uncertainties of the signal region and control region are indicated by red error bars and gray hatched areas, respectively. The gray band in the ratio plot corresponds to the statistical uncertainty in the simulated samples. |
png pdf |
Figure 2-b:
Shape comparison between the signal region A and the corresponding control region, as a function of $ {p_{\mathrm {T}}^{{\mathrm {t}}}} $, for simulated $ {{\mathrm {t}\overline {\mathrm {t}}}} $ and $ {\mathrm {W}}$+jets events. Events with a same-sign $\mu {{\tau} _\mathrm {h}} $ pair are shown. The full selection is applied and the $ {S_{\mathrm {T}}} $ categories are combined. Histograms are normalized to the total number of entries. Uncertainties of the signal region and control region are indicated by red error bars and gray hatched areas, respectively. The gray band in the ratio plot corresponds to the statistical uncertainty in the simulated samples. |
png pdf |
Figure 3:
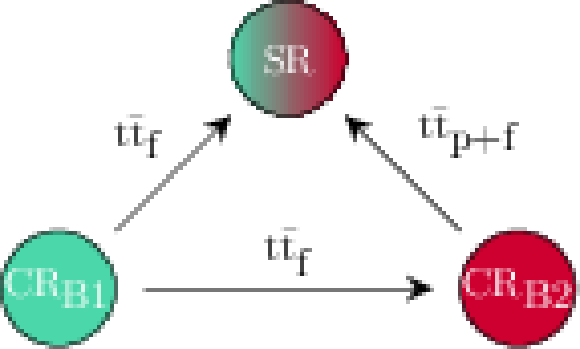
Strategy for the background estimation in category B. The $ {{{\mathrm {t}\overline {\mathrm {t}}}} _{\mathrm {f}}} $ background in the signal region is derived from the control region ${\mathrm {CR}_{\mathrm {B1}}}$. The $ {{{\mathrm {t}\overline {\mathrm {t}}}} _{\mathrm {p+f}}} $ background in the signal region is derived from the control region ${\mathrm {CR}_{\mathrm {B2}}}$. To obtain an estimate of the $ {{{\mathrm {t}\overline {\mathrm {t}}}} _{\mathrm {f}}} $ background in the control region ${\mathrm {CR}_{\mathrm {B2}}}$, the control region ${\mathrm {CR}_{\mathrm {B1}}}$ is used. |
png pdf |
Figure 4:
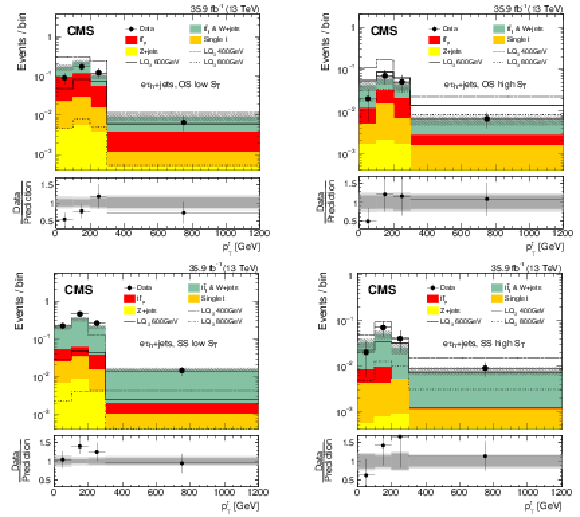
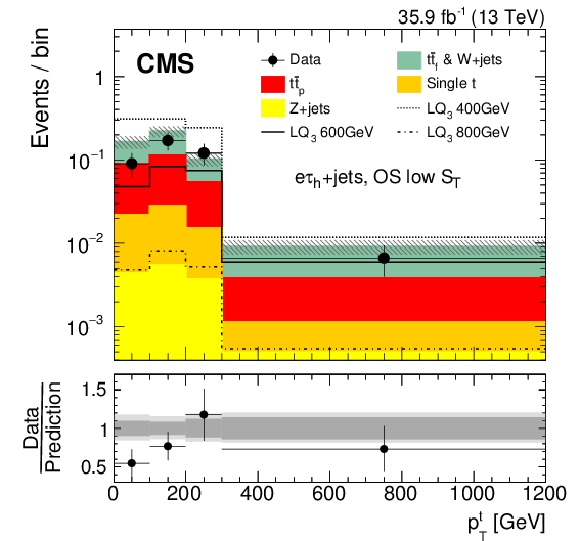
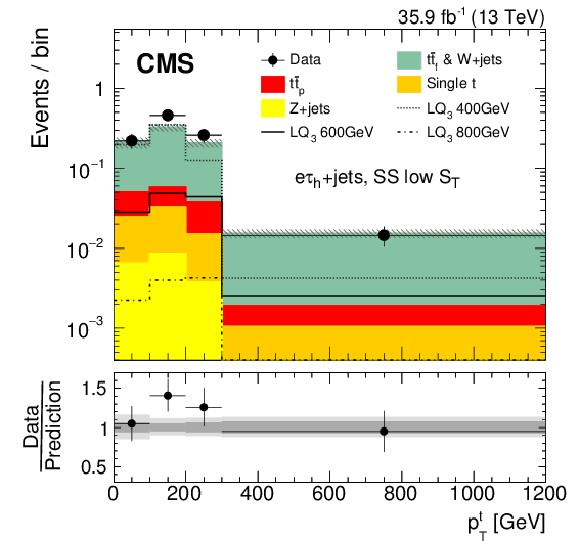
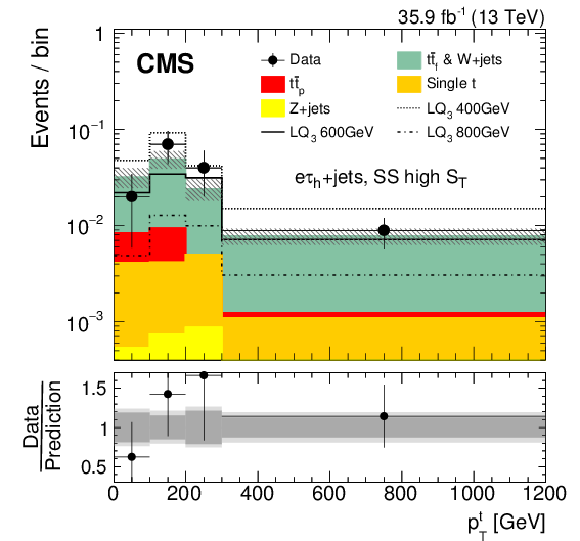
Distributions of $ {p_{\mathrm {T}}^{{\mathrm {t}}}} $ for events in the electron channel passing the full selection in category A. The events are separated into OS (upper), SS (lower), low $ {S_{\mathrm {T}}} $ (left) and high $ {S_{\mathrm {T}}} $ (right) categories. The hatched areas represent the total uncertainties of the SM background. In the bottom panel, the ratio of data to SM background is shown together with statistical (dark gray) and total (light gray) uncertainties of the total SM background. |
png pdf |
Figure 4-a:
Distribution of $ {p_{\mathrm {T}}^{{\mathrm {t}}}} $ for events in the electron channel passing the full selection in category A, in the OS category. The hatched areas represent the total uncertainties of the SM background. In the bottom panel, the ratio of data to SM background is shown together with statistical (dark gray) and total (light gray) uncertainties of the total SM background. |

png pdf |
Figure 4-b:
Distribution of $ {p_{\mathrm {T}}^{{\mathrm {t}}}} $ for events in the electron channel passing the full selection in category A, in the SS category. The hatched areas represent the total uncertainties of the SM background. In the bottom panel, the ratio of data to SM background is shown together with statistical (dark gray) and total (light gray) uncertainties of the total SM background. |
png pdf |
Figure 4-c:
Distribution of $ {p_{\mathrm {T}}^{{\mathrm {t}}}} $ for events in the electron channel passing the full selection in category A, in the low $ {S_{\mathrm {T}}} $ category. The hatched areas represent the total uncertainties of the SM background. In the bottom panel, the ratio of data to SM background is shown together with statistical (dark gray) and total (light gray) uncertainties of the total SM background. |
png pdf |
Figure 4-d:
Distribution of $ {p_{\mathrm {T}}^{{\mathrm {t}}}} $ for events in the electron channel passing the full selection in category A, in the high $ {S_{\mathrm {T}}} $ category. The hatched areas represent the total uncertainties of the SM background. In the bottom panel, the ratio of data to SM background is shown together with statistical (dark gray) and total (light gray) uncertainties of the total SM background. |
png pdf |
Figure 5:
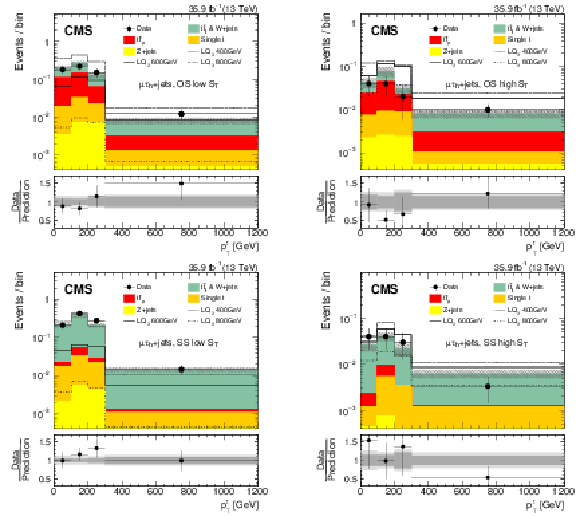
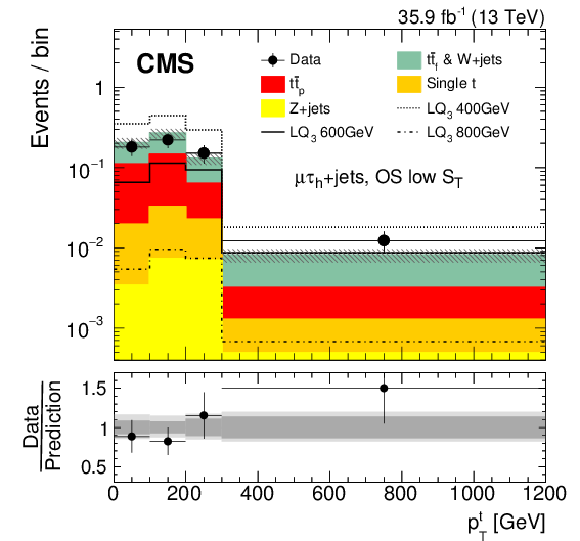
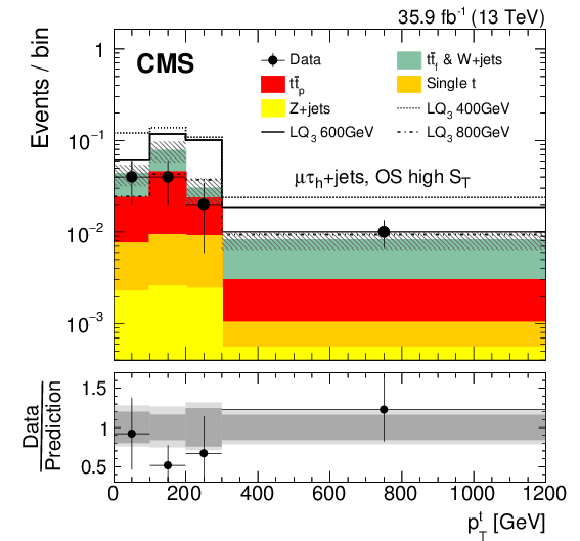
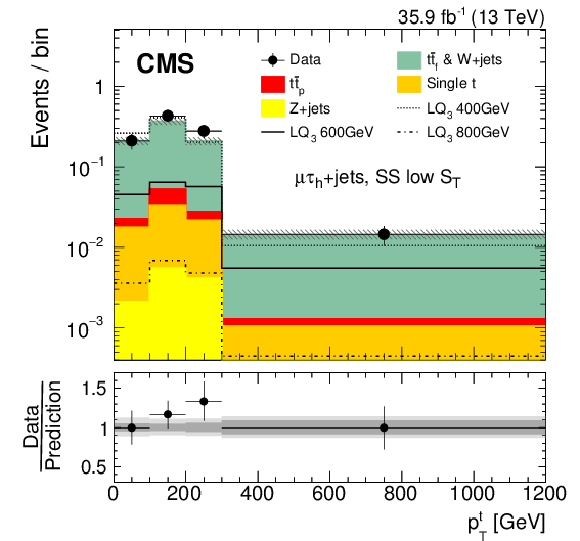
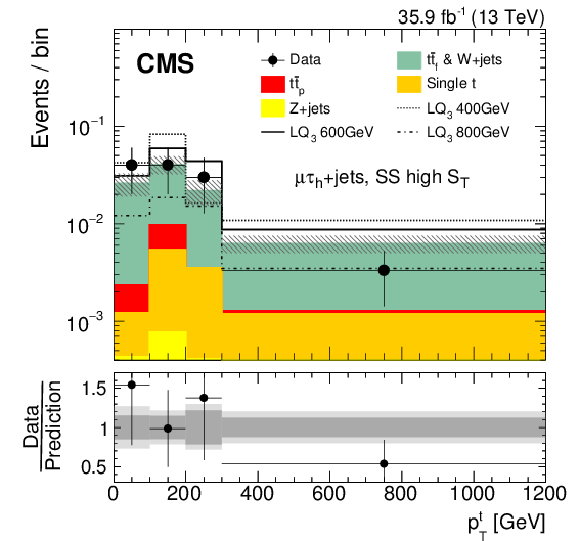
Distributions of $ {p_{\mathrm {T}}^{{\mathrm {t}}}} $ for events in the muon channel passing the full selection in category A. The events are separated into OS (upper), SS (lower), low $ {S_{\mathrm {T}}} $ (left) and high $ {S_{\mathrm {T}}} $ (right) categories. The hatched areas represent the total uncertainties of the SM background. In the bottom panel, the ratio of data to SM background is shown together with statistical (dark gray) and total (light gray) uncertainties of the total SM background. |
png pdf |
Figure 5-a:
Distribution of $ {p_{\mathrm {T}}^{{\mathrm {t}}}} $ for events in the muon channel passing the full selection in category A, in the OS category. The hatched areas represent the total uncertainties of the SM background. In the bottom panel, the ratio of data to SM background is shown together with statistical (dark gray) and total (light gray) uncertainties of the total SM background. |
png pdf |
Figure 5-b:
Distribution of $ {p_{\mathrm {T}}^{{\mathrm {t}}}} $ for events in the muon channel passing the full selection in category A, in the SS category. The hatched areas represent the total uncertainties of the SM background. In the bottom panel, the ratio of data to SM background is shown together with statistical (dark gray) and total (light gray) uncertainties of the total SM background. |
png pdf |
Figure 5-c:
Distribution of $ {p_{\mathrm {T}}^{{\mathrm {t}}}} $ for events in the muon channel passing the full selection in category A, in the low $ {S_{\mathrm {T}}} $ category. The hatched areas represent the total uncertainties of the SM background. In the bottom panel, the ratio of data to SM background is shown together with statistical (dark gray) and total (light gray) uncertainties of the total SM background. |
png pdf |
Figure 5-d:
Distribution of $ {p_{\mathrm {T}}^{{\mathrm {t}}}} $ for events in the muon channel passing the full selection in category A, in the high $ {S_{\mathrm {T}}} $ category. The hatched areas represent the total uncertainties of the SM background. In the bottom panel, the ratio of data to SM background is shown together with statistical (dark gray) and total (light gray) uncertainties of the total SM background. |
png pdf |
Figure 6:
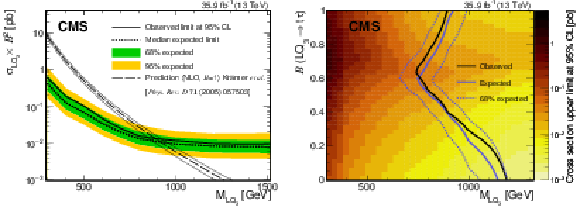
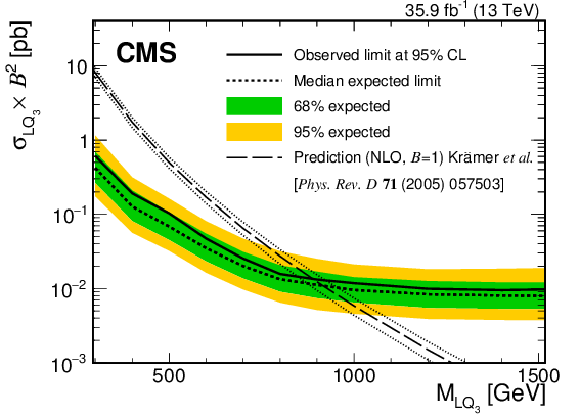
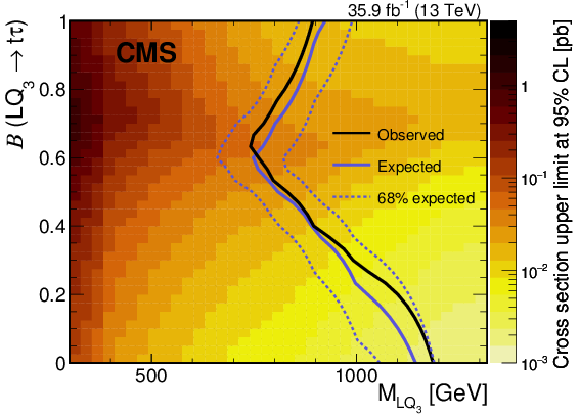
Upper limits at 95% confidence level on the product of the cross section and the branching fraction squared (left), and on the leptoquark mass as a function of the branching fraction (right), for the pair production of scalar LQs decaying to a top quark and a $\tau $ lepton. In the left plot, the theoretical curve corresponds to the NLO cross section with uncertainties from PDF and scale variations [24], shown by the dotted lines. The right plot additionally includes results from a search for pair-produced bottom squarks [38]. |
png pdf |
Figure 6-a:
Upper limits at 95% confidence level on the product of the cross section and the branching fraction squared, for the pair production of scalar LQs decaying to a top quark and a $\tau $ lepton. The theoretical curve corresponds to the NLO cross section with uncertainties from PDF and scale variations [24], shown by the dotted lines. |
png pdf |
Figure 6-b:
Upper limits at 95% confidence level on the leptoquark mass as a function of the branching fraction, for the pair production of scalar LQs decaying to a top quark and a $\tau $ lepton. The plot additionally includes results from a search for pair-produced bottom squarks [38]. |
| Tables | |

png pdf |
Table 1:
Summary of selection criteria in event categories A ($\ell {{\tau} _\mathrm {h}} $+jets) and B ($\ell {{\tau} _\mathrm {h}} {{\tau} _\mathrm {h}} $+jets), where $\ell = \mu$, e. In category A, the two subcategories, OS and SS, are defined by the charge of the $\ell \tau _h$ pair. The fit variable used in each category is also shown. |

png pdf |
Table 2:
Summary of largest systematic uncertainties for the $ {{{\mathrm {t}\overline {\mathrm {t}}}} _{\mathrm {f}}} $ (and W+jets) and $ {{{\mathrm {t}\overline {\mathrm {t}}}} _{\mathrm {p+f}}} $ backgrounds derived from data, for the $ {{{\mathrm {t}\overline {\mathrm {t}}}} _{\mathrm {p}}} $ background obtained from simulation and for a leptoquark signal with a mass of 700 GeV. Shown are the ranges of uncertainties, which are dependent on the search regions and the lepton channel type. |

png pdf |
Table 3:
Final event yield in category B in the muon and electron channels for different leptoquark mass hypotheses, the background processes, and data. The total uncertainties for the signal and the background processes are shown. |
| Summary |
|
A search has been conducted for pair production of third-generation scalar leptoquarks ($ {\mathrm{LQ}_3} $s) decaying into a top quark and a $\tau$ lepton. Proton-proton collision data recorded in 2016 at a center-of-mass energy of 13 TeV, corresponding to an integrated luminosity of 35.9 fb$^{-1}$, has been analyzed. The search has been carried out in the $\ell {\tau_\mathrm{h}}$+jets and $\ell {\tau_\mathrm{h}} {\tau_\mathrm{h}}$+jets channels, where $\ell$ is either an electron or muon and ${\tau_\mathrm{h}}$ indicates a tau lepton decaying to hadrons. Standard model backgrounds due to misidentified $ {\tau_\mathrm{h}} $ leptons are derived from control regions. The measured transverse momentum distributions for the reconstructed top quark candidate are analyzed in four search regions in the $\ell {\tau_\mathrm{h}}$+jets channel. The observed number of events are found to be in agreement with the background predictions. Upper limits on the production cross section of $ {\mathrm{LQ}_3} $ pairs are set between 0.6 and 0.01 pb at 95% confidence level for $ {\mathrm{LQ}_3} $ masses between 300 and 1500 GeV, assuming a branching fraction of $\mathcal{B} = $ 1. The scalar $ {\mathrm{LQ}_3} $s are excluded with masses below 900 GeV, for $\mathcal{B}= $ 1. This result represents the most stringent limits to date on $ {\mathrm{LQ}_3} $s coupled to $\tau$ leptons and top quarks and constrains models explaining flavor anomalies in the $ \mathrm{b} $ quark sector through contributions from scalar LQs. |
| References | ||||
| 1 | W. Buchmuller, R. Ruckl, and D. Wyler | Leptoquarks in lepton-quark collisions | PLB 191 (1987) 442, . [Erratum: \DOI10.1016/S0370-2693(99)00014-3] | |
| 2 | J. C. Pati and A. Salam | Lepton number as the fourth color | PRD 10 (1974) 275, . [Erratum: \DOI10.1103/PhysRevD.11.703.2] | |
| 3 | H. Georgi and S. L. Glashow | Unity of all elementary particle forces | PRL 32 (1974) 438 | |
| 4 | H. Fritzsch and P. Minkowski | Unified interactions of leptons and hadrons | Ann. Phys. 93 (1975) 193 | |
| 5 | E. Farhi and L. Susskind | Technicolor | PR 74 (1981) 277 | |
| 6 | K. D. Lane and M. V. Ramana | Walking technicolor signatures at hadron colliders | PRD 44 (1991) 2678 | |
| 7 | B. Schrempp and F. Schrempp | Light leptoquarks | PLB 153 (1985) 101 | |
| 8 | B. Gripaios | Composite leptoquarks at the LHC | JHEP 02 (2010) 045 | 0910.1789 |
| 9 | G. R. Farrar and P. Fayet | Phenomenology of the production, decay, and detection of new hadronic states associated with supersymmetry | PLB 76 (1978) 575 | |
| 10 | R. Barbier et al. | R-parity violating supersymmetry | PR 420 (2005) 1 | hep-ph/0406039 |
| 11 | BaBar Collaboration | Evidence for an excess of $ \bar{B} \to D^{(*)} \tau^-\bar{\nu}_\tau $ decays | PRL 109 (2012) 101802 | 1205.5442 |
| 12 | BaBar Collaboration | Measurement of an excess of $ \bar{B} \to D^{(*)}\tau^- \bar{\nu}_\tau $ decays and implications for charged Higgs bosons | PRD 88 (2013) 072012 | 1303.0571 |
| 13 | Belle Collaboration | Observation of $ B^0 \to D^{*-} \tau^+ \nu_\tau $ decay at Belle | PRL 99 (2007) 191807 | 0706.4429 |
| 14 | Belle Collaboration | Observation of $ B^+ \to \bar{D}^{*0} \tau^+ \nu_\tau $ and evidence for $ B^+ \to \bar{D}^0 \tau^+ \nu_\tau $ at Belle | PRD 82 (2010) 072005 | 1005.2302 |
| 15 | Belle Collaboration | Measurement of the branching ratio of $ \bar{B} \to D^{(\ast)} \tau^- \bar{\nu}_\tau $ relative to $ \bar{B} \to D^{(\ast)} \ell^- \bar{\nu}_\ell $ decays with hadronic tagging at Belle | PRD 92 (2015) 072014 | 1507.03233 |
| 16 | LHCb Collaboration | Measurement of the ratio of branching fractions $ \mathcal{B}(\bar{B}^0 \to D^{*+}\tau^{-}\bar{\nu}_{\tau})/\mathcal{B}(\bar{B}^0 \to D^{*+}\mu^{-}\bar{\nu}_{\mu}) $ | PRL 115 (2015) 111803 | 1506.08614 |
| 17 | B. Dumont, K. Nishiwaki, and R. Watanabe | LHC constraints and prospects for $ S_1 $ scalar leptoquark explaining the $ \bar B \to D^{(*)} \tau \bar\nu $ anomaly | PRD 94 (2016) 034001 | 1603.05248 |
| 18 | M. Tanaka and R. Watanabe | New physics in the weak interaction of $ \bar B\to D^{(*)}\tau\bar\nu $ | PRD 87 (2013) 034028 | 1212.1878 |
| 19 | Y. Sakaki, M. Tanaka, A. Tayduganov, and R. Watanabe | Testing leptoquark models in $ \bar B \to D^{(*)} \tau \bar\nu $ | PRD 88 (2013) 094012 | 1309.0301 |
| 20 | I. Dor\vsner, S. Fajfer, N. Ko\vsnik, and I. Ni\vsand\vzi\'c | Minimally flavored colored scalar in $ \bar B \to D^{(*)} \tau \bar \nu $ and the mass matrices constraints | JHEP 11 (2013) 084 | 1306.6493 |
| 21 | B. Gripaios, M. Nardecchia, and S. A. Renner | Composite leptoquarks and anomalies in $ B $-meson decays | JHEP 05 (2015) 006 | 1412.1791 |
| 22 | S. Chakdar, T. Li, S. Nandi, and S. K. Rai | Unity of elementary particles and forces for the third family | PLB 718 (2012) 121 | 1206.0409 |
| 23 | S. Chakdar, T. Li, S. Nandi, and S. K. Rai | Top SU(5) models: Baryon and lepton number violating resonances at the LHC | PRD 87 (2013) 096002 | 1302.6942 |
| 24 | M. Kramer, T. Plehn, M. Spira, and P. M. Zerwas | Pair production of scalar leptoquarks at the CERN LHC | PRD 71 (2005) 057503 | hep-ph/0411038 |
| 25 | CMS Collaboration | Search for third-generation scalar leptoquarks in the t$ \tau $ channel in proton-proton collisions at $ \sqrt{s}= $ 8 TeV | JHEP 07 (2015) 042 | CMS-EXO-14-008 1503.09049 |
| 26 | D0 Collaboration | Search for third-generation leptoquarks in $ p \bar{p} $ collisions at $ \sqrt{s} = $ 1.96 TeV | PRL 99 (2007) 061801 | 0705.0812 |
| 27 | CDF Collaboration | Search for third generation vector leptoquarks in $ p \bar{p} $ collisions at $ \sqrt{s} = $ 1.96 TeV | PRD 77 (2008) 091105 | 0706.2832 |
| 28 | ATLAS Collaboration | Search for third generation scalar leptoquarks in pp collisions at $ \sqrt{s} = $ 7 TeV with the ATLAS detector | JHEP 06 (2013) 033 | 1303.0526 |
| 29 | CMS Collaboration | Search for third-generation leptoquarks and scalar bottom quarks in pp collisions at $ \sqrt{s}= $ 7 TeV | JHEP 12 (2012) 055 | CMS-EXO-11-030 1210.5627 |
| 30 | CMS Collaboration | Search for pair production of third-generation scalar leptoquarks and top squarks in proton-proton collisions at $ \sqrt{s} = $ 8 TeV | PLB 739 (2014) 229 | CMS-EXO-12-032 1408.0806 |
| 31 | CMS Collaboration | Searches for third-generation squark production in fully hadronic final states in proton-proton collisions at $ \sqrt{s} = $ 8 TeV | JHEP 06 (2015) 116 | CMS-SUS-14-001 1503.08037 |
| 32 | ATLAS Collaboration | Searches for scalar leptoquarks in pp collisions at $ \sqrt{s} = $ 8 TeV with the ATLAS detector | EPJC 76 (2016) 5 | 1508.04735 |
| 33 | ATLAS Collaboration | Summary of the searches for squarks and gluinos using $ \sqrt{s}= $ 8 TeV pp collisions with the ATLAS experiment at the LHC | JHEP 10 (2015) 054 | 1507.05525 |
| 34 | ATLAS Collaboration | Search for bottom squark pair production in proton-proton collisions at $ \sqrt{s}= $ 13 TeV with the ATLAS detector | EPJC 76 (2016) 547 | 1606.08772 |
| 35 | ATLAS Collaboration | Search for supersymmetry in events with $ b $-tagged jets and missing transverse momentum in $ pp $ collisions at $ \sqrt{s}= $ 13 TeV with the ATLAS detector | JHEP 11 (2017) 195 | 1708.09266 |
| 36 | CMS Collaboration | Search for heavy neutrinos or third-generation leptoquarks in final states with two hadronically decaying $ \tau $ leptons and two jets in proton-proton collisions at $ \sqrt{s}= $ 13 TeV | JHEP 03 (2017) 077 | CMS-EXO-16-016 1612.01190 |
| 37 | CMS Collaboration | Search for third-generation scalar leptoquarks and heavy right-handed neutrinos in final states with two tau leptons and two jets in proton-proton collisions at $ \sqrt{s}= $ 13 TeV | JHEP 07 (2017) 121 | CMS-EXO-16-023 1703.03995 |
| 38 | CMS Collaboration | Search for new phenomena with the $ M_{\mathrm {T2}} $ variable in the all-hadronic final state produced in proton-proton collisions at $ \sqrt{s} = $ 13 TeV | EPJC 77 (2017) 710 | CMS-SUS-16-036 1705.04650 |
| 39 | CMS Collaboration | Search for the pair production of third-generation squarks with two-body decays to a bottom or charm quark and a neutralino in proton-proton collisions at $ \sqrt{s}= $ 13 TeV | Submitted to PLB | CMS-SUS-16-032 1707.07274 |
| 40 | CMS Collaboration | The CMS experiment at the CERN LHC | JINST 3 (2008) S08004 | CMS-00-001 |
| 41 | CMS Collaboration | The CMS trigger system | JINST 12 (2017) P01020 | CMS-TRG-12-001 1609.02366 |
| 42 | CMS Collaboration | CMS luminosity measurements for the 2016 data taking period | CMS-PAS-LUM-17-001 | CMS-PAS-LUM-17-001 |
| 43 | T. Sjostrand, S. Mrenna, and P. Z. Skands | A brief introduction to PYTHIA 8.1 | CPC 178 (2008) 852 | 0710.3820 |
| 44 | P. Nason | A new method for combining NLO QCD with shower Monte Carlo algorithms | JHEP 11 (2004) 040 | hep-ph/0409146 |
| 45 | S. Frixione, P. Nason, and C. Oleari | Matching NLO QCD computations with parton shower simulations: the POWHEG method | JHEP 11 (2007) 070 | 0709.2092 |
| 46 | S. Alioli, P. Nason, C. Oleari, and E. Re | A general framework for implementing NLO calculations in shower Monte Carlo programs: the POWHEG BOX | JHEP 06 (2010) 043 | 1002.2581 |
| 47 | S. Frixione, P. Nason, and G. Ridolfi | A positive-weight next-to-leading-order Monte Carlo for heavy flavour hadroproduction | JHEP 09 (2007) 126 | 0707.3088 |
| 48 | S. Alioli, P. Nason, C. Oleari, and E. Re | NLO single-top production matched with shower in POWHEG: $ s $- and $ t $-channel contributions | JHEP 09 (2009) 111 | 0907.4076 |
| 49 | E. Re | Single-top Wt-channel production matched with parton showers using the POWHEG method | EPJC 71 (2011) 1547 | 1009.2450 |
| 50 | J. Alwall et al. | The automated computation of tree-level and next-to-leading order differential cross sections, and their matching to parton shower simulations | JHEP 07 (2014) 079 | 1405.0301 |
| 51 | R. Frederix and S. Frixione | Merging meets matching in MC@NLO | JHEP 12 (2012) 061 | 1209.6215 |
| 52 | M. L. Mangano, M. Moretti, F. Piccinini, and M. Treccani | Matching matrix elements and shower evolution for top-quark production in hadronic collisions | JHEP 01 (2007) 013 | hep-ph/0611129 |
| 53 | CMS Collaboration | Event generator tunes obtained from underlying event and multiparton scattering measurements | EPJC 76 (2016) 155 | CMS-GEN-14-001 1512.00815 |
| 54 | P. Skands, S. Carrazza, and J. Rojo | Tuning PYTHIA 8.1: the Monash 2013 Tune | EPJC 74 (2014) 3024 | 1404.5630 |
| 55 | NNPDF Collaboration | Parton distributions for the LHC Run II | JHEP 04 (2015) 040 | 1410.8849 |
| 56 | GEANT4 Collaboration | GEANT4---a simulation toolkit | NIMA 506 (2003) 250 | |
| 57 | CMS Collaboration | Particle-flow reconstruction and global event description with the CMS detector | JINST 12 (2017) P10003 | CMS-PRF-14-001 1706.04965 |
| 58 | R. Fruhwirth and A. Strandlie | Track fitting with ambiguities and noise: A study of elastic tracking and nonlinear filters | CPC 120 (1999) 197 | |
| 59 | CMS Collaboration | Description and performance of track and primary-vertex reconstruction with the CMS tracker | JINST 9 (2014) P10009 | CMS-TRK-11-001 1405.6569 |
| 60 | M. Cacciari, G. P. Salam, and G. Soyez | The anti-$ {k_{\mathrm{T}}} $ jet clustering algorithm | JHEP 04 (2008) 063 | 0802.1189 |
| 61 | M. Cacciari, G. P. Salam, and G. Soyez | FastJet user manual | EPJC 72 (2012) 1896 | 1111.6097 |
| 62 | CMS Collaboration | Performance of CMS muon reconstruction in pp collision events at $ \sqrt{s}= $ 7 TeV | JINST 7 (2012) P10002 | CMS-MUO-10-004 1206.4071 |
| 63 | CMS Collaboration | Performance of electron reconstruction and selection with the CMS detector in proton-proton collisions at $ \sqrt{s}= $ 8 TeV | JINST 10 (2015) P06005 | CMS-EGM-13-001 1502.02701 |
| 64 | M. Cacciari, G. P. Salam, and G. Soyez | The catchment area of jets | JHEP 04 (2008) 005 | 0802.1188 |
| 65 | CMS Collaboration | Determination of jet energy calibration and transverse momentum resolution in CMS | JINST 6 (2011) P11002 | CMS-JME-10-011 1107.4277 |
| 66 | CMS Collaboration | Jet energy scale and resolution in the CMS experiment in pp collisions at 8 TeV | JINST 12 (2017) P02014 | CMS-JME-13-004 1607.03663 |
| 67 | CMS Collaboration | Identification of b-quark jets with the CMS experiment | JINST 8 (2013) P04013 | CMS-BTV-12-001 1211.4462 |
| 68 | CMS Collaboration | Identification of heavy-flavour jets with the CMS detector in pp collisions at 13 TeV | Submitted to \it JINST | CMS-BTV-16-002 1712.07158 |
| 69 | CMS Collaboration | Performance of tau-lepton reconstruction and identification in CMS | JINST 7 (2012) P01001 | CMS-TAU-11-001 1109.6034 |
| 70 | CMS Collaboration | Performance of reconstruction and identification of tau leptons in their decays to hadrons and tau neutrino in LHC Run-2 | CMS-PAS-TAU-16-002 | CMS-PAS-TAU-16-002 |
| 71 | M. Stover | Search for third-generation scalar leptoquarks with the CMS experiment | Dissertation, University of Hamburg | |
| 72 | CMS Collaboration | Measurement of the $ t\bar{t} $ production cross section using events in the e$ \mu $ final state in pp collisions at $ \sqrt{s} = $ 13 TeV | EPJC 77 (2017) 172 | CMS-TOP-16-005 1611.04040 |
| 73 | N. Kidonakis | NNLL threshold resummation for top-pair and single-top production | Phys. Part. Nucl. 45 (2014) 714 | 1210.7813 |
| 74 | CMS Collaboration | Observation of the associated production of a single top quark and a W boson in pp collisions at $ \sqrt{s} = $ 8 TeV | PRL 112 (2014) 231802 | CMS-TOP-12-040 1401.2942 |
| 75 | CMS Collaboration | Cross section measurement of $ t $-channel single top quark production in pp collisions at $ \sqrt{s} = $ 13 TeV | PLB 772 (2017) 752 | CMS-TOP-16-003 1610.00678 |
| 76 | CMS Collaboration | Measurement of inclusive W and Z boson production cross sections in pp collisions at $ \sqrt{s} = $ 8 TeV | PRL 112 (2014) 191802 | CMS-SMP-12-011 1402.0923 |
| 77 | J. M. Campbell, R. K. Ellis, and C. Williams | Vector boson pair production at the LHC | JHEP 07 (2011) 018 | 1105.0020 |
| 78 | T. Gehrmann et al. | $ W^+W^- $ production at hadron colliders in next-to-next-to-leading-order QCD | PRL 113 (2014) 212001 | 1408.5243 |
| 79 | CMS Collaboration | Measurement of the WZ production cross section in pp collisions at $ \sqrt{s} = $ 13 TeV | PLB 766 (2017) 268 | CMS-SMP-16-002 1607.06943 |
| 80 | CMS Collaboration | Measurement of the inelastic proton-proton cross section at $ \sqrt{s}= $ 7 TeV | PLB 722 (2013) 5 | CMS-FWD-11-001 1210.6718 |
| 81 | J. Butterworth et al. | PDF4LHC recommendations for LHC Run-2 | JPG 43 (2016) 023001 | 1510.03865 |
| 82 | J. Ott | THETA?A framework for template-based modeling and inference | link | |
| 83 | A. O'Hagan and J. J. Forster | Kendall?s advanced theory of statistics. Vol. 2B: Bayesian Inference | Arnold, London | |
| 84 | D. Dercks et al. | R-Parity violation at the LHC | EPJC 77 (2017) 856 | 1706.09418 |

|
Compact Muon Solenoid LHC, CERN |

|

|

|

|

|

|