

Compact Muon Solenoid
LHC, CERN
| CMS-PAS-HIN-16-023 | ||
| Measurement of nuclear modification factors of $\Upsilon\textrm{(nS)}$ mesons in PbPb collisions at $\sqrt{s_{\text{NN}}} = $ 5.02 TeV | ||
| CMS Collaboration | ||
| February 2017 | ||
| Abstract: The cross sections of $\Upsilon\textrm{(1S)}$, $\Upsilon\textrm{(2S)}$, and $\Upsilon\textrm{(3S)}$ production in PbPb and pp collisions at $\sqrt{s_{\mathrm{NN}}} = $ 5.02 TeV are reported. The nuclear modification factors, $R_\mathrm{AA}$, derived from the PbPb-to-pp ratio of yields for each state, are studied as a function of rapidity, transverse momentum and centrality. A strong modification is observed for all $\Upsilon$ states. The suppression of $\Upsilon\textrm{(1S)}$ seen in PbPb collisions at $\sqrt{s_{\mathrm{NN}}} = $ 5.02 TeV is stronger than the previous one measured at $\sqrt{s_{\mathrm{NN}}} = $ 2.76 TeV, consistent with an increase in the medium temperature at the higher energy. We obtain an upper limit on the production of $\Upsilon\textrm{(3S)}$ of 0.071 at 95% confidence level, the smallest value measured for a hadron $R_\mathrm{AA}$ in heavy ion collisions so far. | ||
|
Links:
CDS record (PDF) ;
inSPIRE record ;
CADI line (restricted) ;
These preliminary results are superseded in this paper, PLB 790 (2019) 270. The superseded preliminary plots can be found here. |
||
| Figures | Summary | Additional Figures | References | CMS Publications |
|---|
| Figures | |
png pdf |
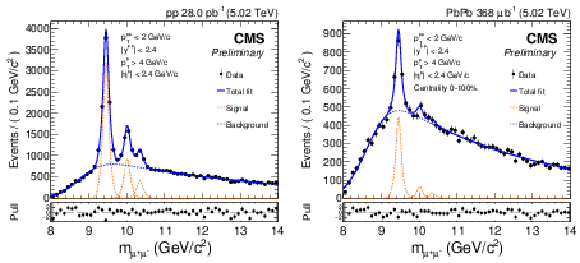
Figure 1:
Invariant mass distribution of muon pairs in pp (left) and PbPb (right) collisions, for the kinematic range, $ {p_{\mathrm {T}}} ^{\mu \mu } < $ 2 GeV/$c$ and $|y^{\mu \mu }|< $ 2.4. The result of the fit and the corresponding pull distributions are also shown. |
png pdf |
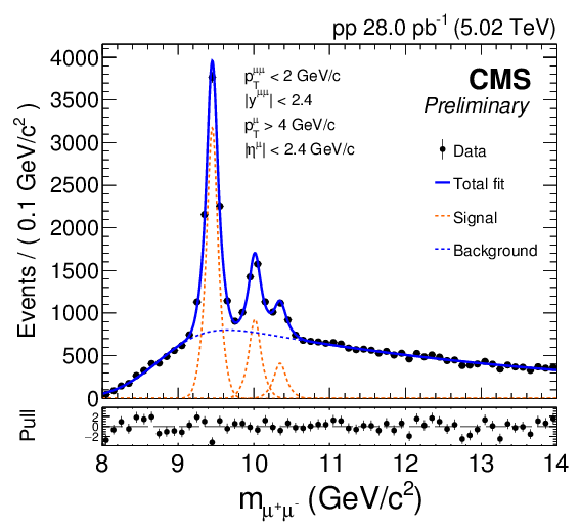
Figure 1-a:
Invariant mass distribution of muon pairs in pp collisions, for the kinematic range, $ {p_{\mathrm {T}}} ^{\mu \mu } < $ 2 GeV/$c$ and $|y^{\mu \mu }|< $ 2.4. The result of the fit and the corresponding pull distribution are also shown. |
png pdf |
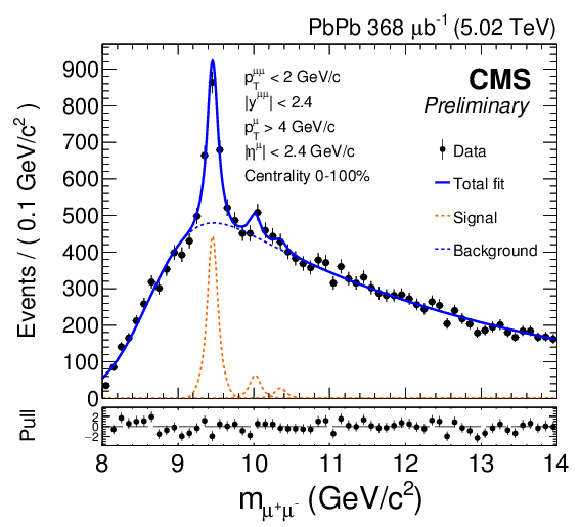
Figure 1-b:
Invariant mass distribution of muon pairs in PbPb collisions, for the kinematic range, $ {p_{\mathrm {T}}} ^{\mu \mu } < $ 2 GeV/$c$ and $|y^{\mu \mu }|< $ 2.4. The result of the fit and the corresponding pull distribution are also shown. |
png pdf |
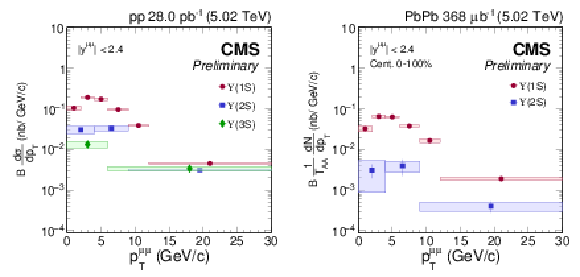
Figure 2:
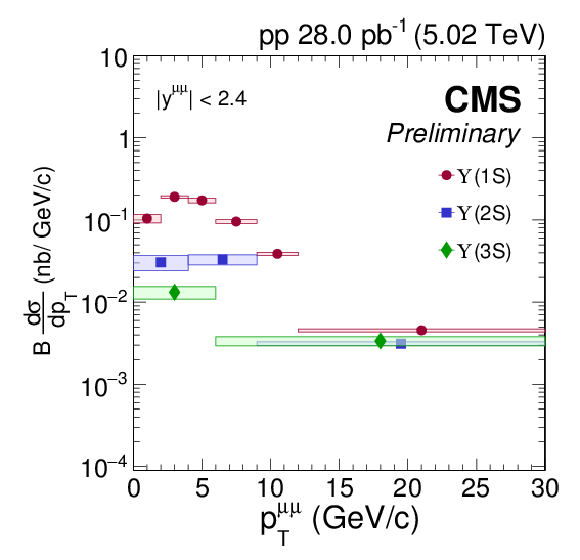
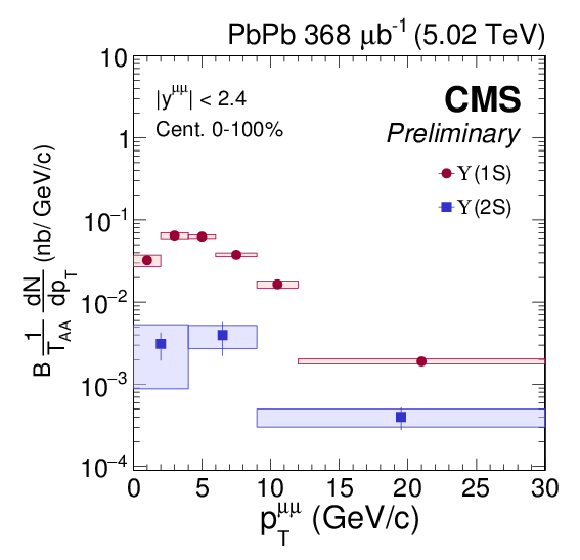
Double differential cross sections of the ${\Upsilon \textrm {(1S)}} $, ${\Upsilon \textrm {(2S)}} $, and ${\Upsilon \textrm {(3S)}} $ mesons as a function of ${p_{\mathrm {T}}} $ for pp (left) and PbPb (right) collisions. The error bars represent the statistical and the boxes the systematic uncertainties. The global luminosity uncertainties of 2.3% in pp and 2% in PbPb $ {N_{\rm MB}}$ are not shown. |
png pdf |
Figure 2-a:
Double differential cross sections of the ${\Upsilon \textrm {(1S)}} $, ${\Upsilon \textrm {(2S)}} $, and ${\Upsilon \textrm {(3S)}} $ mesons as a function of ${p_{\mathrm {T}}} $ for pp collisions. The error bars represent the statistical and the boxes the systematic uncertainties. The global luminosity uncertainty of 2.3% is not shown. |
png pdf |
Figure 2-b:
Double differential cross sections of the ${\Upsilon \textrm {(1S)}} $, ${\Upsilon \textrm {(2S)}} $, and ${\Upsilon \textrm {(3S)}} $ mesons as a function of ${p_{\mathrm {T}}} $ for PbPb collisions. The error bars represent the statistical and the boxes the systematic uncertainties. The global luminosity uncertainty of 2% is not shown. |
png pdf |
Figure 3:
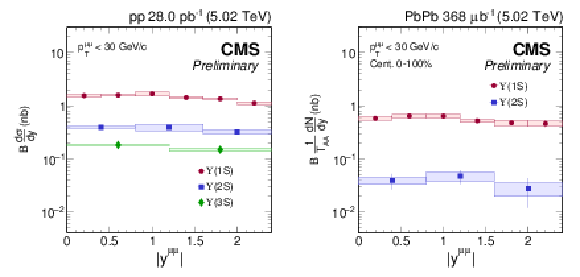
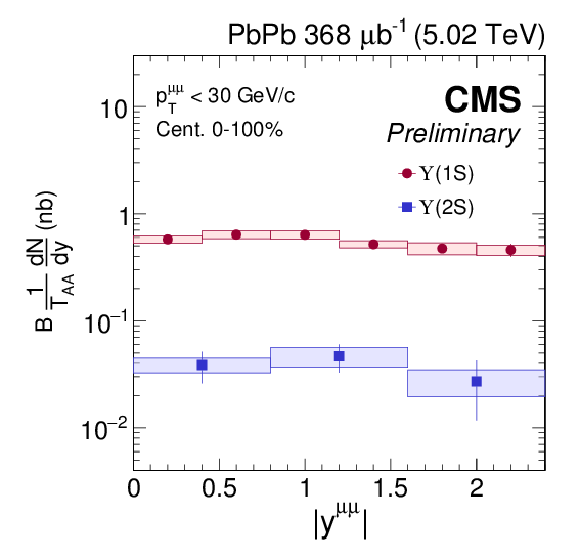
Differential cross sections of the ${\Upsilon \textrm {(1S)}} $, ${\Upsilon \textrm {(2S)}} $, and ${\Upsilon \textrm {(3S)}} $ mesons as a function of rapidity for pp (left) and PbPb (right) collisions. The error bars represent the statistical and the boxes the systematic uncertainties. The global luminosity uncertainties of 2.3% in pp and 2% in PbPb $ {N_{\rm MB}} $ are not shown. |
png pdf |
Figure 3-a:
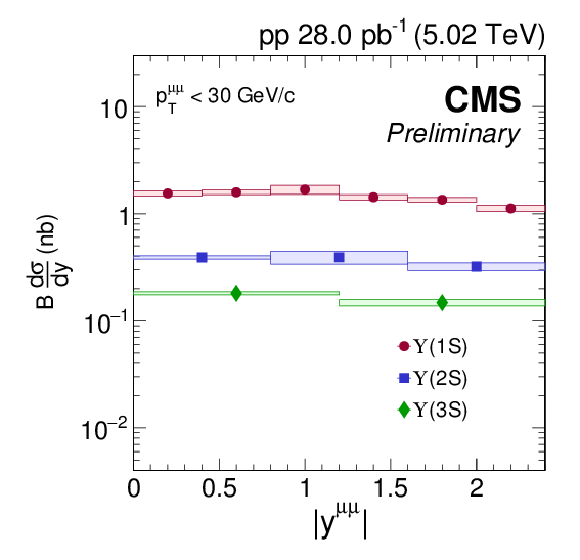
Differential cross sections of the ${\Upsilon \textrm {(1S)}} $, ${\Upsilon \textrm {(2S)}} $, and ${\Upsilon \textrm {(3S)}} $ mesons as a function of rapidity for pp collisions. The error bars represent the statistical and the boxes the systematic uncertainties. The global luminosity uncertainty of 2.3% is not shown. |
png pdf |
Figure 3-b:
Differential cross sections of the ${\Upsilon \textrm {(1S)}} $, ${\Upsilon \textrm {(2S)}} $, and ${\Upsilon \textrm {(3S)}} $ mesons as a function of rapidity for PbPb collisions. The error bars represent the statistical and the boxes the systematic uncertainties. The global luminosity uncertainty of 2% is not shown. |
png pdf |
Figure 4:
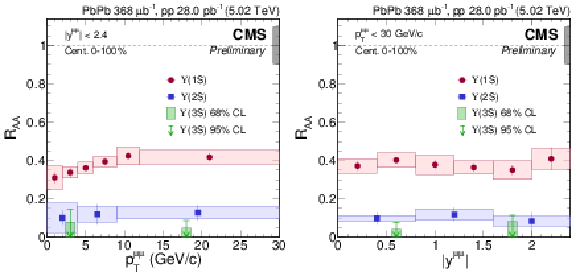
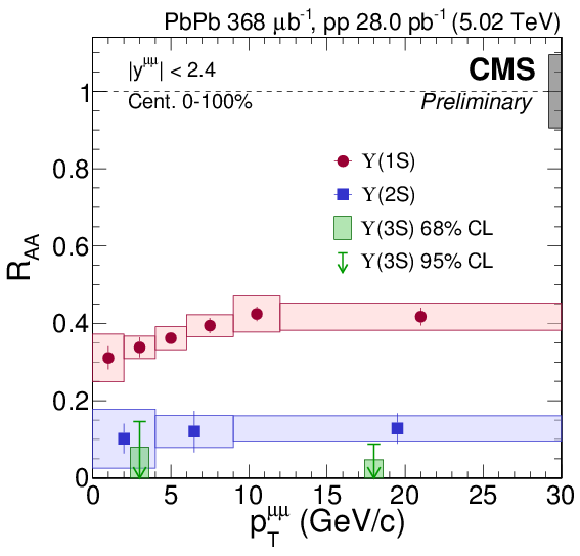
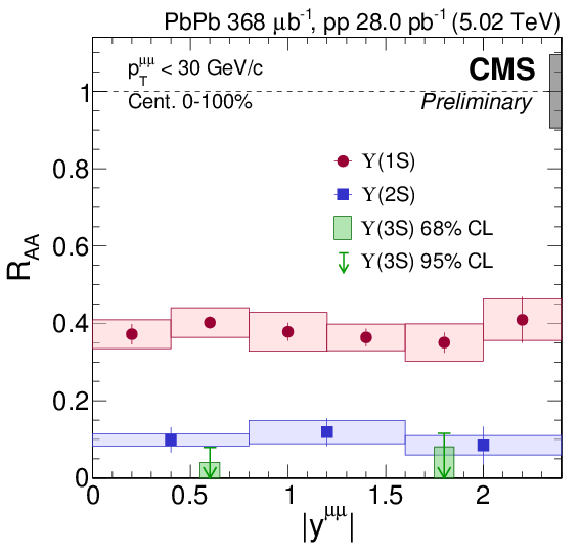
Nuclear modification factors of ${\Upsilon \textrm {(1S)}} $, ${\Upsilon \textrm {(2S)}}$ and ${\Upsilon \textrm {(3S)}} $ meson as functions of ${p_{\mathrm {T}}} $ (left) and rapidity (right). The error bars represent the statistical and the boxes the systematic uncertainties. The gray box near the line at unity displays the global uncertainty which consists of the uncertainties from ${T_{\rm AA}}$, pp luminosity and PbPb ${N_{\rm MB}}$. |
png pdf |
Figure 4-a:
Nuclear modification factors of ${\Upsilon \textrm {(1S)}} $, ${\Upsilon \textrm {(2S)}}$ and ${\Upsilon \textrm {(3S)}} $ meson as functions of ${p_{\mathrm {T}}} $. The error bars represent the statistical and the boxes the systematic uncertainties. The gray box near the line at unity displays the global uncertainty which consists of the uncertainties from ${T_{\rm AA}}$, pp luminosity and PbPb ${N_{\rm MB}}$. |
png pdf |
Figure 4-b:
Nuclear modification factors of ${\Upsilon \textrm {(1S)}} $, ${\Upsilon \textrm {(2S)}}$ and ${\Upsilon \textrm {(3S)}} $ meson as functions of rapidity. The error bars represent the statistical and the boxes the systematic uncertainties. The gray box near the line at unity displays the global uncertainty which consists of the uncertainties from ${T_{\rm AA}}$, pp luminosity and PbPb ${N_{\rm MB}}$. |
png pdf |
Figure 5:
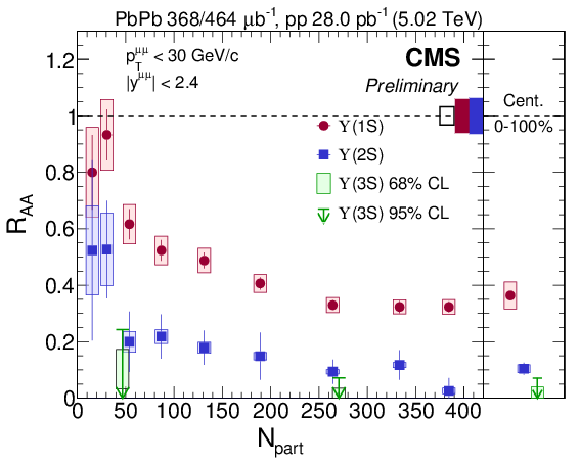
Nuclear modification factors of ${\Upsilon \textrm {(1S)}} $, ${\Upsilon \textrm {(2S)}}$ and ${\Upsilon \textrm {(3S)}} $ mesons as a function of ${N_{\mathrm {part}}}$. The error bars represent the statistical and the boxes the systematic uncertainties. The black box near the dashed line at unity represents the global uncertainty in pp luminosity and PbPb $ {N_{\rm MB}}$ which applies to both ${\Upsilon \textrm {(1S)}}$ and ${\Upsilon \textrm {(2S)}}$ states. The red and blue boxes show the uncertainties of pp yields for ${\Upsilon \textrm {(1S)}}$ and ${\Upsilon \textrm {(2S)}}$ states, respectively. The global uncertainties for the ${\Upsilon \textrm {(3S)}}$ results are embedded in the upper limit computation. For the centrality-integrated results in the right sub-panel, the systematic uncertainty values include the global uncertainties. |
| Summary |
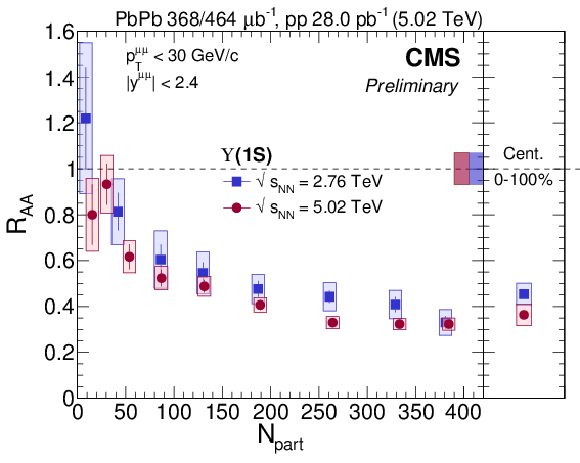
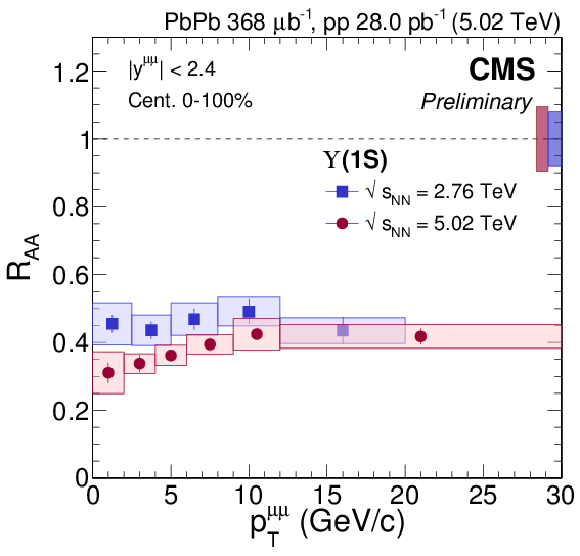
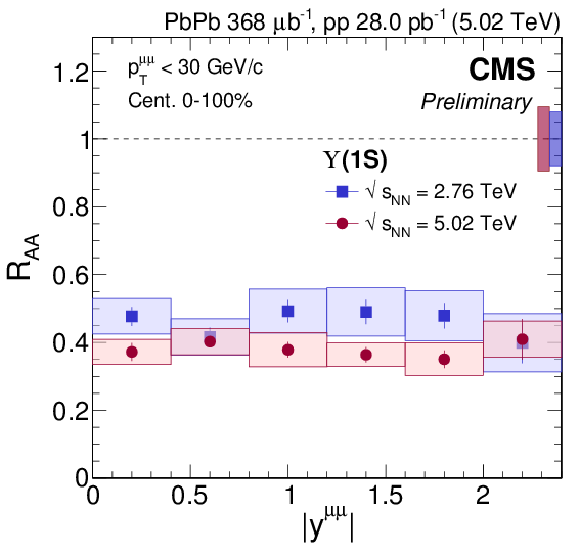
| The pp and PbPb data at $\sqrt{s_{\text{NN}}} = $ 5.02 TeV collected with the CMS detector were analyzed to measure the cross sections of ${\Upsilon\textrm{(1S)}} $, ${\Upsilon\textrm{(2S)}} $, and ${\Upsilon\textrm{(3S)}} $ mesons and their nuclear modification factors as functions of $p_{\mathrm{T}}$, $|y|$ and centrality. A gradual decrease of ${R_{\mathrm{AA}}} $ with centrality for the ${\Upsilon\textrm{(1S)}} $ and ${\Upsilon\textrm{(2S)}} $ states is observed. We measure a small increase of ${R_{\mathrm{AA}}} $ as function of $p_{\mathrm{T}}$ for the ${\Upsilon\textrm{(1S)}} $ state, while ${R_{\mathrm{AA}}} $ values of the ${\Upsilon\textrm{(2S)}} $ and ${\Upsilon\textrm{(3S)}} $ states are consistent with being constant. For all three ${\Upsilon} $ states we observe a constant rapidity dependence of ${R_{\mathrm{AA}}} $ in the measured region. The modification of ${\Upsilon\textrm{(1S)}} $ is larger than the one seen at ${\sqrt{s_{\text{NN}}}} = $ 2.76 TeV, where ${\Upsilon\textrm{(1S)}} $ mesons were suppressed by factor of $\approx$2. This result hints at an increase of the temperature of the medium created by heavy ion collisions at higher collision energy. We observe the nuclear modification factor to be below 0.071 at 95% CL, making this the smallest ${R_{\mathrm{AA}}} $ observed for any hadron. |
| Additional Figures | |
png pdf |
Additional Figure 1:
$R_{\text {AA}}$ vs. centrality for $\Upsilon \textrm {(1S)}$ at 2.76 (blue points) and 5.02 TeV (red points). |
png pdf |
Additional Figure 2:
$R_{\text {AA}}$ vs. $ {p_{\mathrm{T}}}$ for $\Upsilon \textrm {(1S)}$ at 2.76 (blue points) and 5.02 TeV (red points). |
png pdf |
Additional Figure 3:
$R_{\text {AA}}$ vs. rapidity for $\Upsilon \textrm {(1S)}$ at 2.76 (blue points) and 5.02 TeV (red points). |
png pdf |
Additional Figure 4:
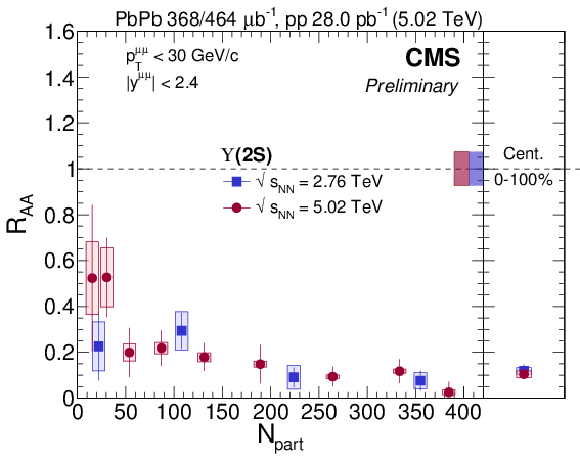
$R_{\text {AA}}$ vs. centrality for $\Upsilon \textrm {(2S)}$ at 2.76 (blue points) and 5.02 TeV (red points). |
png pdf |
Additional Figure 5:
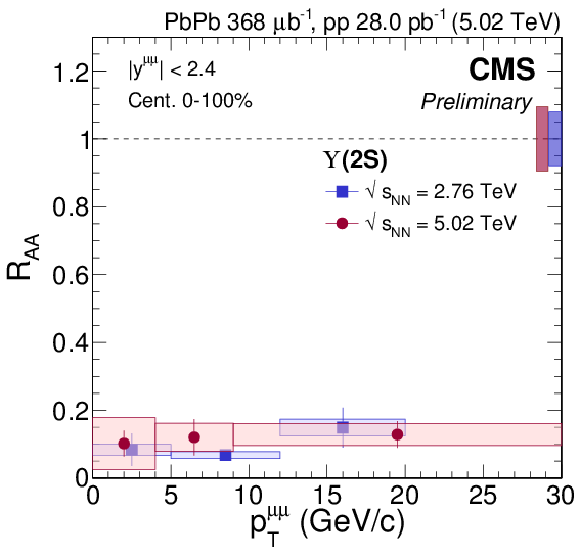
$R_{\text {AA}}$ vs. $ {p_{\mathrm{T}}}$ for $\Upsilon \textrm {(2S)}$ at 2.76 (blue points) and 5.02 TeV (red points). |
png pdf |
Additional Figure 6:
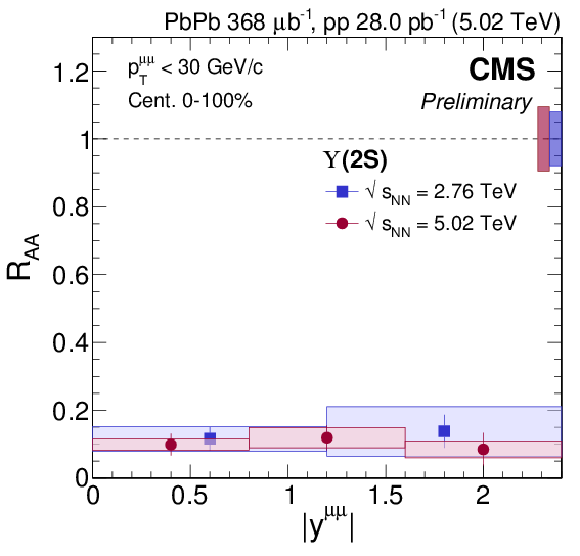
$R_{\text {AA}}$ vs. rapidity for $\Upsilon \textrm {(2S)}$ at 2.76 (blue points) and 5.02 TeV (red points). |
png pdf |
Additional Figure 7:
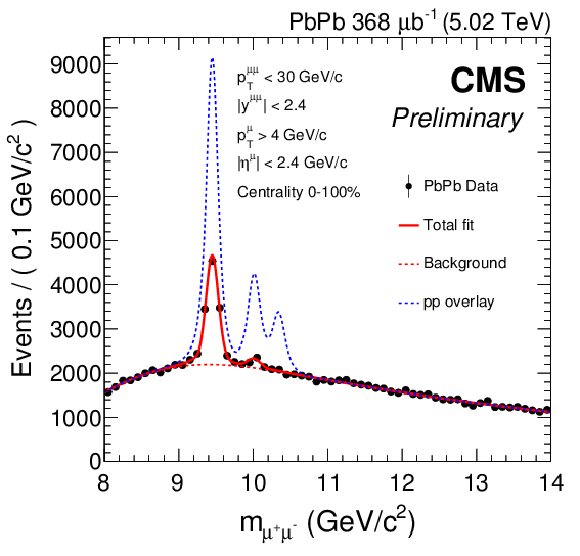
PbPb data mass plot overlaid with the $R_{\text {AA}}$ scaled pp result. |
png pdf |
Additional Figure 8:
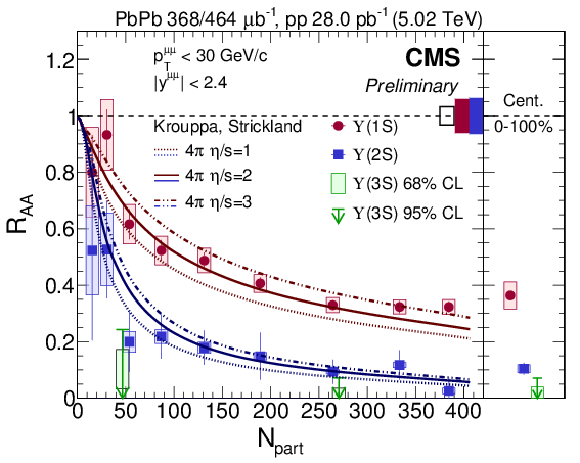
$R_{\text {AA}}$ vs. centrality for $\Upsilon \textrm {(1S)}$ and $\Upsilon \textrm {(2S)}$ compared with a hydrodynamic model. |
png pdf |
Additional Figure 9:
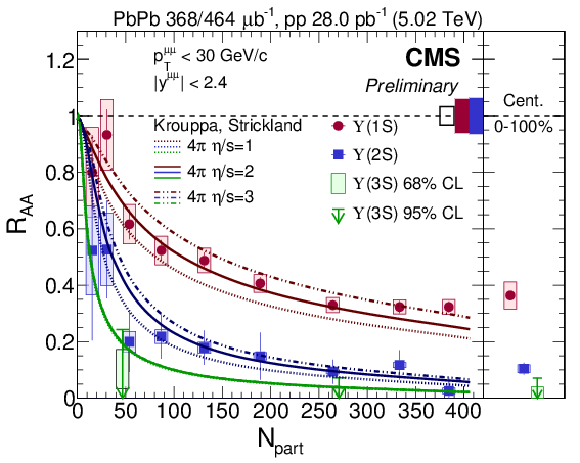
$R_{\text {AA}}$ vs. centrality for $\Upsilon \textrm {(1S)}$, $\Upsilon \textrm {(2S)}$ and $\Upsilon \textrm {(3S)}$ compared with a hydrodynamic model. |
png pdf |
Additional Figure 10:
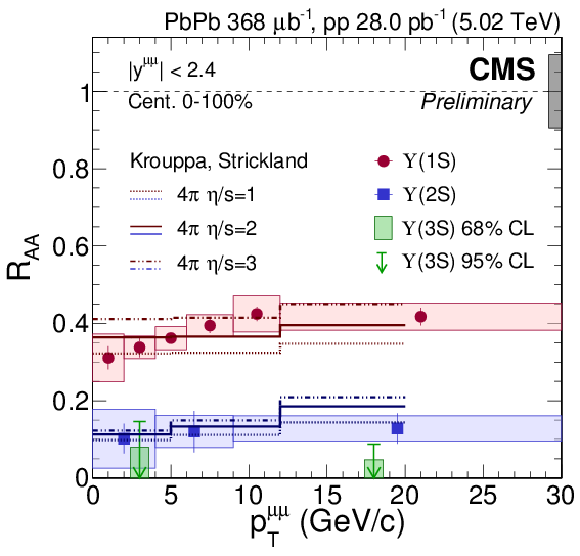
$R_{\text {AA}}$ vs. $ {p_{\mathrm{T}}}$ for $\Upsilon \textrm {(1S)}$ and $\Upsilon \textrm {(2S)}$ compared with a hydrodynamic model. |
png pdf |
Additional Figure 11:
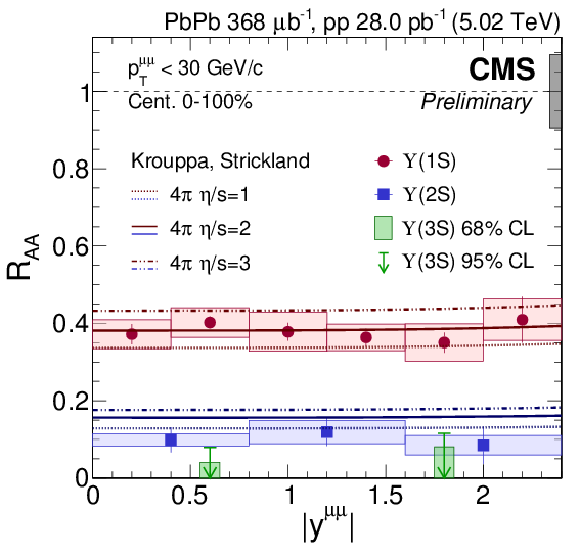
$R_{\text {AA}}$ vs. rapidity for $\Upsilon \textrm {(1S)}$ and $\Upsilon \textrm {(2S)}$ compared with a hydrodynamic model. |
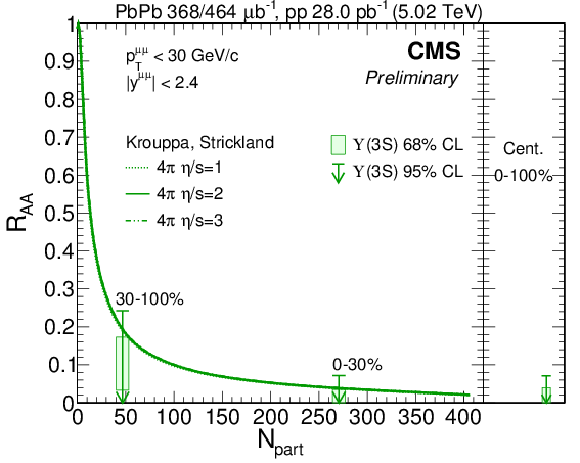
png pdf |
Additional Figure 12:
$R_{\text {AA}}$ vs. centrality for $\Upsilon \textrm {(3S)}$ compared with a hydrodynamic model. |
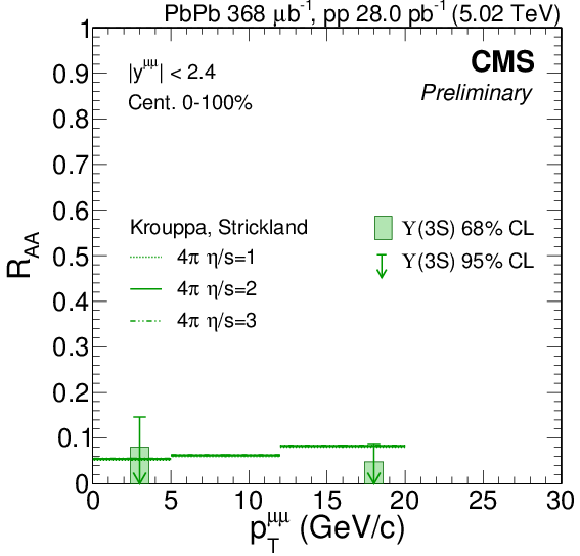
png pdf |
Additional Figure 13:
$R_{\text {AA}}$ vs. $ {p_{\mathrm{T}}}$ for $\Upsilon \textrm {(3S)}$ compared with a hydrodynamic model. |
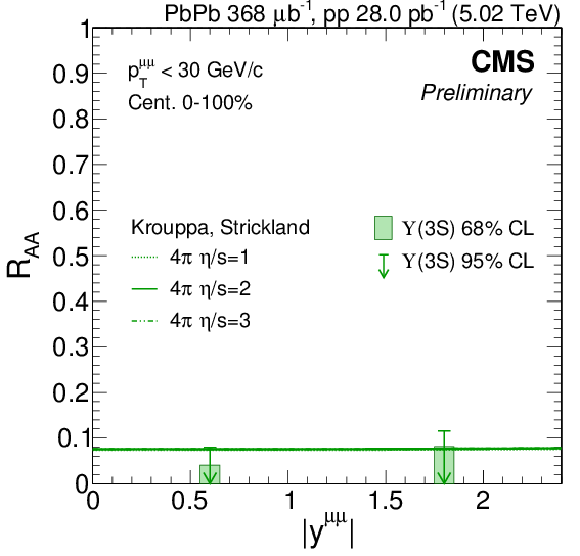
png pdf |
Additional Figure 14:
$R_{\text {AA}}$ vs. rapidity for $\Upsilon \textrm {(3S)}$ compared with a hydrodynamic model. |
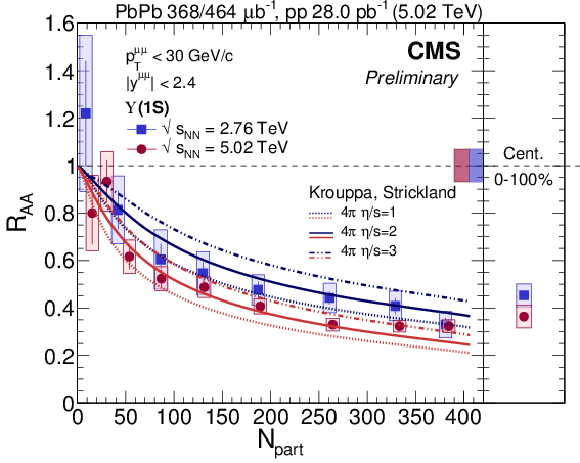
png pdf |
Additional Figure 15:
$R_{\text {AA}}$ vs. centrality for $\Upsilon \textrm {(1S)}$ measured at 2.76 (blue points) and 5.02 TeV (red points) compared with a hydrodynamic model. |
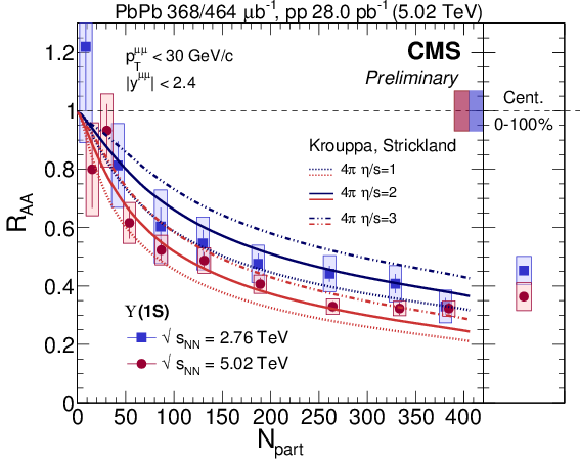
png pdf |
Additional Figure 16:
$R_{\text {AA}}$ vs. centrality for $\Upsilon \textrm {(1S)}$ measured at 2.76 (blue points) and 5.02 TeV (red points) compared with a hydrodynamic model. |
| References | ||||
| 1 | F. Karsch and E. Laermann | Thermodynamics and in-medium hadron properties from lattice QCD | in Quark-Gluon Plasma III, R. C. Hwa and X.-N. Wang, eds World Scientific Publishing Co. Pte. Ltd. | hep-lat/0305025 |
| 2 | E. V. Shuryak | Theory of Hadronic Plasma | Sov. Phys. JETP 47 (1978)212 | |
| 3 | T. Matsui and H. Satz | $ \mathrm{J} / \psi $ suppression by quark-gluon plasma formation | PLB 178 (1986) 416 | |
| 4 | S. Digal, P. Petreczky, and H. Satz | Quarkonium feed down and sequential suppression | PRD 64 (2001) 094015 | hep-ph/0106017 |
| 5 | CMS Collaboration | Suppression and azimuthal anisotropy of prompt and nonprompt $ J/\psi $ production in PbPb collisions at $ \sqrt{s_{NN}} $ = 2.76 TeV | Submitted to: EPJC (2016) | CMS-HIN-14-005 1610.00613 |
| 6 | CMS Collaboration | Suppression of $ \Upsilon(1S) $, $ \Upsilon(2S) $ and $ \Upsilon(3S) $ production in PbPb collisions at $ \sqrt{s_{NN}} $ = 2.76 TeV | Submitted to: PLB (2016) | CMS-HIN-15-001 1611.01510 |
| 7 | CMS Collaboration | Strong suppression of $ \varUpsilon $ excited states in PbPb collisions at $ \sqrt{s_{NN}} = $ 5.02 TeV | CMS-PAS-HIN-16-008 | |
| 8 | CMS Collaboration | Measurement of momentum scale and resolution using low-mass resonances and cosmic ray muons | CDS | |
| 9 | CMS Collaboration | The CMS experiment at the CERN LHC | JINST 3 (2008) S08004 | CMS-00-001 |
| 10 | T. Sjostrand, S. Mrenna, and P. Skands | PYTHIA 6.4 physics and manual | JHEP 05 (2006) 026 | hep-ph/0603175 |
| 11 | GEANT4 Collaboration | GEANT4: A Simulation toolkit | NIMA506 (2003) 250--303 | |
| 12 | M. J. Oreglia | PhD thesis, Stanford University, 1980 SLAC Report R-236 | ||
| 13 | Particle Data Group Collaboration | Review of Particle Physics | CPC 38 (2014) 090001 | |
| 14 | G. J. Feldman and R. D. Cousins | A unified approach to the classical statistical analysis of small signals | PRD 57 (1998) 3873 | physics/9711021 |
| 15 | CMS Collaboration | Measurements of Inclusive $ W $ and $ Z $ Cross Sections in $ pp $ Collisions at $ \sqrt{s} = $ 7 TeV | JHEP 01 (2011) 080 | CMS-EWK-10-002 1012.2466 |
| 16 | C. Loizides, J. Nagle, and P. Steinberg | Improved version of the PHOBOS Glauber Monte Carlo | SoftwareX 1-2 (2015) 13 | 1408.2549 |
| 17 | CMS Collaboration | CMS Luminosity Calibration for the $ pp $ Reference Run at $ \sqrt{s}=5.02 $$ TeV $ | CMS-PAS-LUM-16-001 | CMS-PAS-LUM-16-001 |
| 18 | B. Krouppa and M. Strickland | Predictions for bottomonia suppression in 5.023 TeV Pb-Pb collisions | Universe 2 (2016), no. 3, 16 | 1605.03561 |
| 19 | CMS Collaboration | Charged-particle nuclear modification factors in PbPb and pPb collisions at $ \sqrt{s_{\mathrm{NN}}}= $ 5.02 TeV | Submitted to: JHEP (2016) | CMS-HIN-15-015 1611.01664 |

|
Compact Muon Solenoid LHC, CERN |

|

|

|

|

|

|