
Compact Muon Solenoid
LHC, CERN
| CMS-PAS-HIN-16-008 | ||
| Strong suppression of $\Upsilon$ excited states in PbPb collisions at $\sqrt{s_{NN}} = $ 5.02 TeV | ||
| CMS Collaboration | ||
| September 2016 | ||
| Abstract: Measurements of $\Upsilon$ mesons, produced in pp and PbPb collisions at $\sqrt{s_{NN}} = $ 5.02 TeV and reconstructed via their dimuon decay channel, are reported using data collected by the CMS experiment. Double ratios are formed by comparing the yields of the excited states to the ground state in both PbPb and pp collisions at the same energy. The ${\Upsilon (\textrm {2S})}$ double ratio is studied as a function of centrality, dimuon transverse momentum, and rapidity. We find suppression in all centrality bins and no variation with kinematics. For the ${\Upsilon (\textrm {3S})}$, no significant signal is found in the PbPb data. A search in centrality bins shows that the double ratio is significantly below unity at all centralities, an observation that indicates strong suppression in heavy-ion collisions. The centrality-integrated double ratios are 0.308 $\pm$ 0.055 (stat) $\pm$ 0.017 (syst) for the ${\Upsilon (\textrm {2S})}$ and less than 0.26 at 95% confidence level for the ${\Upsilon (\textrm {3S})}$. | ||
|
Links:
CDS record (PDF) ;
inSPIRE record ;
CADI line (restricted) ;
These preliminary results are superseded in this paper, PRL 120 (2018) 142301. The superseded preliminary plots can be found here. |
||
| Figures | Summary | Additional Figures | References | CMS Publications |
|---|
| Figures | |

png pdf |
Figure 1:
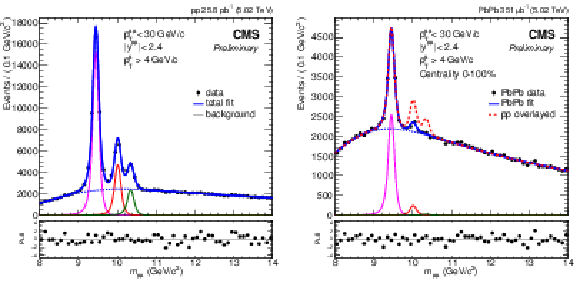
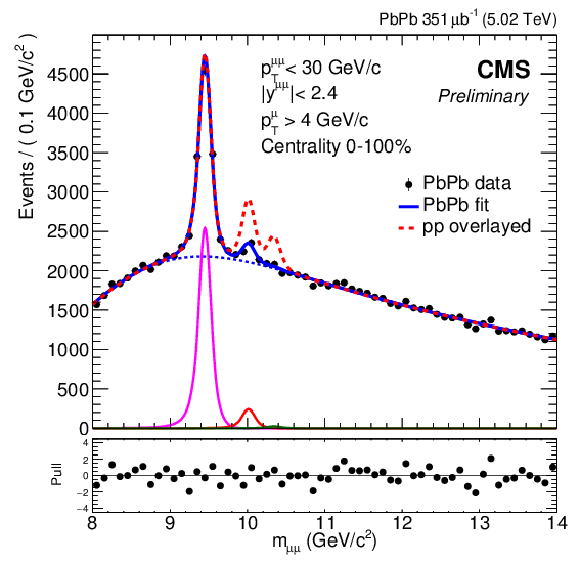
Dimuon invariant mass distributions (black circles) for pp data (left) and centrality-integrated PbPb data (right). The fit is shown as a solid blue line and the background component as a dashed blue line. ${\Upsilon (\textrm {1S})}$, ${\Upsilon (\textrm {2S})}$, and ${\Upsilon (\textrm {3S})}$ are also depicted as solid magenta, red and green lines, respectively. The dashed red line in the PbPb panel represents the pp ${\Upsilon }$ signal fit normalized at the ${\Upsilon (\textrm {1S})}$ mass. The lower panels show the pull distributions. |

png pdf |
Figure 1-a:
Dimuon invariant mass distributions (black circles) for pp data. The fit is shown as a solid blue line and the background component as a dashed blue line. ${\Upsilon (\textrm {1S})}$, ${\Upsilon (\textrm {2S})}$, and ${\Upsilon (\textrm {3S})}$ are also depicted as solid magenta, red and green lines, respectively. The lower panel shows the pull distributions. |

png pdf |
Figure 1-b:
Dimuon invariant mass distributions (black circles) for centrality-integrated PbPb data. The fit is shown as a solid blue line and the background component as a dashed blue line. ${\Upsilon (\textrm {1S})}$, ${\Upsilon (\textrm {2S})}$, and ${\Upsilon (\textrm {3S})}$ are also depicted as solid magenta, red and green lines, respectively. The dashed red line represents the pp ${\Upsilon }$ signal fit normalized at the ${\Upsilon (\textrm {1S})}$ mass. The lower panel shows the pull distributions. |

png pdf |
Figure 2:
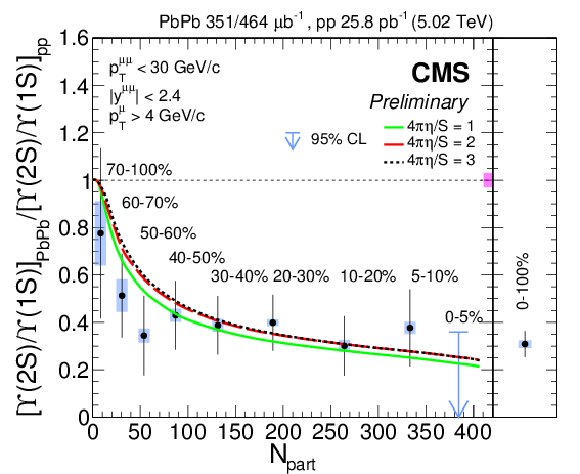
Double ratio of $ {\Upsilon (\textrm {2S})} $ as a function of centrality. The centrality-integrated value is shown in the right sub-panel. The error bars represent the statistical uncertainty from the PbPb data, while the boxes represent the systematic uncertainty. The box drawn around the line at unity depicts the systematic and statistical uncertainties from pp as well as the systematic uncertainties due to the combined detection efficiency, which are applicable to all points. |

png pdf |
Figure 3:
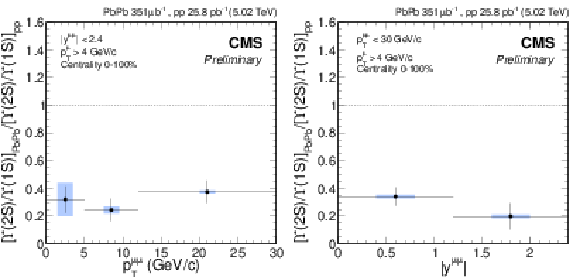
Double ratio of the $ {\Upsilon (\textrm {2S})} $ as a function of ${p_{\mathrm {T}}} $ (left) and rapidity (right). The error bars depict the statistical uncertainty while the boxes represent the systematic uncertainties (signal PDF, background PDF, and combined detection efficiency). The contributions from both PbPb and pp are incorporated in the uncertainties. |

png pdf |
Figure 3-a:
Double ratio of the $ {\Upsilon (\textrm {2S})} $ as a function of ${p_{\mathrm {T}}} $. The error bars depict the statistical uncertainty while the boxes represent the systematic uncertainties (signal PDF, background PDF, and combined detection efficiency). The contributions from both PbPb and pp are incorporated in the uncertainties. |

png pdf |
Figure 3-b:
Double ratio of the $ {\Upsilon (\textrm {2S})} $ as a function of rapidity. The error bars depict the statistical uncertainty while the boxes represent the systematic uncertainties (signal PDF, background PDF, and combined detection efficiency). The contributions from both PbPb and pp are incorporated in the uncertainties. |

png pdf |
Figure 4:
Upper limits at 95% CL (blue arrows) and 68% CL (red boxes) of the $ {\Upsilon (\textrm {3S})}$ double ratio as a function of centrality. The centrality-integrated limit is shown in the right sub-panel. |
| Summary |
| In summary, we presented measurements of the ${\Upsilon (\textrm {2S})}$ and ${\Upsilon (\textrm {3S})}$ double ratios, at 5.02 TeV, using pp and PbPb data samples significantly larger than those used in the measurement reported in Ref. [16], devoted to the 2.76 TeV data. Indeed, the integrated luminosities increased by a factor of 2.3 for the PbPb sample and by more than a factor 100 for the pp sample. Furthermore, the ${\Upsilon}$ production cross sections should increase with the collision energy by around a factor of 1.8, from 2.76 to 5.02 TeV. The centrality-integrated double ratios are $DR_{21} =$ 0.308 $\pm$ 0.055(stat) $\pm$ 0.017(syst) for the ${\Upsilon (\textrm {2S})}$ and $DR_{31} < $ 0.26 at 95% CL for the ${\Upsilon (\textrm {3S})}$. The large relative suppression of the ${\Upsilon (\textrm {2S})}$ does not show significant variations with $p_{\mathrm{T}}$ and $| y | $, within the explored phase space window of $p_{\mu\mu} < $ 30 GeV/$c$ and $ | y_{\mu\mu} | < $ 2.4. In the most peripheral bin (70-100%), the ${\Upsilon (\textrm {2S})}$ double ratio is consistent with unity. For the most central bin (0-5%), it is consistent with zero and the upper limit on the double ratio is evaluated to be 0.36 at 95% CL. The ${\Upsilon (\textrm {3S})}$ double ratio is significantly lower than unity in all centrality bins of the analysis and there is no indication that the suppression is weaker in the most peripheral events probed in our study. |
| Additional Figures | |

png pdf |
Additional Figure 1:
Double ratio of ${\Upsilon (\textrm {2S})}$ as a function of centrality. The centrality-integrated value is shown in the right sub-panel. The error bars represent the statistical uncertainty from the PbPb data, while the boxes represent the systematic uncertainty. The box drawn around the line at unity depicts the systematic and statistical uncertainties from pp as well as the systematic uncertainties due to the combined detection efficiency, which are applicable to all points. Theory curves are also shown, for different shear viscosity over entropy ratios [1]. |
| References | ||||
| 1 | T. Matsui and H. Satz | $ \mathrm{J}/\psi $ Suppression by Quark-Gluon Plasma Formation | PLB 178 (1986) 416 | |
| 2 | N. Brambilla et al. | Heavy quarkonium: progress, puzzles, and opportunities | EPJC 71 (2011) 1534 | 1010.5827 |
| 3 | A. Andronic et al. | Heavy-flavour and quarkonium production in the LHC era: from proton–proton to heavy-ion collisions | EPJC 76 (2016) 107 | 1506.03981 |
| 4 | M. Cheng et al. | Equation of State for physical quark masses | PRD 81 (2010) 054504 | 0911.2215 |
| 5 | Wuppertal-Budapest Collaboration | Is there still any $ T_c $ mystery in lattice QCD? Results with physical masses in the continuum limit III | JHEP 09 (2010) 073 | 1005.3508 |
| 6 | S. Digal, P. Petreczky, and H. Satz | Quarkonium feed down and sequential suppression | PRD 64 (2001) 094015 | hep-ph/0106017 |
| 7 | A. Mocsy and P. Petreczky | Color screening melts quarkonium | PRL 99 (2007) 211602 | 0706.2183 |
| 8 | M. Laine, O. Philipsen, P. Romatschke, and M. Tassler | Real-time static potential in hot QCD | JHEP 03 (2007) 054 | hep-ph/0611300 |
| 9 | A. Dumitru, Y. Guo, and M. Strickland | The Imaginary part of the static gluon propagator in an anisotropic (viscous) QCD plasma | PRD 79 (2009) 114003 | 0903.4703 |
| 10 | A. Rothkopf, T. Hatsuda, and S. Sasaki | Complex Heavy-Quark Potential at Finite Temperature from Lattice QCD | PRL 108 (2012) 162001 | 1108.1579 |
| 11 | Y. Burnier, O. Kaczmarek, and A. Rothkopf | Quarkonium at finite temperature: Towards realistic phenomenology from first principles | JHEP 12 (2015) 101 | 1509.07366 |
| 12 | R. L. Thews, M. Schroedter, and J. Rafelski | Enhanced $ \mathrm{J}/\psi $ production in deconfined quark matter | PRC 63 (2001) 054905 | hep-ph/0007323 |
| 13 | M. I. Gorenstein, A. P. Kostyuk, H. Stoecker, and W. Greiner | Statistical coalescence model with exact charm conservation | PLB 509 (2001) 277 | hep-ph/0010148 |
| 14 | A. Andronic, P. Braun-Munzinger, K. Redlich, and J. Stachel | Evidence for charmonium generation at the phase boundary in ultra-relativistic nuclear collisions | PLB 652 (2007) 259 | nucl-th/0701079 |
| 15 | ALICE Collaboration | Centrality, rapidity and transverse momentum dependence of $ \mathrm{J}/\psi $ suppression in Pb-Pb collisions at $ \sqrt{s_{\rm NN}} $ = 2.76 TeV | PLB 734 (2014) 314 | 1311.0214 |
| 16 | CMS Collaboration | Observation of sequential Upsilon suppression in PbPb collisions | PRL 109 (2012) 222301 | CMS-HIN-11-011 1208.2826 |
| 17 | B. Krouppa and M. Strickland | Predictions for bottomonia suppression in 5.023 TeV Pb-Pb collisions | 1605.03561 | |
| 18 | CMS Collaboration | The CMS experiment at the CERN LHC | JINST 3 (2008) S08004 | CMS-00-001 |
| 19 | CMS Collaboration | Performance of CMS muon reconstruction in $ pp $ collision events at $ \sqrt{s}=7 $ TeV | JINST 7 (2012) P10002 | CMS-MUO-10-004 1206.4071 |
| 20 | CMS Collaboration | Dependence on pseudorapidity and centrality of charged hadron production in PbPb collisions at a nucleon-nucleon centre-of-mass energy of 2.76 TeV | JHEP 08 (2011) 141 | CMS-HIN-10-001 1107.4800 |
| 21 | C. Loizides, J. Nagle, and P. Steinberg | Improved version of the PHOBOS Glauber Monte Carlo | SoftwareX 1-2 (2015) 13 | 1408.2549 |
| 22 | M. J. Oreglia | A study of the reactions $\psi' \to \gamma\gamma \psi$ | PhD thesis, Stanford University, 1980 SLAC Report SLAC-R-236, see A | |
| 23 | Particle Data Group Collaboration | Review of Particle Physics | CPC 38 (2014) 090001 | |
| 24 | H. Akaike | A new look at the statistical model identification | IEEE Trans. Autom. Control 19 (1974) 716 | |
| 25 | K. Burnham and D. Anderson | Multimodel inference: understanding AIC and BIC in model selection | Sociol. Methods Res. 33 (2004) 261 | |
| 26 | T. Sjostrand, S. Mrenna, and P. Skands | PYTHIA 6.4 physics and manual | JHEP 05 (2006) 026 | hep-ph/0603175 |
| 27 | CMS Collaboration | Indications of suppression of excited $ \varUpsilon $ states in PbPb collisions at $ \sqrt{S_{NN}} $ = 2.76 TeV | PRL 107 (2011) 052302 | CMS-HIN-11-007 1105.4894 |
| 28 | CMS Collaboration | Event activity dependence of Y(nS) production in $ \sqrt{s_{NN}} $=5.02 TeV pPb and $ \sqrt{s} $=2.76 TeV pp collisions | JHEP 04 (2014) 103 | CMS-HIN-13-003 1312.6300 |
| 29 | CMS Collaboration | Measurement of Prompt $ \psi(2S) \to \mathrm{J}/\psi $ Yield Ratios in PbPb and pp Collisions at $ \sqrt {s_{NN}} = $ 2.76 TeV | PRL 113 (2014) 262301 | CMS-HIN-12-007 1410.1804 |
| 30 | G. J. Feldman and R. D. Cousins | A Unified approach to the classical statistical analysis of small signals | PRD 57 (1998) 3873 | physics/9711021 |

|
Compact Muon Solenoid LHC, CERN |

|

|

|

|

|

|