

Compact Muon Solenoid
LHC, CERN
| CMS-PAS-EXO-25-004 | ||
| Search for resonant production of pairs of dijet resonances in proton-proton collisions at $ \sqrt{s} = $ 13.6 TeV | ||
| CMS Collaboration | ||
| 2025-10-27 | ||
| Abstract: A search for a resonance, decaying to pairs of dijet resonances with the same mass, is conducted in final states with at least four individually resolved jets and four-jet masses above 1.6 TeV. The search is conducted using data collected by the CMS experiment, during the year 2024, in pp collisions at a center-of-mass energy of 13.6 TeV. Our benchmark model is a diquark, decaying to a pair of vector-like quarks, which in turn decay to a pair of jets. This model probes resonant production in the four-jet and dijet mass distributions. Both upper limits at 95% confidence level and significances are reported on the production cross section of new resonances as a function of their masses. This search does not observe any events with four-jet mass around 8 TeV, where in a previous analysis at $ \sqrt{s}= $ 13 TeV an excess with a local (global) significance of 3.9 (1.6) standard deviations was observed. | ||
| Links: CDS record (PDF) ; CADI line (restricted) ; | ||
| Figures | |
png pdf |
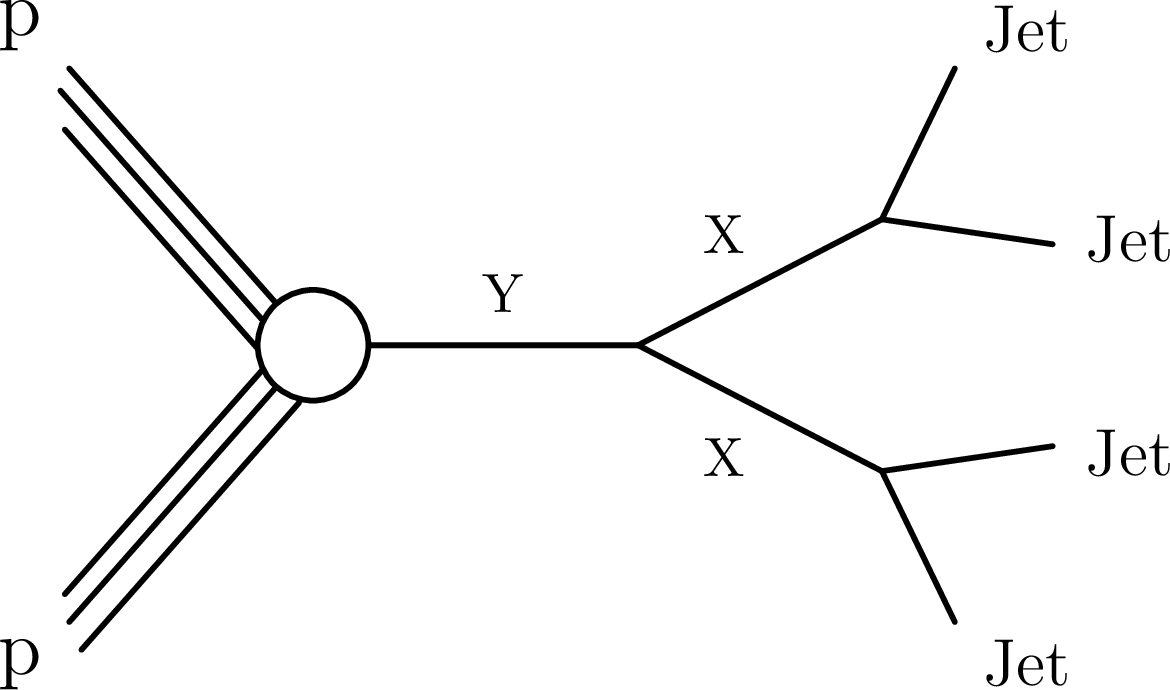
Figure 1:
Resonant production via a particle, Y, of pairs of dijet resonances, X. |
png pdf |
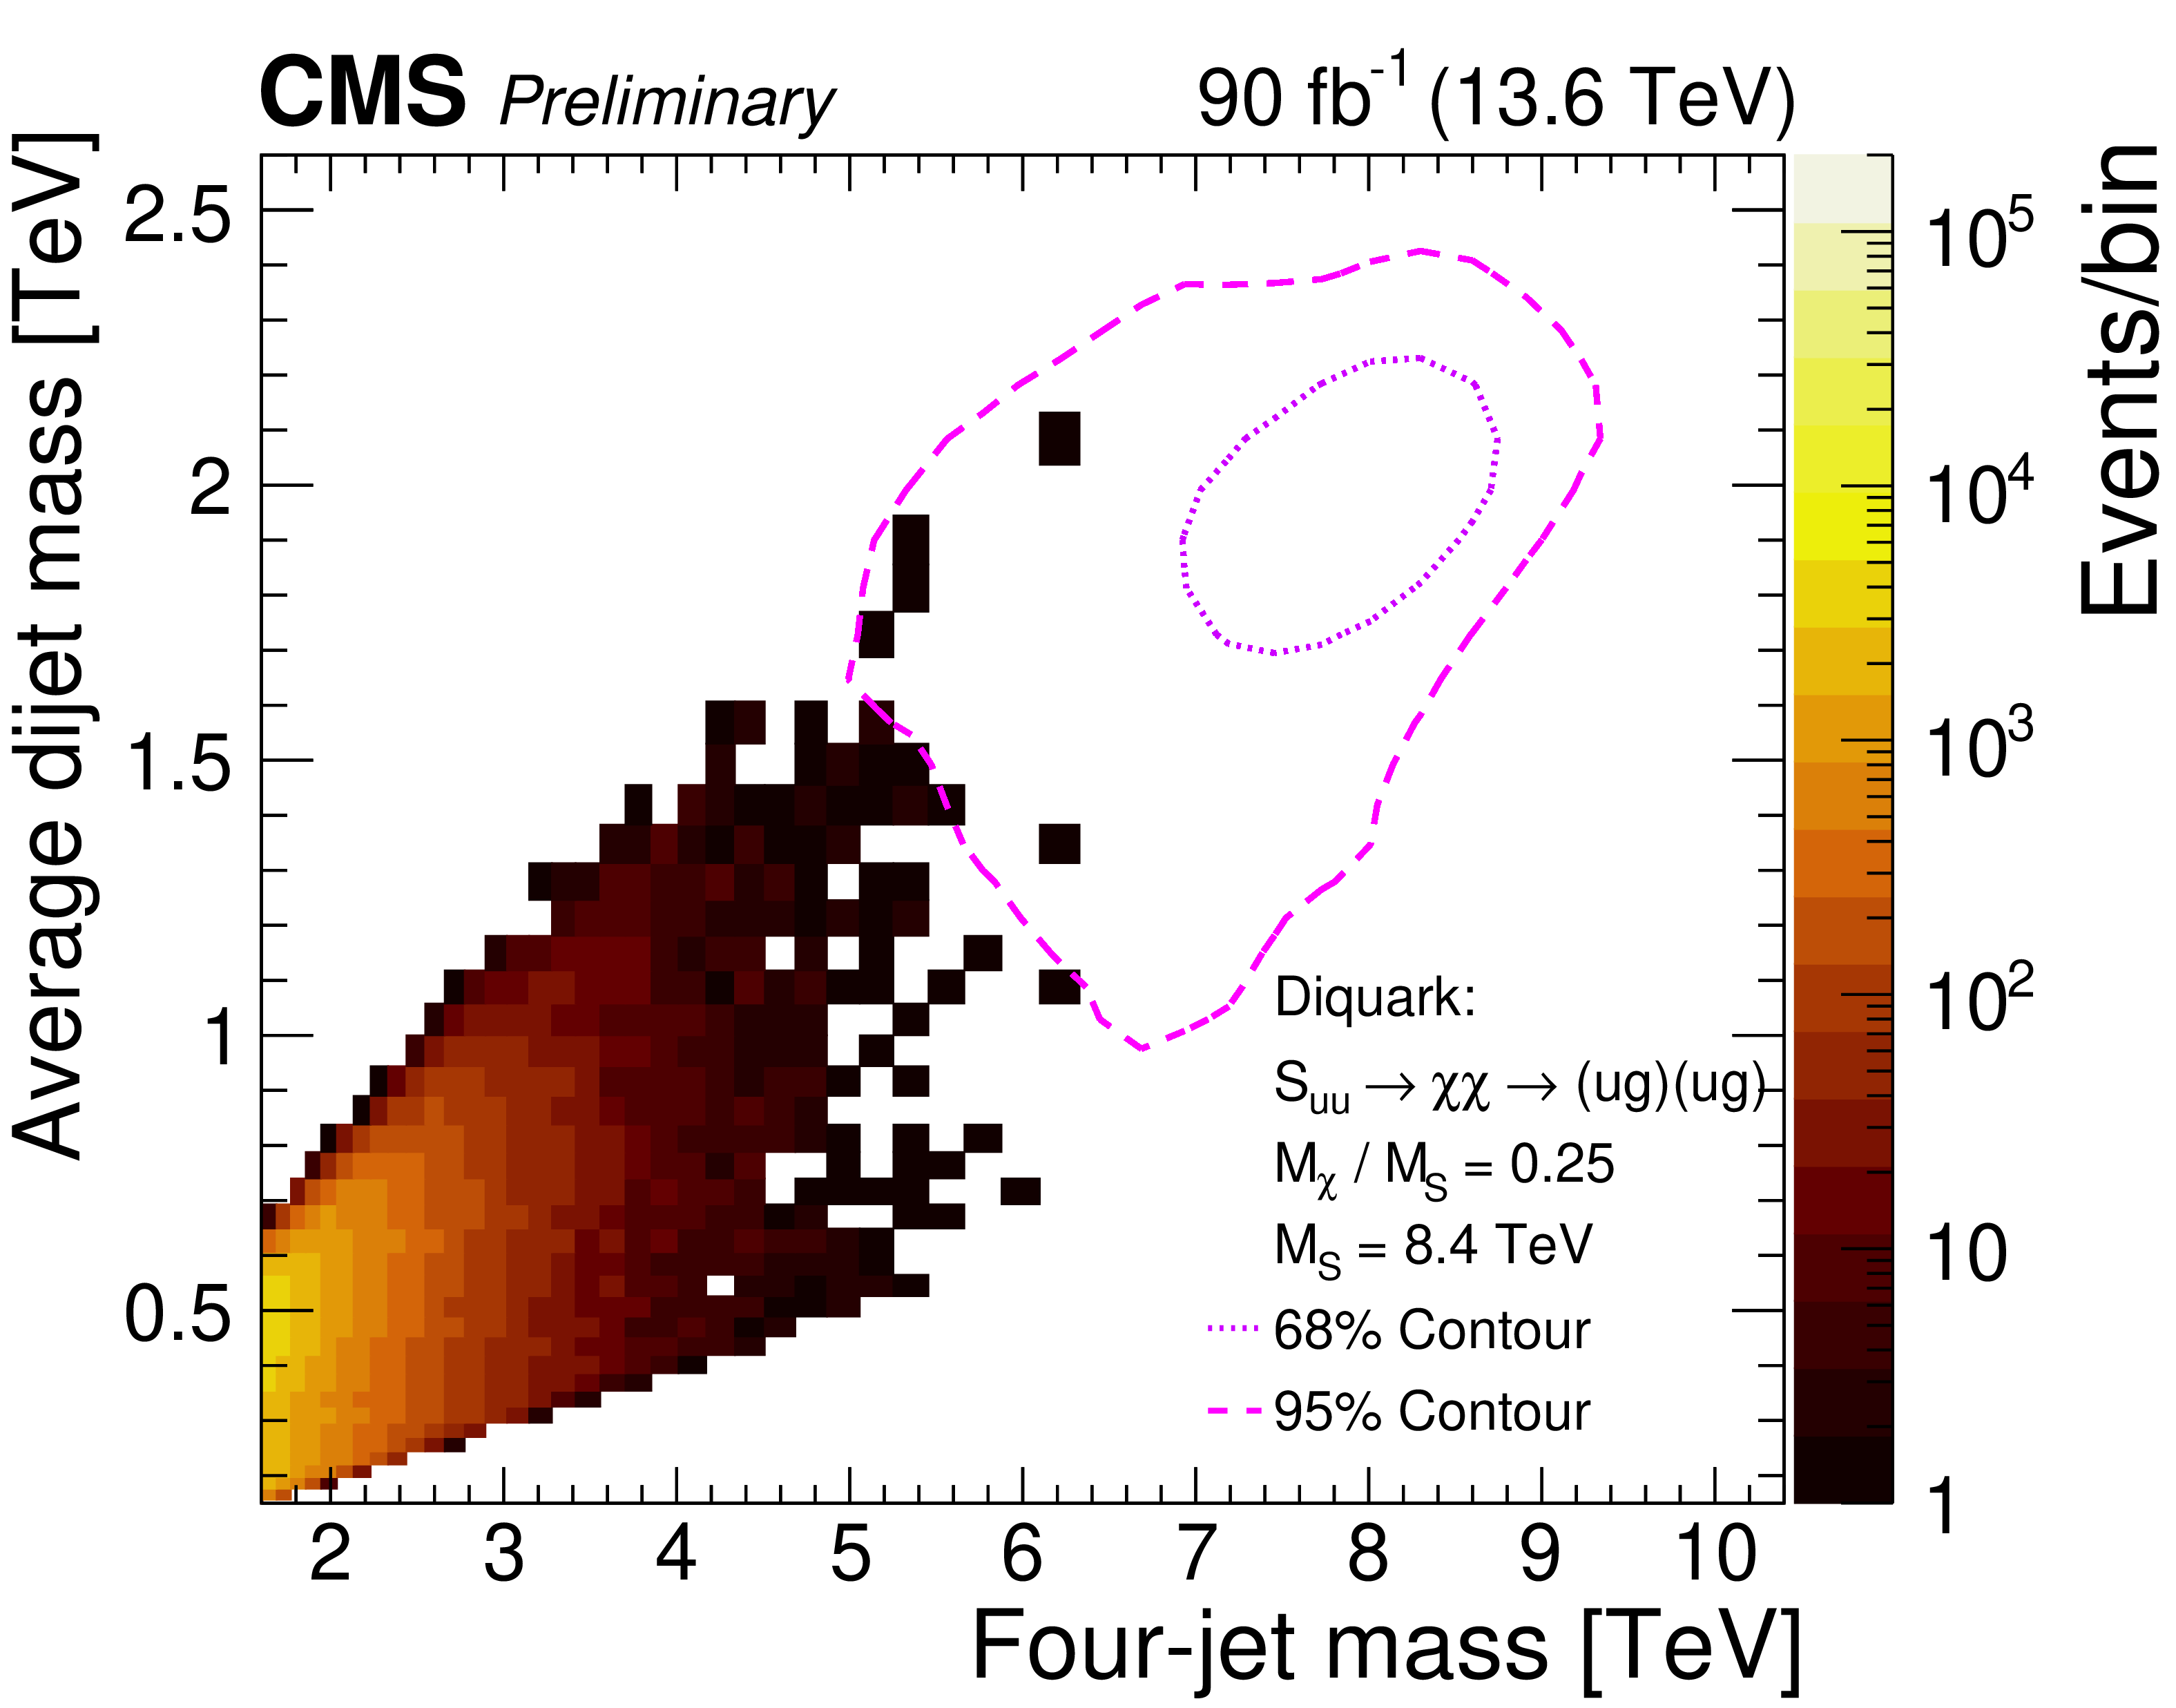
Figure 2:
Number of observed events (color scale) within bins of the four-jet mass and the average mass of the two dijets. The dotted and dashed curves show the 68% and 95% probability contours, respectively, from a signal simulation of a diquark with a mass of 8.4 TeV, decaying to a pair of vector-like quarks, each with a mass of 2.1 TeV. |
png pdf |
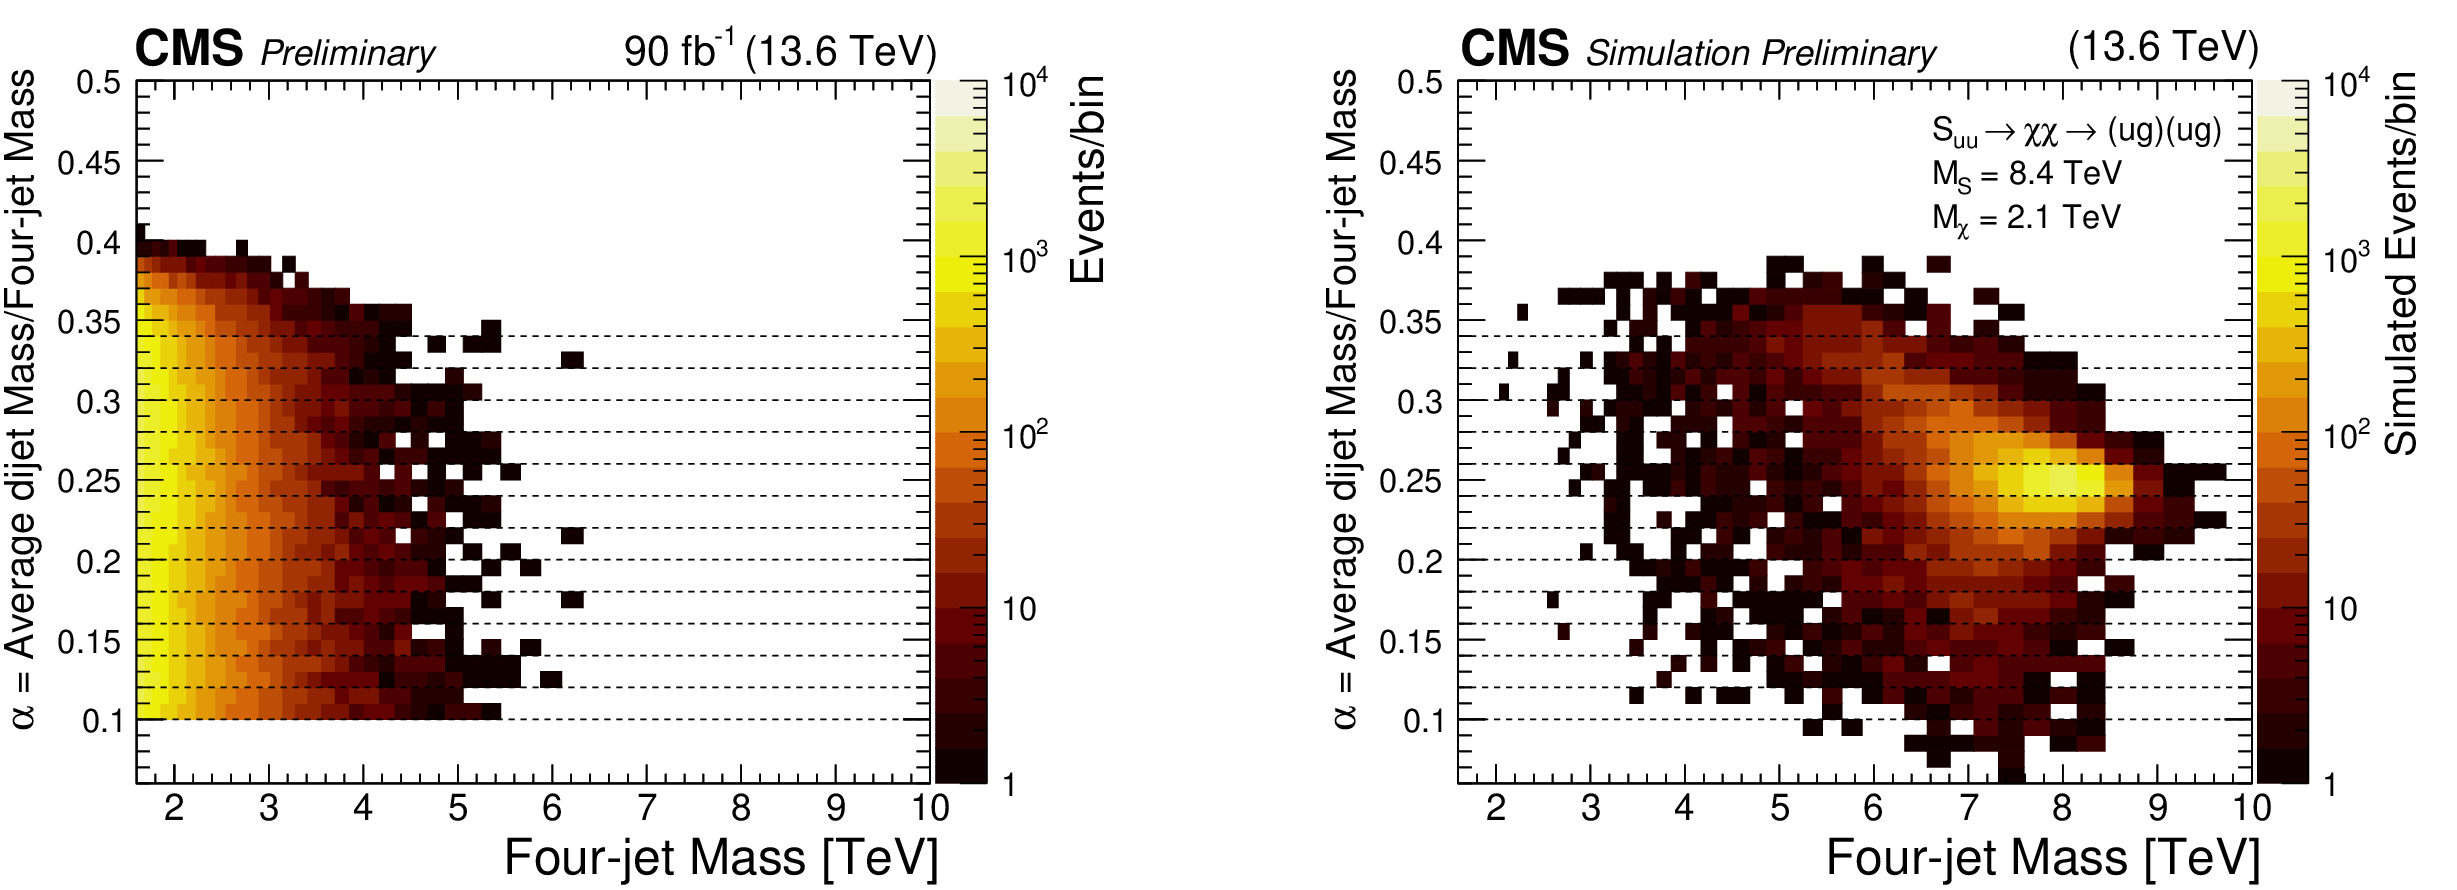
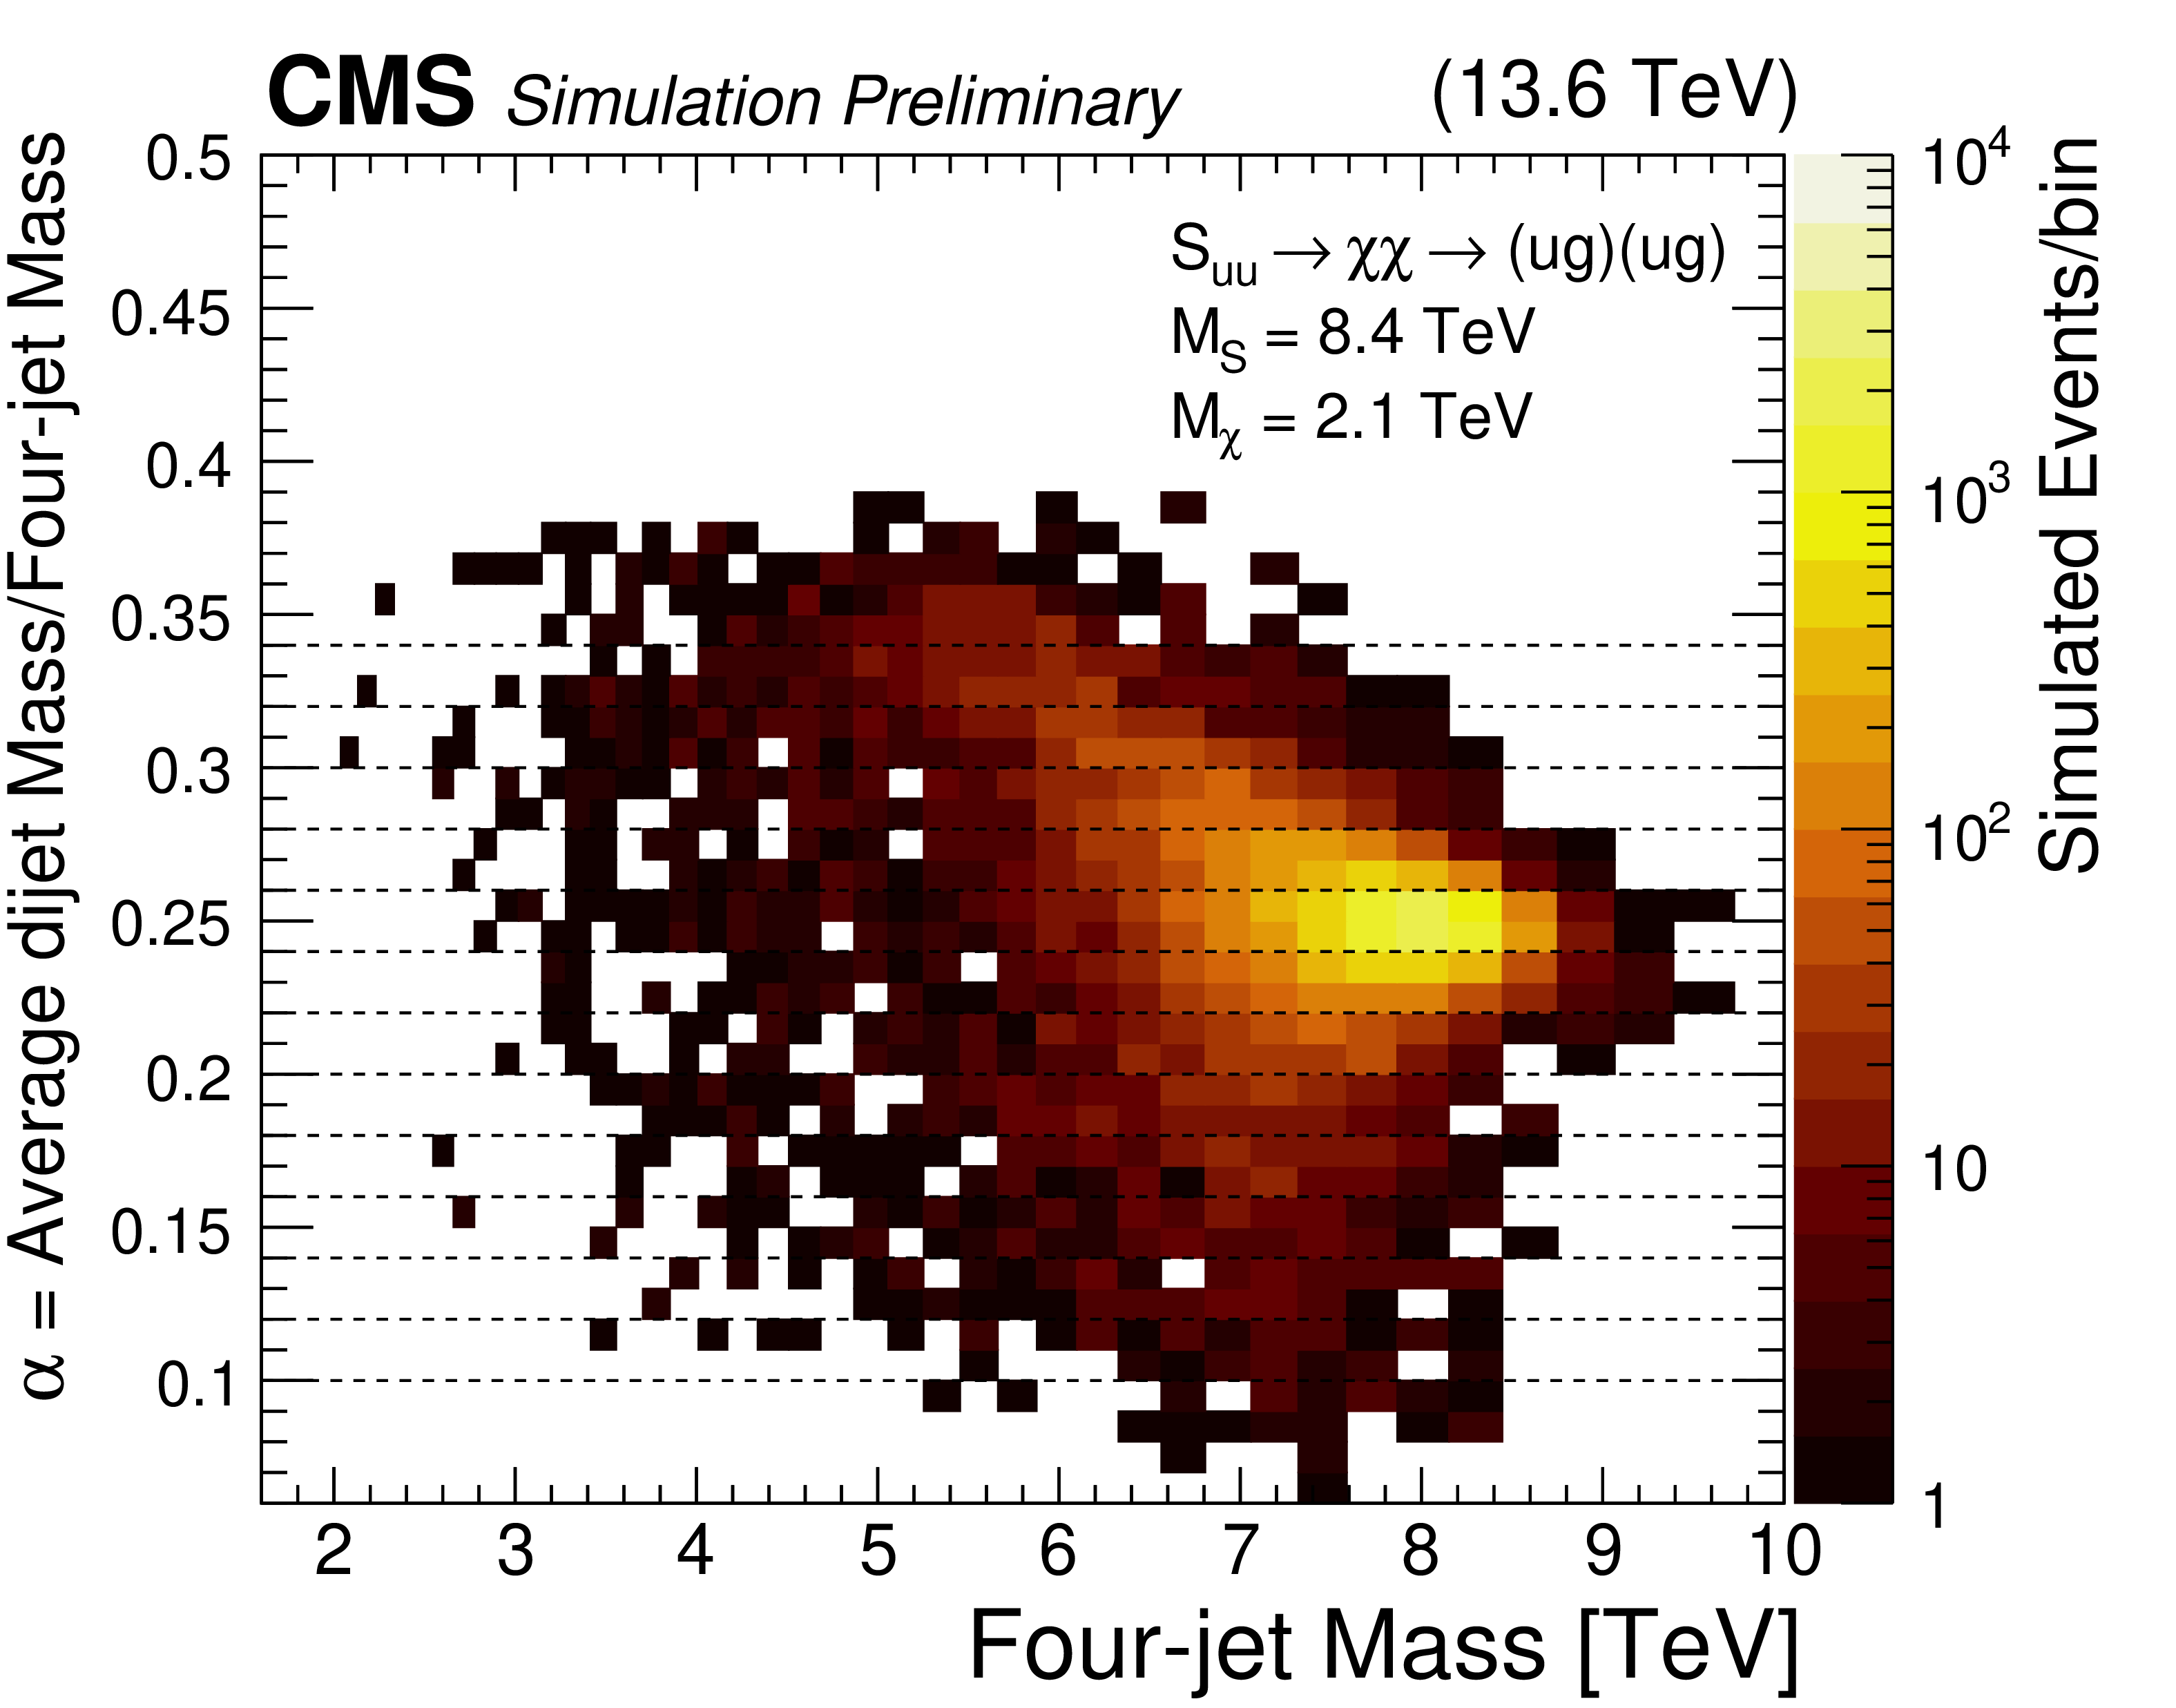
Figure 3:
(Left) Number of observed events (color scale) within bins of the four-jet mass and the ratio $ \alpha $, which is the average mass of the two dijets divided by the four-jet mass. (Right) Number of events predicted in the same bins by a simulation of a diquark with a mass of 8.4 TeV, decaying to a pair of vector-like quarks, each with a mass of 2.1 TeV. Both distributions also show the thirteen $ \alpha $ bins used to define the four-jet mass distributions used in the search (dashed lines). |
png pdf |
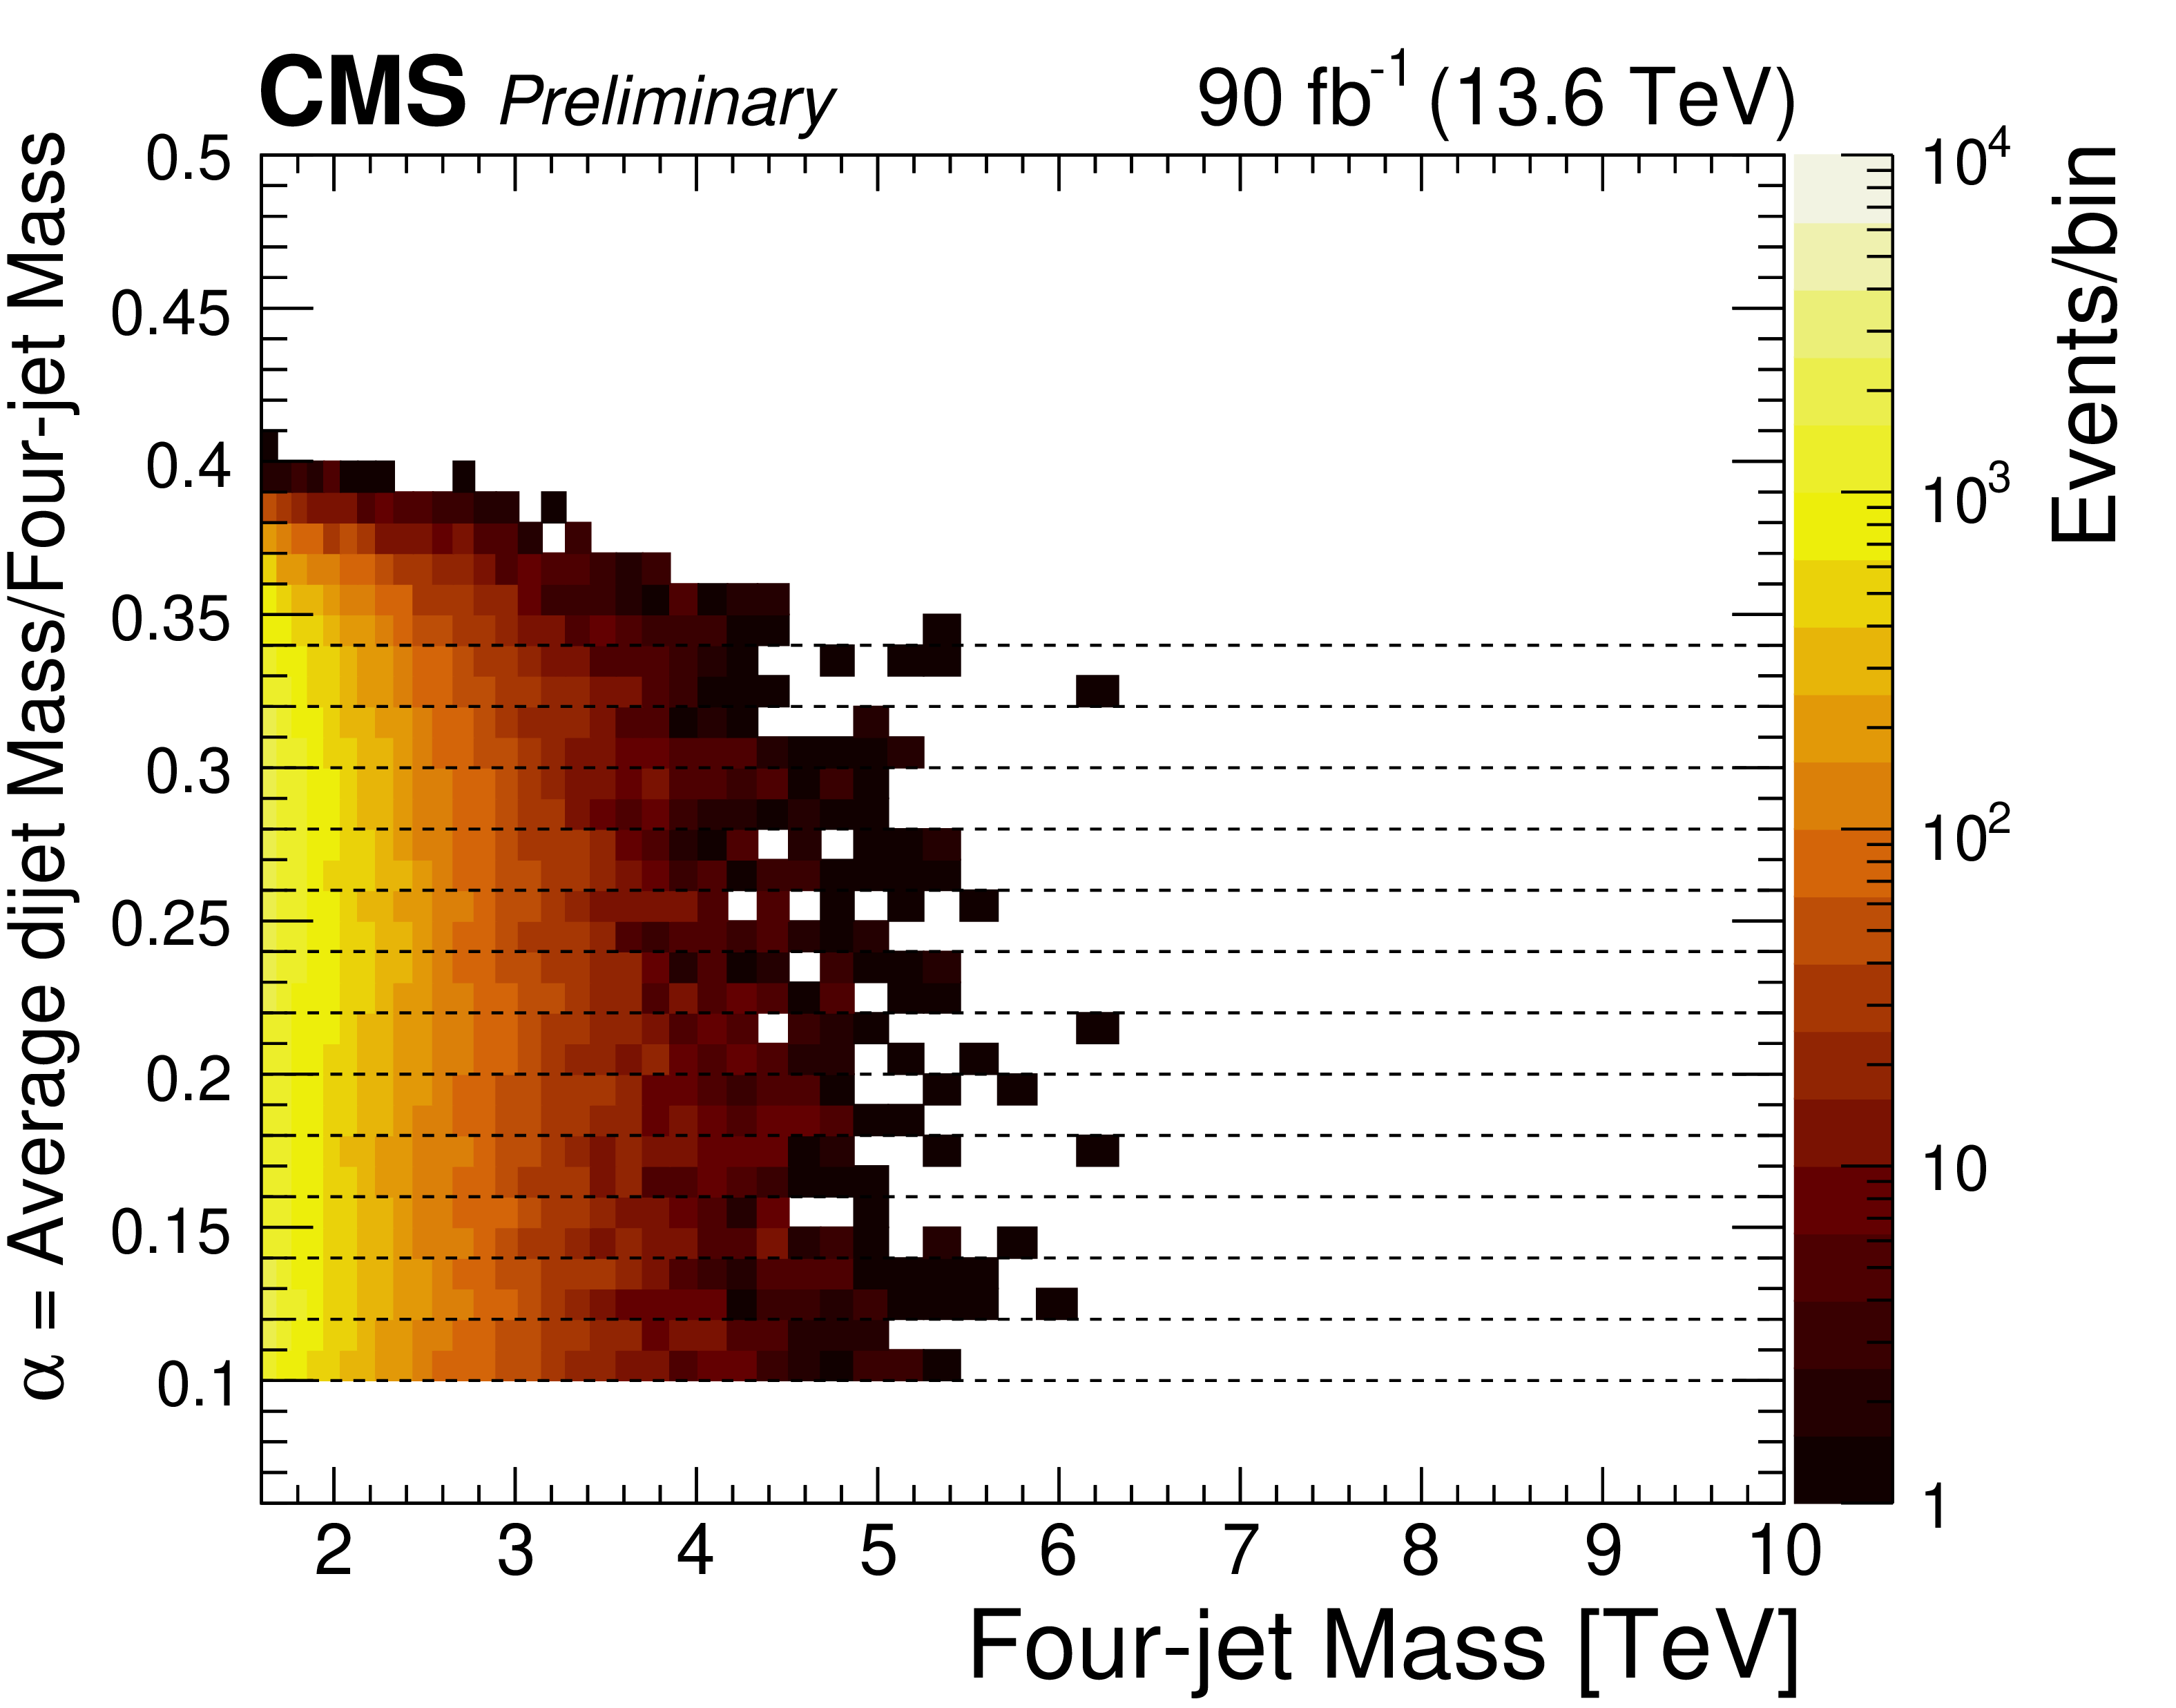
Figure 3-a:
(Left) Number of observed events (color scale) within bins of the four-jet mass and the ratio $ \alpha $, which is the average mass of the two dijets divided by the four-jet mass. (Right) Number of events predicted in the same bins by a simulation of a diquark with a mass of 8.4 TeV, decaying to a pair of vector-like quarks, each with a mass of 2.1 TeV. Both distributions also show the thirteen $ \alpha $ bins used to define the four-jet mass distributions used in the search (dashed lines). |
png pdf |
Figure 3-b:
(Left) Number of observed events (color scale) within bins of the four-jet mass and the ratio $ \alpha $, which is the average mass of the two dijets divided by the four-jet mass. (Right) Number of events predicted in the same bins by a simulation of a diquark with a mass of 8.4 TeV, decaying to a pair of vector-like quarks, each with a mass of 2.1 TeV. Both distributions also show the thirteen $ \alpha $ bins used to define the four-jet mass distributions used in the search (dashed lines). |
png pdf |
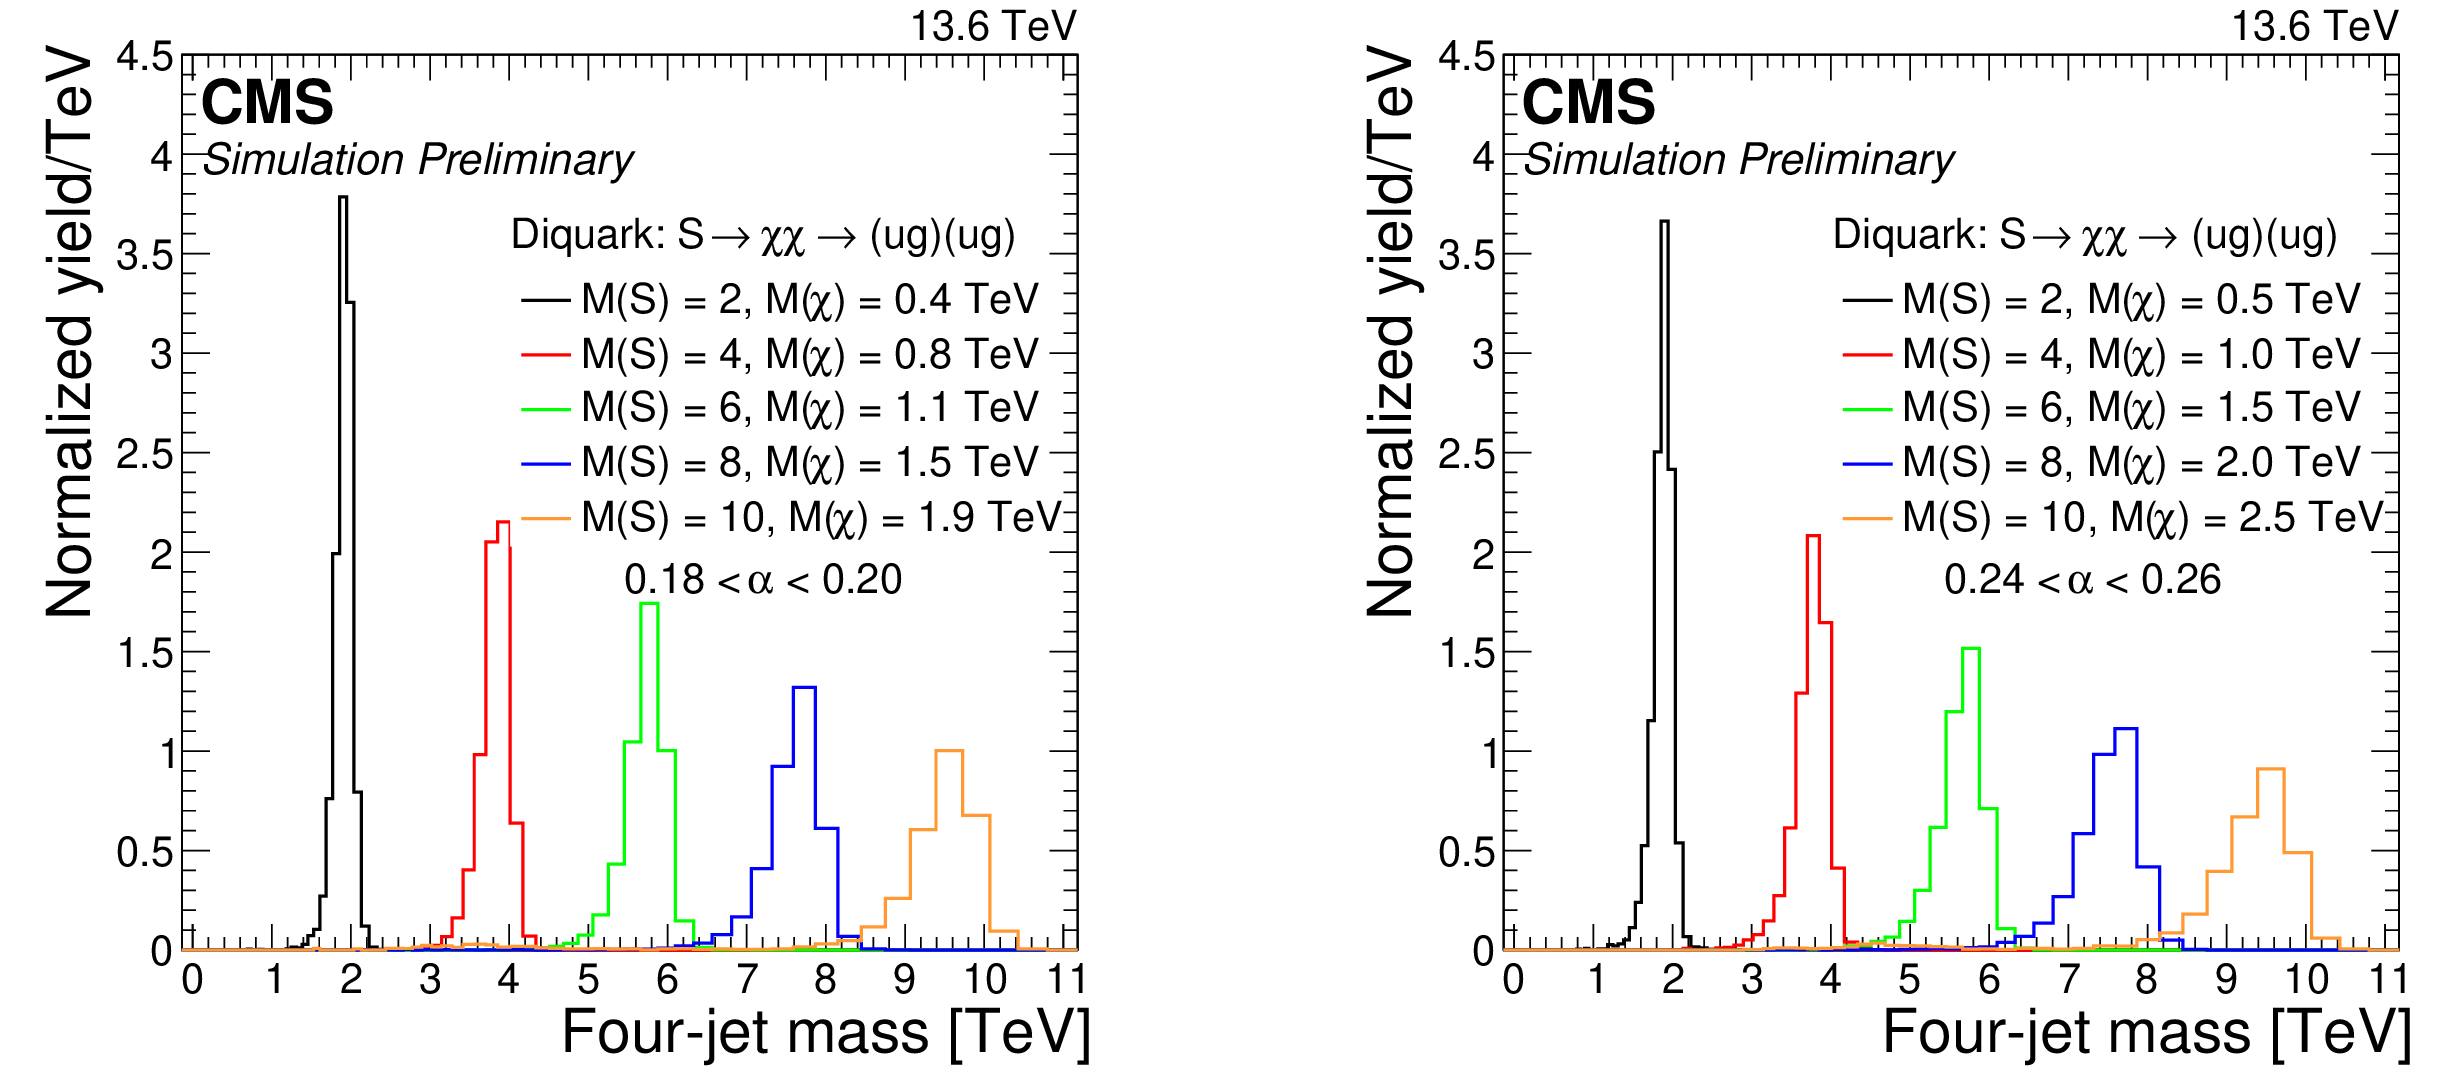
Figure 4:
Signal differential distributions as functions of four-jet mass for various resonance masses, shown for $ \alpha_{\mathrm{true}} = M(\mathrm{X})/M(\mathrm{Y}) = $ 0.19 (left) in the reconstructed 0.18 $ < \alpha < $ 0.20 bin and for $ \alpha_{\mathrm{true}} = M(\mathrm{X})/M(\mathrm{Y}) = $ 0.25 (right) in the reconstructed 0.24 $ < \alpha < $ 0.26 bin. These reconstructed $ \alpha $ bins contain the majority of the signal in each case. The integral of each distribution has been normalized to unity. |
png pdf |
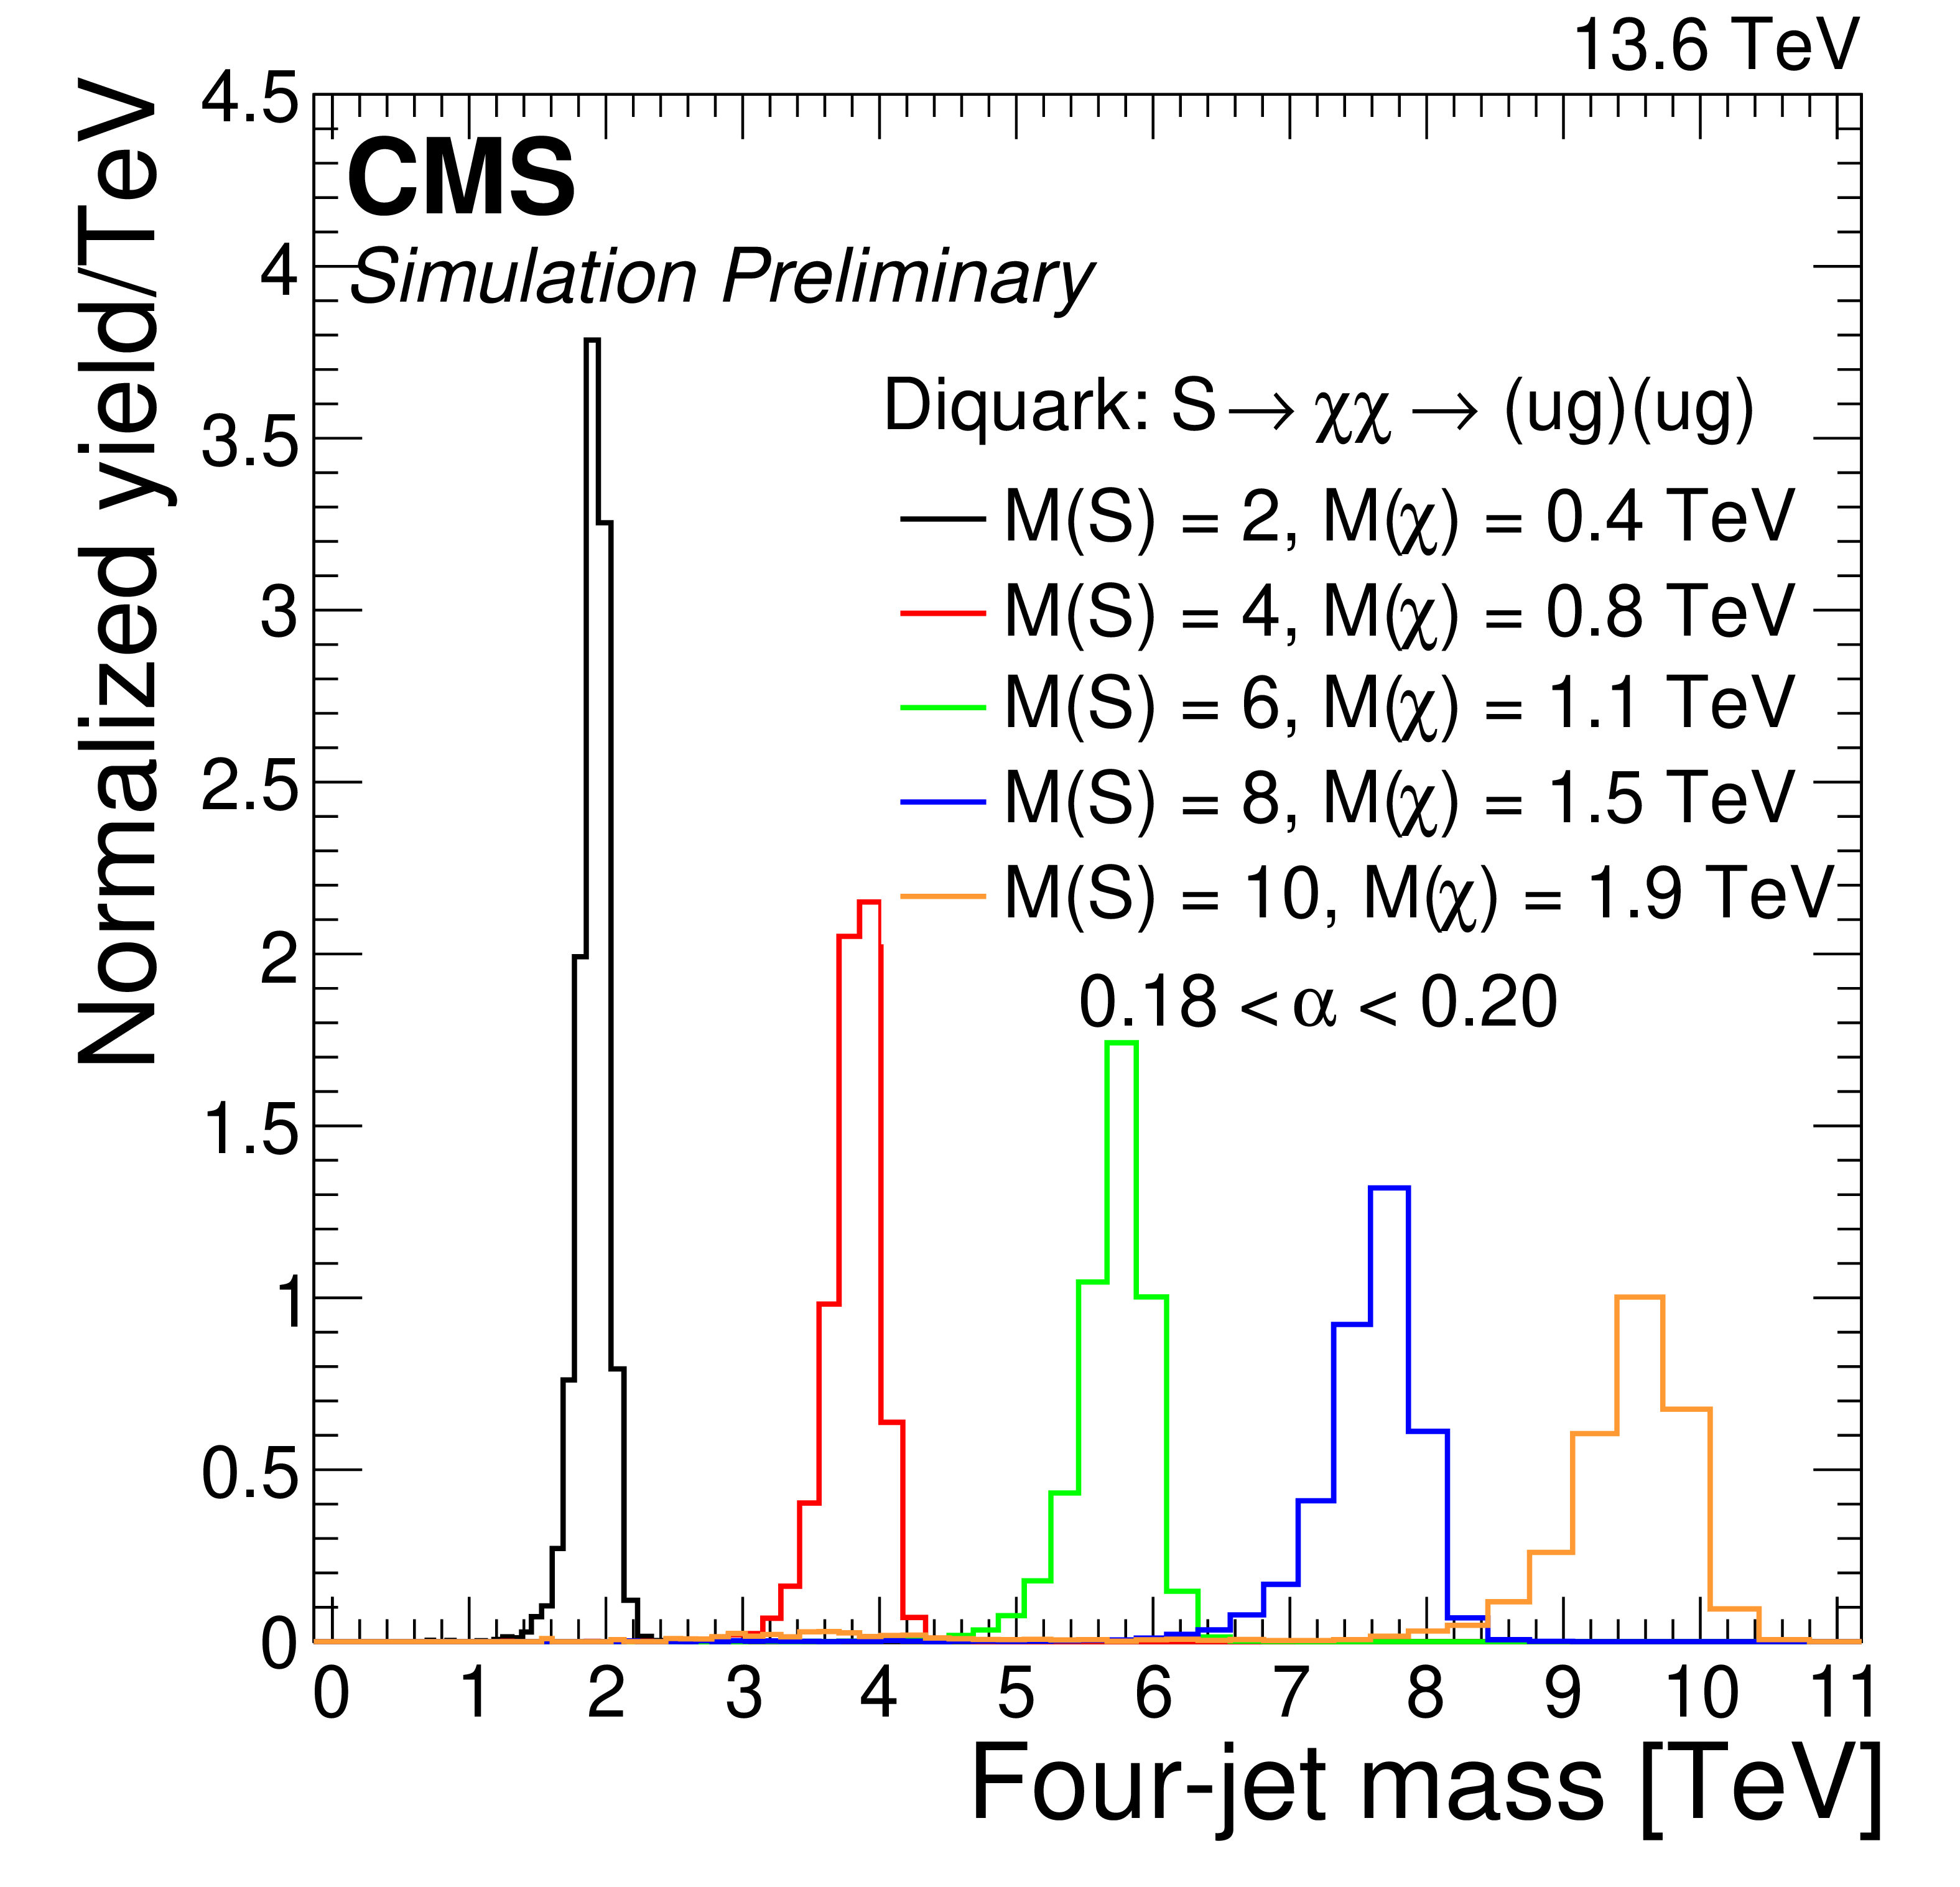
Figure 4-a:
Signal differential distributions as functions of four-jet mass for various resonance masses, shown for $ \alpha_{\mathrm{true}} = M(\mathrm{X})/M(\mathrm{Y}) = $ 0.19 (left) in the reconstructed 0.18 $ < \alpha < $ 0.20 bin and for $ \alpha_{\mathrm{true}} = M(\mathrm{X})/M(\mathrm{Y}) = $ 0.25 (right) in the reconstructed 0.24 $ < \alpha < $ 0.26 bin. These reconstructed $ \alpha $ bins contain the majority of the signal in each case. The integral of each distribution has been normalized to unity. |
png pdf |
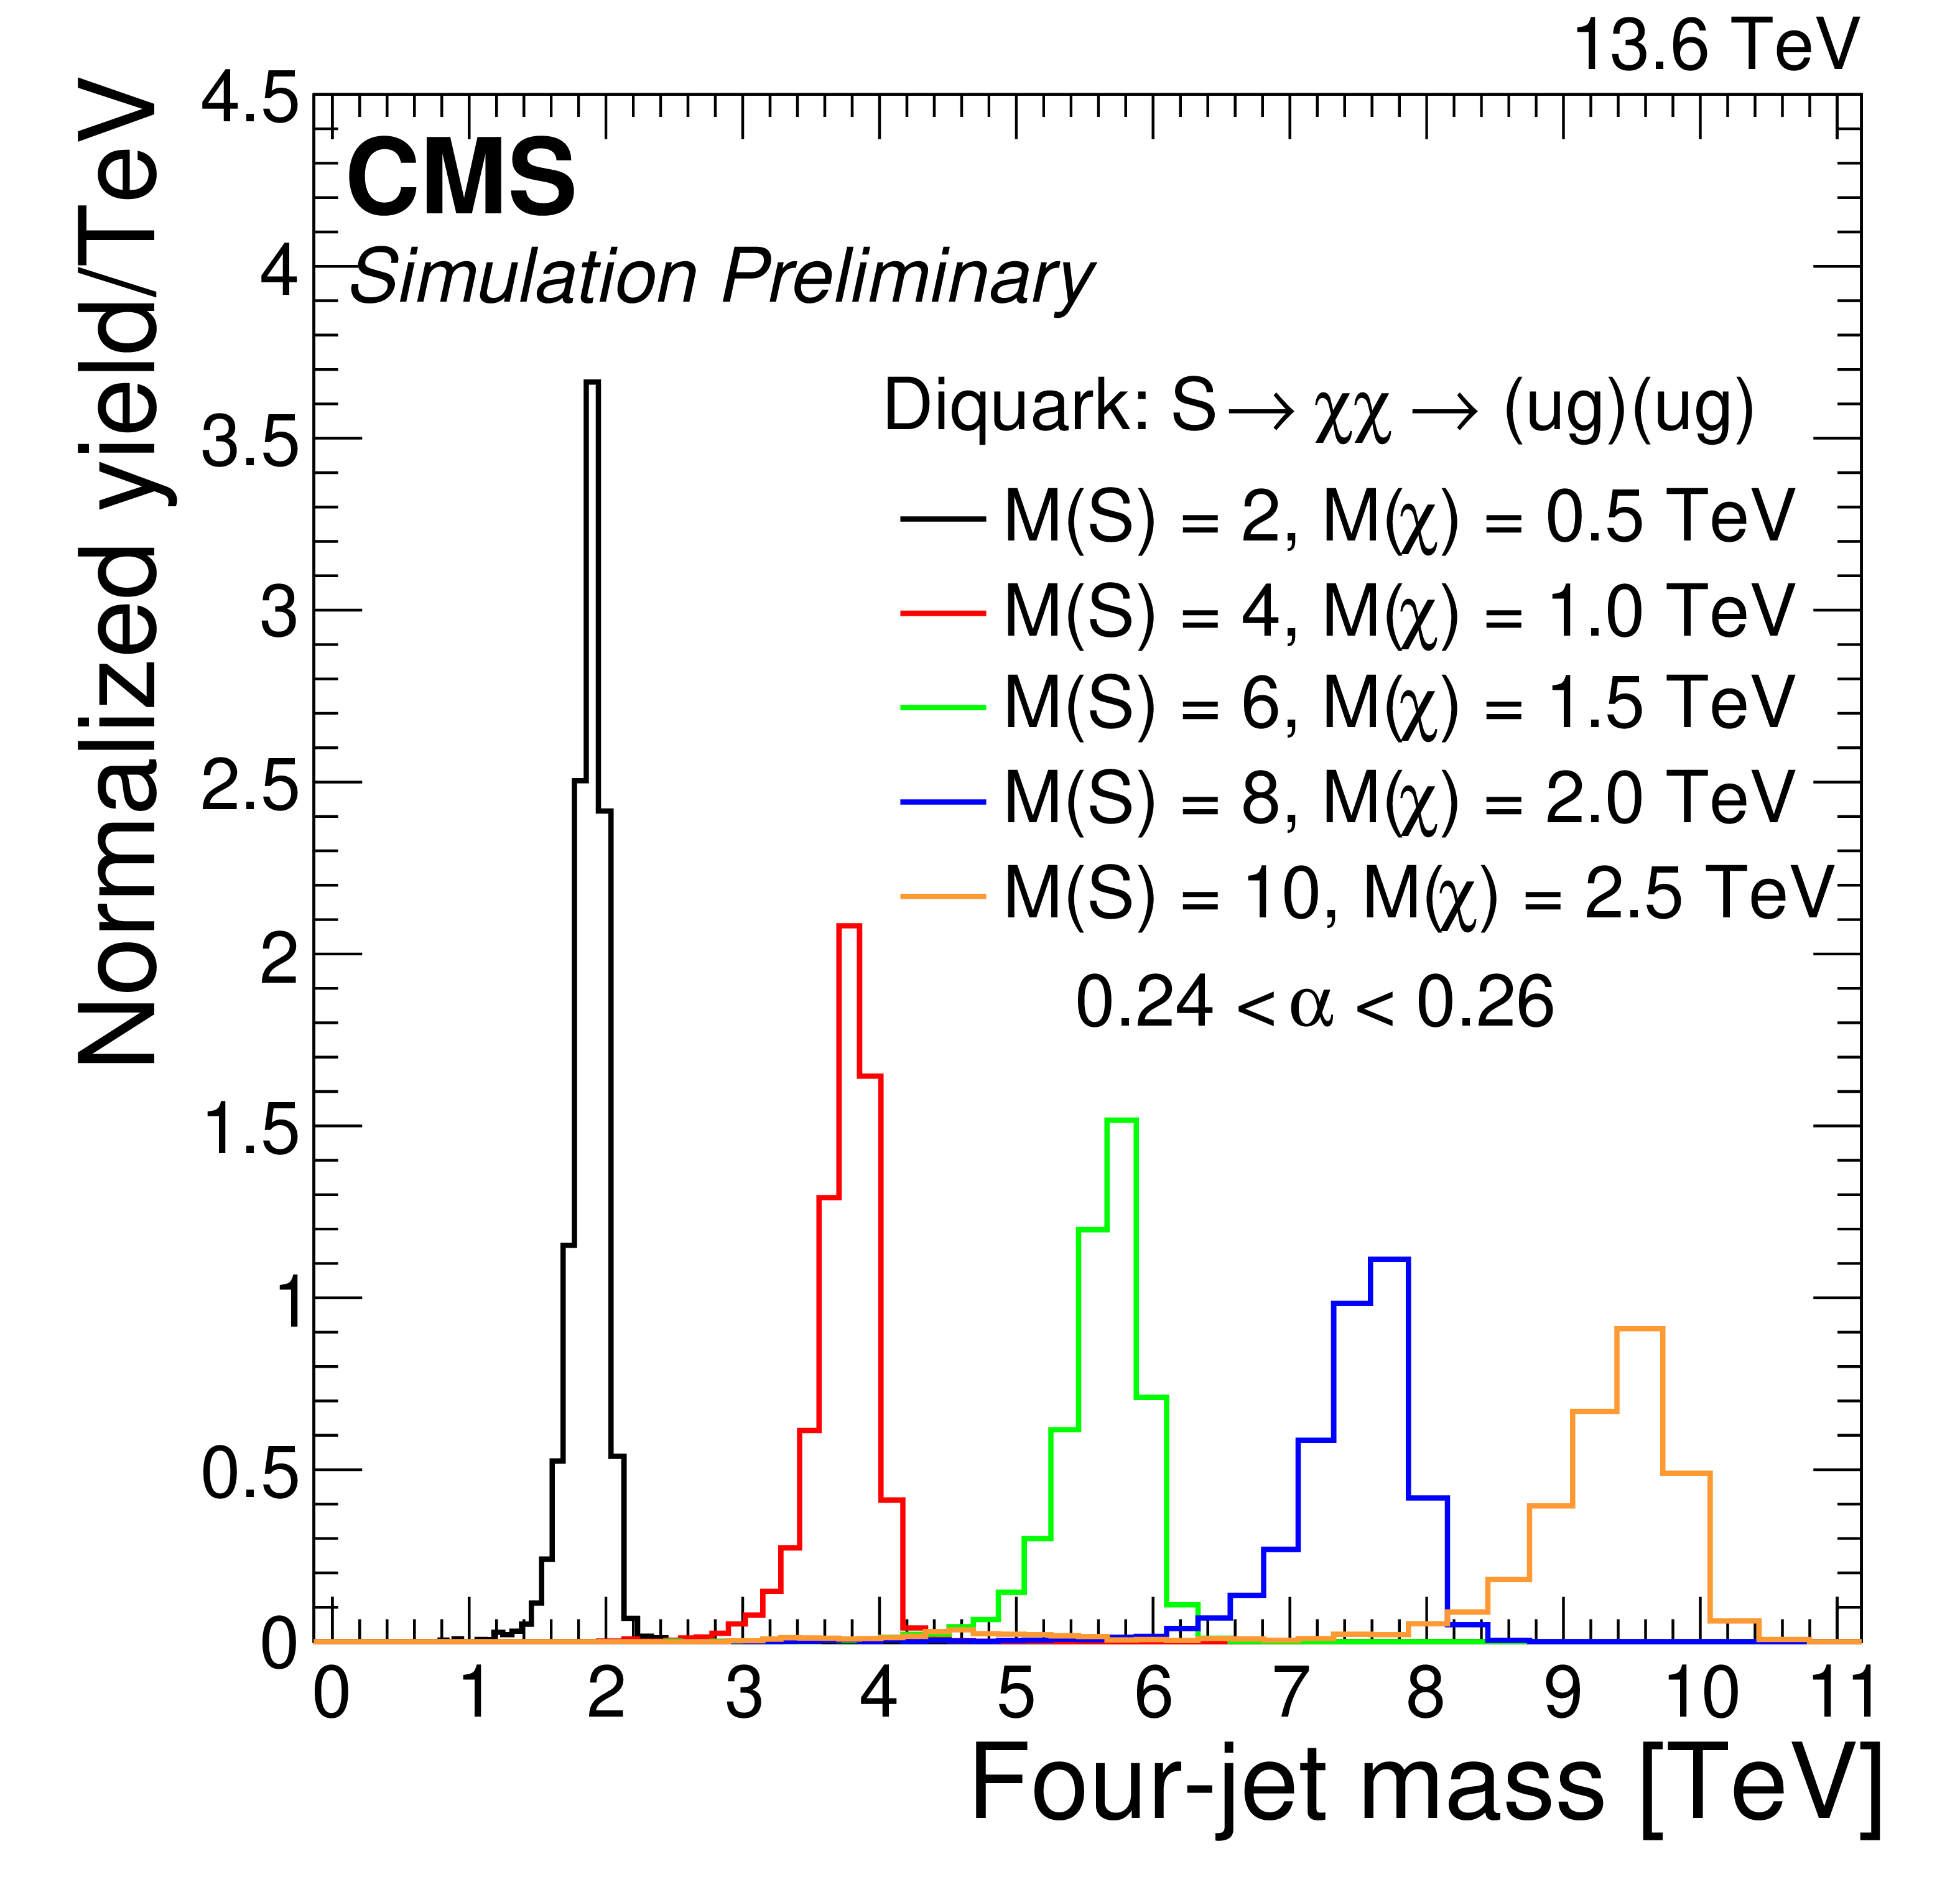
Figure 4-b:
Signal differential distributions as functions of four-jet mass for various resonance masses, shown for $ \alpha_{\mathrm{true}} = M(\mathrm{X})/M(\mathrm{Y}) = $ 0.19 (left) in the reconstructed 0.18 $ < \alpha < $ 0.20 bin and for $ \alpha_{\mathrm{true}} = M(\mathrm{X})/M(\mathrm{Y}) = $ 0.25 (right) in the reconstructed 0.24 $ < \alpha < $ 0.26 bin. These reconstructed $ \alpha $ bins contain the majority of the signal in each case. The integral of each distribution has been normalized to unity. |
png pdf |
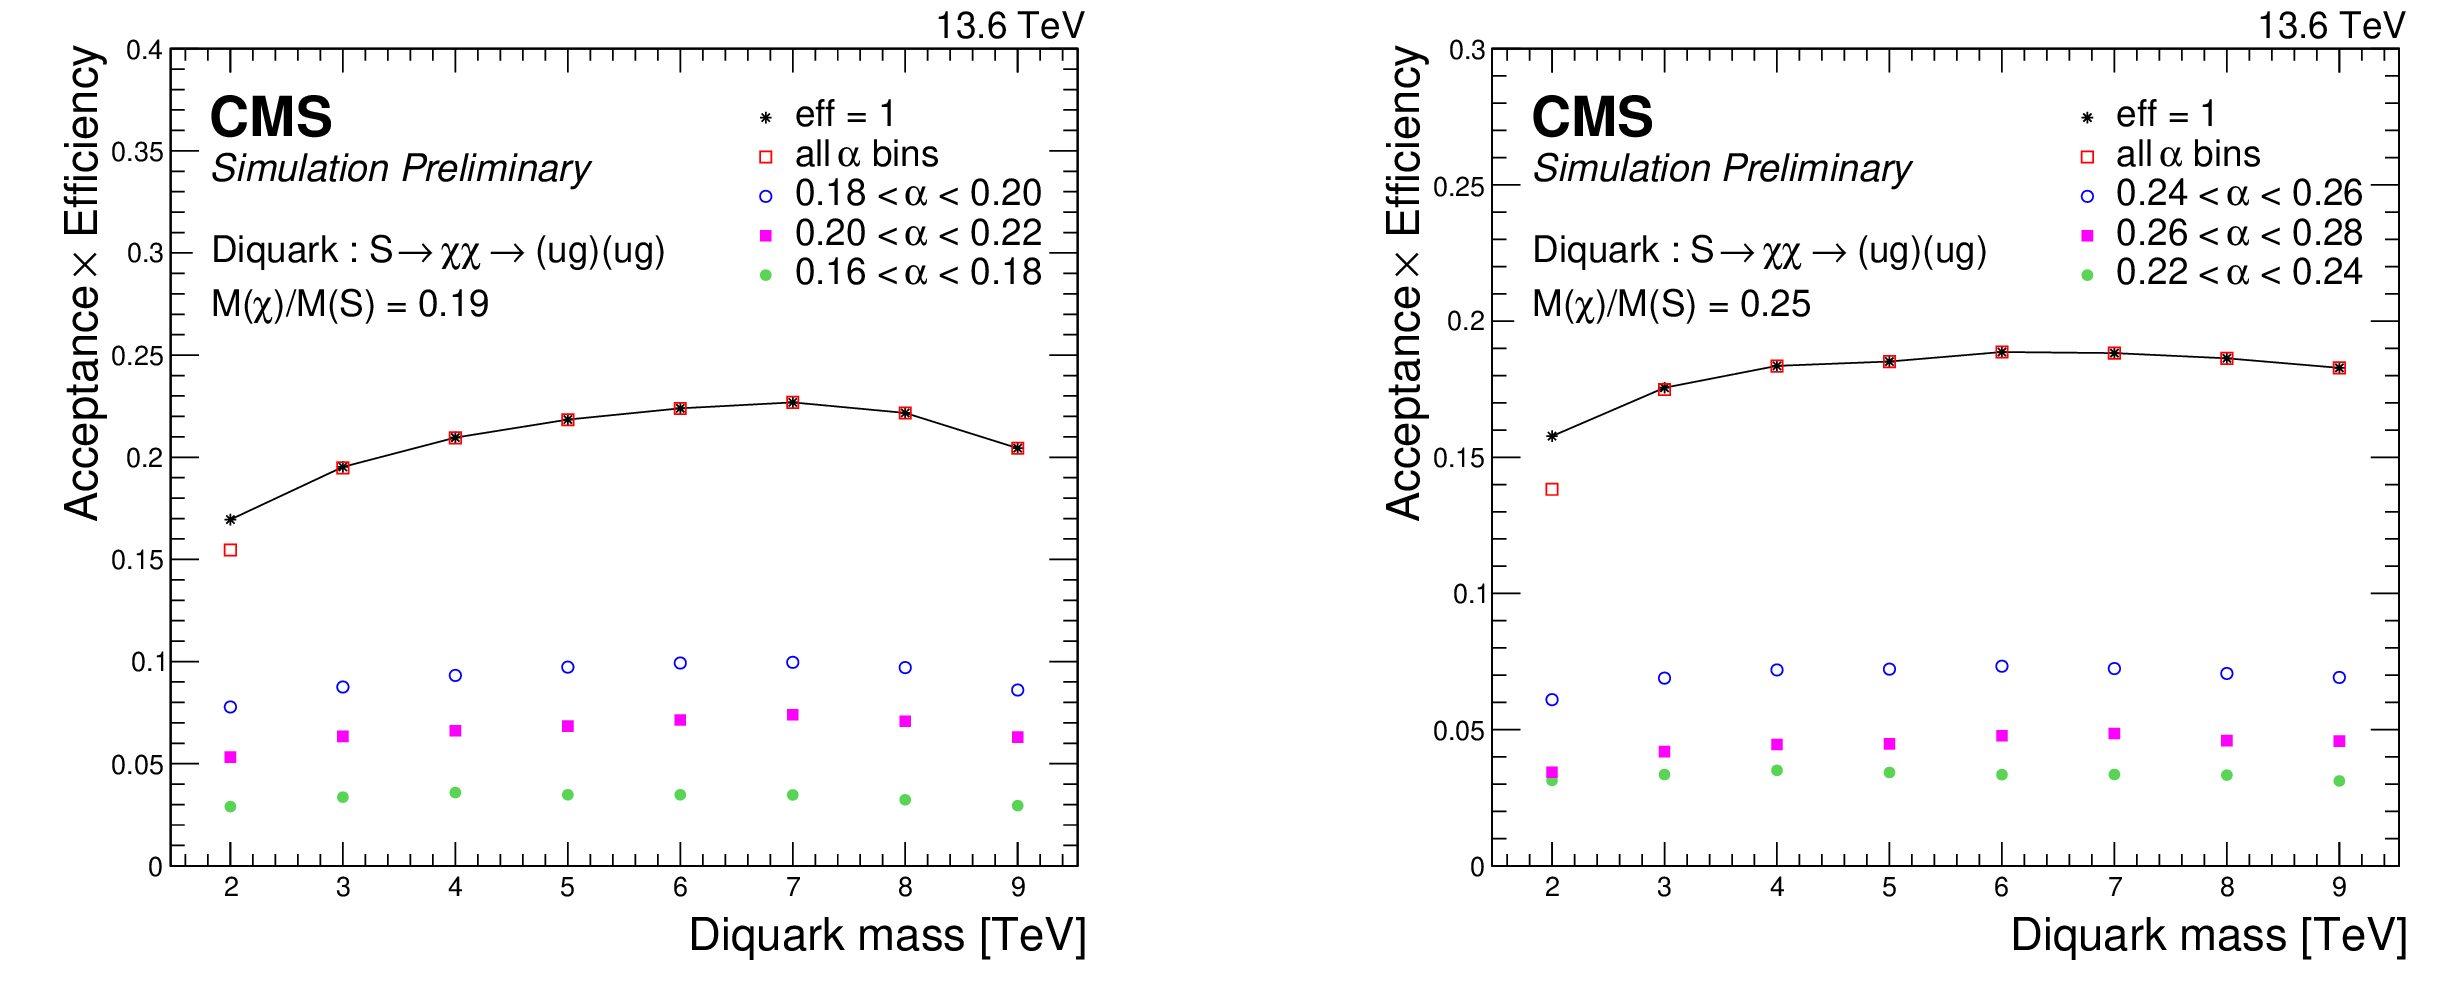
Figure 5:
The products of acceptance and efficiency of a resonant signal vs. the diquark mass inclusively, i.e., for all $ \alpha $ values, and for the three $ \alpha $ bins that contain the majority ($ \geq $85%) of the signal for signals with $ \alpha_{\mathrm{true}} = M(\mathrm{X})/M(\mathrm{Y}) = $ 0.19 (left) and $ \alpha_{\mathrm{true}} = M(\mathrm{X})/M(\mathrm{Y}) = $ 0.25 (right). The case when the efficiency of the mass selection is unity is also shown as a solid line. |
png pdf |
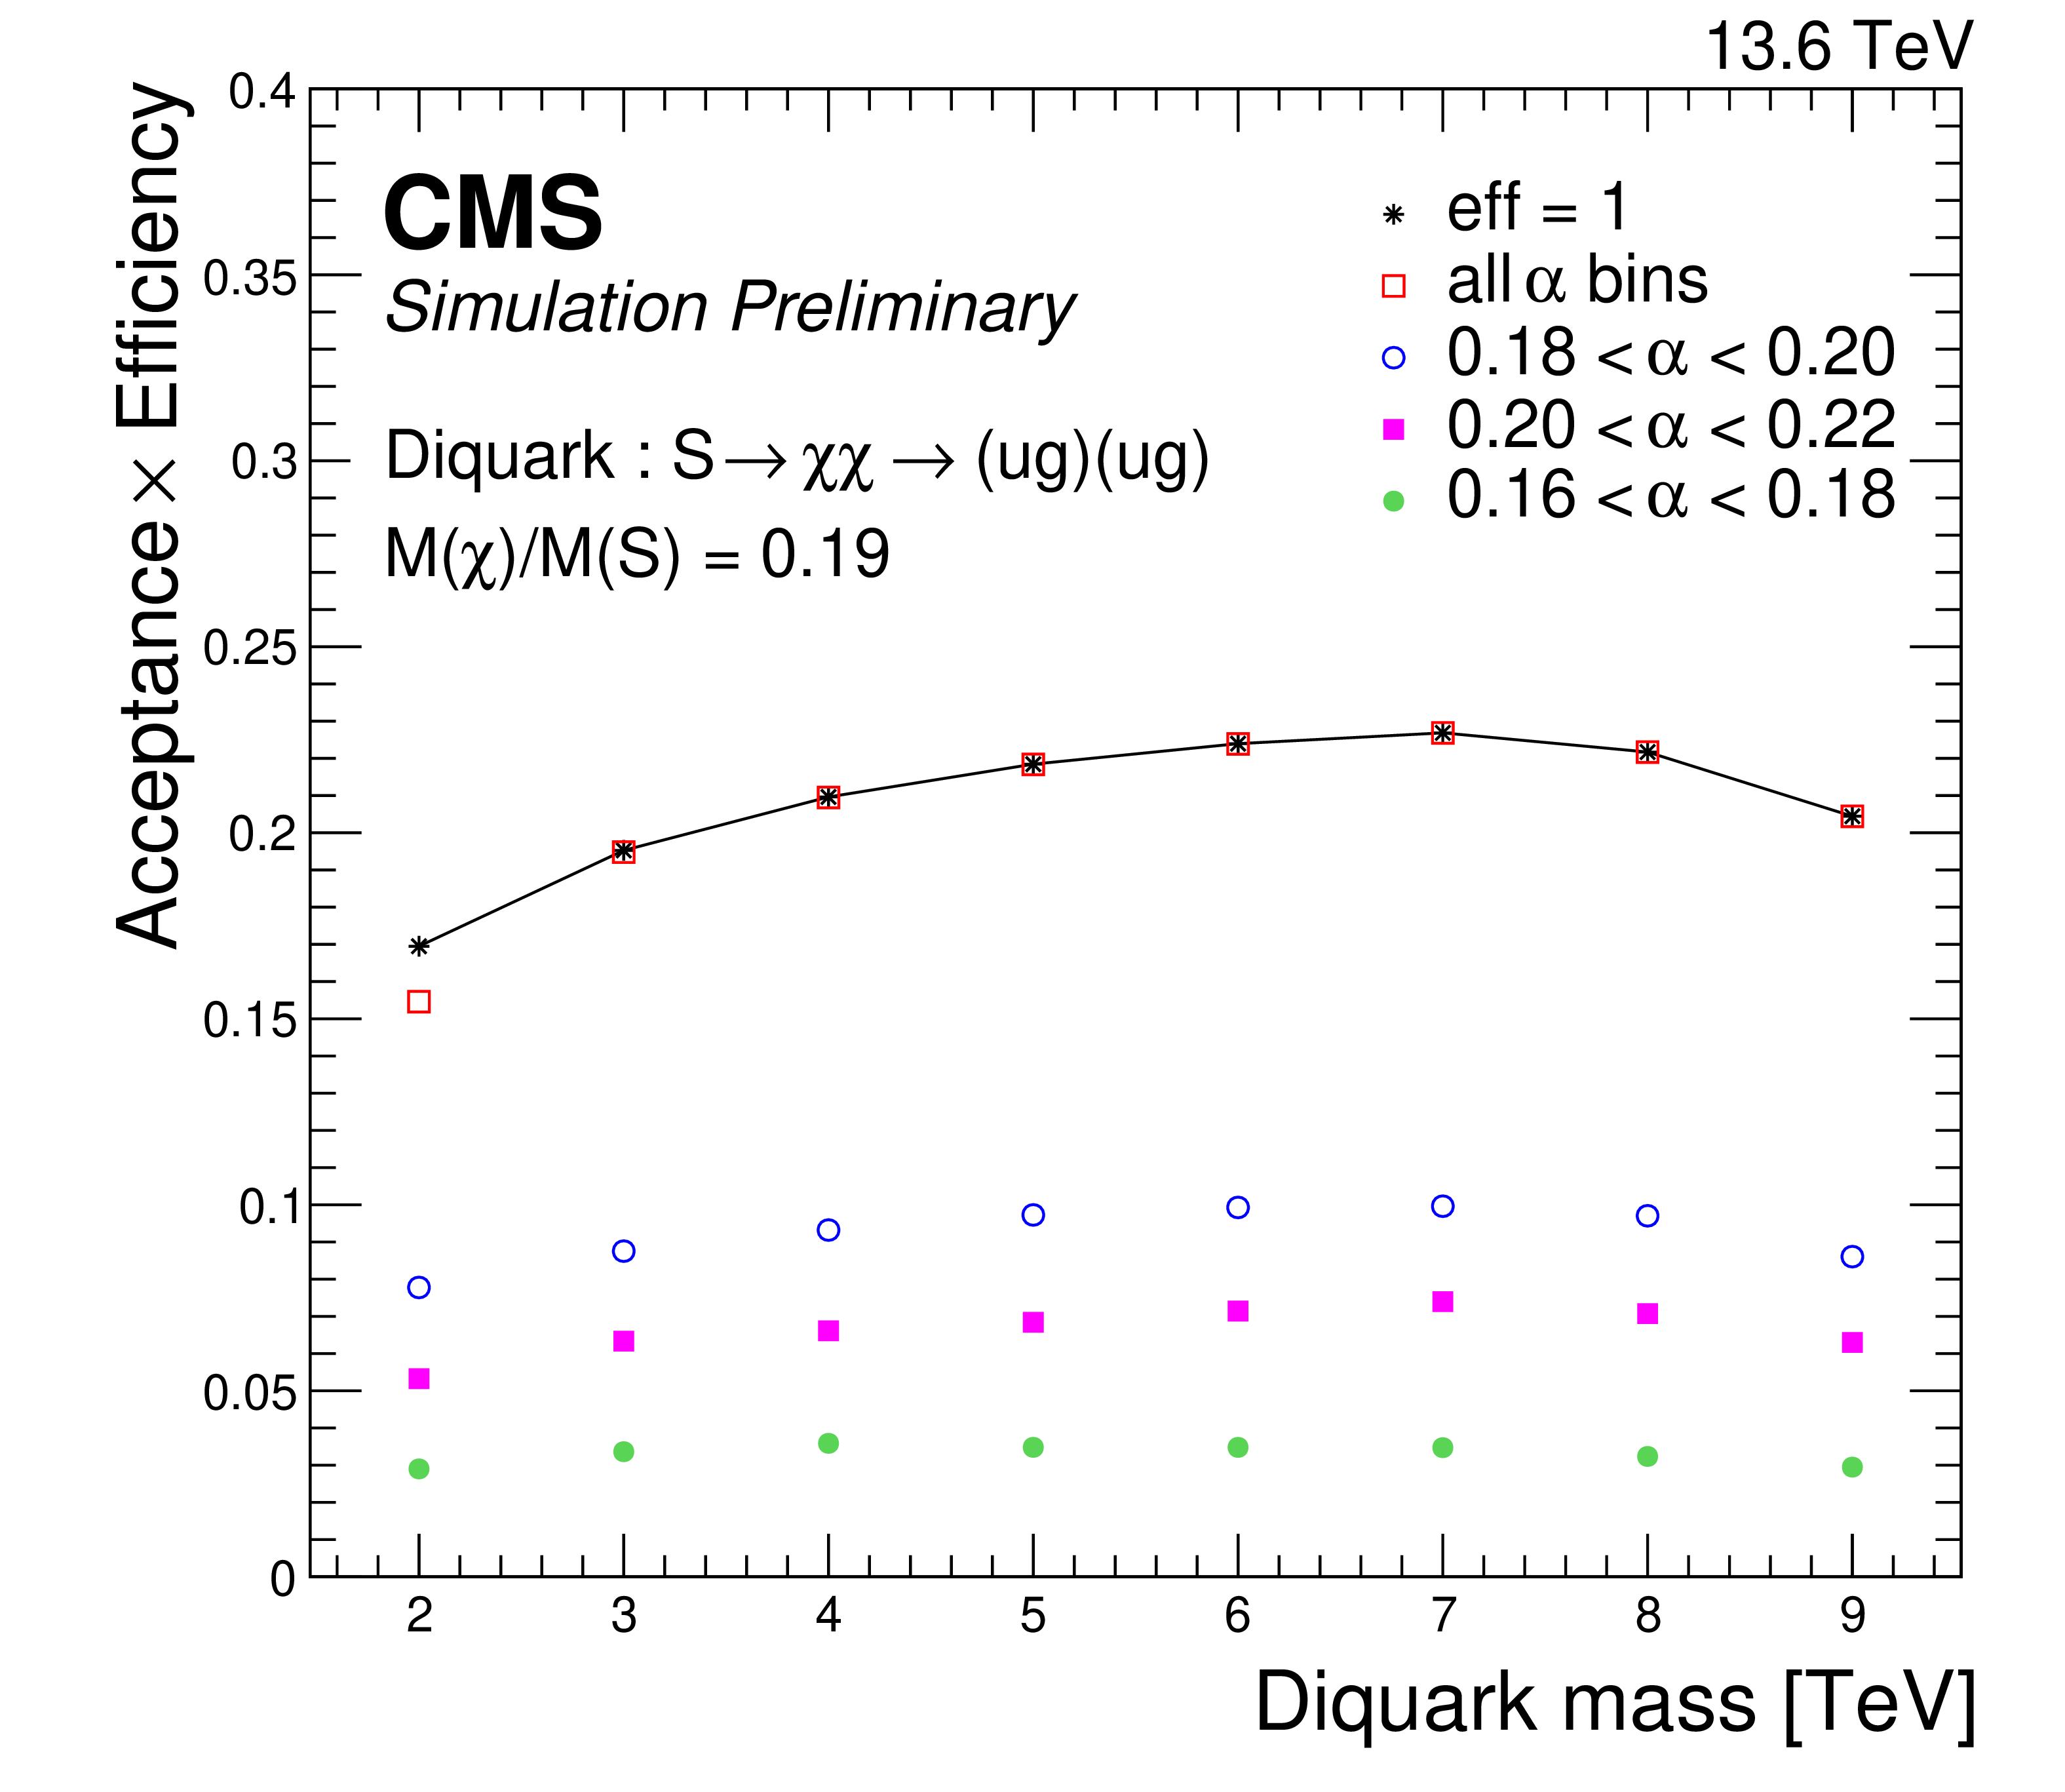
Figure 5-a:
The products of acceptance and efficiency of a resonant signal vs. the diquark mass inclusively, i.e., for all $ \alpha $ values, and for the three $ \alpha $ bins that contain the majority ($ \geq $85%) of the signal for signals with $ \alpha_{\mathrm{true}} = M(\mathrm{X})/M(\mathrm{Y}) = $ 0.19 (left) and $ \alpha_{\mathrm{true}} = M(\mathrm{X})/M(\mathrm{Y}) = $ 0.25 (right). The case when the efficiency of the mass selection is unity is also shown as a solid line. |
png pdf |
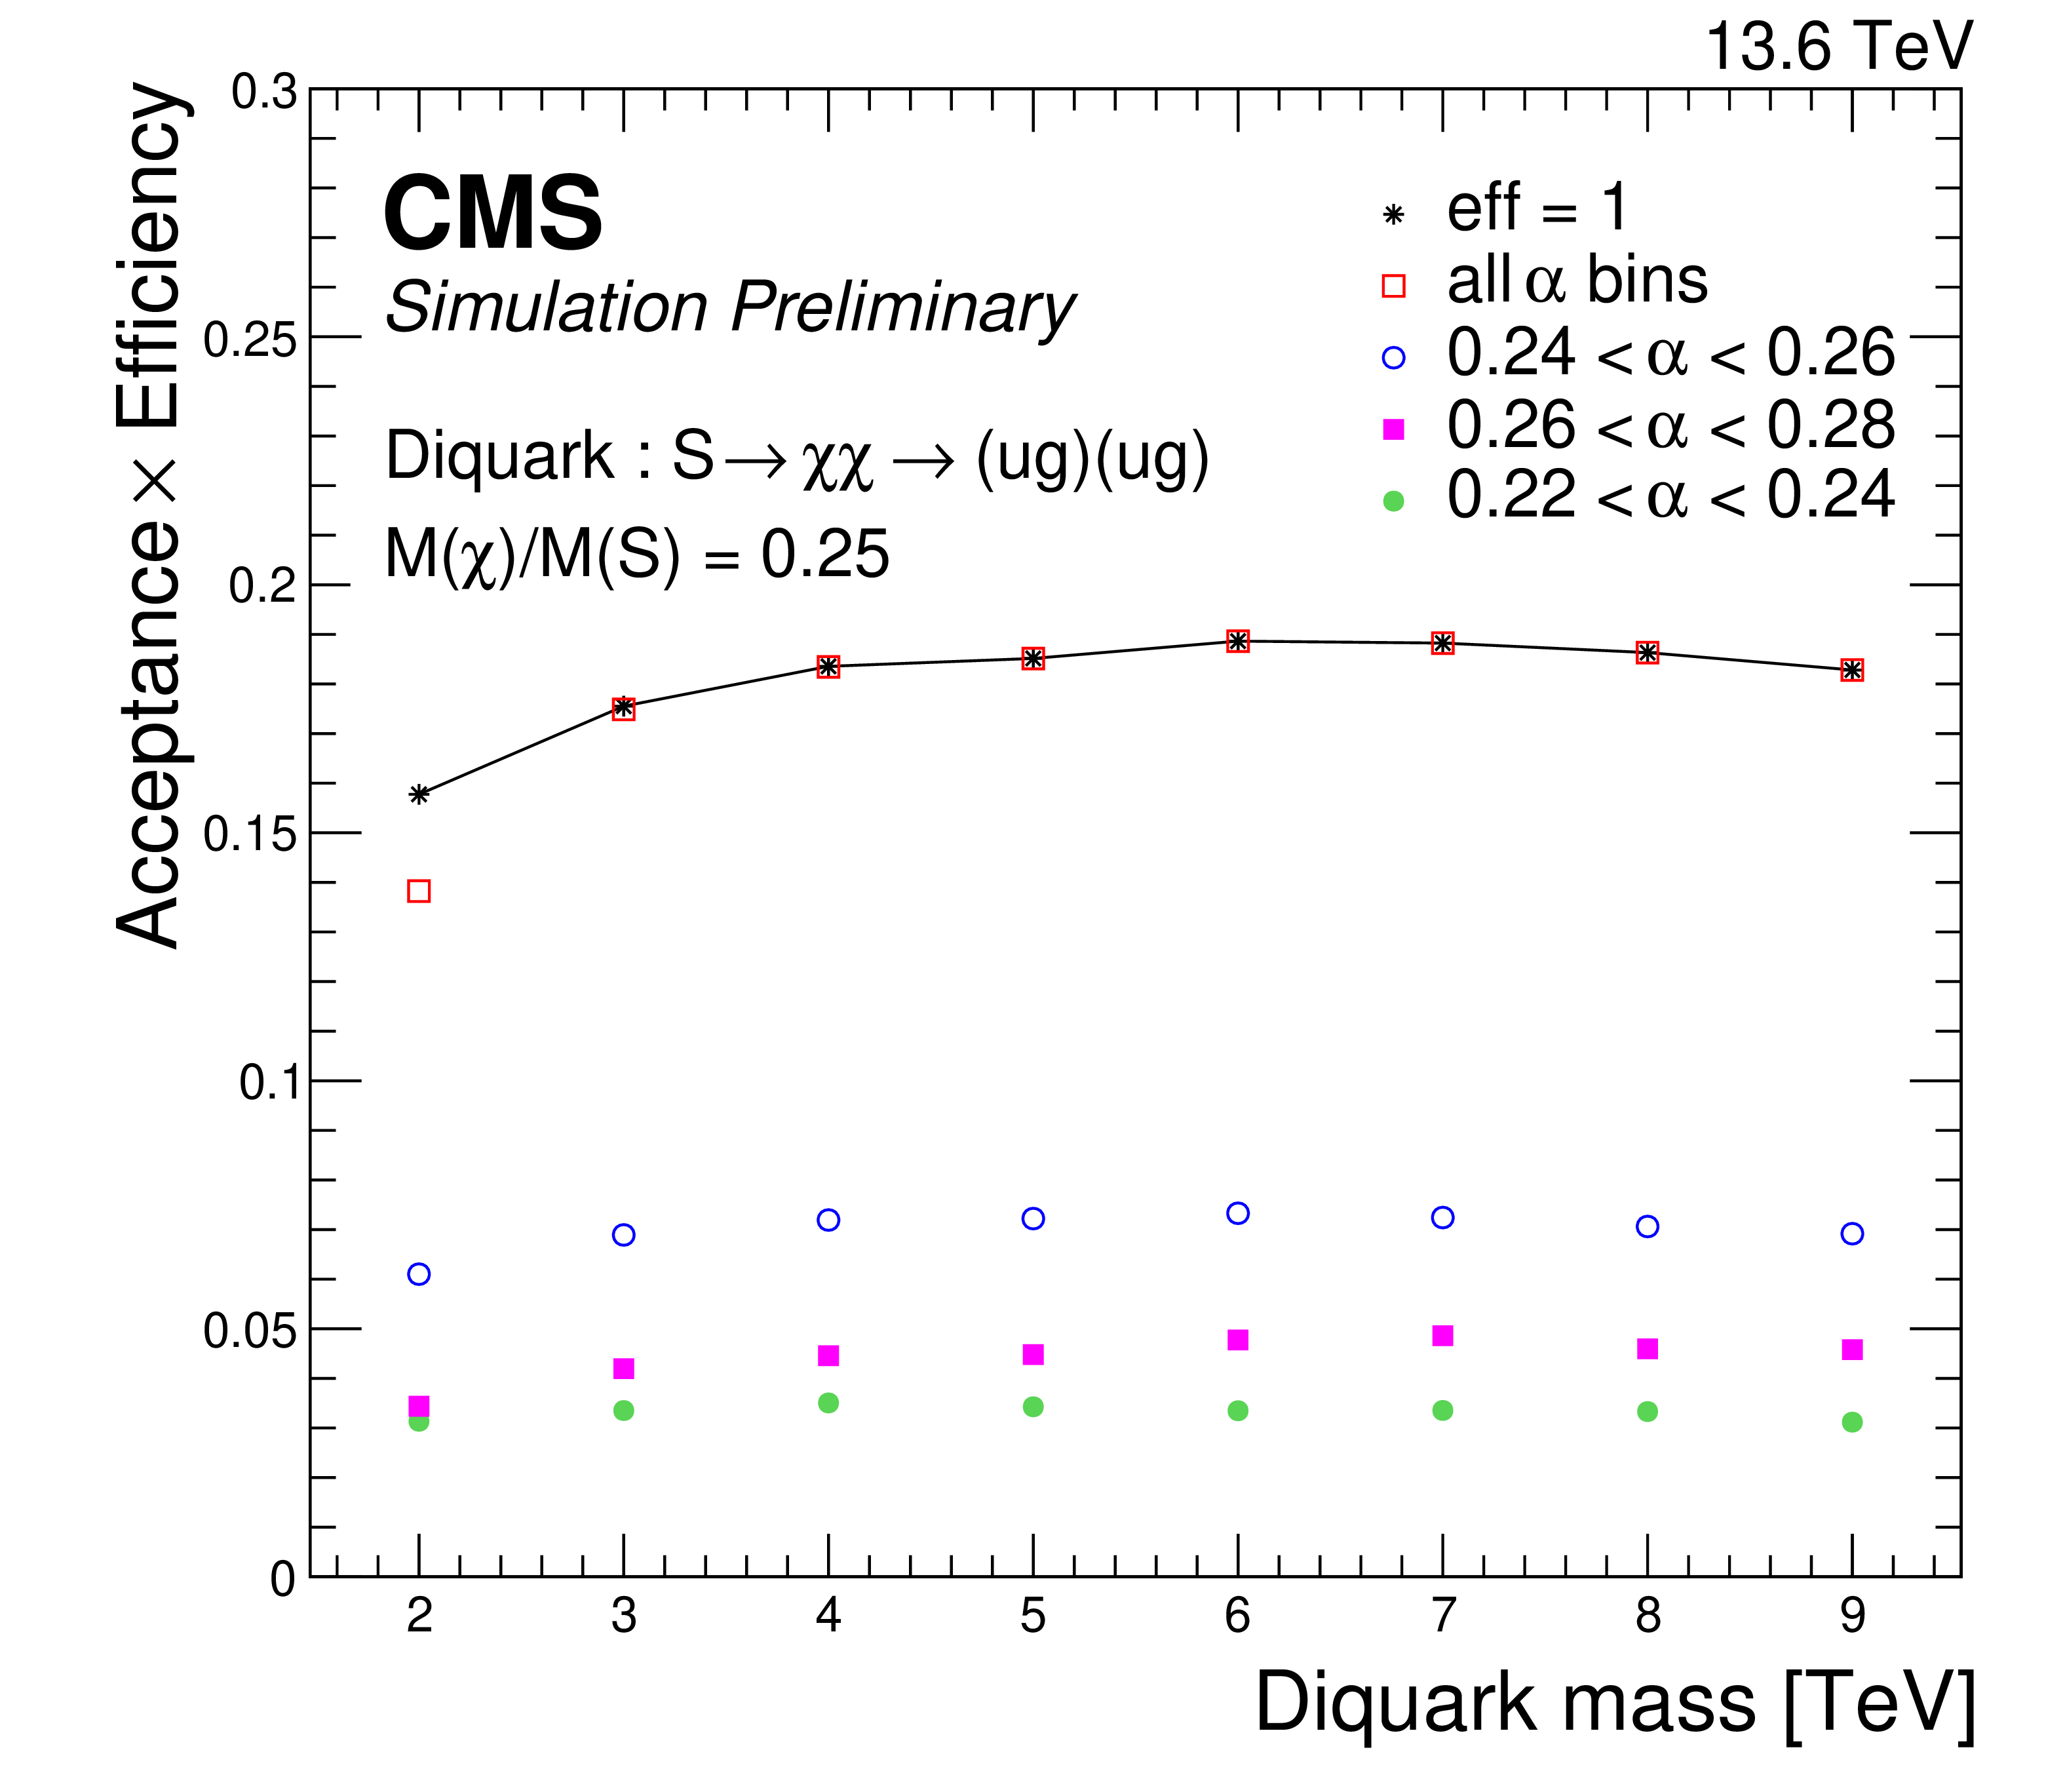
Figure 5-b:
The products of acceptance and efficiency of a resonant signal vs. the diquark mass inclusively, i.e., for all $ \alpha $ values, and for the three $ \alpha $ bins that contain the majority ($ \geq $85%) of the signal for signals with $ \alpha_{\mathrm{true}} = M(\mathrm{X})/M(\mathrm{Y}) = $ 0.19 (left) and $ \alpha_{\mathrm{true}} = M(\mathrm{X})/M(\mathrm{Y}) = $ 0.25 (right). The case when the efficiency of the mass selection is unity is also shown as a solid line. |
png pdf |
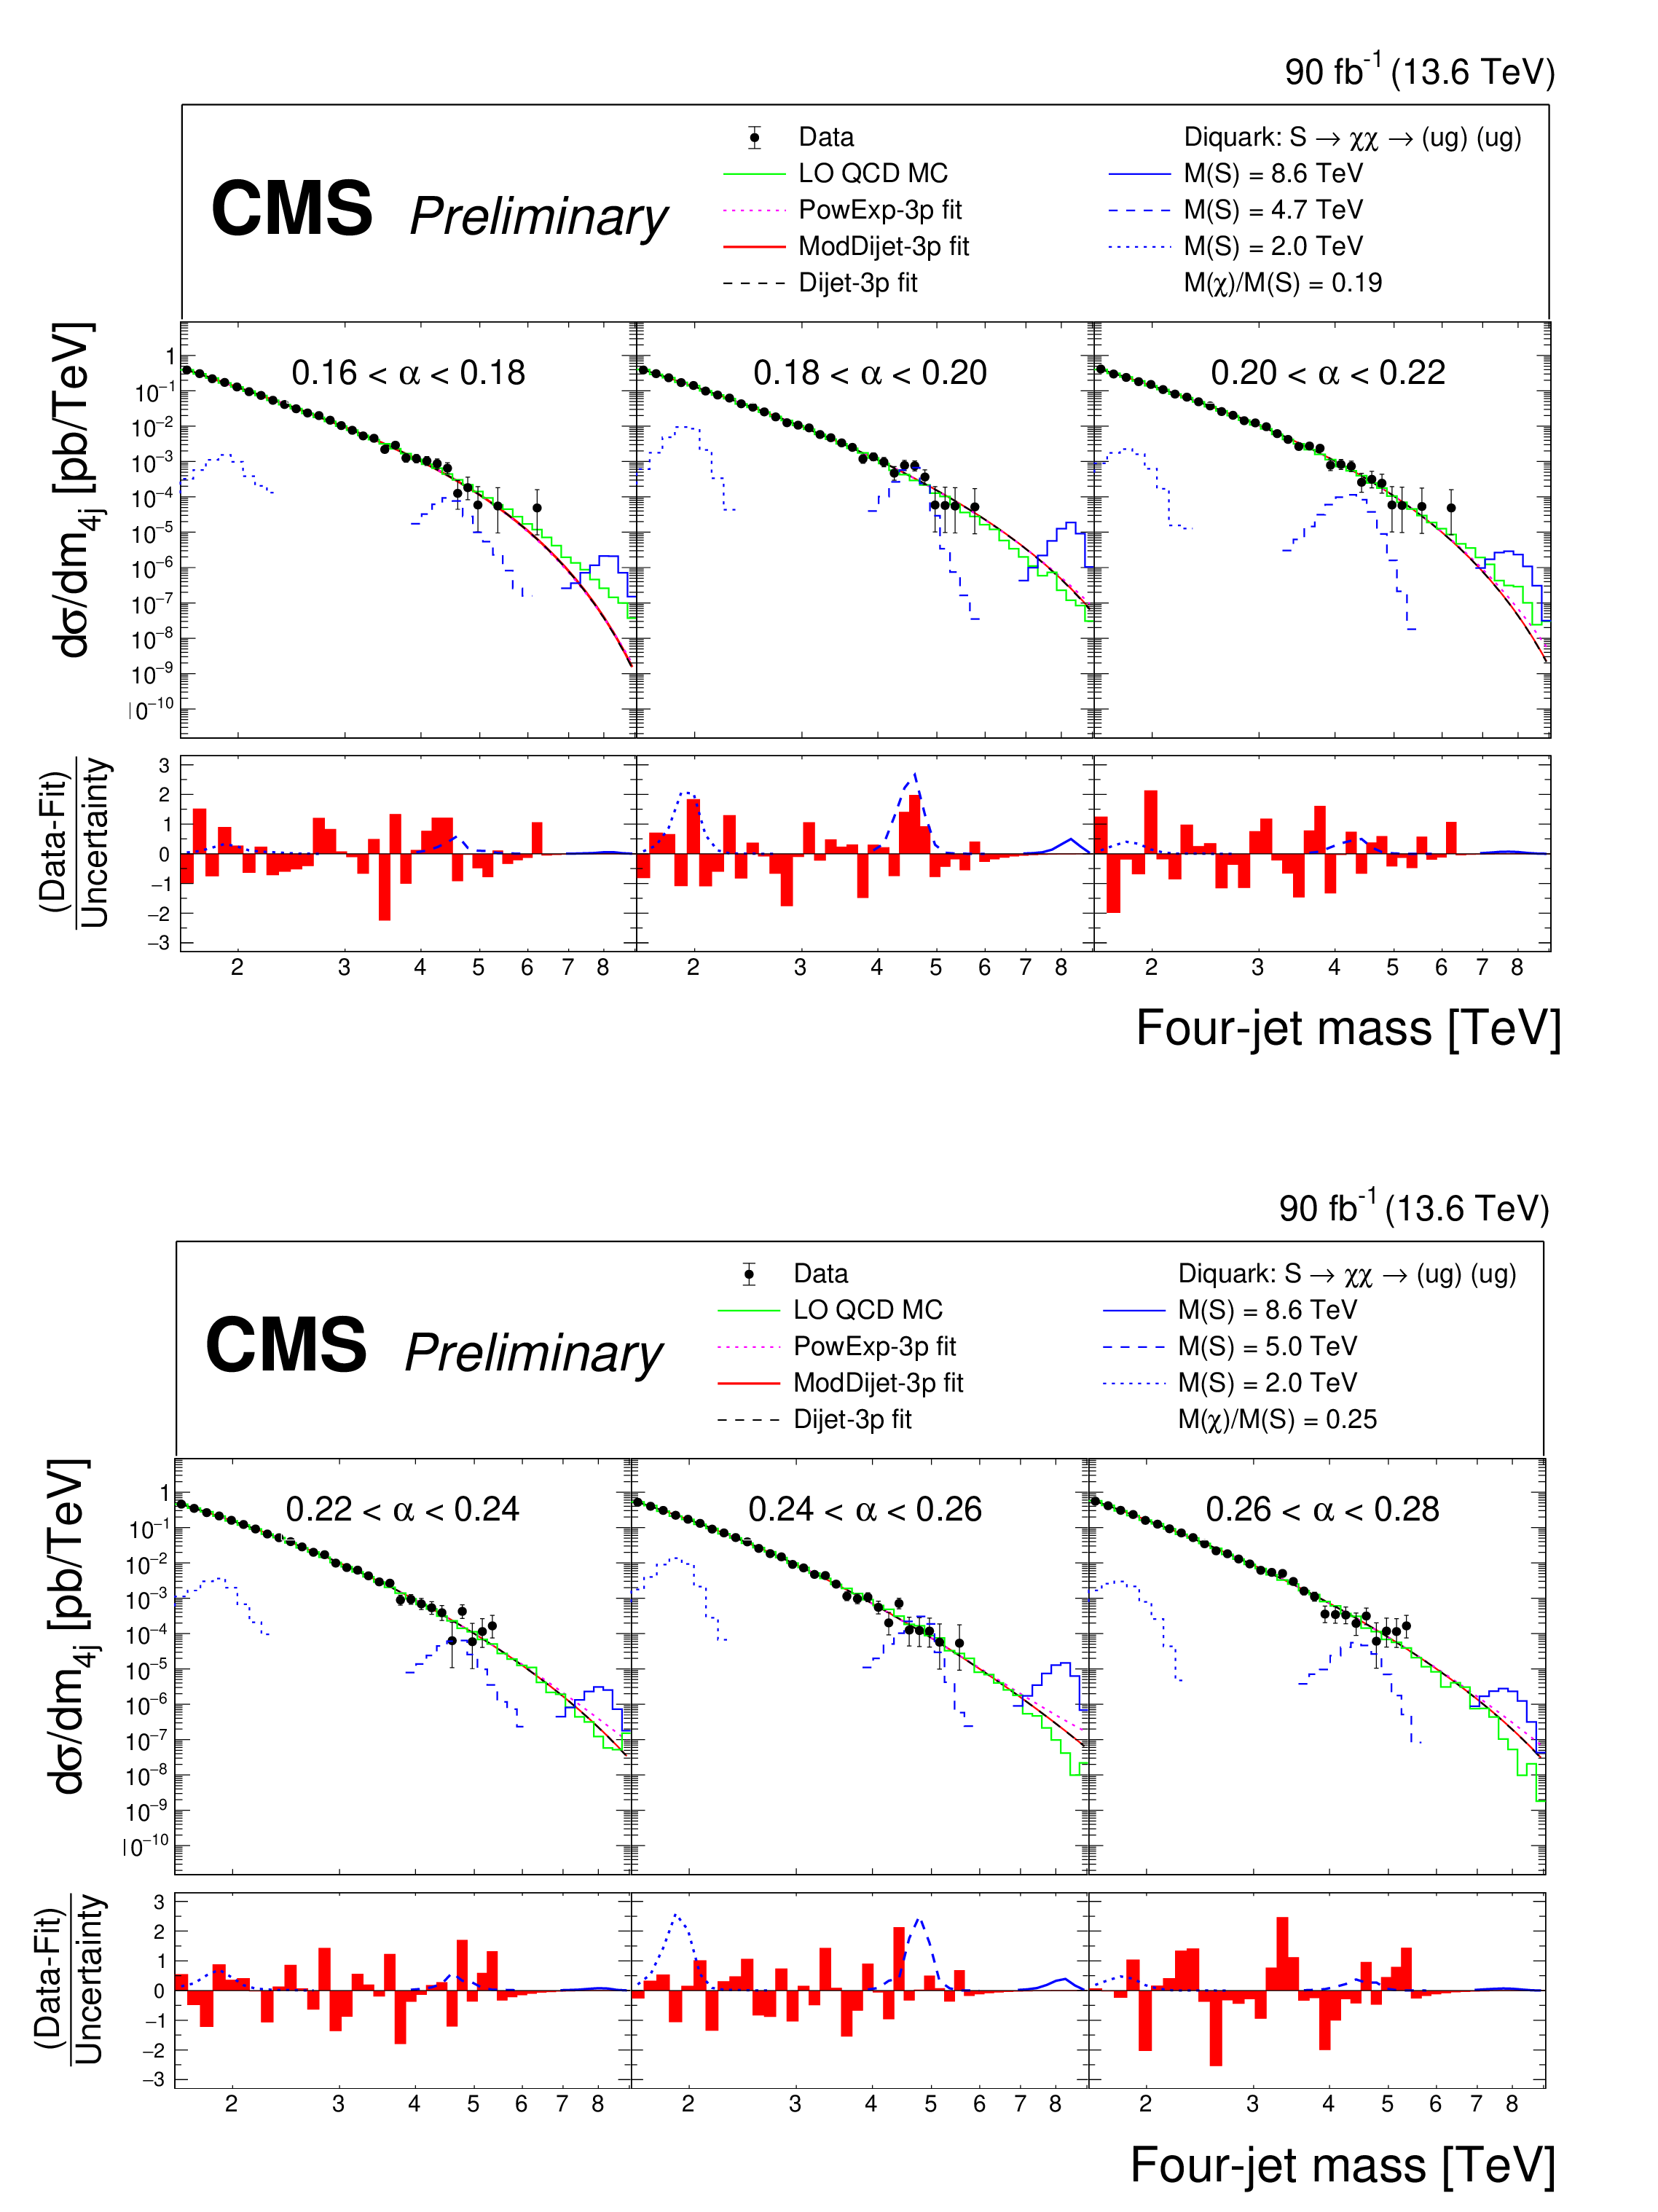
Figure 6:
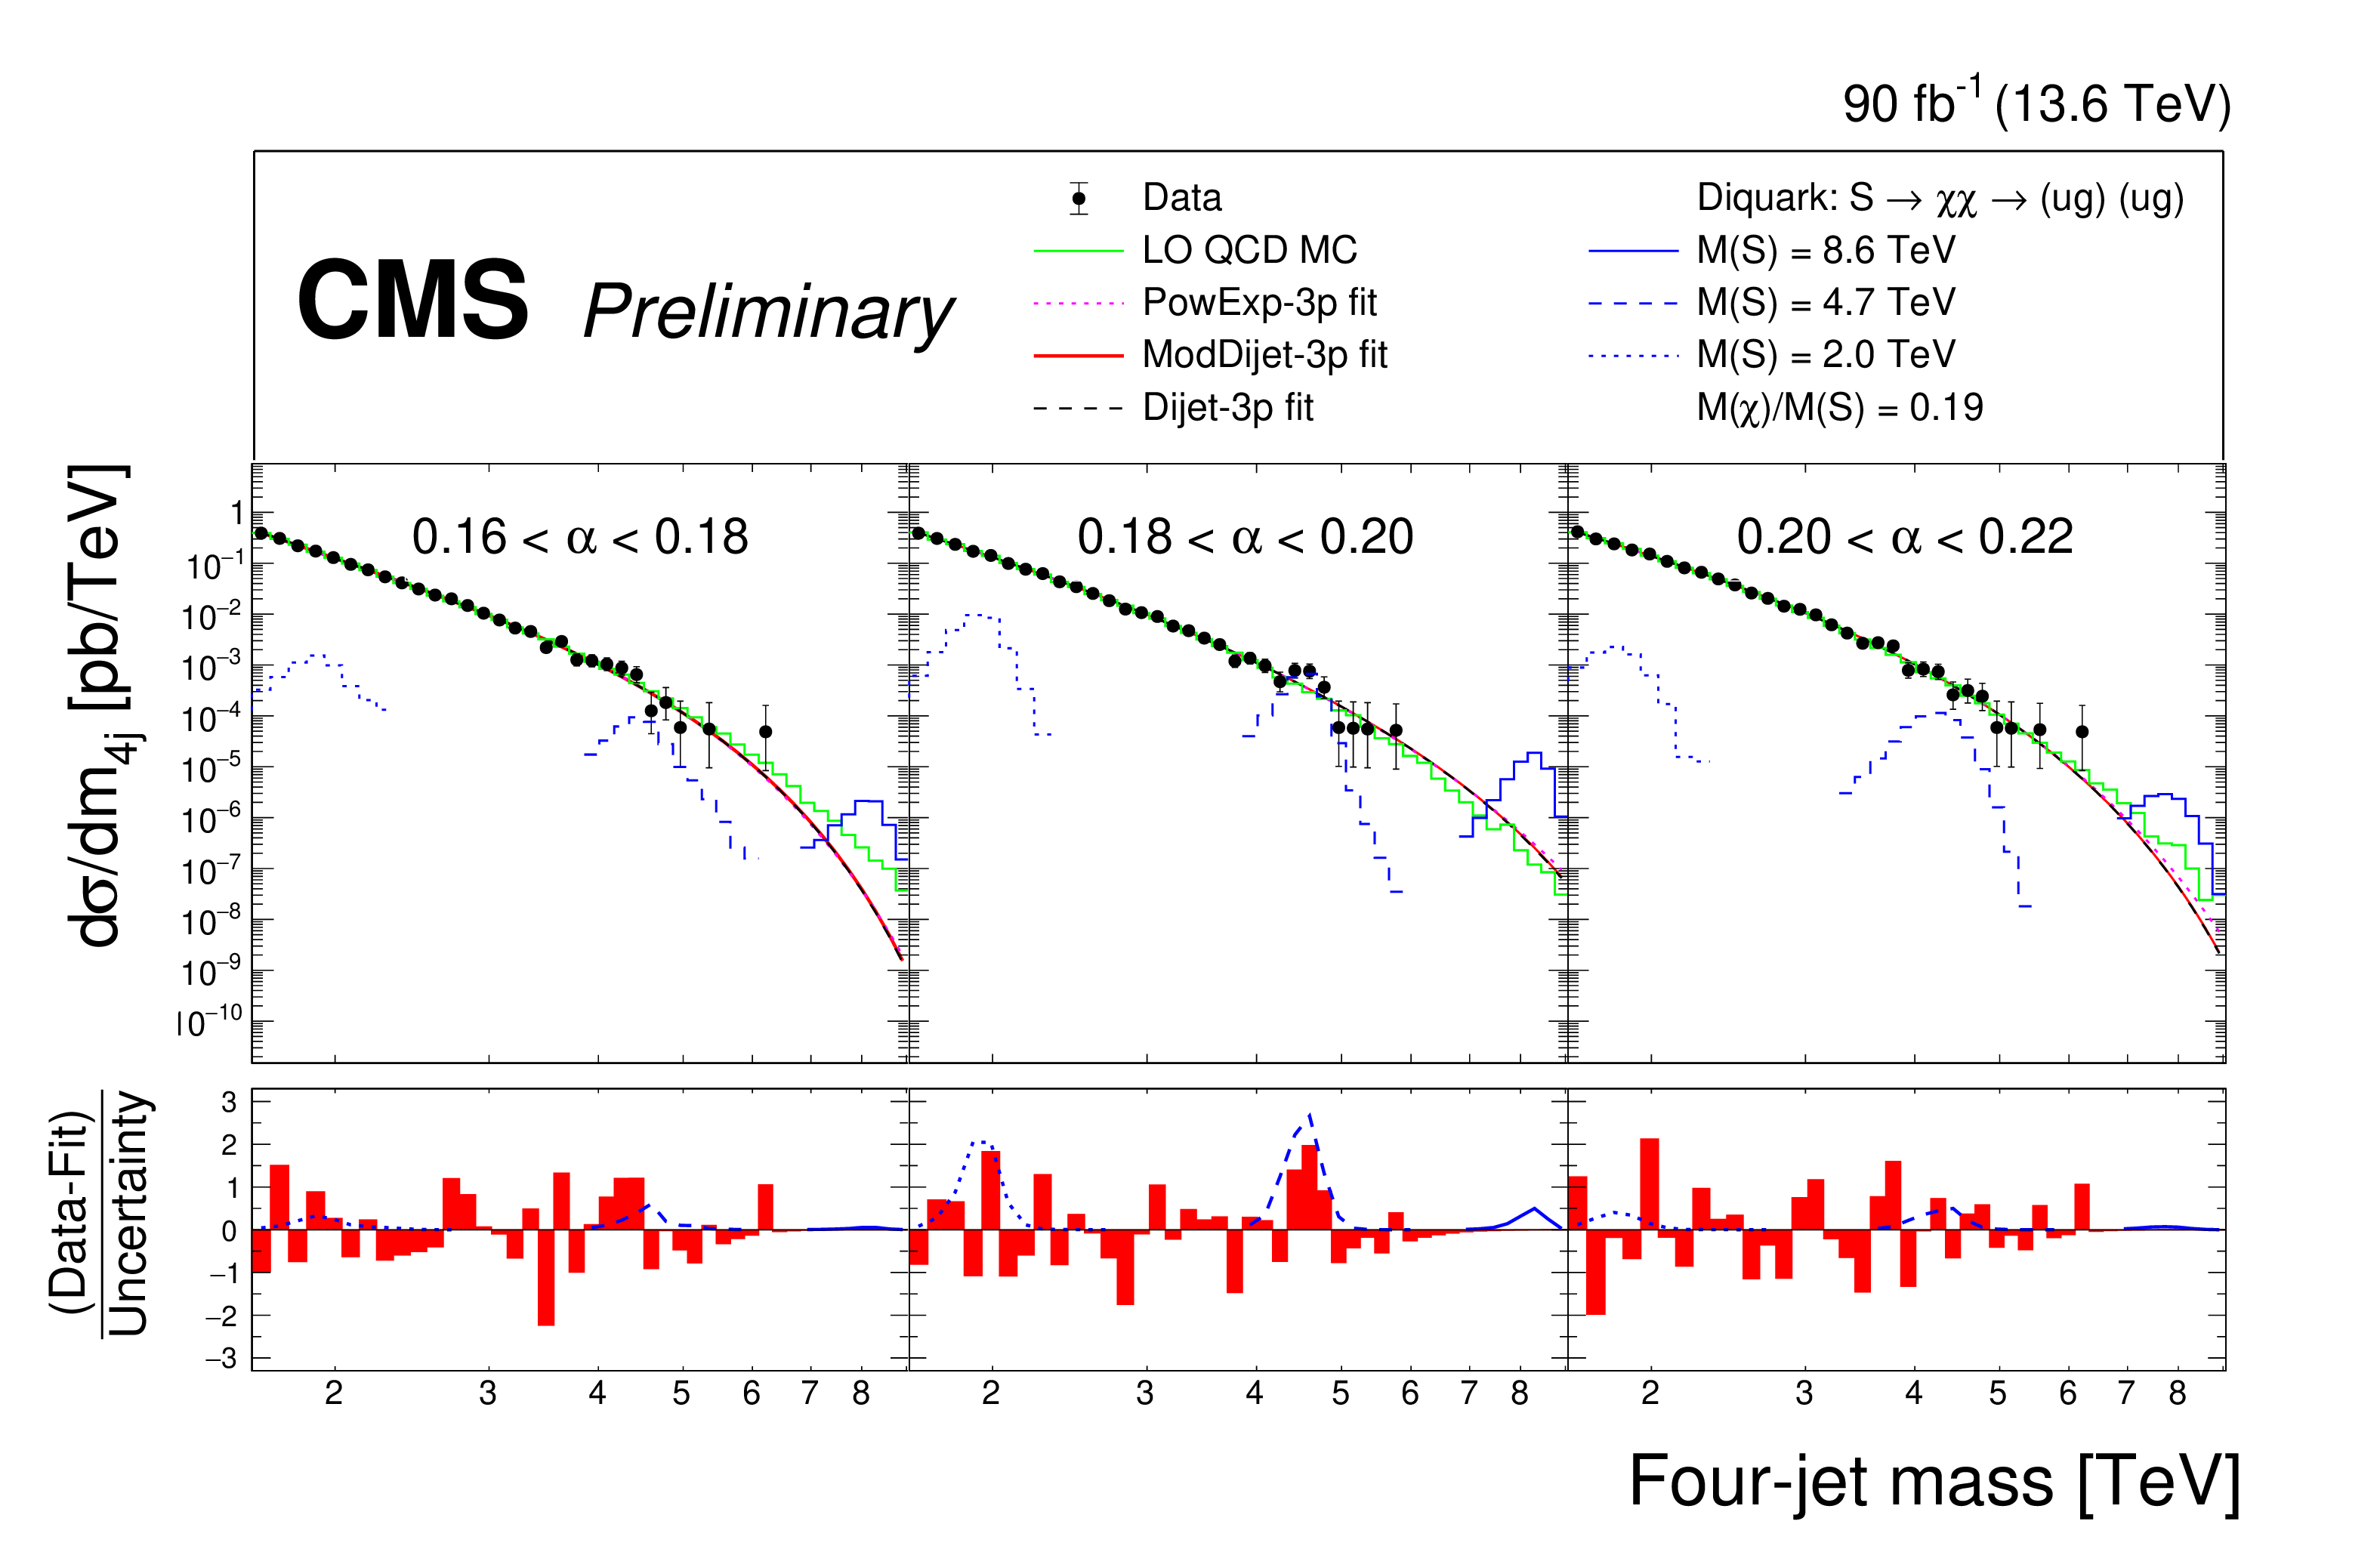
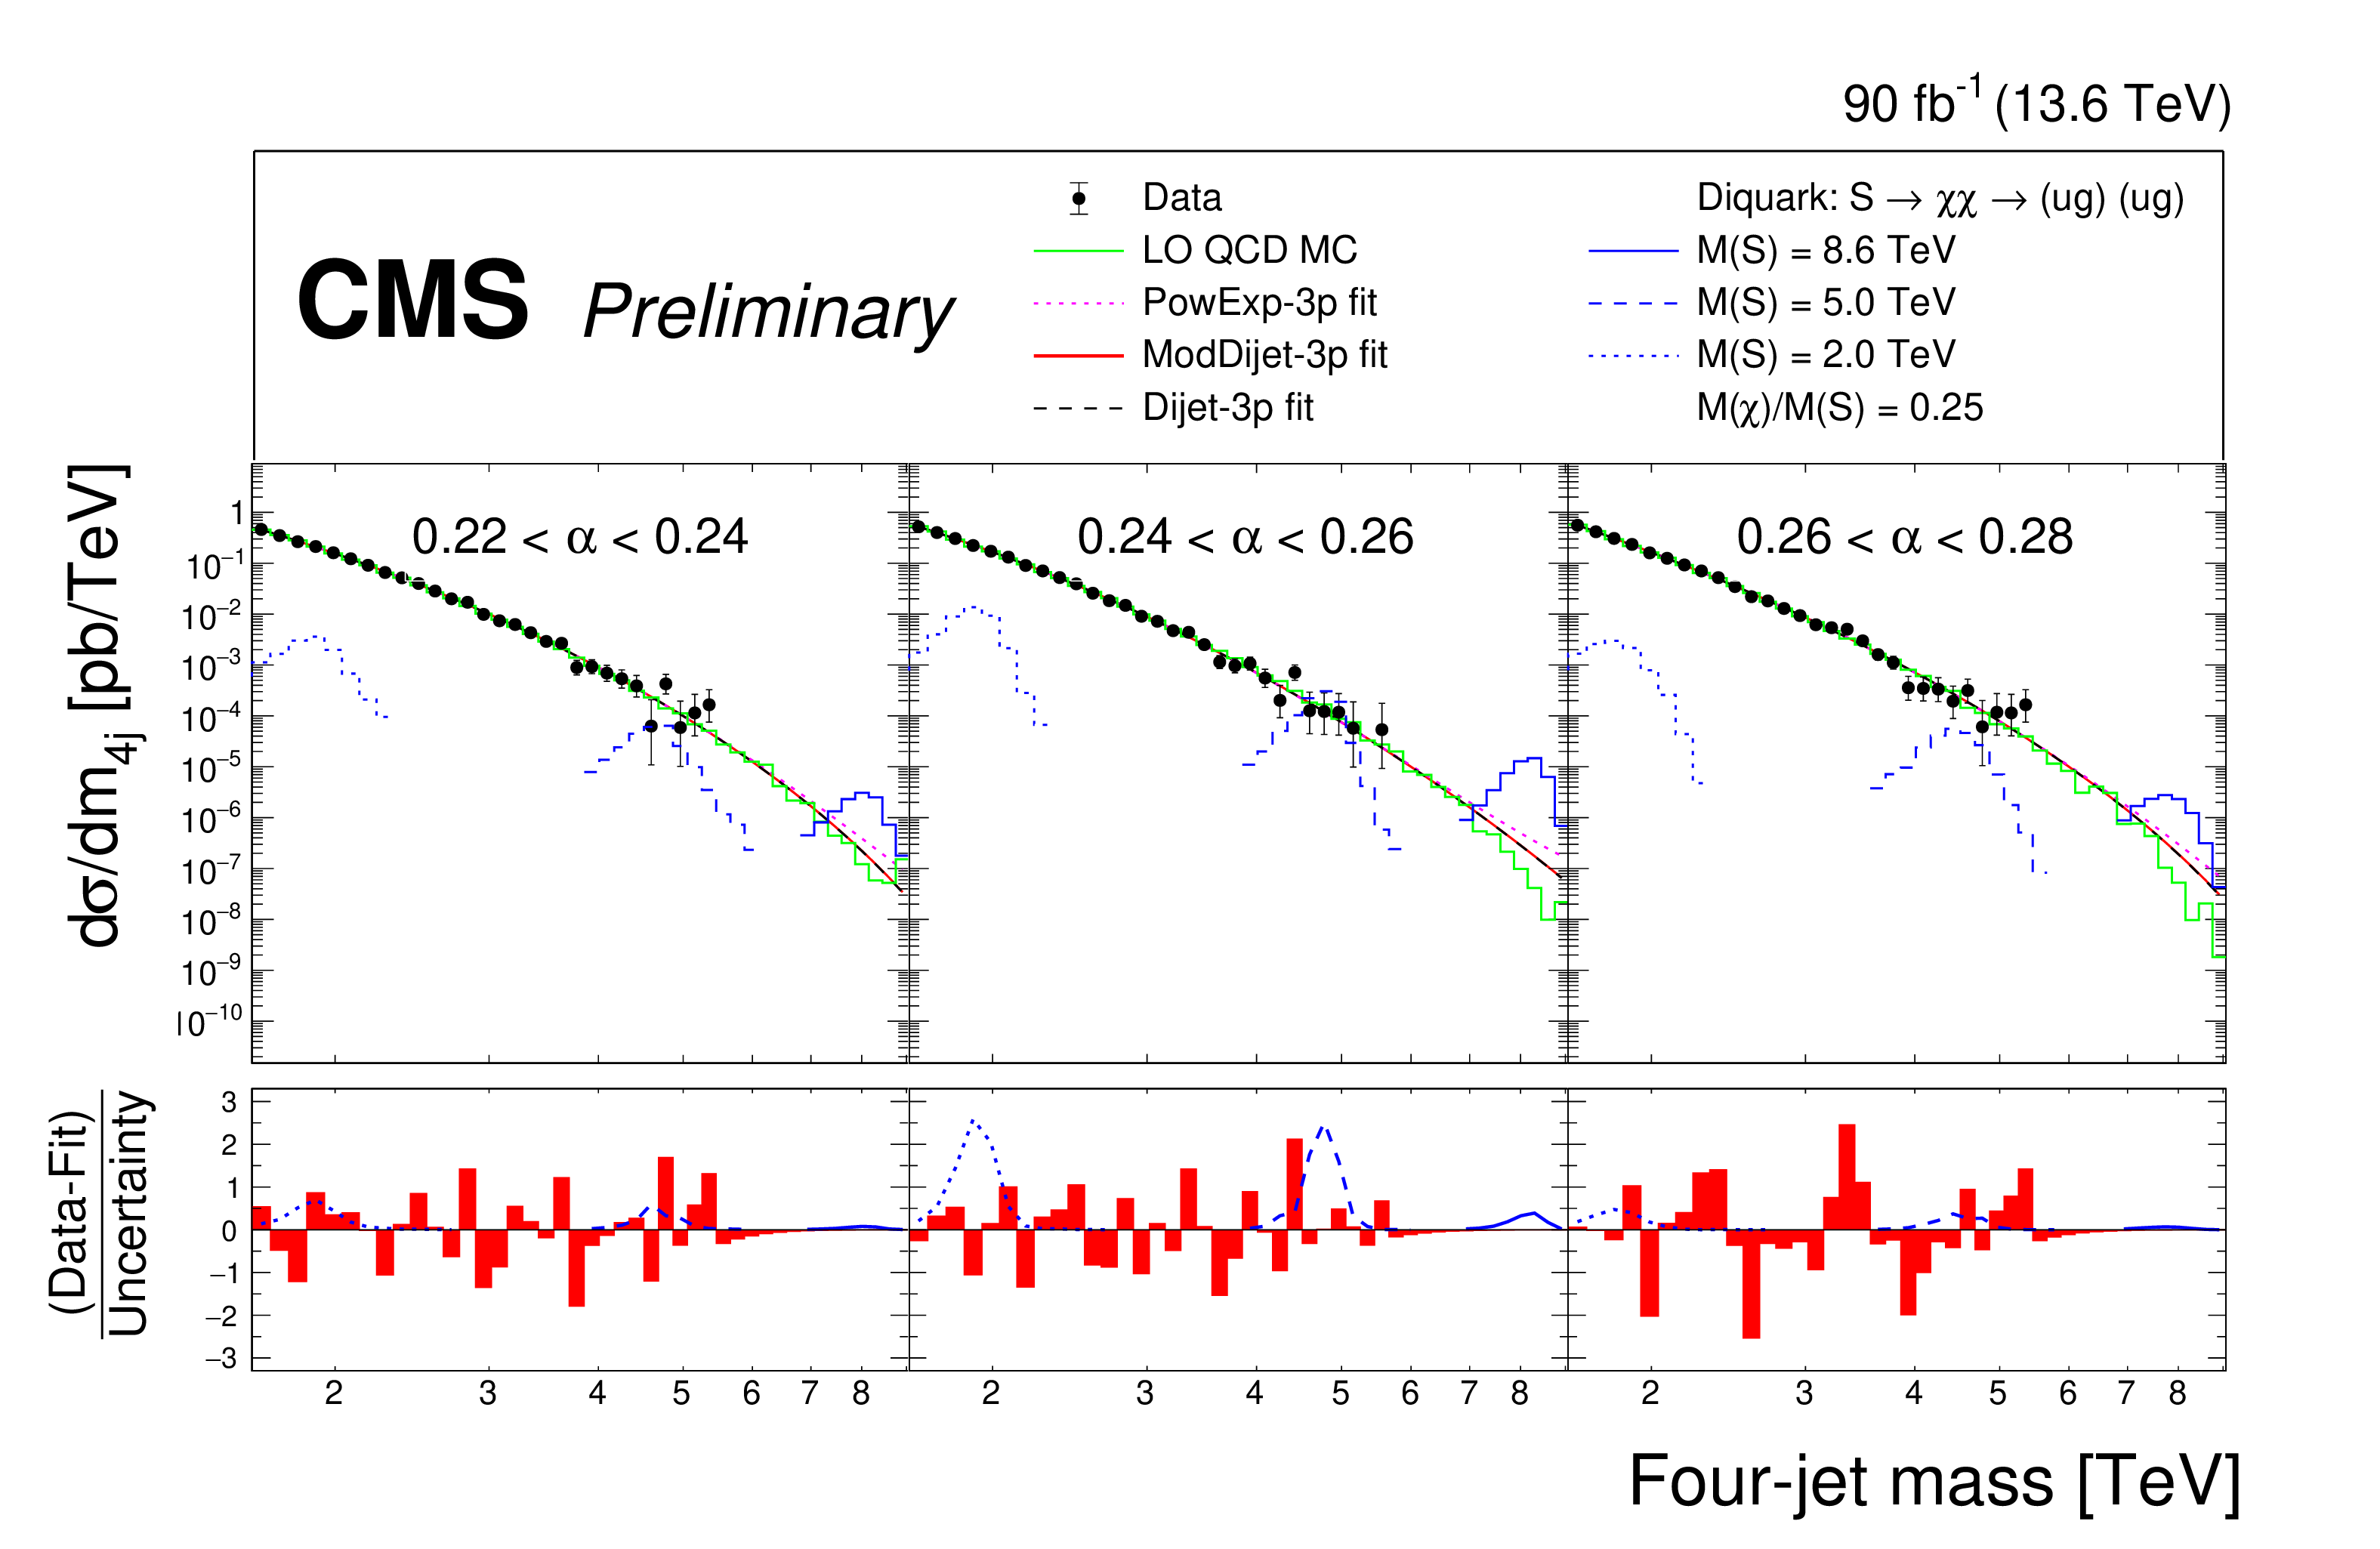
The four-jet mass distributions of the data (points), within six of the thirteen $ \alpha $ bins, compared with the simulated LO QCD background distribution normalized to the data (green histogram) and fitted with three functions: a power-law times an exponential (magenta dotted), the dijet function (black dashed), and the modified dijet function (red solid), each function with three free parameters. Examples of predicted diquark signals are shown, with cross sections equal to the observed upper limits at 95% confidence level, for low (blue dotted), medium (blue dashed) and high (blue solid) resonance masses. The lower panels show the pulls from the fit of the modified dijet function to the data, calculated using the statistical uncertainty of the data. |
png pdf |
Figure 6-a:
The four-jet mass distributions of the data (points), within six of the thirteen $ \alpha $ bins, compared with the simulated LO QCD background distribution normalized to the data (green histogram) and fitted with three functions: a power-law times an exponential (magenta dotted), the dijet function (black dashed), and the modified dijet function (red solid), each function with three free parameters. Examples of predicted diquark signals are shown, with cross sections equal to the observed upper limits at 95% confidence level, for low (blue dotted), medium (blue dashed) and high (blue solid) resonance masses. The lower panels show the pulls from the fit of the modified dijet function to the data, calculated using the statistical uncertainty of the data. |
png pdf |
Figure 6-b:
The four-jet mass distributions of the data (points), within six of the thirteen $ \alpha $ bins, compared with the simulated LO QCD background distribution normalized to the data (green histogram) and fitted with three functions: a power-law times an exponential (magenta dotted), the dijet function (black dashed), and the modified dijet function (red solid), each function with three free parameters. Examples of predicted diquark signals are shown, with cross sections equal to the observed upper limits at 95% confidence level, for low (blue dotted), medium (blue dashed) and high (blue solid) resonance masses. The lower panels show the pulls from the fit of the modified dijet function to the data, calculated using the statistical uncertainty of the data. |
png pdf |
Figure 7:
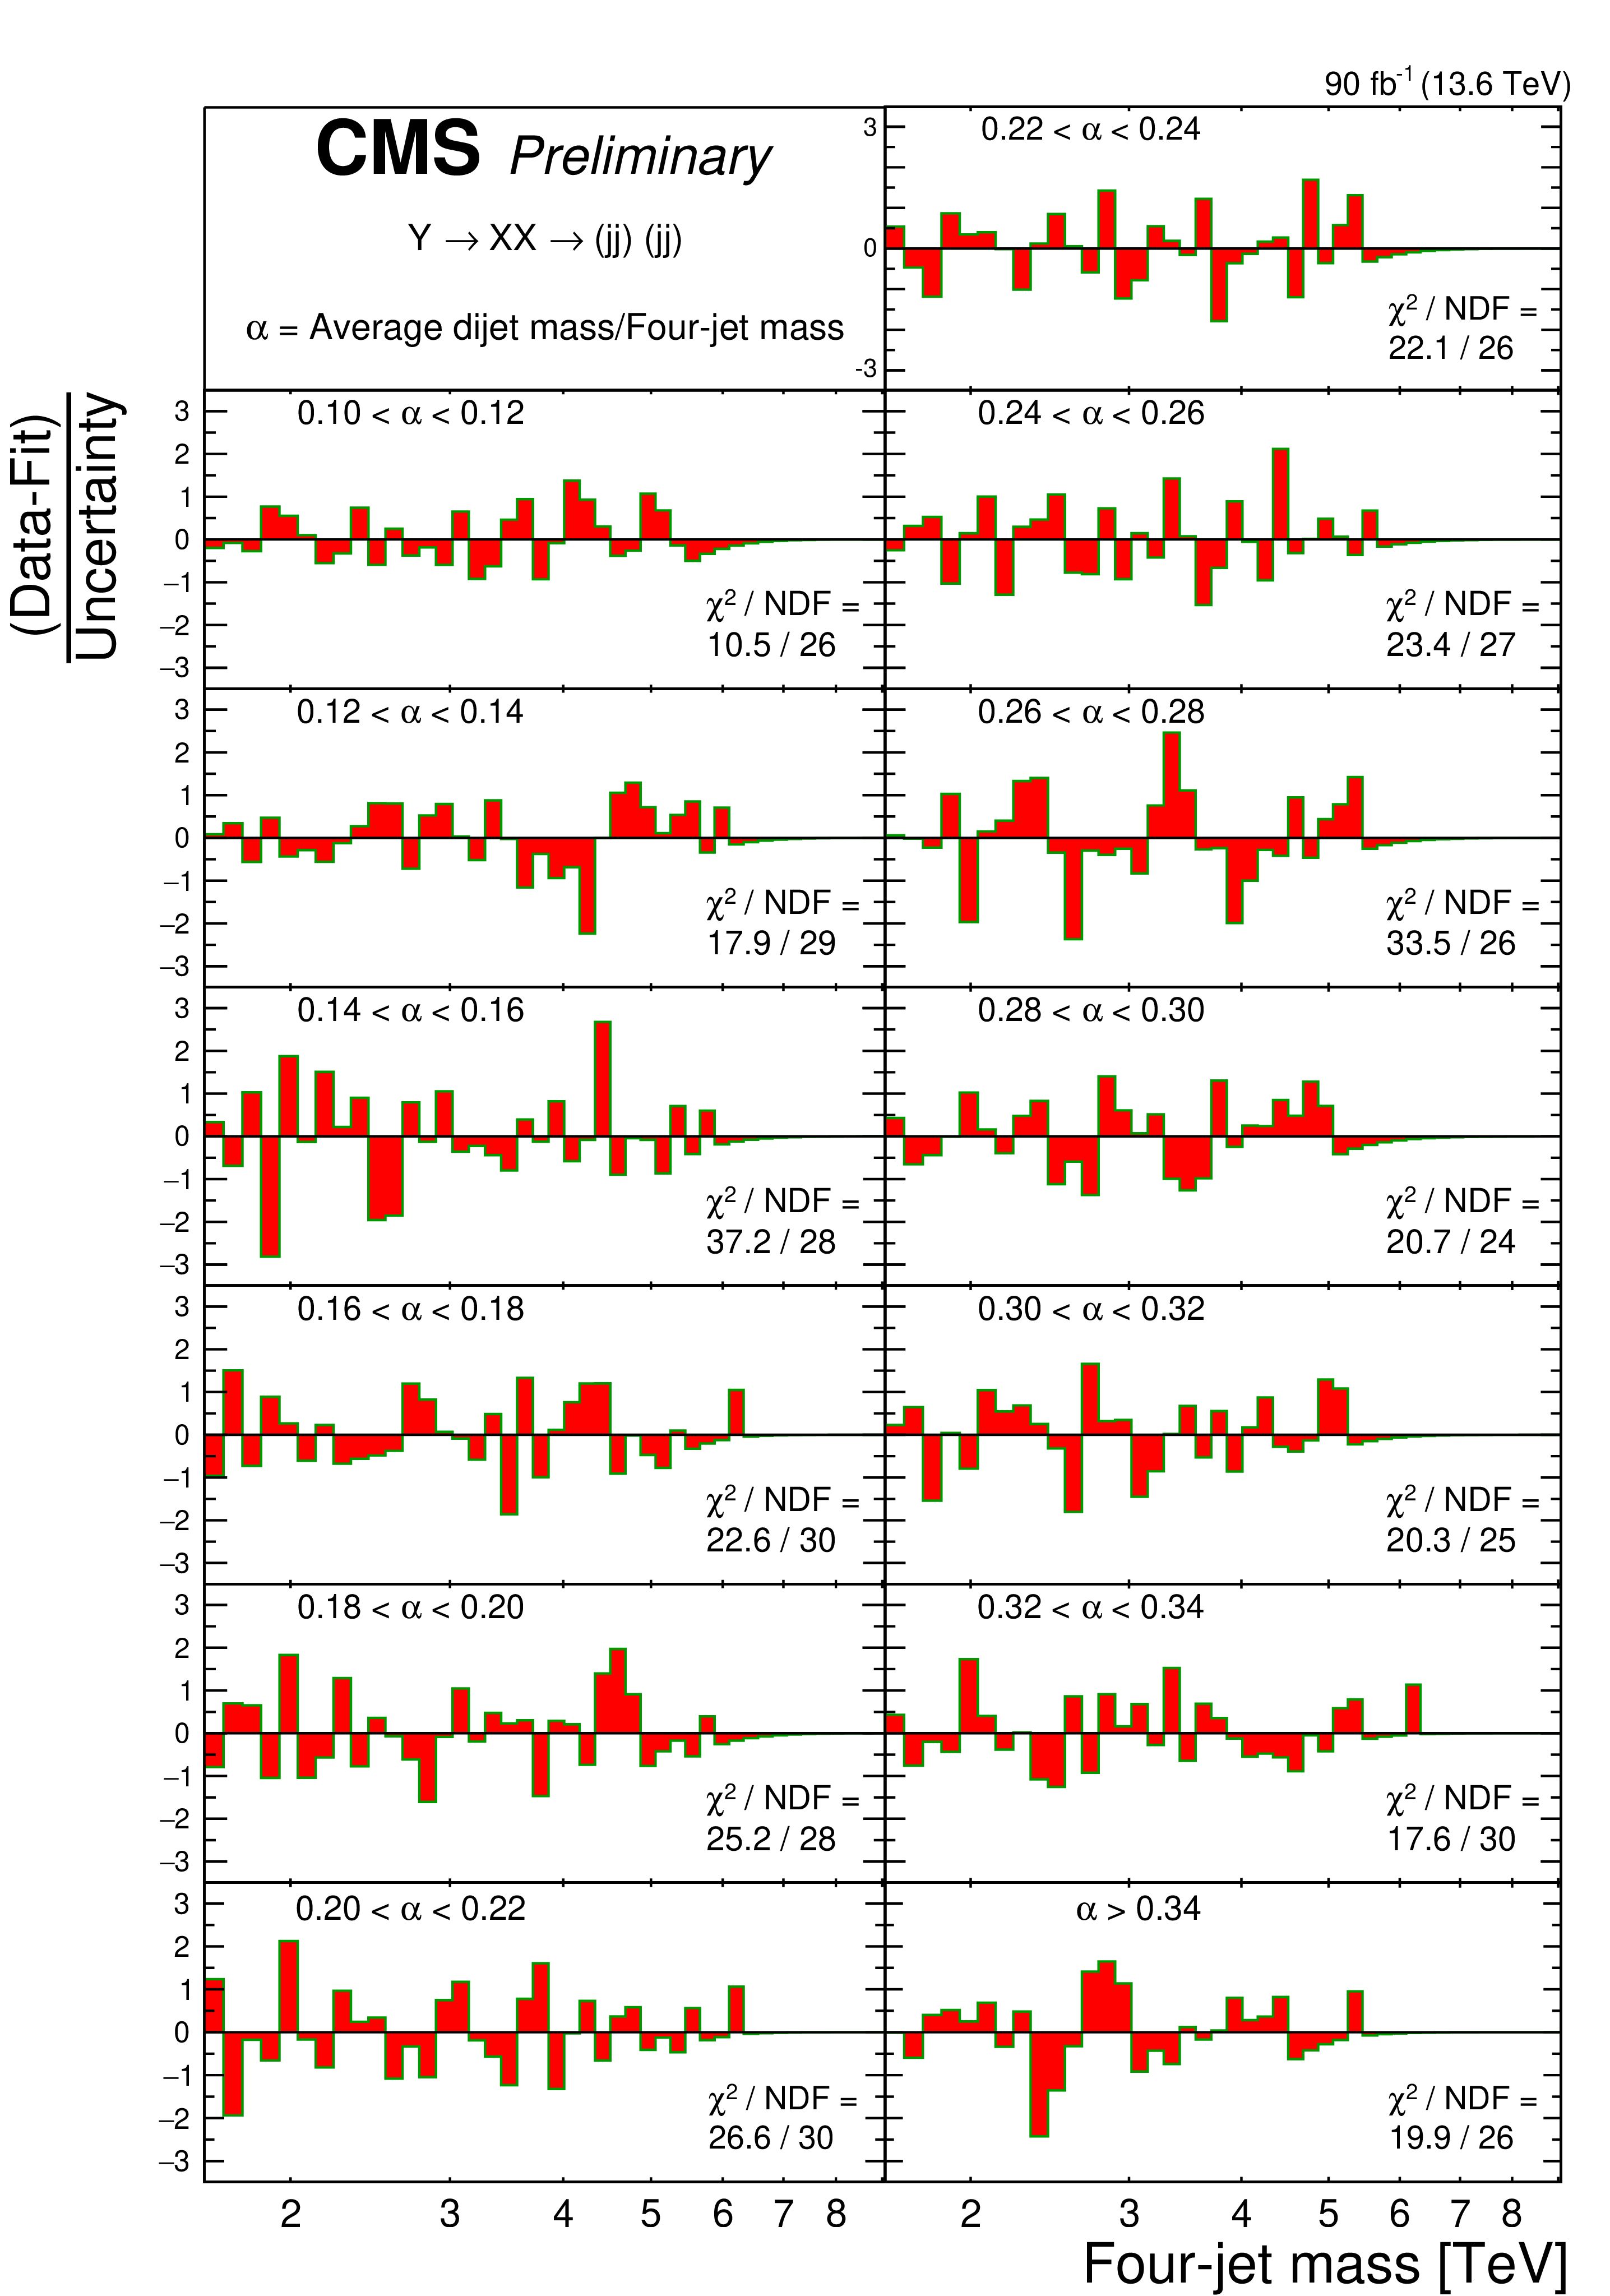
The pulls from the fit of the modified dijet function to the four-jet mass distribution, and the reduced chi-squared of the fit $ \chi^2 $/NDF, for all thirteen $ \alpha $ bins of the search. The pulls are calculated using the statistical uncertainty of the data. |
png pdf |
Figure 8:
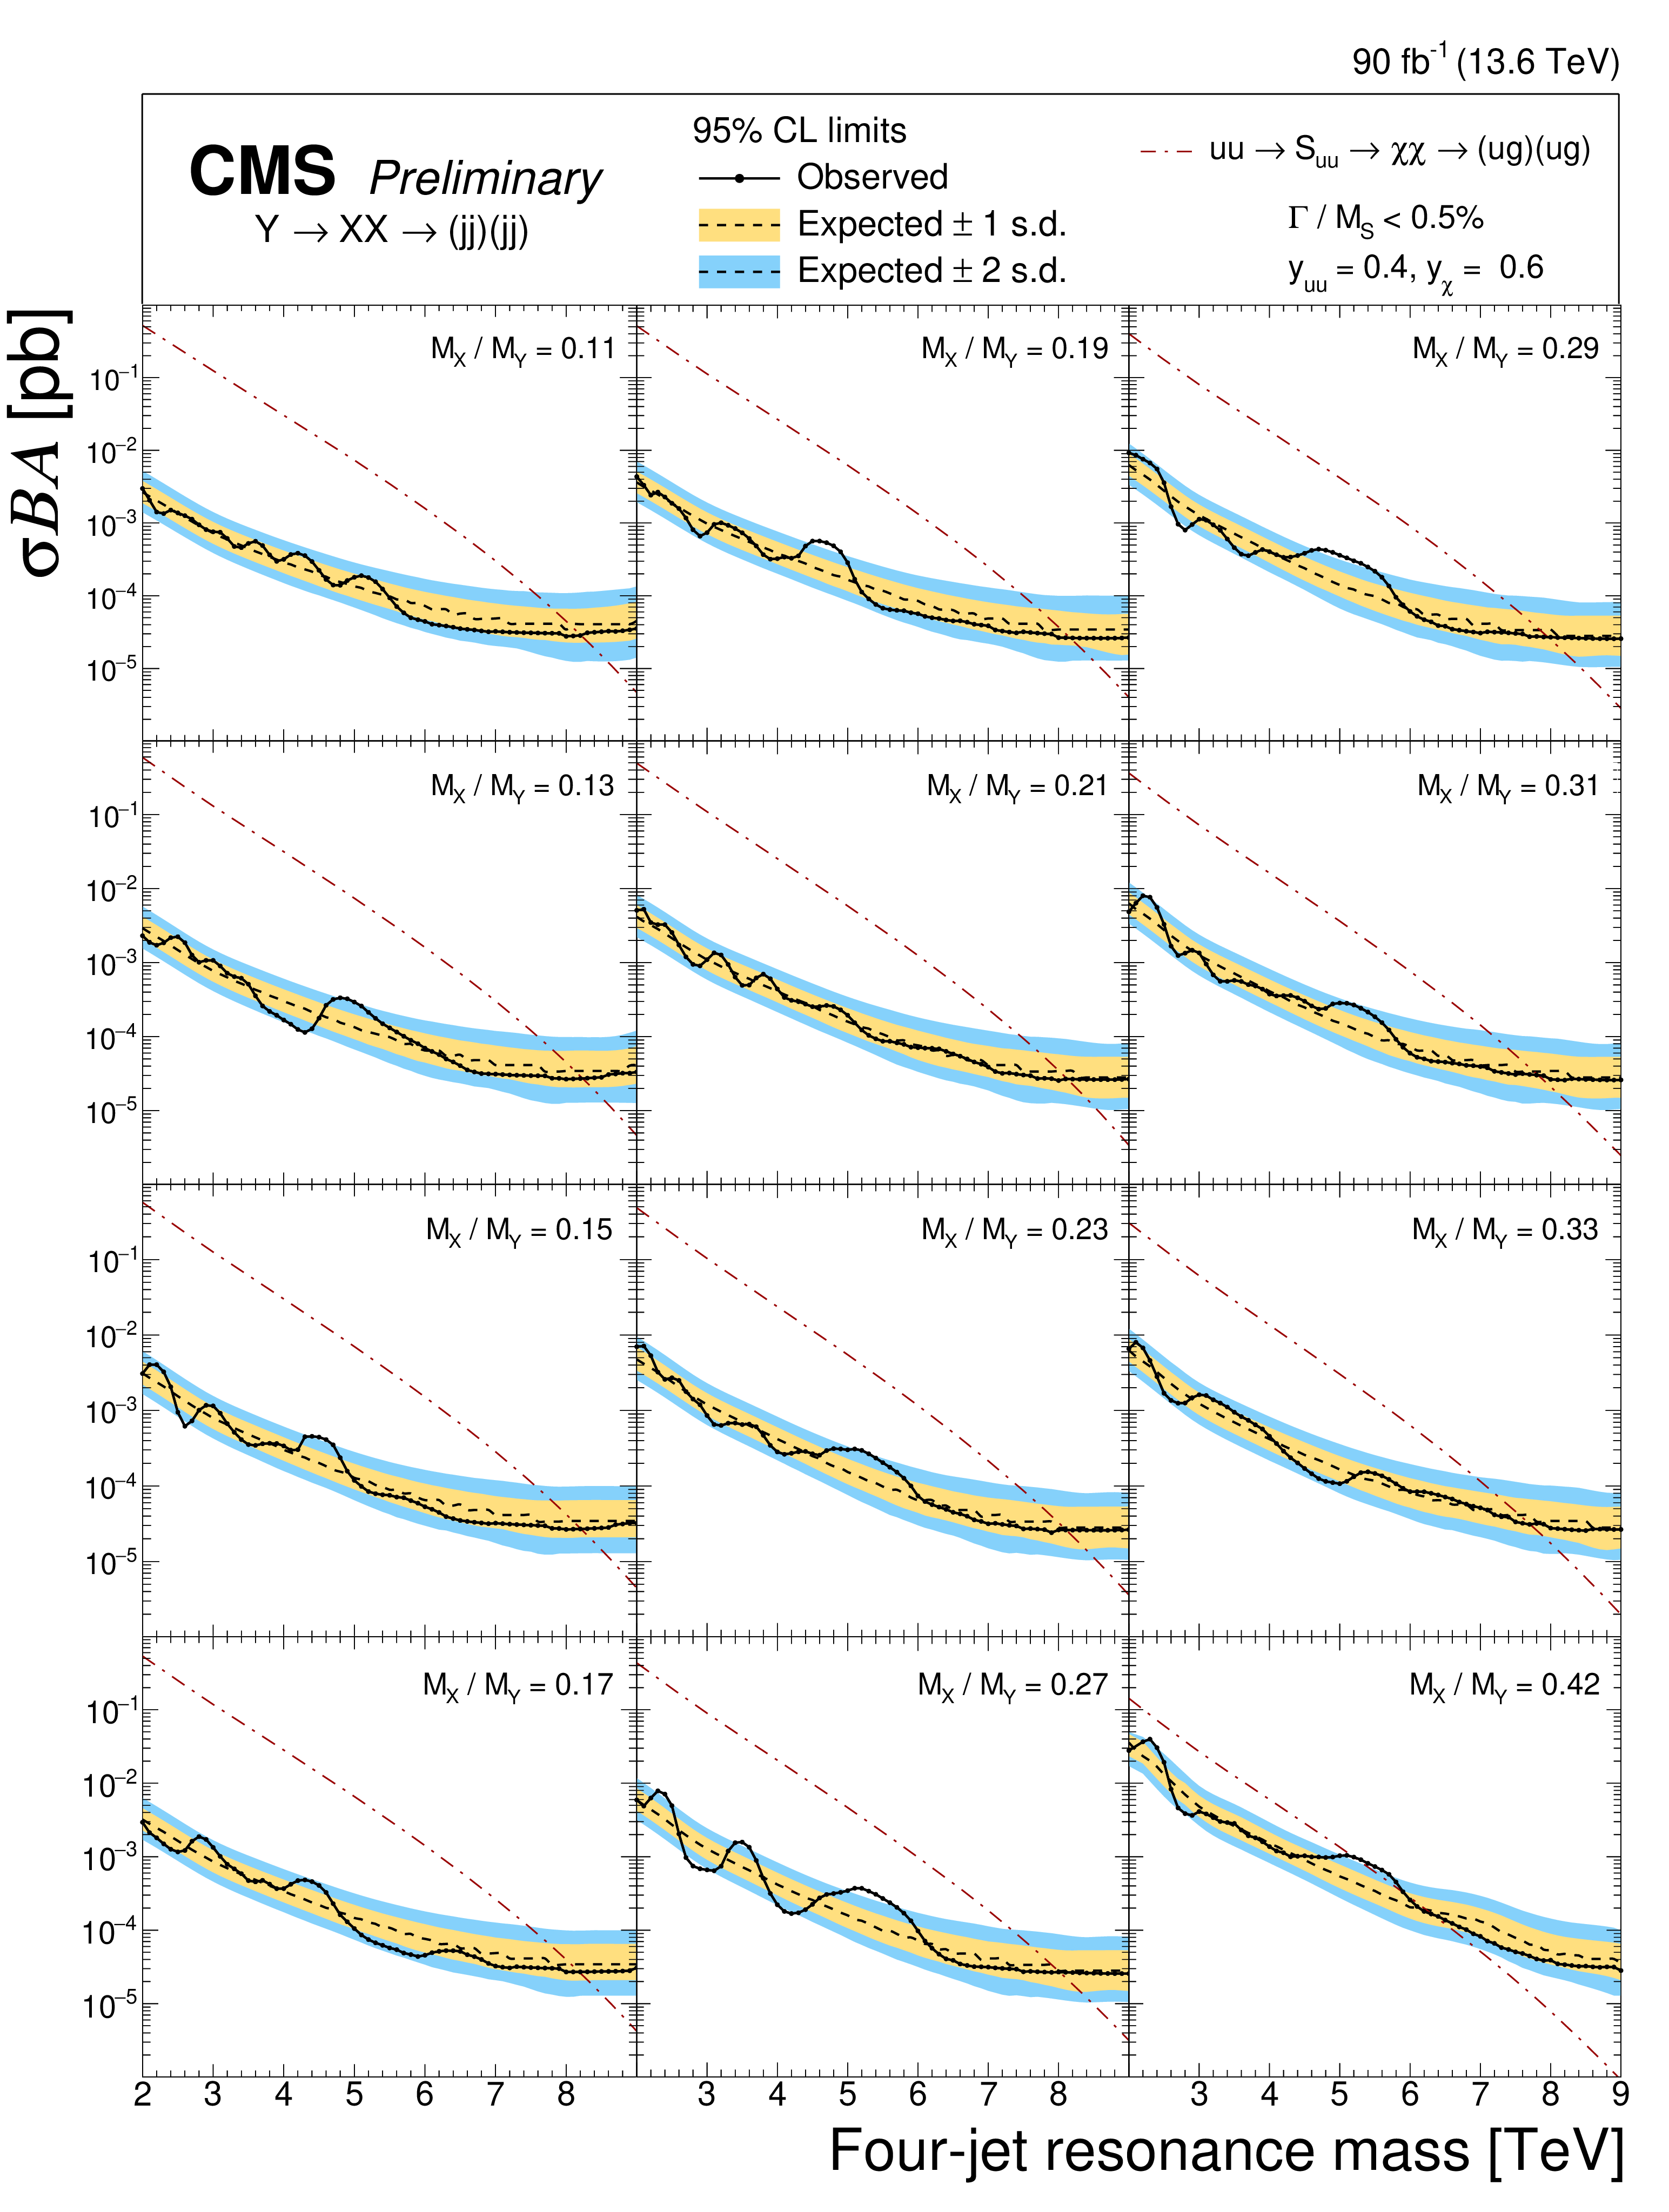
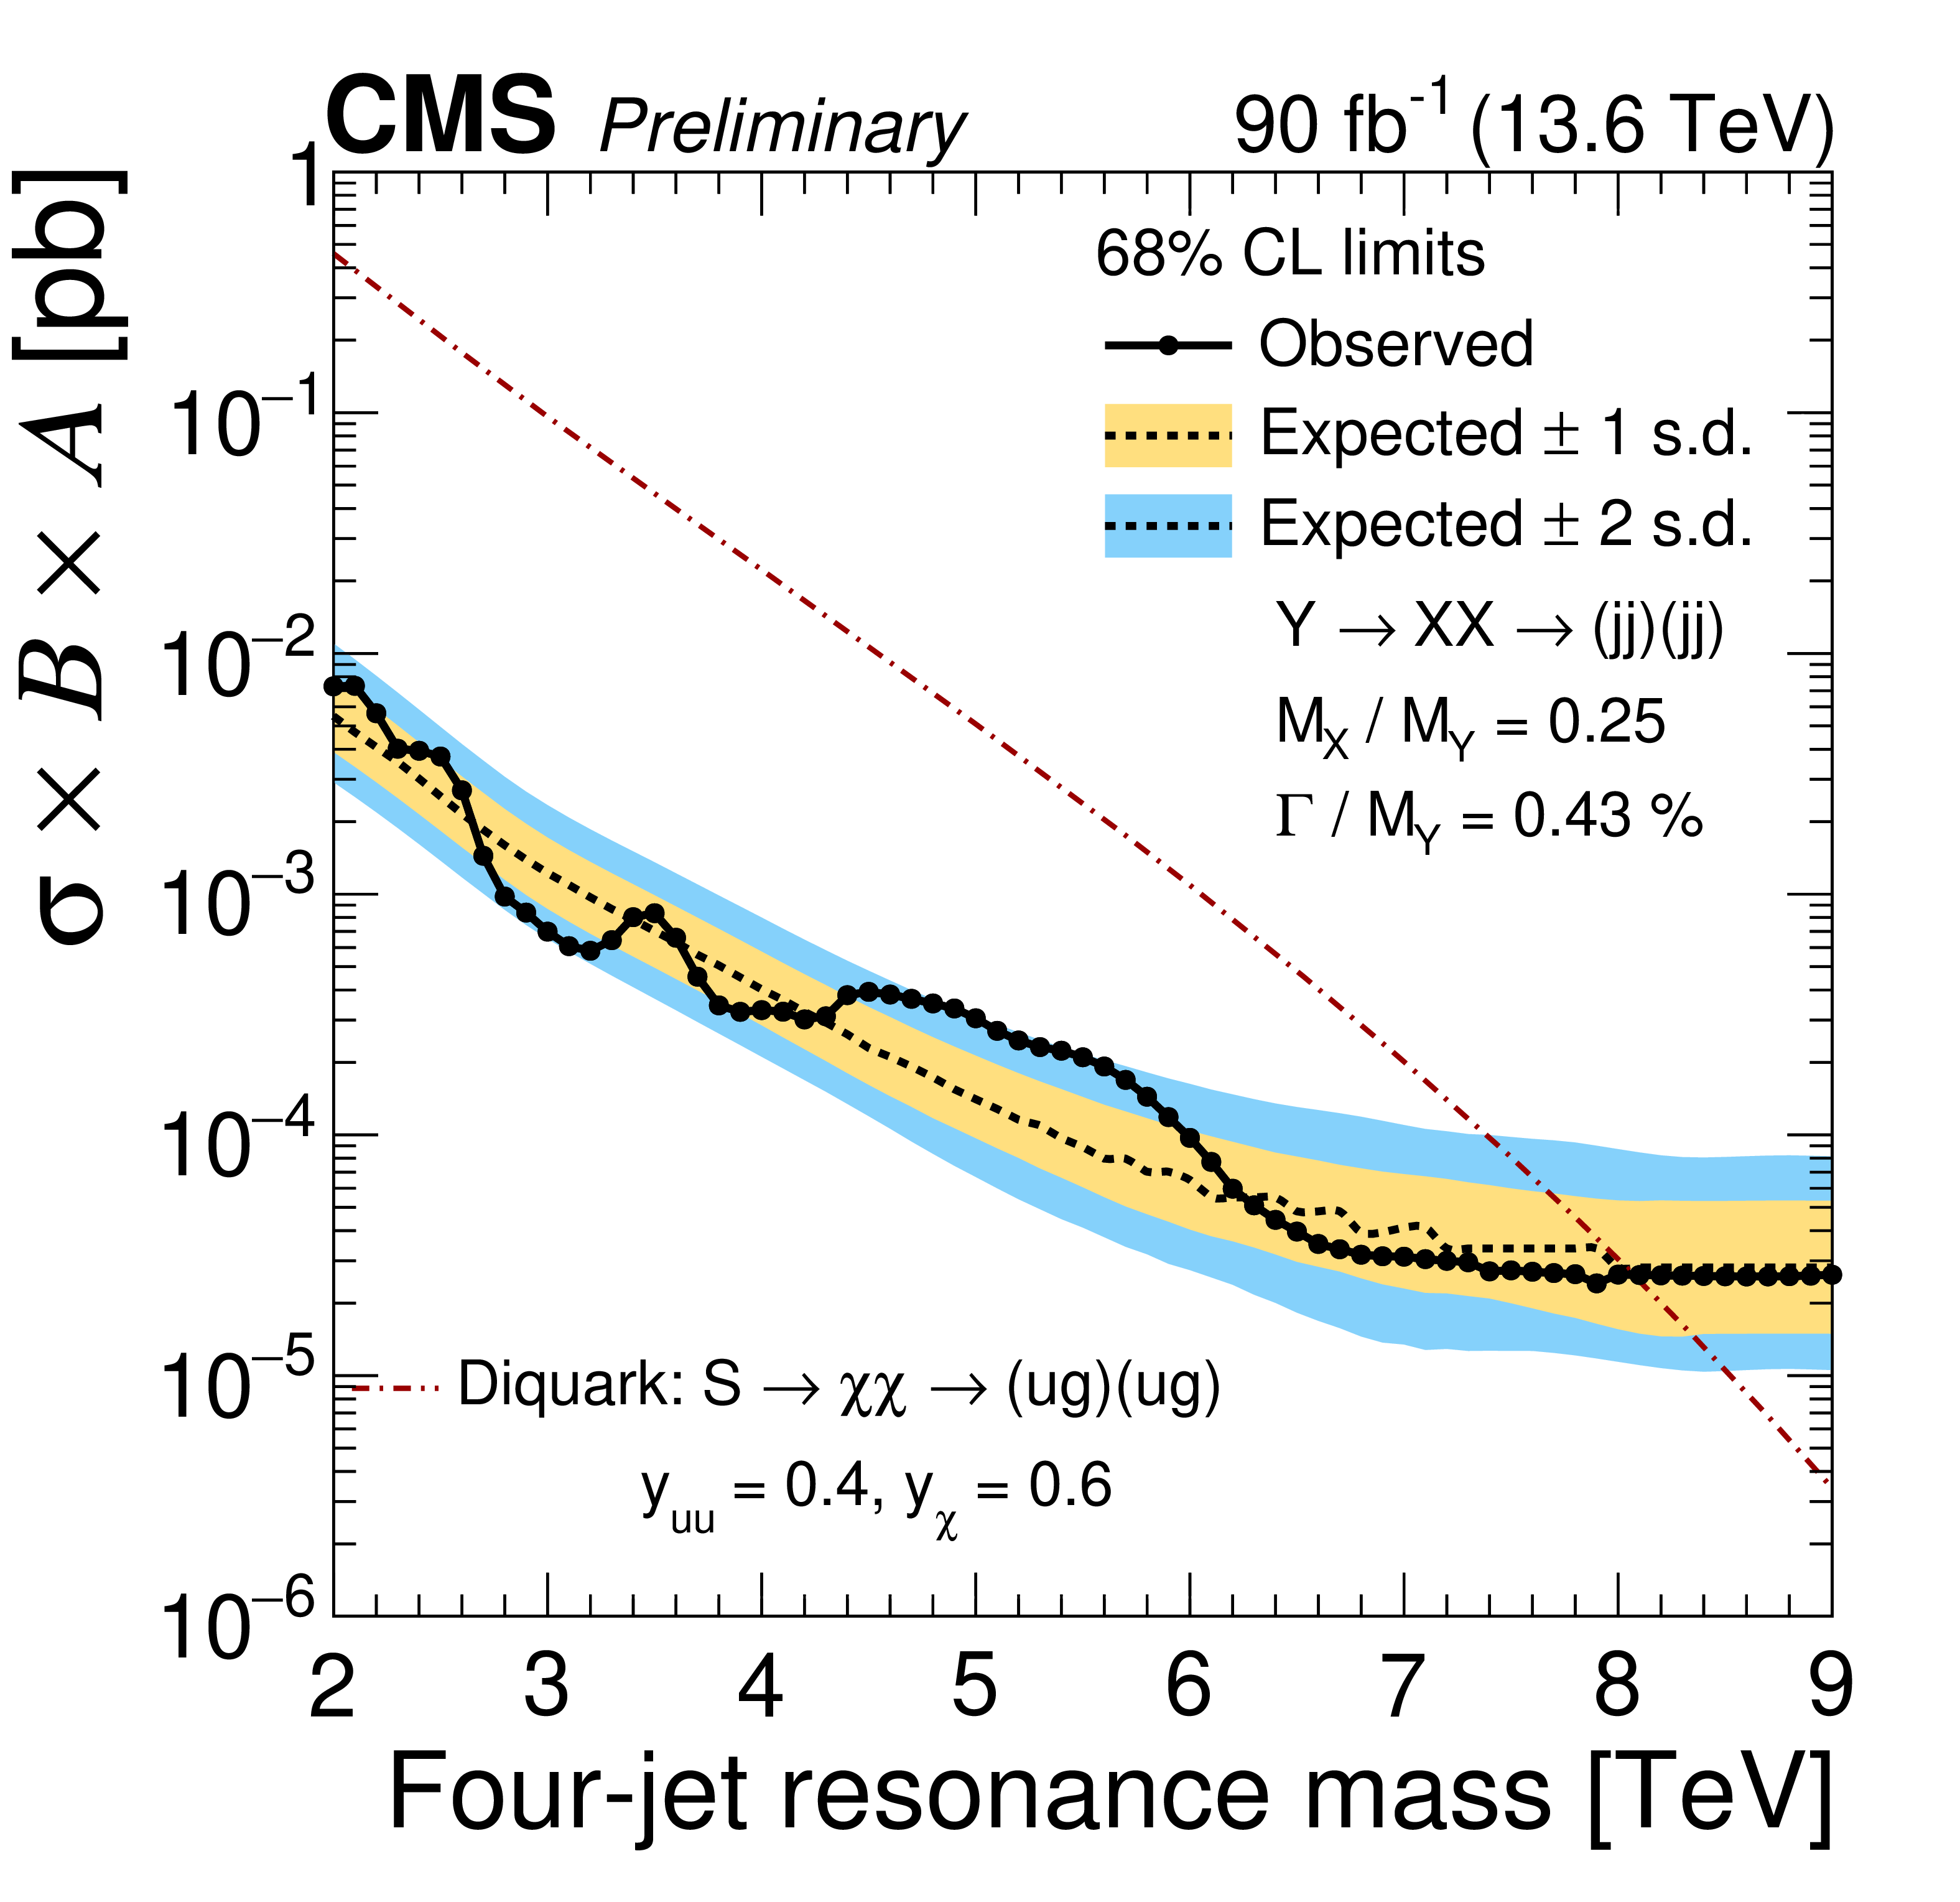
The observed 95% CL upper limits (black lines with points) on the product of the cross section, branching fraction, and acceptance for resonant production of paired dijet resonances decaying to a quark-gluon pair, with the values of $ \alpha_{\mathrm{true}} = M(\mathrm{X})/M(\mathrm{Y}) $ shown. The corresponding expected limits (dashed lines) and their variations at the 1 and 2 standard deviation levels (shaded bands) are also shown. Limits are compared to predictions for a scalar diquark [3] (dot-dashed line) with couplings to pairs of up quarks, $ y_{uu} = $ 0.4, and to pairs of vector-like quarks, $ y_{\chi} = $ 0.6. |
png pdf |
Figure 9:
The observed 95% CL upper limits (black lines with points) on the product of the cross section, branching fraction, and acceptance for resonant production of paired dijet resonances decaying to a quark-gluon pair, with $ \alpha_{\mathrm{true}}=M(\mathrm{X})/M(\mathrm{Y})= $ 0.25. The corresponding expected limits (dashed lines) and their variations at the 1 and 2 standard deviation levels (shaded bands) are also shown. Limits are compared to predictions for a scalar diquark [3] (dot-dashed line) with couplings to pairs of up quarks, $ y_{uu} = $ 0.4, and to pairs of vector-like quarks, $ y_{\chi} = $ 0.6. |
png pdf |
Figure 10:
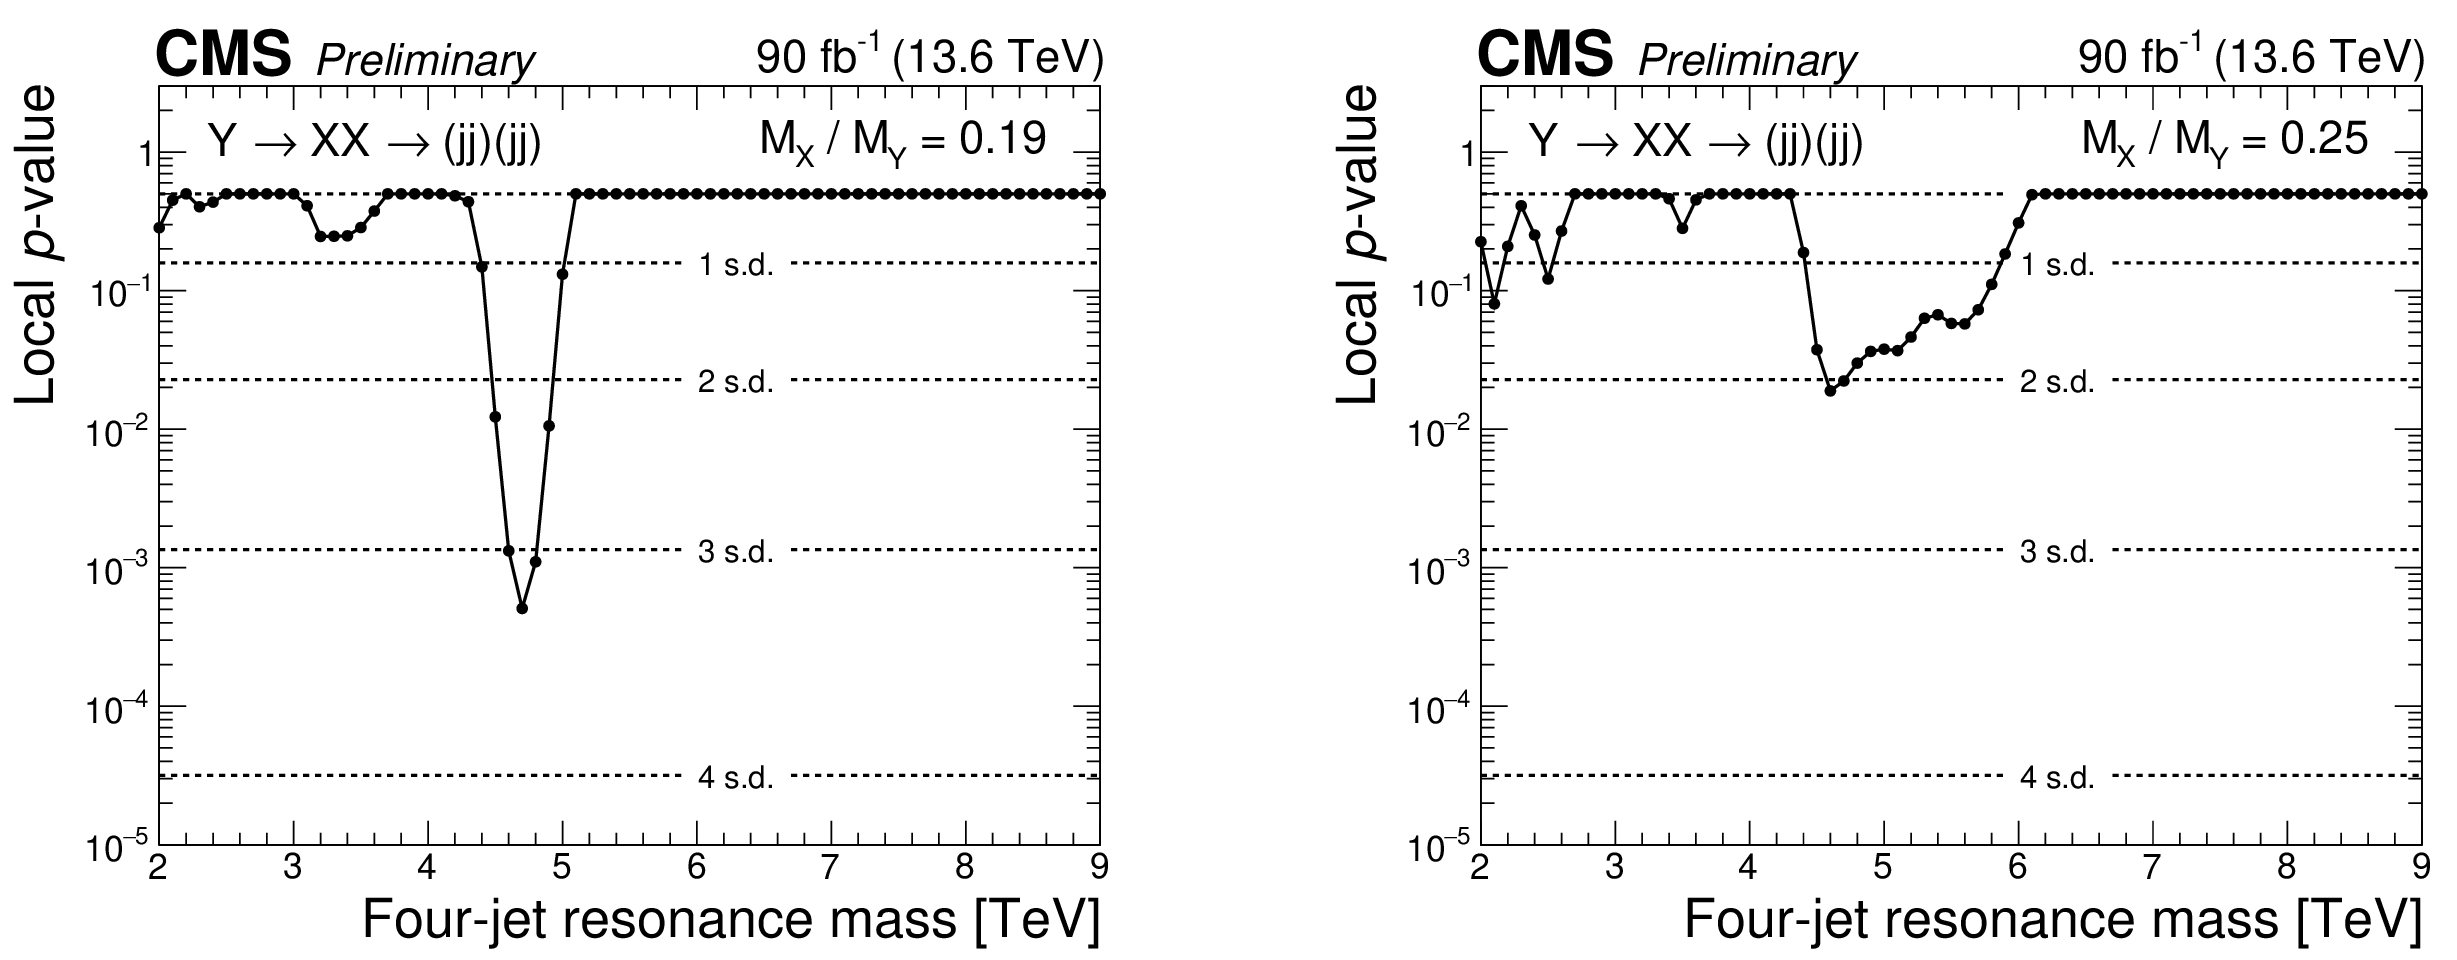
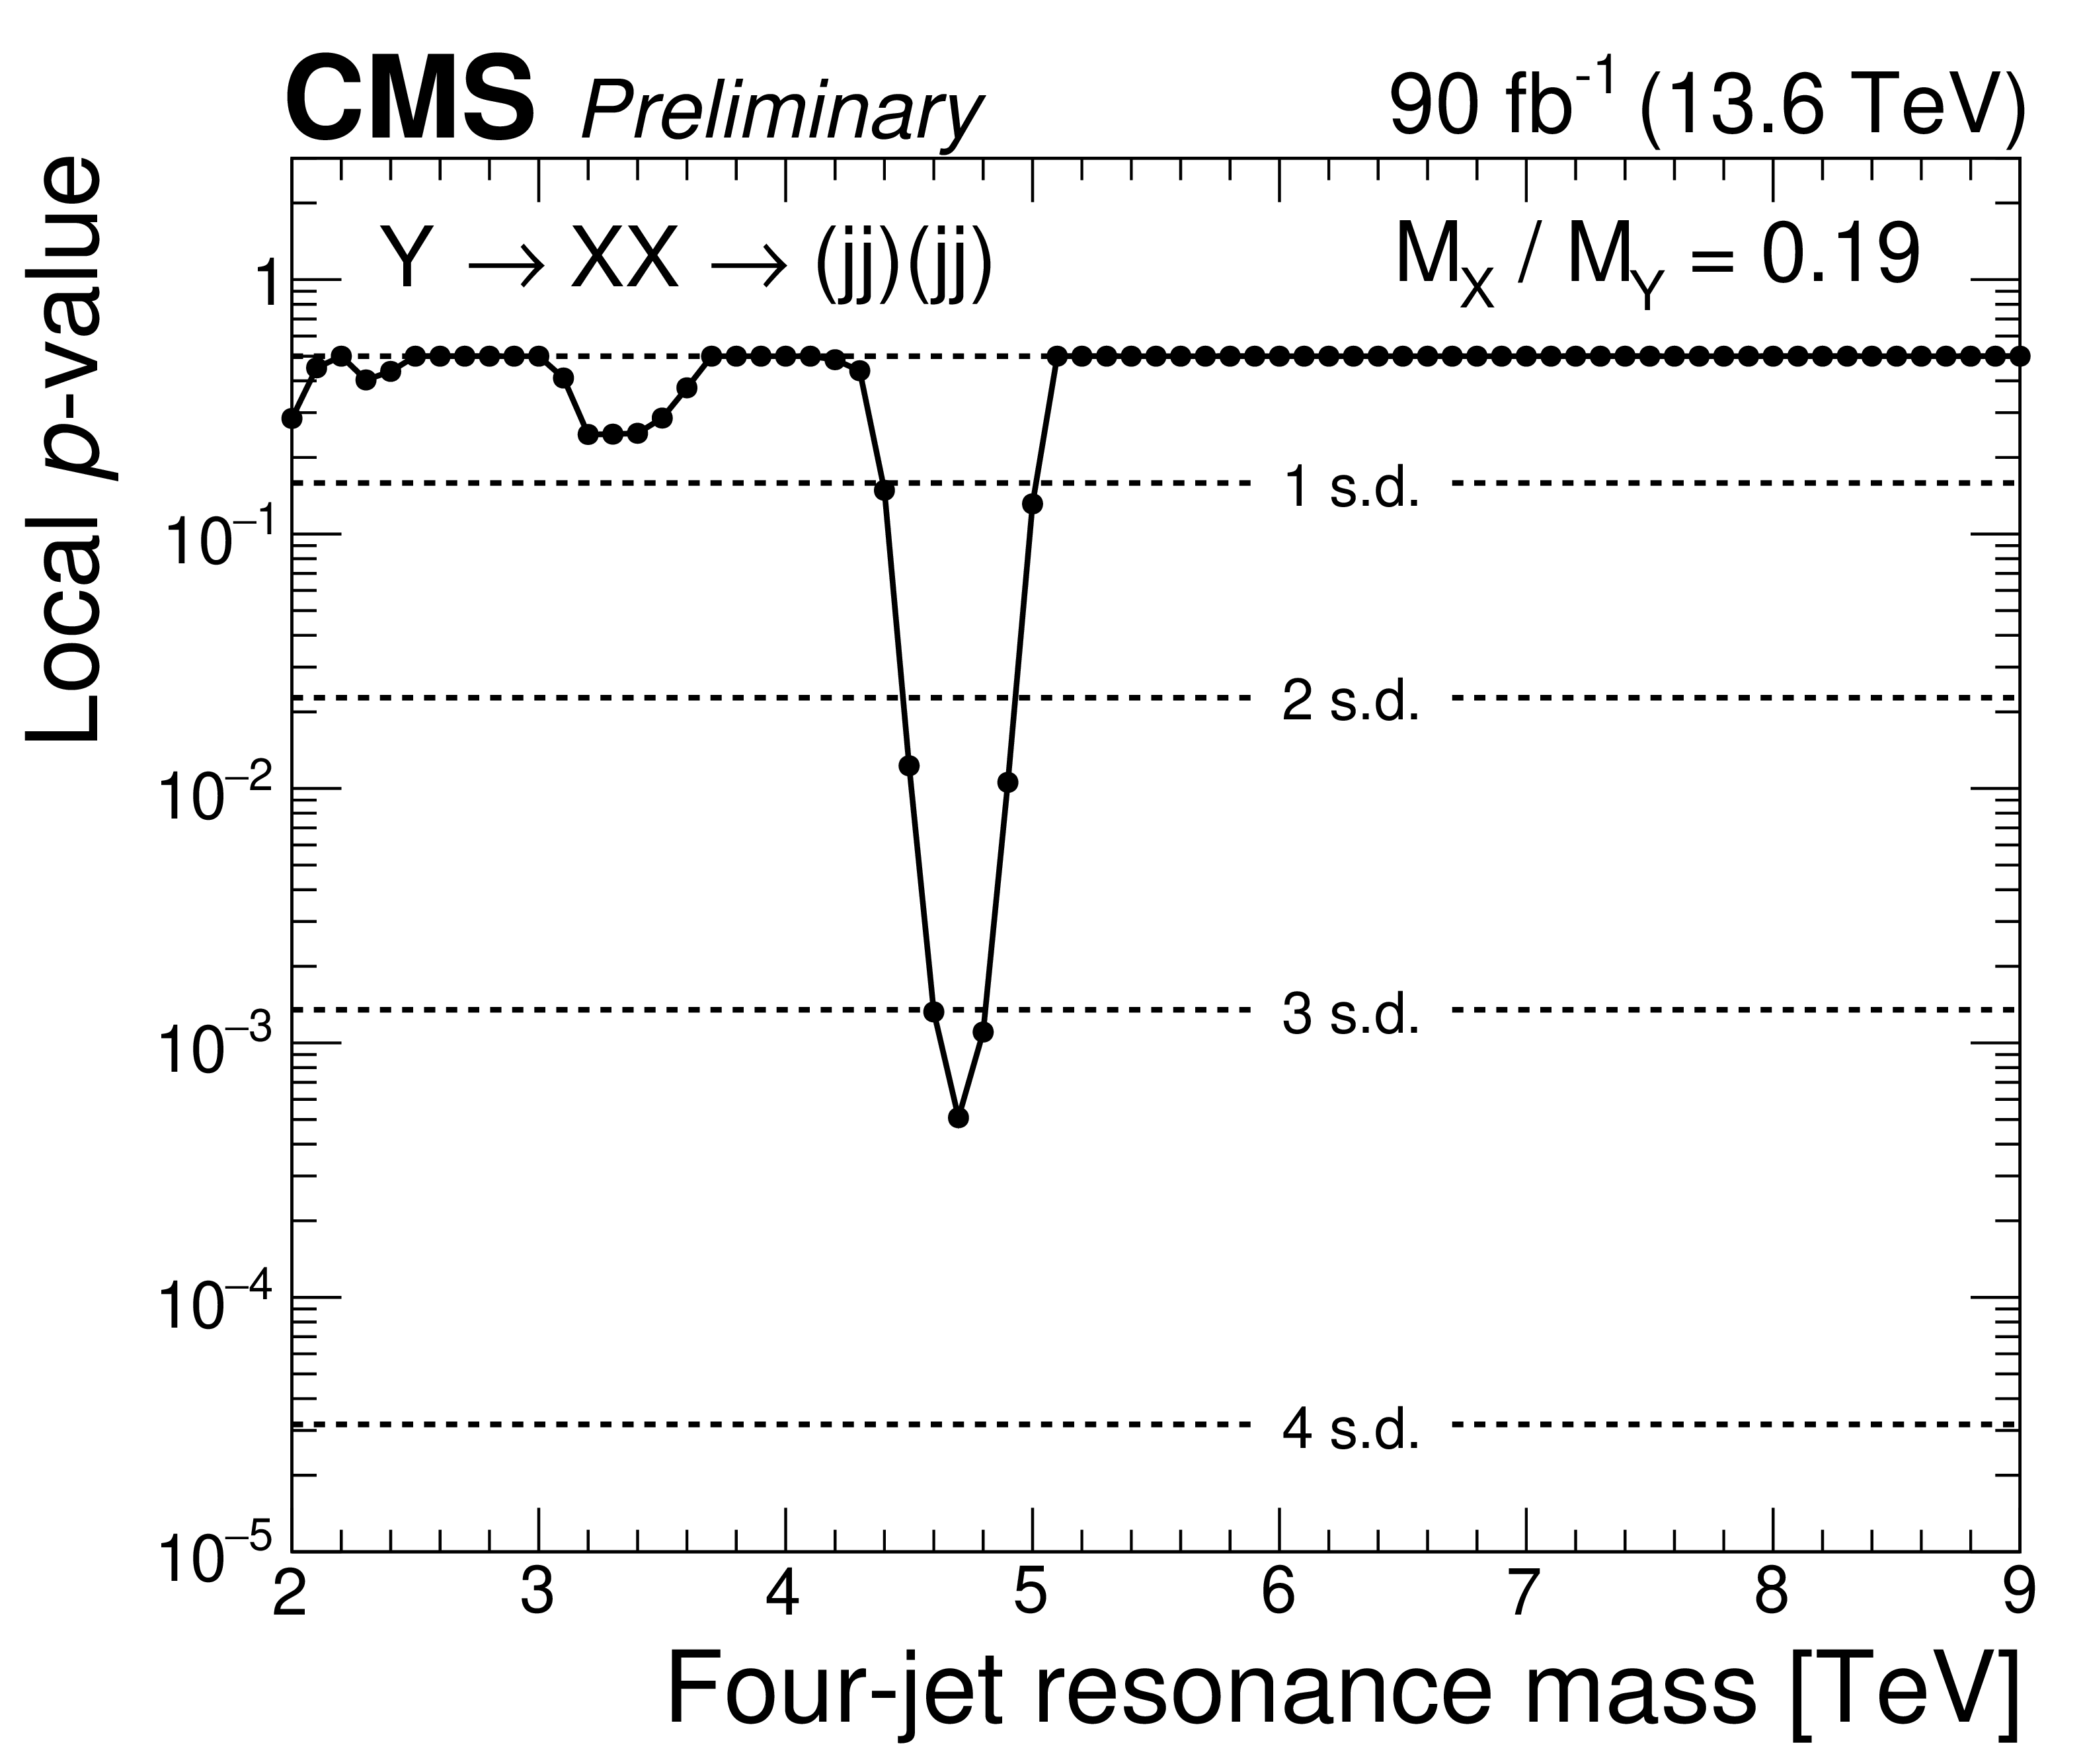
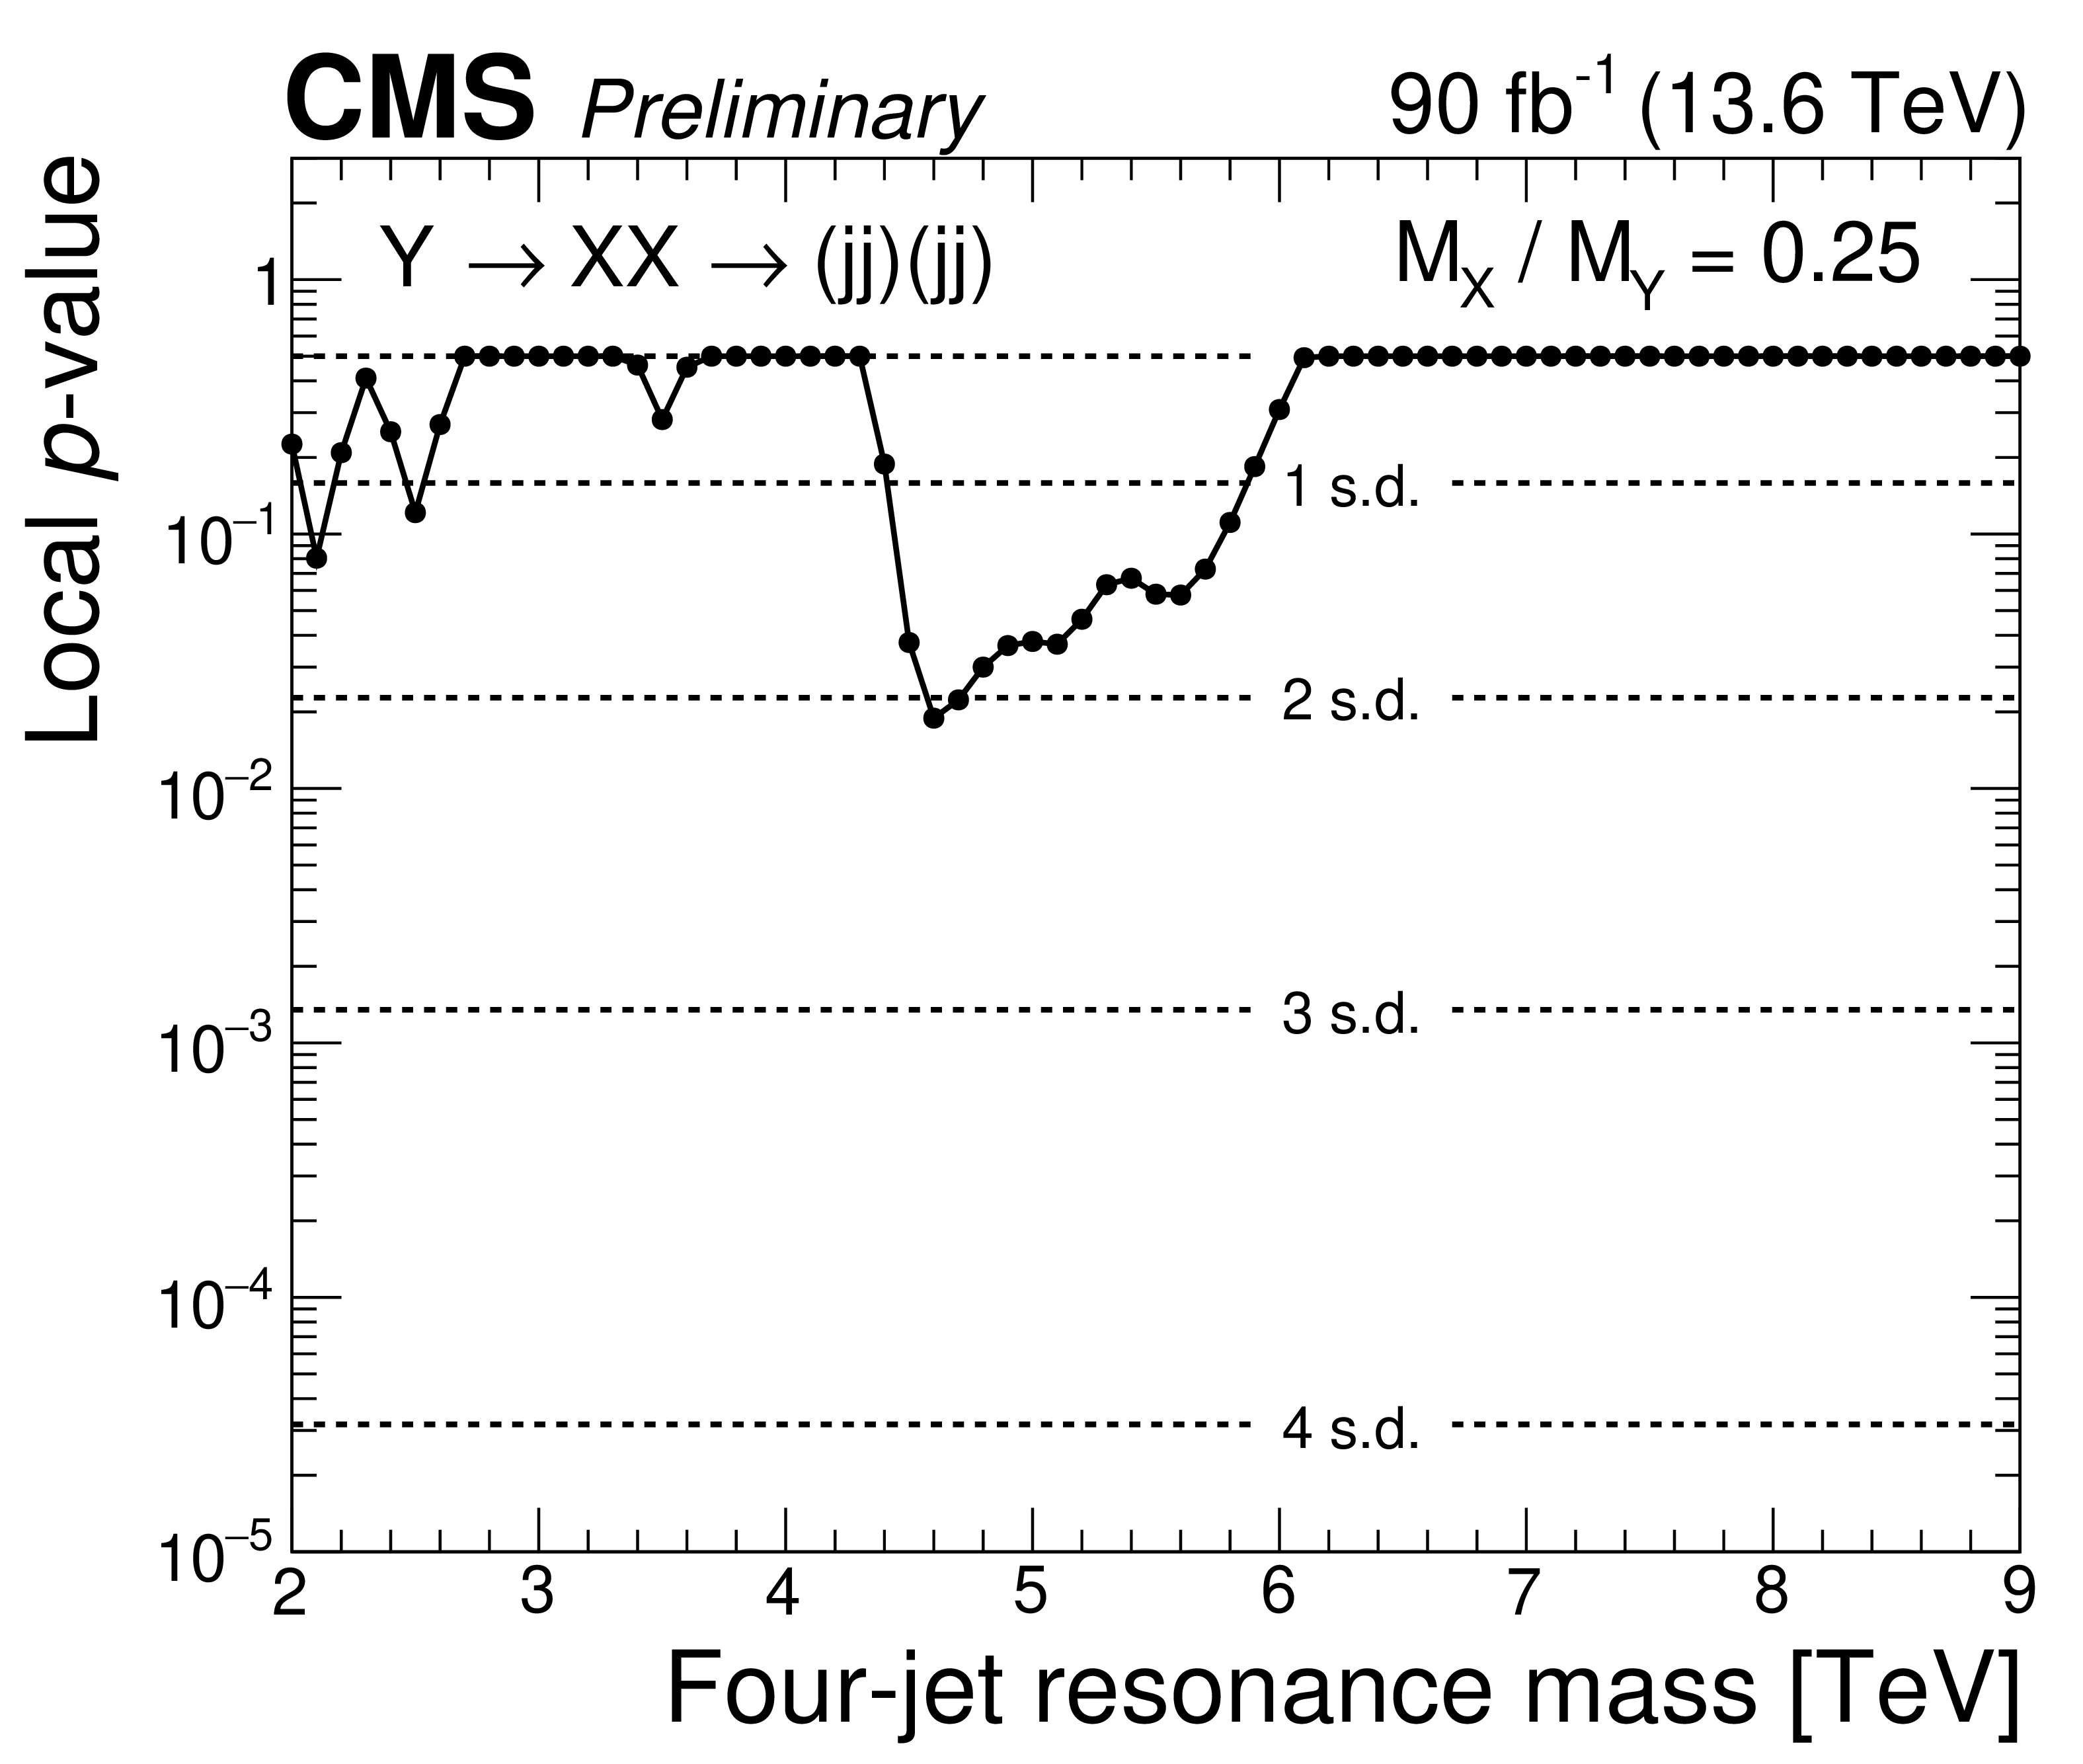
Observed $ p $-values (points) for a four-jet resonance, Y, decaying to a pair of dijet resonances, $ \mathrm{X} $, with $ \alpha_\textrm{true} = M(\mathrm{X})/M(\mathrm{Y}) = $ 0.19 (left) and $ \alpha_\textrm{true} = M(\mathrm{X})/M(\mathrm{Y}) = $ 0.25 (right). The vertical scales indicate the local $ p $-value for a signal over all $ \alpha $ bins. Also shown are corresponding levels of local significance in units of standard deviation ($ \sigma $). |
png pdf |
Figure 10-a:
Observed $ p $-values (points) for a four-jet resonance, Y, decaying to a pair of dijet resonances, $ \mathrm{X} $, with $ \alpha_\textrm{true} = M(\mathrm{X})/M(\mathrm{Y}) = $ 0.19 (left) and $ \alpha_\textrm{true} = M(\mathrm{X})/M(\mathrm{Y}) = $ 0.25 (right). The vertical scales indicate the local $ p $-value for a signal over all $ \alpha $ bins. Also shown are corresponding levels of local significance in units of standard deviation ($ \sigma $). |
png pdf |
Figure 10-b:
Observed $ p $-values (points) for a four-jet resonance, Y, decaying to a pair of dijet resonances, $ \mathrm{X} $, with $ \alpha_\textrm{true} = M(\mathrm{X})/M(\mathrm{Y}) = $ 0.19 (left) and $ \alpha_\textrm{true} = M(\mathrm{X})/M(\mathrm{Y}) = $ 0.25 (right). The vertical scales indicate the local $ p $-value for a signal over all $ \alpha $ bins. Also shown are corresponding levels of local significance in units of standard deviation ($ \sigma $). |
png pdf |
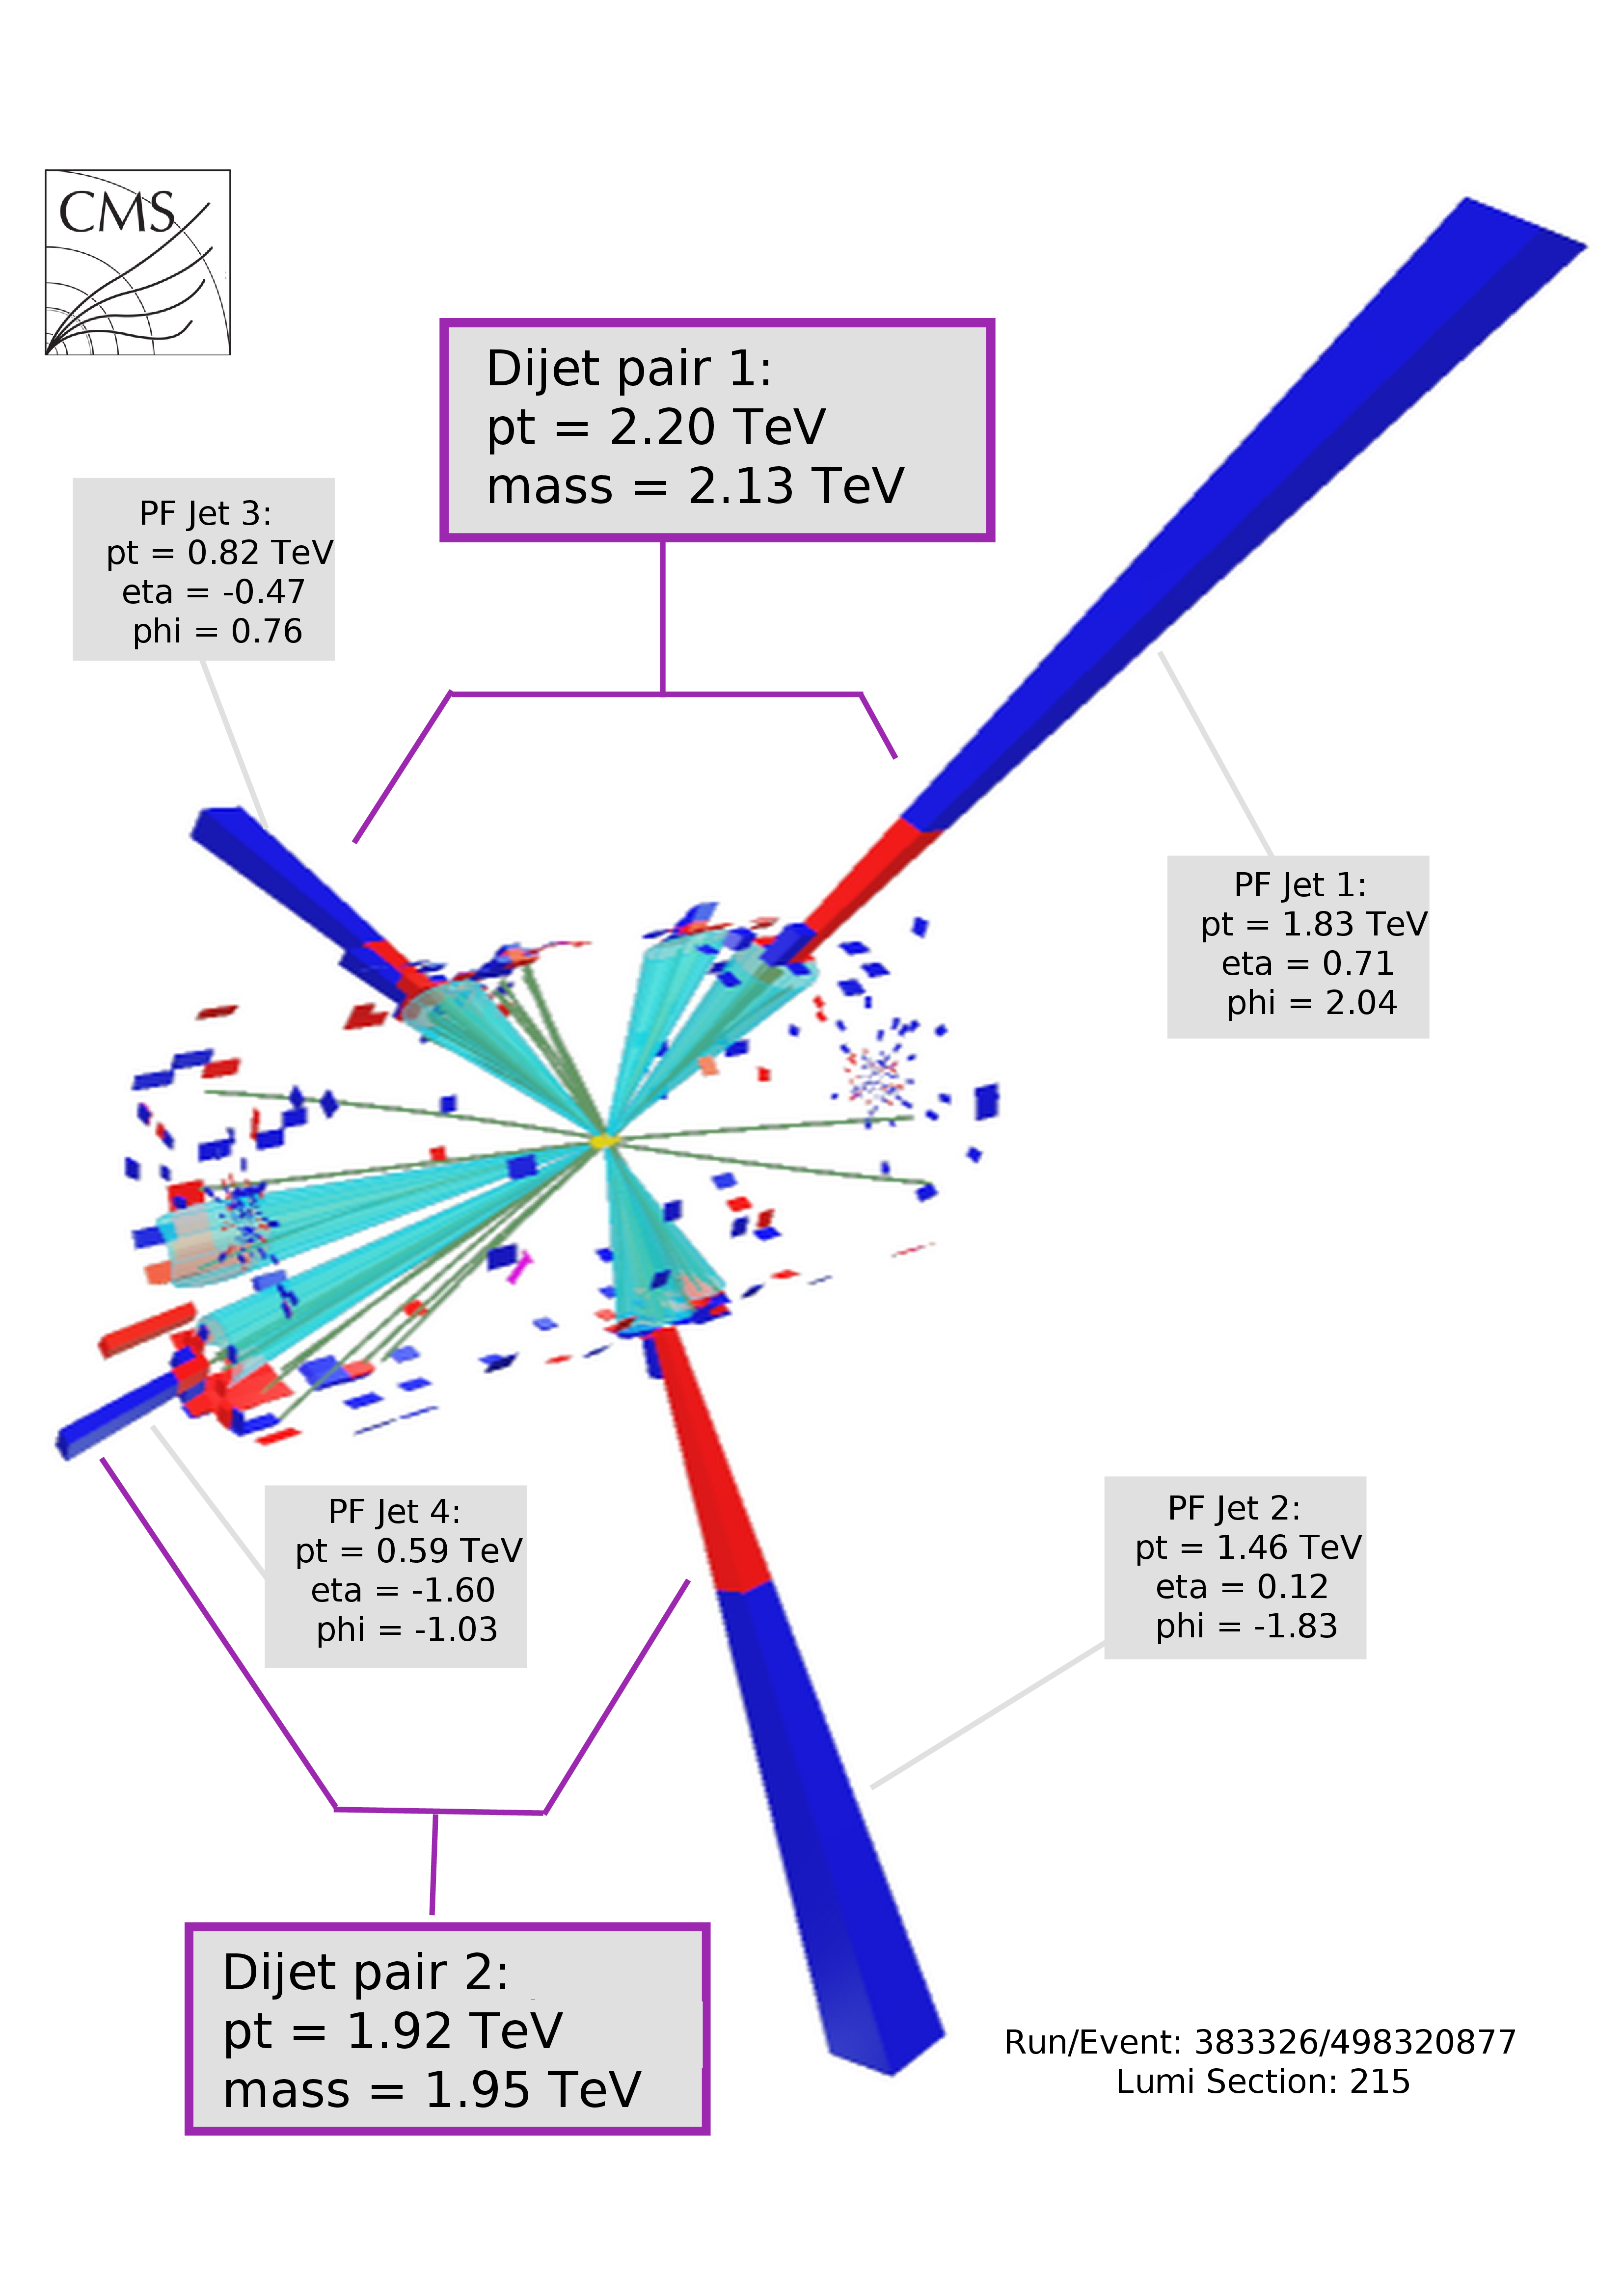
Figure 11:
Three--dimensional display of the event with the high four-jet mass of 6.21 TeV. The display shows the energy deposited in the electromagnetic (red) and hadronic (blue) calorimeters and the reconstructed tracks of charged particles (green). The grouping of the four observed jets into two dijet pairs (purple box) is discussed in the text. |
| Summary |
| A search for paired dijet resonances has been presented in final states with at least four jets, probing four-jet masses above 1.6 TeV. Data from proton-proton collisions at $ \sqrt{s}= $ 13.6 TeV were used in this search, collected by the CMS experiment at the LHC during 2024, corresponding to an integrated luminosity of 90 fb$^{-1}$. Empirical functions that model the background, and simulated shapes of resonance signals, are fitted to the observed four-jet mass distributions. The maximum significance is observed at a four-jet resonance mass of 4.7 TeV and a dijet resonance mass of 0.89 TeV, corresponding to 3.3 s.d. of local and 1.0 s.d. of global significance. Model-independent upper limits at 95% confidence level (CL) are presented on the production cross section times branching fraction and acceptance. The limits are presented as a function of the four-jet resonance mass between 2 and 9 TeV, for all accessible values of the ratio of the dijet to four-jet resonance masses. Limits are compared to a model [3] of diquarks, that decay to pairs of vector-like quarks, which in-turn decay to a quark and a gluon. Mass limits for all accessible values of the ratio of the vector-like quark to diquark masses, for a benchmark scenario where the diquark couplings to pairs of up quarks is 0.4, and the diquark couplings to pairs of vector-like quarks is 0.6 are presented. An interesting high four-jet mass event is observed in this search at 6.2 TeV four-jet and 2.0 TeV average dijet mass, similar to one of the highest four-jet mass CMS events and the hightest four-jet mass ATLAS event of Run 2. However, no additional events have been observed yet around 8 TeV in this search, but we do not exclude a four-jet resonance signal hypothesis for the Run 2 events. More data are needed to establish if these Run 2 events were the first hints of a signal or a statistical fluctuation of the QCD background. |
| References | ||||
| 1 | CMS Collaboration | Search for resonant and nonresonant production of pairs of dijet resonances in proton-proton collisions at $ \sqrt{s} = $ 13 TeV | JHEP 07 (2023) 161 | CMS-EXO-21-010 2206.09997 |
| 2 | ATLAS Collaboration | Pursuit of paired dijet resonances in the Run 2 dataset with ATLAS | PRD 108 (2023) 112005 | 2307.14944 |
| 3 | B. A. Dobrescu, R. M. Harris, and J. Isaacson | Ultraheavy resonances at the LHC: beyond the QCD background | 1810.09429 | |
| 4 | CMS Collaboration | The CMS experiment at the CERN LHC | JINST 3 (2008) S08004 | |
| 5 | T. Sjostrand et al. | An introduction to PYTHIA 8.2 | Comput. Phys. Commun. 191 (2015) 159 | 1410.3012 |
| 6 | CMS Collaboration | Event generator tunes obtained from underlying event and multiparton scattering measurements | EPJC 76 (2016) 155 | CMS-GEN-14-001 1512.00815 |
| 7 | NNPDF Collaboration | Parton distributions from high-precision collider data | EPJC 77 (2017) 663 | 1706.00428 |
| 8 | J. Alwall et al. | The automated computation of tree-level and next-to-leading order differential cross sections, and their matching to parton shower simulations | JHEP 07 (2014) 079 | 1405.0301 |
| 9 | GEANT4 Collaboration | Geant4 --- a simulation toolkit | Nucl. Instr. Meth. A 506 (2003) 250 | |
| 10 | CMS Collaboration | Particle-flow reconstruction and global event description with the CMS detector | JINST 12 (2017) P10003 | CMS-PRF-14-001 1706.04965 |
| 11 | M. Cacciari and G. P. Salam | Dispelling the $ N^{3} $ myth for the $ k_\mathrm{T} $ jet-finder | PLB 641 (2006) 57 | hep-ph/0512210 |
| 12 | M. Cacciari, G. P. Salam, and G. Soyez | The anti-$ k_{\mathrm{T}} $ jet clustering algorithm | JHEP 04 (2008) 063 | 0802.1189 |
| 13 | M. Cacciari, G. P. Salam, and G. Soyez | FastJet user manual | EPJC 72 (2012) 1896 | 1111.6097 |
| 14 | D. Contardo et al. | Technical Proposal for the Phase-II Upgrade of the CMS Detector | technical report, Geneva, 2015 link |
|
| 15 | CMS Collaboration | The CMS trigger system | JINST 12 (2017) P01020 | CMS-TRG-12-001 1609.02366 |
| 16 | CMS Collaboration | Jet energy scale and resolution in the CMS experiment in pp collisions at 8 TeV | JINST 12 (2017) P02014 | CMS-JME-13-004 1607.03663 |
| 17 | CMS Collaboration | Jet algorithms performance in 13 TeV data | CMS Physics Analysis Summary, CERN, 2017 CMS-PAS-JME-16-003 |
CMS-PAS-JME-16-003 |
| 18 | CMS Collaboration | Search for pair-produced resonances decaying to quark pairs in proton-proton collisions at $ \sqrt{s}= $ 13 TeV | PRD 98 (2018) 112014 | CMS-EXO-17-021 1808.03124 |
| 19 | CMS Collaboration | Search for narrow and broad dijet resonances in proton-proton collisions at $ \sqrt{s}= $ 13 TeV and constraints on dark matter mediators and other new particles | JHEP 08 (2018) 130 | CMS-EXO-16-056 1806.00843 |
| 20 | CMS Collaboration | Search for dijet resonances in proton-proton collisions at $ \sqrt{s} = $ 13 TeV and constraints on dark matter and other models | PLB 769 (2017) 520 | CMS-EXO-16-032 1611.03568 |
| 21 | CMS Collaboration | Search for narrow resonances in dijet final states at $ \sqrt{s}= $ 8 TeV with the novel CMS technique of data scouting | PRL 117 (2016) 031802 | CMS-EXO-14-005 1604.08907 |
| 22 | CMS Collaboration | Search for narrow resonances decaying to dijets in proton-proton collisions at $ \sqrt{s} = $ 13 TeV | PRL 116 (2016) 071801 | CMS-EXO-15-001 1512.01224 |
| 23 | CMS Collaboration | Search for dijet resonances in 7 TeV pp collisions at CMS | PRL 105 (2010) 211801 | CMS-EXO-10-010 1010.0203 |
| 24 | CMS Collaboration | Search for resonances in the dijet mass spectrum from 7 TeV pp collisions at CMS | PLB 704 (2011) 123 | CMS-EXO-11-015 1107.4771 |
| 25 | CMS Collaboration | Search for narrow resonances and quantum black holes in inclusive and b-tagged dijet mass spectra from pp collisions at $ \sqrt{s}= $ 7 TeV | JHEP 01 (2013) 013 | CMS-EXO-11-094 1210.2387 |
| 26 | CMS Collaboration | Search for narrow resonances using the dijet mass spectrum in pp collisions at $ \sqrt{s} = $ 8 TeV | PRD 87 (2013) 114015 | CMS-EXO-12-016 1302.4794 |
| 27 | CMS Collaboration | Search for resonances and quantum black holes using dijet mass spectra in proton-proton collisions at $ \sqrt{s} = $ 8 TeV | PRD 91 (2015) 052009 | CMS-EXO-12-059 1501.04198 |
| 28 | ATLAS Collaboration | Search for new phenomena in dijet mass and angular distributions from pp collisions at $ \sqrt{s}= $ 13 TeV with the ATLAS detector | PLB 754 (2016) 302 | 1512.01530 |
| 29 | ATLAS Collaboration | Search for new particles in two-jet final states in 7 TeV proton-proton collisions with the ATLAS detector at the LHC | PRL 105 (2010) 161801 | 1008.2461 |
| 30 | ATLAS Collaboration | Search for new physics in dijet mass and angular distributions in $ pp $ collisions at $ \sqrt{s} = $ 7 TeV measured with the ATLAS detector | New J. Phys. 13 (2011) 053044 | 1103.3864 |
| 31 | ATLAS Collaboration | Search for new physics in the dijet mass distribution using 1 fb$ ^{-1} $ of $ pp $ collision data at $ \sqrt{s} = $ 7 TeV collected by the ATLAS detector | PLB 708 (2012) 37 | 1108.6311 |
| 32 | ATLAS Collaboration | ATLAS search for new phenomena in dijet mass and angular distributions using pp collisions at $ \sqrt{s}= $ 7 TeV | JHEP 01 (2013) 029 | 1210.1718 |
| 33 | ATLAS Collaboration | Search for new phenomena in the dijet mass distribution using pp collision data at $ \sqrt{s}= $ 8 TeV with the ATLAS detector | PRD 91 (2015) 052007 | 1407.1376 |
| 34 | CDF Collaboration | Search for new particles decaying into dijets in proton-antiproton collisions at $ \sqrt{s} = $ 1.96 TeV | PRD 79 (2009) 112002 | 0812.4036 |
| 35 | P. D. Dauncey, M. Kenzie, N. Wardle, and G. J. Davies | Handling uncertainties in background shapes: the discrete profiling method | JINST 10 (2015) P04015 | 1408.6865 |
| 36 | E. Gross and O. Vitells | Trial factors for the look elsewhere effect in high energy physics | EPJC 70 (2010) 525 | |
| 37 | CMS Collaboration | Measurement of the offline integrated luminosity for the cms proton-proton collision dataset recorded in 2023 | CMS Detector Performance Summary CMS-DP-2024-068, 2024 CDS |
|
| 38 | T. Junk | Confidence level computation for combining searches with small statistics | Nucl. Instr. Meth. A 434 (1999) 435 | hep-ex/9902006 |
| 39 | A. L. Read | Presentation of search results: the $ CL_s $ technique | JPG 28 (2002) 2693 | |
| 40 | ATLAS and CMS Collaborations, and LHC Higgs Combination Group | Procedure for the LHC Higgs boson search combination in summer 2011 | Technical Report CMS-NOTE-2011-005, ATL-PHYS-PUB-2011-11, CERN, 2011 | |
| 41 | G. Cowan, K. Cranmer, E. Gross, and O. Vitells | Asymptotic formulae for likelihood-based tests of new physics | EPJC 71 (2011) 1554 | |
|
|
Compact Muon Solenoid LHC, CERN |
|

|

|

|

|

|