

Compact Muon Solenoid
LHC, CERN
| CMS-PAS-EXO-24-006 | ||
| Search for heavy resonances decaying into four leptons with high Lorentz boosts in proton-proton collisions at $ \sqrt{s} = $ 13 TeV | ||
| CMS Collaboration | ||
| 29 March 2025 | ||
| Abstract: A search for a high-mass resonance decaying into four-lepton final states via two intermediate bosons is presented. The search uses proton-proton collision data at a center-of-mass energy of 13 TeV collected by the CMS detector at LHC, corresponding to an integrated luminosity of 138 fb$ ^{-1} $. Signal hypotheses with a light intermediate boson may result in highly collimated decay products. Boosted electron pairs reconstructed into a single merged object are distinguished using a novel electron identification technique. A collimated muon pair may fail to reconstruct one of the tracks. In this case, the missing muon momentum is obtained from the missing transverse energy. No significant excess is observed. Model-independent upper limits on the product of cross section and branching ratio to four-leptons are set with $ \mathrm{X}\rightarrow\mathrm{YY}\rightarrow\!4\ell $ and $ \mathrm{X}\rightarrow\mathrm{Z}\mathrm{Y}\rightarrow\!4\ell $ channels for $ M_{\mathrm{X}} $ from 250 GeV to 2 TeV and $ M_{\mathrm{Y}} $ greater than 0.4 GeV at 95% confidence level. | ||
| Links: CDS record (PDF) ; CADI line (restricted) ; | ||
| Figures | |
png pdf |
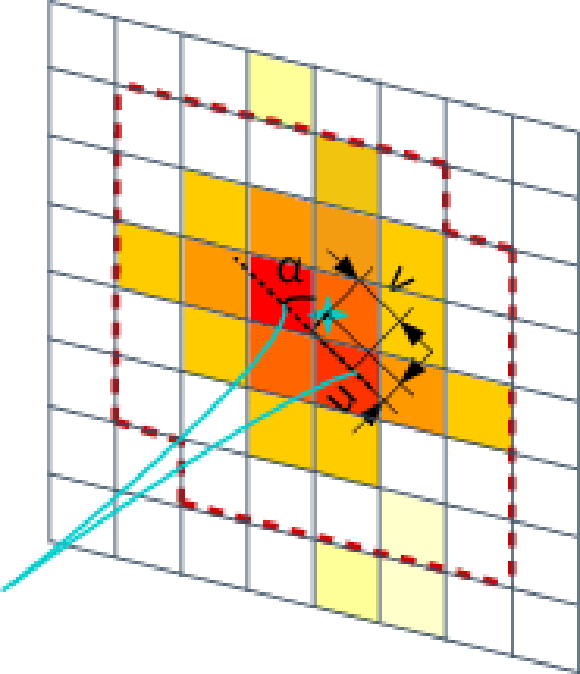
Figure 1:
Visual representations of the variable $ \alpha_{track} $, $ \Delta u_{in}^{5\times5} $ and $ \Delta v_{in}^{5\times5} $. Cyan-colored lines depict the incoming tracks of an electron pair. The Red dashed line represents the union of two 5$ \times $5 clusters around the closest crystal from the tracks. The cyan-colored star is the log-weighted CoG of the $ \textrm{U}_{5\times5} $ clusters. |
png pdf |
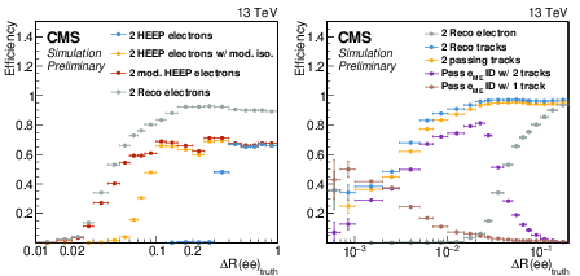
Figure 2:
The signal dielectron ID efficiency as a function of $ \Delta R $ for the cases with (left) two reconstructed electrons and (right) a $ \mathrm{e}_{\textrm{ME}} $. The ID efficiencies incorporate the effects of all prerequisite selections. For instance, the HEEP ID efficiency includes the reconstruction efficiency, and the $ \mathrm{e}_{\textrm{ME}} $ ID efficiency with two tracks includes track selection efficiency. |
png pdf |
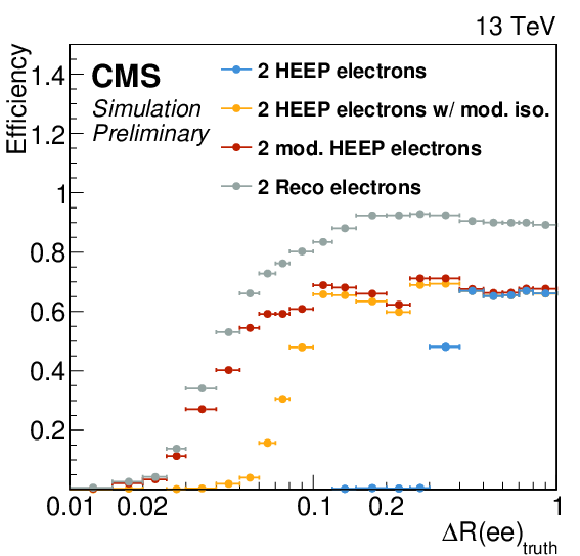
Figure 2-a:
The signal dielectron ID efficiency as a function of $ \Delta R $ for the cases with (left) two reconstructed electrons and (right) a $ \mathrm{e}_{\textrm{ME}} $. The ID efficiencies incorporate the effects of all prerequisite selections. For instance, the HEEP ID efficiency includes the reconstruction efficiency, and the $ \mathrm{e}_{\textrm{ME}} $ ID efficiency with two tracks includes track selection efficiency. |
png pdf |
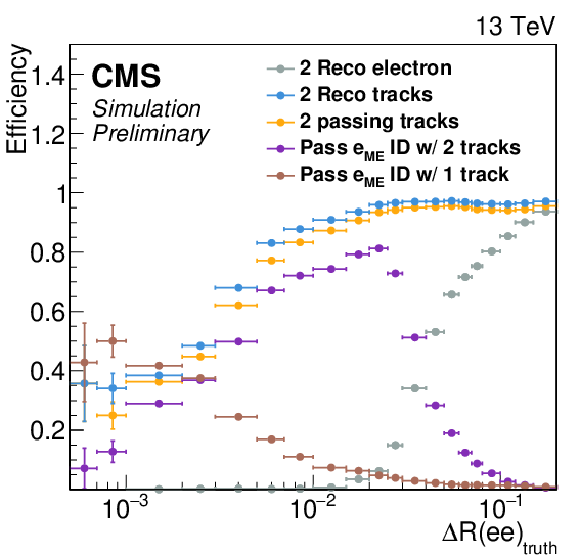
Figure 2-b:
The signal dielectron ID efficiency as a function of $ \Delta R $ for the cases with (left) two reconstructed electrons and (right) a $ \mathrm{e}_{\textrm{ME}} $. The ID efficiencies incorporate the effects of all prerequisite selections. For instance, the HEEP ID efficiency includes the reconstruction efficiency, and the $ \mathrm{e}_{\textrm{ME}} $ ID efficiency with two tracks includes track selection efficiency. |
png pdf |
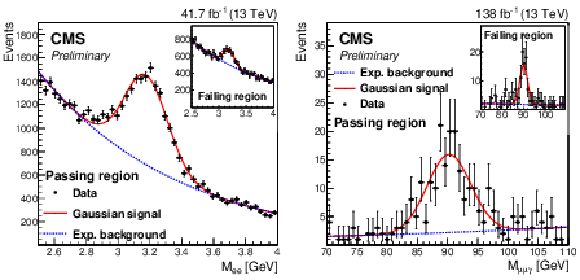
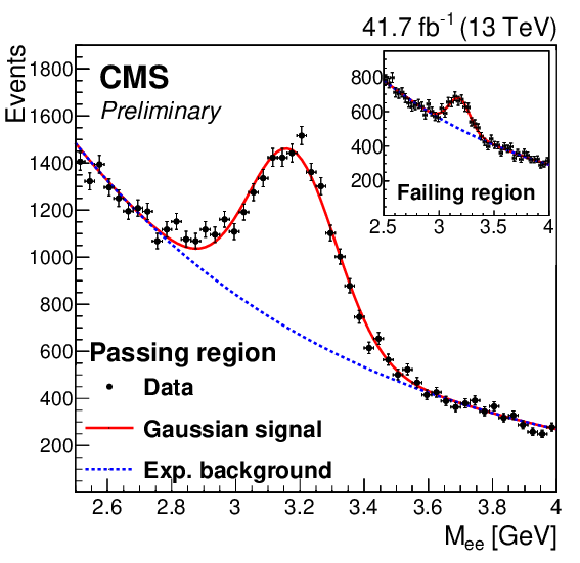
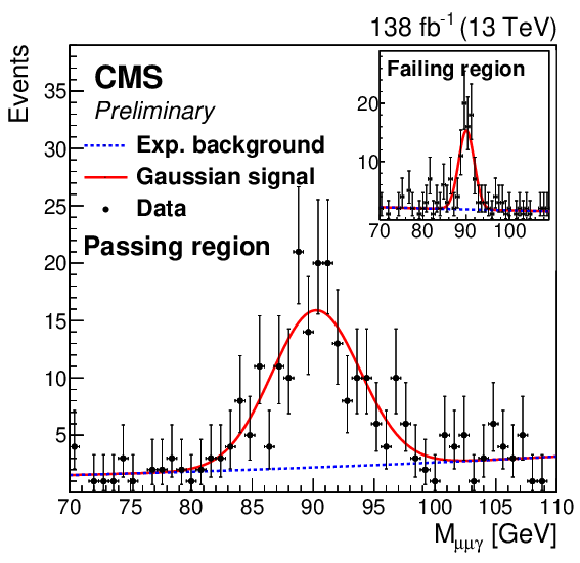
Figure 3:
The invariant mass distribution obtained from (left) two tracks of boosted $ \mathrm{J}/\psi\rightarrow\mathrm{e}\mathrm{e} $ with $ E_{T}^{5\times5} > $ 30 GeV, and (right) dimuon and an FSR photon with $ E_{T}^{5\times5} > $ 20 GeV converted into an electron pair with only a single reconstructed track. The passing (failing) region represents $ \mathrm{e}_{\textrm{ME}} $ candidates that pass (fail) the $ \mathrm{e}_{\textrm{ME}} $ ID criteria. The signal (background) contribution is modeled with a Gaussian (exponential) function, illustrated with a red (blue) line. |
png pdf |
Figure 3-a:
The invariant mass distribution obtained from (left) two tracks of boosted $ \mathrm{J}/\psi\rightarrow\mathrm{e}\mathrm{e} $ with $ E_{T}^{5\times5} > $ 30 GeV, and (right) dimuon and an FSR photon with $ E_{T}^{5\times5} > $ 20 GeV converted into an electron pair with only a single reconstructed track. The passing (failing) region represents $ \mathrm{e}_{\textrm{ME}} $ candidates that pass (fail) the $ \mathrm{e}_{\textrm{ME}} $ ID criteria. The signal (background) contribution is modeled with a Gaussian (exponential) function, illustrated with a red (blue) line. |
png pdf |
Figure 3-b:
The invariant mass distribution obtained from (left) two tracks of boosted $ \mathrm{J}/\psi\rightarrow\mathrm{e}\mathrm{e} $ with $ E_{T}^{5\times5} > $ 30 GeV, and (right) dimuon and an FSR photon with $ E_{T}^{5\times5} > $ 20 GeV converted into an electron pair with only a single reconstructed track. The passing (failing) region represents $ \mathrm{e}_{\textrm{ME}} $ candidates that pass (fail) the $ \mathrm{e}_{\textrm{ME}} $ ID criteria. The signal (background) contribution is modeled with a Gaussian (exponential) function, illustrated with a red (blue) line. |
png pdf |
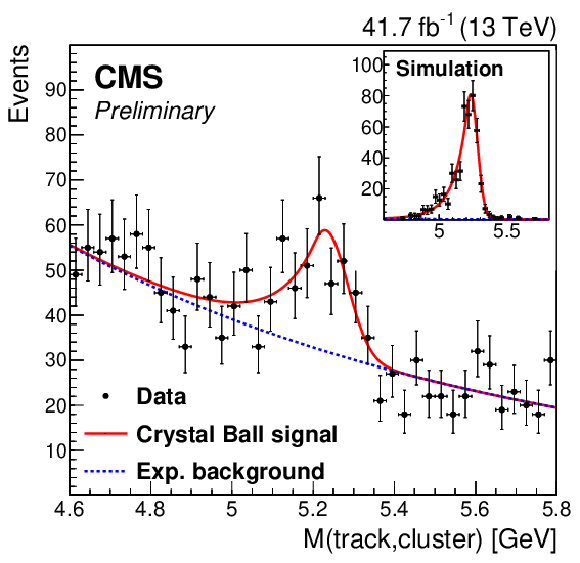
Figure 4:
The invariant mass distribution between the $ \textrm{U}_{5\times5} $ cluster and the kaon candidate with $ E_{T}^{5\times5} > $ 30 GeV. The signal (background) contribution is modeled with a Crystal Ball (exponential) function, represented with a red (blue) line. The subfigure on top right illustrates the distribution of simulated $ {\mathrm{B}}\rightarrow\mathrm{J}/\psi\mathrm{K}\rightarrow\mathrm{e}\mathrm{e}\mathrm{K} $ events. |
png pdf |
Figure 5:
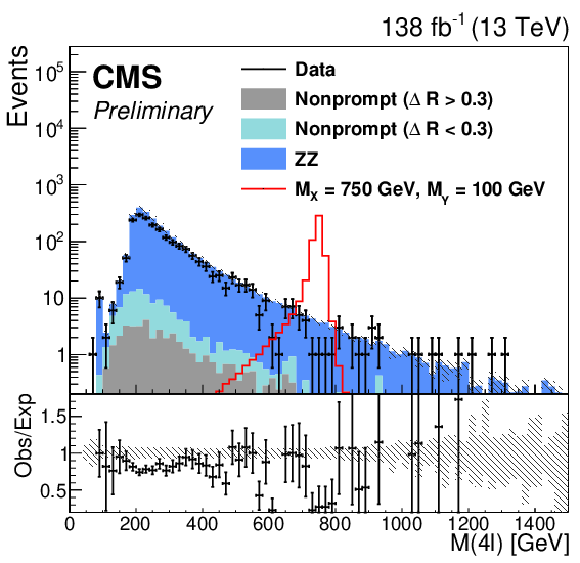
The observed and expected number of events in the resolved signal region before the likelihood fit. The shaded band represents background systematic uncertainties. The red histogram shows simulated $ \textrm{X}\rightarrow\textrm{YY}\rightarrow\!4\ell $ signal events, normalized to the cross section times branching ratio of 10 fb. |
png pdf |
Figure 6:
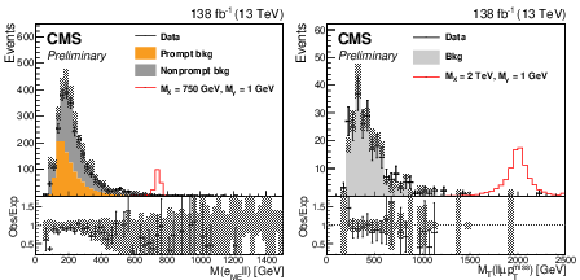
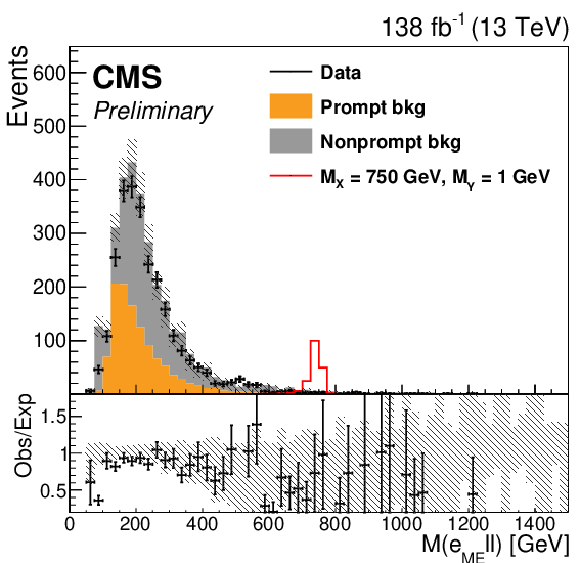
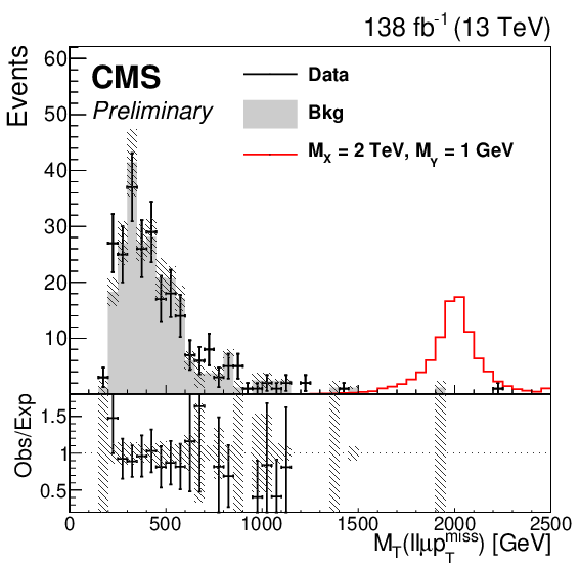
The observed and expected number of events in the (left) $ \mathrm{e}_{\textrm{ME}}\ell\ell $ and (right) $ \ell\ell\mup_{\mathrm{T}}^\text{miss} $ channels ($ \ell = \mathrm{e},\mu $) before the likelihood fit. The shaded band represents background systematic uncertainties. The red histogram shows simulated $ \textrm{X}\rightarrow\mathrm{Z}\textrm{Y}\rightarrow\!4\ell $ signal events, normalized to the cross section times branching ratio of 10 fb. |
png pdf |
Figure 6-a:
The observed and expected number of events in the (left) $ \mathrm{e}_{\textrm{ME}}\ell\ell $ and (right) $ \ell\ell\mup_{\mathrm{T}}^\text{miss} $ channels ($ \ell = \mathrm{e},\mu $) before the likelihood fit. The shaded band represents background systematic uncertainties. The red histogram shows simulated $ \textrm{X}\rightarrow\mathrm{Z}\textrm{Y}\rightarrow\!4\ell $ signal events, normalized to the cross section times branching ratio of 10 fb. |
png pdf |
Figure 6-b:
The observed and expected number of events in the (left) $ \mathrm{e}_{\textrm{ME}}\ell\ell $ and (right) $ \ell\ell\mup_{\mathrm{T}}^\text{miss} $ channels ($ \ell = \mathrm{e},\mu $) before the likelihood fit. The shaded band represents background systematic uncertainties. The red histogram shows simulated $ \textrm{X}\rightarrow\mathrm{Z}\textrm{Y}\rightarrow\!4\ell $ signal events, normalized to the cross section times branching ratio of 10 fb. |
png pdf |
Figure 7:
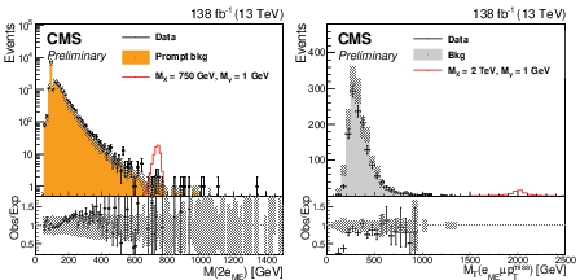
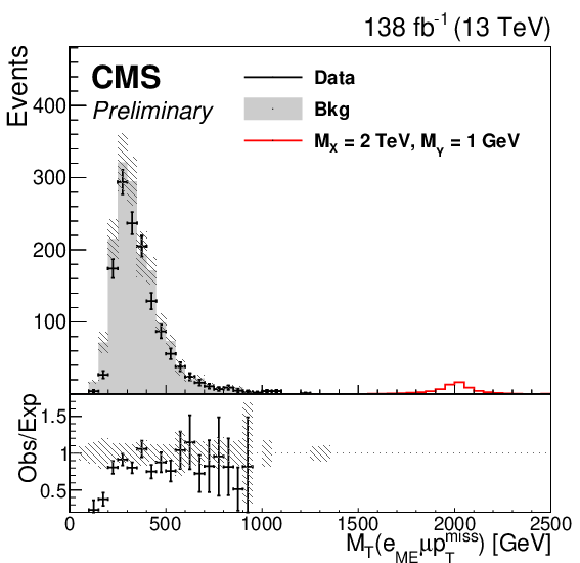
The observed and expected number of events in the (left) 2 $ \mathrm{e}_{\textrm{ME}} $ and (right) $ \mathrm{e}_{\textrm{ME}}\mup_{\mathrm{T}}^\text{miss} $ signal regions before the likelihood fit. The shaded band represents background systematic uncertainties. The red histogram shows simulated $ \textrm{X}\rightarrow\textrm{YY}\rightarrow\!4\ell $ signal events, normalized to the cross section times branching ratio of 10 fb. |

png pdf |
Figure 7-a:
The observed and expected number of events in the (left) 2 $ \mathrm{e}_{\textrm{ME}} $ and (right) $ \mathrm{e}_{\textrm{ME}}\mup_{\mathrm{T}}^\text{miss} $ signal regions before the likelihood fit. The shaded band represents background systematic uncertainties. The red histogram shows simulated $ \textrm{X}\rightarrow\textrm{YY}\rightarrow\!4\ell $ signal events, normalized to the cross section times branching ratio of 10 fb. |
png pdf |
Figure 7-b:
The observed and expected number of events in the (left) 2 $ \mathrm{e}_{\textrm{ME}} $ and (right) $ \mathrm{e}_{\textrm{ME}}\mup_{\mathrm{T}}^\text{miss} $ signal regions before the likelihood fit. The shaded band represents background systematic uncertainties. The red histogram shows simulated $ \textrm{X}\rightarrow\textrm{YY}\rightarrow\!4\ell $ signal events, normalized to the cross section times branching ratio of 10 fb. |
png pdf |
Figure 8:
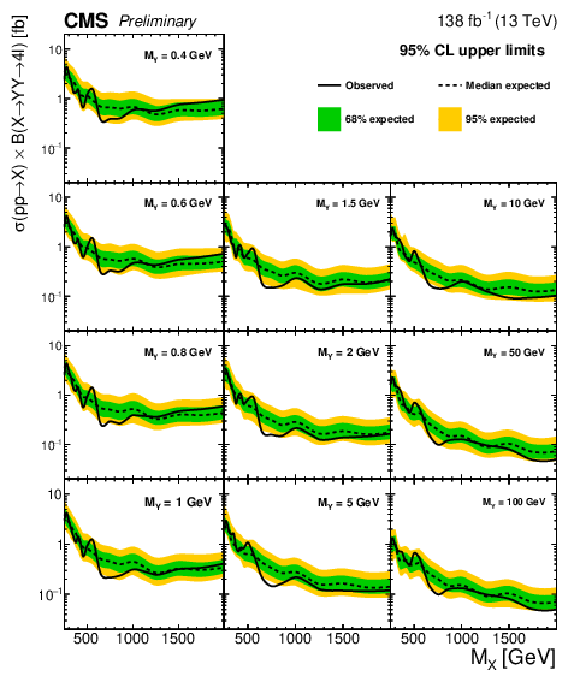
The observed and expected limit on the cross section times branching ratio as a function of $ M_{\textrm{X}} $ with the $ \textrm{X}\rightarrow\textrm{YY}\rightarrow\!4\ell $ decay mode. The $ M_{\textrm{Y}} $ ranges from 0.4 GeV to 100 GeV. The branching ratio of $ \textrm{B}(\textrm{Y}\rightarrow\mathrm{e}\mathrm{e}) $ is assumed to be equal to the $ \textrm{B}(\textrm{Y}\rightarrow\mu\mu) $. |
png pdf |
Figure 9:
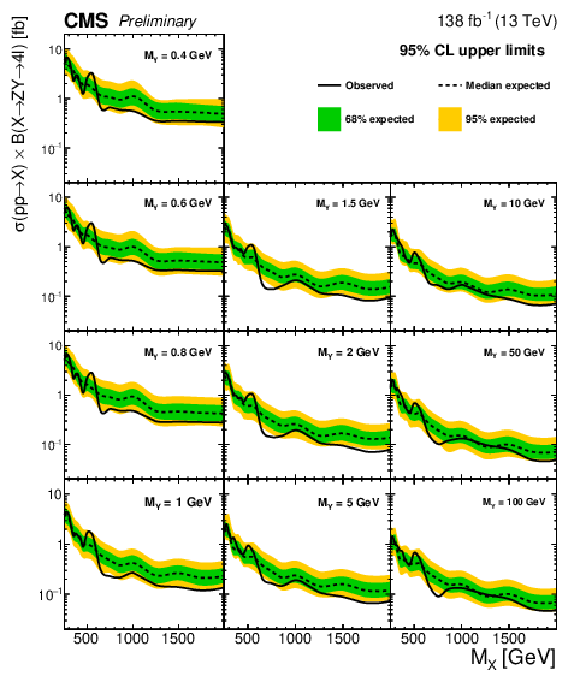
The observed and expected limit on the cross section times branching ratio as a function of $ M_{\textrm{X}} $ with the $ \textrm{X}\rightarrow\mathrm{Z}\textrm{Y}\rightarrow\!4\ell $ decay mode. The $ M_{\textrm{Y}} $ ranges from 0.4 GeV to 100 GeV. The branching ratio of $ \textrm{B}(\textrm{Y}\rightarrow\mathrm{e}\mathrm{e}) $ is assumed to be equal to the $ \textrm{B}(\textrm{Y}\rightarrow\mu\mu) $. |
png pdf |
Figure 10:
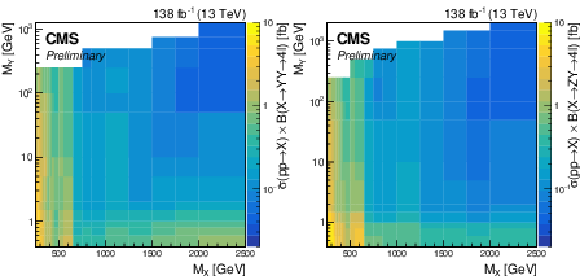
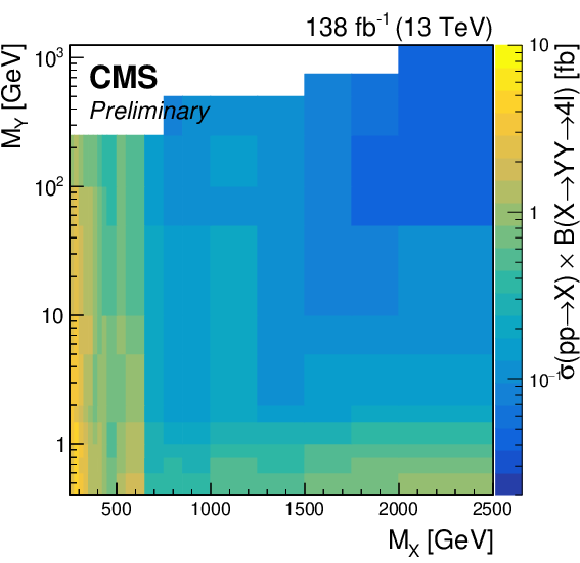
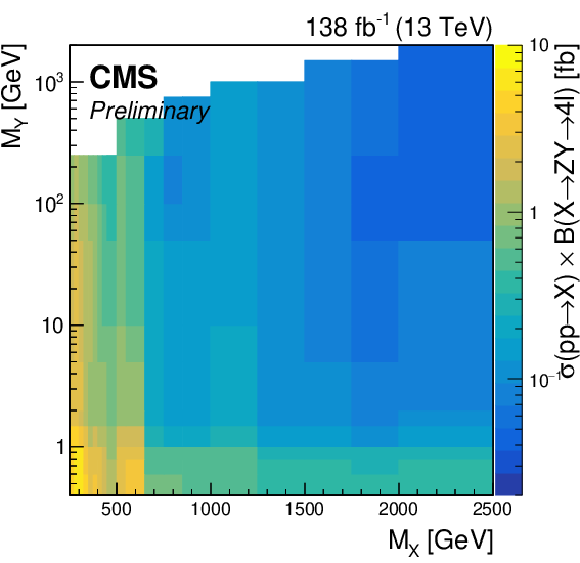
The 2-dimensional observed upper limit on the cross section times branching ratio with 95% CL as a function of $ M_{\textrm{X}} $ and $ M_{\textrm{Y}} $ for the (left) $ \textrm{X}\rightarrow\textrm{YY}\rightarrow\!4\ell $ and (right) $ \textrm{X}\rightarrow\mathrm{Z}\textrm{Y}\rightarrow\!4\ell $ signal hypotheses. |
png pdf |
Figure 10-a:
The 2-dimensional observed upper limit on the cross section times branching ratio with 95% CL as a function of $ M_{\textrm{X}} $ and $ M_{\textrm{Y}} $ for the (left) $ \textrm{X}\rightarrow\textrm{YY}\rightarrow\!4\ell $ and (right) $ \textrm{X}\rightarrow\mathrm{Z}\textrm{Y}\rightarrow\!4\ell $ signal hypotheses. |
png pdf |
Figure 10-b:
The 2-dimensional observed upper limit on the cross section times branching ratio with 95% CL as a function of $ M_{\textrm{X}} $ and $ M_{\textrm{Y}} $ for the (left) $ \textrm{X}\rightarrow\textrm{YY}\rightarrow\!4\ell $ and (right) $ \textrm{X}\rightarrow\mathrm{Z}\textrm{Y}\rightarrow\!4\ell $ signal hypotheses. |
| Tables | |

png pdf |
Table 1:
The list of signal regions, where each signal region consists of the reconstructed objects listed in the table. The e and $ \mu $ represent reconstructed resolved lepton objects. |
| Summary |
| A model-independent search for a high-mass resonance decaying into four-lepton final states via two intermediate bosons has been presented for $ \textrm{X}\rightarrow\textrm{YY}\rightarrow\!4\ell $ and $ \textrm{X}\rightarrow\mathrm{Z}\textrm{Y}\rightarrow\!4\ell $ signal hypotheses. The search uses pp collision data at a center-of-mass energy of 13 TeV collected by the CMS detector at LHC, corresponding to an integrated luminosity of 138 fb$ ^{-1} $. A combination of heavy $ M_{\textrm{X}} $ and light $ M_{\textrm{Y}} $ can lead to a significant Lorentz boost, which can result in boosted signatures such as $ \mathrm{e}_{\textrm{ME}} $ and $ \mu_{\textrm{CM}} $. A dedicated $ \mathrm{e}_{\textrm{ME}} $ ID is developed using the compatibility between the tracks and $ \textrm{U}_{5\times5} $ cluster. Signal event candidates with a $ \mu_{\textrm{CM}} $ are analyzed using $ {\vec p}_{\mathrm{T}}^{\kern1pt\text{miss}} $ as a proxy. No significant excess is observed. The maximum global (local) observed significance is 1.85$ \sigma $ (2.37$ \sigma $) at $ M_{\textrm{X}} = $ 550 GeV and $ M_{\textrm{Y}} = $ 0.8 GeV. The 95% CL upper limits on the product of cross section and branching ratio to four-lepton final states are set in the range $ M_{\textrm{X}} > $ 250 GeV and $ M_{\textrm{Y}} > $ 0.4 GeV. |
| References | ||||
| 1 | G. C. Branco et al. | Theory and phenomenology of two-higgs-doublet models | Physics Reports 516 (2012) 1 | |
| 2 | D. Curtin, R. Essig, S. Gori, and J. Shelton | Illuminating dark photons with high-energy colliders | JHEP 15 (2015) 157 | |
| 3 | V. Barger and H.-S. Lee | Four-lepton resonance at the Large Hadron Collider | PRD 85 (2012) 055030 | |
| 4 | CMS Collaboration | Search for low-mass dilepton resonances in Higgs boson decays to four-lepton final states in proton-proton collisions at $ \sqrt{s} = $ 13 TeV | EPJC 82 (2022) 290 | |
| 5 | ATLAS Collaboration | Search for Higgs bosons decaying into new spin-0 or spin-1 particles in four-lepton final states with the ATLAS detector with 139 $ \textrm{fb}^{-1} $ of pp collision data at$ \sqrt{s} = $ 13 TeV | JHEP 22 (2022) 41 | |
| 6 | CMS Collaboration | Search for heavy scalar resonances decaying to a pair of Z bosons in the 4-lepton final state at 13 TeV | Technical report, CERN, Geneva, 2024 CDS |
|
| 7 | ATLAS Collaboration | Search for heavy resonances decaying into a pair of Z bosons in the $ l^{+}l^{-}l^{\prime +}l^{\prime -} $ and $ l^{+}l^{-}\nu\bar{\nu} $ final states using 139 $ \textrm{fb}^{-1} $ of proton-proton collisions at $ \sqrt{s} = $ 13 TeV with the ATLAS detector | EPJC 81 (2021) 332 | |
| 8 | CMS Collaboration | The CMS experiment at the CERN LHC | JINST 3 (2008) S08004 | |
| 9 | CMS Collaboration | Performance of the CMS Level-1 trigger in proton-proton collisions at $ \sqrt{s} = $ 13\,TeV | JINST 15 (2020) P10017 | CMS-TRG-17-001 2006.10165 |
| 10 | CMS Collaboration | The CMS trigger system | JINST 12 (2017) P01020 | CMS-TRG-12-001 1609.02366 |
| 11 | CMS Collaboration | Electron and photon reconstruction and identification with the CMS experiment at the CERN LHC | JINST 16 (2021) P05014 | |
| 12 | CMS Collaboration | Performance of the CMS muon detector and muon reconstruction with proton-proton collisions at $ \sqrt{s}= $ 13 TeV | JINST 13 (2018) P06015 | CMS-MUO-16-001 1804.04528 |
| 13 | CMS Collaboration | Description and performance of track and primary-vertex reconstruction with the cms tracker | JINST 9 (2014) P10009 | |
| 14 | CMS Collaboration | Particle-flow reconstruction and global event description with the CMS detector | JINST 12 (2017) P10003 | CMS-PRF-14-001 1706.04965 |
| 15 | CMS Collaboration | Performance of reconstruction and identification of $ \tau $ leptons decaying to hadrons and $ \nu_\tau $ in pp collisions at $ \sqrt{s}= $ 13 TeV | JINST 13 (2018) P10005 | CMS-TAU-16-003 1809.02816 |
| 16 | CMS Collaboration | Jet energy scale and resolution in the CMS experiment in pp collisions at 8 TeV | JINST 12 (2017) P02014 | CMS-JME-13-004 1607.03663 |
| 17 | CMS Collaboration | Performance of missing transverse momentum reconstruction in proton-proton collisions at $ \sqrt{s} = $ 13\,TeV using the CMS detector | JINST 14 (2019) P07004 | CMS-JME-17-001 1903.06078 |
| 18 | T. Sjöstrand et al. | An introduction to PYTHIA 8.2 | Computer Physics Communications 191 (2015) 159 | |
| 19 | J. Alwall et al. | The automated computation of tree-level and next-to-leading order differential cross sections, and their matching to parton shower simulations | JHEP 14 (2014) 79 | |
| 20 | P. Nason | A New method for combining NLO QCD with shower Monte Carlo algorithms | JHEP 11 (2004) 040 | hep-ph/0409146 |
| 21 | S. Frixione, P. Nason, and C. Oleari | Matching NLO QCD computations with Parton Shower simulations: the POWHEG method | JHEP 11 (2007) 070 | 0709.2092 |
| 22 | S. Alioli, P. Nason, C. Oleari, and E. Re | A general framework for implementing NLO calculations in shower Monte Carlo programs: the POWHEG BOX | JHEP 06 (2010) 043 | 1002.2581 |
| 23 | P. Nason and G. Zanderighi | $ W^+ W^- $, $ W Z $ and $ Z Z $ production in the POWHEG-BOX-V2 | EPJC 74 (2014) 2702 | 1311.1365 |
| 24 | CMS Collaboration | Extraction and validation of a new set of cms pythia8 tunes from underlying-event measurements | EPJC 80 (2020) 4 | |
| 25 | R. D. Ball et al. | Parton distributions from high-precision collider data | EPJC 77 (2017) 663 | |
| 26 | S. Agostinelli et al. | Geant4-a simulation toolkit | NIM A 506 (2003) 250 | |
| 27 | CMS Collaboration | Search for leptophobic $ \textrm{Z}^{\prime} $ bosons decaying into four-lepton final states in proton-proton collisions at $ \sqrt{s} = $8 TeV | PLB 773 (2017) 563 | |
| 28 | CMS Collaboration | Recording and reconstructing 10 billion unbiased $ {\mathrm{B}} $ hadron decays in CMS | CMS Detector Performance Summaries CMS-DP-2019-043, 2019 CDS |
|
| 29 | CMS Collaboration | Performance of photon reconstruction and identification with the CMS detector in proton-proton collisions at $ \sqrt{s} = $ 8 TeV | JINST 10 (2015) P08010 | |
| 30 | CMS Collaboration | Performance of the cms muon trigger system in proton-proton collisions at $ \sqrt{s} = $ 13 TeV | JINST 16 (2021) P07001 | |
| 31 | CMS Collaboration | Performance of the reconstruction and identification of high-momentum muons in proton-proton collisions at $ \sqrt{s} = $ 13 TeV | JINST 15 (2020) P02027 | |
| 32 | CMS Collaboration | Measurements of properties of the higgs boson decaying into the four-lepton final state in pp collisions at $ \sqrt{s} = $ 13 TeV | JHEP 17 (2017) 47 | |
| 33 | CMS Collaboration | Precision luminosity measurement in proton-proton collisions at $ \sqrt{s}= $ 13 TeV in 2015 and 2016 at CMS | EPJC 81 (2021) 800 | CMS-LUM-17-003 2104.01927 |
| 34 | CMS Collaboration | CMS luminosity measurement for the 2017 data-taking period at $ \sqrt{s}= $ 13 TeV | CMS Physics Analysis Summary, 2018 CMS-PAS-LUM-17-004 |
CMS-PAS-LUM-17-004 |
| 35 | CMS Collaboration | CMS luminosity measurement for the 2018 data-taking period at $ \sqrt{s}= $ 13 TeV | CMS Physics Analysis Summary, 2019 CMS-PAS-LUM-18-002 |
CMS-PAS-LUM-18-002 |
| 36 | T. Junk | Confidence level computation for combining searches with small statistics | NIM A 434 (1999) 435 | |
| 37 | CMS Collaboration | The CMS statistical analysis and combination tool: Combine | Comput. Softw. Big Sci. 8 (2024) 19 | CMS-CAT-23-001 2404.06614 |
| 38 | W. Verkerke and D. Kirkby | The RooFit toolkit for data modeling | in Proc. 13th International Conference on Computing in High Energy and Nuclear Physics (CHEP): La Jolla CA, United States, 2003 eConf C0303241 MOLT007 |
physics/0306116 |
| 39 | L. Moneta et al. | The RooStats project | in Proc. 13th International Workshop on Advanced Computing and Analysis Techniques in Physics Research (ACAT ): Jaipur, India, 2010 PoS (ACAT) 057 |
1009.1003 |
| 40 | E. Gross and O. Vitells | Trial factors for the look elsewhere effect in high energy physics | EPJC 70 (2010) 525 | 1005.1891 |

|
Compact Muon Solenoid LHC, CERN |

|

|

|

|

|

|