

Compact Muon Solenoid
LHC, CERN
| CMS-PAS-TOP-22-012 | ||
| First measurement of the top quark pair production cross section in proton-proton collisions at $ \sqrt{s}= $ 13.6 TeV | ||
| CMS Collaboration | ||
| 22 September 2022 | ||
| Abstract: The first measurement of the top quark pair ($ \mathrm{t\bar{t}} $) production cross section in proton-proton collisions at $ \sqrt{s}= $ 13.6 TeV is presented. Data recorded with the CMS detector at the CERN LHC in July and August 2022 corresponding to an integrated luminosity of 1.20 $ \pm $ 0.07 fb$ ^{-1} $ are analyzed. Events are selected with one or two charged leptons (electrons and muons) and additional jets. A maximum likelihood fit is performed to event categories defined by the number and flavors of the leptons, and the number of jets and jets identified as originating from the decay of b hadrons. An inclusive $ \mathrm{t\bar{t}} $ production cross section of 887 $ ^{+43}_{-41} $ (stat+syst) $ \pm $ 53 (lumi) pb is measured, in agreement with the standard model prediction of 921 $ ^{+29}_{-37} $ pb. | ||
|
Links:
CDS record (PDF) ;
CADI line (restricted) ;
These preliminary results are superseded in this paper, JHEP 08 (2023) 204. The superseded preliminary plots can be found here. |
||
| Figures | |
png pdf |
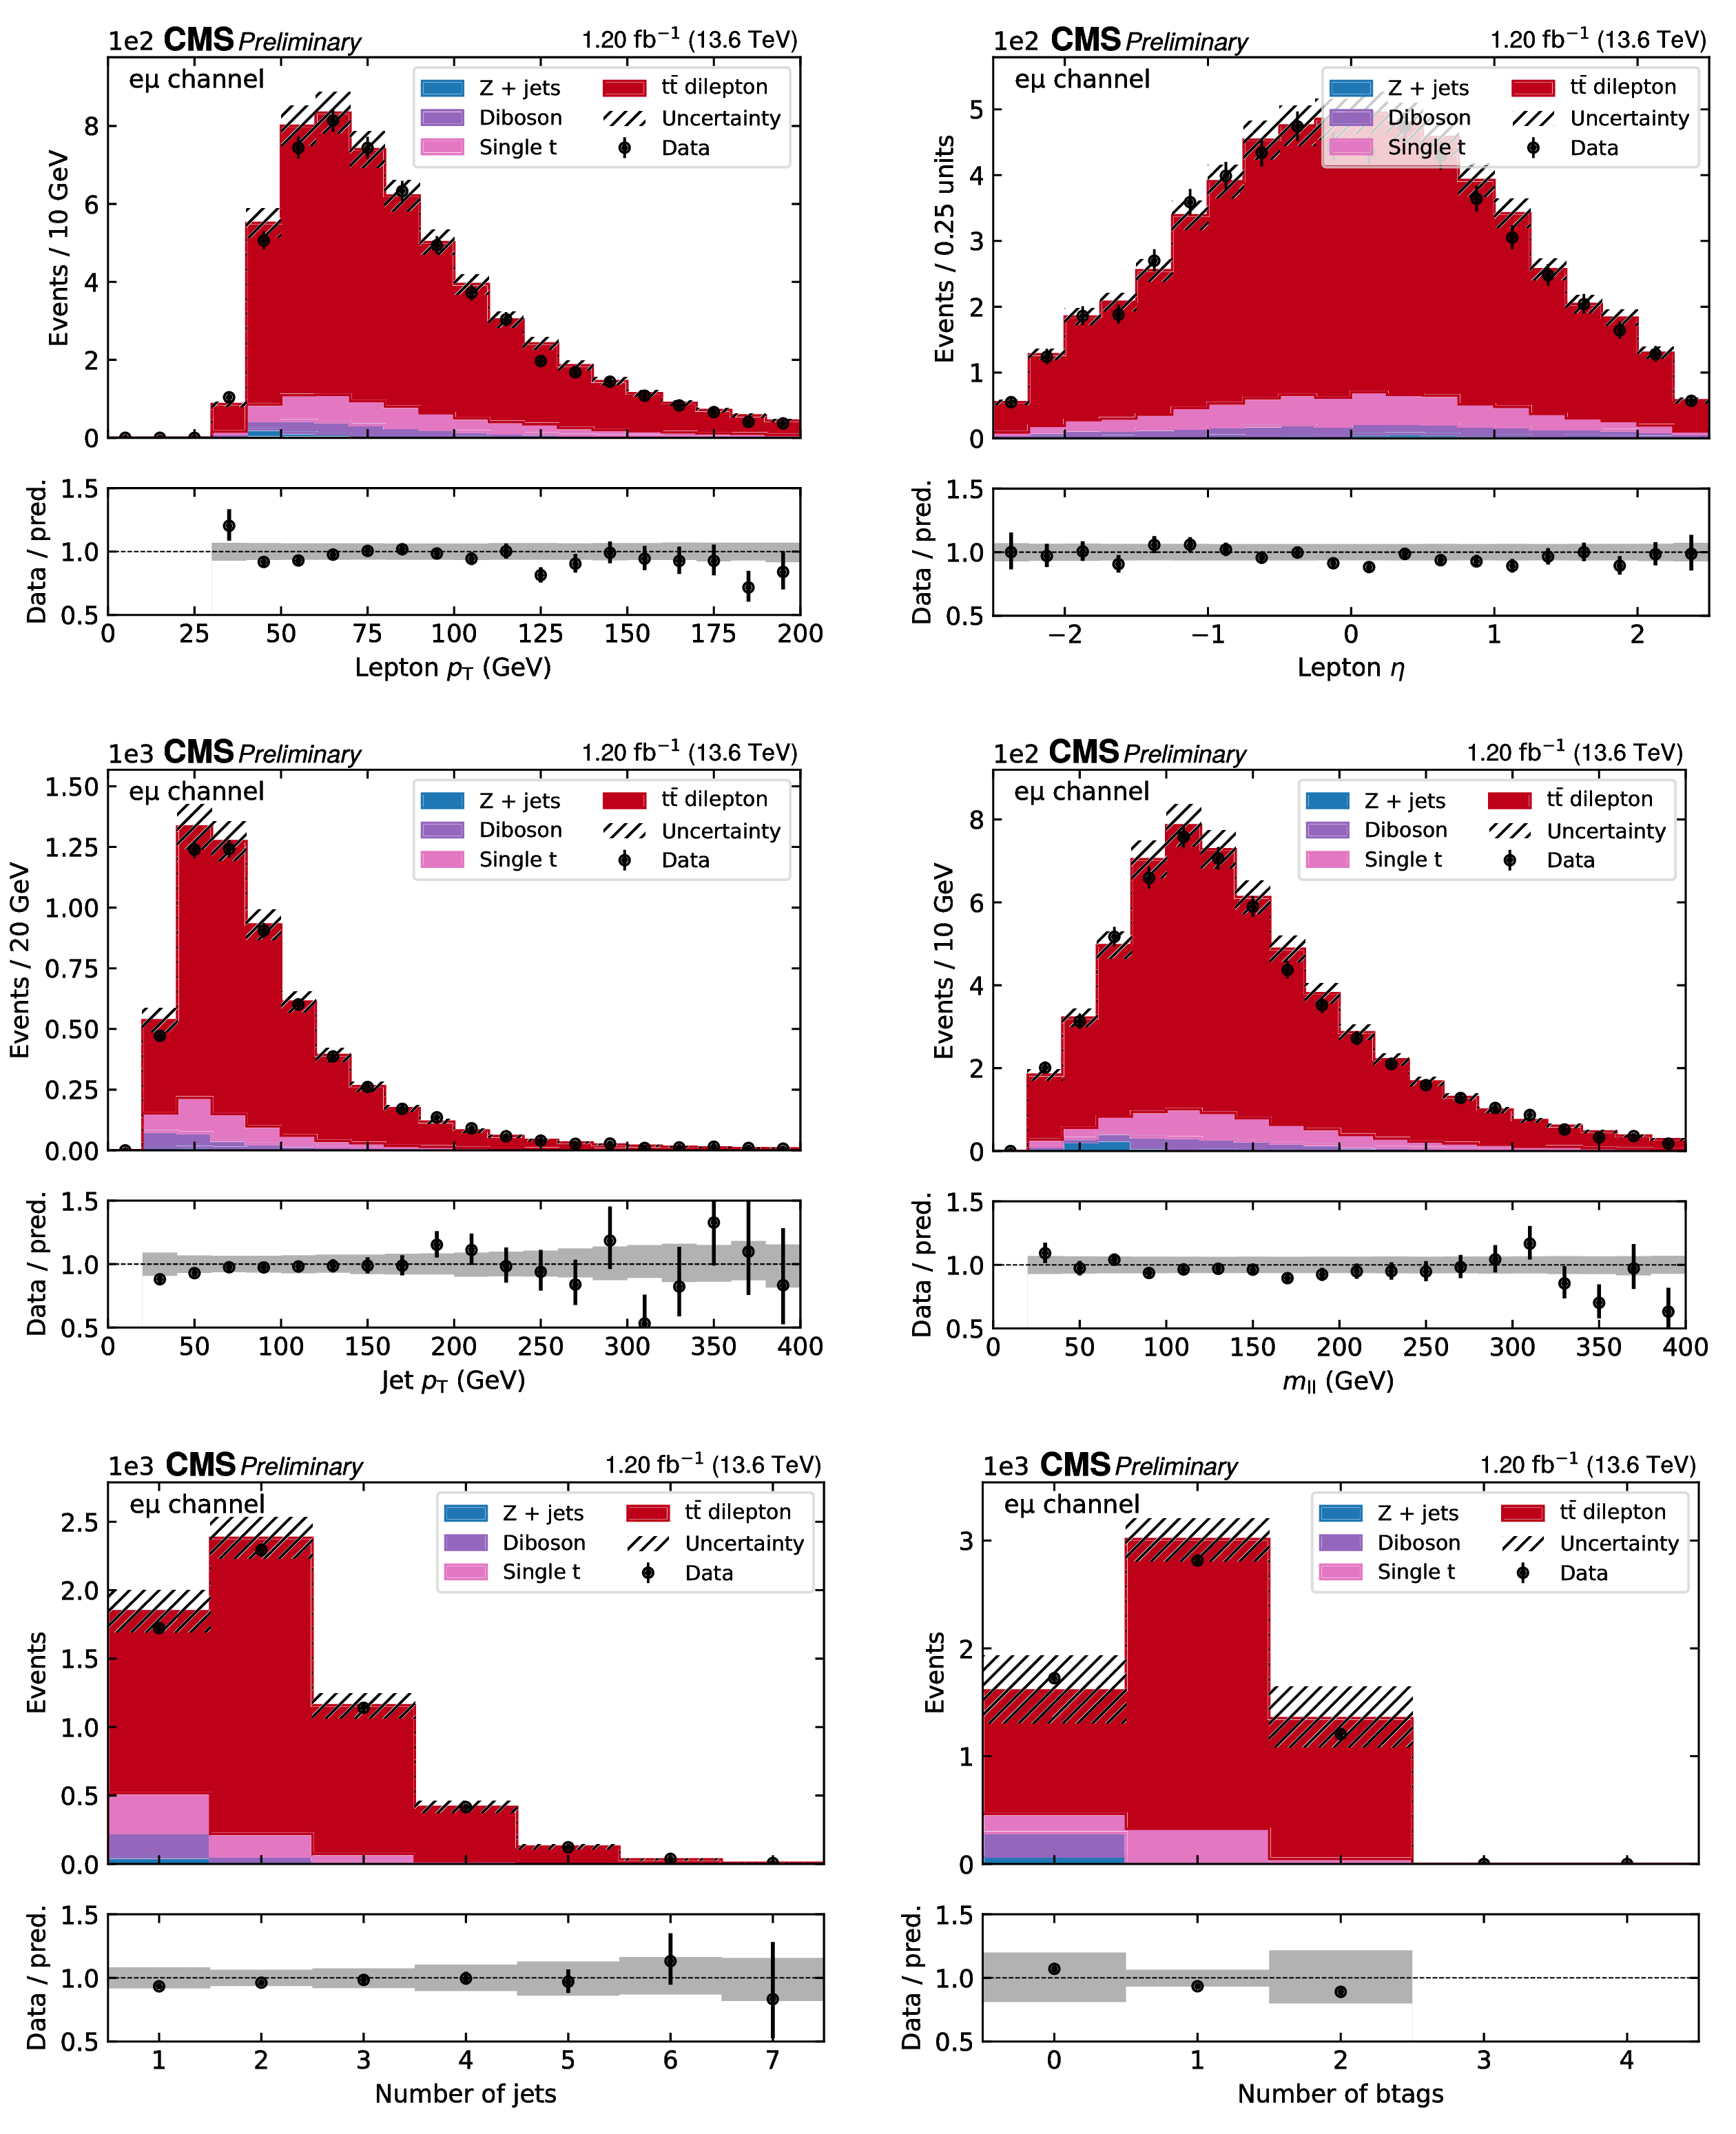
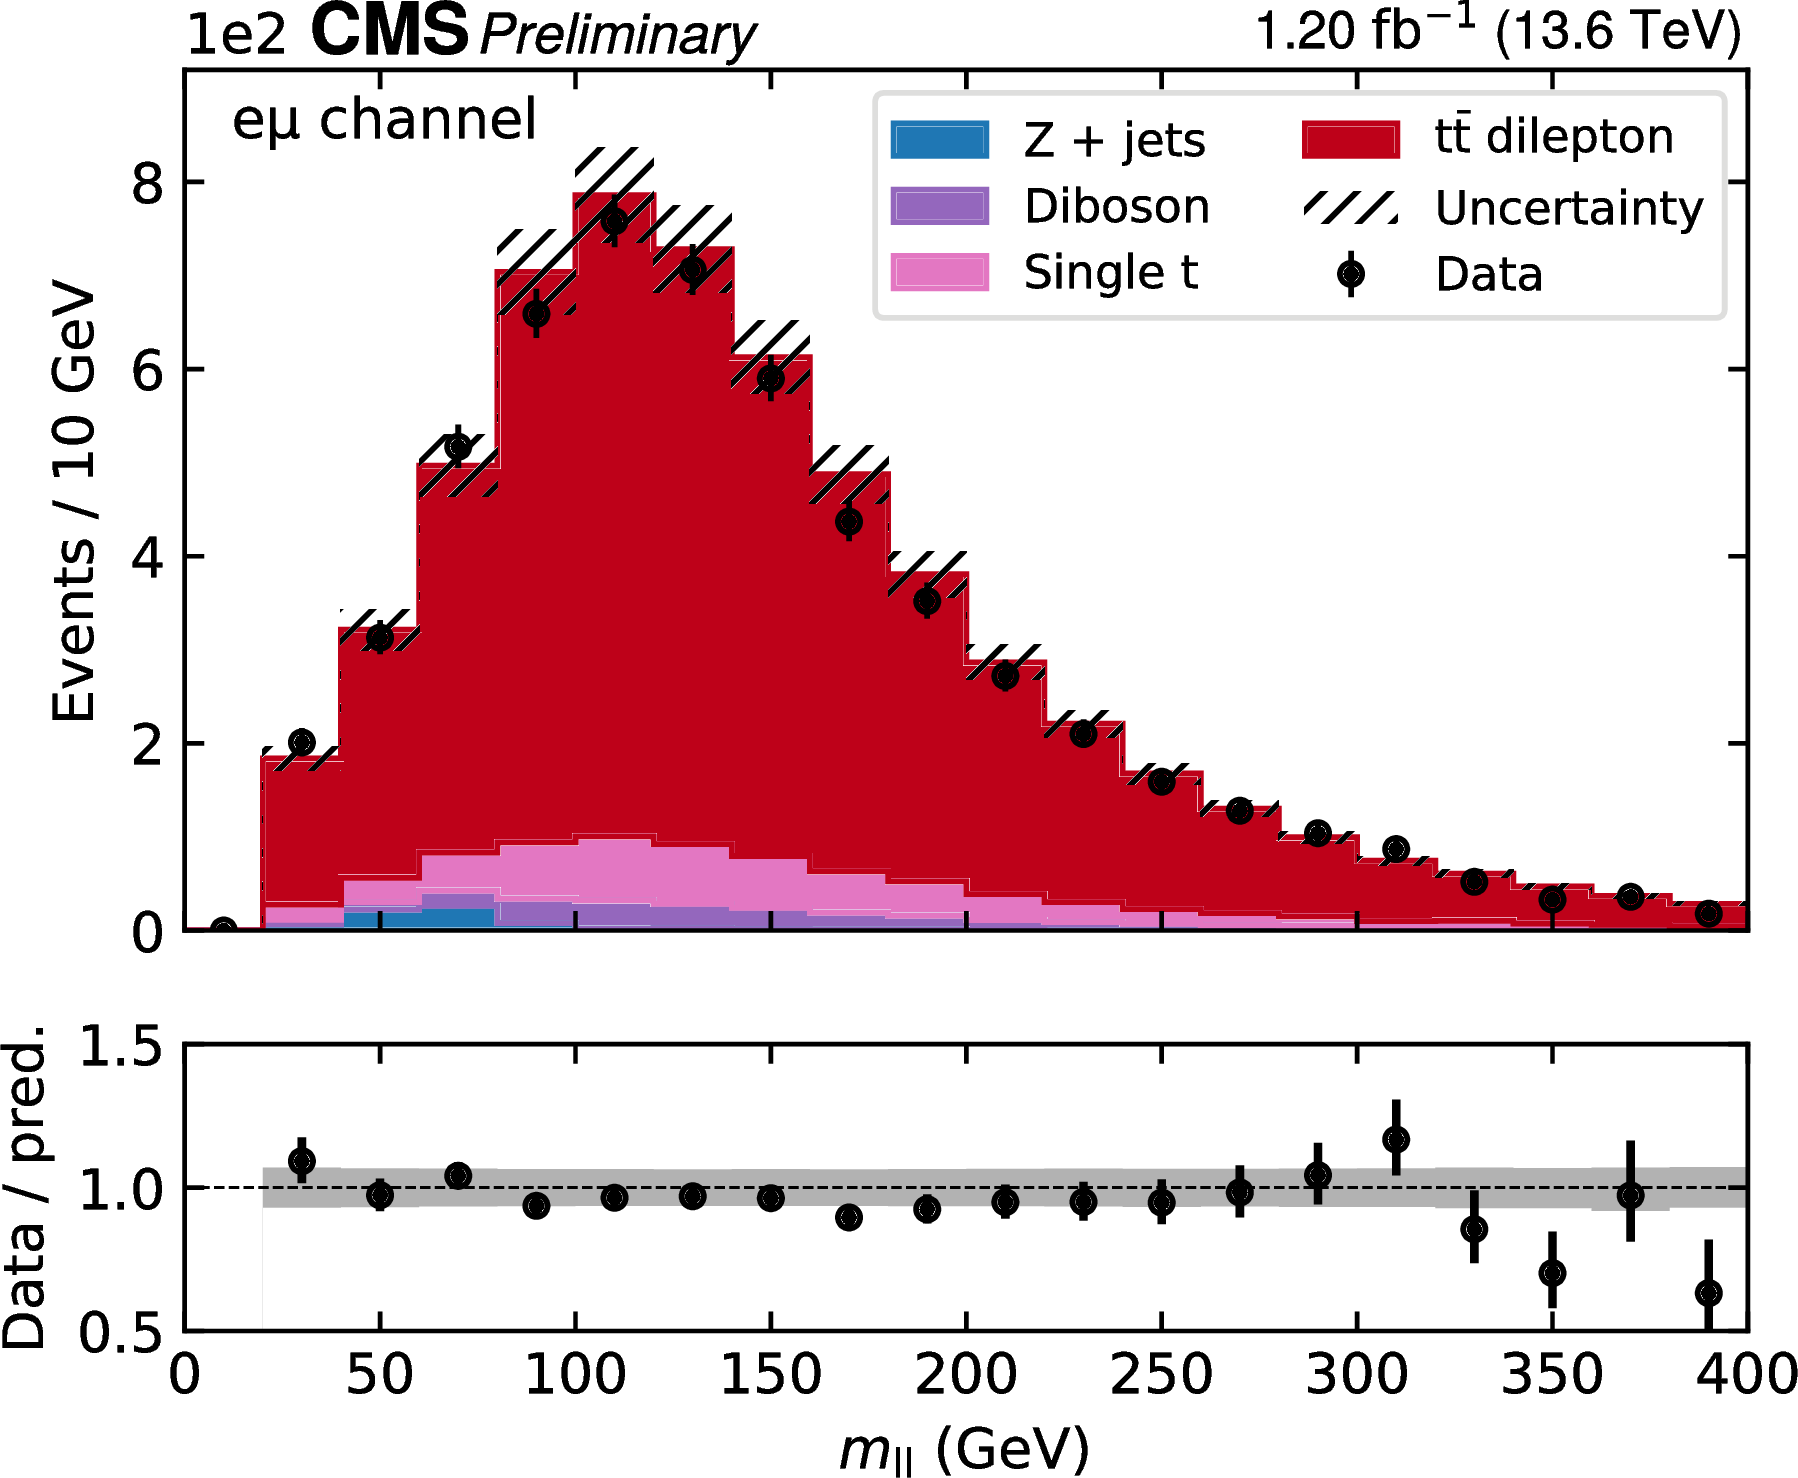
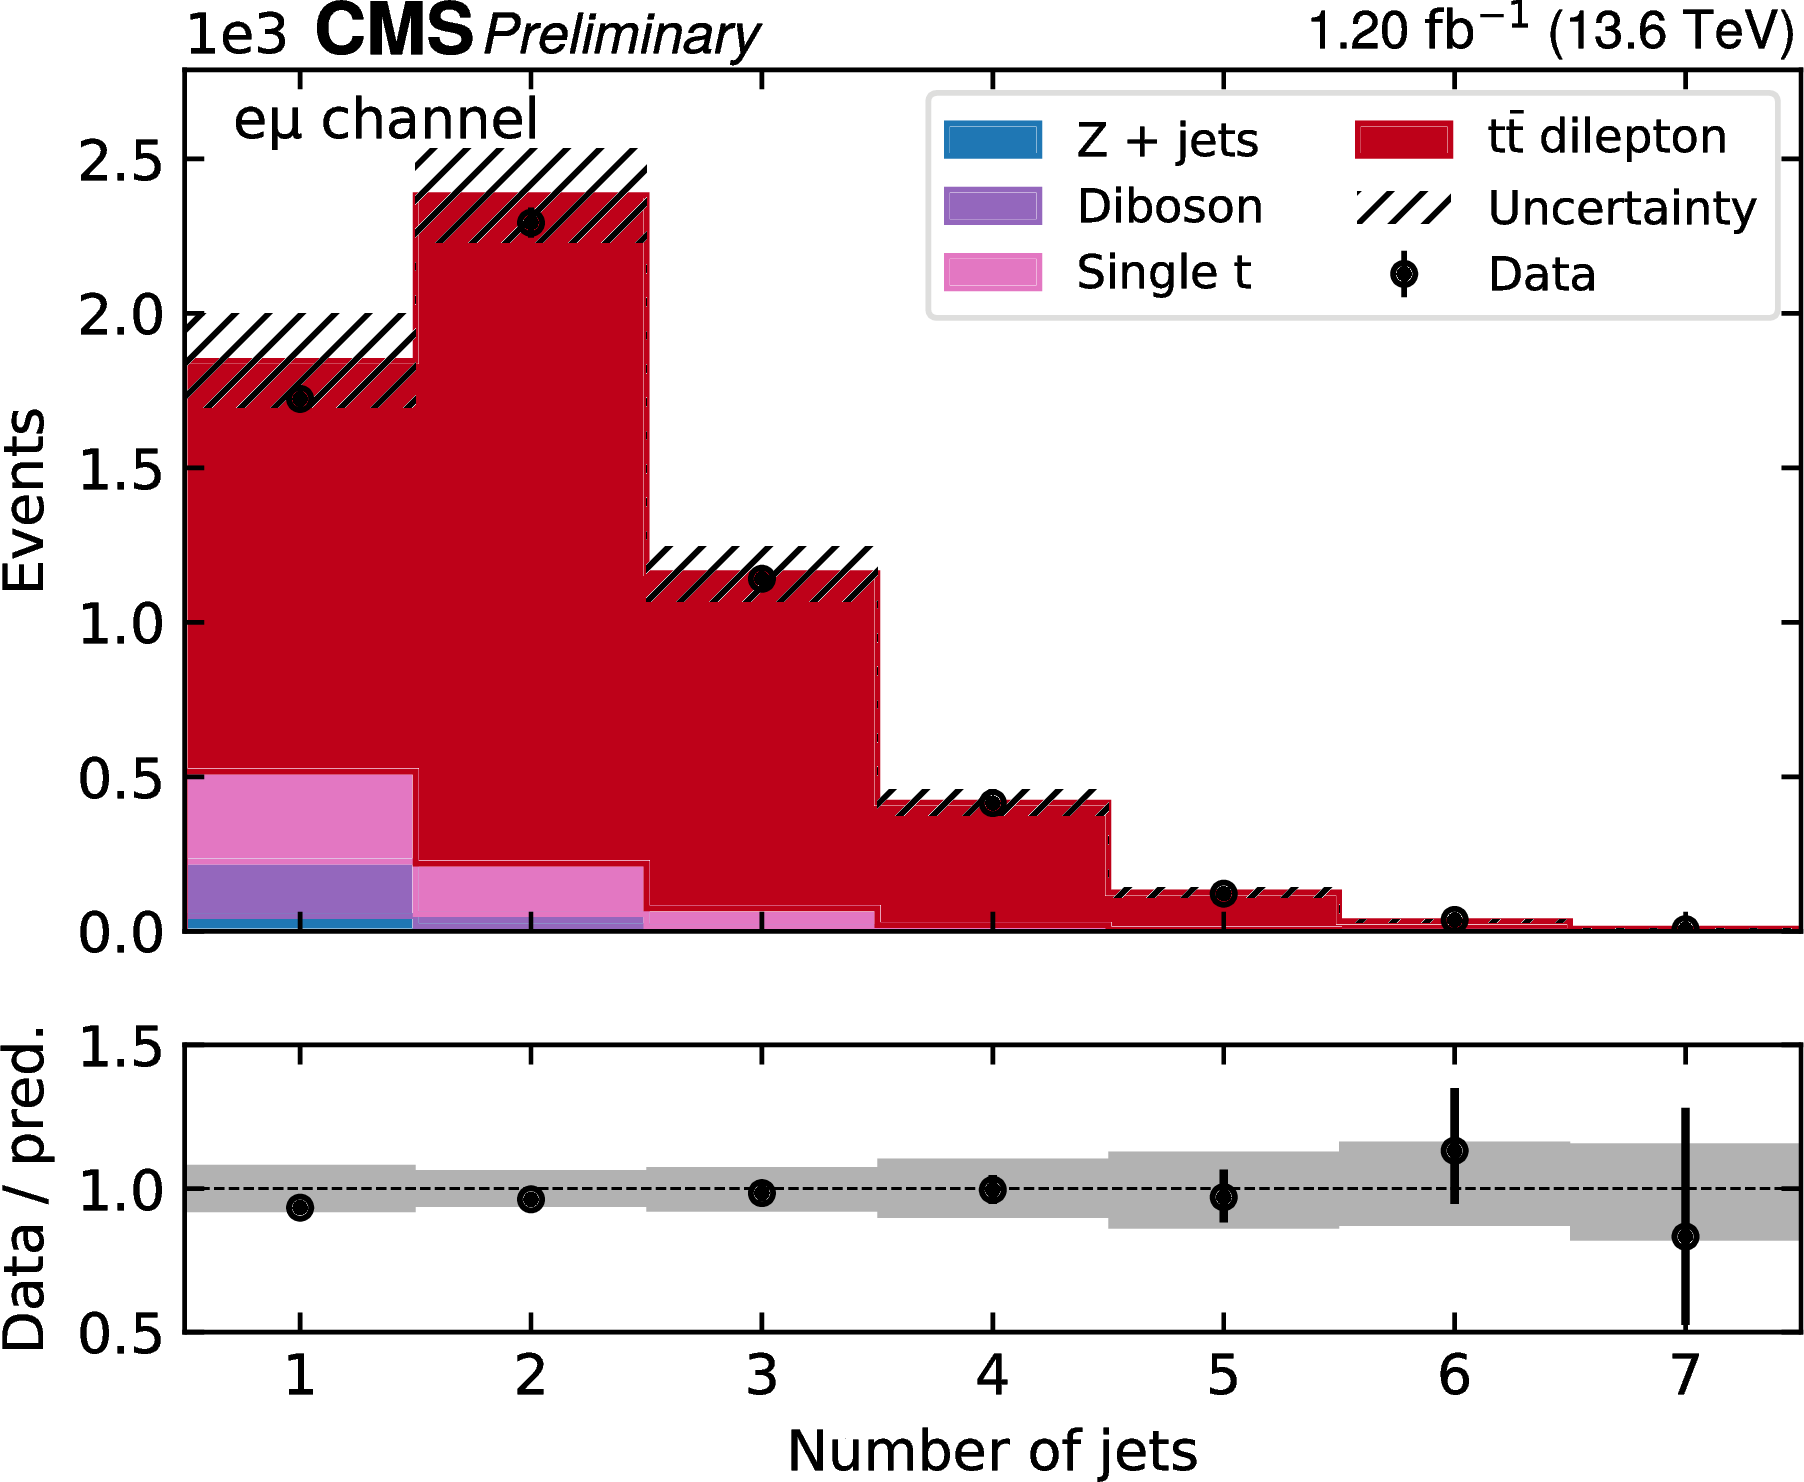
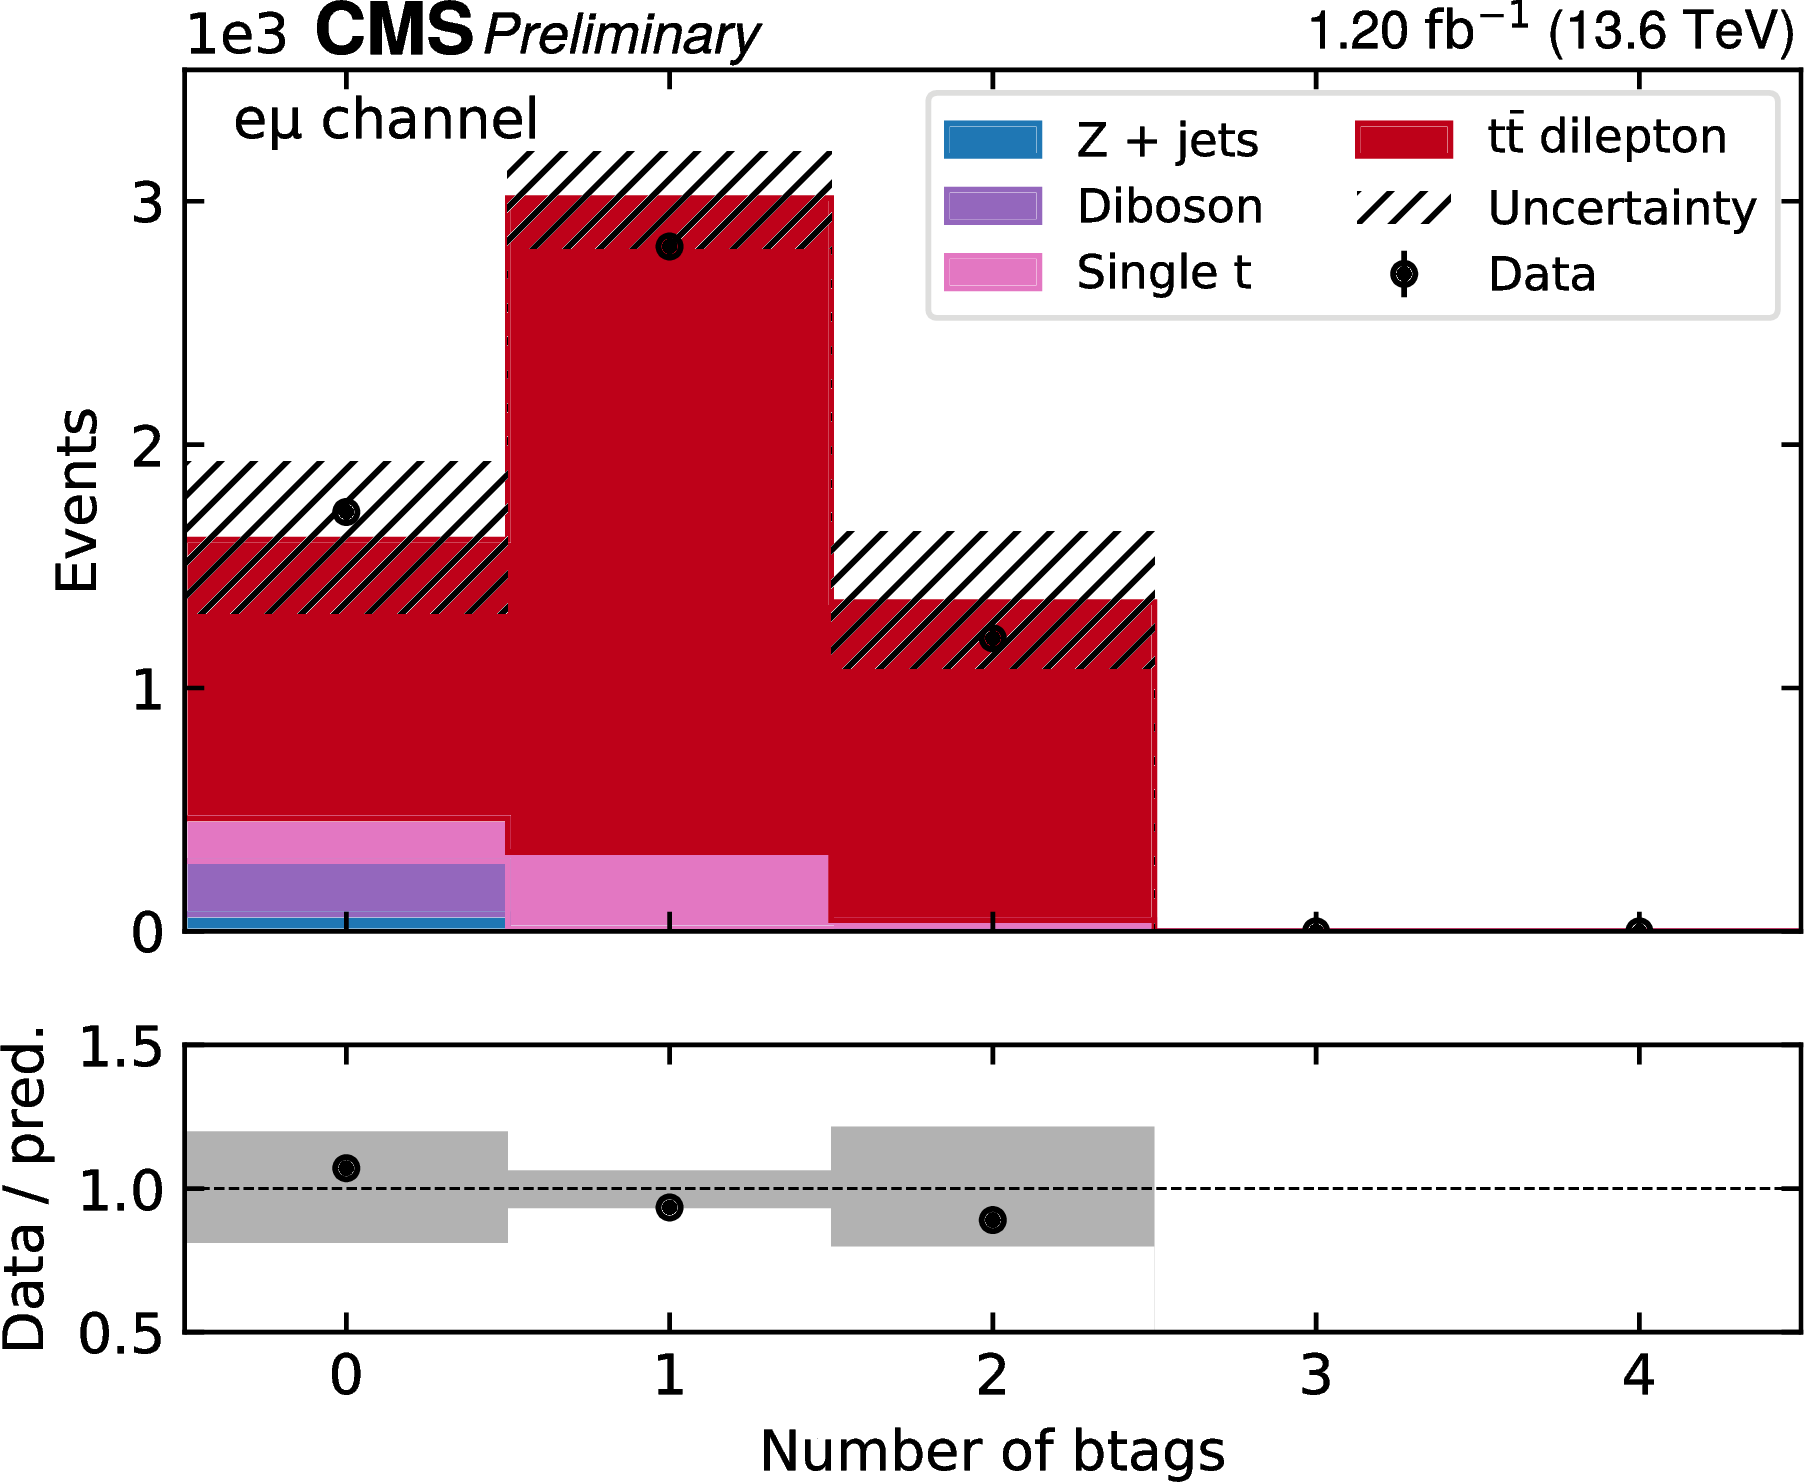
Figure 1:
Control plots in the $ \mathrm{e}^\pm\mu^\mp $ channel. From upper left to lower right: leading lepton $ p_{\mathrm{T}} $ and $ \eta $, leading jet $ p_{\mathrm{T}} $, $ m_{\ell \ell} $, number of jets and b jets. The MC predictions are normalized using measured luminosity and theoretical cross sections, and are scaled by the lepton scale factors as obtained in the fit. The uncertainty bands include all experimental statistical and systematic uncertainties including the integrated luminosity, but excluding the lepton scale factors, which have flat prior probability density distributions. The lower panels show the ratio of the data to the MC simulation. |
png pdf |
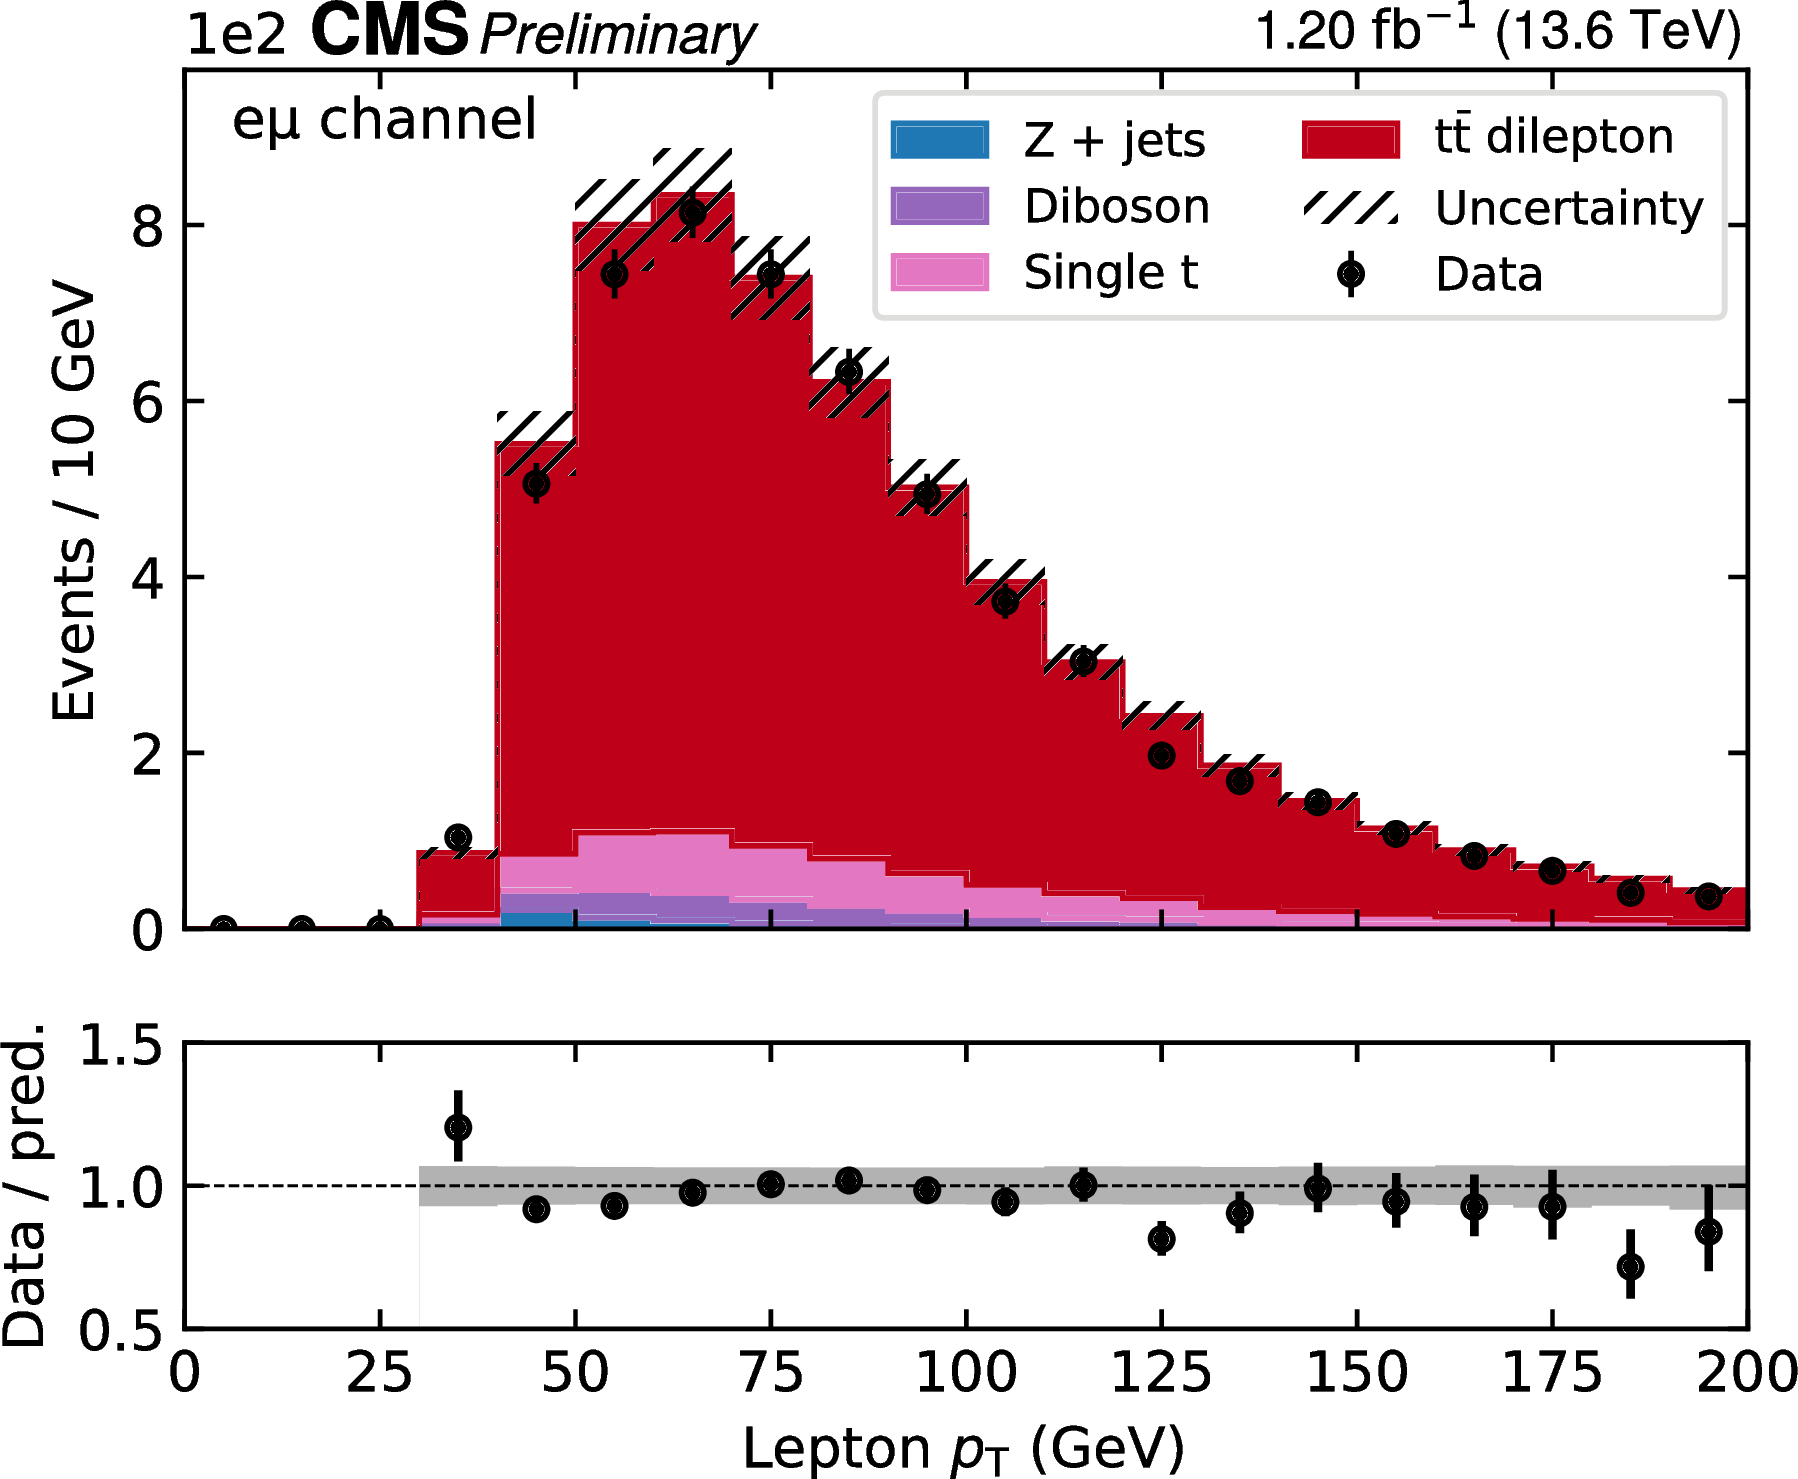
Figure 1-a:
Control plots in the $ \mathrm{e}^\pm\mu^\mp $ channel. From upper left to lower right: leading lepton $ p_{\mathrm{T}} $ and $ \eta $, leading jet $ p_{\mathrm{T}} $, $ m_{\ell \ell} $, number of jets and b jets. The MC predictions are normalized using measured luminosity and theoretical cross sections, and are scaled by the lepton scale factors as obtained in the fit. The uncertainty bands include all experimental statistical and systematic uncertainties including the integrated luminosity, but excluding the lepton scale factors, which have flat prior probability density distributions. The lower panels show the ratio of the data to the MC simulation. |
png pdf |
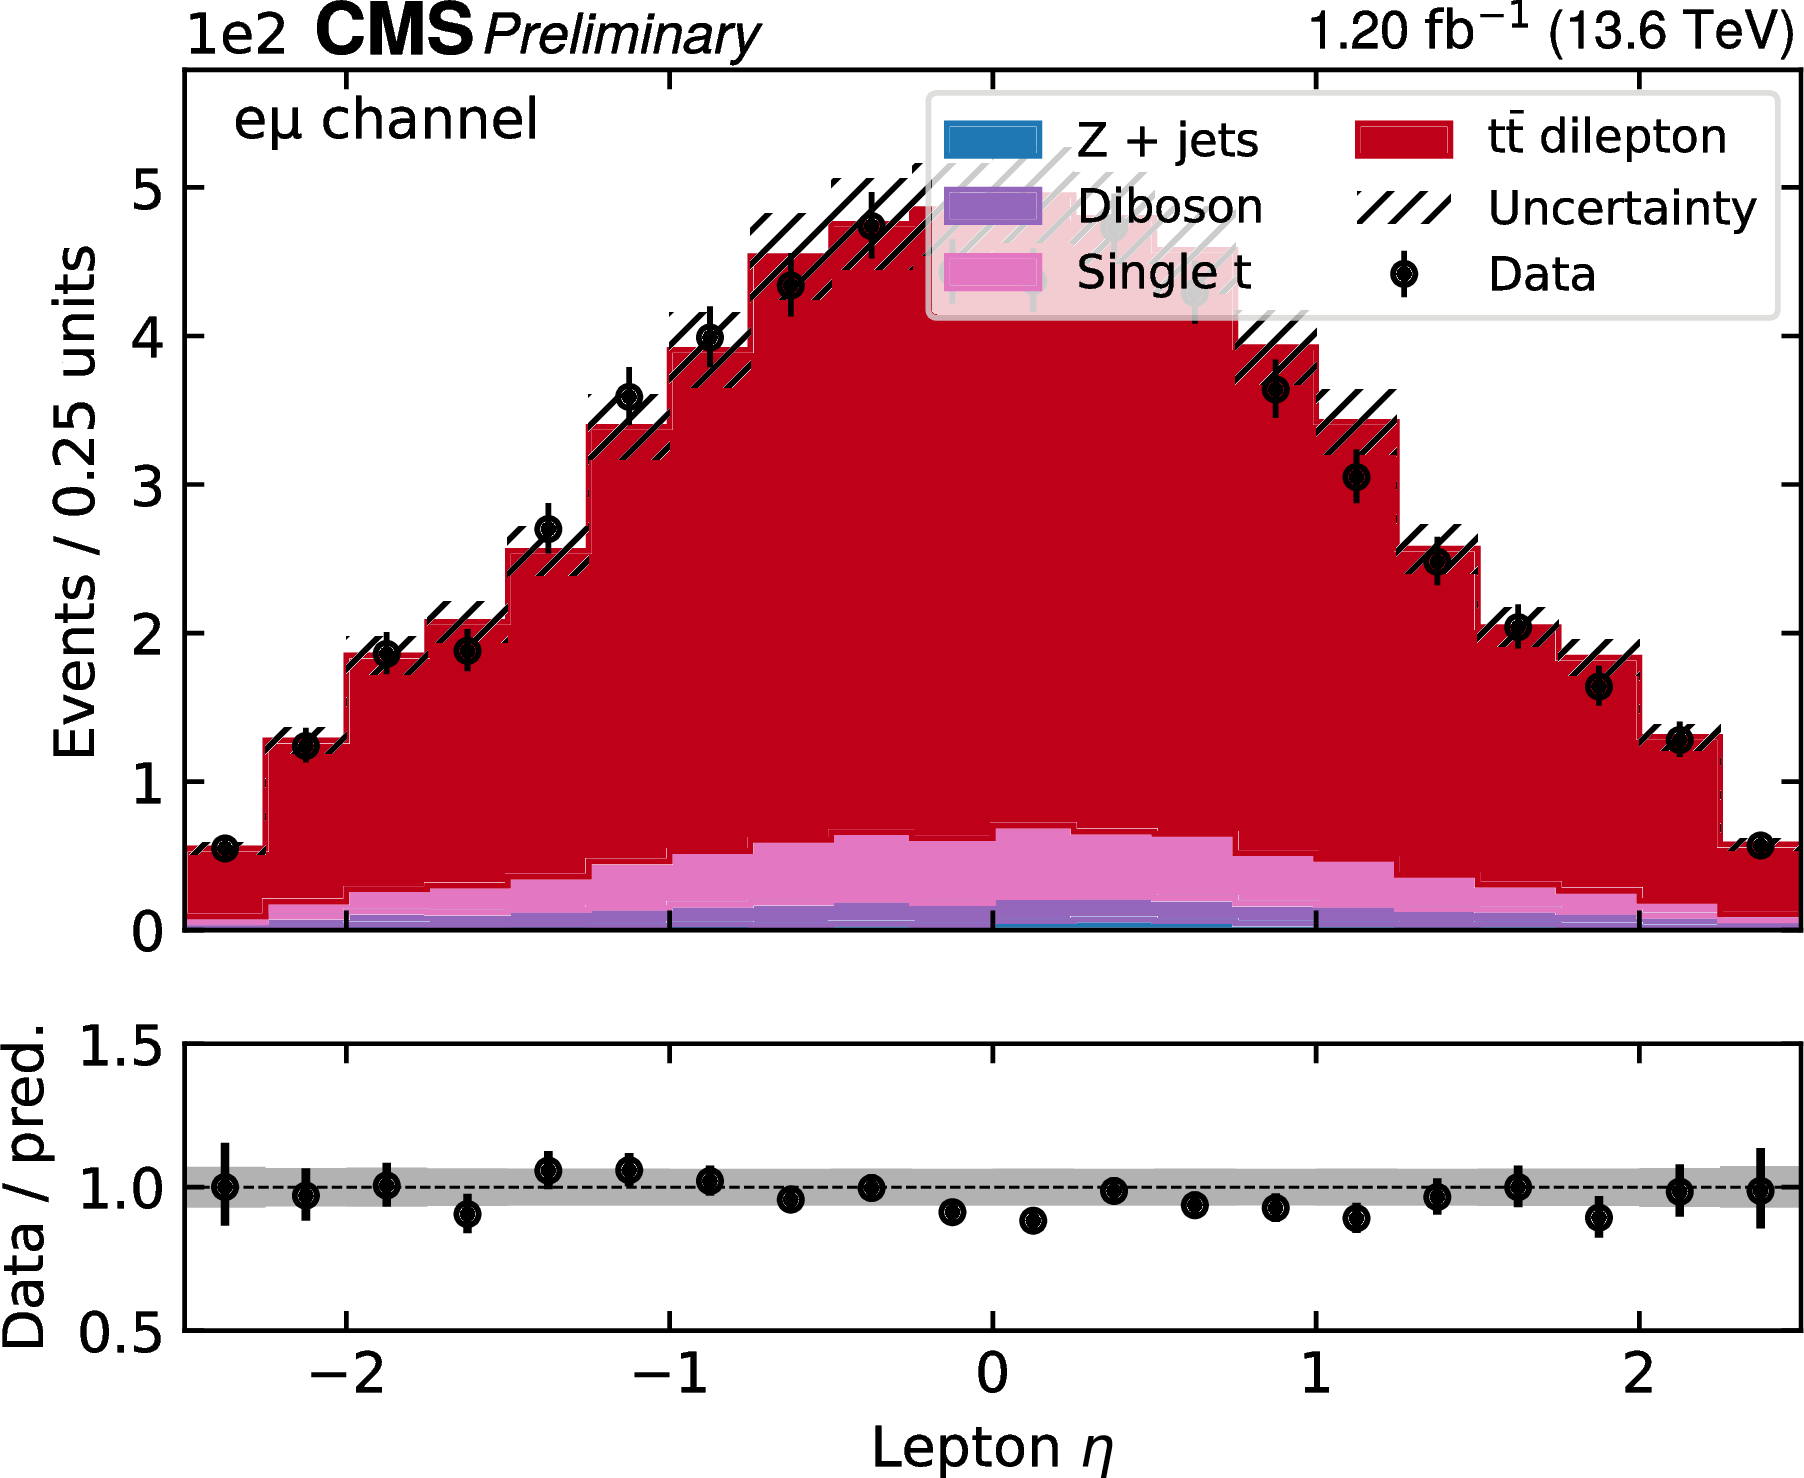
Figure 1-b:
Control plots in the $ \mathrm{e}^\pm\mu^\mp $ channel. From upper left to lower right: leading lepton $ p_{\mathrm{T}} $ and $ \eta $, leading jet $ p_{\mathrm{T}} $, $ m_{\ell \ell} $, number of jets and b jets. The MC predictions are normalized using measured luminosity and theoretical cross sections, and are scaled by the lepton scale factors as obtained in the fit. The uncertainty bands include all experimental statistical and systematic uncertainties including the integrated luminosity, but excluding the lepton scale factors, which have flat prior probability density distributions. The lower panels show the ratio of the data to the MC simulation. |
png pdf |
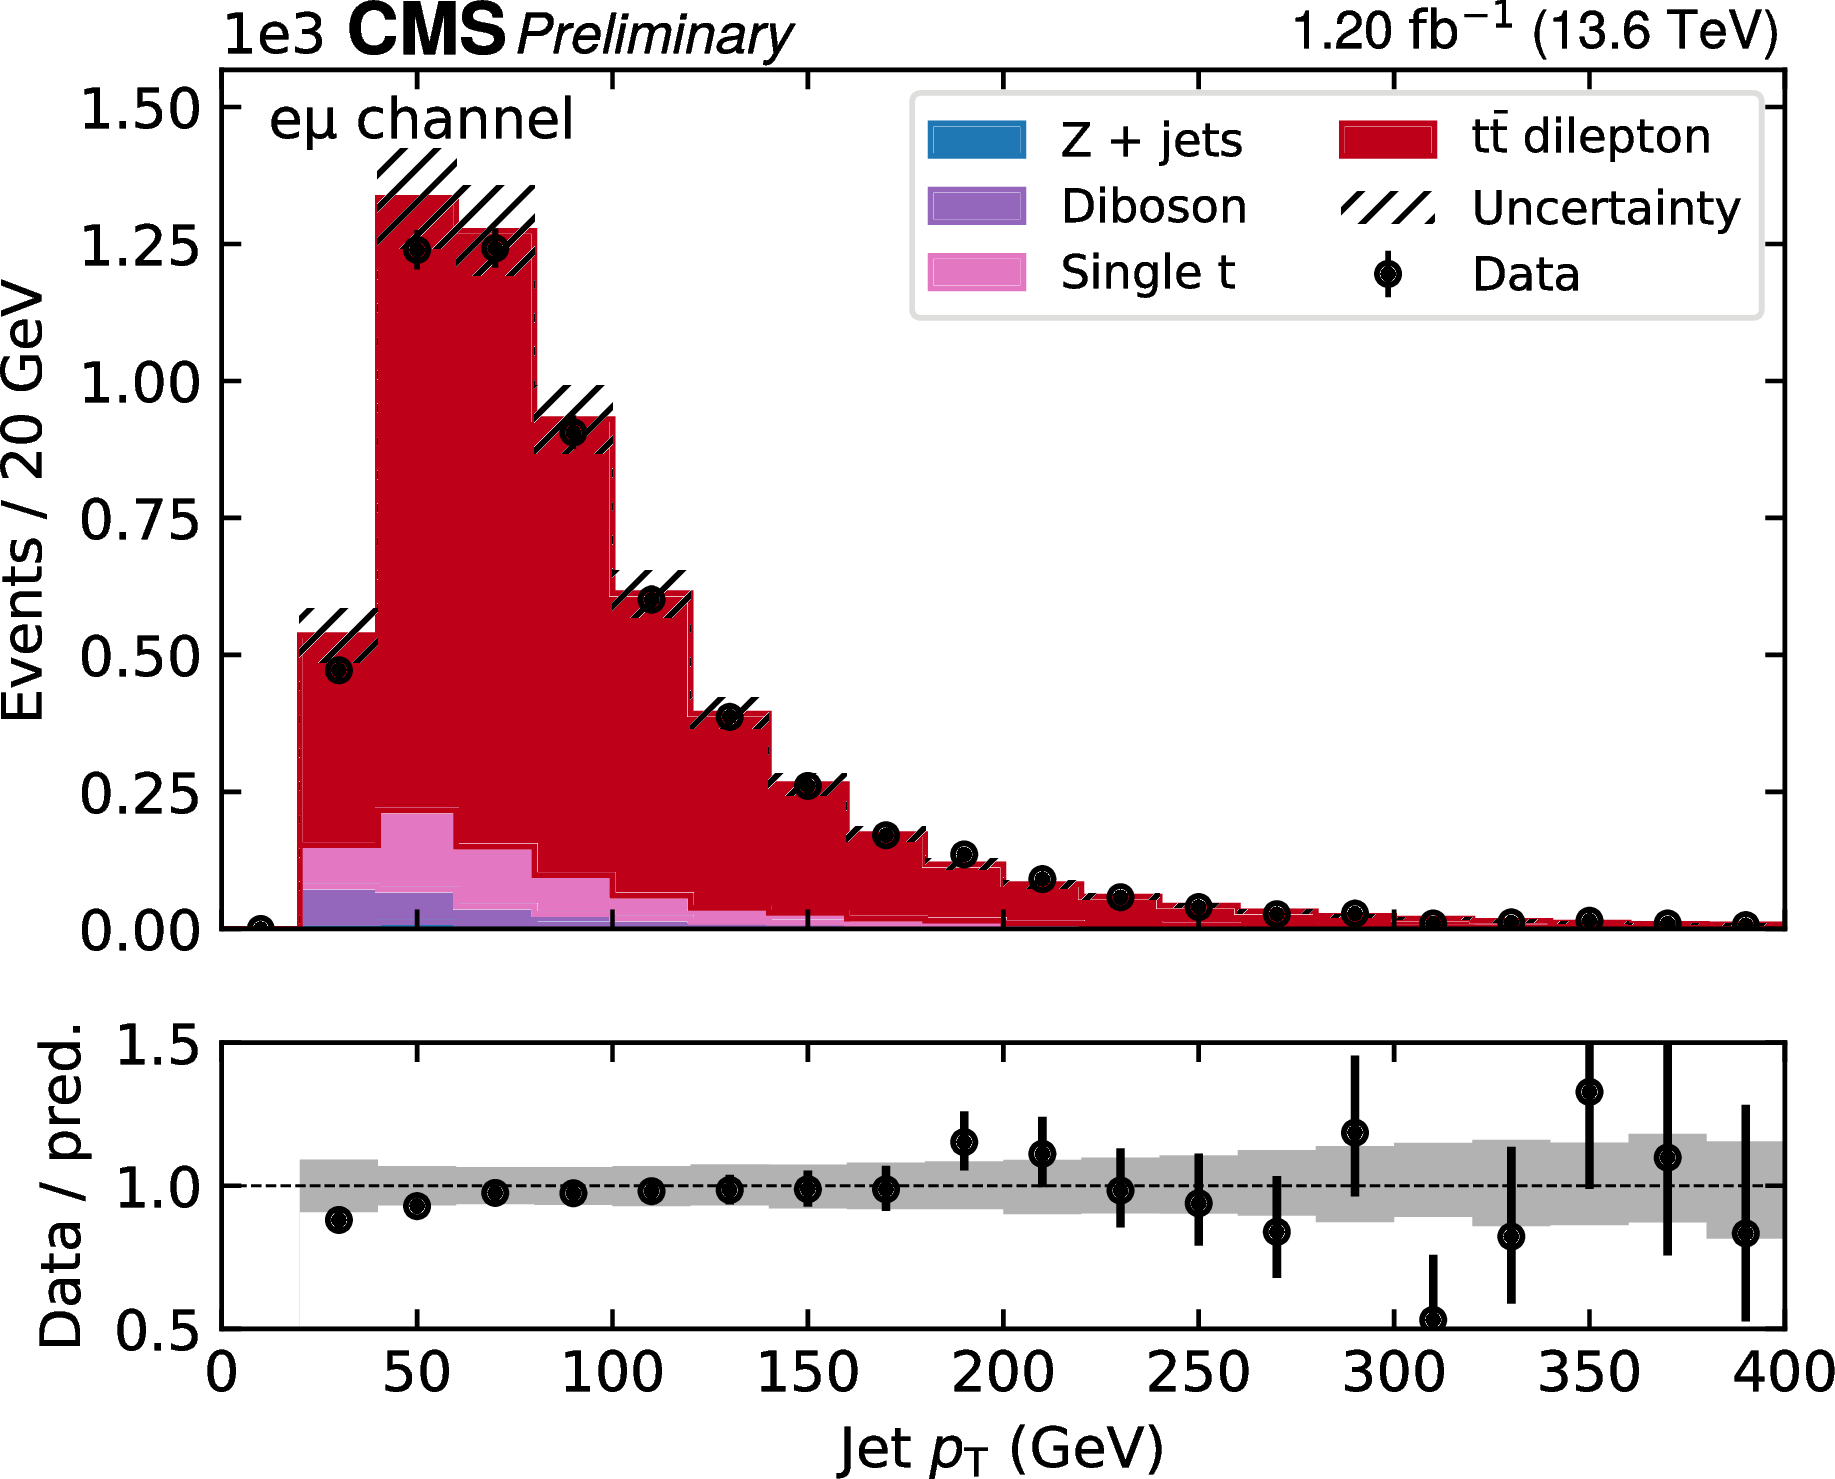
Figure 1-c:
Control plots in the $ \mathrm{e}^\pm\mu^\mp $ channel. From upper left to lower right: leading lepton $ p_{\mathrm{T}} $ and $ \eta $, leading jet $ p_{\mathrm{T}} $, $ m_{\ell \ell} $, number of jets and b jets. The MC predictions are normalized using measured luminosity and theoretical cross sections, and are scaled by the lepton scale factors as obtained in the fit. The uncertainty bands include all experimental statistical and systematic uncertainties including the integrated luminosity, but excluding the lepton scale factors, which have flat prior probability density distributions. The lower panels show the ratio of the data to the MC simulation. |
png pdf |
Figure 1-d:
Control plots in the $ \mathrm{e}^\pm\mu^\mp $ channel. From upper left to lower right: leading lepton $ p_{\mathrm{T}} $ and $ \eta $, leading jet $ p_{\mathrm{T}} $, $ m_{\ell \ell} $, number of jets and b jets. The MC predictions are normalized using measured luminosity and theoretical cross sections, and are scaled by the lepton scale factors as obtained in the fit. The uncertainty bands include all experimental statistical and systematic uncertainties including the integrated luminosity, but excluding the lepton scale factors, which have flat prior probability density distributions. The lower panels show the ratio of the data to the MC simulation. |
png pdf |
Figure 1-e:
Control plots in the $ \mathrm{e}^\pm\mu^\mp $ channel. From upper left to lower right: leading lepton $ p_{\mathrm{T}} $ and $ \eta $, leading jet $ p_{\mathrm{T}} $, $ m_{\ell \ell} $, number of jets and b jets. The MC predictions are normalized using measured luminosity and theoretical cross sections, and are scaled by the lepton scale factors as obtained in the fit. The uncertainty bands include all experimental statistical and systematic uncertainties including the integrated luminosity, but excluding the lepton scale factors, which have flat prior probability density distributions. The lower panels show the ratio of the data to the MC simulation. |
png pdf |
Figure 1-f:
Control plots in the $ \mathrm{e}^\pm\mu^\mp $ channel. From upper left to lower right: leading lepton $ p_{\mathrm{T}} $ and $ \eta $, leading jet $ p_{\mathrm{T}} $, $ m_{\ell \ell} $, number of jets and b jets. The MC predictions are normalized using measured luminosity and theoretical cross sections, and are scaled by the lepton scale factors as obtained in the fit. The uncertainty bands include all experimental statistical and systematic uncertainties including the integrated luminosity, but excluding the lepton scale factors, which have flat prior probability density distributions. The lower panels show the ratio of the data to the MC simulation. |
png pdf |
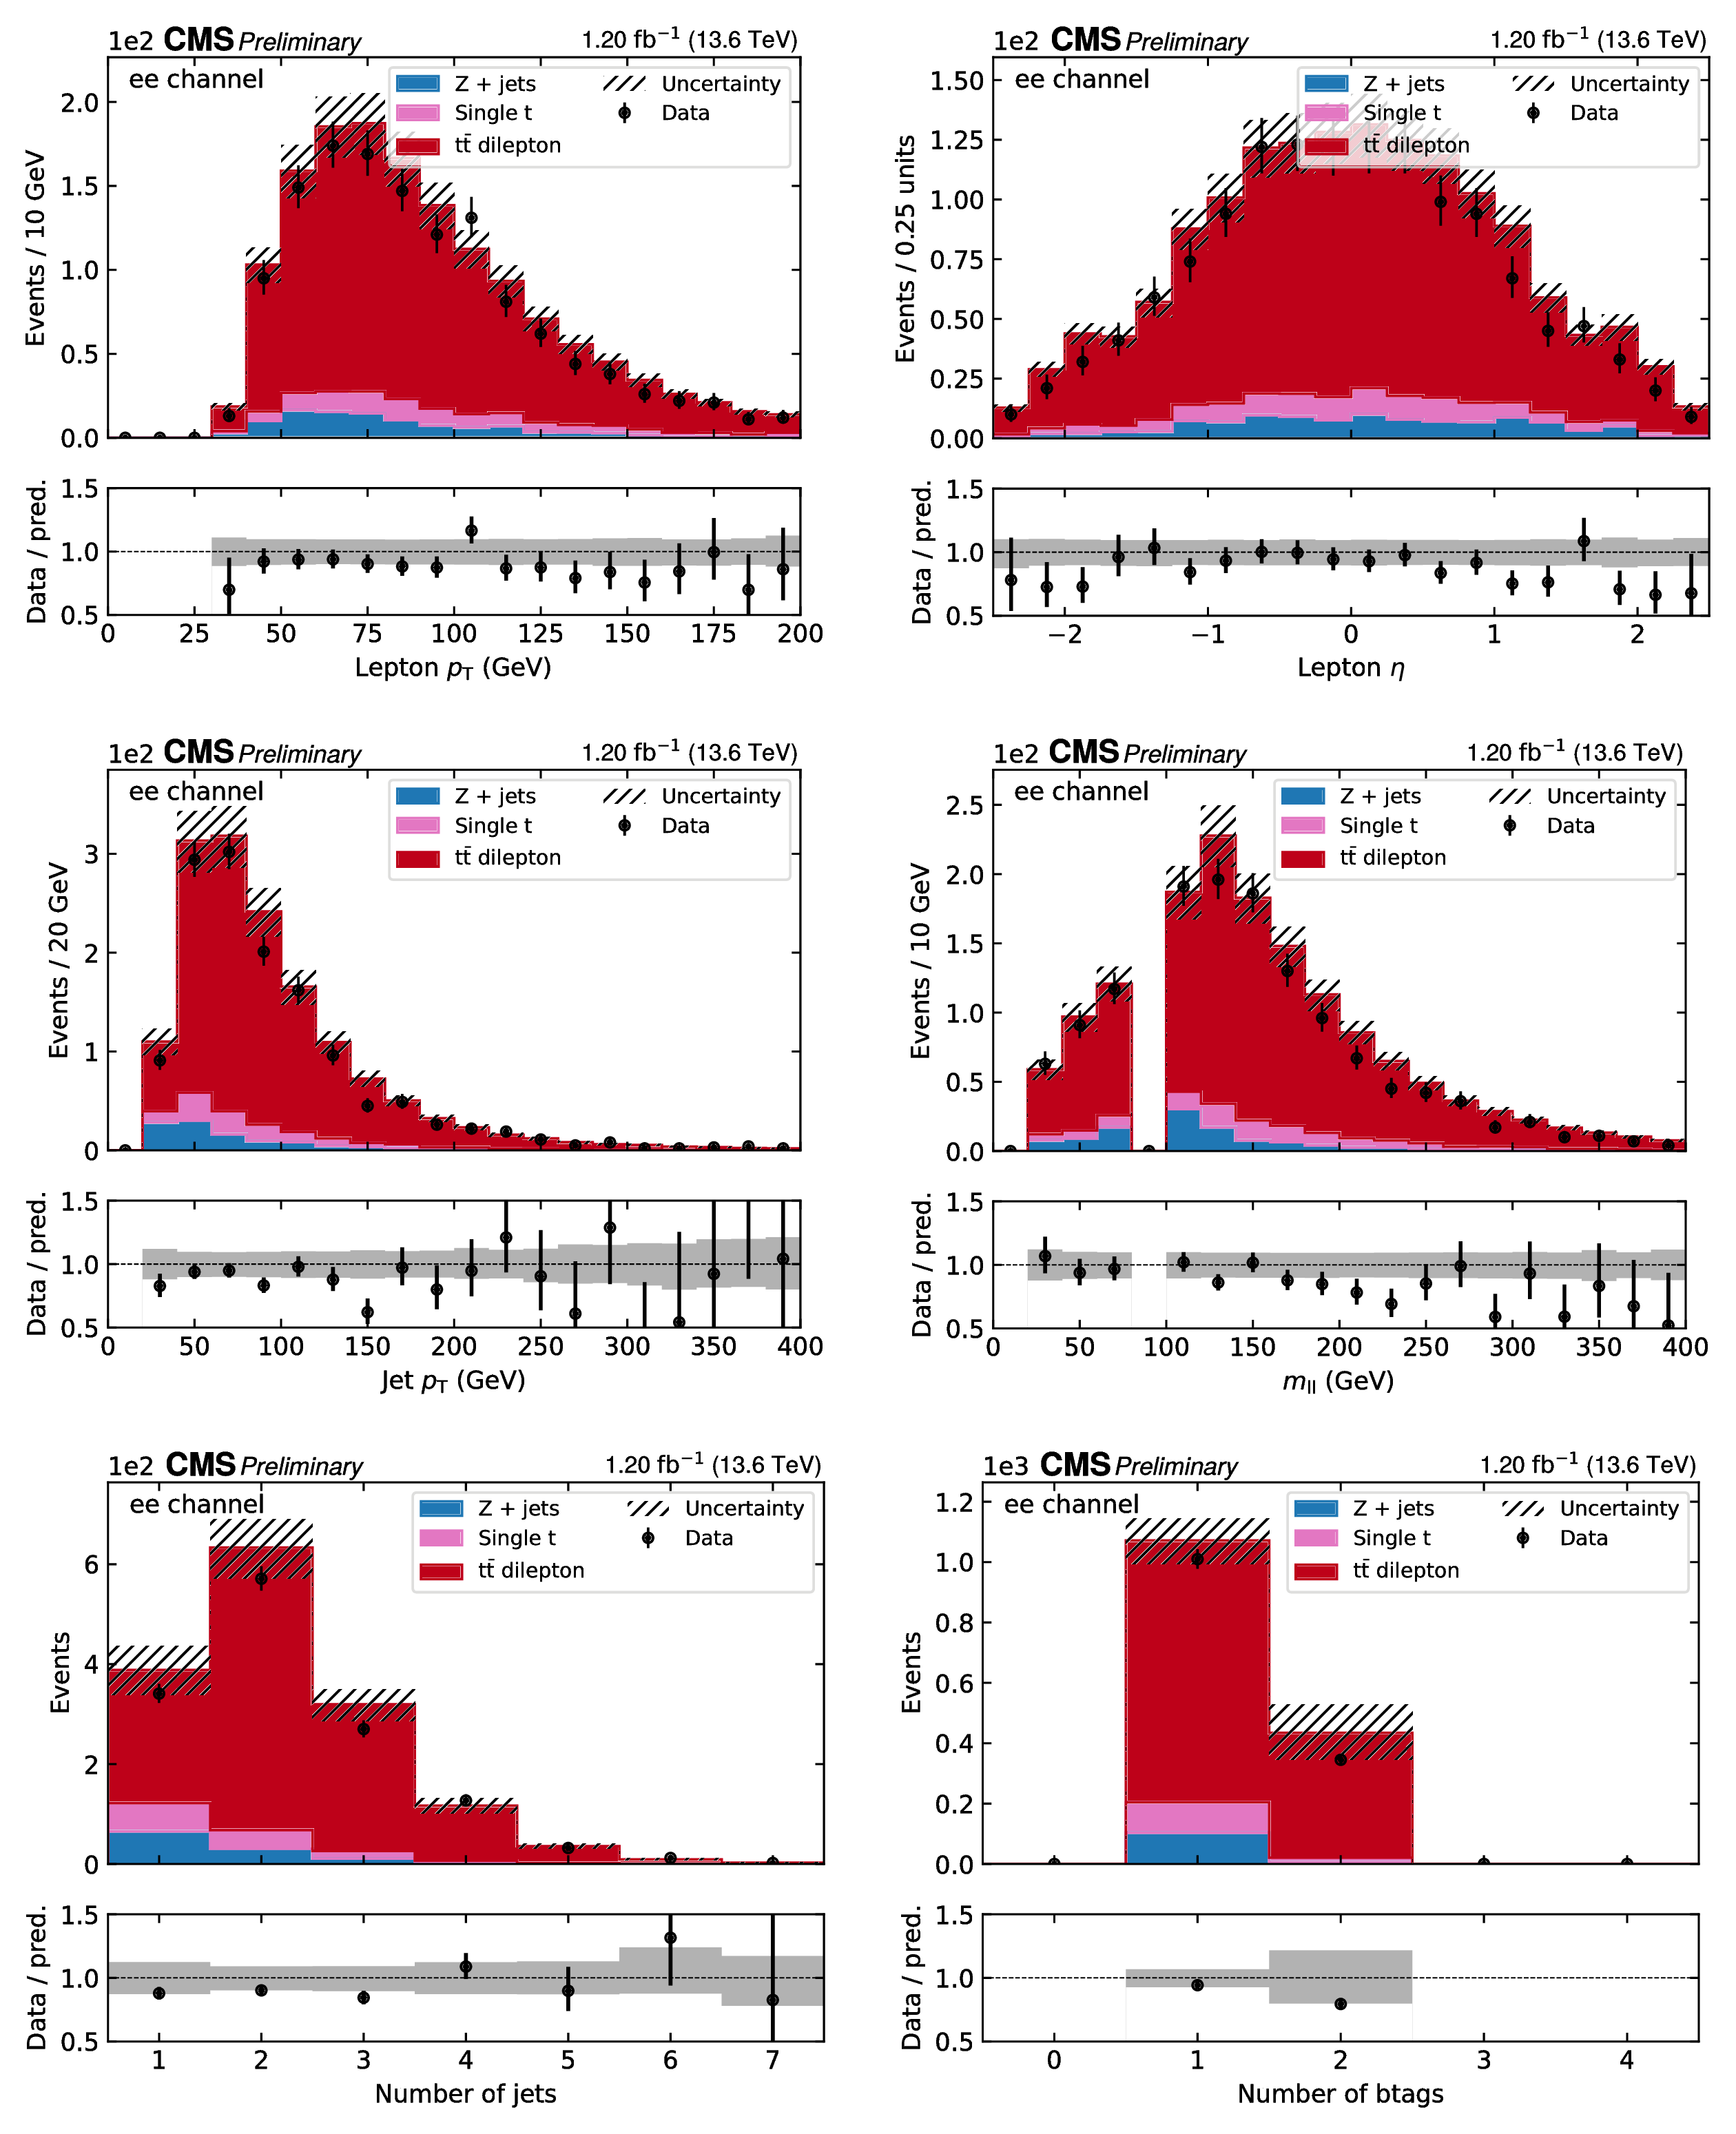
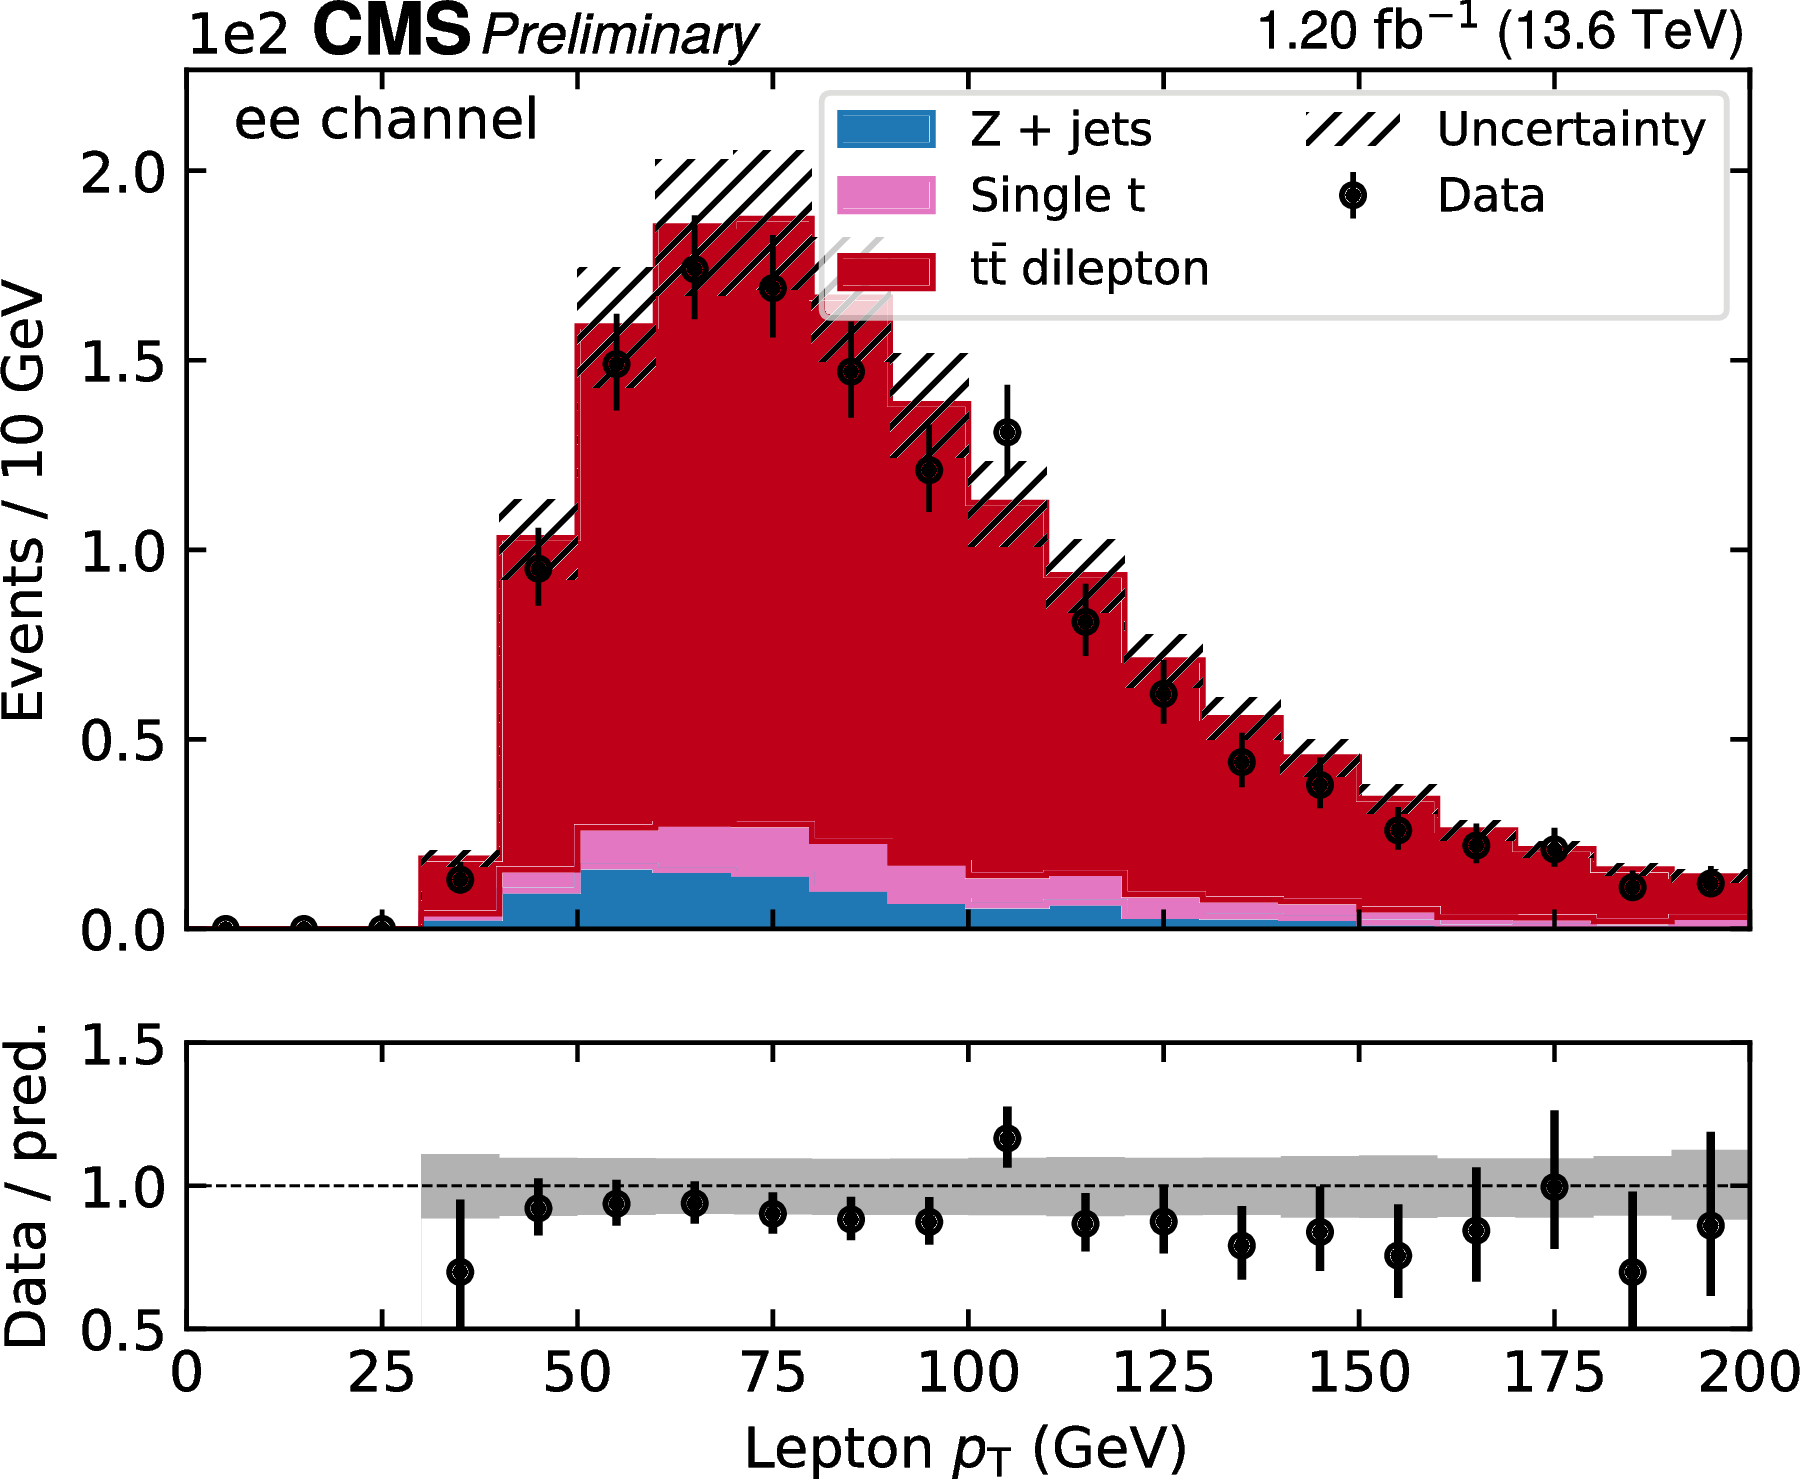
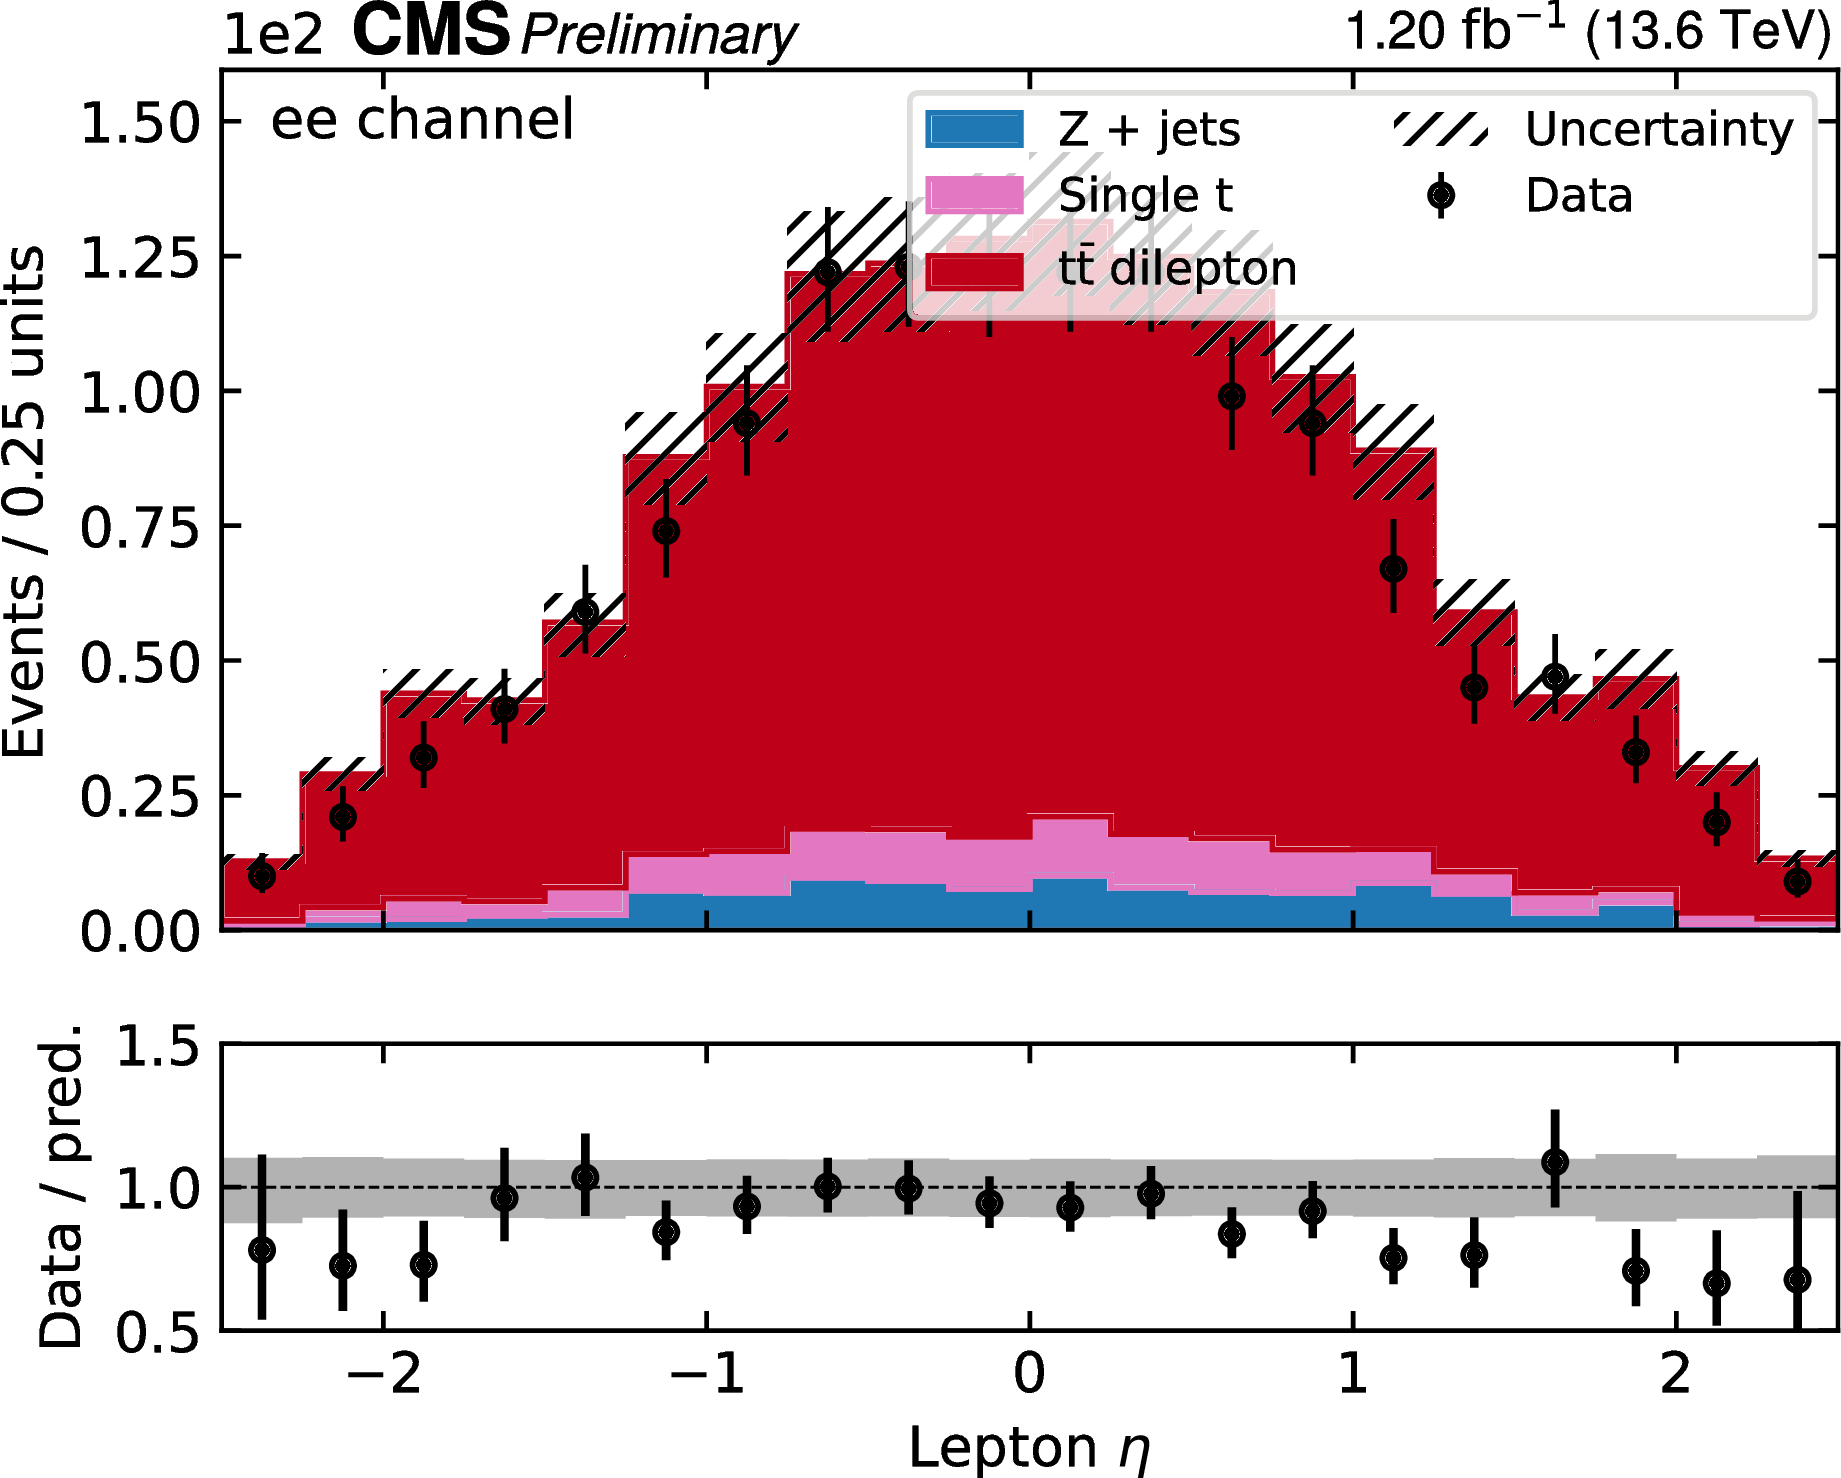
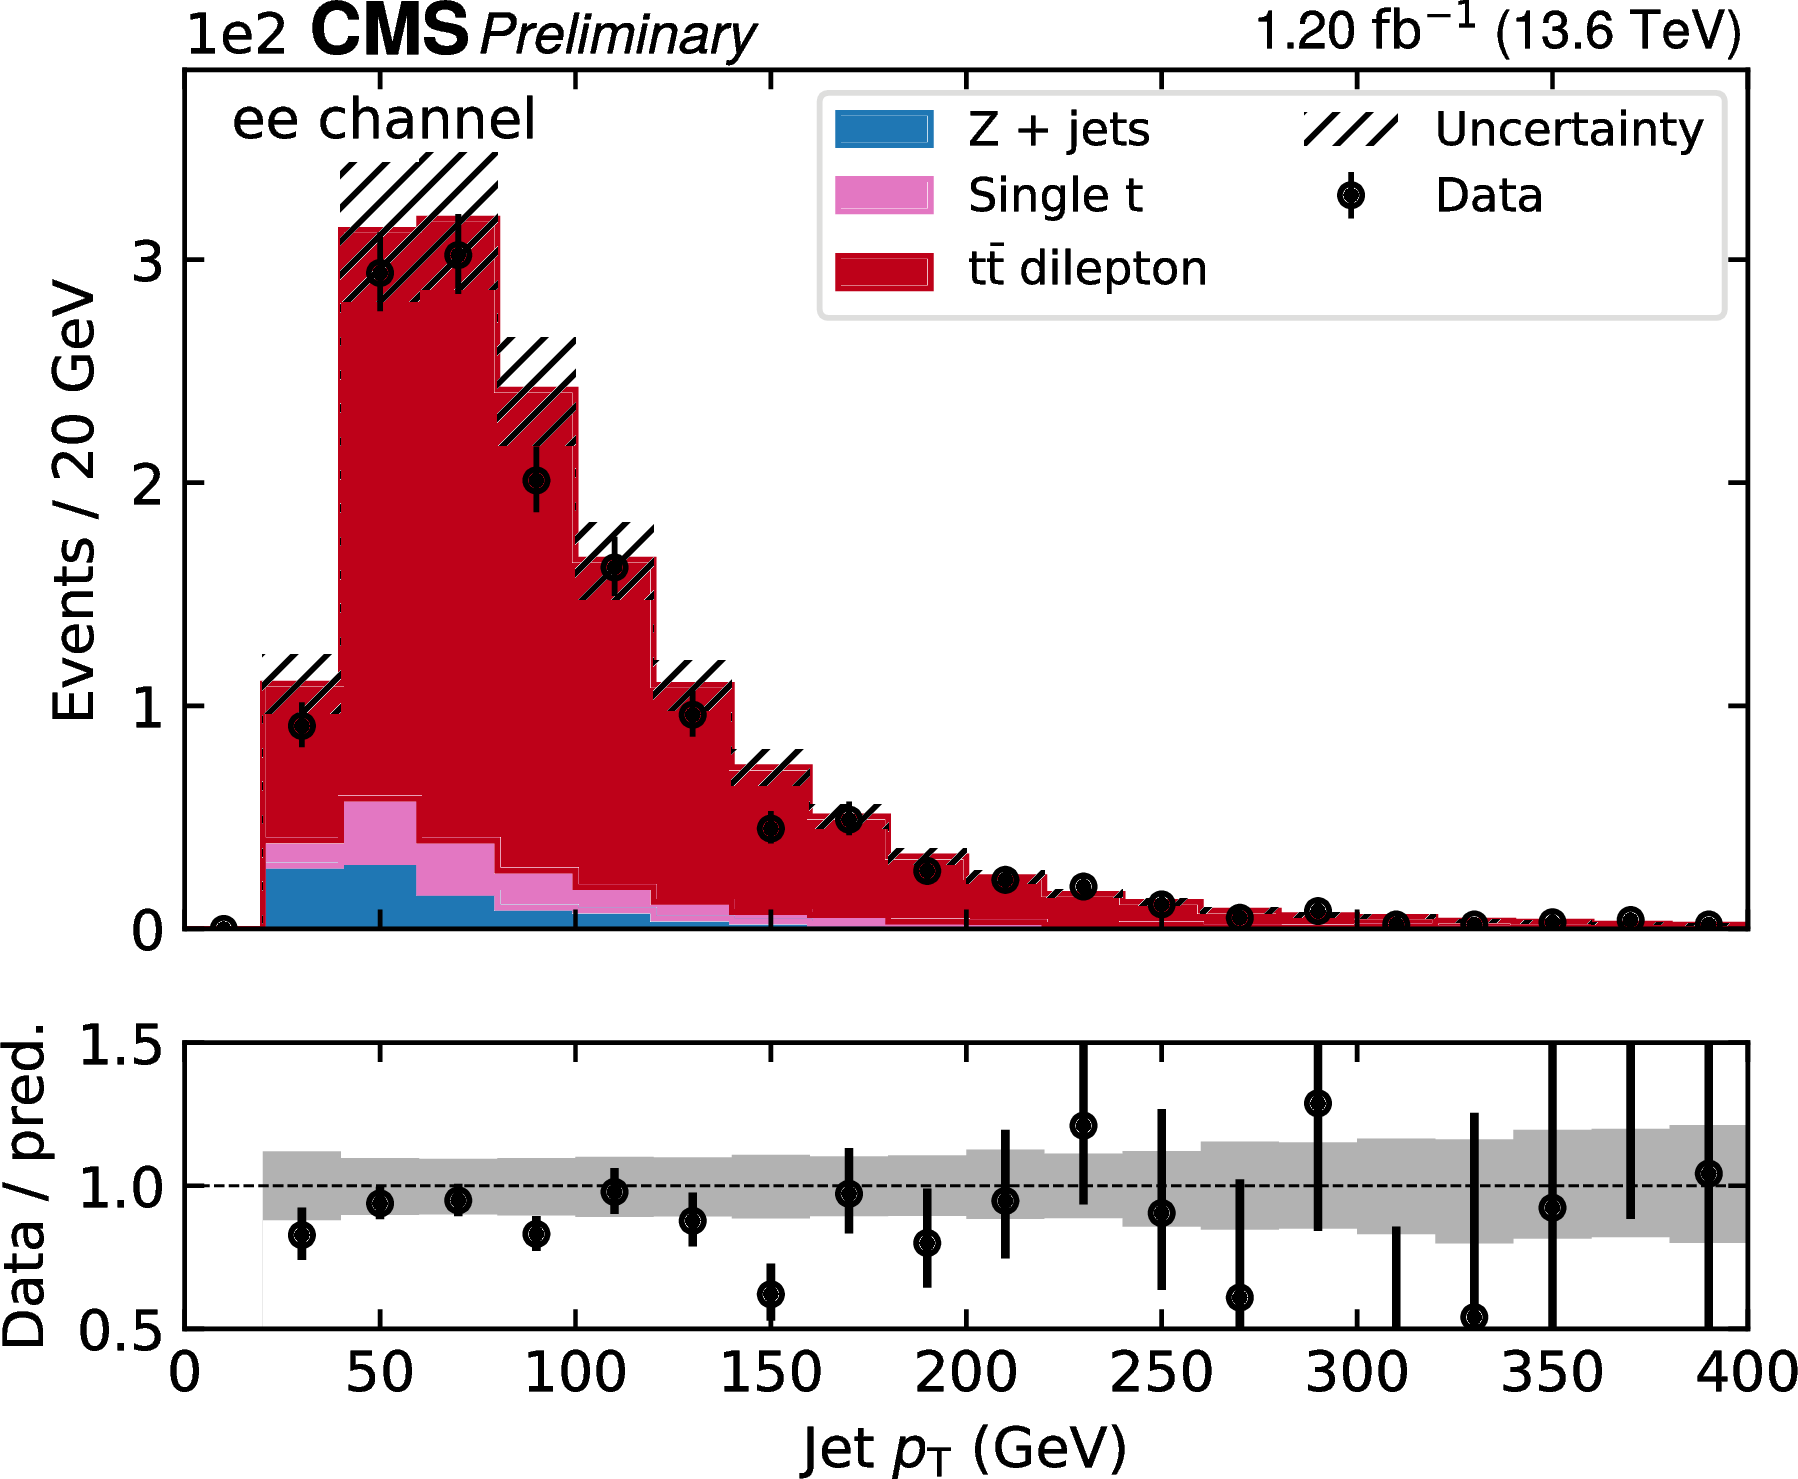
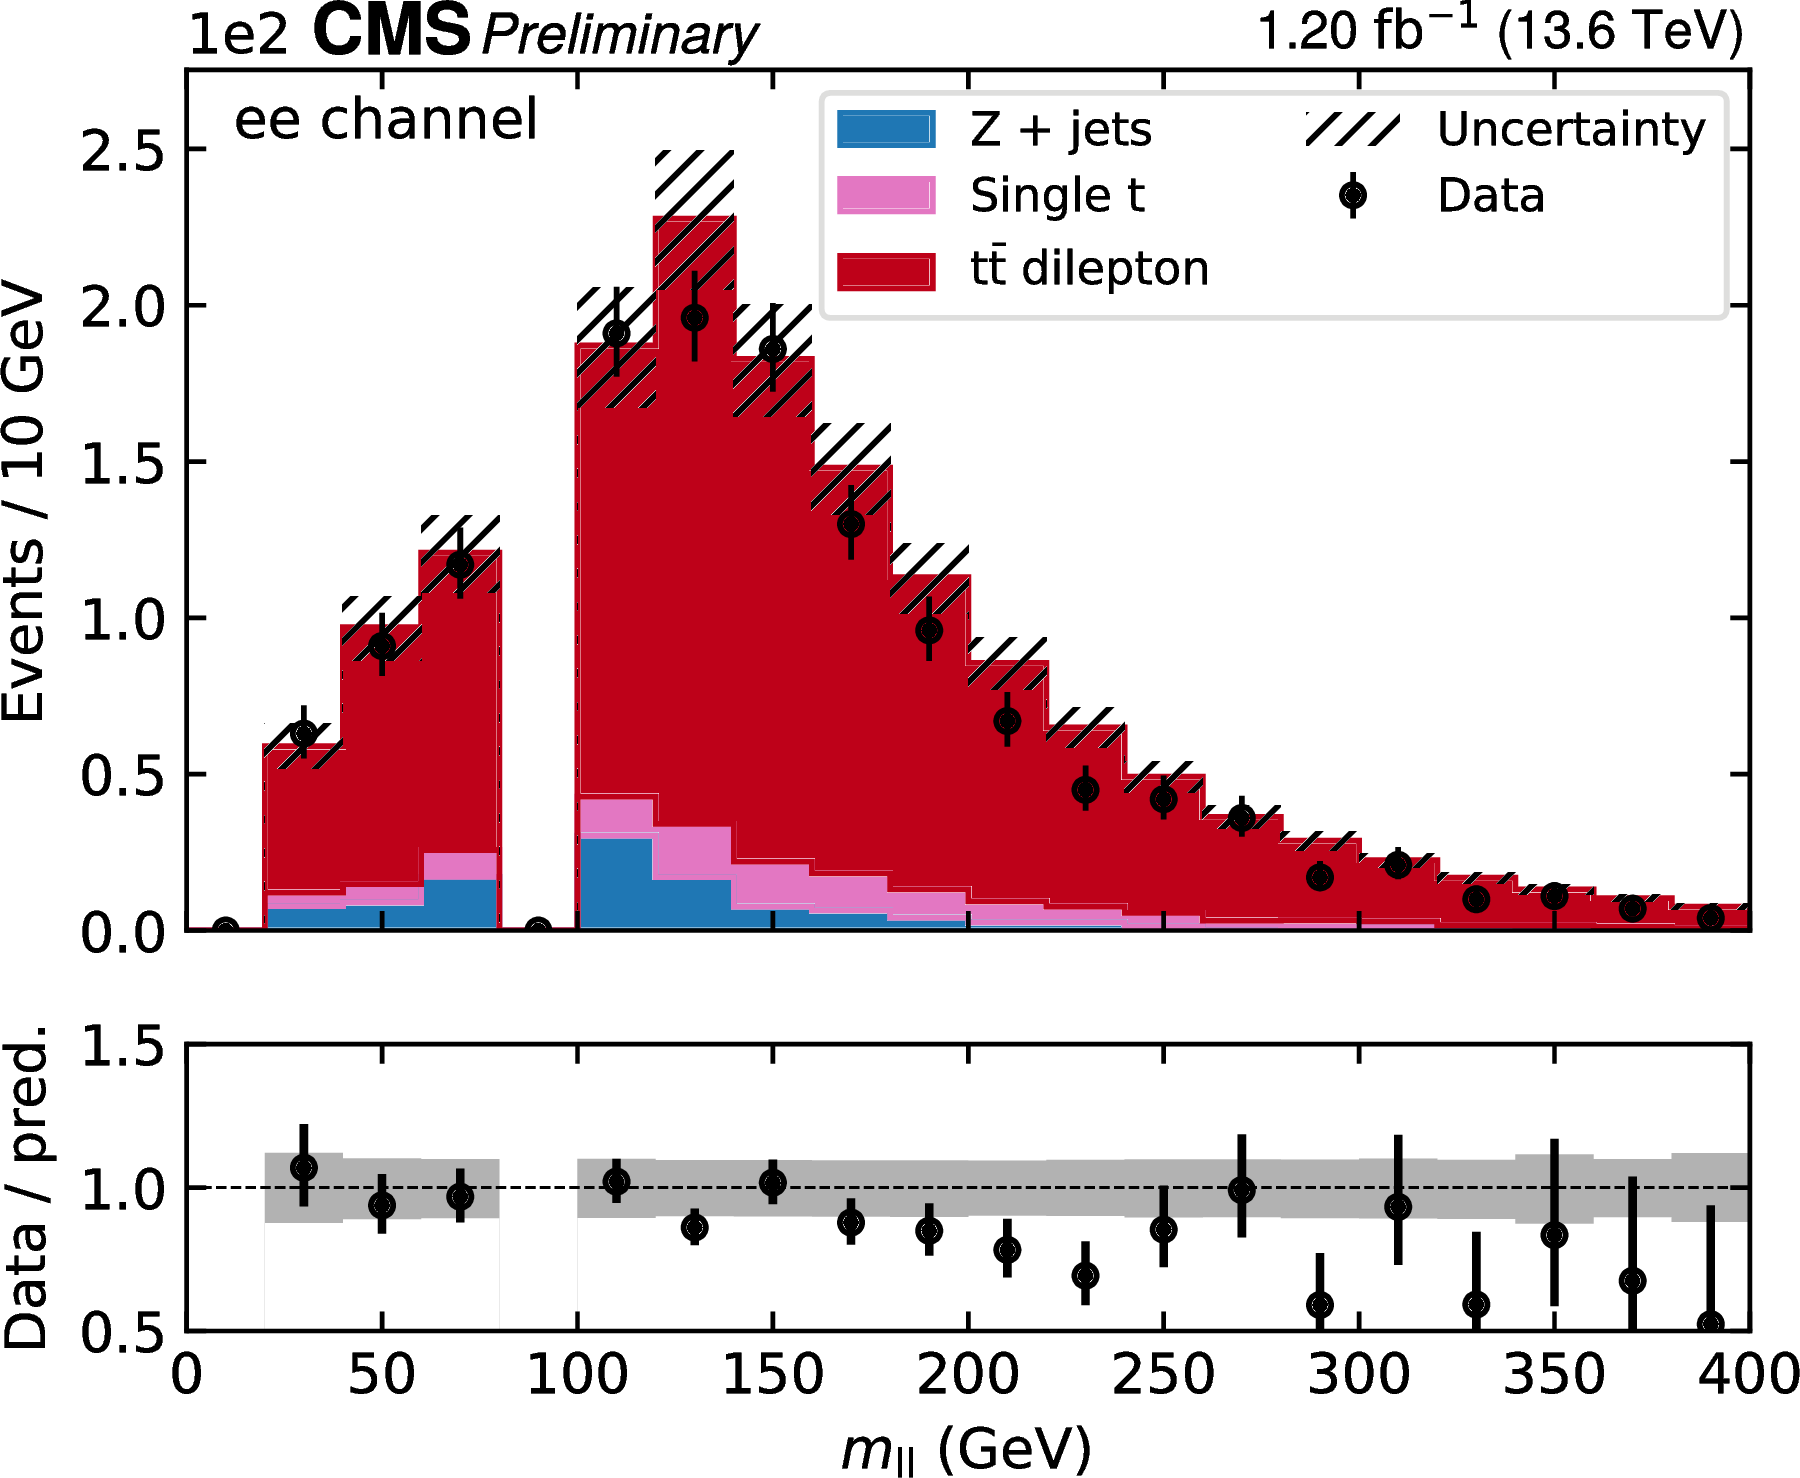
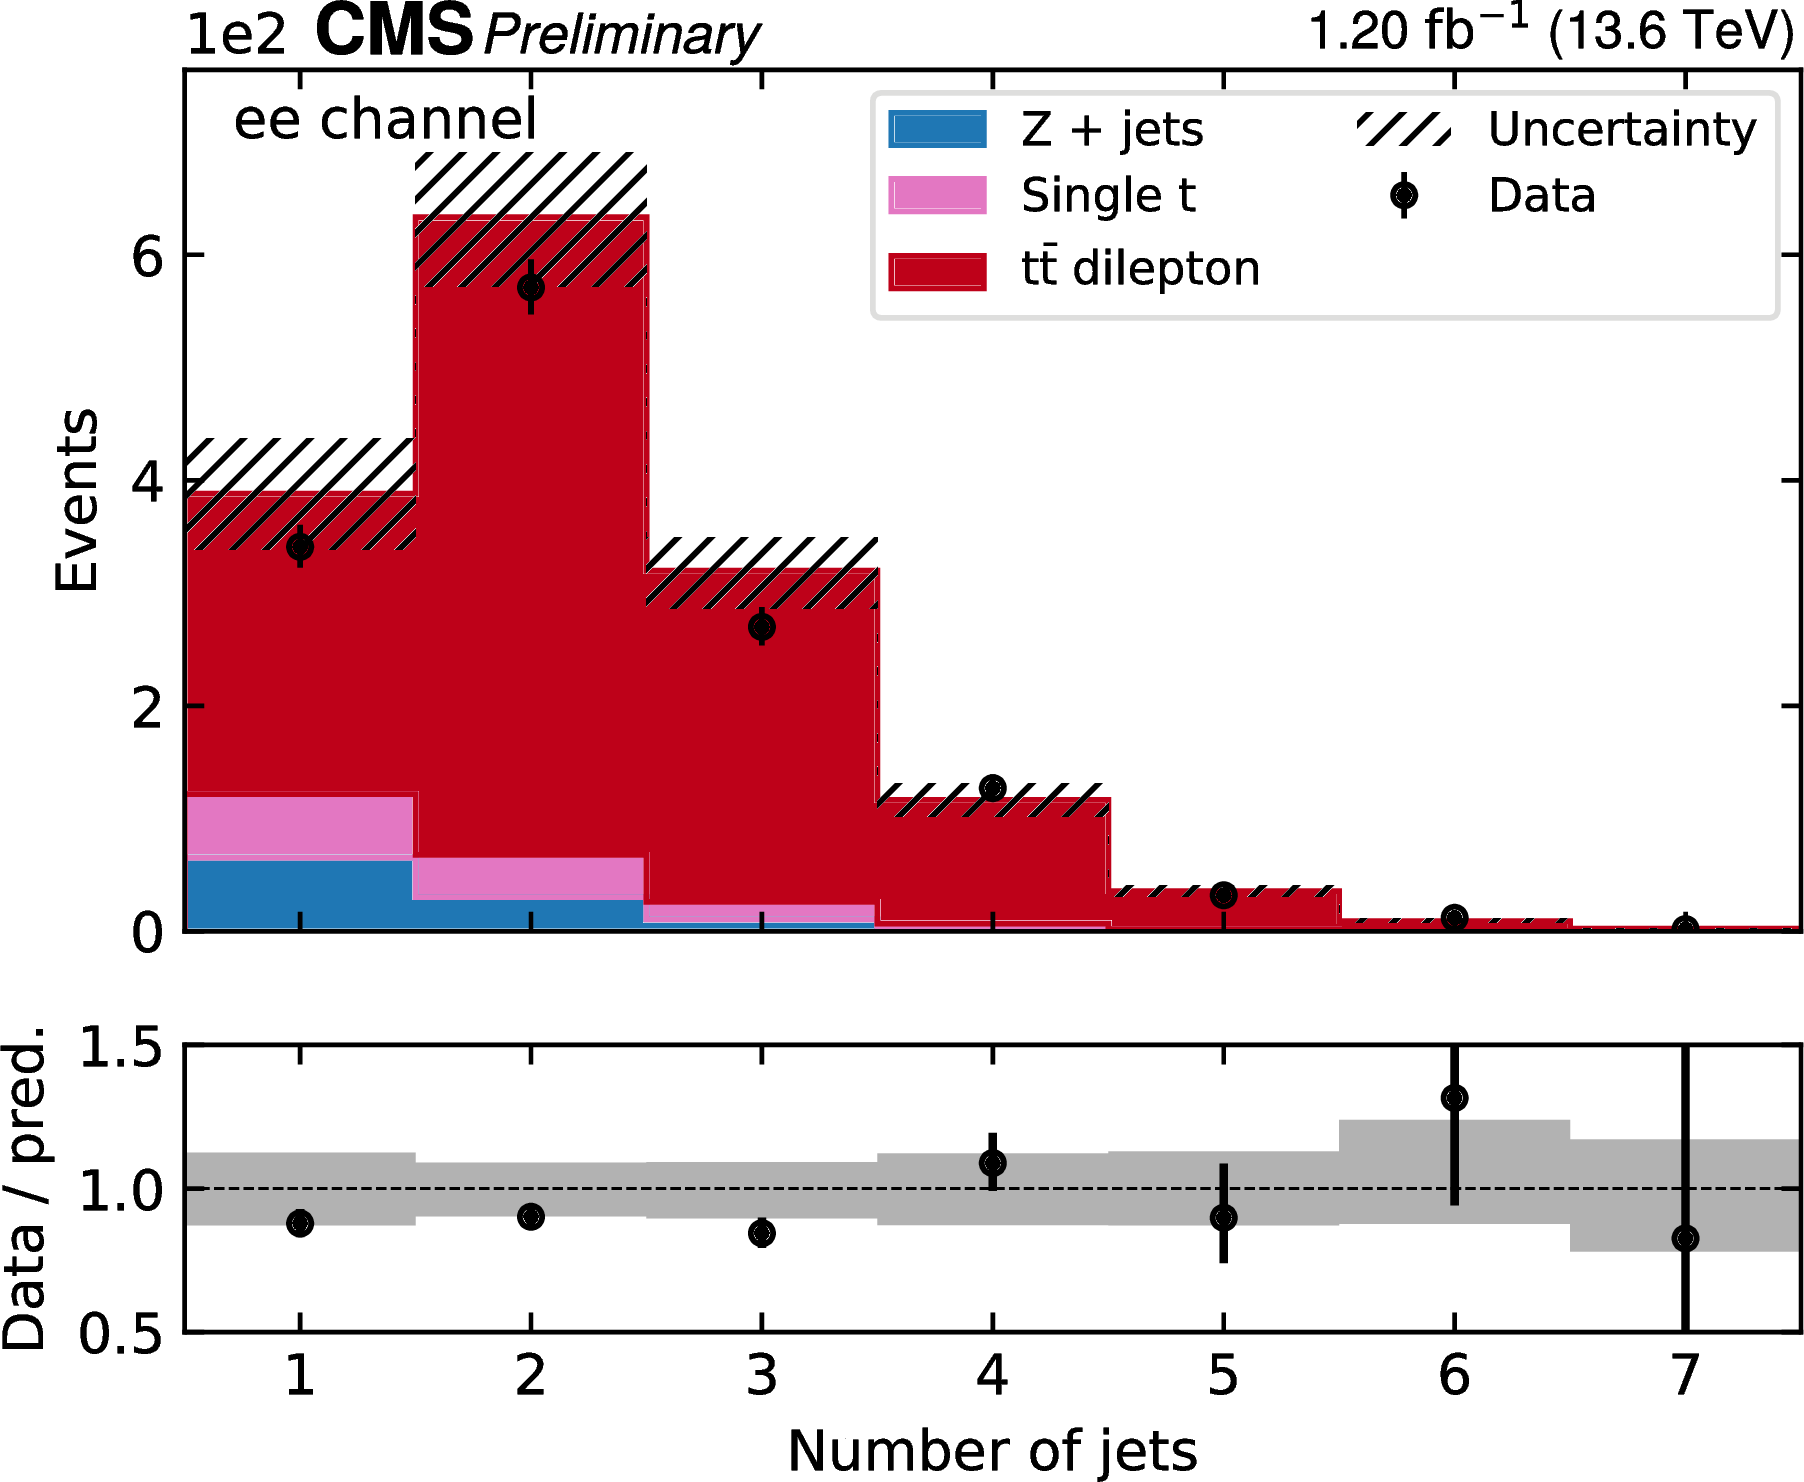
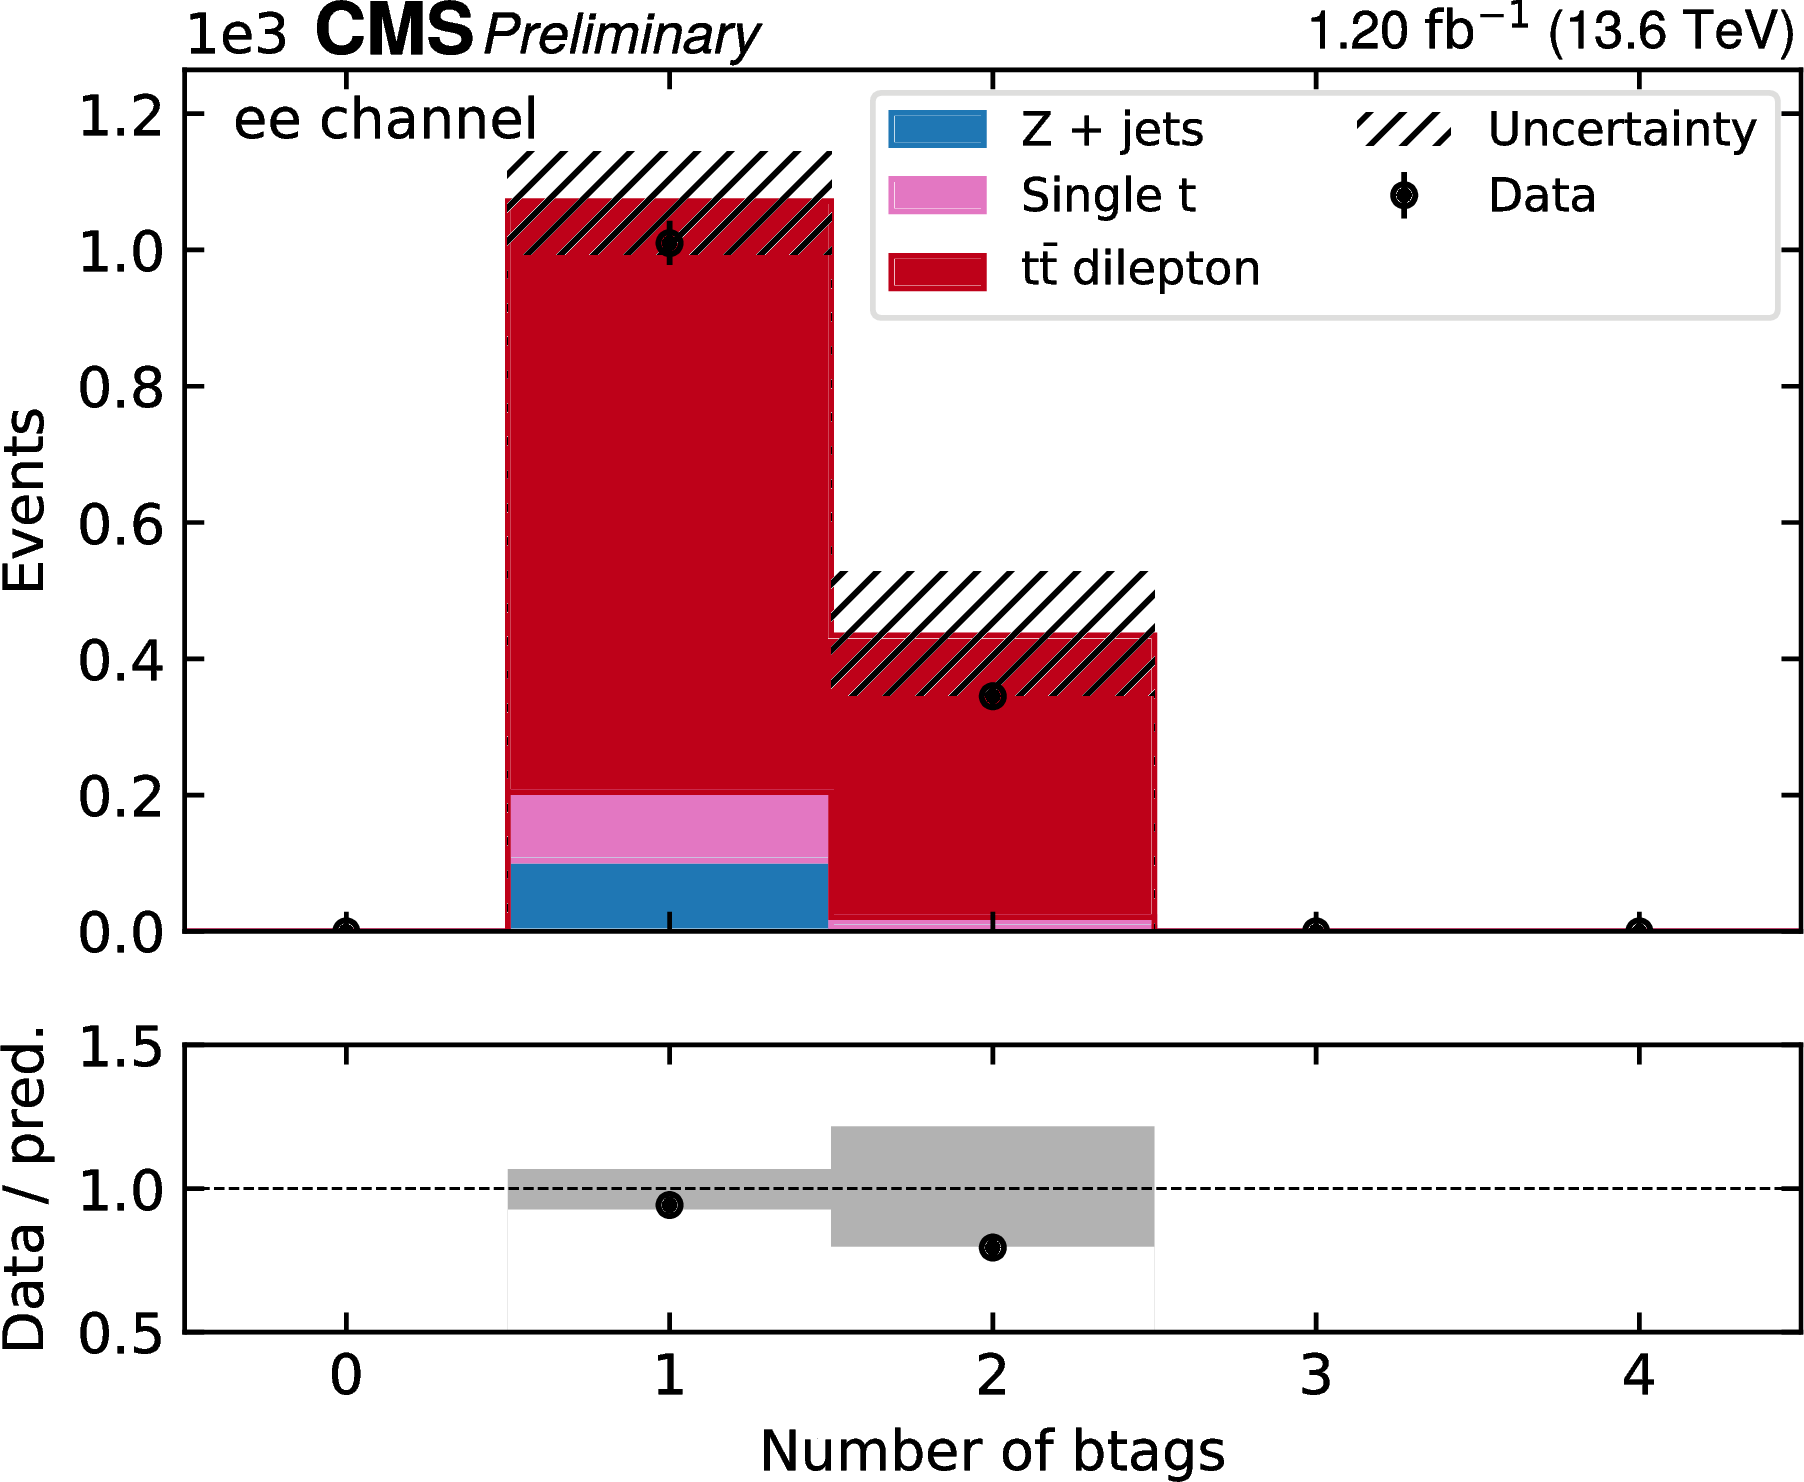
Figure 2:
Control plots in the $ \mathrm{e}^+\mathrm{e}^- $ channel. From upper left to lower right: leading lepton $ p_{\mathrm{T}} $ and $ \eta $, leading jet $ p_{\mathrm{T}} $, $ m_{\ell \ell} $, number of jets and b jets. The MC predictions are normalized using measured luminosity and theoretical cross sections, and are scaled by the lepton scale factors as obtained in the fit. The uncertainty bands include all experimental statistical and systematic uncertainties including the integrated luminosity, but excluding the lepton scale factors, which have flat prior probability density distributions. The lower panels show the ratio of the data to the MC simulation. |
png pdf |
Figure 2-a:
Control plots in the $ \mathrm{e}^+\mathrm{e}^- $ channel. From upper left to lower right: leading lepton $ p_{\mathrm{T}} $ and $ \eta $, leading jet $ p_{\mathrm{T}} $, $ m_{\ell \ell} $, number of jets and b jets. The MC predictions are normalized using measured luminosity and theoretical cross sections, and are scaled by the lepton scale factors as obtained in the fit. The uncertainty bands include all experimental statistical and systematic uncertainties including the integrated luminosity, but excluding the lepton scale factors, which have flat prior probability density distributions. The lower panels show the ratio of the data to the MC simulation. |
png pdf |
Figure 2-b:
Control plots in the $ \mathrm{e}^+\mathrm{e}^- $ channel. From upper left to lower right: leading lepton $ p_{\mathrm{T}} $ and $ \eta $, leading jet $ p_{\mathrm{T}} $, $ m_{\ell \ell} $, number of jets and b jets. The MC predictions are normalized using measured luminosity and theoretical cross sections, and are scaled by the lepton scale factors as obtained in the fit. The uncertainty bands include all experimental statistical and systematic uncertainties including the integrated luminosity, but excluding the lepton scale factors, which have flat prior probability density distributions. The lower panels show the ratio of the data to the MC simulation. |
png pdf |
Figure 2-c:
Control plots in the $ \mathrm{e}^+\mathrm{e}^- $ channel. From upper left to lower right: leading lepton $ p_{\mathrm{T}} $ and $ \eta $, leading jet $ p_{\mathrm{T}} $, $ m_{\ell \ell} $, number of jets and b jets. The MC predictions are normalized using measured luminosity and theoretical cross sections, and are scaled by the lepton scale factors as obtained in the fit. The uncertainty bands include all experimental statistical and systematic uncertainties including the integrated luminosity, but excluding the lepton scale factors, which have flat prior probability density distributions. The lower panels show the ratio of the data to the MC simulation. |
png pdf |
Figure 2-d:
Control plots in the $ \mathrm{e}^+\mathrm{e}^- $ channel. From upper left to lower right: leading lepton $ p_{\mathrm{T}} $ and $ \eta $, leading jet $ p_{\mathrm{T}} $, $ m_{\ell \ell} $, number of jets and b jets. The MC predictions are normalized using measured luminosity and theoretical cross sections, and are scaled by the lepton scale factors as obtained in the fit. The uncertainty bands include all experimental statistical and systematic uncertainties including the integrated luminosity, but excluding the lepton scale factors, which have flat prior probability density distributions. The lower panels show the ratio of the data to the MC simulation. |
png pdf |
Figure 2-e:
Control plots in the $ \mathrm{e}^+\mathrm{e}^- $ channel. From upper left to lower right: leading lepton $ p_{\mathrm{T}} $ and $ \eta $, leading jet $ p_{\mathrm{T}} $, $ m_{\ell \ell} $, number of jets and b jets. The MC predictions are normalized using measured luminosity and theoretical cross sections, and are scaled by the lepton scale factors as obtained in the fit. The uncertainty bands include all experimental statistical and systematic uncertainties including the integrated luminosity, but excluding the lepton scale factors, which have flat prior probability density distributions. The lower panels show the ratio of the data to the MC simulation. |
png pdf |
Figure 2-f:
Control plots in the $ \mathrm{e}^+\mathrm{e}^- $ channel. From upper left to lower right: leading lepton $ p_{\mathrm{T}} $ and $ \eta $, leading jet $ p_{\mathrm{T}} $, $ m_{\ell \ell} $, number of jets and b jets. The MC predictions are normalized using measured luminosity and theoretical cross sections, and are scaled by the lepton scale factors as obtained in the fit. The uncertainty bands include all experimental statistical and systematic uncertainties including the integrated luminosity, but excluding the lepton scale factors, which have flat prior probability density distributions. The lower panels show the ratio of the data to the MC simulation. |
png pdf |
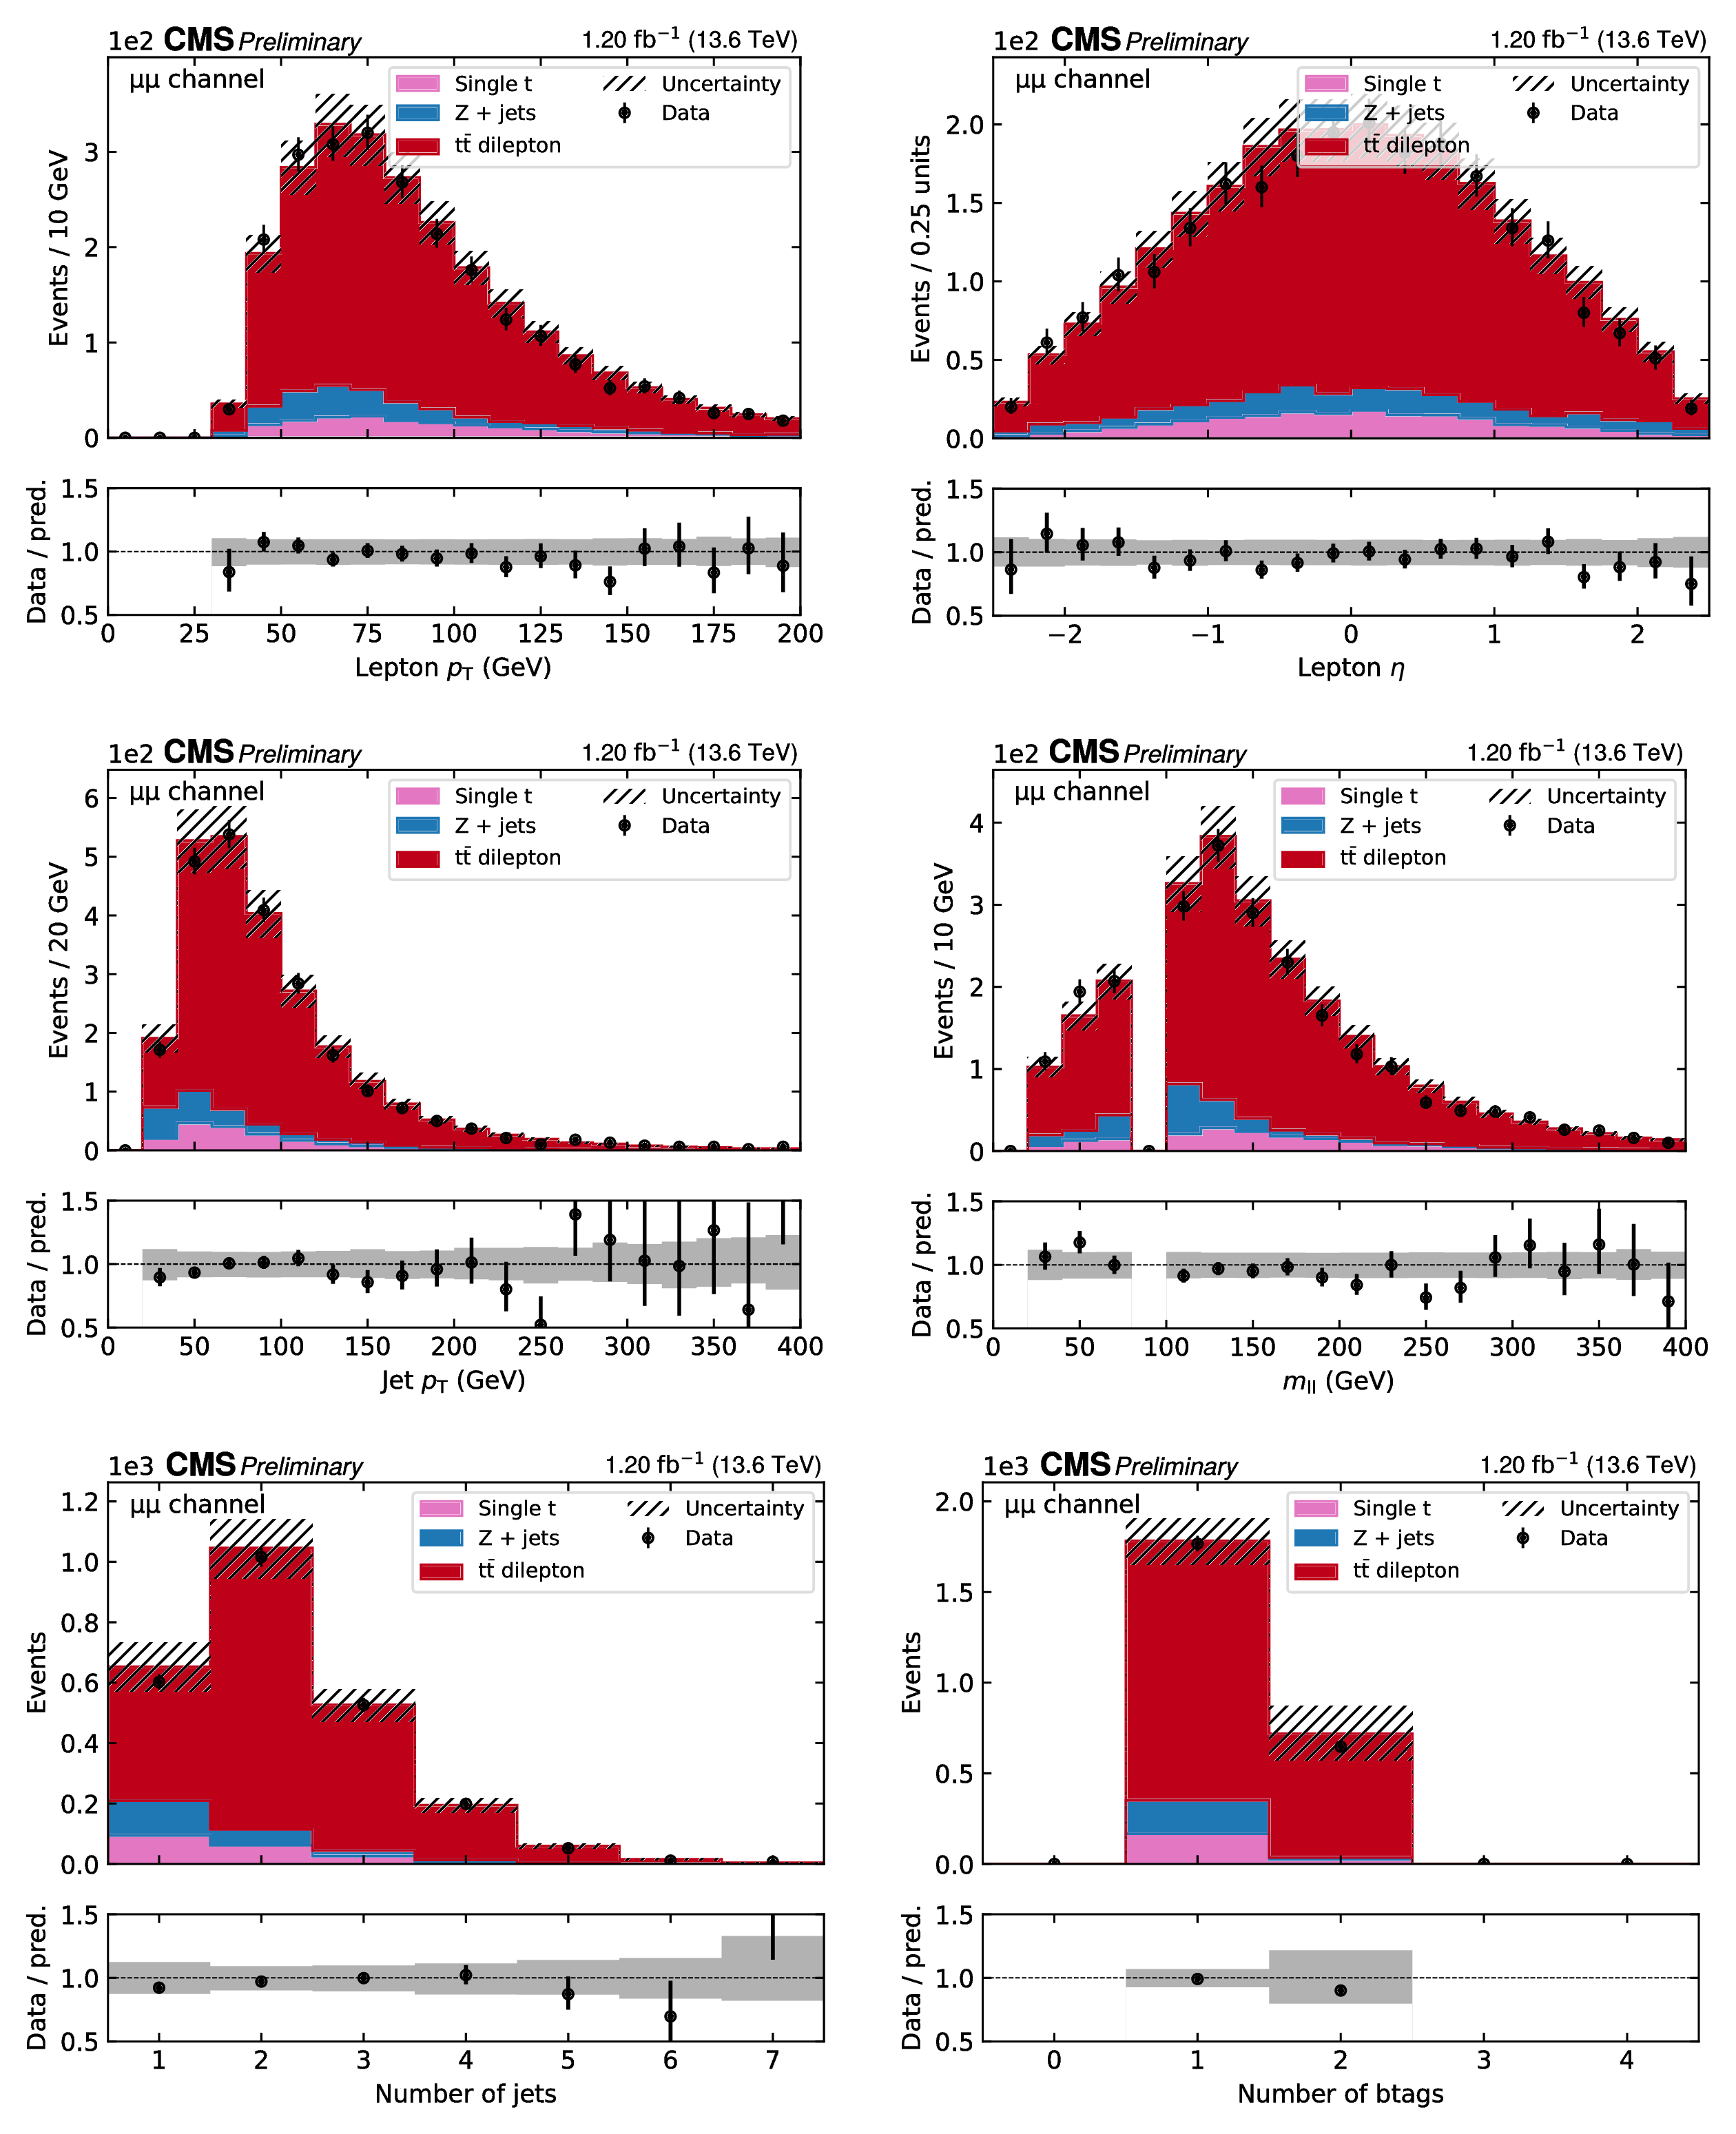
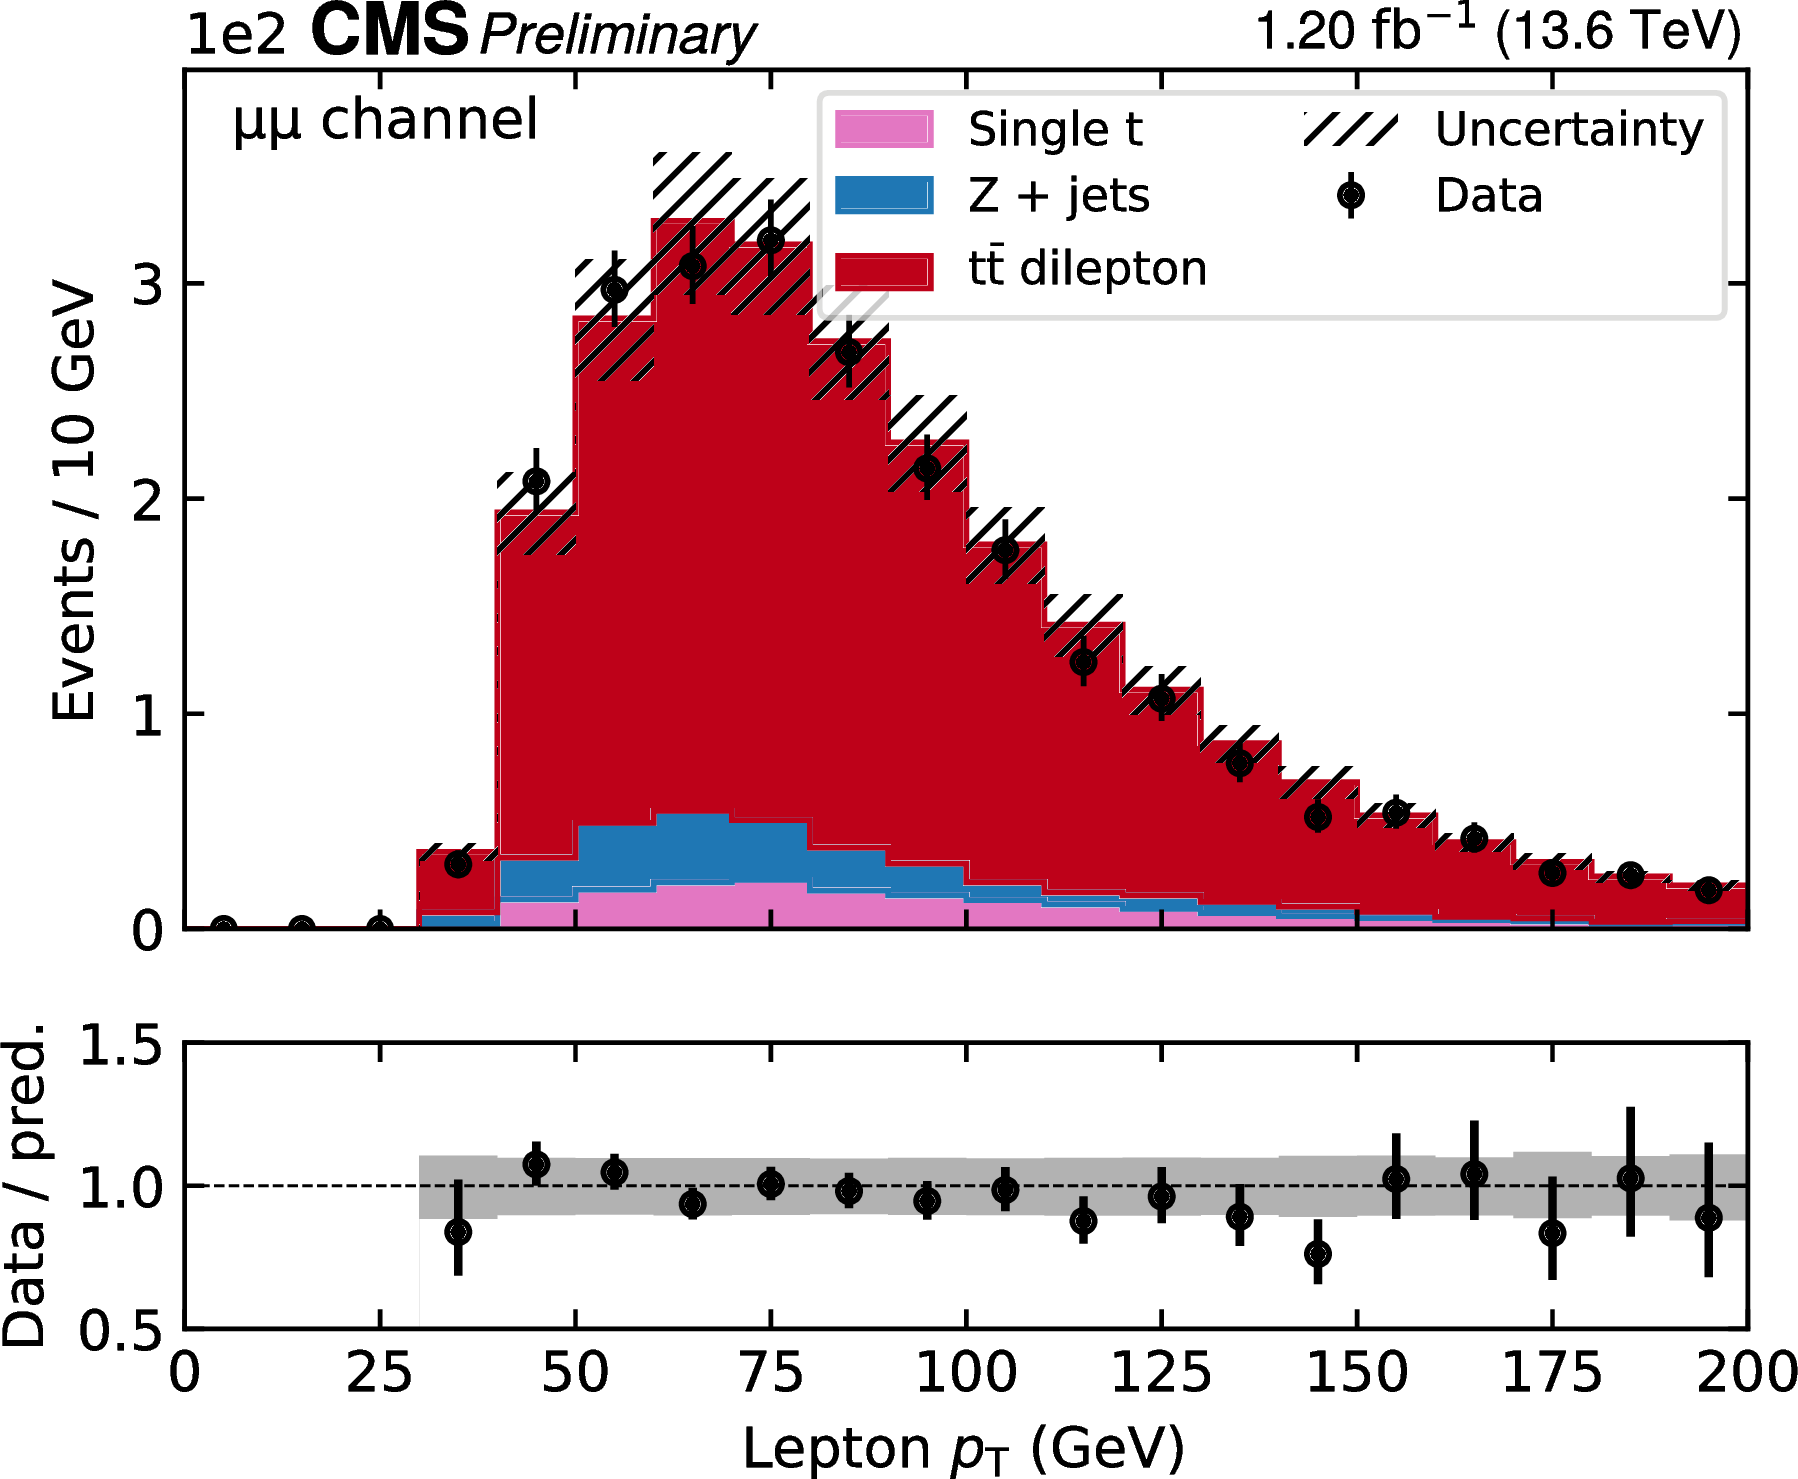
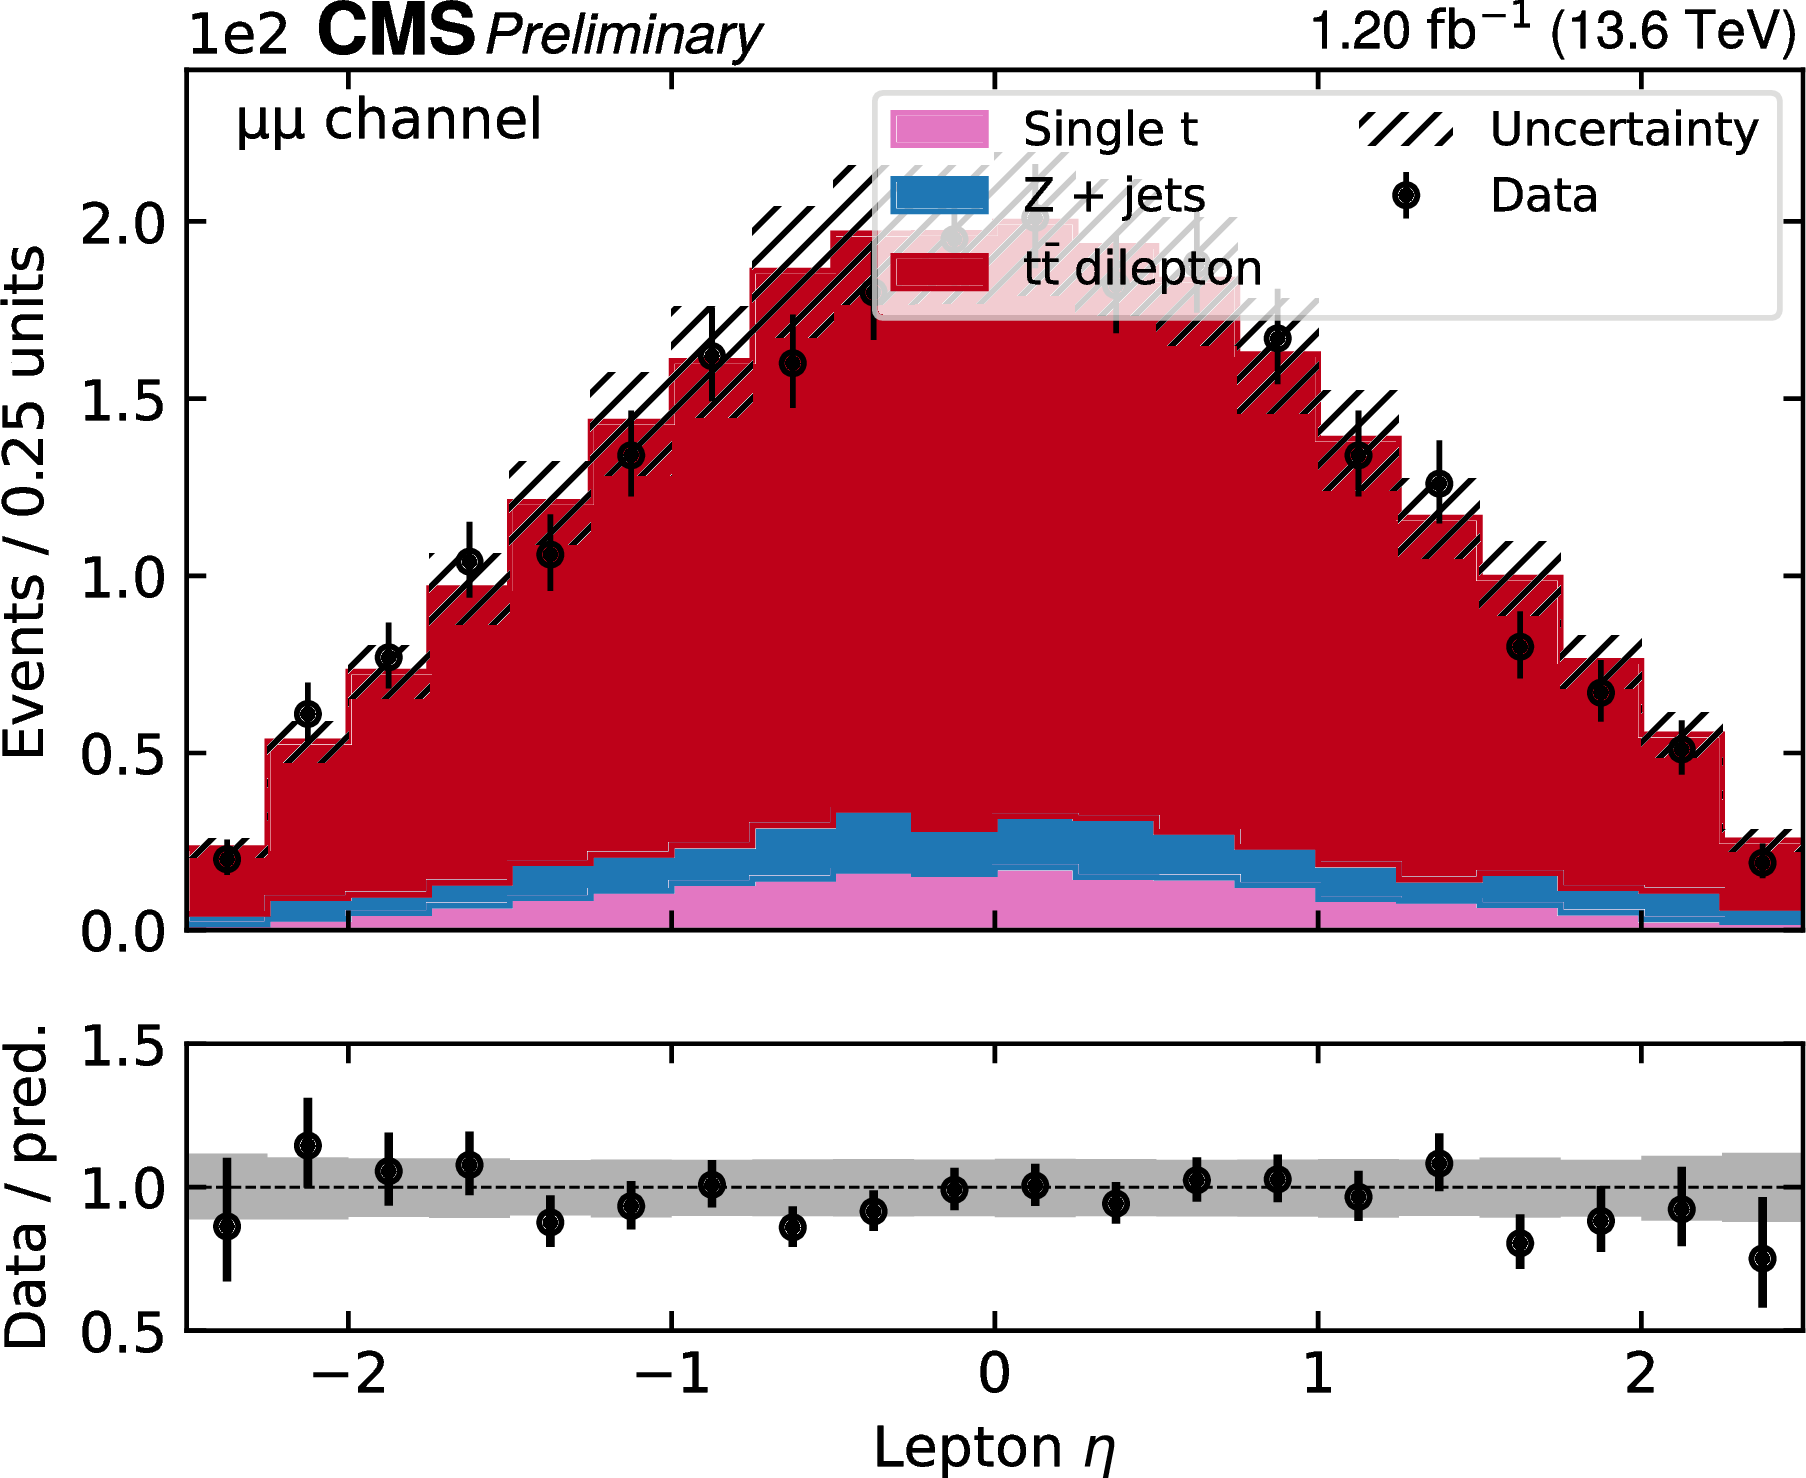
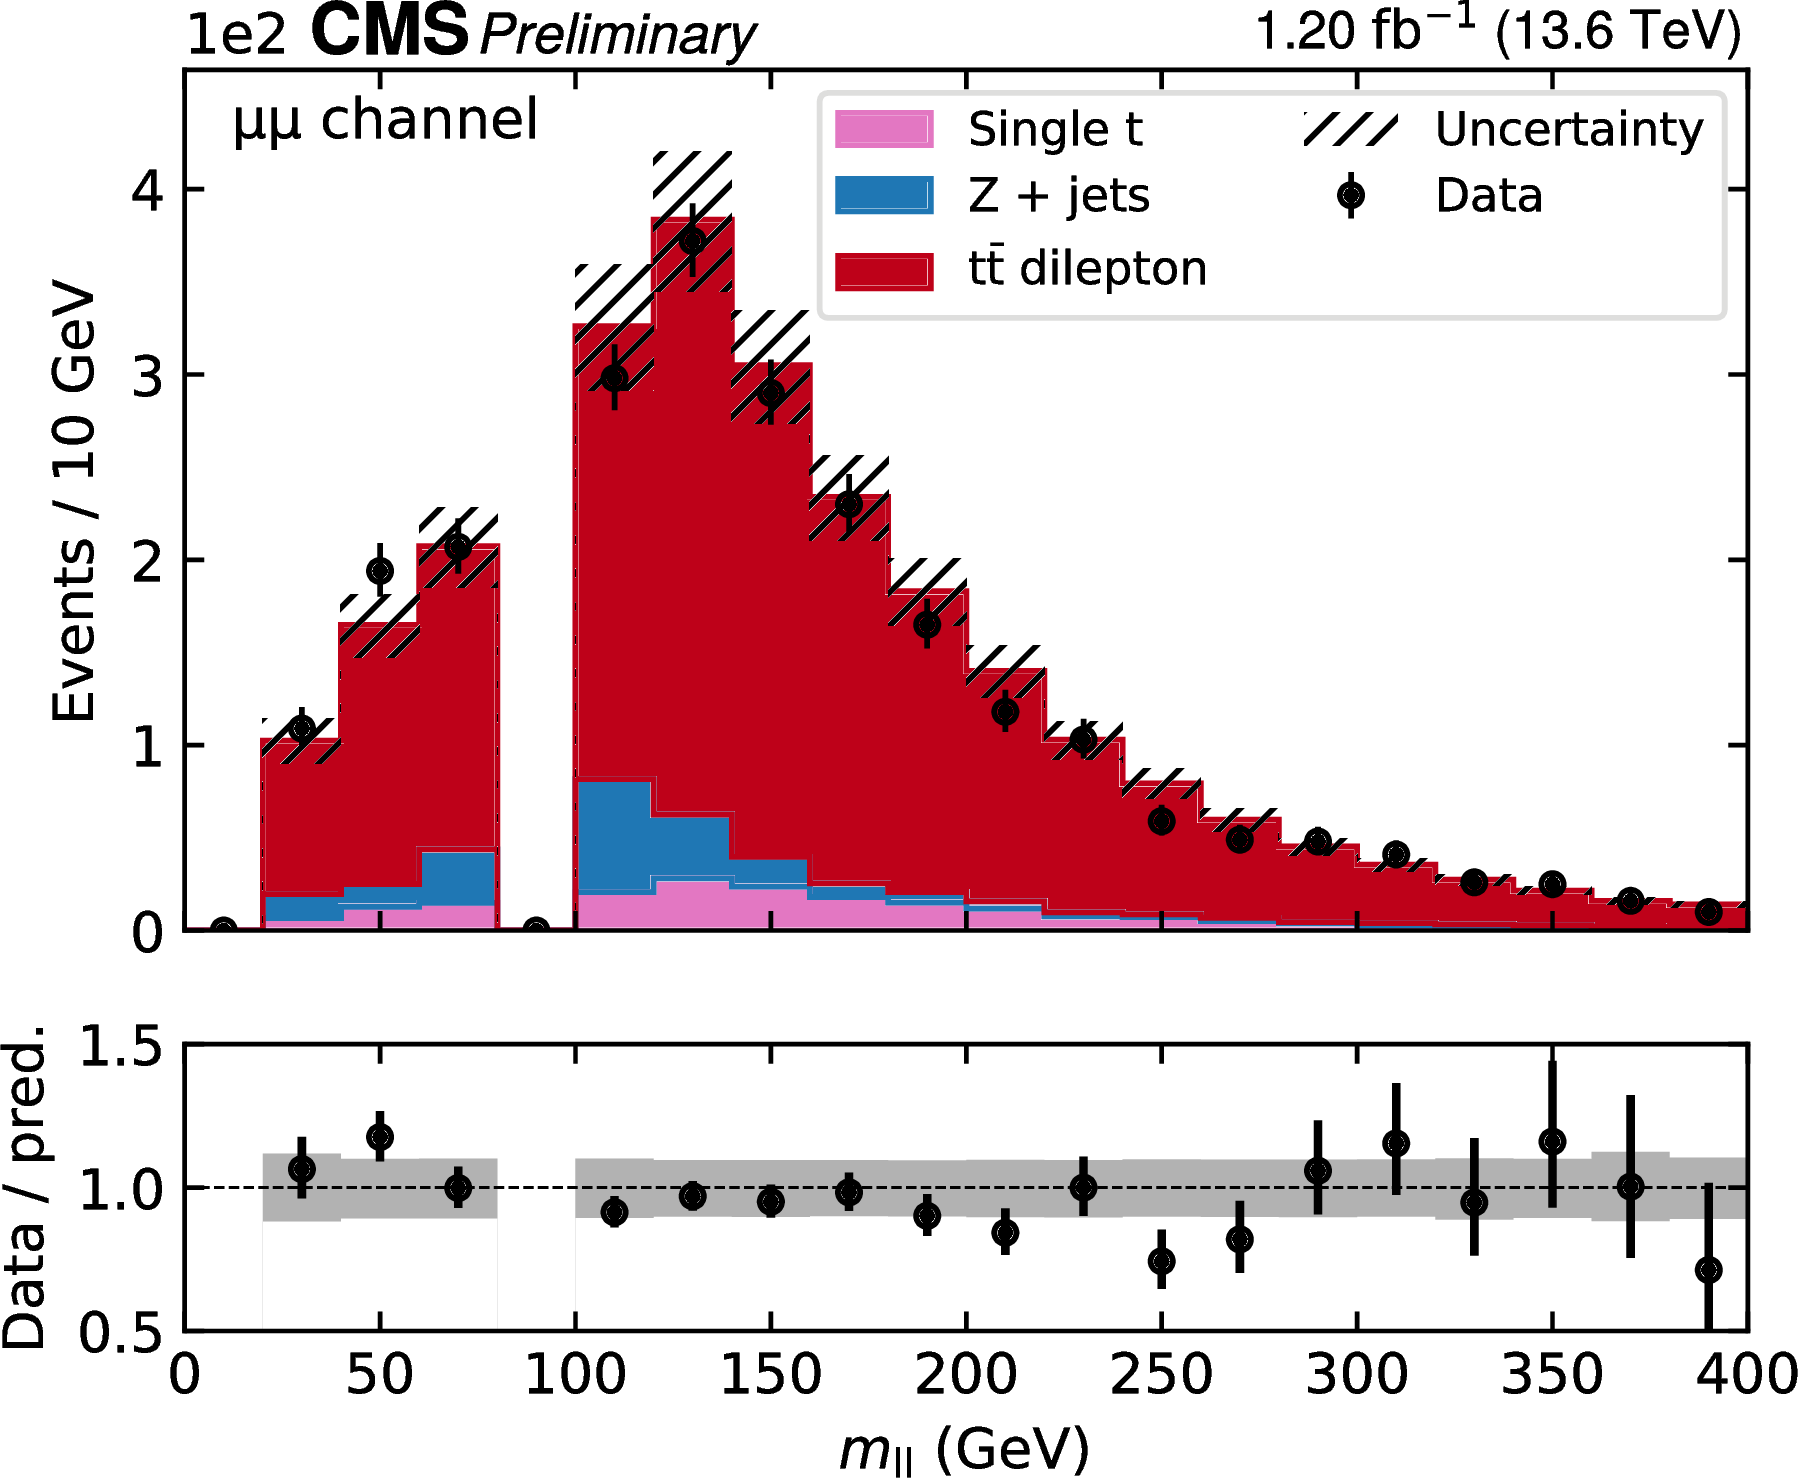
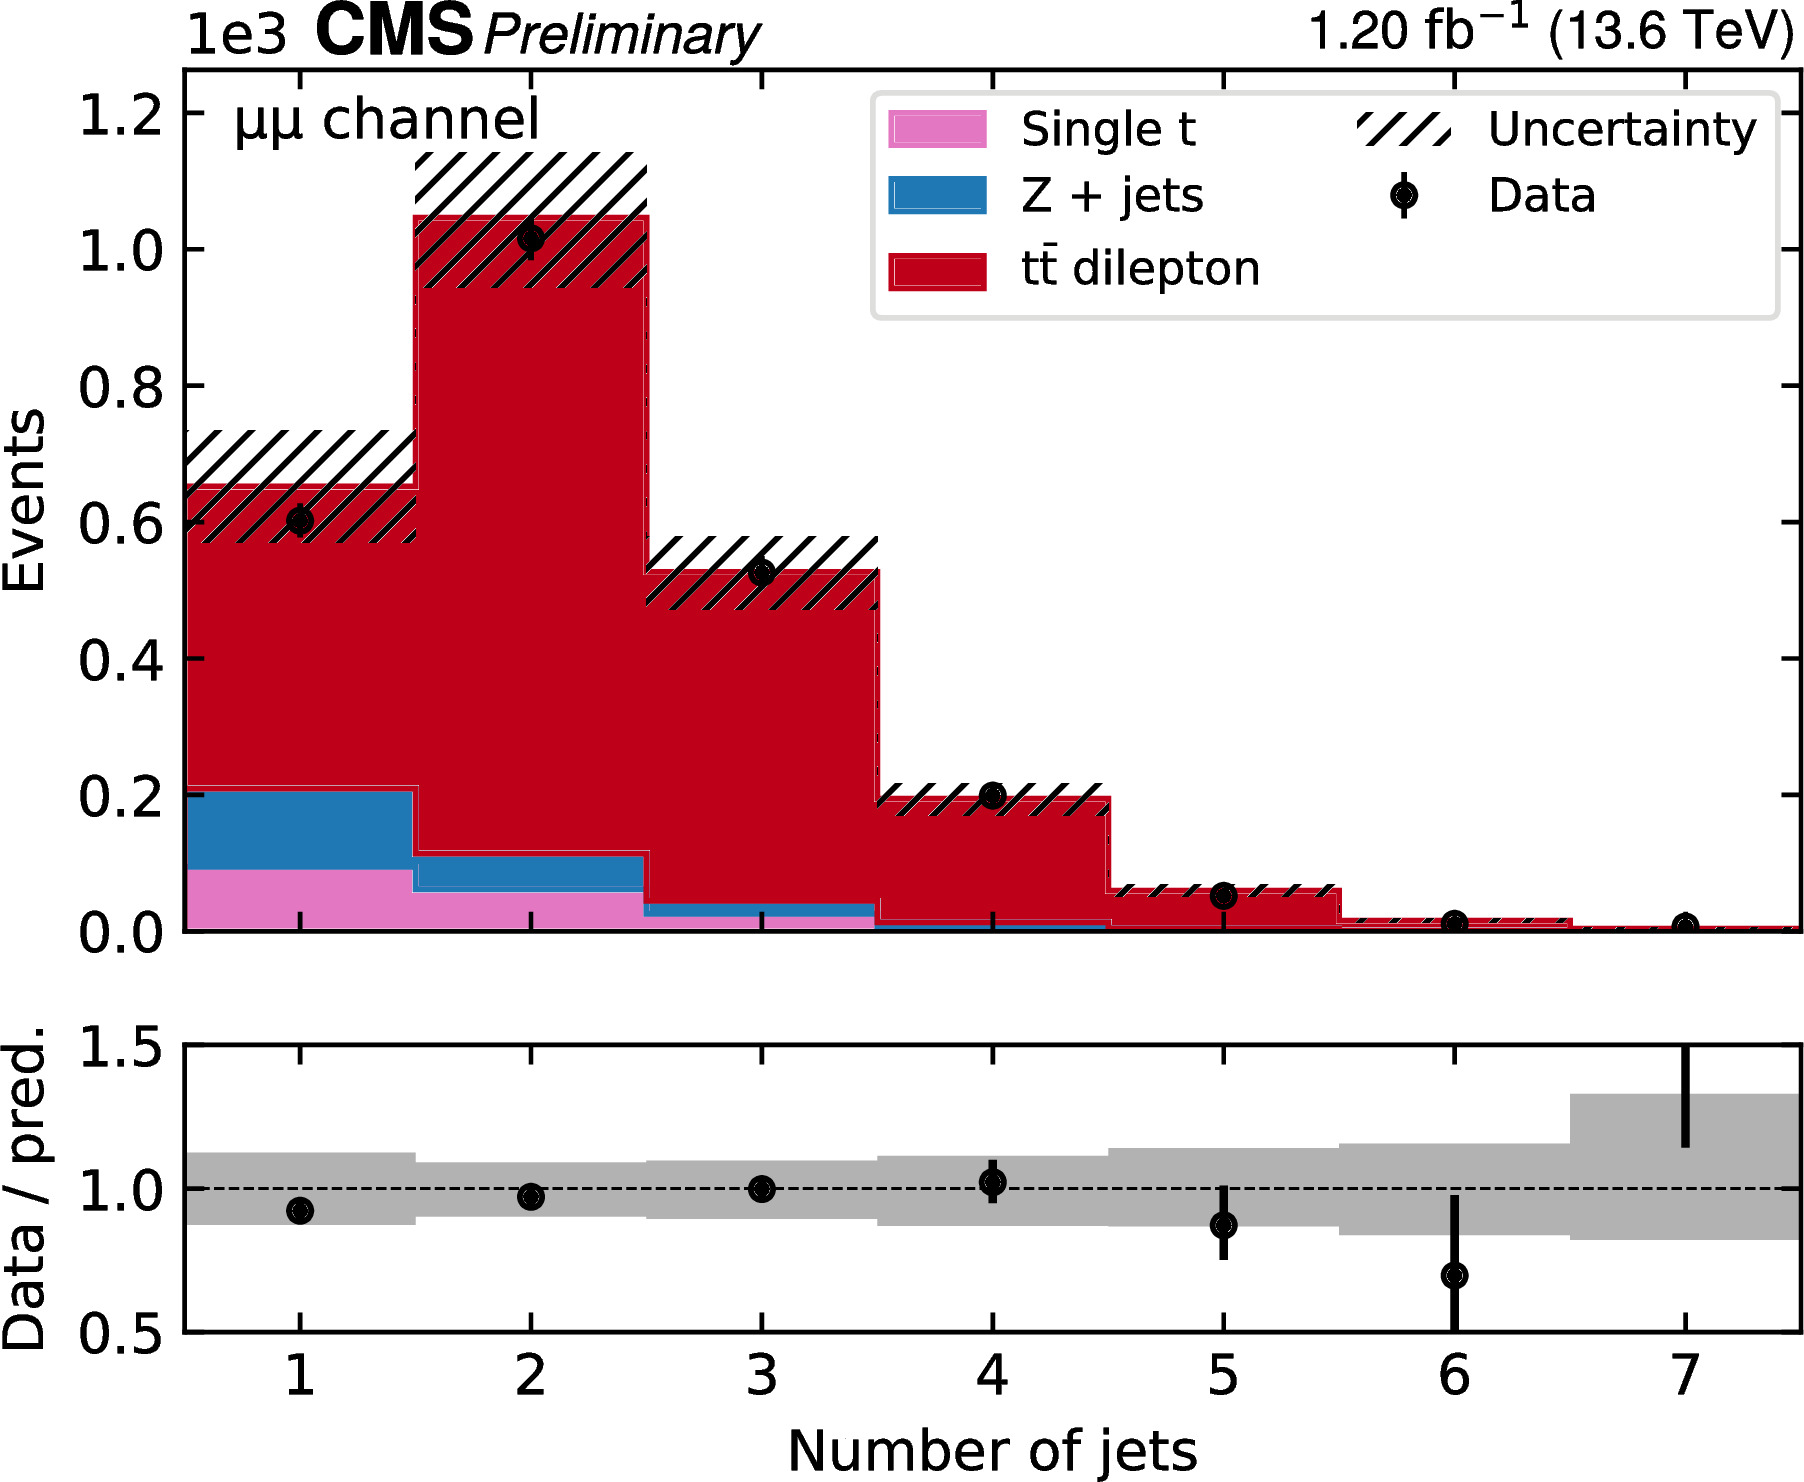
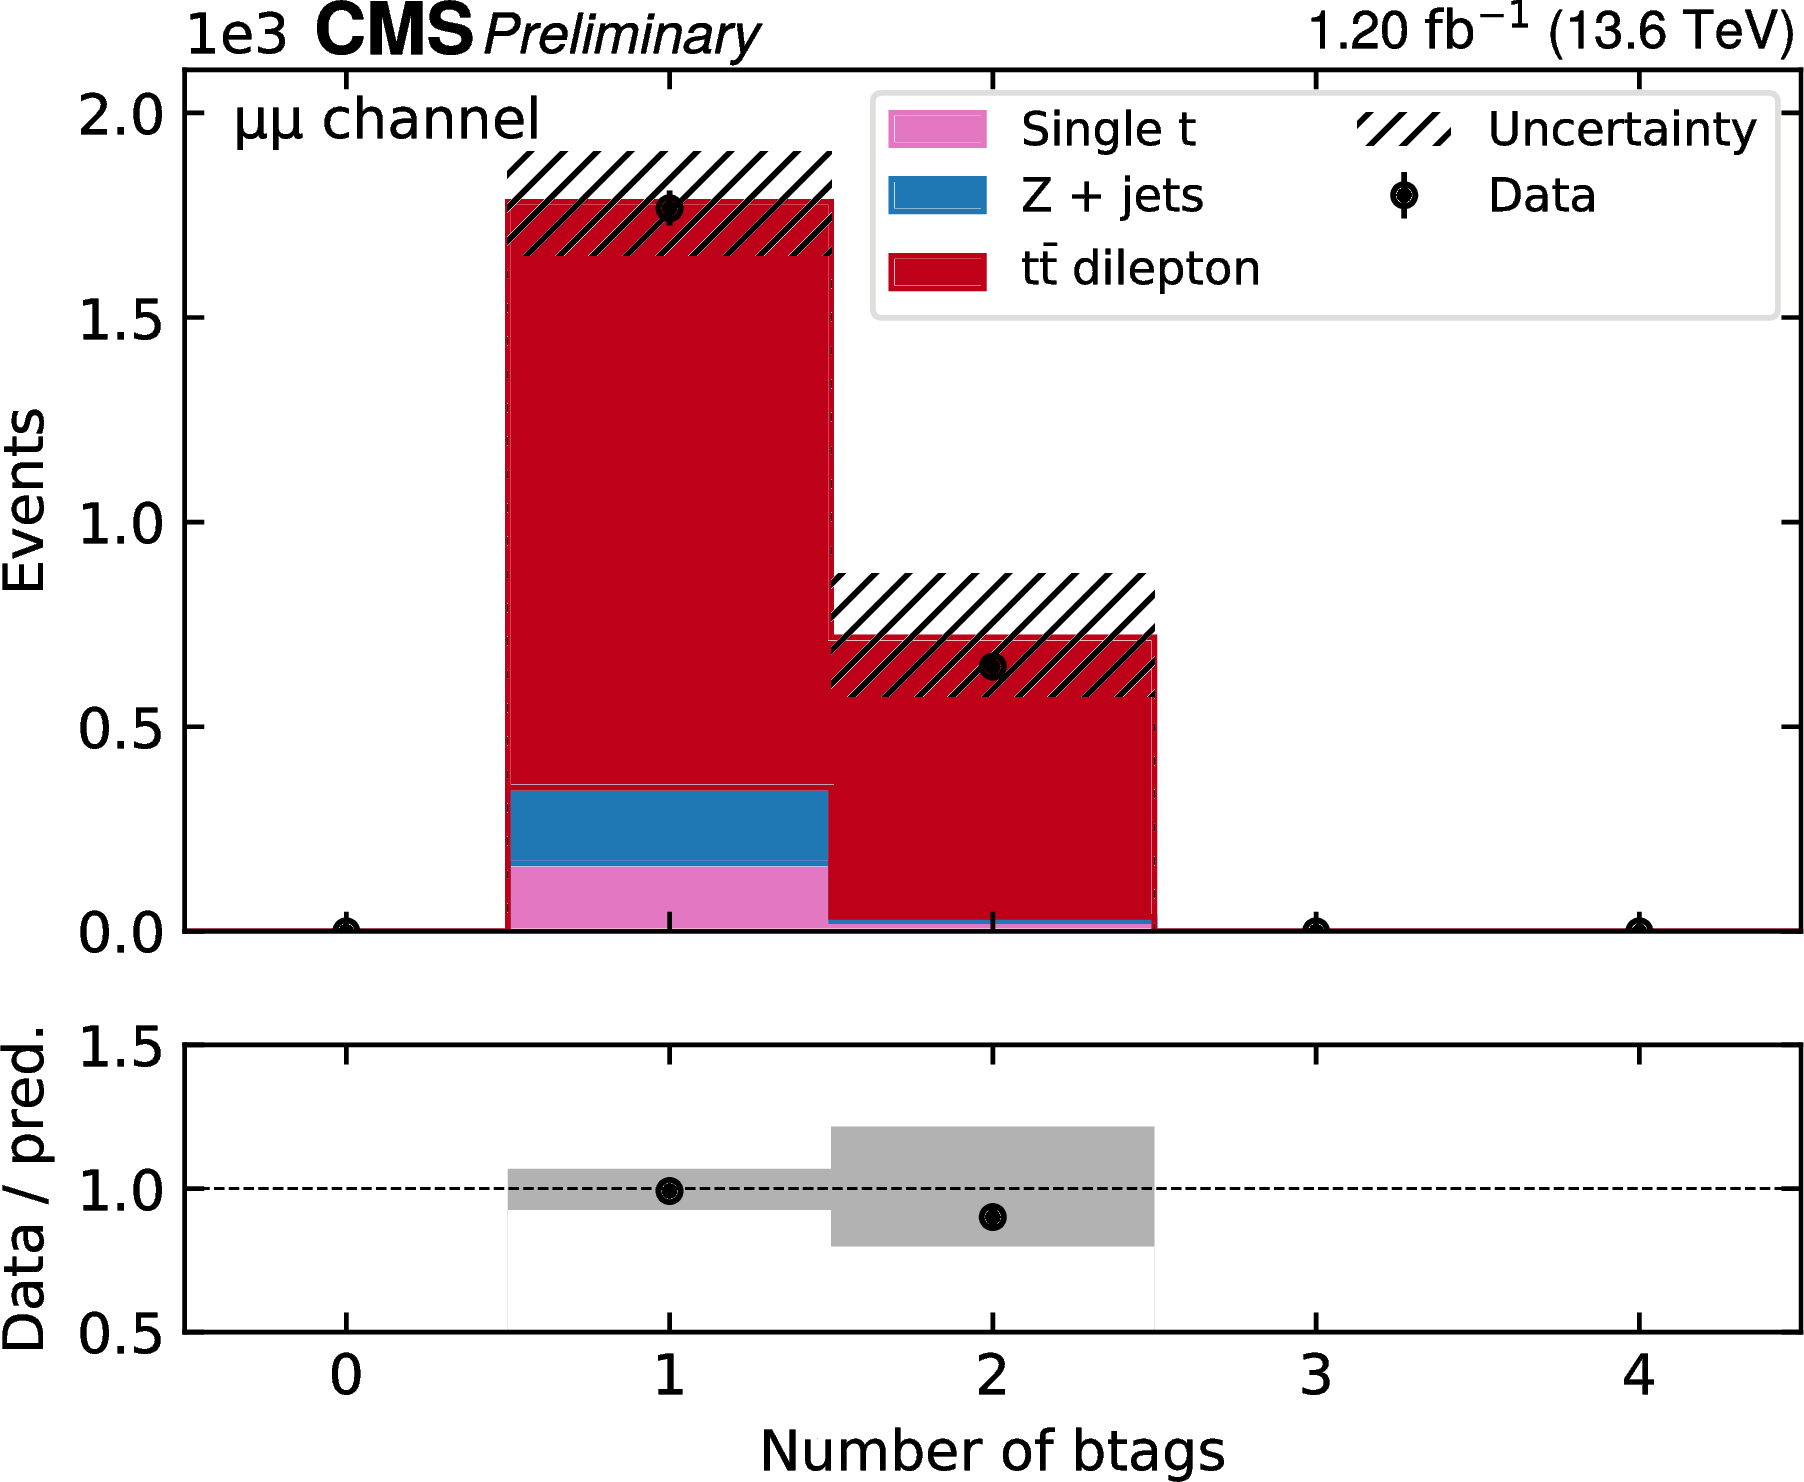
Figure 3:
Control plots in the $ \mu^{+}\mu^{-} $ channel. From upper left to lower right: leading lepton $ p_{\mathrm{T}} $ and $ \eta $, leading jet $ p_{\mathrm{T}} $, $ m_{\ell \ell} $, number of jets and b jets. The MC predictions are normalized using measured luminosity and theoretical cross sections, and are scaled by the lepton scale factors as obtained in the fit. The uncertainty bands include all experimental statistical and systematic uncertainties including the integrated luminosity, but excluding the lepton scale factors, which have flat prior probability density distributions. The lower panels show the ratio of the data to the MC simulation. |
png pdf |
Figure 3-a:
Control plots in the $ \mu^{+}\mu^{-} $ channel. From upper left to lower right: leading lepton $ p_{\mathrm{T}} $ and $ \eta $, leading jet $ p_{\mathrm{T}} $, $ m_{\ell \ell} $, number of jets and b jets. The MC predictions are normalized using measured luminosity and theoretical cross sections, and are scaled by the lepton scale factors as obtained in the fit. The uncertainty bands include all experimental statistical and systematic uncertainties including the integrated luminosity, but excluding the lepton scale factors, which have flat prior probability density distributions. The lower panels show the ratio of the data to the MC simulation. |
png pdf |
Figure 3-b:
Control plots in the $ \mu^{+}\mu^{-} $ channel. From upper left to lower right: leading lepton $ p_{\mathrm{T}} $ and $ \eta $, leading jet $ p_{\mathrm{T}} $, $ m_{\ell \ell} $, number of jets and b jets. The MC predictions are normalized using measured luminosity and theoretical cross sections, and are scaled by the lepton scale factors as obtained in the fit. The uncertainty bands include all experimental statistical and systematic uncertainties including the integrated luminosity, but excluding the lepton scale factors, which have flat prior probability density distributions. The lower panels show the ratio of the data to the MC simulation. |

png pdf |
Figure 3-c:
Control plots in the $ \mu^{+}\mu^{-} $ channel. From upper left to lower right: leading lepton $ p_{\mathrm{T}} $ and $ \eta $, leading jet $ p_{\mathrm{T}} $, $ m_{\ell \ell} $, number of jets and b jets. The MC predictions are normalized using measured luminosity and theoretical cross sections, and are scaled by the lepton scale factors as obtained in the fit. The uncertainty bands include all experimental statistical and systematic uncertainties including the integrated luminosity, but excluding the lepton scale factors, which have flat prior probability density distributions. The lower panels show the ratio of the data to the MC simulation. |
png pdf |
Figure 3-d:
Control plots in the $ \mu^{+}\mu^{-} $ channel. From upper left to lower right: leading lepton $ p_{\mathrm{T}} $ and $ \eta $, leading jet $ p_{\mathrm{T}} $, $ m_{\ell \ell} $, number of jets and b jets. The MC predictions are normalized using measured luminosity and theoretical cross sections, and are scaled by the lepton scale factors as obtained in the fit. The uncertainty bands include all experimental statistical and systematic uncertainties including the integrated luminosity, but excluding the lepton scale factors, which have flat prior probability density distributions. The lower panels show the ratio of the data to the MC simulation. |
png pdf |
Figure 3-e:
Control plots in the $ \mu^{+}\mu^{-} $ channel. From upper left to lower right: leading lepton $ p_{\mathrm{T}} $ and $ \eta $, leading jet $ p_{\mathrm{T}} $, $ m_{\ell \ell} $, number of jets and b jets. The MC predictions are normalized using measured luminosity and theoretical cross sections, and are scaled by the lepton scale factors as obtained in the fit. The uncertainty bands include all experimental statistical and systematic uncertainties including the integrated luminosity, but excluding the lepton scale factors, which have flat prior probability density distributions. The lower panels show the ratio of the data to the MC simulation. |
png pdf |
Figure 3-f:
Control plots in the $ \mu^{+}\mu^{-} $ channel. From upper left to lower right: leading lepton $ p_{\mathrm{T}} $ and $ \eta $, leading jet $ p_{\mathrm{T}} $, $ m_{\ell \ell} $, number of jets and b jets. The MC predictions are normalized using measured luminosity and theoretical cross sections, and are scaled by the lepton scale factors as obtained in the fit. The uncertainty bands include all experimental statistical and systematic uncertainties including the integrated luminosity, but excluding the lepton scale factors, which have flat prior probability density distributions. The lower panels show the ratio of the data to the MC simulation. |
png pdf |
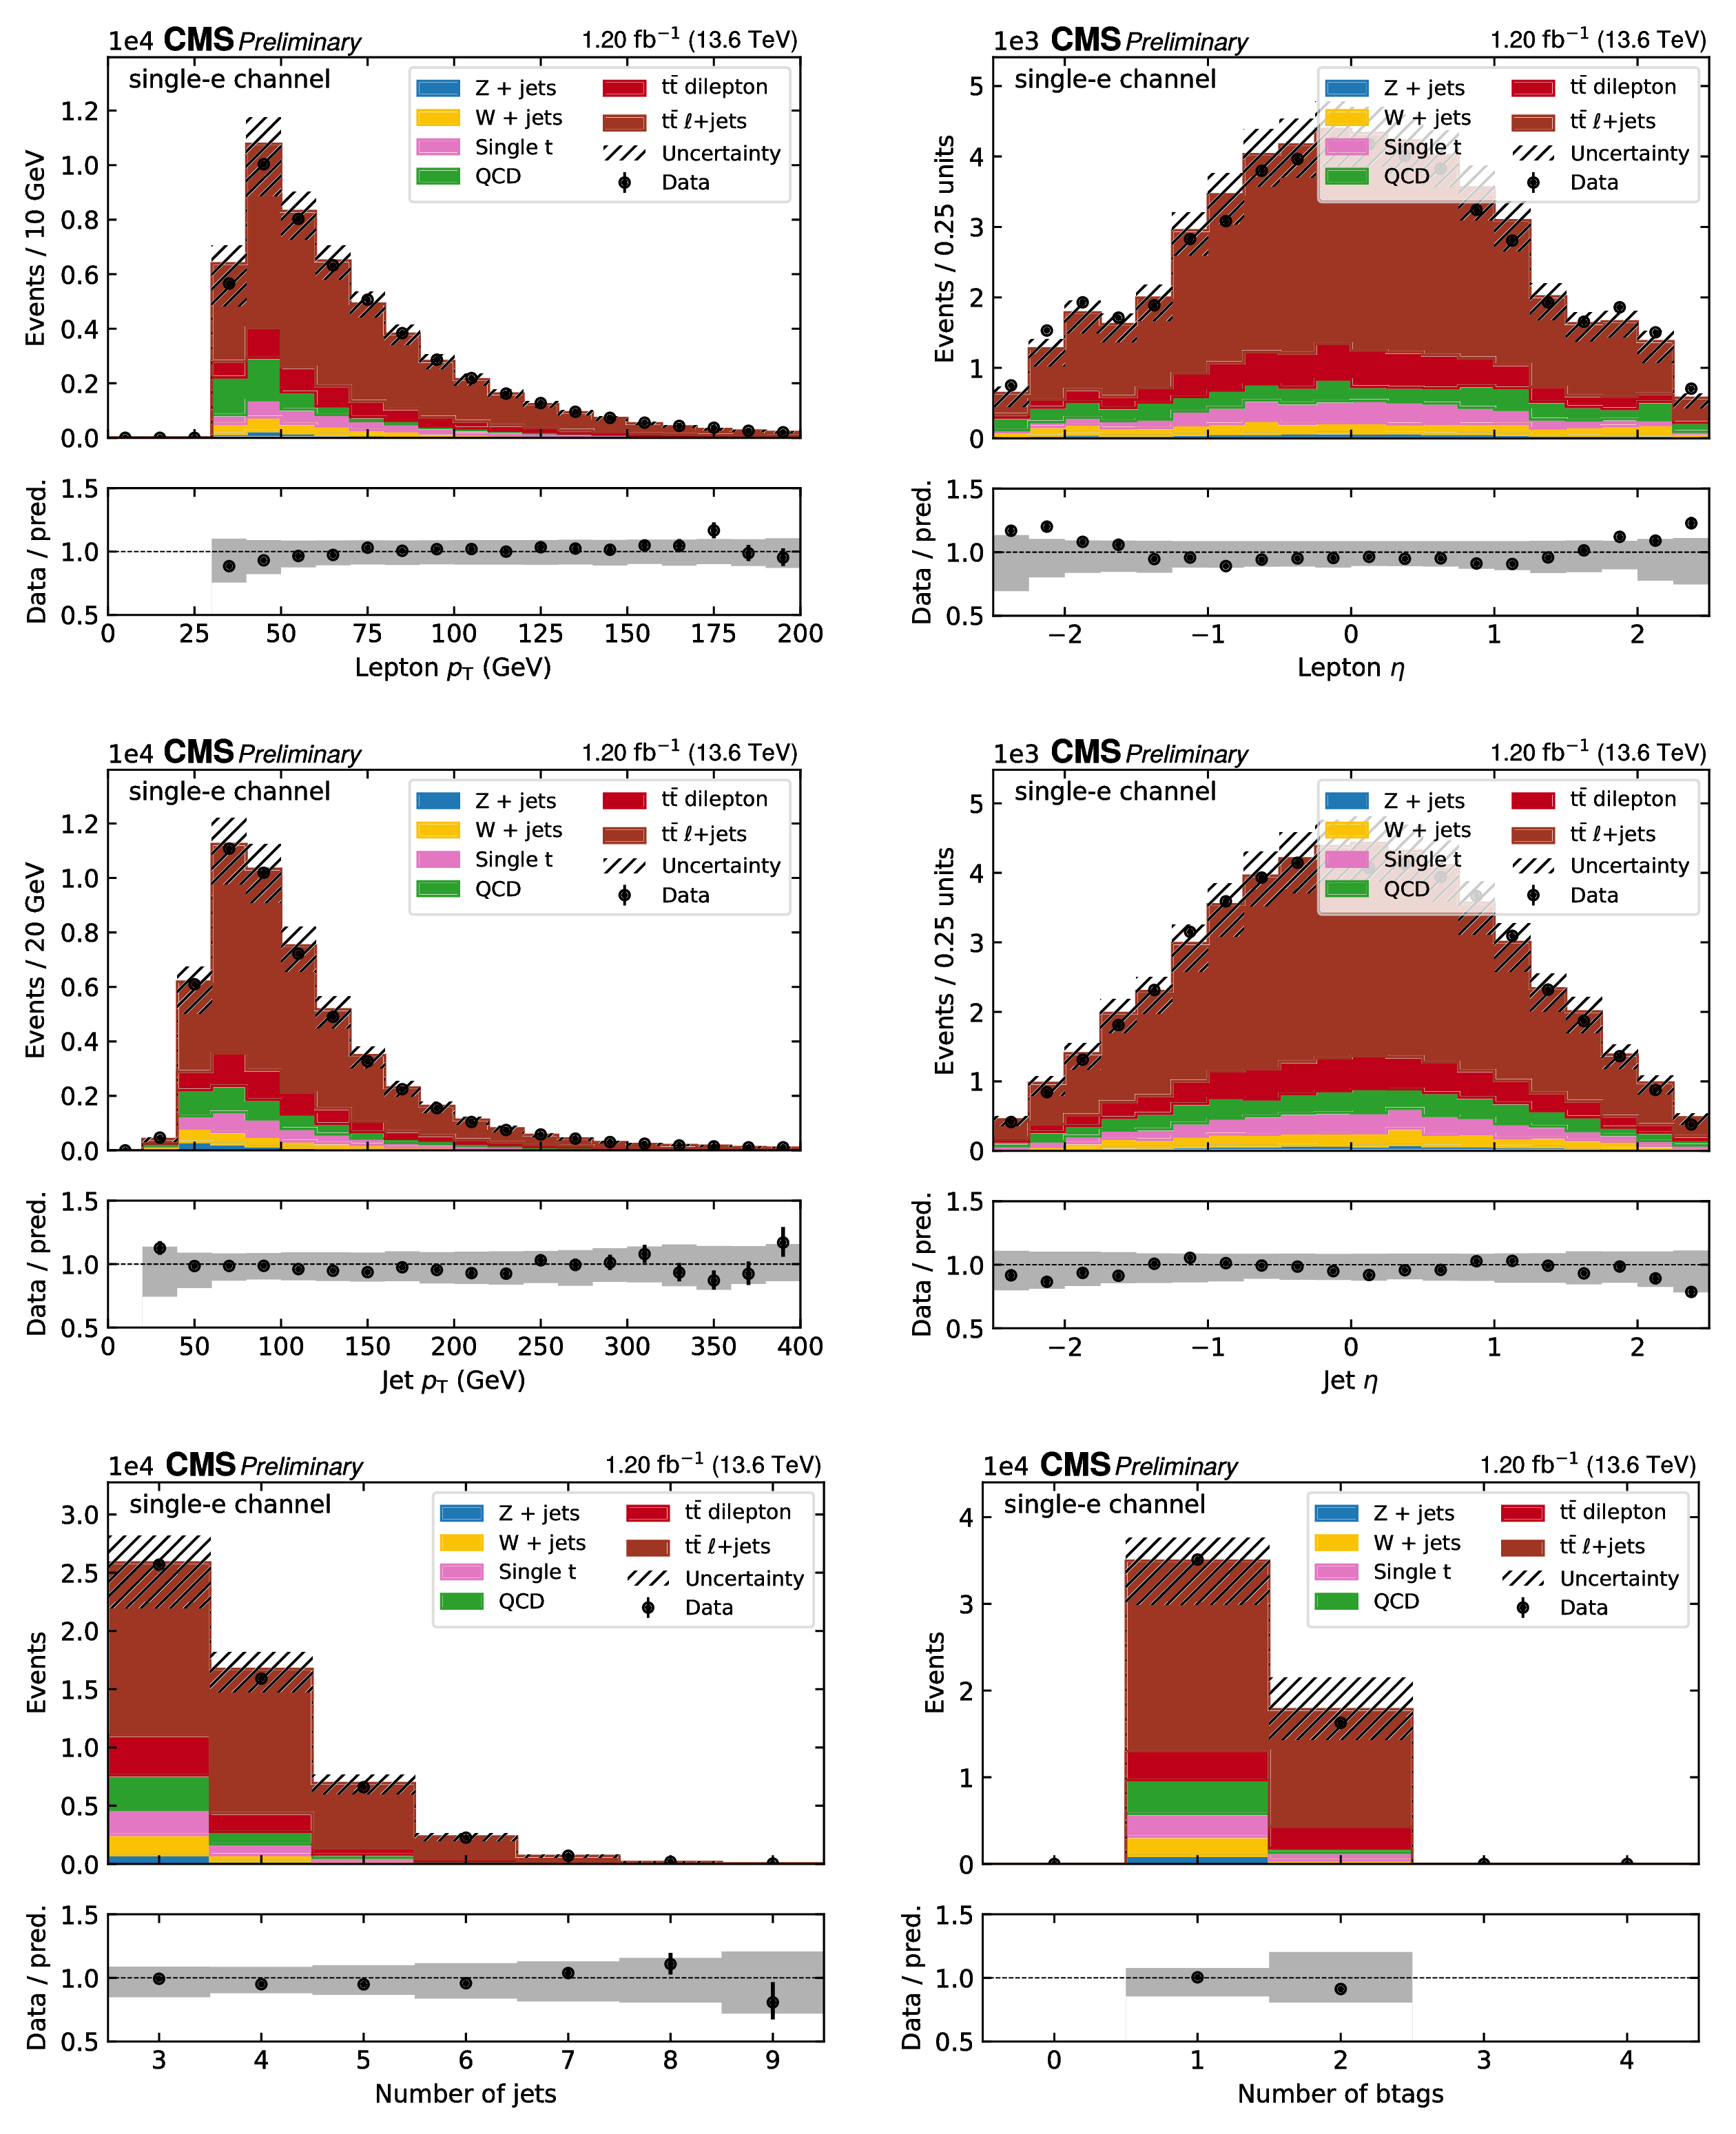
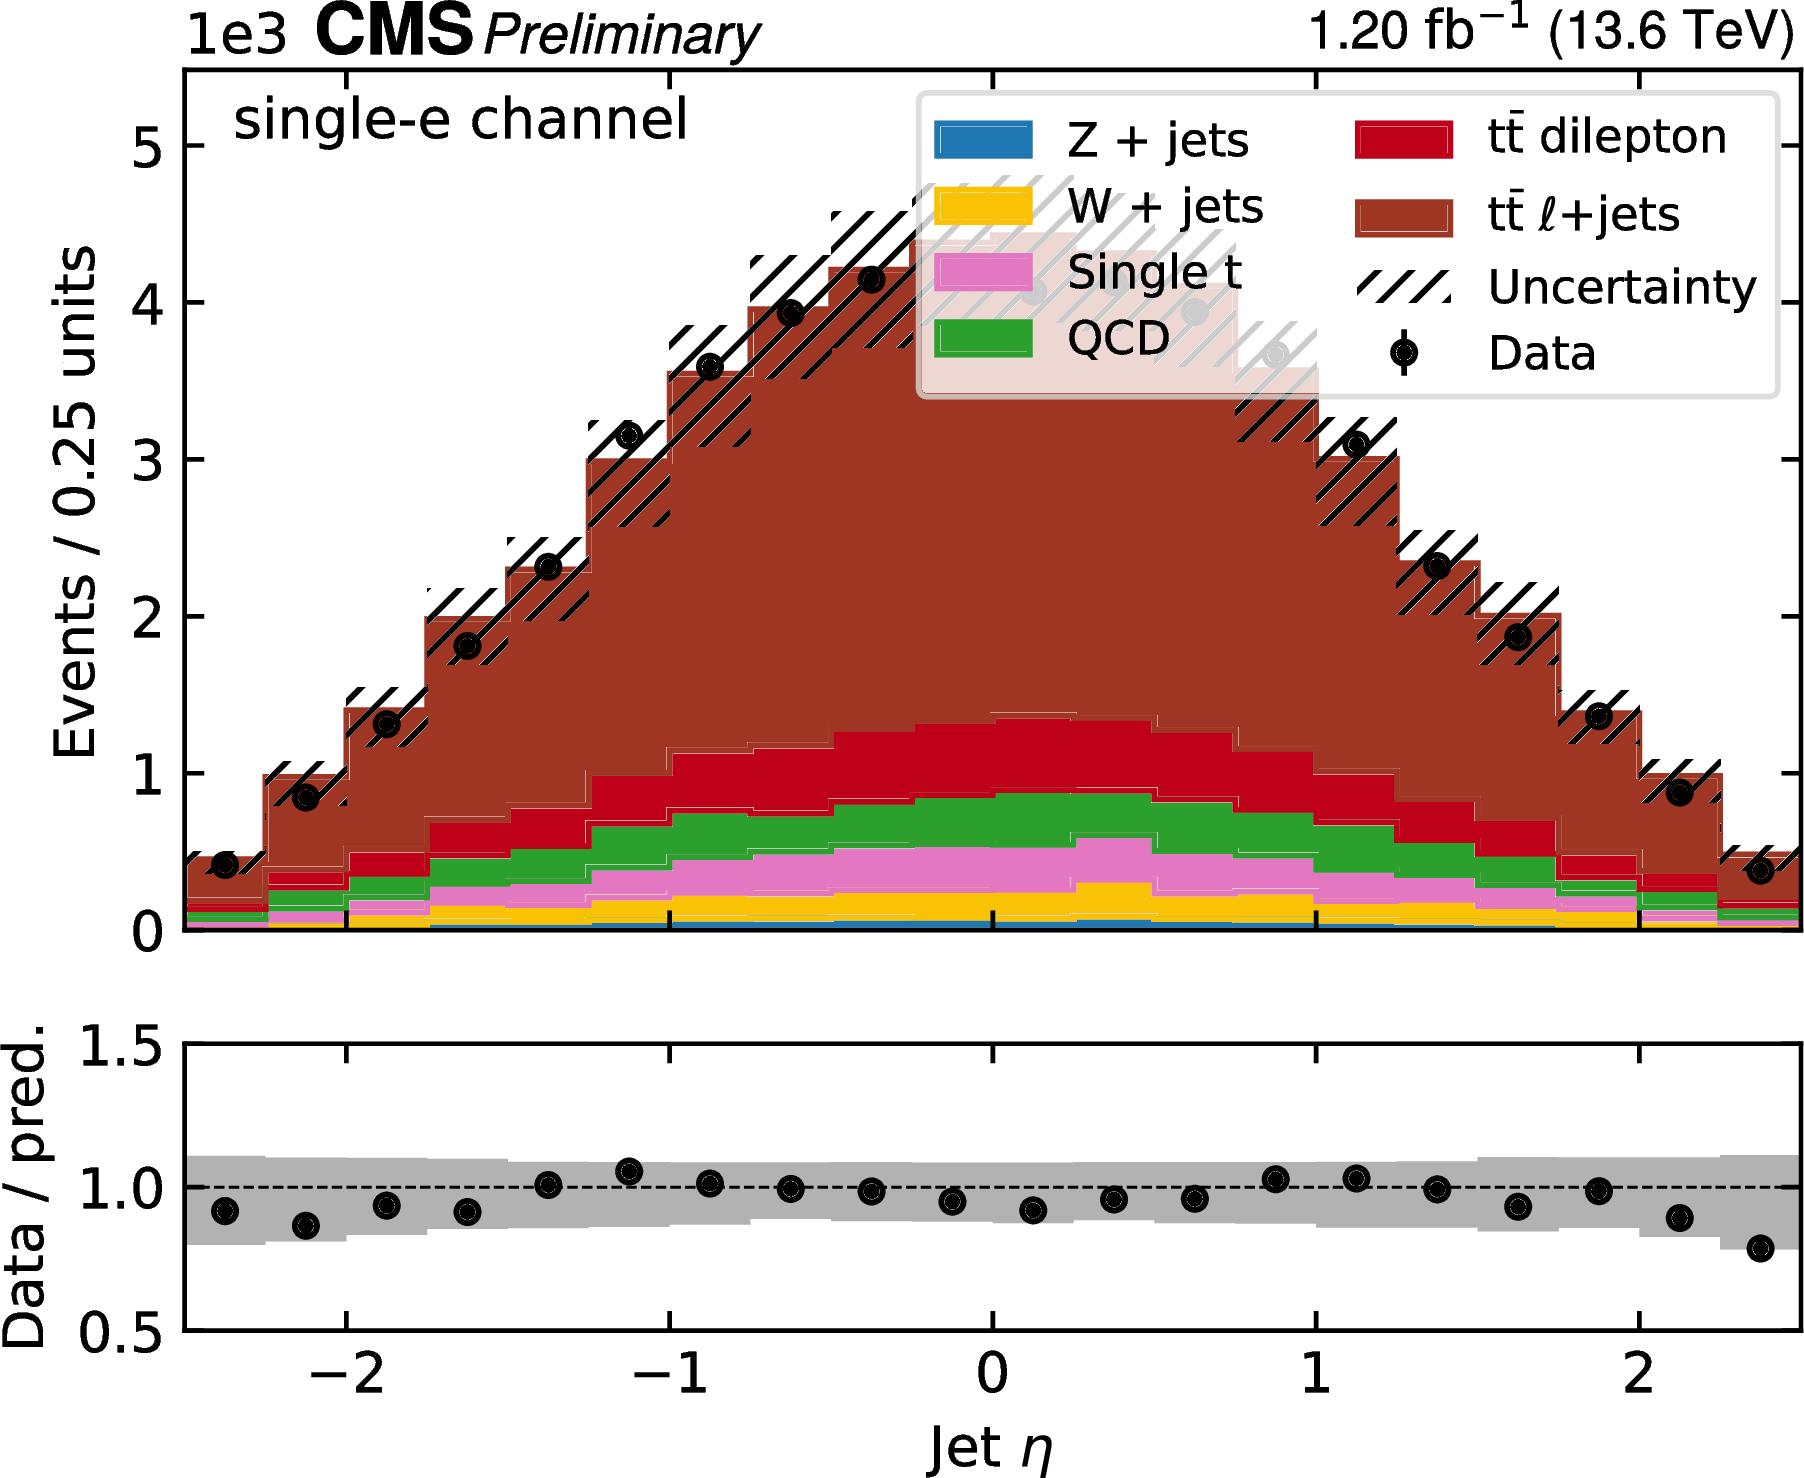
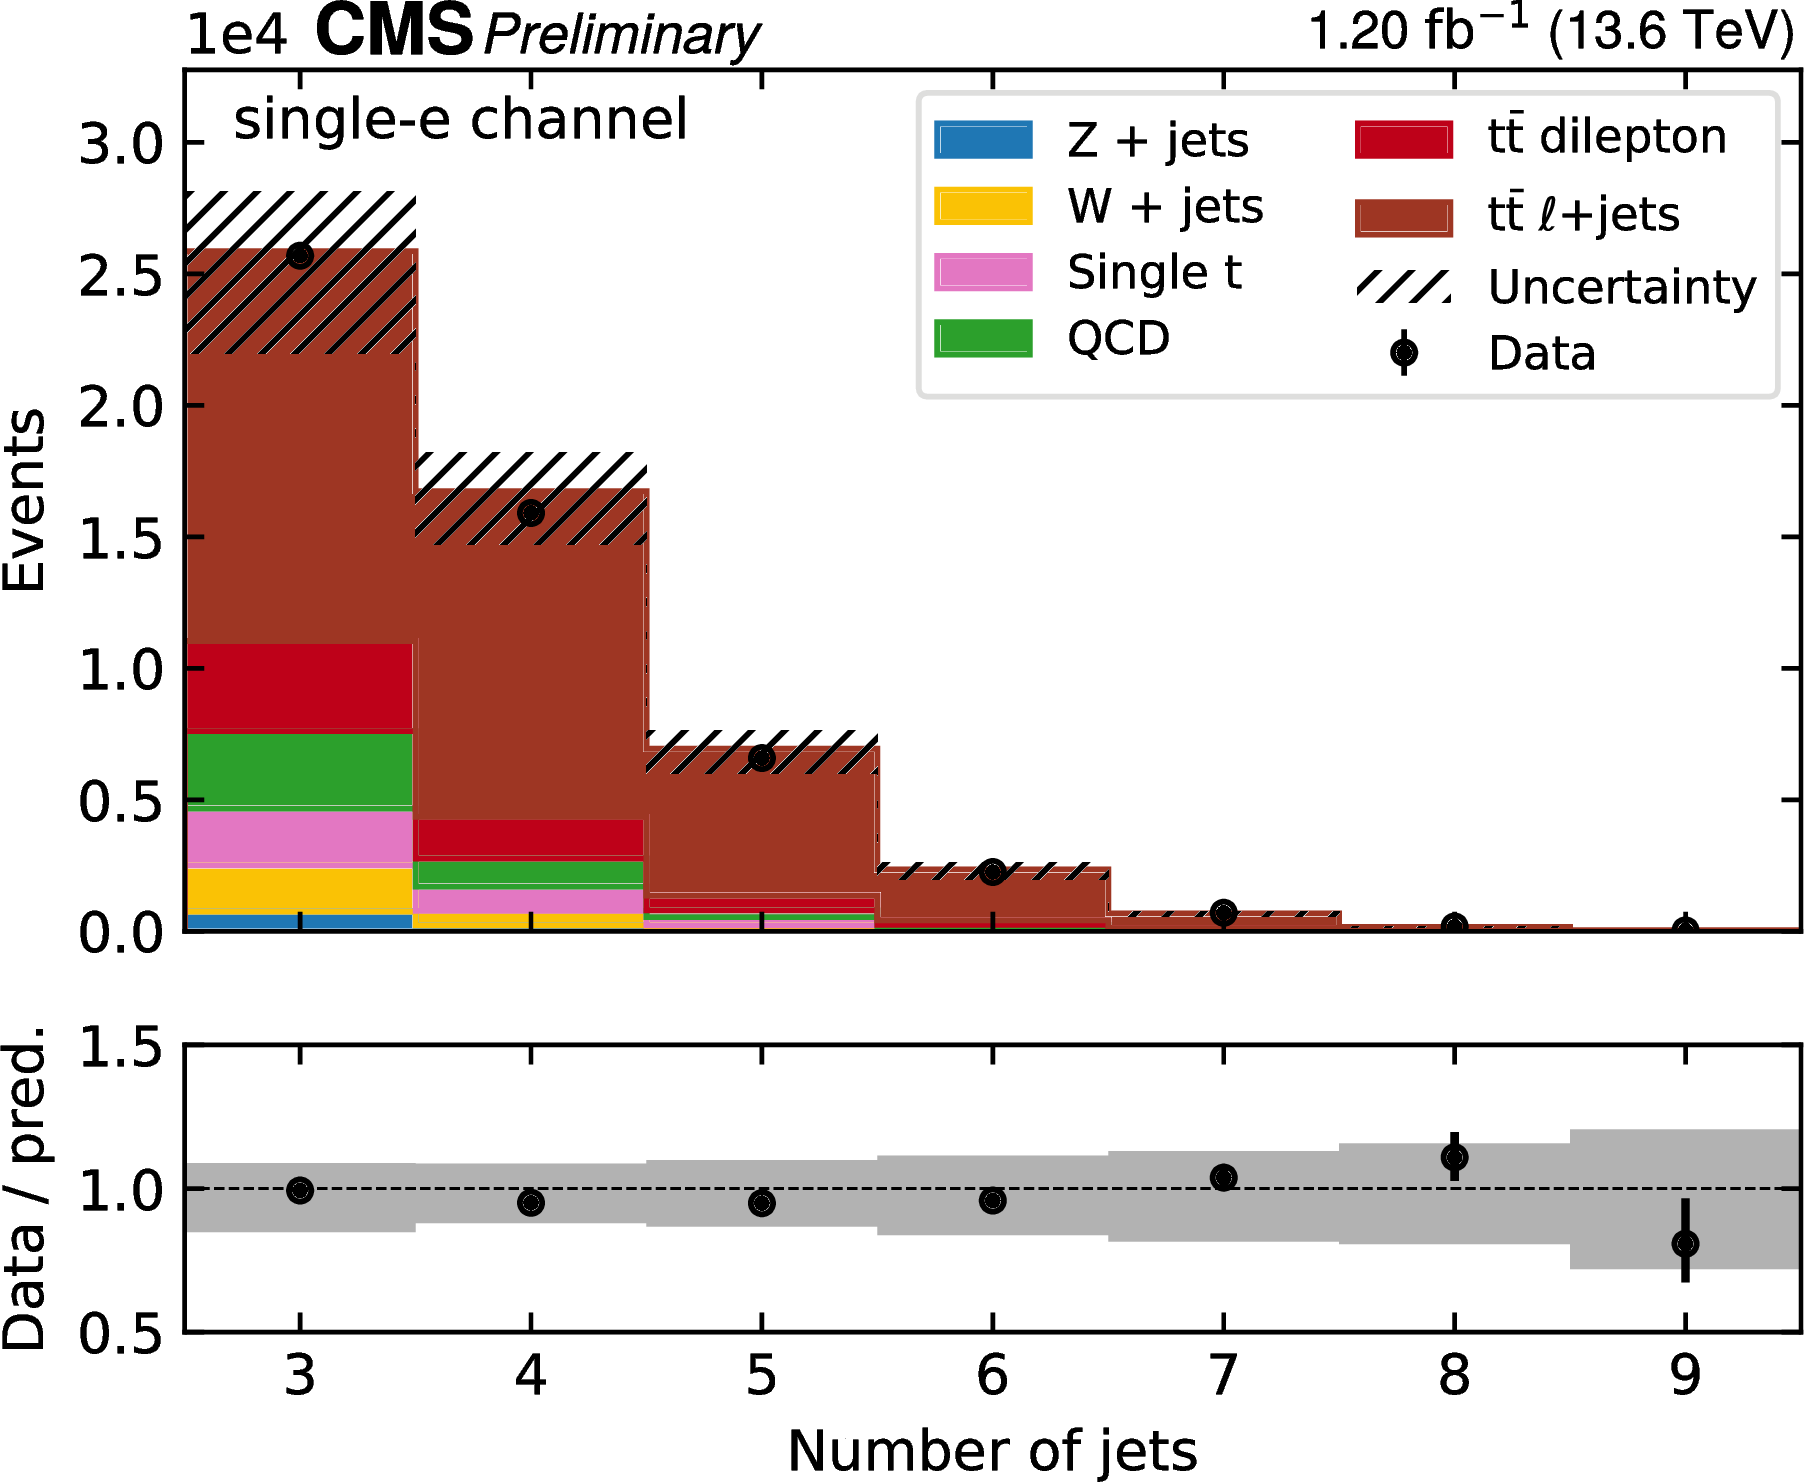
Figure 4:
Control plots in the e+jets channel. From upper left to lower right: lepton $ p_{\mathrm{T}} $ and $ \eta $, leading jet $ p_{\mathrm{T}} $ and $ \eta $, number of jets and b jets. The MC predictions are normalized using measured luminosity and theoretical cross sections, and are scaled by the lepton scale factors as obtained in the fit. The uncertainty bands include all experimental statistical and systematic uncertainties including the integrated luminosity, but excluding the lepton scale factors, which have flat prior probability density distributions. The lower panels show the ratio of the data to the MC simulation. |
png pdf |
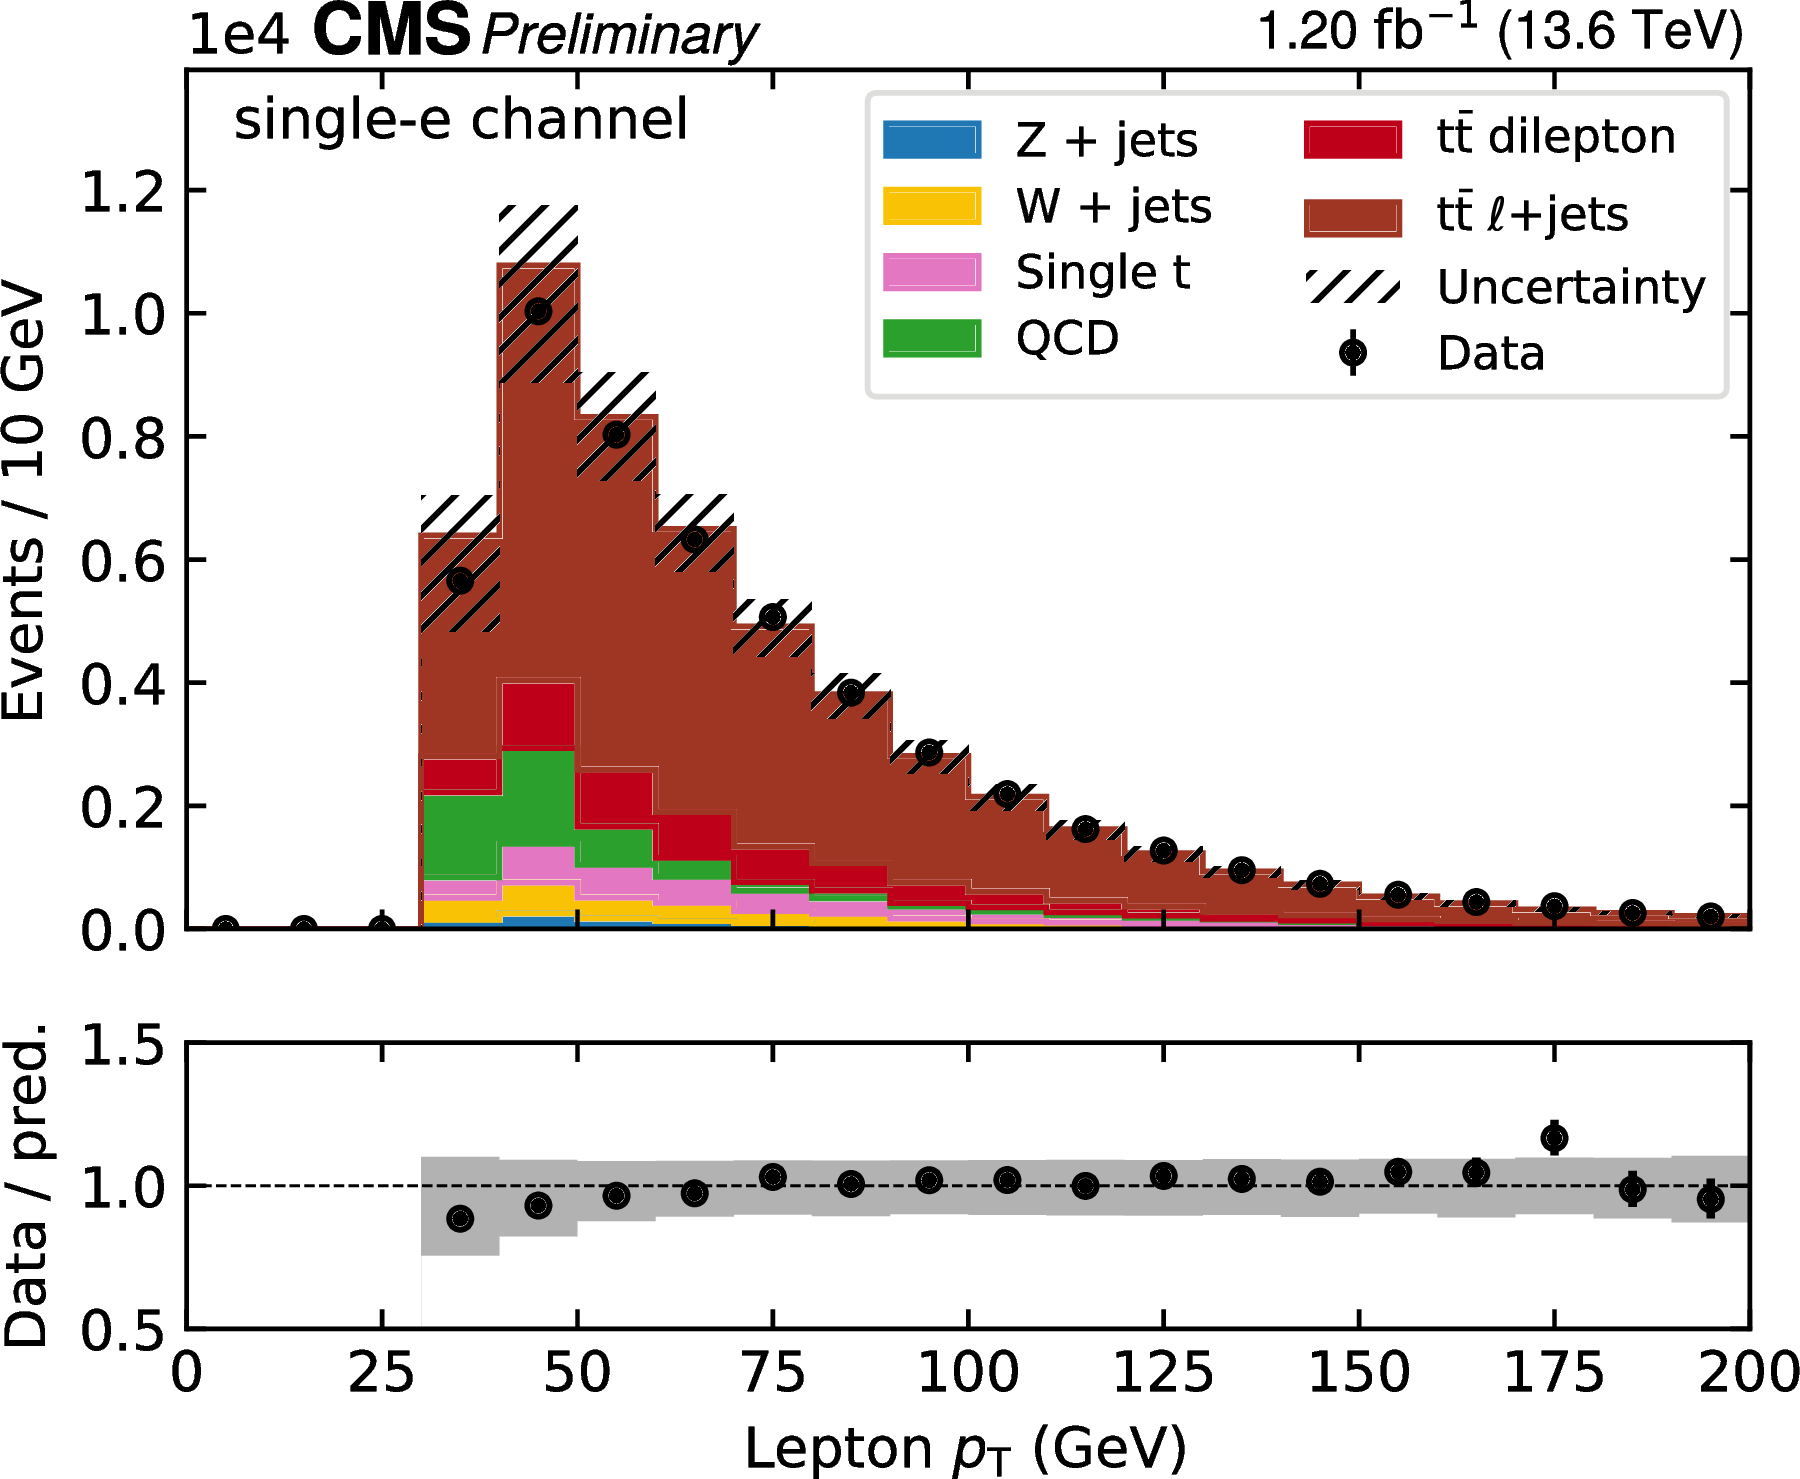
Figure 4-a:
Control plots in the e+jets channel. From upper left to lower right: lepton $ p_{\mathrm{T}} $ and $ \eta $, leading jet $ p_{\mathrm{T}} $ and $ \eta $, number of jets and b jets. The MC predictions are normalized using measured luminosity and theoretical cross sections, and are scaled by the lepton scale factors as obtained in the fit. The uncertainty bands include all experimental statistical and systematic uncertainties including the integrated luminosity, but excluding the lepton scale factors, which have flat prior probability density distributions. The lower panels show the ratio of the data to the MC simulation. |
png pdf |
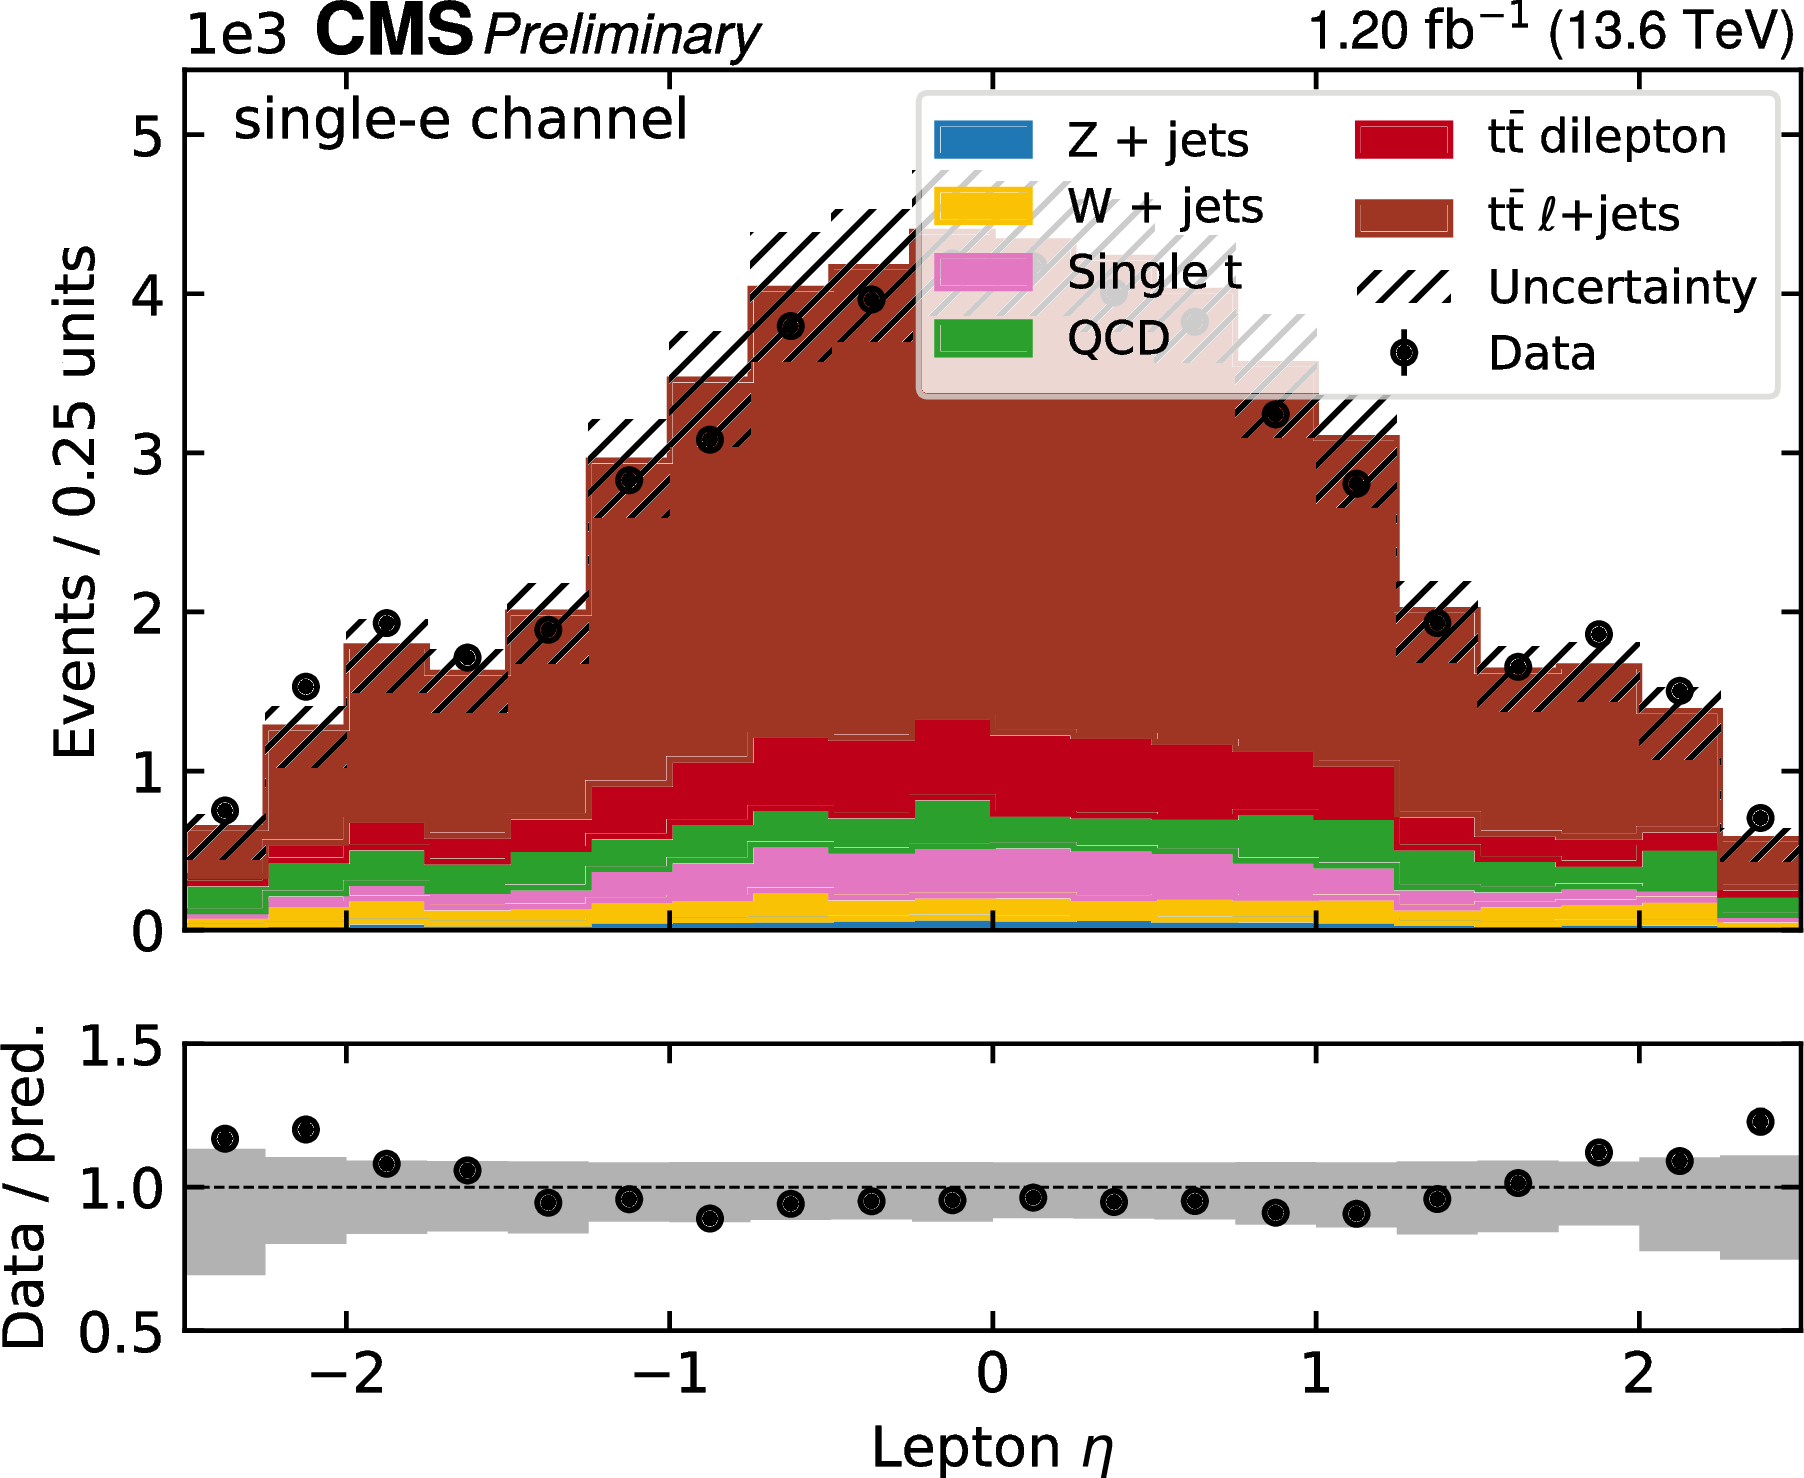
Figure 4-b:
Control plots in the e+jets channel. From upper left to lower right: lepton $ p_{\mathrm{T}} $ and $ \eta $, leading jet $ p_{\mathrm{T}} $ and $ \eta $, number of jets and b jets. The MC predictions are normalized using measured luminosity and theoretical cross sections, and are scaled by the lepton scale factors as obtained in the fit. The uncertainty bands include all experimental statistical and systematic uncertainties including the integrated luminosity, but excluding the lepton scale factors, which have flat prior probability density distributions. The lower panels show the ratio of the data to the MC simulation. |
png pdf |
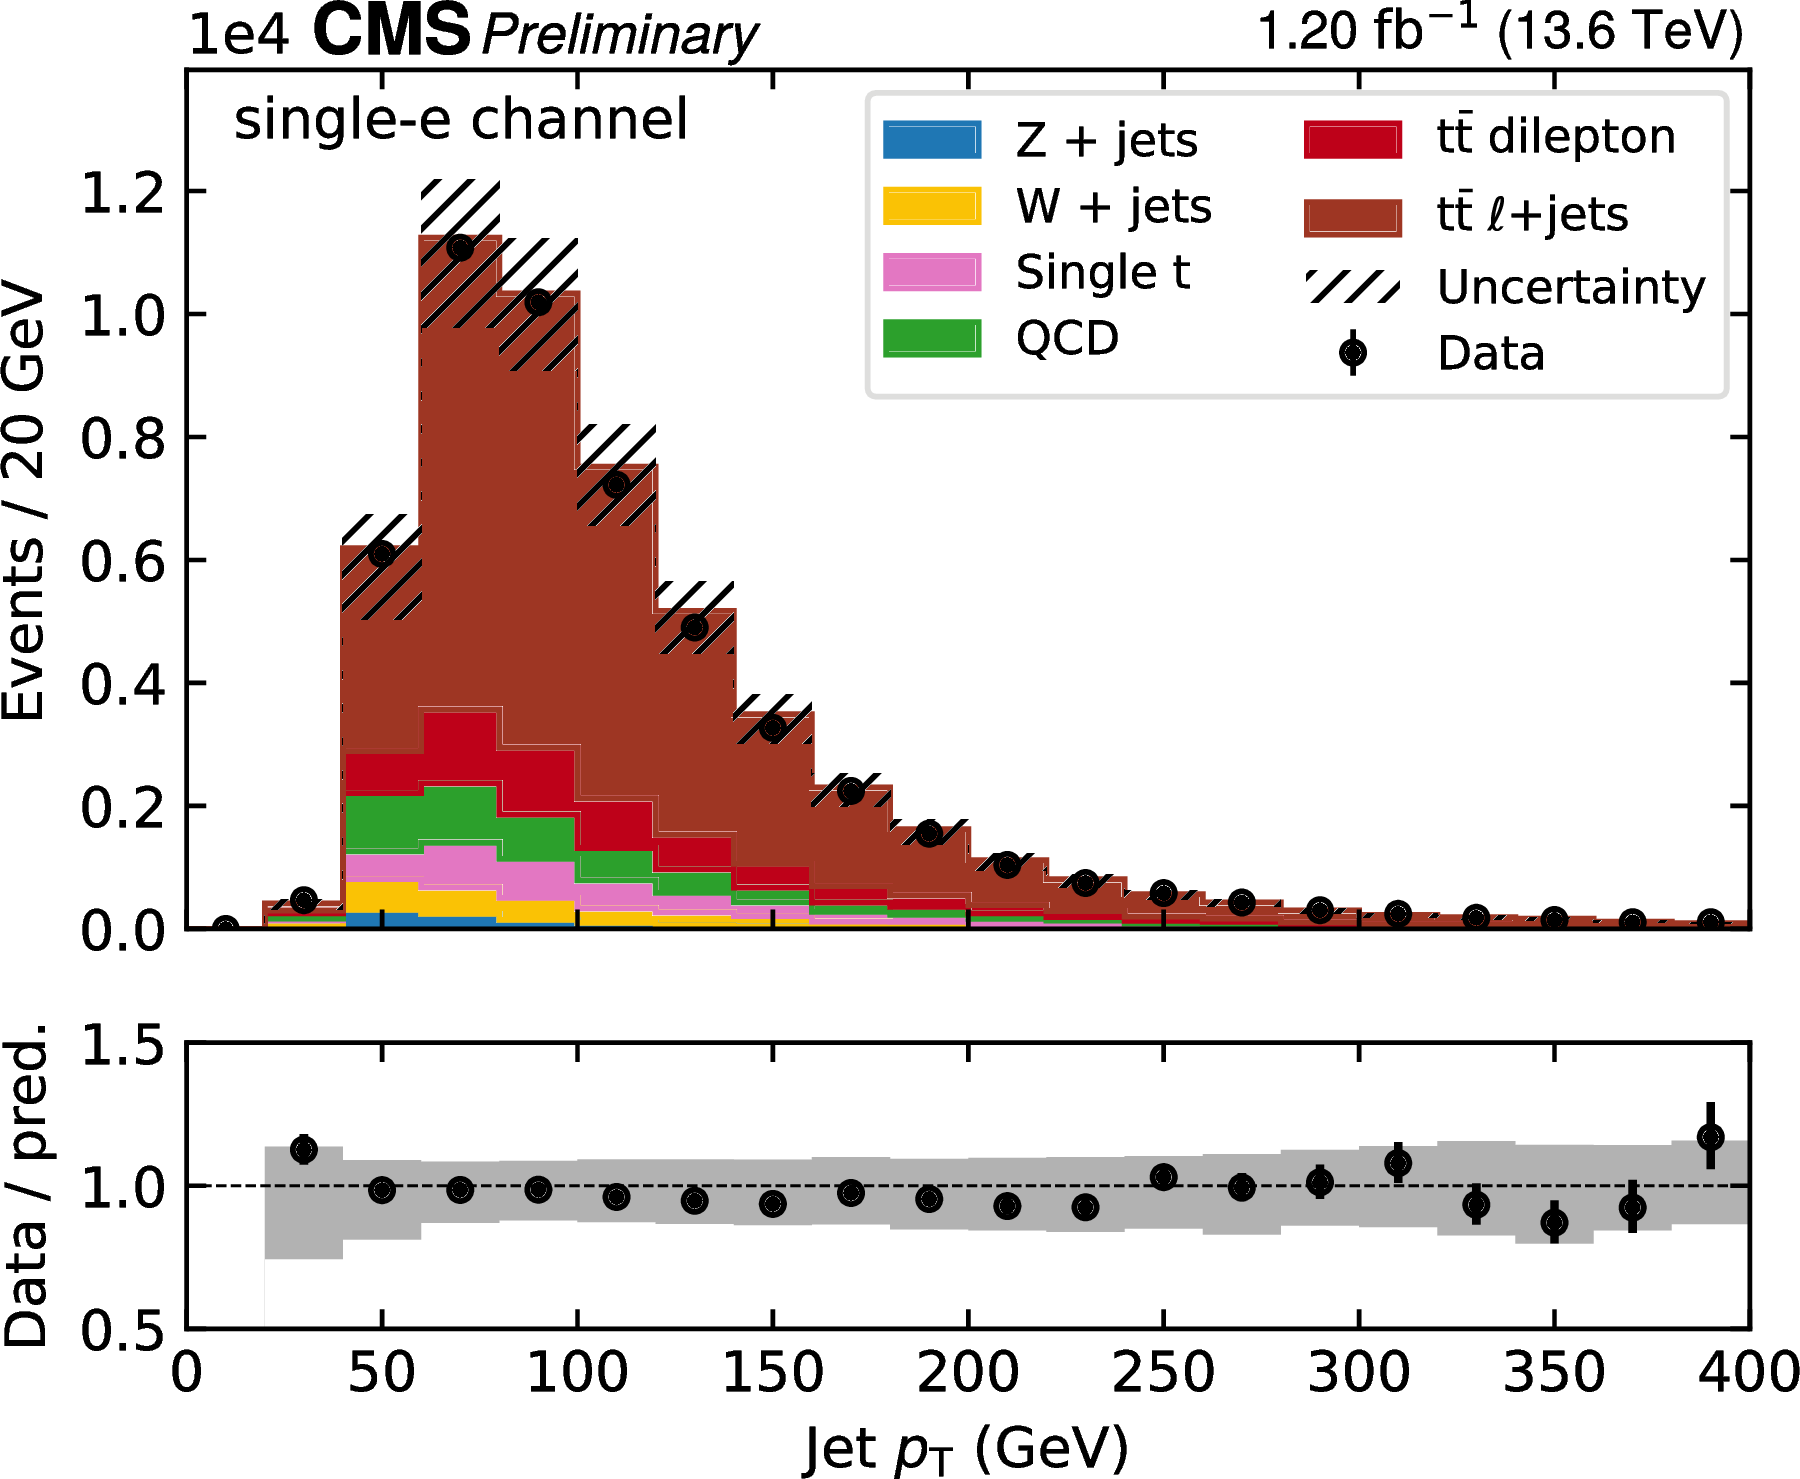
Figure 4-c:
Control plots in the e+jets channel. From upper left to lower right: lepton $ p_{\mathrm{T}} $ and $ \eta $, leading jet $ p_{\mathrm{T}} $ and $ \eta $, number of jets and b jets. The MC predictions are normalized using measured luminosity and theoretical cross sections, and are scaled by the lepton scale factors as obtained in the fit. The uncertainty bands include all experimental statistical and systematic uncertainties including the integrated luminosity, but excluding the lepton scale factors, which have flat prior probability density distributions. The lower panels show the ratio of the data to the MC simulation. |
png pdf |
Figure 4-d:
Control plots in the e+jets channel. From upper left to lower right: lepton $ p_{\mathrm{T}} $ and $ \eta $, leading jet $ p_{\mathrm{T}} $ and $ \eta $, number of jets and b jets. The MC predictions are normalized using measured luminosity and theoretical cross sections, and are scaled by the lepton scale factors as obtained in the fit. The uncertainty bands include all experimental statistical and systematic uncertainties including the integrated luminosity, but excluding the lepton scale factors, which have flat prior probability density distributions. The lower panels show the ratio of the data to the MC simulation. |
png pdf |
Figure 4-e:
Control plots in the e+jets channel. From upper left to lower right: lepton $ p_{\mathrm{T}} $ and $ \eta $, leading jet $ p_{\mathrm{T}} $ and $ \eta $, number of jets and b jets. The MC predictions are normalized using measured luminosity and theoretical cross sections, and are scaled by the lepton scale factors as obtained in the fit. The uncertainty bands include all experimental statistical and systematic uncertainties including the integrated luminosity, but excluding the lepton scale factors, which have flat prior probability density distributions. The lower panels show the ratio of the data to the MC simulation. |
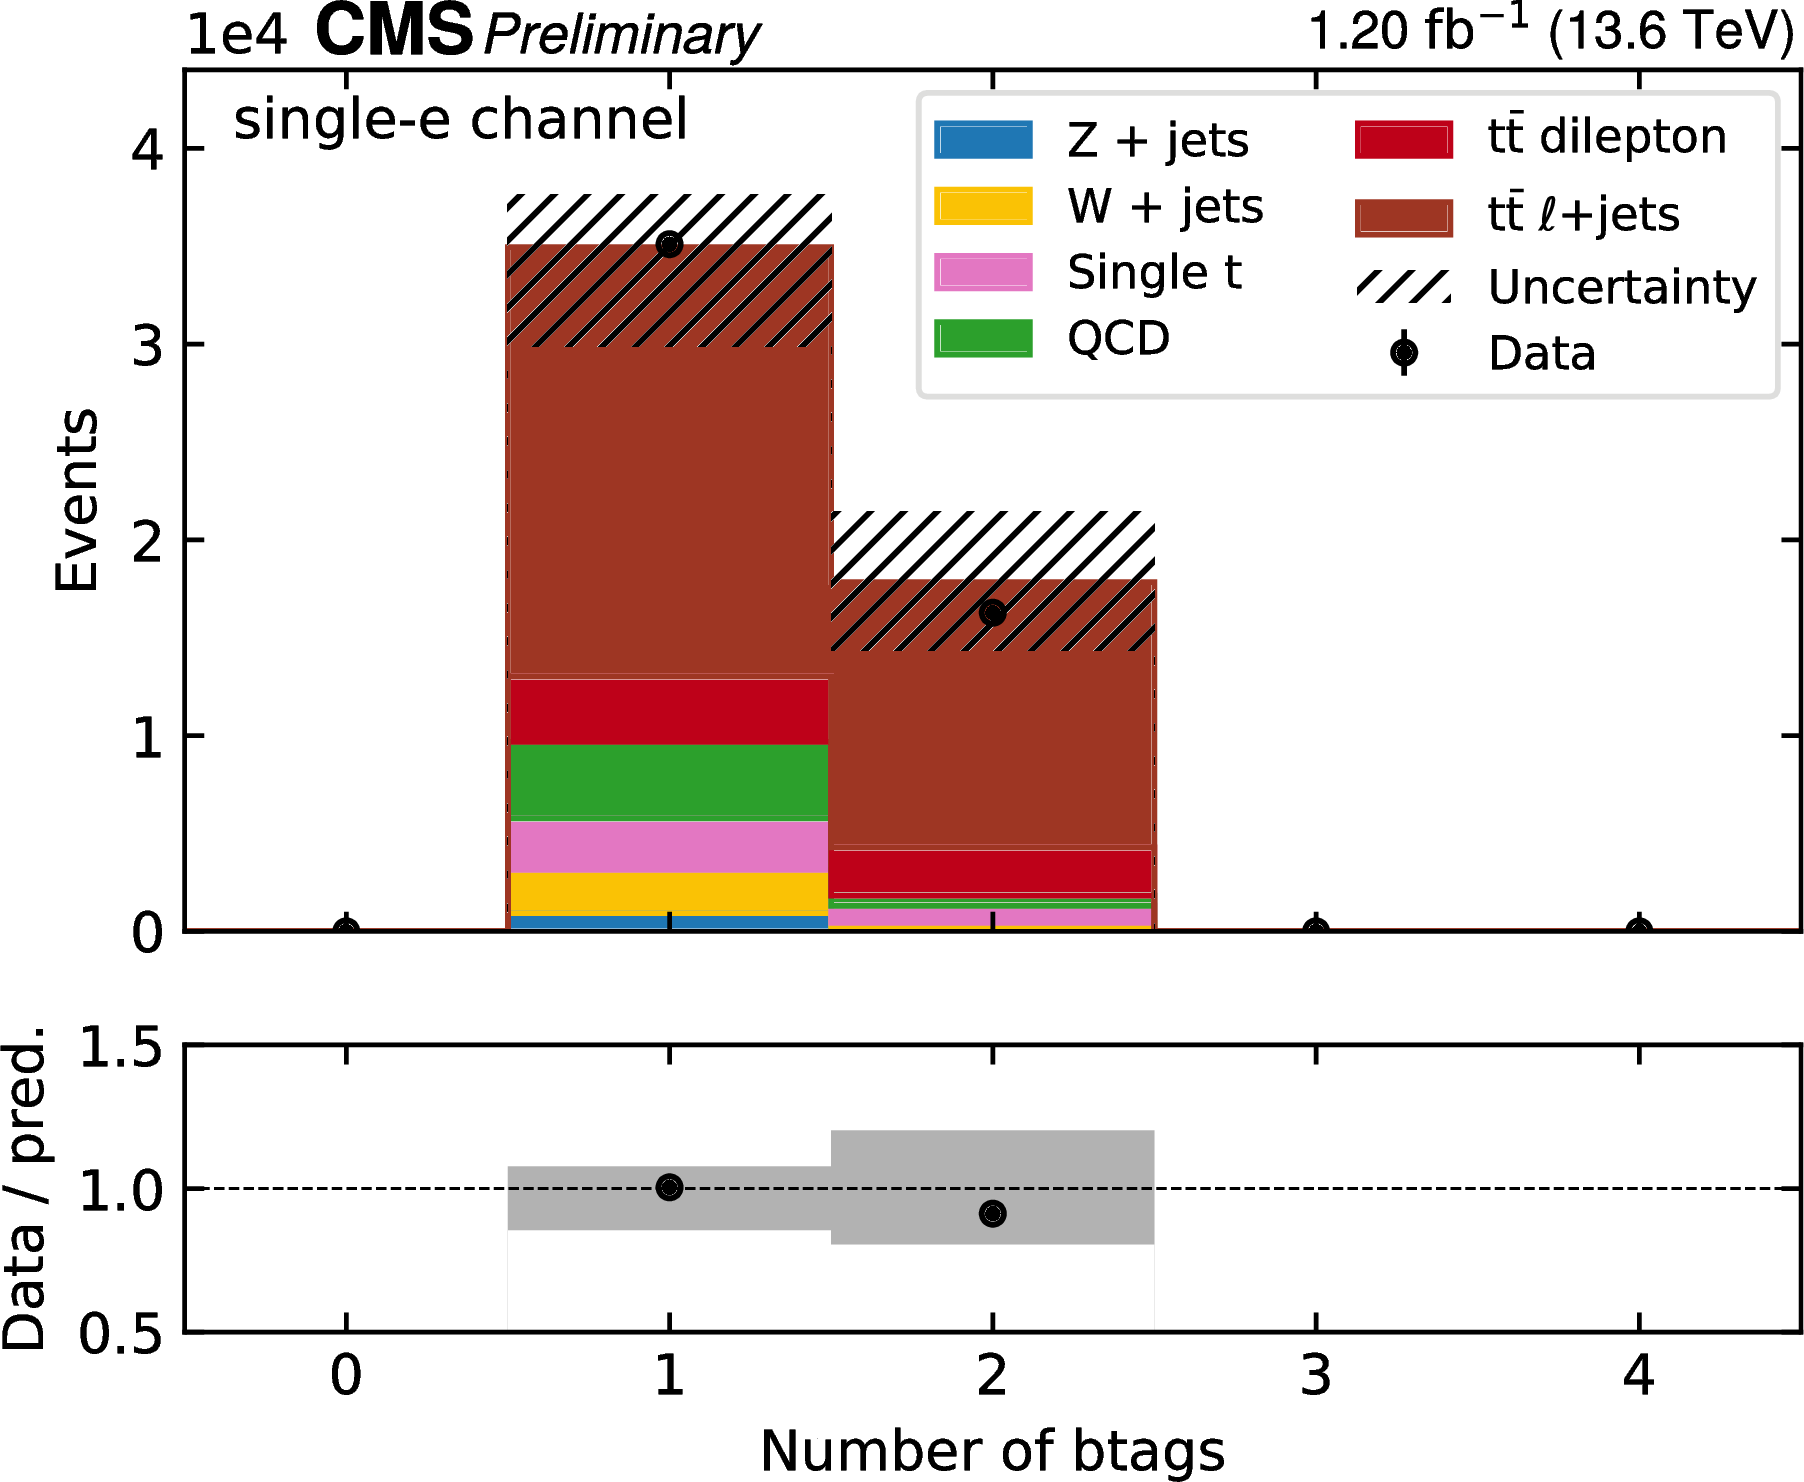
png pdf |
Figure 4-f:
Control plots in the e+jets channel. From upper left to lower right: lepton $ p_{\mathrm{T}} $ and $ \eta $, leading jet $ p_{\mathrm{T}} $ and $ \eta $, number of jets and b jets. The MC predictions are normalized using measured luminosity and theoretical cross sections, and are scaled by the lepton scale factors as obtained in the fit. The uncertainty bands include all experimental statistical and systematic uncertainties including the integrated luminosity, but excluding the lepton scale factors, which have flat prior probability density distributions. The lower panels show the ratio of the data to the MC simulation. |
png pdf |
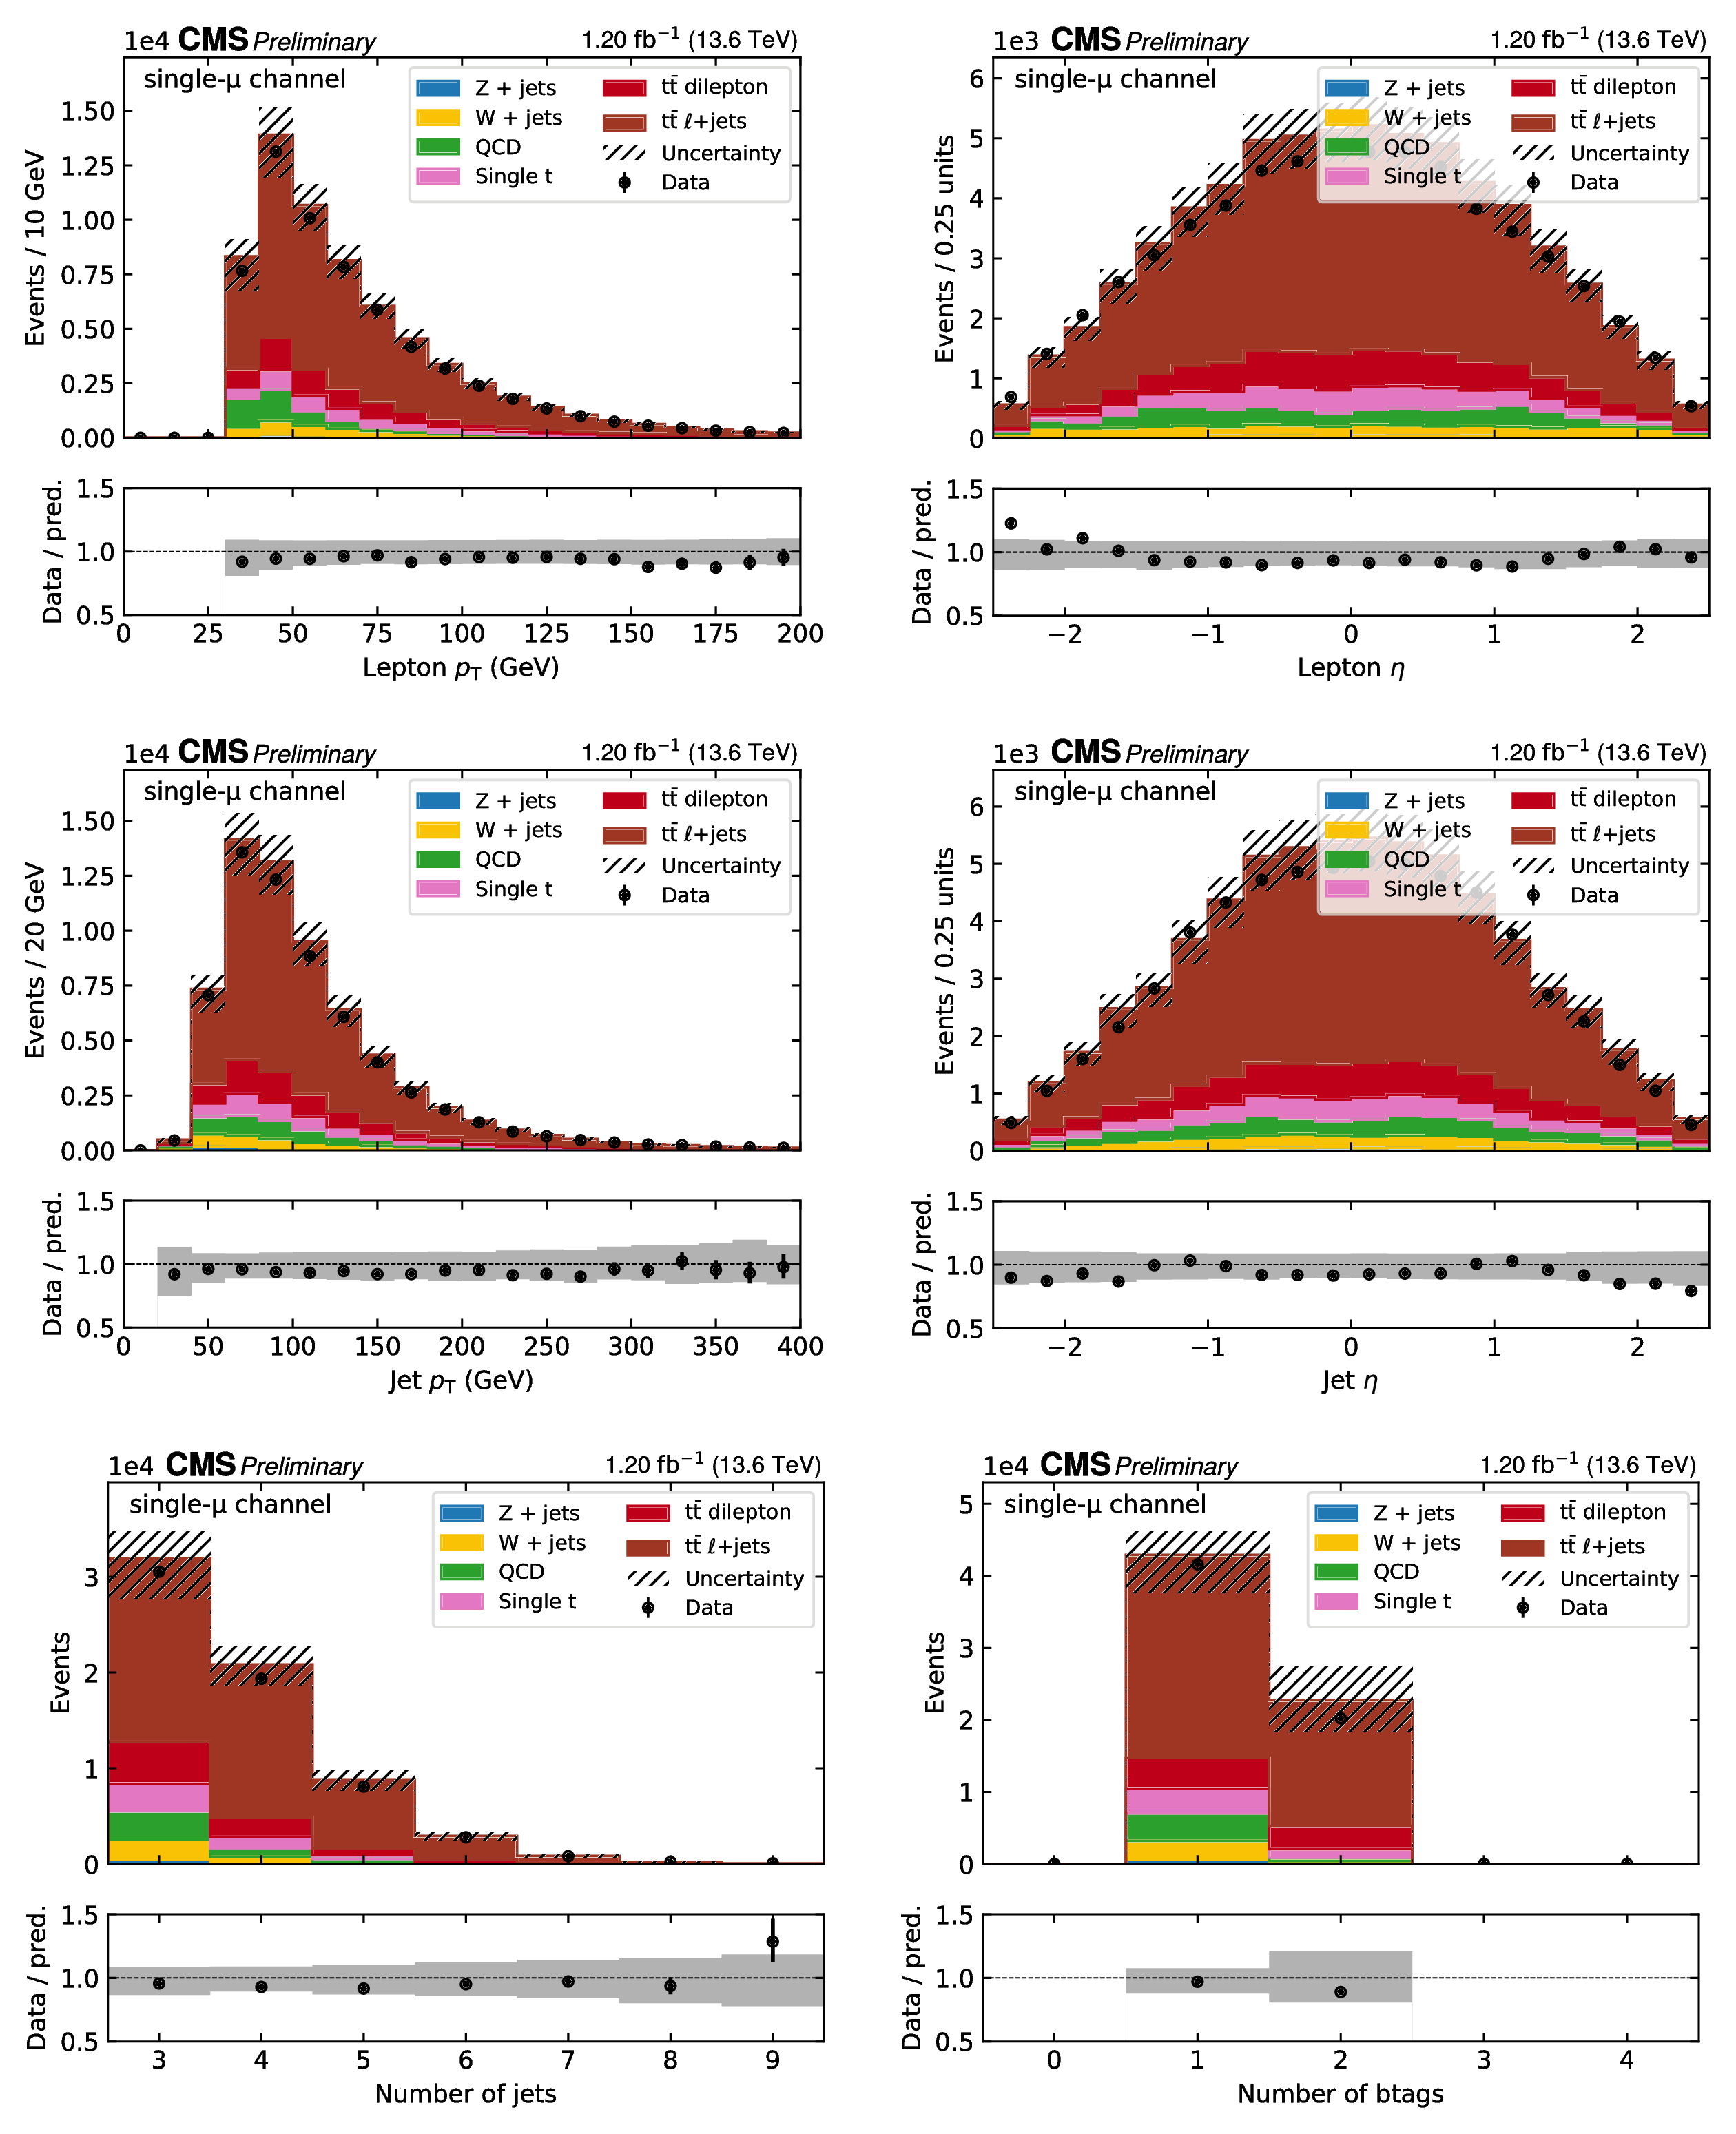
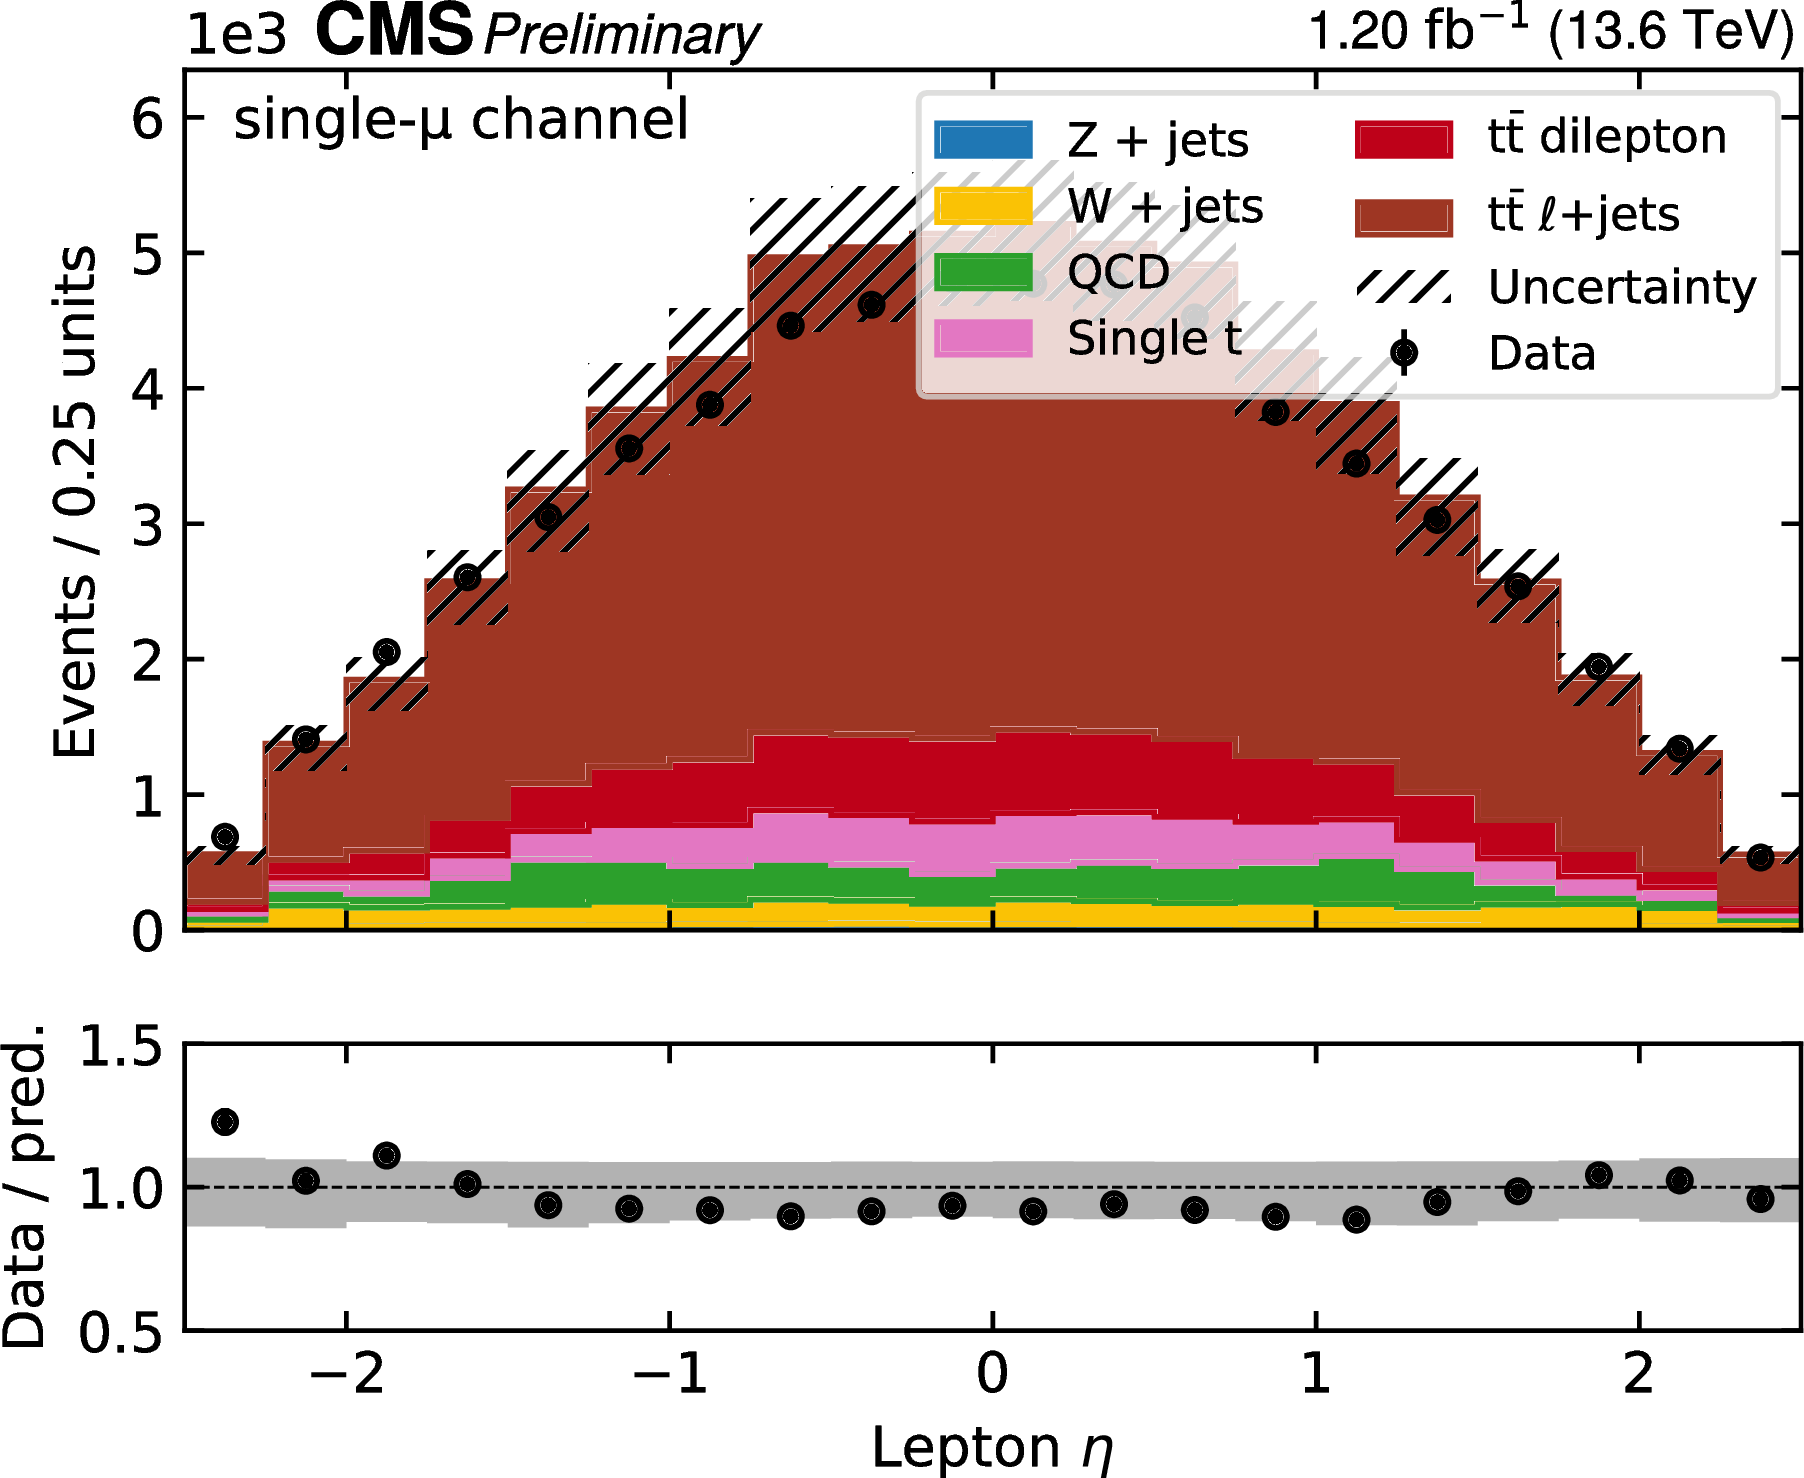
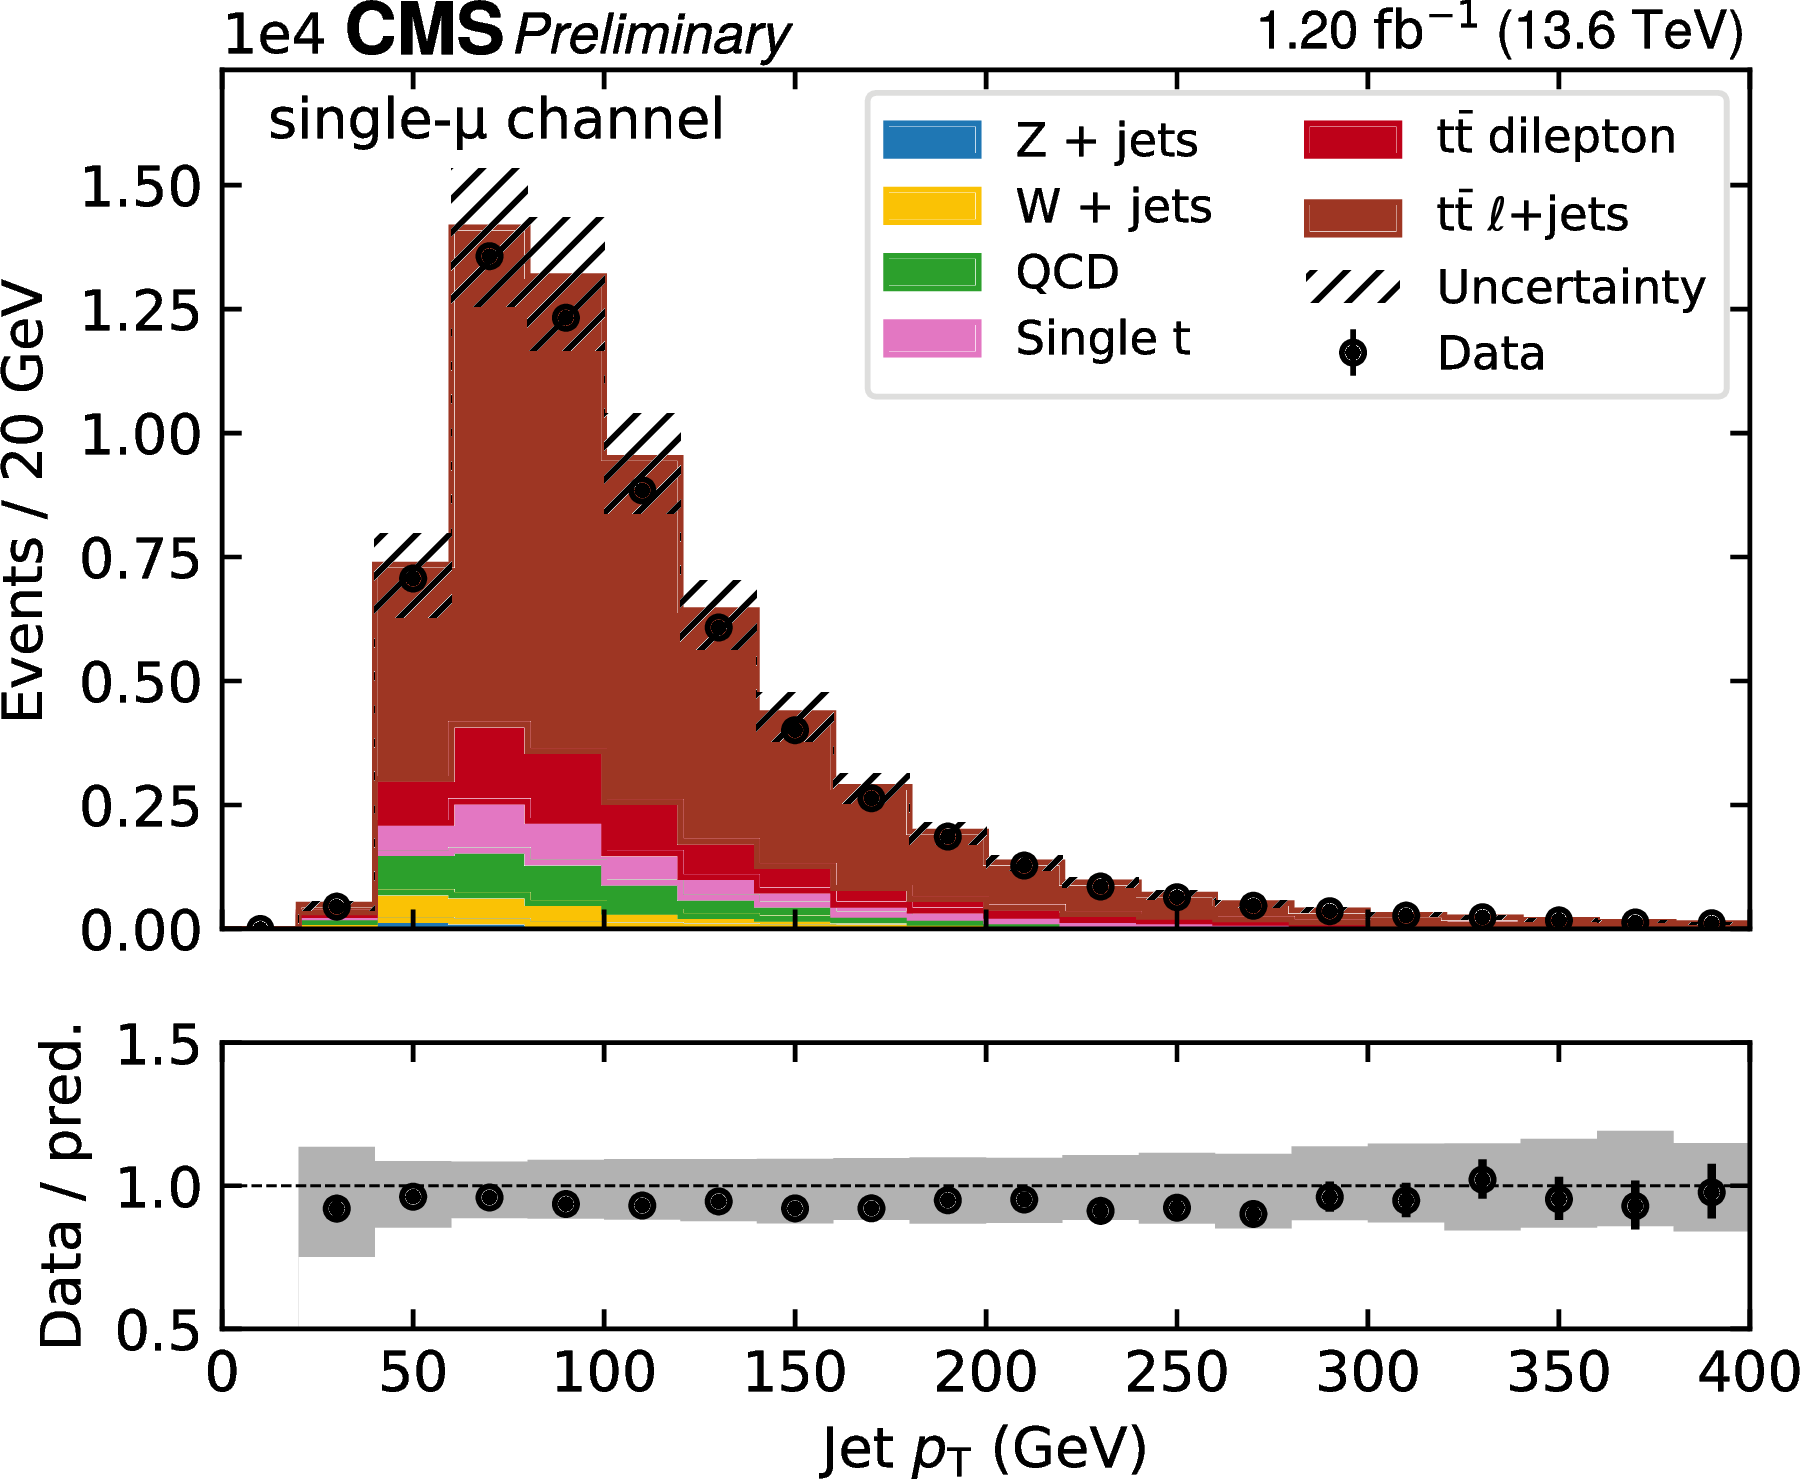
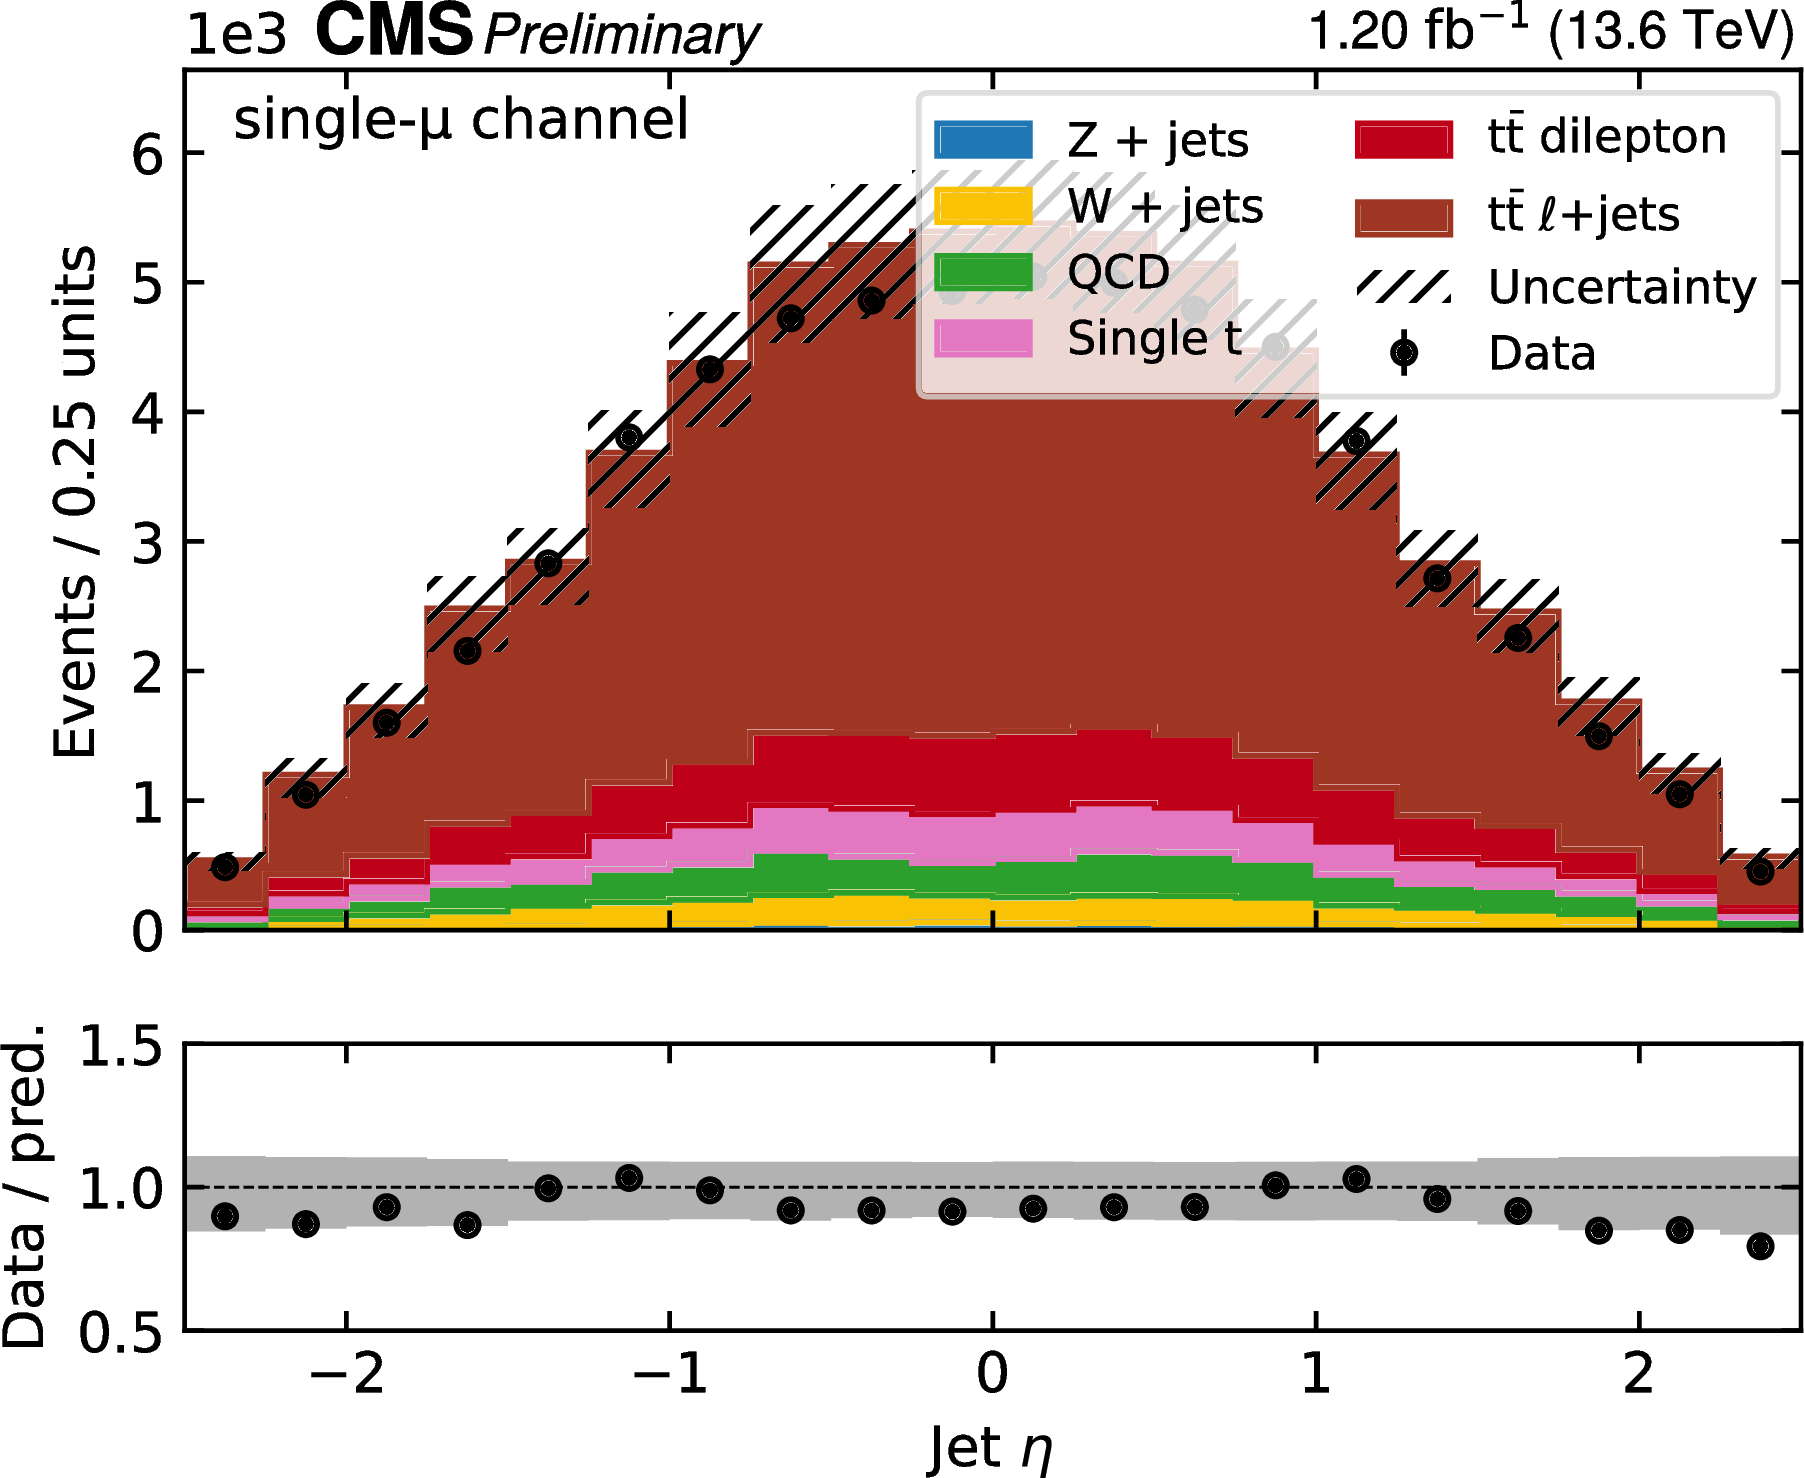
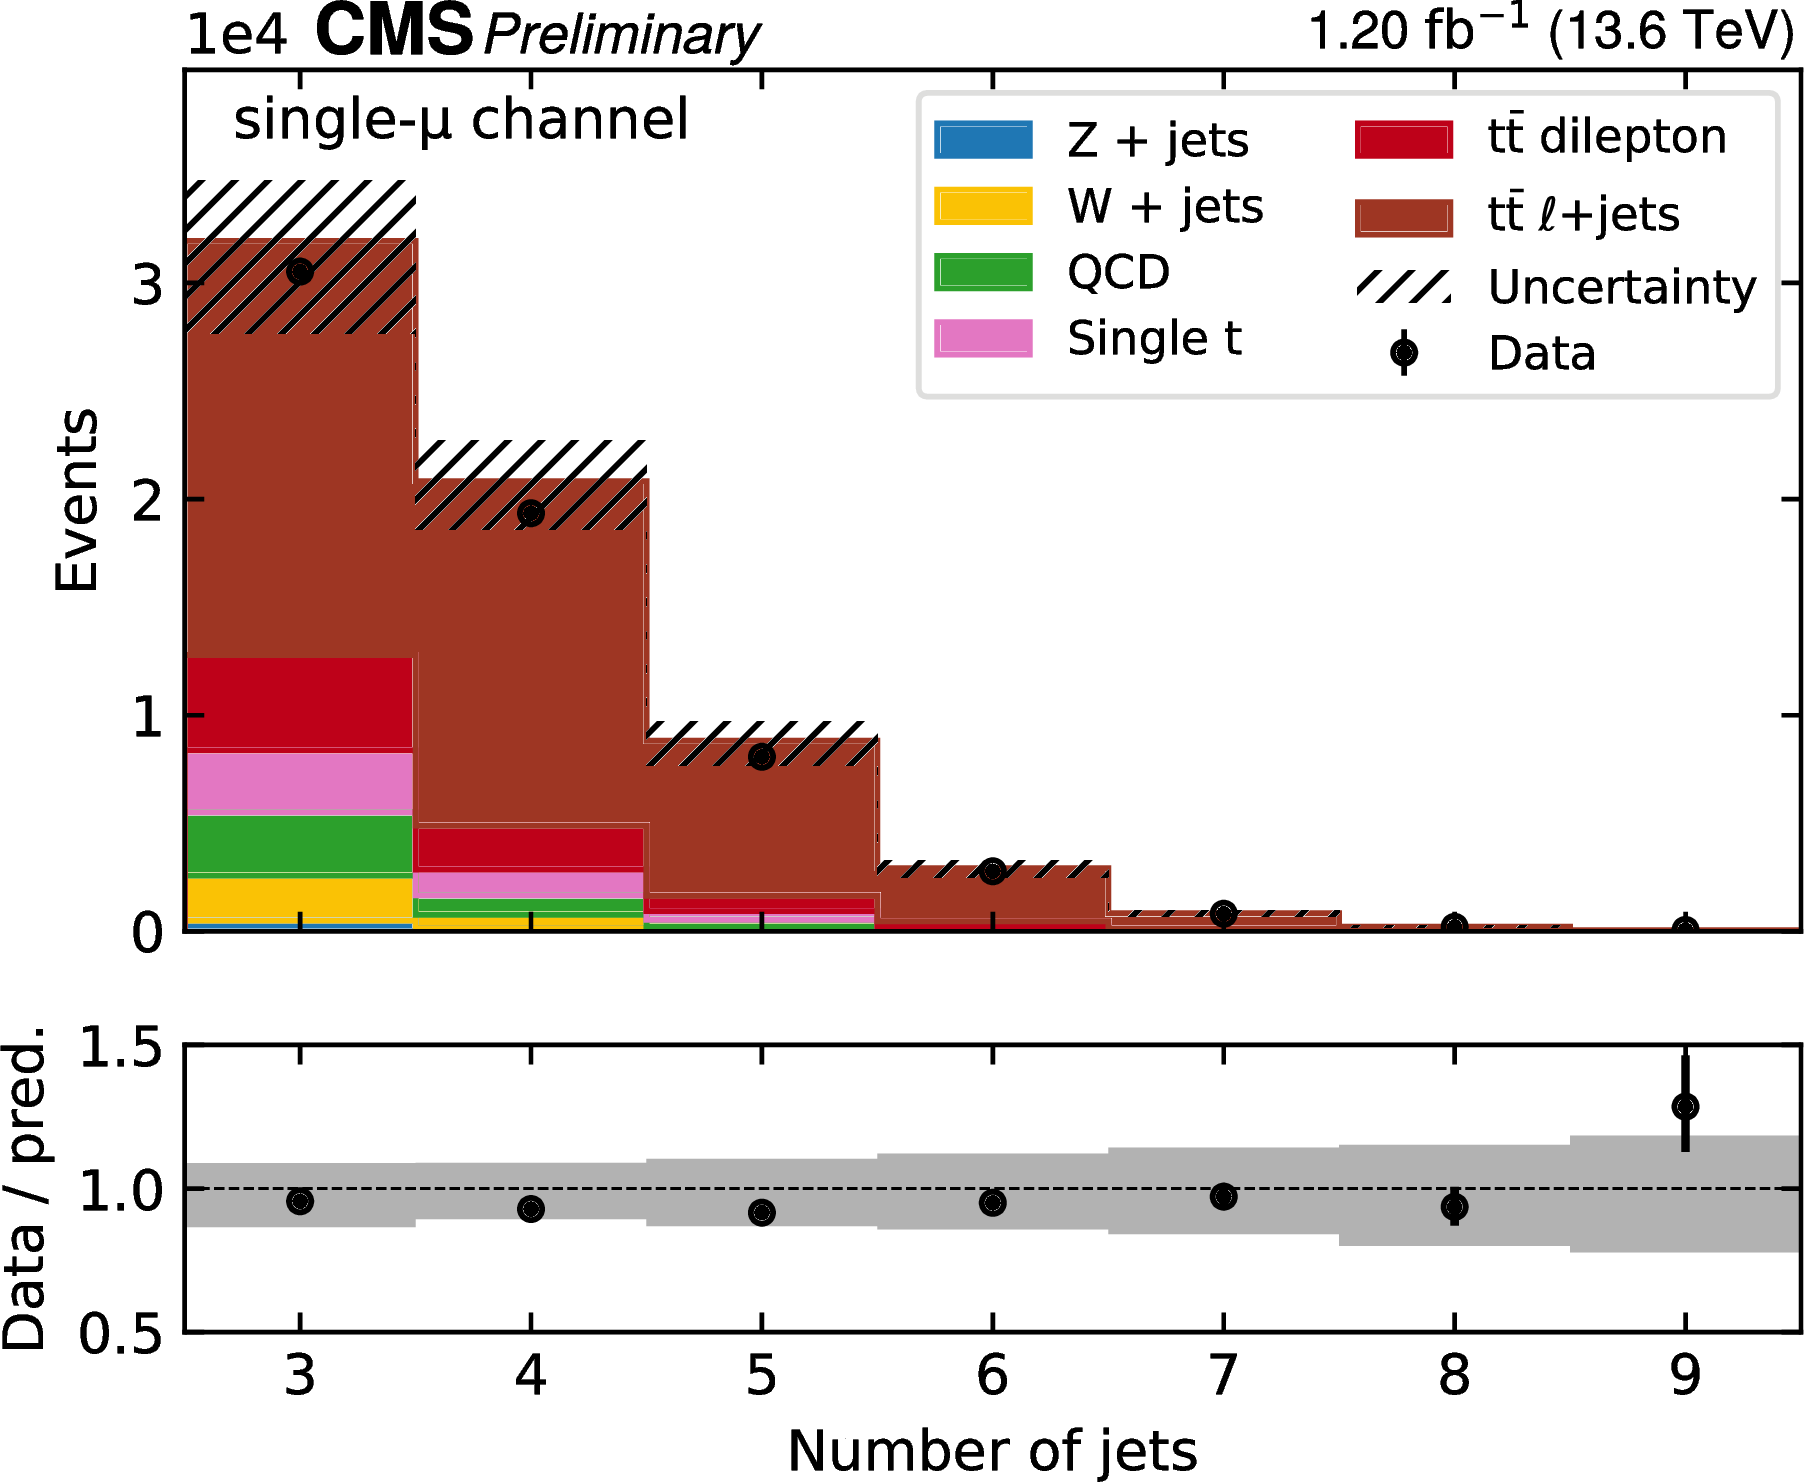
Figure 5:
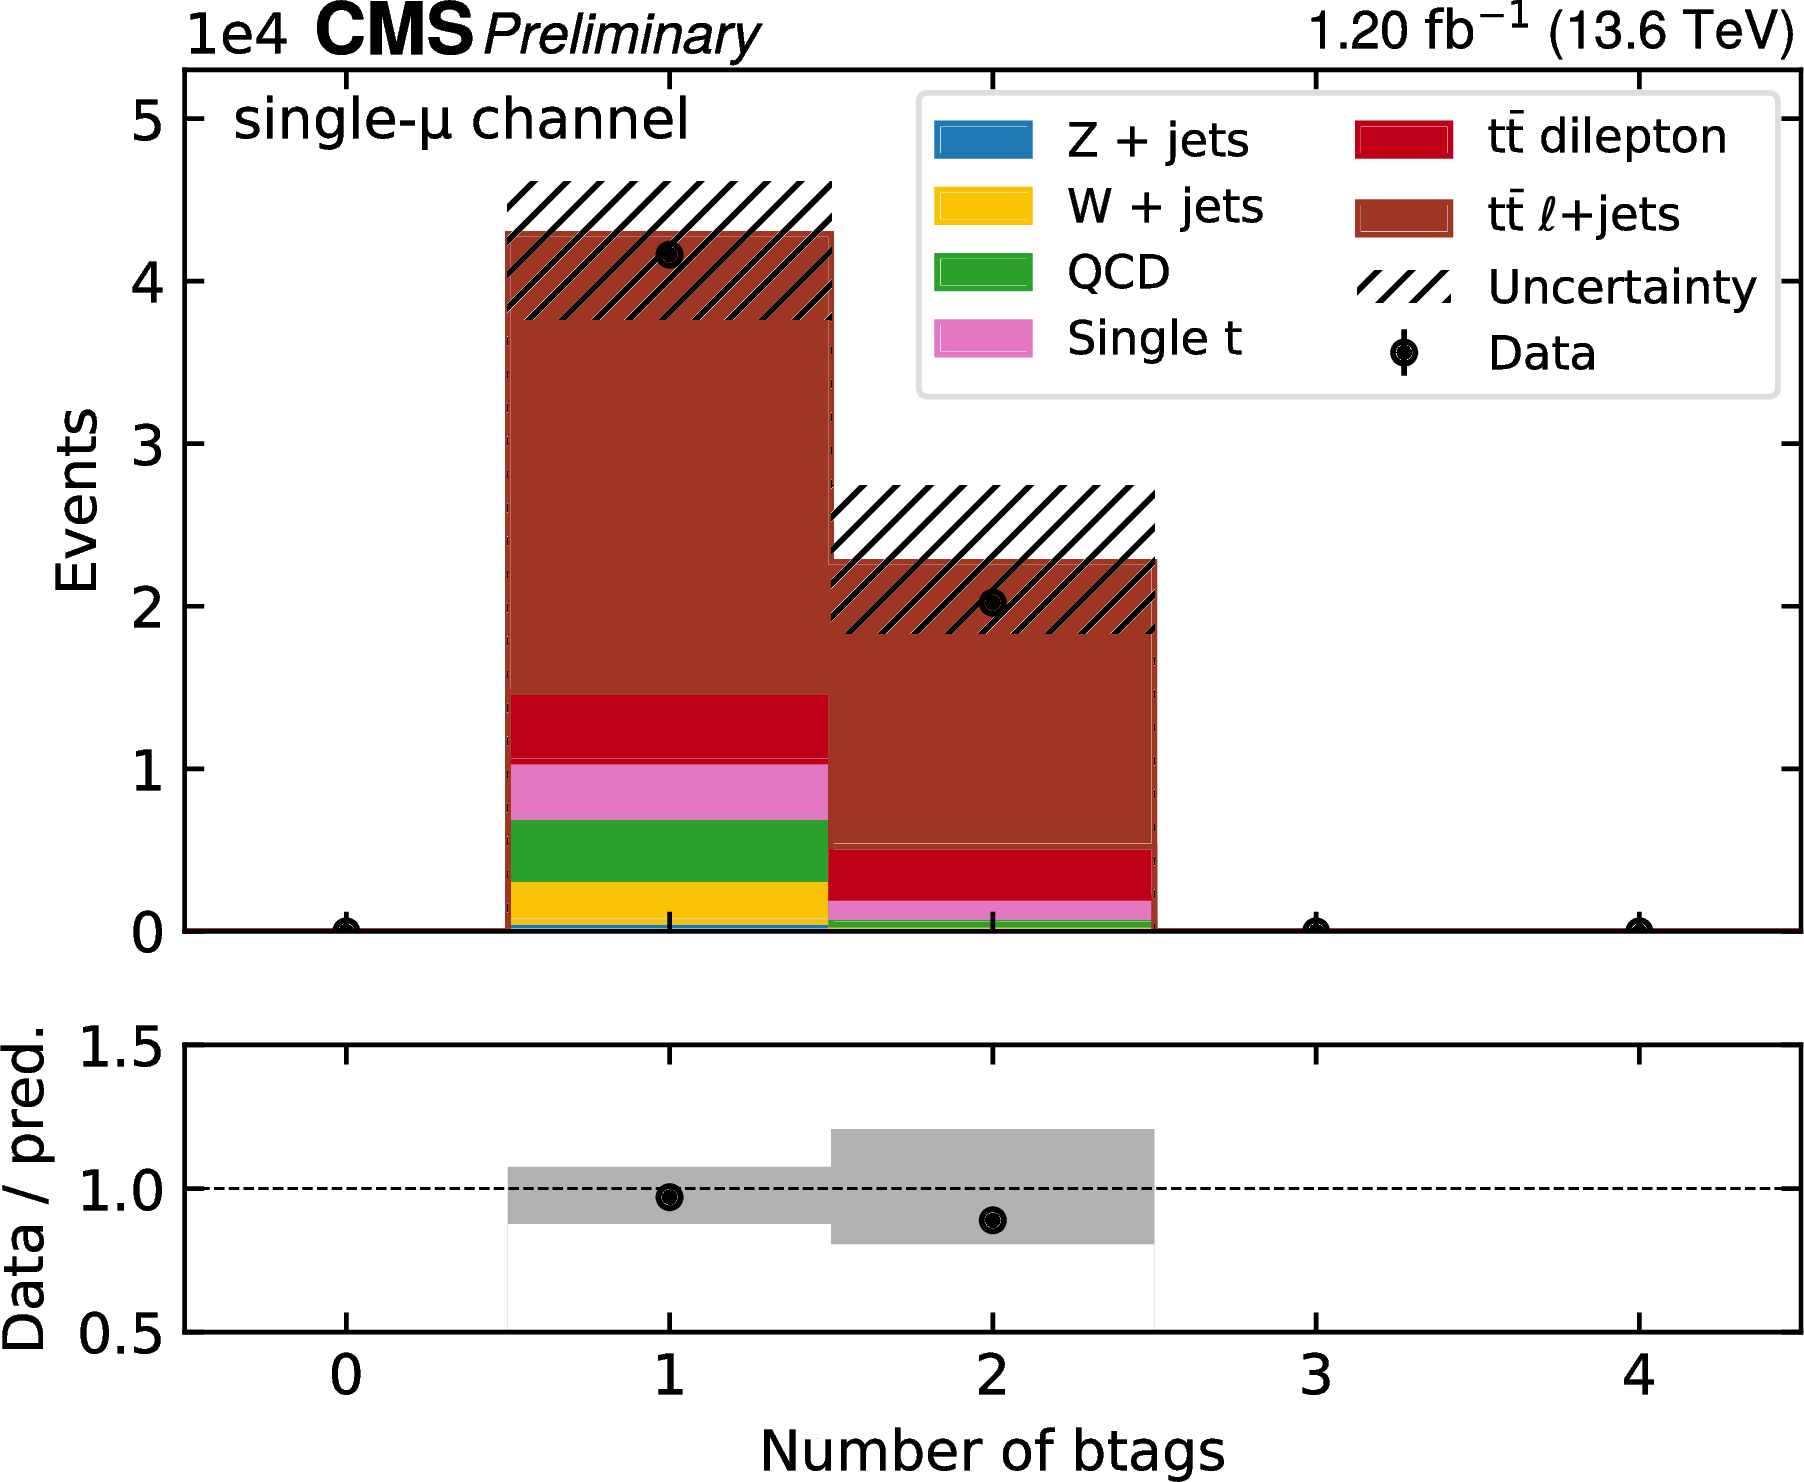
Control plots in the $ \mu$+jets channel. From upper left to lower right: lepton $ p_{\mathrm{T}} $ and $ \eta $, leading jet $ p_{\mathrm{T}} $ and $ \eta $, number of jets and b jets. The MC predictions are normalized using measured luminosity and theoretical cross sections, and are scaled by the lepton scale factors as obtained in the fit. The uncertainty bands include all experimental statistical and systematic uncertainties including the integrated luminosity, but excluding the lepton scale factors, which have flat prior probability density distributions. The lower panels show the ratio of the data to the MC simulation. |

png pdf |
Figure 5-a:
Control plots in the $ \mu$+jets channel. From upper left to lower right: lepton $ p_{\mathrm{T}} $ and $ \eta $, leading jet $ p_{\mathrm{T}} $ and $ \eta $, number of jets and b jets. The MC predictions are normalized using measured luminosity and theoretical cross sections, and are scaled by the lepton scale factors as obtained in the fit. The uncertainty bands include all experimental statistical and systematic uncertainties including the integrated luminosity, but excluding the lepton scale factors, which have flat prior probability density distributions. The lower panels show the ratio of the data to the MC simulation. |
png pdf |
Figure 5-b:
Control plots in the $ \mu$+jets channel. From upper left to lower right: lepton $ p_{\mathrm{T}} $ and $ \eta $, leading jet $ p_{\mathrm{T}} $ and $ \eta $, number of jets and b jets. The MC predictions are normalized using measured luminosity and theoretical cross sections, and are scaled by the lepton scale factors as obtained in the fit. The uncertainty bands include all experimental statistical and systematic uncertainties including the integrated luminosity, but excluding the lepton scale factors, which have flat prior probability density distributions. The lower panels show the ratio of the data to the MC simulation. |
png pdf |
Figure 5-c:
Control plots in the $ \mu$+jets channel. From upper left to lower right: lepton $ p_{\mathrm{T}} $ and $ \eta $, leading jet $ p_{\mathrm{T}} $ and $ \eta $, number of jets and b jets. The MC predictions are normalized using measured luminosity and theoretical cross sections, and are scaled by the lepton scale factors as obtained in the fit. The uncertainty bands include all experimental statistical and systematic uncertainties including the integrated luminosity, but excluding the lepton scale factors, which have flat prior probability density distributions. The lower panels show the ratio of the data to the MC simulation. |
png pdf |
Figure 5-d:
Control plots in the $ \mu$+jets channel. From upper left to lower right: lepton $ p_{\mathrm{T}} $ and $ \eta $, leading jet $ p_{\mathrm{T}} $ and $ \eta $, number of jets and b jets. The MC predictions are normalized using measured luminosity and theoretical cross sections, and are scaled by the lepton scale factors as obtained in the fit. The uncertainty bands include all experimental statistical and systematic uncertainties including the integrated luminosity, but excluding the lepton scale factors, which have flat prior probability density distributions. The lower panels show the ratio of the data to the MC simulation. |
png pdf |
Figure 5-e:
Control plots in the $ \mu$+jets channel. From upper left to lower right: lepton $ p_{\mathrm{T}} $ and $ \eta $, leading jet $ p_{\mathrm{T}} $ and $ \eta $, number of jets and b jets. The MC predictions are normalized using measured luminosity and theoretical cross sections, and are scaled by the lepton scale factors as obtained in the fit. The uncertainty bands include all experimental statistical and systematic uncertainties including the integrated luminosity, but excluding the lepton scale factors, which have flat prior probability density distributions. The lower panels show the ratio of the data to the MC simulation. |
png pdf |
Figure 5-f:
Control plots in the $ \mu$+jets channel. From upper left to lower right: lepton $ p_{\mathrm{T}} $ and $ \eta $, leading jet $ p_{\mathrm{T}} $ and $ \eta $, number of jets and b jets. The MC predictions are normalized using measured luminosity and theoretical cross sections, and are scaled by the lepton scale factors as obtained in the fit. The uncertainty bands include all experimental statistical and systematic uncertainties including the integrated luminosity, but excluding the lepton scale factors, which have flat prior probability density distributions. The lower panels show the ratio of the data to the MC simulation. |
png pdf |
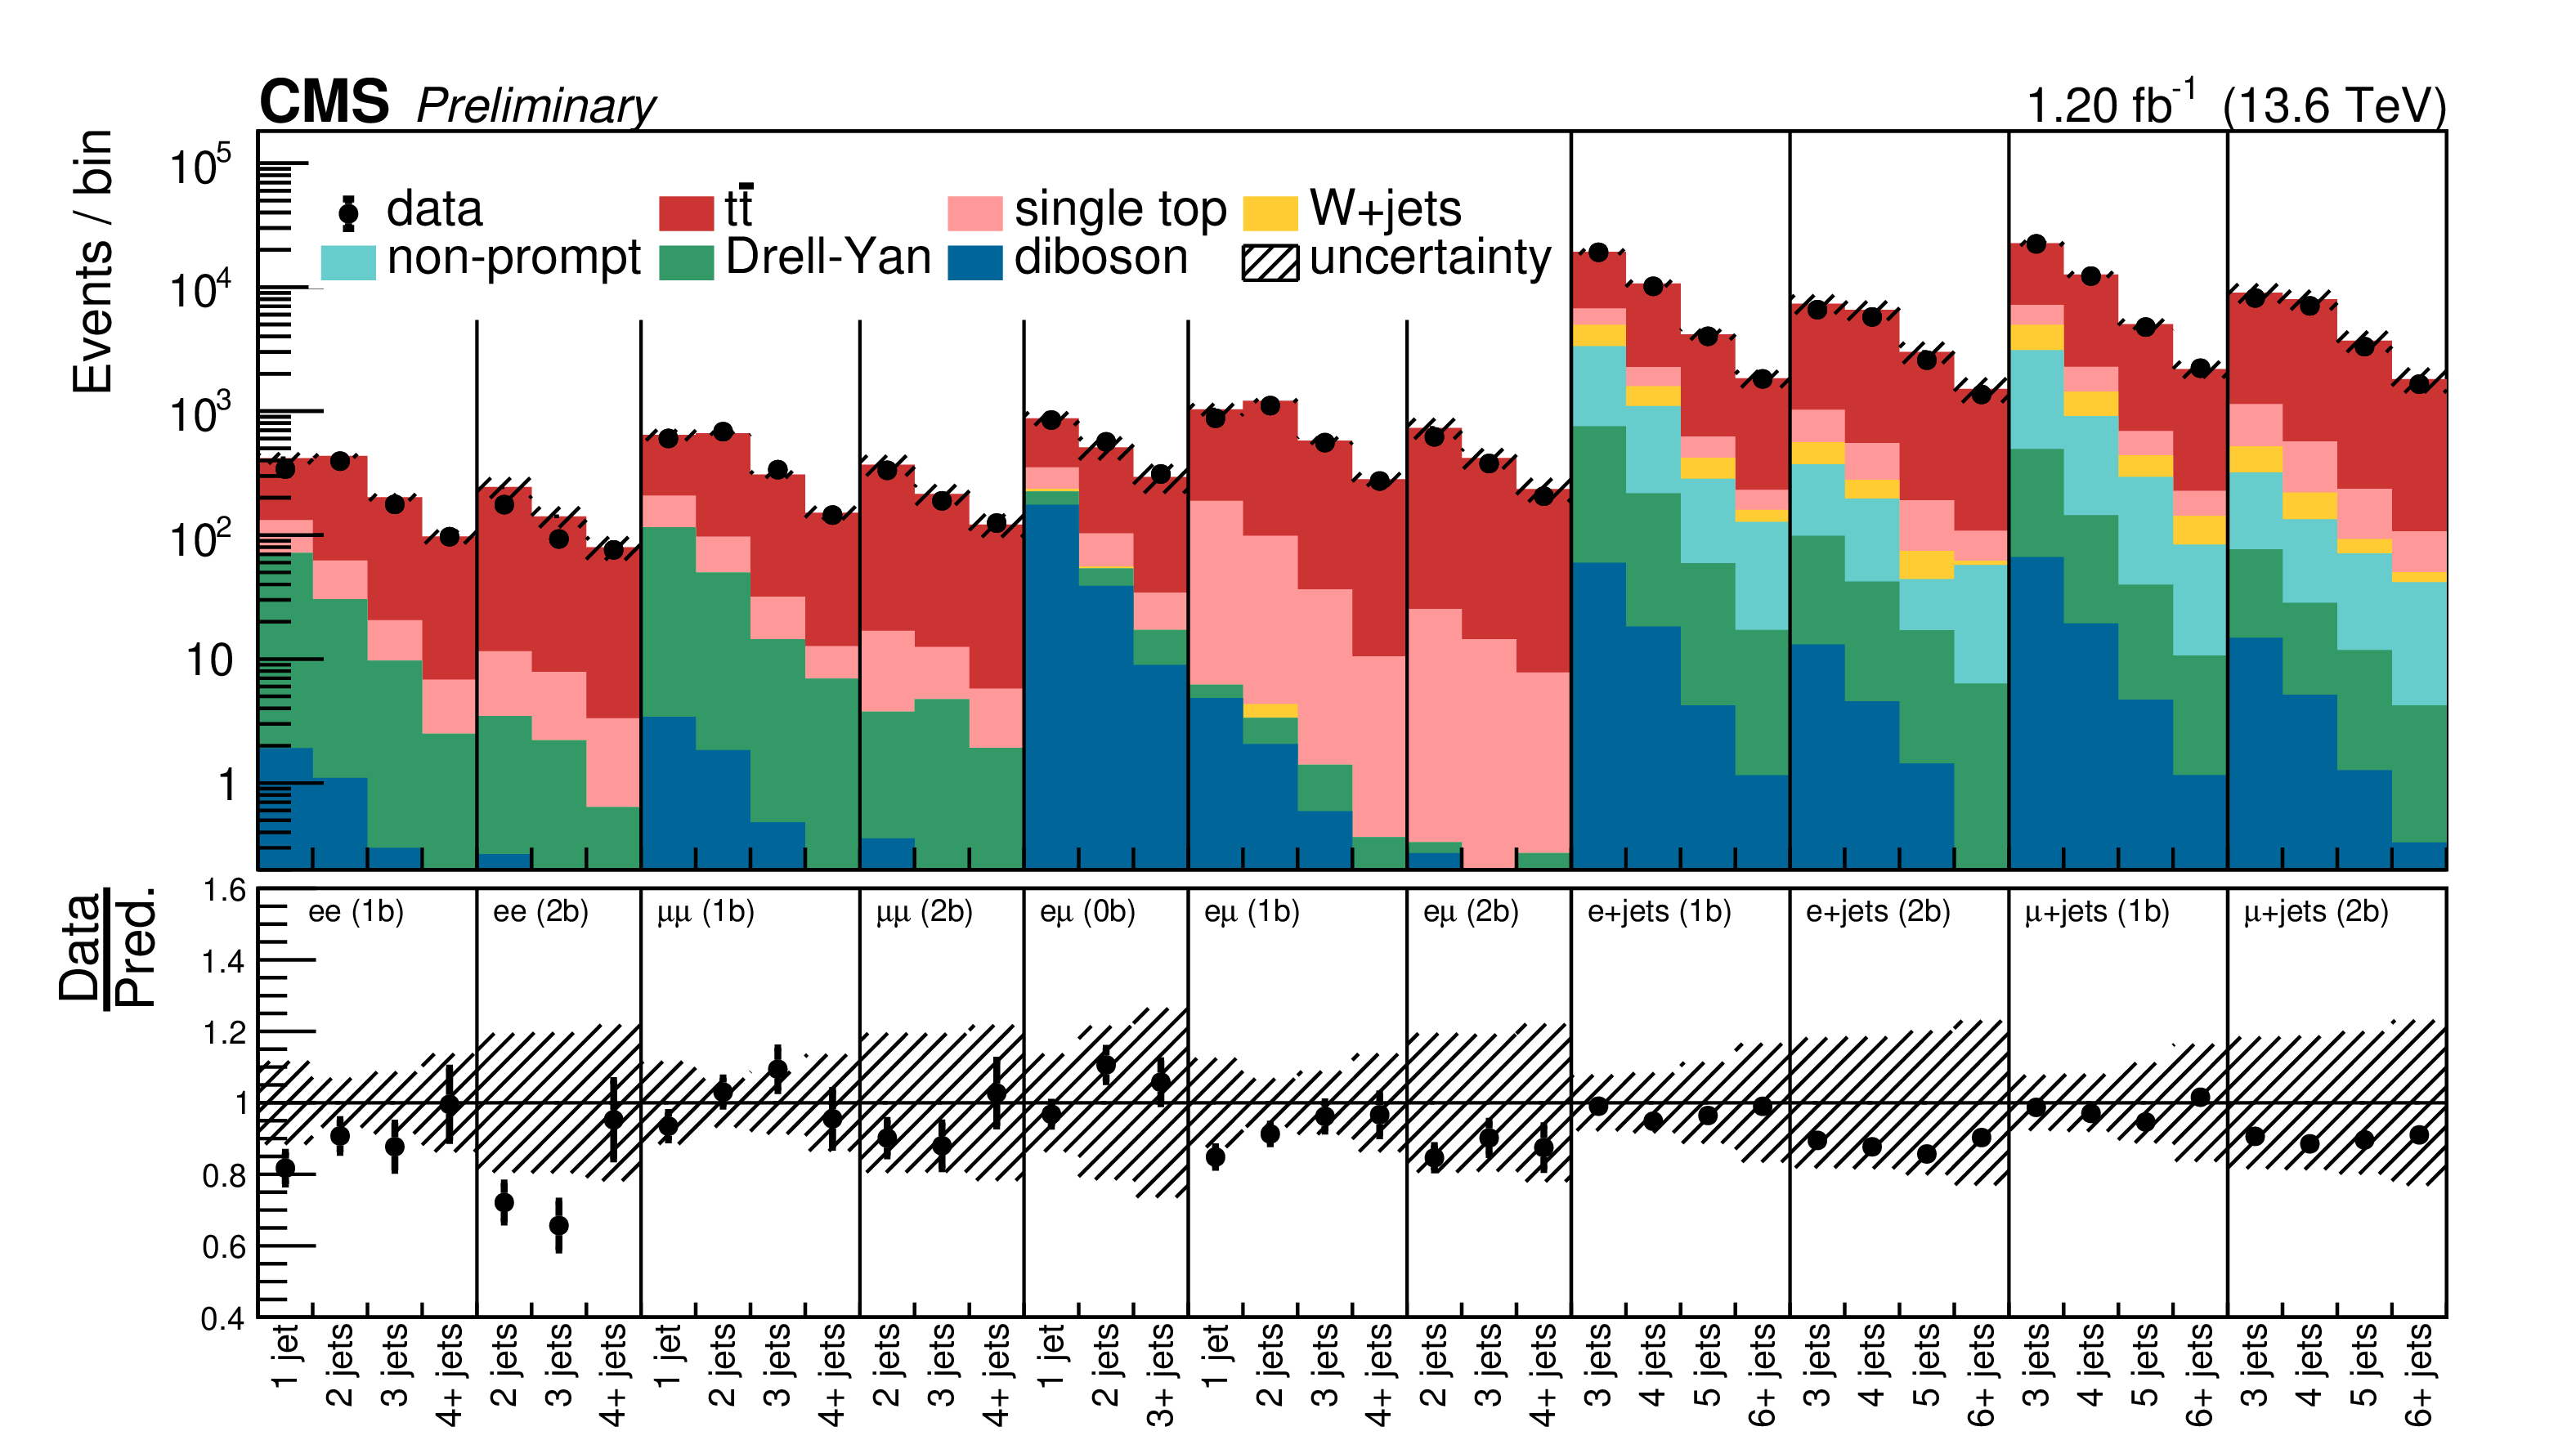
Figure 6:
Comparison between simulation and data in the final analysis binning prior to performing the fit. The lepton ID efficiency uncertainties, which have flat prior probability density distributions, are not included in the uncertainty bands. |
png pdf |
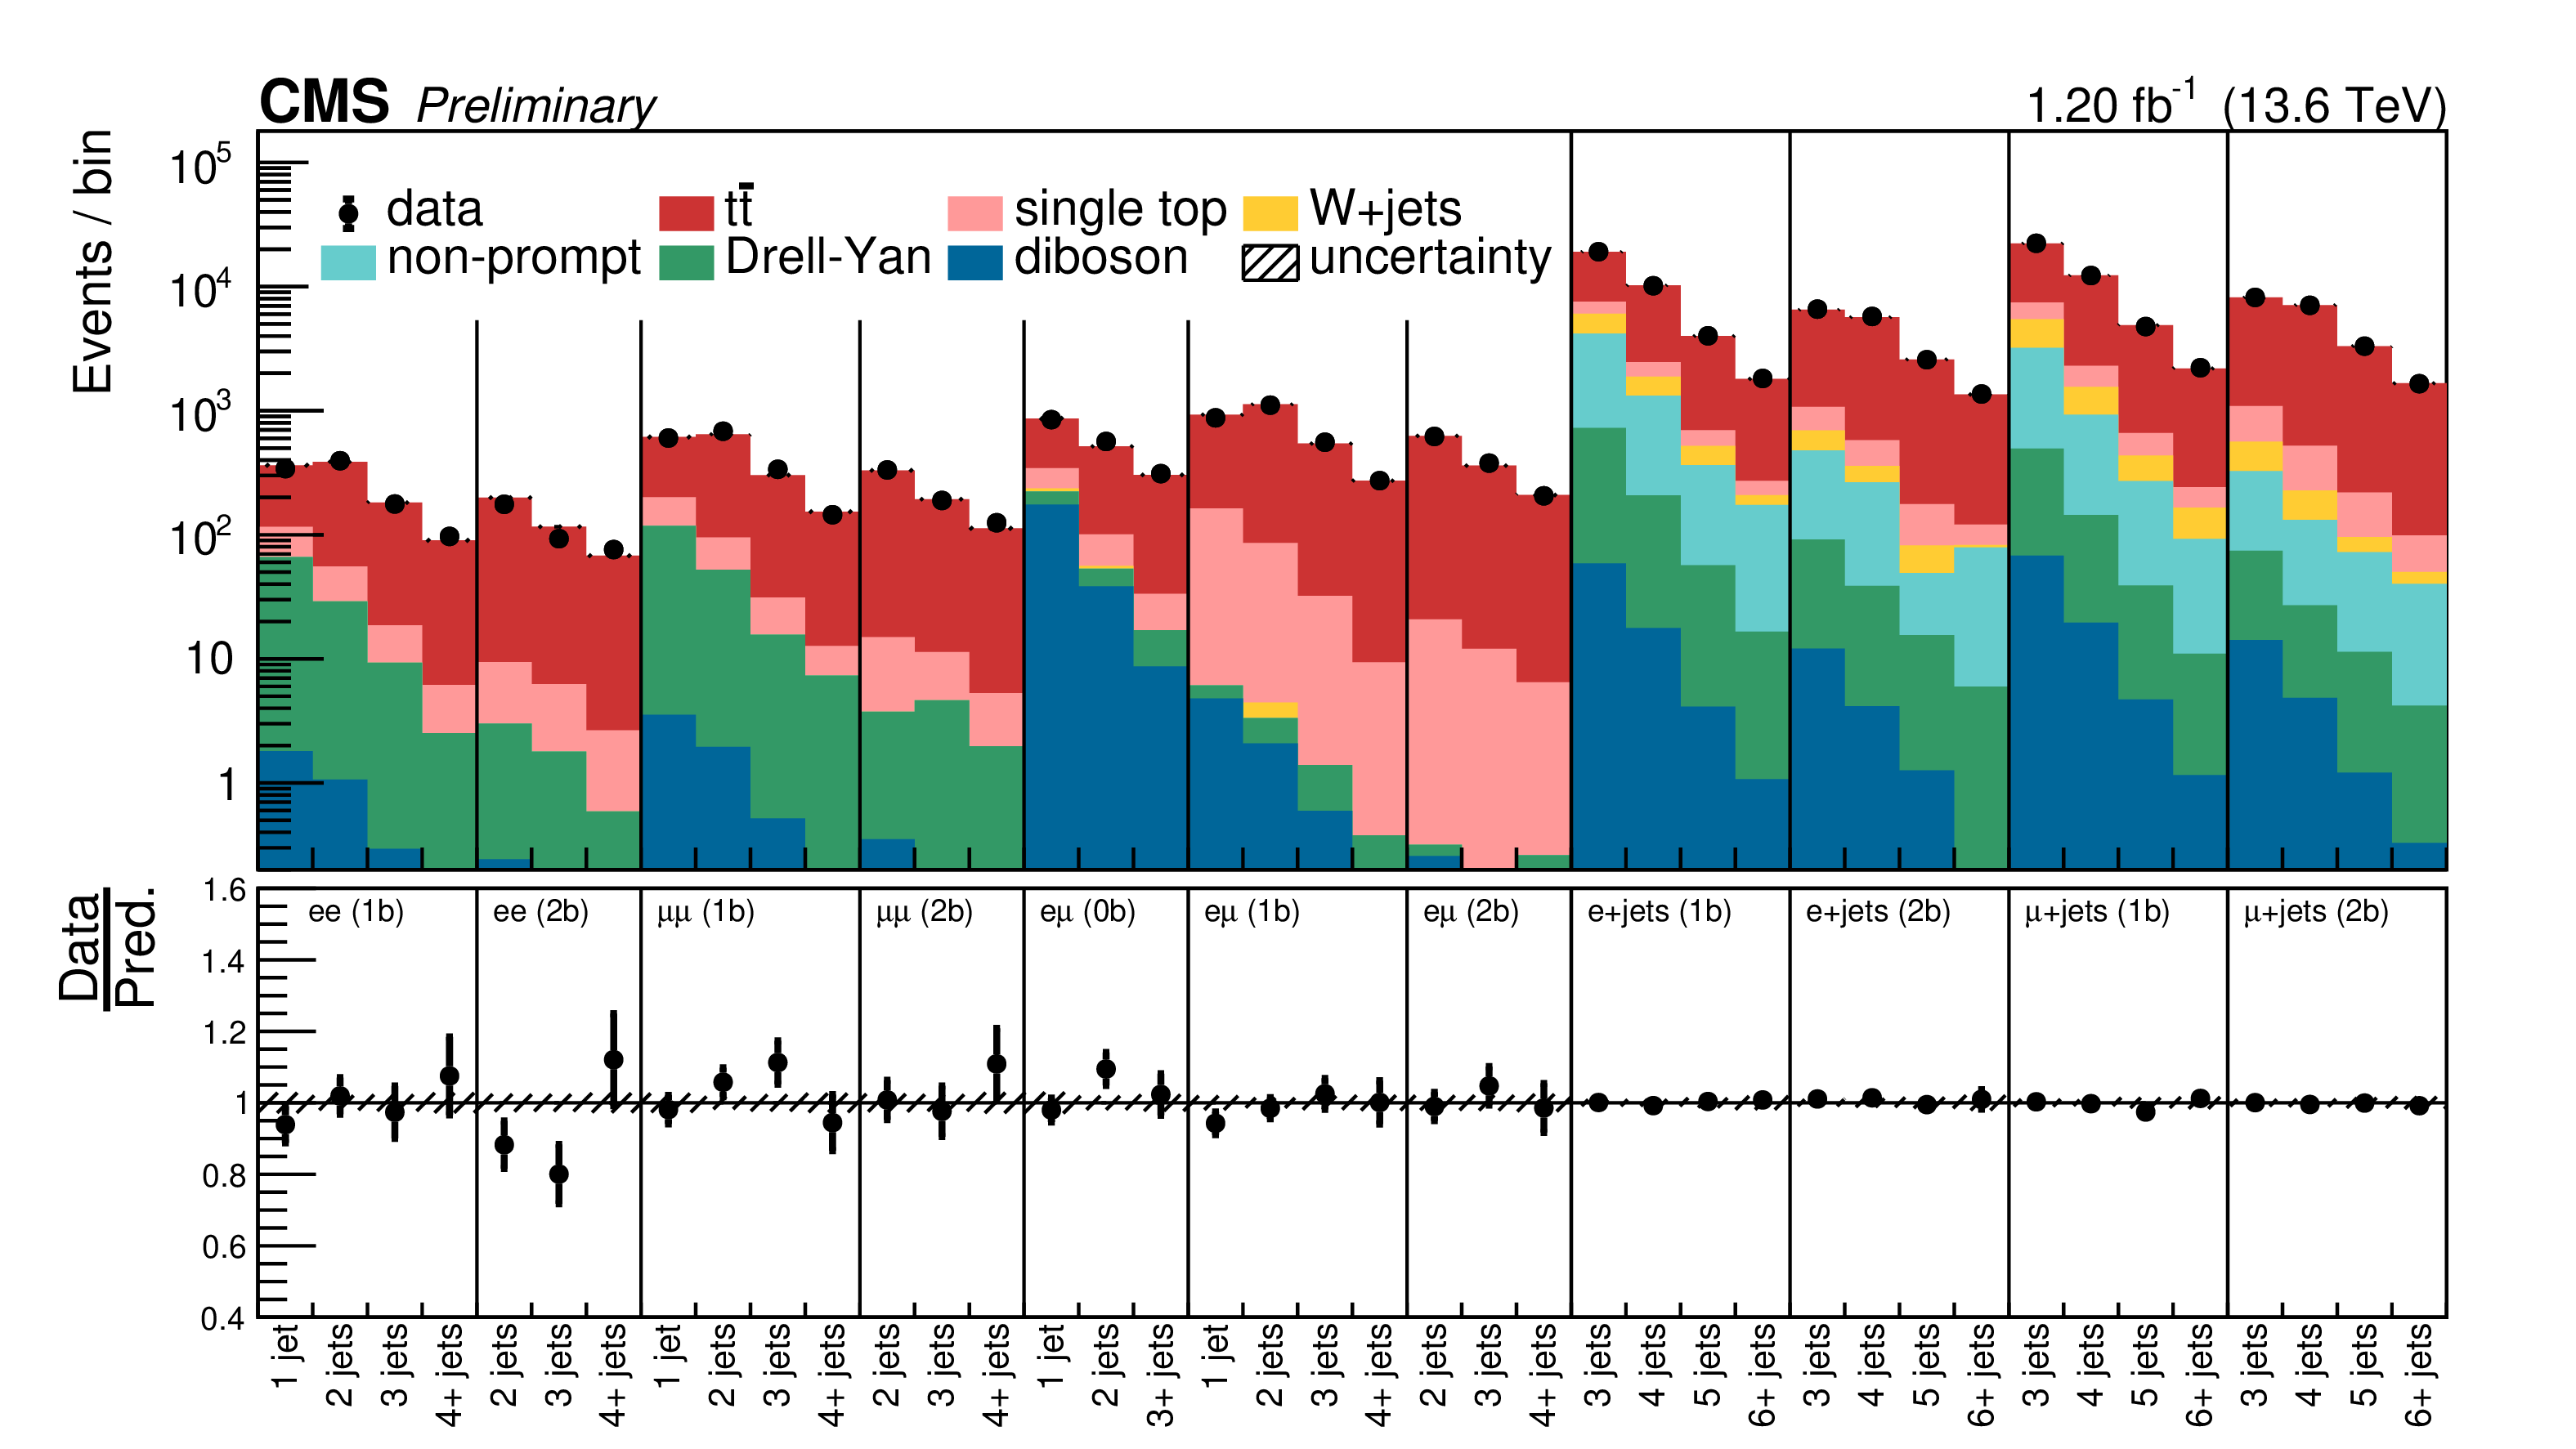
Figure 7:
Resulting postfit agreement and uncertainties after performing the fit. The lepton ID efficiency uncertainties are not included in the uncertainty bands. |
png pdf |
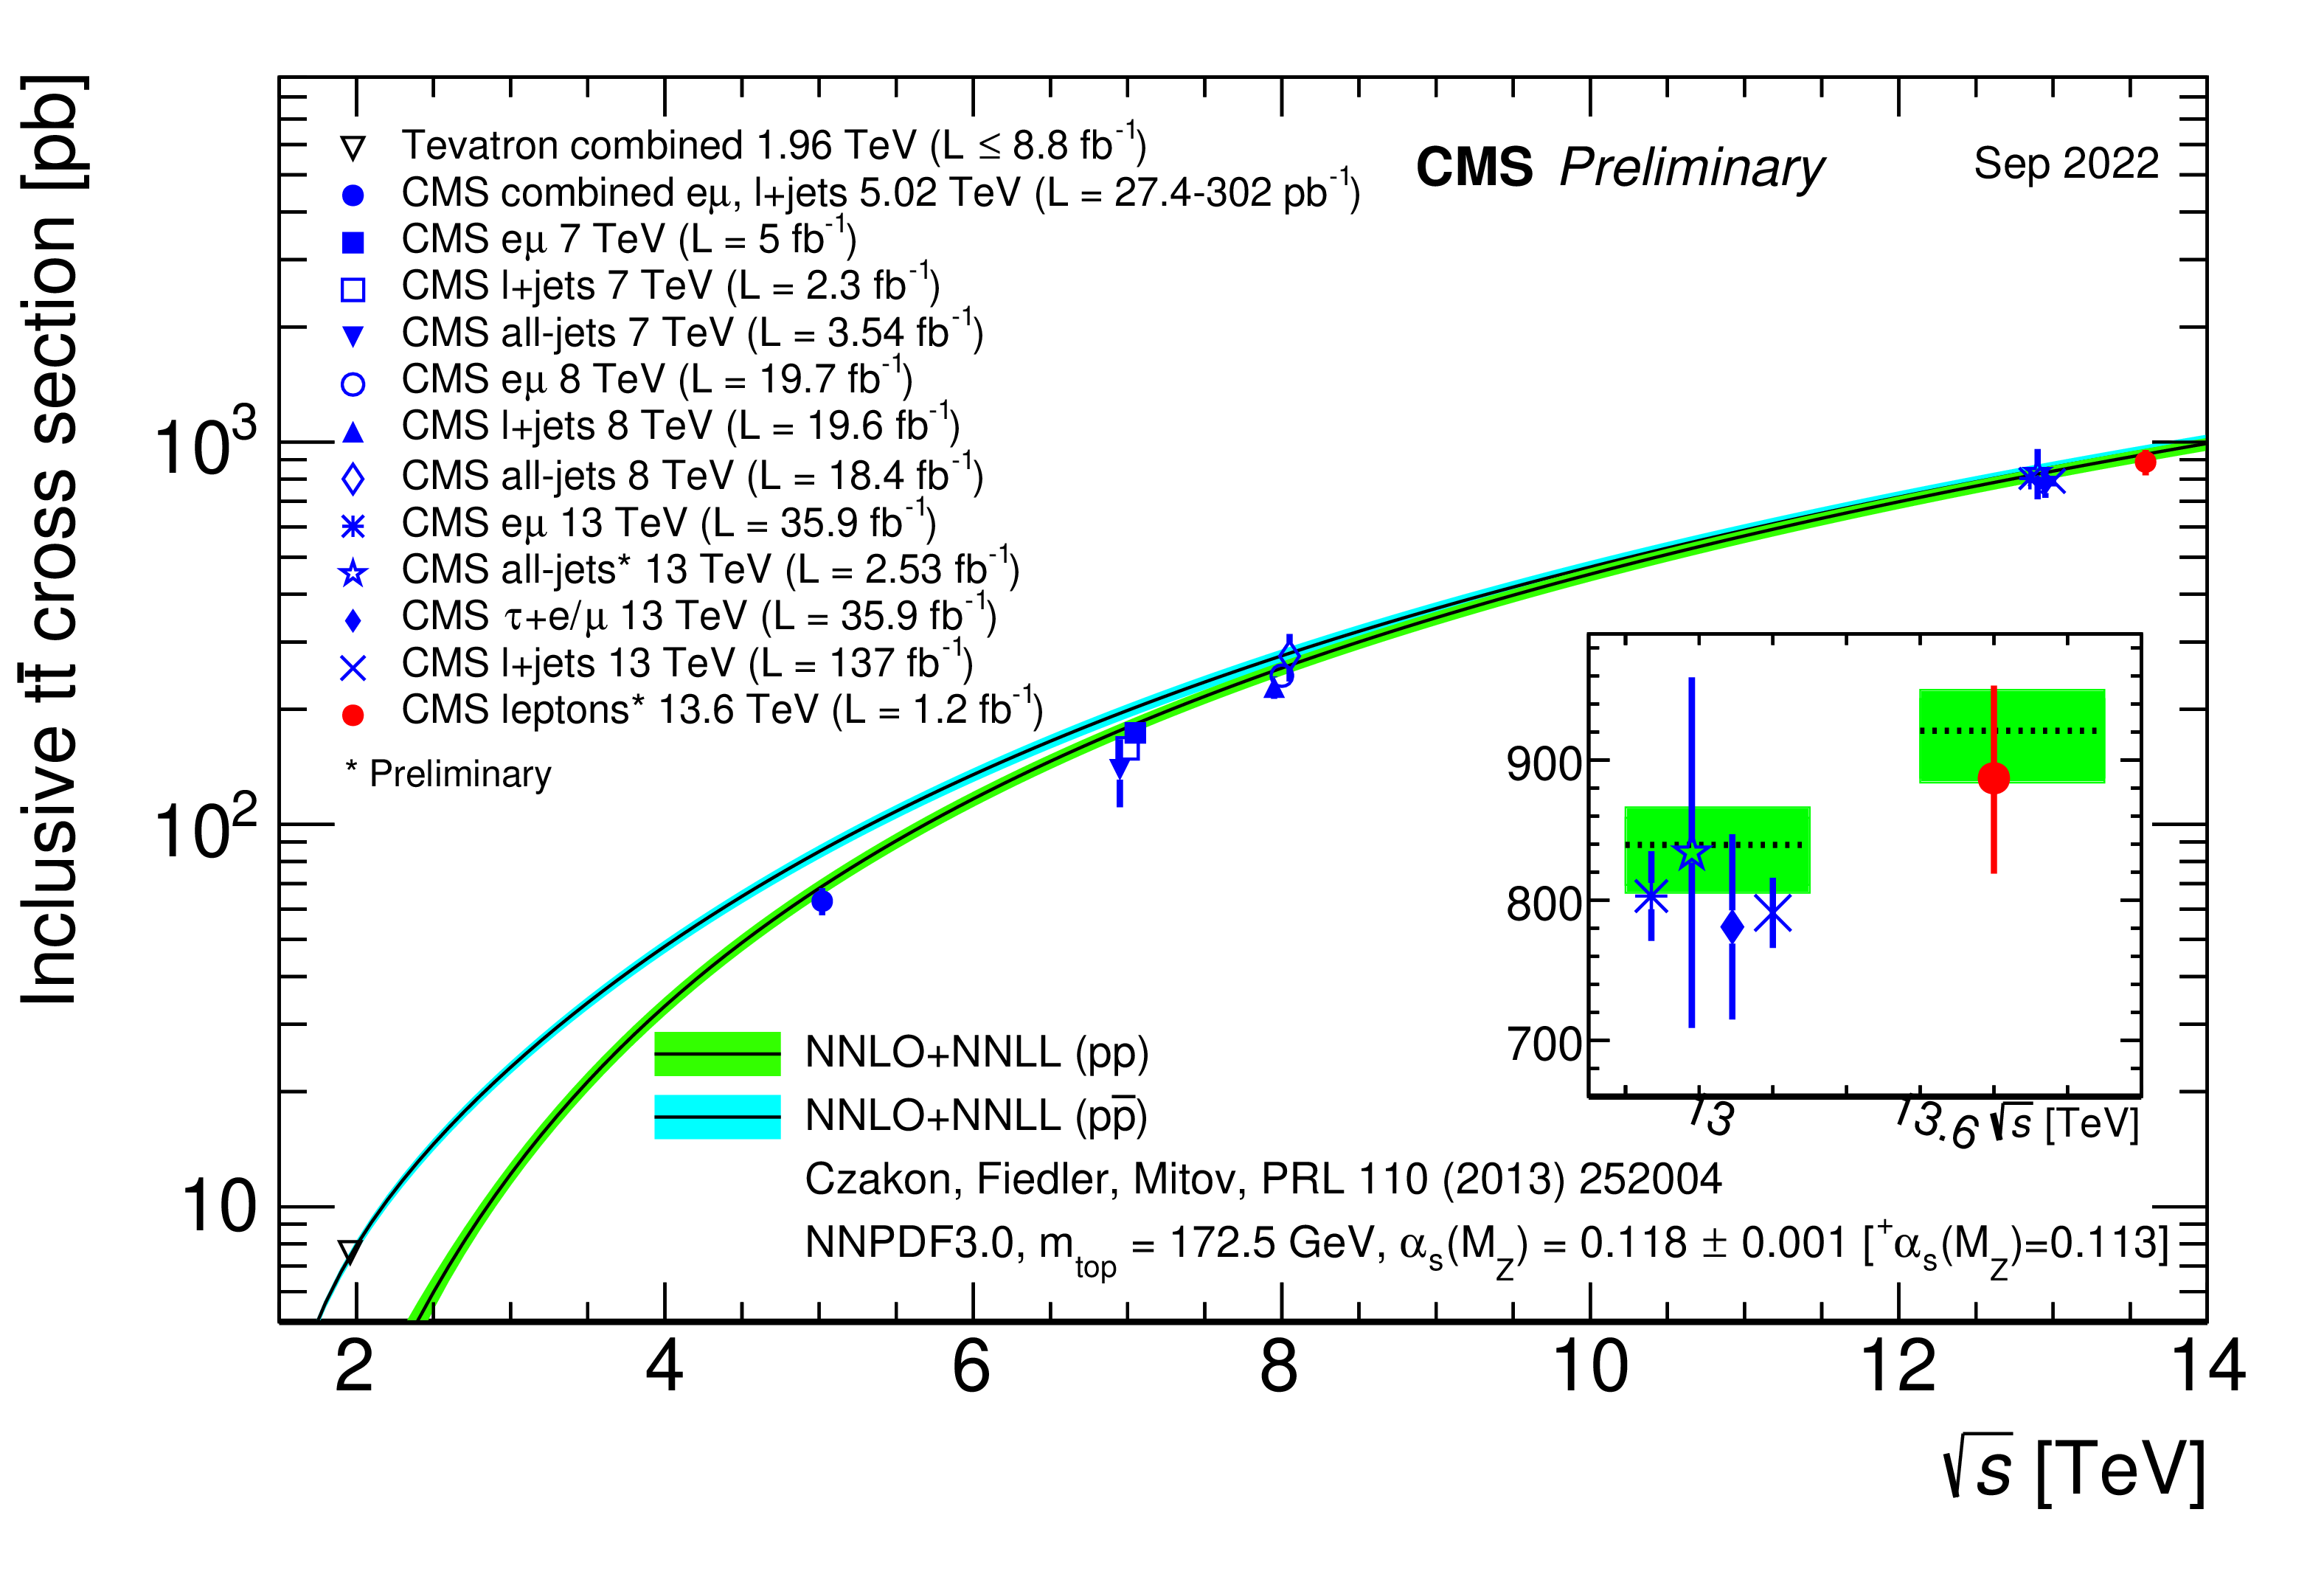
Figure 8:
The $ \mathrm{t}\overline{\mathrm{t}} $ cross section as a function of $ \sqrt{s} $, as obtained in previous measurements by the CMS experiment in pp collisions [1-6,8,11,12] (blue markers) and at the Tevatron in $ \mathrm{p}\overline{\mathrm{p}} $ collisions [64] (empty black downward triangle). The red bullet shows the result from this analysis at $ \sqrt{s} $. Points corresponding to measurements at the same $ \sqrt{s} $ are horizontally shifted for better readability. |
| Tables | |
png pdf |
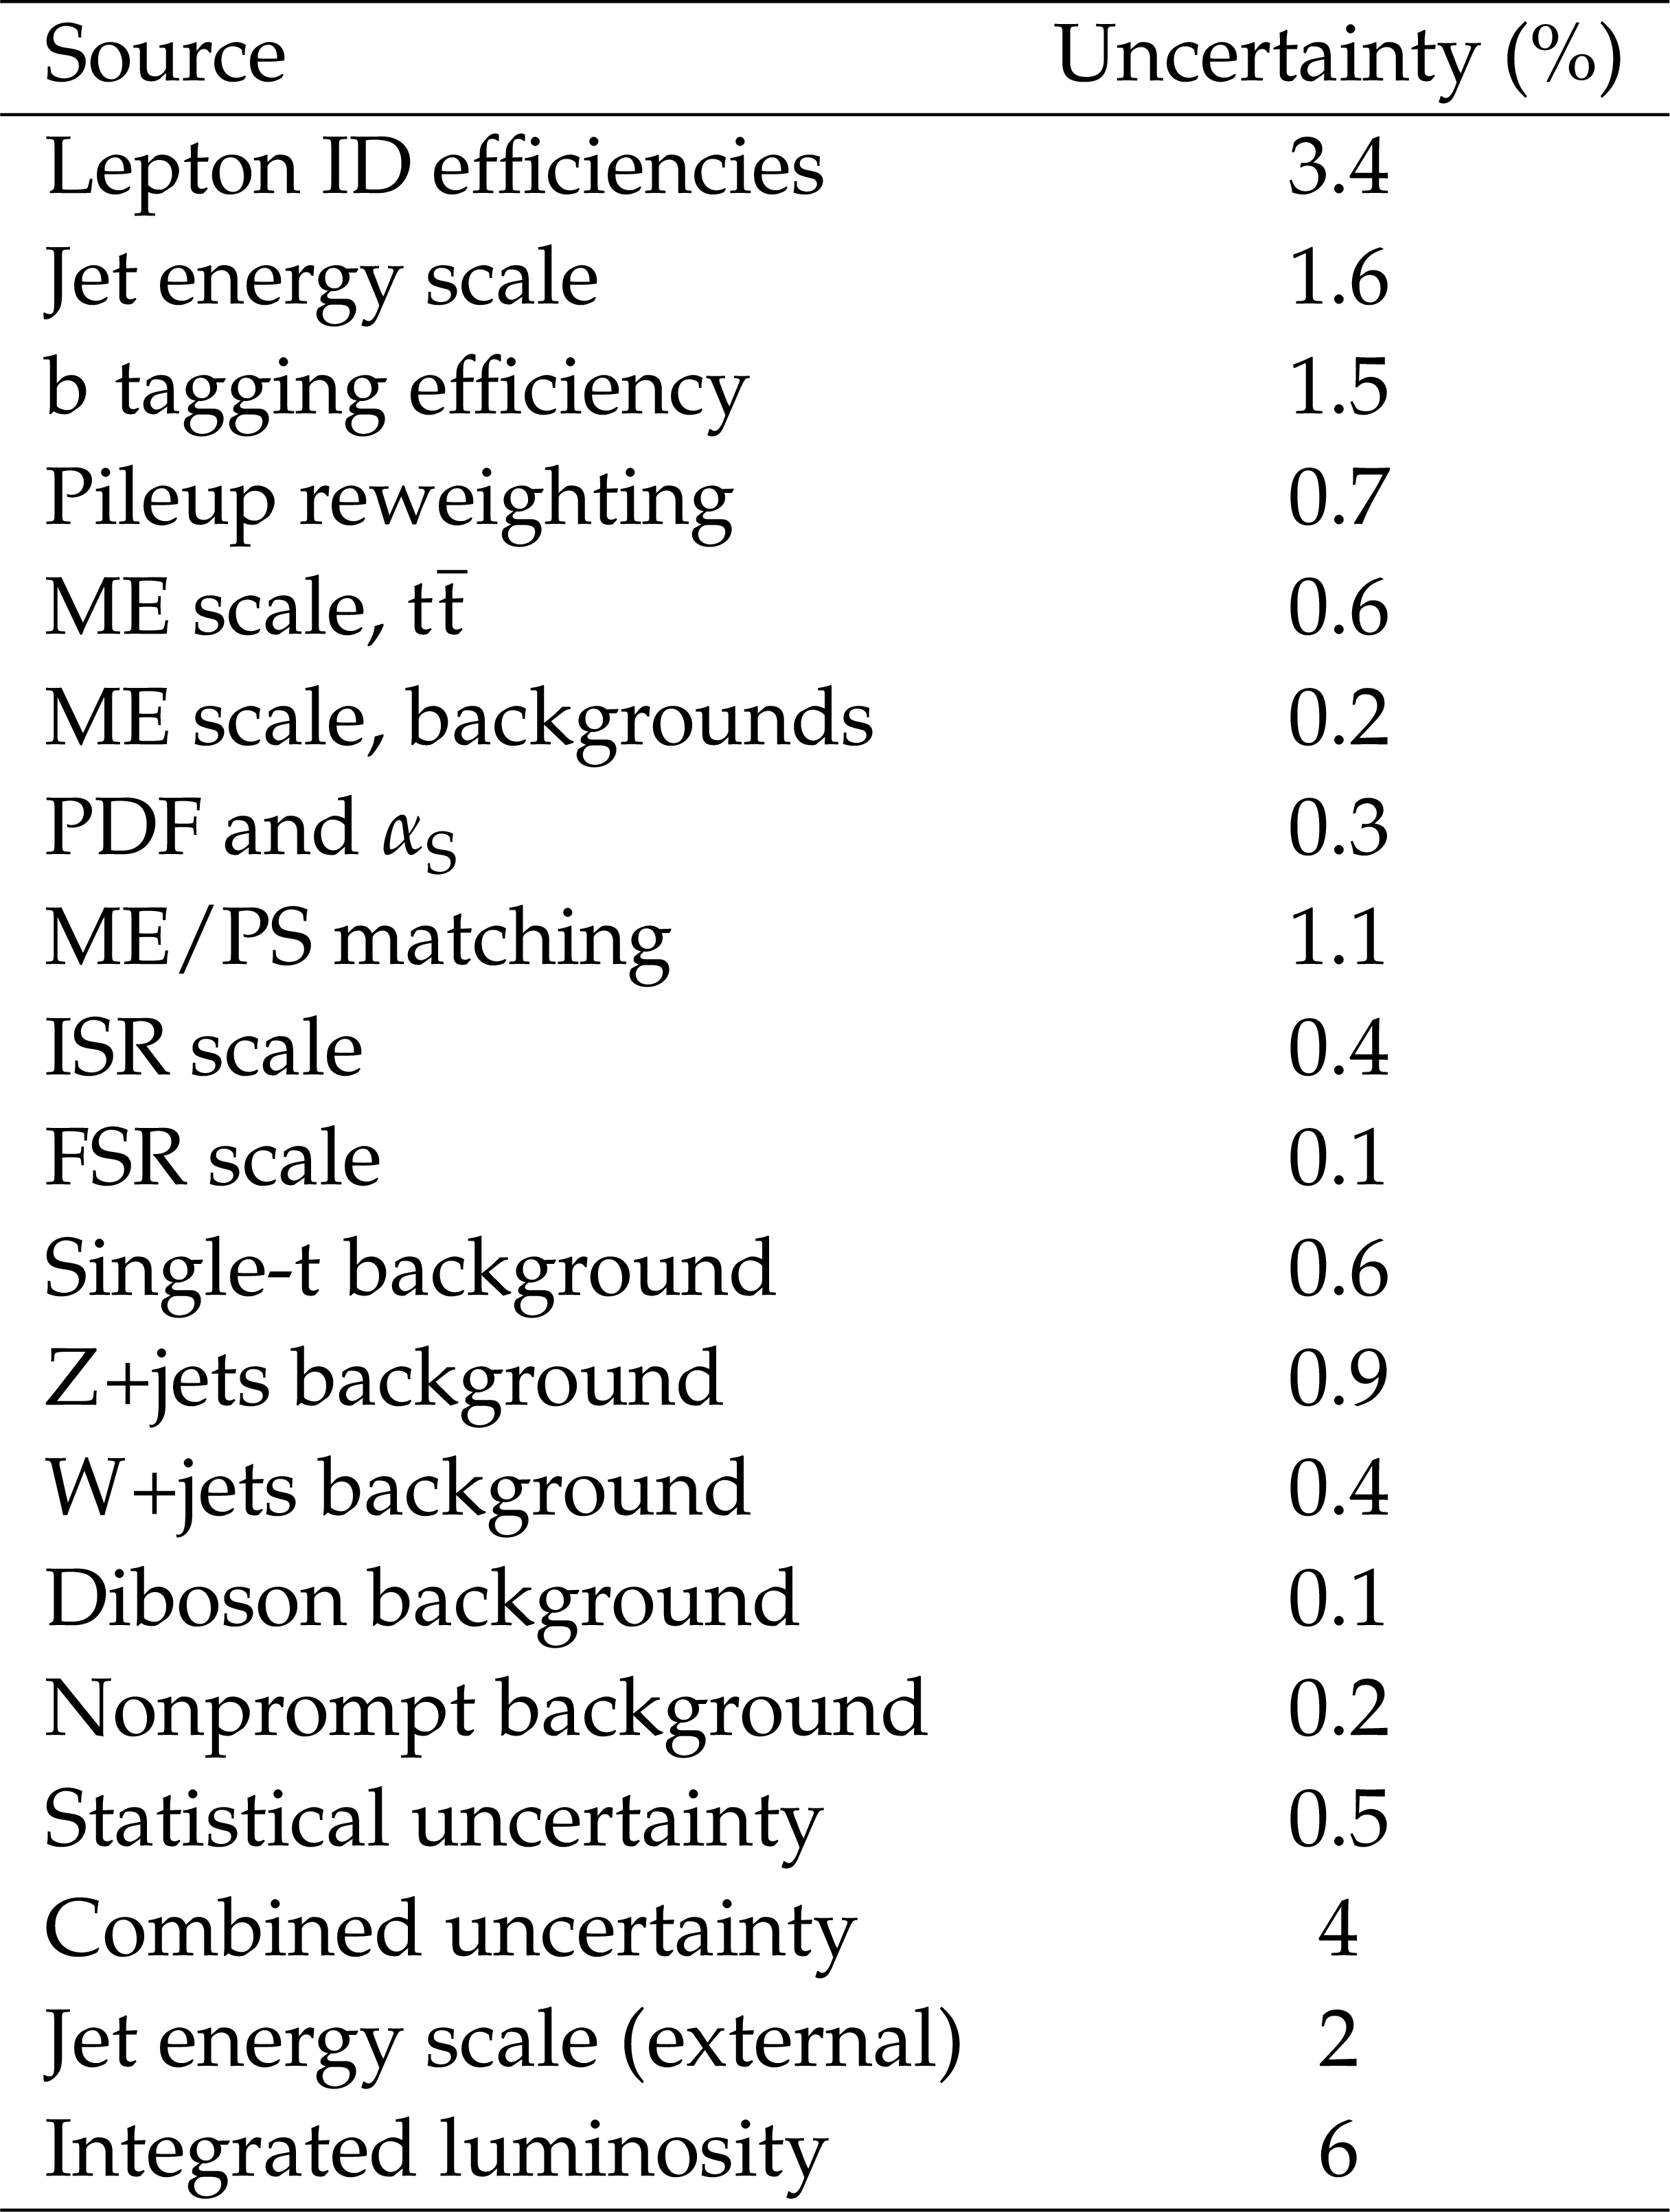
Table 1:
Summary of the sources of uncertainty in the $ \sigma_{\mathrm{t}\overline{\mathrm{t}}} $ measurement. The uncertainty in the integrated luminosity and the additional uncertainty due to the jet energy scale are listed separately. The individual values of relative uncertainty are approximate and given without their correlations. The combined uncertainty, which accounts for the correlations, is symmetrized. |
| Summary |
| The first measurement of the top quark pair ($ \mathrm{t}\overline{\mathrm{t}} $) production cross section in proton-proton collisions at $ \sqrt{s} $ is presented. Data recorded with the CMS detector in July and August 2022, corresponding to an integrated luminosity of 1.20 fb$ ^{-1} $, are analyzed. Events are selected with one or two charged leptons (electrons and muons) and additional jets. A maximum likelihood fit is performed to categories defined by the number and flavors of the leptons, and the number of jets and jets identified as originating from the hadronization of b hadrons. In the fit, uncertainties in the lepton selection efficiencies, the jet energy scale, and the b tagging efficiencies are constrained. An inclusive $ \mathrm{t}\overline{\mathrm{t}} $ production cross section of 887 $ ^{+43}_{-41} $ (stat+syst) $ \pm $ 53 (lumi) pb is measured, compared to the standard model prediction of 921 $ ^{+29}_{-37}$ pb. |
| References | ||||
| 1 | CMS Collaboration | Measurement of the $\mathrm{t}\overline{\mathrm{t}}$ production cross section in the all-jet final state in $ {\mathrm{p}\mathrm{p}} $ collisions at $ \sqrt{s}= $ 7 TeV | JHEP 05 (2013) 065 | CMS-TOP-11-007 1302.0508 |
| 2 | CMS Collaboration | Measurement of the $\mathrm{t}\overline{\mathrm{t}}$ production cross section in the all-jets final state in $ {\mathrm{p}\mathrm{p}} $ collisions at $ \sqrt{s}= $ 8 TeV | EPJC 76 (2016) 128 | CMS-TOP-14-018 1509.06076 |
| 3 | CMS Collaboration | Measurements of the $\mathrm{t}\overline{\mathrm{t}}$ production cross section in lepton+jets final states in $ {\mathrm{p}\mathrm{p}} $ collisions at 8 TeV and ratio of 8 to 7 TeV cross sections | EPJC 77 (2017) 15 | CMS-TOP-12-006 1602.09024 |
| 4 | CMS Collaboration | Measurement of the $\mathrm{t}\overline{\mathrm{t}}$ production cross section in the $ {\mathrm{e}\mu} $ channel in proton-proton collisions at $ \sqrt{s}= $ 7 and 8 TeV | JHEP 08 (2016) 029 | CMS-TOP-13-004 1603.02303 |
| 5 | CMS Collaboration | Measurement of the $\mathrm{t}\overline{\mathrm{t}}$ production cross section at 13 TeV in the all-jets final state | CMS Physics Analysis Summary, 2016 CMS-PAS-TOP-16-013 |
CMS-PAS-TOP-16-013 |
| 6 | CMS Collaboration | Measurement of the $\mathrm{t}\overline{\mathrm{t}}$ production cross section, the top quark mass, and the strong coupling constant using dilepton events in $ {\mathrm{p}\mathrm{p}} $ collisions at $ \sqrt{s}= $ 13 TeV | EPJC 79 (2019) 368 | CMS-TOP-17-001 1812.10505 |
| 7 | ATLAS Collaboration | Measurement of the $\mathrm{t}\overline{\mathrm{t}}$ production cross-section and lepton differential distributions in $\mathrm{e}^\pm\mu^\mp$ dilepton events from pp collisions at \sqrts[13] with the ATLAS detector | EPJC 80 (2020) 528 | 1910.08819 |
| 8 | CMS Collaboration | Measurement of the top quark pair production cross section in dilepton final states containing one $\tau$ lepton in $ {\mathrm{p}\mathrm{p}} $ collisions at $ \sqrt{s}= $ 13 TeV | JHEP 02 (2020) 191 | CMS-TOP-18-005 1911.13204 |
| 9 | ATLAS Collaboration | Measurements of top-quark pair single- and double-differential cross-sections in the all-hadronic channel in pp collisions at \sqrts[13] using the ATLAS detector | JHEP 01 (2021) 033 | 2006.09274 |
| 10 | ATLAS Collaboration | Measurement of the $\mathrm{t}\overline{\mathrm{t}}$ production cross-section in the lepton+jets channel at \sqrts[13] with the ATLAS experiment | PLB 810 (2020) 135797 | 2006.13076 |
| 11 | CMS Collaboration | Measurement of differential $\mathrm{t}\overline{\mathrm{t}}$ production cross sections in the full kinematic range using lepton+jets events from proton-proton collisions at $ \sqrt{s}= $ 13 TeV | PRD 104 (2021) 092013 | CMS-TOP-20-001 2108.02803 |
| 12 | CMS Collaboration | Measurement of the inclusive $\mathrm{t}\overline{\mathrm{t}}$ production cross section in proton-proton collisions at $ \sqrt{s}= $ 5.02 TeV | JHEP 04 (2022) 144 | CMS-TOP-20-004 2112.09114 |
| 13 | ATLAS and CMS Collaborations | Combination of inclusive top-quark pair production cross-section measurements using ATLAS and CMS data at $ \sqrt{s}= $ 7 and 8 TeV | Submitted to JHEP, 2022 | 2205.13830 |
| 14 | ATLAS Collaboration | Measurement of the $\mathrm{t}\overline{\mathrm{t}}$ production cross-section in pp collisions at \sqrts[5.02] with the ATLAS detector | Submitted to JHEP, 2022 | 2207.01354 |
| 15 | M. Cacciari et al. | Top-pair production at hadron colliders with next-to-next-to-leading logarithmic soft-gluon resummation | PLB 710 (2012) 612 | 1111.5869 |
| 16 | P. Barnreuther, M. Czakon, and A. Mitov | Percent level precision physics at the Tevatron: Next-to-next-to-leading order QCD corrections to $ \mathrm{q}\overline{\mathrm{q}}\to\mathrm{t}\overline{\mathrm{t}}$+X | PRL 109 (2012) 132001 | 1204.5201 |
| 17 | M. Czakon and A. Mitov | NNLO corrections to top-pair production at hadron colliders: the all-fermionic scattering channels | JHEP 12 (2012) 054 | 1207.0236 |
| 18 | M. Czakon and A. Mitov | NNLO corrections to top pair production at hadron colliders: the quark-gluon reaction | JHEP 01 (2013) 080 | 1210.6832 |
| 19 | M. Czakon, P. Fiedler, and A. Mitov | Total top-quark pair-production cross section at hadron colliders through $ \mathcal{O}({\alpha_\mathrm{S}}^4) $ | PRL 110 (2013) 252004 | 1303.6254 |
| 20 | S. Catani et al. | Top-quark pair hadroproduction at next-to-next-to-leading order in QCD | PRD 99 (2019) 051501 | 1901.04005 |
| 21 | M. Czakon and A. Mitov | \textsctop++: a program for the calculation of the top-pair cross-section at hadron colliders | Comput. Phys. Commun. 185 (2014) 2930 | 1112.5675 |
| 22 | CMS Collaboration | The CMS experiment at the CERN LHC | JINST 3 (2008) S08004 | |
| 23 | CMS Collaboration | Performance of the CMS Level-1 trigger in proton-proton collisions at $ \sqrt{s}= $ 13 TeV | JINST 15 (2020) P10017 | CMS-TRG-17-001 2006.10165 |
| 24 | CMS Collaboration | The CMS trigger system | JINST 12 (2017) P01020 | CMS-TRG-12-001 1609.02366 |
| 25 | CMS Collaboration | Particle-flow reconstruction and global event description with the CMS detector | JINST 12 (2017) P10003 | CMS-PRF-14-001 1706.04965 |
| 26 | CMS Collaboration | Technical proposal for the Phase-II upgrade of the Compact Muon Solenoid | CMS Technical Proposal CERN-LHCC-2015-010, CMS-TDR-15-02, 2015 CDS |
|
| 27 | M. Cacciari, G. P. Salam, and G. Soyez | The anti-$k_{\mathrm{T}}$ jet clustering algorithm | JHEP 04 (2008) 063 | 0802.1189 |
| 28 | M. Cacciari, G. P. Salam, and G. Soyez | FastJet user manual | EPJC 72 (2012) 1896 | 1111.6097 |
| 29 | CMS Collaboration | Jet energy scale and resolution in the CMS experiment in $ {\mathrm{p}\mathrm{p}} $ collisions at 8 TeV | JINST 12 (2017) P02014 | CMS-JME-13-004 1607.03663 |
| 30 | CMS Collaboration | Pileup mitigation at CMS in 13 TeV data | JINST 15 (2020) P09018 | CMS-JME-18-001 2003.00503 |
| 31 | CMS Collaboration | Jet algorithms performance in 13 TeV data | CMS Physics Analysis Summary, 2017 CMS-PAS-JME-16-003 |
CMS-PAS-JME-16-003 |
| 32 | CMS Collaboration | Measurements of inclusive W and Z cross sections in $ {\mathrm{p}\mathrm{p}} $ collisions at $ \sqrt{s}= $ 7 TeV | JHEP 01 (2011) 080 | CMS-EWK-10-002 1012.2466 |
| 33 | CMS Collaboration | Precision luminosity measurement in proton-proton collisions at $ \sqrt{s}= $ 13 TeV in 2015 and 2016 at CMS | EPJC 81 (2021) 800 | CMS-LUM-17-003 2104.01927 |
| 34 | CMS BRIL Collaboration | The Pixel Luminosity Telescope: A detector for luminosity measurement at CMS using silicon pixel sensors | Submitted to Eur. Phys. J. C, 2022 | 2206.08870 |
| 35 | CMS Collaboration | Upgraded CMS Fast Beam Condition Monitor for LHC Run 3 online luminosity and beam induced background measurements | CMS Detector Performance Note CMS-DP-2022-033, 2022 CDS |
|
| 36 | CMS Collaboration | Emittance scans for CMS luminosity calibration in 2017 | CMS Detector Performance Note CMS-DP-2018-011, 2018 CDS |
|
| 37 | S. Frixione, G. Ridolfi, and P. Nason | A positive-weight next-to-leading-order Monte Carlo for heavy flavour hadroproduction | JHEP 09 (2007) 126 | 0707.3088 |
| 38 | S. Frixione, P. Nason, and C. Oleari | Matching NLO QCD computations with parton shower simulations: the POWHEG method | JHEP 11 (2007) 070 | 0709.2092 |
| 39 | S. Alioli, P. Nason, C. Oleari, and E. Re | A general framework for implementing NLO calculations in shower Monte Carlo programs: the POWHEG \textscbox | JHEP 06 (2010) 043 | 1002.2581 |
| 40 | P. Artoisenet, R. Frederix, O. Mattelaer, and R. Rietkerk | Automatic spin-entangled decays of heavy resonances in Monte Carlo simulations | JHEP 03 (2013) 015 | 1212.3460 |
| 41 | J. Alwall et al. | The automated computation of tree-level and next-to-leading order differential cross sections, and their matching to parton shower simulations | JHEP 07 (2014) 079 | 1405.0301 |
| 42 | T. Sjöstrand et al. | An introduction to PYTHIA8.2 | Comput. Phys. Commun. 191 (2015) 159 | 1410.3012 |
| 43 | NNPDF Collaboration | Parton distributions from high-precision collider data | EPJC 77 (2017) 663 | 1706.00428 |
| 44 | CMS Collaboration | Extraction and validation of a new set of CMS PYTHIA8 tunes from underlying-event measurements | EPJC 80 (2020) 4 | CMS-GEN-17-001 1903.12179 |
| 45 | J. Alwall et al. | Comparative study of various algorithms for the merging of parton showers and matrix elements in hadronic collisions | EPJC 53 (2008) 473 | 0706.2569 |
| 46 | S. Agostinelli et al. | GEANT 4---a simulation toolkit | NIM A 506 (2003) 250 | |
| 47 | J. Campbell, T. Neumann, and Z. Sullivan | Single-top-quark production in the $ t $-channel at NNLO | JHEP 02 (2021) 040 | 2012.01574 |
| 48 | N. Kidonakis and N. Yamanaka | Higher-order corrections for $\mathrm{t}\mathrm{W}$ production at high-energy hadron colliders | JHEP 05 (2021) 278 | 2102.11300 |
| 49 | S. Camarda et al. | \textscDYTurbo: Fast predictions for Drell--Yan processes | EPJC 80 (2020) 251 | 1910.07049 |
| 50 | M. Grazzini, S. Kallweit, and M. Wiesemann | Fully differential NNLO computations with \textscmatrix | EPJC 78 (2018) 537 | 1711.06631 |
| 51 | CMS Collaboration | Electron and photon reconstruction and identification with the CMS experiment at the CERN LHC | JINST 16 (2021) P05014 | CMS-EGM-17-001 2012.06888 |
| 52 | CMS Collaboration | Performance of the CMS muon detector and muon reconstruction with proton-proton collisions at $ \sqrt{s}= $ 13 TeV | JINST 13 (2018) P06015 | CMS-MUO-16-001 1804.04528 |
| 53 | CMS Collaboration | Identification of heavy-flavour jets with the CMS detector in $ {\mathrm{p}\mathrm{p}} $ collisions at 13 TeV | JINST 13 (2018) P05011 | CMS-BTV-16-002 1712.07158 |
| 54 | CMS Collaboration | Performance of the DeepJet b tagging algorithm using 41.9 fb$^{-1}$ of data from proton-proton collisions at 13 TeV with Phase 1 CMS detector | CMS Detector Performance Note CMS-DP-2018-058, 2018 CDS |
|
| 55 | E. Bols et al. | Jet flavour classification using DeepJet | JINST 15 (2020) P12012 | 2008.10519 |
| 56 | Particle Data Group , R. L. Workman et al. | Review of particle physics | Prog. Theor. Exp. Phys. 2022 (2022) 083C01 | |
| 57 | CMS Collaboration | Search for dark matter particles produced in association with a top quark pair at $ \sqrt{s}= $ 13 TeV | PRL 122 (2019) 011803 | CMS-EXO-16-049 1807.06522 |
| 58 | S. van der Meer | Calibration of the effective beam height in the ISR | ISR Report CERN-ISR-PO-68-31, 1968 | |
| 59 | P. Grafström and W. Kozanecki | Luminosity determination at proton colliders | Prog. Part. Nucl. Phys. 81 (2015) 97 | |
| 60 | CMS Collaboration | CMS $ {\mathrm{Z}(\mu\mu)} $ yields for comparisons with ATLAS | CMS Detector Performance Note CMS-DP-2012-014, 2012 CDS |
|
| 61 | M. Cacciari et al. | The $\mathrm{t}\overline{\mathrm{t}}$ cross-section at 1.8 and 1.96 TeV: a study of the systematics due to parton densities and scale dependence | JHEP 04 (2004) 068 | hep-ph/0303085 |
| 62 | CMS Collaboration | Investigations of the impact of the parton shower tuning in PYTHIA8 in the modelling of $\mathrm{t}\overline{\mathrm{t}}$ at $ \sqrt{s}= $ 8 and 13 TeV | CMS Physics Analysis Summary, 2016 CMS-PAS-TOP-16-021 |
CMS-PAS-TOP-16-021 |
| 63 | J. Butterworth et al. | PDF4LHC recommendations for LHC Run II | JPG 43 (2016) 023001 | 1510.03865 |
| 64 | CDF and D0 Collaborations | Combination of measurements of the top-quark pair production cross section from the Tevatron collider | PRD 89 (2014) 072001 | 1309.7570 |
|
|
Compact Muon Solenoid LHC, CERN |
|

|

|

|

|

|