

Compact Muon Solenoid
LHC, CERN
| CMS-PAS-TOP-21-014 | ||
| Measurement of the $\mathrm{t\bar{t}}$ charge asymmetry in highly boosted events in the single-lepton channel at 13 TeV | ||
| CMS Collaboration | ||
| May 2022 | ||
| Abstract: The measurement of the charge asymmetry for highly boosted top quark pairs decaying to a single lepton and jets is presented. The analysis is performed using 138 fb$^{-1}$ of data collected in pp collisions at $\sqrt{s}= $ 13 TeV with the CMS detector during Run 2 of the Large Hadron Collider. The selection is optimized for top quark-antiquark pairs produced with large Lorentz boosts, resulting in non-isolated leptons and overlapping jets. The top quark charge asymmetry is measured for events with $\mathrm{t\bar{t}}$ invariant mass larger than 750 GeV and corrected for detector and acceptance effects using a binned maximum likelihood fit. The measured top quark charge asymmetry is in good agreement with the standard model prediction at next-to-next-to-leading order in perturbation theory with next-to-leading order electroweak corrections. Differential distributions for two invariant mass ranges are also presented. | ||
|
Links:
CDS record (PDF) ;
CADI line (restricted) ;
These preliminary results are superseded in this paper, PLB 846 (2023) 137703. The superseded preliminary plots can be found here. |
||
| Figures | |
png pdf |
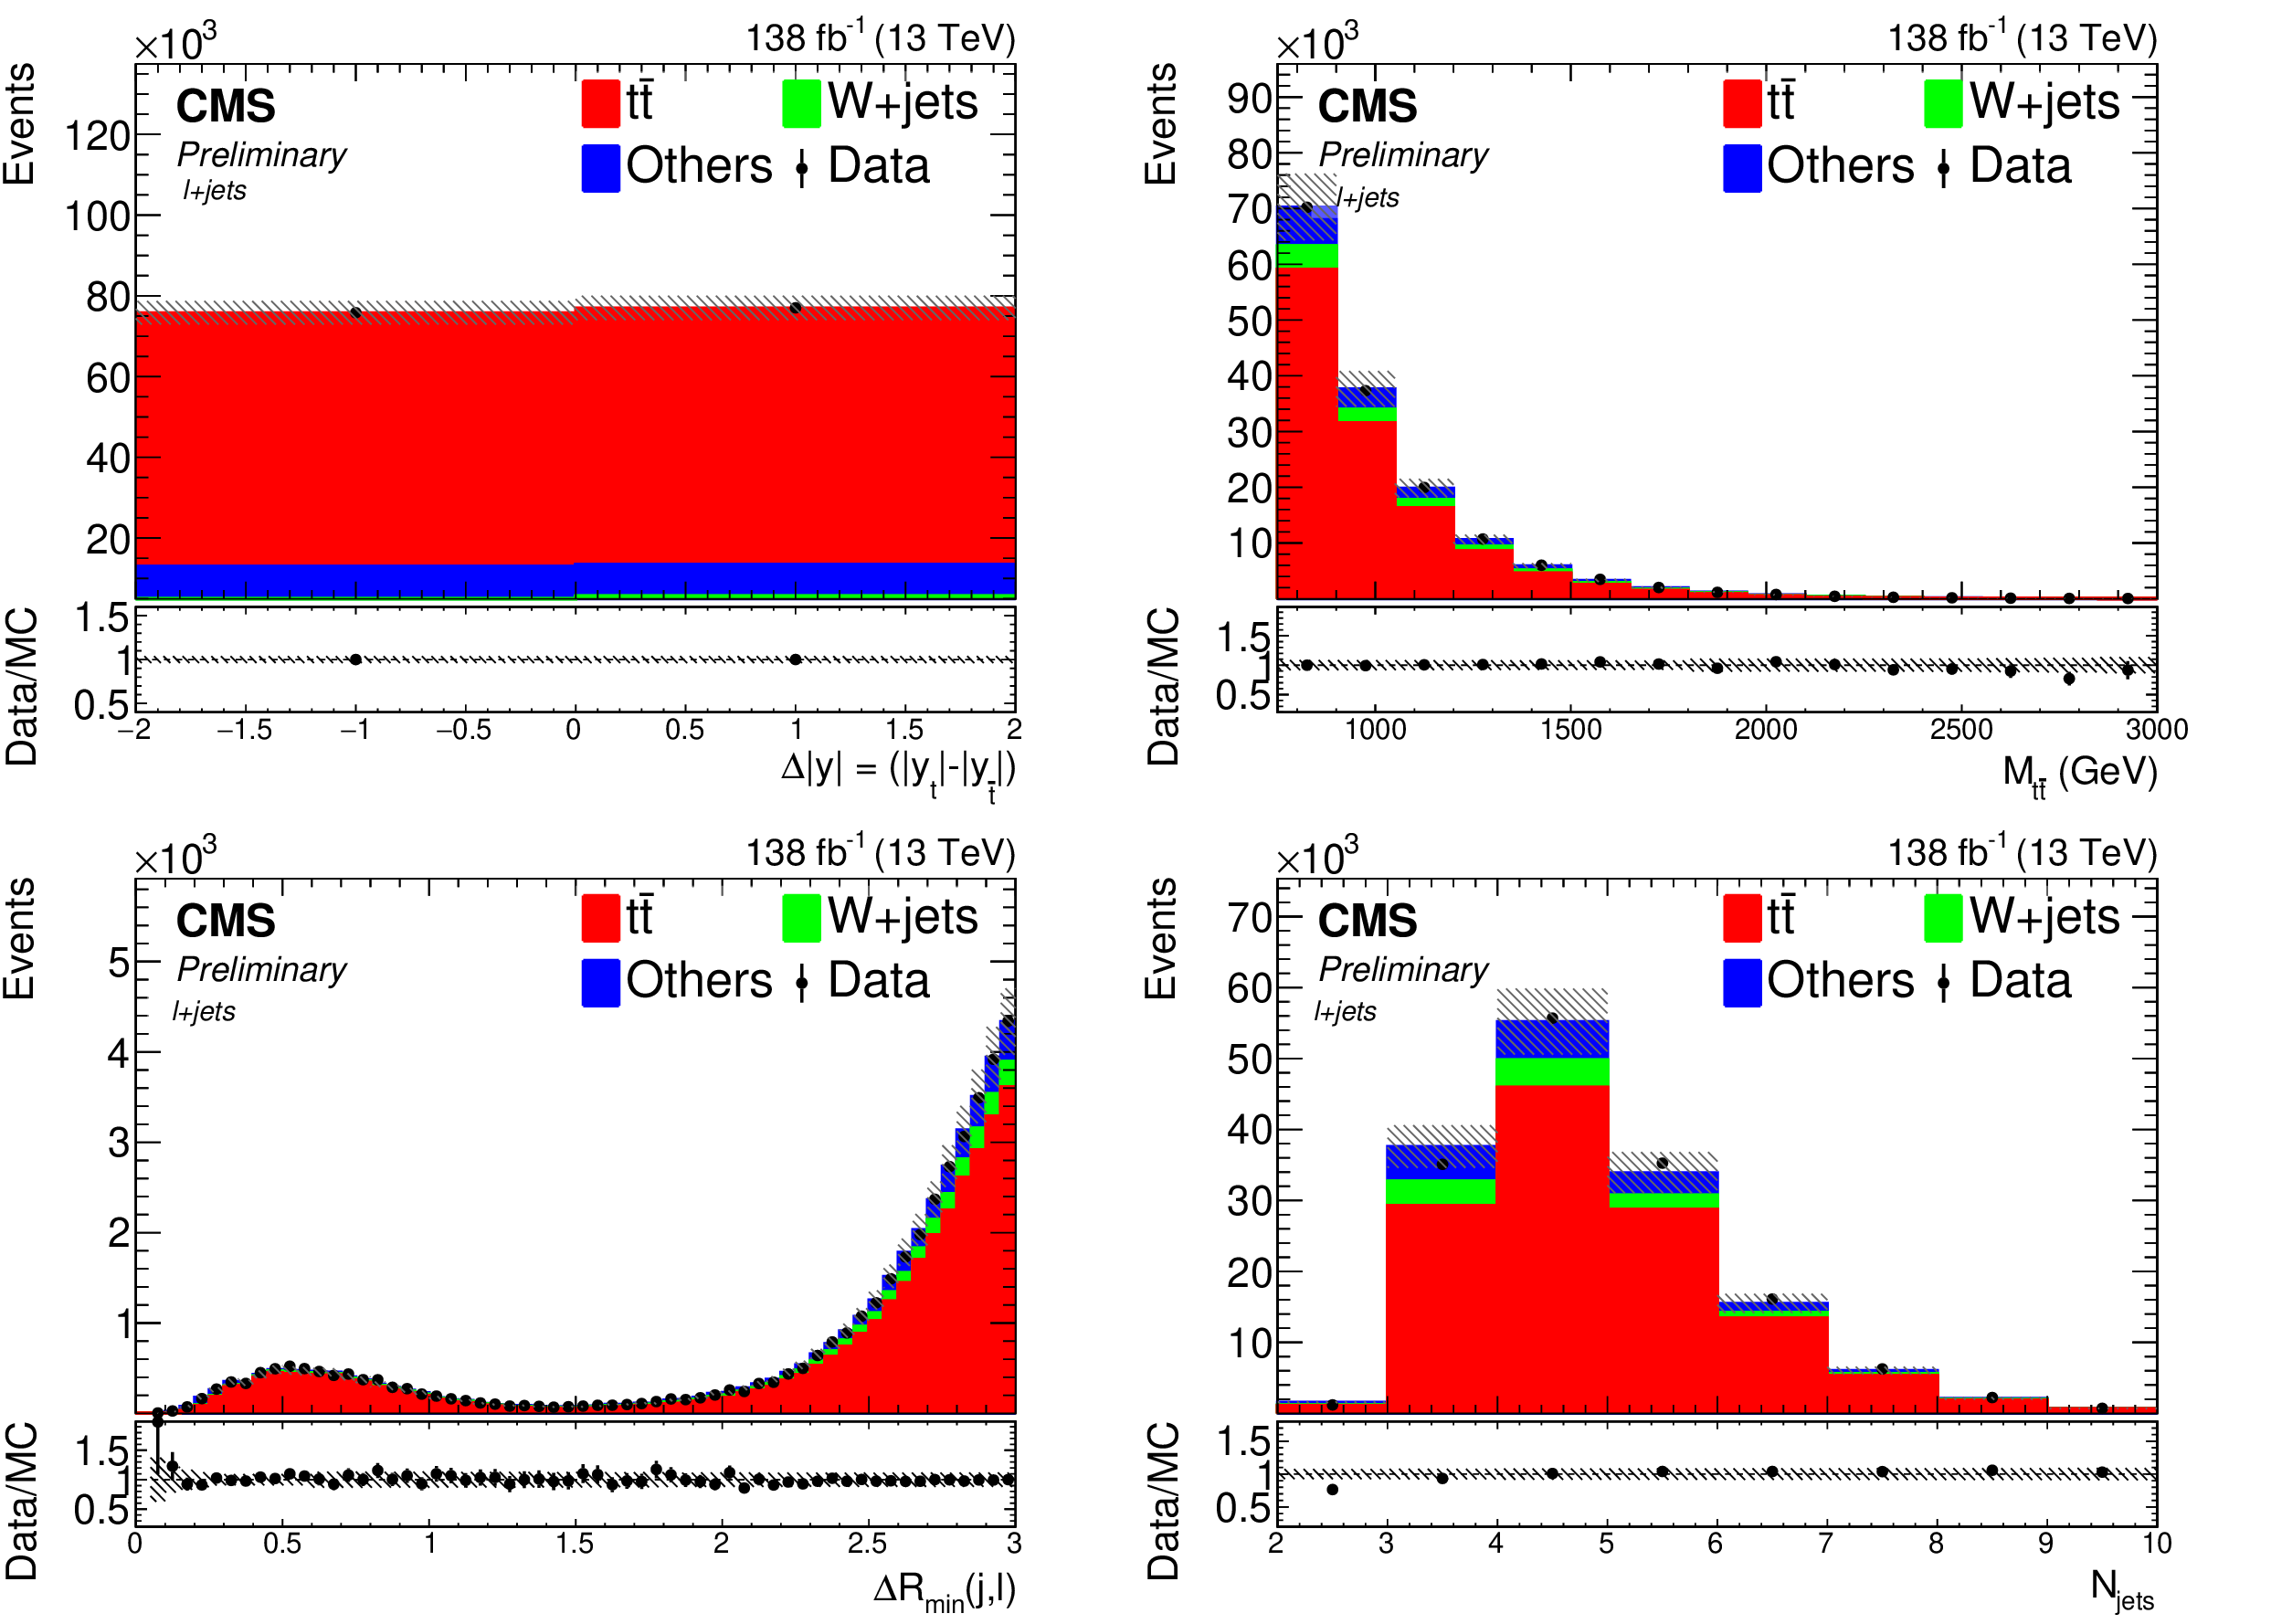
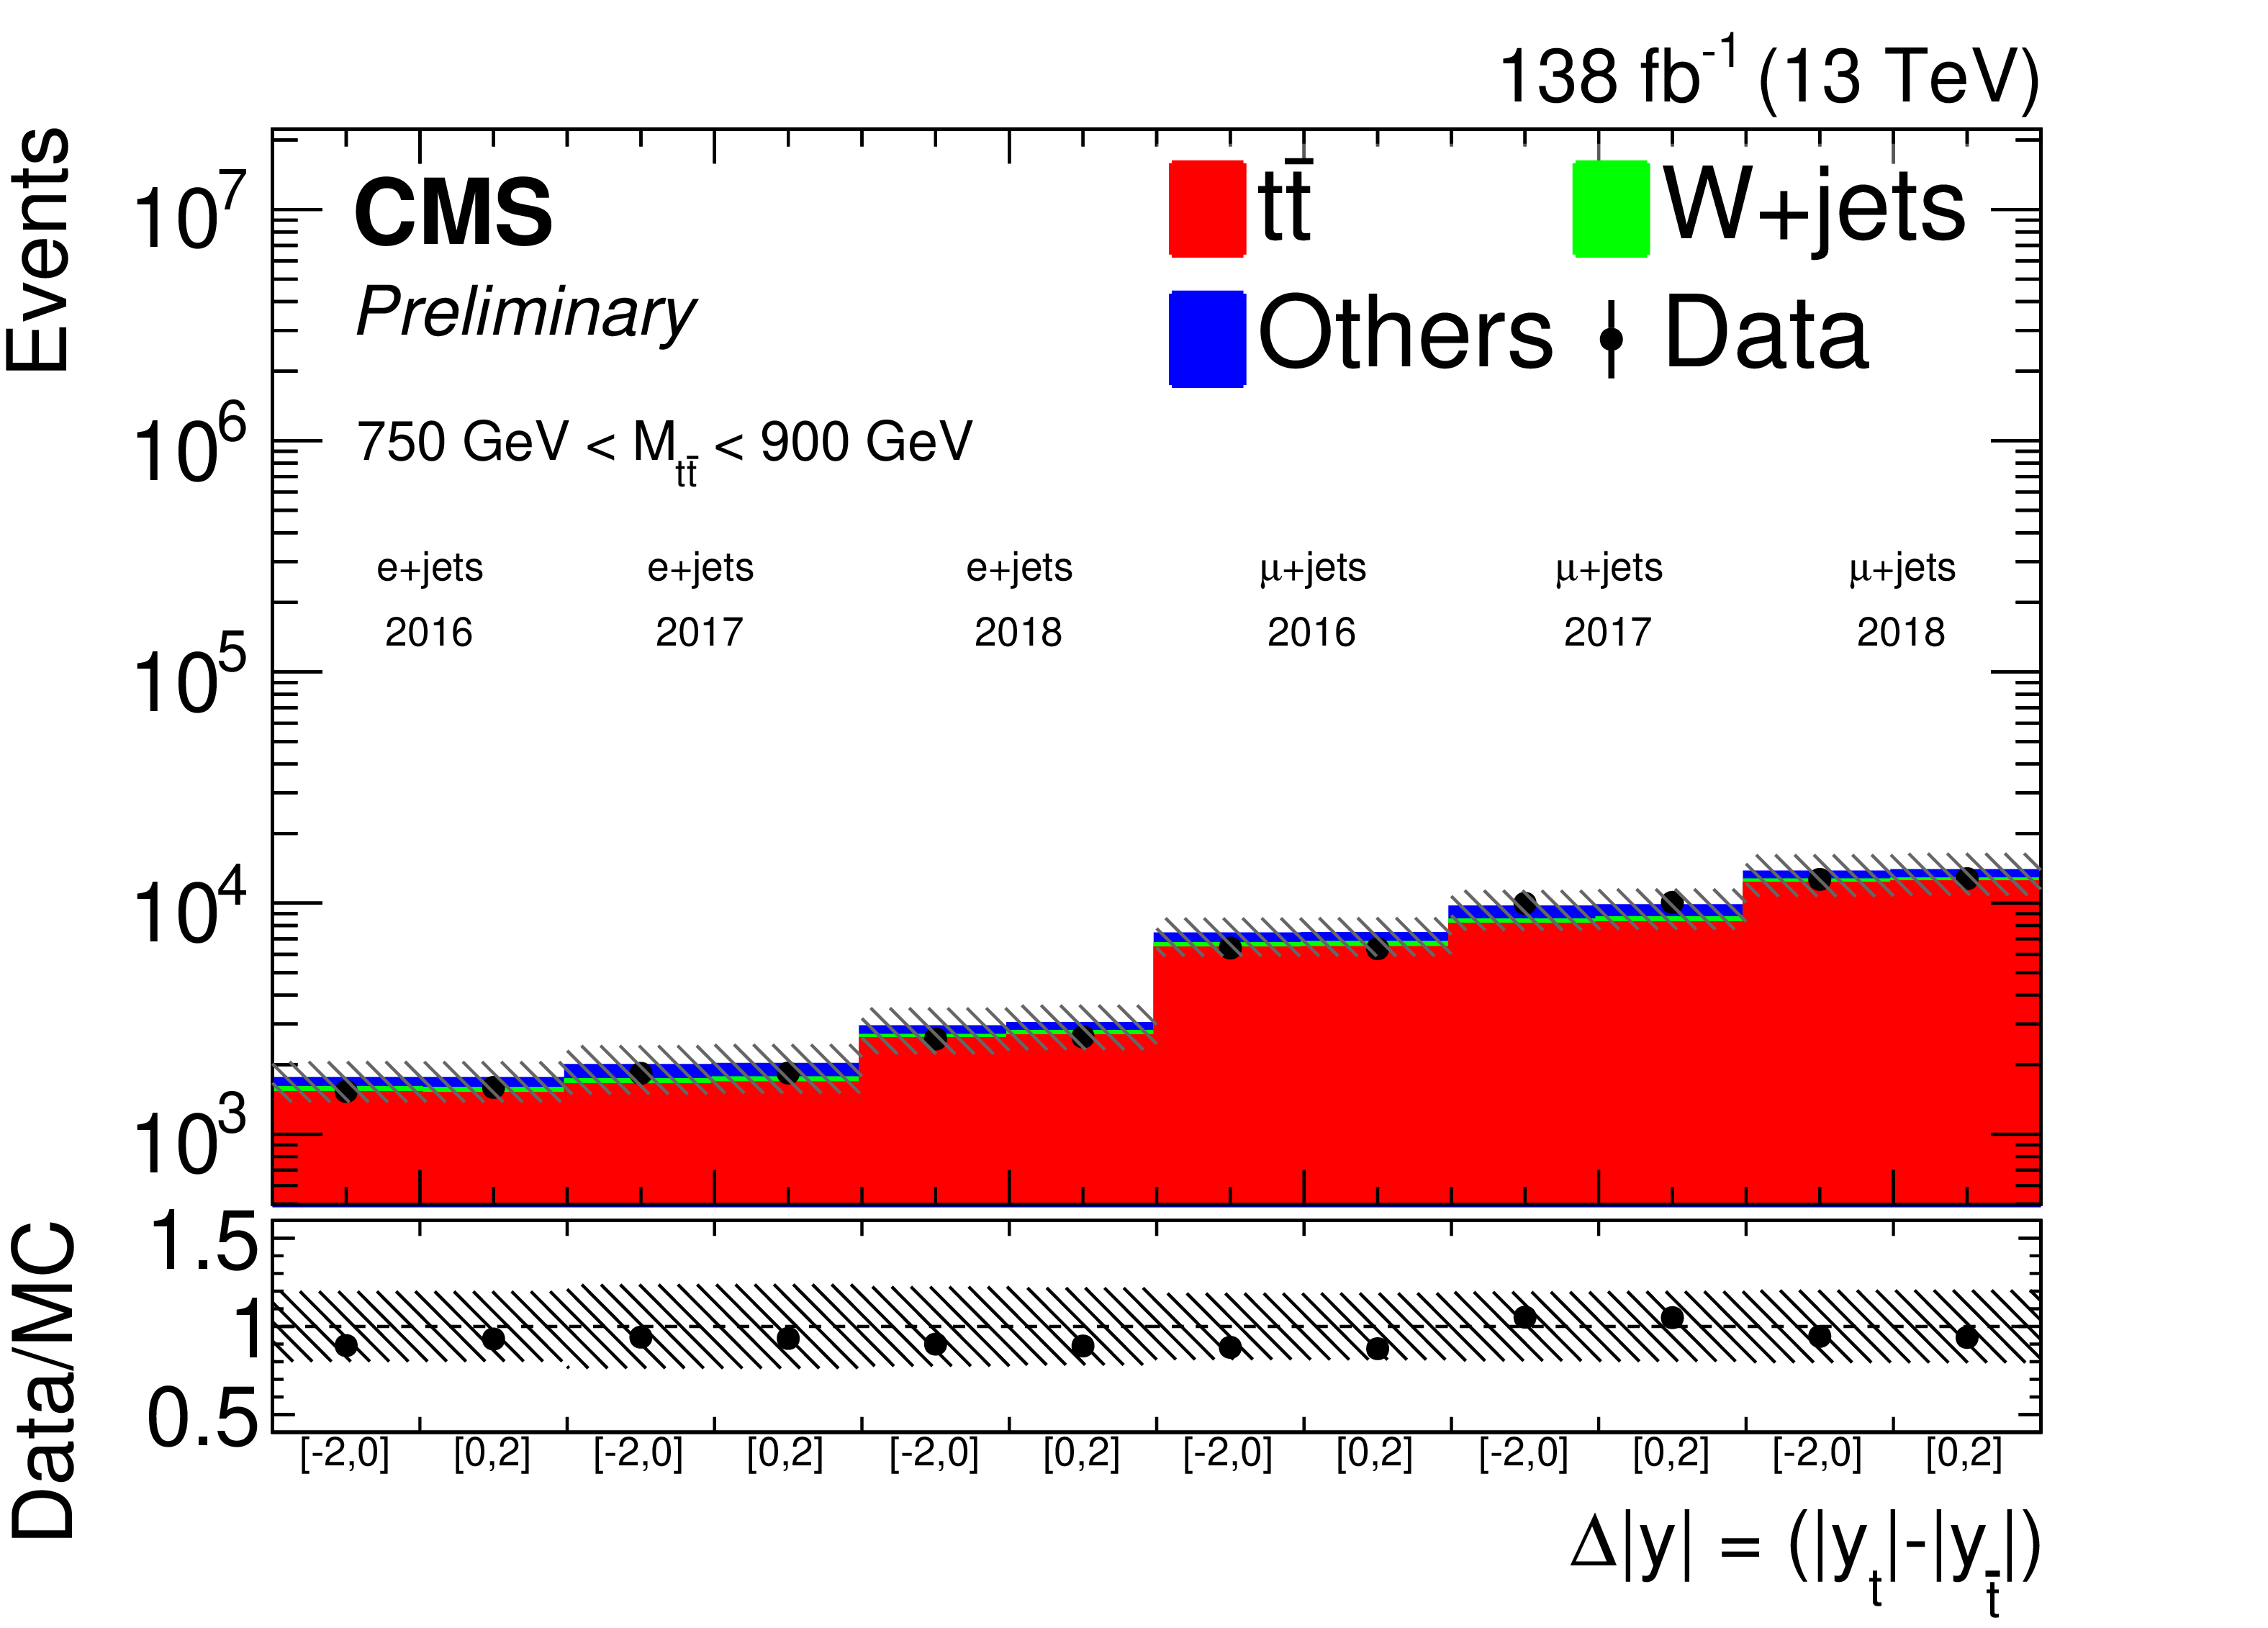
Figure 1:
Comparison between data and SM prediction for the events in the signal candidate sample in the combined $\ell$+jets channel after the likelihood normalization (see Section 6) for several quantities: $\Delta |y|$ (top left), reconstructed $ {M_{{\mathrm{t} {}\mathrm{\bar{t}}}}} $ (top right), distance between the lepton and the closest AK4 jet ${\Delta R_{\text {min}}(\ell, j)}$ (bottom left), and the number of AK4 jets (bottom right). Data points are shown with their statistical uncertainty. The shaded band combines the MC statistical uncertainty and the systematic uncertainty (see Section 5). Overall, good agreement between data and simulation is observed in all variables. |
png pdf |
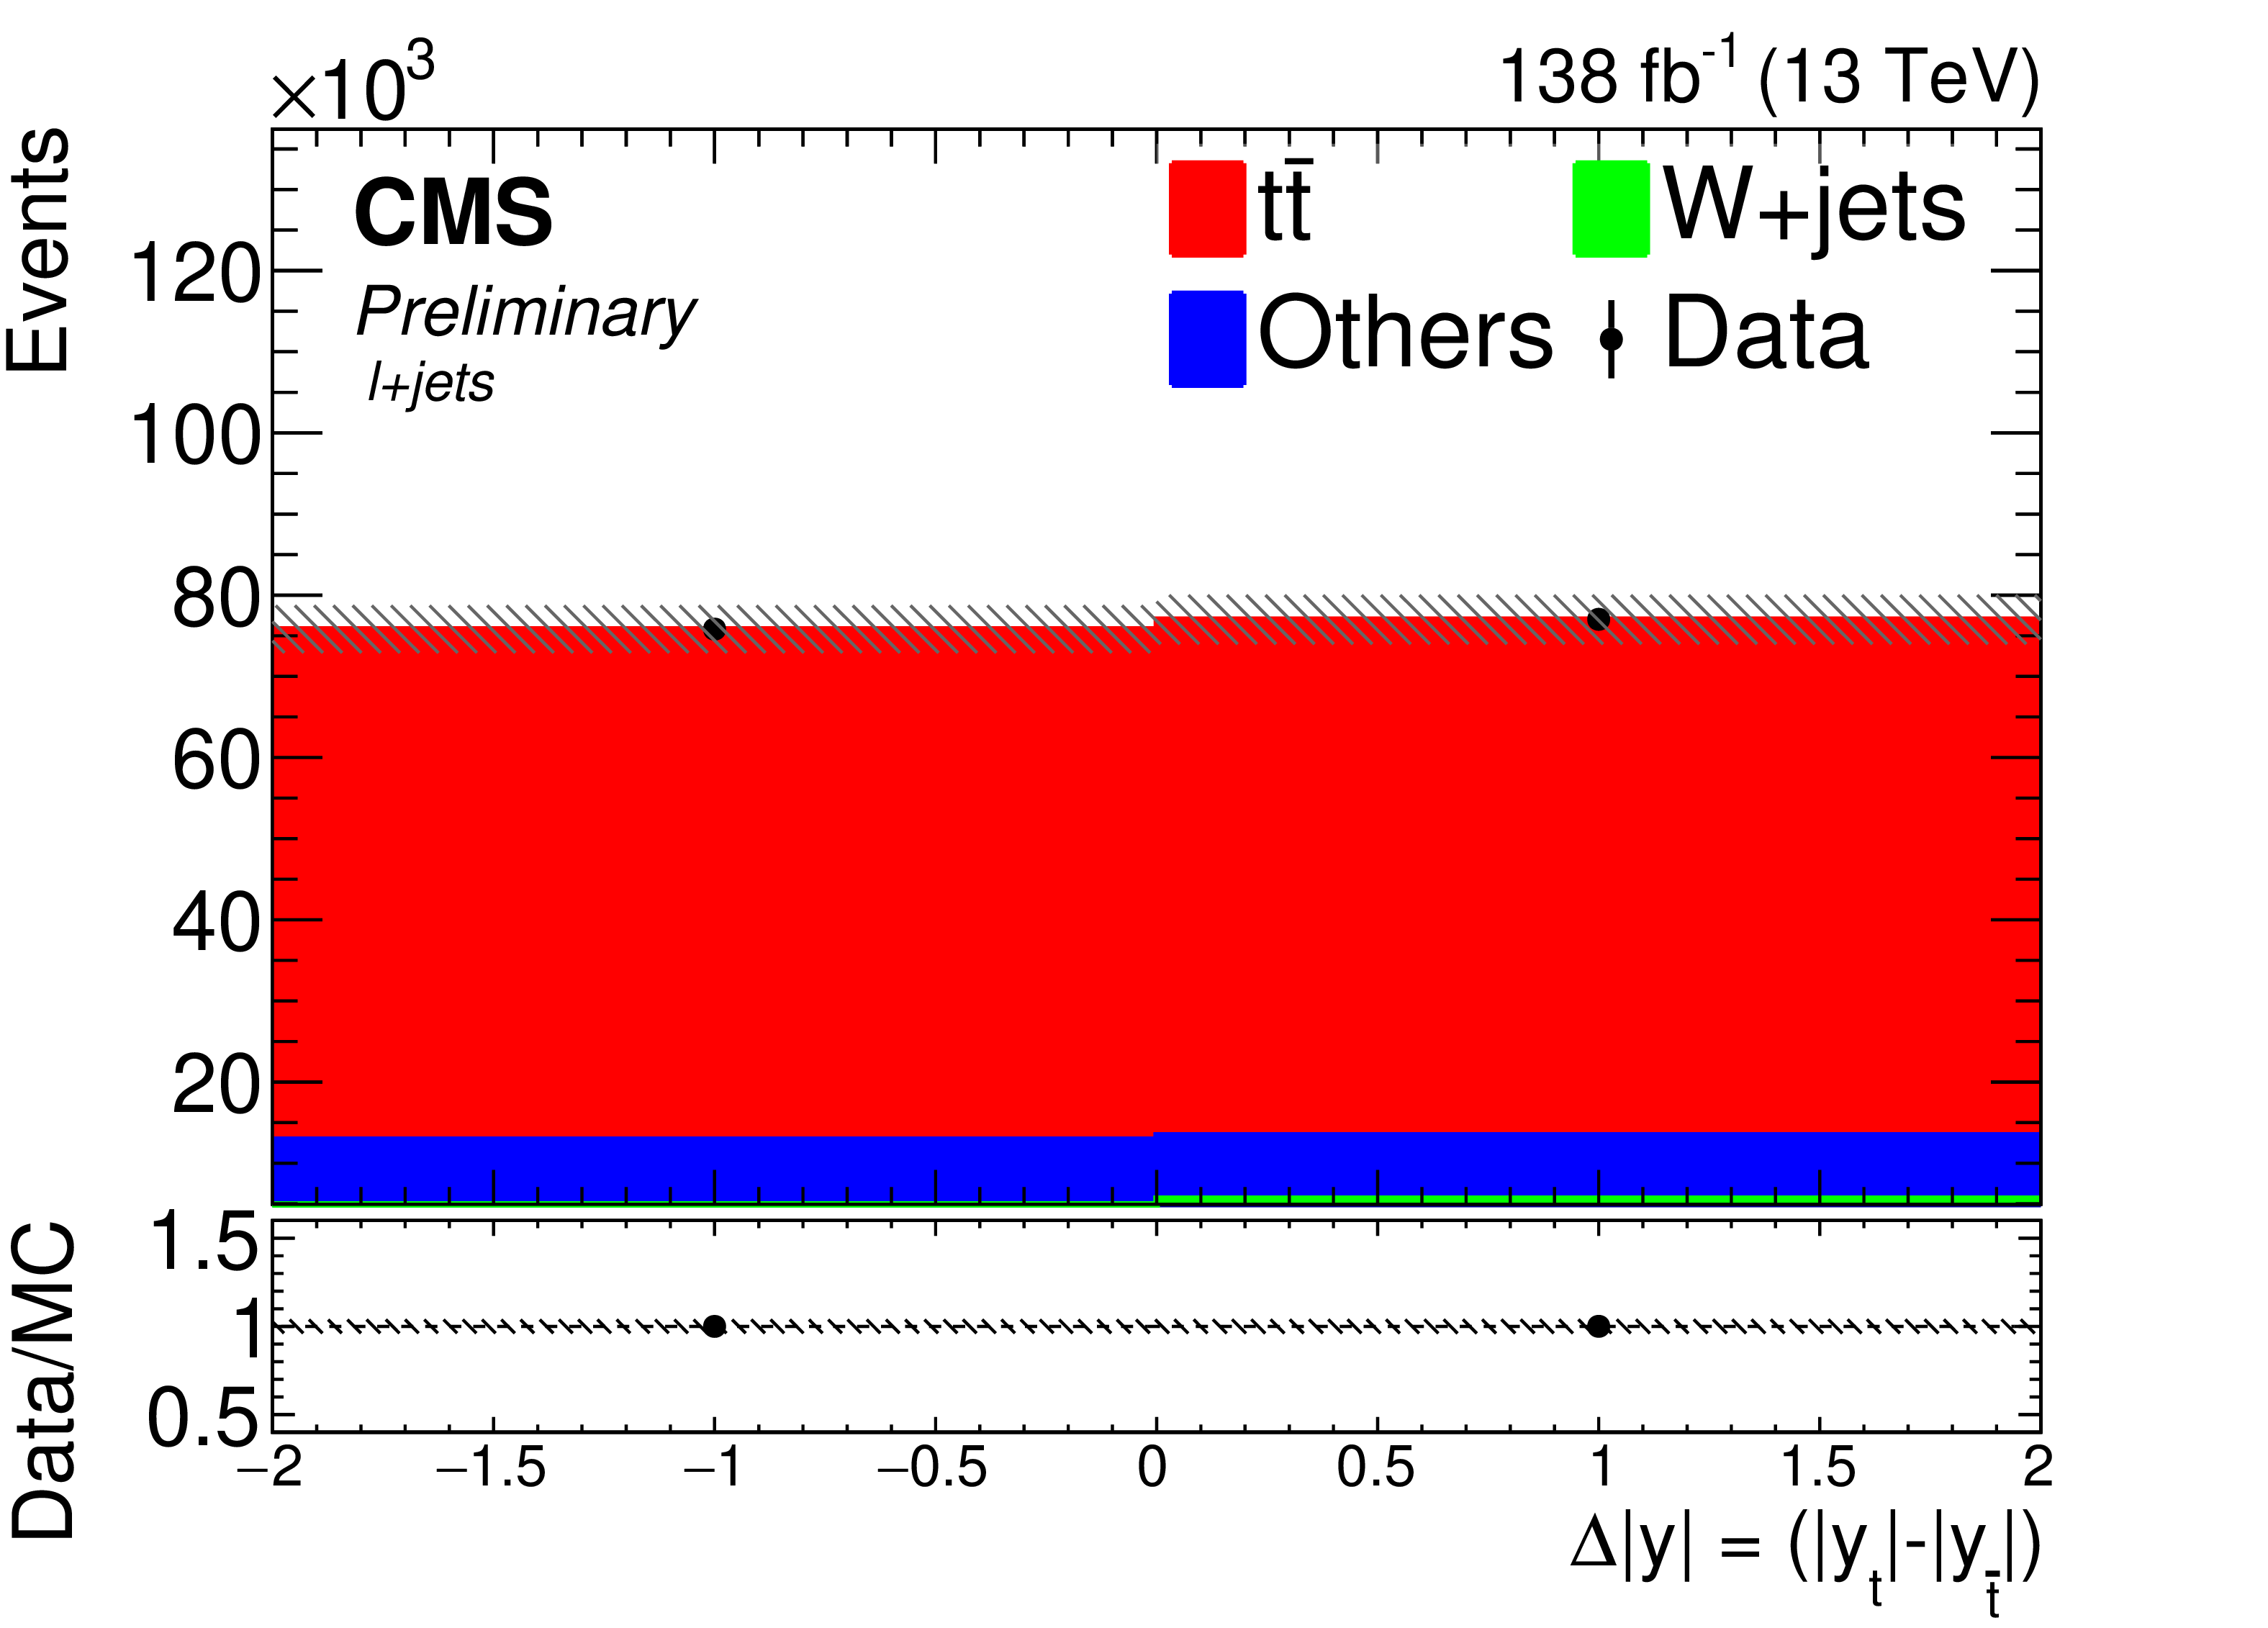
Figure 1-a:
Comparison between data and SM prediction for the events in the signal candidate sample in the combined $\ell$+jets channel after the likelihood normalization (see Section 6) for several quantities: $\Delta |y|$ (top left), reconstructed $ {M_{{\mathrm{t} {}\mathrm{\bar{t}}}}} $ (top right), distance between the lepton and the closest AK4 jet ${\Delta R_{\text {min}}(\ell, j)}$ (bottom left), and the number of AK4 jets (bottom right). Data points are shown with their statistical uncertainty. The shaded band combines the MC statistical uncertainty and the systematic uncertainty (see Section 5). Overall, good agreement between data and simulation is observed in all variables. |
png pdf |
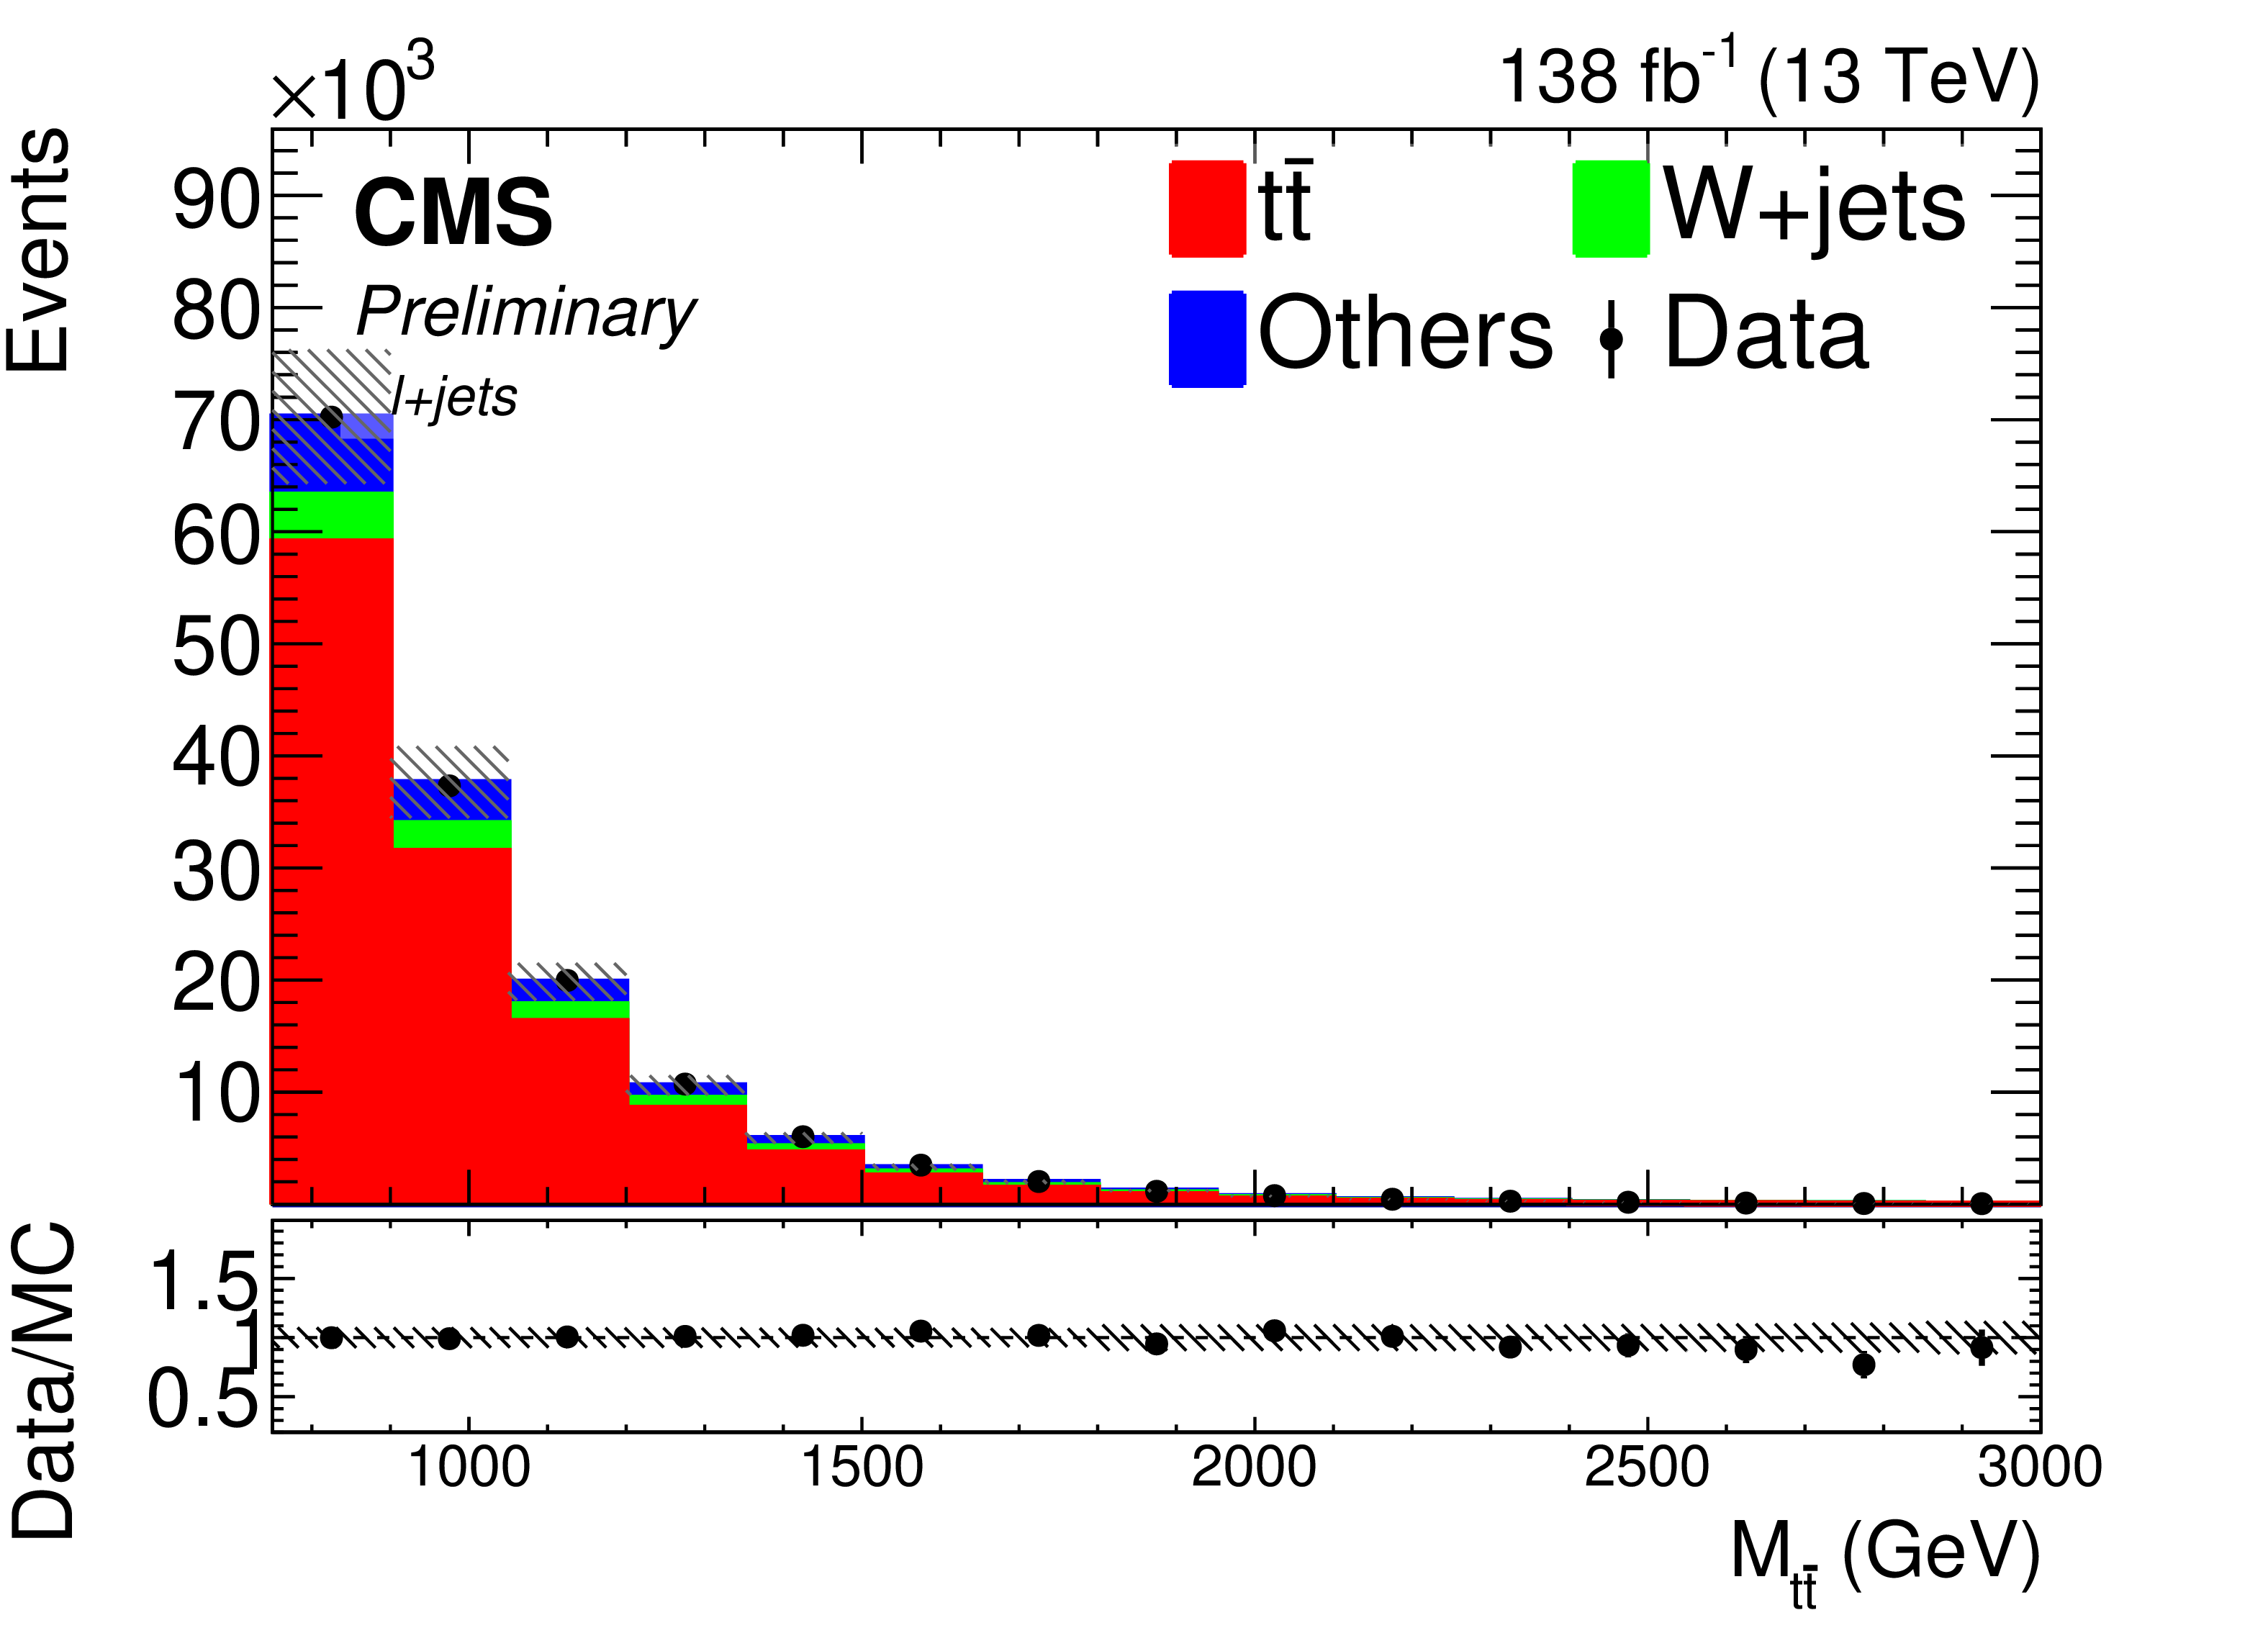
Figure 1-b:
Comparison between data and SM prediction for the events in the signal candidate sample in the combined $\ell$+jets channel after the likelihood normalization (see Section 6) for several quantities: $\Delta |y|$ (top left), reconstructed $ {M_{{\mathrm{t} {}\mathrm{\bar{t}}}}} $ (top right), distance between the lepton and the closest AK4 jet ${\Delta R_{\text {min}}(\ell, j)}$ (bottom left), and the number of AK4 jets (bottom right). Data points are shown with their statistical uncertainty. The shaded band combines the MC statistical uncertainty and the systematic uncertainty (see Section 5). Overall, good agreement between data and simulation is observed in all variables. |

png pdf |
Figure 1-c:
Comparison between data and SM prediction for the events in the signal candidate sample in the combined $\ell$+jets channel after the likelihood normalization (see Section 6) for several quantities: $\Delta |y|$ (top left), reconstructed $ {M_{{\mathrm{t} {}\mathrm{\bar{t}}}}} $ (top right), distance between the lepton and the closest AK4 jet ${\Delta R_{\text {min}}(\ell, j)}$ (bottom left), and the number of AK4 jets (bottom right). Data points are shown with their statistical uncertainty. The shaded band combines the MC statistical uncertainty and the systematic uncertainty (see Section 5). Overall, good agreement between data and simulation is observed in all variables. |

png pdf |
Figure 1-d:
Comparison between data and SM prediction for the events in the signal candidate sample in the combined $\ell$+jets channel after the likelihood normalization (see Section 6) for several quantities: $\Delta |y|$ (top left), reconstructed $ {M_{{\mathrm{t} {}\mathrm{\bar{t}}}}} $ (top right), distance between the lepton and the closest AK4 jet ${\Delta R_{\text {min}}(\ell, j)}$ (bottom left), and the number of AK4 jets (bottom right). Data points are shown with their statistical uncertainty. The shaded band combines the MC statistical uncertainty and the systematic uncertainty (see Section 5). Overall, good agreement between data and simulation is observed in all variables. |
png pdf |
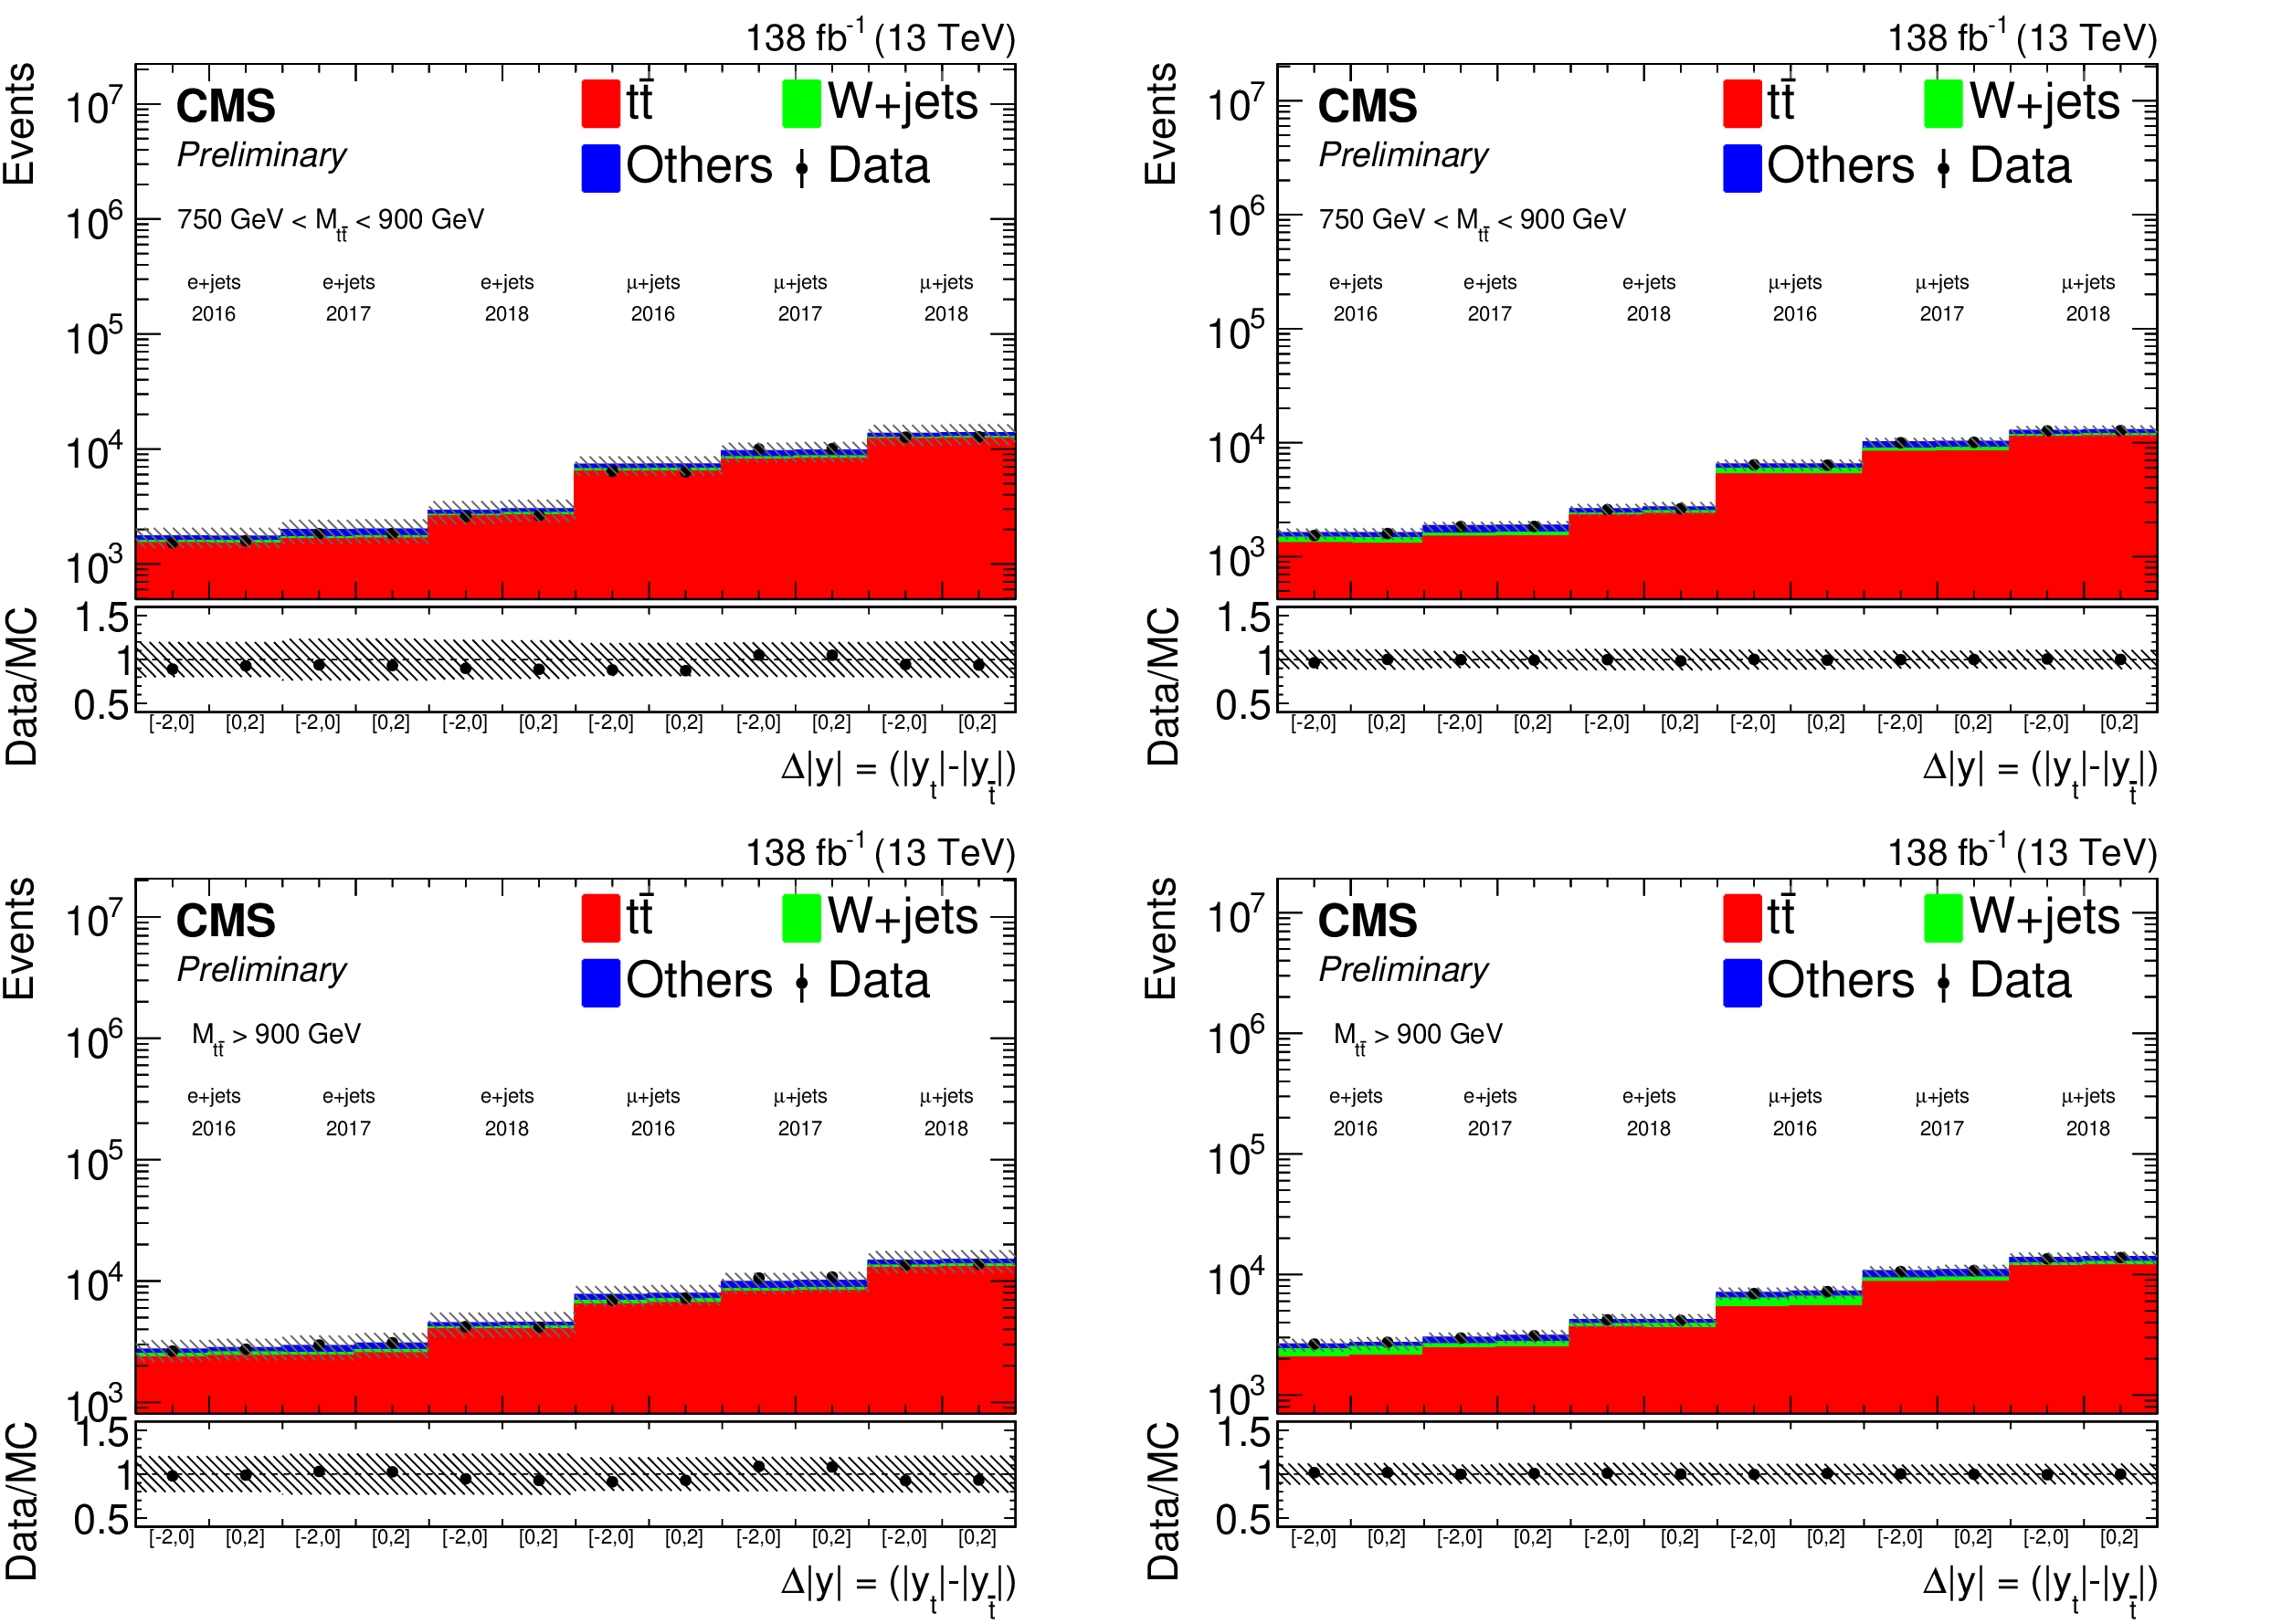
Figure 2:
Comparison between data and SM prediction for ${\Delta |y|}$ for each of the 12 analysis channels both before (left) and after (right) the likelihood normalization. The plots in the top row correspond to 750 GeV $ \le {M_{{\mathrm{t} {}\mathrm{\bar{t}}}}} \le $ 900 GeV, and the plots in the bottom row to $ {M_{{\mathrm{t} {}\mathrm{\bar{t}}}}} > $ 900 GeV. Data points are shown with statistical uncertainty, and the shaded band combines the MC statistical uncertainty and the systematic uncertainty. As can be observed, these uncertainties are reduced significantly after the likelihood fit, and the agreement between data and simulation is improved. Overall, excellent agreement in all channels is observed. |
png pdf |
Figure 2-a:
Comparison between data and SM prediction for ${\Delta |y|}$ for each of the 12 analysis channels both before (left) and after (right) the likelihood normalization. The plots in the top row correspond to 750 GeV $ \le {M_{{\mathrm{t} {}\mathrm{\bar{t}}}}} \le $ 900 GeV, and the plots in the bottom row to $ {M_{{\mathrm{t} {}\mathrm{\bar{t}}}}} > $ 900 GeV. Data points are shown with statistical uncertainty, and the shaded band combines the MC statistical uncertainty and the systematic uncertainty. As can be observed, these uncertainties are reduced significantly after the likelihood fit, and the agreement between data and simulation is improved. Overall, excellent agreement in all channels is observed. |

png pdf |
Figure 2-b:
Comparison between data and SM prediction for ${\Delta |y|}$ for each of the 12 analysis channels both before (left) and after (right) the likelihood normalization. The plots in the top row correspond to 750 GeV $ \le {M_{{\mathrm{t} {}\mathrm{\bar{t}}}}} \le $ 900 GeV, and the plots in the bottom row to $ {M_{{\mathrm{t} {}\mathrm{\bar{t}}}}} > $ 900 GeV. Data points are shown with statistical uncertainty, and the shaded band combines the MC statistical uncertainty and the systematic uncertainty. As can be observed, these uncertainties are reduced significantly after the likelihood fit, and the agreement between data and simulation is improved. Overall, excellent agreement in all channels is observed. |

png pdf |
Figure 2-c:
Comparison between data and SM prediction for ${\Delta |y|}$ for each of the 12 analysis channels both before (left) and after (right) the likelihood normalization. The plots in the top row correspond to 750 GeV $ \le {M_{{\mathrm{t} {}\mathrm{\bar{t}}}}} \le $ 900 GeV, and the plots in the bottom row to $ {M_{{\mathrm{t} {}\mathrm{\bar{t}}}}} > $ 900 GeV. Data points are shown with statistical uncertainty, and the shaded band combines the MC statistical uncertainty and the systematic uncertainty. As can be observed, these uncertainties are reduced significantly after the likelihood fit, and the agreement between data and simulation is improved. Overall, excellent agreement in all channels is observed. |

png pdf |
Figure 2-d:
Comparison between data and SM prediction for ${\Delta |y|}$ for each of the 12 analysis channels both before (left) and after (right) the likelihood normalization. The plots in the top row correspond to 750 GeV $ \le {M_{{\mathrm{t} {}\mathrm{\bar{t}}}}} \le $ 900 GeV, and the plots in the bottom row to $ {M_{{\mathrm{t} {}\mathrm{\bar{t}}}}} > $ 900 GeV. Data points are shown with statistical uncertainty, and the shaded band combines the MC statistical uncertainty and the systematic uncertainty. As can be observed, these uncertainties are reduced significantly after the likelihood fit, and the agreement between data and simulation is improved. Overall, excellent agreement in all channels is observed. |
png pdf |
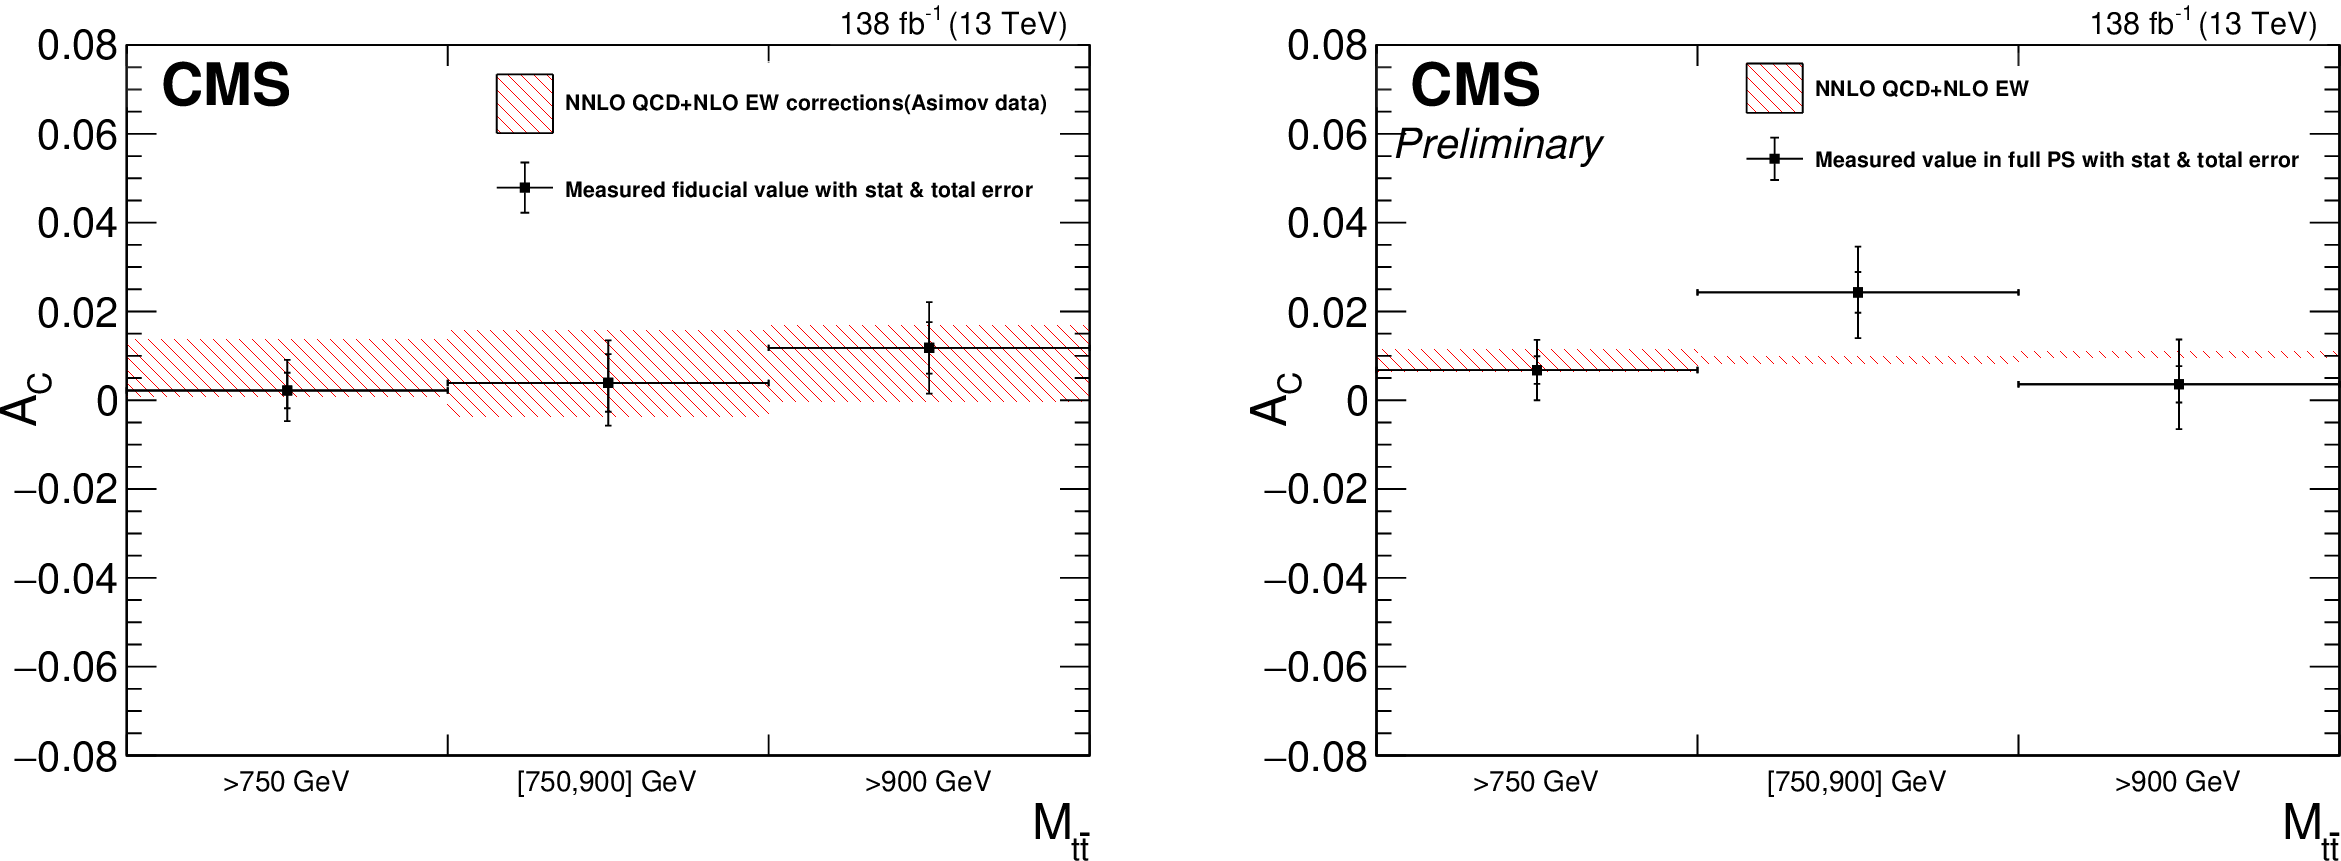
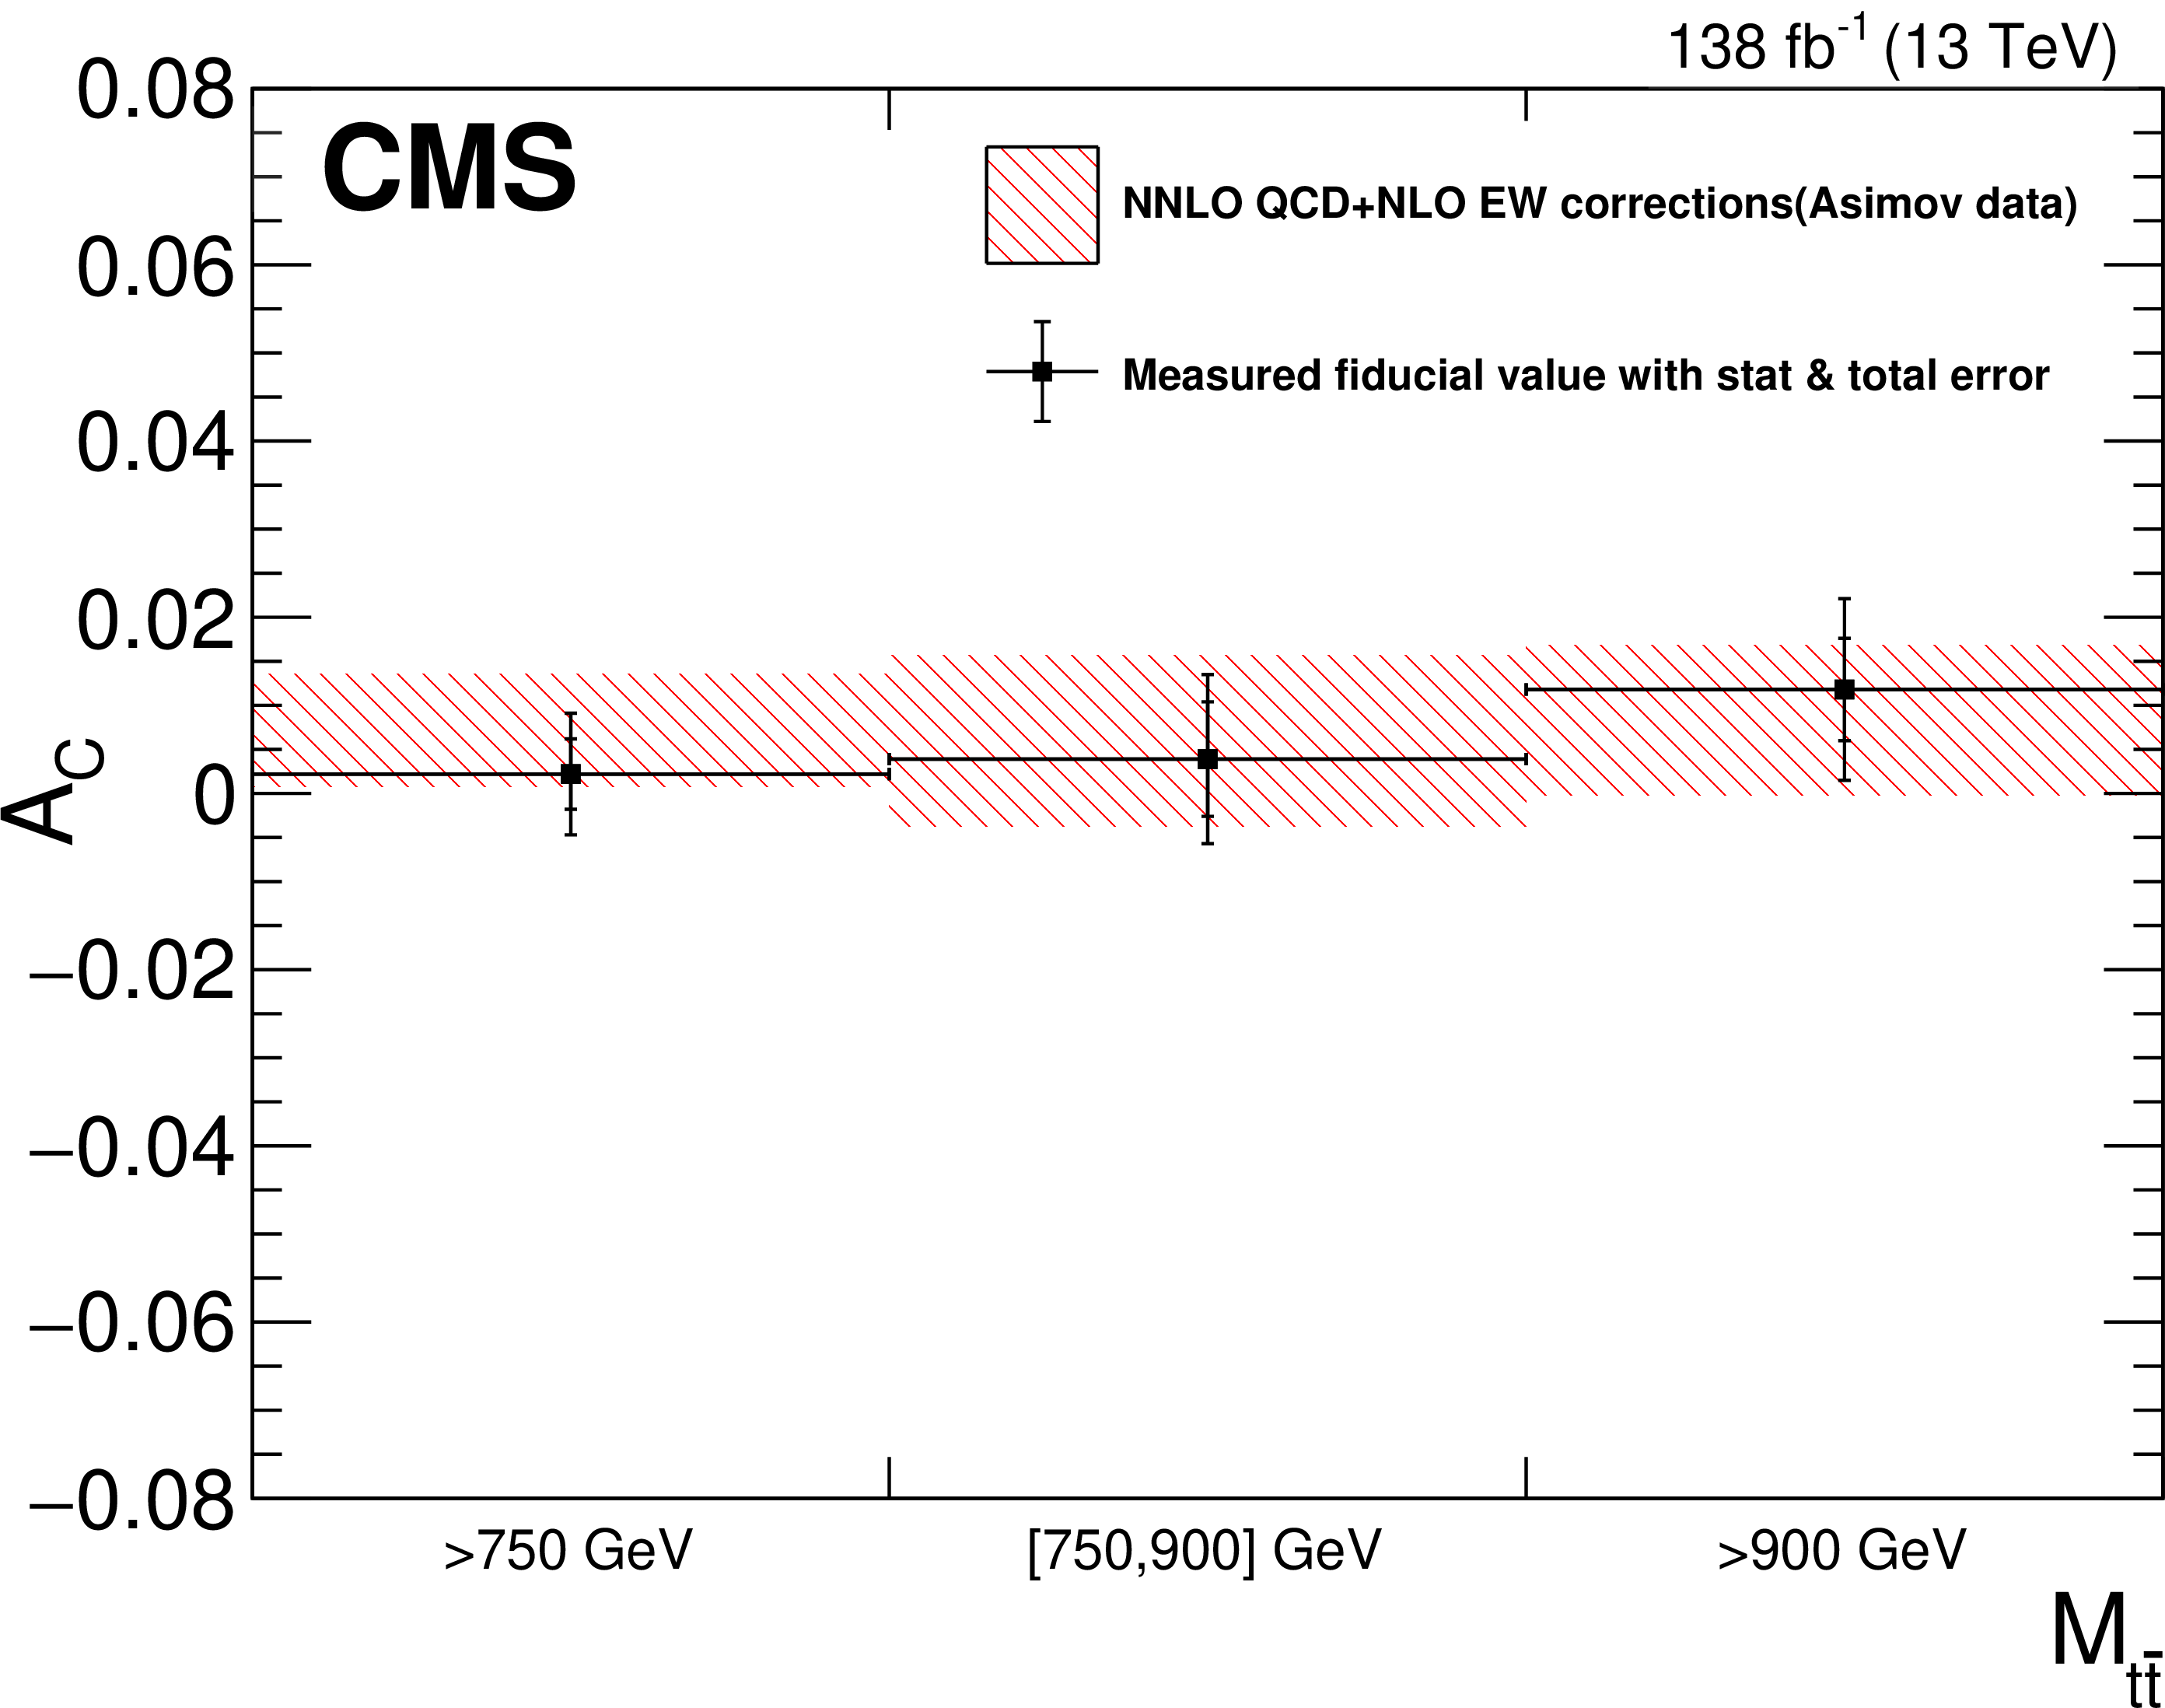
Figure 3:
The measured ${A_{C}}$ values in different mass regions, combining the $ \mu$+jets and e+jets channels, compared with the prediction in the fiducial region obtained by fitting Asimov data (left) and the theoretical prediction including NNLO QCD and NLO EW corrections from Ref. [4] (right). |
png pdf |
Figure 3-a:
The measured ${A_{C}}$ values in different mass regions, combining the $ \mu$+jets and e+jets channels, compared with the prediction in the fiducial region obtained by fitting Asimov data (left) and the theoretical prediction including NNLO QCD and NLO EW corrections from Ref. [4] (right). |

png pdf |
Figure 3-b:
The measured ${A_{C}}$ values in different mass regions, combining the $ \mu$+jets and e+jets channels, compared with the prediction in the fiducial region obtained by fitting Asimov data (left) and the theoretical prediction including NNLO QCD and NLO EW corrections from Ref. [4] (right). |
png pdf |
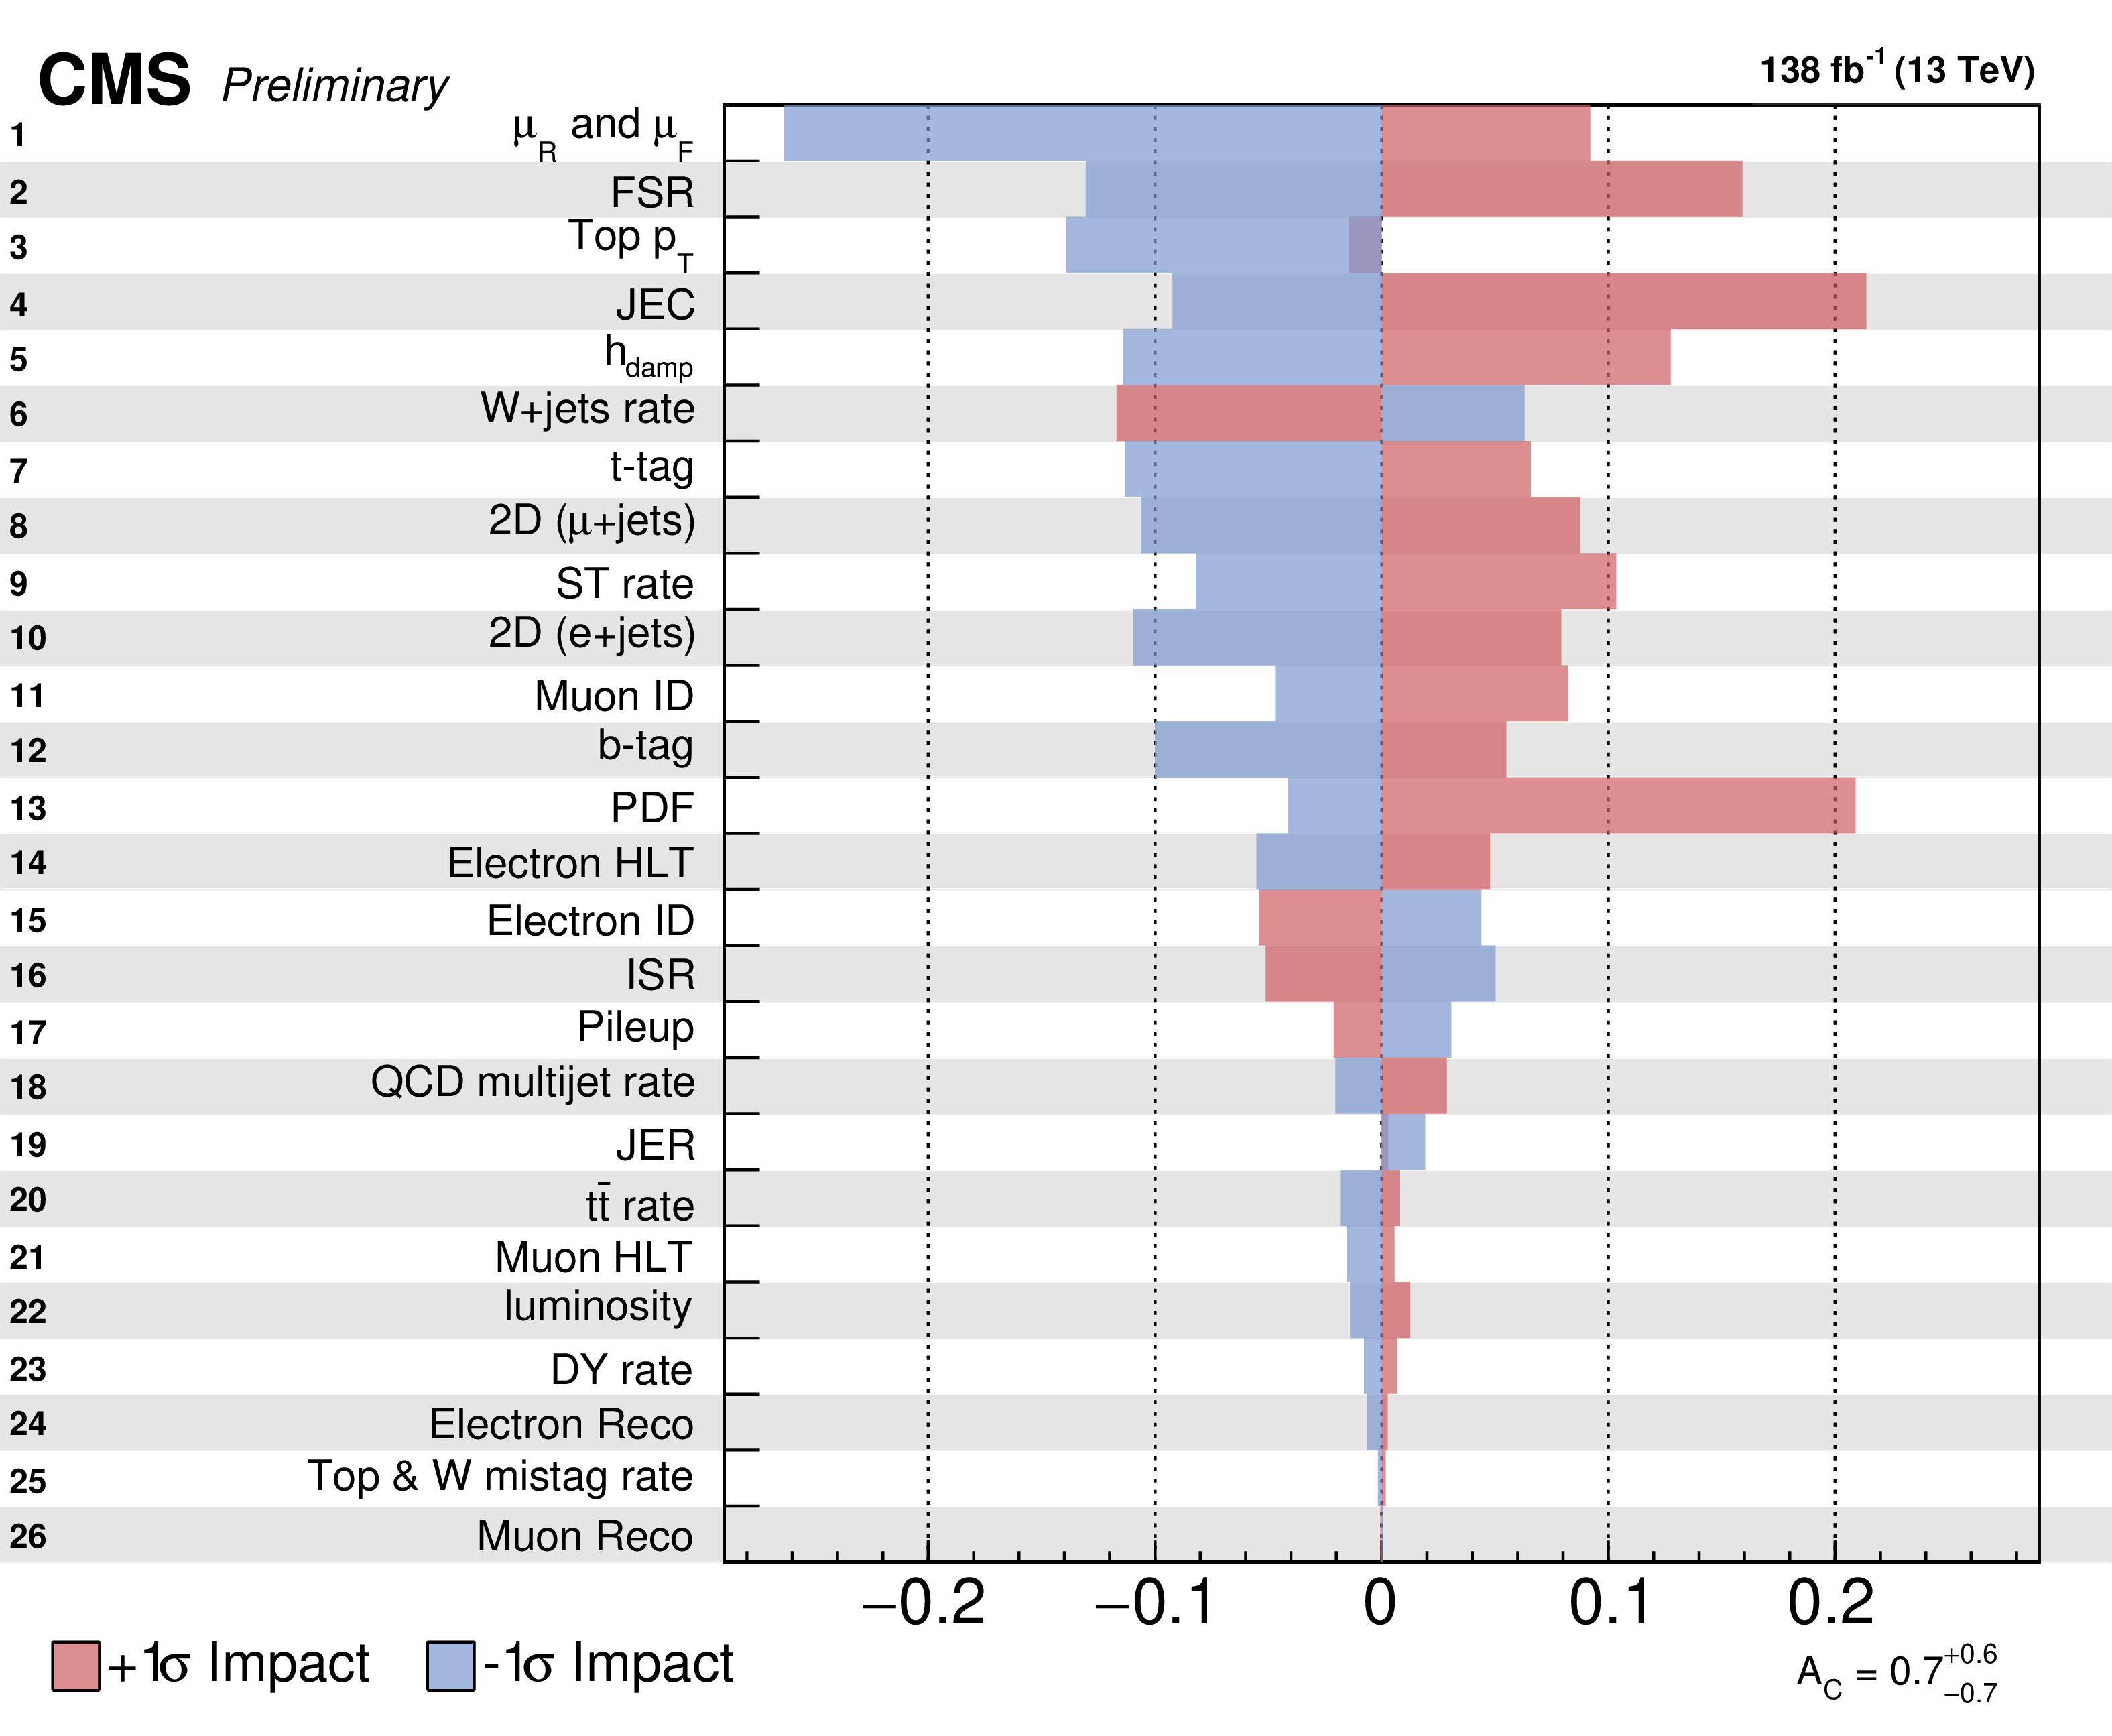
Figure 4:
The impacts of the nuisance parameters corresponding to the systematic uncertainties for the inclusive ${A_{C}}$ measurement for $ {M_{{\mathrm{t} {}\mathrm{\bar{t}}}}} \ge $ 750 GeV. The blue and red bars show the effect on the unfolded ${A_{C}}$ values for up and down variations of the systematic uncertainty. MC statistical uncertainties are omitted here. |
| Tables | |
png pdf |
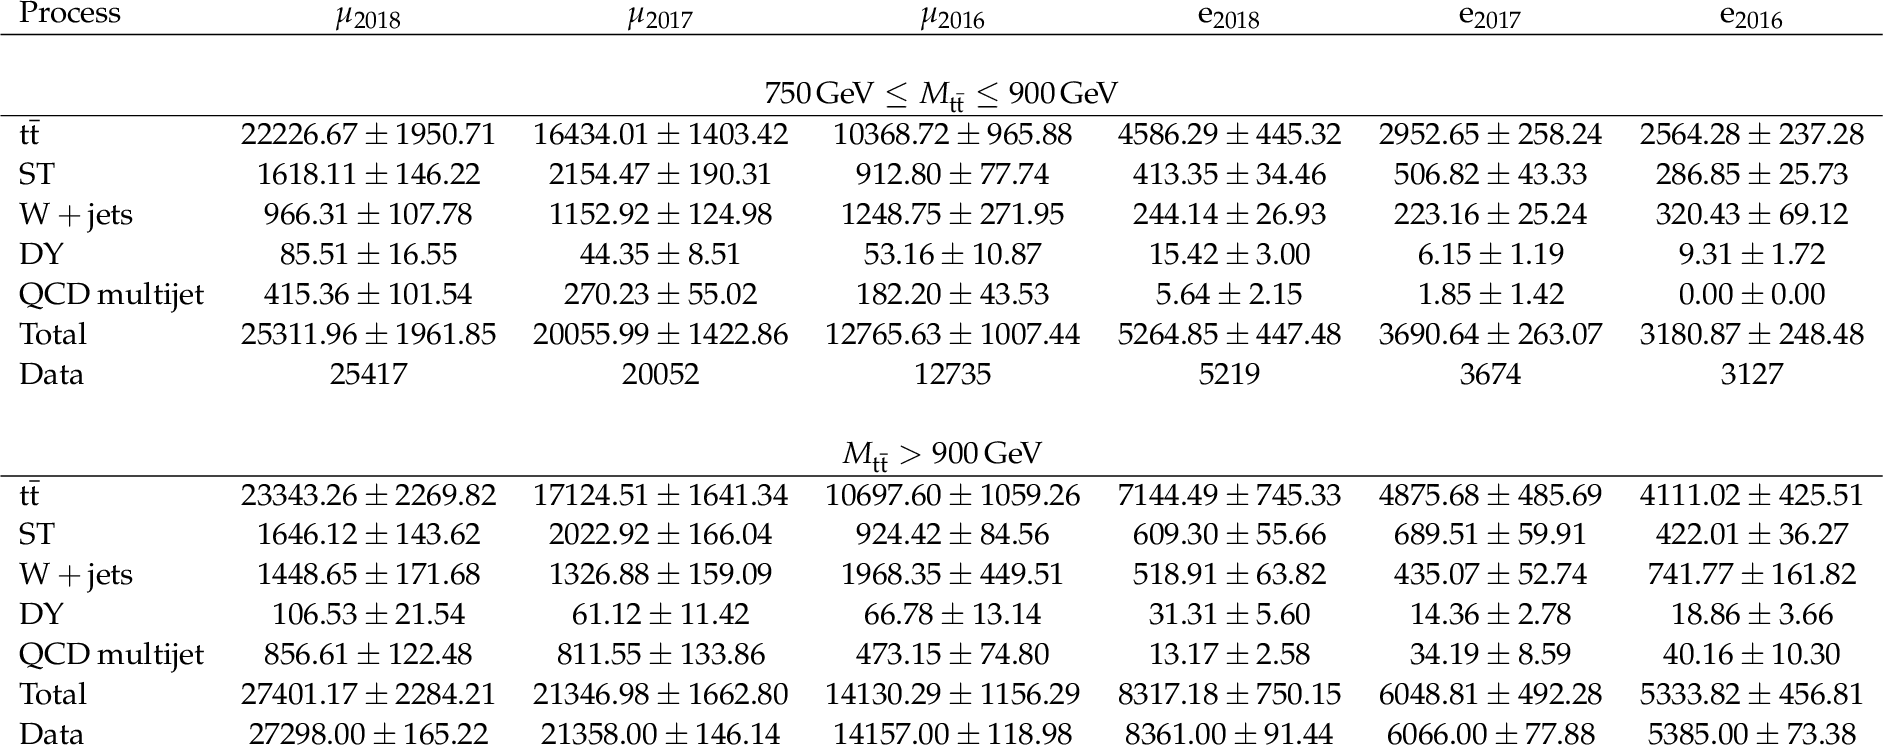
Table 1:
Event yields after the likelihood fit for each of the 12 channels used in the analysis ($ \mu$+jets, e+jets and 3 years: 2018, 2017, and 2016), separated into the two mass regions, for events that pass the signal sample selection. The errors shown include both the MC statistical and the total systematic uncertainty. |
png pdf |
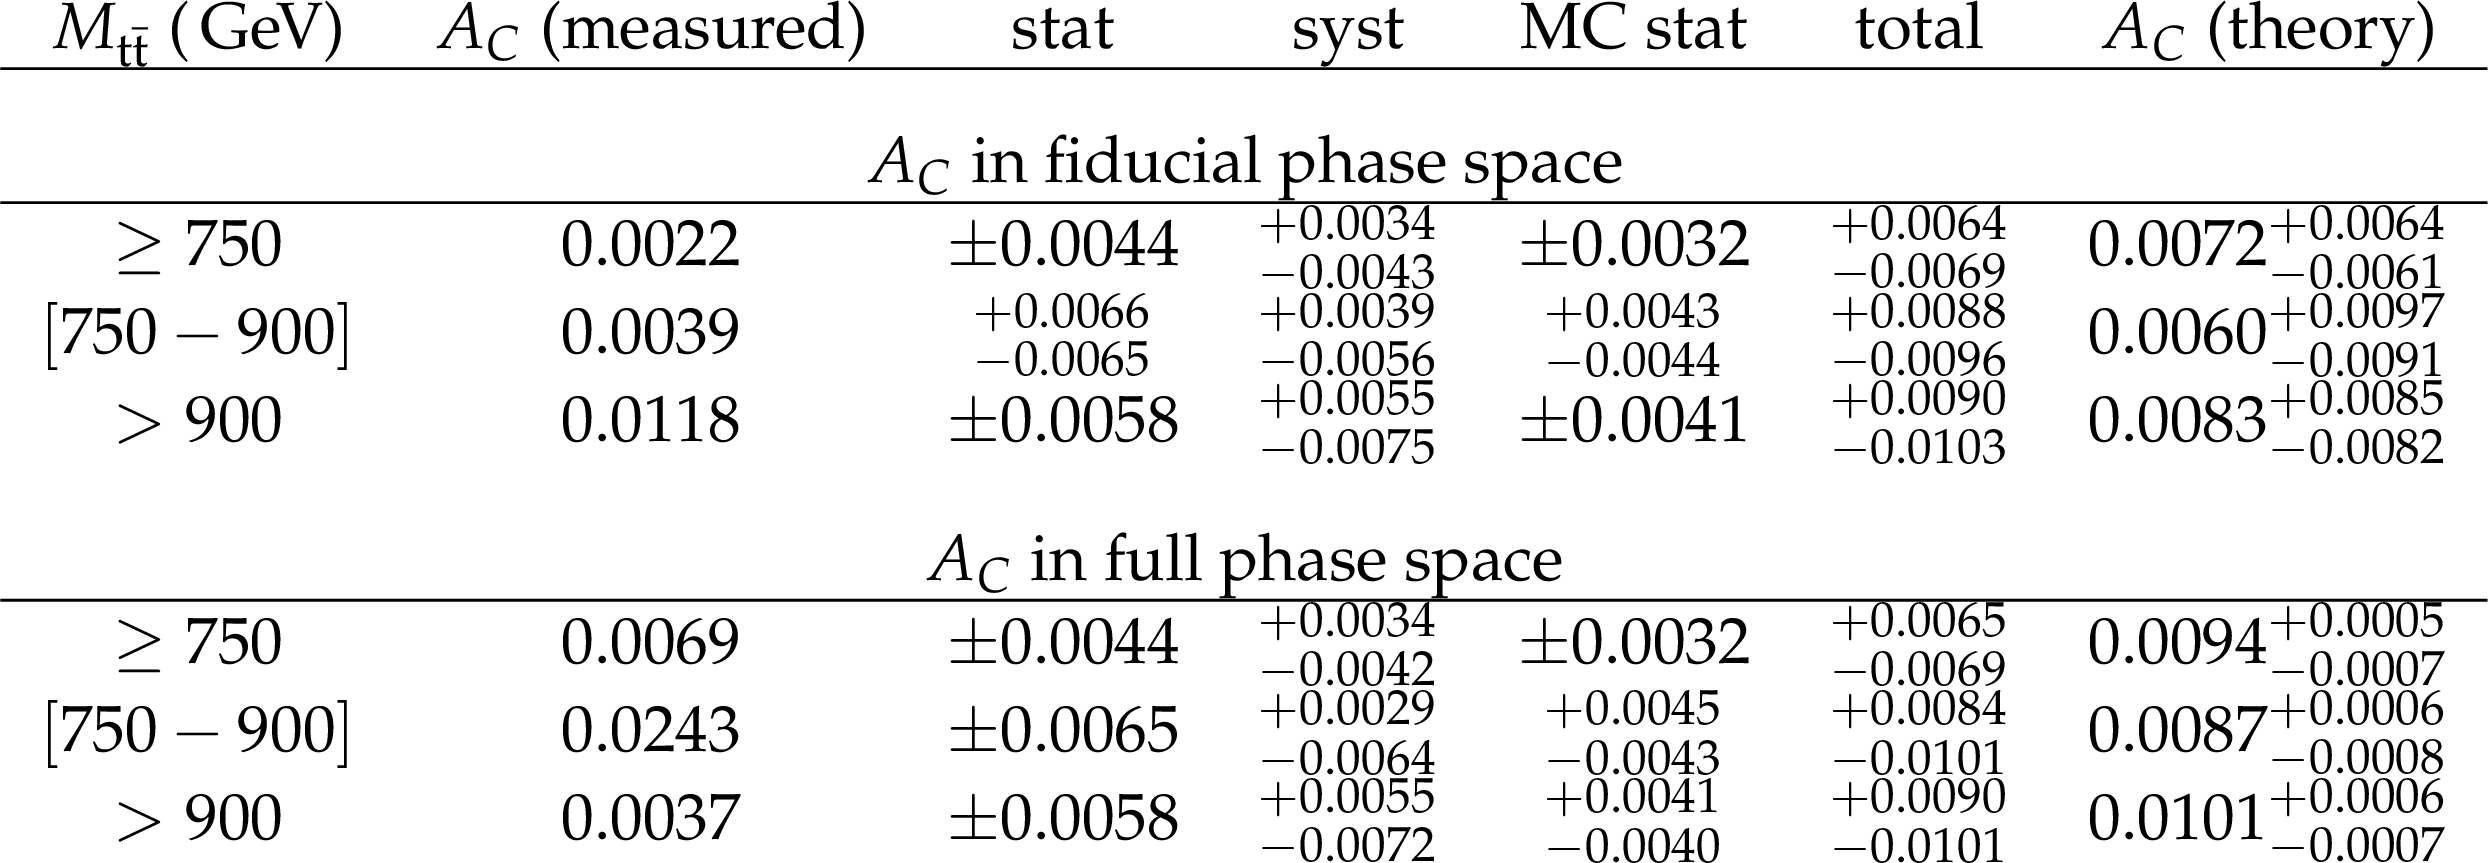
Table 2:
Measured unfolded charge asymmetry at fiducial phase level in individual channels compared with the SM predictions. |
| Summary |
| The first measurement of the charge asymmetry for highly boosted top quark-antiquark pairs in pp collisions at $\sqrt{s} = $ 13 TeV has been presented based on 138 fb$^{-1}$ of data. The selection was optimized for top quark-antiquark pairs produced with large Lorentz boosts and decaying to a single lepton + jets, resulting in non-isolated leptons and overlapping jets. The top quark charge asymmetry is corrected for detector and acceptance effects using a binned maximum likelihood fit. The resulting unfolded charge asymmetry for $\mathrm{t\bar{t}}$ events with ${M_{\mathrm{t\bar{t}}}} \ge $ 750 GeV corrected to the full phase space is ${{A_{C}} ^{\text{full}}} = $ 0.0069$_{-0.0069}^{+0.0065}$. The corresponding theoretical prediction at NNLO in perturbation theory with NLO electroweak corrections from Ref. [4] is 0.0094$^{+0.0005}_{-0.0007}$. Good agreement between the data and the SM prediction is observed. |
| References | ||||
| 1 | M. Czakon, P. Fiedler, and A. Mitov | Total top-quark pair-production cross section at hadron colliders through $ o(\alpha^4_s) $ | PRL 110 (2013) 252004 | 1303.6254 |
| 2 | S. Catani et al. | Top-quark pair production at the LHC: Fully differential QCD predictions at NNLO | JHEP 07 (2019) 100 | 1906.06535 |
| 3 | M. Czakon, P. Fiedler, and A. Mitov | Resolving the Tevatron top quark forward-backward asymmetry puzzle: Fully differential next-to-next-to-leading-order calculation | PRL 115 (2015) 052001 | 1411.3007 |
| 4 | M. Czakon et al. | Top-quark charge asymmetry at the LHC and Tevatron through NNLO QCD and NLO EW | PRD 98 (2018) 014003 | 1711.03945 |
| 5 | M. Czakon, D. Heymes, and A. Mitov | High-precision differential predictions for top-quark pairs at the LHC | PRL 116 (2016) 082003 | 1511.00549 |
| 6 | J. Rojo et al. | The PDF4LHC report on PDFs and LHC data: results from Run I and preparation for Run II | JPG 42 (2015) 103103 | 1507.00556 |
| 7 | J. A. Aguilar-Saavedra, A. Juste, and F. Rubbo | Boosting the $ \mathrm{t\bar{t}} $ charge asymmetry | PLB 707 (2012) 92 | 1109.3710 |
| 8 | O. Antunano, J. H. Kuhn, and G. Rodrigo | Top quarks, axigluons and charge asymmetries at hadron colliders | PRD 77 (2008) 014003 | 0709.1652 |
| 9 | P. H. Frampton, J. Shu, and K. Wang | Axigluon as possible explanation for $ {\mathrm{p}}\mathrm{\bar{p}}\to\mathrm{t\bar{t}} $ forward--backward asymmetry | PLB 683 (2010) 294 | 0911.2955 |
| 10 | J. L. Rosner | Prominent decay modes of a leptophobic $ Z^\prime $ | PLB 387 (1996) 113 | hep-ph/9607207 |
| 11 | P. Ferrario and G. Rodrigo | Massive color-octet bosons and the charge asymmetries of top quarks at hadron colliders | PRD 78 (2008) 094018 | 0809.3354 |
| 12 | P. Ferrario and G. Rodrigo | Constraining heavy colored resonances from top-antitop quark events | PRD 80 (2009) 051701 | 0906.5541 |
| 13 | J. A. Aguilar-Saavedra and M. P\'erez-Victoria | Asymmetries in $ t\overline{t} $ production: LHC versus Tevatron | PRD 84 (2011) 115013 | 1105.4606 |
| 14 | J. A. Aguilar-Saavedra and M. Perez-Victoria | Simple models for the top asymmetry: Constraints and predictions | JHEP 09 (2011) 097 | 1107.0841 |
| 15 | C. Zhang and S. Willenbrock | Effective-field-theory approach to top-quark production and decay | PRD 83 (2011) 034006 | 1008.3869 |
| 16 | T. Aaltonen et al. | Evidence for a mass dependent forward-backward asymmetry in top quark pair production | PRD 83 (2011) 112003 | 1101.0034 |
| 17 | V. M. Abazov et al. | Forward-backward asymmetry in top quark-antiquark production | PRD 84 (2011) 112005 | 1107.4995 |
| 18 | S. Frixione and B. R. Webber | Matching NLO QCD computations and parton shower simulations | JHEP 06 (2002) 029 | hep-ph/0204244 |
| 19 | T. Aaltonen et al. | Combined forward-backward asymmetry measurements in top-antitop quark production at the Tevatron | PRL 120 (2018) 042001 | 1709.04894 |
| 20 | J. A. Aguilar-Saavedra, D. Amidei, A. Juste, and M. P\'erez-Victoria | Asymmetries in top quark pair production at hadron colliders | Rev. Mod. Phys. 87 (2015) 421 | 1406.1798 |
| 21 | CMS Collaboration | Search for resonant $ \mathrm{t}\overline{\mathrm{t}} $ production in proton-proton collisions at $ \sqrt{s}= $ 13 TeV | JHEP 04 (2019) 031 | CMS-B2G-17-017 1810.05905 |
| 22 | CMS Collaboration | Performance of the CMS Level-1 trigger in proton-proton collisions at $ \sqrt{s} = $ 13 TeV | JINST 15 (2020) P10017 | CMS-TRG-17-001 2006.10165 |
| 23 | CMS Collaboration | The CMS trigger system | JINST 12 (2017) P01020 | CMS-TRG-12-001 1609.02366 |
| 24 | CMS Collaboration | The CMS experiment at the CERN LHC | JINST 3 (2008) S08004 | CMS-00-001 |
| 25 | CMS Collaboration | Particle-flow reconstruction and global event description with the CMS detector | JINST 12 (2017) P10003 | CMS-PRF-14-001 1706.04965 |
| 26 | CMS Collaboration | Description and performance of track and primary-vertex reconstruction with the CMS tracker | JINST 9 (2014) P10009 | CMS-TRK-11-001 1405.6569 |
| 27 | CMS Collaboration | Technical proposal for the Phase-II upgrade of the Compact Muon Solenoid | CMS-PAS-TDR-15-002 | CMS-PAS-TDR-15-002 |
| 28 | M. Cacciari, G. P. Salam, and G. Soyez | The anti-$ {k_{\mathrm{T}}} $ jet clustering algorithm | JHEP 04 (2008) 063 | 0802.1189 |
| 29 | M. Cacciari, G. P. Salam, and G. Soyez | FastJet user manual | EPJC 72 (2012) 1896 | 1111.6097 |
| 30 | CMS Collaboration | Performance of missing transverse momentum reconstruction in proton-proton collisions at $ \sqrt{s} = $ 13 TeV using the CMS detector | JINST 14 (2019) P07004 | CMS-JME-17-001 1903.06078 |
| 31 | CMS Collaboration | Determination of jet energy calibration and transverse momentum resolution in CMS | JINST 6 (2011) P11002 | CMS-JME-10-011 1107.4277 |
| 32 | A. J. Larkoski, S. Marzani, G. Soyez, and J. Thaler | Soft Drop | JHEP 05 (2014) 146 | 1402.2657 |
| 33 | J. Thaler and K. Van Tilburg | Identifying boosted objects with N-subjettiness | JHEP 03 (2011) 015 | 1011.2268 |
| 34 | E. Bols et al. | Jet flavour classification using DeepJet | JINST 15 (2020), no. 12, P12012 | 2008.10519 |
| 35 | CMS Collaboration | Precision luminosity measurement in proton-proton collisions at $ \sqrt{s} = $ 13 TeV in 2015 and 2016 at CMS | EPJC 81 (2021) 800 | CMS-LUM-17-003 2104.01927 |
| 36 | CMS Collaboration | CMS luminosity measurement for the 2017 data-taking period at $ \sqrt{s} = $ 13 TeV | CMS-PAS-LUM-17-004 | CMS-PAS-LUM-17-004 |
| 37 | CMS Collaboration | CMS luminosity measurement for the 2018 data-taking period at $ \sqrt{s} = $ 13 TeV | CMS-PAS-LUM-18-002 | CMS-PAS-LUM-18-002 |
| 38 | S. Alioli, P. Nason, C. Oleari, and Re | A general framework for implementing NLO calculations in shower Monte Carlo programs: the POWHEG BOX | JHEP 06 (2010) 043 | 1002.2581 |
| 39 | J. Alwall et al. | The automated computation of tree-level and next-to-leading order differential cross sections, and their matching to parton shower simulations | JHEP 07 (2014) 079 | 1405.0301 |
| 40 | T. Sjostrand et al. | An introduction to PYTHIA 8.2 | CPC 191 (2015) 159 | 1410.3012 |
| 41 | CMS Collaboration | Extraction and validation of a new set of CMS PYTHIA8 tunes from underlying-event measurements | EPJC 80 (2020) 4 | CMS-GEN-17-001 1903.12179 |
| 42 | R. J. Barlow and C. Beeston | Fitting using finite Monte Carlo samples | CPC 77 (1993) 219 | |
|
|
Compact Muon Solenoid LHC, CERN |
|

|

|

|

|

|