

Compact Muon Solenoid
LHC, CERN
| CMS-PAS-TOP-15-018 | ||
| Template measurement of the top quark forward-backward asymmetry and anomalous chromoelectric and chromomagnetic moments in the semileptonic channel at $\sqrt{s}=$ 13 TeV | ||
| CMS Collaboration | ||
| September 2019 | ||
| Abstract: The linearized parton-level top quark forward-backward asymmetry $A^{(1)}_{\mathrm{FB}}$ and anomalous chromoelectric ($d$) and chromomagnetic ($\mu$) moments are measured in 35.9 fb$^{-1}$ of LHC proton-proton collision data collected with the CMS detector in 2016 at a center-of-mass energy 13 TeV. Candidate top quark/antiquark pair events decaying to lepton (muon or electron) plus jets final states with "resolved" (low energy) and "boosted" (high energy) topologies are selected and reconstructed using a kinematic fit of the decay products to top quark pair hypotheses. Parameters of interest are measured using binned likelihood fits to observed data of differential models based on extensions to tree-level cross sections for quark-antiquark and gluon-gluon initial states, and are determined to be $A^{(1)}_{\mathrm{FB}}=$ 0.048$^{+0.088}_{-0.084}$(stat) $\pm$ 0.028 (syst), $d=$ 0.002 $\pm$ 0.010 (stat) $^{+0.014}_{-0.019}$ (syst), and $\mu=$ -0.024 $^{+0.013}_{-0.007}$(stat) $^{+0.016}_{-0.006}$ (syst). The forward-backward asymmetry measured using this technique is directly comparable to similar quantities derived from Tevatron measurements. | ||
|
Links:
CDS record (PDF) ;
CADI line (restricted) ;
These preliminary results are superseded in this paper, JHEP 06 (2020) 146. The superseded preliminary plots can be found here. |
||
| Figures | |
png pdf |
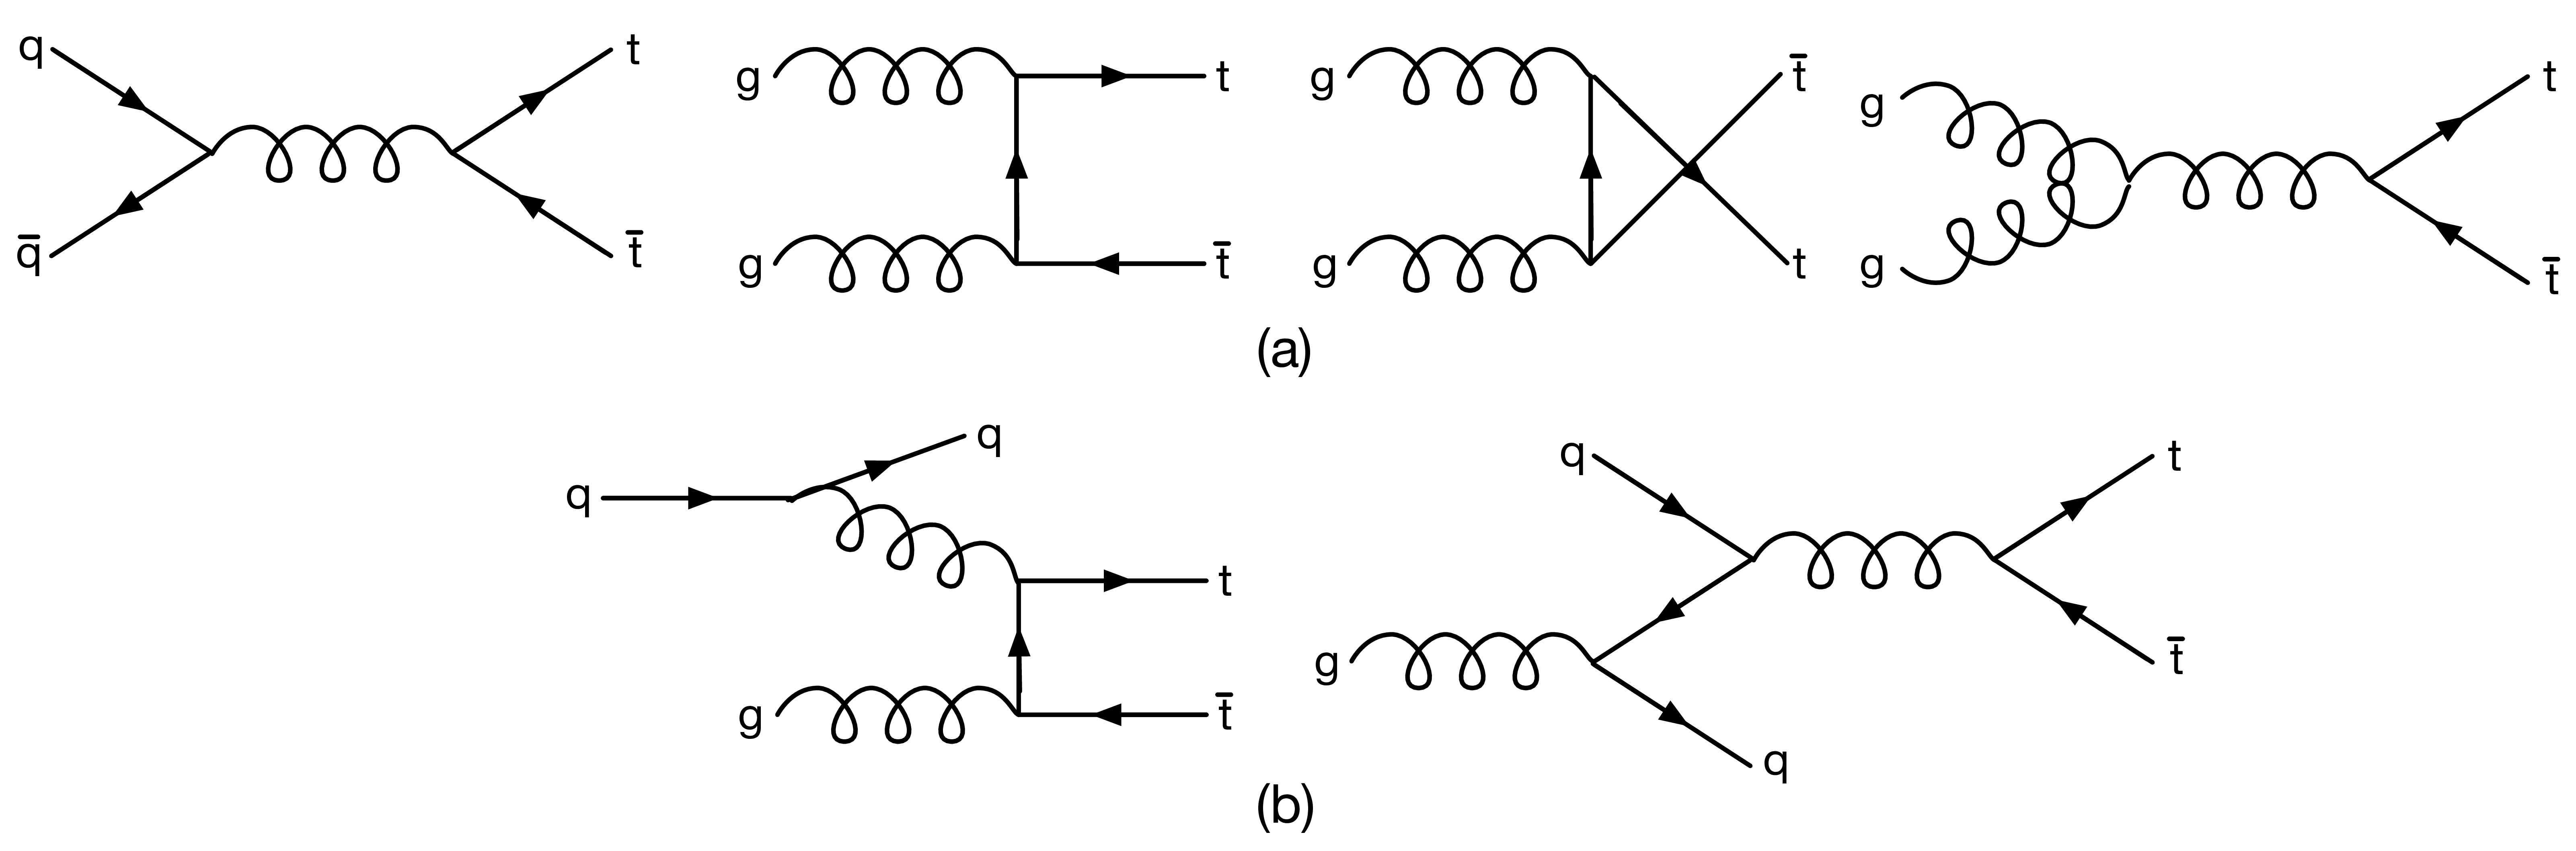
Figure 1:
(a) Feynman diagrams for the leading order (LO) quark-antiquark (${\mathrm{q} \mathrm{\bar{q}}}$) and gluon-gluon (gg) initiated subprocesses. (b) Example diagrams for the next-to-leading order (NLO) quark-gluon (${\mathrm{q}}{\mathrm{g}}$) initiated subprocess. |
png pdf |
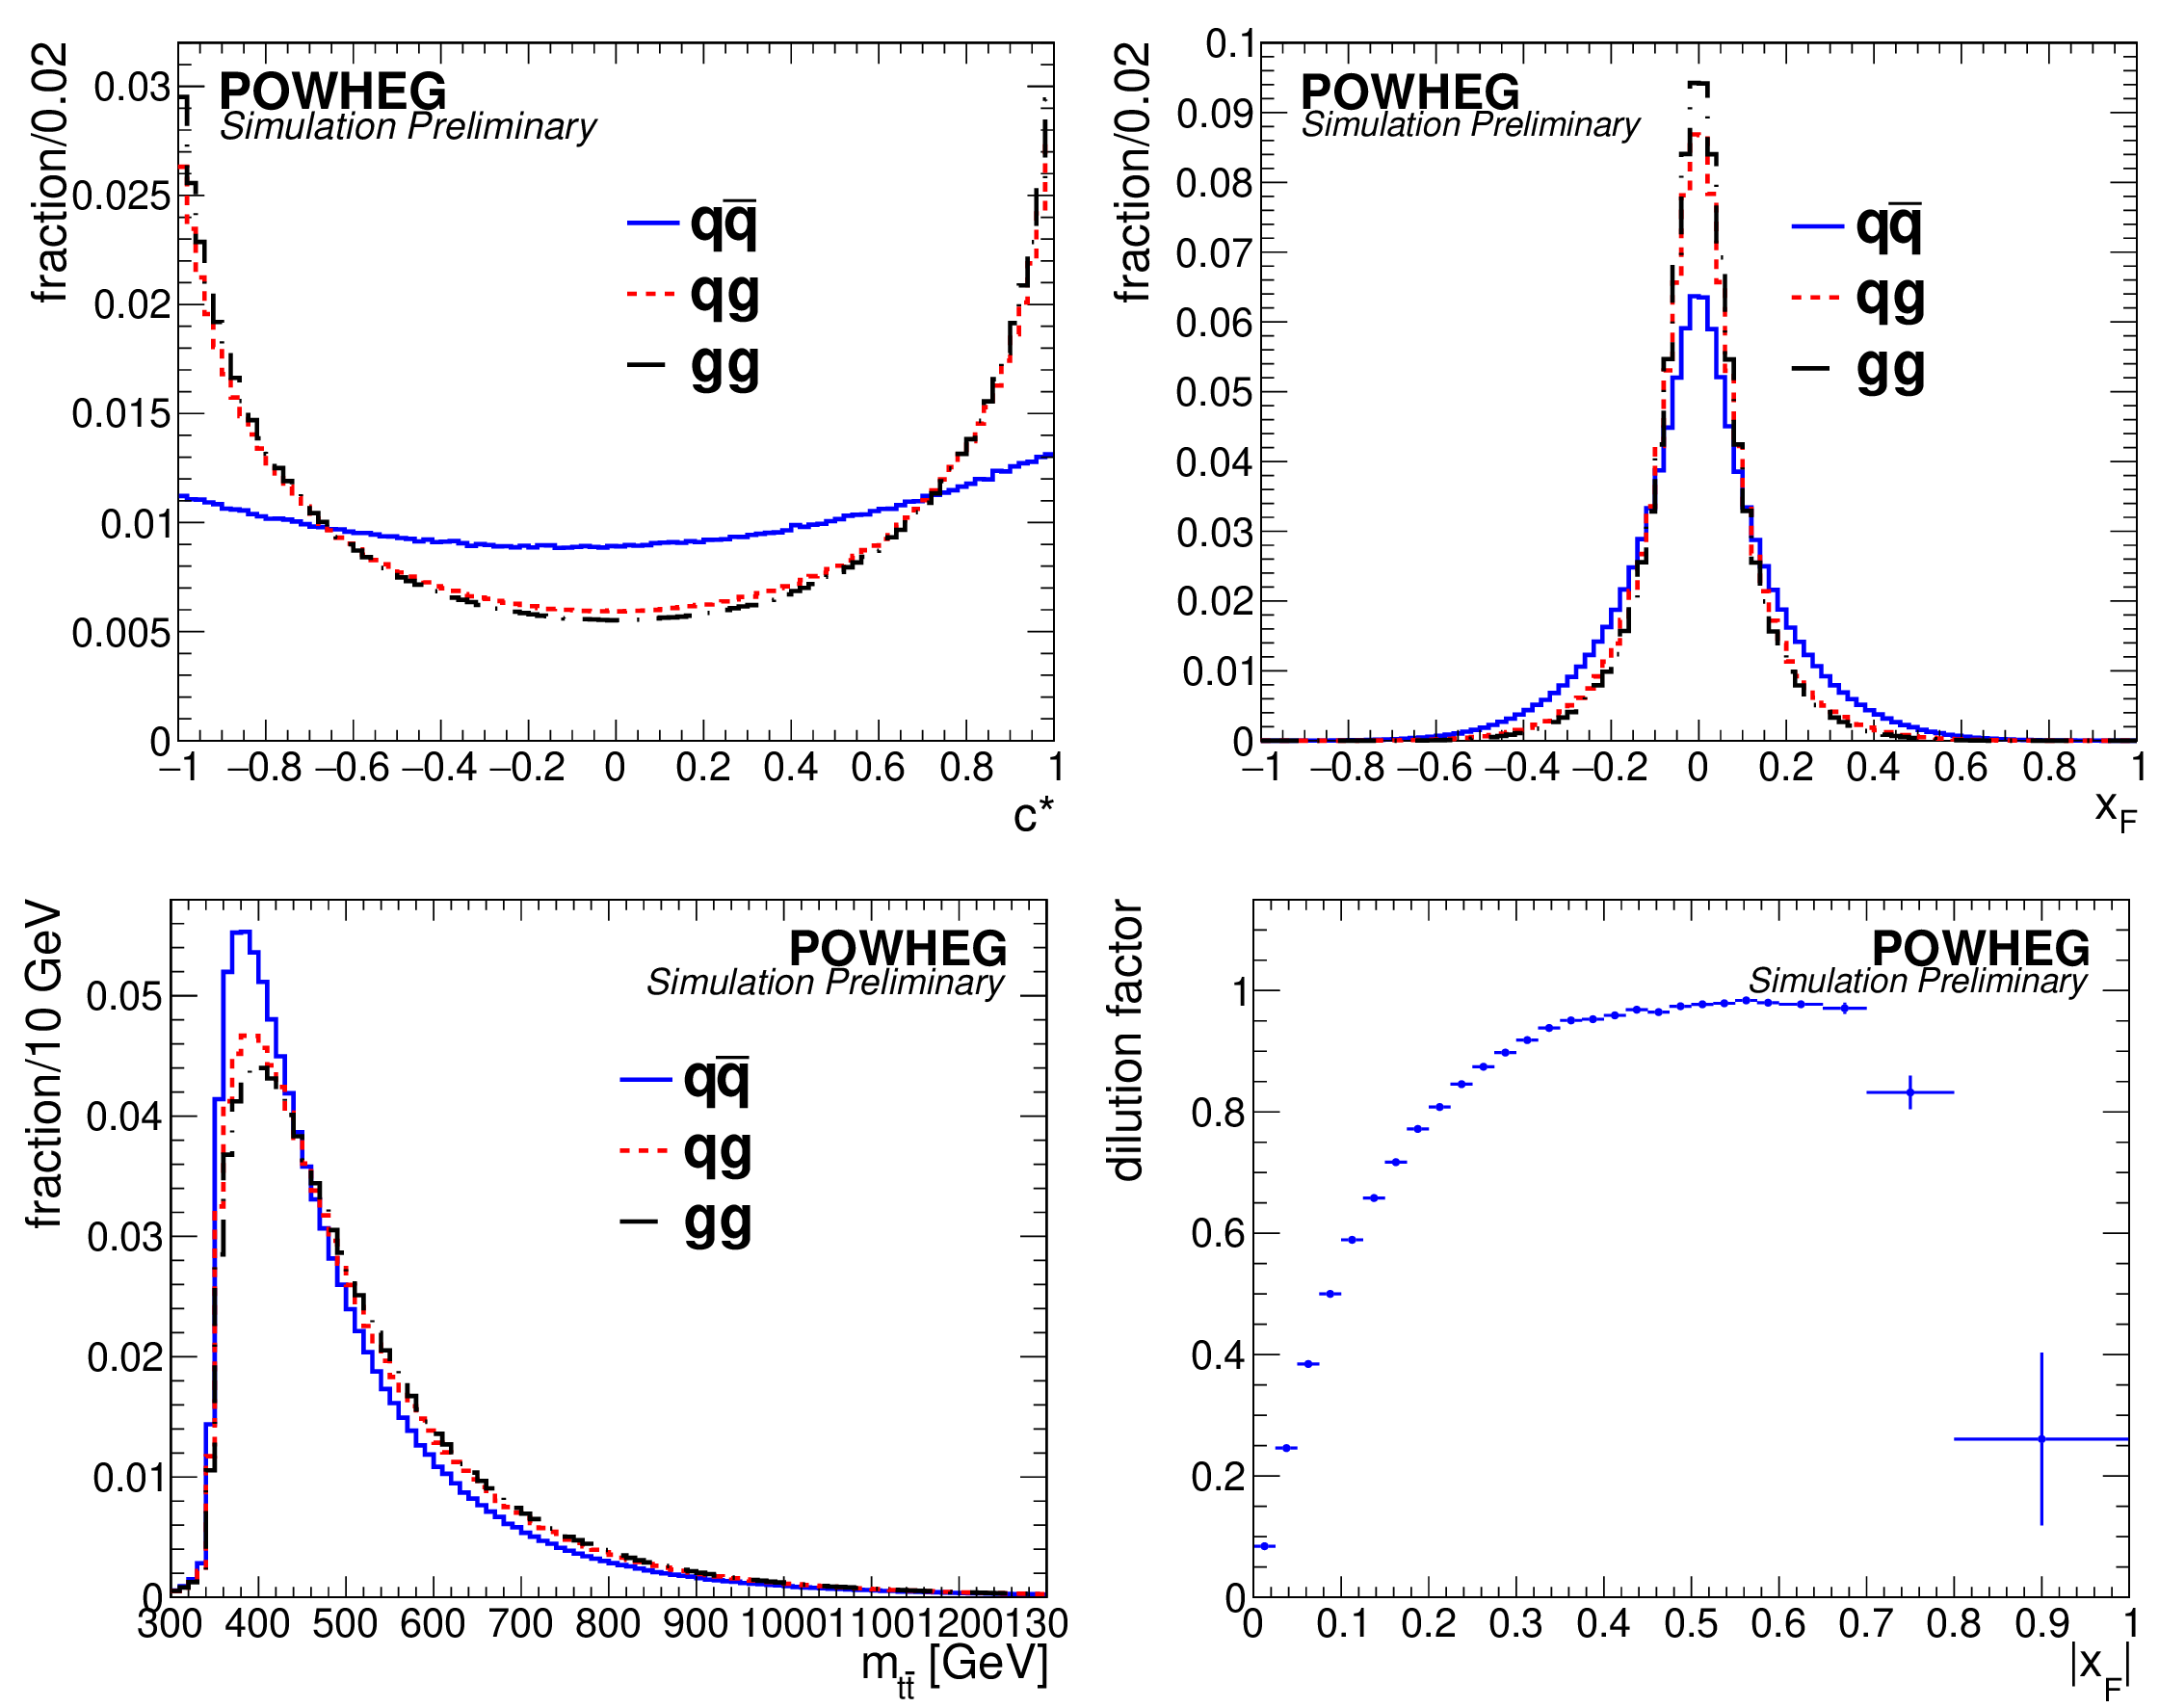
Figure 2:
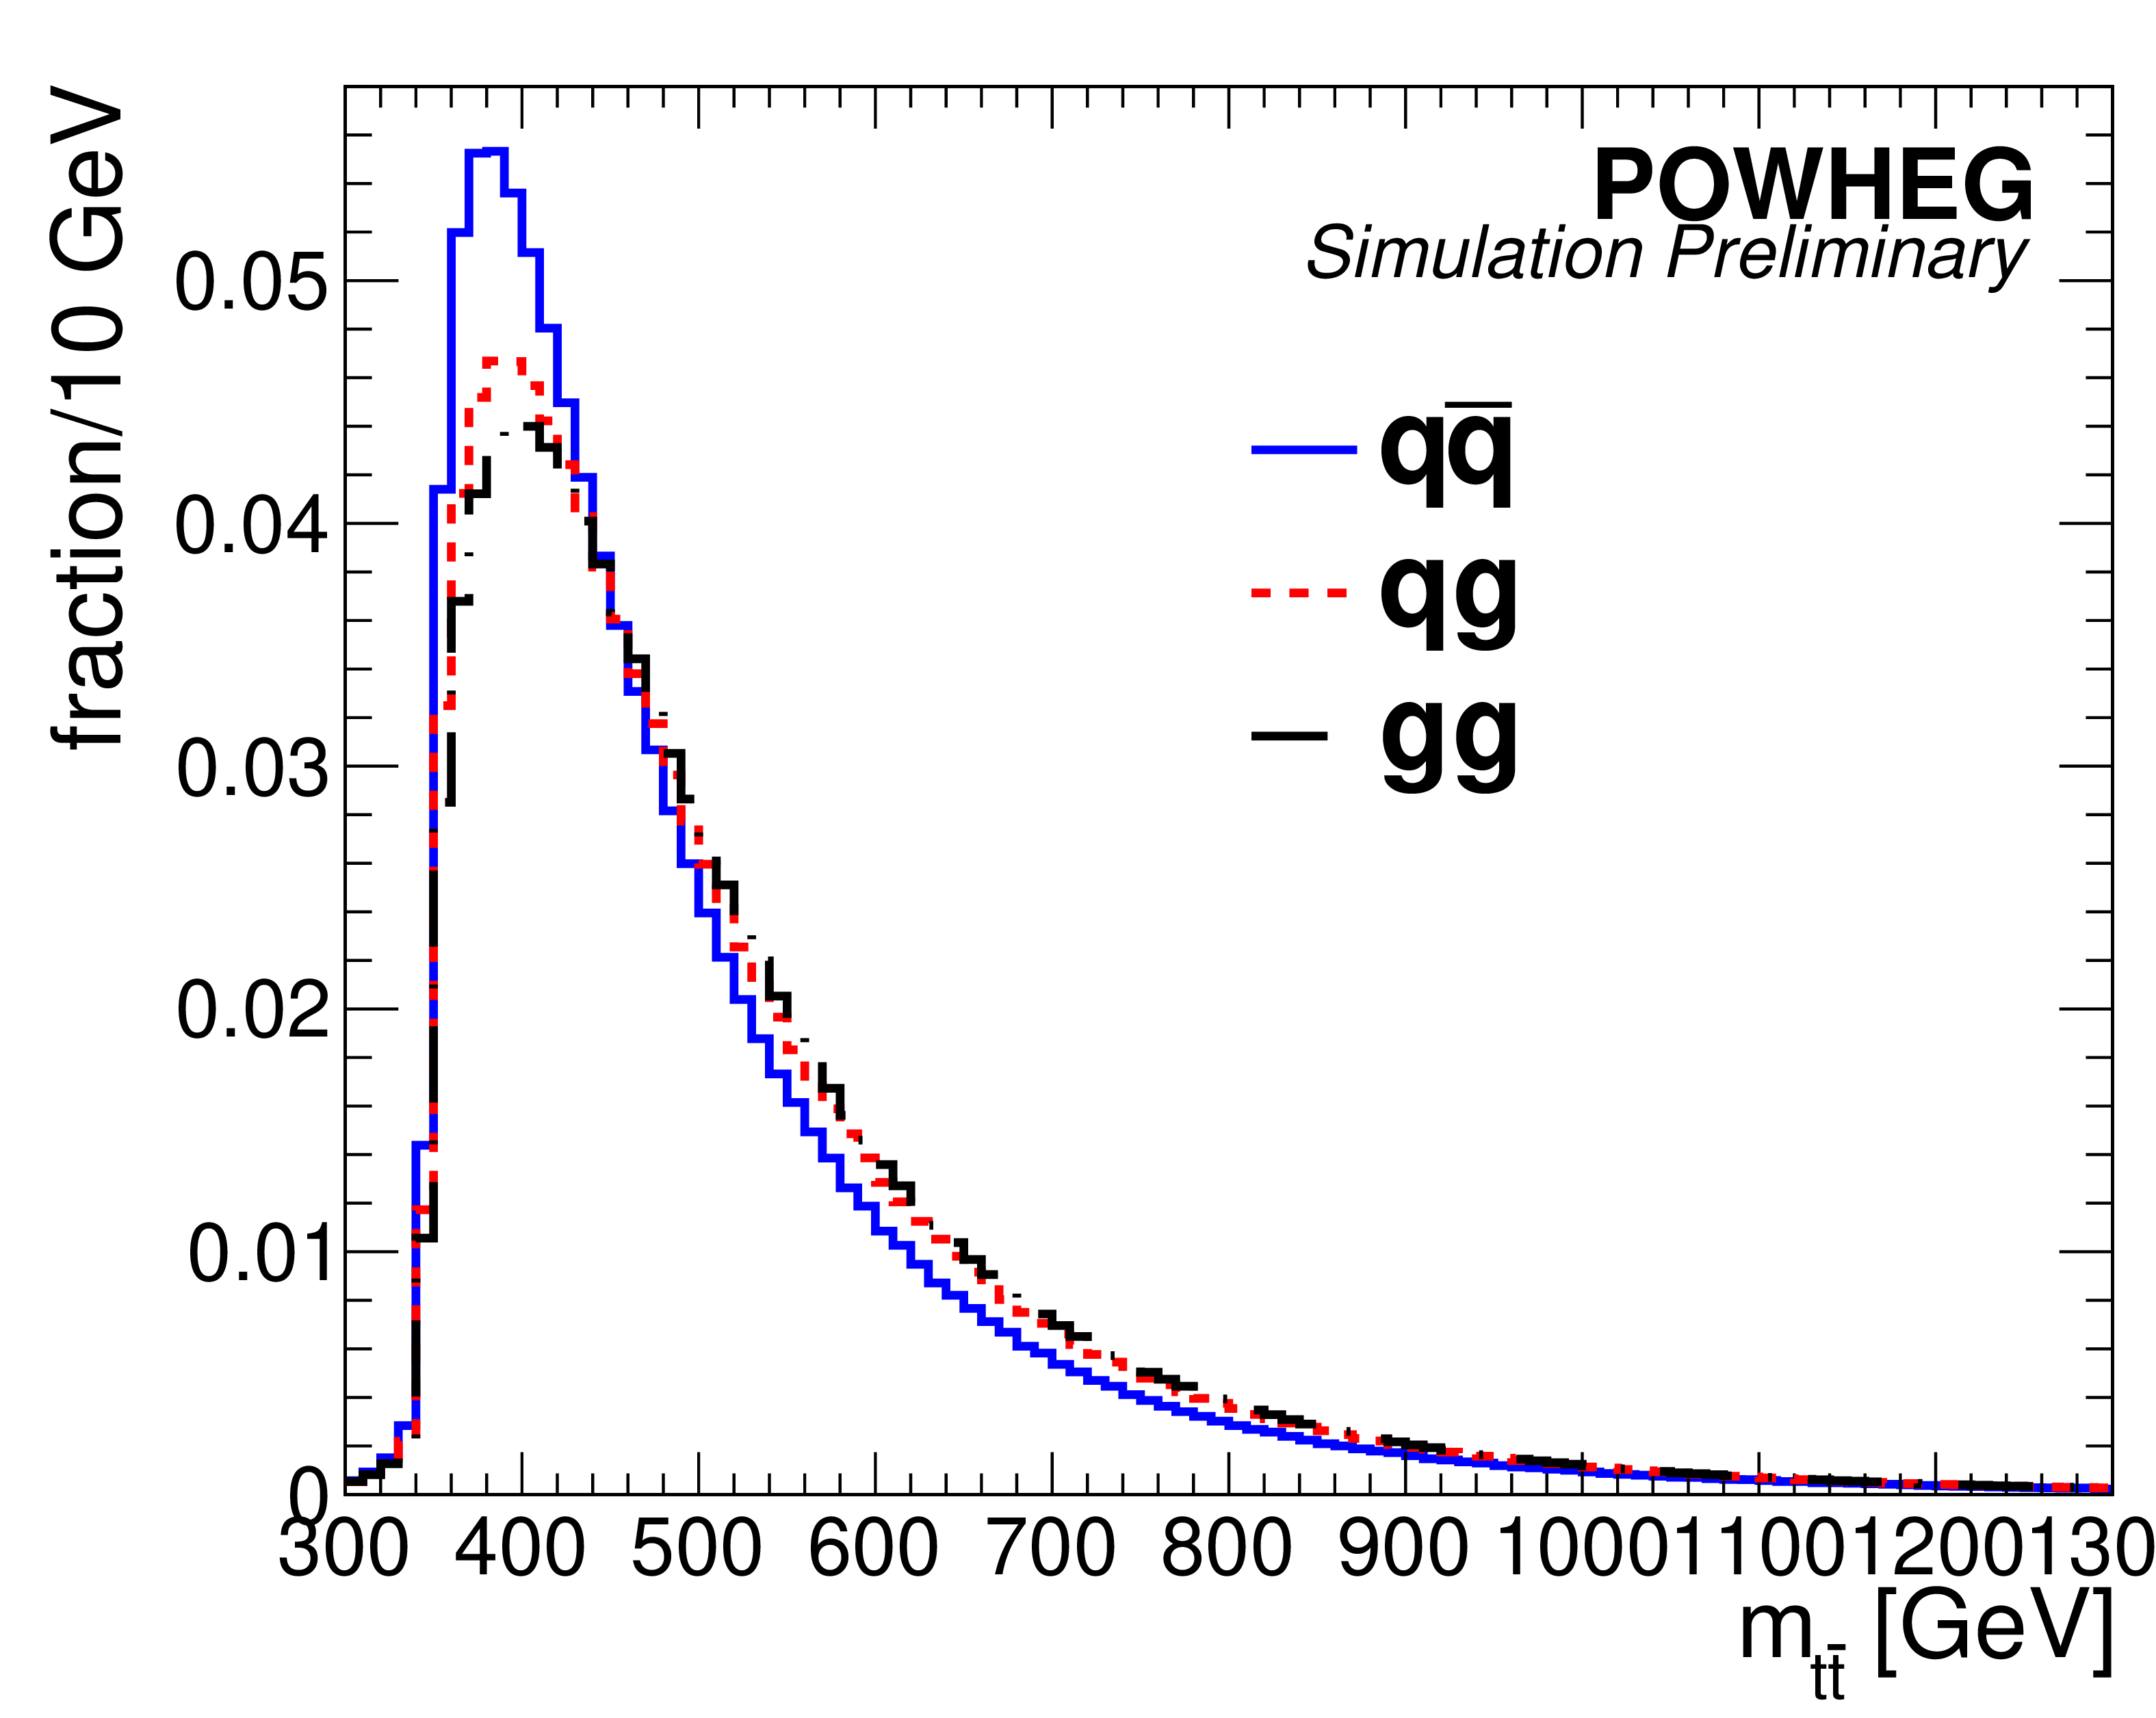
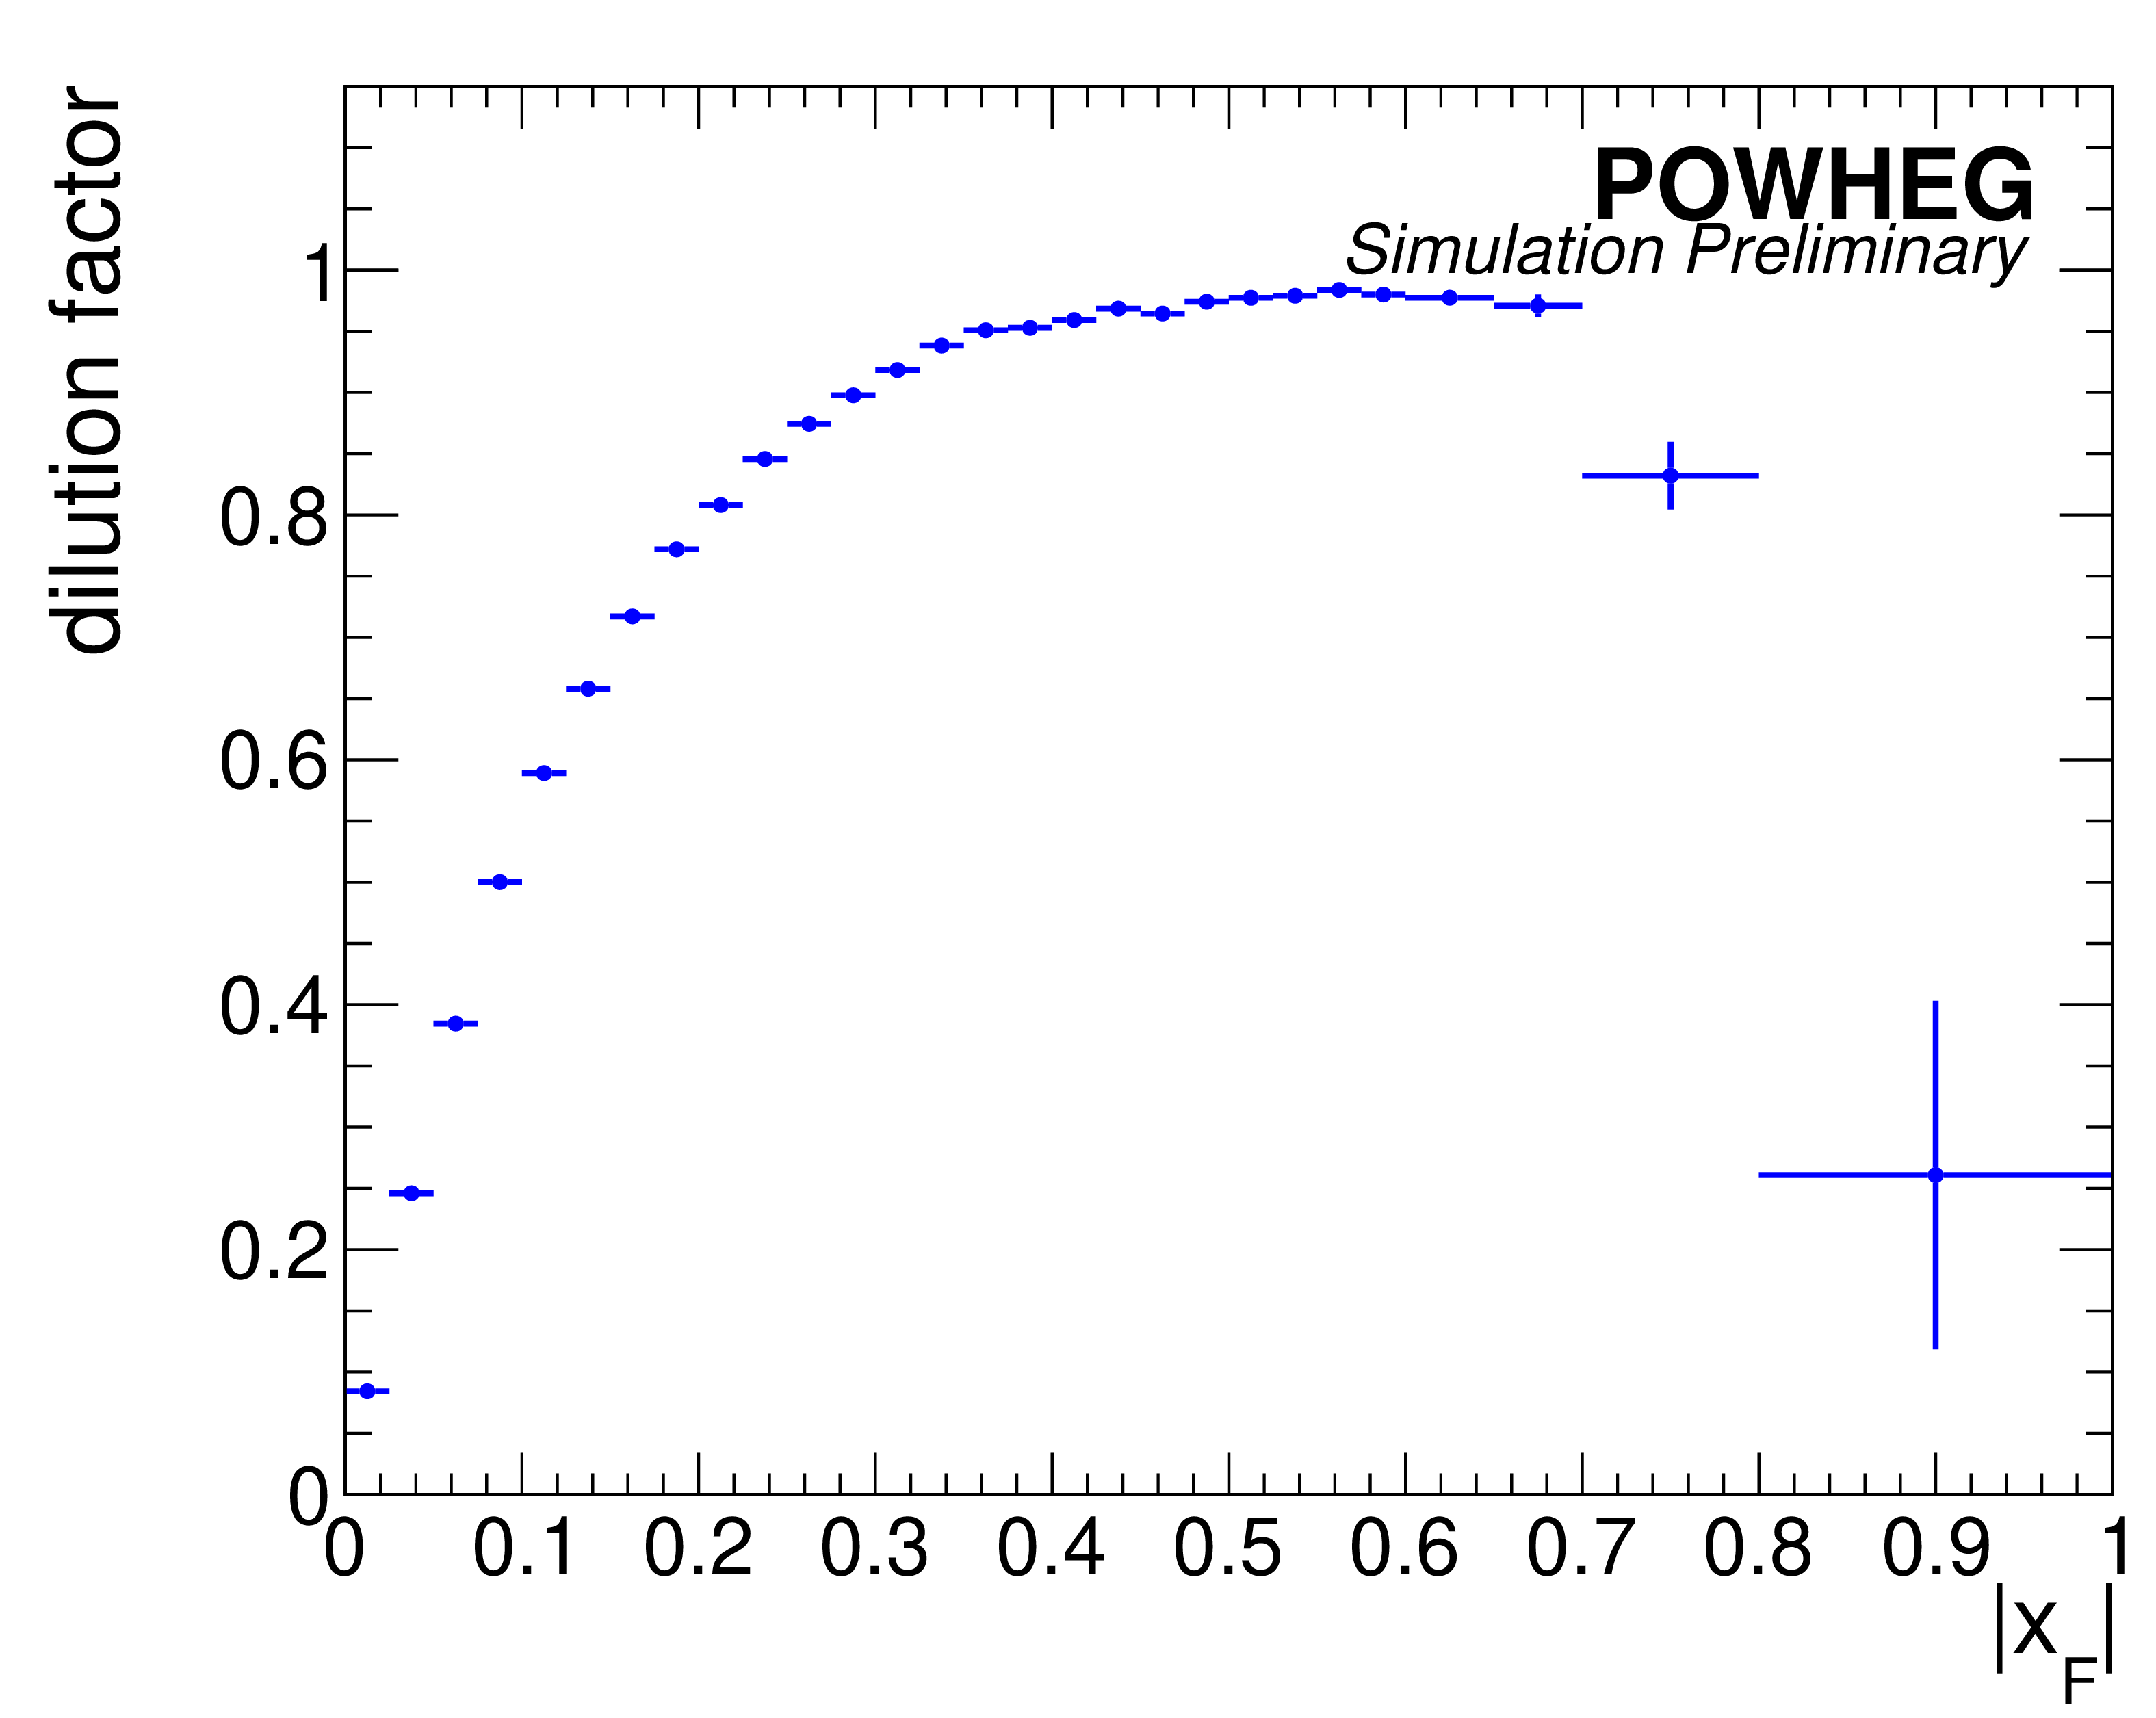
The generator-level ${c^{*}}$ (top left), ${x_{F}}$ (top right), and ${m_{{\mathrm{t} {}\mathrm{\bar{t}}}}}$ (bottom left) distributions for the subprocesses $ {\mathrm{q} \mathrm{\bar{q}}} / {\mathrm{q}}{\mathrm{g}}/ {\mathrm{g}}{\mathrm{g}}\to {\mathrm{t} {}\mathrm{\bar{t}}} $. The result of taking the longitudinal direction of the ${\mathrm{t} {}\mathrm{\bar{t}}}$ pair in the lab frame as the quark direction for ${\mathrm{q} \mathrm{\bar{q}}}$ events is shown in the bottom right plot. |
png pdf |
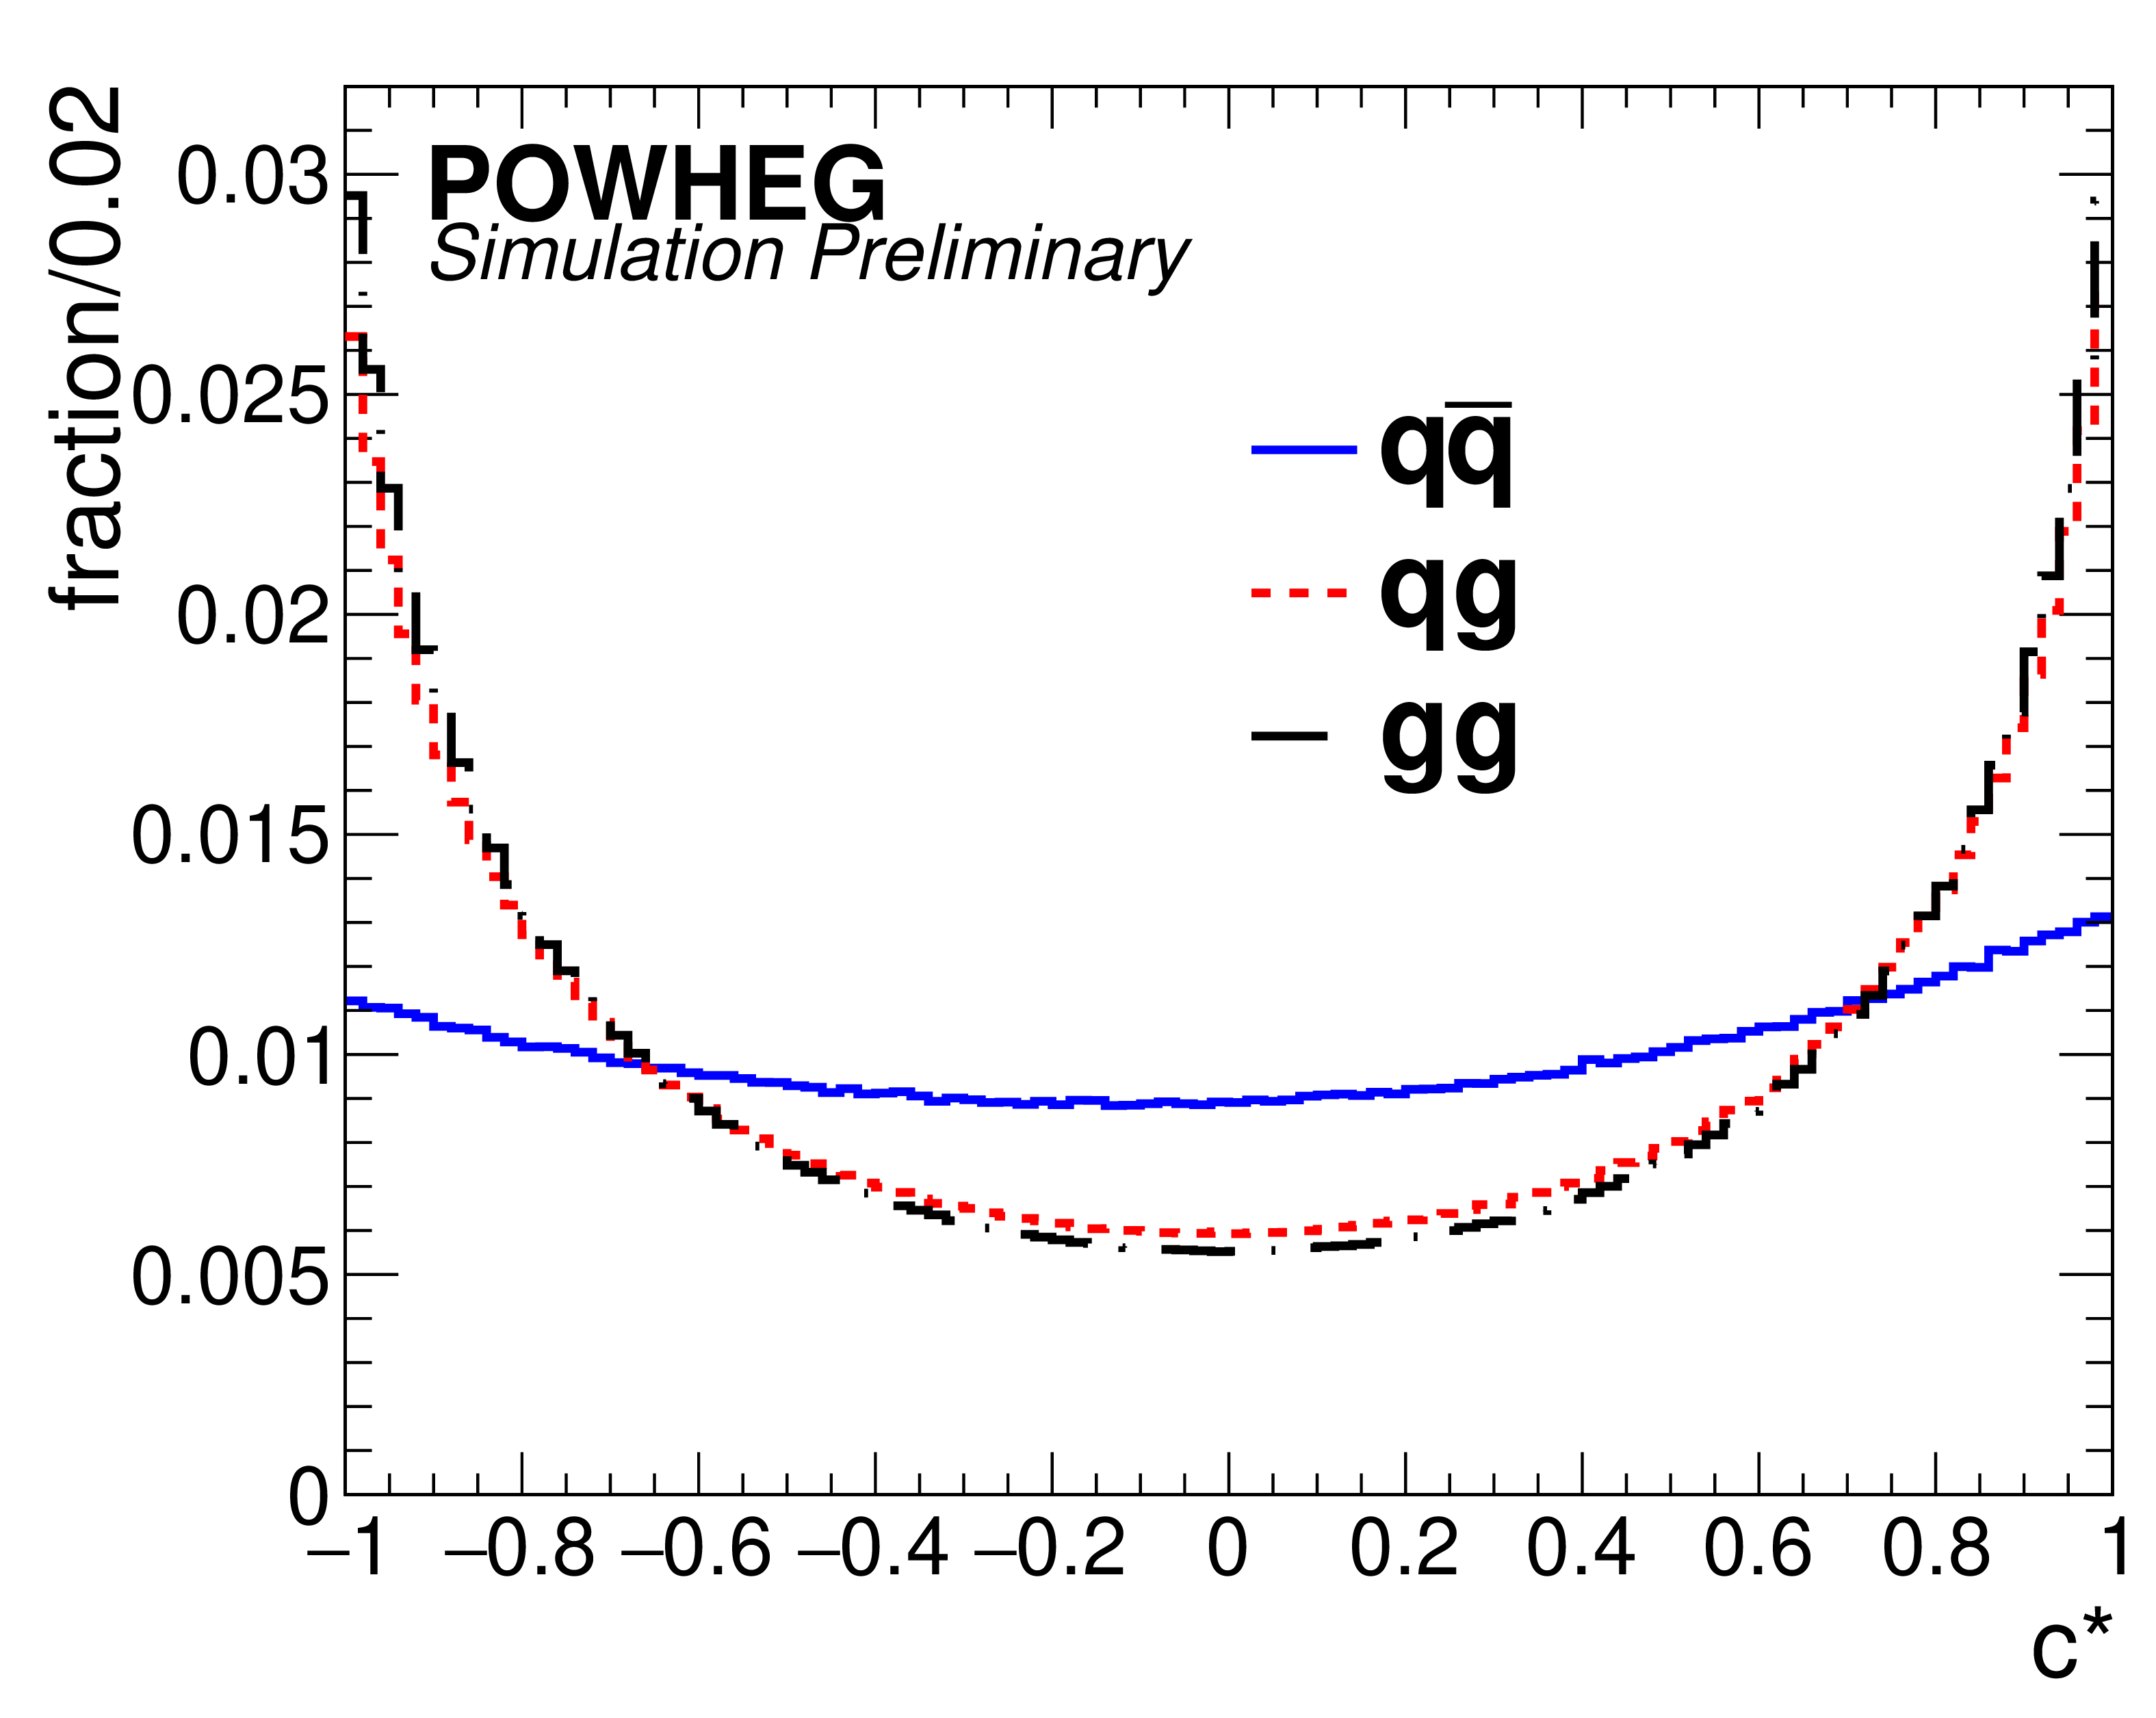
Figure 2-a:
The generator-level ${c^{*}}$ distribution for the subprocesses $ {\mathrm{q} \mathrm{\bar{q}}} / {\mathrm{q}}{\mathrm{g}}/ {\mathrm{g}}{\mathrm{g}}\to {\mathrm{t} {}\mathrm{\bar{t}}} $. |
png pdf |
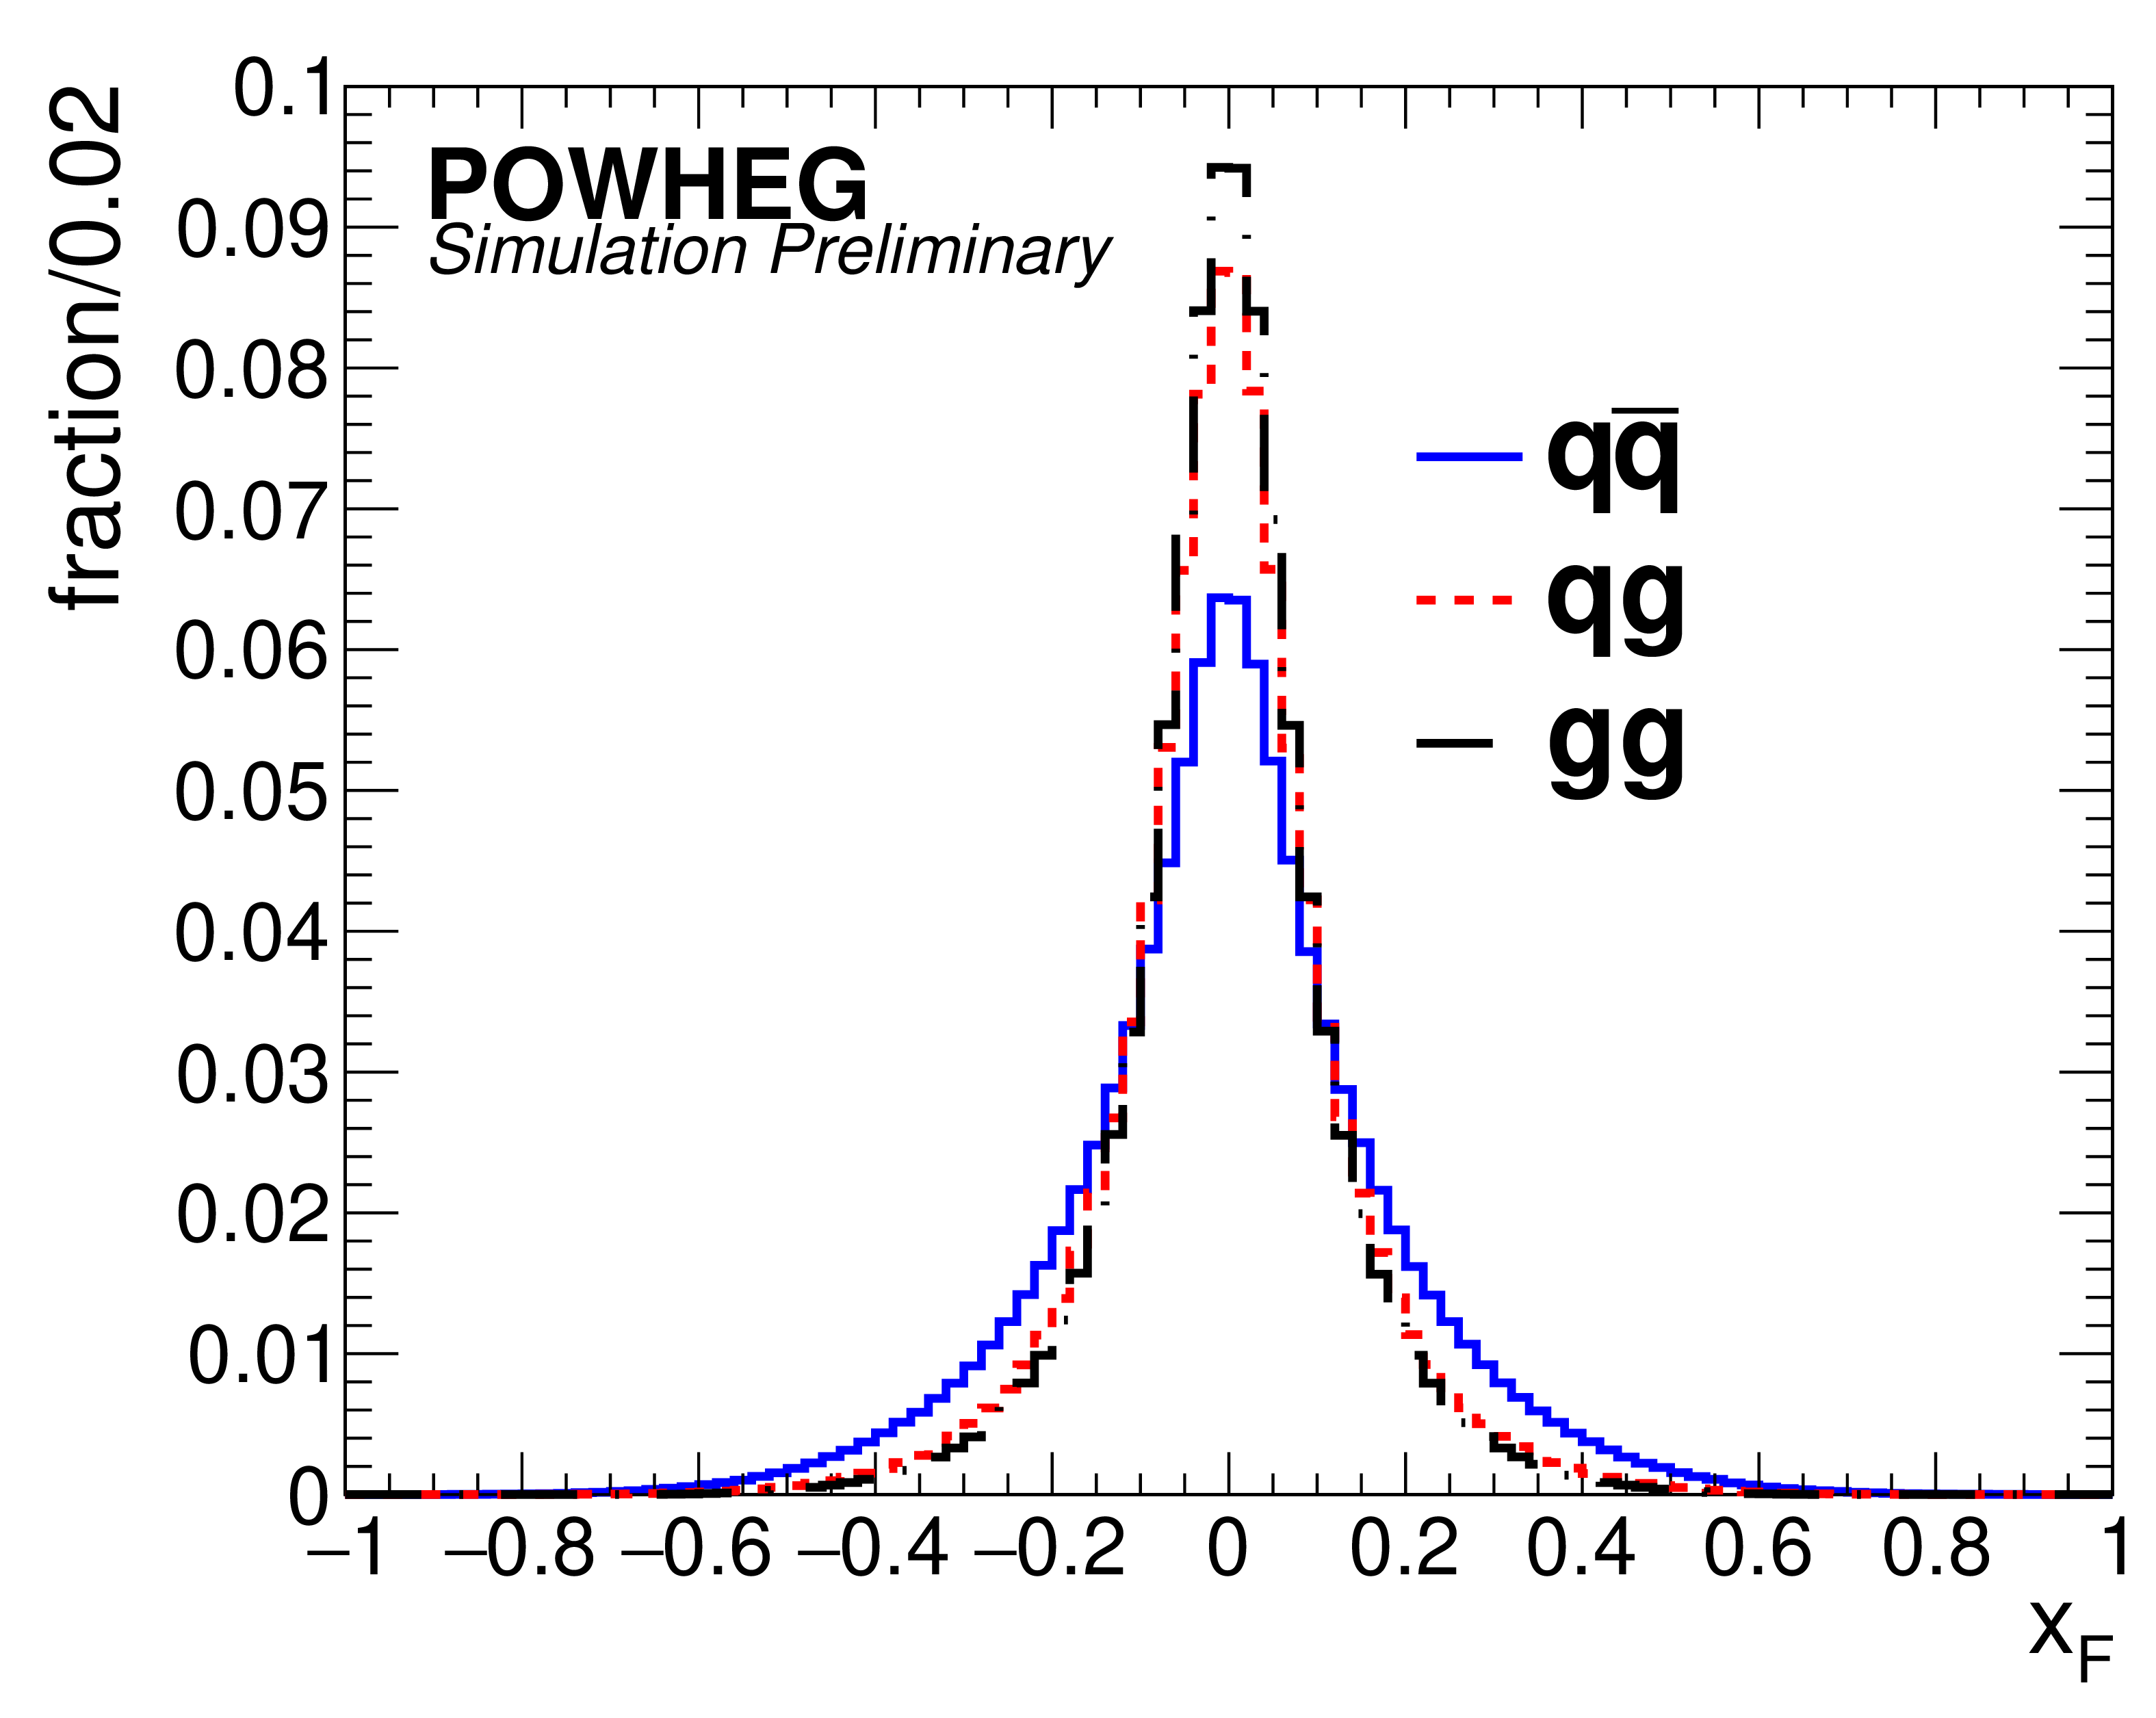
Figure 2-b:
The generator-level ${x_{F}}$ distribution for the subprocesses $ {\mathrm{q} \mathrm{\bar{q}}} / {\mathrm{q}}{\mathrm{g}}/ {\mathrm{g}}{\mathrm{g}}\to {\mathrm{t} {}\mathrm{\bar{t}}} $. |
png pdf |
Figure 2-c:
The generator-level ${m_{{\mathrm{t} {}\mathrm{\bar{t}}}}}$ distribution for the subprocesses $ {\mathrm{q} \mathrm{\bar{q}}} / {\mathrm{q}}{\mathrm{g}}/ {\mathrm{g}}{\mathrm{g}}\to {\mathrm{t} {}\mathrm{\bar{t}}} $. |
png pdf |
Figure 2-d:
The result of taking the longitudinal direction of the ${\mathrm{t} {}\mathrm{\bar{t}}}$ pair in the lab frame as the quark direction for ${\mathrm{q} \mathrm{\bar{q}}}$ events is shown. |
png pdf |
Figure 3:
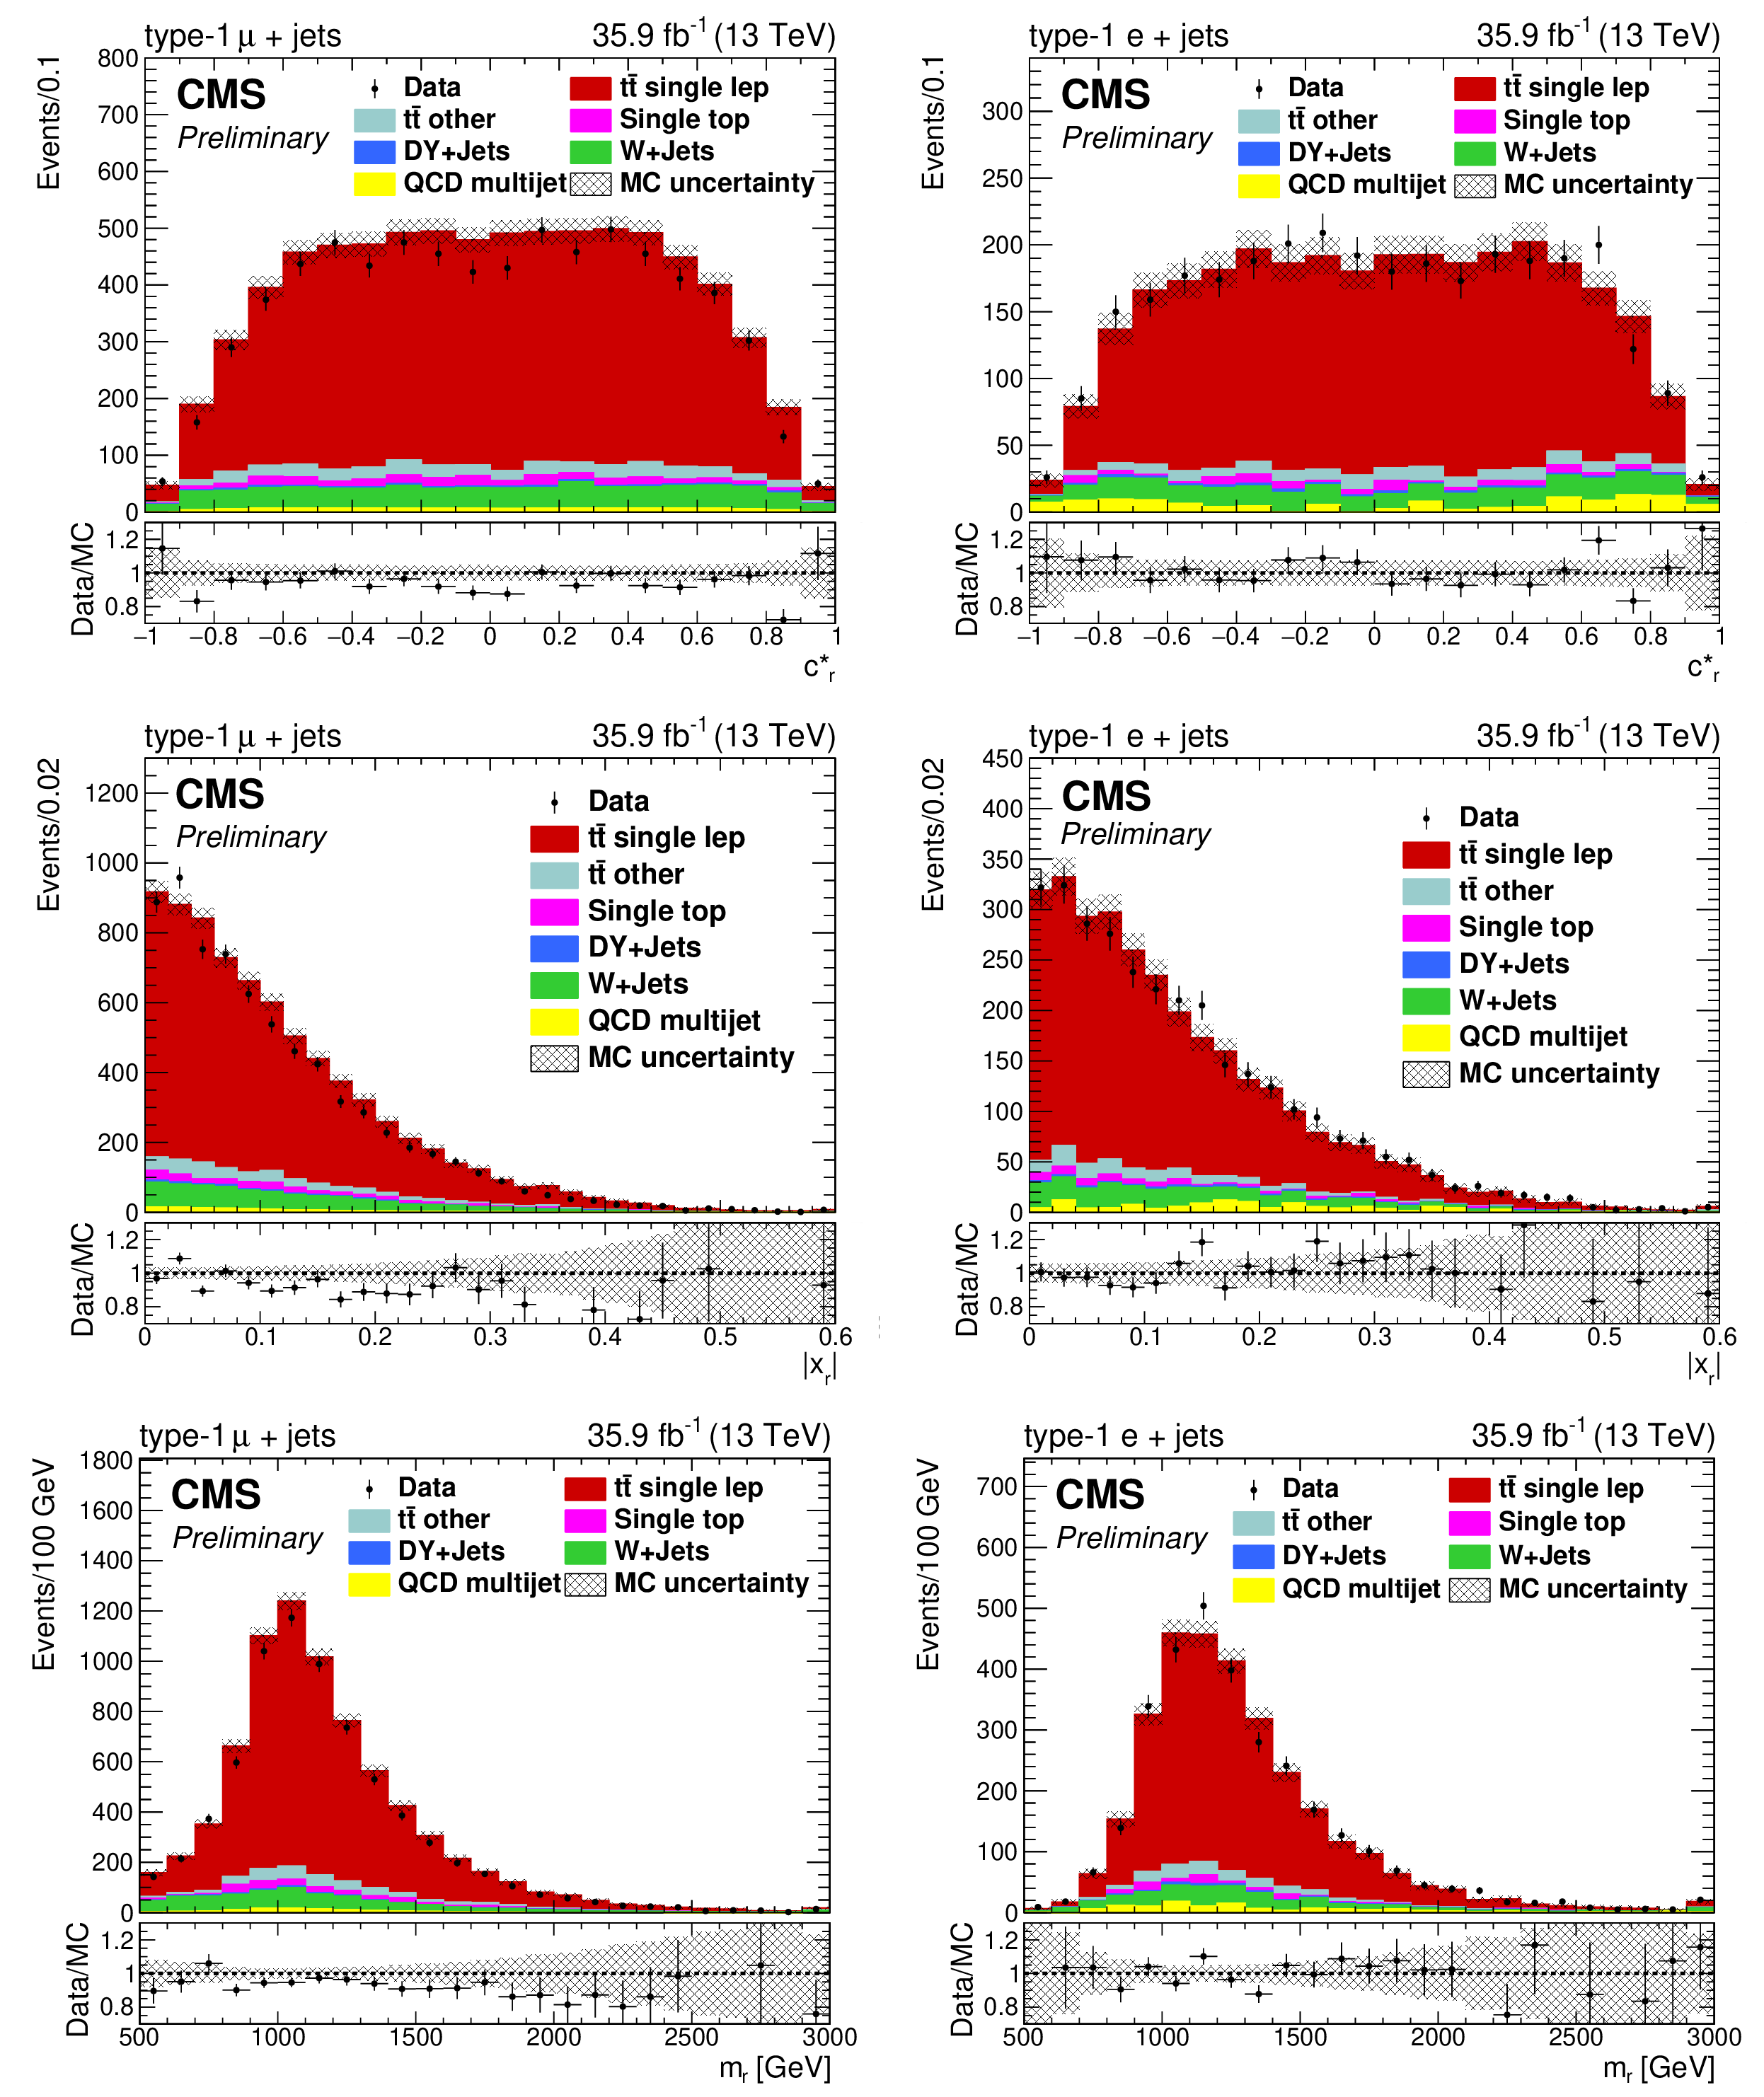
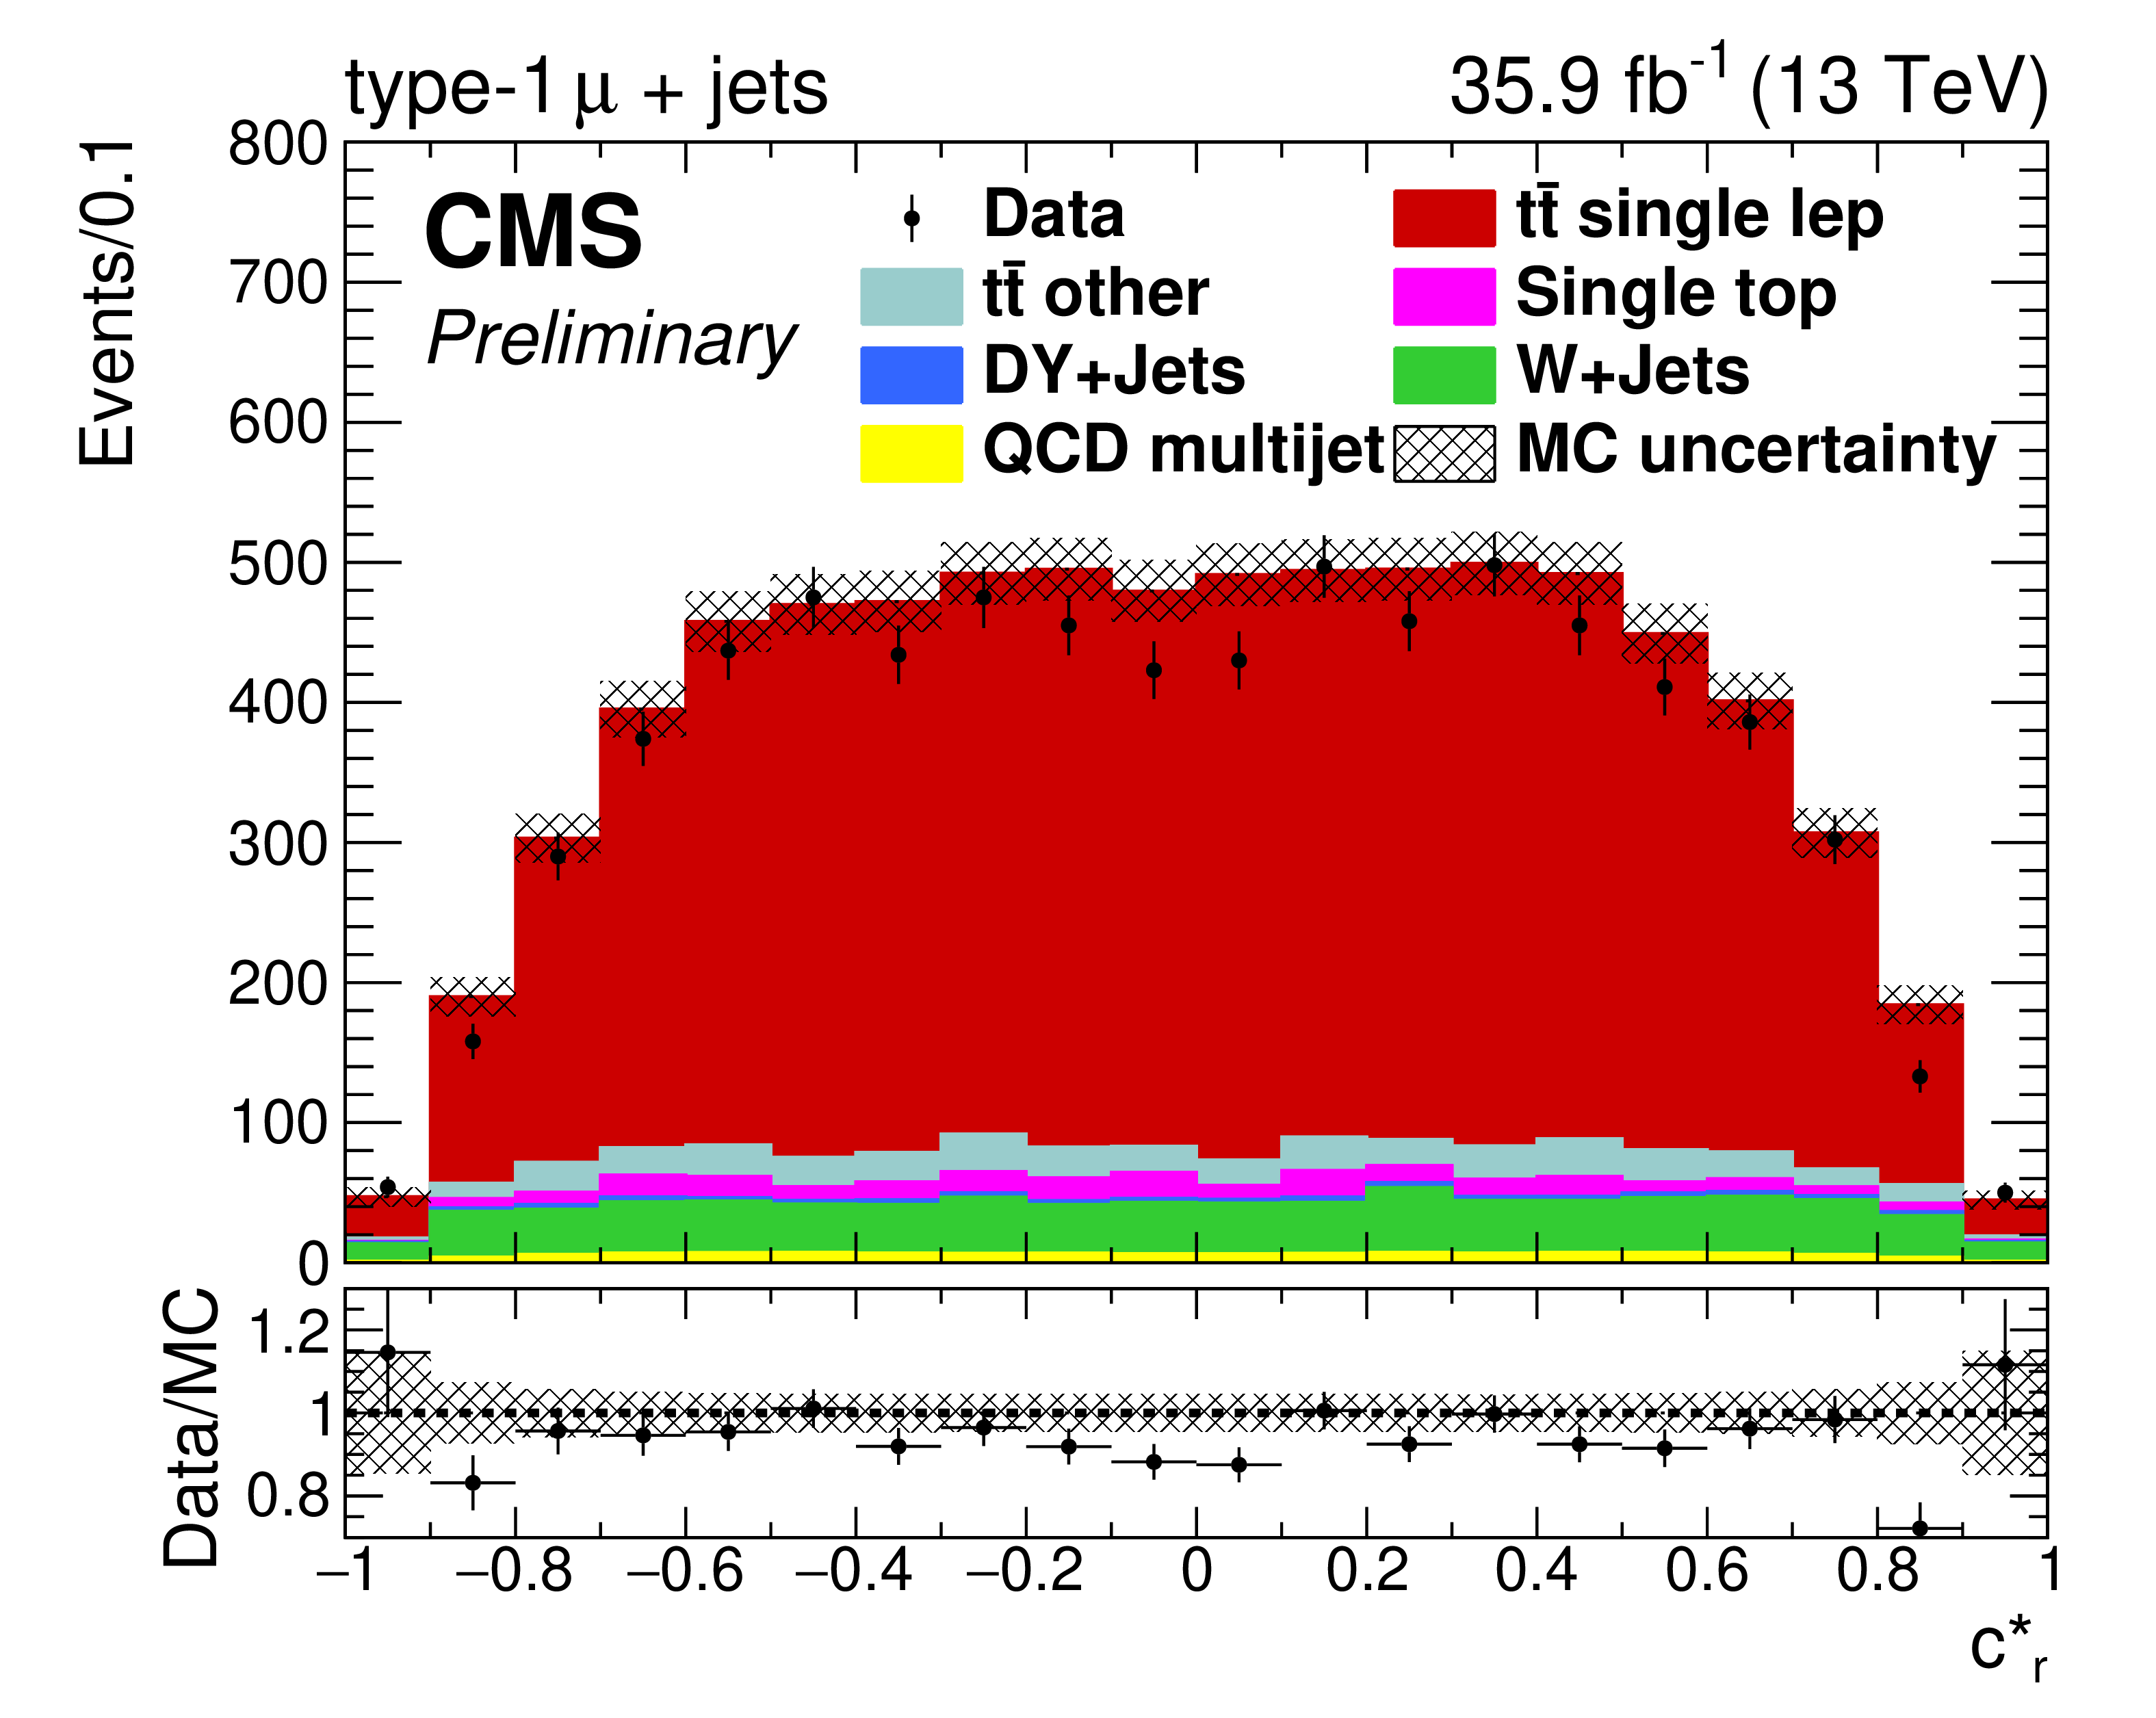
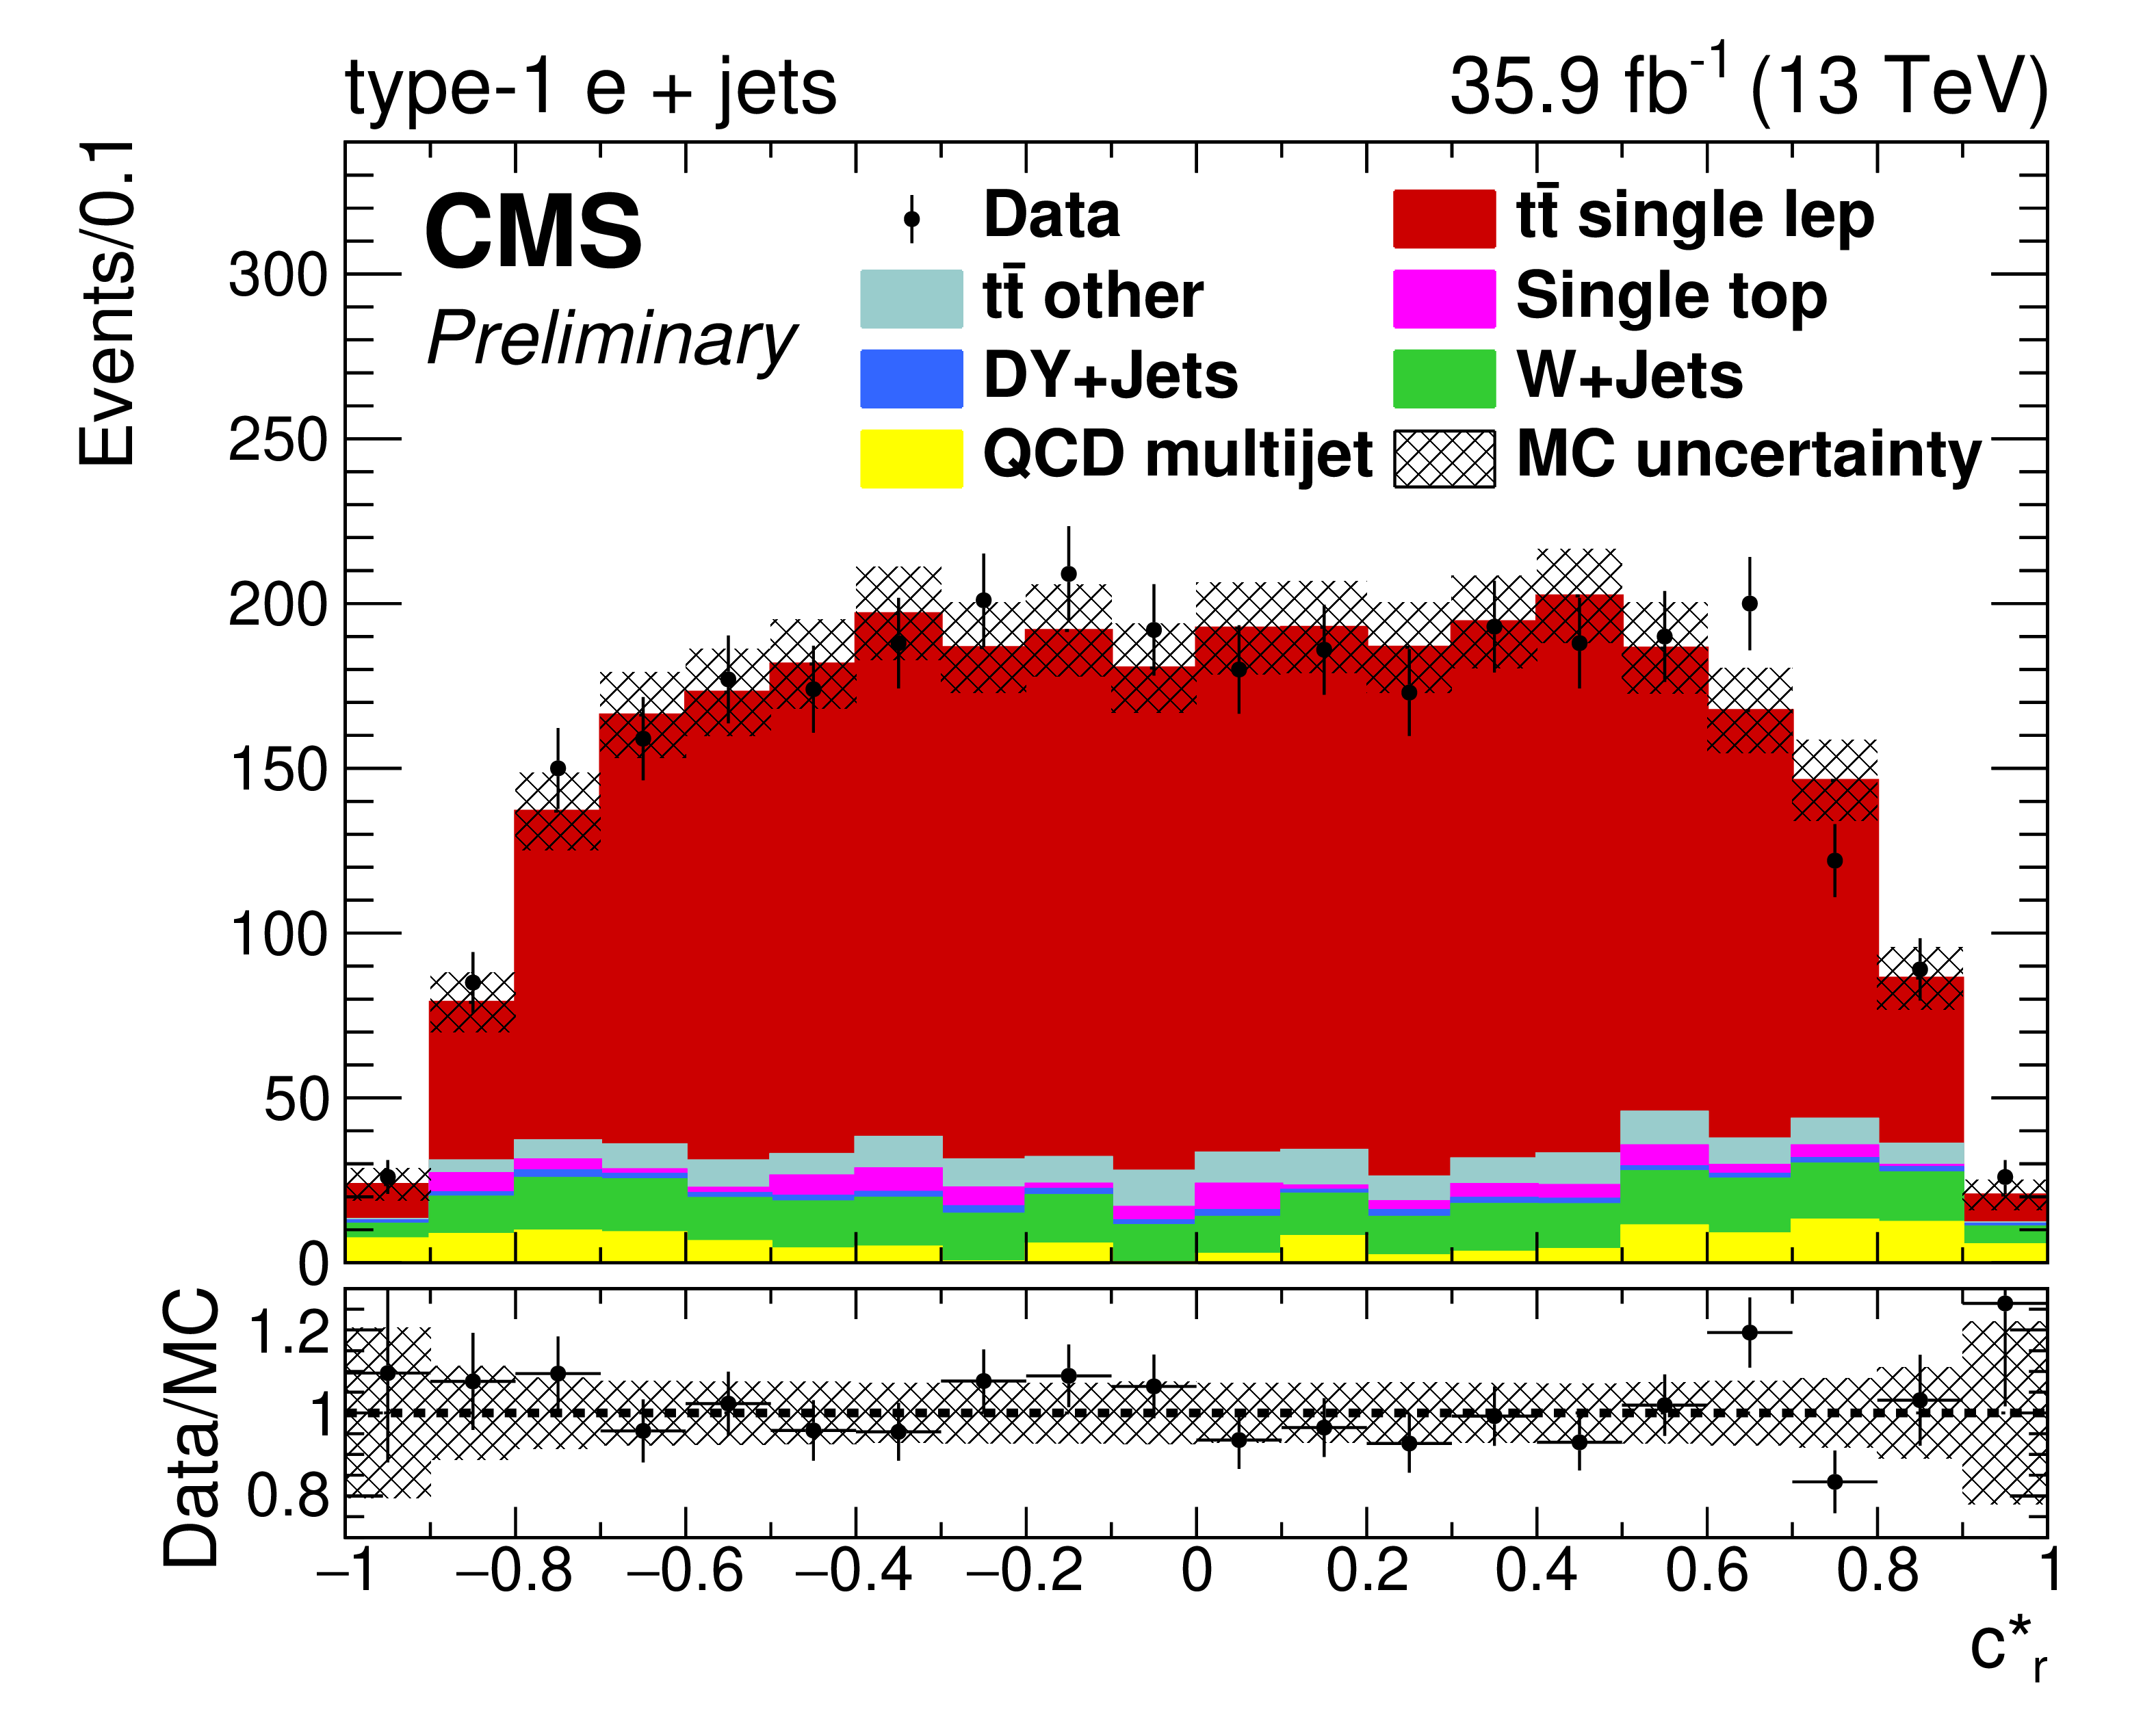
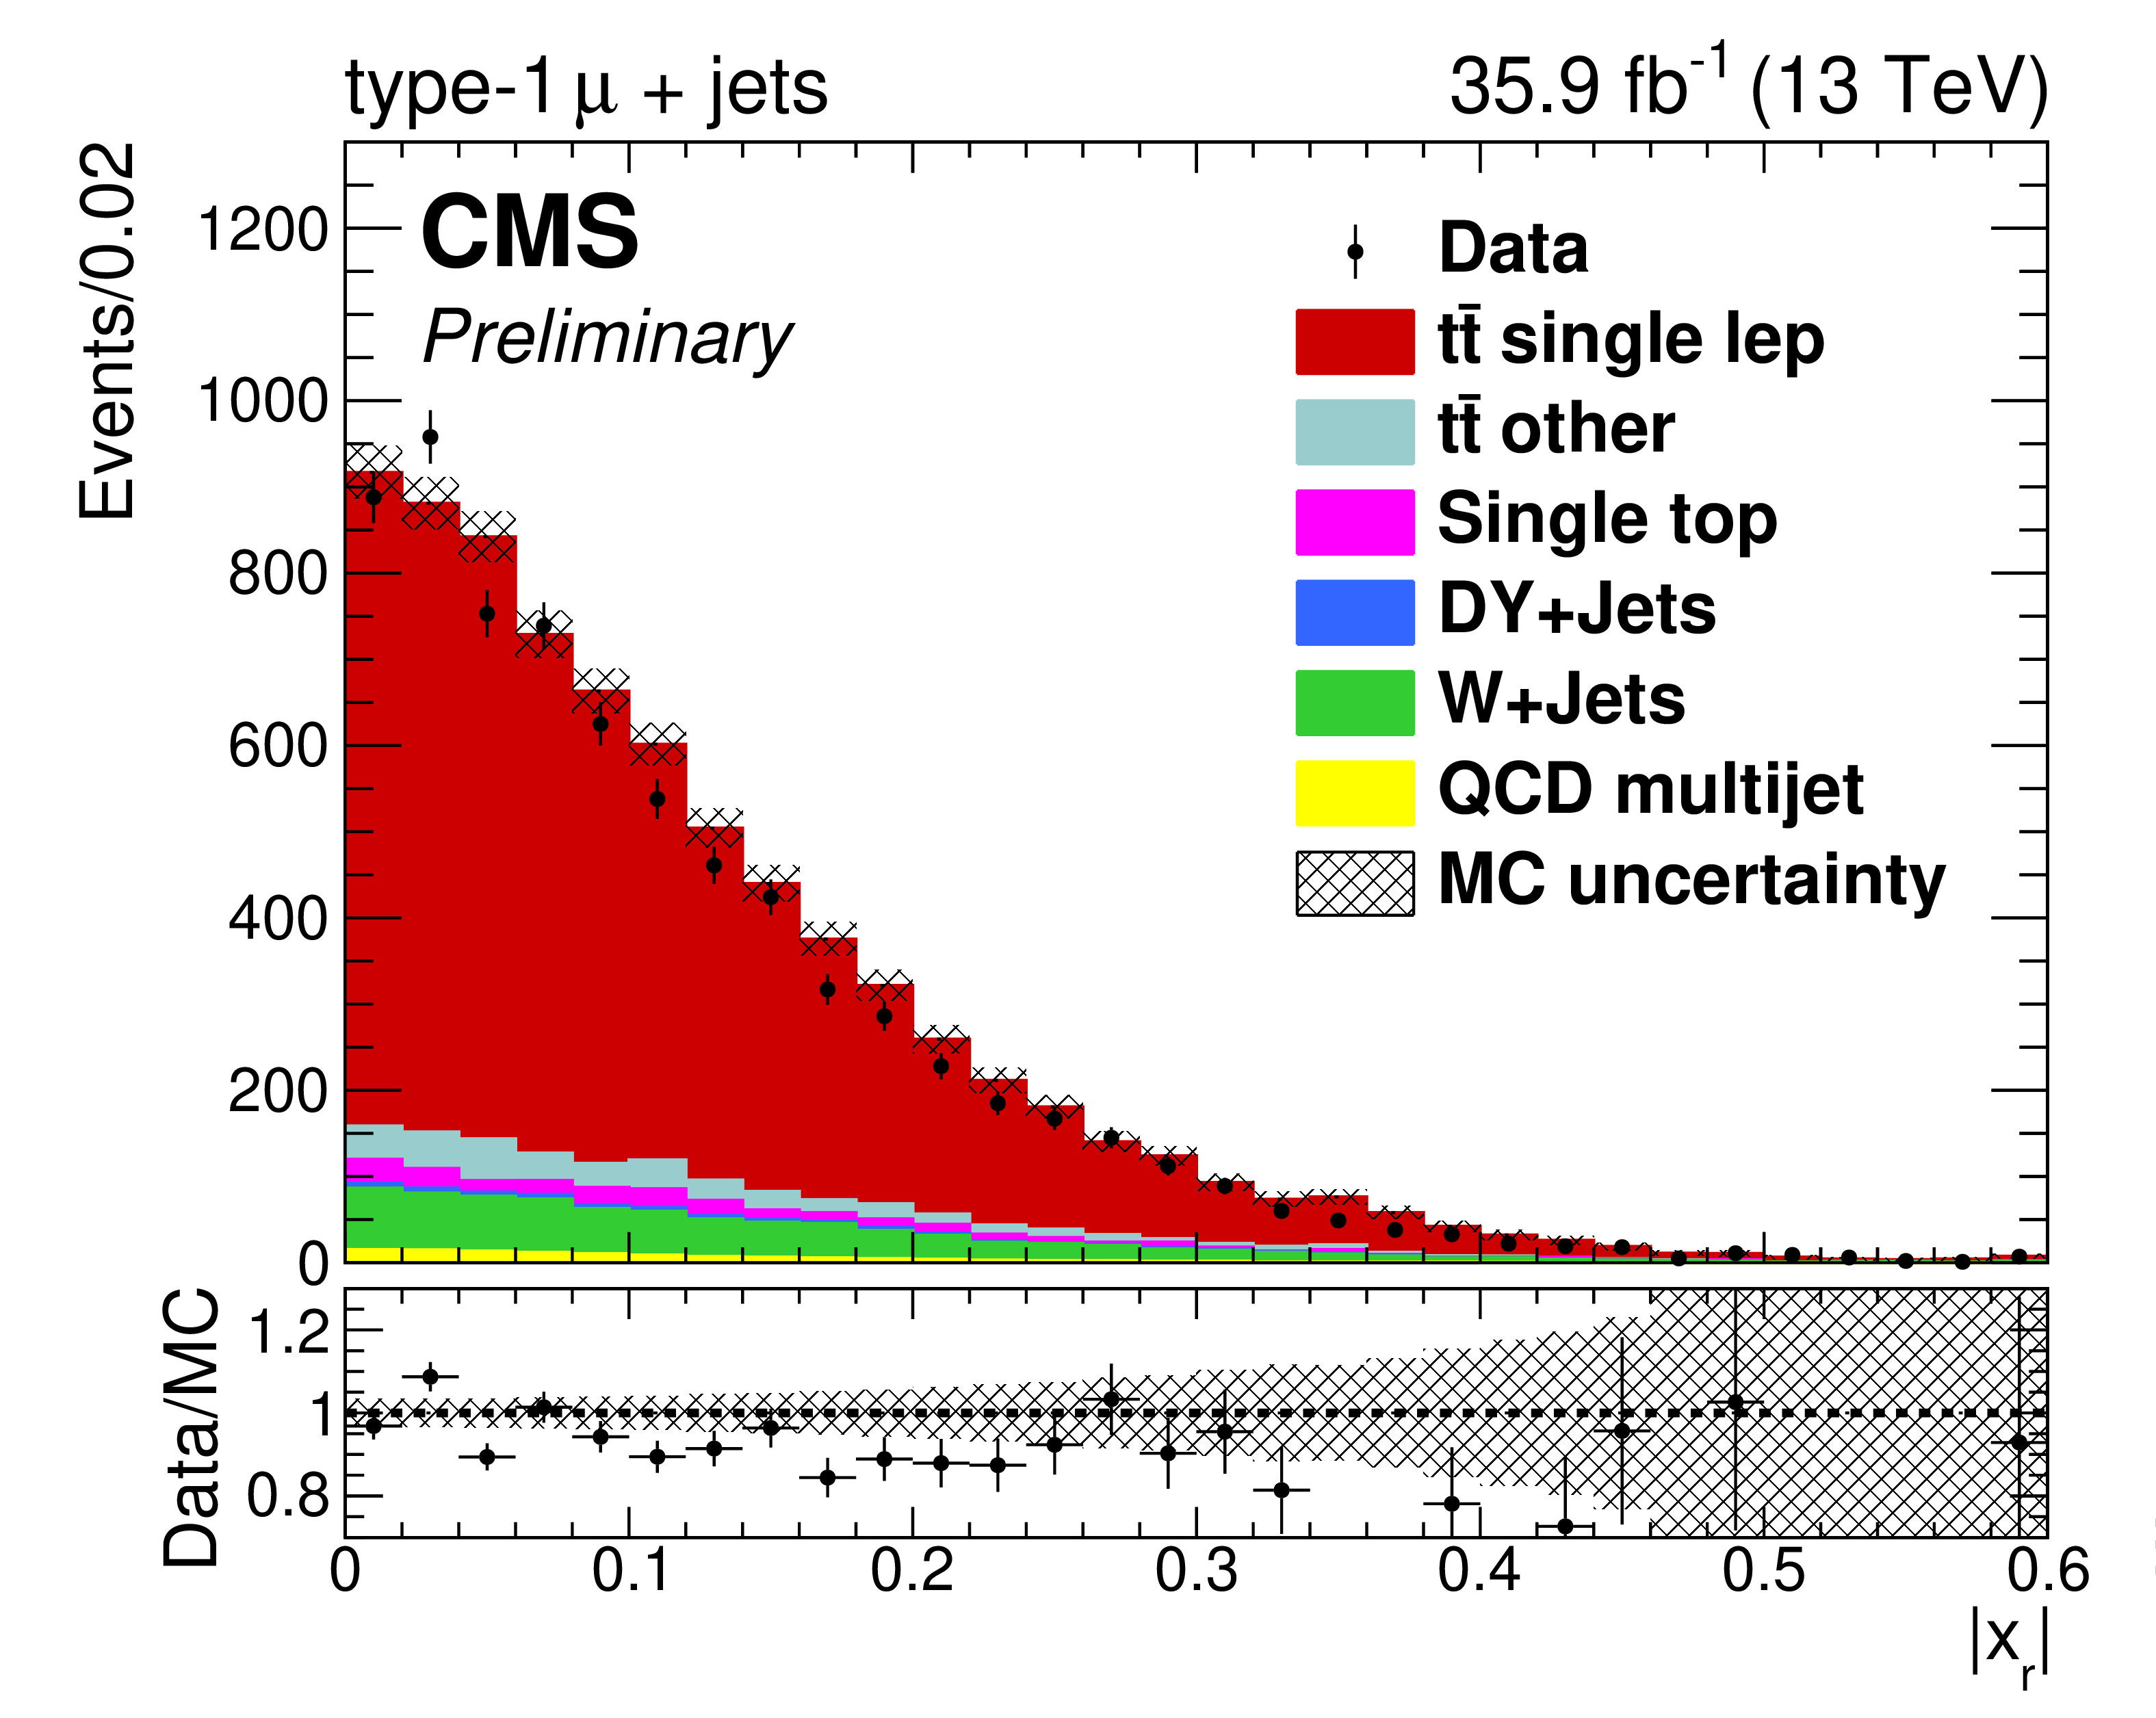
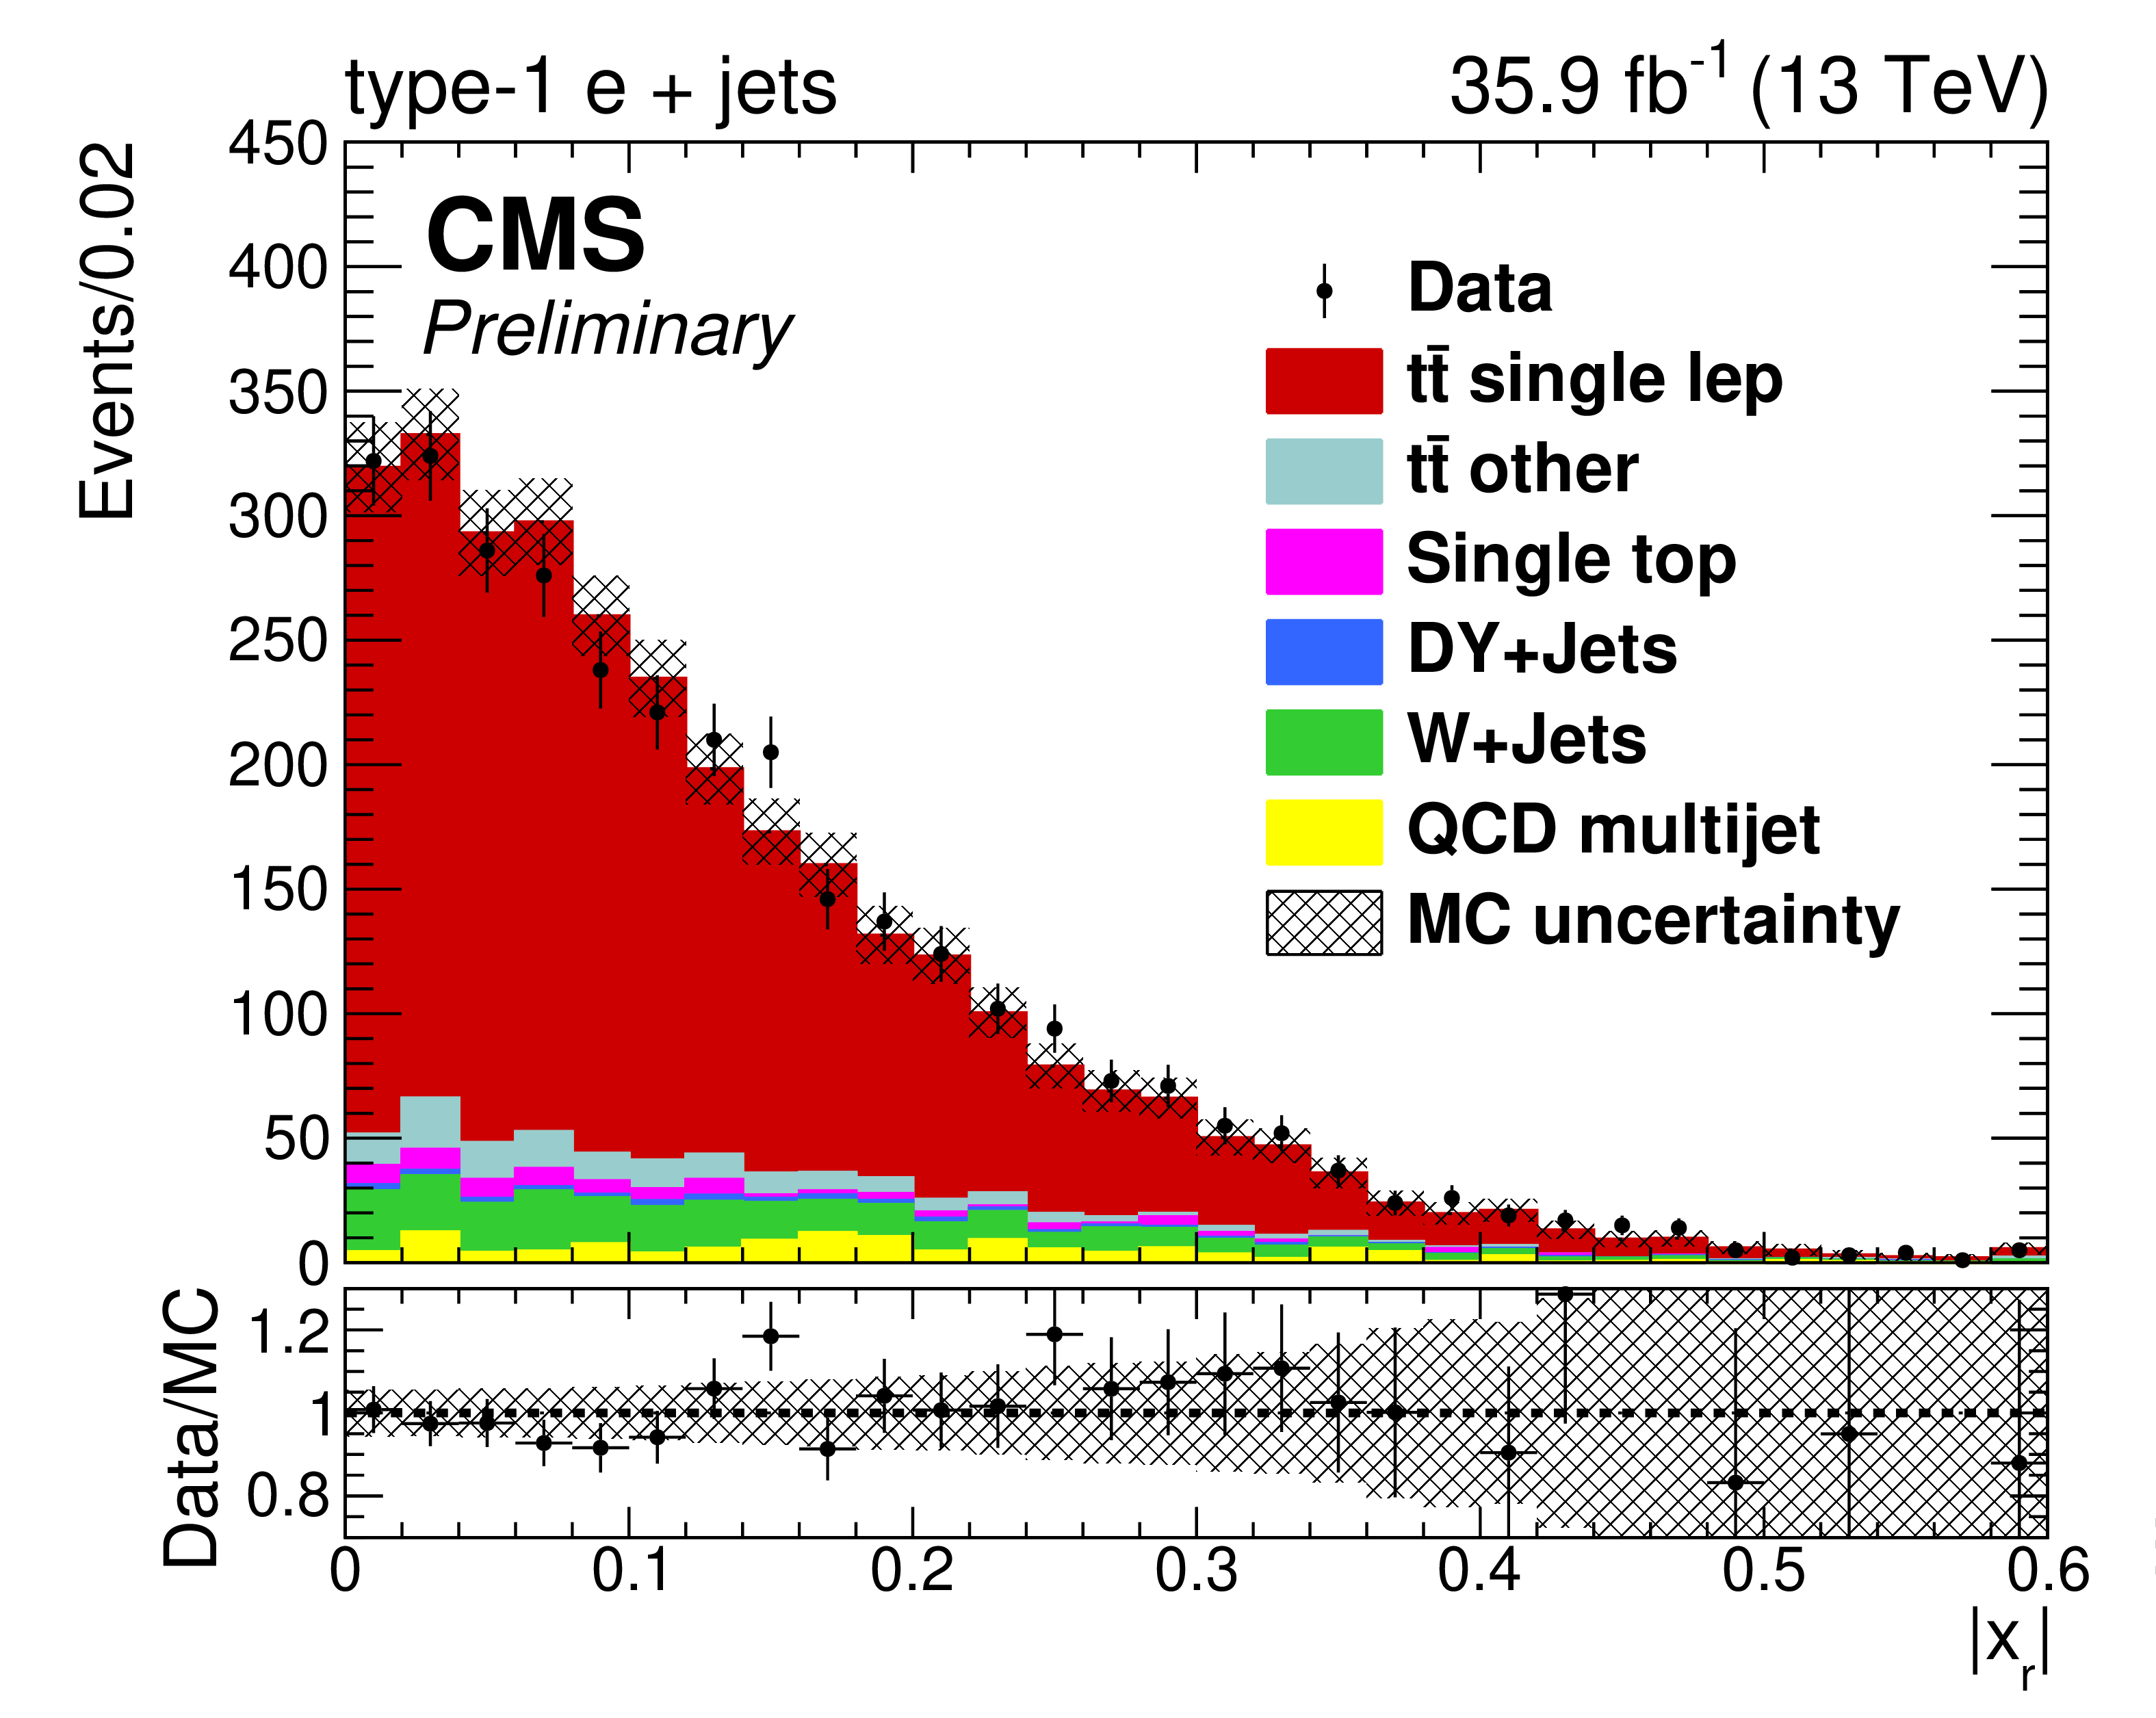
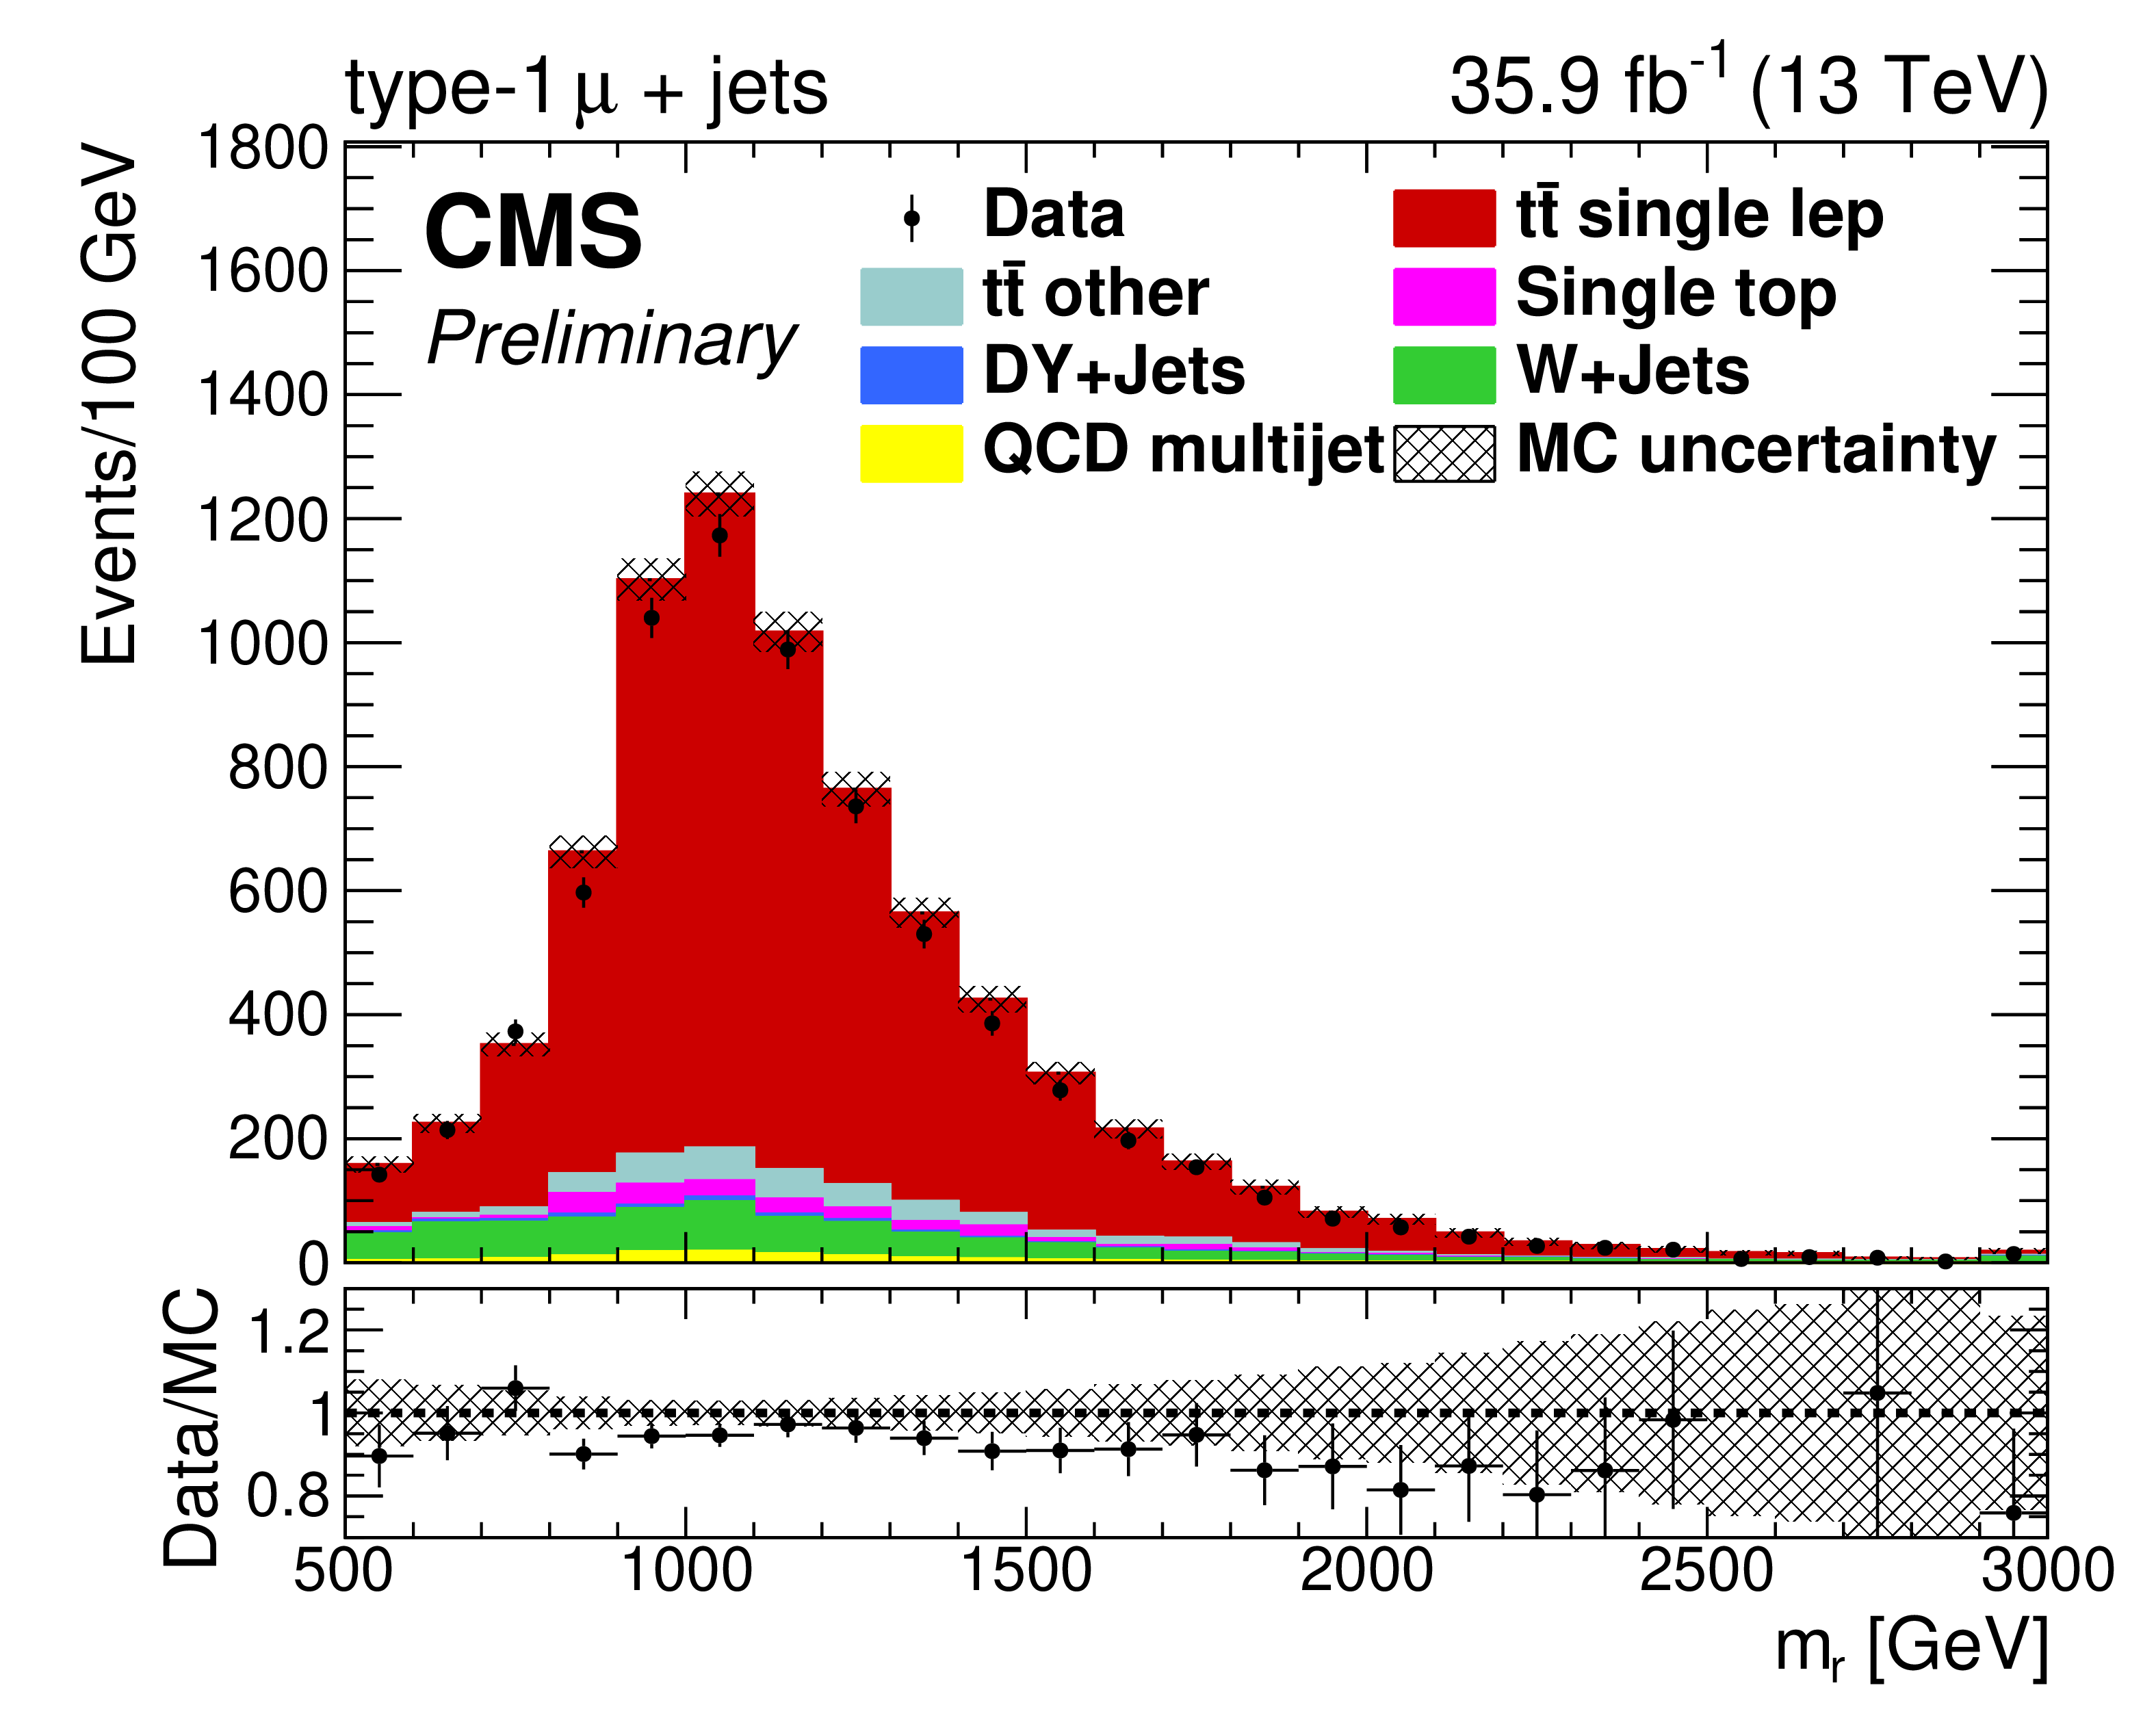
Data/MC comparison of reconstructed ${c^{*}_{\mathrm {r}}}$ (top), $ {| {x_{\mathrm {r}}} |}$ (middle), and ${m_{\mathrm {r}}}$ (bottom) for events passing full type-1 $\mu$+jets (left column) and e+jets (right column) selection criteria. The MC signal and background show their nominal, pre-fit predictions, and the MC uncertainty pictured in the hatched bands represents statistical errors only. Contribution from QCD multijet background is estimated using the data-driven method described in Section 5. The lower panels of each figure show the ratio of the observed data and total prediction in each bin. |
png pdf |
Figure 3-a:
Data/MC comparison of reconstructed ${c^{*}_{\mathrm {r}}}$ for events passing full type-1 $\mu$+jets selection criteria. The MC signal and background show their nominal, pre-fit predictions, and the MC uncertainty pictured in the hatched bands represents statistical errors only. Contribution from QCD multijet background is estimated using the data-driven method described in Section 5. The lower panel shows the ratio of the observed data and total prediction in each bin. |
png pdf |
Figure 3-b:
Data/MC comparison of reconstructed ${c^{*}_{\mathrm {r}}}$ for events passing full type-1 e+jets selection criteria. The MC signal and background show their nominal, pre-fit predictions, and the MC uncertainty pictured in the hatched bands represents statistical errors only. Contribution from QCD multijet background is estimated using the data-driven method described in Section 5. The lower panel shows the ratio of the observed data and total prediction in each bin. |
png pdf |
Figure 3-c:
Data/MC comparison of reconstructed $ {| {x_{\mathrm {r}}} |}$ for events passing full type-1 $\mu$+jets selection criteria. The MC signal and background show their nominal, pre-fit predictions, and the MC uncertainty pictured in the hatched bands represents statistical errors only. Contribution from QCD multijet background is estimated using the data-driven method described in Section 5. The lower panel shows the ratio of the observed data and total prediction in each bin. |
png pdf |
Figure 3-d:
Data/MC comparison of reconstructed $ {| {x_{\mathrm {r}}} |}$ for events passing full type-1 e+jets selection criteria. The MC signal and background show their nominal, pre-fit predictions, and the MC uncertainty pictured in the hatched bands represents statistical errors only. Contribution from QCD multijet background is estimated using the data-driven method described in Section 5. The lower panel shows the ratio of the observed data and total prediction in each bin. |
png pdf |
Figure 3-e:
Data/MC comparison of reconstructed ${m_{\mathrm {r}}}$ for events passing full type-1 $\mu$+jets selection criteria. The MC signal and background show their nominal, pre-fit predictions, and the MC uncertainty pictured in the hatched bands represents statistical errors only. Contribution from QCD multijet background is estimated using the data-driven method described in Section 5. The lower panel shows the ratio of the observed data and total prediction in each bin. |
png pdf |
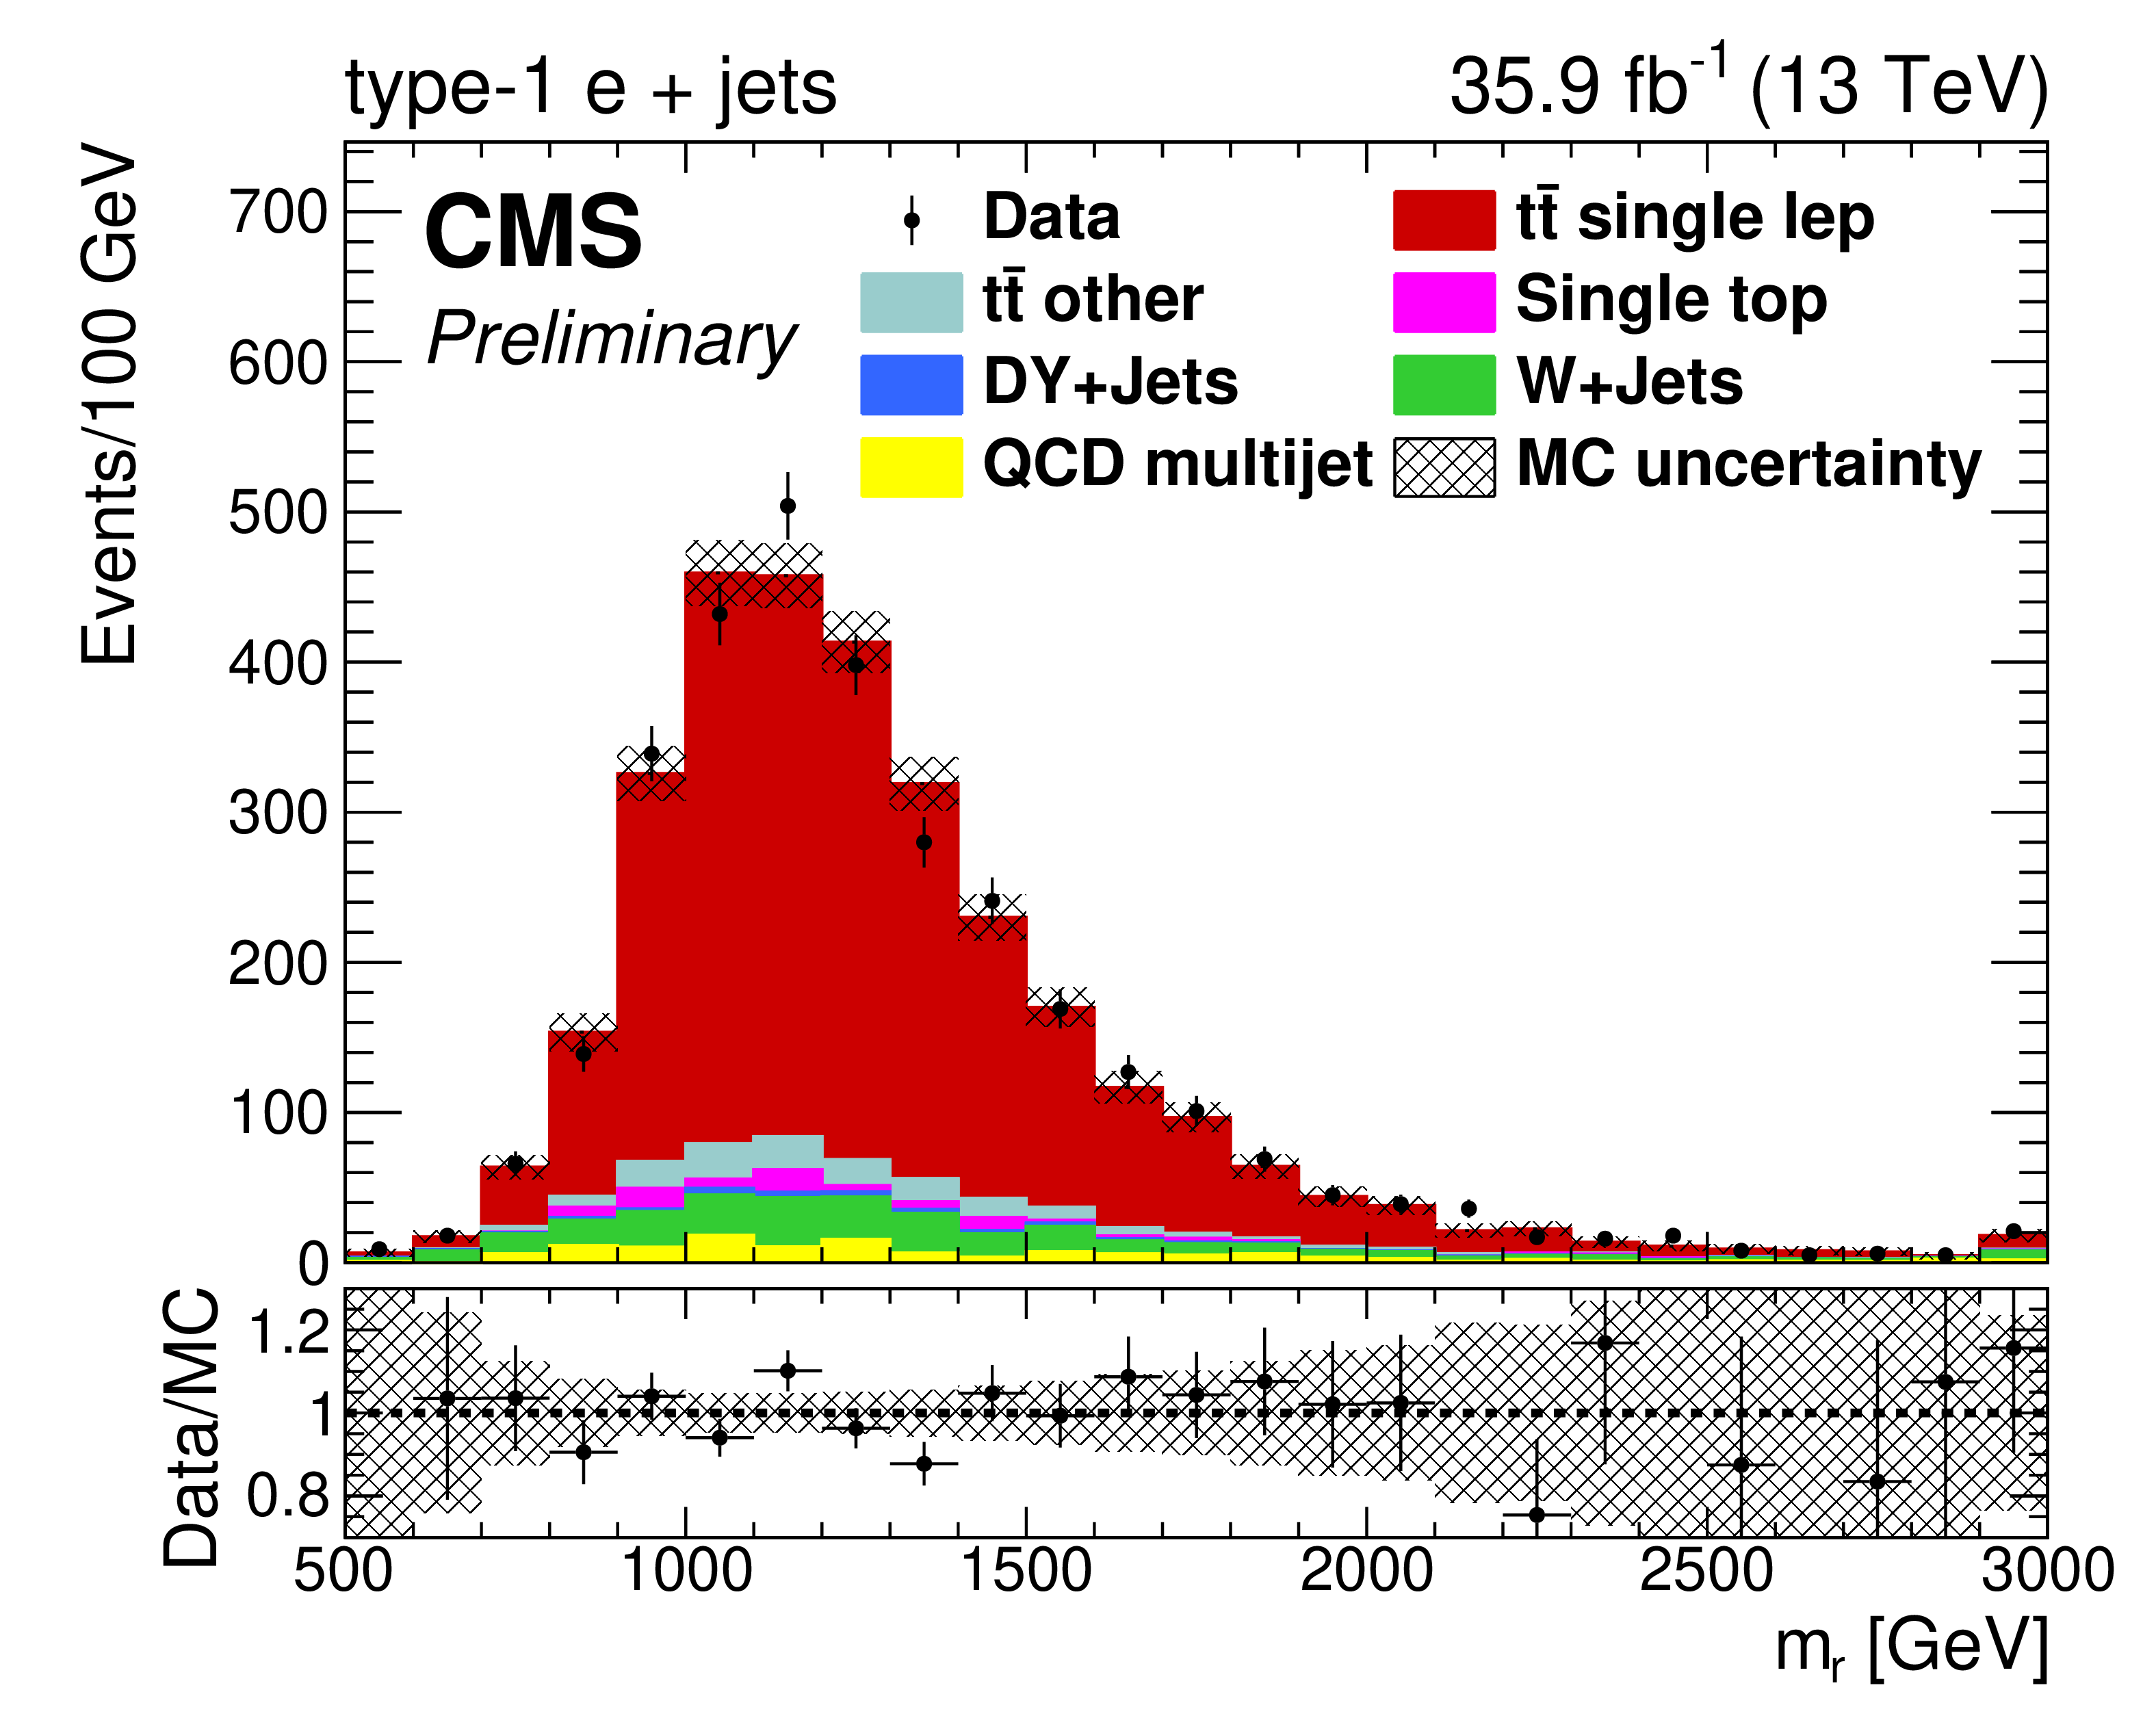
Figure 3-f:
Data/MC comparison of reconstructed ${m_{\mathrm {r}}}$ for events passing full type-1 e+jets selection criteria. The MC signal and background show their nominal, pre-fit predictions, and the MC uncertainty pictured in the hatched bands represents statistical errors only. Contribution from QCD multijet background is estimated using the data-driven method described in Section 5. The lower panel shows the ratio of the observed data and total prediction in each bin. |
png pdf |
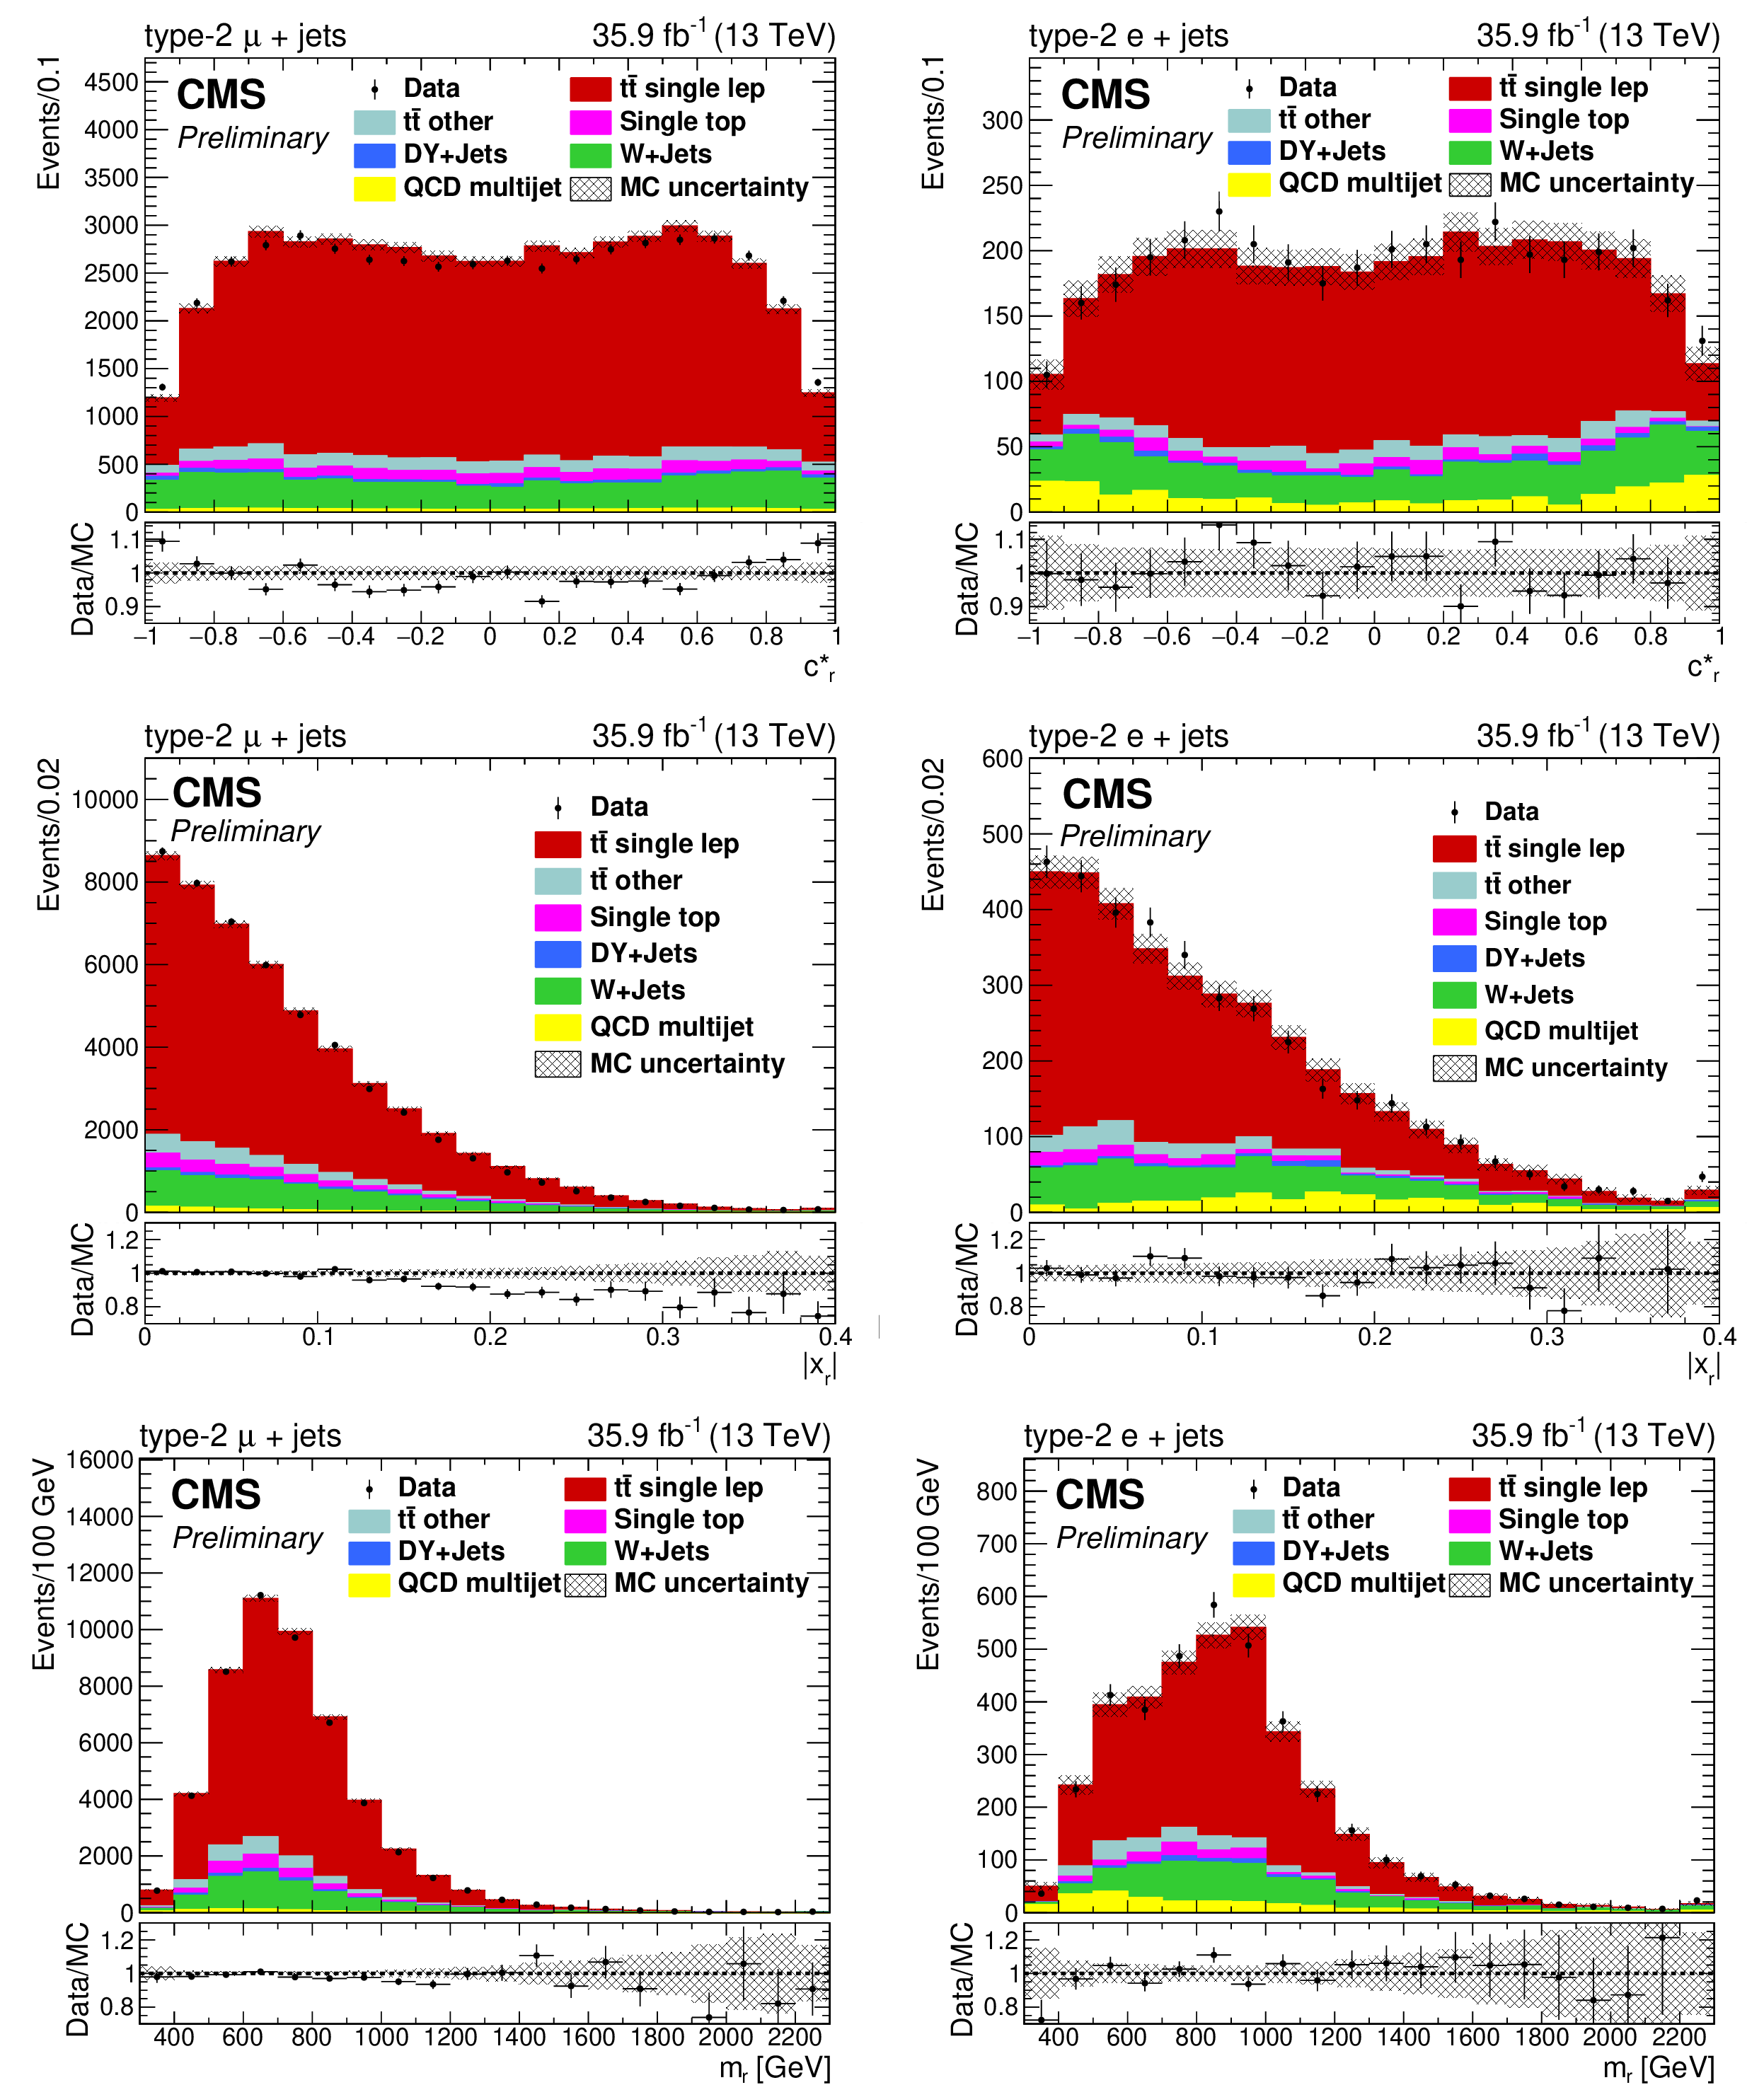
Figure 4:
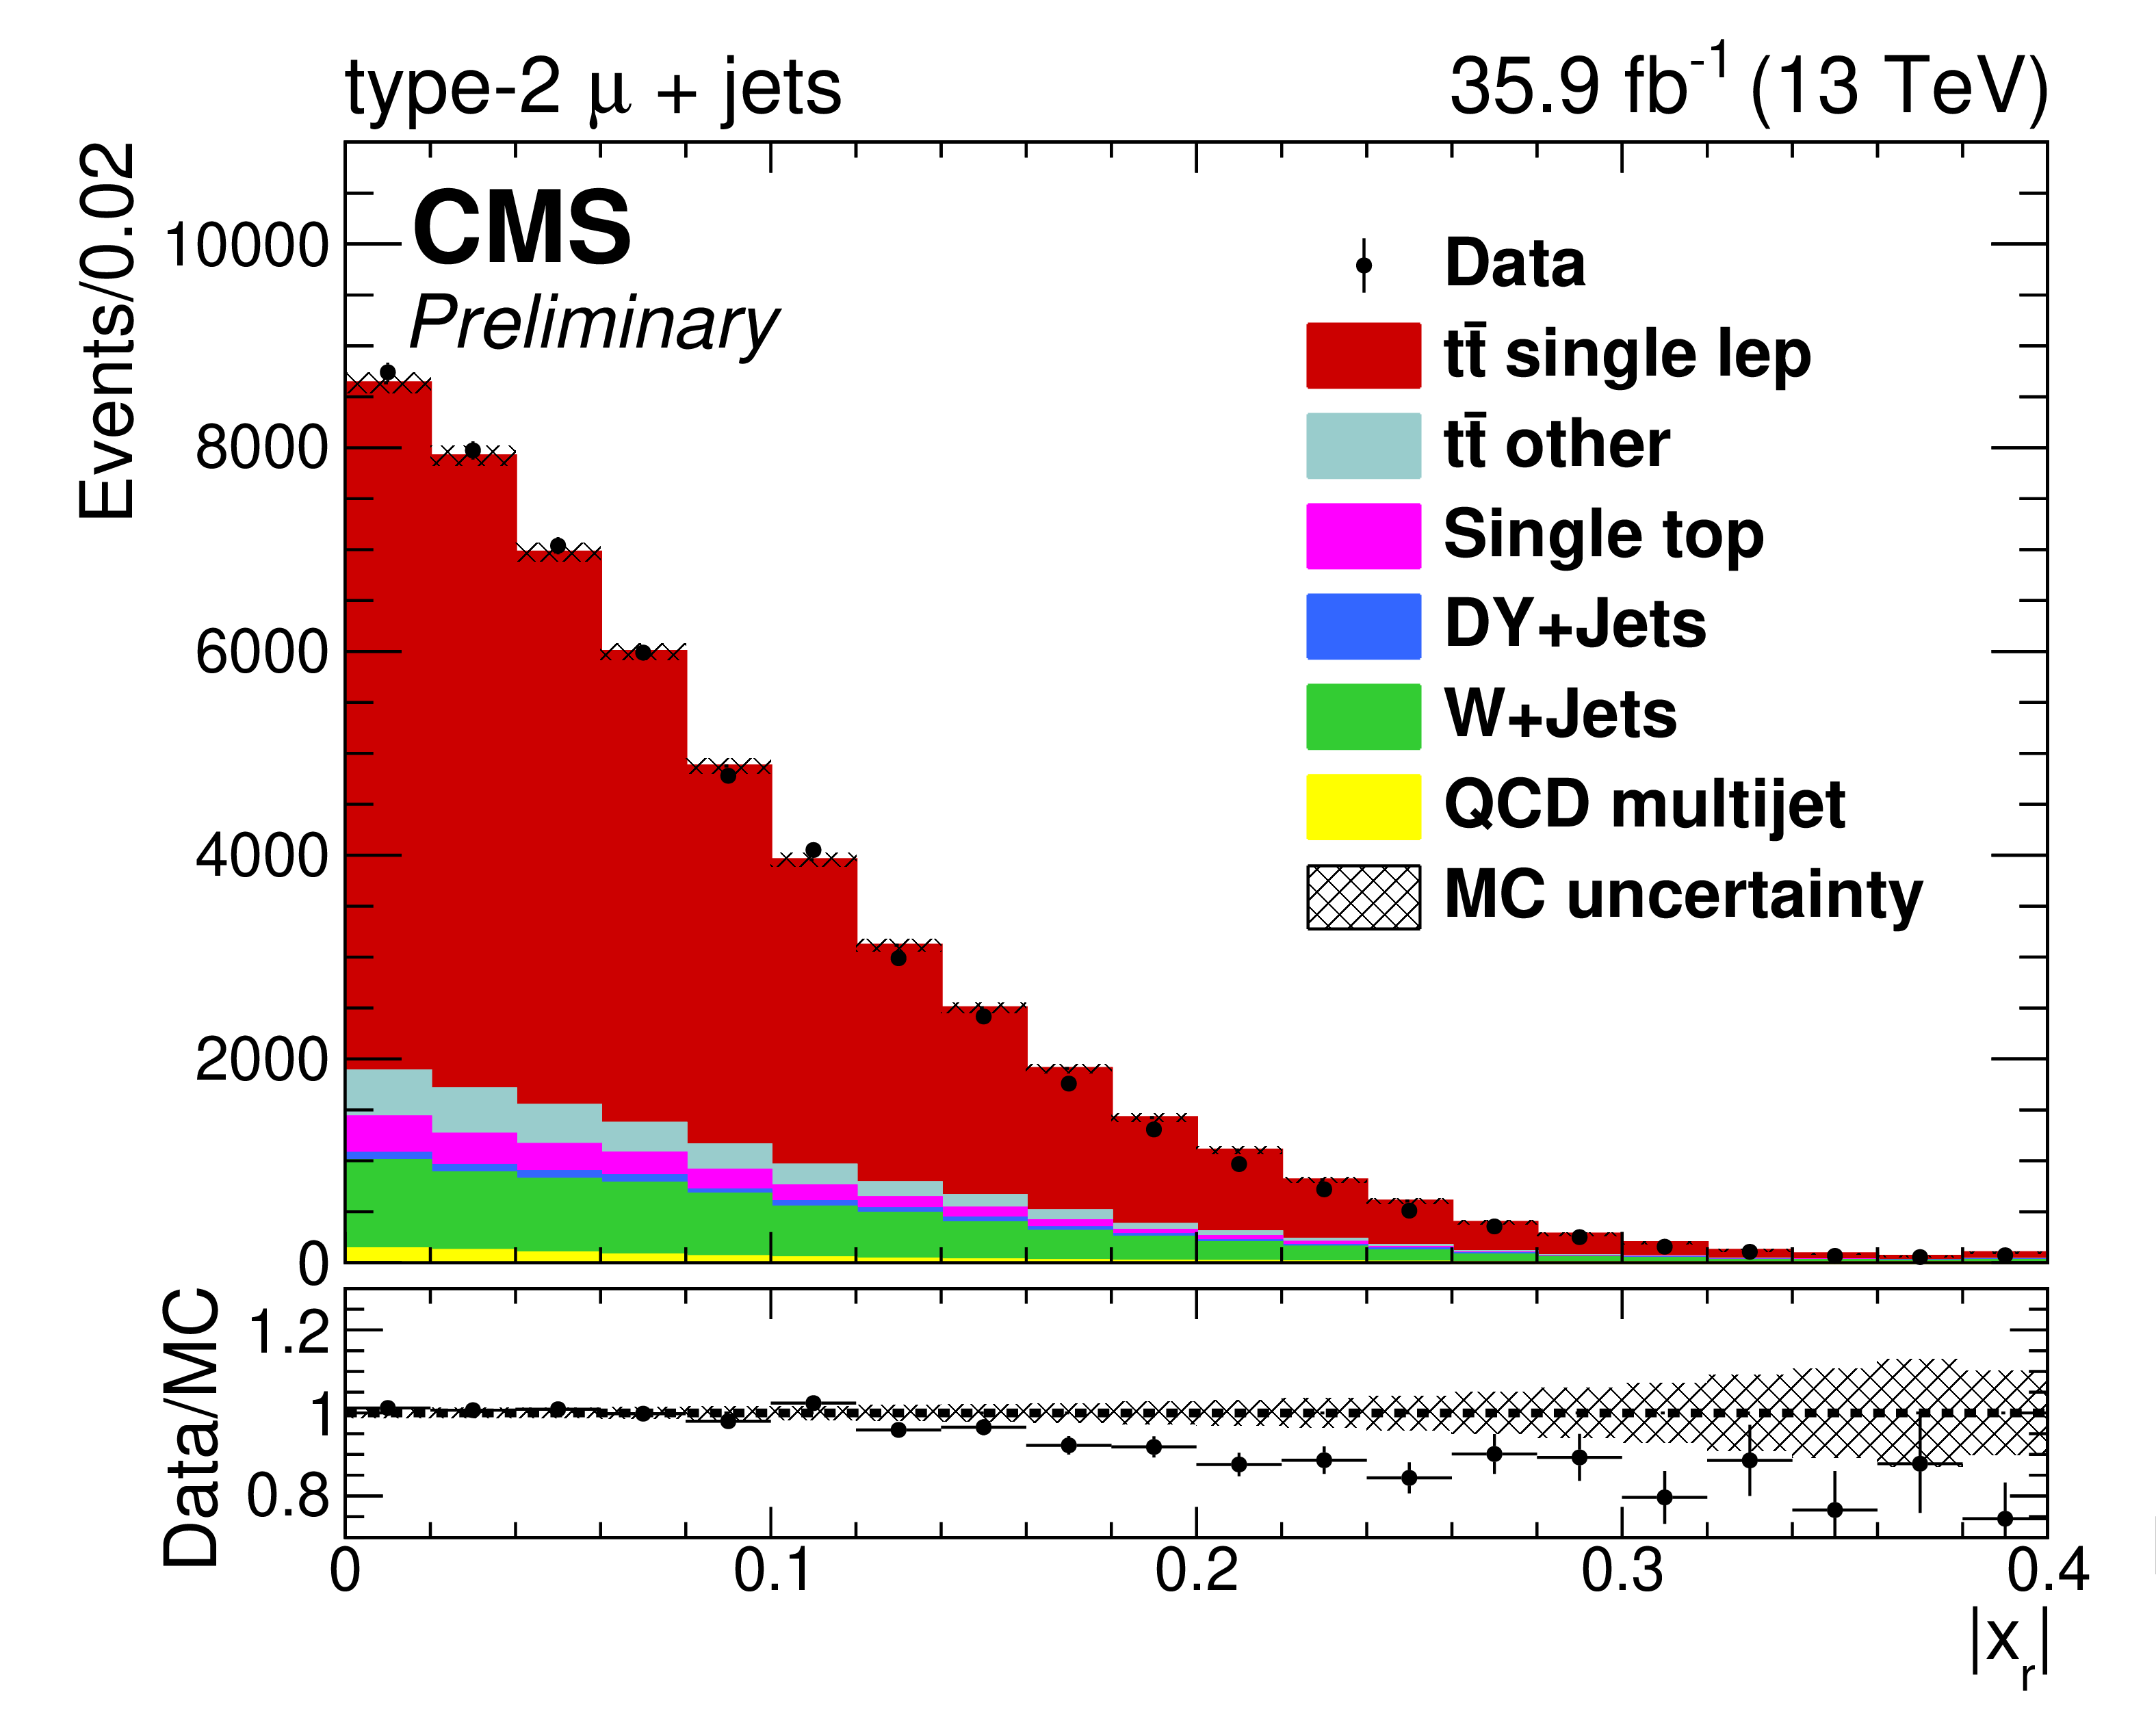
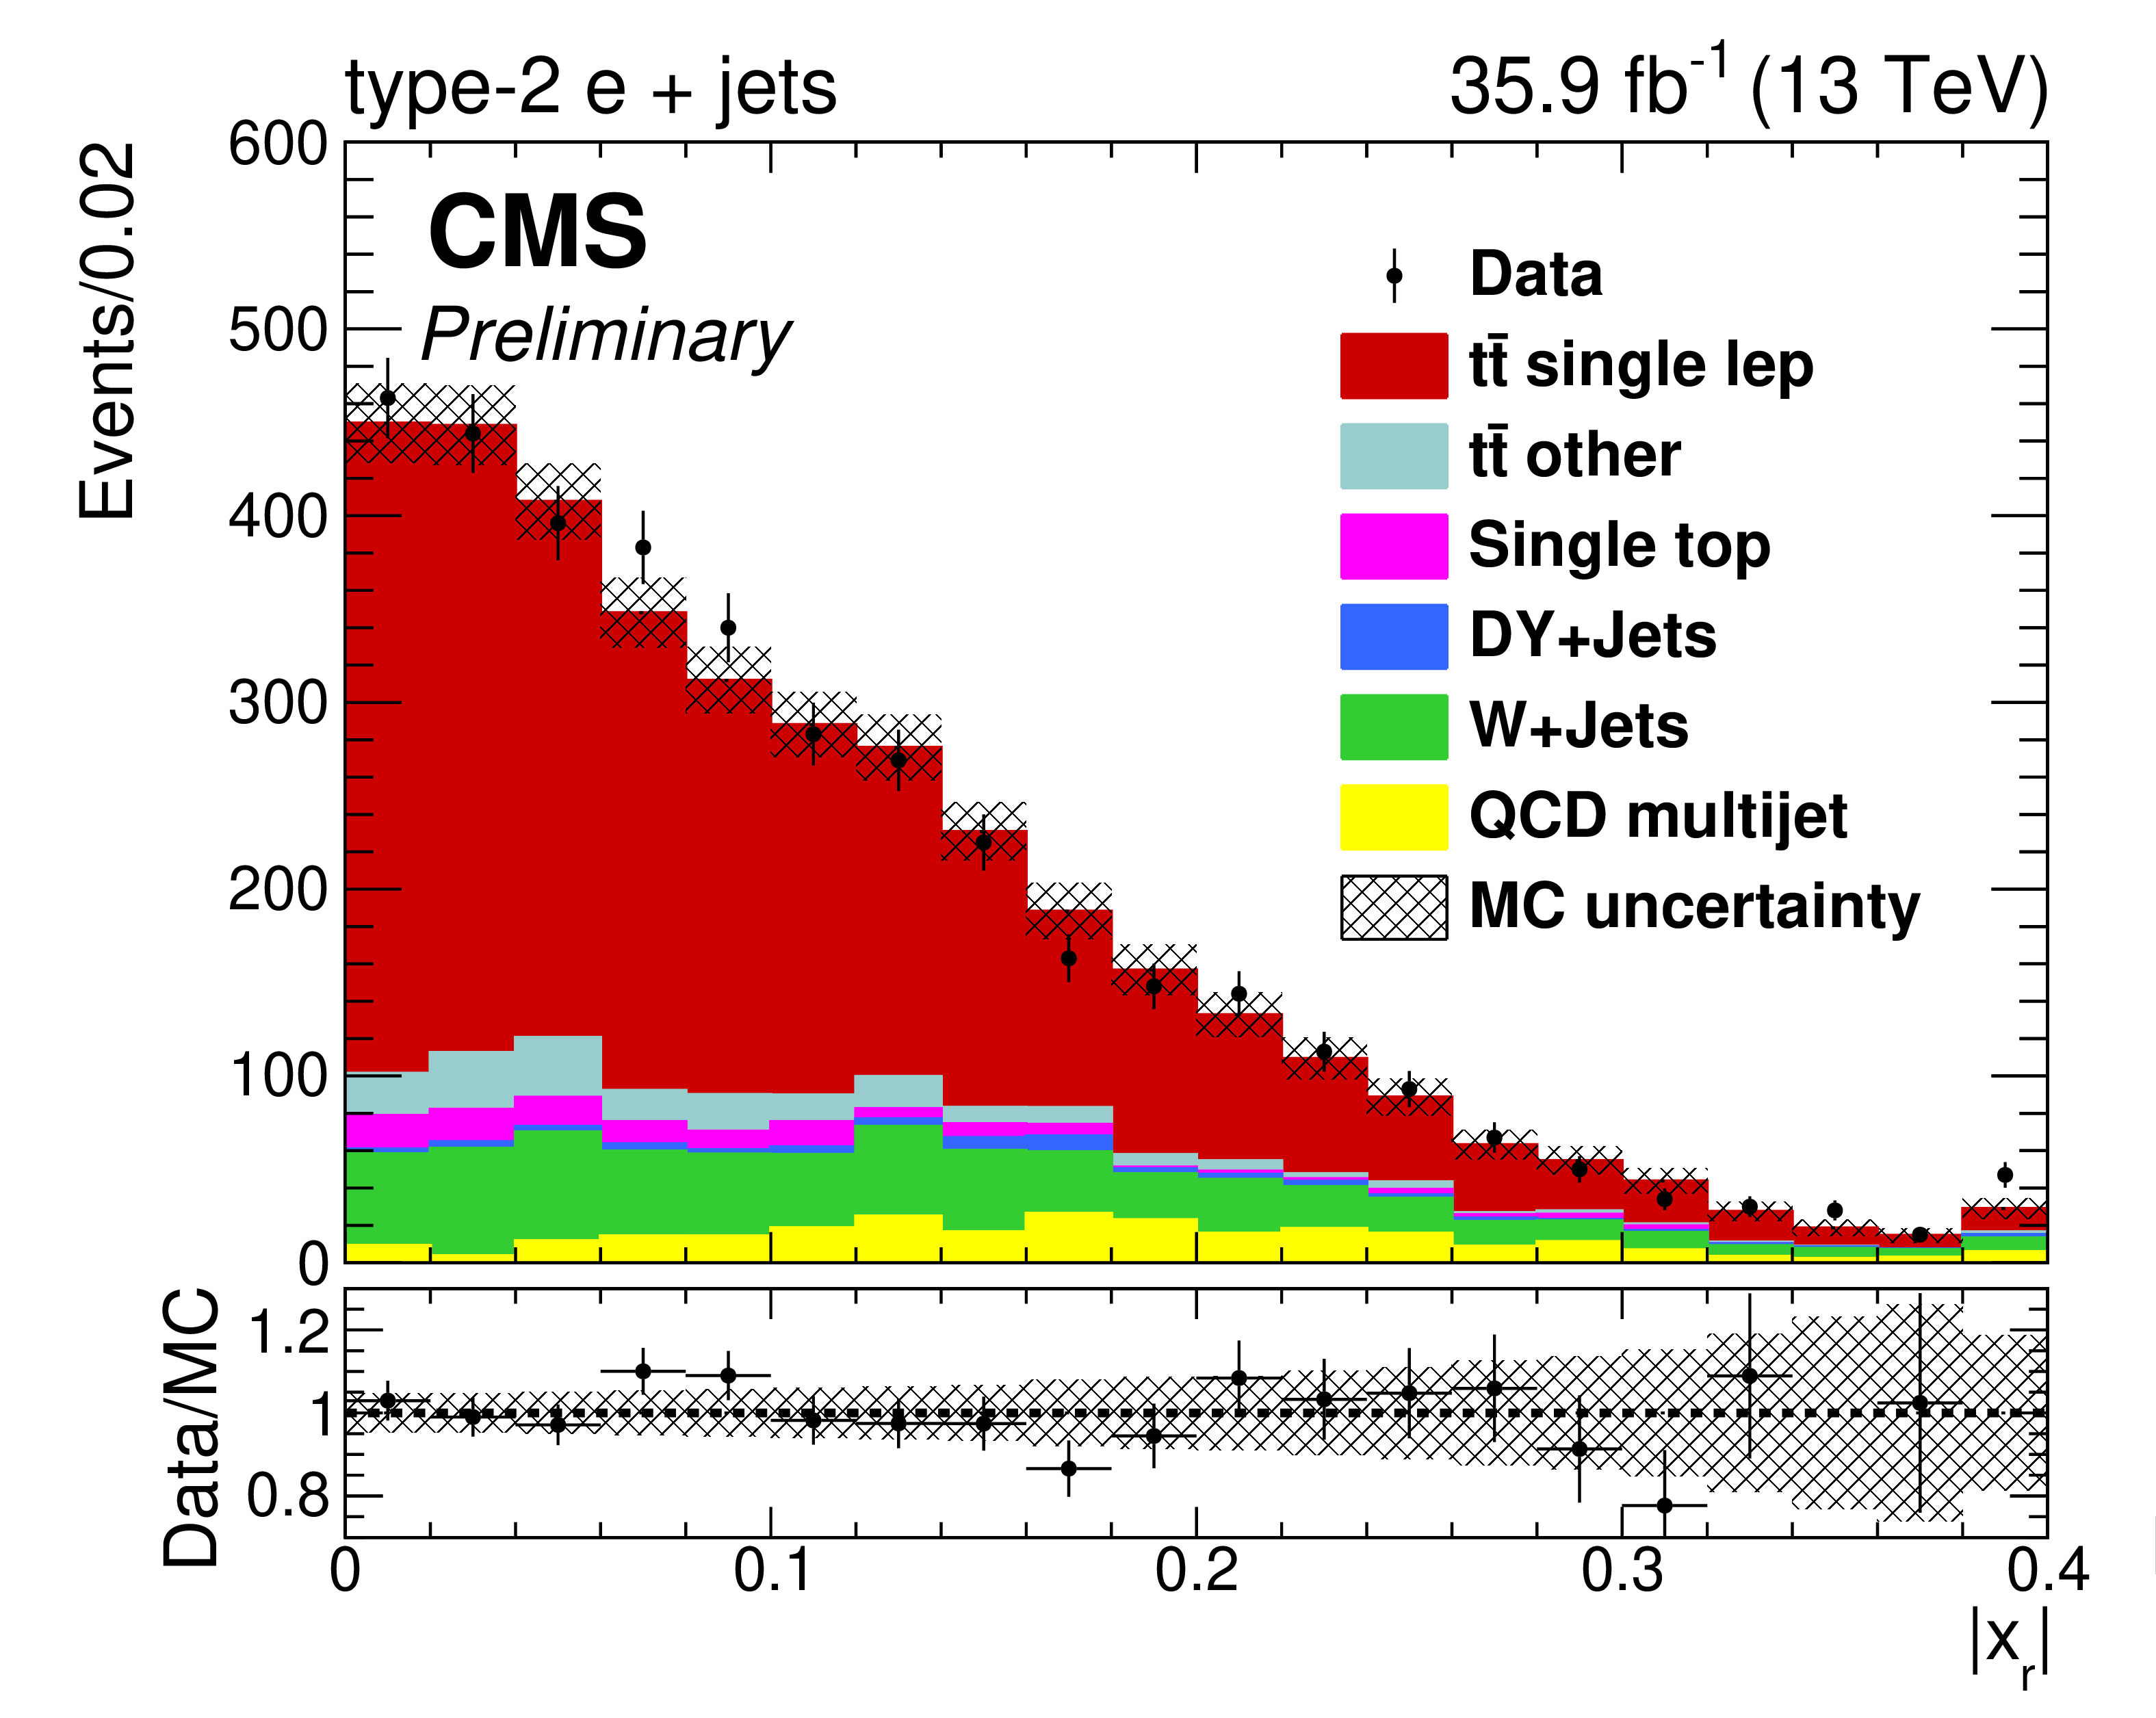
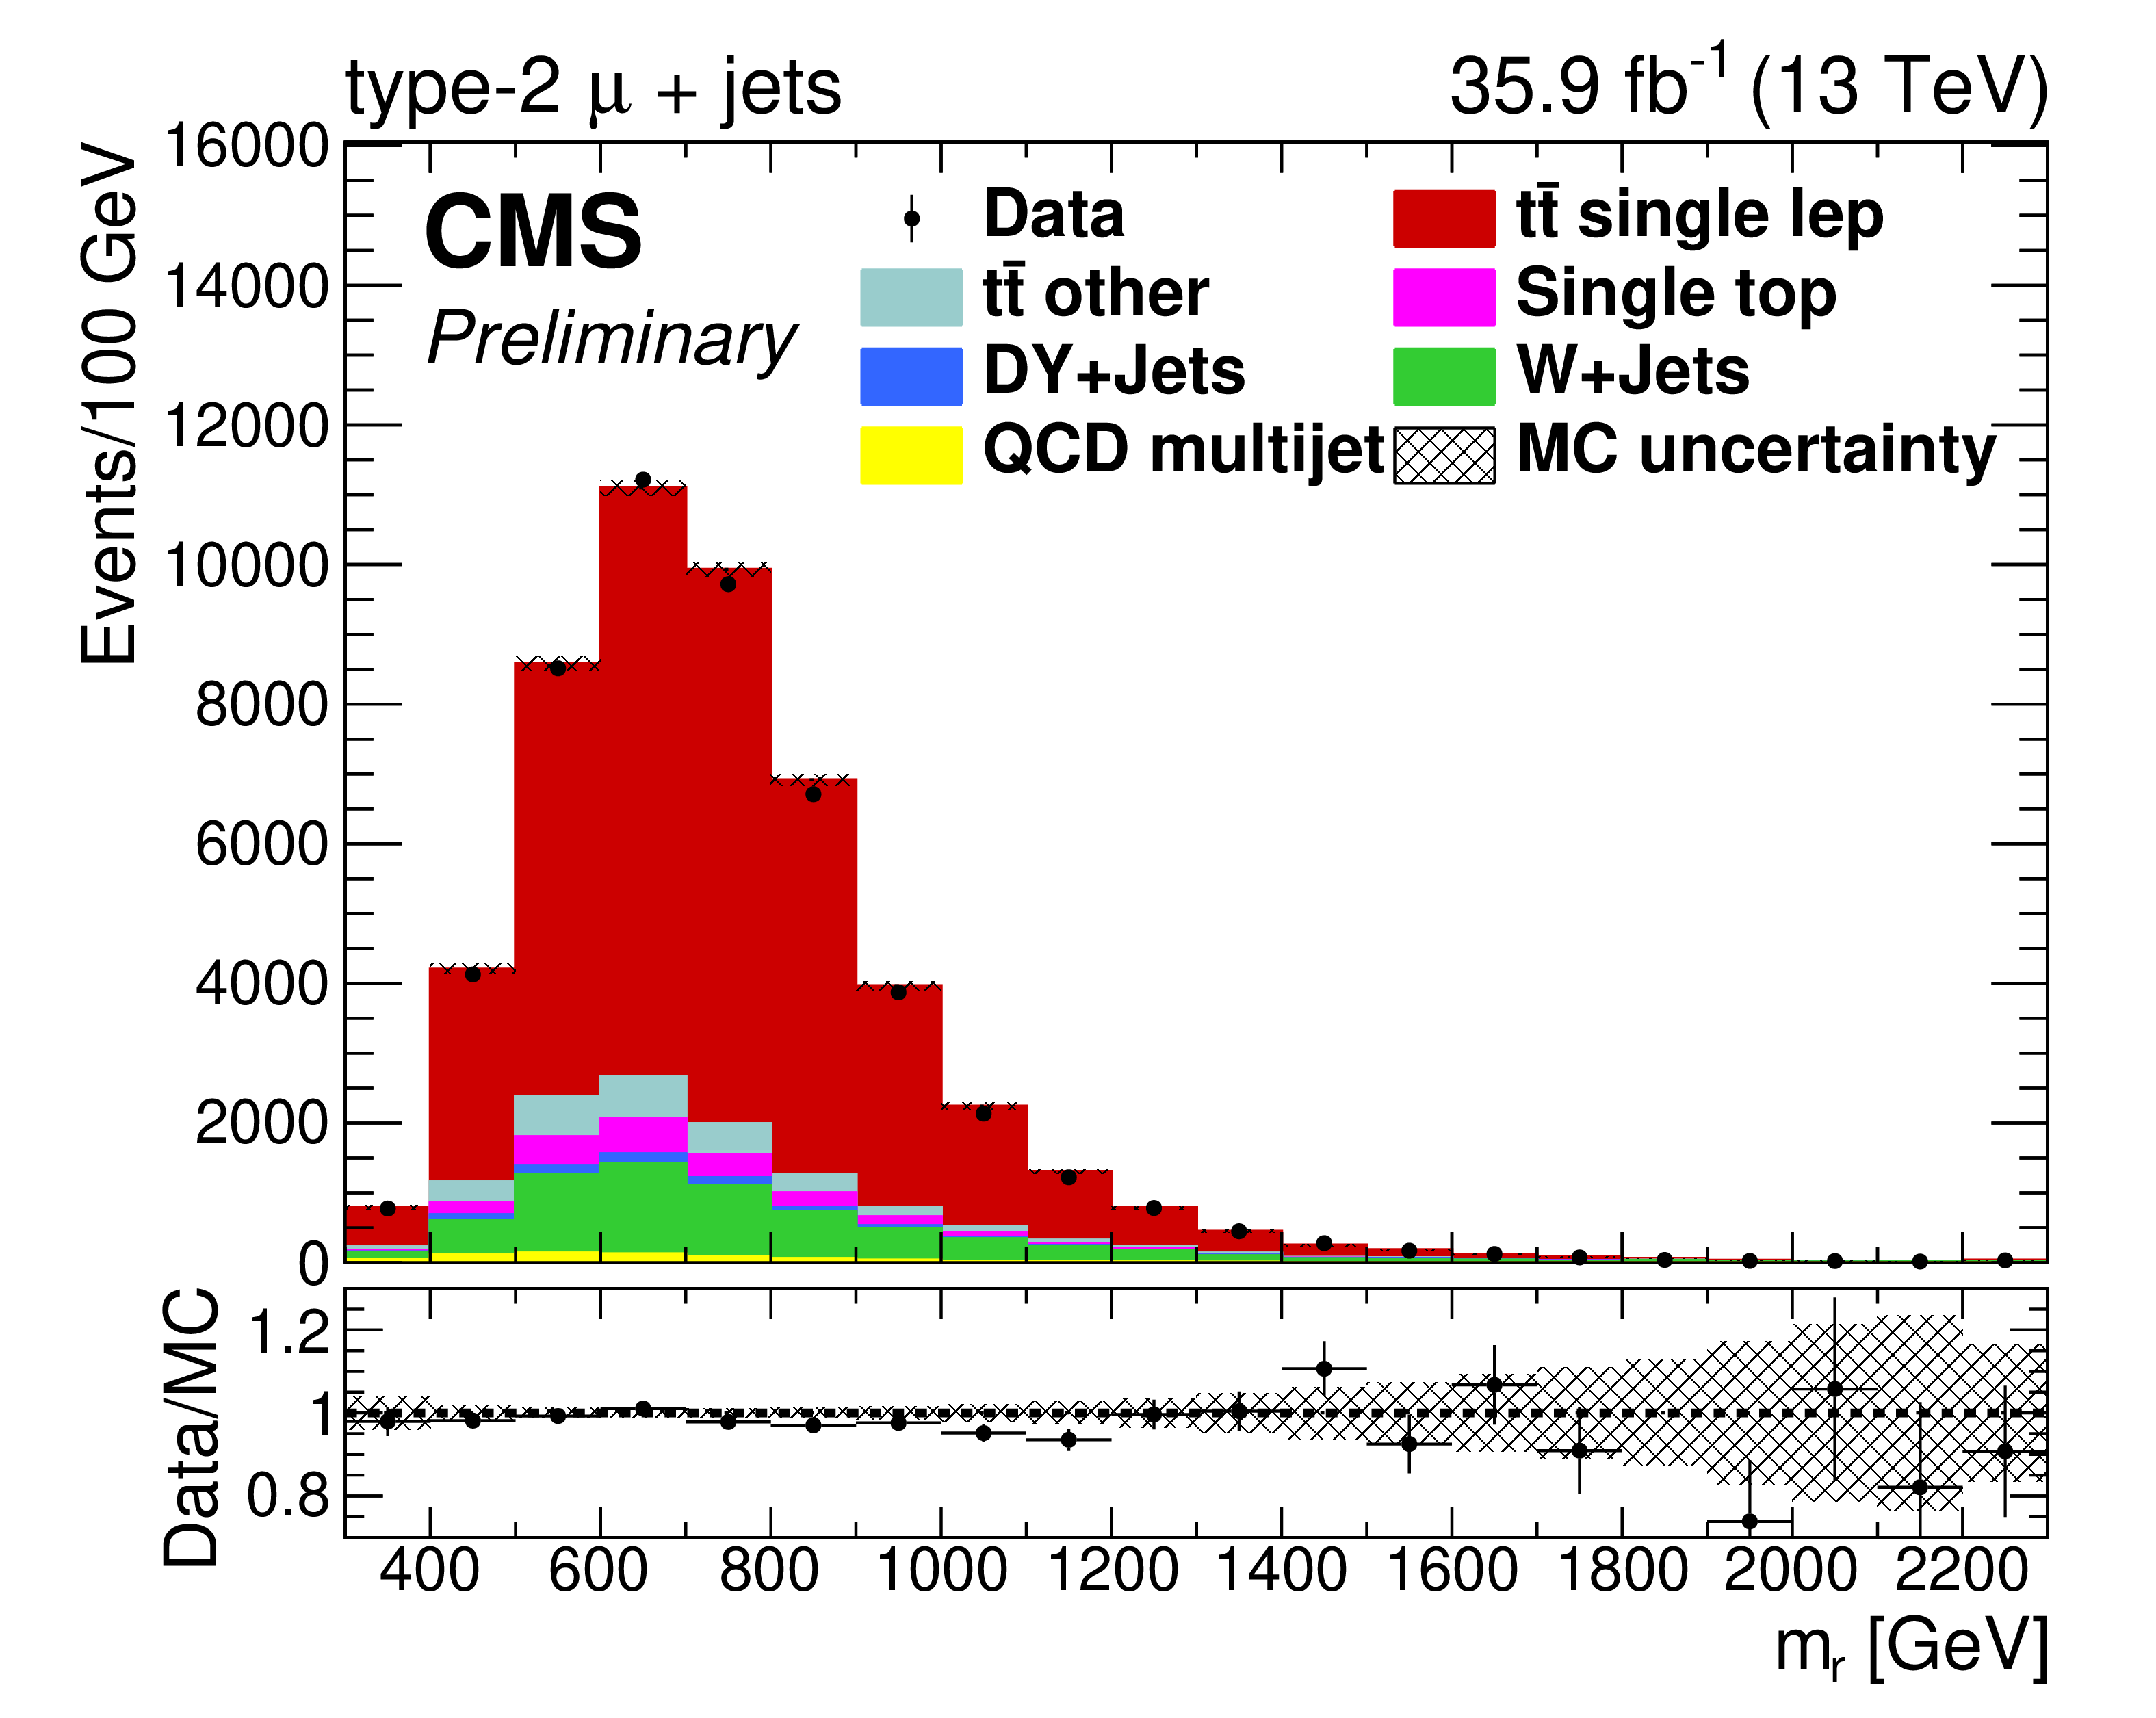
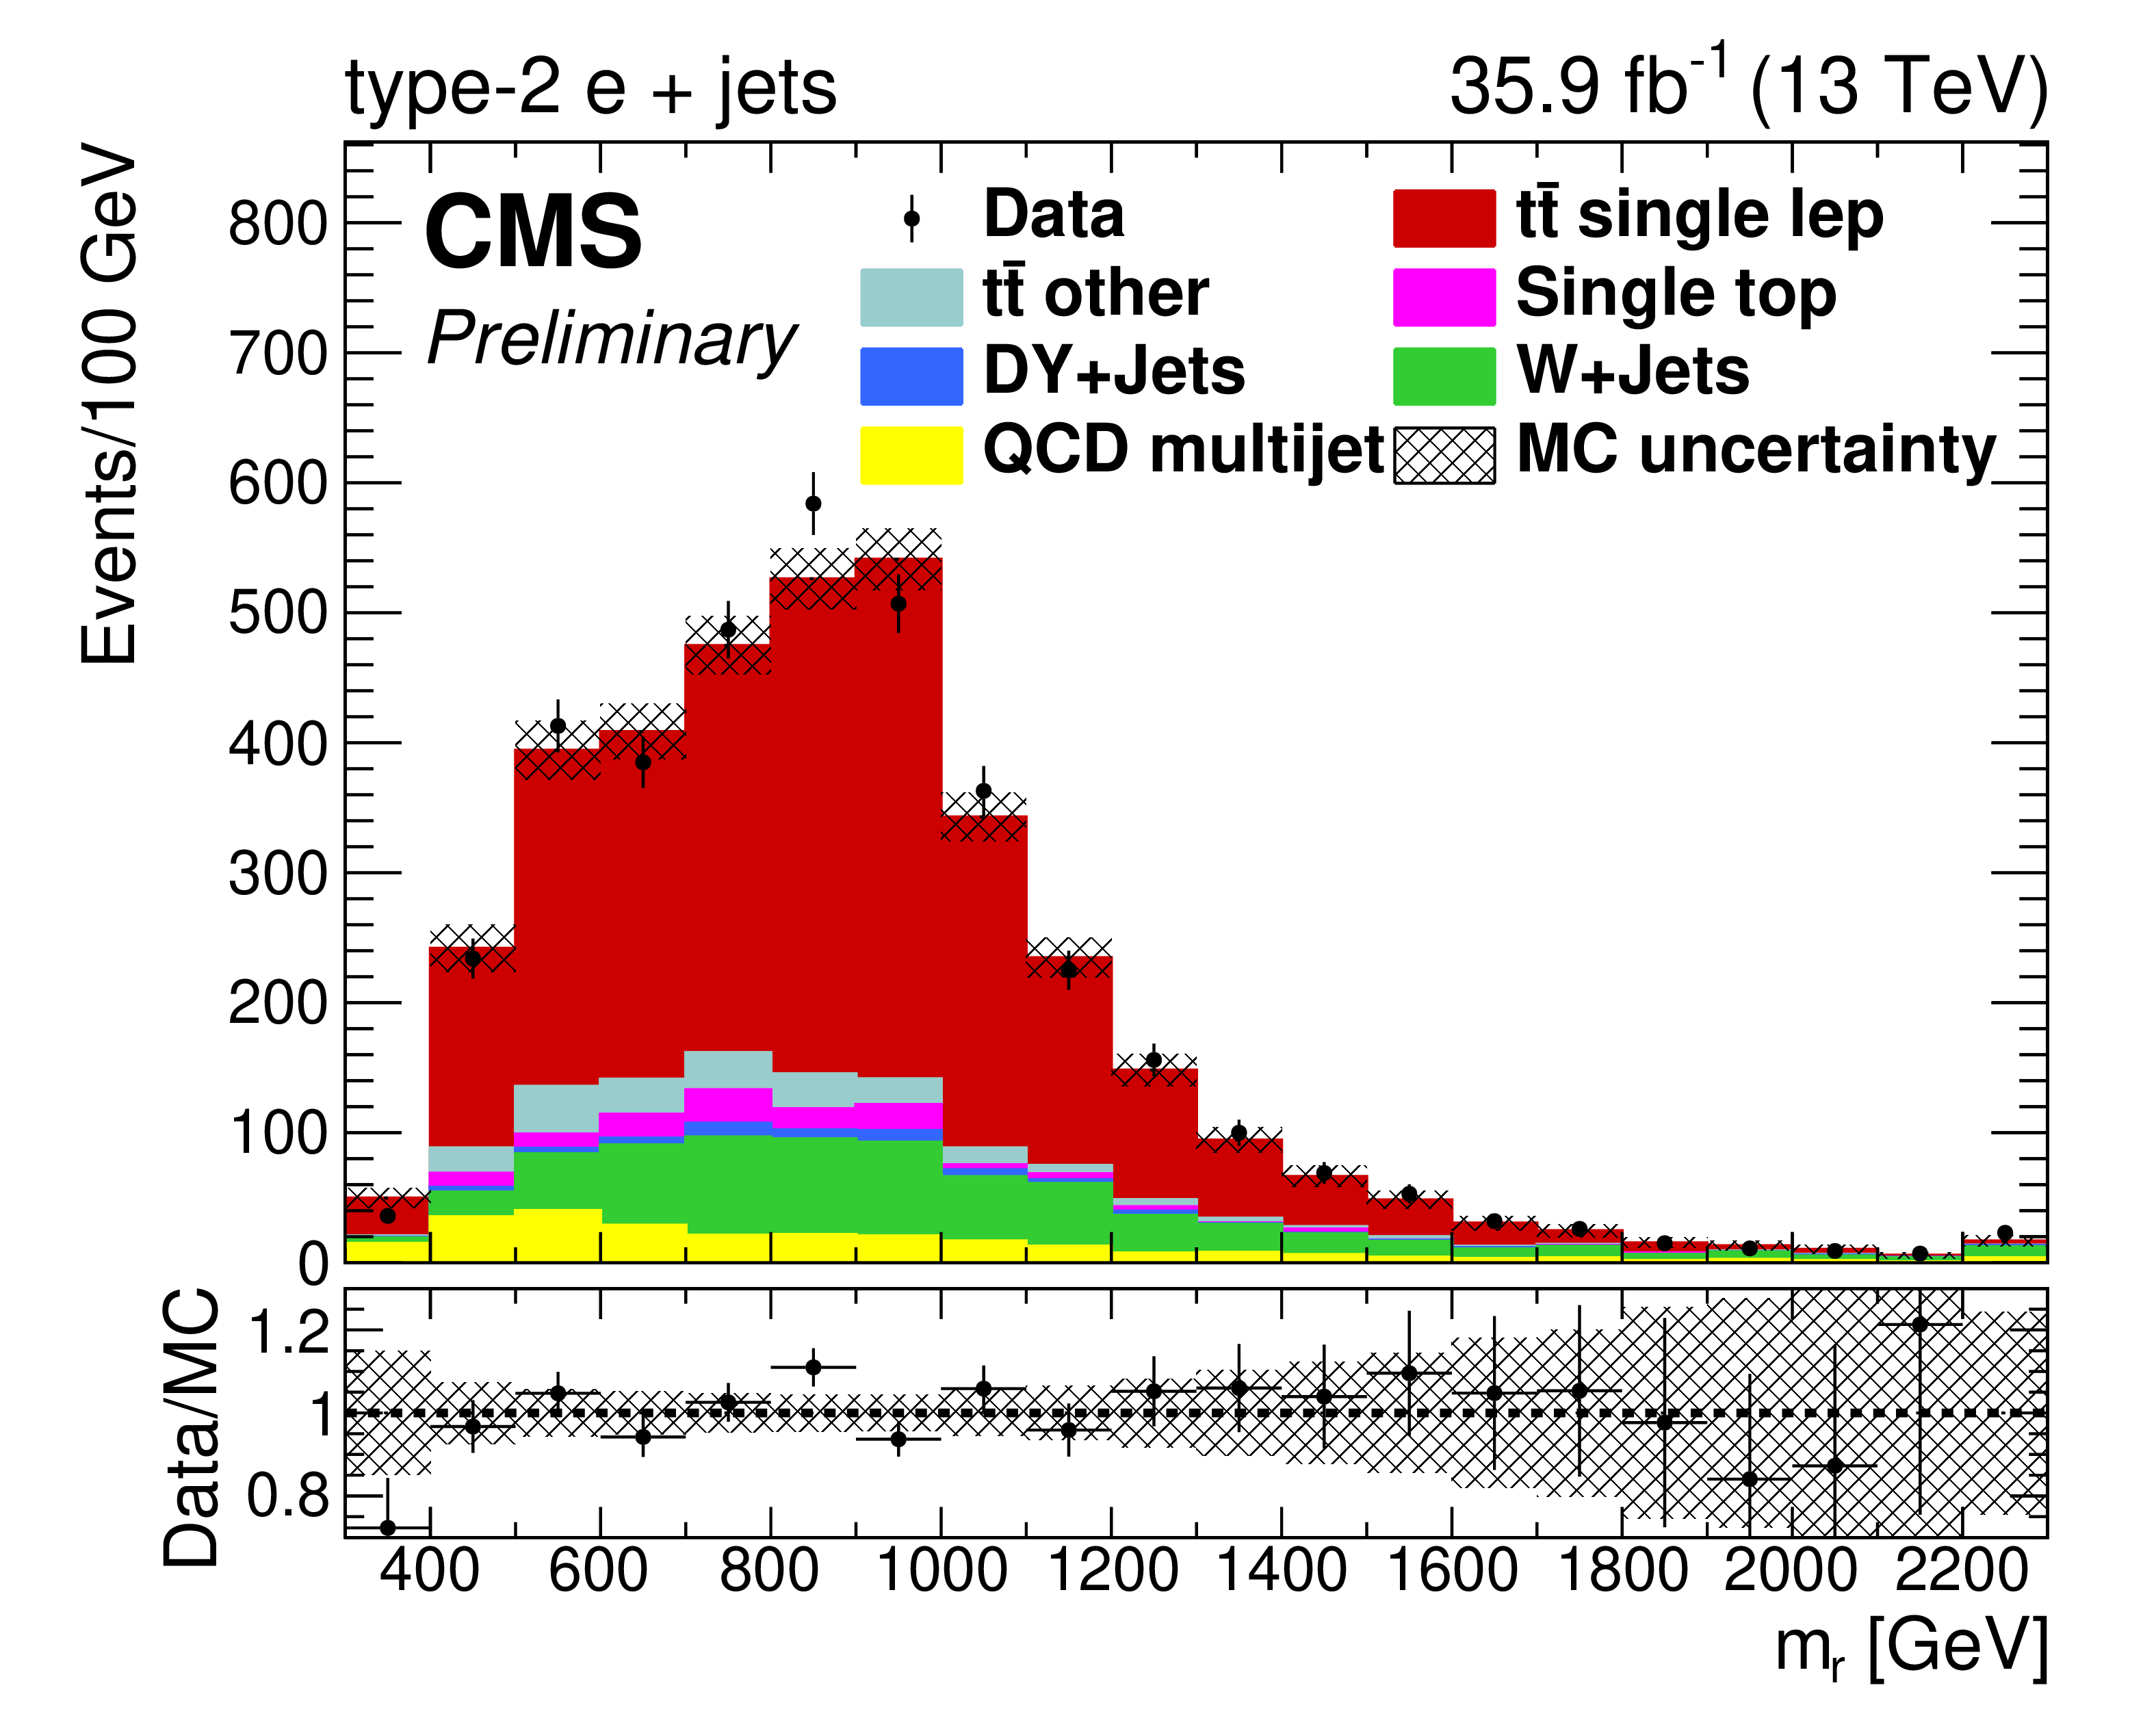
Data/MC comparison of reconstructed ${c^{*}_{\mathrm {r}}}$ (top), $ {| {x_{\mathrm {r}}} |}$ (middle), and ${m_{\mathrm {r}}}$ (bottom) for events passing full type-2 $\mu$+jets (left column) and e+jets (right column) selection criteria. The MC signal and background show their nominal, pre-fit predictions, and the MC uncertainty pictured in the hatched bands represents statistical errors only. Contribution from QCD multijet background is estimated using the data-driven method described in Section 5. The lower panels of each figure show the ratio of the observed data and total prediction in each bin. |
png pdf |
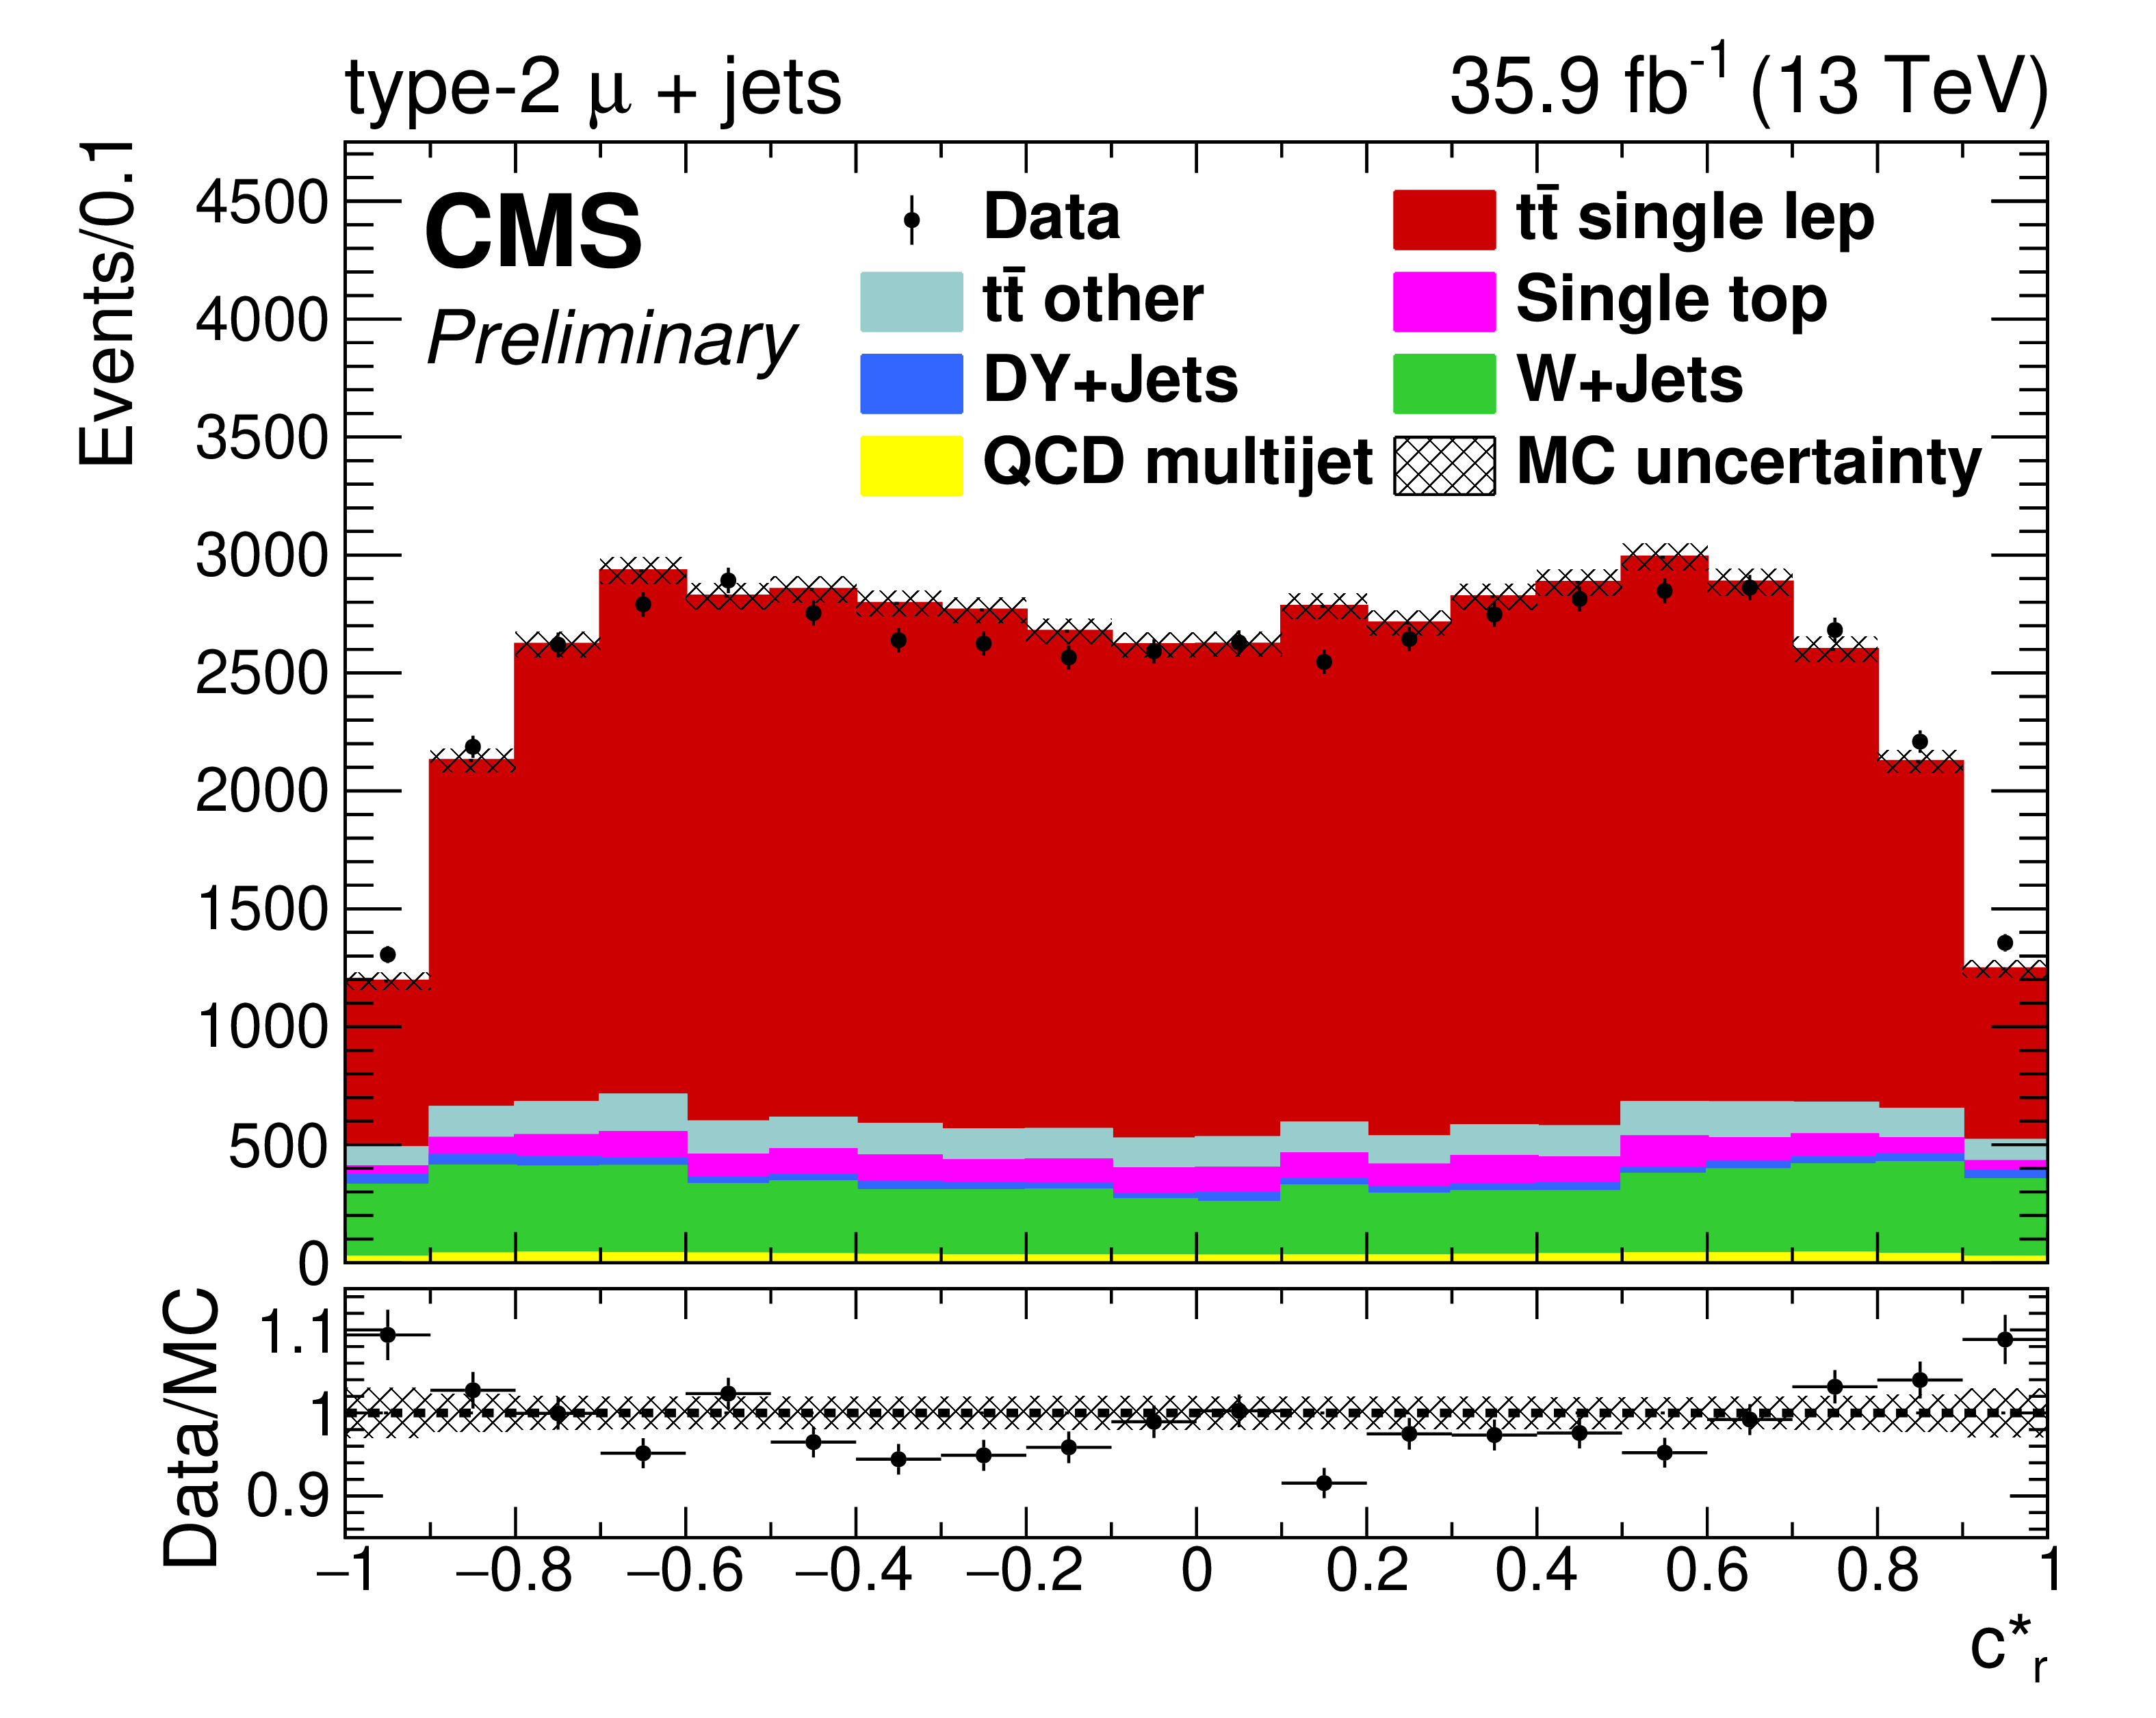
Figure 4-a:
Data/MC comparison of reconstructed ${c^{*}_{\mathrm {r}}}$ for events passing full type-2 $\mu$+jets selection criteria. The MC signal and background show their nominal, pre-fit predictions, and the MC uncertainty pictured in the hatched bands represents statistical errors only. Contribution from QCD multijet background is estimated using the data-driven method described in Section 5. The lower panel shows the ratio of the observed data and total prediction in each bin. |
png pdf |
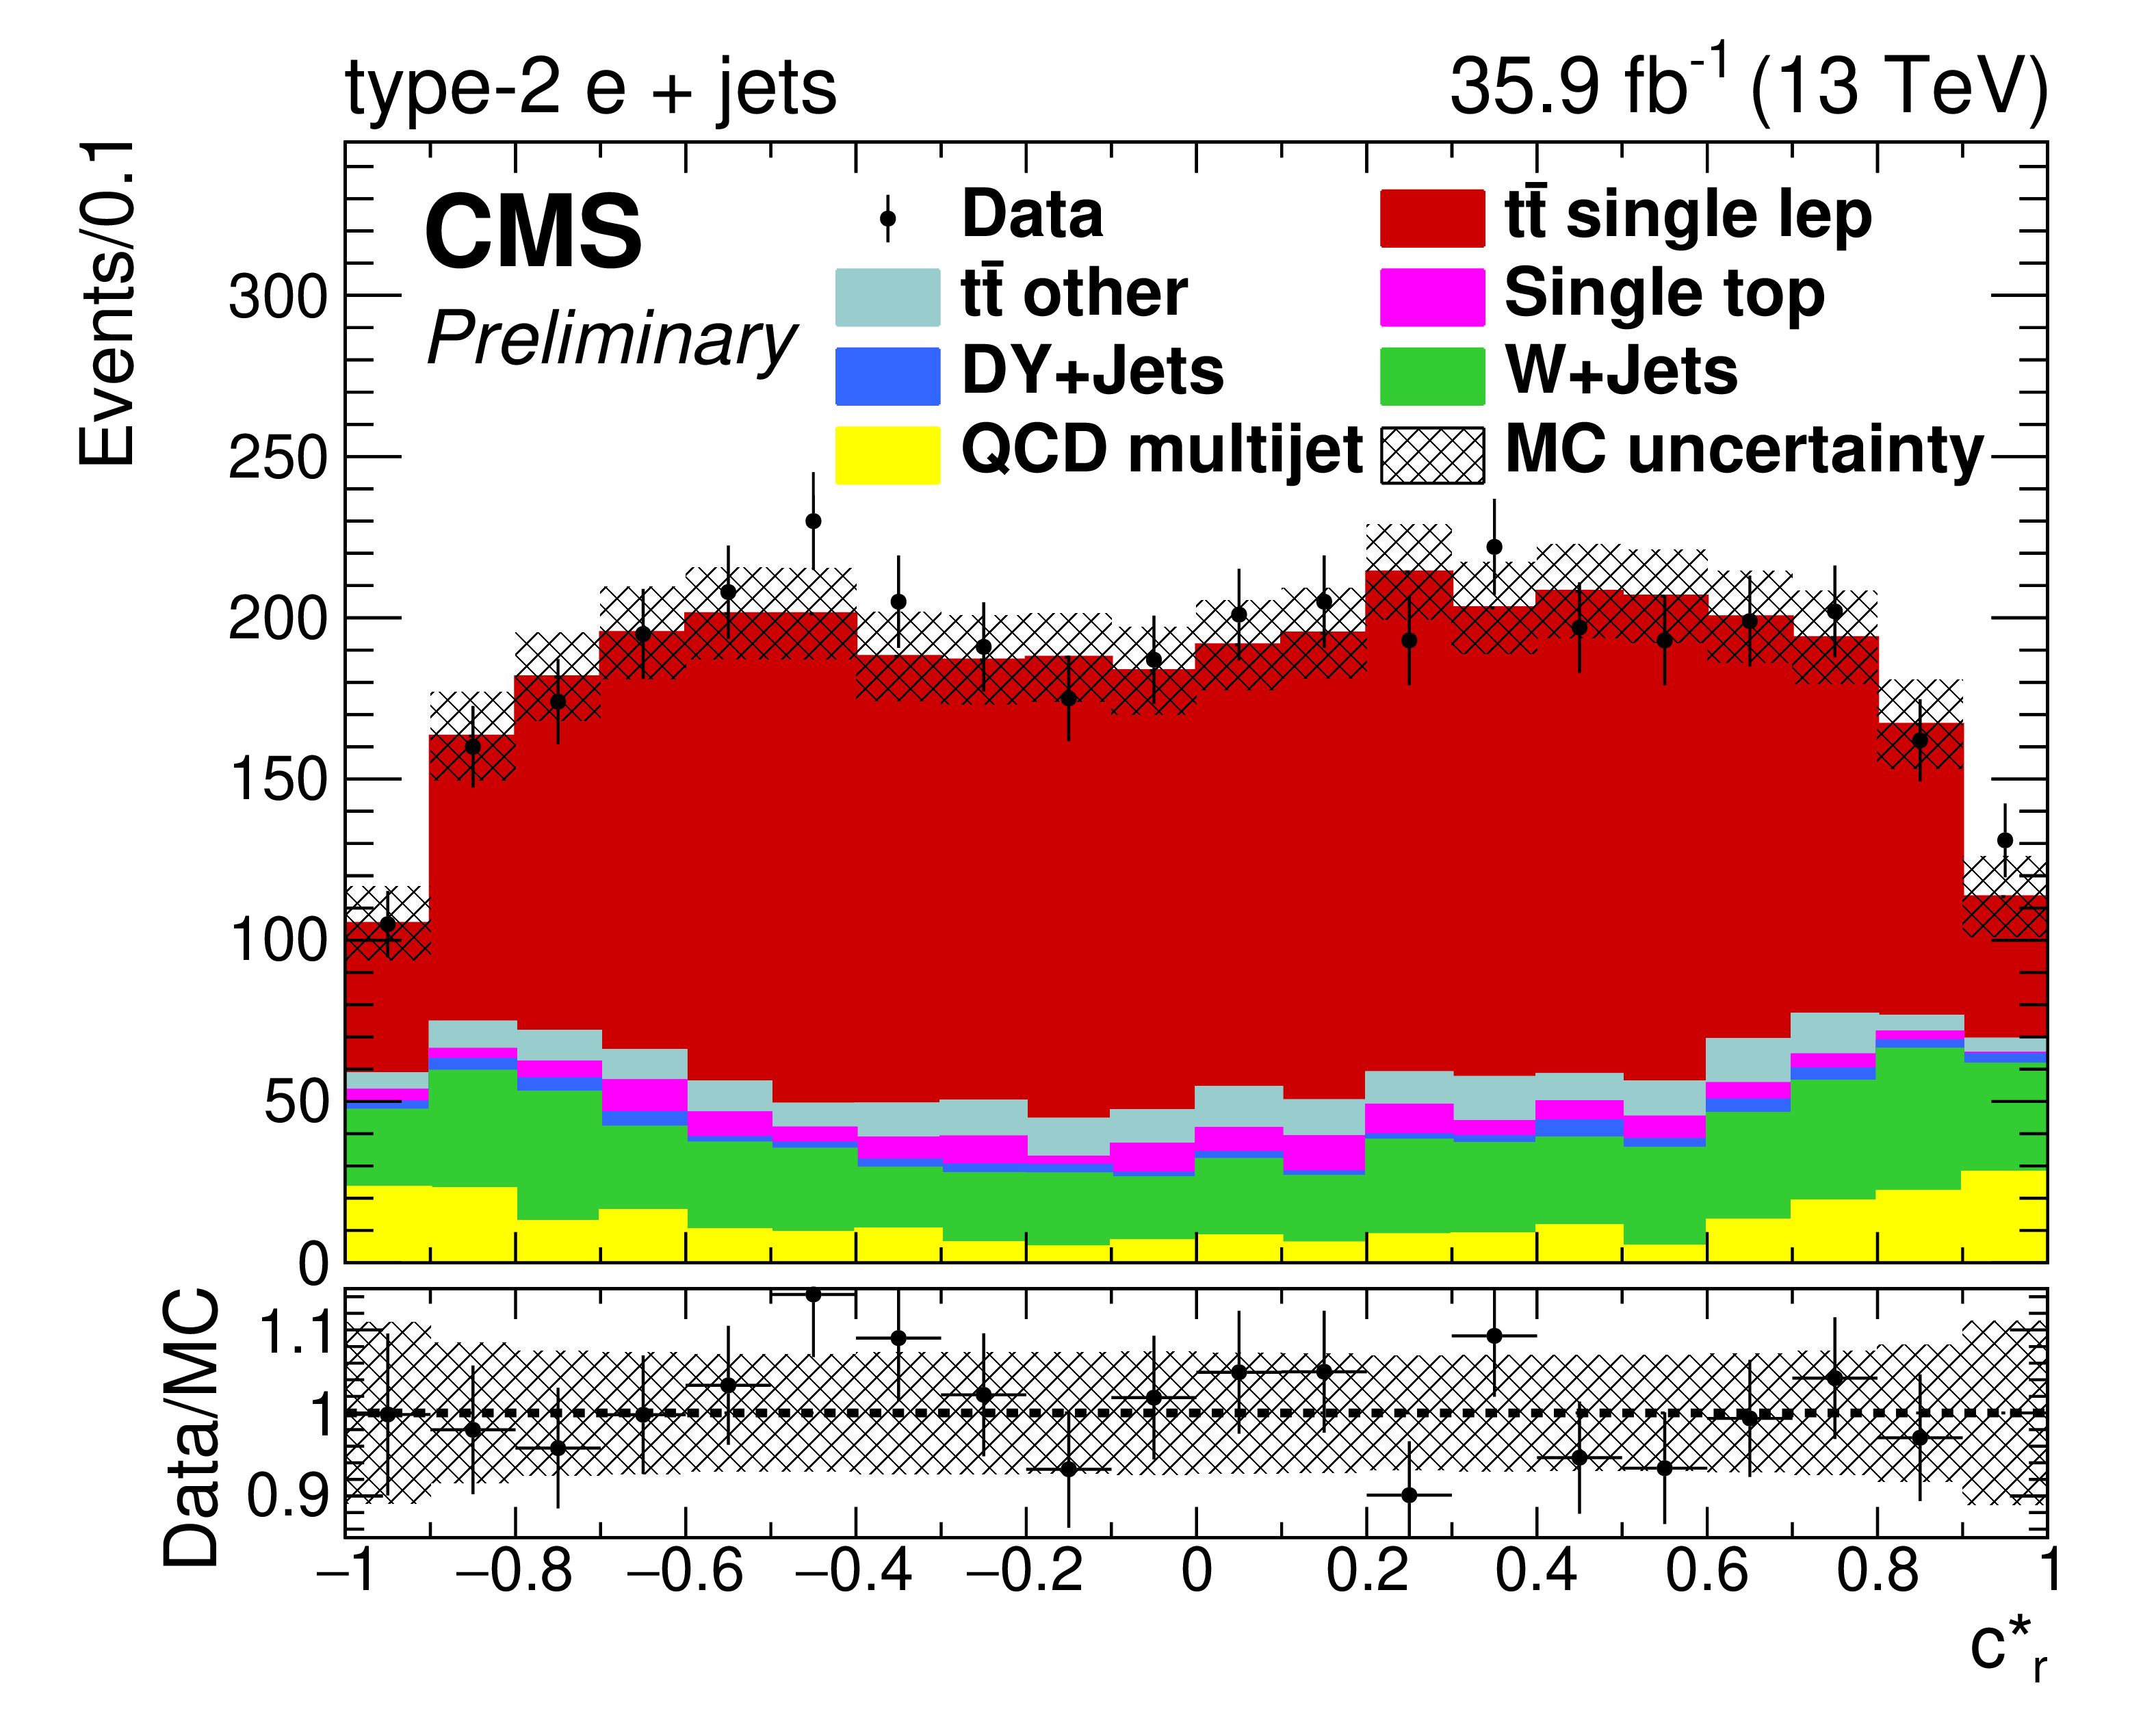
Figure 4-b:
Data/MC comparison of reconstructed ${c^{*}_{\mathrm {r}}}$ for events passing full type-2 e+jets selection criteria. The MC signal and background show their nominal, pre-fit predictions, and the MC uncertainty pictured in the hatched bands represents statistical errors only. Contribution from QCD multijet background is estimated using the data-driven method described in Section 5. The lower panel shows the ratio of the observed data and total prediction in each bin. |
png pdf |
Figure 4-c:
Data/MC comparison of reconstructed $ {| {x_{\mathrm {r}}} |}$ for events passing full type-2 $\mu$+jets selection criteria. The MC signal and background show their nominal, pre-fit predictions, and the MC uncertainty pictured in the hatched bands represents statistical errors only. Contribution from QCD multijet background is estimated using the data-driven method described in Section 5. The lower panel shows the ratio of the observed data and total prediction in each bin. |
png pdf |
Figure 4-d:
Data/MC comparison of reconstructed $ {| {x_{\mathrm {r}}} |}$ for events passing full type-2 e+jets selection criteria. The MC signal and background show their nominal, pre-fit predictions, and the MC uncertainty pictured in the hatched bands represents statistical errors only. Contribution from QCD multijet background is estimated using the data-driven method described in Section 5. The lower panel shows the ratio of the observed data and total prediction in each bin. |
png pdf |
Figure 4-e:
Data/MC comparison of reconstructed ${m_{\mathrm {r}}}$ for events passing full type-2 $\mu$+jets selection criteria. The MC signal and background show their nominal, pre-fit predictions, and the MC uncertainty pictured in the hatched bands represents statistical errors only. Contribution from QCD multijet background is estimated using the data-driven method described in Section 5. The lower panel shows the ratio of the observed data and total prediction in each bin. |
png pdf |
Figure 4-f:
Data/MC comparison of reconstructed ${m_{\mathrm {r}}}$ for events passing full type-2 e+jets selection criteria. The MC signal and background show their nominal, pre-fit predictions, and the MC uncertainty pictured in the hatched bands represents statistical errors only. Contribution from QCD multijet background is estimated using the data-driven method described in Section 5. The lower panel shows the ratio of the observed data and total prediction in each bin. |
png pdf |
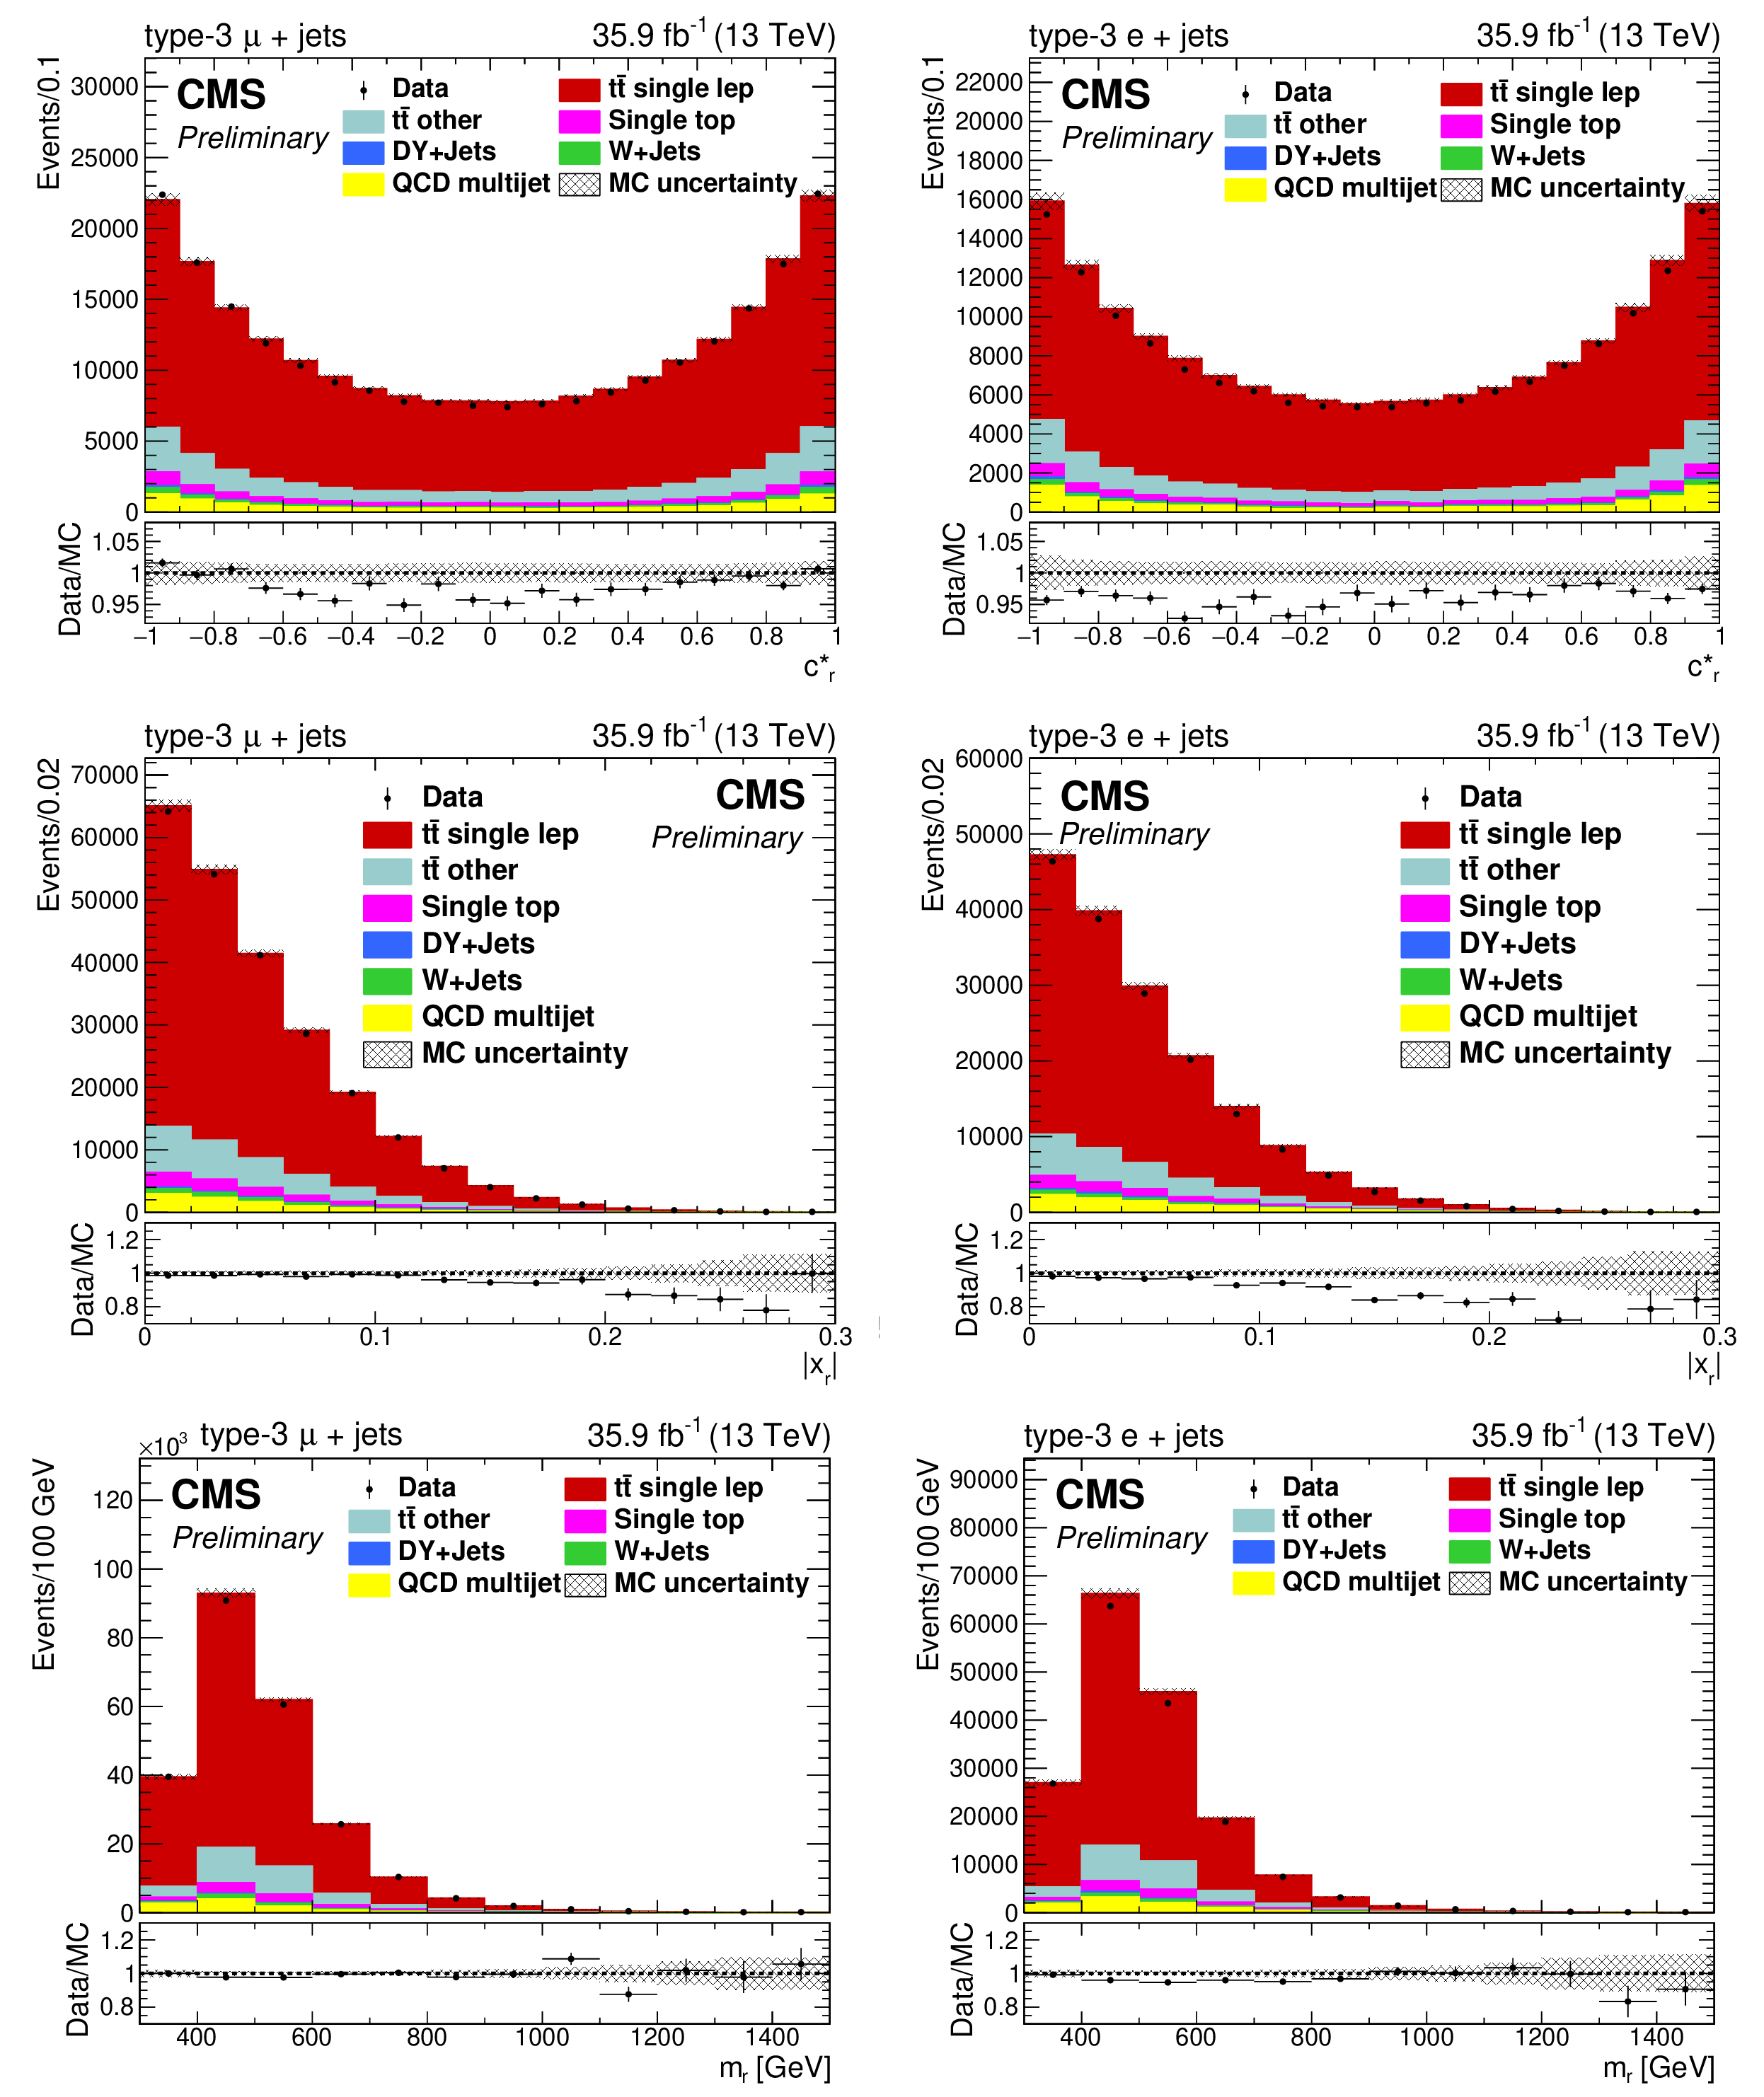
Figure 5:
Data/MC comparison of reconstructed ${c^{*}_{\mathrm {r}}}$ (top), $ {| {x_{\mathrm {r}}} |}$ (middle), and ${m_{\mathrm {r}}}$ (bottom) for events passing full type-3 $\mu$+jets (left column) and e+jets (right column) selection criteria. The MC signal and background show their nominal, pre-fit predictions, and the MC uncertainty pictured in the hatched bands represents statistical errors only. Contribution from QCD multijet background is estimated using the data-driven method described in Section 5. The lower panels of each figure show the ratio of the observed data and total prediction in each bin. |
png pdf |
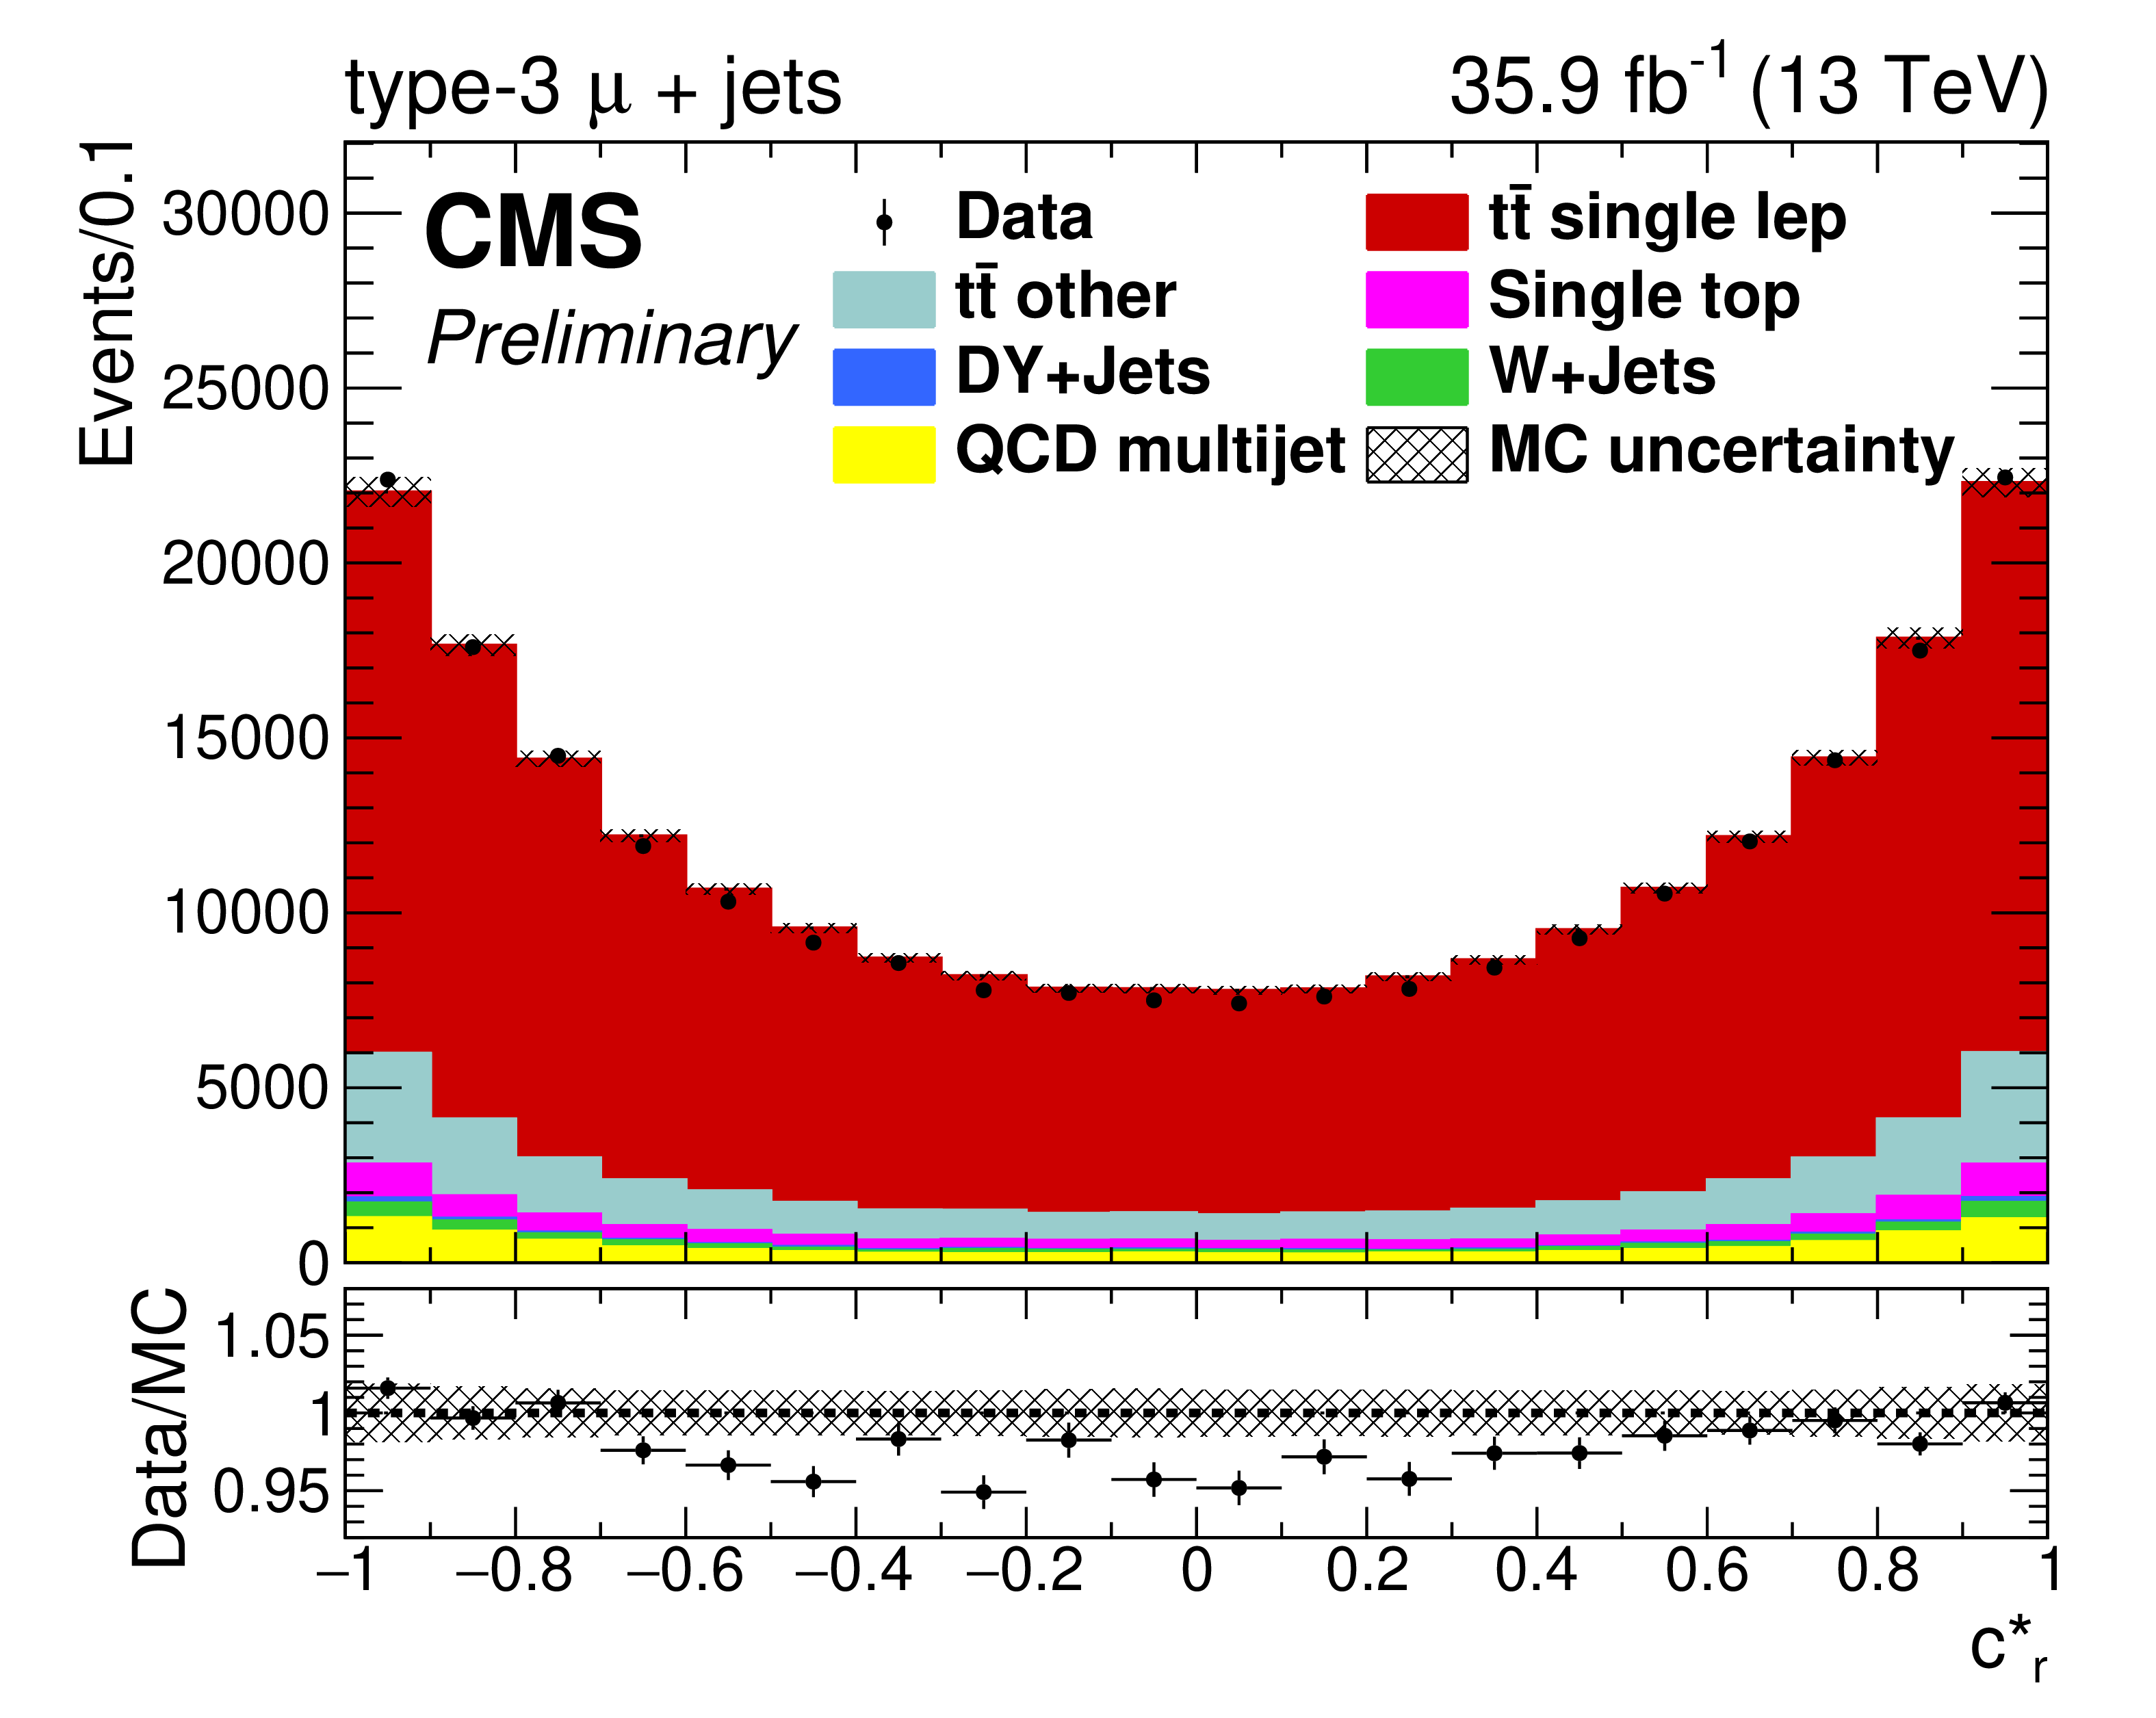
Figure 5-a:
Data/MC comparison of reconstructed ${c^{*}_{\mathrm {r}}}$ for events passing full type-3 $\mu$+jets selection criteria. The MC signal and background show their nominal, pre-fit predictions, and the MC uncertainty pictured in the hatched bands represents statistical errors only. Contribution from QCD multijet background is estimated using the data-driven method described in Section 5. The lower panel shows the ratio of the observed data and total prediction in each bin. |
png pdf |
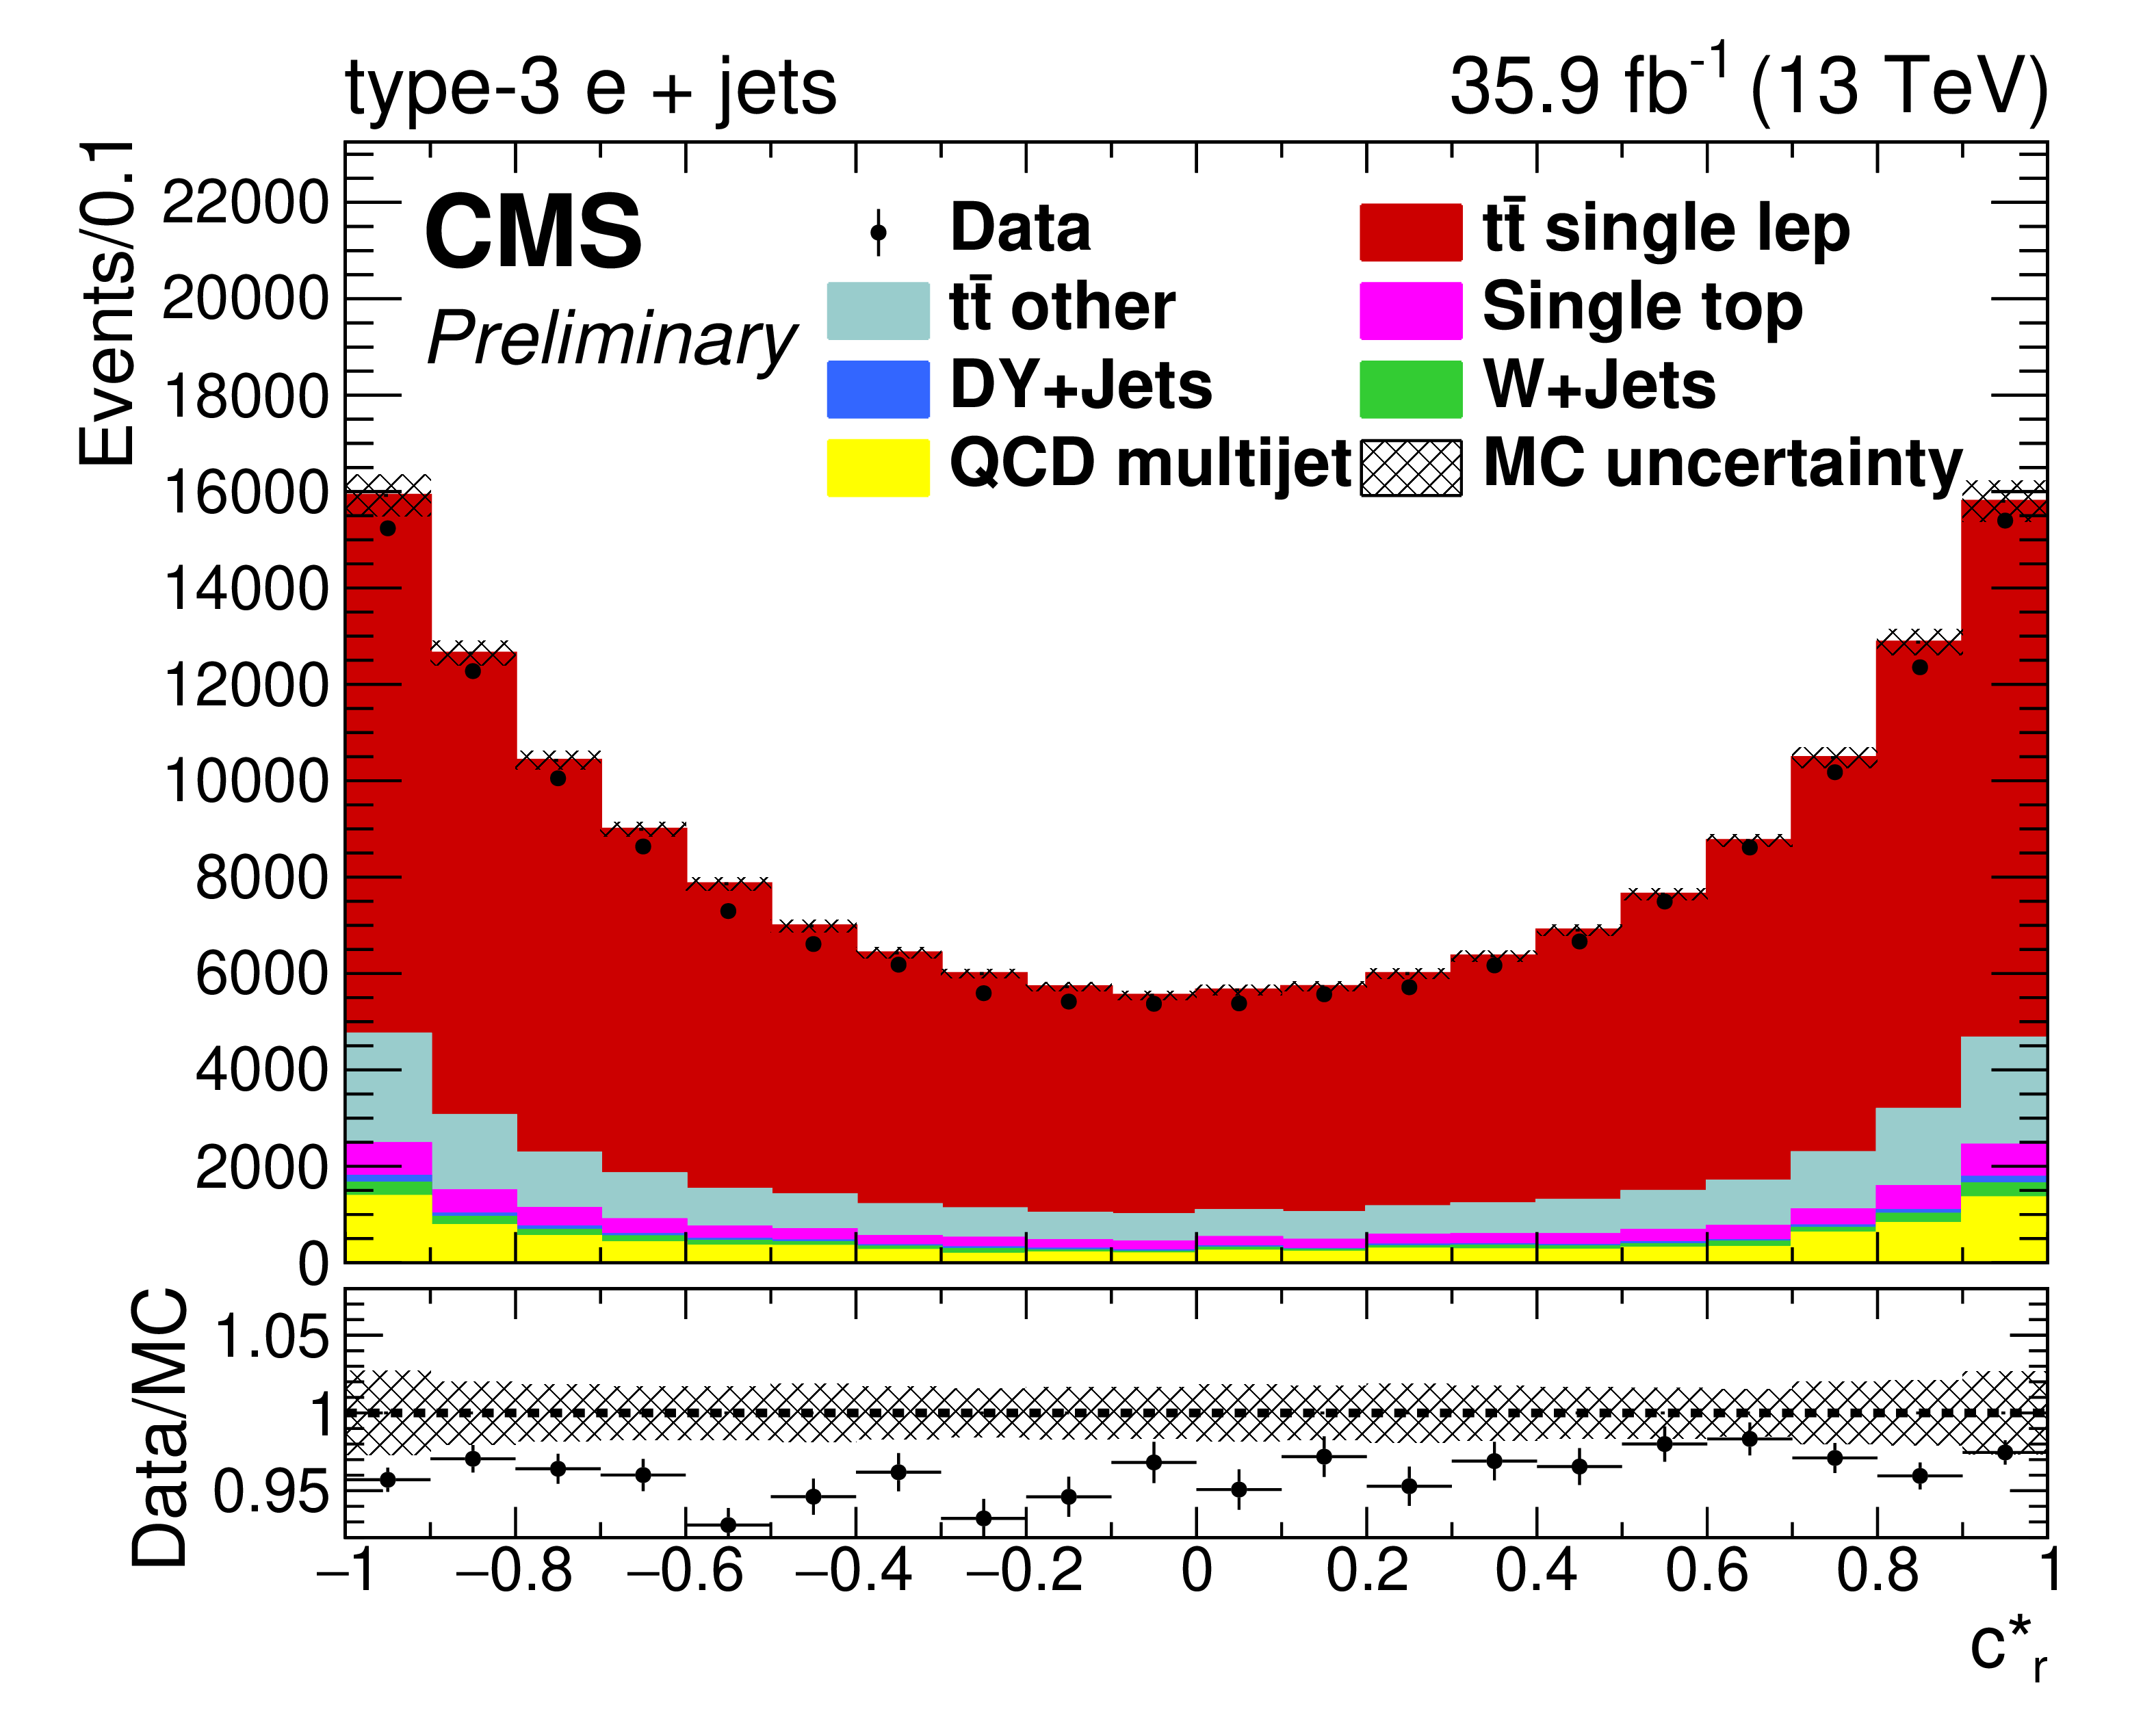
Figure 5-b:
Data/MC comparison of reconstructed ${c^{*}_{\mathrm {r}}}$ for events passing full type-3 e+jets selection criteria. The MC signal and background show their nominal, pre-fit predictions, and the MC uncertainty pictured in the hatched bands represents statistical errors only. Contribution from QCD multijet background is estimated using the data-driven method described in Section 5. The lower panel shows the ratio of the observed data and total prediction in each bin. |
png pdf |
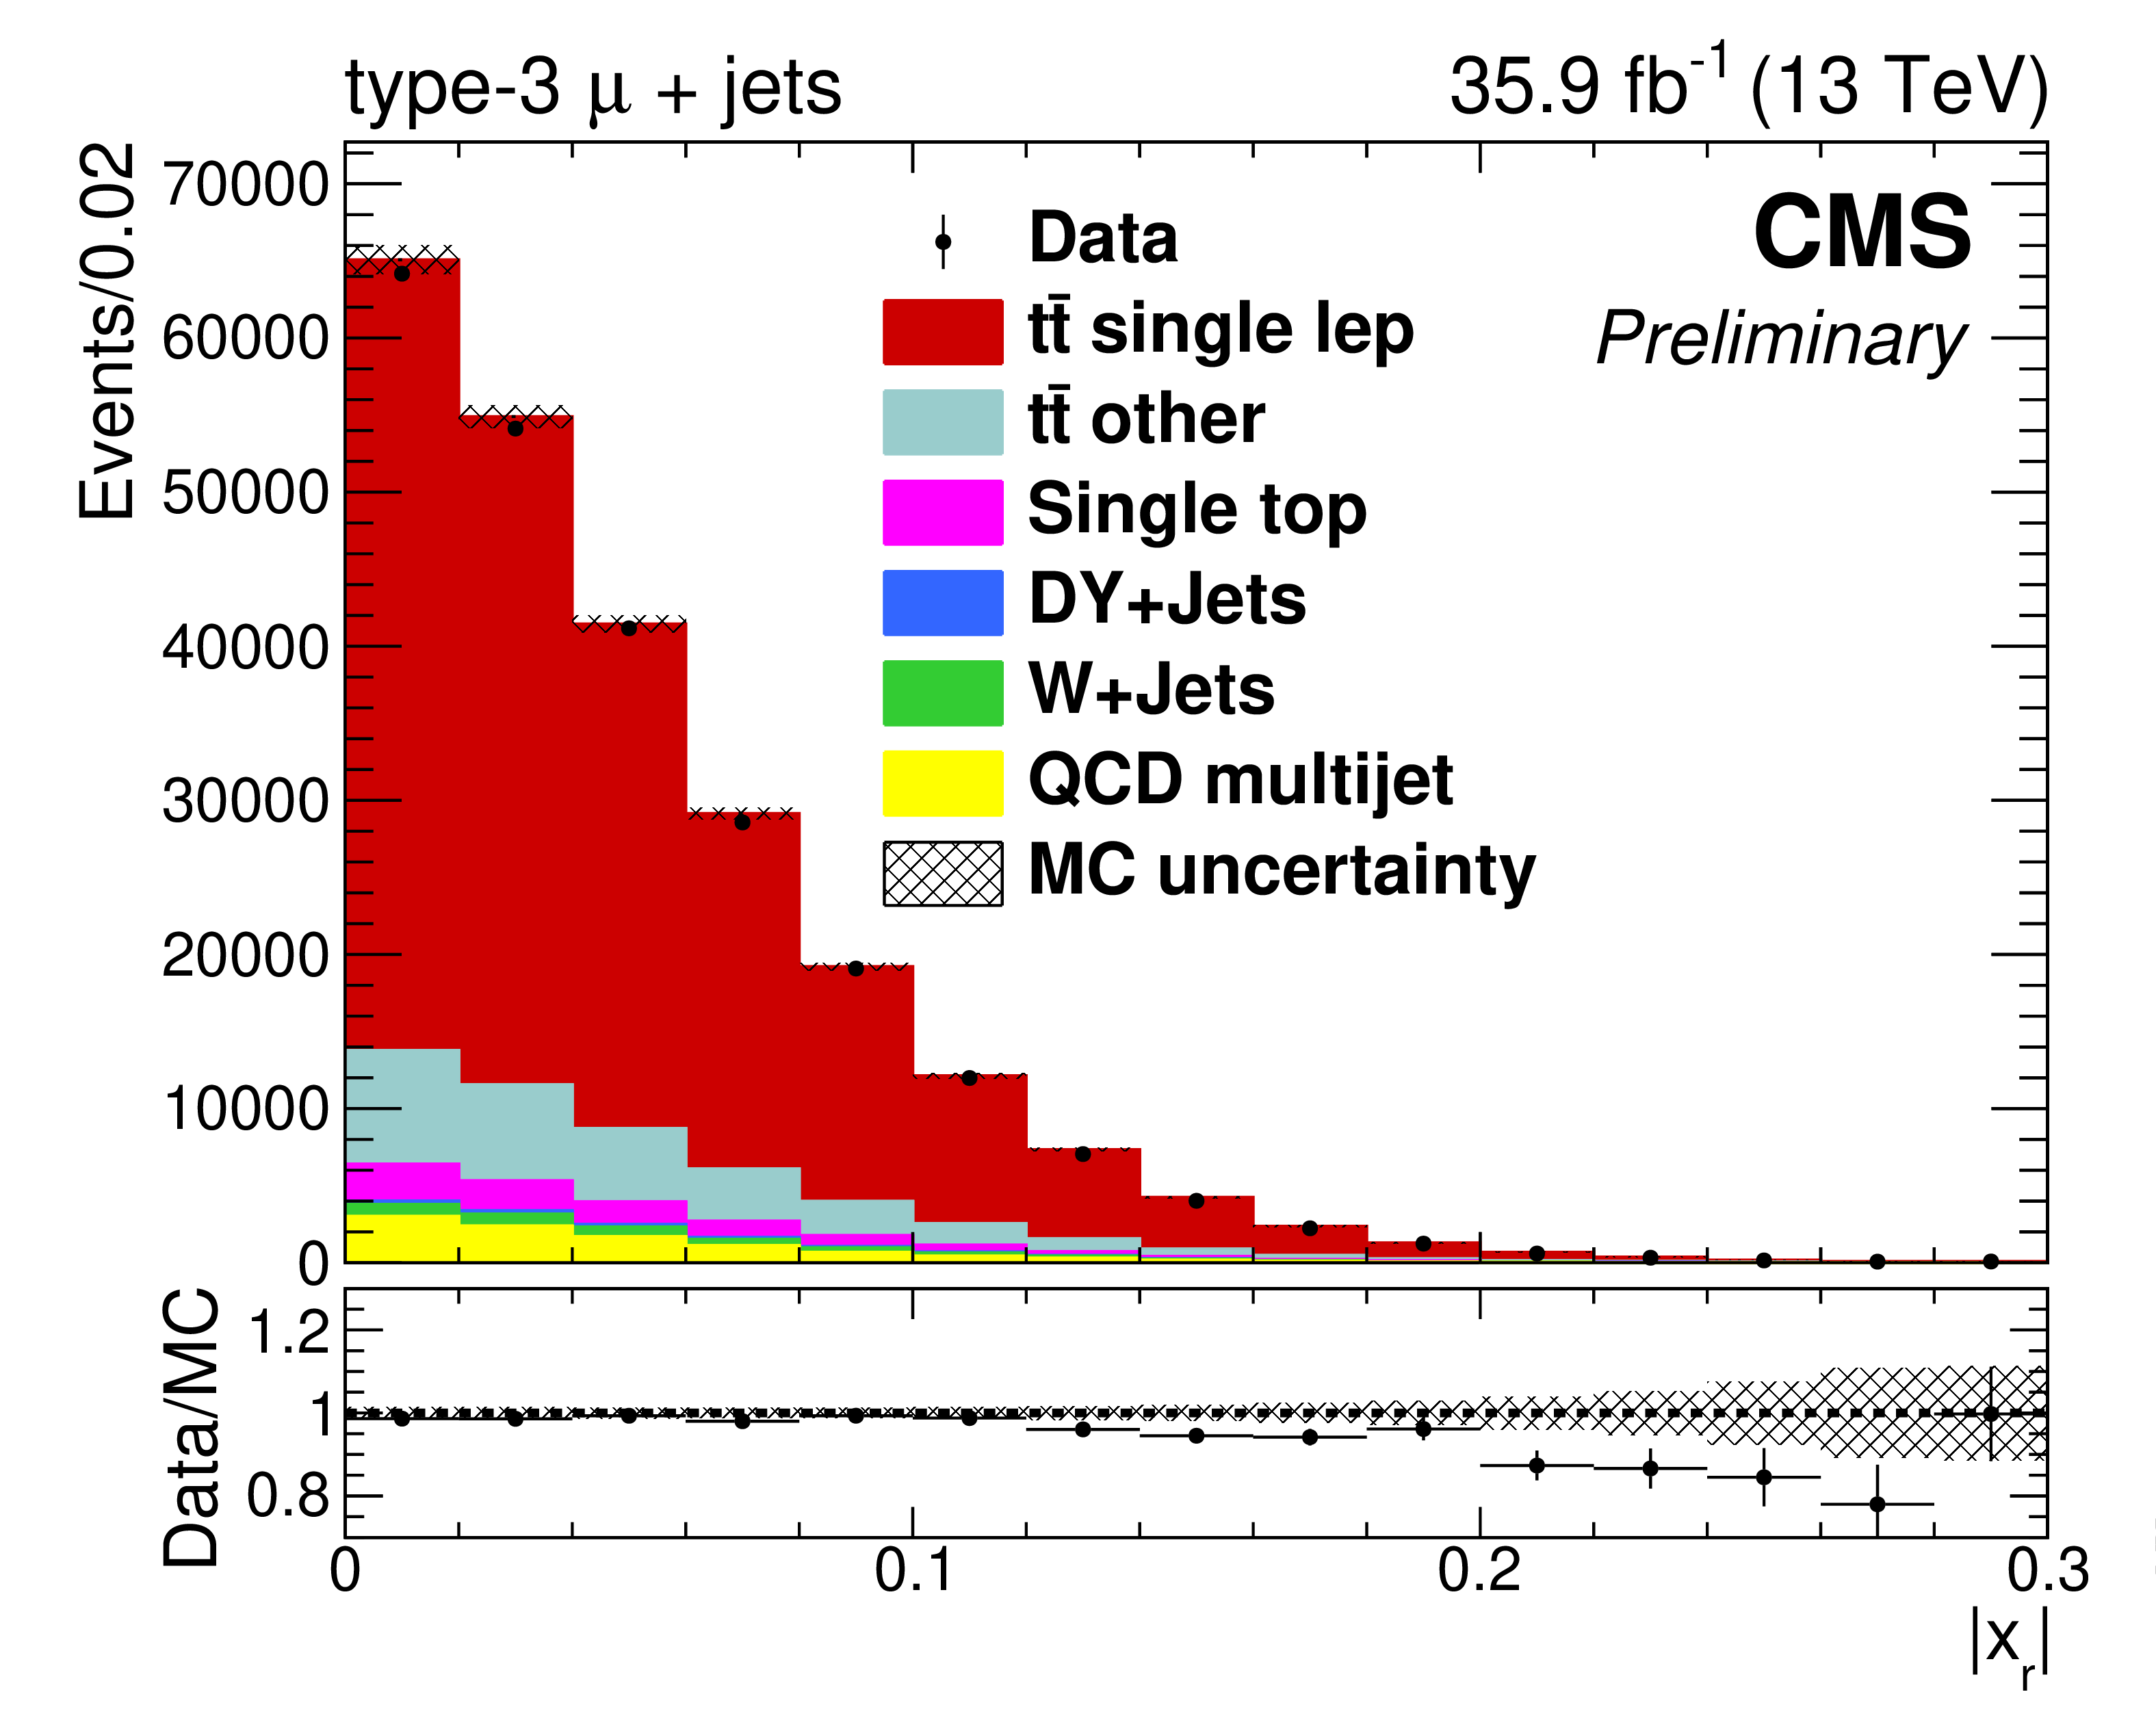
Figure 5-c:
Data/MC comparison of reconstructed $ {| {x_{\mathrm {r}}} |}$ for events passing full type-3 $\mu$+jets selection criteria. The MC signal and background show their nominal, pre-fit predictions, and the MC uncertainty pictured in the hatched bands represents statistical errors only. Contribution from QCD multijet background is estimated using the data-driven method described in Section 5. The lower panel shows the ratio of the observed data and total prediction in each bin. |
png pdf |
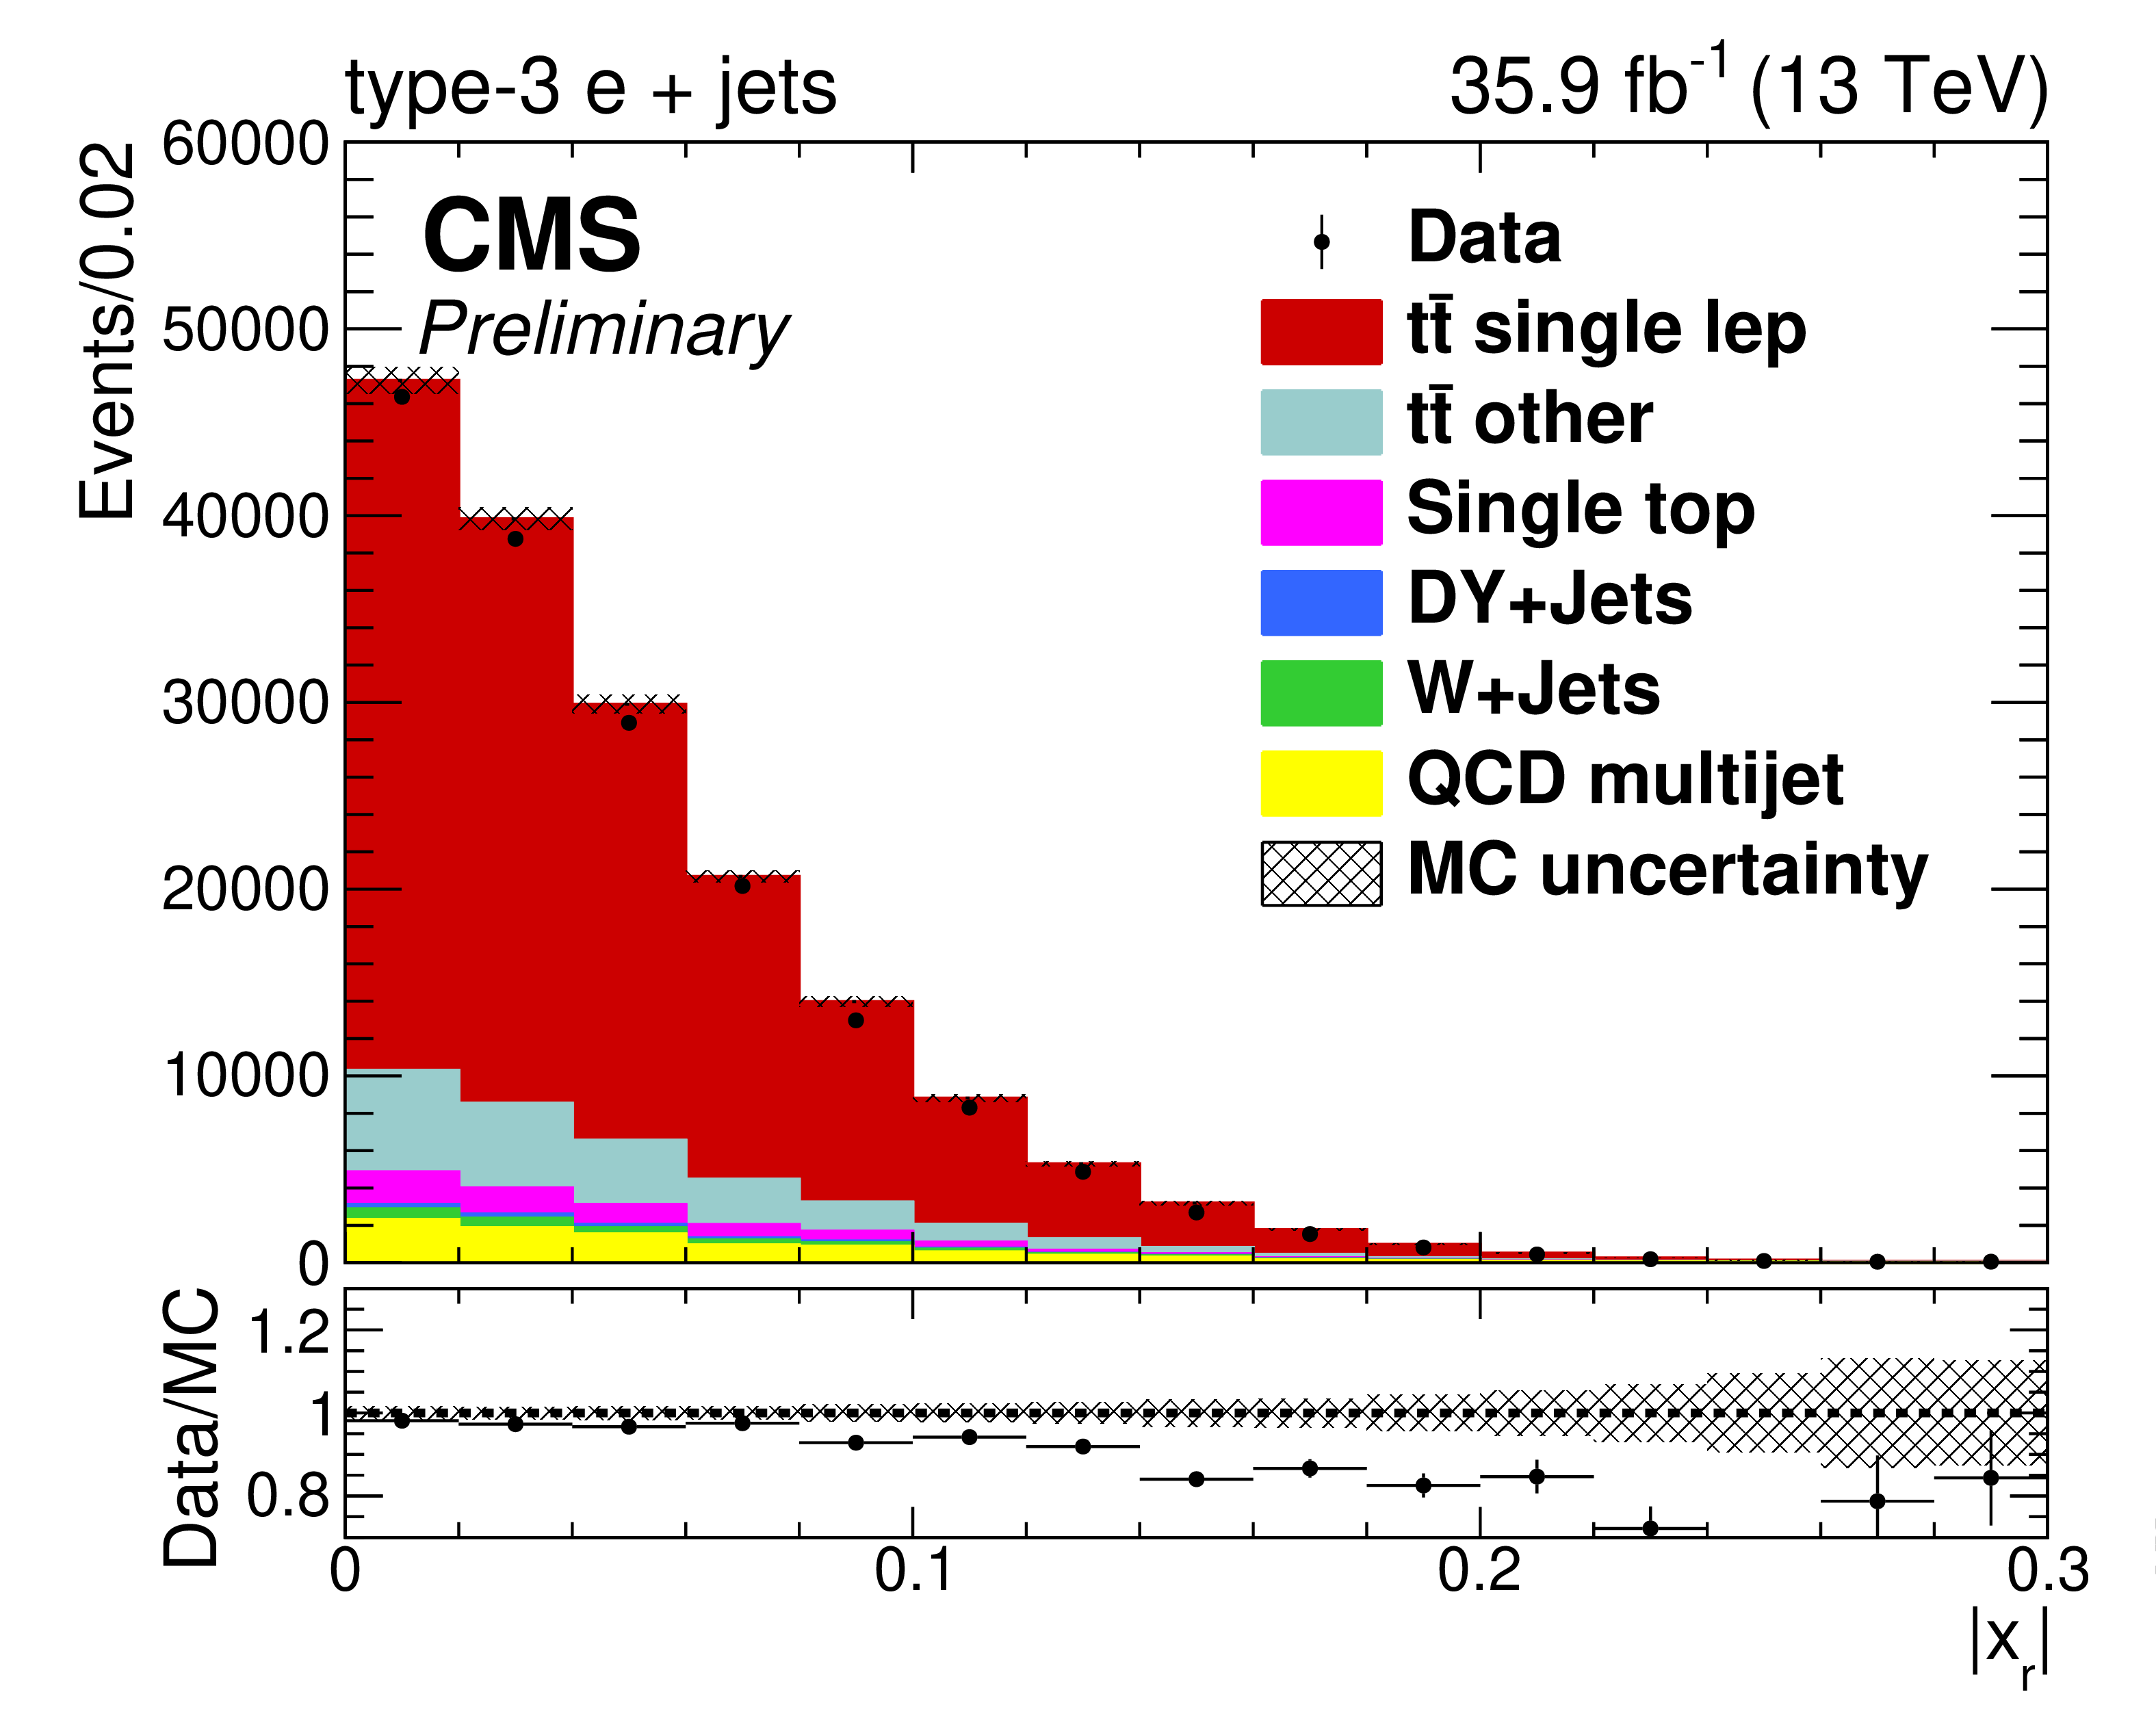
Figure 5-d:
Data/MC comparison of reconstructed $ {| {x_{\mathrm {r}}} |}$ for events passing full type-3 e+jets selection criteria. The MC signal and background show their nominal, pre-fit predictions, and the MC uncertainty pictured in the hatched bands represents statistical errors only. Contribution from QCD multijet background is estimated using the data-driven method described in Section 5. The lower panel shows the ratio of the observed data and total prediction in each bin. |
png pdf |
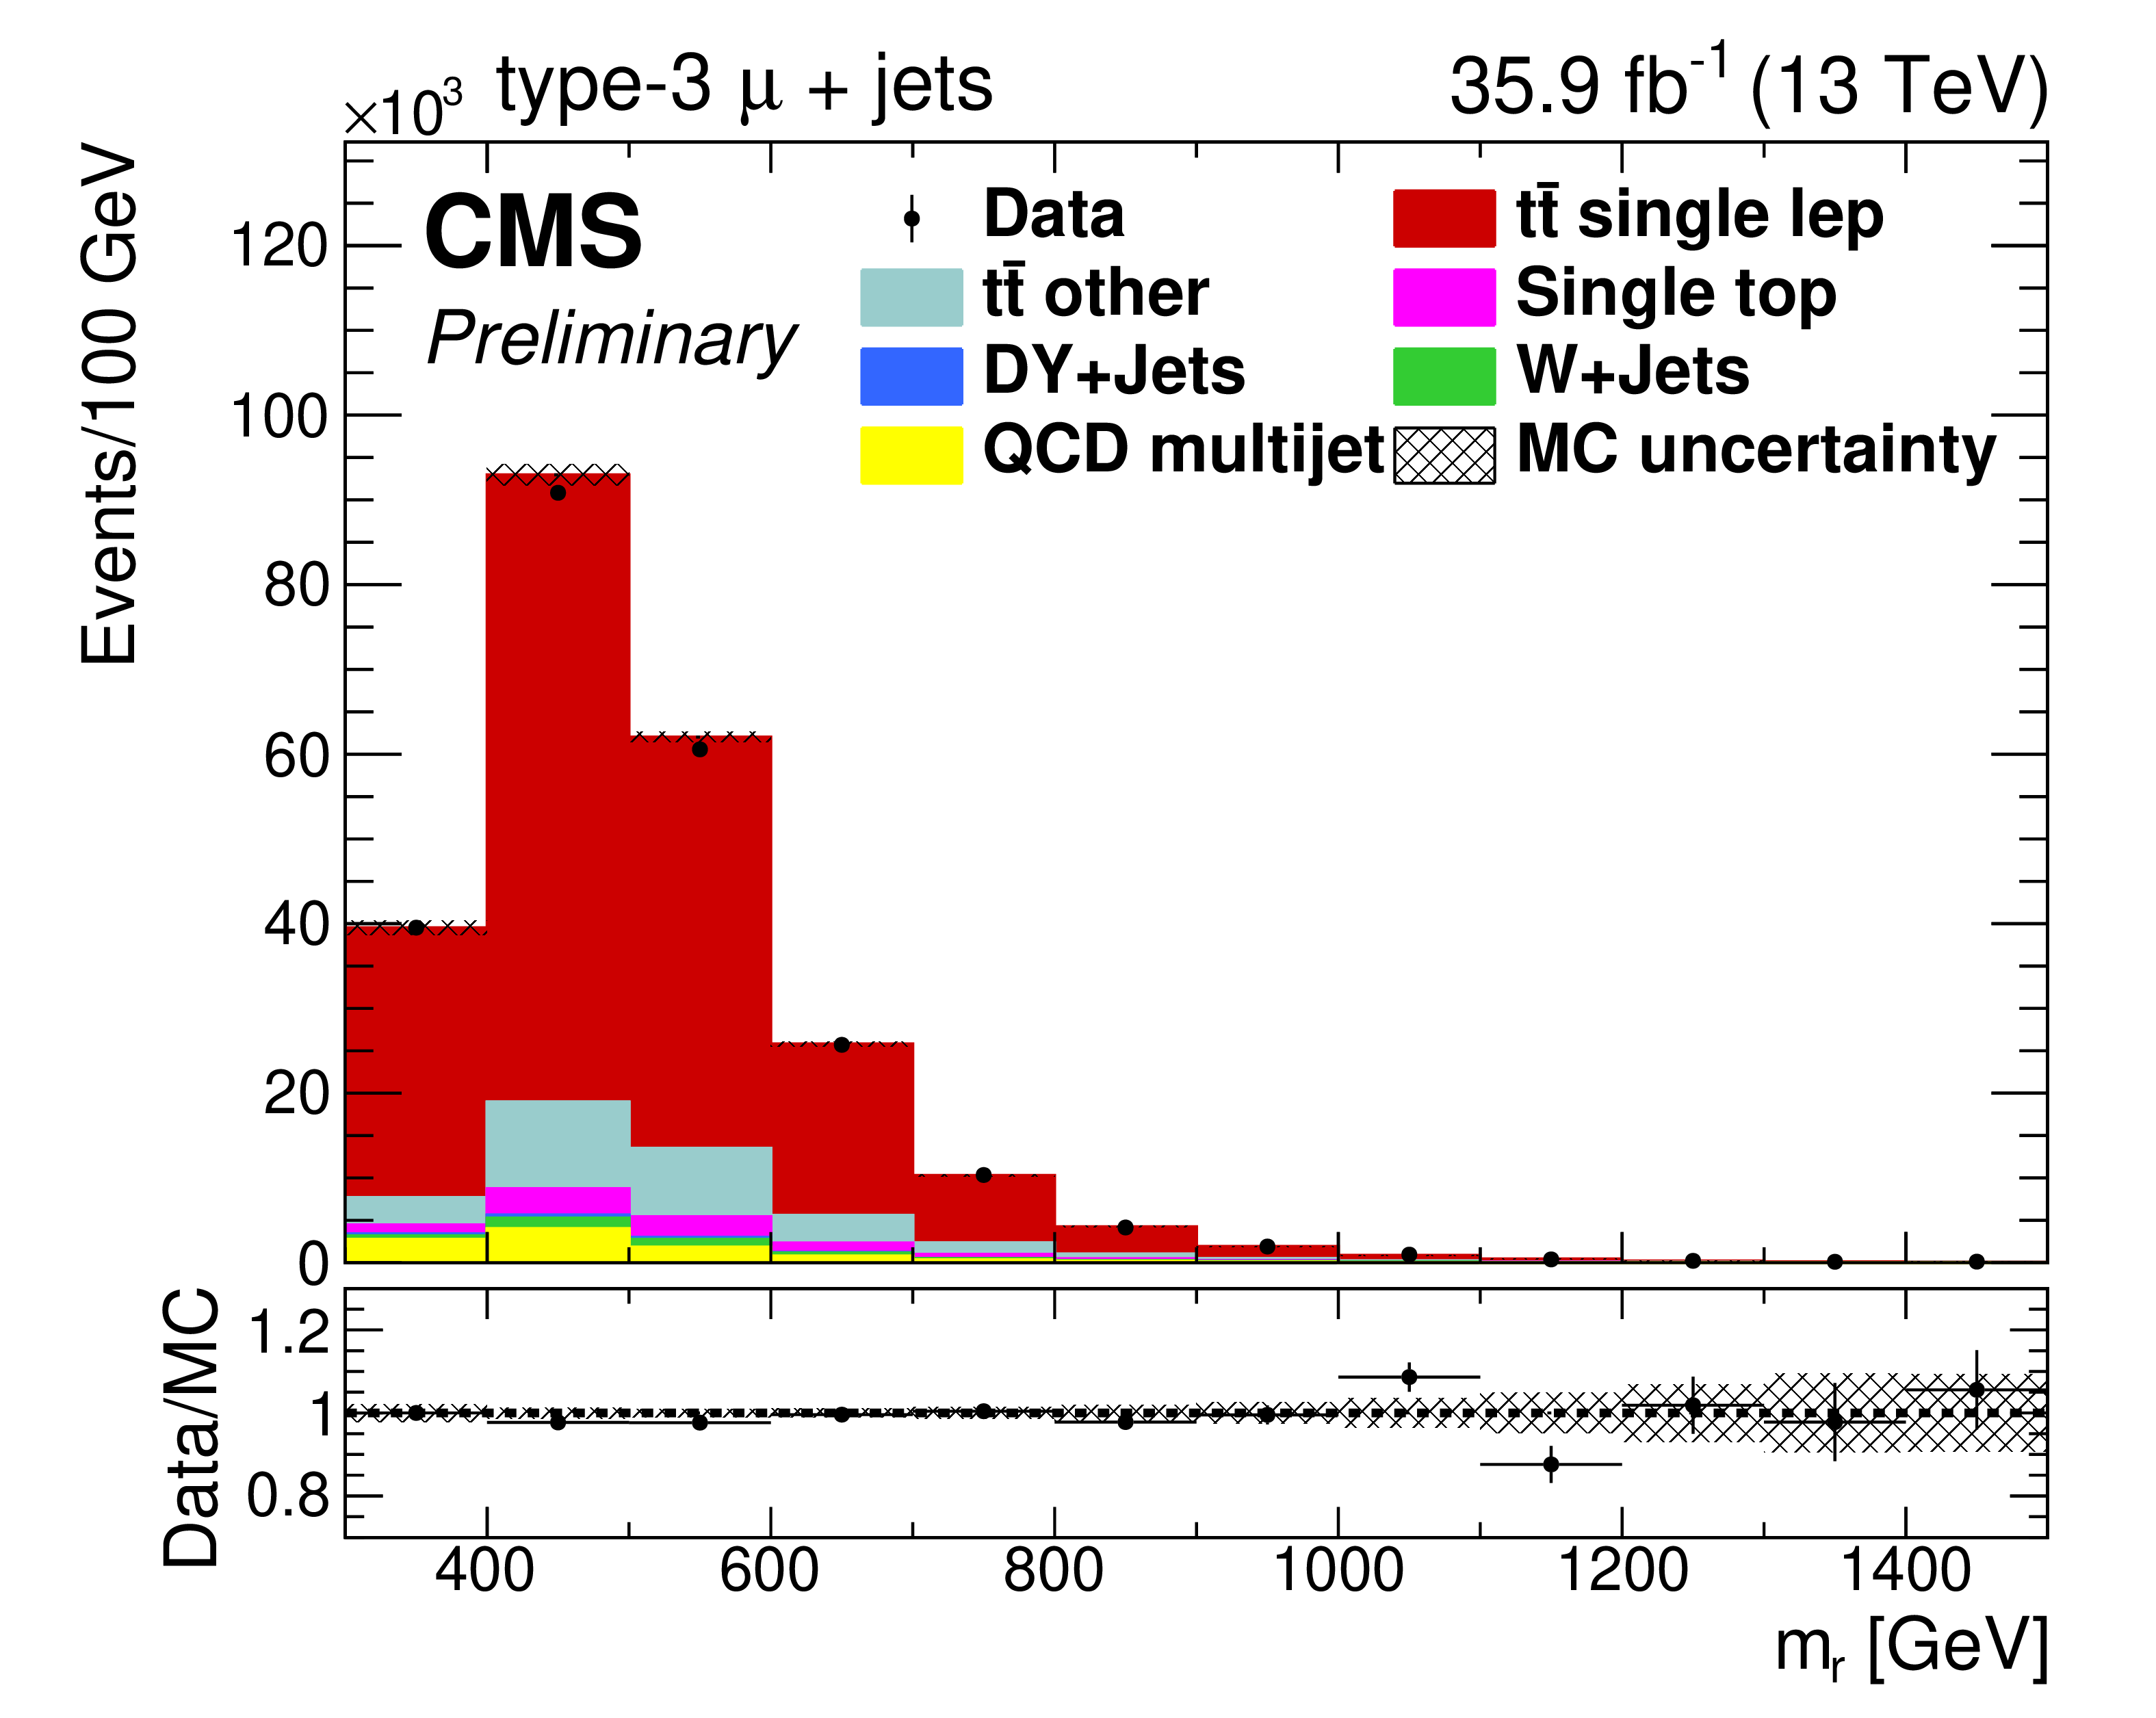
Figure 5-e:
Data/MC comparison of reconstructed ${m_{\mathrm {r}}}$ for events passing full type-3 $\mu$+jets selection criteria. The MC signal and background show their nominal, pre-fit predictions, and the MC uncertainty pictured in the hatched bands represents statistical errors only. Contribution from QCD multijet background is estimated using the data-driven method described in Section 5. The lower panel shows the ratio of the observed data and total prediction in each bin. |
png pdf |
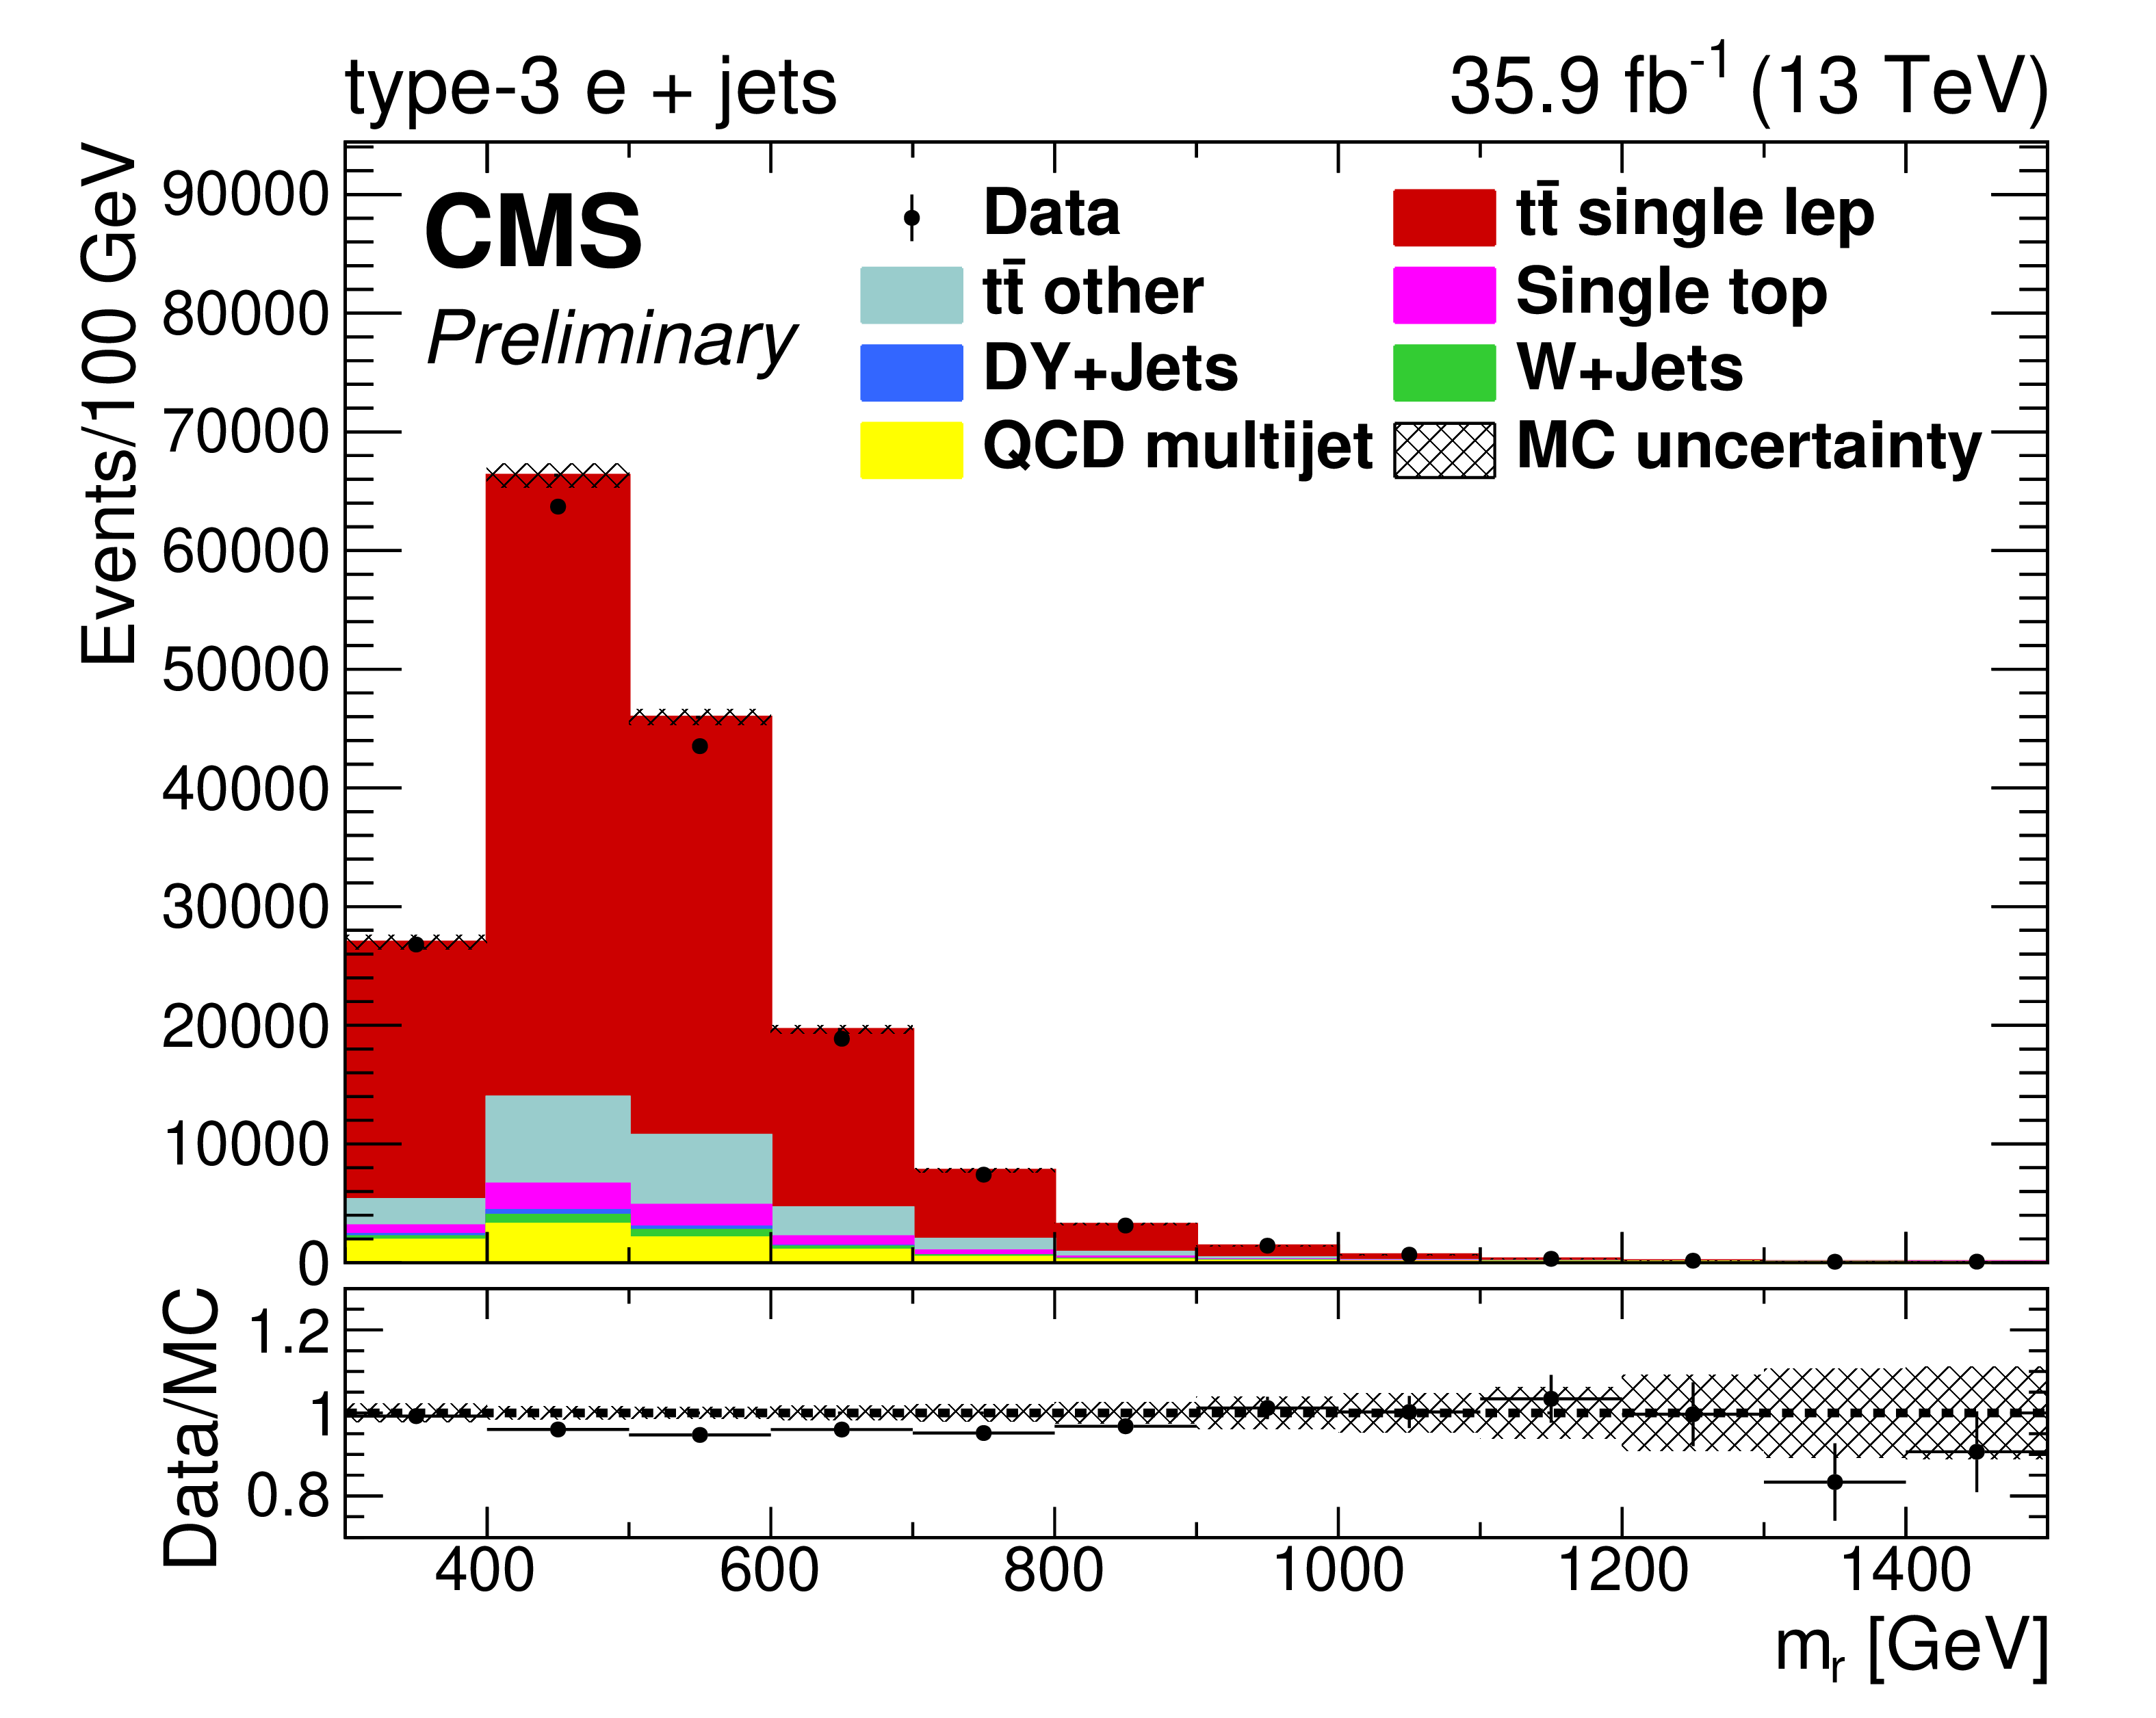
Figure 5-f:
Data/MC comparison of reconstructed ${m_{\mathrm {r}}}$ for events passing full type-3 e+jets selection criteria. The MC signal and background show their nominal, pre-fit predictions, and the MC uncertainty pictured in the hatched bands represents statistical errors only. Contribution from QCD multijet background is estimated using the data-driven method described in Section 5. The lower panel shows the ratio of the observed data and total prediction in each bin. |
png pdf |
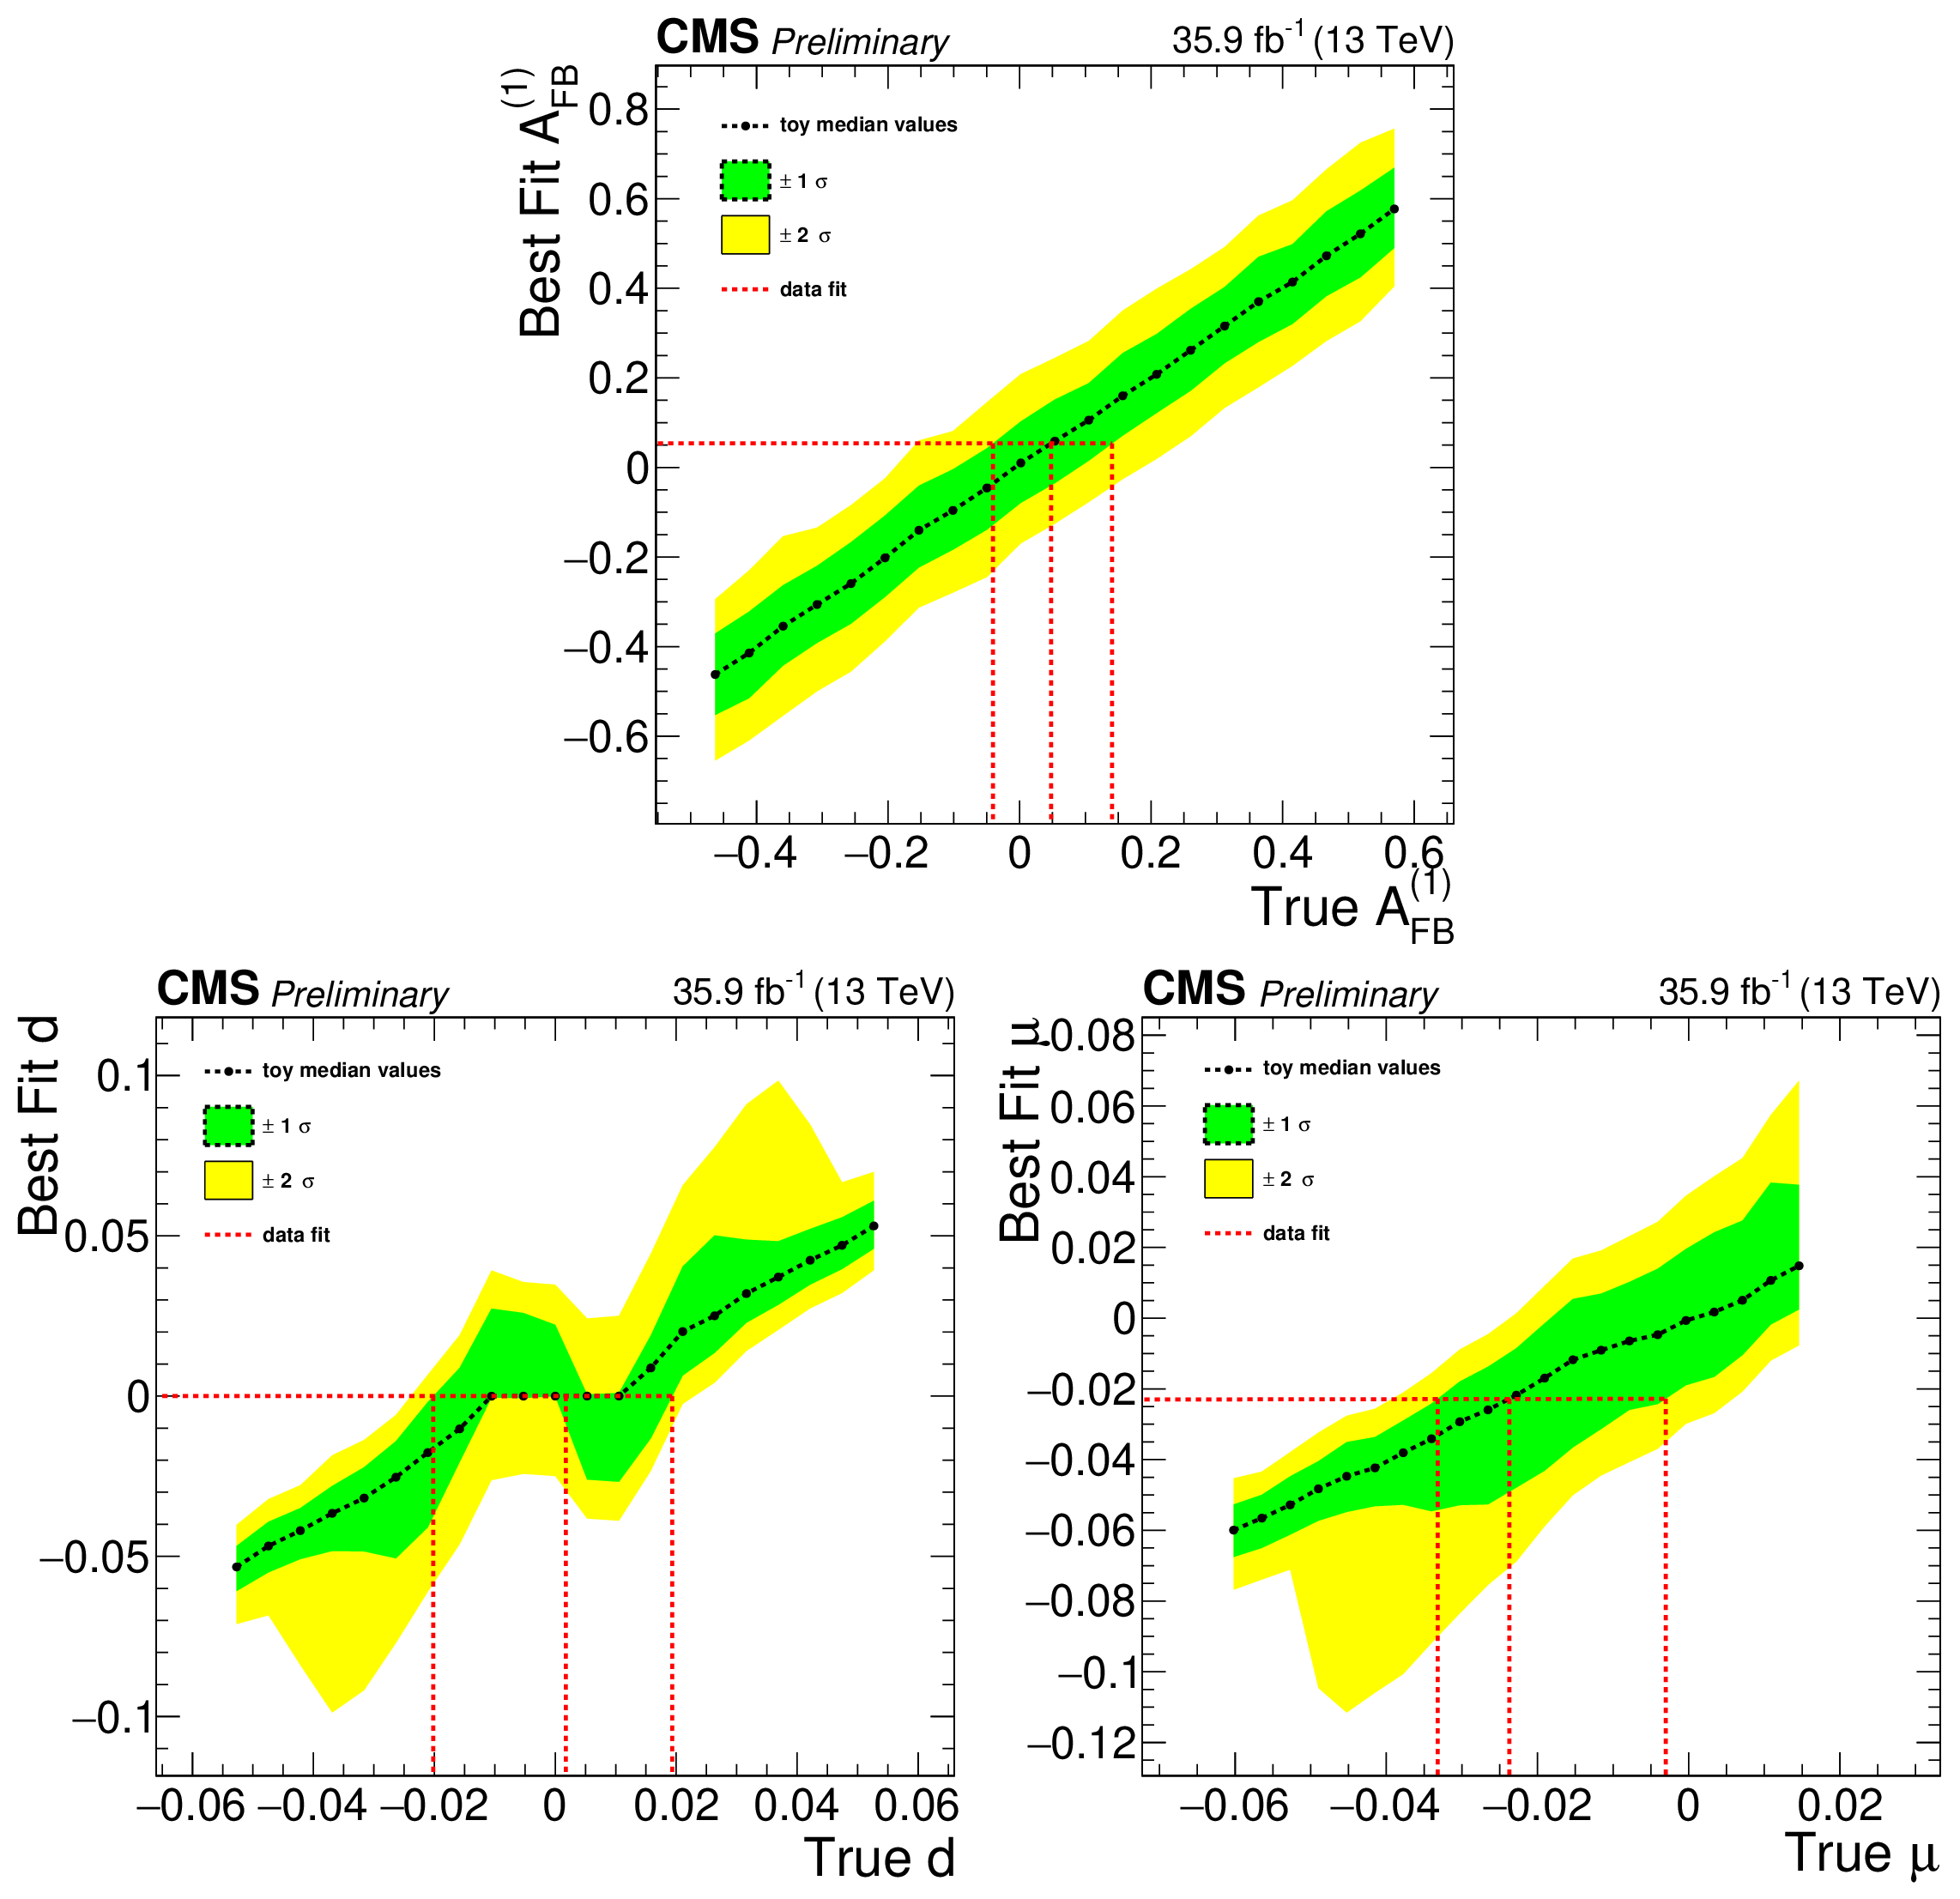
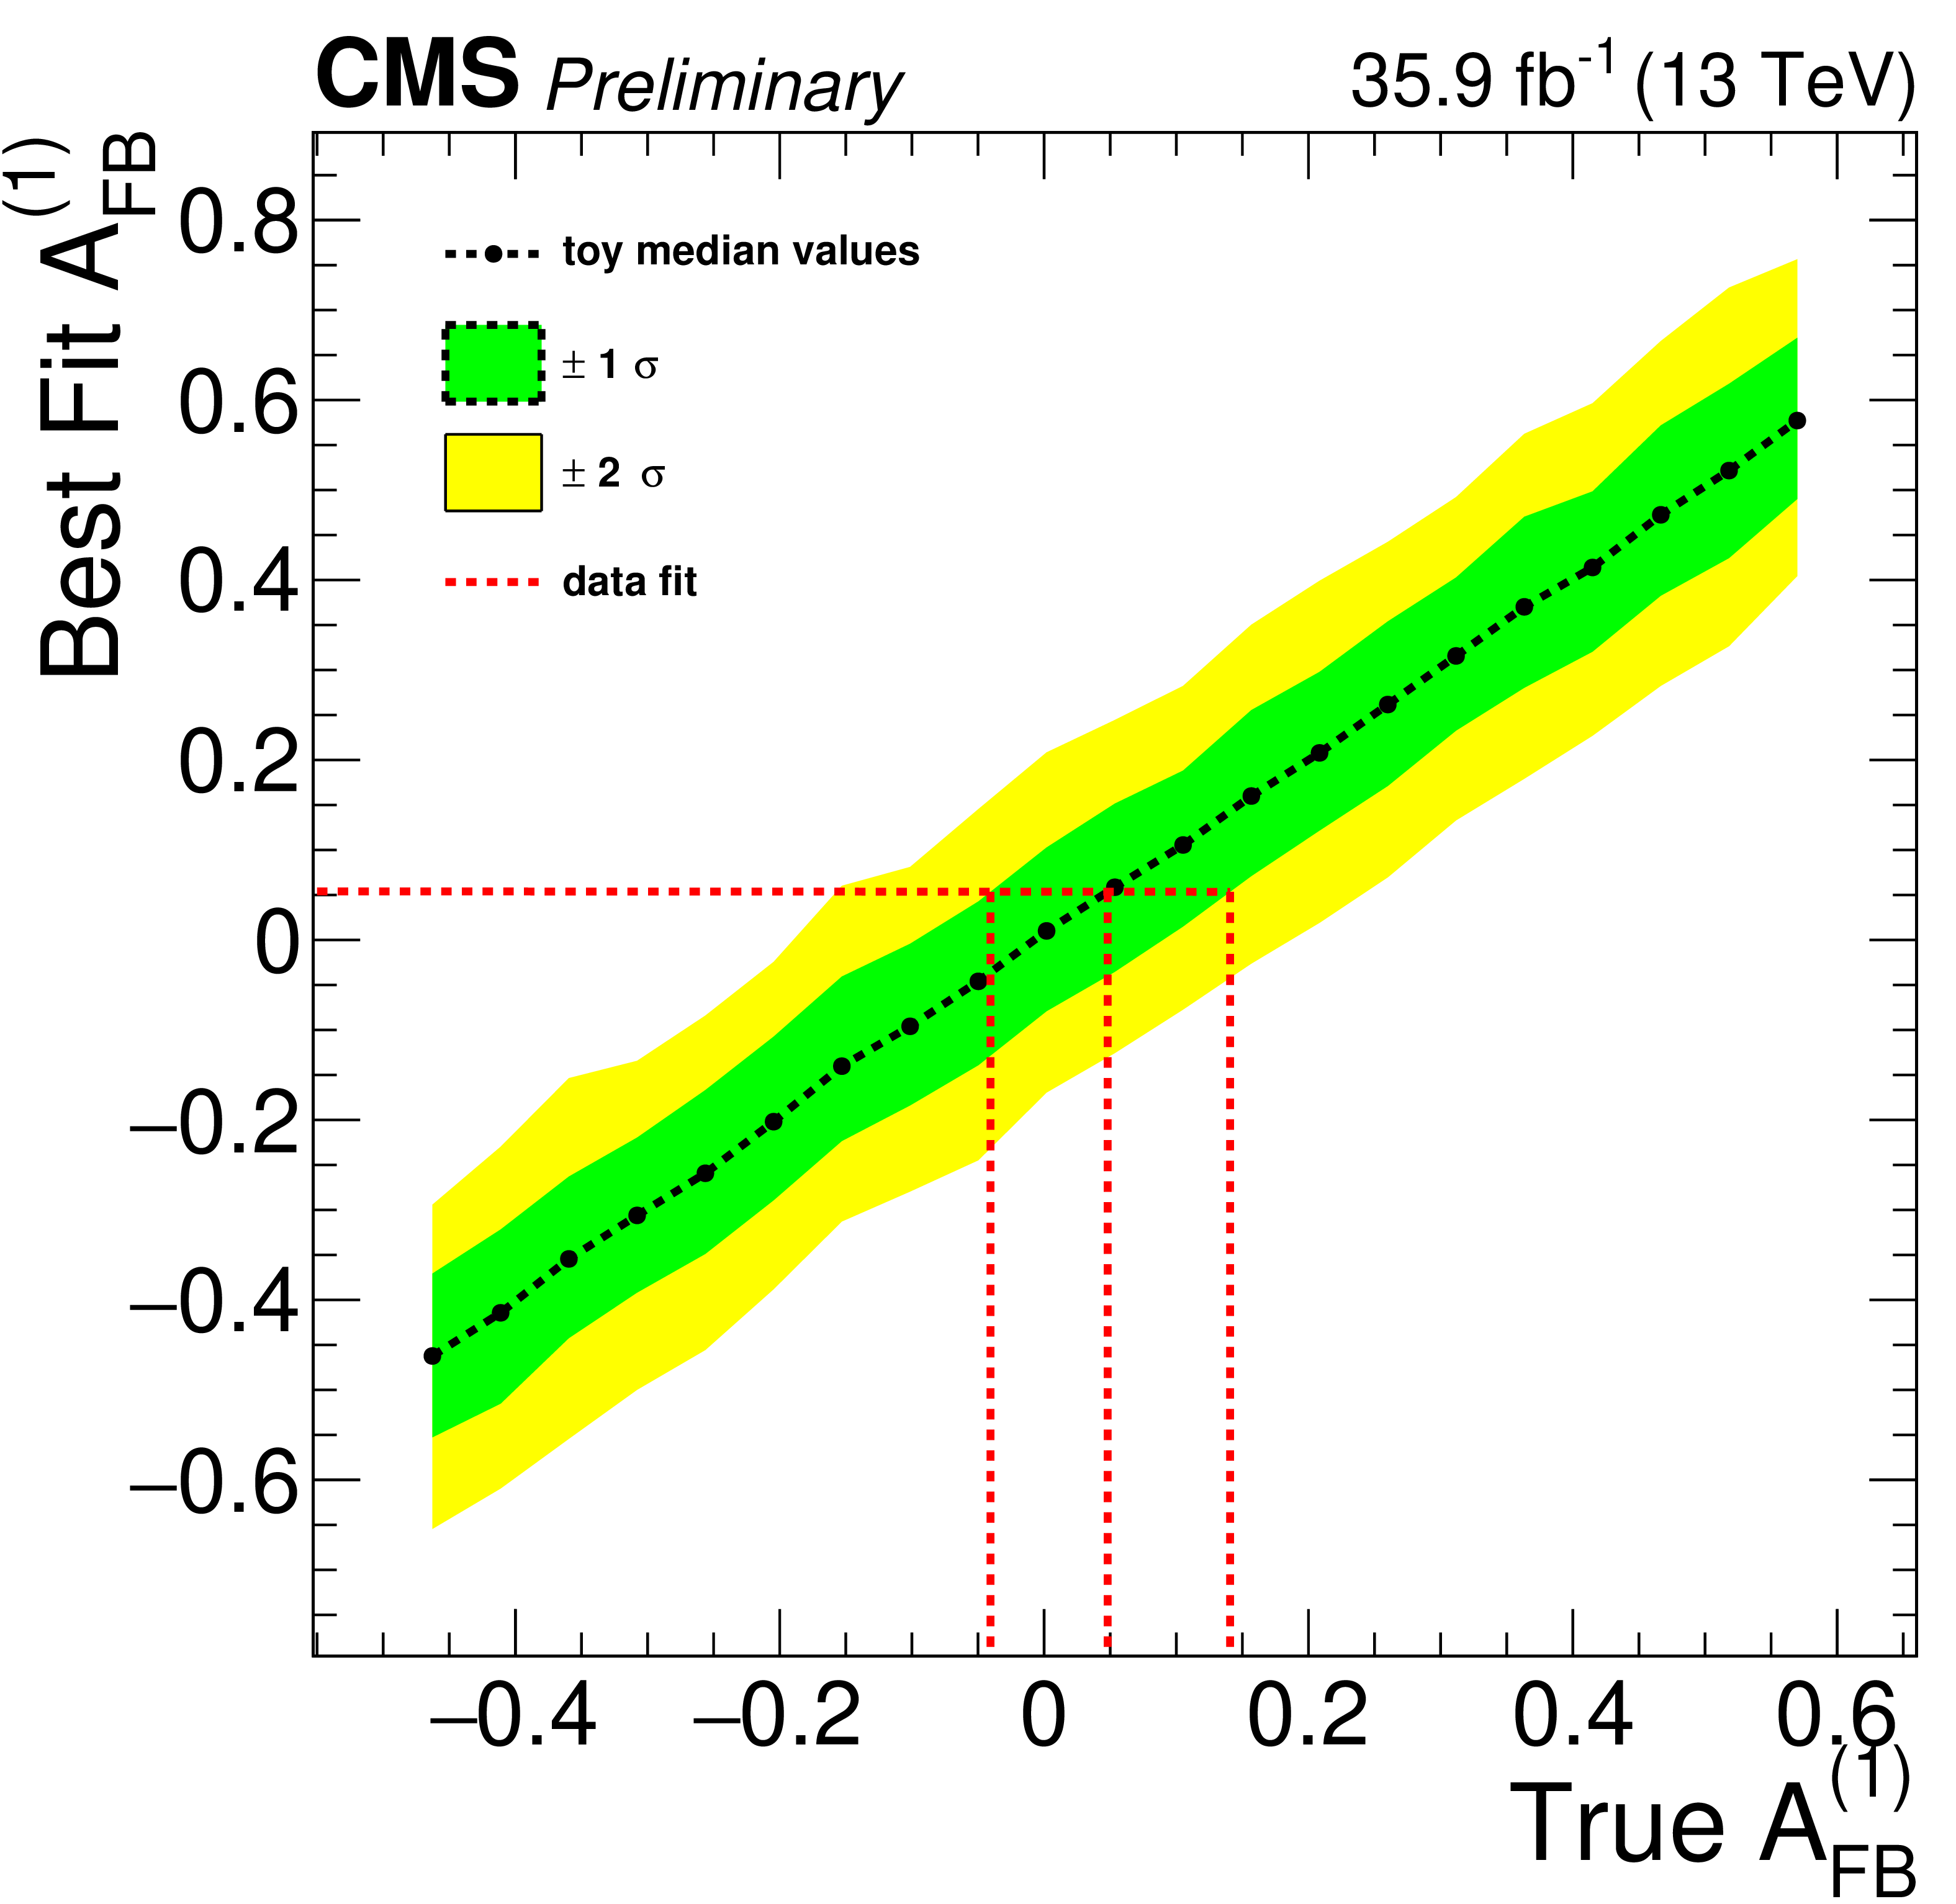
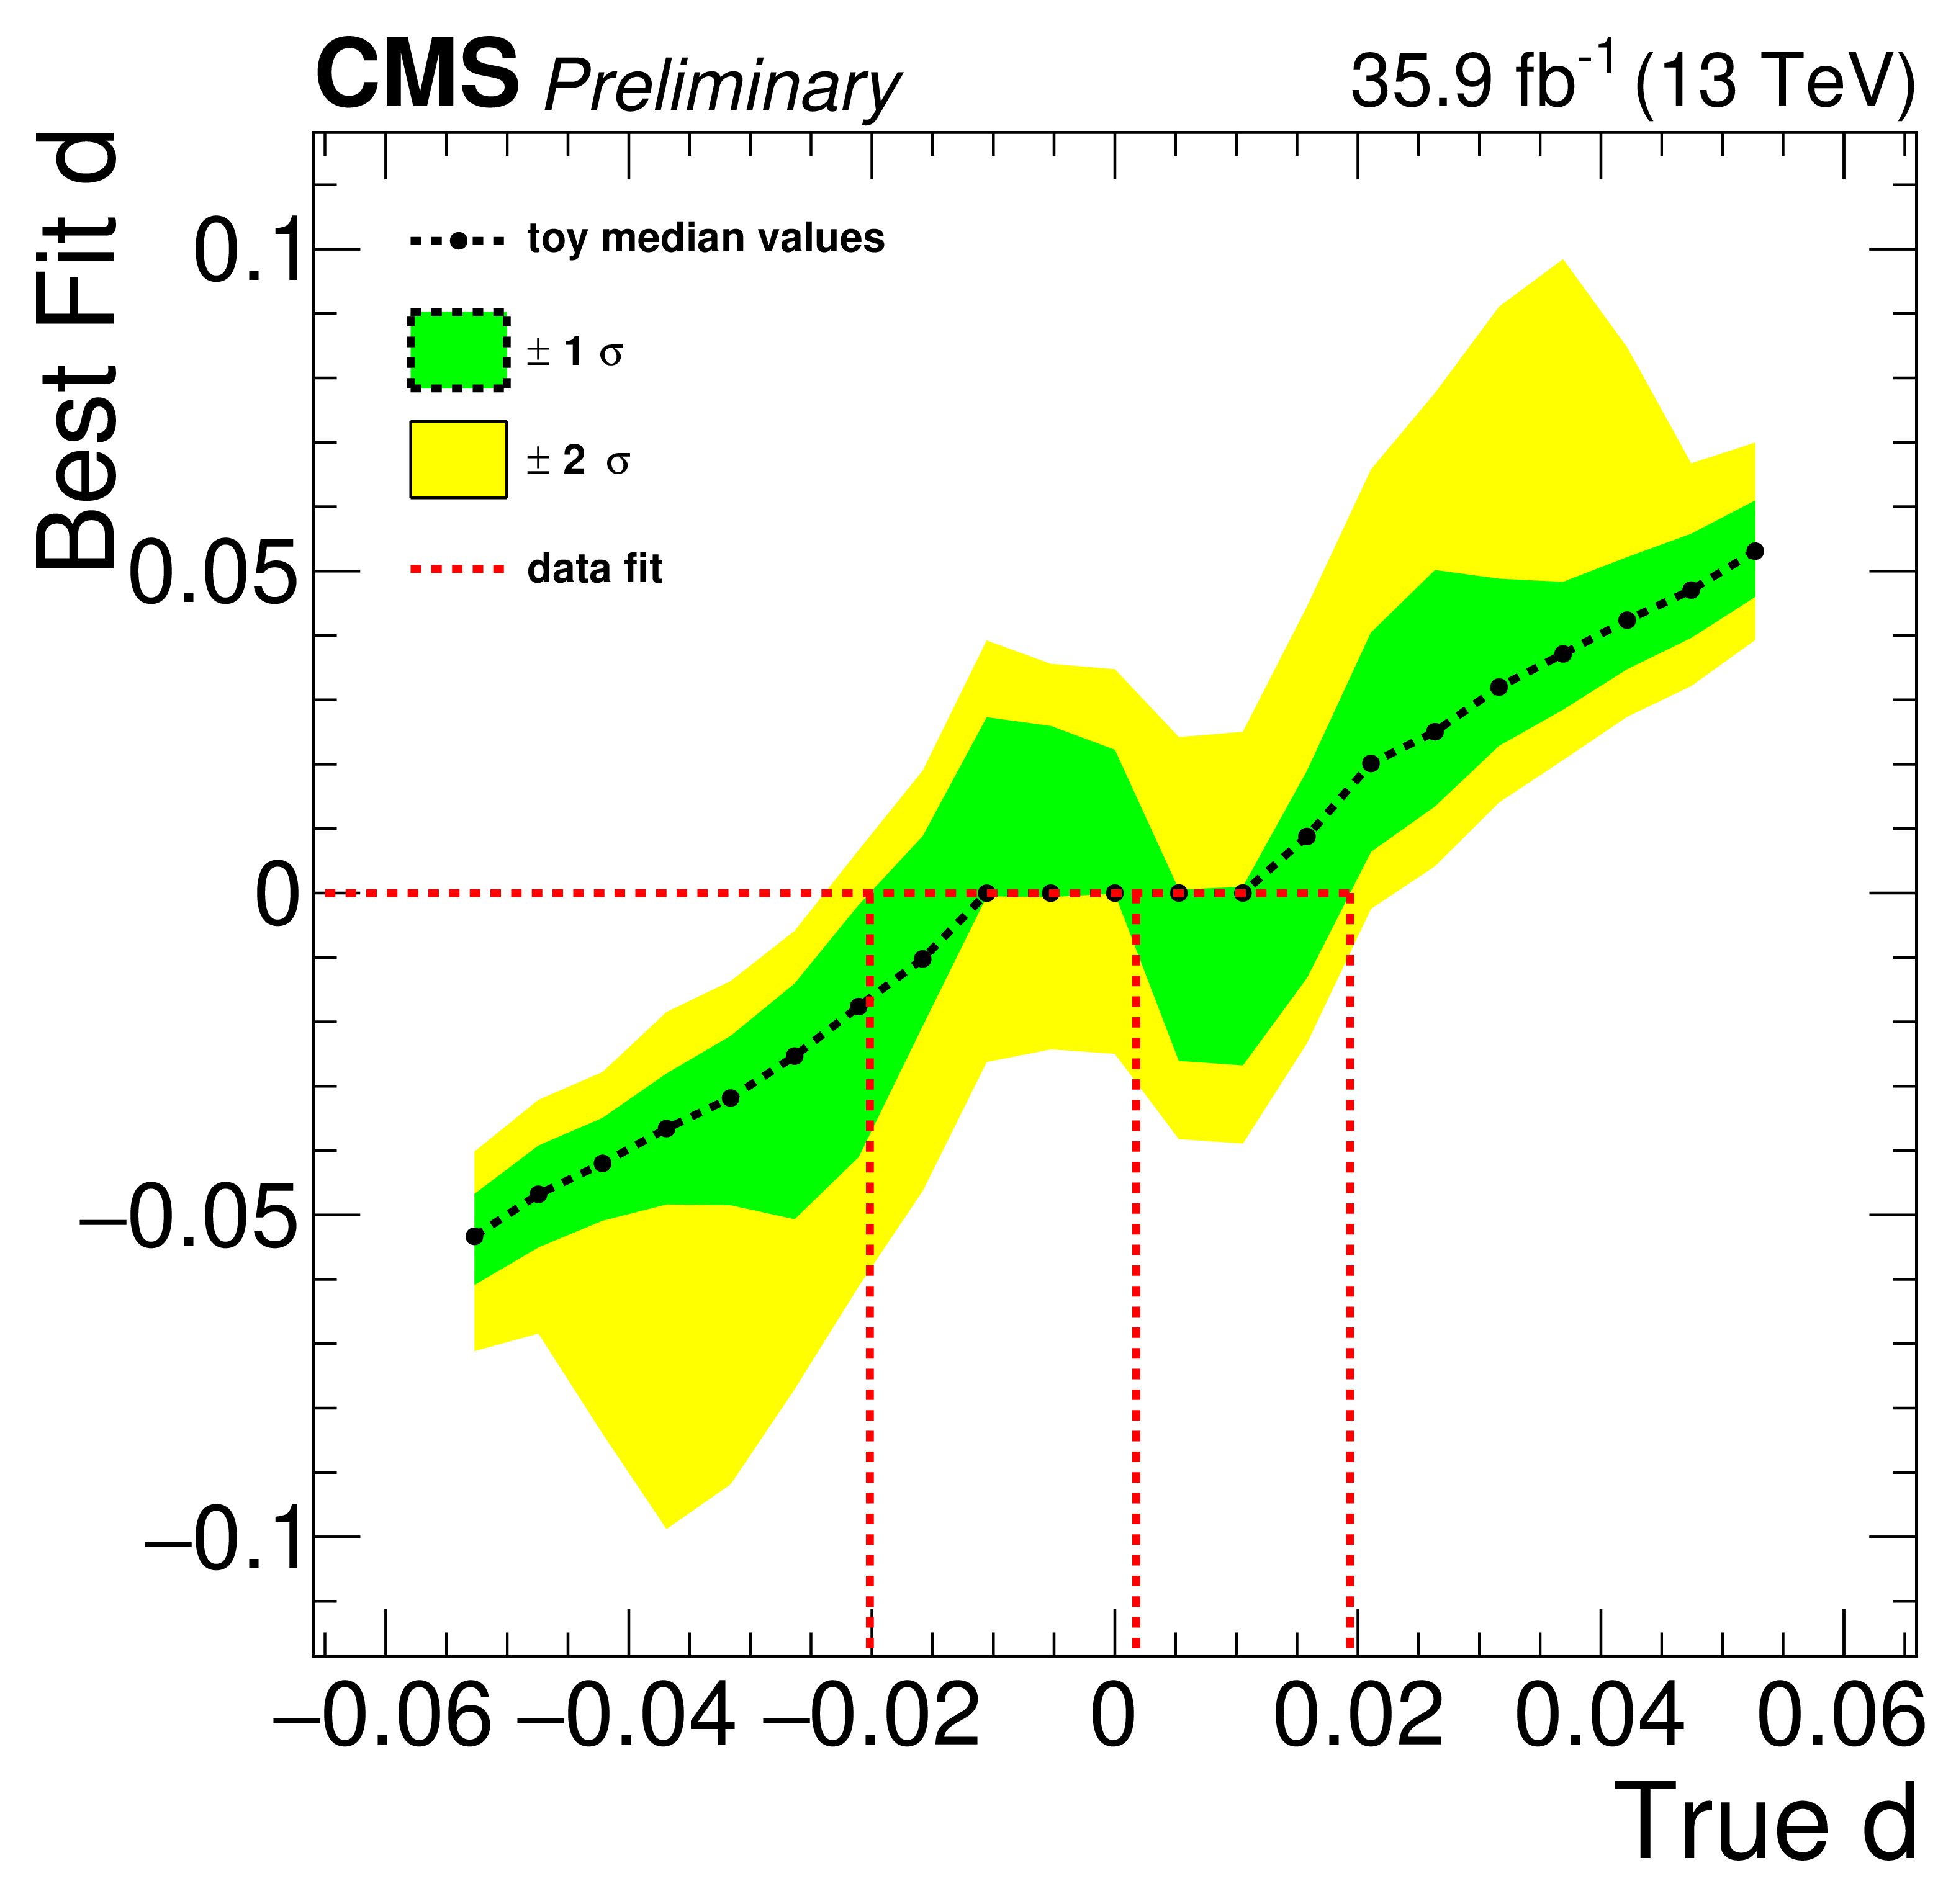
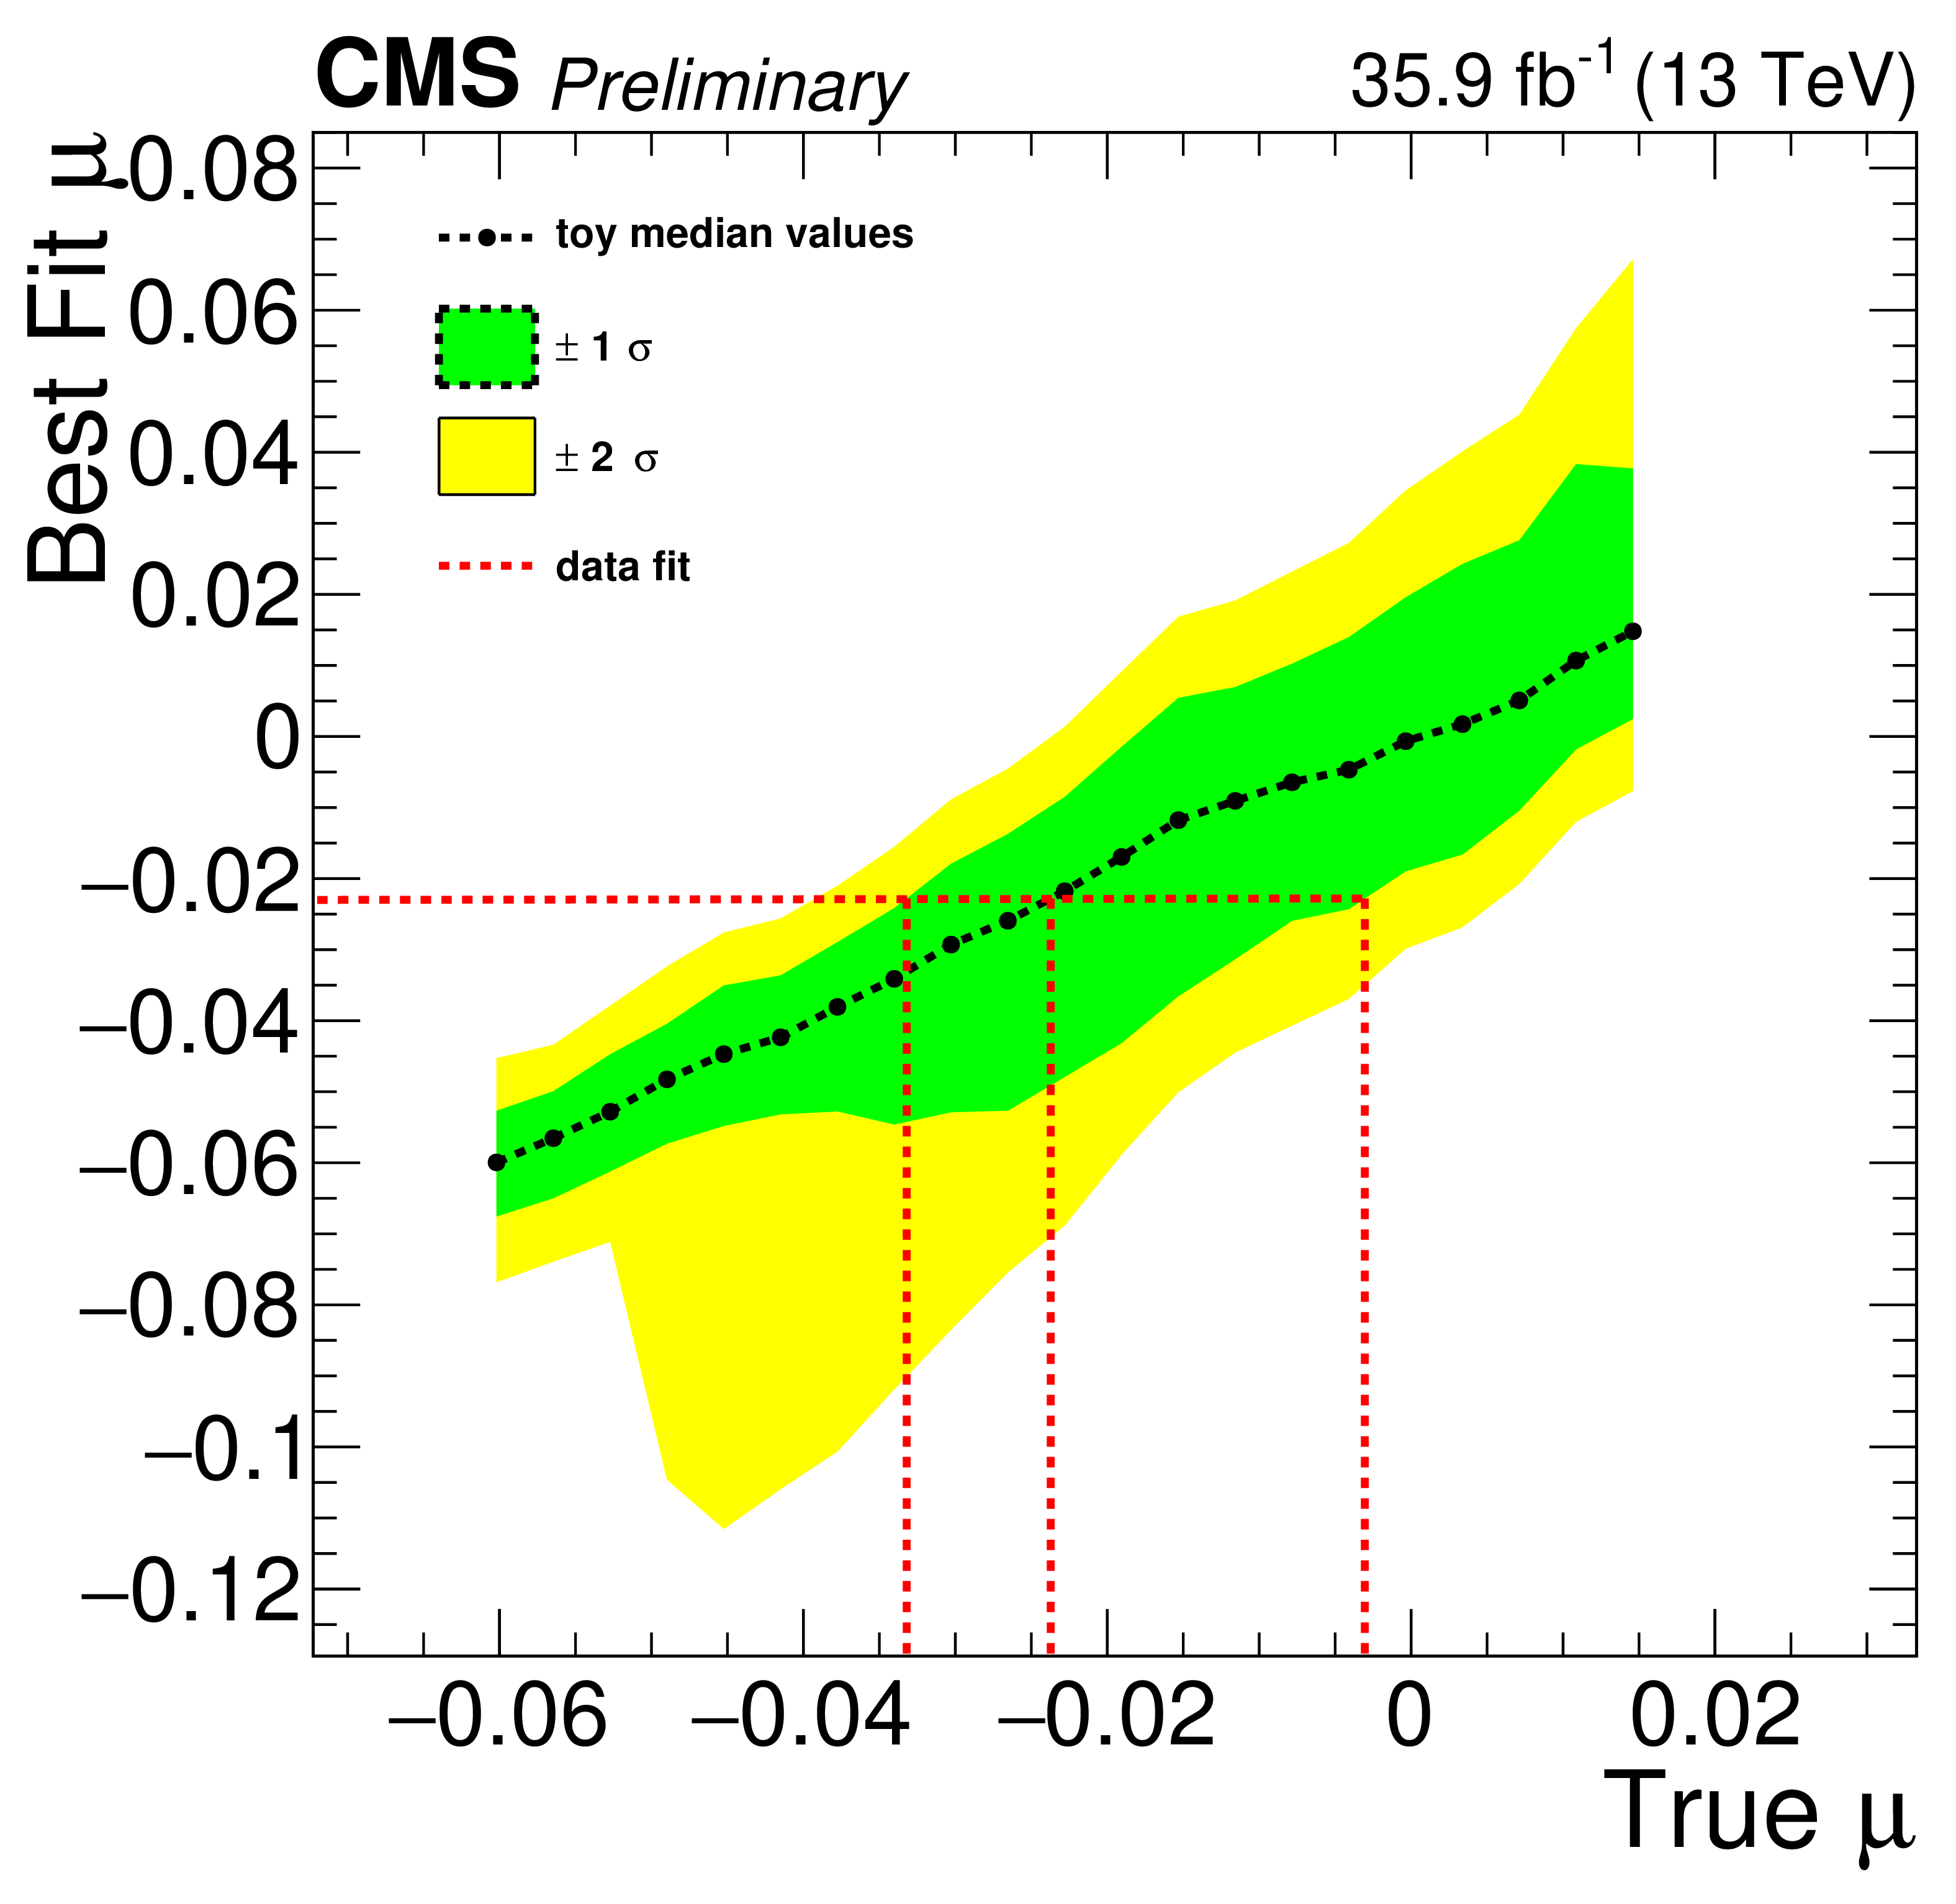
Figure 6:
Neyman constructions for the ${A^{(1)}_\mathrm {FB}}$ (top), $d$ (bottom left) and $\mu $ (bottom right) parameters of interest considering groups of 1,000 toys generated with systematic uncertainty nuisance parameters floating. The horizontal red lines indicate the values of the parameters determined by the fits and the vertical red lines indicate where these values intersect with the central value and uncertainty curves from the toy groups. |
png pdf |
Figure 6-a:
Neyman construction for the ${A^{(1)}_\mathrm {FB}}$ parameter of interest considering groups of 1,000 toys generated with systematic uncertainty nuisance parameters floating. The horizontal red line indicates the value of the parameter determined by the fit and the vertical red lines indicate where this value intersects with the central value and uncertainty curves from the toy groups. |
png pdf |
Figure 6-b:
Neyman construction for the $d$ parameter of interest considering groups of 1,000 toys generated with systematic uncertainty nuisance parameters floating. The horizontal red line indicates the value of the parameter determined by the fit and the vertical red lines indicate where this value intersects with the central value and uncertainty curves from the toy groups. |
png pdf |
Figure 6-c:
Neyman construction for the $\mu $ parameter of interest considering groups of 1,000 toys generated with systematic uncertainty nuisance parameters floating. The horizontal red line indicates the value of the parameter determined by the fit and the vertical red lines indicate where this value intersects with the central value and uncertainty curves from the toy groups. |
png pdf |
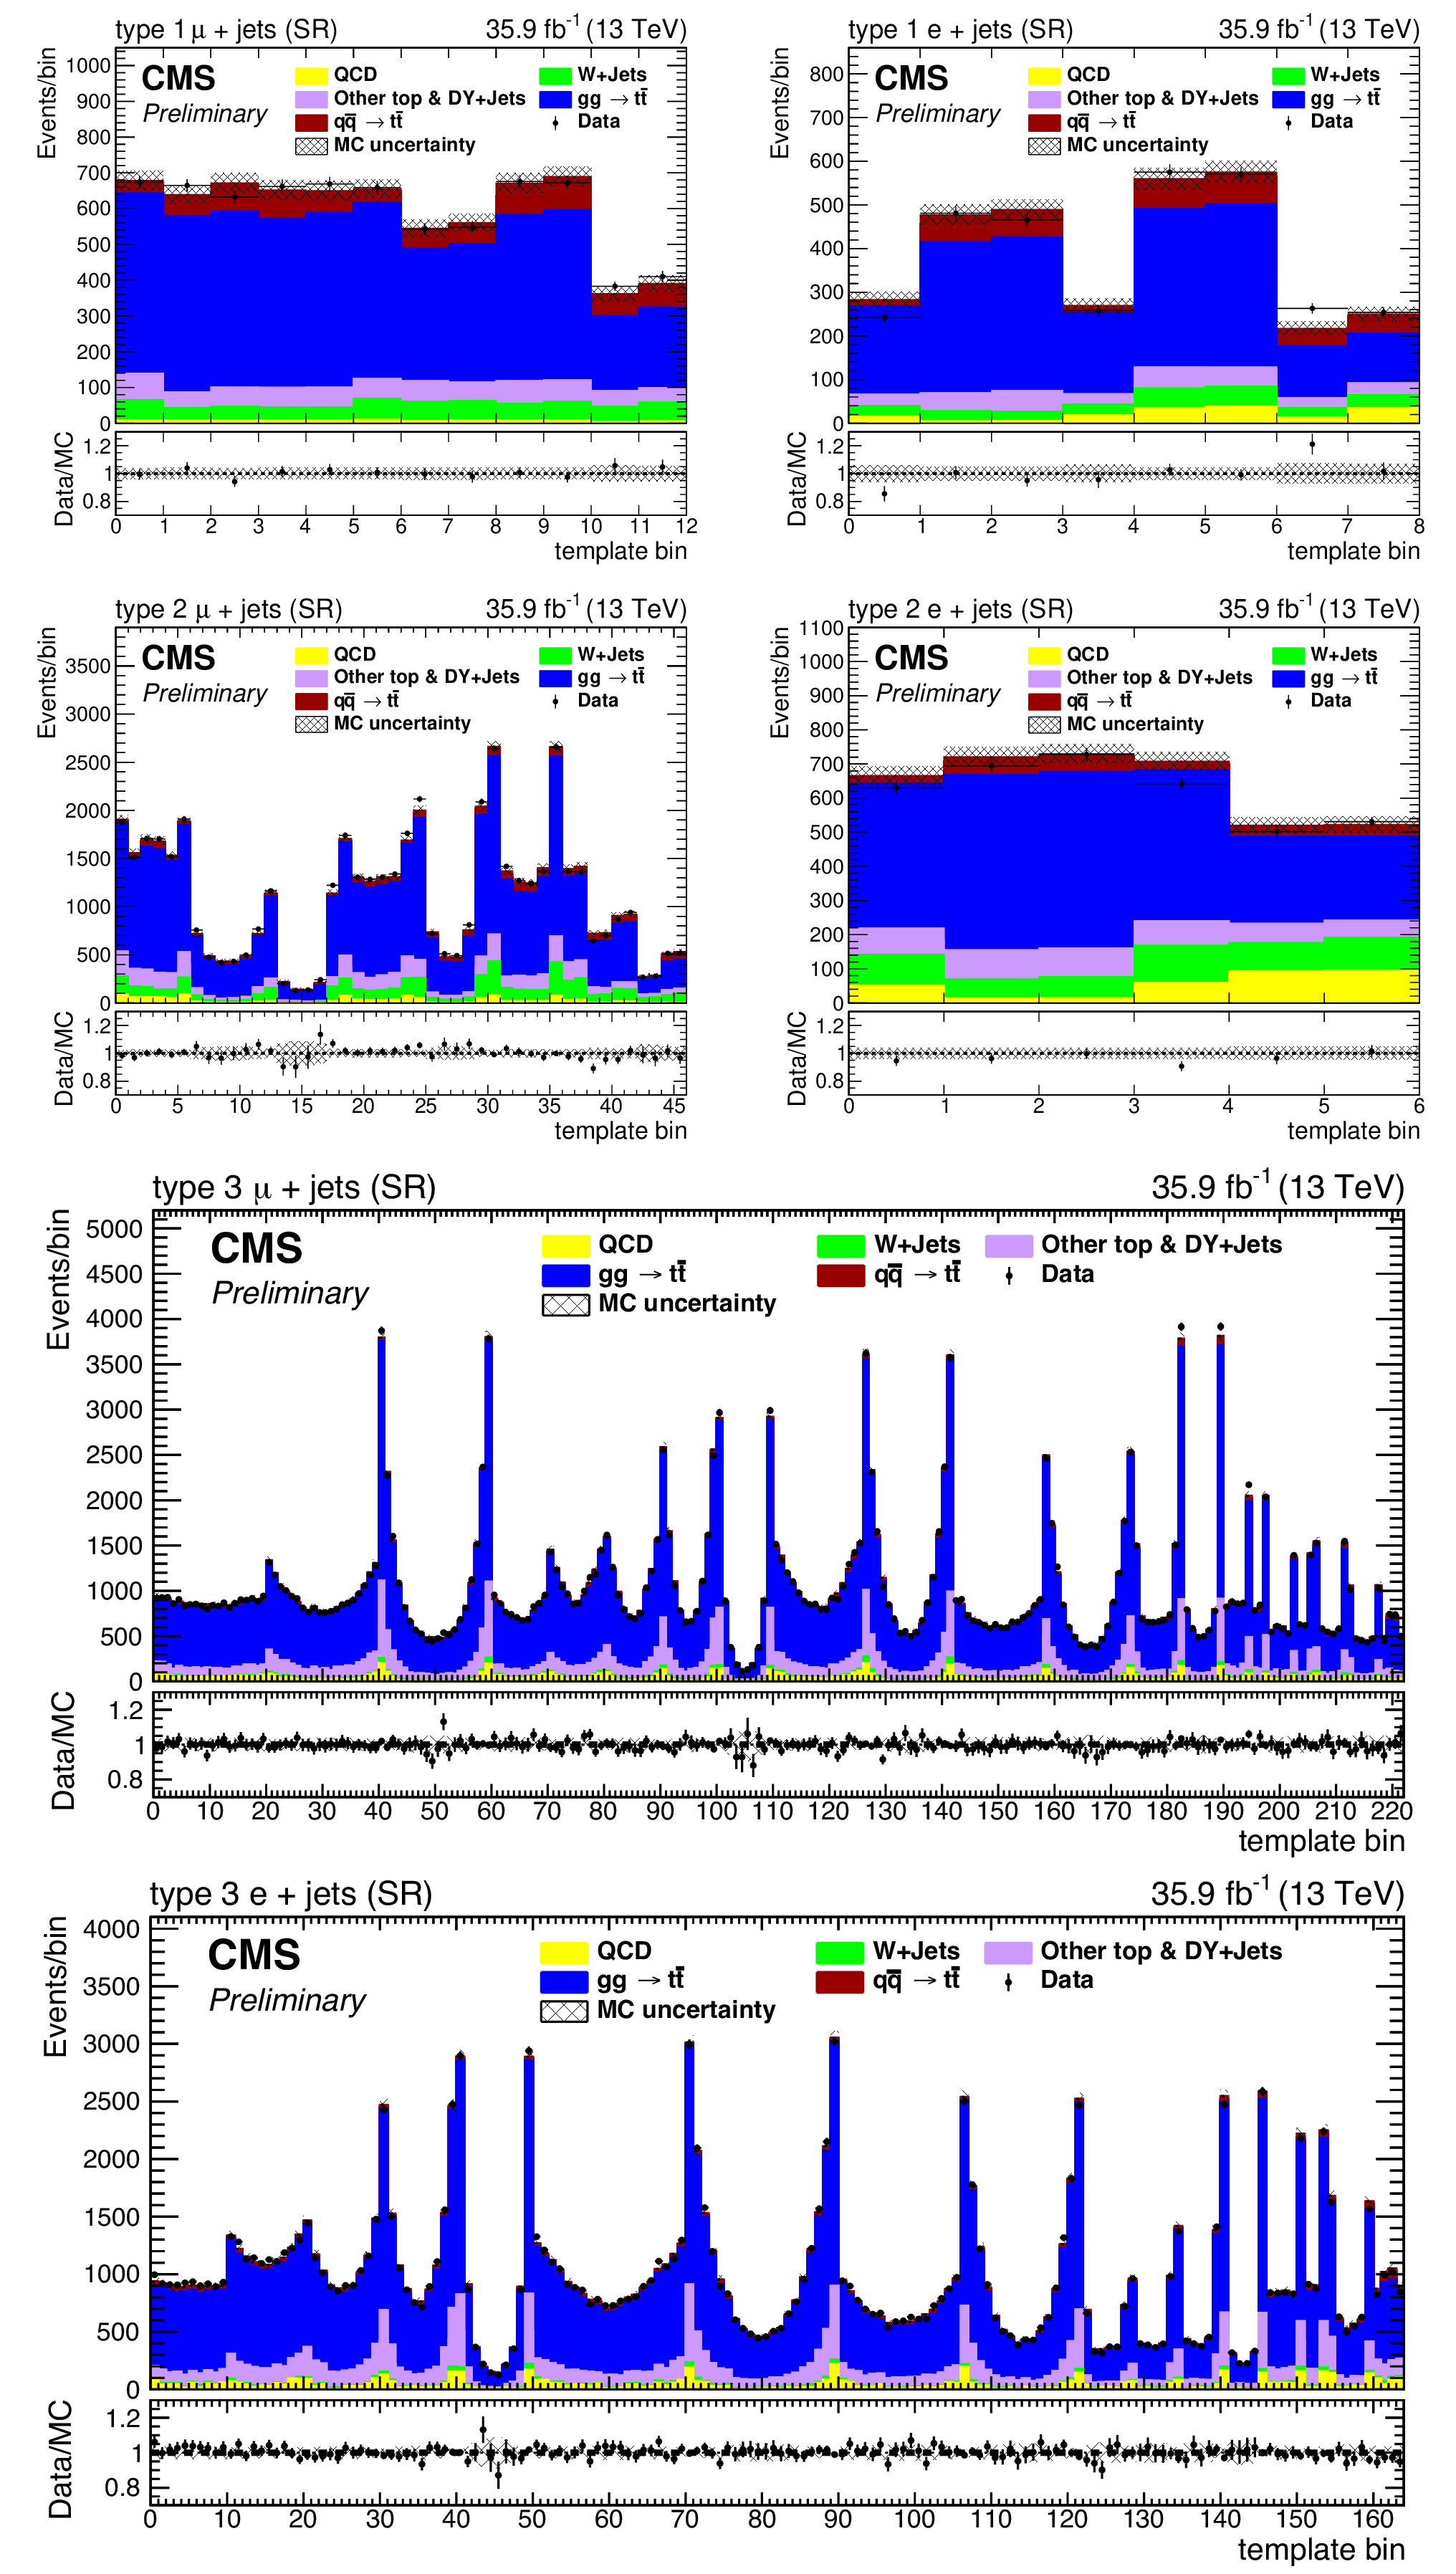
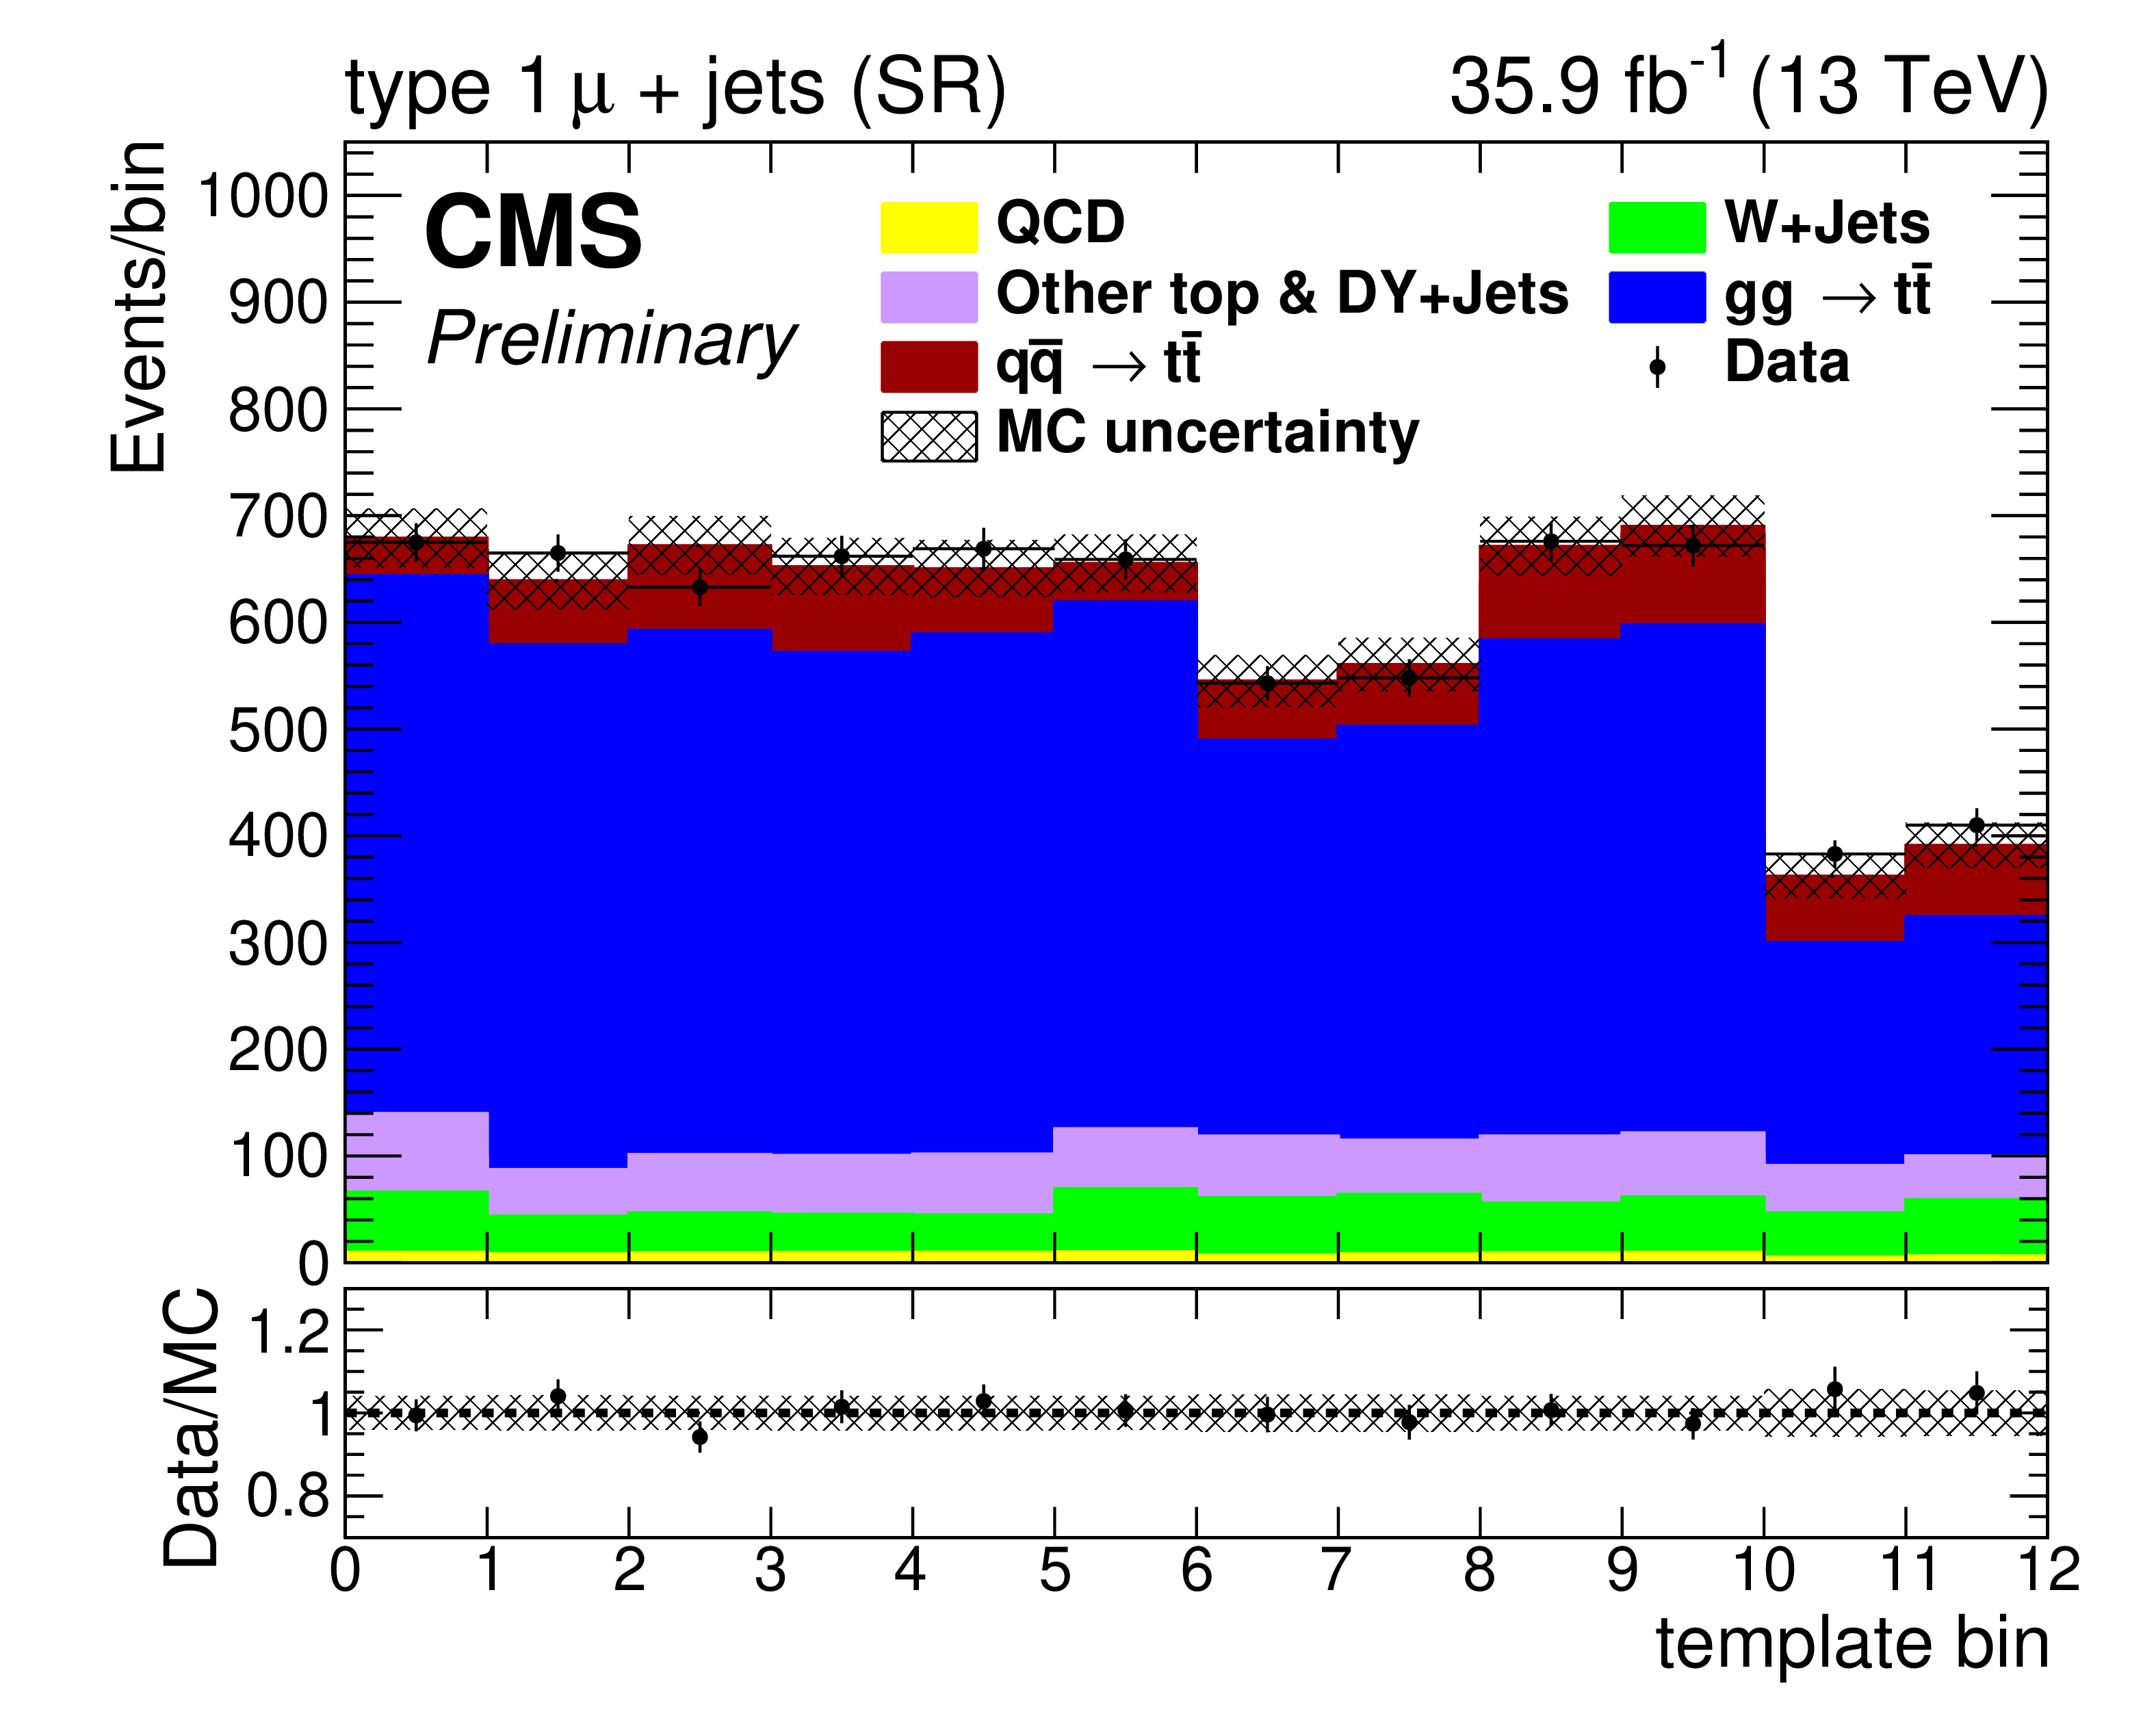
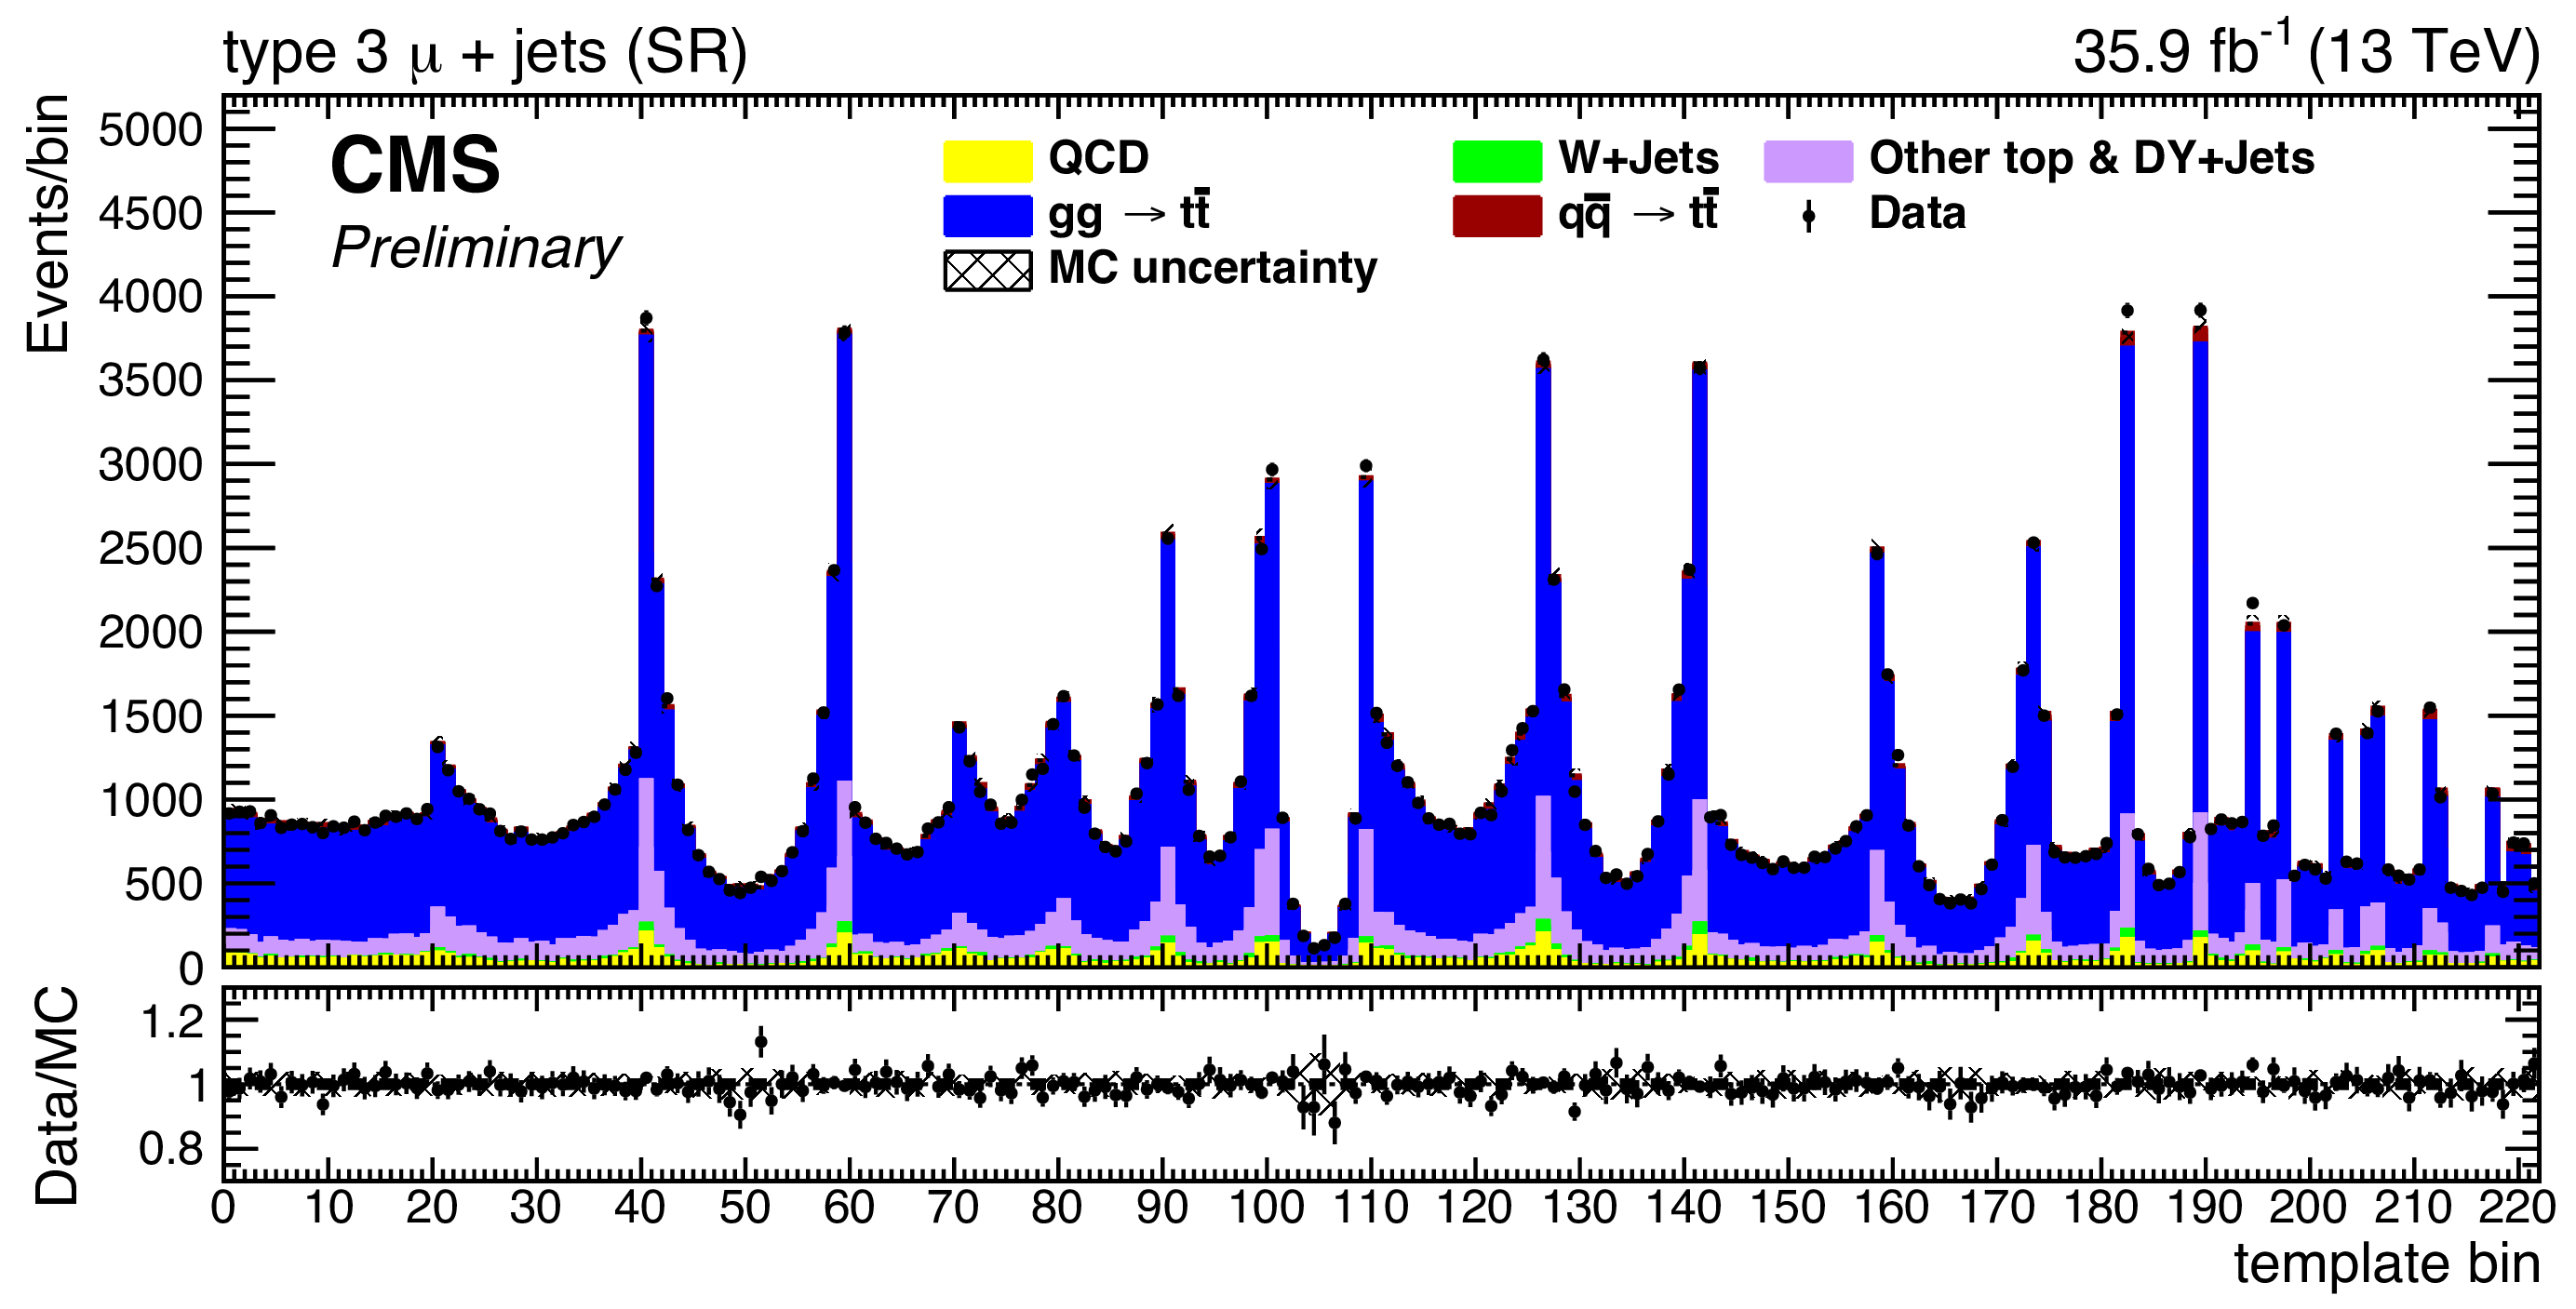
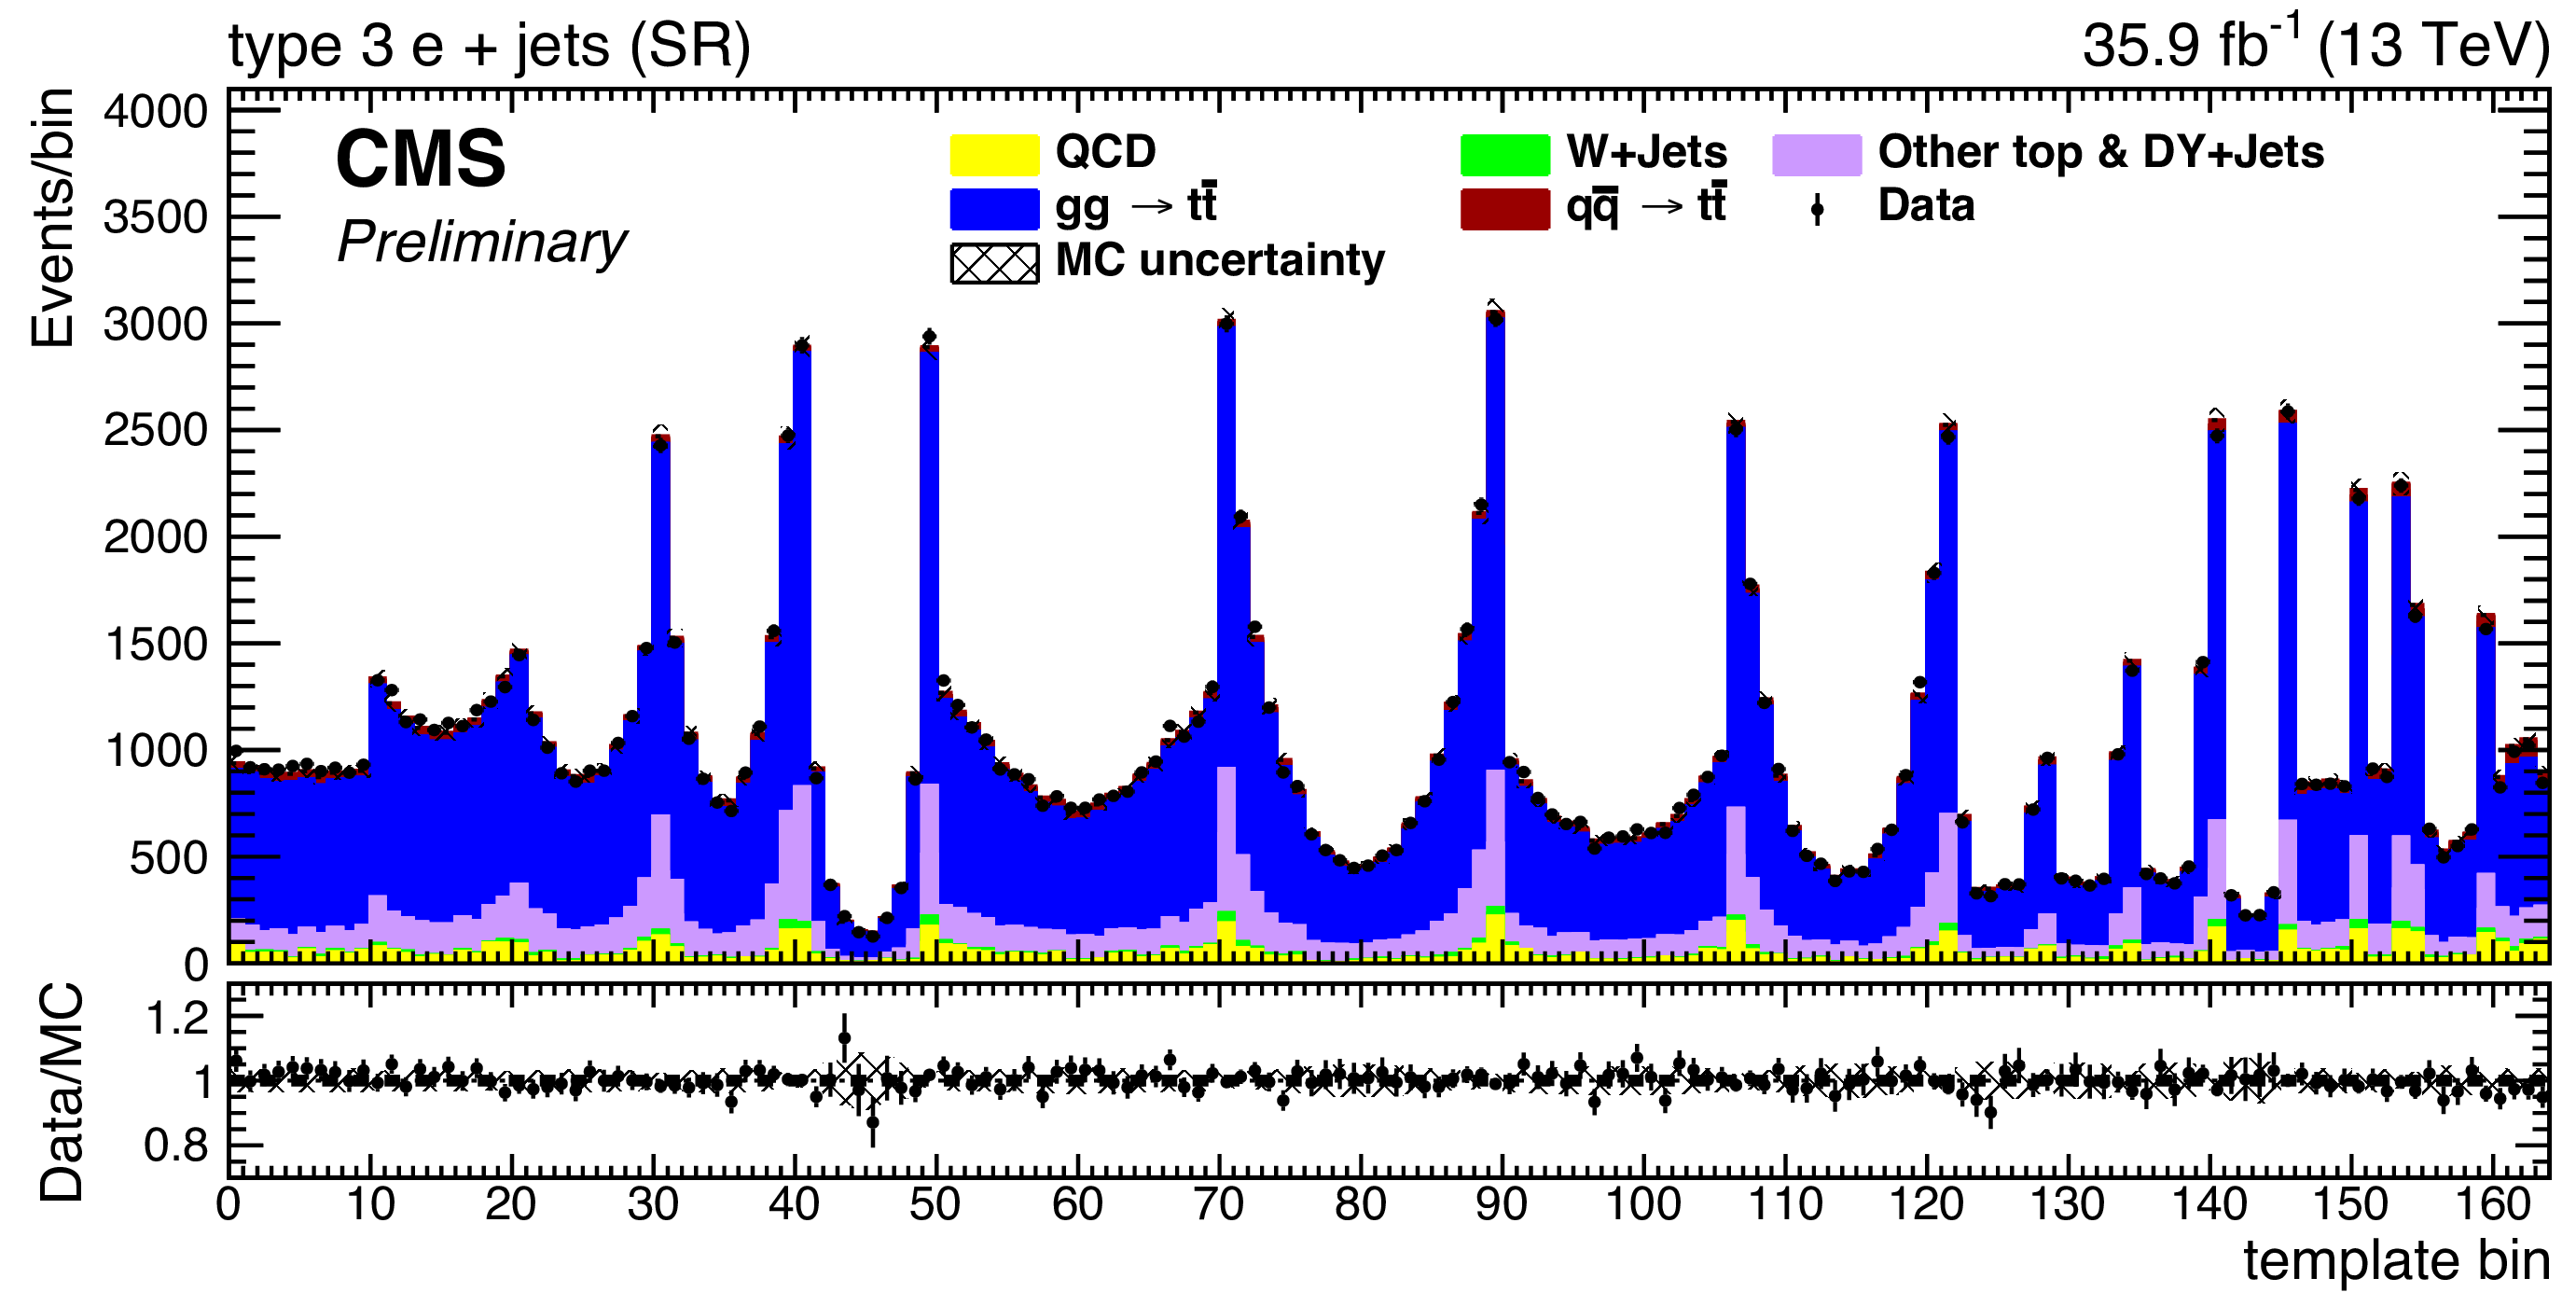
Figure 7:
Postfit data/MC comparisons as functions of template bin number for the ${A^{(1)}_\mathrm {FB}}$ parameter investigation. The top four plots show events in the type-1 (top row) and type-2 (second row) $\mu$+jets (left column) and e+jets (right column) channels, and the bottom two plots show events in the type-3 $\mu$+jets (third row) and e+jets (bottom row) channels, summed over lepton charge in all cases. |
png pdf |
Figure 7-a:
Postfit data/MC comparison as functions of template bin number for the ${A^{(1)}_\mathrm {FB}}$ parameter investigation for events in the type-1 $\mu$+jets channel, summed over lepton charge. |
png pdf |
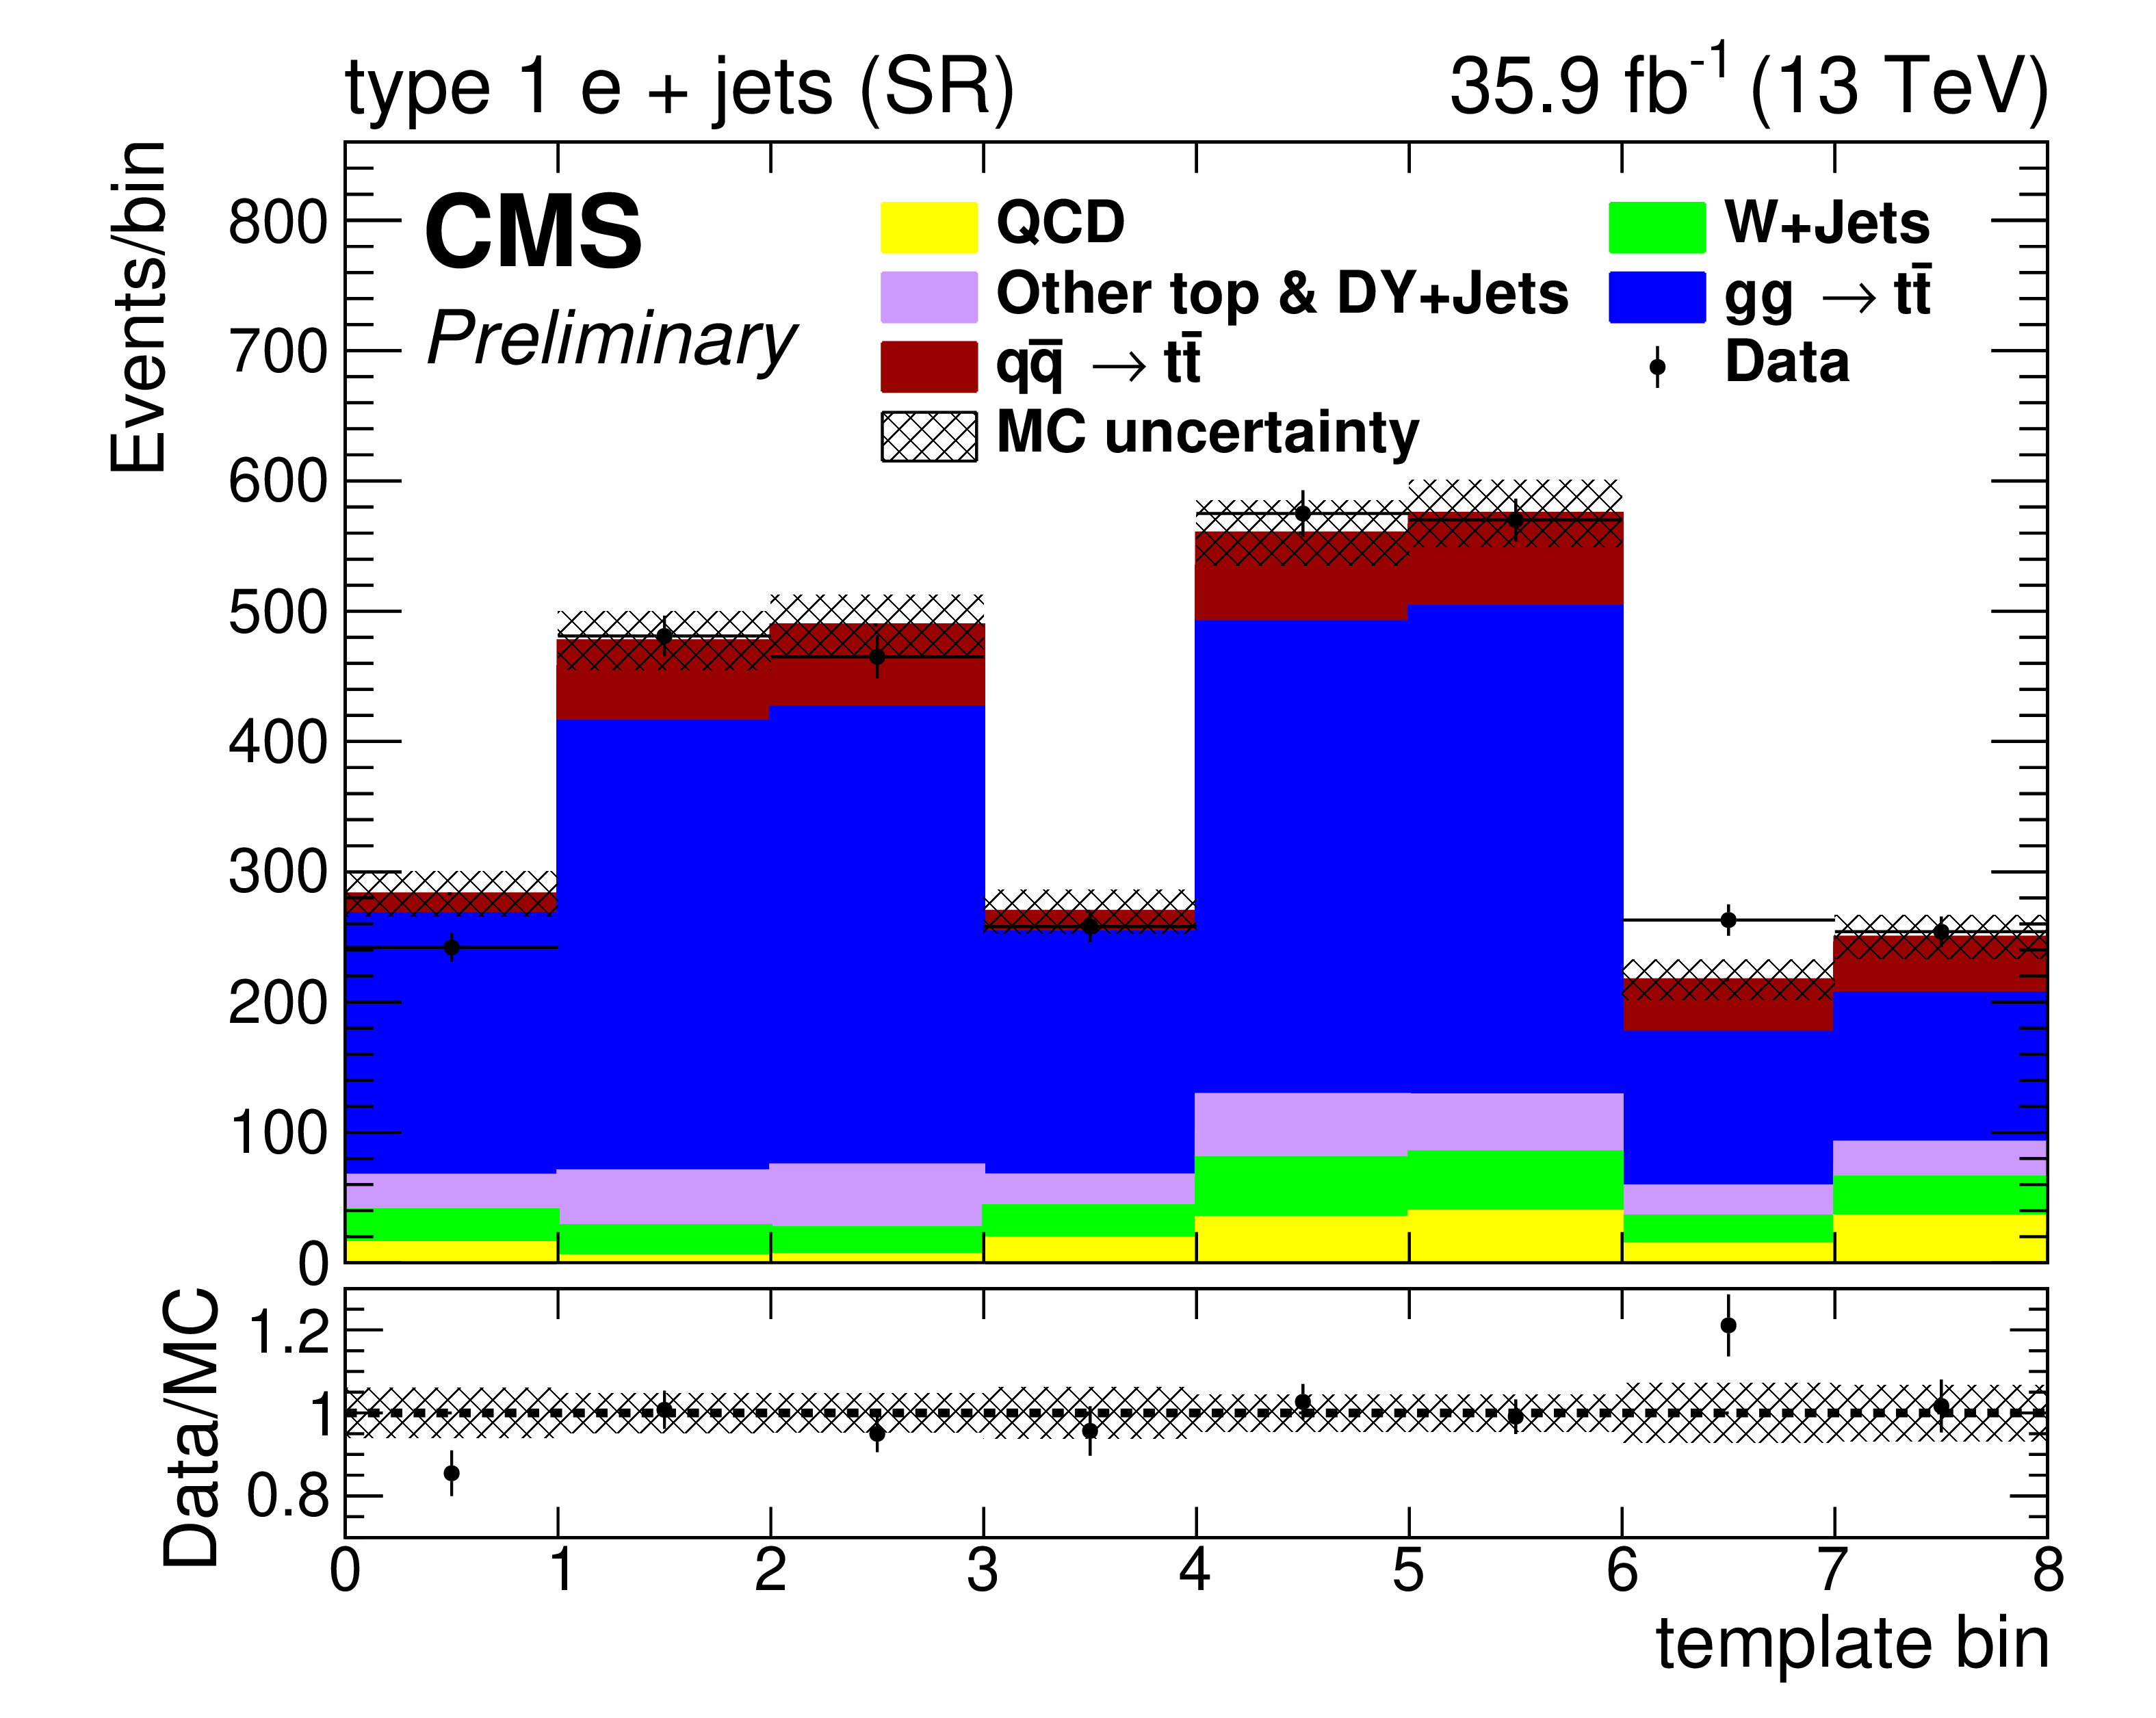
Figure 7-b:
Postfit data/MC comparison as functions of template bin number for the ${A^{(1)}_\mathrm {FB}}$ parameter investigation for events in the type-1 e+jets channel, summed over lepton charge. |
png pdf |
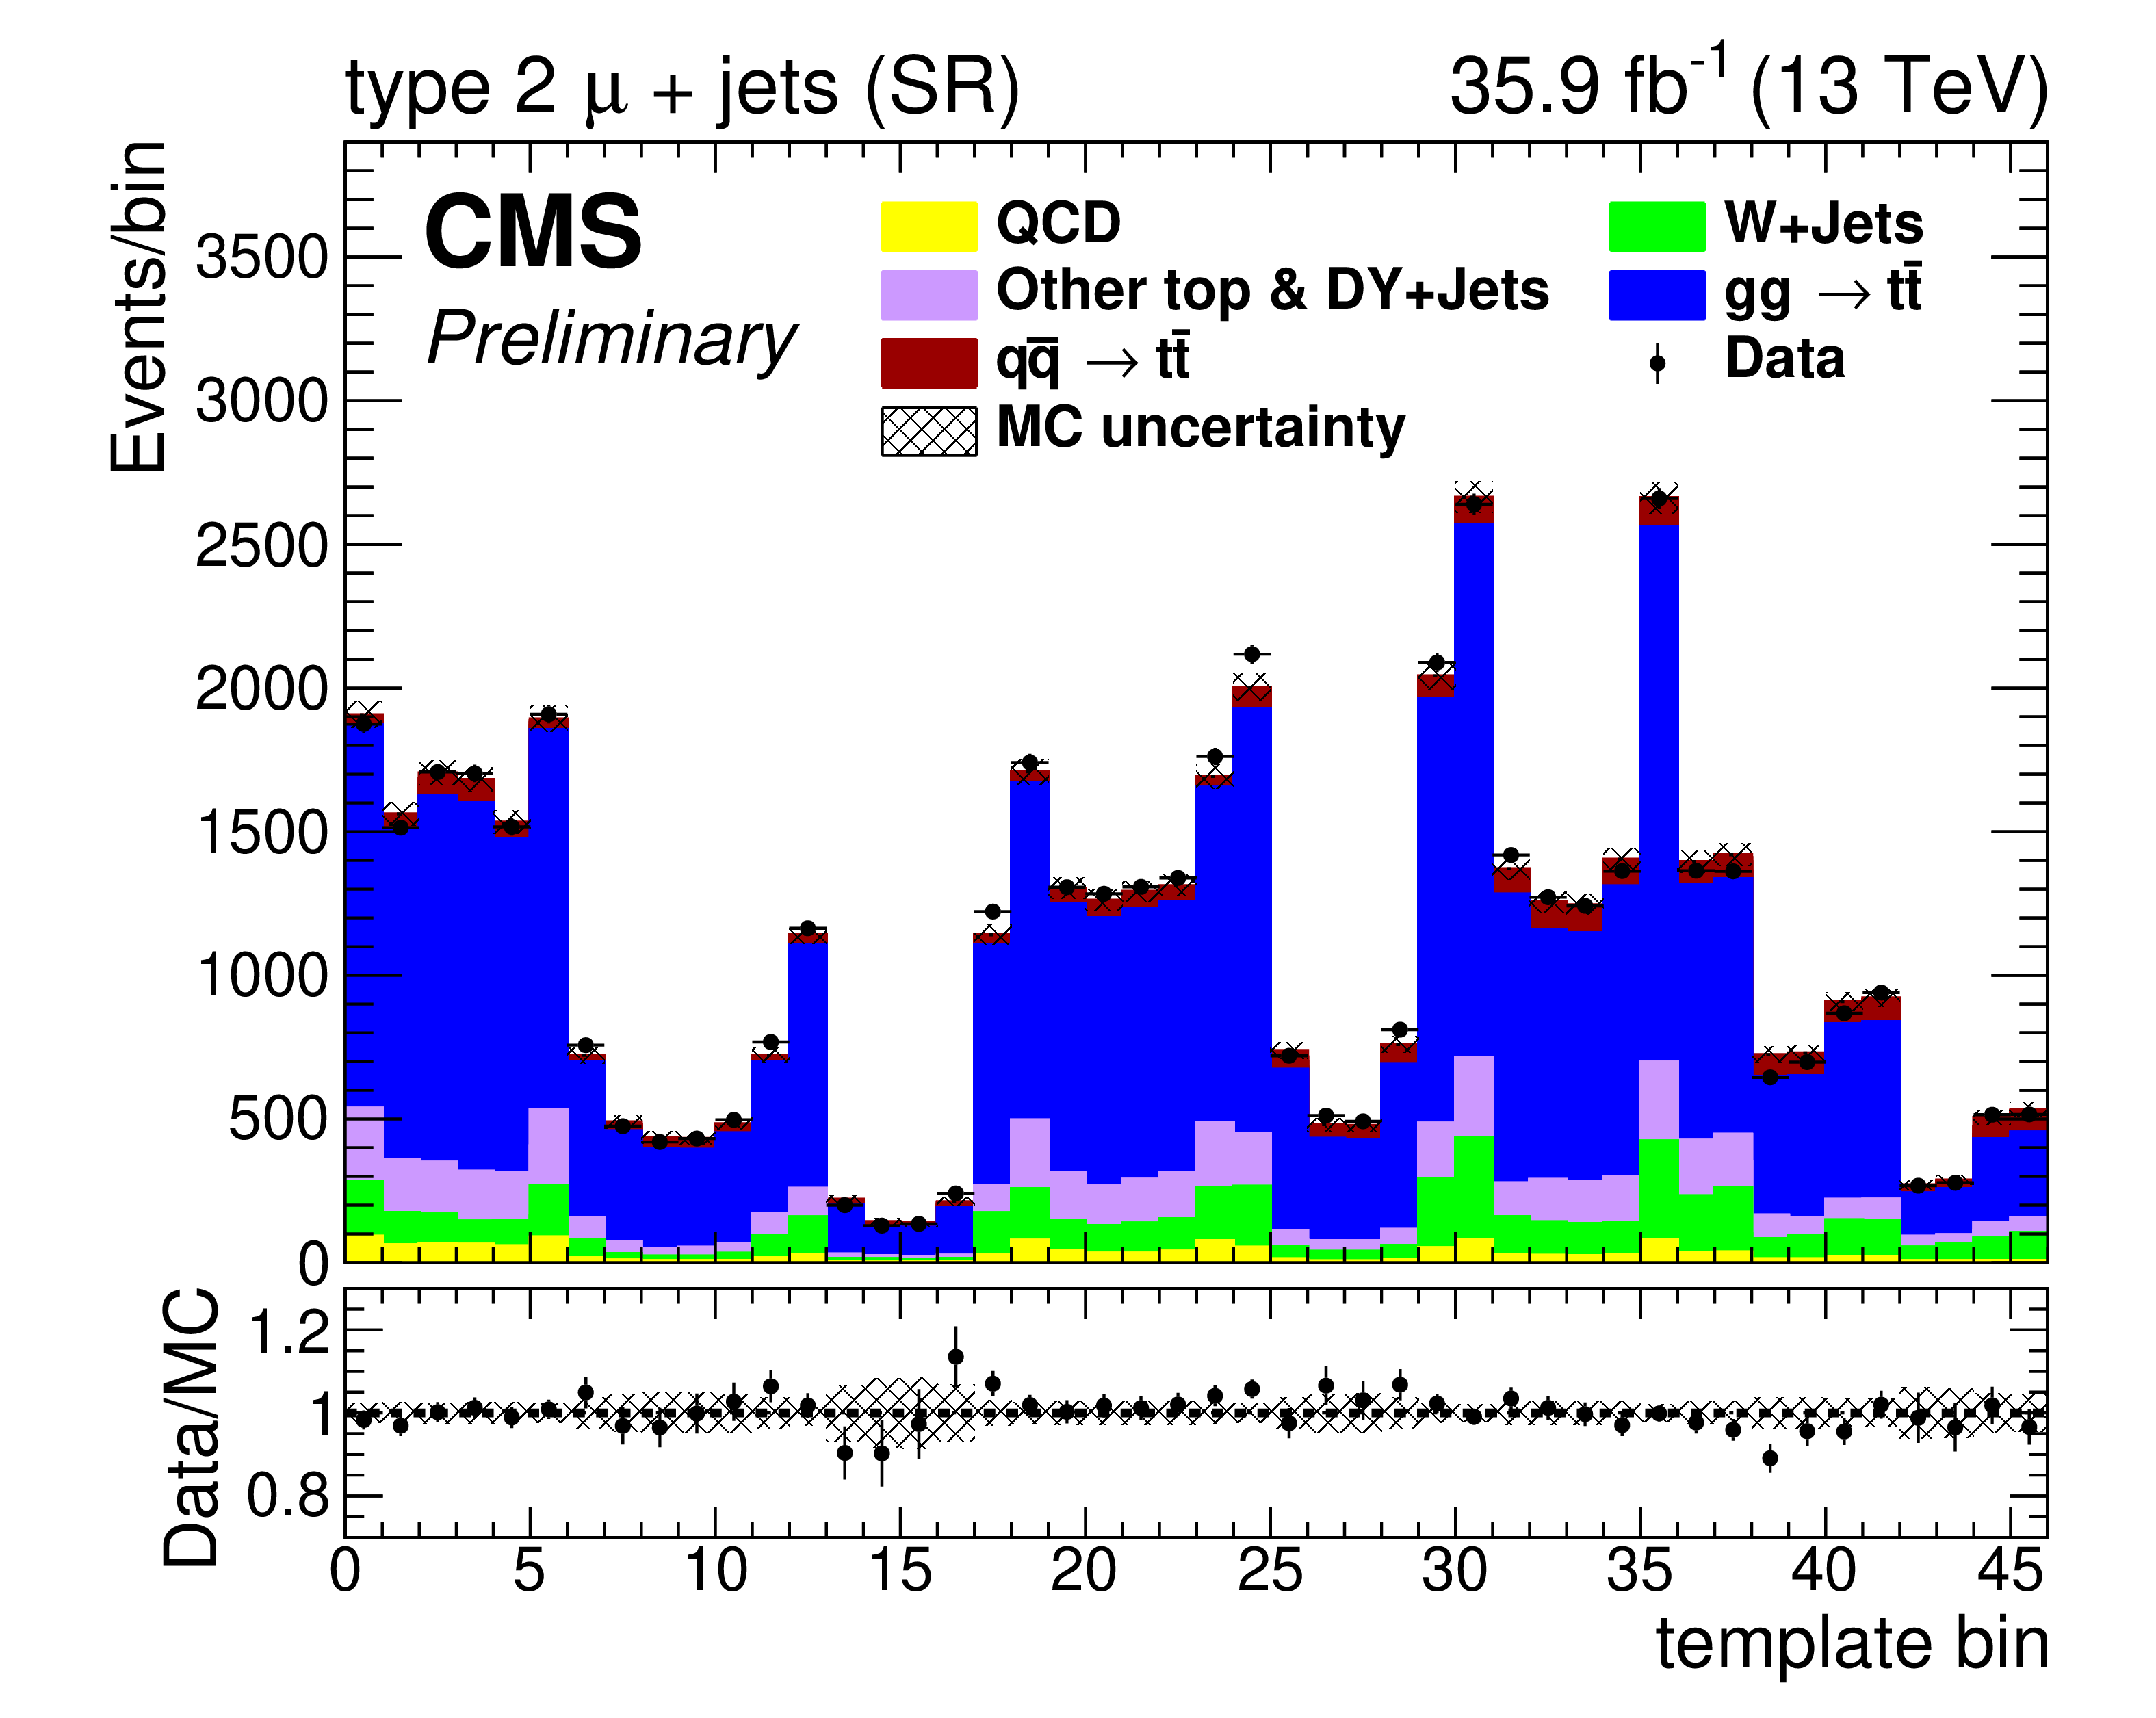
Figure 7-c:
Postfit data/MC comparison as functions of template bin number for the ${A^{(1)}_\mathrm {FB}}$ parameter investigation for events in the type-2 $\mu$+jets channel, summed over lepton charge. |
png pdf |
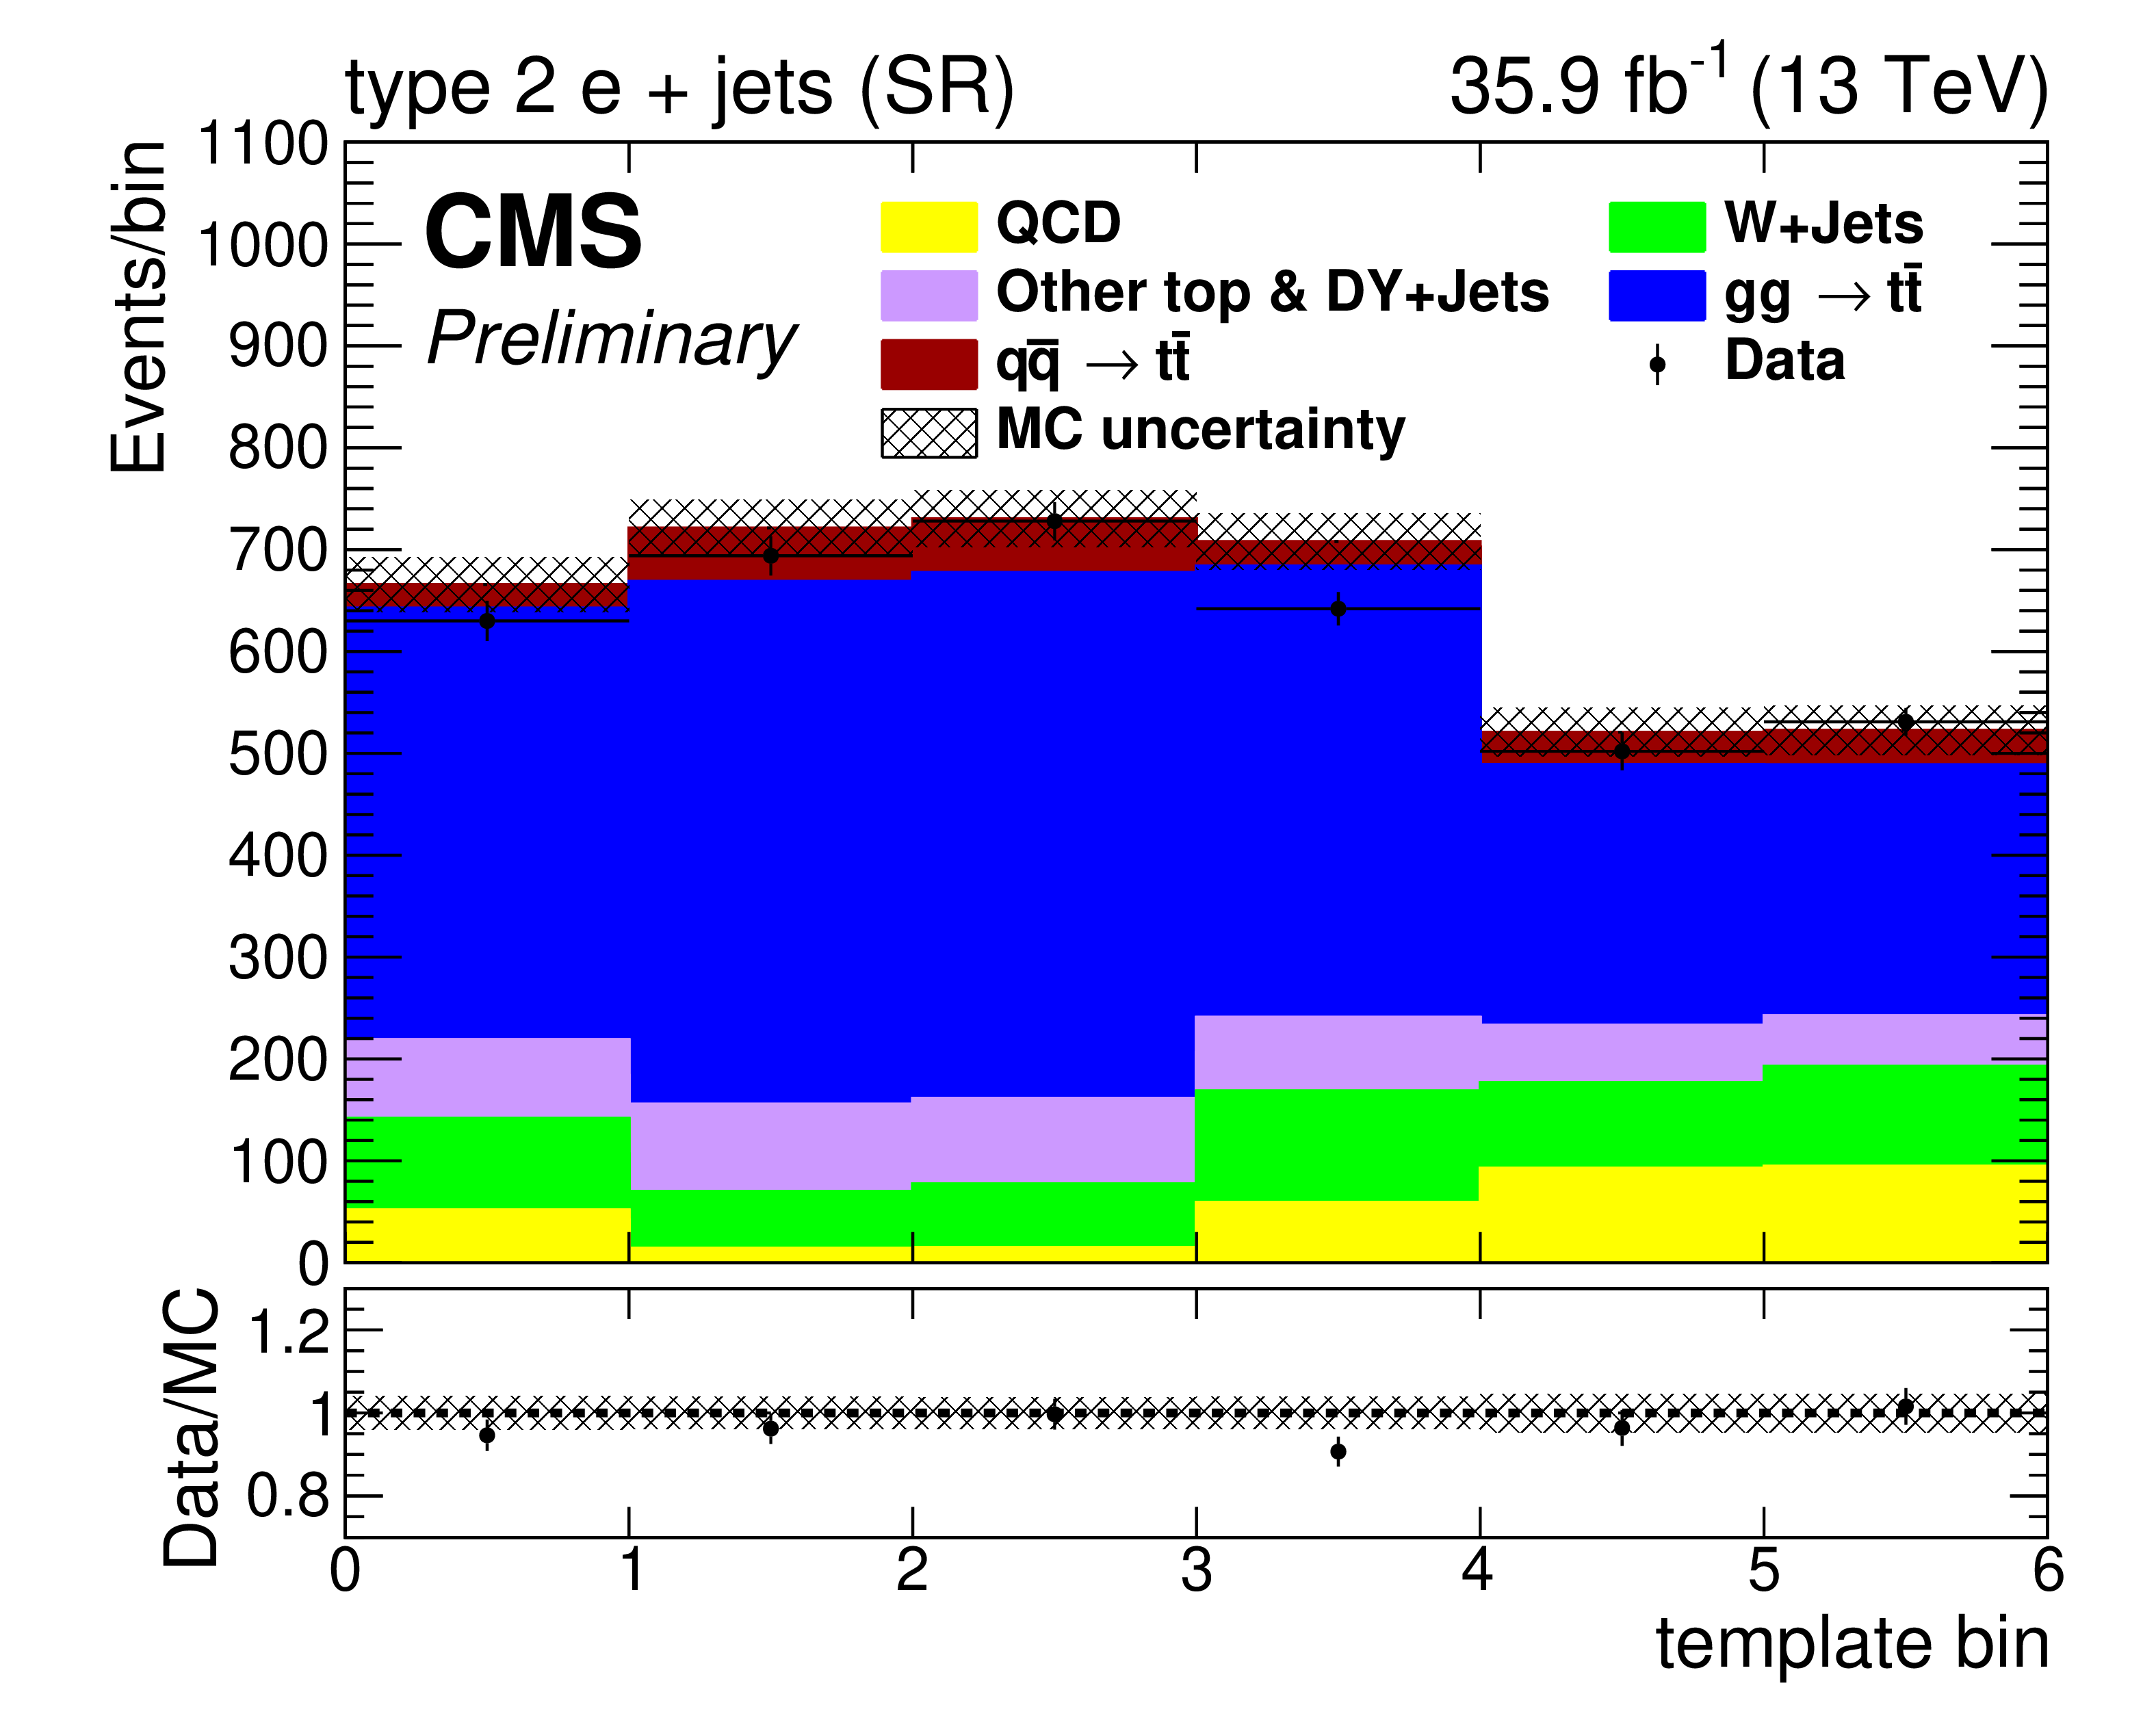
Figure 7-d:
Postfit data/MC comparison as functions of template bin number for the ${A^{(1)}_\mathrm {FB}}$ parameter investigation for events in the type-2 e+jets channel, summed over lepton charge. |
png pdf |
Figure 7-e:
Postfit data/MC comparison as functions of template bin number for the ${A^{(1)}_\mathrm {FB}}$ parameter investigation for events in the type-3 $\mu$+jets channel, summed over lepton charge. |
png pdf |
Figure 7-f:
Postfit data/MC comparison as functions of template bin number for the ${A^{(1)}_\mathrm {FB}}$ parameter investigation for events in the type-3 e+jets channel, summed over lepton charge. |
| Tables | |
png pdf |
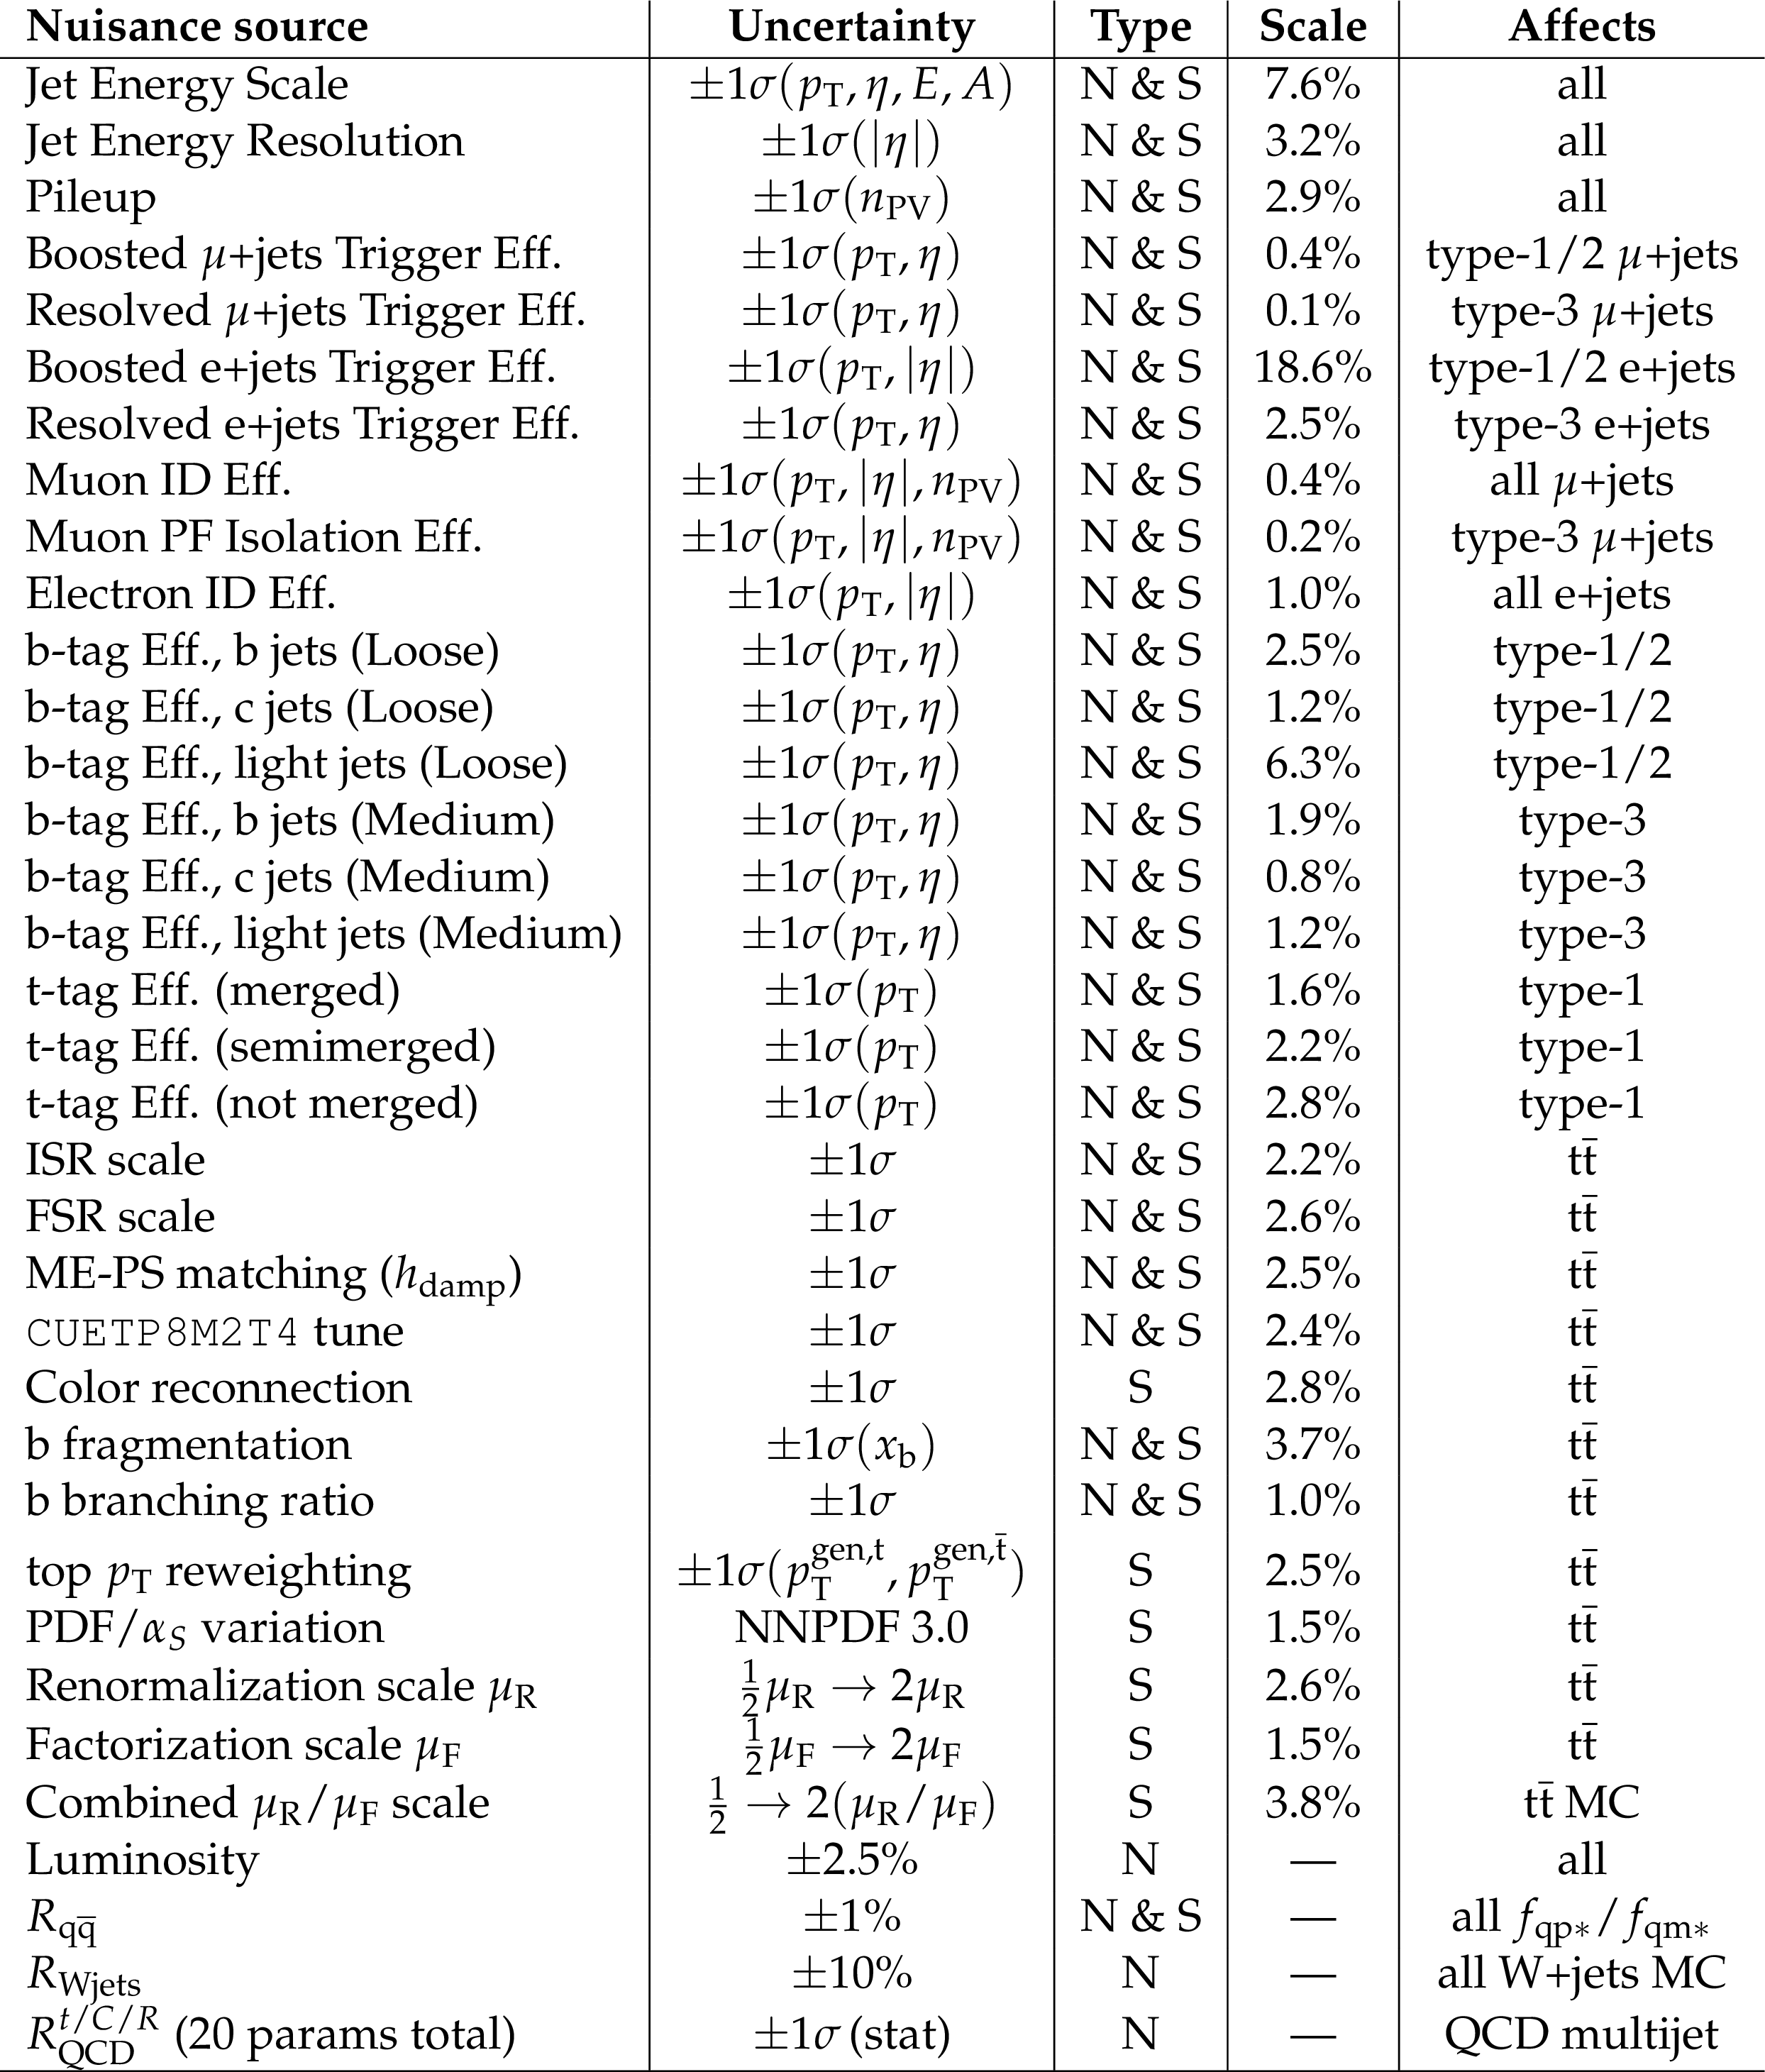
Table 1:
List of nuisance parameters considered in fits to data. "N" stands for "normalization" and "S" for "shape" in the "type" column. The "Scale" column lists the absolute value of the associated fractional up/down shifts averaged over all affected template bins. $R_{\text {QCD}}^{t/C/R}$ indicated that the QCD multijet yield uncertainties are independent in each topology $t$, channel $C$, and region $R$. |
png pdf |
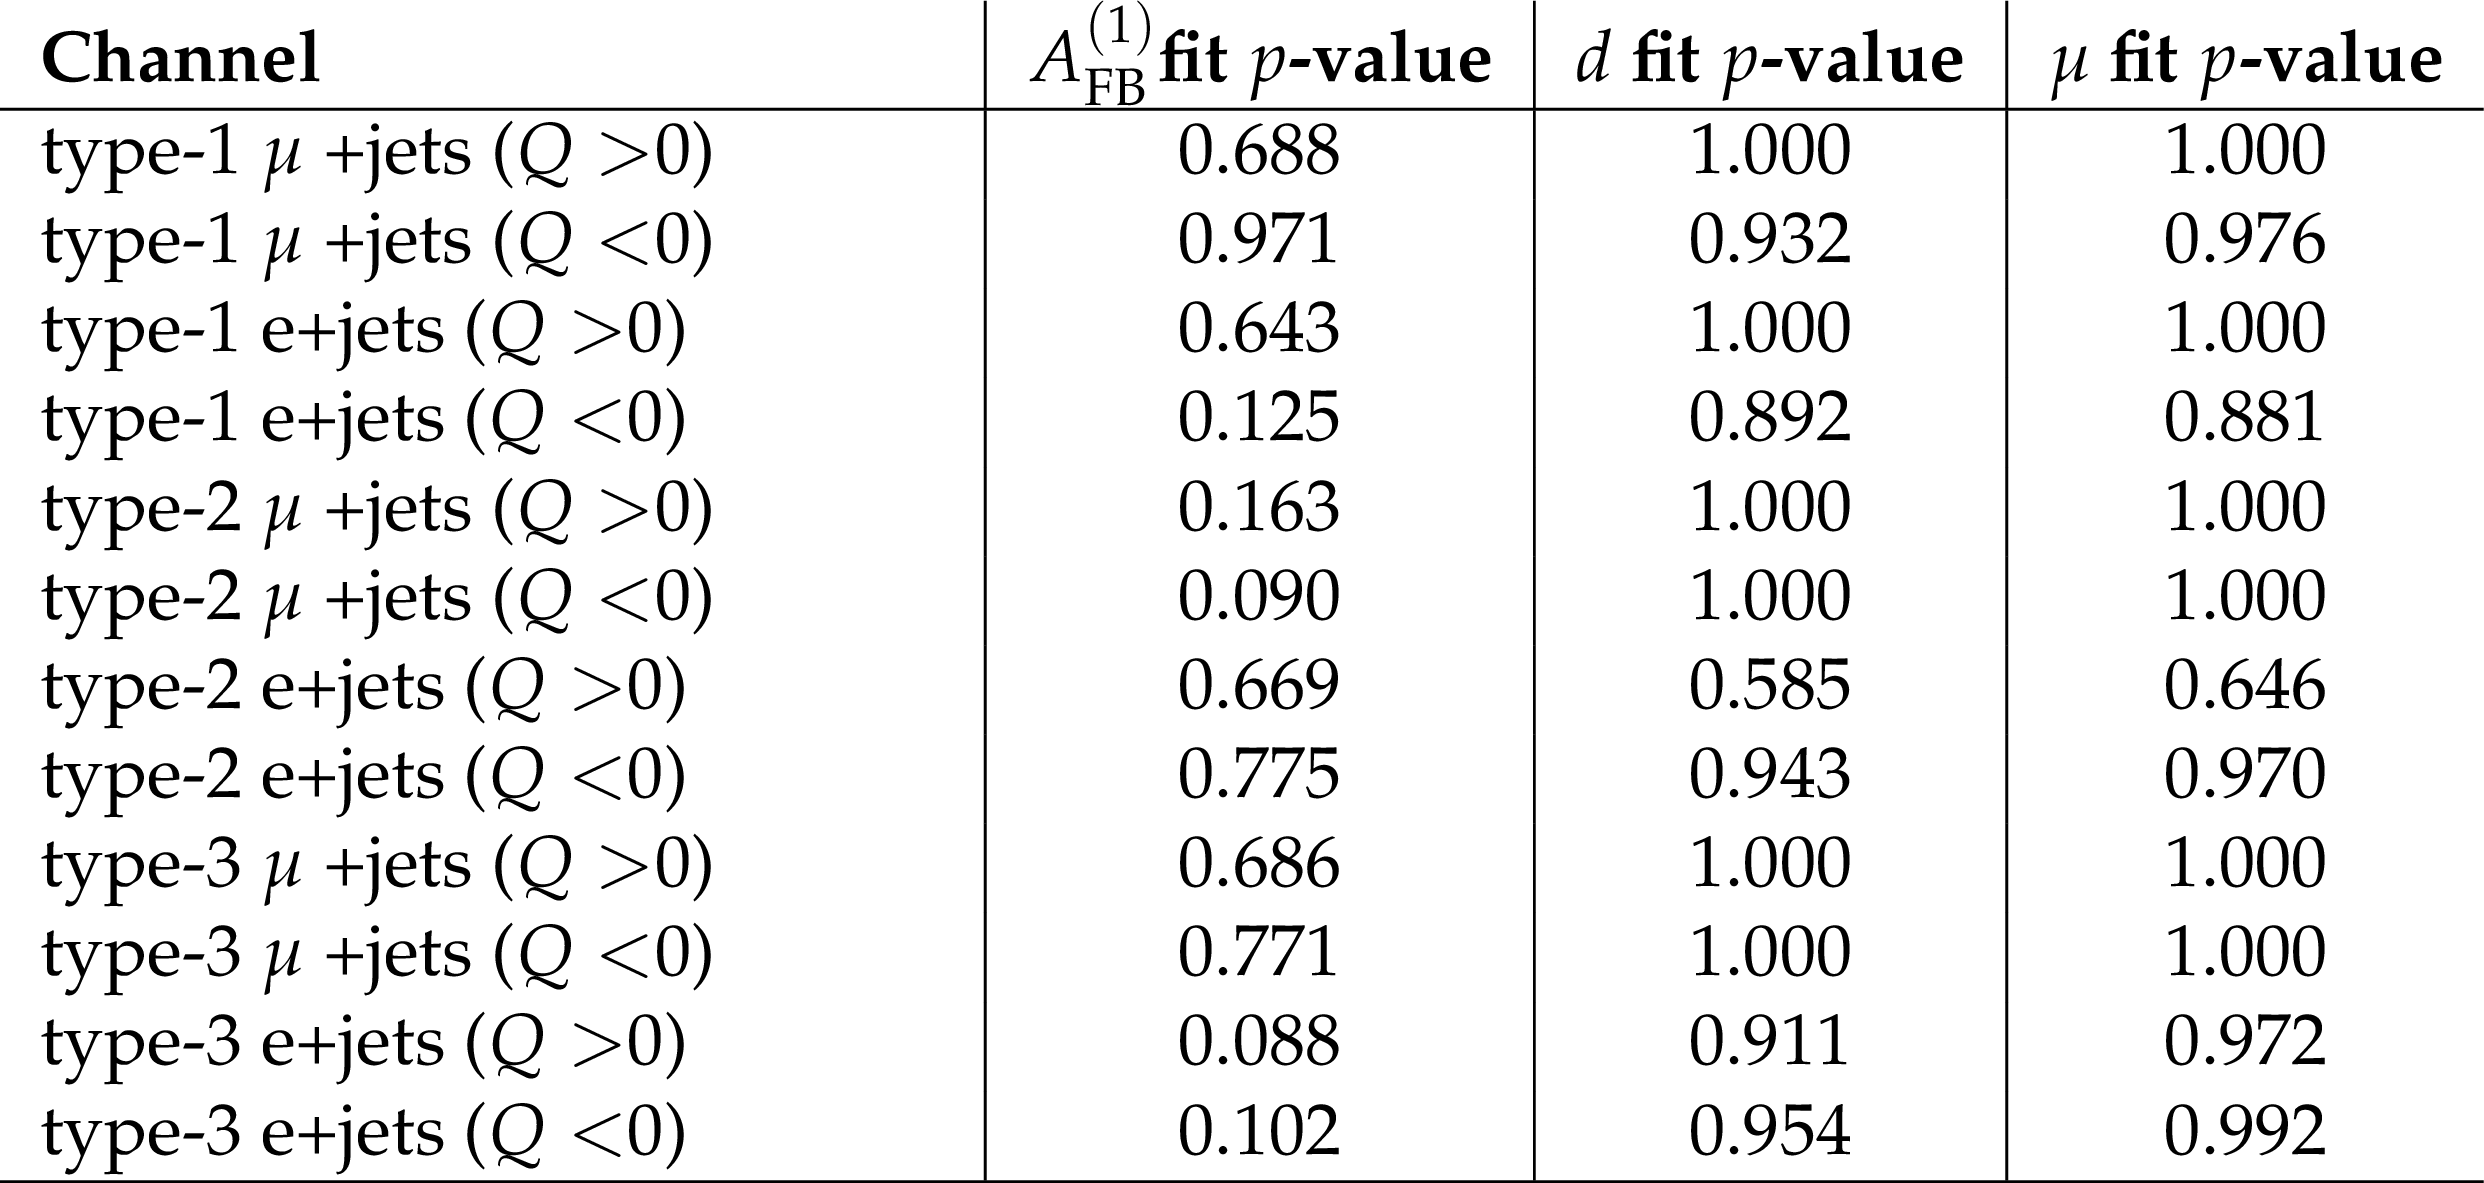
Table 2:
Observed $p$-values representing channel-dependent goodness of fit. |
| Summary |
| The linearized parton-level top quark forward-backward asymmetry ${A^{(1)}_\mathrm{FB}}$ and anomalous chromoelectric ($d$) and chromomagnetic ($\mu$) moments have been measured in 35.9 fb$^{-1}$ of LHC proton-proton collision data collected with the CMS detector in 2016 at a center-of-mass energy of 13 TeV. Candidate $\mathrm{t\bar{t}}$ events decaying to lepton plus jets final states with "resolved" (low-momentum) and "boosted" (high-momentum) topologies were selected and their top quark candidate pairs were reconstructed using a kinematic fit of the decay products to $\mathrm{t\bar{t}}$ hypotheses. Parameters of interest have been measured using template-based likelihood fits to observed data of differential models based on extensions to tree-level cross sections for quark-antiquark and gluon-gluon initial states, and are determined to be ${A^{(1)}_\mathrm{FB}}= $ 0.048$^{+0.088}_{-0.084}$ (stat) $\pm$ 0.028 (syst), $d=$ 0.002 $\pm$ 0.010 (stat) $^{+0.014}_{-0.019}$ (syst), and $\mu=-$0.024 $^{+0.013}_{-0.007}$ (stat) $^{+0.016}_{-0.006}$ (syst). |
| References | ||||
| 1 | Q.-H. Cao et al. | Forward-backward asymmetry of top quark pair production | PRD 81 (2010) 114004 | 1003.3461 |
| 2 | M. I. Gresham, I.-W. Kim, and K. M. Zurek | On models of new physics for the Tevatron top $ {A_\text{FB}} $ | PRD 83 (2011) 114027 | 1103.3501 |
| 3 | J. H. Kuhn and G. Rodrigo | Charge asymmetry of heavy quarks at hadron colliders | PRD 59 (1999) 054017 | hep-ph/9807420 |
| 4 | J. H. Kuhn and G. Rodrigo | Charge asymmetries of top quarks at hadron colliders revisited | JHEP 01 (2012) 063 | 1109.6830 |
| 5 | J. A. Aguilar-Saavedra, W. Bernreuther, and Z. G. Si | Collider-independent top quark forward-backward asymmetries: standard model predictions | PRD 86 (2012) 115020 | 1209.6352 |
| 6 | M. Czakon, P. Fiedler, and A. Mitov | Resolving the Tevatron Top Quark Forward-Backward Asymmetry Puzzle: Fully Differential Next-to-Next-to-Leading-Order Calculation | PRL 115 (2015) 052001 | 1411.3007 |
| 7 | CDF Collaboration | Evidence for a mass dependent forward-backward asymmetry in top quark pair production | PRD 83 (2011) 112003 | 1101.0034 |
| 8 | D0 Collaboration | First measurement of the forward-backward charge asymmetry in top quark pair production | PRL 100 (2008) 142002 | 0712.0851 |
| 9 | D0 Collaboration | Measurement of the forward-backward asymmetry in top quark-antiquark production in $ {{\mathrm{p}}}\bar{{{\mathrm{p}}}} $ collisions using the lepton+jets channel | PRD 90 (2014) 072011 | 1405.0421 |
| 10 | CDF Collaboration | Measurement of the forward-backward asymmetry of top-quark and antiquark pairs using the full CDF Run II data set | PRD 93 (2016) 112005 | 1602.09015 |
| 11 | CDF and D0 Collaborations | Combined forward-backward asymmetry measurements in top-antitop quark production at the Tevatron | PRL 120 (2018) 042001 | 1709.04894 |
| 12 | CMS Collaboration | Measurement of the charge asymmetry in top-quark pair production in proton-proton collisions at $ \sqrt{s}= $ 7 TeV | PLB 709 (2012) 28 | CMS-TOP-11-014 1112.5100 |
| 13 | CMS Collaboration | Measurements of the $ \mathrm{t\bar{t}} $ charge asymmetry using the dilepton decay channel in $ {\mathrm{p}}{\mathrm{p}} $ collisions at $ \sqrt{s} = $ 7 TeV | JHEP 04 (2014) 191 | CMS-TOP-12-010 1402.3803 |
| 14 | CMS Collaboration | Measurement of the charge asymmetry in top quark pair production in pp collisions at $ \sqrt{s} = $ 8 TeV using a template method | PRD 93 (2016) 034014 | CMS-TOP-13-013 1508.03862 |
| 15 | CMS Collaboration | Measurements of $ \mathrm{t\bar{t}} $ charge asymmetry using dilepton final states in $ {\mathrm{p}}{\mathrm{p}} $ collisions at $ \sqrt s= $ 8 TeV | PLB 760 (2016) 365 | CMS-TOP-15-009 1603.06221 |
| 16 | ATLAS Collaboration | Measurement of the charge asymmetry in top quark pair production in $ {{\mathrm{p}}}{{\mathrm{p}}} $ collisions at $ \sqrt{s}= $ 7 TeV using the ATLAS detector | EPJC 72 (2012) 2039 | 1203.4211 |
| 17 | ATLAS Collaboration | Measurement of the charge asymmetry in highly boosted top-quark pair production in $ \sqrt{s} = $ 8 TeV pp collision data collected by the ATLAS experiment | PLB 756 (2016) 52 | 1512.06092 |
| 18 | D. Atwood, A. Aeppli, and A. Soni | Extracting anomalous gluon-top effective couplings at the supercolliders | PRL 69 (1992) 2754 | |
| 19 | D. Atwood, A. Kagan, and T. G. Rizzo | Constraining anomalous top quark couplings at the Tevatron | PRD 52 (1995) 6264 | hep-ph/9407408 |
| 20 | P. Haberl, O. Nachtmann, and A. Wilch | Top production in hadron hadron collisions and anomalous top-gluon couplings | PRD 53 (1996) 4875 | hep-ph/9505409 |
| 21 | K.-M. Cheung | Probing the chromoelectric and chromomagnetic dipole moments of the top quark at hadronic colliders | PRD 53 (1996) 3604 | hep-ph/9511260 |
| 22 | CMS Collaboration | Measurements of $ \mathrm{t\bar{t}} $ spin correlations and top quark polarization using dilepton final states in pp collisions at $ \sqrt{s}= $ 8 TeV | PRD 93 (2016) 052007 | CMS-TOP-14-023 1601.01107 |
| 23 | P. Nason | A New method for combining NLO QCD with shower Monte Carlo algorithms | JHEP 11 (2004) 040 | hep-ph/0409146 |
| 24 | S. Frixione, P. Nason, and C. Oleari | Matching NLO QCD computations with Parton Shower simulations: the POWHEG method | JHEP 11 (2007) 070 | 0709.2092 |
| 25 | S. Alioli, P. Nason, C. Oleari, and E. Re | A general framework for implementing NLO calculations in shower Monte Carlo programs: the POWHEG BOX | JHEP 06 (2010) 043 | 1002.2581 |
| 26 | J. C. Collins and D. E. Soper | Angular distribution of dileptons in high-energy hadron collisions | PRD 16 (1977) 2219 | |
| 27 | CMS Collaboration | CMS luminosity measurements for the 2016 data taking period | CMS-PAS-LUM-17-001 | CMS-PAS-LUM-17-001 |
| 28 | S. Frixione, P. Nason, and G. Ridolfi | A positive-weight next-to-leading-order Monte Carlo for heavy flavour hadroproduction | JHEP 09 (2007) 126 | 0707.3088 |
| 29 | T. Sjostrand et al. | An Introduction to PYTHIA 8.2 | CPC 191 (2015) 159 | 1410.3012 |
| 30 | CMS Collaboration | Investigations of the impact of the parton shower tuning in Pythia 8 in the modelling of $ \mathrm{t\overline{t}} $ at $ \sqrt{s}= $ 8 and 13 TeV | CMS-PAS-TOP-16-021 | CMS-PAS-TOP-16-021 |
| 31 | A. Kalogeropoulos and J. Alwall | The SysCalc code: A tool to derive theoretical systematic uncertainties | 1801.08401 | |
| 32 | M. Cacciari et al. | The $ \mathrm{t\bar{t}} $ cross-section at 1.8 TeV and 1.96 TeV: A study of the systematics due to parton densities and scale dependence | JHEP 04 (2004) 068 | hep-ph/0303085 |
| 33 | S. Catani, D. de Florian, M. Grazzini, and P. Nason | Soft gluon resummation for Higgs boson production at hadron colliders | JHEP 07 (2003) 028 | hep-ph/0306211 |
| 34 | NNPDF Collaboration | Parton distributions for the LHC Run II | JHEP 04 (2015) 040 | 1410.8849 |
| 35 | S. Alioli, P. Nason, C. Oleari, and E. Re | NLO single-top production matched with shower in POWHEG: s- and t-channel contributions | JHEP 09 (2009) 111 | 0907.4076 |
| 36 | P. Artoisenet, R. Frederix, O. Mattelaer, and R. Rietkerk | Automatic spin-entangled decays of heavy resonances in Monte Carlo simulations | JHEP 03 (2013) 015 | 1212.3460 |
| 37 | E. Re | Single-top Wt-channel production matched with parton showers using the POWHEG method | EPJC 71 (2011) 1547 | 1009.2450 |
| 38 | S. Frixione and B. R. Webber | Matching NLO QCD computations and parton shower simulations | JHEP 06 (2002) 029 | hep-ph/0204244 |
| 39 | J. Alwall et al. | The automated computation of tree-level and next-to-leading order differential cross sections, and their matching to parton shower simulations | JHEP 07 (2014) 079 | 1405.0301 |
| 40 | J. Alwall et al. | Comparative study of various algorithms for the merging of parton showers and matrix elements in hadronic collisions | EPJC 53 (2008) 473 | 0706.2569 |
| 41 | GEANT4 Collaboration | GEANT4: a simulation toolkit | NIMA 506 (2003) 250 | |
| 42 | P. Kant et al. | HatHor for single top-quark production: Updated predictions and uncertainty estimates for single top-quark production in hadronic collisions | CPC 191 (2015) 74 | 1406.4403 |
| 43 | N. Kidonakis | Two-loop soft anomalous dimensions for single top quark associated production with a W or H | PRD 82 (2010) 054018 | 1005.4451 |
| 44 | R. Gavin, Y. Li, F. Petriello, and S. Quackenbush | FEWZ 2.0: A code for hadronic Z production at next-to-next-to-leading order | CPC 182 (2011) 2388 | 1011.3540 |
| 45 | M. Czakon and A. Mitov | Top++: a program for the calculation of the top pair cross section at hadron colliders | CPC 185 (2014) 2930 | 1112.5675 |
| 46 | J. Thaler and K. Van Tilburg | Identifying boosted objects with N-subjettiness | JHEP 03 (2011) 015 | 1011.2268 |
| 47 | CMS Collaboration | Identification of heavy-flavour jets with the CMS detector in pp collisions at 13 TeV | JINST 13 (2018) P05011 | CMS-BTV-16-002 1712.07158 |
| 48 | J. Erdmann et al. | A likelihood-based reconstruction algorithm for top-quark pairs and the KLFitter framework | NIMA 748 (2014) 18 | 1312.5595 |
| 49 | F. James and M. Roos | Minuit: a system for function minimization and analysis of the parameter errors and correlations | CPC 10 (1975) 343 | |
| 50 | M. Czakon et al. | Top-pair production at the LHC through NNLO QCD and NLO EW | JHEP 10 (2017) 186 | 1705.04105 |
| 51 | CMS Collaboration | Search for new physics in top quark production in dilepton final states in proton-proton collisions at $ \sqrt{s} = $ 13 TeV | CMS-TOP-17-020 1903.11144 |
|
| 52 | J. Butterworth et al. | PDF4LHC recommendations for LHC Run II | JPG 43 (2016) 023001 | 1510.03865 |
| 53 | J. Rojo et al. | The PDF4LHC report on PDFs and LHC data: Results from Run I and preparation for Run II | JPG 42 (2015) 103103 | 1507.00556 |
| 54 | A. Accardi et al. | A critical appraisal and evaluation of modern PDFs | EPJC 76 (2016) 471 | 1603.08906 |
| 55 | R. J. Barlow and C. Beeston | Fitting using finite Monte Carlo samples | CPC 77 (1993) 219 | |
| 56 | J. Neyman | Outline of a theory of statistical estimation based on the classical theory of probability | Philos. Trans. Royal Soc. A 236 (1937) 333 | |
| 57 | F. J. Massey Jr. | The Kolmogorov-Smirnov test for goodness of fit | J. Am. Stat. Assoc. 46 (1951) 68 | |
|
|
Compact Muon Solenoid LHC, CERN |
|

|

|

|

|

|