

Compact Muon Solenoid
LHC, CERN
| CMS-PAS-SUS-19-013 | ||
| Search for supersymmetry in proton-proton collisions at $\sqrt{s}= $ 13 TeV in final states with high-momentum Z bosons and missing transverse momentum | ||
| CMS Collaboration | ||
| May 2020 | ||
| Abstract: A search for physics beyond the standard model in events with highly Lorentz-boosted Z bosons and missing transverse momentum is presented. The analysed proton-proton collision data, corresponding to an integrated luminosity of 137 fb$^{-1}$, were recorded at $\sqrt{s}= $ 13 TeV by the CMS experiment. The search utilizes wide-cone jets to identify quark pairs from Z boson decays. Backgrounds from standard model processes are suppressed by requirements on the jet mass and missing transverse momentum. No significant excess in the event yield is observed beyond the number of background events expected from the standard model. An exclusion limit on the mass of gluinos - supersymmetric partners of gluons - as large as 1920 GeV is set at 95% confidence level within the framework of simplified model spectra. | ||
|
Links:
CDS record (PDF) ;
CADI line (restricted) ;
These preliminary results are superseded in this paper, JHEP 09 (2020) 149. The superseded preliminary plots can be found here. |
||
| Figures | |
png pdf |
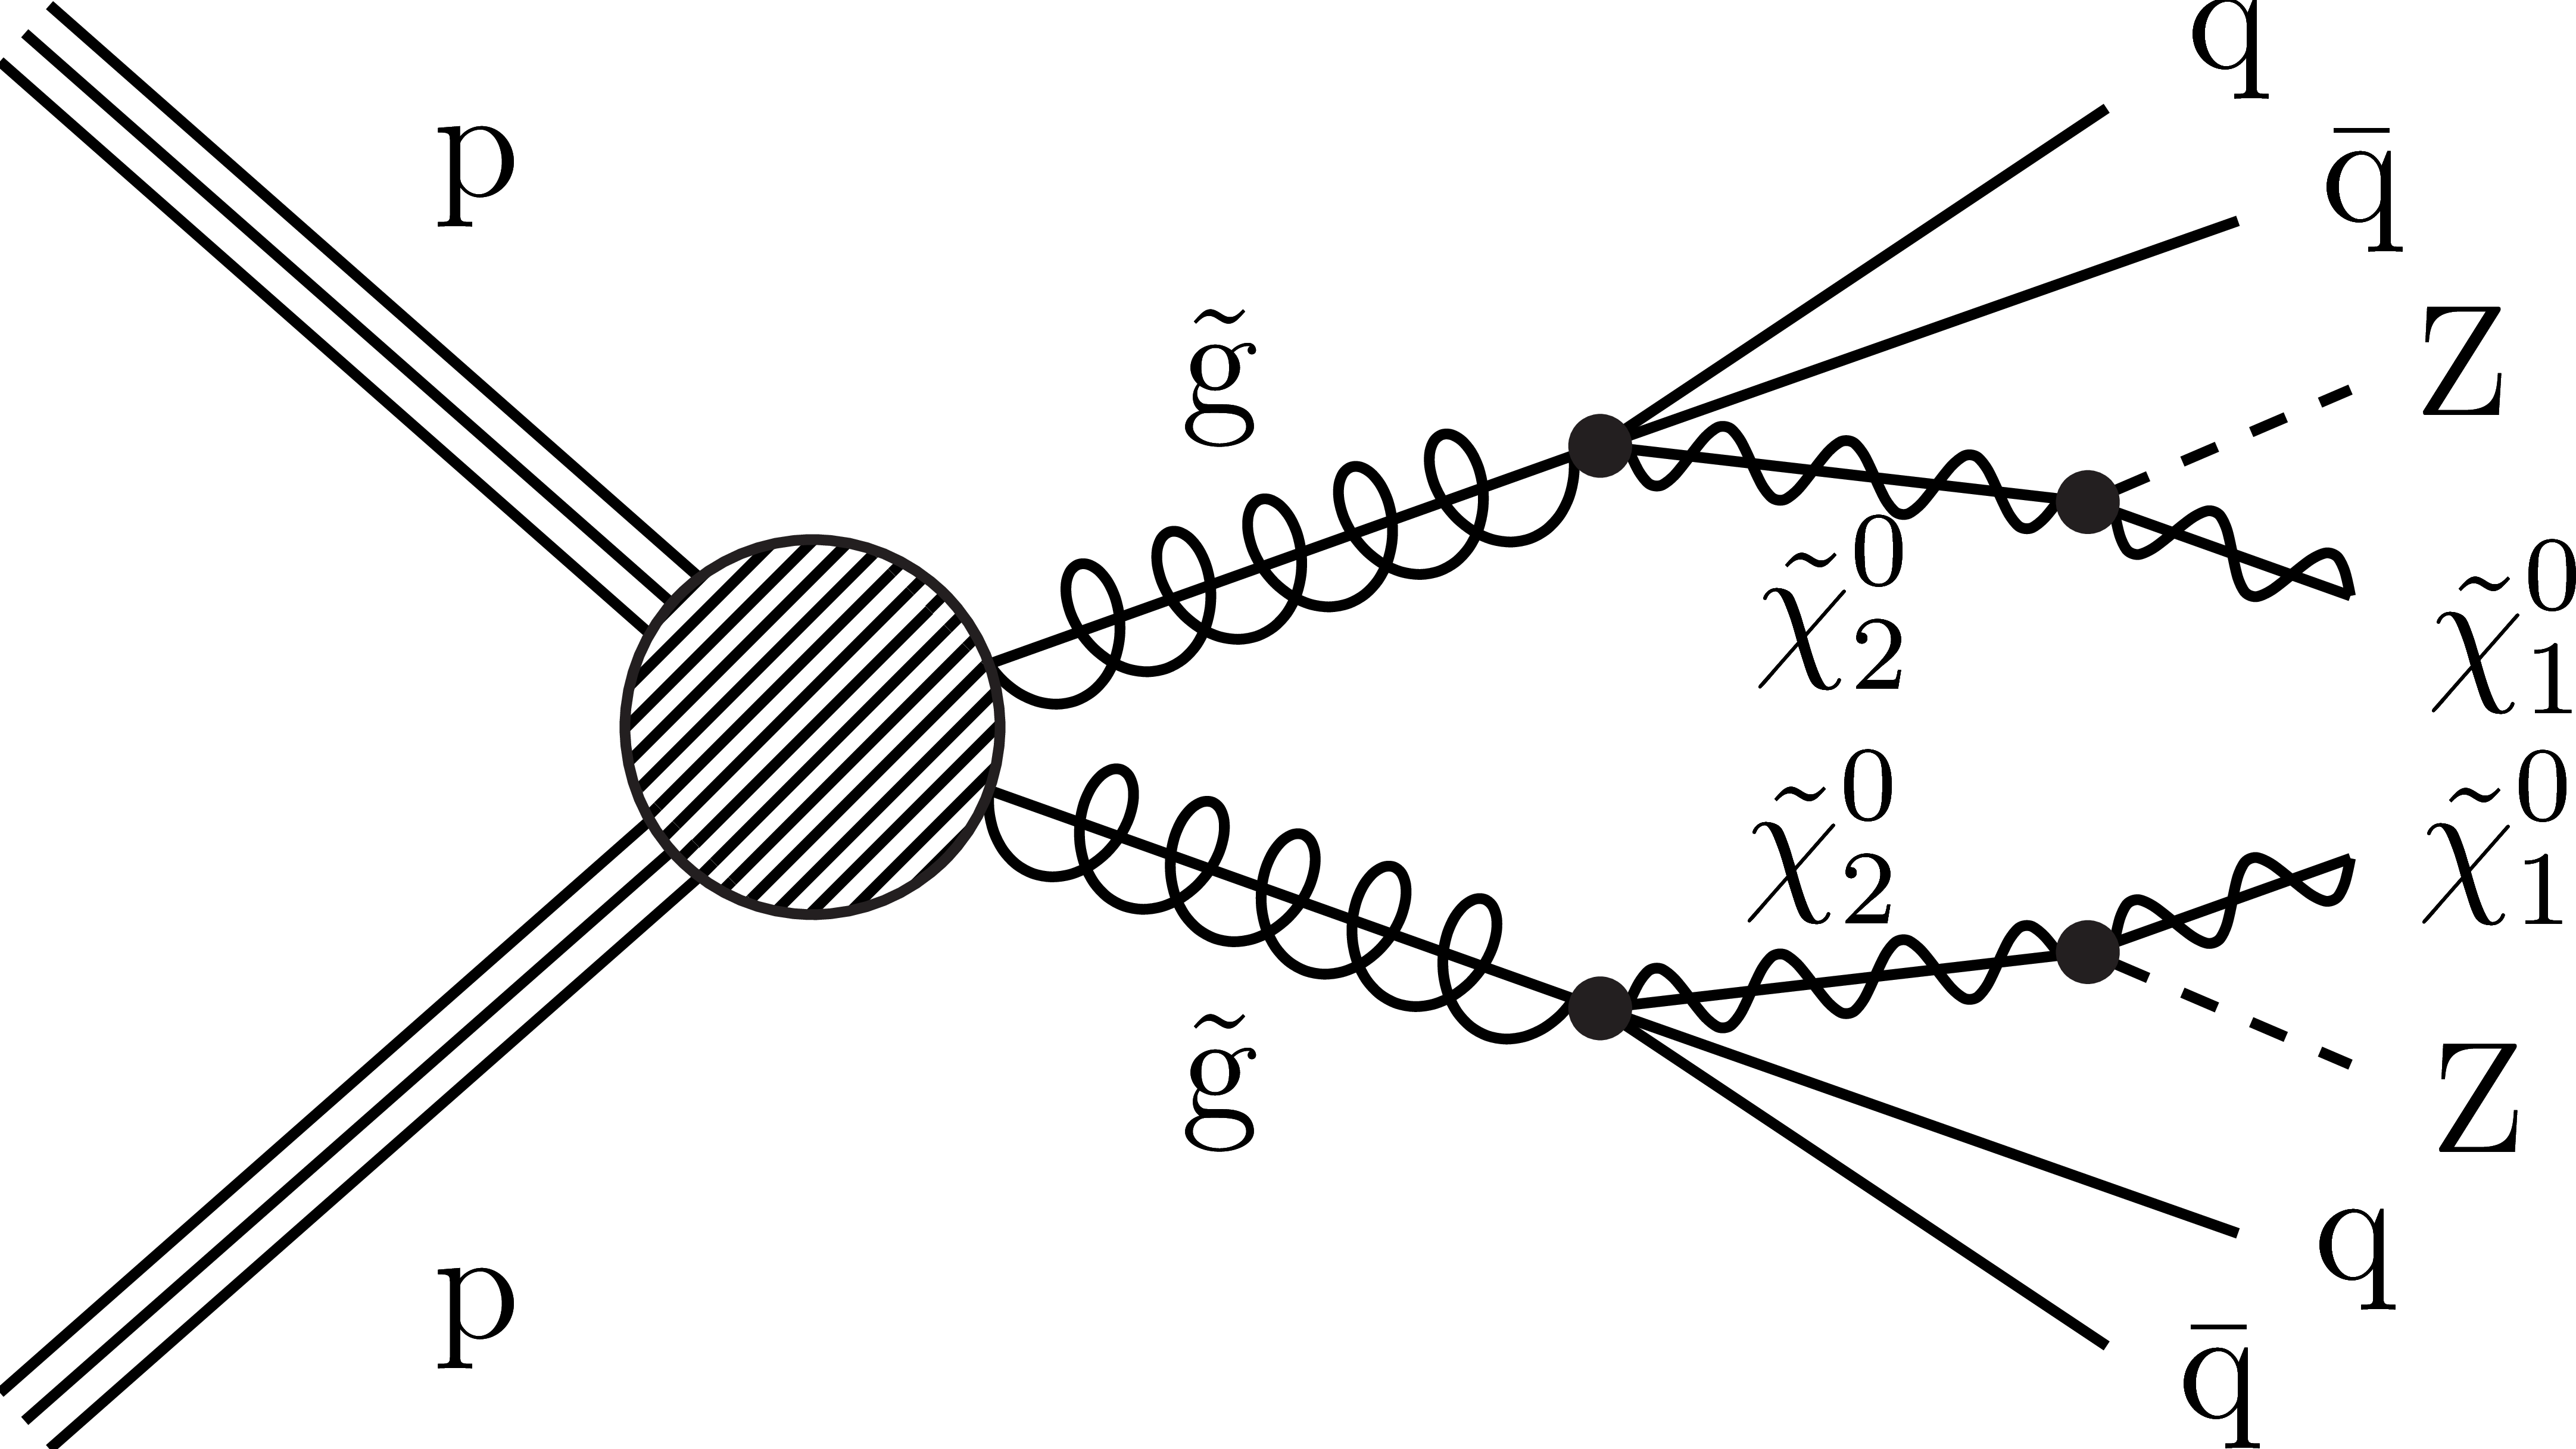
Figure 1:
Signal diagram for the T5ZZ SMS process. The assumed small mass splitting between the ${\mathrm{\tilde{g}}}$ and ${\tilde{\chi}^0_2}$ implies a massive ${\tilde{\chi}^0_2}$. We further assume a 100% branching fraction for the ${\tilde{\chi}^0_2}$ decay to the Z boson and ${\tilde{\chi}^0_1}$, leading to a high-momentum Z boson and large ${{p_{\mathrm {T}}} ^\text {miss}}$. |
png pdf |
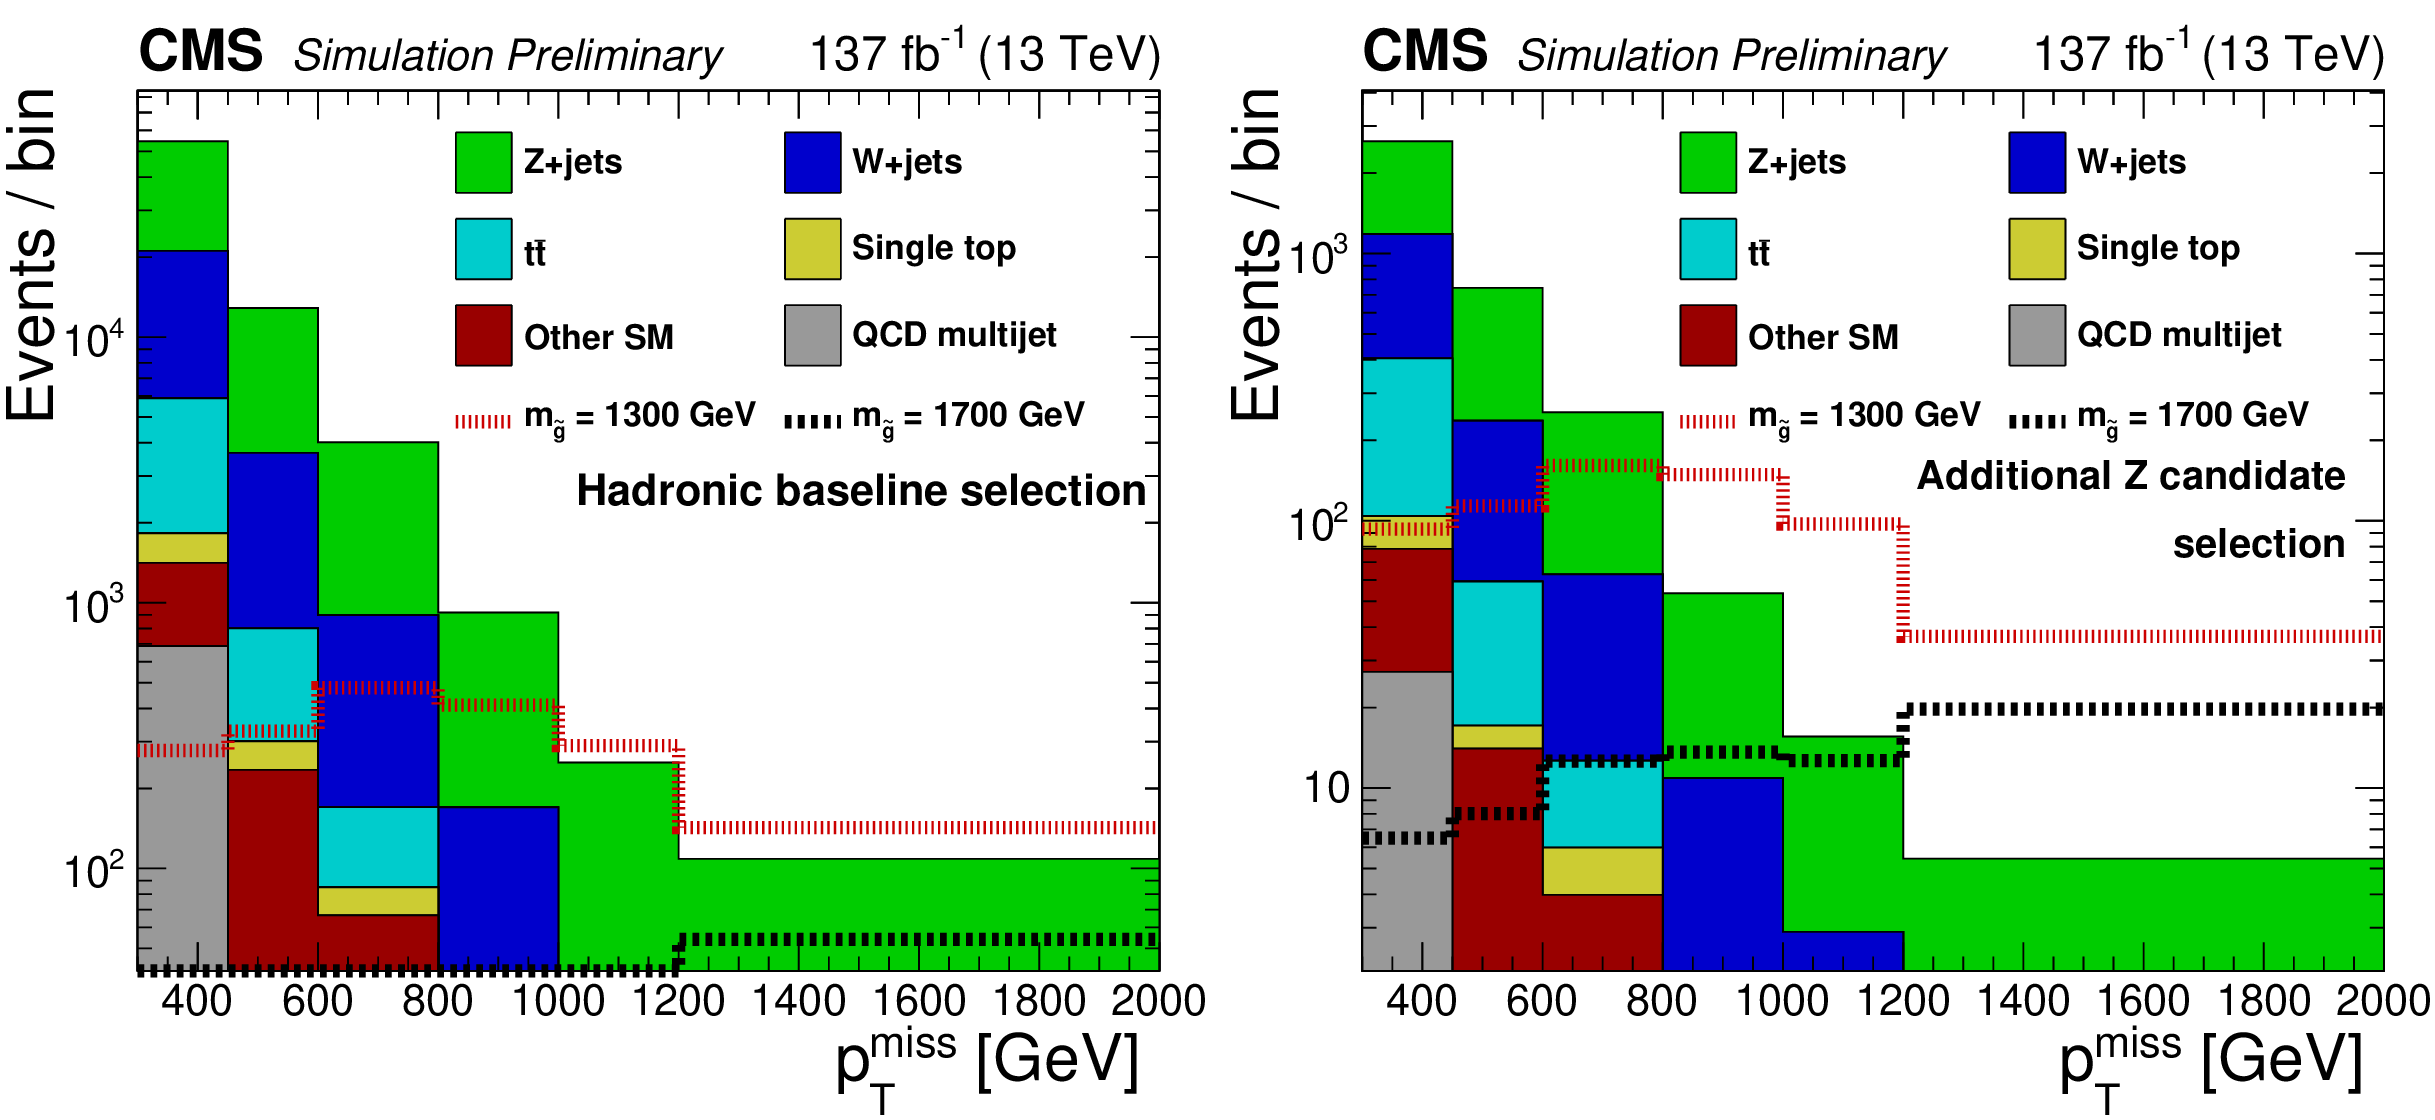
Figure 2:
Distributions of ${{p_{\mathrm {T}}} ^\text {miss}}$ for simulated SM backgrounds (stacked histograms), with only the hadronic baseline selection (left), and after the additional Z candidate selection (right). Expected signal contributions for two example mass points (dotted lines) are also shown. The last bin includes overflow events. |
png pdf |
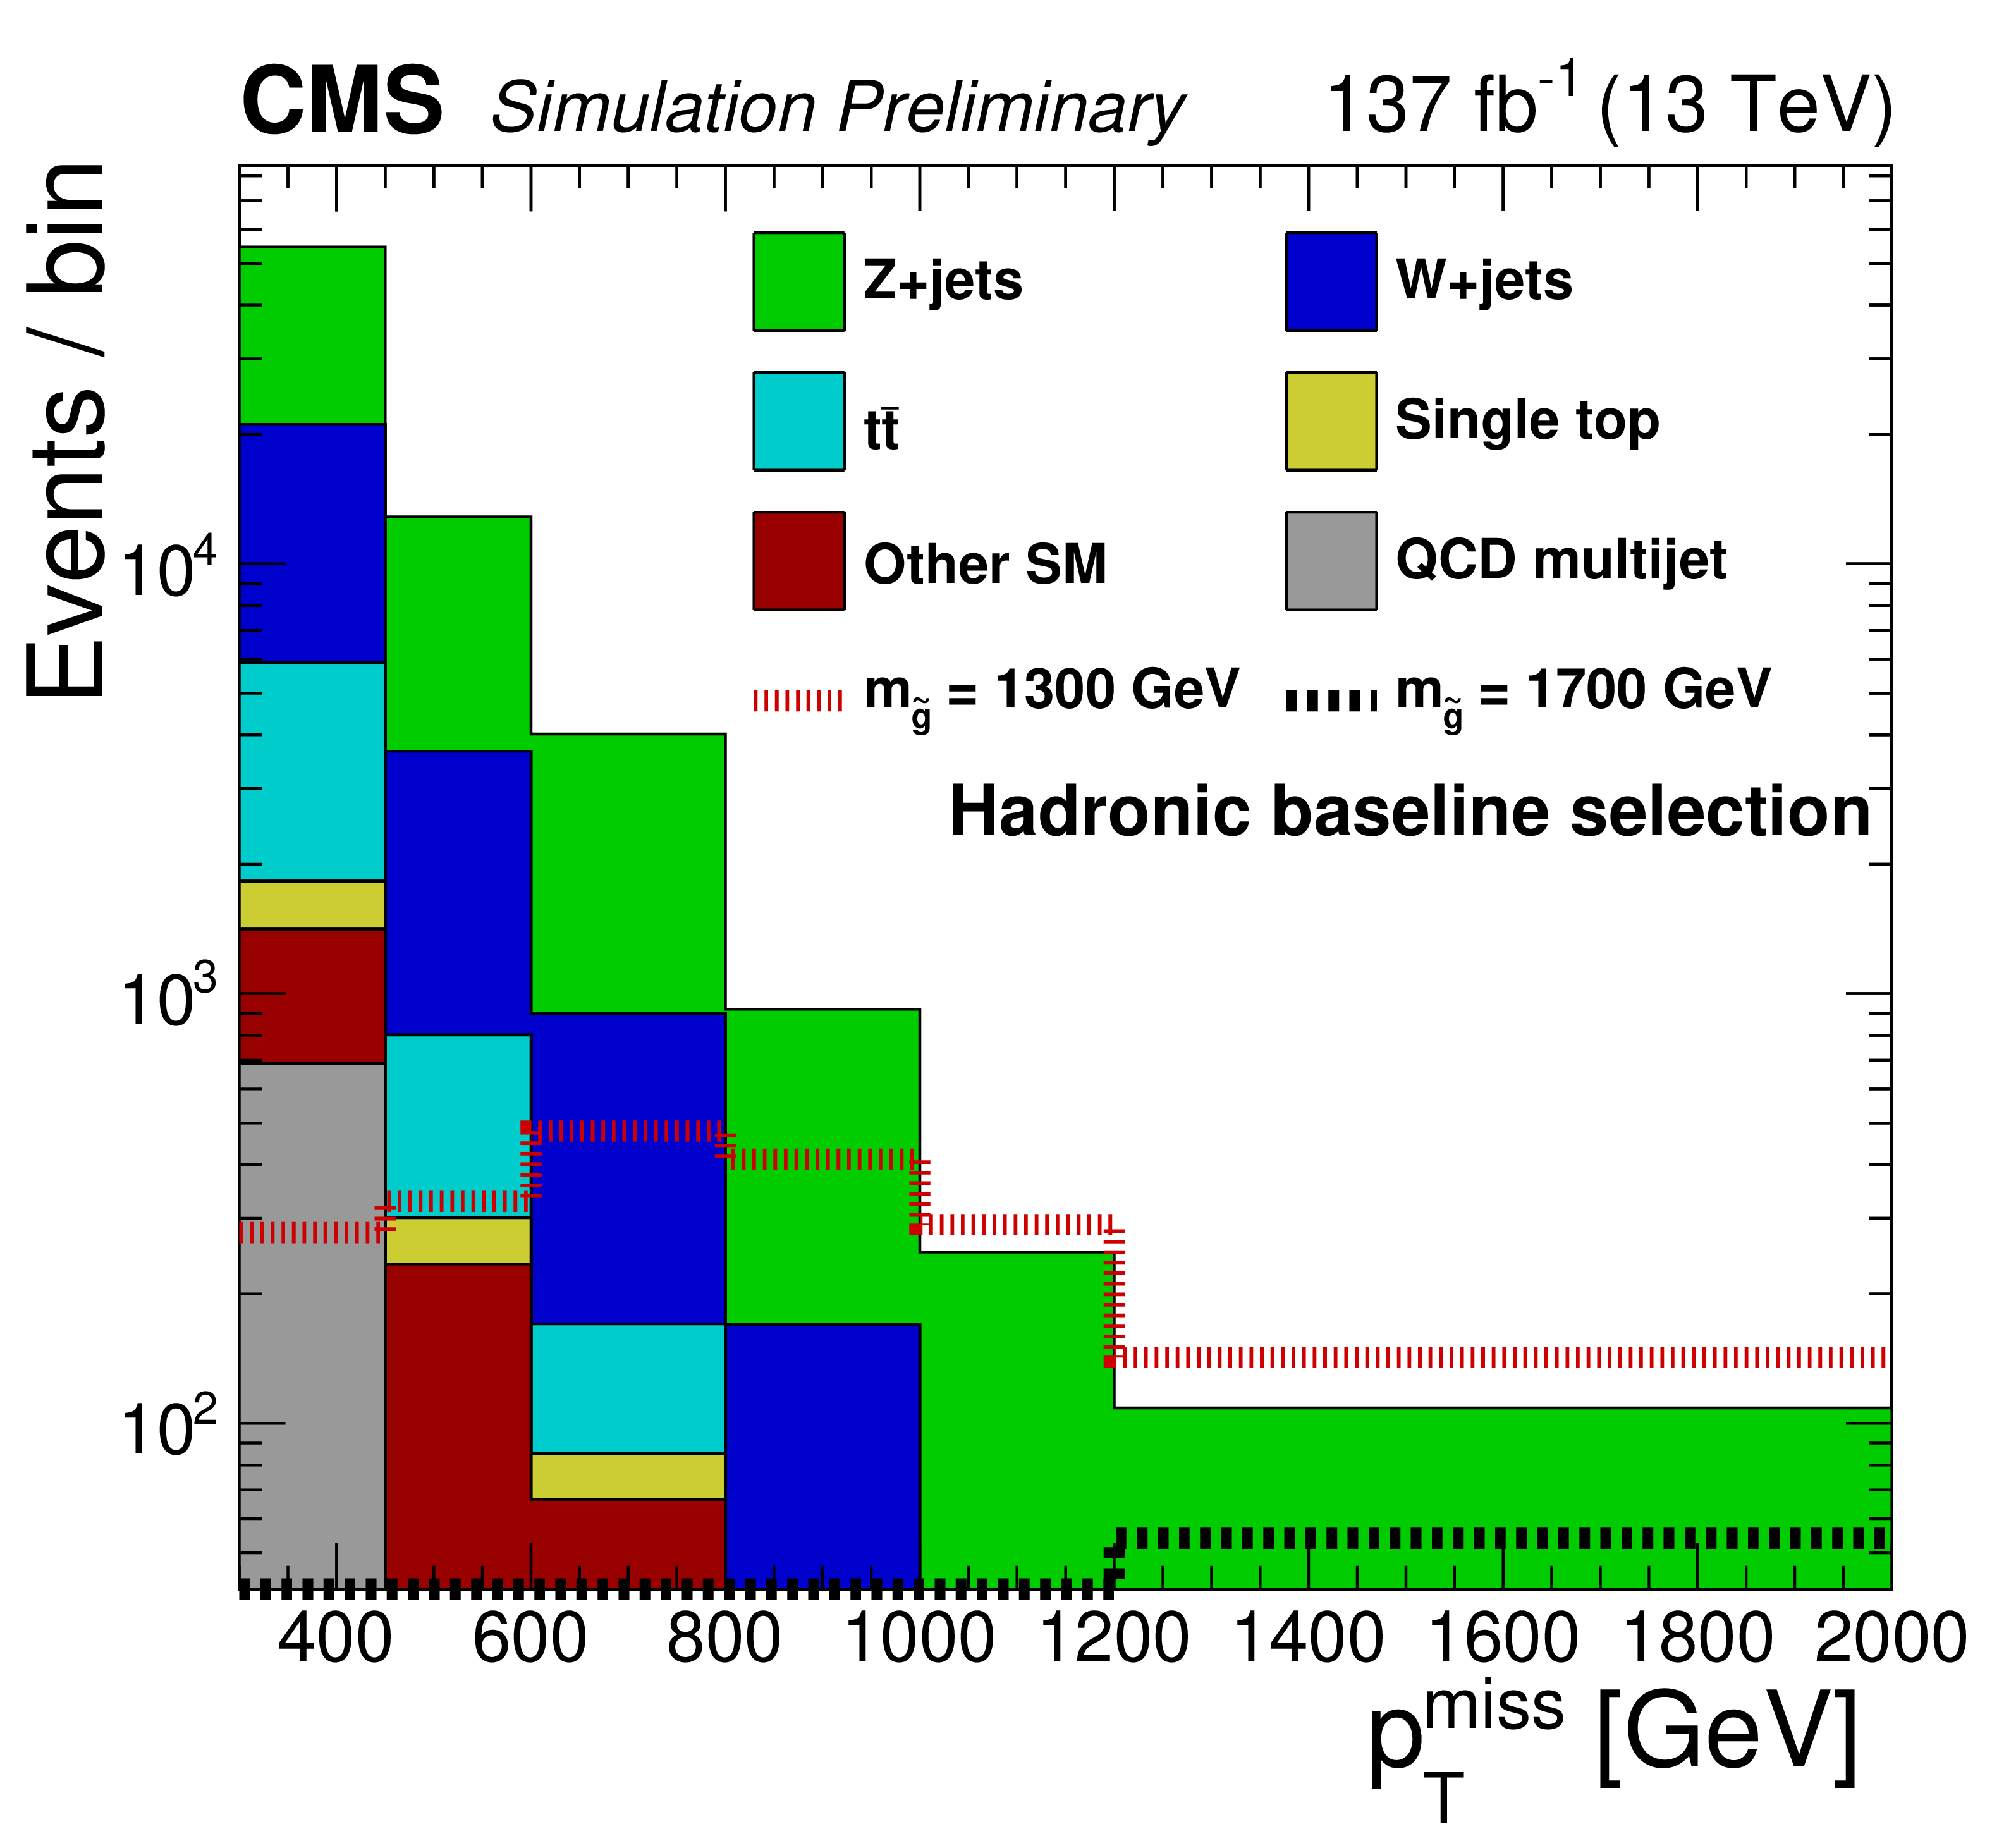
Figure 2-a:
Distributions of ${{p_{\mathrm {T}}} ^\text {miss}}$ for simulated SM backgrounds (stacked histograms), with only the hadronic baseline selection (left), and after the additional Z candidate selection (right). Expected signal contributions for two example mass points (dotted lines) are also shown. The last bin includes overflow events. |
png pdf |
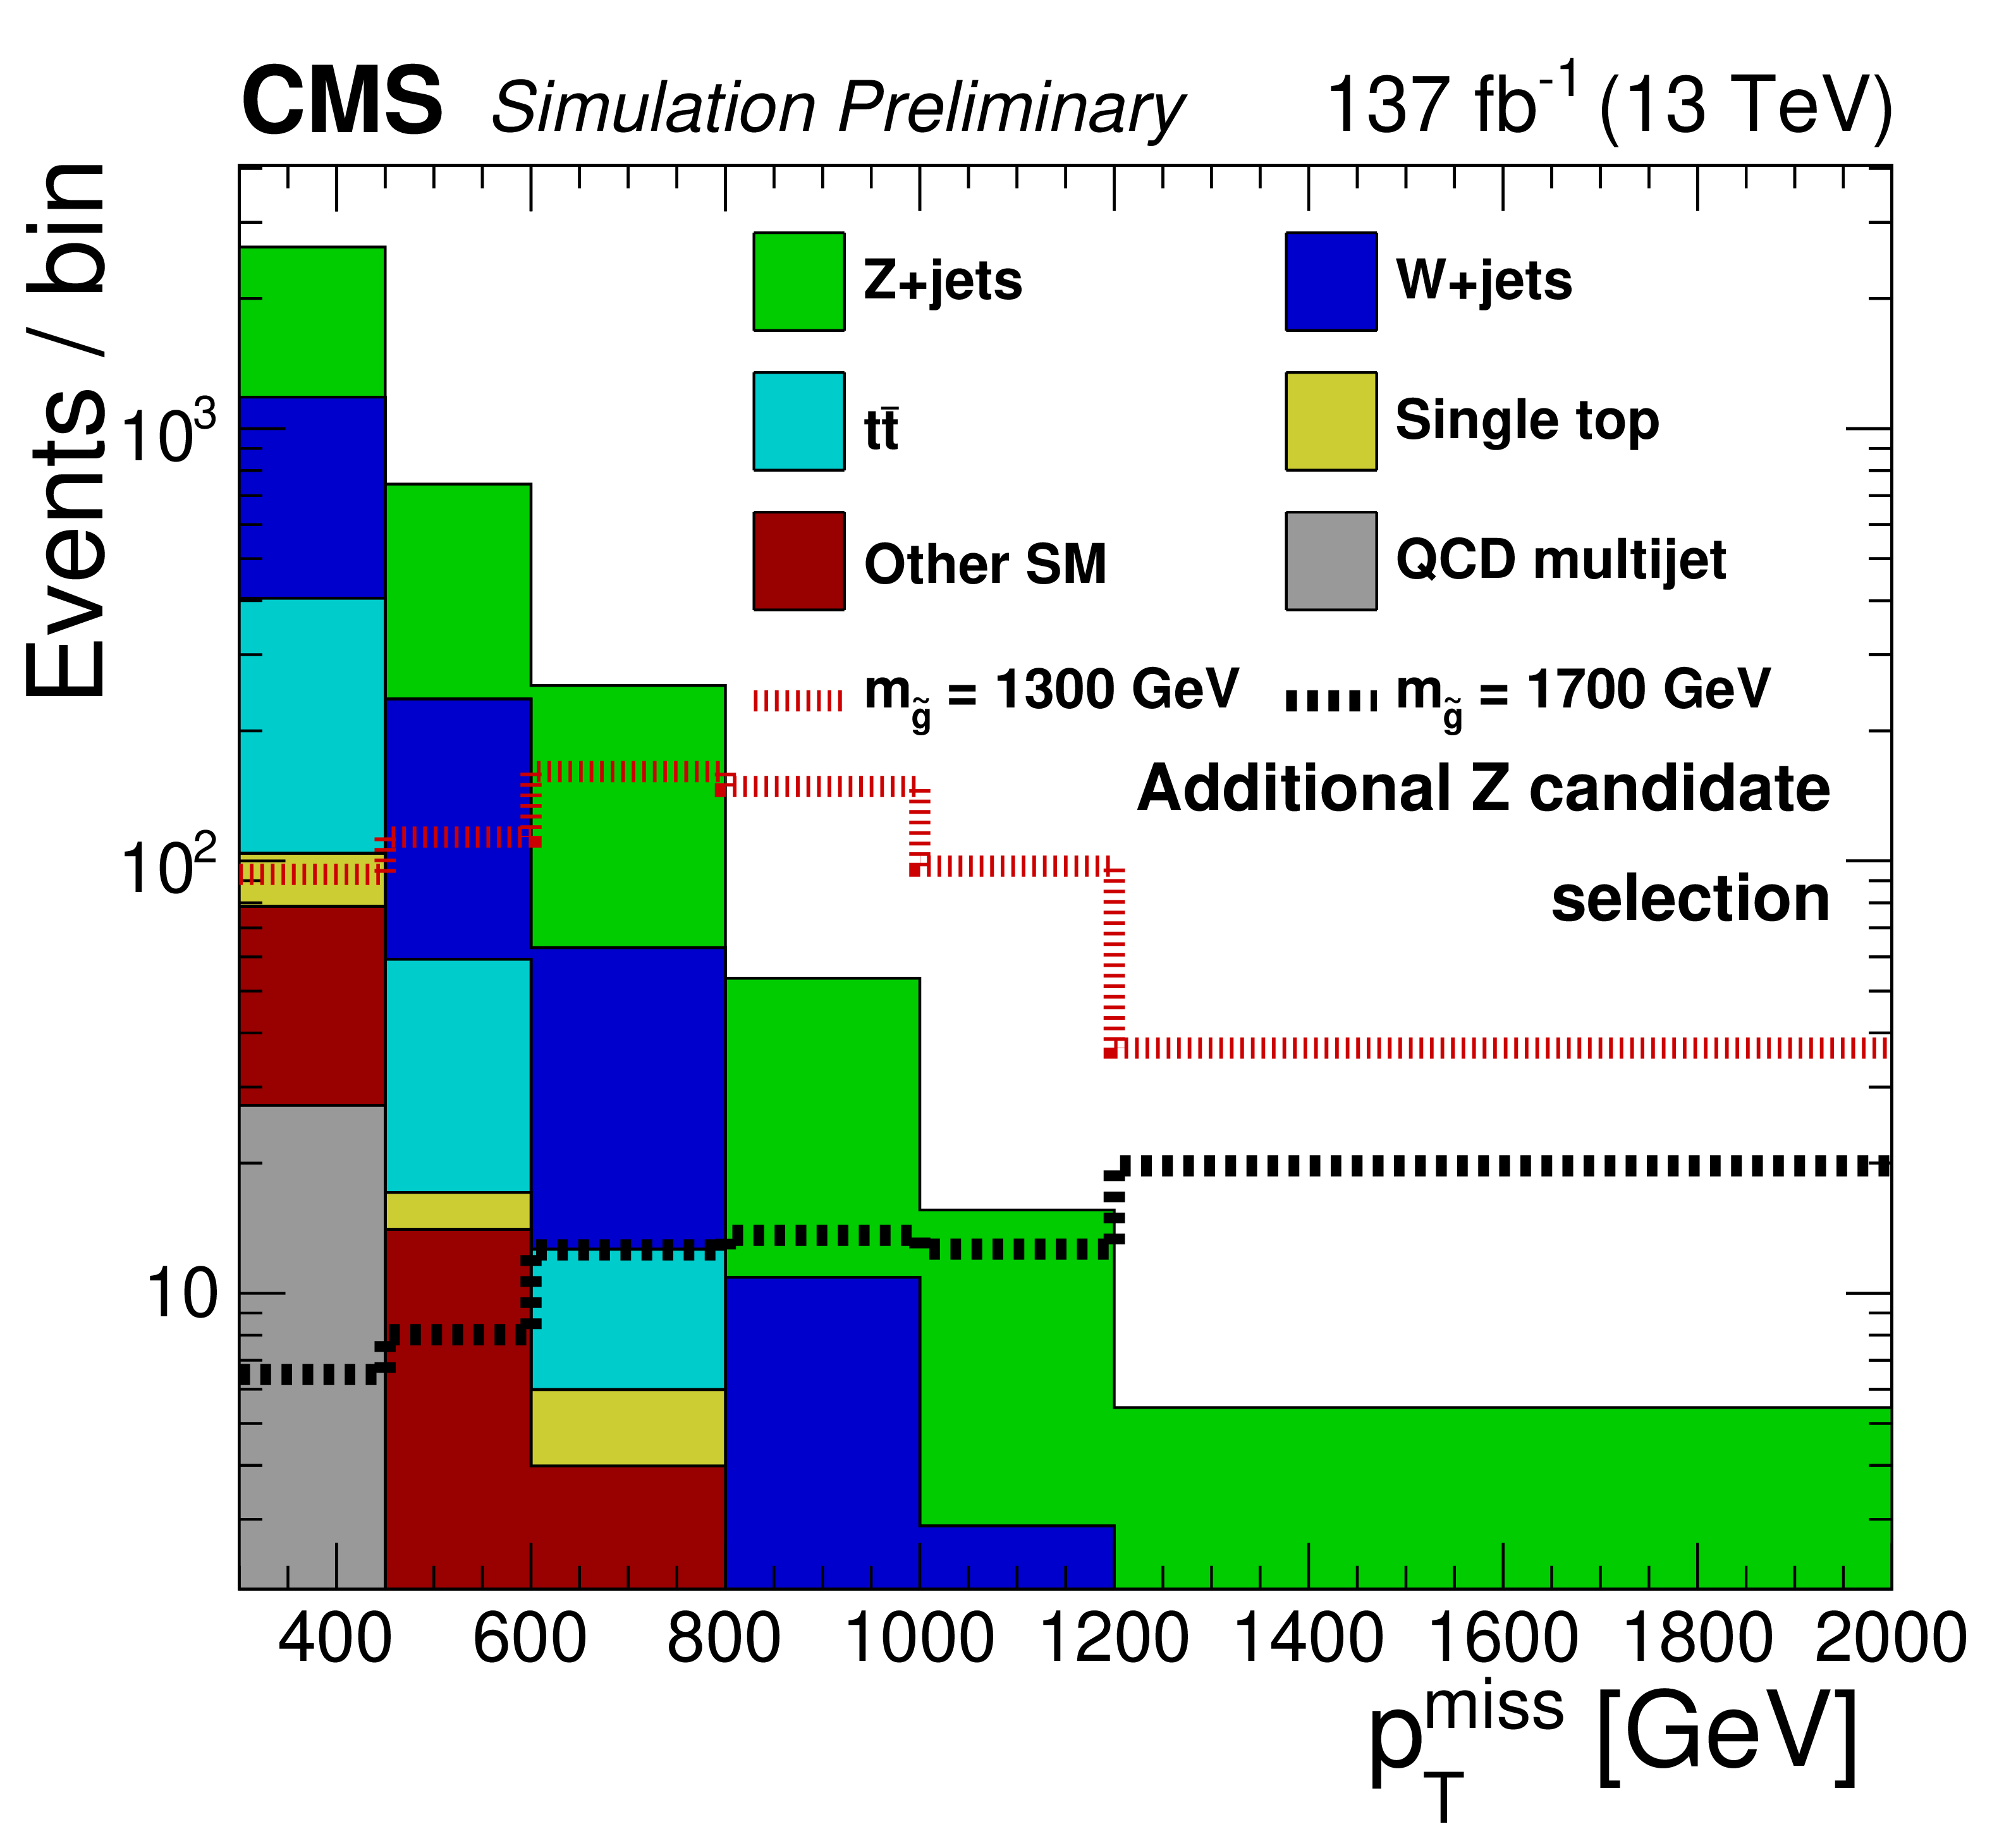
Figure 2-b:
Distributions of ${{p_{\mathrm {T}}} ^\text {miss}}$ for simulated SM backgrounds (stacked histograms), with only the hadronic baseline selection (left), and after the additional Z candidate selection (right). Expected signal contributions for two example mass points (dotted lines) are also shown. The last bin includes overflow events. |
png pdf |
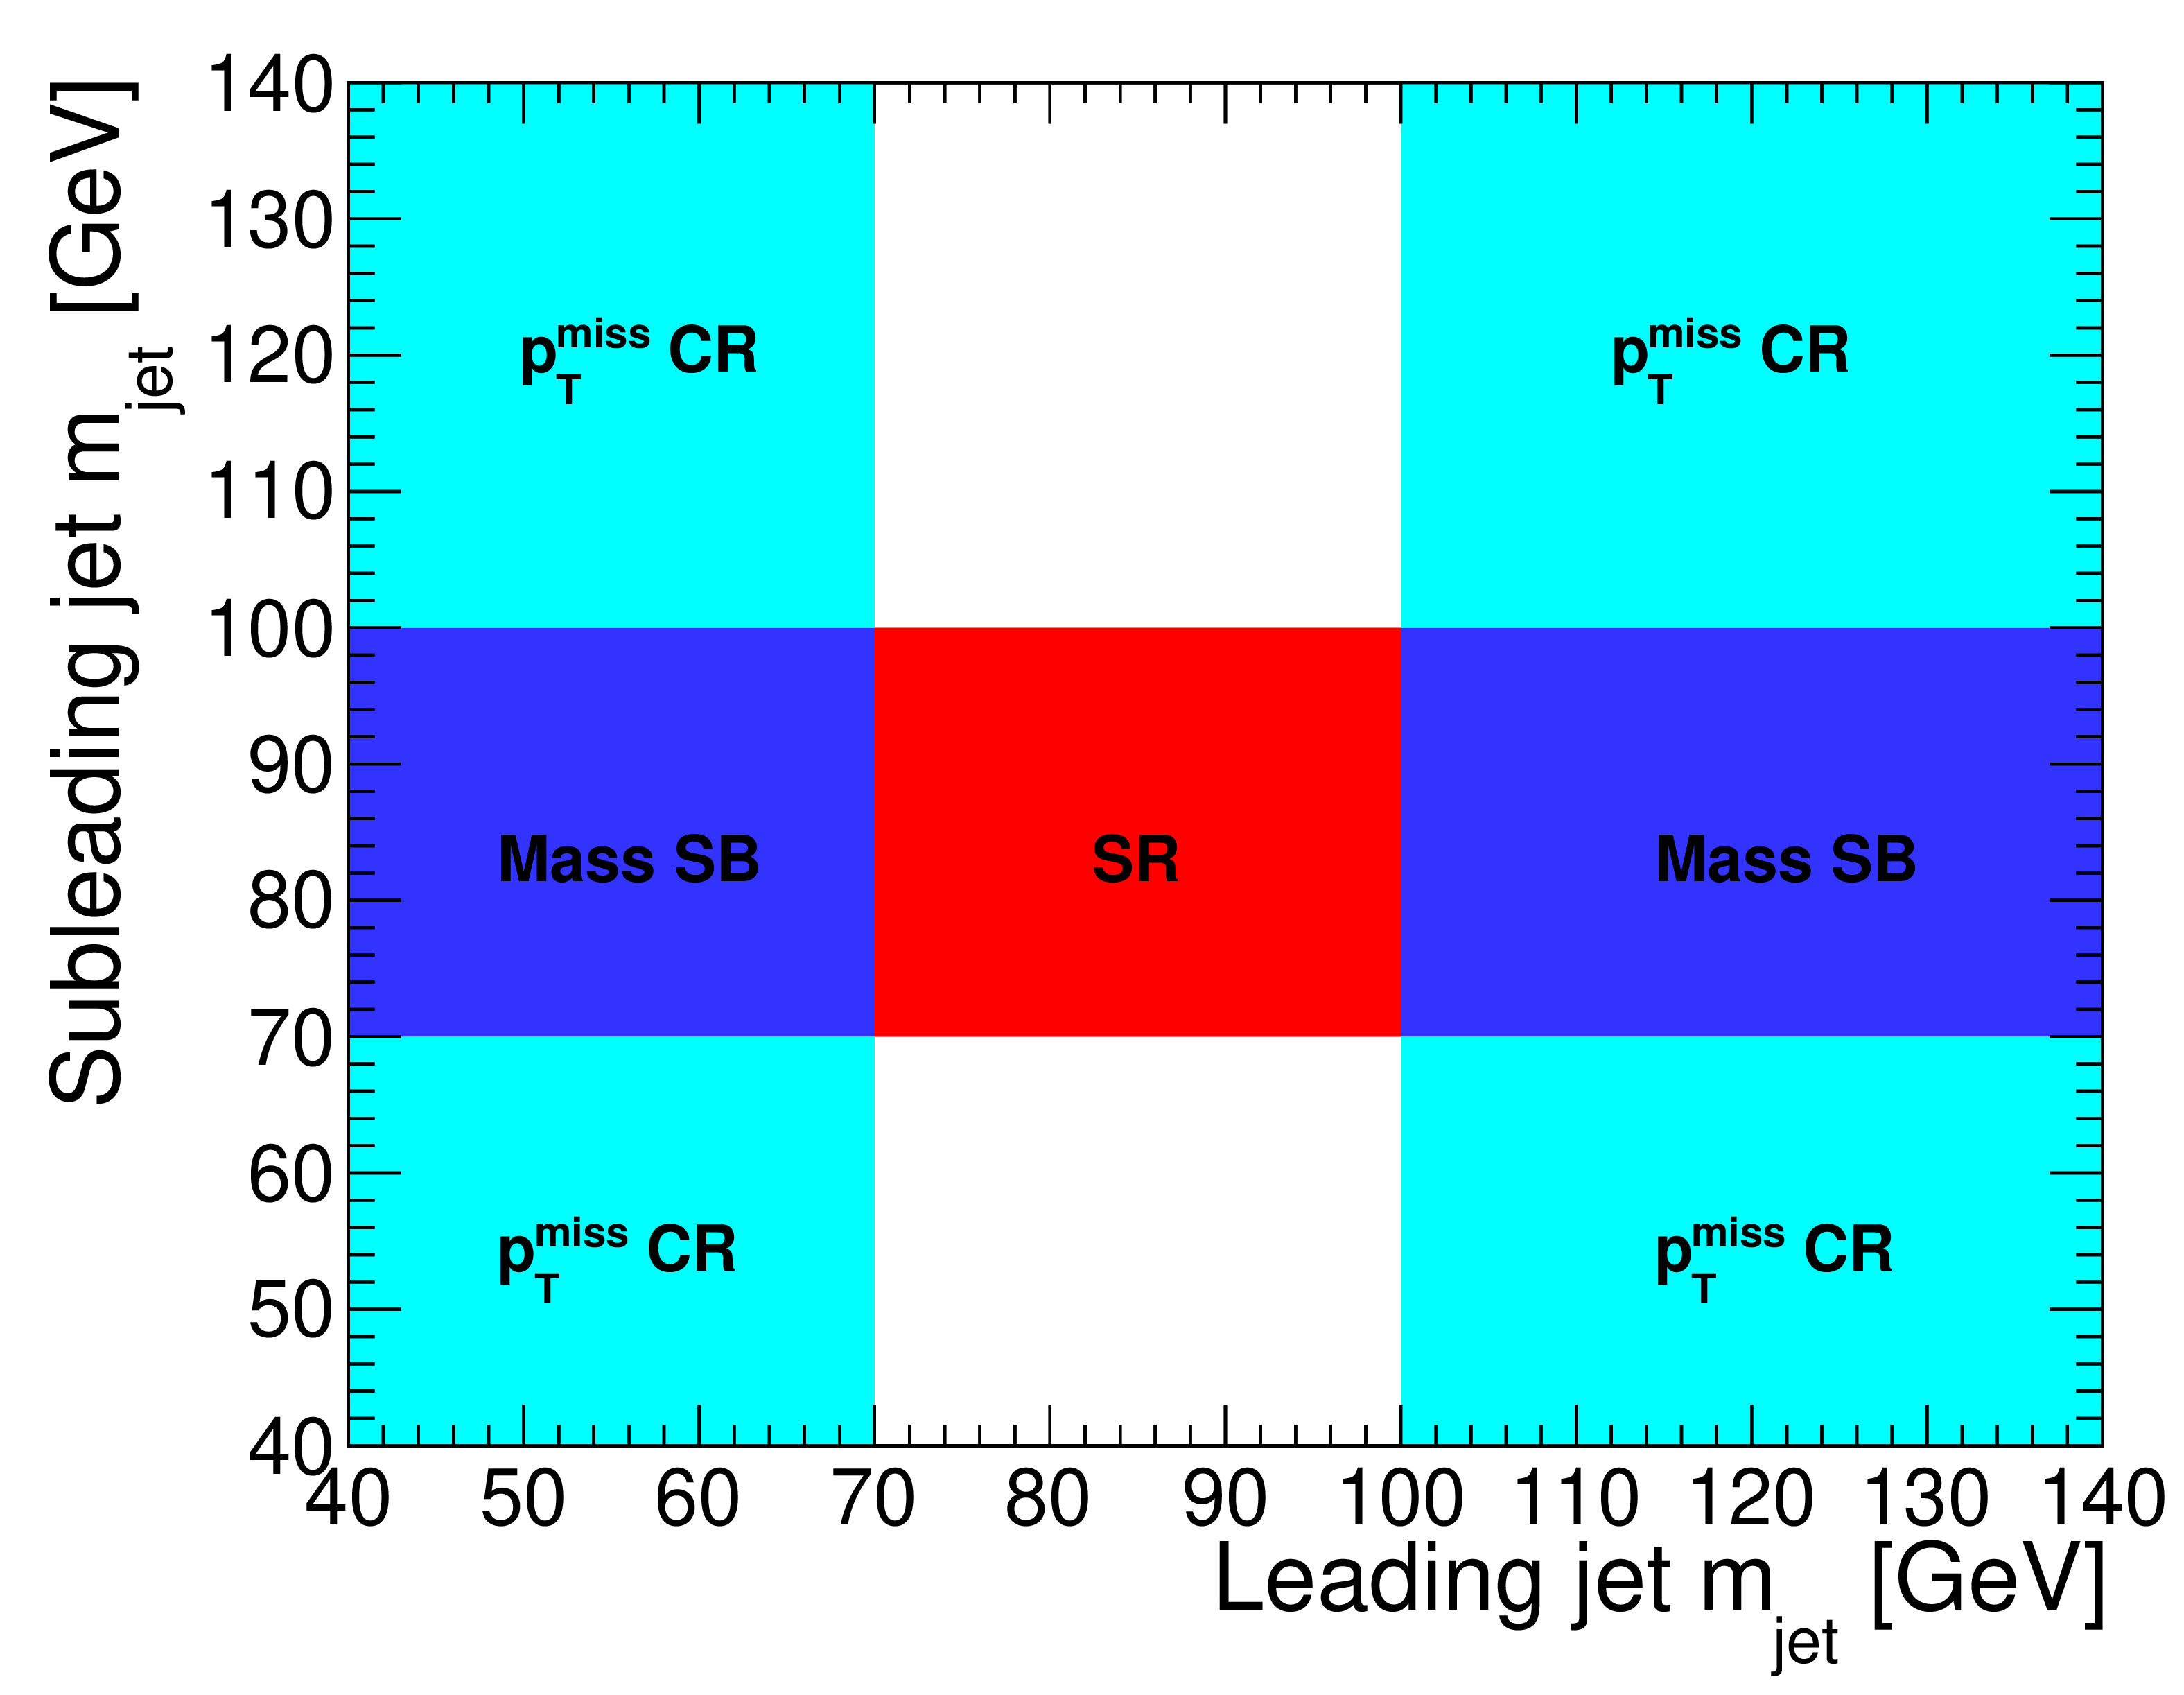
Figure 3:
Definition of the search and control regions in the plane of subleading- vs leading-jet ${m_{\text {jet}}}$. The search region (red), with both ${m_{\text {jet}}}$ values lying within the Z signal window, defines the acceptance for potential signal; the leading-jet mass sideband (dark blue), with subleading jet within and leading jet outside the window, is used to measure the background normalization; the ${{p_{\mathrm {T}}} ^\text {miss}}$ control region (light blue), with both leading- and subleading-jet ${m_{\text {jet}}}$ values lying outside the Z signal window, is used to derive the ${{p_{\mathrm {T}}} ^\text {miss}}$ shape in the search region. |
png pdf |
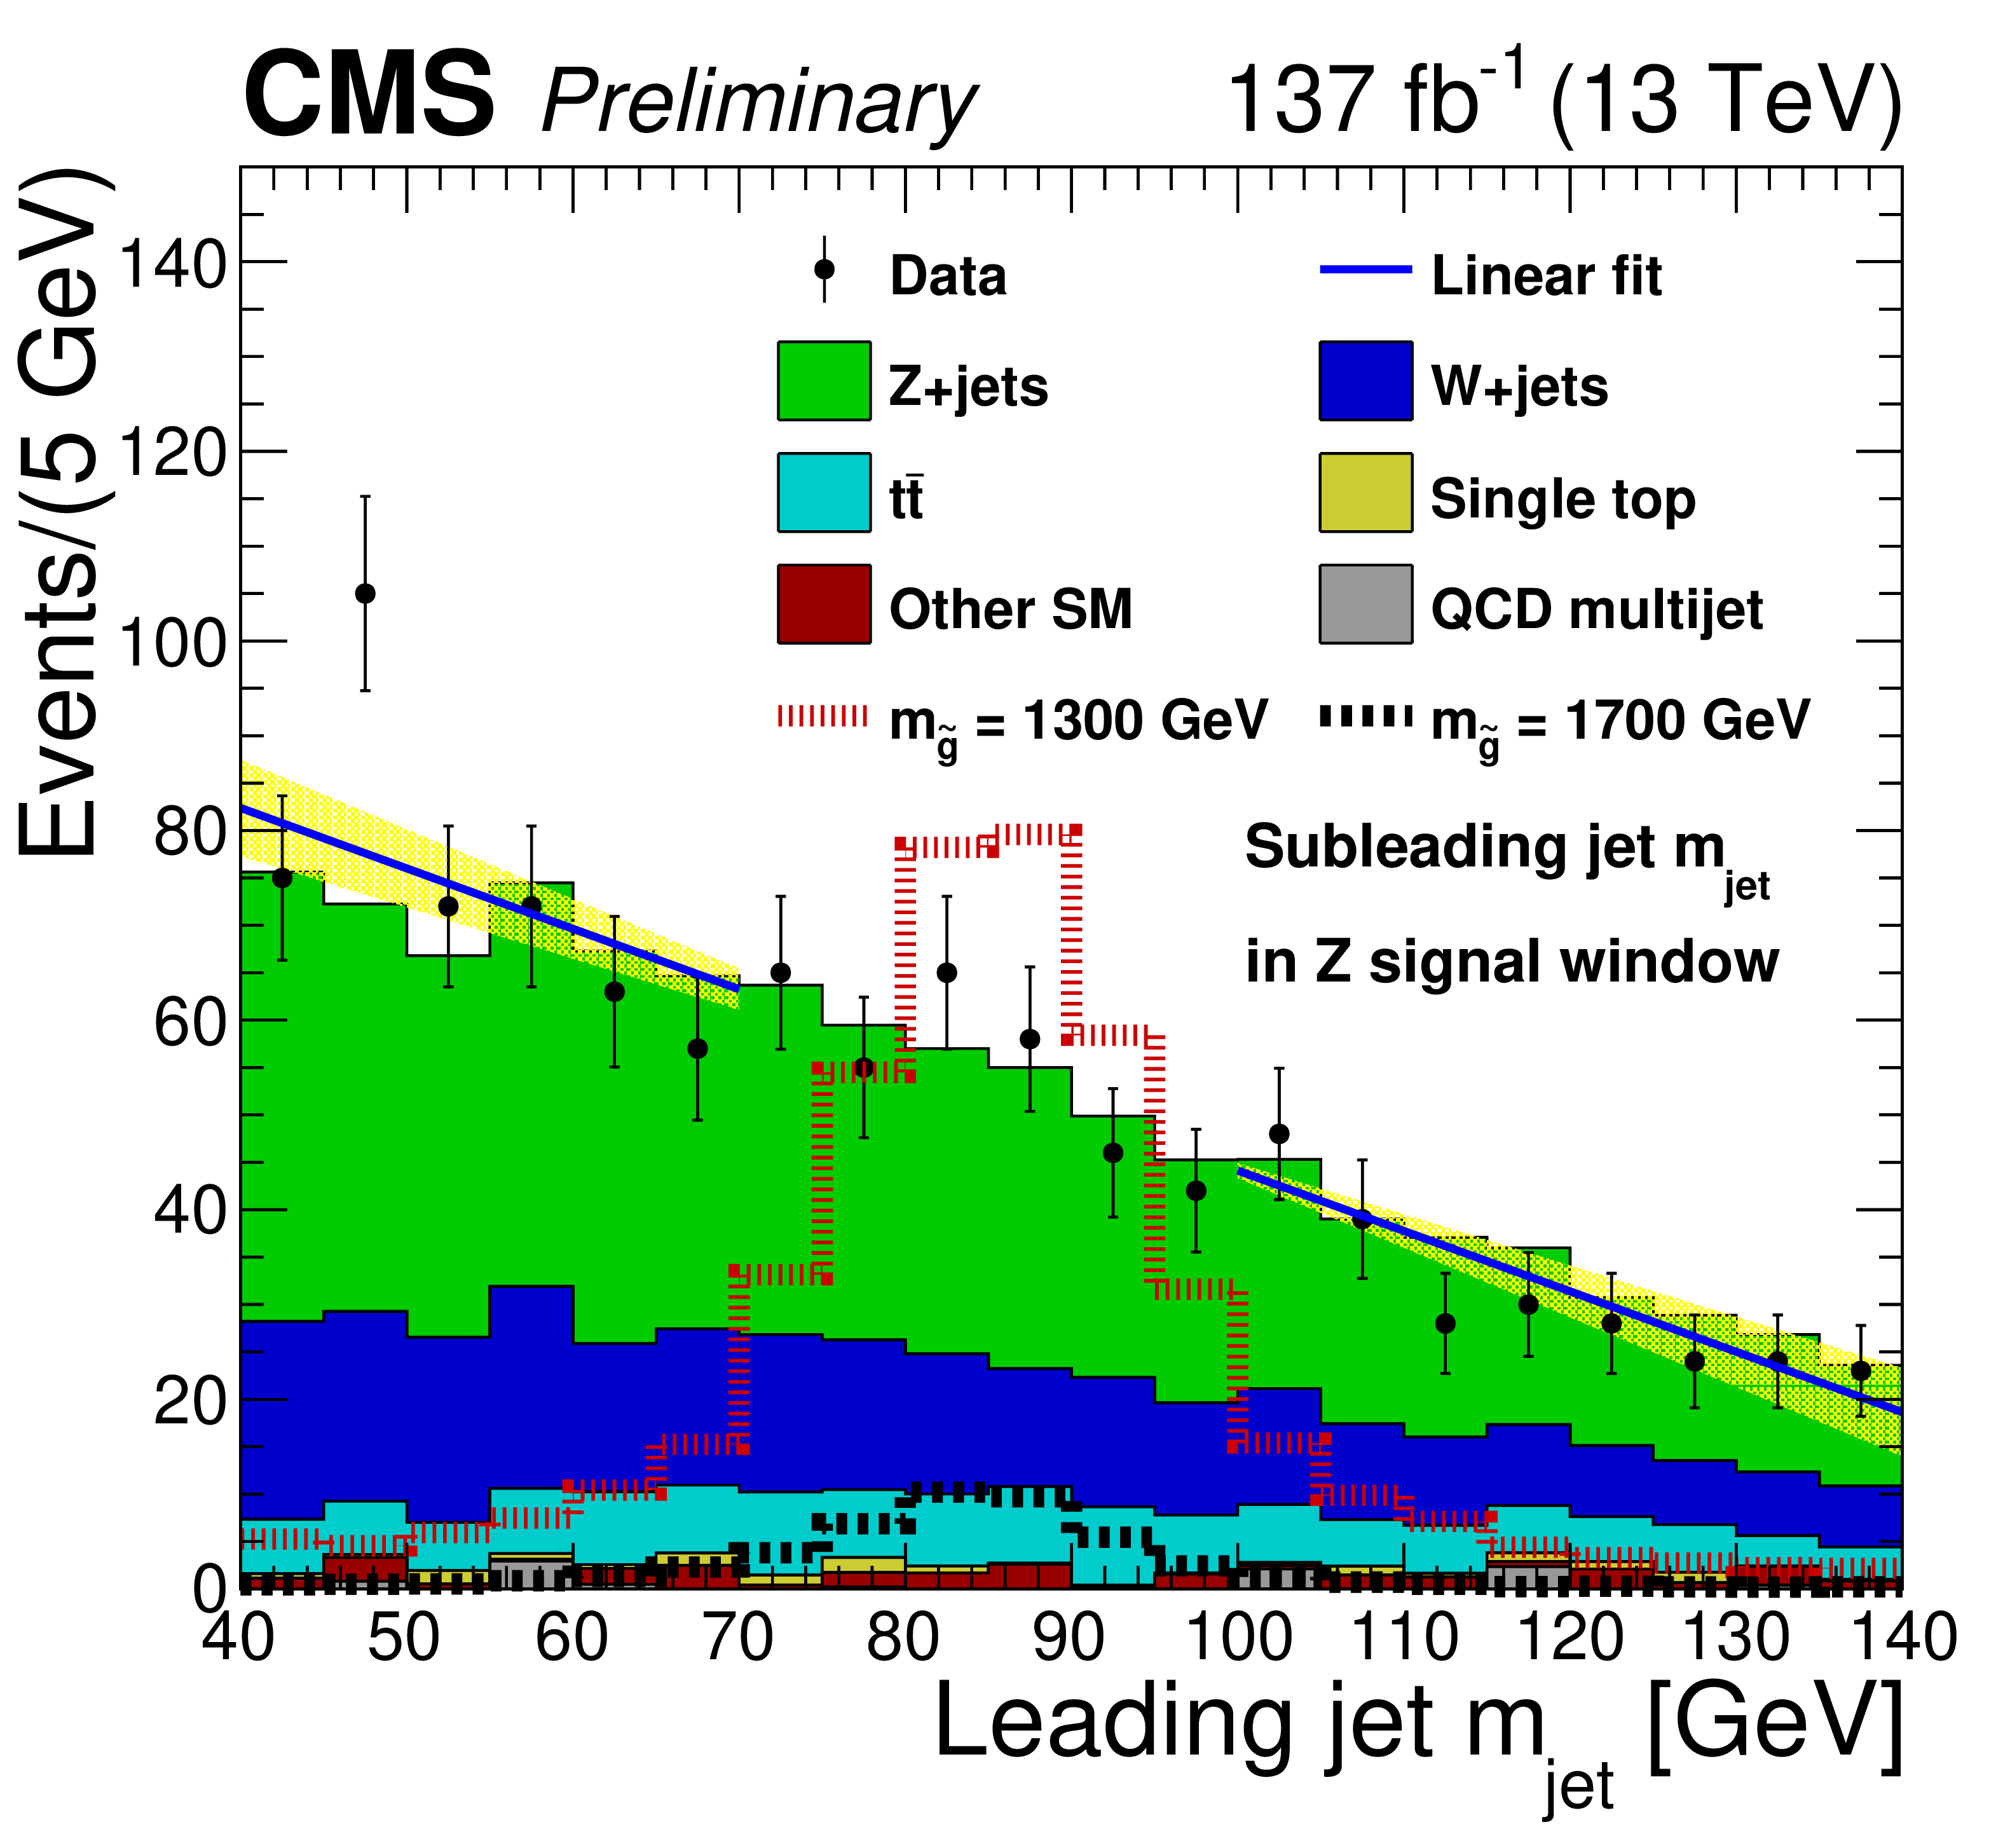
Figure 4:
Leading AK8 jet ${m_{\text {jet}}}$ shape fit in the mass sidebands. The Z-candidate selection is applied and the subleading AK8 jet ${m_{\text {jet}}}$ value is required to lie in the Z signal window. The yellow band represents the $ \pm $1$ \sigma $ uncertainty in the fit to the mass sideband performed with a linear function, which is indicated by the blue line. The stacked histogram shows the background from simulation scaled to the data. |
png pdf |
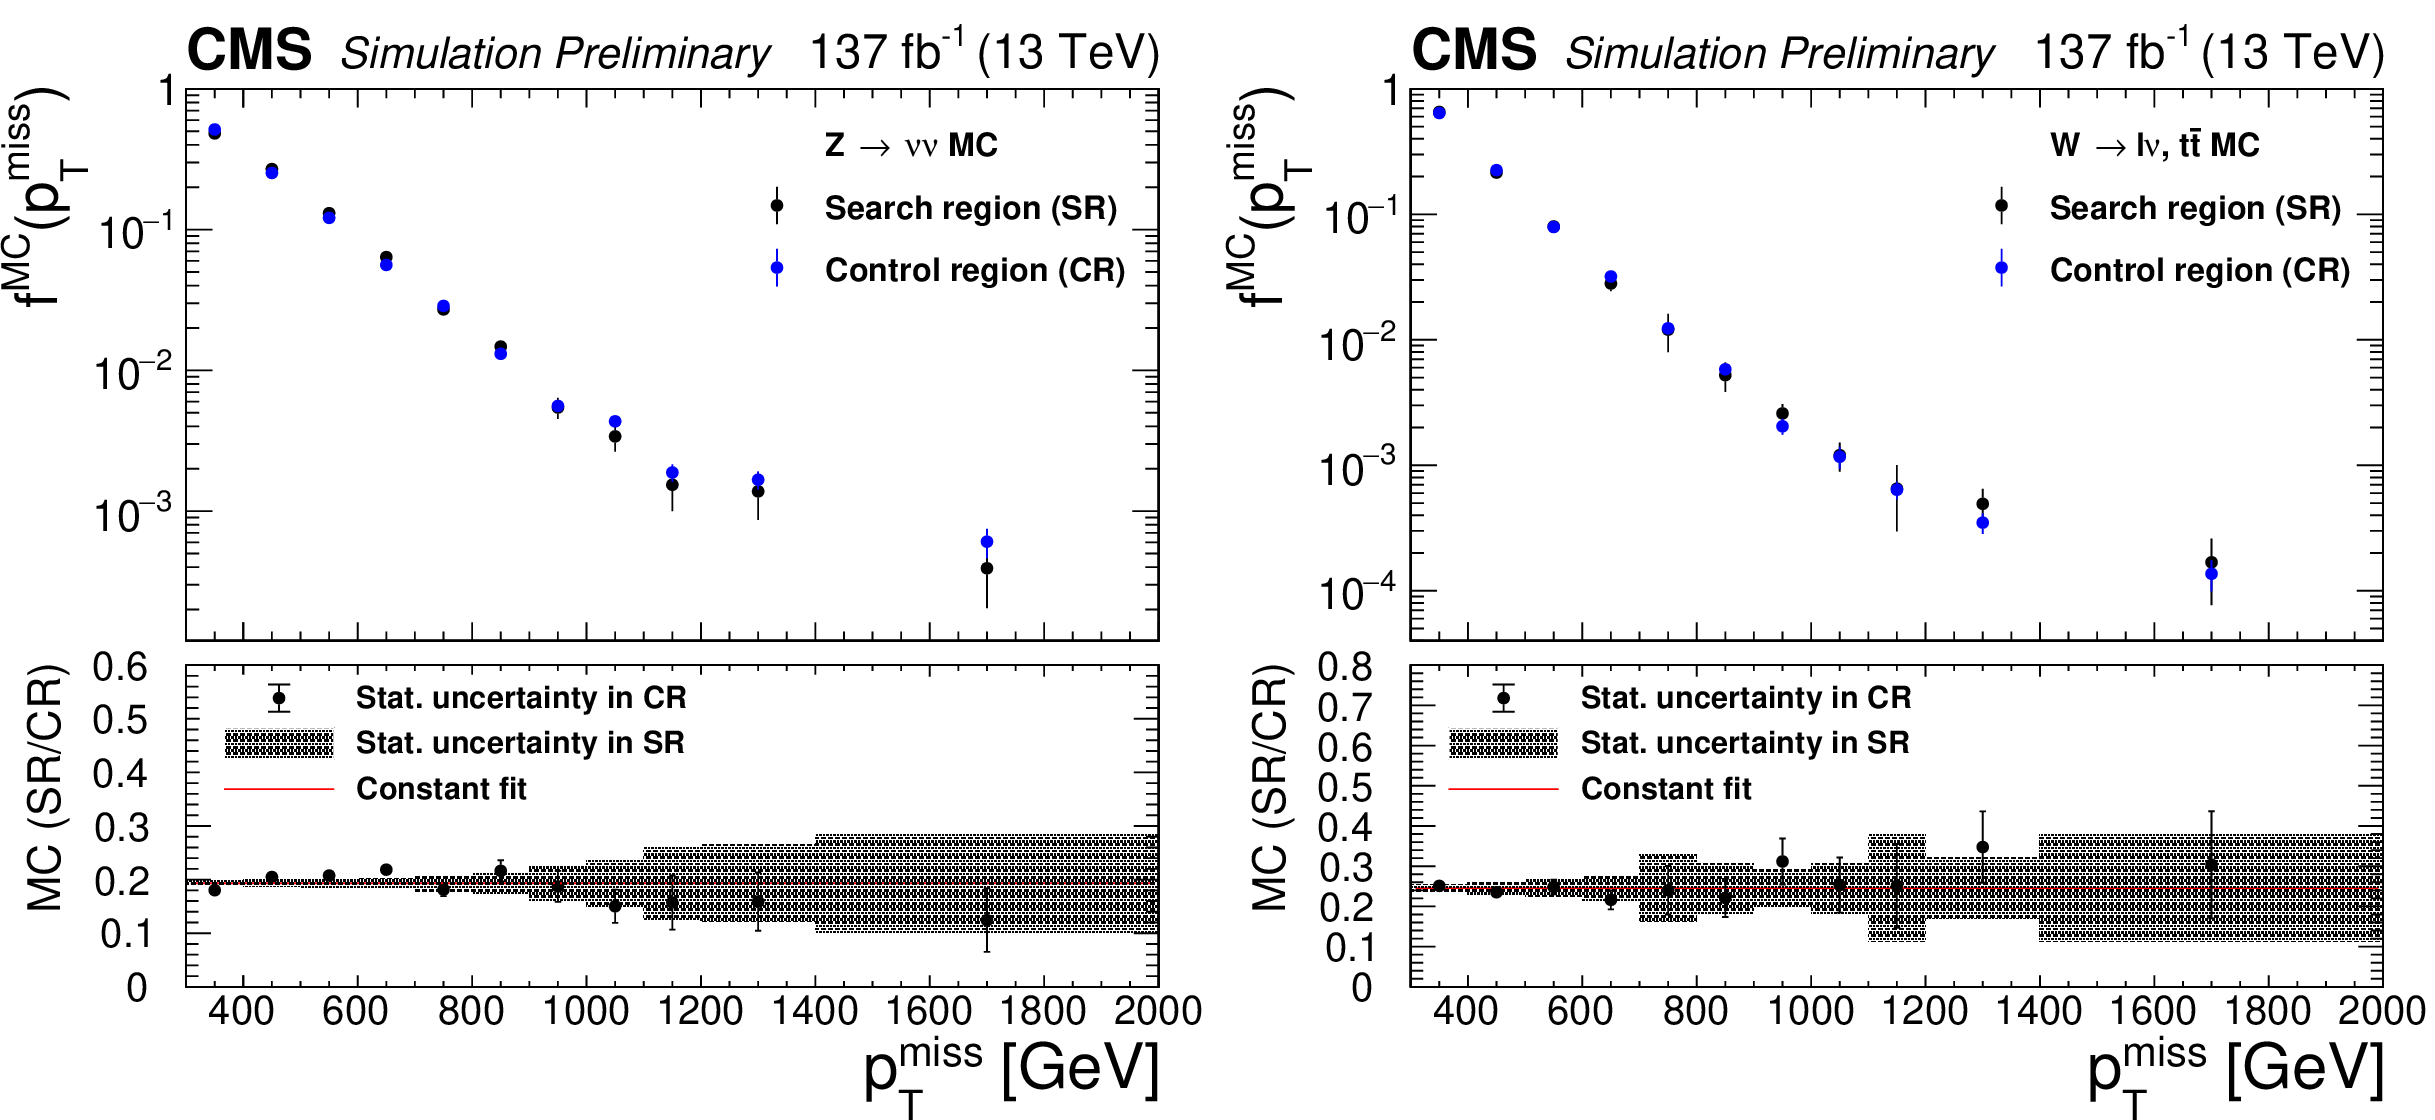
Figure 5:
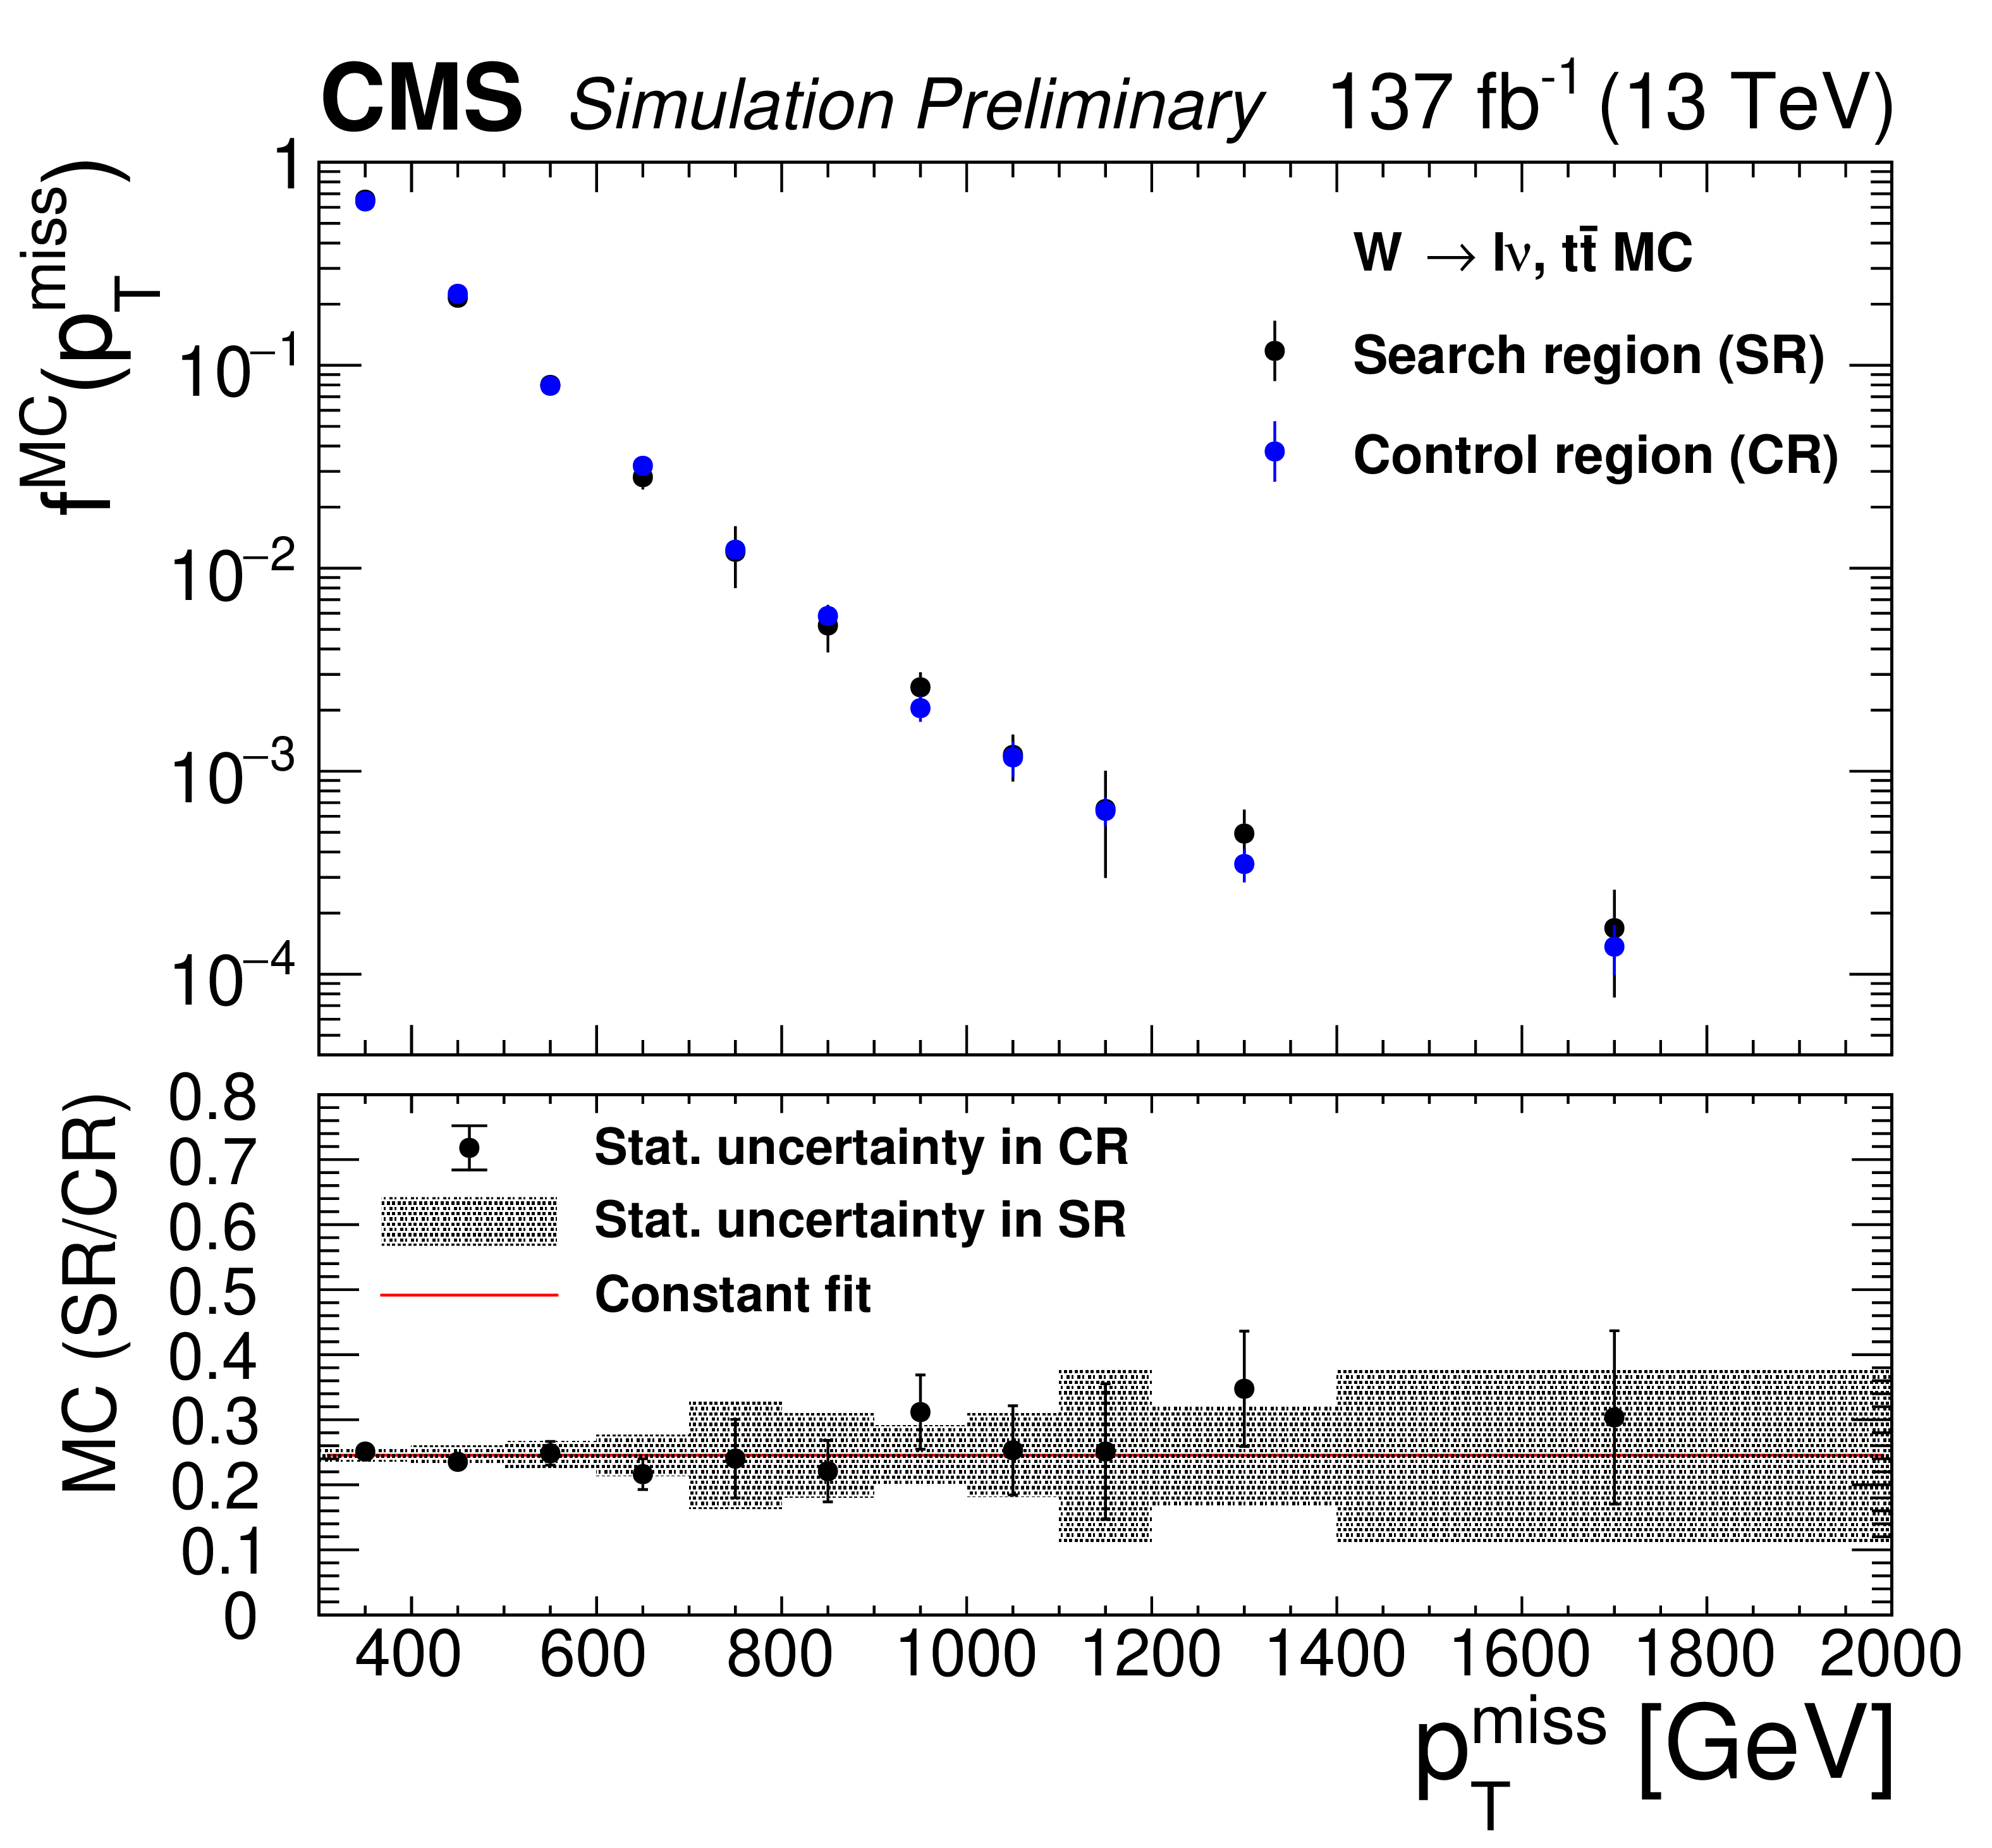
Comparison of the ${{p_{\mathrm {T}}} ^\text {miss}}$ shape in the search and control regions. The top panels show the unit-normalized ${{p_{\mathrm {T}}} ^\text {miss}}$ distributions $f^{\text {MC}}({{p_{\mathrm {T}}} ^\text {miss}})$ in the two regions while the bottom panels show the ratio of the number of events in the search region to that in the control region. This comparison is done for two main background components: ${{\mathrm{Z}} \rightarrow \nu \overline {\nu}}$ (left), and ${\mathrm{t} \mathrm{\bar{t}}}$ plus W+jets (right). A fit to a constant is included in the bottom panels to show the average ratio. |
png pdf |
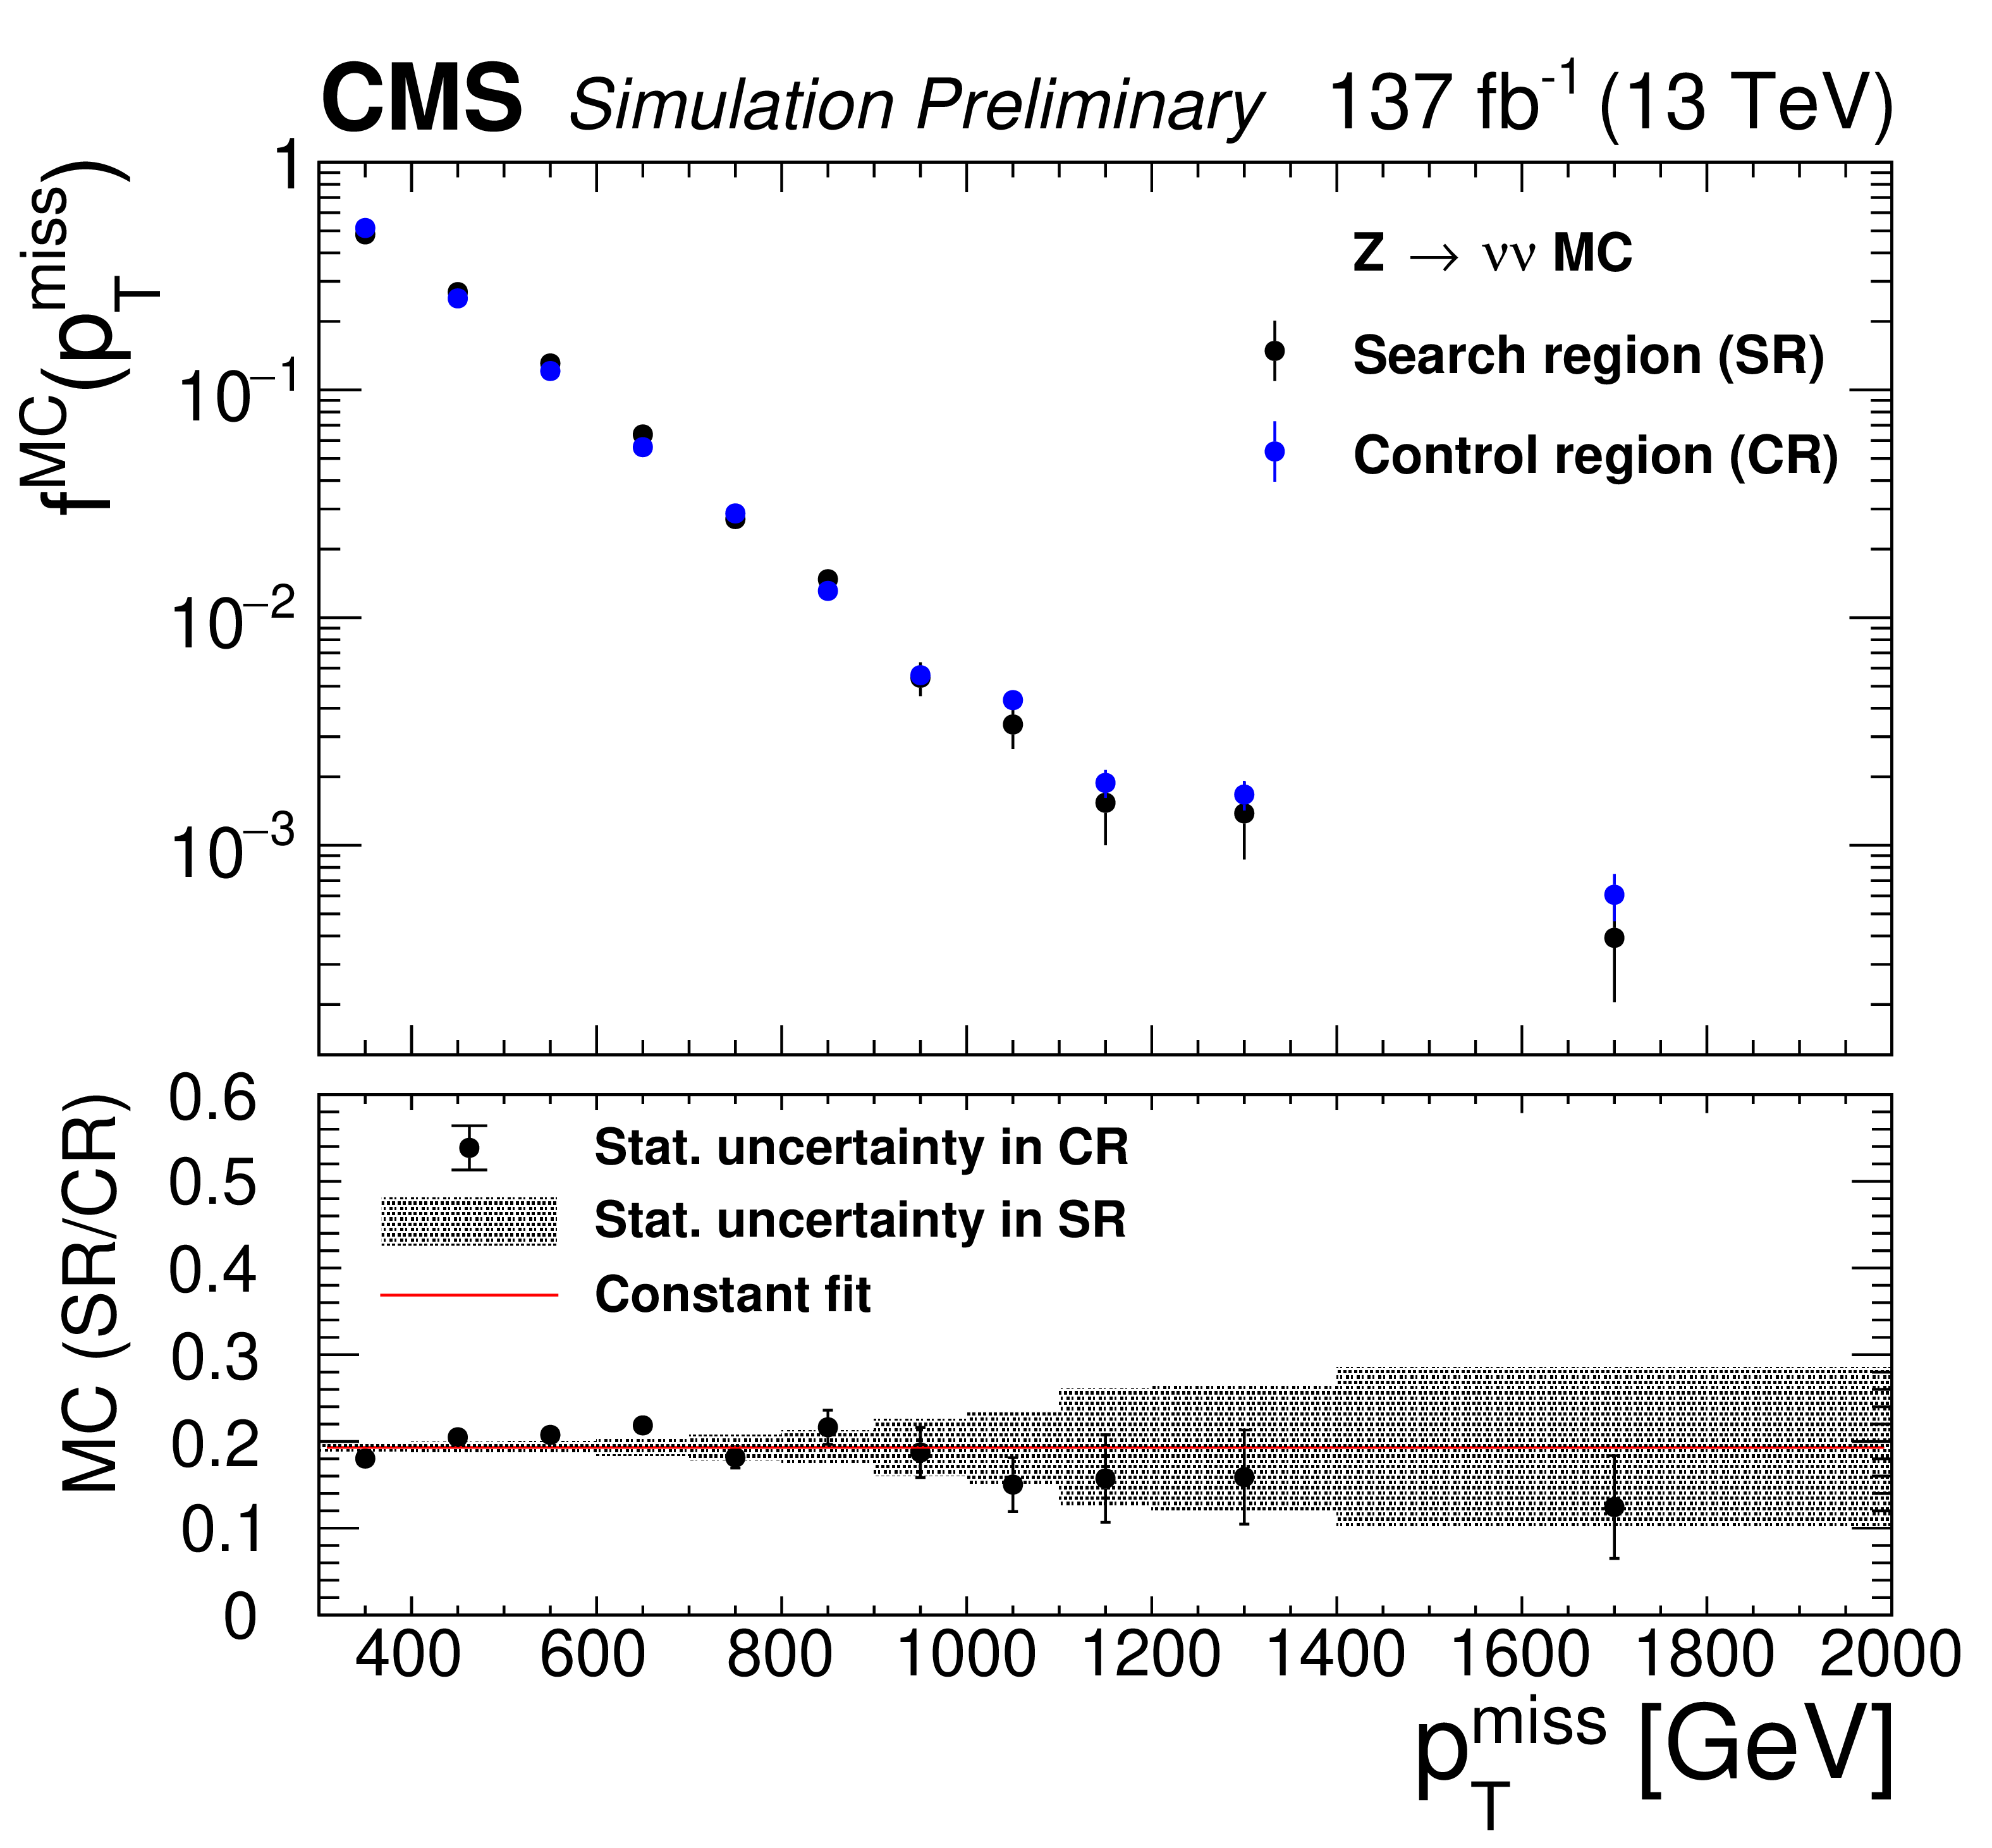
Figure 5-a:
Comparison of the ${{p_{\mathrm {T}}} ^\text {miss}}$ shape in the search and control regions. The top panels show the unit-normalized ${{p_{\mathrm {T}}} ^\text {miss}}$ distributions $f^{\text {MC}}({{p_{\mathrm {T}}} ^\text {miss}})$ in the two regions while the bottom panels show the ratio of the number of events in the search region to that in the control region. This comparison is done for two main background components: ${{\mathrm{Z}} \rightarrow \nu \overline {\nu}}$ (left), and ${\mathrm{t} \mathrm{\bar{t}}}$ plus W+jets (right). A fit to a constant is included in the bottom panels to show the average ratio. |
png pdf |
Figure 5-b:
Comparison of the ${{p_{\mathrm {T}}} ^\text {miss}}$ shape in the search and control regions. The top panels show the unit-normalized ${{p_{\mathrm {T}}} ^\text {miss}}$ distributions $f^{\text {MC}}({{p_{\mathrm {T}}} ^\text {miss}})$ in the two regions while the bottom panels show the ratio of the number of events in the search region to that in the control region. This comparison is done for two main background components: ${{\mathrm{Z}} \rightarrow \nu \overline {\nu}}$ (left), and ${\mathrm{t} \mathrm{\bar{t}}}$ plus W+jets (right). A fit to a constant is included in the bottom panels to show the average ratio. |
png pdf |
Figure 6:
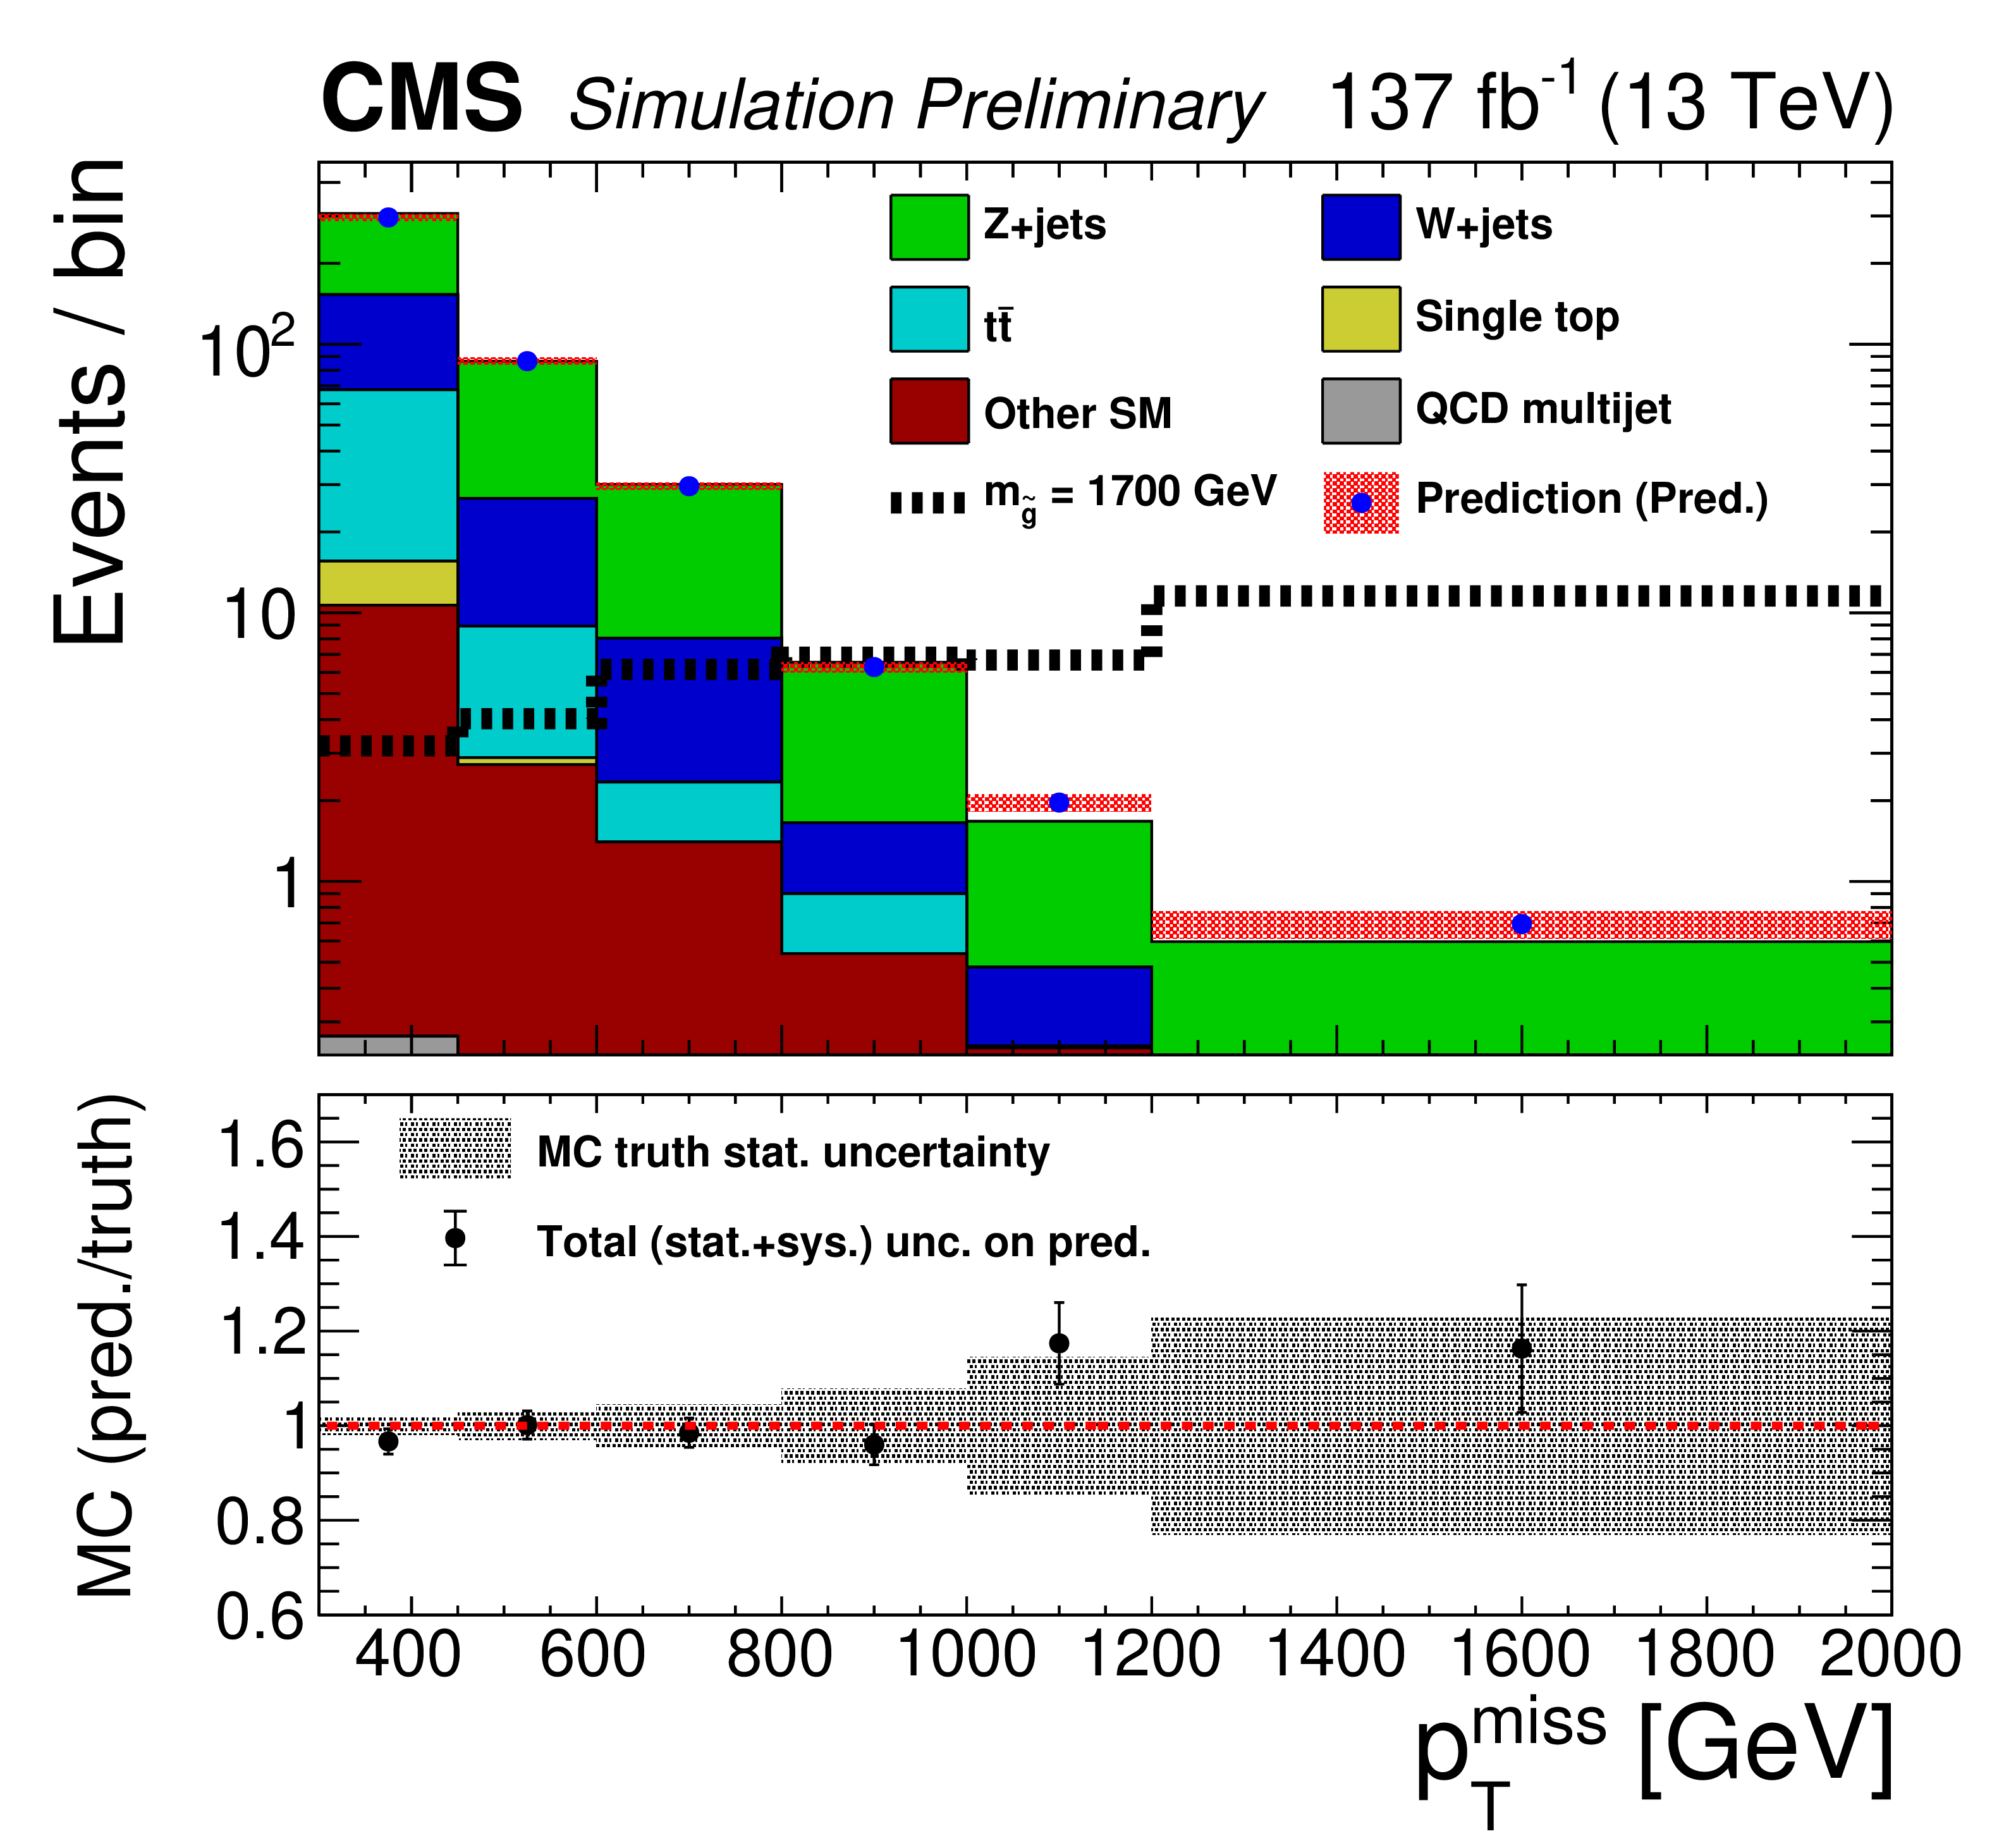
Results of the closure test in which the data-driven prediction method applied to simulation is compared with the direct yield, in the analysis search bins. The lower panel shows the ratio of the prediction to the direct yield. The grey band shows the statistical uncertainty in the direct yield, and the error bars on the points represent the total uncertainty in the prediction. |
png pdf |
Figure 7:
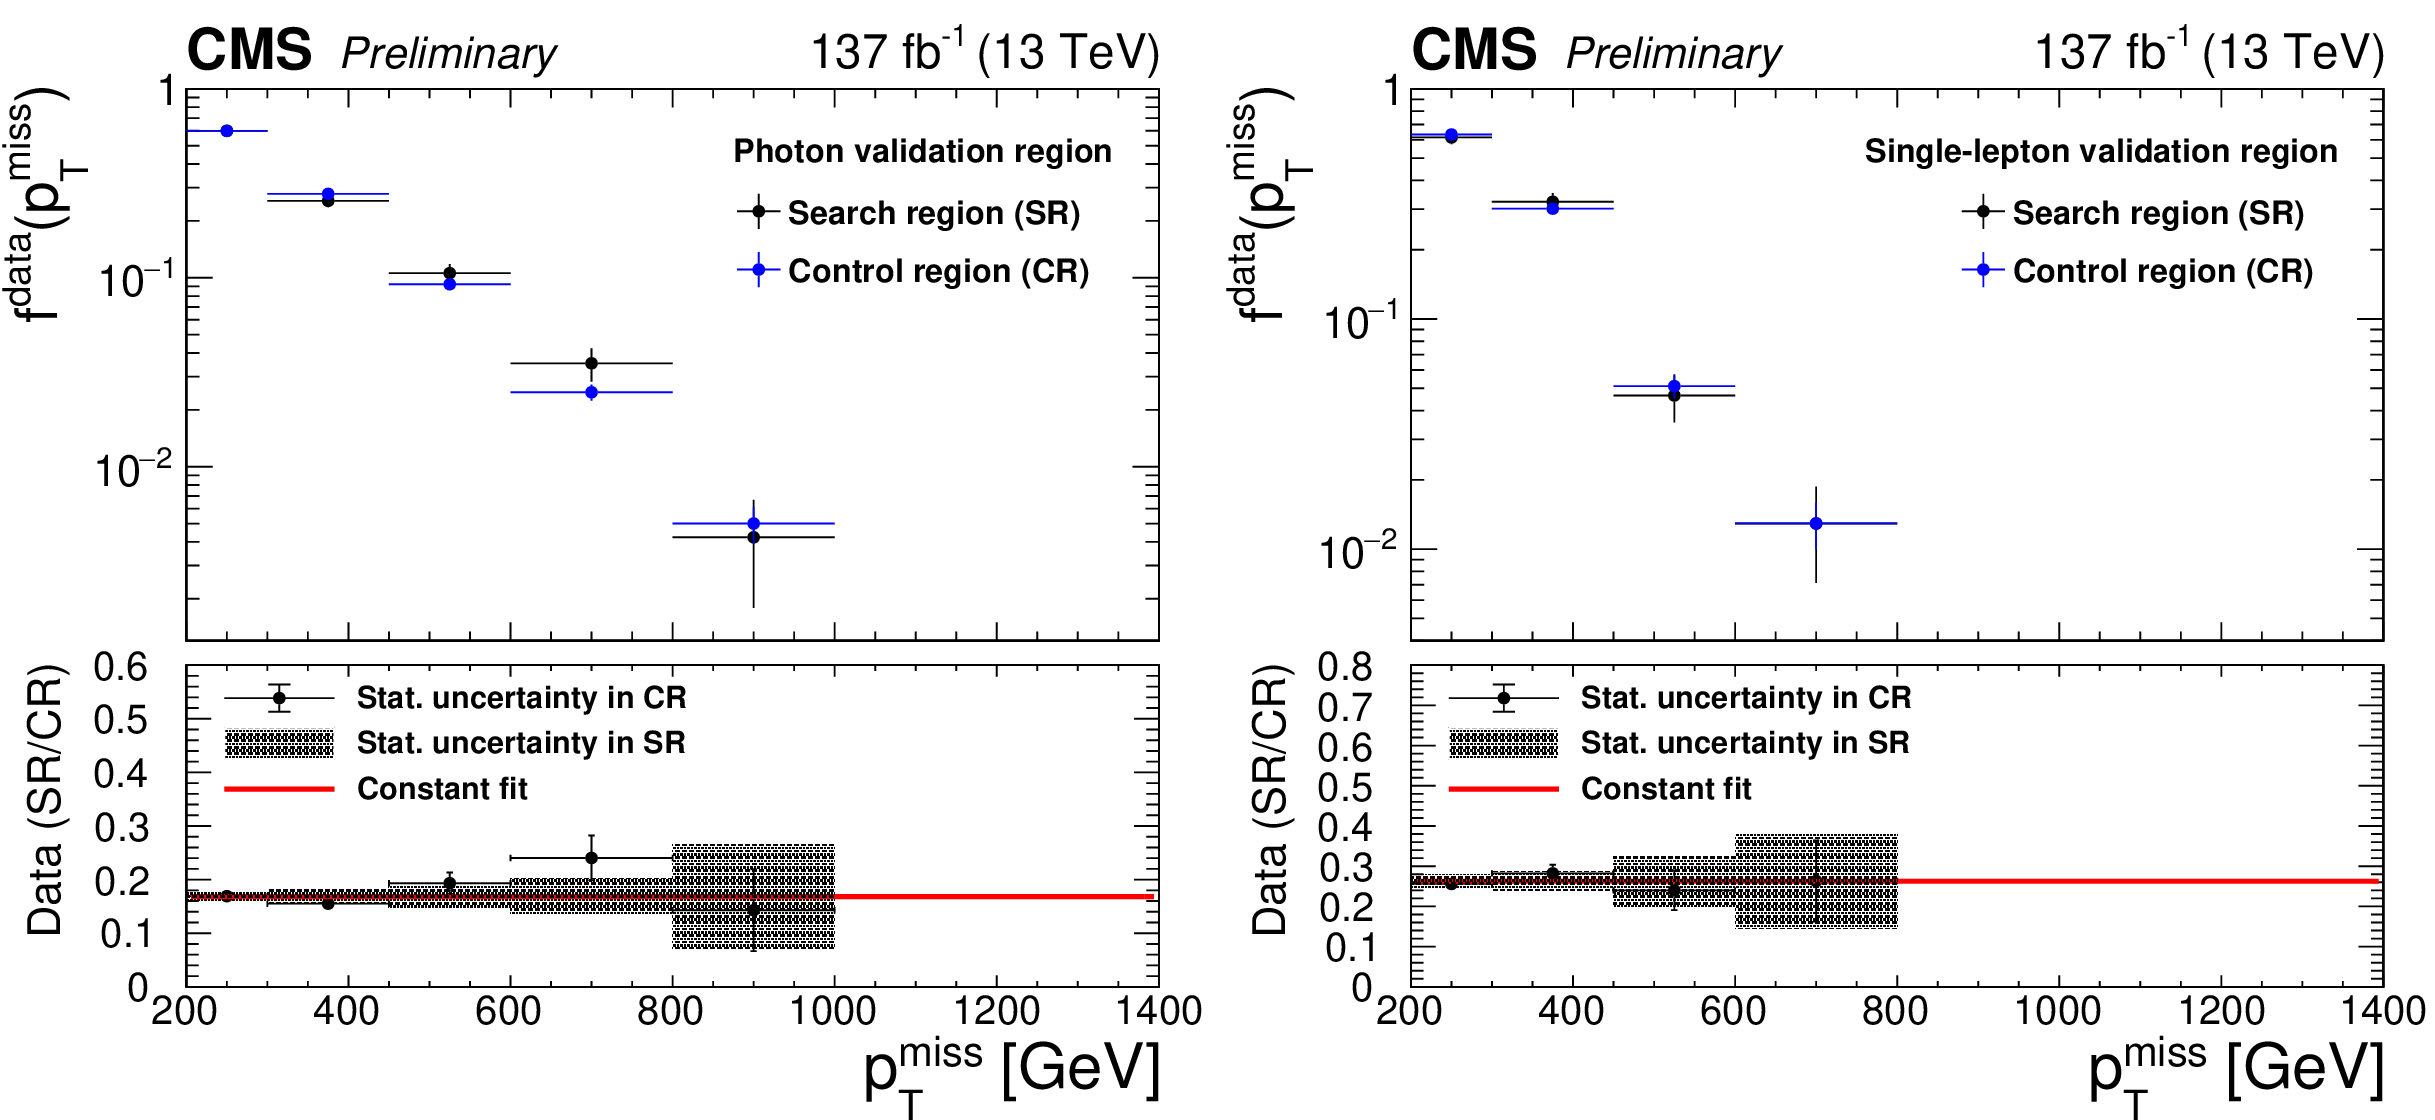
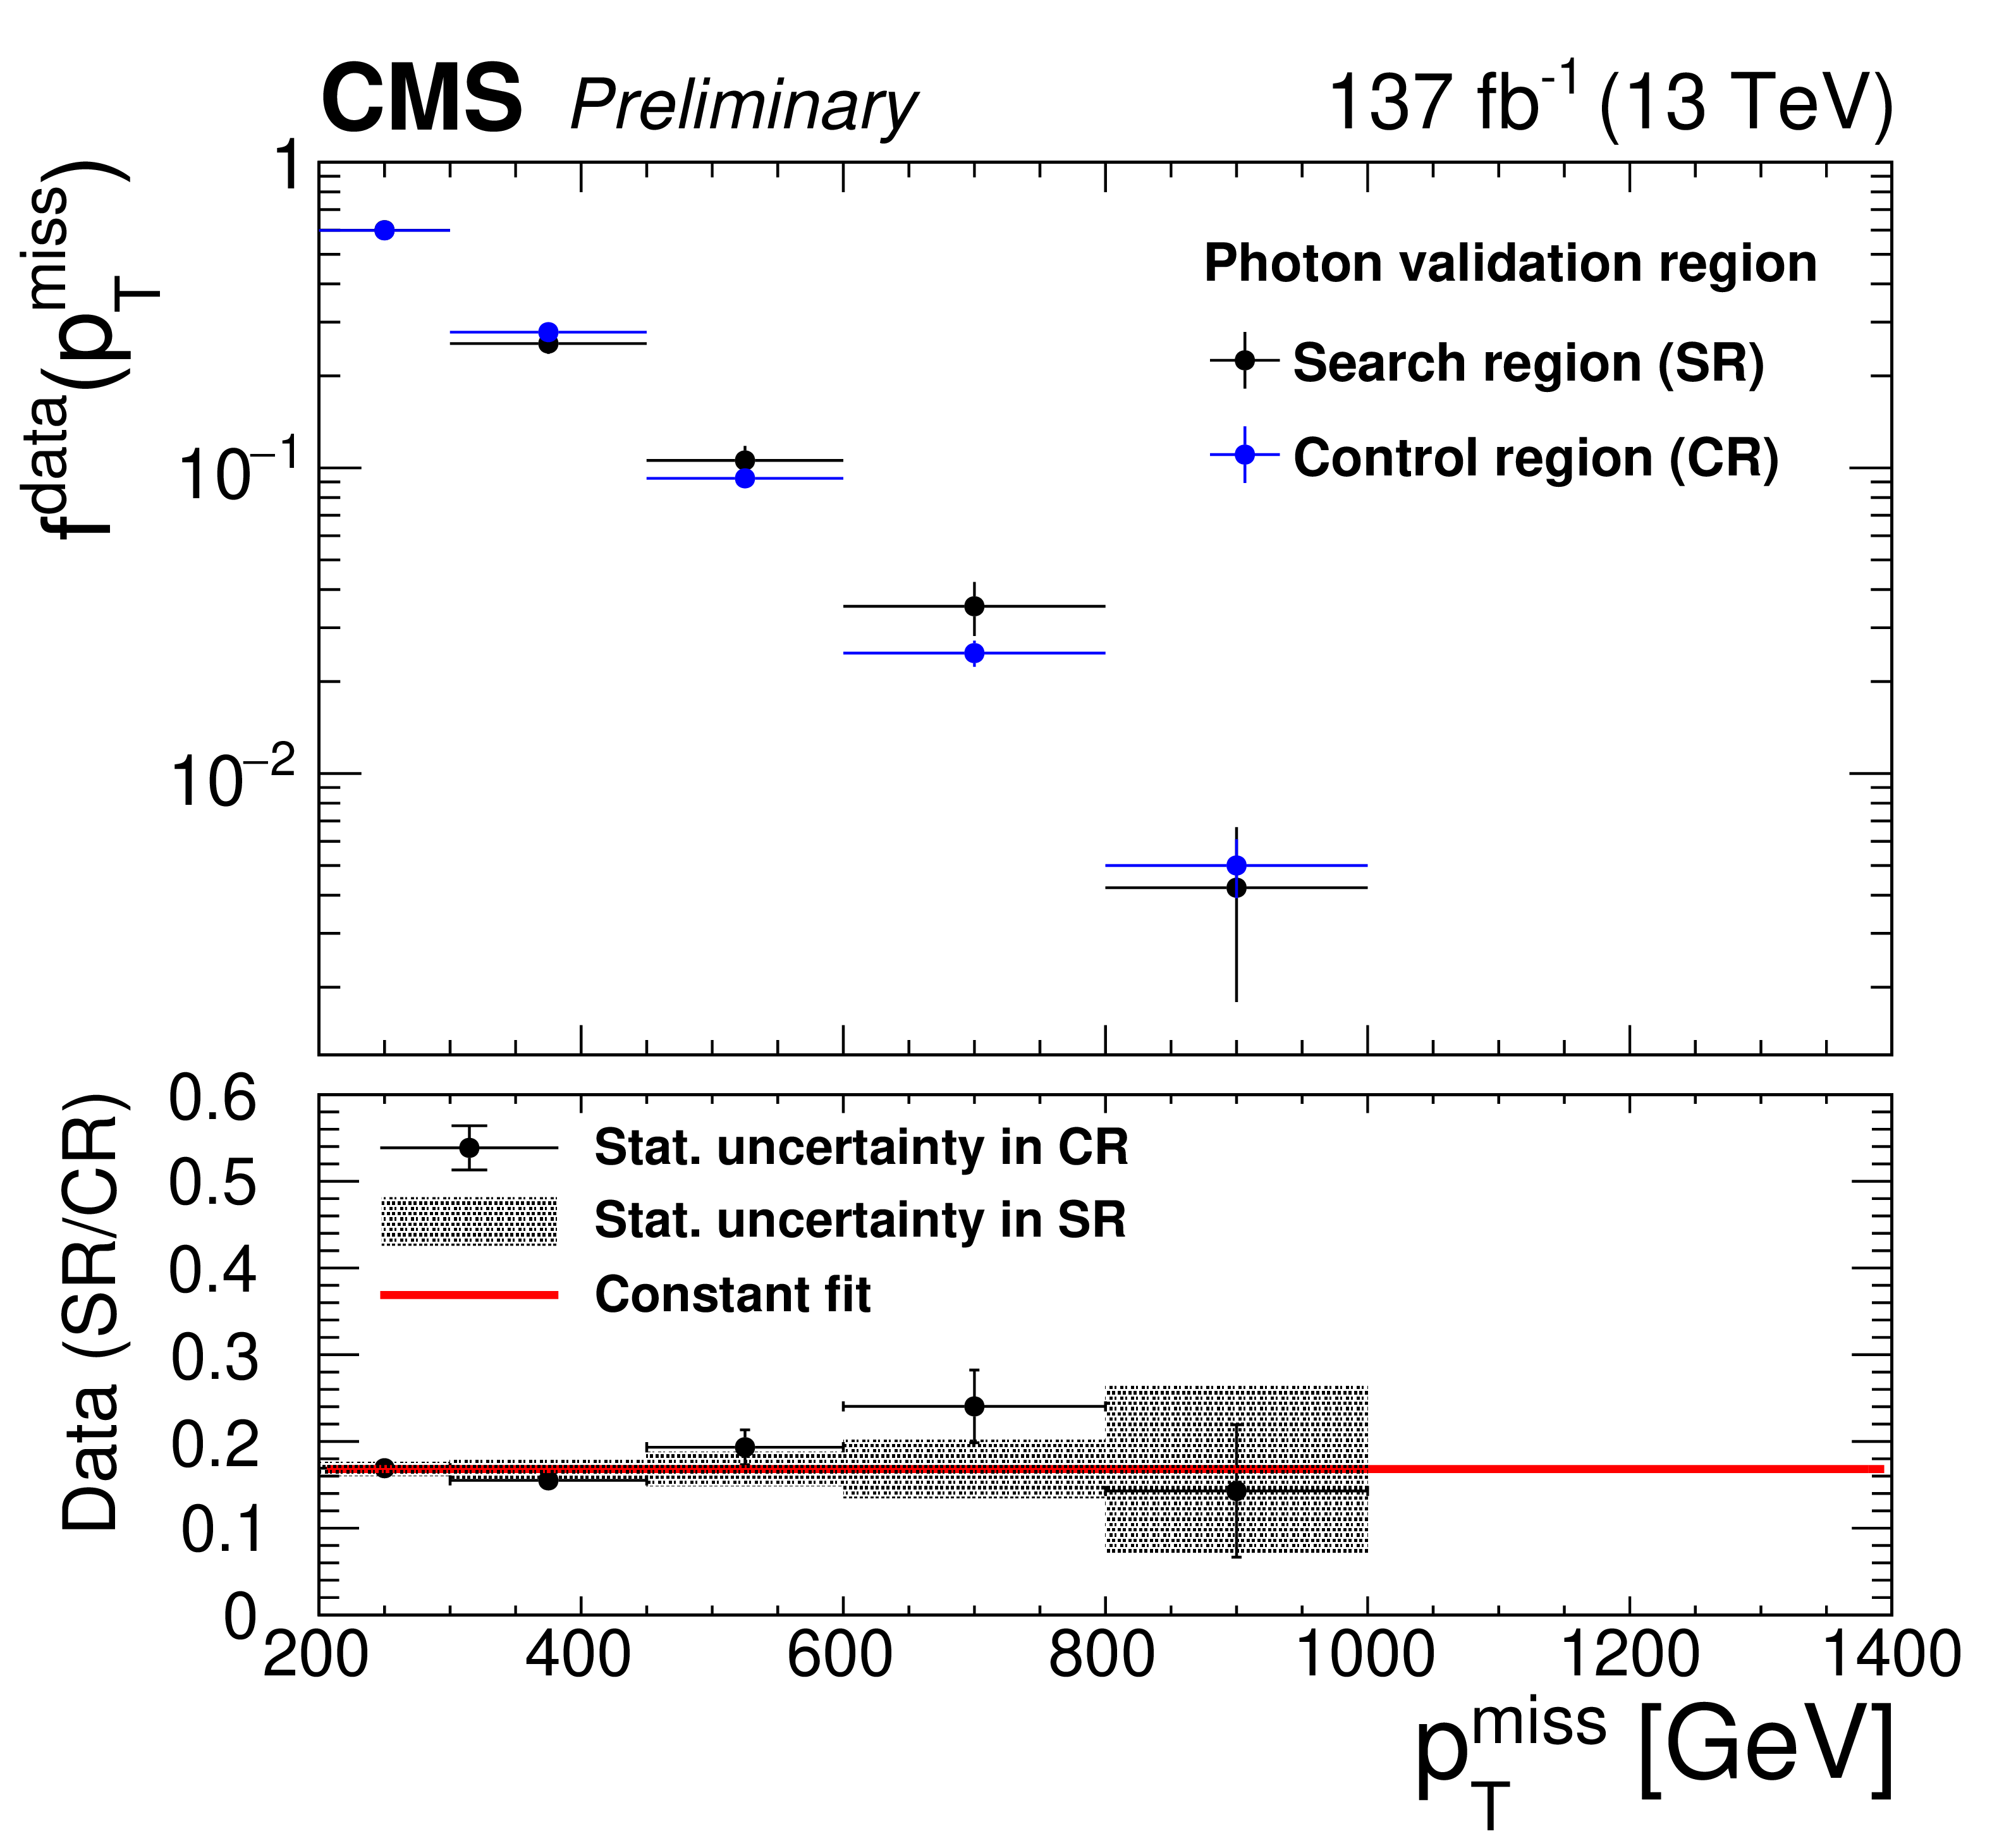
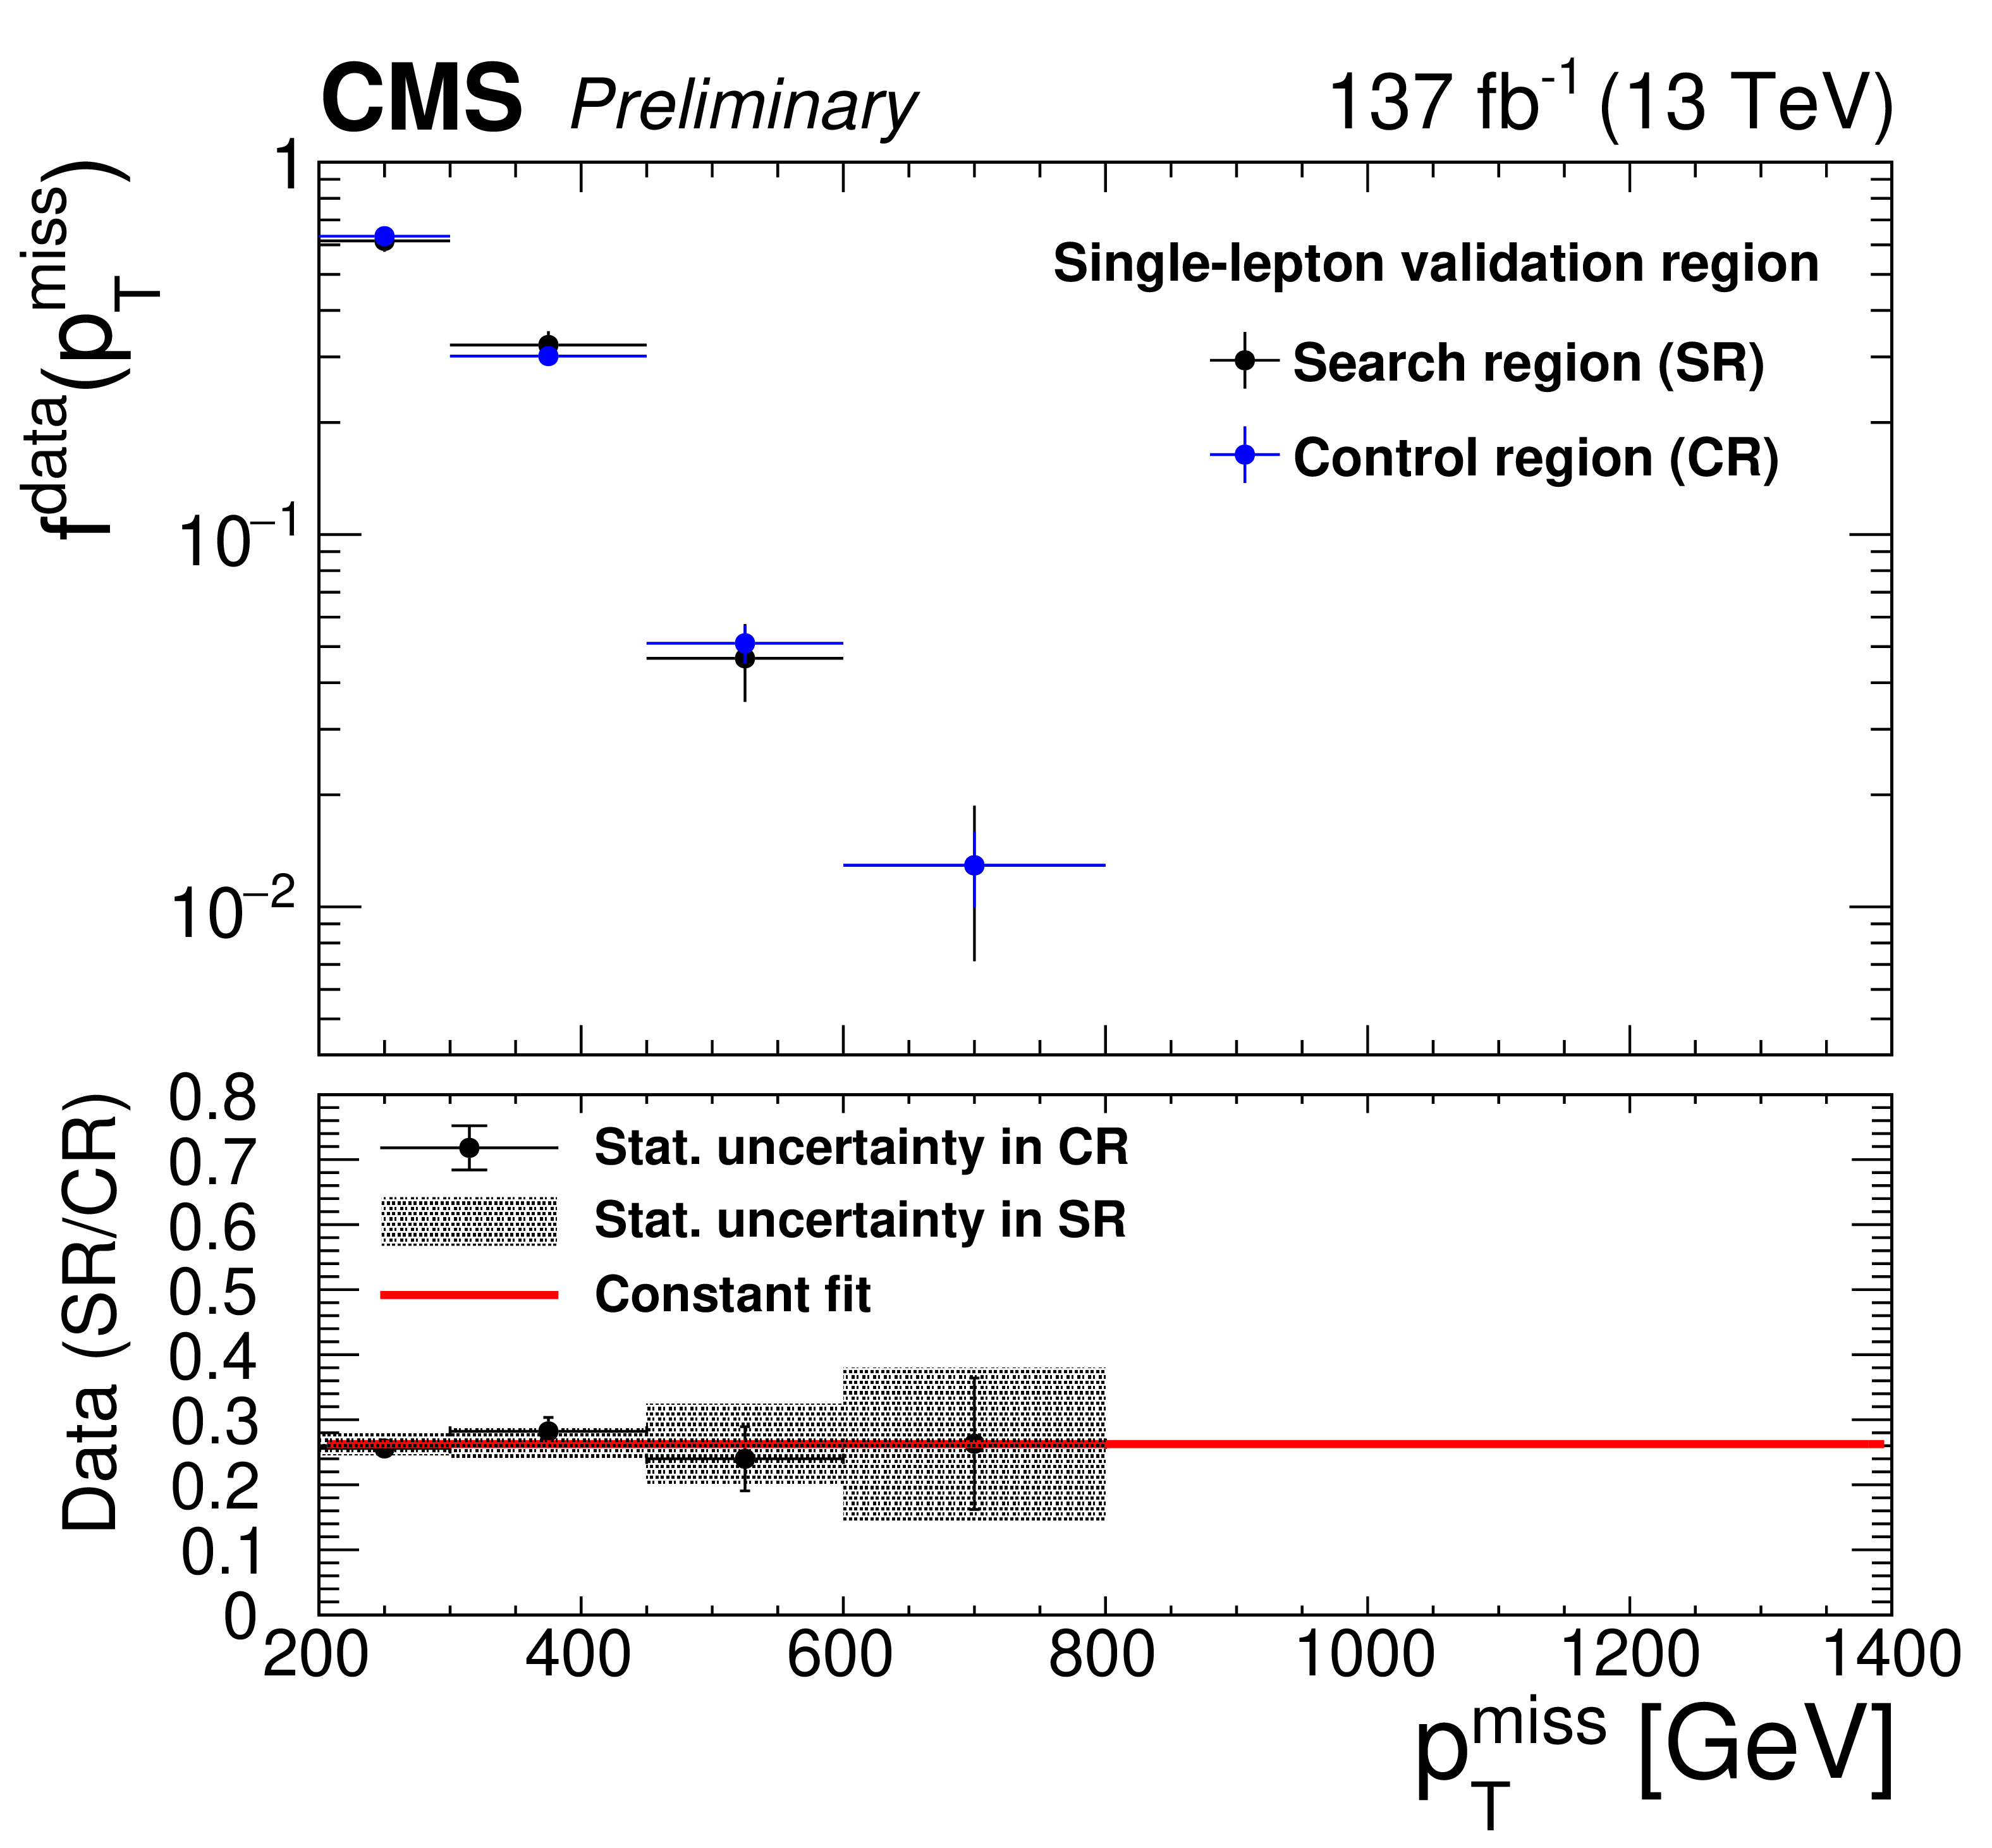
Comparison of the ${{p_{\mathrm {T}}} ^\text {miss}}$ shape between the Z signal window and ${{p_{\mathrm {T}}} ^\text {miss}}$ control region for the photon (left) and single-lepton (right) validation samples in data. The top panels show the unit-normalized ${{p_{\mathrm {T}}} ^\text {miss}}$ distributions $f^{\text {data}}({{p_{\mathrm {T}}} ^\text {miss}})$ in the two regions while the bottom panels show the ratio of the number of events in the search region to that in the control region. A fit to a constant is included in the bottom panels to show the average ratio. The horizontal bars on the markers indicate the widths of the search bins. |
png pdf |
Figure 7-a:
Comparison of the ${{p_{\mathrm {T}}} ^\text {miss}}$ shape between the Z signal window and ${{p_{\mathrm {T}}} ^\text {miss}}$ control region for the photon (left) and single-lepton (right) validation samples in data. The top panels show the unit-normalized ${{p_{\mathrm {T}}} ^\text {miss}}$ distributions $f^{\text {data}}({{p_{\mathrm {T}}} ^\text {miss}})$ in the two regions while the bottom panels show the ratio of the number of events in the search region to that in the control region. A fit to a constant is included in the bottom panels to show the average ratio. The horizontal bars on the markers indicate the widths of the search bins. |
png pdf |
Figure 7-b:
Comparison of the ${{p_{\mathrm {T}}} ^\text {miss}}$ shape between the Z signal window and ${{p_{\mathrm {T}}} ^\text {miss}}$ control region for the photon (left) and single-lepton (right) validation samples in data. The top panels show the unit-normalized ${{p_{\mathrm {T}}} ^\text {miss}}$ distributions $f^{\text {data}}({{p_{\mathrm {T}}} ^\text {miss}})$ in the two regions while the bottom panels show the ratio of the number of events in the search region to that in the control region. A fit to a constant is included in the bottom panels to show the average ratio. The horizontal bars on the markers indicate the widths of the search bins. |
png pdf |
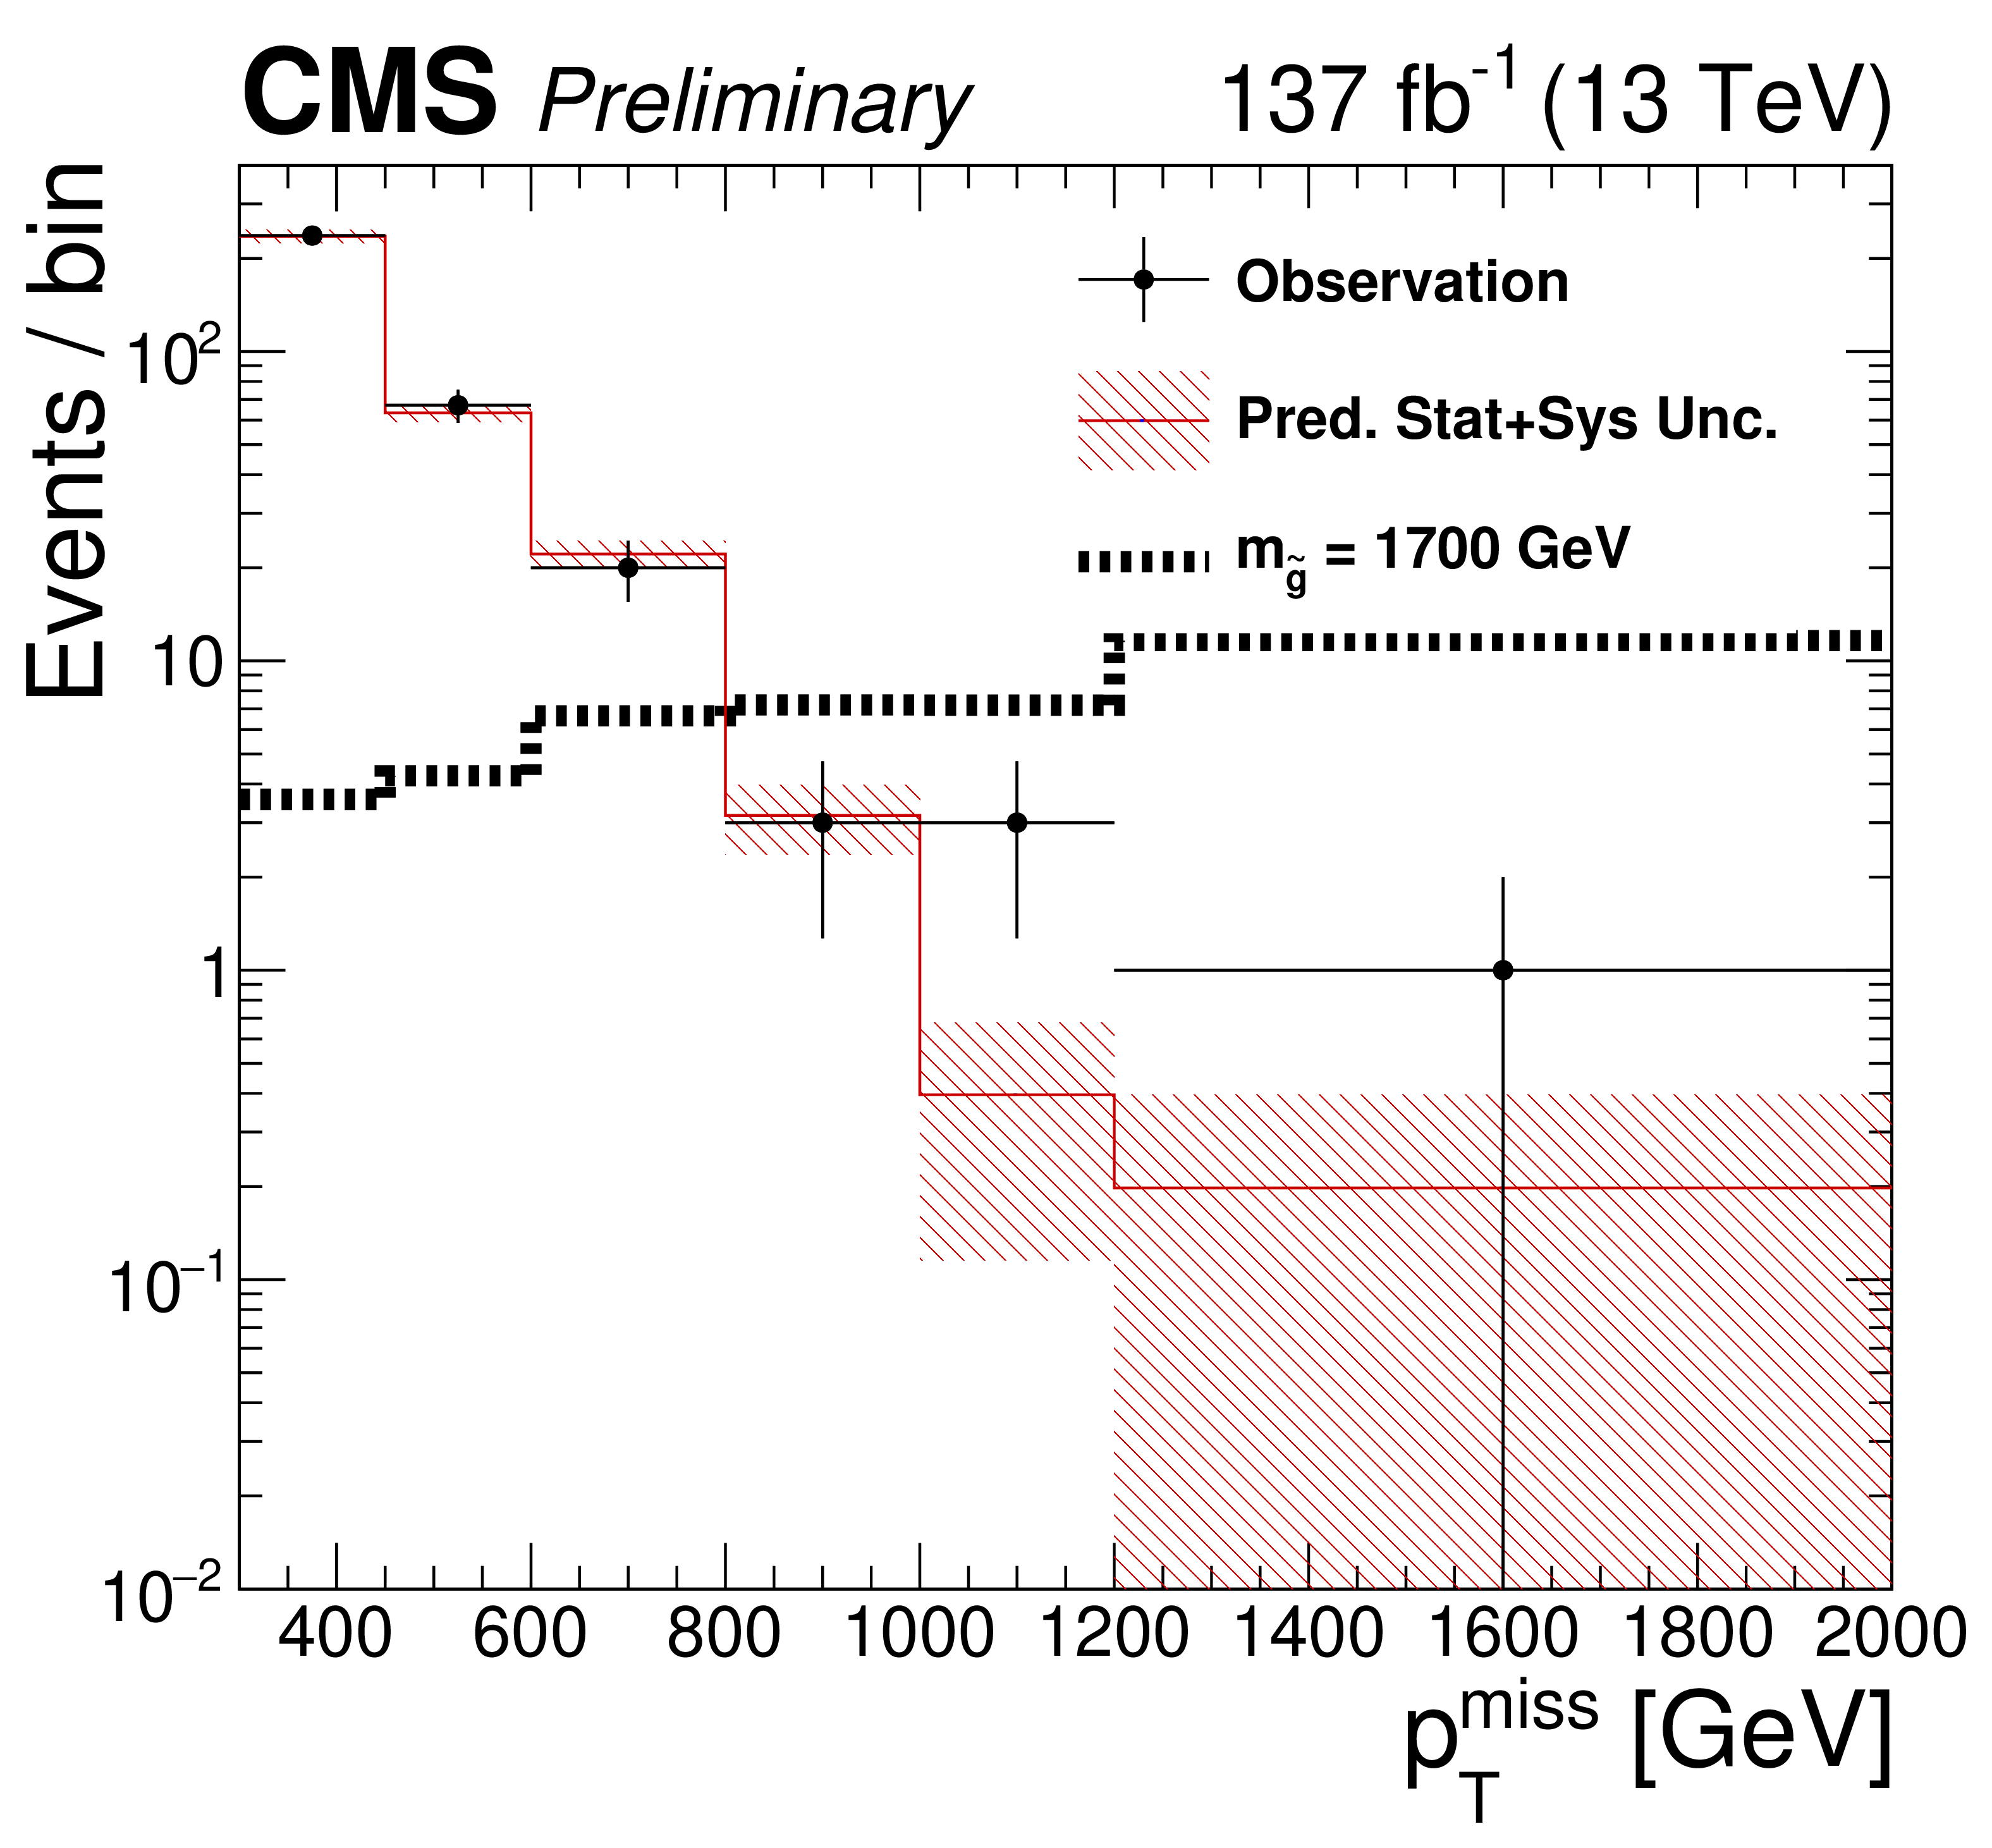
Figure 8:
Observation and background prediction as a function of ${{p_{\mathrm {T}}} ^\text {miss}}$. The horizontal bar associated with each data point represents the width of the corresponding bin. The red hatched region denotes the expected statistical and systematic uncertainties added in quadrature. |
png pdf |
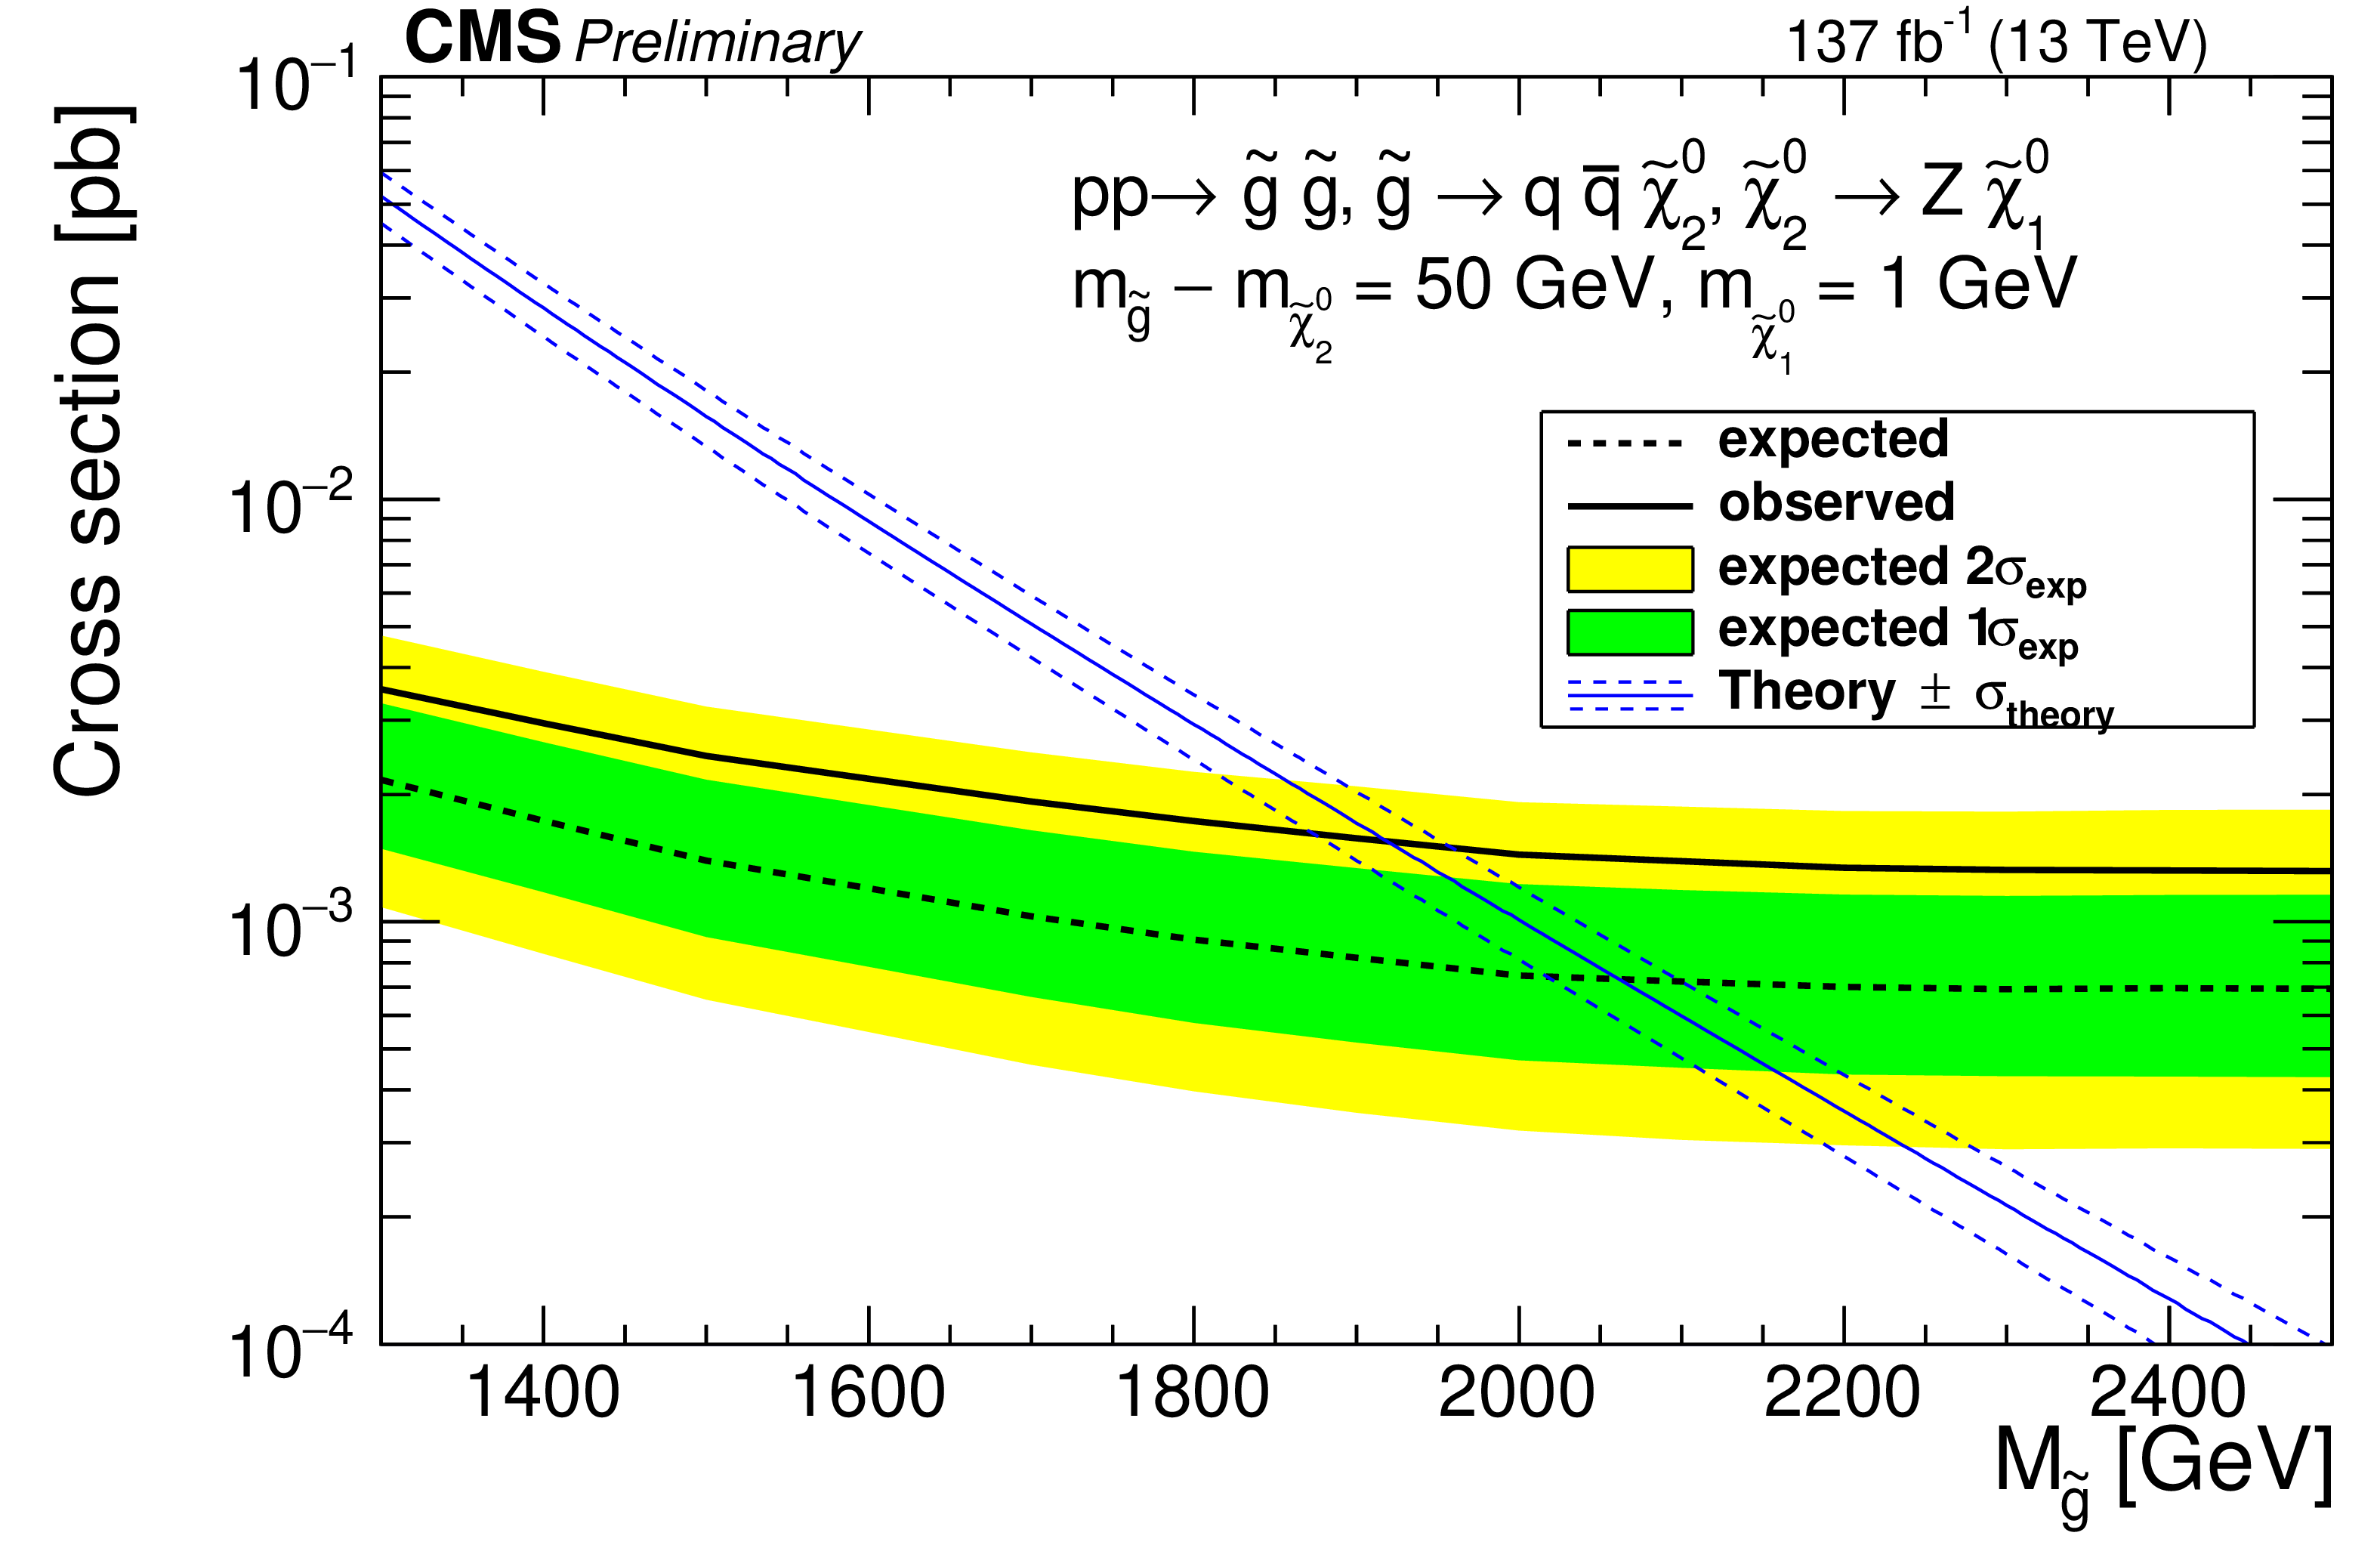
Figure 9:
95% CL upper limit on the production cross section for the T5ZZ signal model as a function of the gluino mass. The thick solid black curve shows the observed exclusion limit. The thick dashed black curve presents the expected limit while the green and yellow bands represent the $ \pm $1$ \sigma $ and $ \pm $2$ \sigma $ uncertainty ranges. The approximate-NNLO+NNLL cross sections [37,38,39,40,41] are shown in the thin solid blue curve while the dashed blue curves show their theoretical uncertainties [79]. The T5ZZ model assumes a 100% branching fraction for the ${\tilde{\chi}^0_2}$ to decay to the Z boson and ${\tilde{\chi}^0_1}$. |
| Tables | |
png pdf |
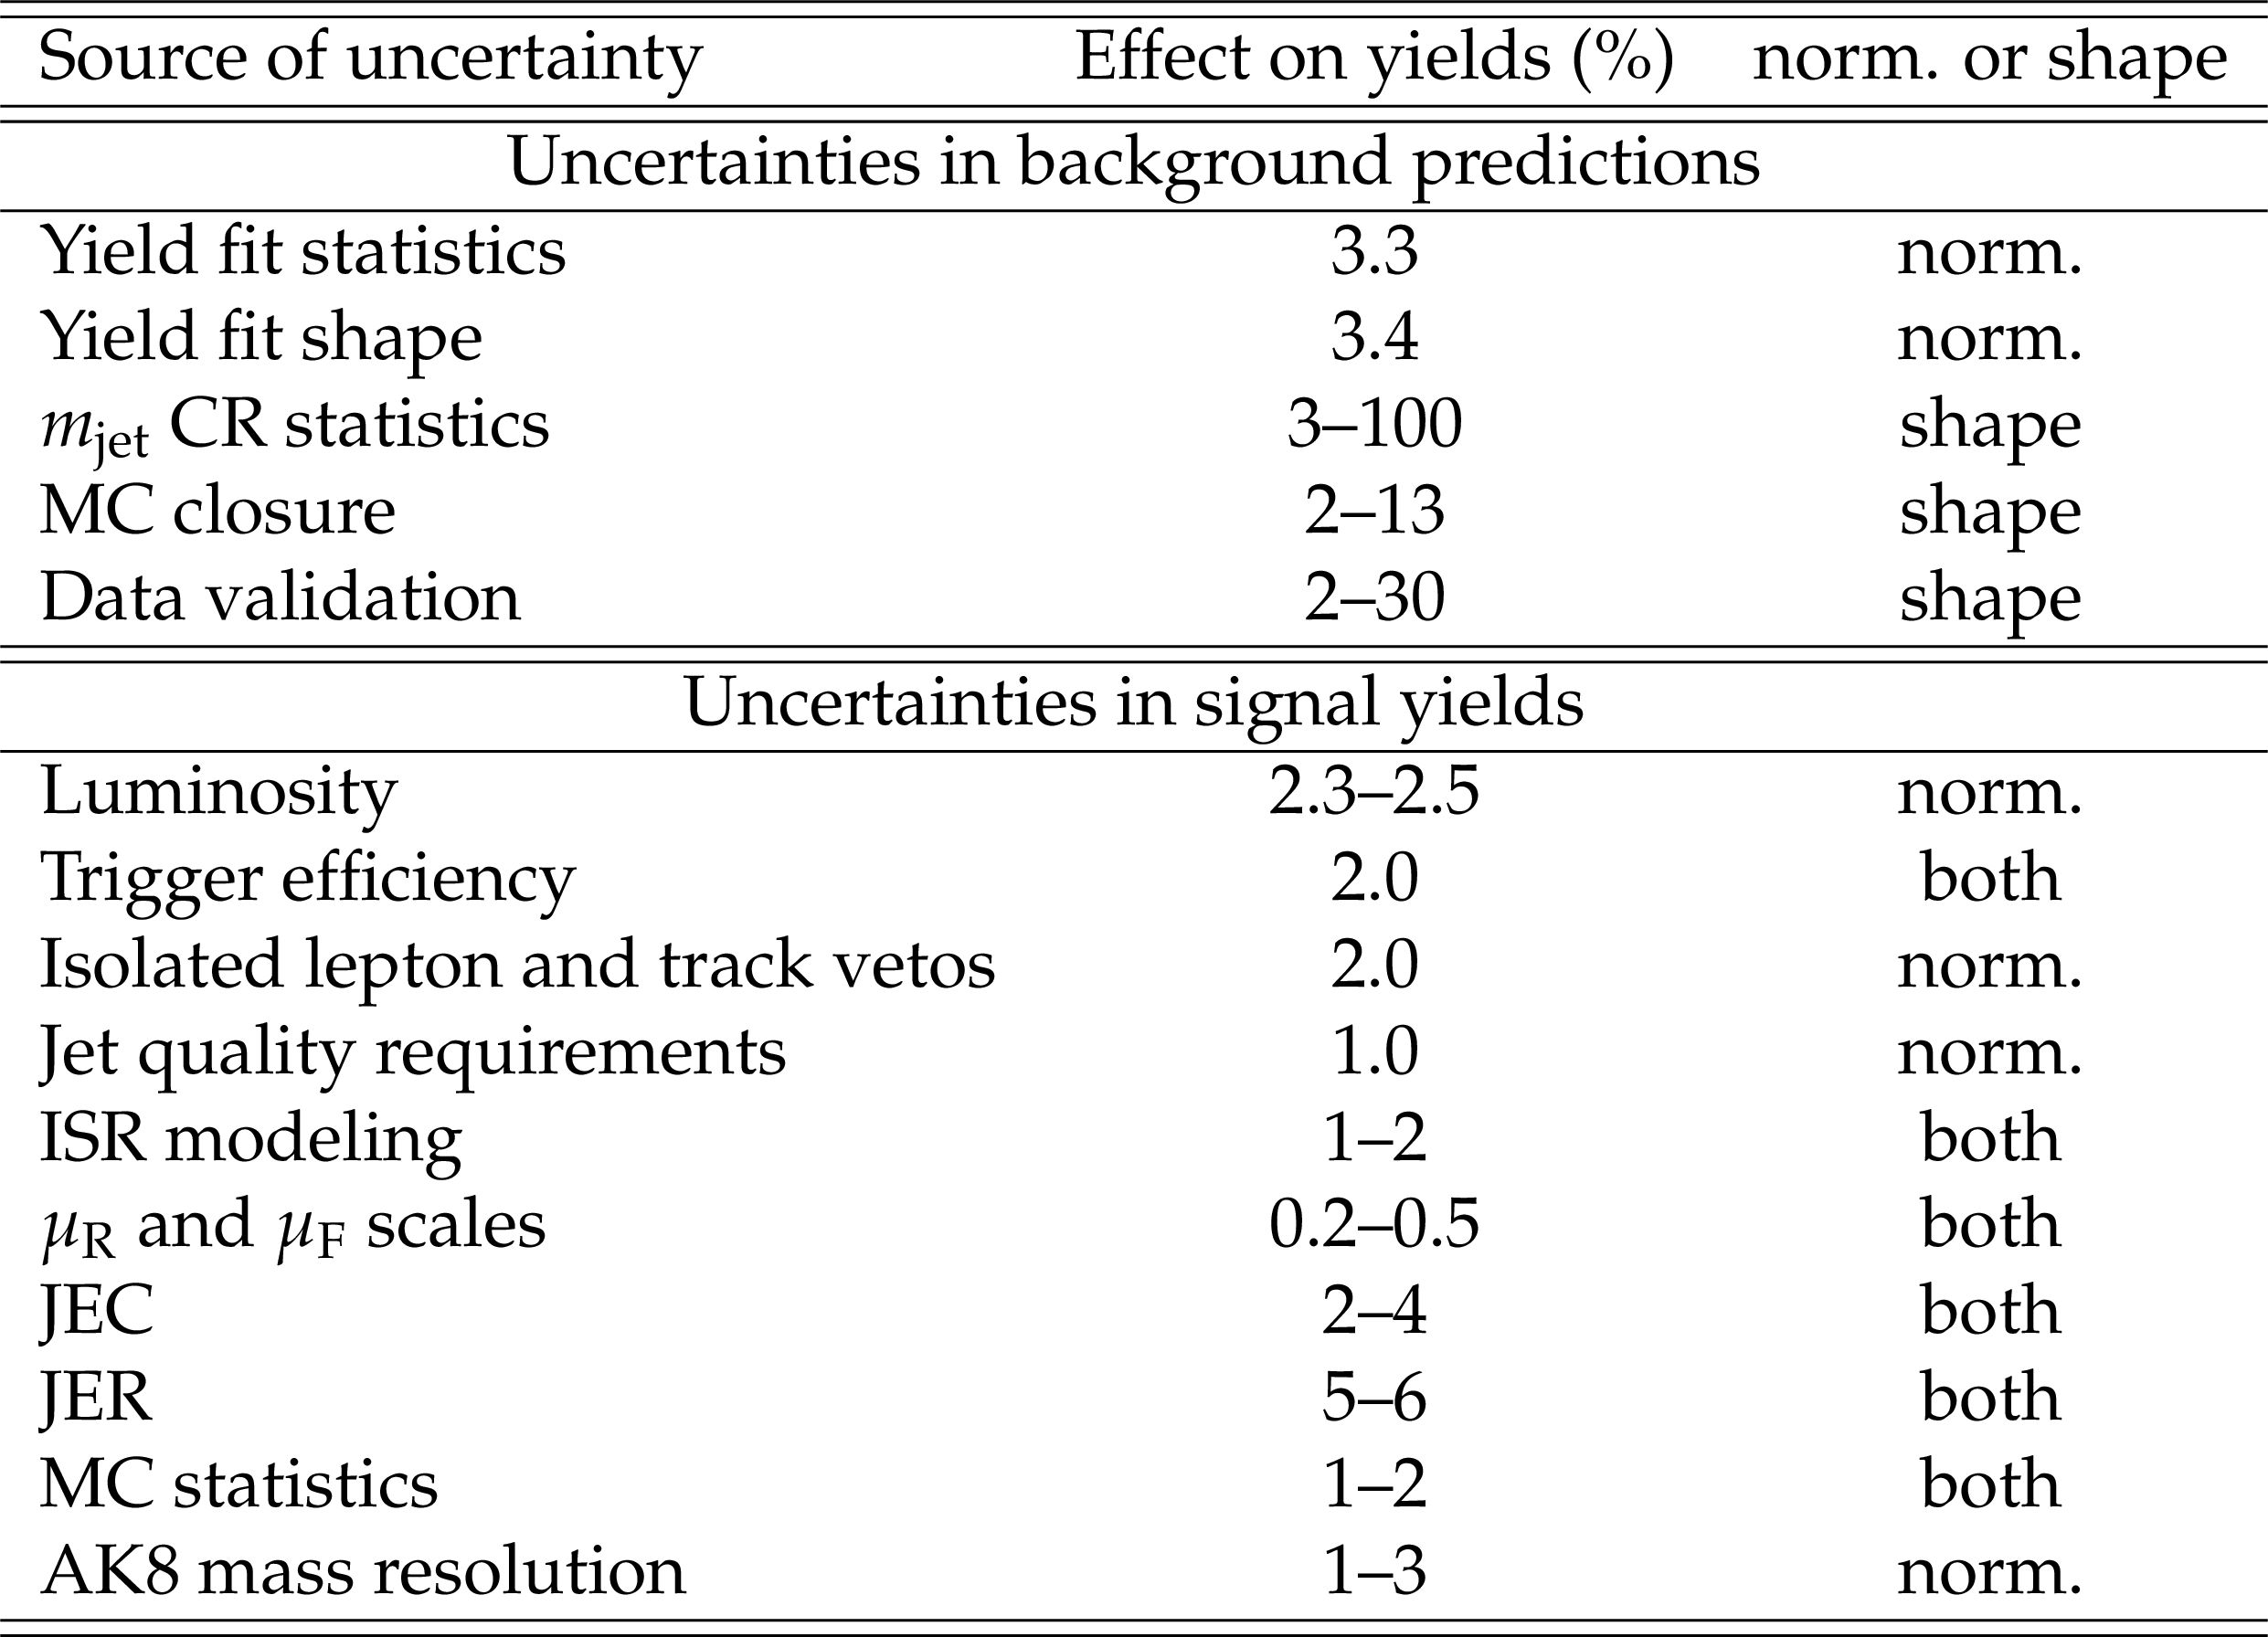
Table 1:
Summary of systematic uncertainties, where the ranges refer to different ${{p_{\mathrm {T}}} ^\text {miss}}$ bins. In the last column we distinguish uncertainties that affect the normalizations ("norm."), the shapes of distributions, or both. |
png pdf |
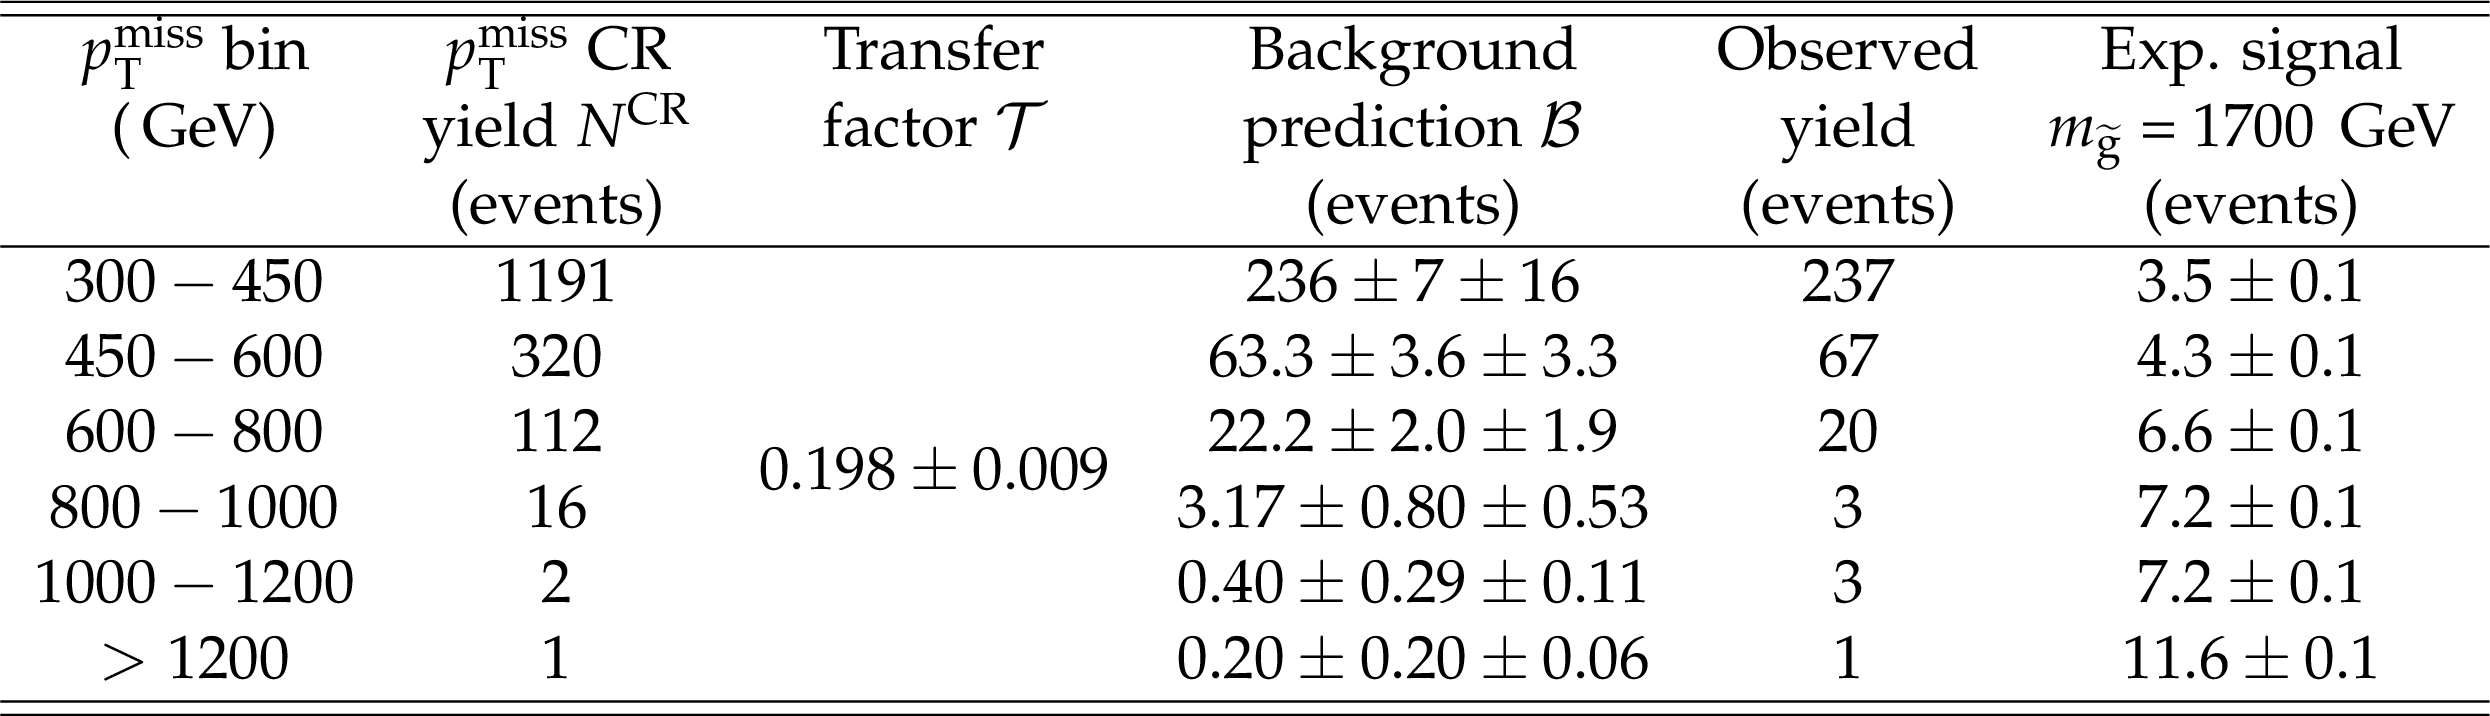
Table 2:
Number of events in the ${{p_{\mathrm {T}}} ^\text {miss}}$ control region, transfer factor, background prediction, and observed yield in each of the six ${{p_{\mathrm {T}}} ^\text {miss}}$ bins. Where two uncertainties are quoted, the first is statistical and the second systematic. The systematic uncertainties in the background prediction include the shape uncertainties in addition to the uncertainty in $\mathcal {T}$. Also listed in the last column is the number of expected signal events and corresponding statistical uncertainties for an example mass point. |
| Summary |
| Results are presented of a search for events with two hadronically decaying, highly energetic Z bosons and large momentum imbalance, in pp collisions at $\sqrt{s} = $ 13 TeV. The sample corresponds to an integrated luminosity of 137 fb$^{-1}$. The signature for a Z boson candidate is a wide-cone jet having a measured mass compatible with the Z boson mass. Yields from standard model background processes are estimated from the data in jet-mass sidebands and other control samples, and are small for events with the largest momentum imbalance. No evidence for physics beyond the standard model is observed. The reach of the search is interpreted in a simplified supersymmetry model of gluino pair production in which each gluino decays to a low-momentum quark pair and the next-to-lightest supersymmetric particle, and the latter decays to a Z boson and the lightest supersymmetric particle. For this scenario, the data exclude gluino masses below 1920 GeV at 95% confidence level. |
| References | ||||
| 1 | CMS Collaboration | Observation of a new boson at a mass of 125 GeV with the CMS experiment at the LHC | PLB 716 (2012) 30 | |
| 2 | ATLAS Collaboration | Observation of a new particle in the search for the Standard Model Higgs boson with the ATLAS detector at the LHC | PLB 716 (2012) 1 | |
| 3 | R. Barbieri and G. F. Giudice | Upper bounds on supersymmetric particle masses | NPB 306 (1988) 63 | |
| 4 | S. Dimopoulos and G. F. Giudice | Naturalness constraints in supersymmetric theories with nonuniversal soft terms | PLB 357 (1995) 573 | hep-ph/9507282 |
| 5 | R. Barbieri and D. Pappadopulo | S-particles at their naturalness limits | JHEP 10 (2009) 061 | 0906.4546 |
| 6 | M. Papucci, J. T. Ruderman, and A. Weiler | Natural SUSY endures | JHEP 09 (2012) 035 | 1110.6926 |
| 7 | P. Fayet and S. Ferrara | Supersymmetry | PR 32 (1977) 249 | |
| 8 | H. P. Nilles | Supersymmetry, supergravity and particle physics | PR 110 (1984) 1 | |
| 9 | S. P. Martin | A supersymmetry primer | Adv. Ser. Direct. High Energy Phys. 21 (2010) 1 | hep-ph/9709356 |
| 10 | P. Fayet | Supergauge invariant extension of the Higgs mechanism and a model for the electron and its neutrino | NPB 90 (1975) 104 | |
| 11 | G. R. Farrar and P. Fayet | Phenomenology of the production, decay, and detection of new hadronic states associated with supersymmetry | PLB 76 (1978) 575 | |
| 12 | N. Arkani-Hamed et al. | MARMOSET: The path from LHC data to the new standard model via on-shell effective theories | hep-ph/0703088 | |
| 13 | J. Alwall, M.-P. Le, M. Lisanti, and J. G. Wacker | Model-independent jets plus missing energy searches | PRD 79 (2009) 015005 | 0809.3264 |
| 14 | J. Alwall, P. Schuster, and N. Toro | Simplified models for a first characterization of new physics at the LHC | PRD 79 (2009) 075020 | 0810.3921 |
| 15 | D. Alves et al. | Simplified models for LHC new physics searches | JPG 39 (2012) 105005 | 1105.2838 |
| 16 | H. Baer et al. | Natural SUSY with a bino- or wino-like LSP | PRD 91 (2015) 075005 | |
| 17 | CMS Collaboration | The CMS experiment at the CERN LHC | JINST 3 (2008) S08004 | CMS-00-001 |
| 18 | CMS Collaboration | The CMS trigger system | JINST 12 (2017) P01020 | CMS-TRG-12-001 1609.02366 |
| 19 | J. Alwall et al. | The automated computation of tree-level and next-to-leading order differential cross sections, and their matching to parton shower simulations | JHEP 07 (2014) 079 | 1405.0301 |
| 20 | J. Alwall et al. | Comparative study of various algorithms for the merging of parton showers and matrix elements in hadronic collisions | EPJC 53 (2008) 473 | 0706.2569 |
| 21 | R. Frederix and S. Frixione | Merging meets matching in MC@NLO | JHEP 12 (2012) 061 | 1209.6215 |
| 22 | P. Nason | A new method for combining NLO QCD with shower Monte Carlo algorithms | JHEP 11 (2004) 040 | hep-ph/0409146 |
| 23 | S. Frixione, P. Nason, and C. Oleari | Matching NLO QCD computations with parton shower simulations: the POWHEG method | JHEP 11 (2007) 070 | 0709.2092 |
| 24 | S. Alioli, P. Nason, C. Oleari, and E. Re | A general framework for implementing NLO calculations in shower Monte Carlo programs: the POWHEG BOX | JHEP 06 (2010) 043 | 1002.2581 |
| 25 | S. Alioli, P. Nason, C. Oleari, and E. Re | NLO single-top production matched with shower in POWHEG: $ s $- and $ t $-channel contributions | JHEP 09 (2009) 111 | 0907.4076 |
| 26 | E. Re | Single-top Wt-channel production matched with parton showers using the POWHEG method | EPJC 71 (2011) 1547 | 1009.2450 |
| 27 | GEANT4 Collaboration | GEANT4---a simulation toolkit | NIMA 506 (2003) 250 | |
| 28 | T. Melia, P. Nason, R. Rontsch, and G. Zanderighi | W$ ^+ $W$ ^- $, WZ and ZZ production in the POWHEG BOX | JHEP 11 (2011) 078 | 1107.5051 |
| 29 | M. Beneke, P. Falgari, S. Klein, and C. Schwinn | Hadronic top-quark pair production with NNLL threshold resummation | NPB 855 (2012) 695 | 1109.1536 |
| 30 | M. Cacciari et al. | Top-pair production at hadron colliders with next-to-next-to-leading logarithmic soft-gluon resummation | PLB 710 (2012) 612 | 1111.5869 |
| 31 | P. Barnreuther, M. Czakon, and A. Mitov | Percent level precision physics at the Tevatron: First genuine NNLO QCD corrections to $ \mathrm{q\bar{q}}\to\mathrm{t\bar{t}} +X $ | PRL 109 (2012) 132001 | 1204.5201 |
| 32 | M. Czakon and A. Mitov | NNLO corrections to top-pair production at hadron colliders: the all-fermionic scattering channels | JHEP 12 (2012) 054 | 1207.0236 |
| 33 | M. Czakon and A. Mitov | NNLO corrections to top pair production at hadron colliders: the quark-gluon reaction | JHEP 01 (2013) 080 | 1210.6832 |
| 34 | M. Czakon, P. Fiedler, and A. Mitov | Total top-quark pair-production cross section at hadron colliders through $ O({\alpha_S}^4) $ | PRL 110 (2013) 252004 | 1303.6254 |
| 35 | R. Gavin, Y. Li, F. Petriello, and S. Quackenbush | W physics at the LHC with FEWZ 2.1 | CPC 184 (2013) 208 | 1201.5896 |
| 36 | R. Gavin, Y. Li, F. Petriello, and S. Quackenbush | FEWZ 2.0: A code for hadronic Z production at next-to-next-to-leading order | CPC 182 (2011) 2388 | 1011.3540 |
| 37 | W. Beenakker, R. Hopker, M. Spira, and P. M. Zerwas | Squark and gluino production at hadron colliders | NPB 492 (1997) 51 | hep-ph/9610490 |
| 38 | A. Kulesza and L. Motyka | Threshold resummation for squark-antisquark and gluino-pair production at the LHC | PRL 102 (2009) 111802 | 0807.2405 |
| 39 | A. Kulesza and L. Motyka | Soft gluon resummation for the production of gluino-gluino and squark-antisquark pairs at the LHC | PRD 80 (2009) 095004 | 0905.4749 |
| 40 | W. Beenakker et al. | Soft-gluon resummation for squark and gluino hadroproduction | JHEP 12 (2009) 041 | 0909.4418 |
| 41 | W. Beenakker et al. | Squark and gluino hadroproduction | Int. J. Mod. Phys. A 26 (2011) 2637 | 1105.1110 |
| 42 | W. Beenakker et al. | NNLL-fast: predictions for coloured supersymmetric particle production at the LHC with threshold and Coulomb resummation | JHEP 12 (2016) 133 | 1607.07741 |
| 43 | W. Beenakker et al. | NNLL resummation for squark-antisquark pair production at the LHC | JHEP 01 (2012) 076 | 1110.2446 |
| 44 | W. Beenakker et al. | Towards NNLL resummation: hard matching coefficients for squark and gluino hadroproduction | JHEP 10 (2013) 120 | 1304.6354 |
| 45 | W. Beenakker et al. | NNLL resummation for squark and gluino production at the LHC | JHEP 12 (2014) 023 | 1404.3134 |
| 46 | W. Beenakker et al. | Stop production at hadron colliders | NPB 515 (1998) 3 | hep-ph/9710451 |
| 47 | W. Beenakker et al. | Supersymmetric top and bottom squark production at hadron colliders | JHEP 08 (2010) 098 | 1006.4771 |
| 48 | W. Beenakker et al. | NNLL resummation for stop pair-production at the LHC | JHEP 05 (2016) 153 | 1601.02954 |
| 49 | T. Sjostrand et al. | An introduction to PYTHIA 8.2 | CPC 191 (2015) 159 | 1410.3012 |
| 50 | CMS Collaboration | Event generator tunes obtained from underlying event and multiparton scattering measurements | EPJC 76 (2016) 155 | CMS-GEN-14-001 1512.00815 |
| 51 | CMS Collaboration | Extraction and validation of a new set of CMS PYTHIA8 tunes from underlying-event measurements | EPJC 80 (2020) 4 | CMS-GEN-17-001 1903.12179 |
| 52 | NNPDF Collaboration | Parton distributions with QED corrections | NPB 877 (2013) 290 | 1308.0598 |
| 53 | NNPDF Collaboration | Parton distributions from high-precision collider data | EPJC 77 (2017) 663 | 1706.00428 |
| 54 | CMS Collaboration | Particle-flow reconstruction and global event description with the CMS detector | JINST 12 (2017) P10003 | CMS-PRF-14-001 1706.04965 |
| 55 | M. Cacciari, G. P. Salam, and G. Soyez | The anti-$ {k_{\mathrm{T}}} $ jet clustering algorithm | JHEP 04 (2008) 063 | 0802.1189 |
| 56 | M. Cacciari, G. P. Salam, and G. Soyez | FastJet user manual | EPJC 72 (2012) 1896 | 1111.6097 |
| 57 | CMS Collaboration | Jet performance in pp collisions at $ \sqrt{s}= $ 7 ~TeV | CDS | |
| 58 | CMS Collaboration | Jet algorithms performance in 13 TeV data | CMS-PAS-JME-16-003 | CMS-PAS-JME-16-003 |
| 59 | CMS Collaboration | Jet energy scale and resolution in the CMS experiment in pp collisions at 8 TeV | JINST 12 (2017) P02014 | CMS-JME-13-004 1607.03663 |
| 60 | M. Cacciari and G. P. Salam | Pileup subtraction using jet areas | PLB 659 (2008) 119 | 0707.1378 |
| 61 | A. J. Larkoski, S. Marzani, G. Soyez, and J. Thaler | Soft Drop | JHEP 05 (2014) 146 | 1402.2657 |
| 62 | D. Bertolini, P. Harris, M. Low, and N. Tran | Pileup Per Particle Identification | JHEP 10 (2014) 059 | 1407.6013 |
| 63 | CMS Collaboration | Identification of heavy-flavour jets with the CMS detector in pp collisions at 13 TeV | JINST 13 (2018) P05011 | CMS-BTV-16-002 1712.07158 |
| 64 | CMS Collaboration | Performance of electron reconstruction and selection with the CMS detector in proton-proton collisions at $ \sqrt{s} = $ 8 TeV | JINST 10 (2015) P06005 | CMS-EGM-13-001 1502.02701 |
| 65 | CMS Collaboration | Performance of the CMS muon detector and muon reconstruction with proton-proton collisions at $ \sqrt{s} = $ 13 TeV | JINST 13 (2018) P06015 | CMS-MUO-16-001 1804.04528 |
| 66 | K. Rehermann and B. Tweedie | Efficient identification of boosted semileptonic top quarks at the LHC | JHEP 03 (2011) 059 | 1007.2221 |
| 67 | CMS Collaboration | Performance of photon reconstruction and identification with the CMS detector in proton-proton collisions at $ \sqrt{s} = $ 8 TeV | JINST 10 (2015) P08010 | CMS-EGM-14-001 1502.02702 |
| 68 | UA1 Collaboration | Experimental observation of isolated large transverse energy electrons with associated missing energy at $ \sqrt{s}= $ 540 ~GeV | PLB 122 (1983) 103 | |
| 69 | CMS Collaboration | Performance of missing transverse momentum reconstruction in proton-proton collisions at $ \sqrt{s} = $ 13 TeV using the CMS detector | JINST 14 (2019) P07004 | CMS-JME-17-001 1903.06078 |
| 70 | CMS Collaboration | CMS luminosity measurements for the 2016 data taking period | CMS-PAS-LUM-17-001 | CMS-PAS-LUM-17-001 |
| 71 | CMS Collaboration | CMS luminosity measurement for the 2017 data-taking period at $ \sqrt{s} = $ 13 TeV | CMS-PAS-LUM-17-004 | CMS-PAS-LUM-17-004 |
| 72 | CMS Collaboration | CMS luminosity measurement for the 2018 data-taking period at $ \sqrt{s}= $ 13 TeV | CMS-PAS-LUM-18-002 | CMS-PAS-LUM-18-002 |
| 73 | S. Catani, D. de Florian, M. Grazzini, and P. Nason | Soft gluon resummation for Higgs boson production at hadron colliders | JHEP 07 (2003) 028 | hep-ph/0306211 |
| 74 | M. Cacciari et al. | The $ \mathrm{t\bar{t}} $ cross-section at 1.8 TeV and 1.96 TeV: a study of the systematics due to parton densities and scale dependence | JHEP 04 (2004) 068 | hep-ph/0303085 |
| 75 | G. Cowan, K. Cranmer, E. Gross, and O. Vitells | Asymptotic formulae for likelihood-based tests of new physics | EPJC 71 (2011) 1554 | 1007.1727 |
| 76 | A. L. Read | Presentation of search results: the CLs technique | JPG 28 (2002) 2693 | |
| 77 | T. Junk | Confidence level computation for combining searches with small statistics | NIMA 434 (1999) 435 | hep-ex/9902006 |
| 78 | ATLAS and CMS Collaborations | Procedure for the LHC Higgs boson search combination in Summer 2011 | CMS-NOTE-2011-005 | |
| 79 | C. Borschensky et al. | Squark and gluino production cross sections in pp collisions at $ \sqrt{s} = $ 13, 14, 33 and 100 TeV | EPJC 74 (2014) 3174 | 1407.5066 |
|
|
Compact Muon Solenoid LHC, CERN |
|

|

|

|

|

|