

Compact Muon Solenoid
LHC, CERN
| CMS-PAS-SMP-21-006 | ||
| Cross section measurements of jet multiplicity and jet transverse momenta in multijet events at $\sqrt{s}= $ 13 TeV | ||
| CMS Collaboration | ||
| July 2021 | ||
| Abstract: Multijet events at large transverse momentum ($p_{\mathrm{T}}$) are measured at $\sqrt{s}= $ 13 TeV with data recorded with the CMS detector at the LHC corresponding to an integrated luminosity of 36.3 fb$^{-1}$. The multiplicity of jets with $p_{\mathrm{T}} > $ 50 GeV in addition to a high $p_{\mathrm{T}}$ dijet system is measured for different regions of the transverse momentum of the leading $p_{\mathrm{T}}$ jet and as a function of the azimuthal angle $\Delta\phi_{1,2}$ between the two leading jets in the dijet system. The differential cross section of the four jets leading in $p_{\mathrm{T}}$ is measured as a function of their transverse momentum. The measurements are compared to leading order matrix-element calculations supplemented with parton shower, hadronization and multiparton interactions. In addition next-to-leading order matrix-element calculations combined with conventional parton shower as well as with Parton Branching (PB) transverse momentum dependent (TMD) parton densities and PB-TMD initial state parton shower are compared to the measurements. | ||
|
Links:
CDS record (PDF) ;
CADI line (restricted) ;
These preliminary results are superseded in this paper, Submitted to EPJC. The superseded preliminary plots can be found here. |
||
| Figures | |
png pdf |
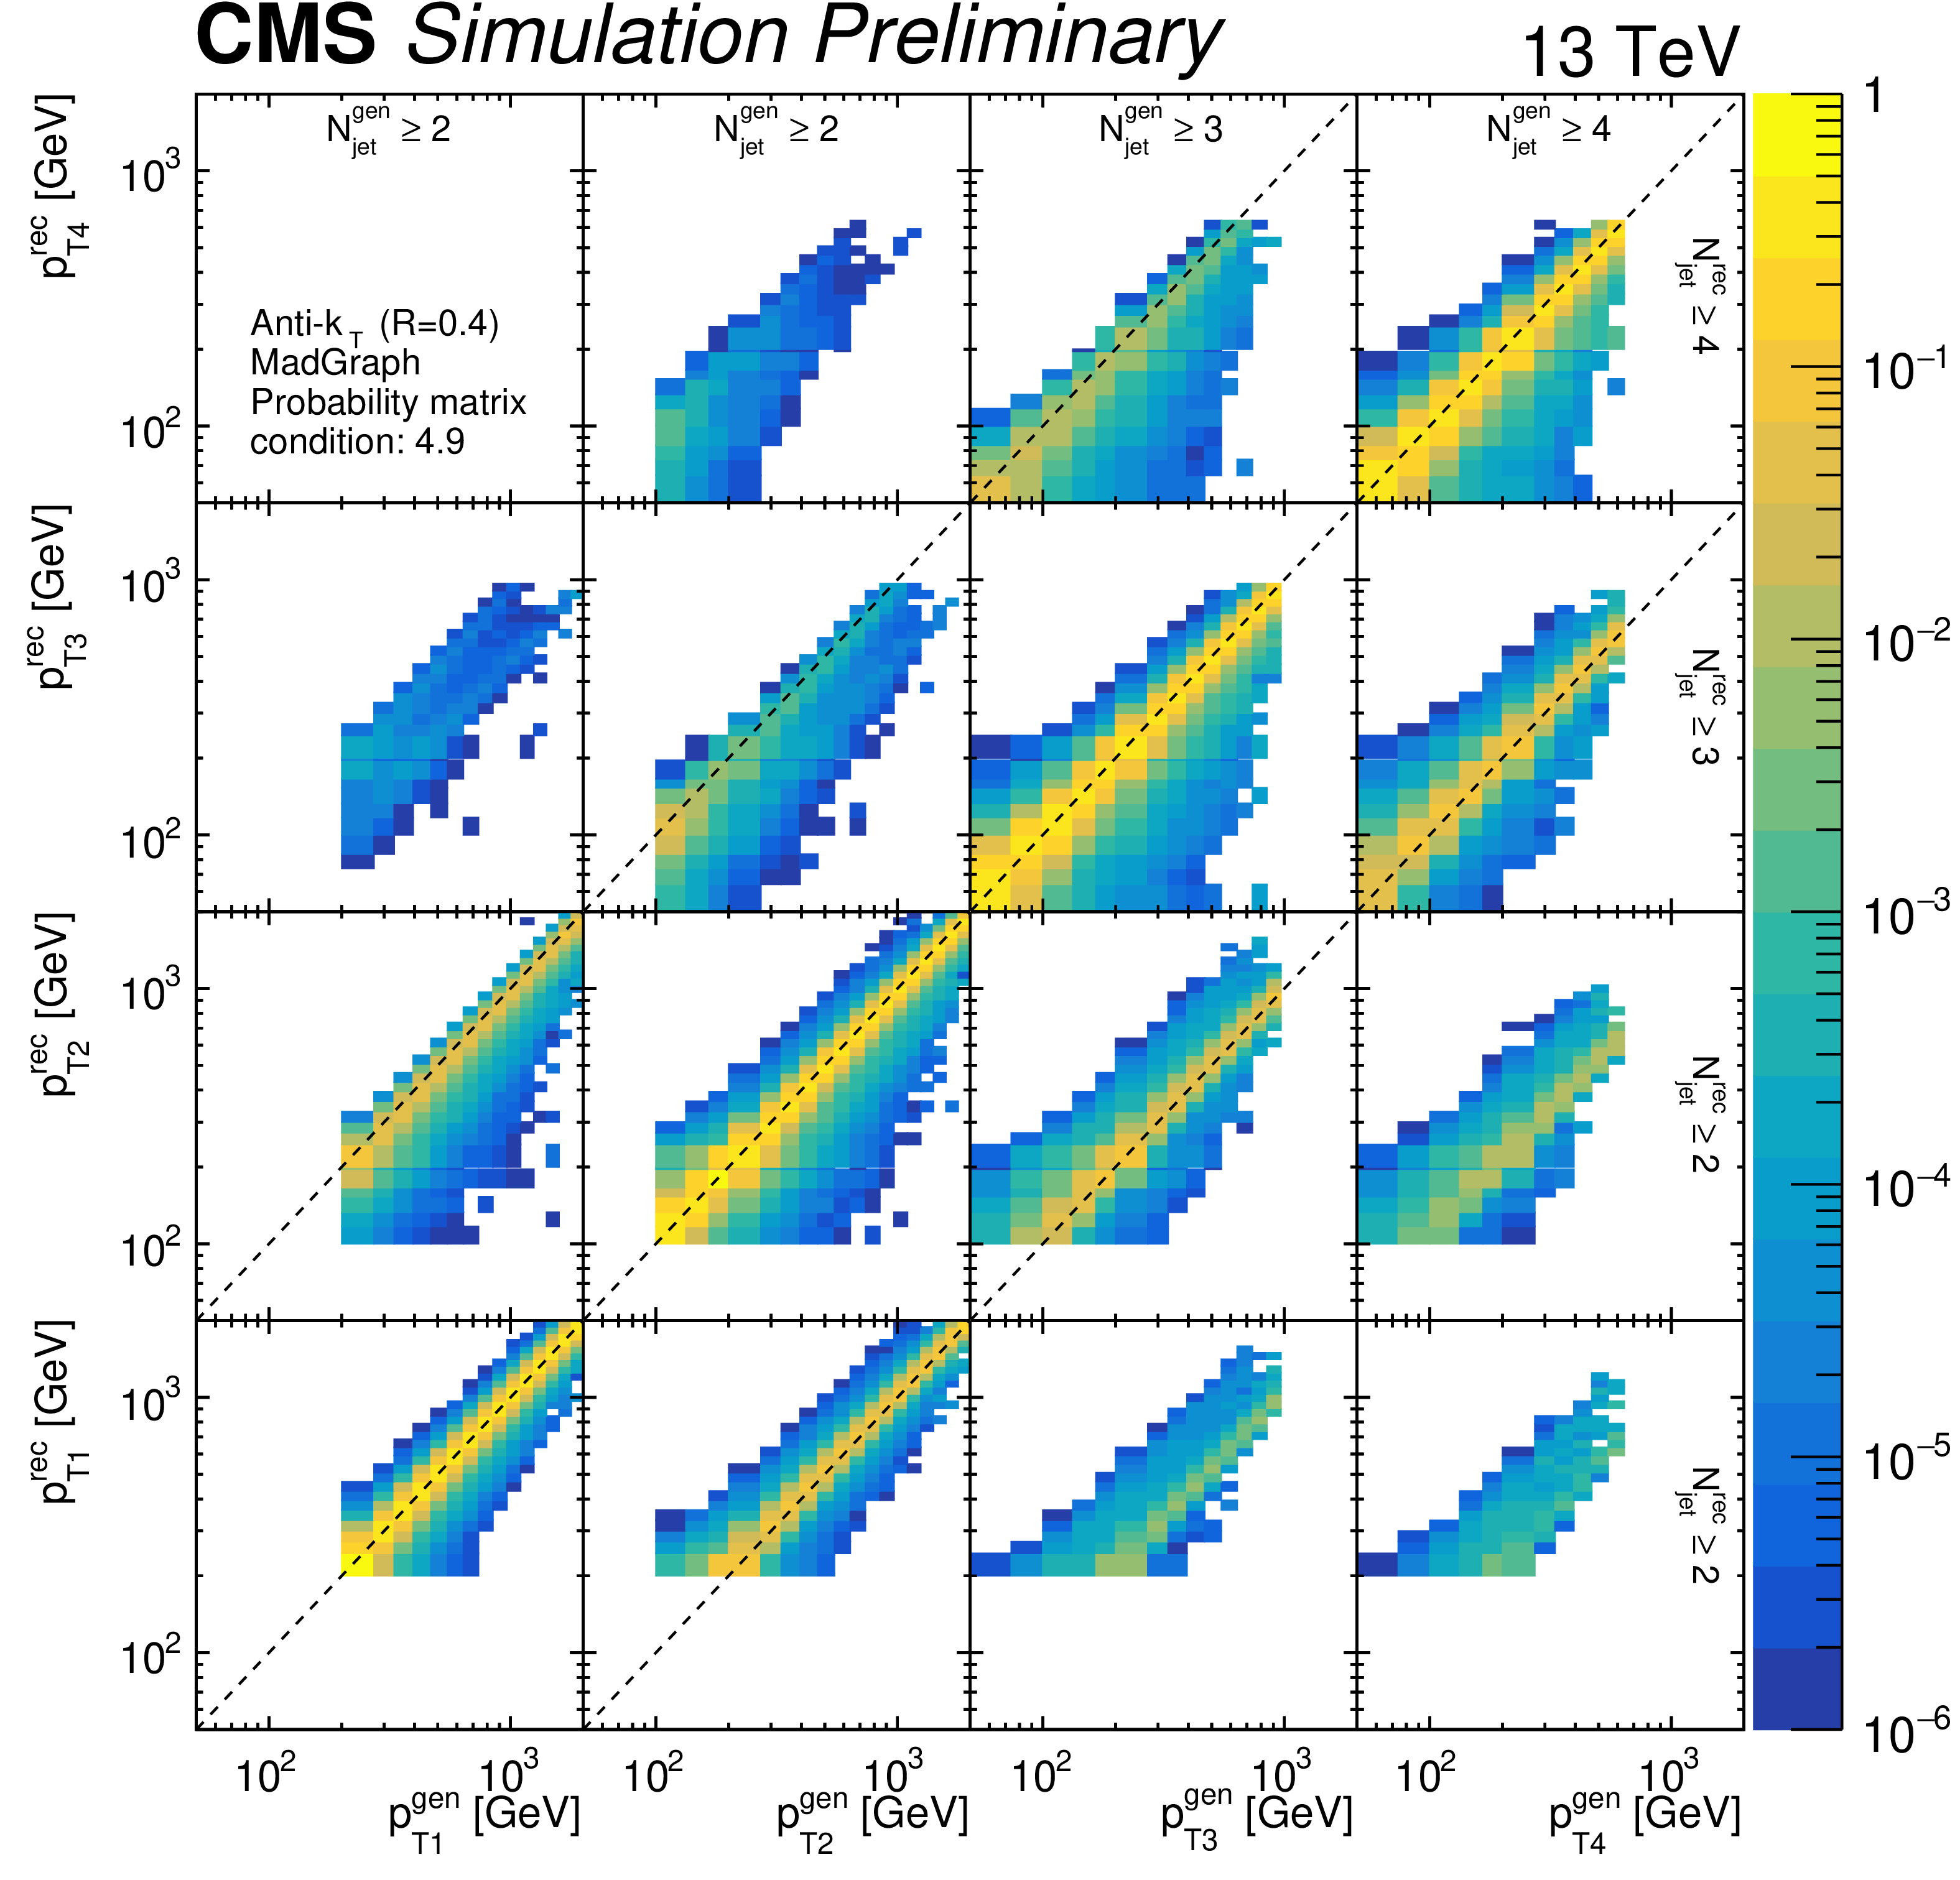
Figure 1:
Probability matrix (condition number: 4.9) for the ${p_{\mathrm {T}}}$ of the four leading jets constructed with the MadGraph+Py8 sample. The global 4$\times $4 sectors corresponds to each one of the first four jets ${p_{\mathrm {T}}}$ distributions, the $x$-axis corresponds to the hadron(gen) level and $y$-axis corresponds to the detector(rec) level as labeled in each axis. The $z$-axis covers a range from 10$^{-6}$ to 1 indicating the probability of migrations from the hadron level bin to the correspondent detector level bin. |
png pdf |
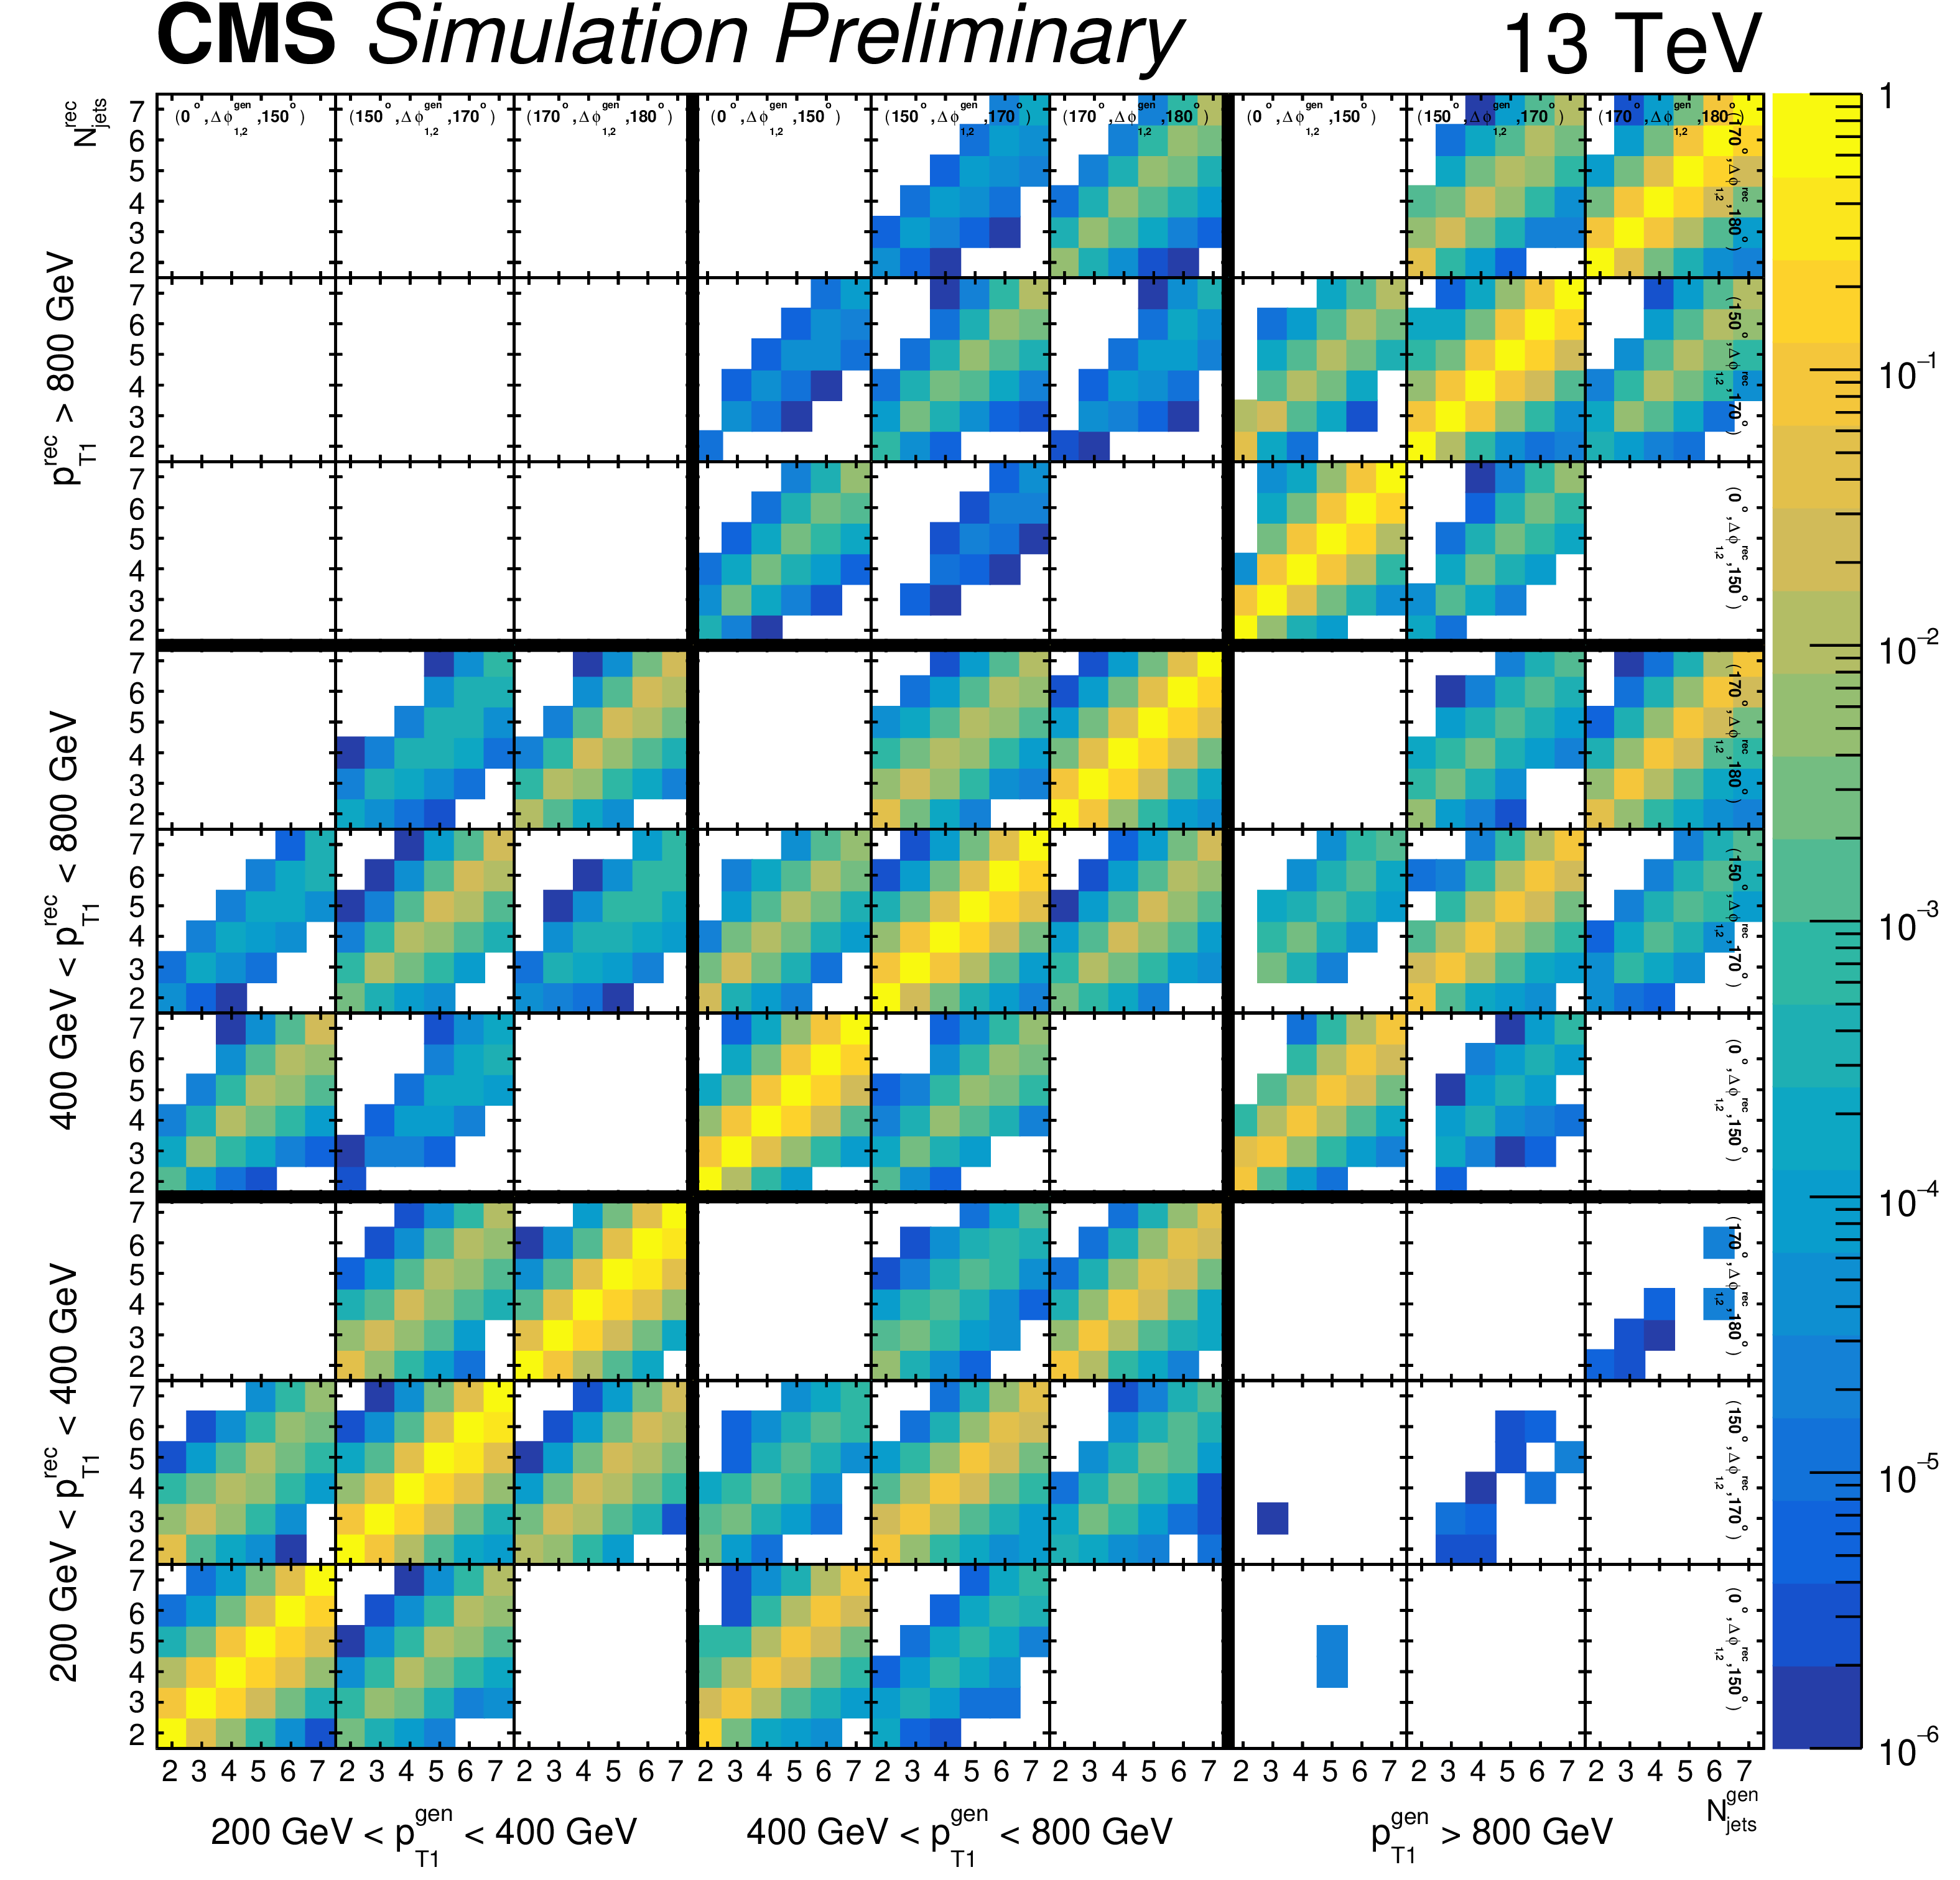
Figure 2:
Probability matrix (condition number: 3.0) for the jet multiplicity distribution constructed with the MadGraph+Py8 sample. The global 3$\times $3 sectors (delimited by the thick black lines) corresponds to the ${p_{\mathrm{T1}}}$ bins, indicated by the labels in the $x$(down) and $y$(left) axis; and inside this ones there are smaller 3$\times $3 structures corresponding to the ${\Delta \phi _{1,2}}$ bins, indicated in the uppermost row and rightmost column, the $x$($y$)-axis of these ${\Delta \phi _{1,2}}$ cells corresponds to the jet multiplicity at hadron(detector) level. The $z$-axis covers a range from 10$^{-6}$ to 1 indicating the probability of migrations from the hadron level bin to the correspondent detector level bin. |

png pdf |
Figure 3:
Correlation matrix for the hadron level ${p_{\mathrm {T}}}$ of the four leading jets. It contains contributions form the data recorded in 2016 and from the limited statistics from the MadGraph+Py8 sample. Here each one of the 4$\times $4 sectors corresponds to one of the ${p_{\mathrm {T}}}$ spectra measured, indicated by the $x$ and $y$-axis labels. The $z$-axis covers a range from -1 to 1 indicating the correlations in blue shades and anti-correlations in red shades, the values between -0.1 and 0.1 are represented in white. |

png pdf |
Figure 4:
Correlation matrix at hadron level for the jet multiplicity distribution. It contains contributions form the data recordered in 2016 and from the limited statistics from the MadGraph+Py8 sample. The global 3$\times $3 sectors (delimited by the thick black lines) corresponds to the ${p_{\mathrm{T1}}}$ bins, indicated by the labels in the $x$(down) and $y$(left) axis; and inside this ones there are smaller 3$\times $3 structures corresponding to the ${\Delta \phi _{1,2}}$ bins, indicated in the uppermost row and rightmost column, the $x$ and $y$-axis of these ${\Delta \phi _{1,2}}$ cells corresponds to the jet multiplicity. The $z$-axis covers a range from $-$1 to 1 indicating the correlations in blue shades and anti-correlations in red shades, the values between $-$0.1 and 0.1 are represented in white. |

png pdf |
Figure 5:
Relative uncertainties for the jet multiplicity distribution in bins of ${p_{\mathrm{T1}}}$ and ${\Delta \phi _{1,2}}$. Here Other includes luminosity, pileup, prefiring and unfolding model uncertainties added in quadrature. |
png pdf |
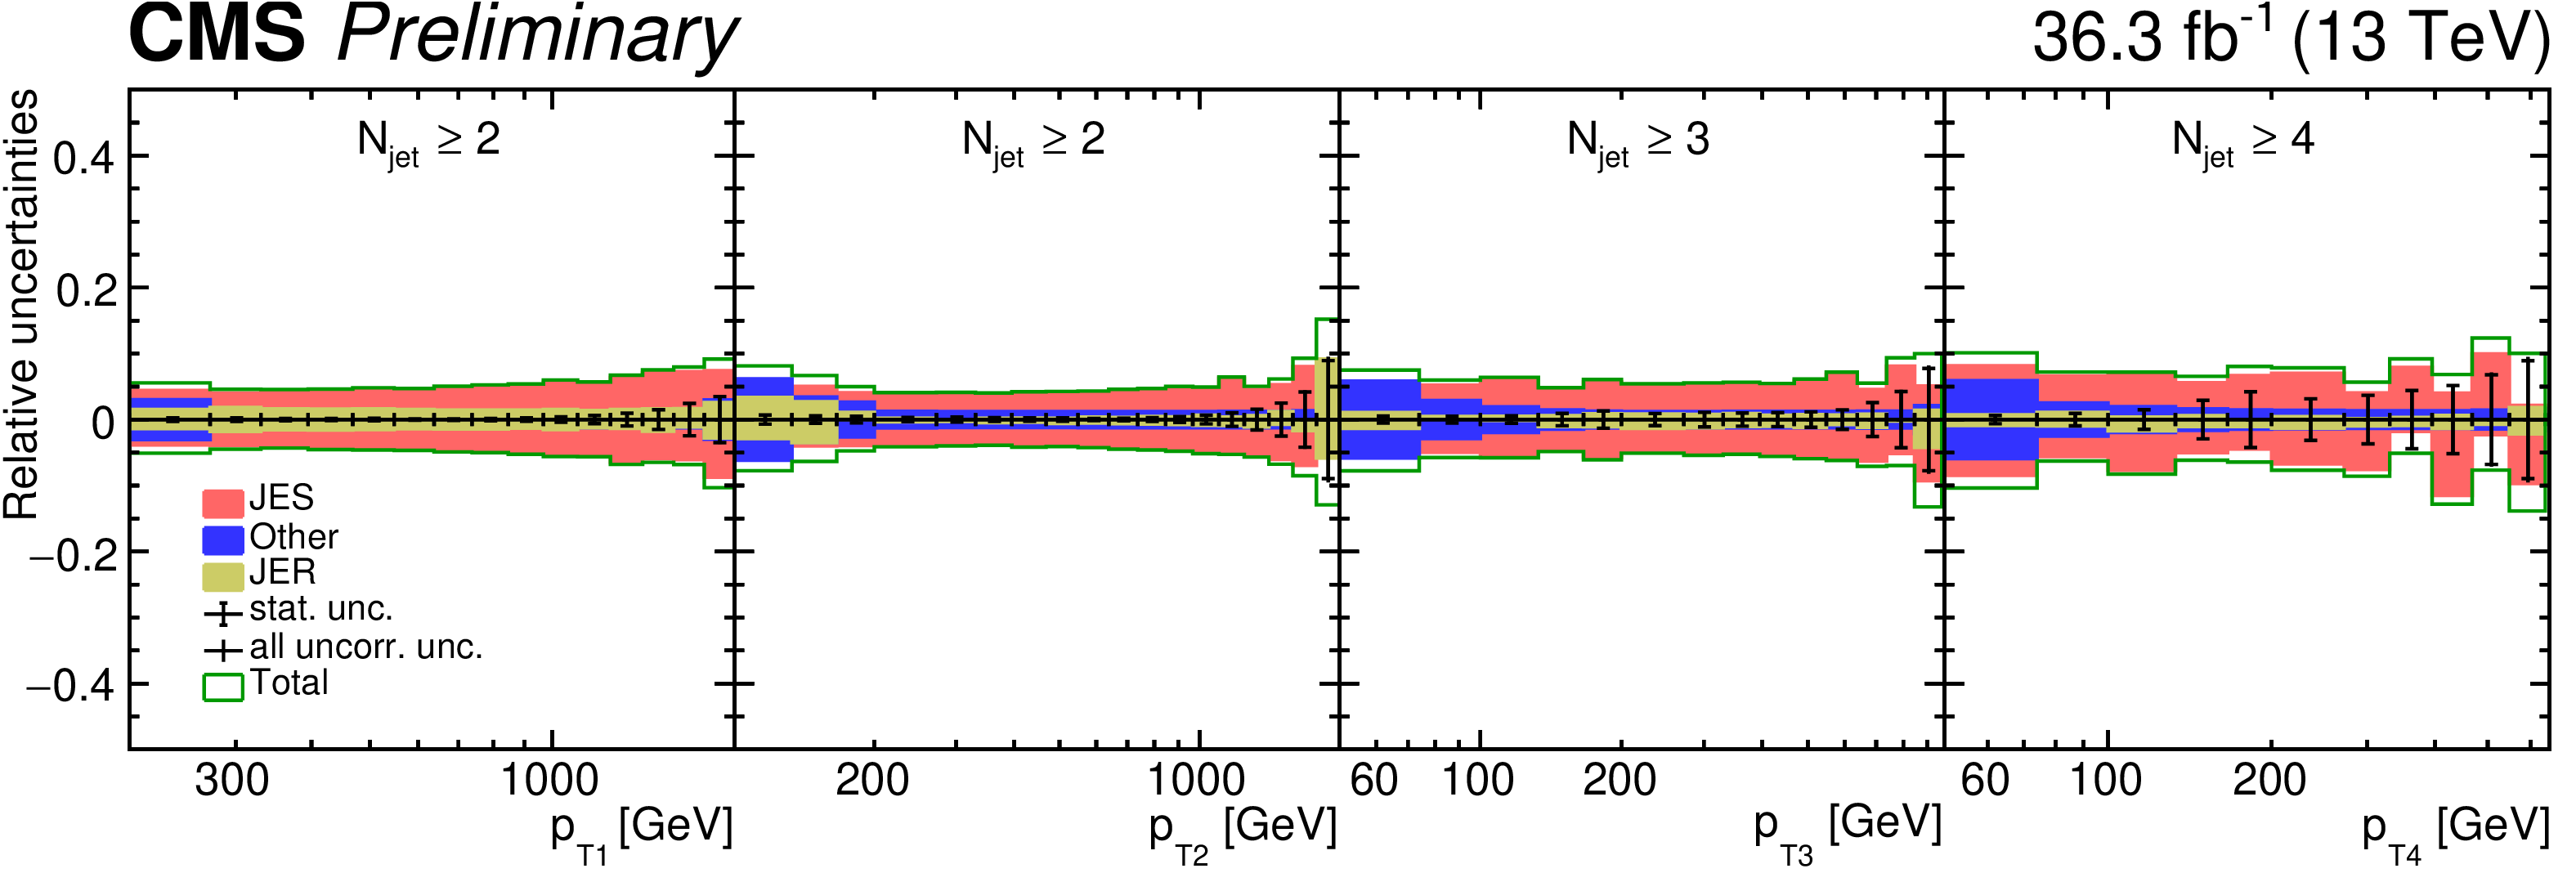
Figure 6:
Relative uncertaities for the ${p_{\mathrm {T}}}$ distributions of the four leading jets. Here Other includes luminosity, pileup, prefiring and unfolding model uncertainties added in quadrature. |
png pdf |
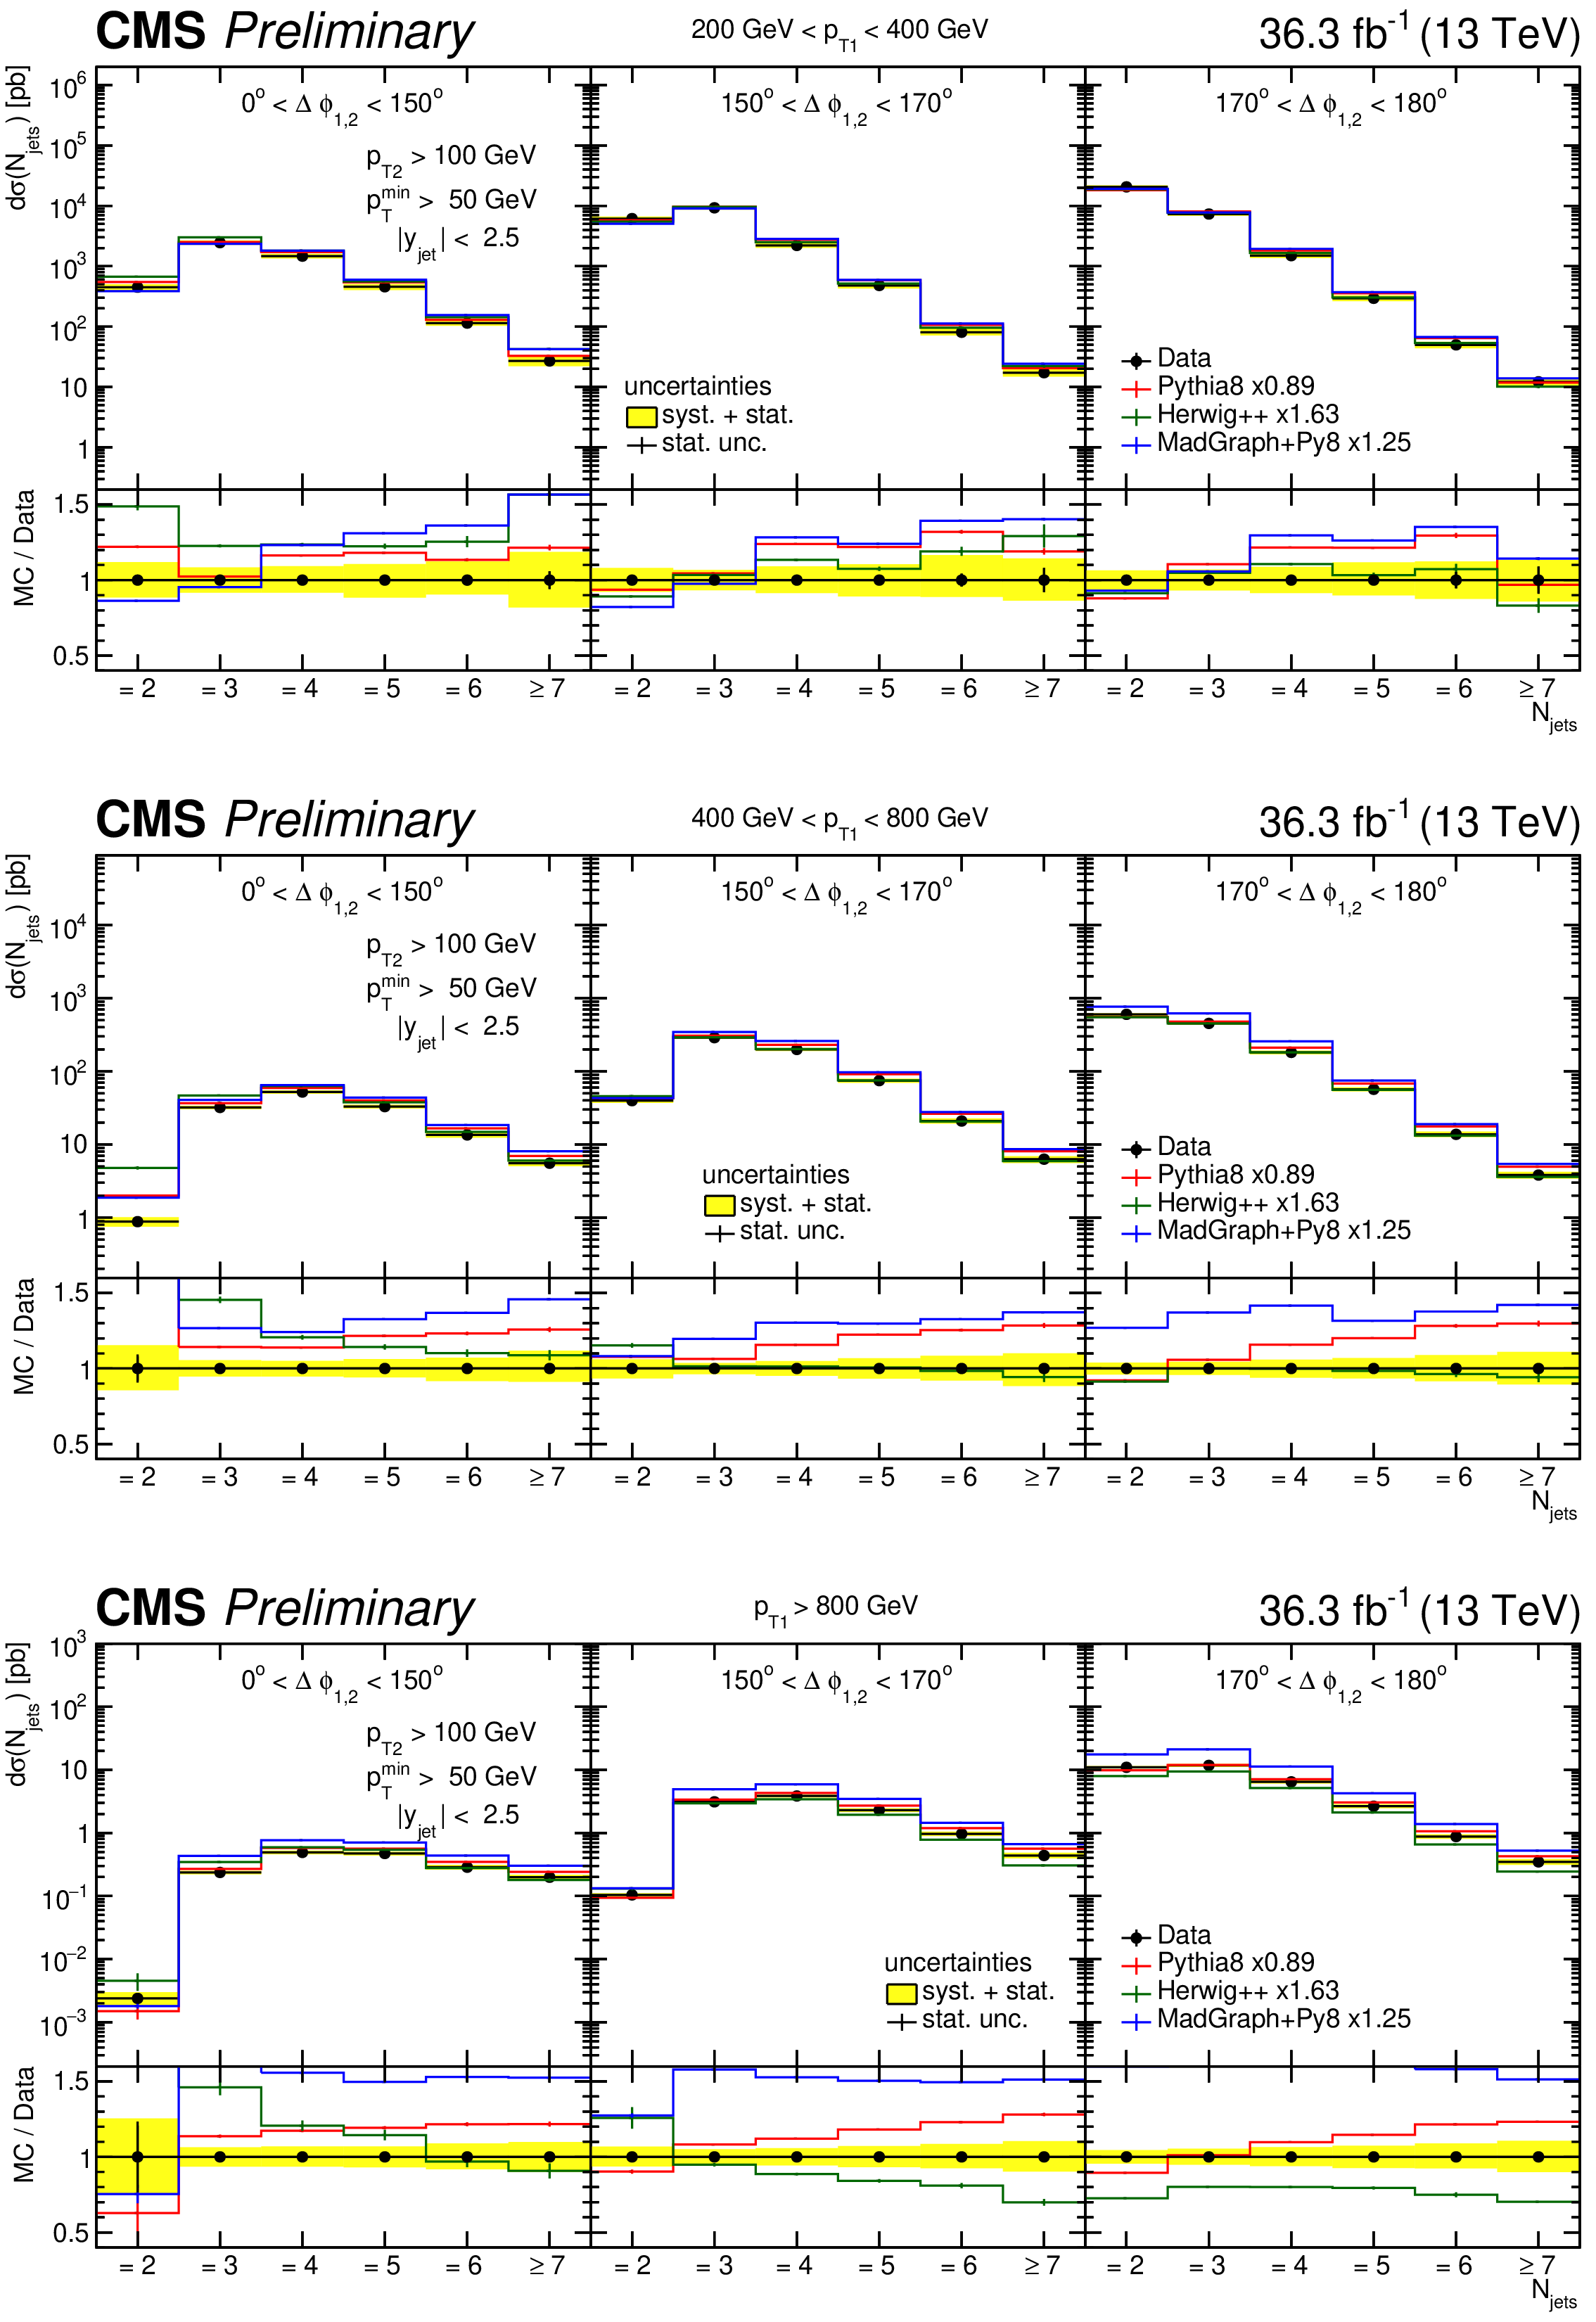
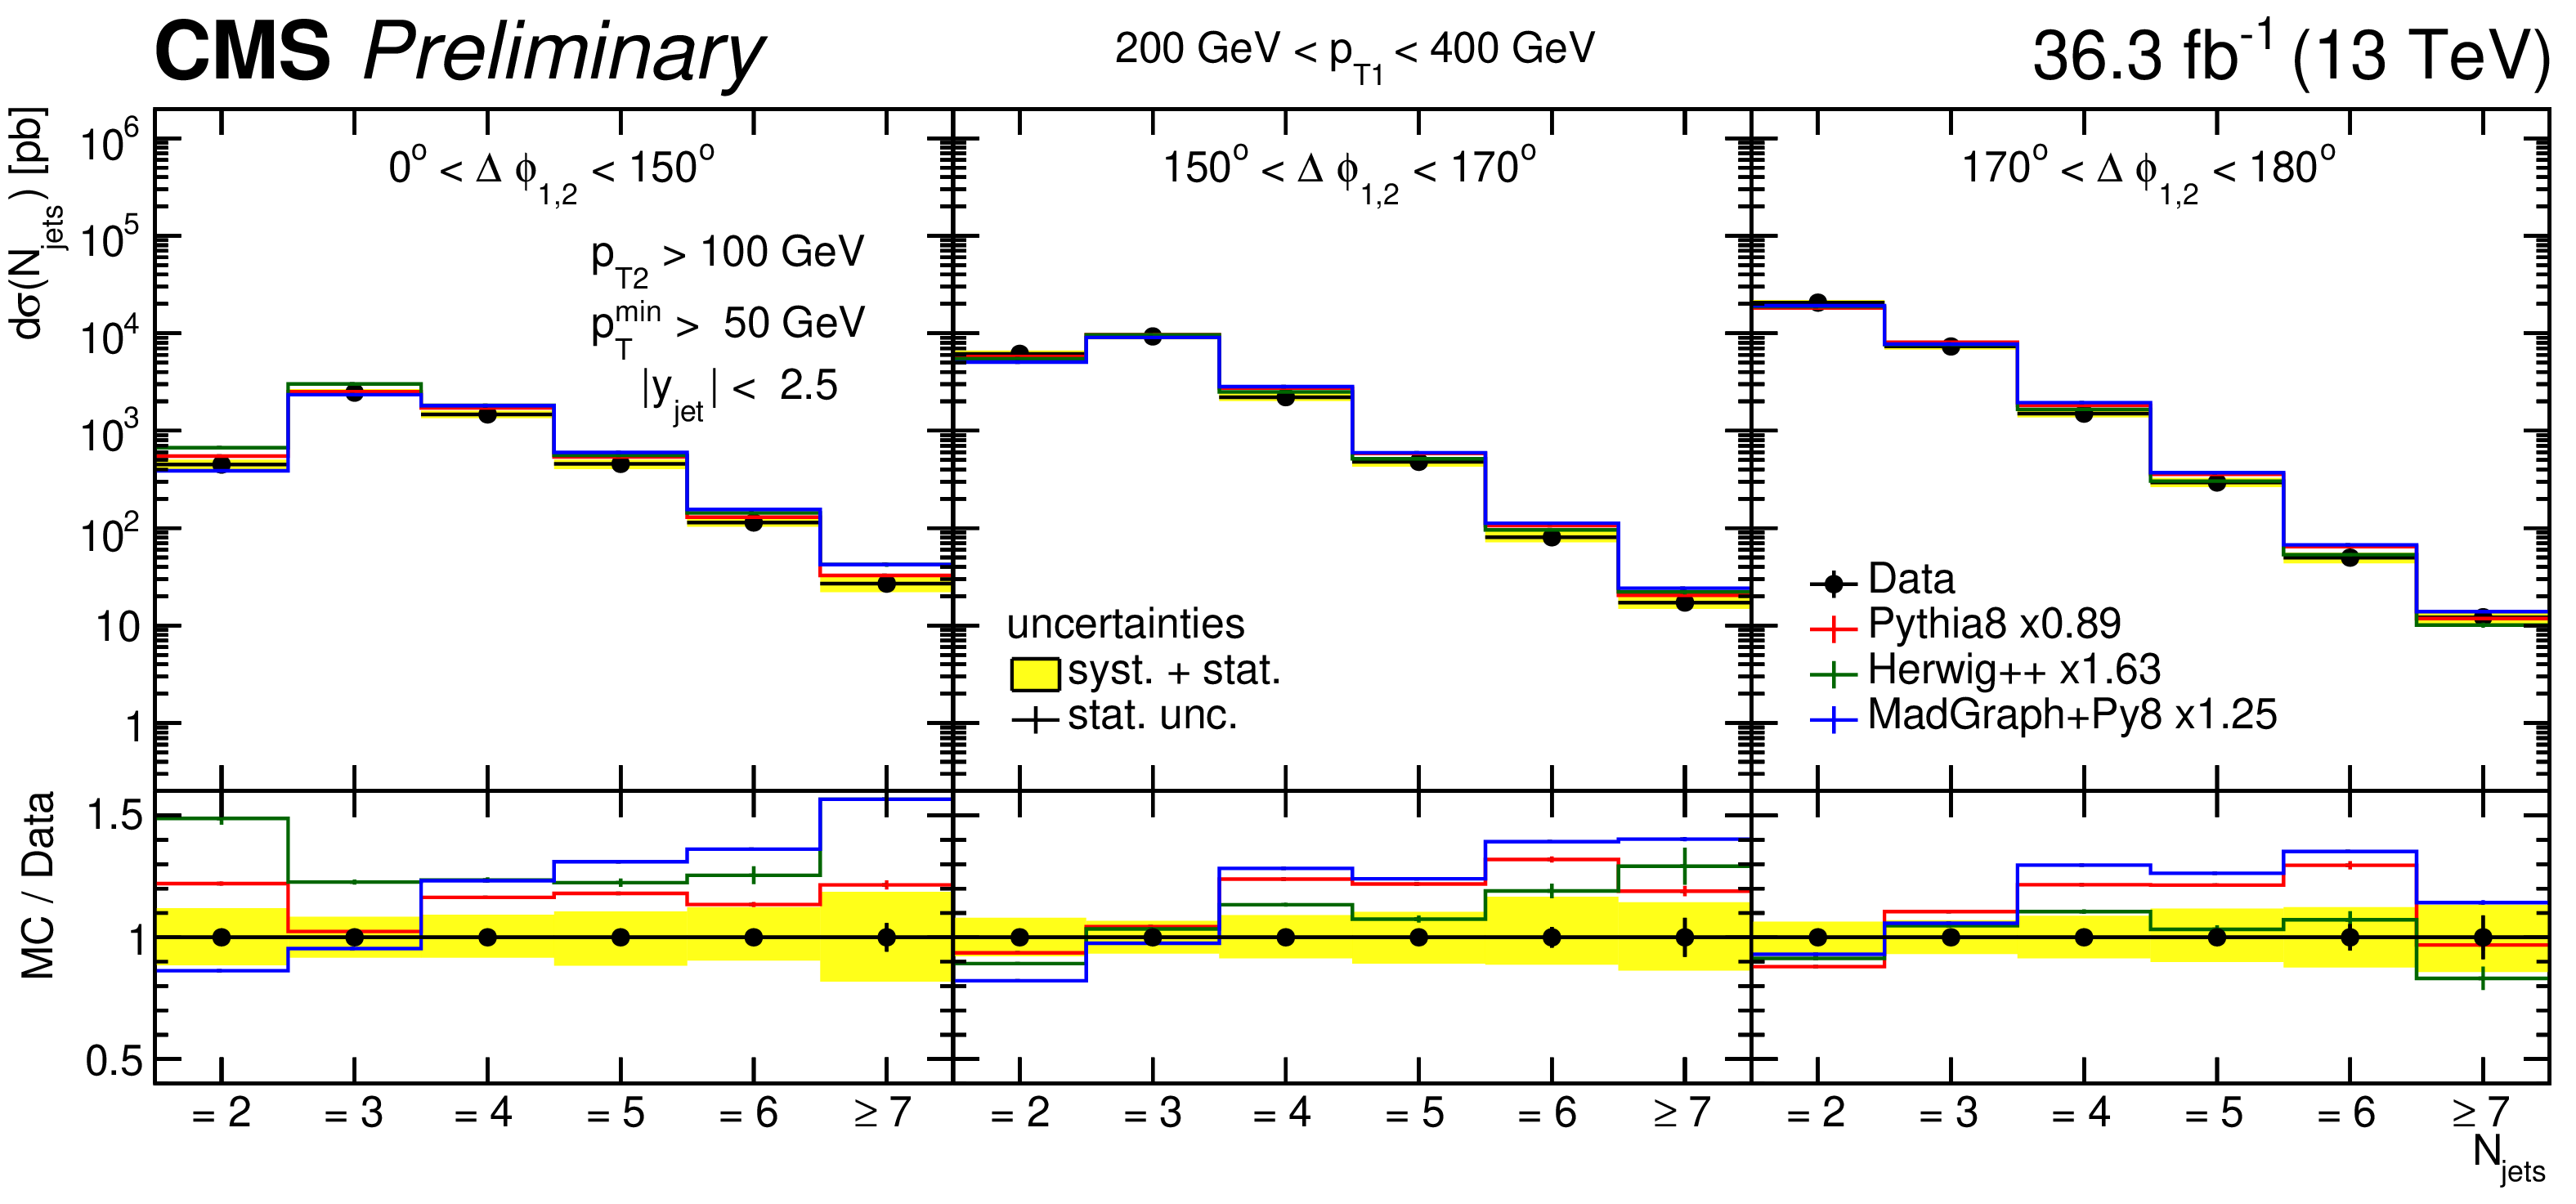
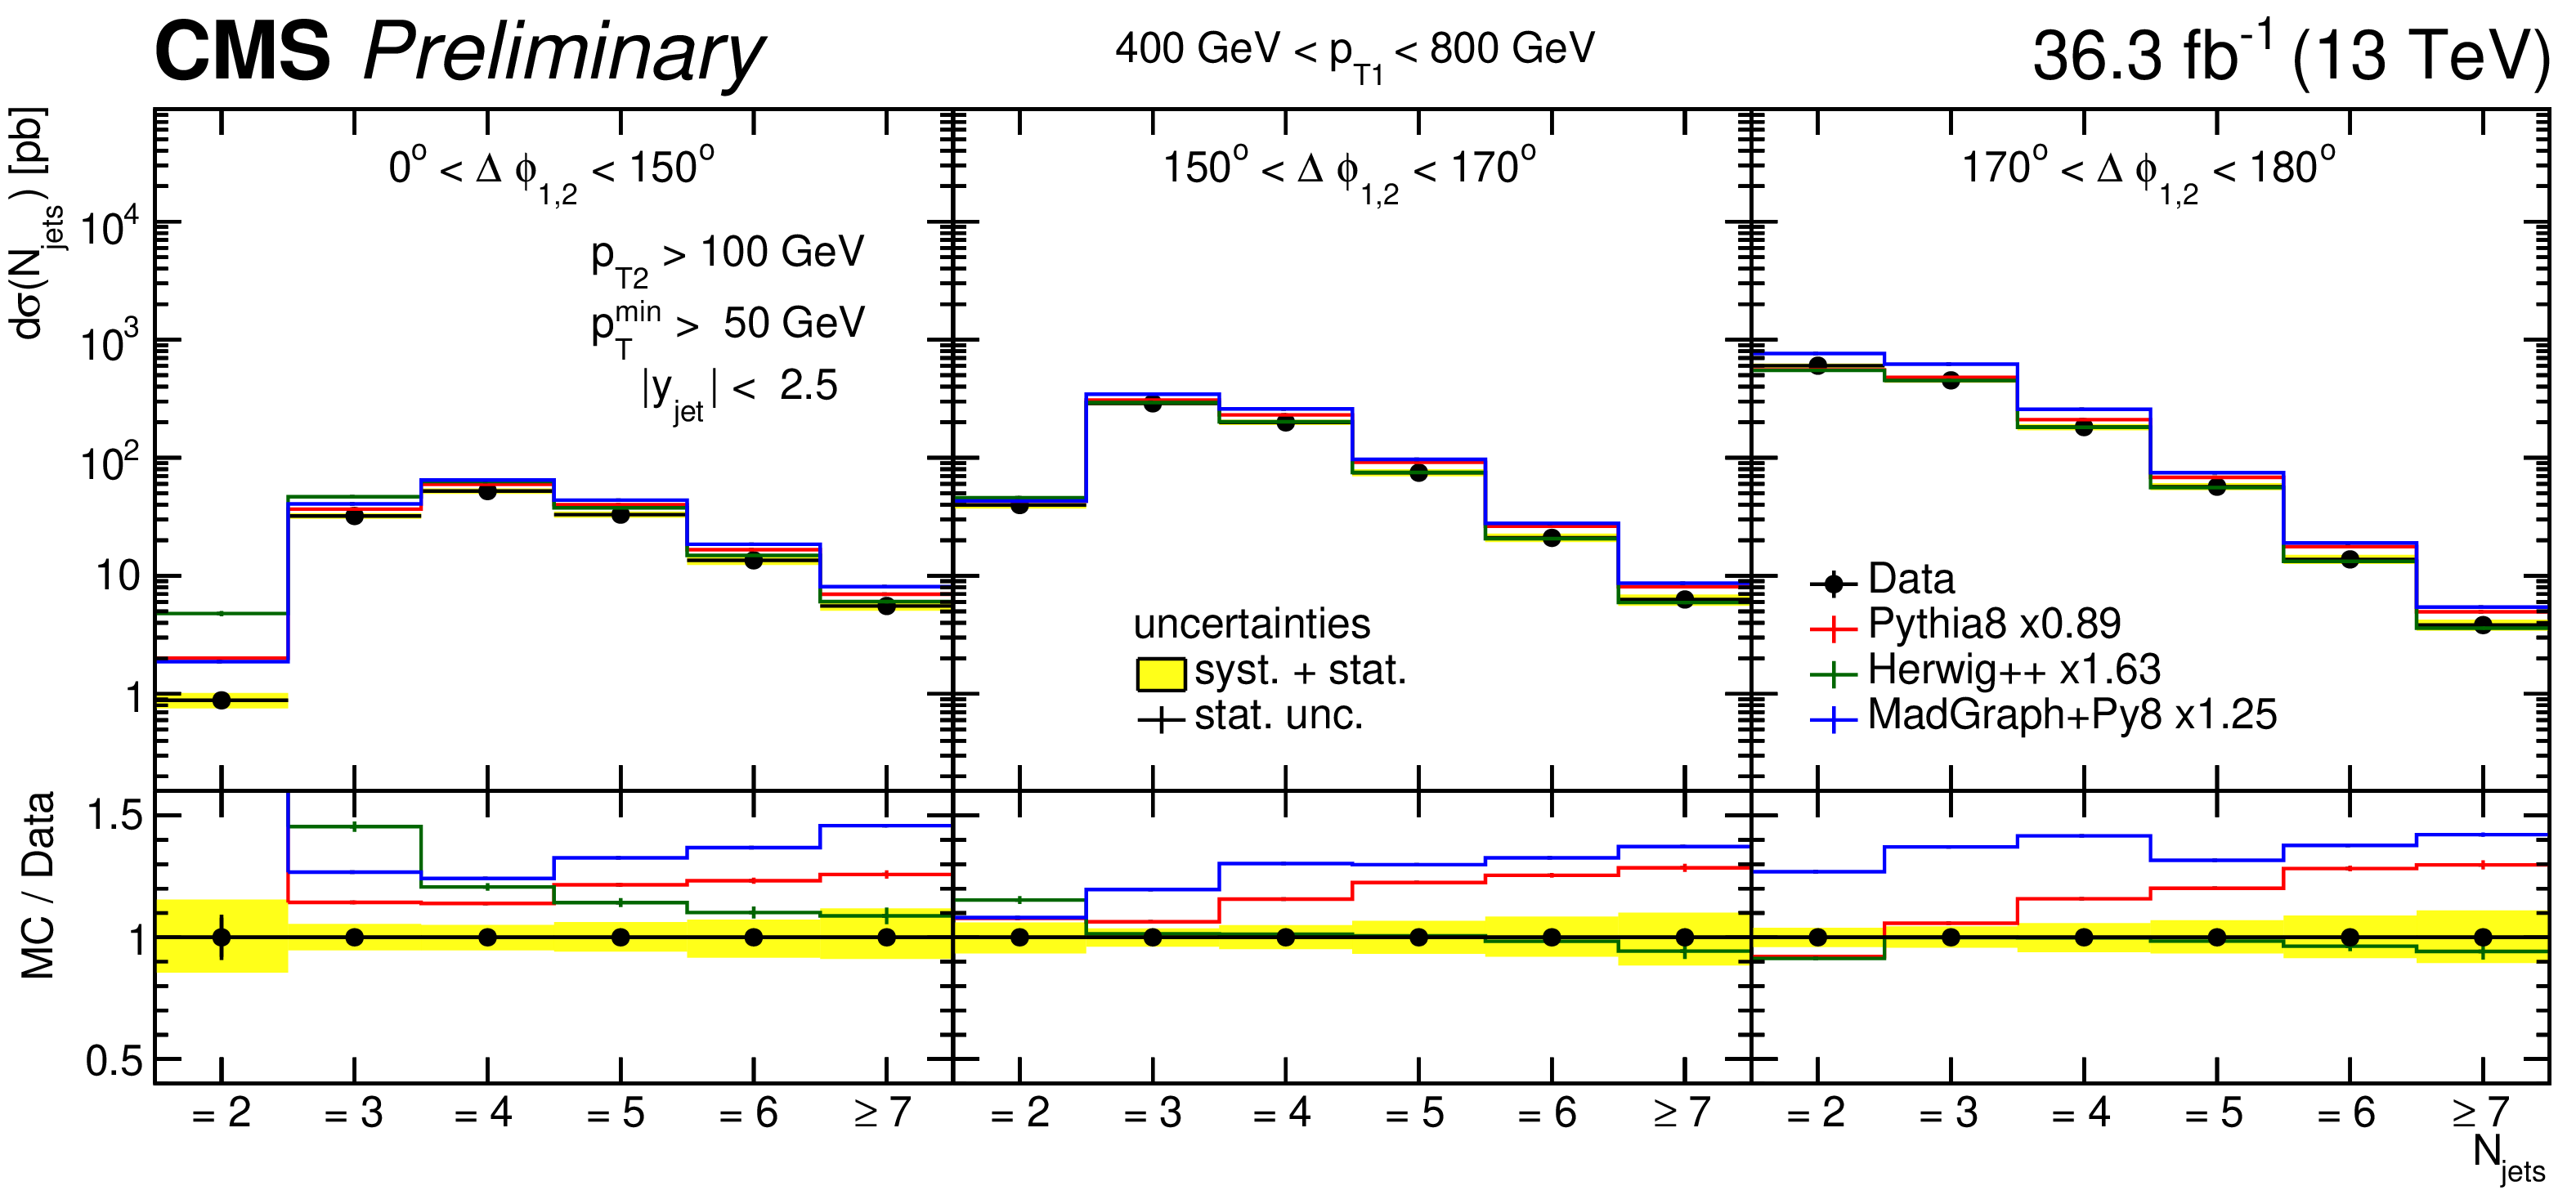
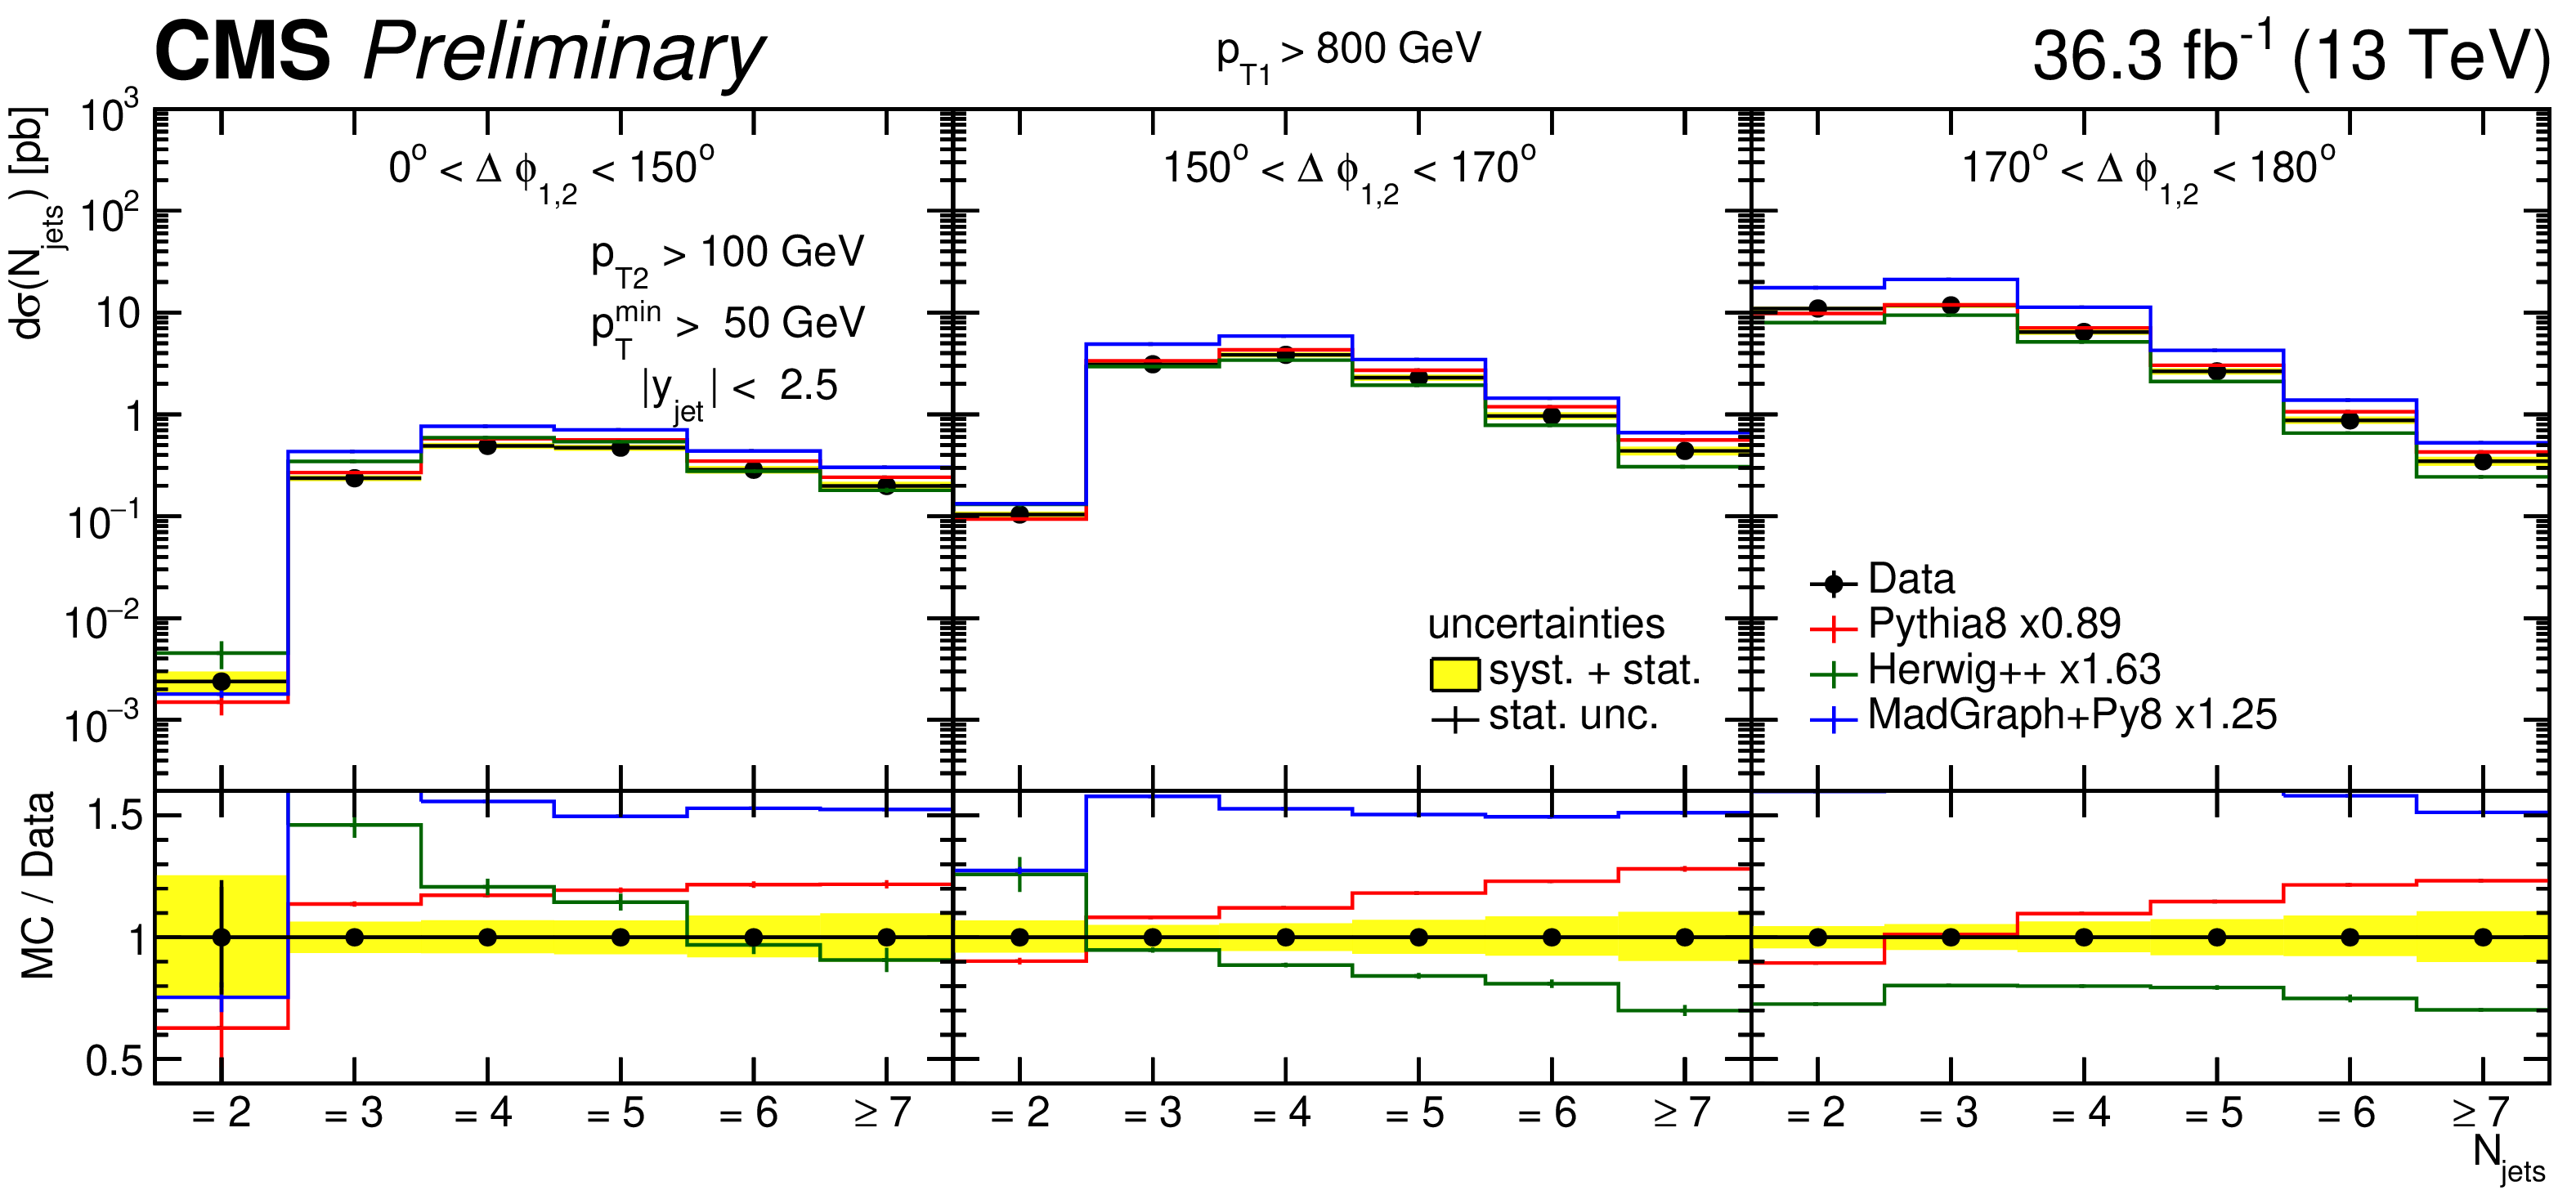
Figure 7:
Differential cross section as function of the exclusive jet multiplicity (inclusive for 7 jets) in bins of ${p_{\mathrm{T1}}}$ and ${\Delta \phi _{1,2}}$. The data are compared to LO predictions normalized to the measured inclusive dijet cross section using the scaling factors shown in the legend. |
png pdf |
Figure 7-a:
Differential cross section as function of the exclusive jet multiplicity (inclusive for 7 jets) in bins of ${p_{\mathrm{T1}}}$ and ${\Delta \phi _{1,2}}$. The data are compared to LO predictions normalized to the measured inclusive dijet cross section using the scaling factors shown in the legend. |
png pdf |
Figure 7-b:
Differential cross section as function of the exclusive jet multiplicity (inclusive for 7 jets) in bins of ${p_{\mathrm{T1}}}$ and ${\Delta \phi _{1,2}}$. The data are compared to LO predictions normalized to the measured inclusive dijet cross section using the scaling factors shown in the legend. |
png pdf |
Figure 7-c:
Differential cross section as function of the exclusive jet multiplicity (inclusive for 7 jets) in bins of ${p_{\mathrm{T1}}}$ and ${\Delta \phi _{1,2}}$. The data are compared to LO predictions normalized to the measured inclusive dijet cross section using the scaling factors shown in the legend. |

png pdf |
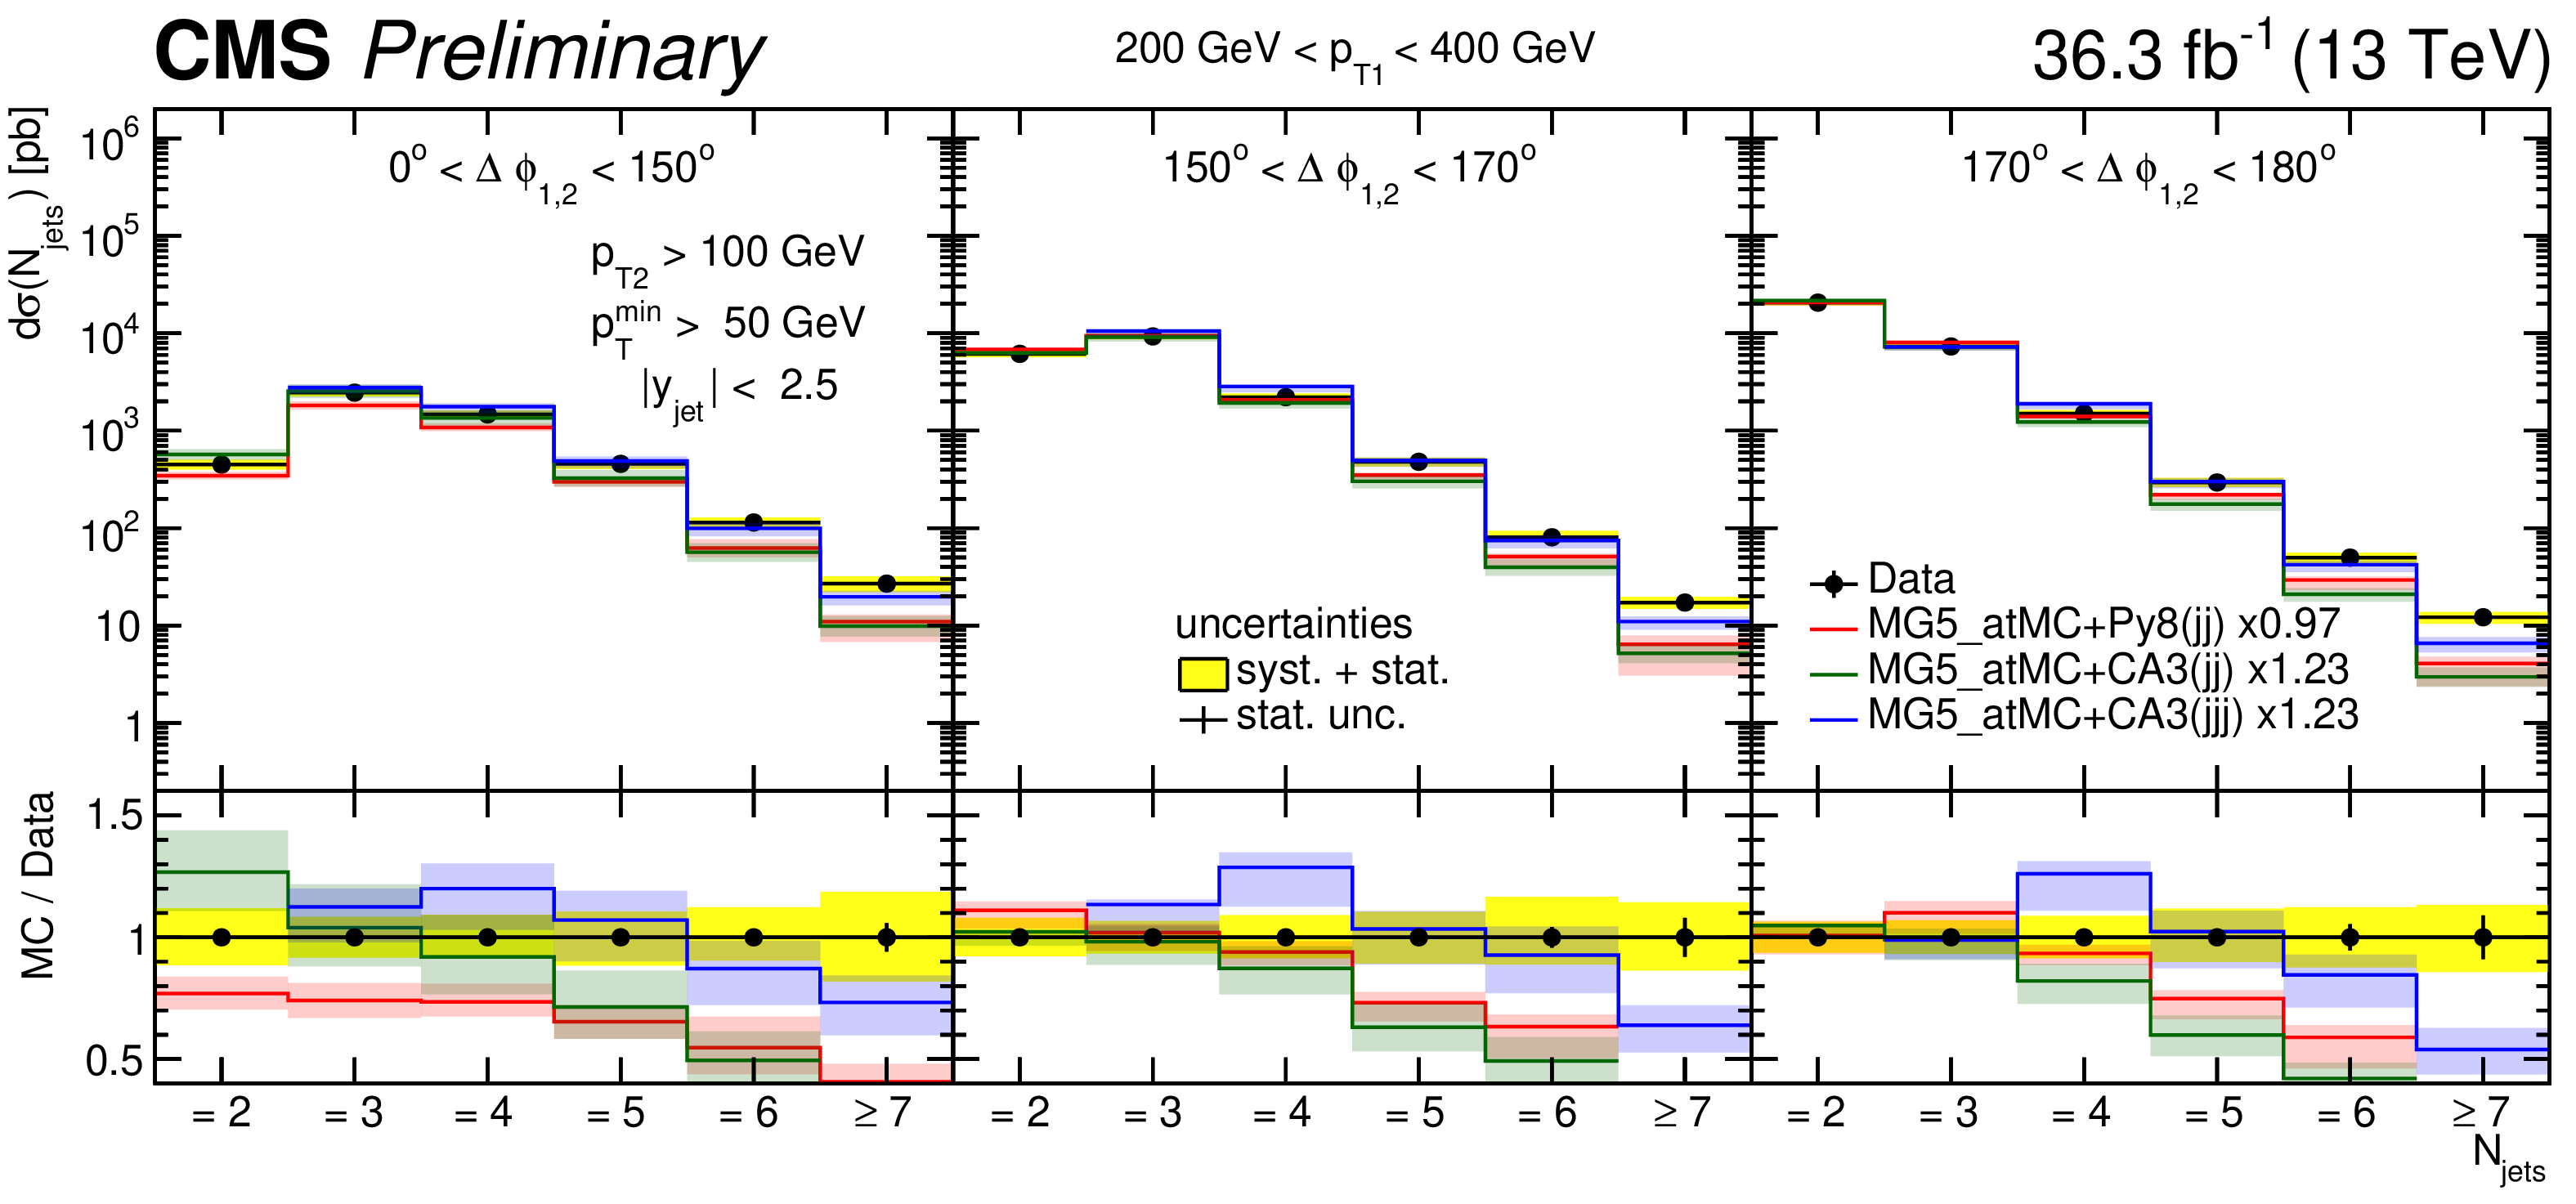
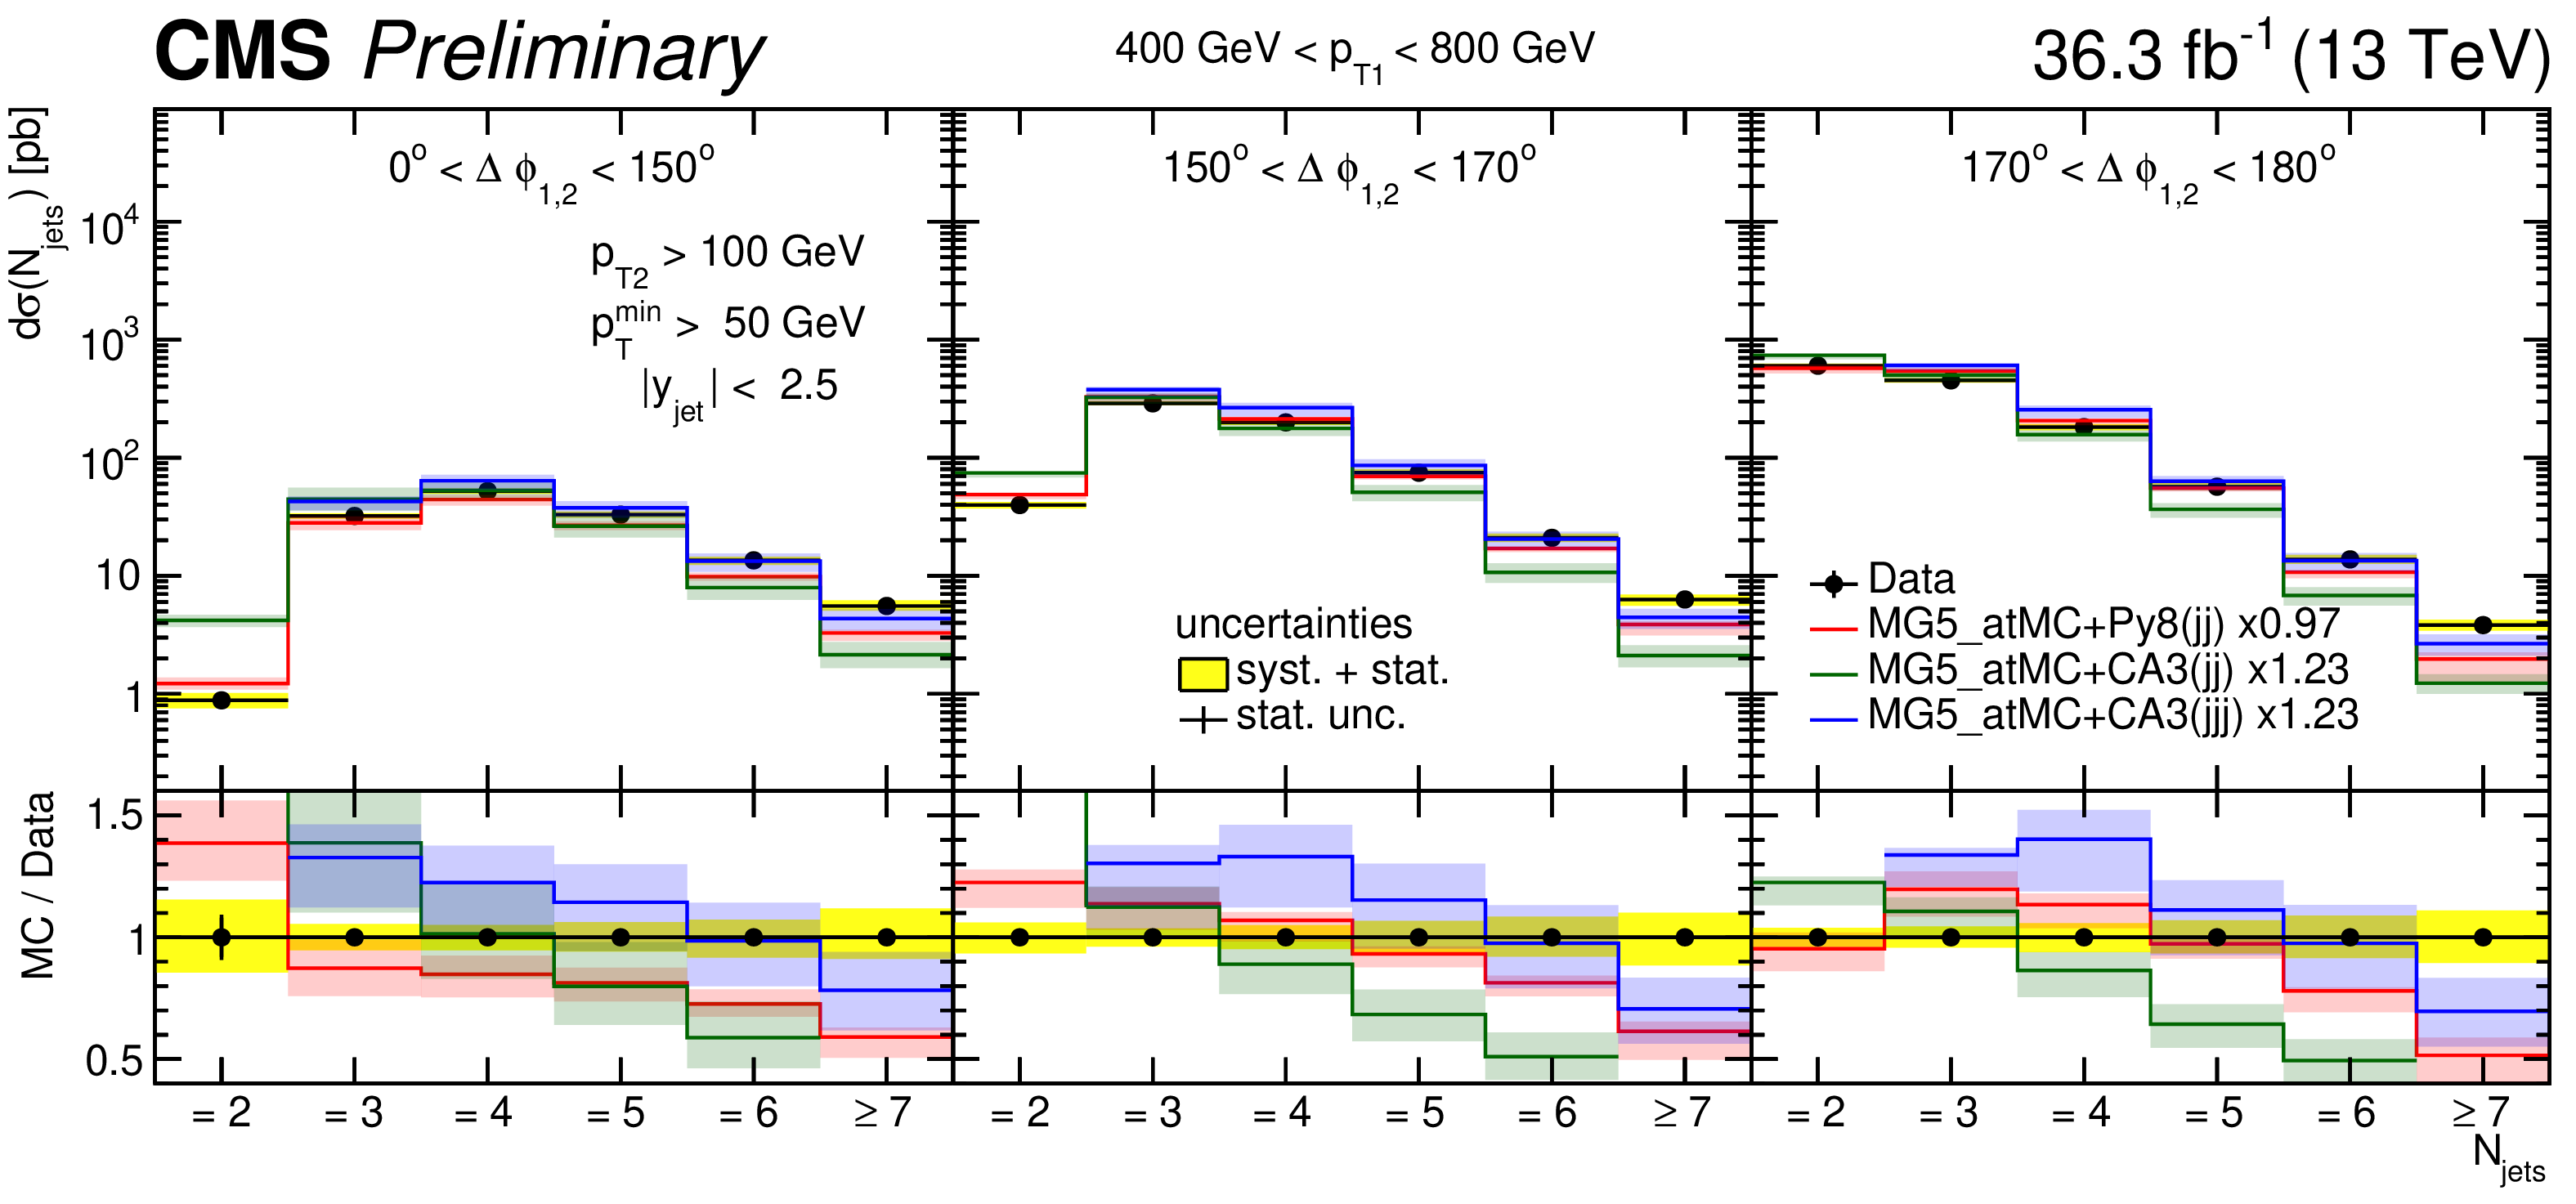
Figure 8:
Differential cross section as function of the exclusive jet multiplicity (inclusive for 7 jets) in bins of ${p_{\mathrm{T1}}}$ and ${\Delta \phi _{1,2}}$. The data are compared to NLO dijet predictions MG5_aMC+Py8 (jj) and MG5_aMC+CA3 (jj) as well as the NLO three-jet prediction of MG5_aMC+CA3 (jjj). The predictions are normalized to the measured inclusive dijet cross section using the scaling factors shown in the legend. |
png pdf |
Figure 8-a:
Differential cross section as function of the exclusive jet multiplicity (inclusive for 7 jets) in bins of ${p_{\mathrm{T1}}}$ and ${\Delta \phi _{1,2}}$. The data are compared to NLO dijet predictions MG5_aMC+Py8 (jj) and MG5_aMC+CA3 (jj) as well as the NLO three-jet prediction of MG5_aMC+CA3 (jjj). The predictions are normalized to the measured inclusive dijet cross section using the scaling factors shown in the legend. |
png pdf |
Figure 8-b:
Differential cross section as function of the exclusive jet multiplicity (inclusive for 7 jets) in bins of ${p_{\mathrm{T1}}}$ and ${\Delta \phi _{1,2}}$. The data are compared to NLO dijet predictions MG5_aMC+Py8 (jj) and MG5_aMC+CA3 (jj) as well as the NLO three-jet prediction of MG5_aMC+CA3 (jjj). The predictions are normalized to the measured inclusive dijet cross section using the scaling factors shown in the legend. |

png pdf |
Figure 8-c:
Differential cross section as function of the exclusive jet multiplicity (inclusive for 7 jets) in bins of ${p_{\mathrm{T1}}}$ and ${\Delta \phi _{1,2}}$. The data are compared to NLO dijet predictions MG5_aMC+Py8 (jj) and MG5_aMC+CA3 (jj) as well as the NLO three-jet prediction of MG5_aMC+CA3 (jjj). The predictions are normalized to the measured inclusive dijet cross section using the scaling factors shown in the legend. |
png pdf |
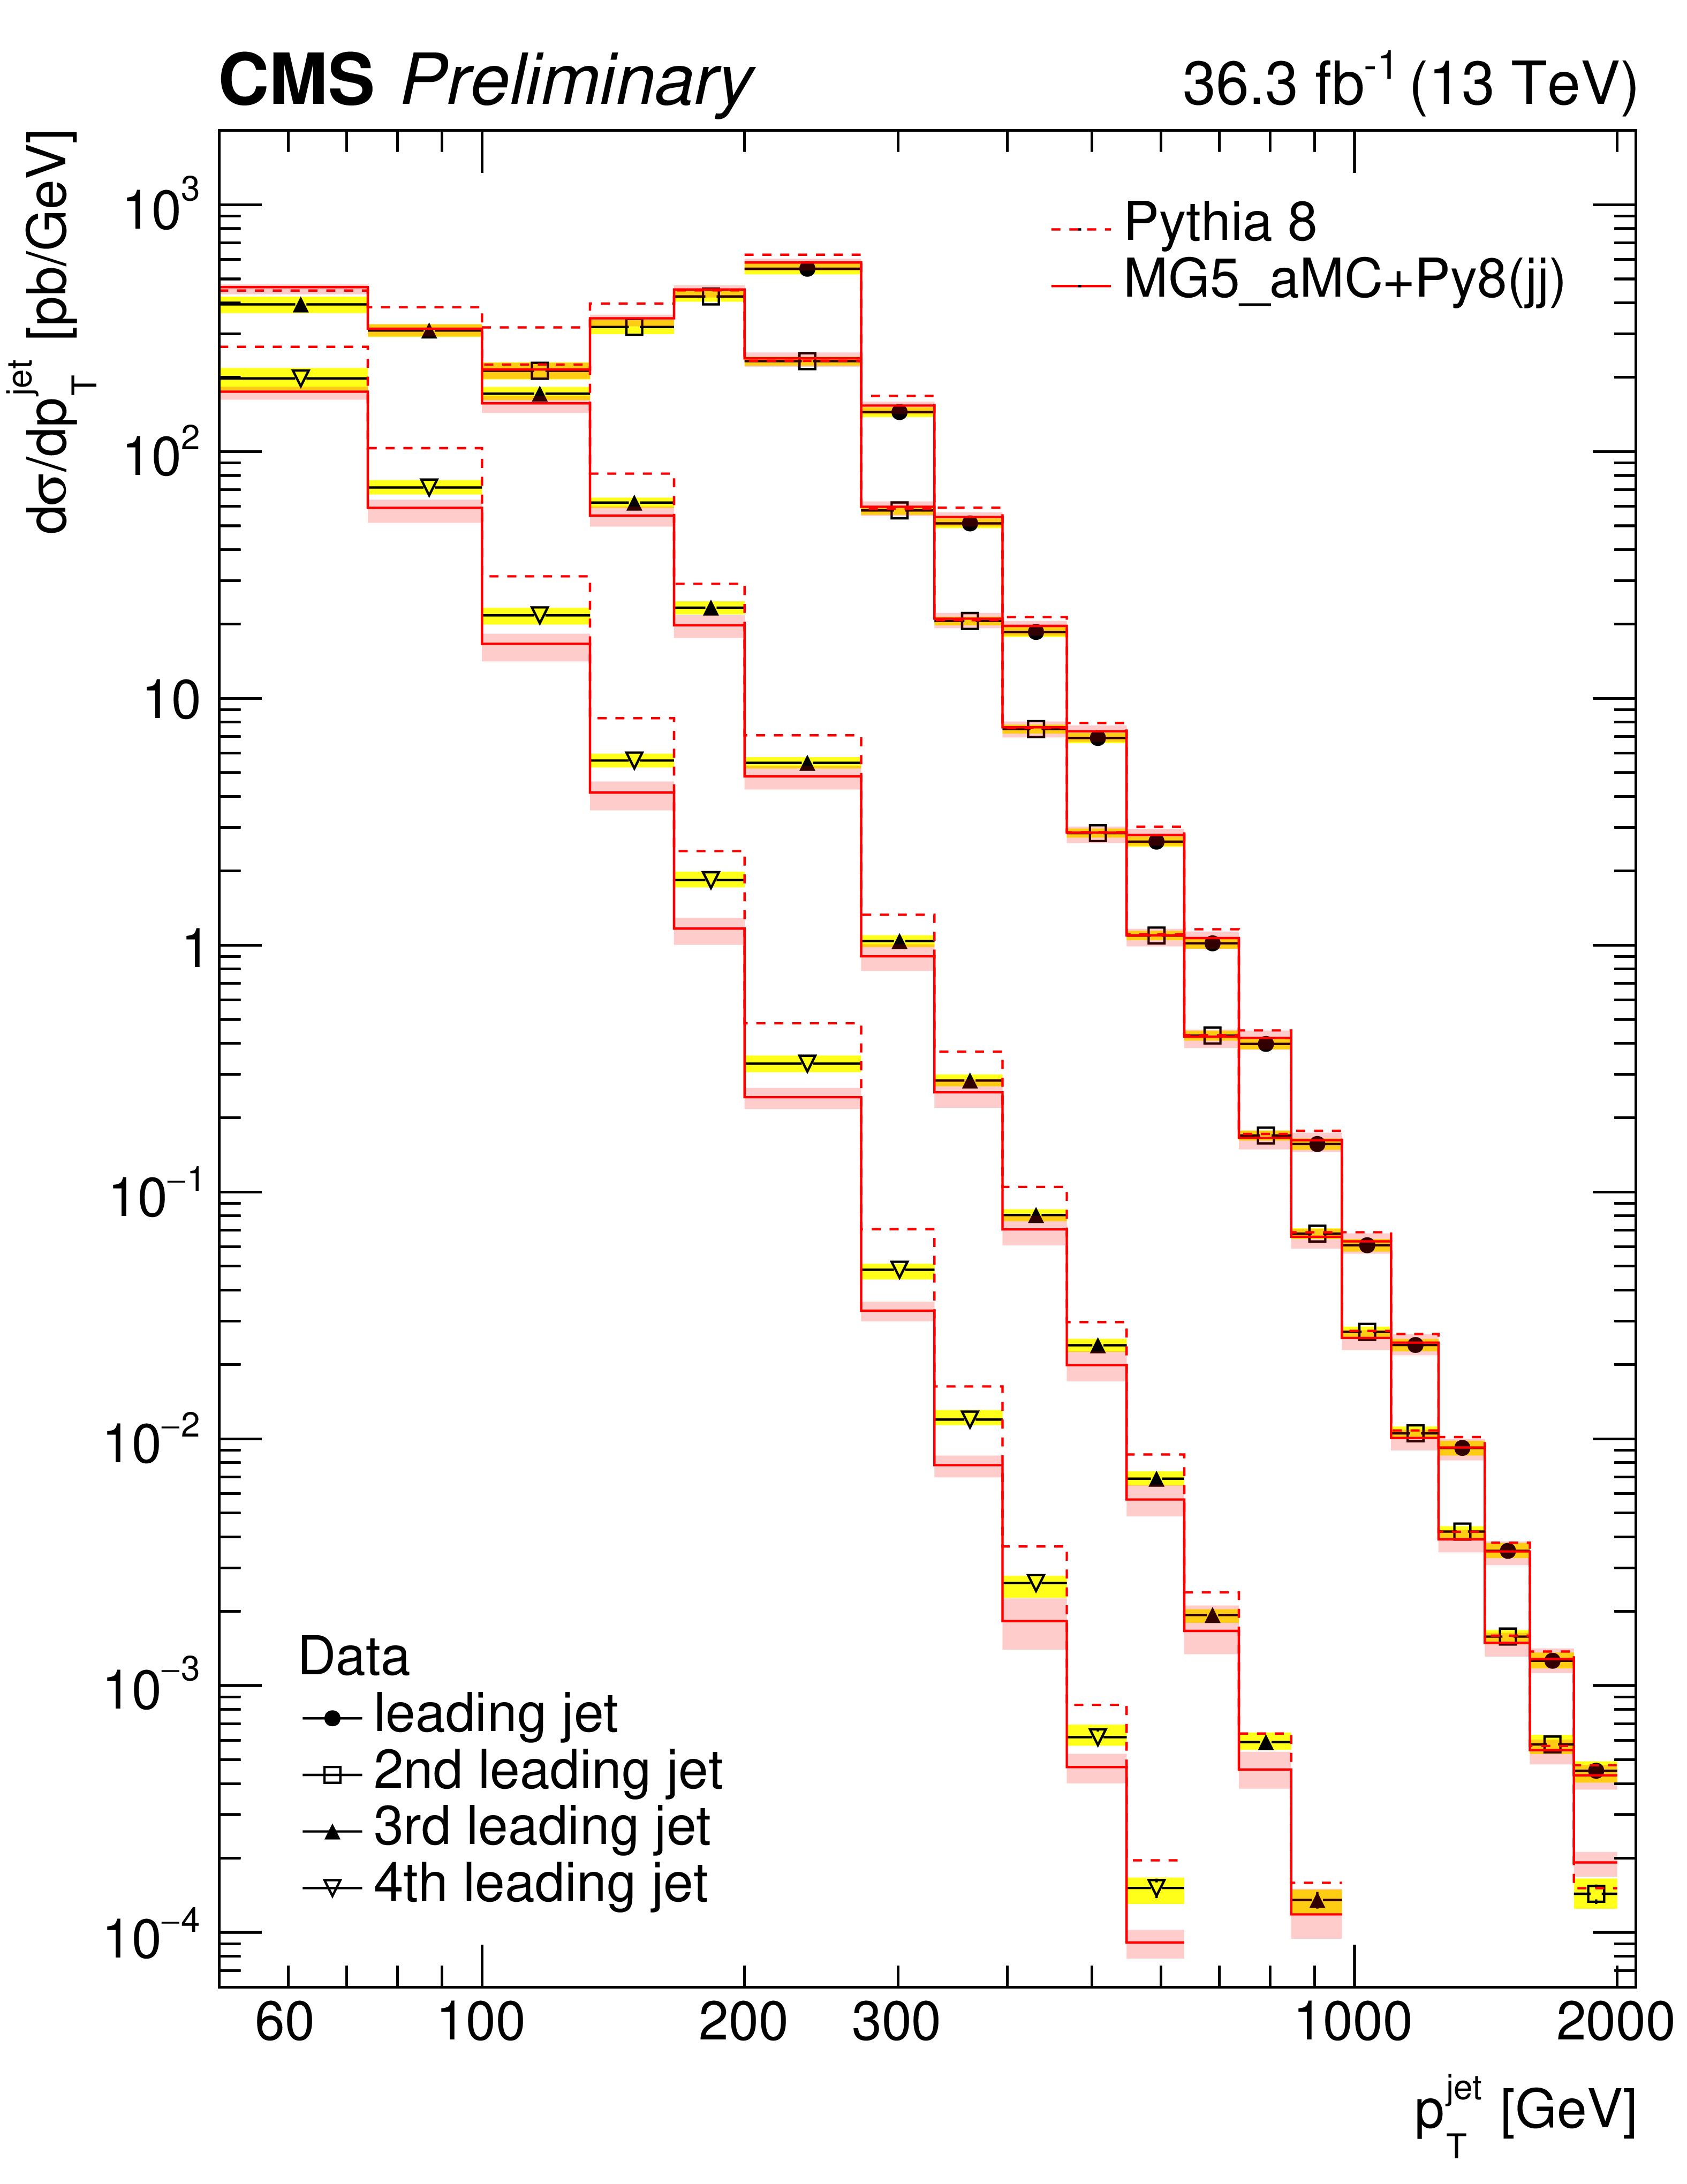
Figure 9:
Transverse momenta of the measured four leading jets, here the yellow band represents the total experimental uncertainty. Data is compared to LO (PYTHIA 8) and NLO (MG5_aMC+Py8) predictions. The red band in the NLO prediction represents the scale uncertainty. |
png pdf |
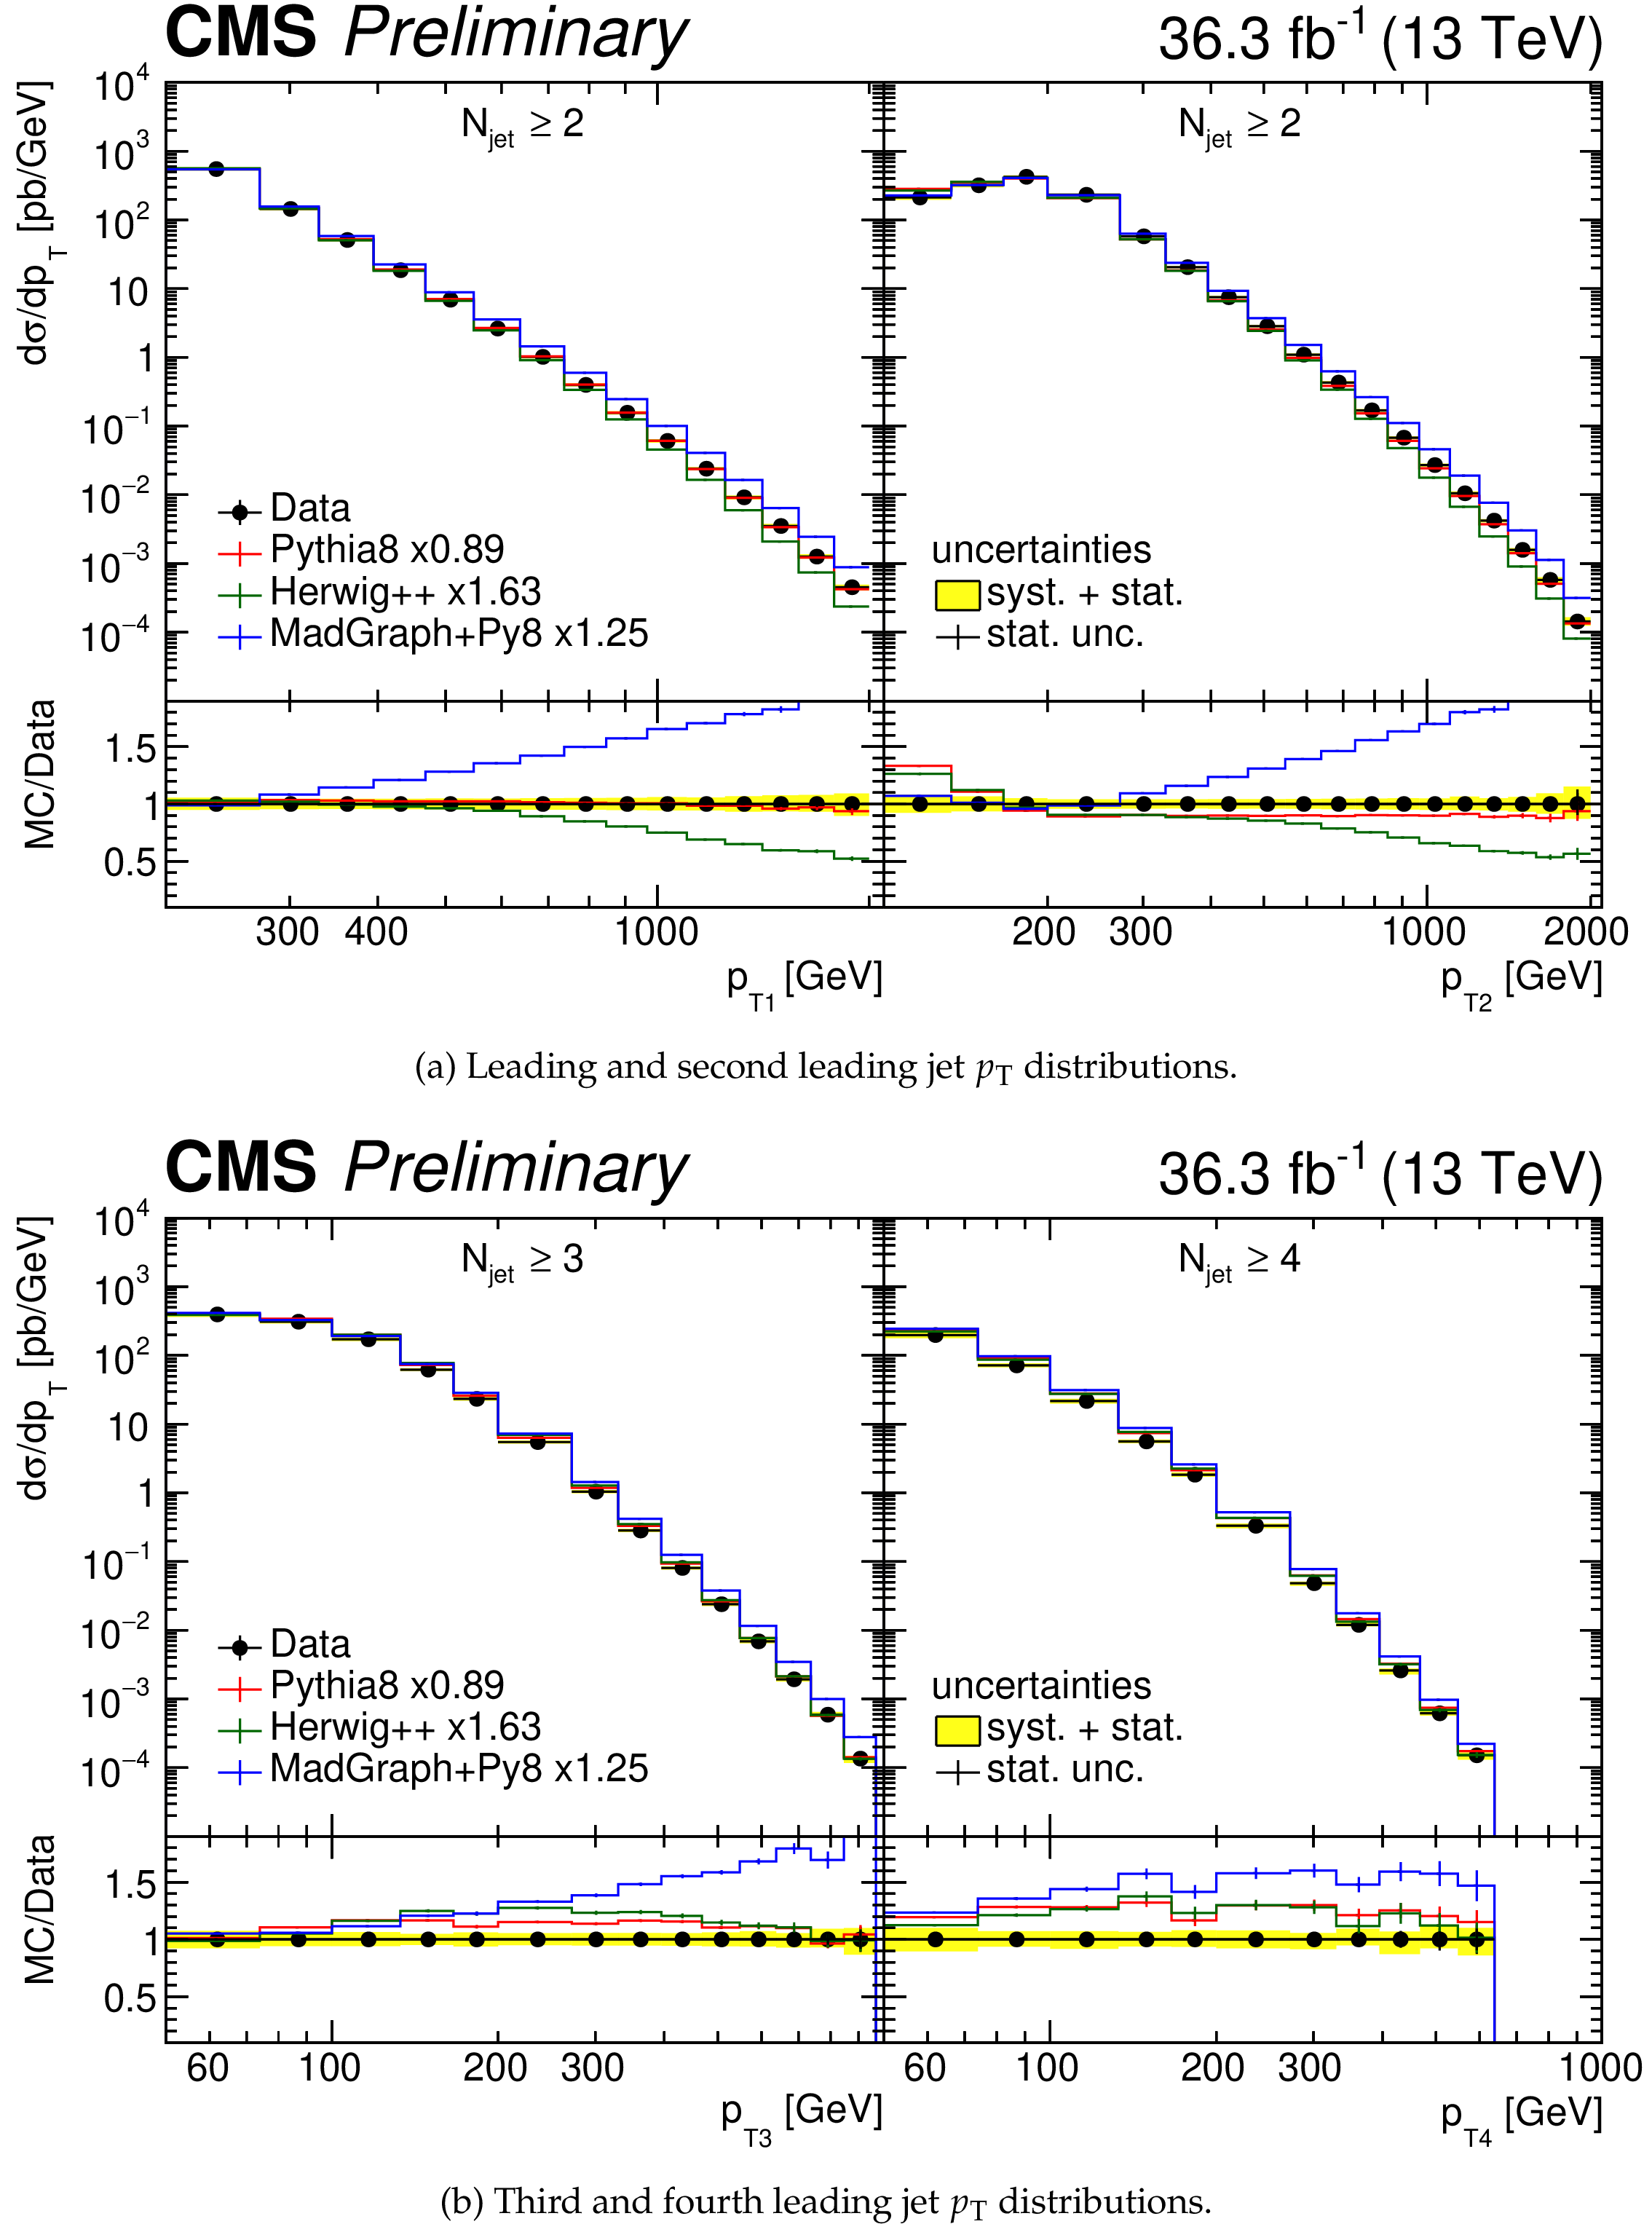
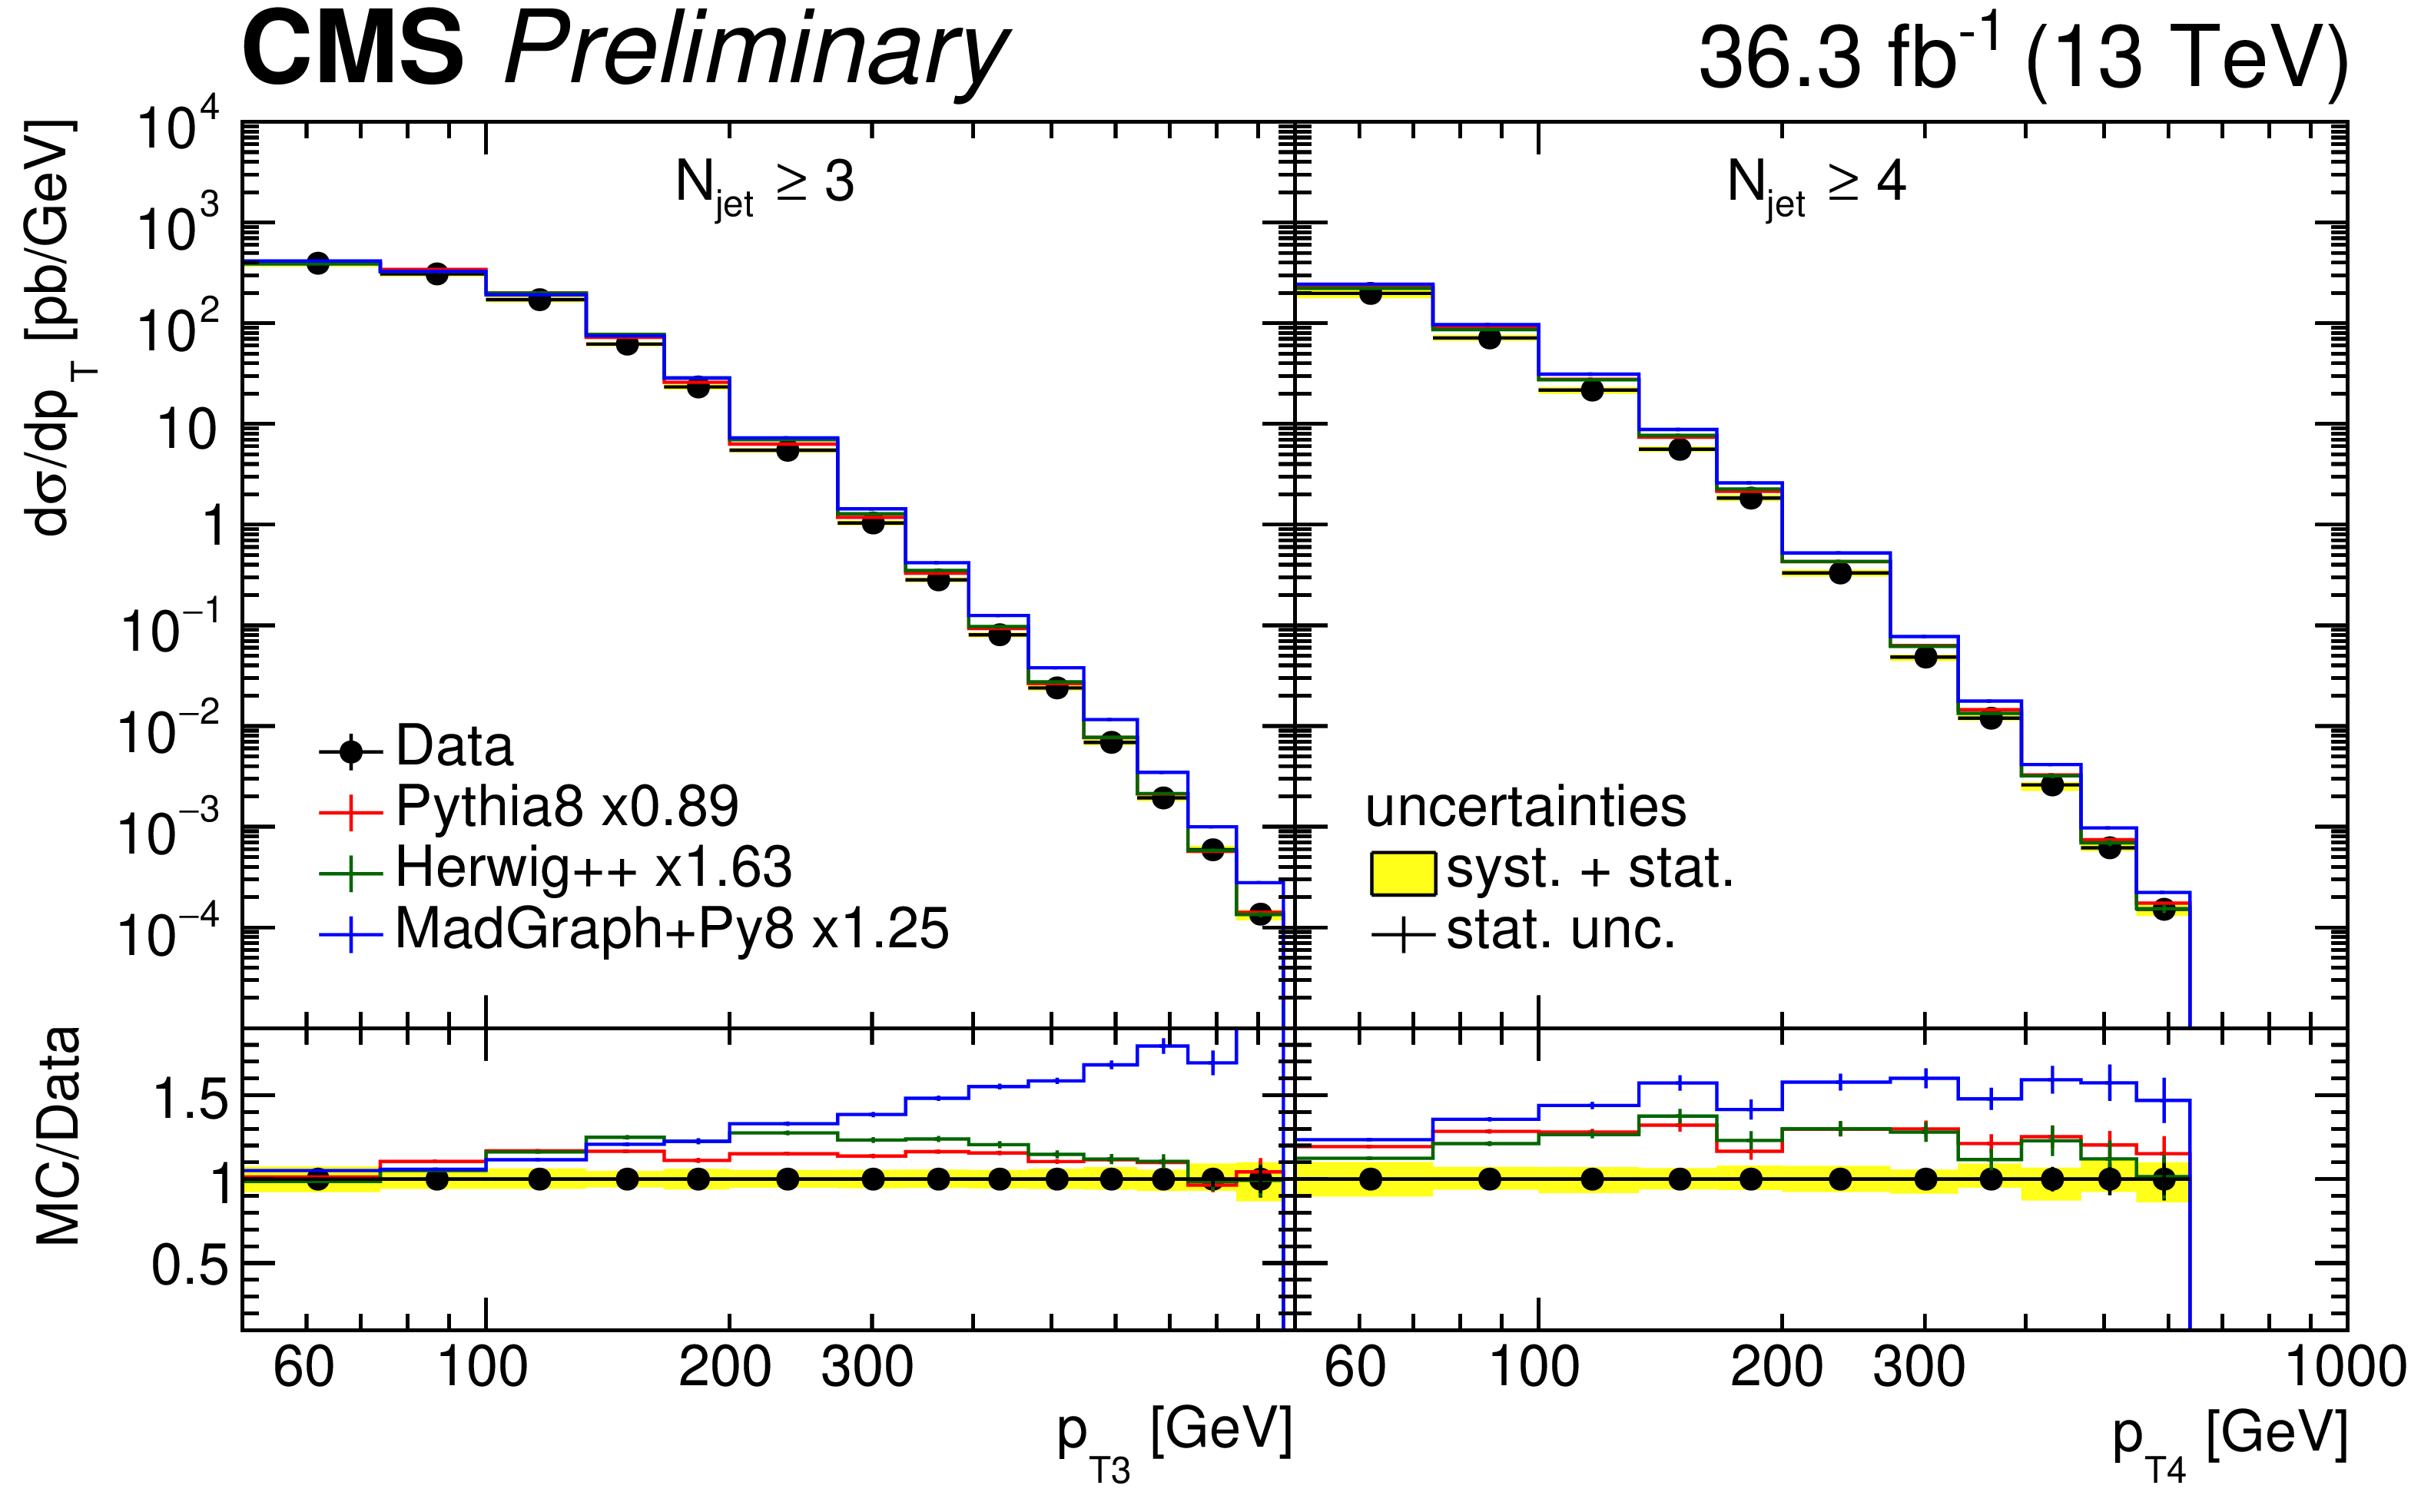
Figure 10:
Transverse momenta of the four leading jets compared to LO predictions normalized to the inclusive dijet data cross section using the scaling factors shown in the legend. |

png pdf |
Figure 10-a:
Transverse momenta of the four leading jets compared to LO predictions normalized to the inclusive dijet data cross section using the scaling factors shown in the legend. |
png pdf |
Figure 10-b:
Transverse momenta of the four leading jets compared to LO predictions normalized to the inclusive dijet data cross section using the scaling factors shown in the legend. |

png pdf |
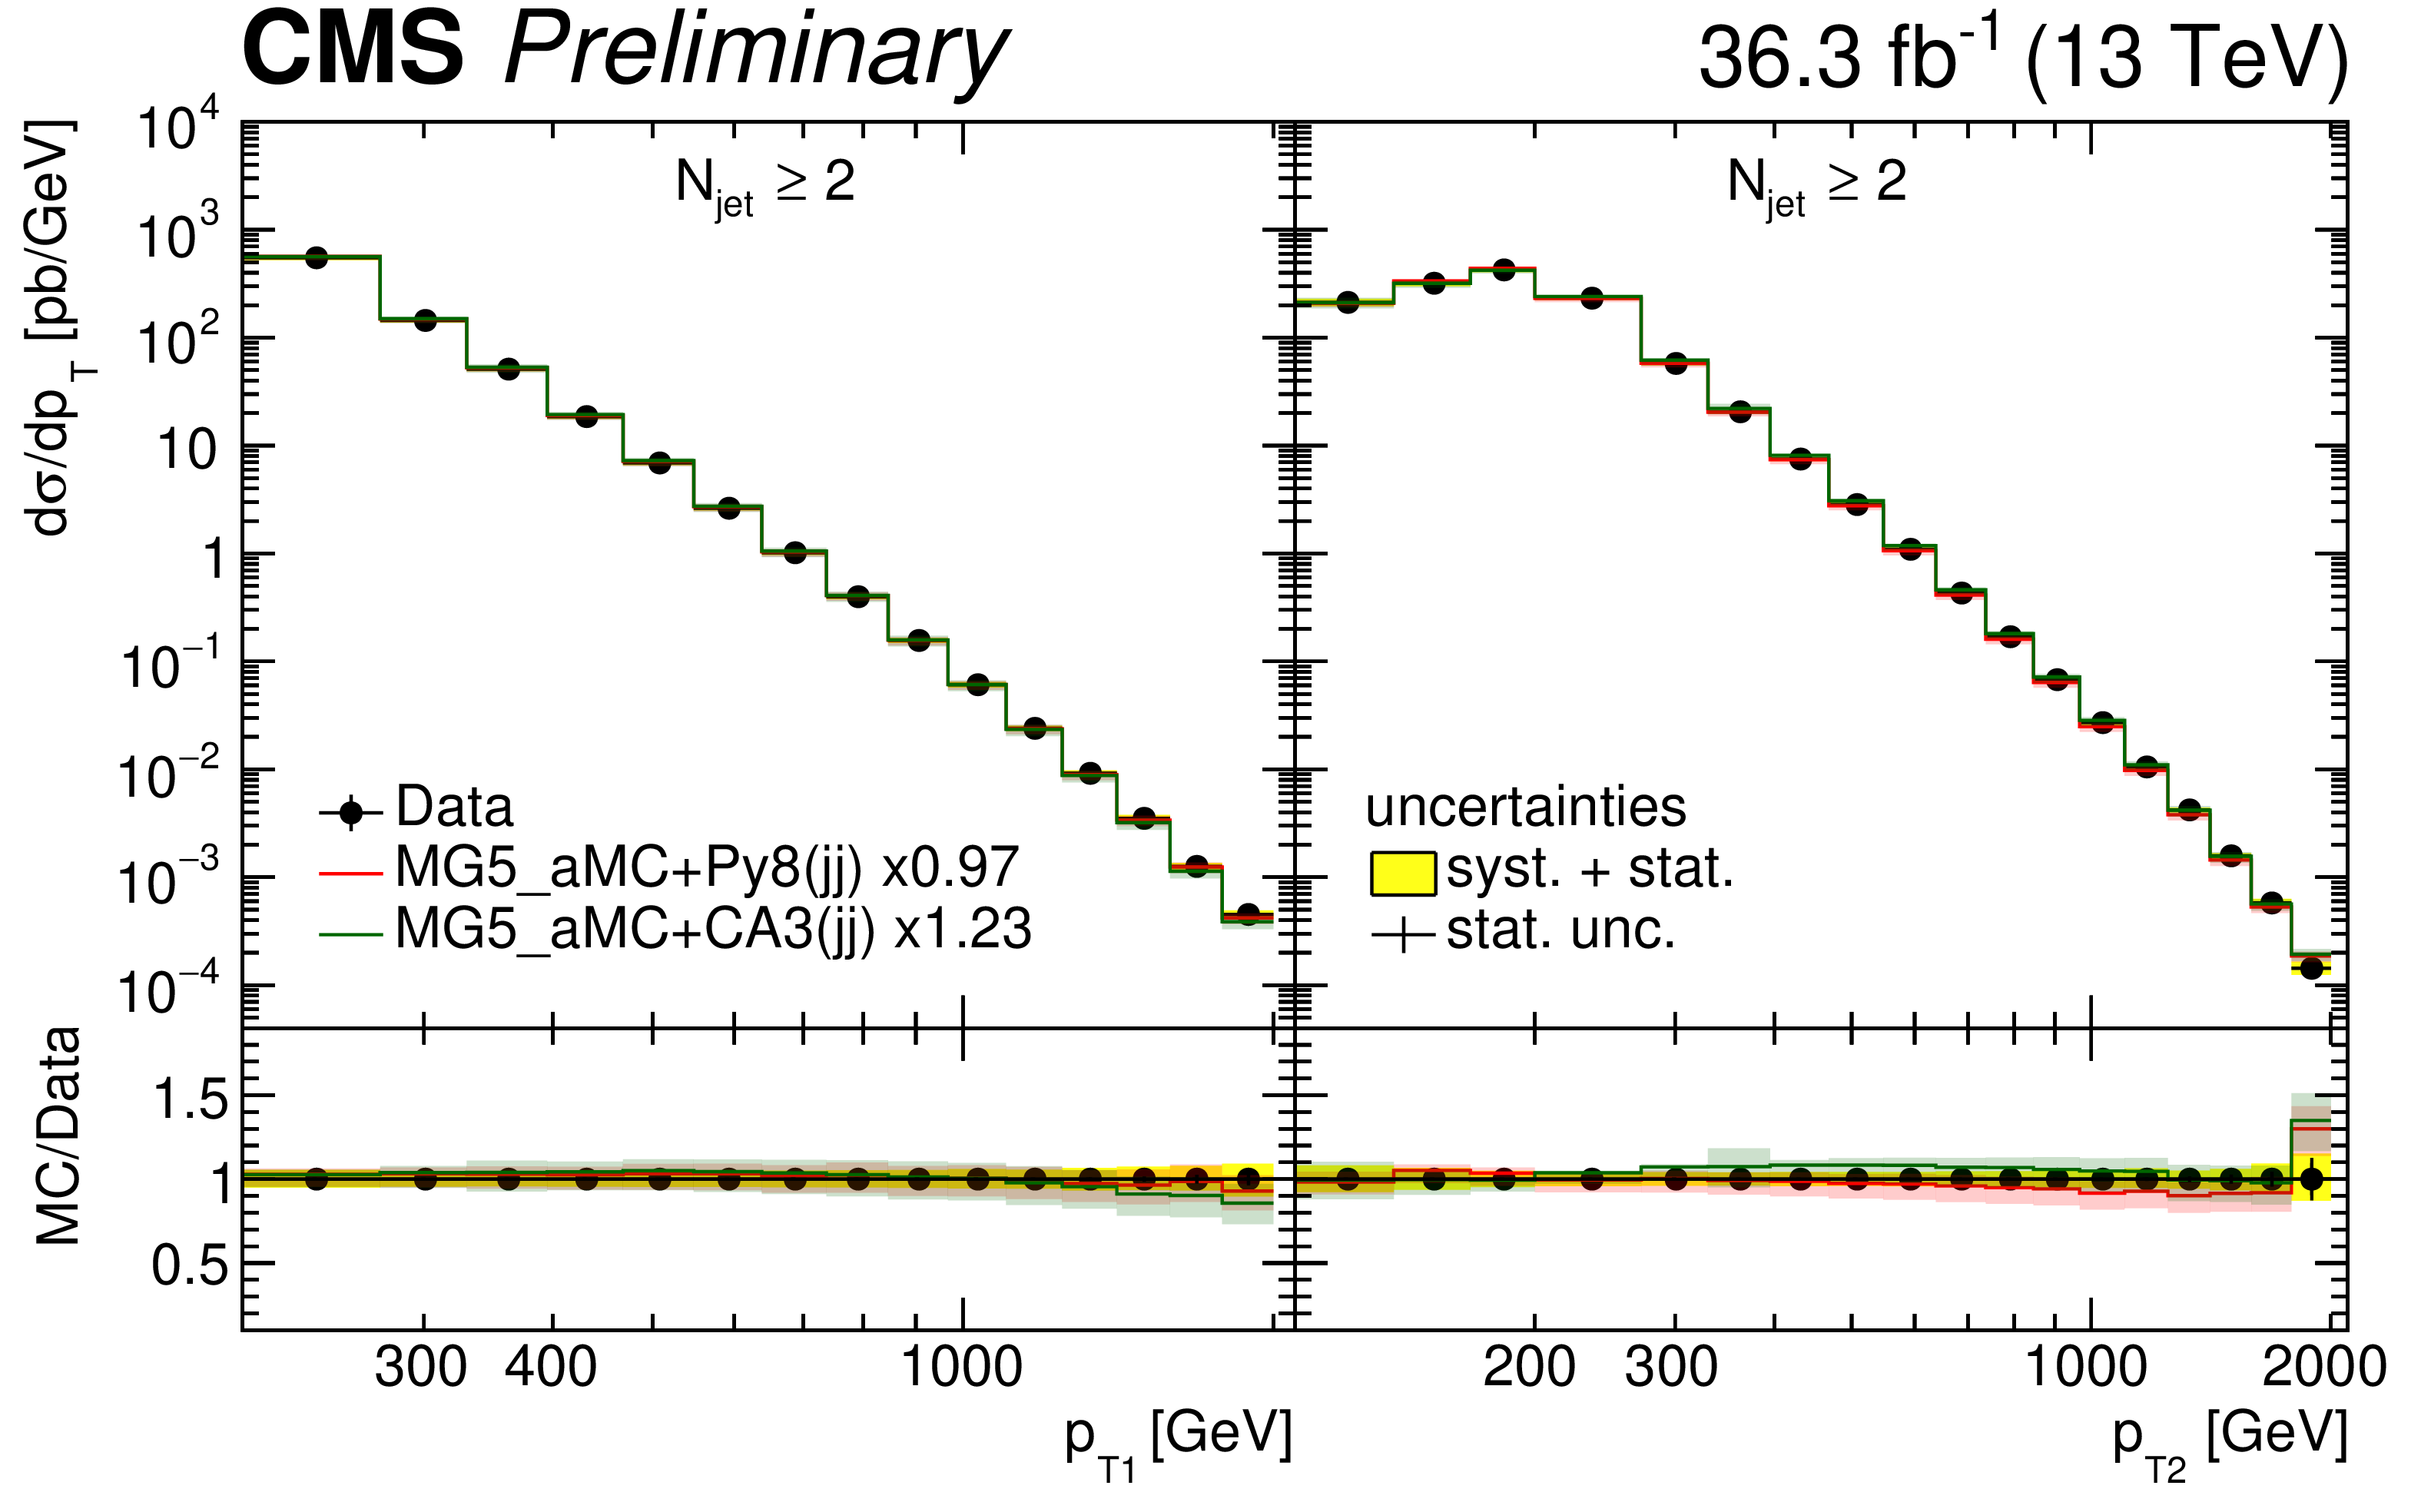
Figure 11:
Transverse momenta of the four leading jets compared to NLO predictions normalized to the inclusive dijet data cross section by using the scaling factors shown in the legend. |
png pdf |
Figure 11-a:
Transverse momenta of the four leading jets compared to NLO predictions normalized to the inclusive dijet data cross section by using the scaling factors shown in the legend. |

png pdf |
Figure 11-b:
Transverse momenta of the four leading jets compared to NLO predictions normalized to the inclusive dijet data cross section by using the scaling factors shown in the legend. |
| Tables | |
png pdf |
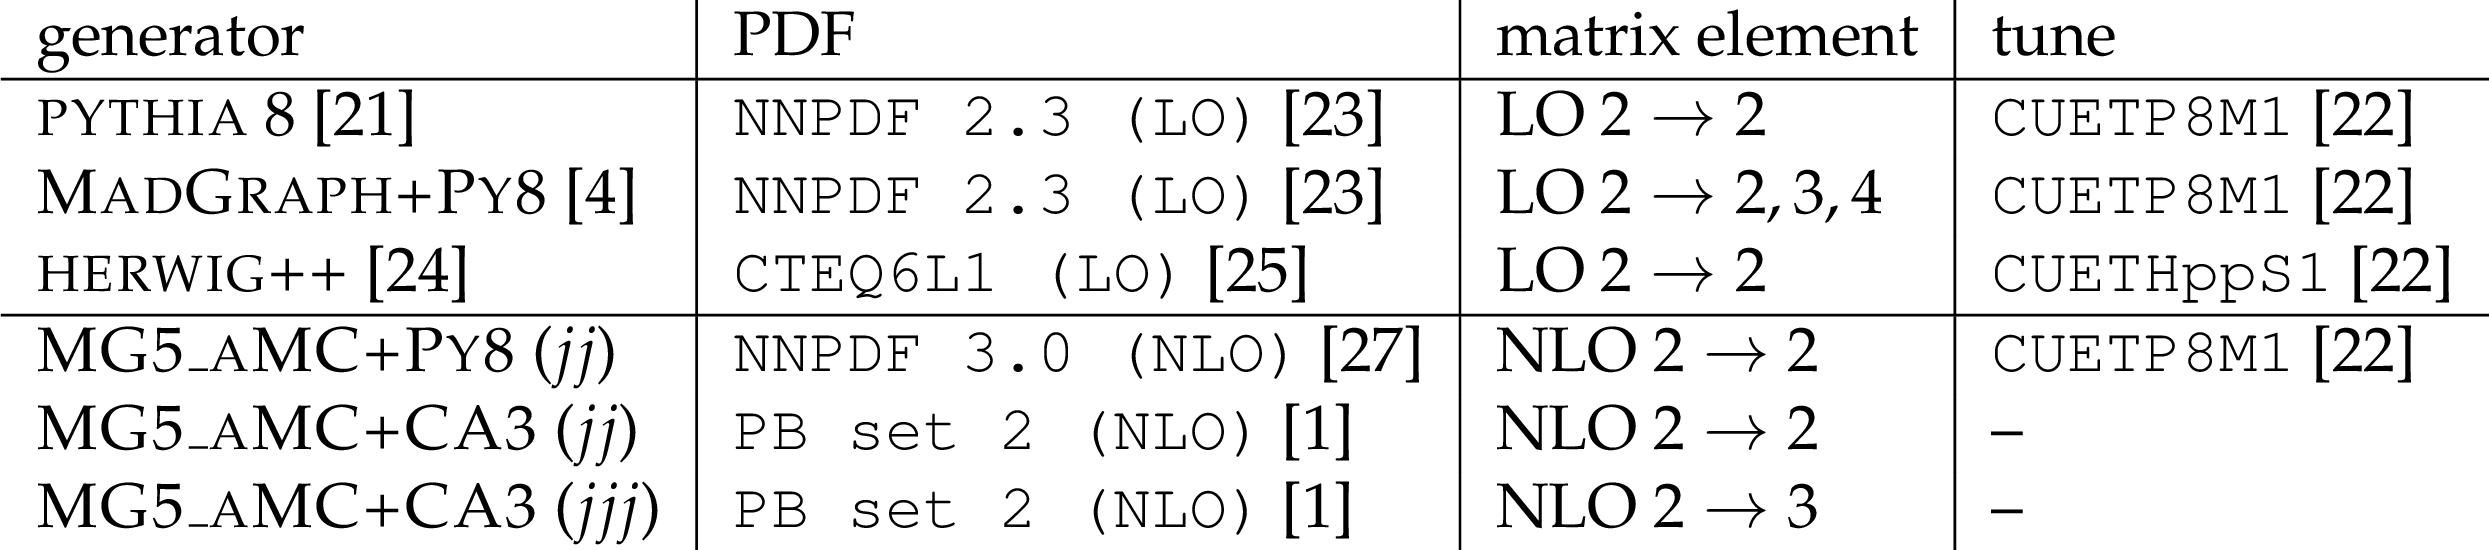
Table 1:
Description of the simulated samples used in the analysis. |
png pdf |
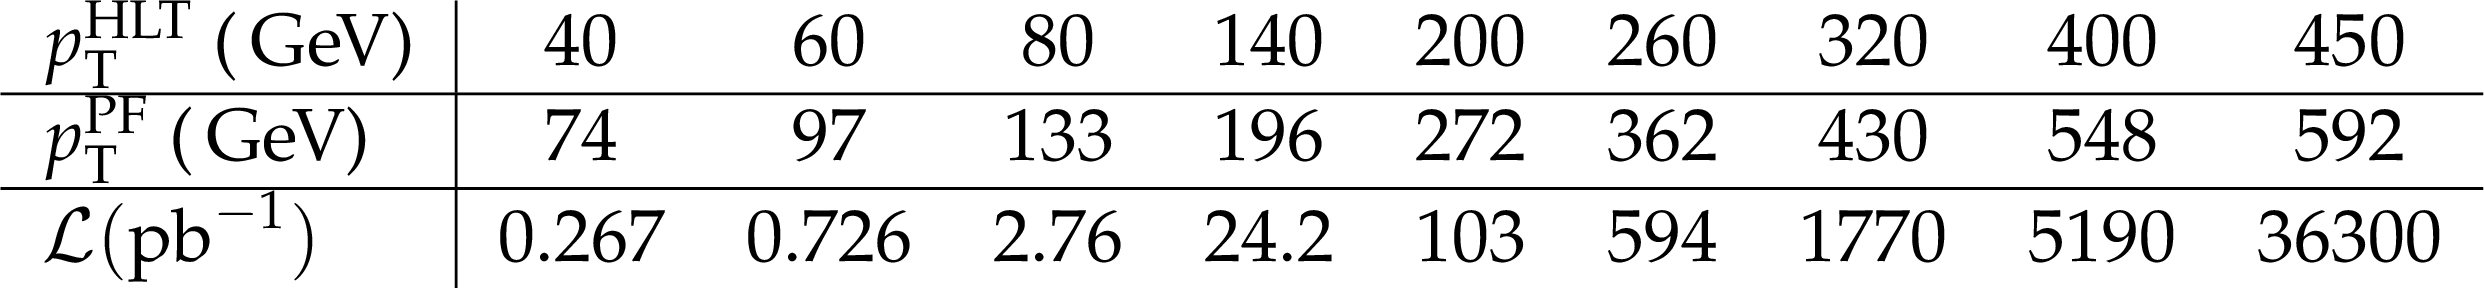
Table 2:
The integrated luminosity for each trigger sample considered in this analysis with the ${p_{\mathrm {T}}}$ thresholds for HLT(PF) reconstruction. |
| Summary |
|
A study of multi-jet events has been performed in pp collisions at a center-of-mass energy of 13 TeV with data collected with the CMS detector corresponding to an integrated luminosity of 36.3 fb$^{-1}$ . The measurements are performed by selecting a dijet system containing a jet with ${p_{\mathrm{T}}} > $ 200 GeV and a subleading jet with ${p_{\mathrm{T}}} > $ 100 GeV within $|y| < $ 2.5. For the first time, the jet multiplicity in bins of the leading jet ${p_{\mathrm{T}}}$ and the azimuthal angle between the two leading jets ${\Delta\phi_{1,2}} $ is measured. The differential cross section of the four leading ${p_{\mathrm{T}}}$ jets is measured up to the TeV scale. The jet multiplicity distributions show that even in the back-to-back region of the the dijet system, up to seven jets are measurable. The measurement of the differential cross section as a function of the jet ${p_{\mathrm{T}}}$ for the first four leading ${p_{\mathrm{T}}}$ jets is an important benchmark for Standard Model multijet cross section calculations, and especially for the simulations including parton showers for higher jet multiplicity. The measured multiplicity distribution of jets in addition to the dijet system with ${p_{\mathrm{T}}} > $ 50 GeV and $|y| < $ 2.5 is reasonably described by the LO multijet MadGraphLO simulation, nonetheless in the back-to-back region HERWIG++ provides a better shape description. The measured differential cross section as a function of the transverse momentum of the four leading ${p_{\mathrm{T}}}$ jets is not well described by any of the predictions, especially cross sections for the third and fourth jets are not described in normalization and shape. The predictions using dijet NLO matrix elements, MG5_aMC+Py8 (jj) and MG5_aMC+CA3 (jj) describe the lower multiplicity regions rather well, as well as the transverse momenta of the leading jets. The cross section of the third and fourth jet is described in shape only by MG5_aMC+CA3 (jj). The three jet NLO calculation MG5_aMC+CA3 (jjj) describes very well the cross section of the third and fourth jet. While the description of the lower jet multiplicity cross section obtained with NLO dijet calculations supplemented with conventional parton shower or with PB -TMDs and TMD parton shower is rather good, the higher jet multiplicities are not described with either parton shower approach. The measurements presented here allow for very stringent tests of theory predictions in the perturbative high ${p_{\mathrm{T}}}$ and high jet multiplicity regions. |
| References | ||||
| 1 | A. Bermudez Martinez et al. | Collinear and TMD parton densities from fits to precision DIS measurements in the parton branching method | PRD 99 (2019) 074008 | 1804.11152 |
| 2 | F. Hautmann et al. | Soft-gluon resolution scale in QCD evolution equations | PLB 772 (2017) 446 | 1704.01757 |
| 3 | F. Hautmann et al. | Collinear and TMD quark and gluon densities from parton branching solution of QCD evolution equations | JHEP 01 (2018) 070 | 1708.03279 |
| 4 | J. Alwall et al. | The automated computation of tree-level and next-to-leading order differential cross sections, and their matching to parton shower simulations | JHEP 07 (2014) 079 | 1405.0301 |
| 5 | S. Baranov et al. | CASCADE3 A Monte Carlo event generator based on TMDs | EPJC 81 (2021) 425 | 2101.10221 |
| 6 | D0 Collaboration | Measurement of dijet azimuthal decorrelations at central rapidities in $ \mathrm{p}\overline{\mathrm{p}} $ collisions at $ \sqrt{s}= $ 1.96 TeV | PRL 94 (2005) 221801 | hep-ex/0409040 |
| 7 | D0 Collaboration | Measurement of the combined rapidity and $ {p_{\mathrm{T}}} $ dependence of dijet azimuthal decorrelations in $ \mathrm{p}\overline{\mathrm{p}} $ collisions at $ \sqrt{s}= $ 1.96 TeV | PLB 721 (2013) 212 | 1212.1842 |
| 8 | ATLAS Collaboration | Measurement of dijet azimuthal decorrelations in $ \mathrm{p}\mathrm{p} $ collisions at $ \sqrt{s}=$ 7 TeV | PRL 106 (2011) 172002 | 1102.2696 |
| 9 | CMS Collaboration | Dijet azimuthal decorrelations in $ \mathrm{p}\mathrm{p} $ collisions at $ \sqrt{s}=$ 7 TeV | PRL 106 (2011) 122003 | CMS-QCD-10-026 1101.5029 |
| 10 | CMS Collaboration | Measurement of dijet azimuthal decorrelation in pp collisions at $ \sqrt{s}=$ 8 TeV | EPJC 76 (2016) 536 | CMS-SMP-14-015 1602.04384 |
| 11 | CMS Collaboration | Azimuthal correlations for inclusive 2-jet, 3-jet, and 4-jet events in pp collisions at $ \sqrt{s}= $ 13 TeV | EPJC 78 (2018) 566 | CMS-SMP-16-014 1712.05471 |
| 12 | CMS Collaboration | Azimuthal separation in nearly back-to-back jet topologies in inclusive 2- and 3-jet events in pp collisions at $ \sqrt{s}= $ 13 TeV | EPJC 79 (2019) 773 | CMS-SMP-17-009 1902.04374 |
| 13 | CMS Collaboration | Performance of the CMS Level-1 trigger in proton-proton collisions at $ \sqrt{s} = $ 13 TeV | JINST 15 (2020) P10017 | CMS-TRG-17-001 2006.10165 |
| 14 | CMS Collaboration | The CMS trigger system | JINST 12 (2017) P01020 | CMS-TRG-12-001 1609.02366 |
| 15 | CMS Collaboration | Particle-flow reconstruction and global event description with the cms detector | JINST 12 (2017) P10003 | CMS-PRF-14-001 1706.04965 |
| 16 | M. Cacciari, G. P. Salam, and G. Soyez | The anti-$ k_t $ jet clustering algorithm | JHEP 04 (2008) 063 | 0802.1189 |
| 17 | M. Cacciari, G. P. Salam, and G. Soyez | FastJet user manual | EPJC 72 (2012) 1896 | 1111.6097 |
| 18 | CMS Collaboration | Jet energy scale and resolution in the CMS experiment in pp collisions at 8 TeV | JINST 12 (2017) P02014 | CMS-JME-13-004 1607.03663 |
| 19 | CMS Collaboration | Performance of missing transverse momentum reconstruction in proton-proton collisions at $ \sqrt{s} = $ 13 TeV using the CMS detector | JINST 14 (2019) P07004 | CMS-JME-17-001 1903.06078 |
| 20 | CMS Collaboration | The CMS experiment at the CERN LHC | JINST 3 (2008) S08004 | CMS-00-001 |
| 21 | T. Sjostrand et al. | An introduction to PYTHIA 8.2 | CPC 191 (2015) 159 | 1410.3012 |
| 22 | CMS Collaboration | Event generator tunes obtained from underlying event and multiparton scattering measurements | EPJC 76 (2016) 155 | CMS-GEN-14-001 1512.00815 |
| 23 | NNPDF Collaboration | Unbiased global determination of parton distributions and their uncertainties at NNLO and at LO | NPB 855 (2012) 153 | 1107.2652 |
| 24 | M. Bahr et al. | Herwig++ physics and manual | EPJC 58 (2008) 639 | 0803.0883 |
| 25 | J. Pumplin et al. | New generation of parton distributions with uncertainties from global QCD analysis | JHEP 07 (2002) 012 | hep-ph/0201195 |
| 26 | J. Alwall et al. | Comparative study of various algorithms for the merging of parton showers and matrix elements in hadronic collisions | EPJC 53 (2008) 473 | 0706.2569 |
| 27 | NNPDF Collaboration | Parton distributions for the LHC Run II | JHEP 04 (2015) 040 | 1410.8849 |
| 28 | T. Sjostrand, S. Mrenna, and P. Skands | PYTHIA 6.4 physics and manual | JHEP 05 (2006) 026 | hep-ph/0603175 |
| 29 | GEANT4 Collaboration | GEANT4--a simulation toolkit | NIMA 506 (2003) 250 | |
| 30 | CMS Collaboration | Tracking and primary vertex results in first 7 TeV collisions | CMS-PAS-TRK-10-005 | |
| 31 | CMS Collaboration | Calorimeter jet quality criteria for the first CMS collision data | CMS-PAS-JME-09-008 | |
| 32 | S. Schmitt | TUnfold: an algorithm for correcting migration effects in high energy physics | JINST 7 (2012) T10003 | 1205.6201 |
| 33 | CMS Collaboration | Precision luminosity measurement in proton-proton collisions at $ \sqrt{s} = $ 13 TeV in 2015 and 2016 at CMS | Submitted to EPJC | CMS-LUM-17-003 2104.01927 |
|
|
Compact Muon Solenoid LHC, CERN |
|

|

|

|

|

|