

Compact Muon Solenoid
LHC, CERN
| CMS-PAS-SMP-20-003 | ||
| Measurement of mass dependence of the transverse momentum of Drell Yan lepton pairs in proton-proton collisions at $\sqrt{s} = $ 13 TeV | ||
| CMS Collaboration | ||
| April 2021 | ||
| Abstract: The double differential cross sections of the Drell-Yan lepton pair ($\ell^+\ell^-$, electron or muon) production, as a function of its invariant mass $m_{\ell\ell}$, transverse momentum $p_\mathrm{T}(\ell\ell)$, and $\varphi^*$ are measured. The $\varphi^*$ observable is highly correlated with $p_\mathrm{T}(\ell\ell)$ and is used to probe the low $p_\mathrm{T}(\ell\ell)$ region in a complementary way. Drell-Yan masses up to 1 TeV are investigated. Additionally, a measurement is performed requiring at least one jet in the final state. To benefit from partial cancellation of the systematic uncertainty, the ratios of the differential cross sections in $p_\mathrm{T}(\ell\ell)$ and $\varphi^*$ for the $m_{\ell\ell}$ bins around the Z mass peak over the one on the Z mass peak are presented. The collected data correspond to an integrated luminosity of 36.3 fb$^{-1}$ of proton-proton collisions recorded with the CMS detector at the LHC at the center-of-mass energy of 13 TeV in 2016. Measurements are compared to state-of-the-art predictions based on perturbative quantum chromodynamics including soft gluon resummation. | ||
|
Links:
CDS record (PDF) ;
inSPIRE record ;
CADI line (restricted) ;
These preliminary results are superseded in this paper, EPJC 83 (2023) 628. The superseded preliminary plots can be found here. |
||
| Figures | |
png pdf |
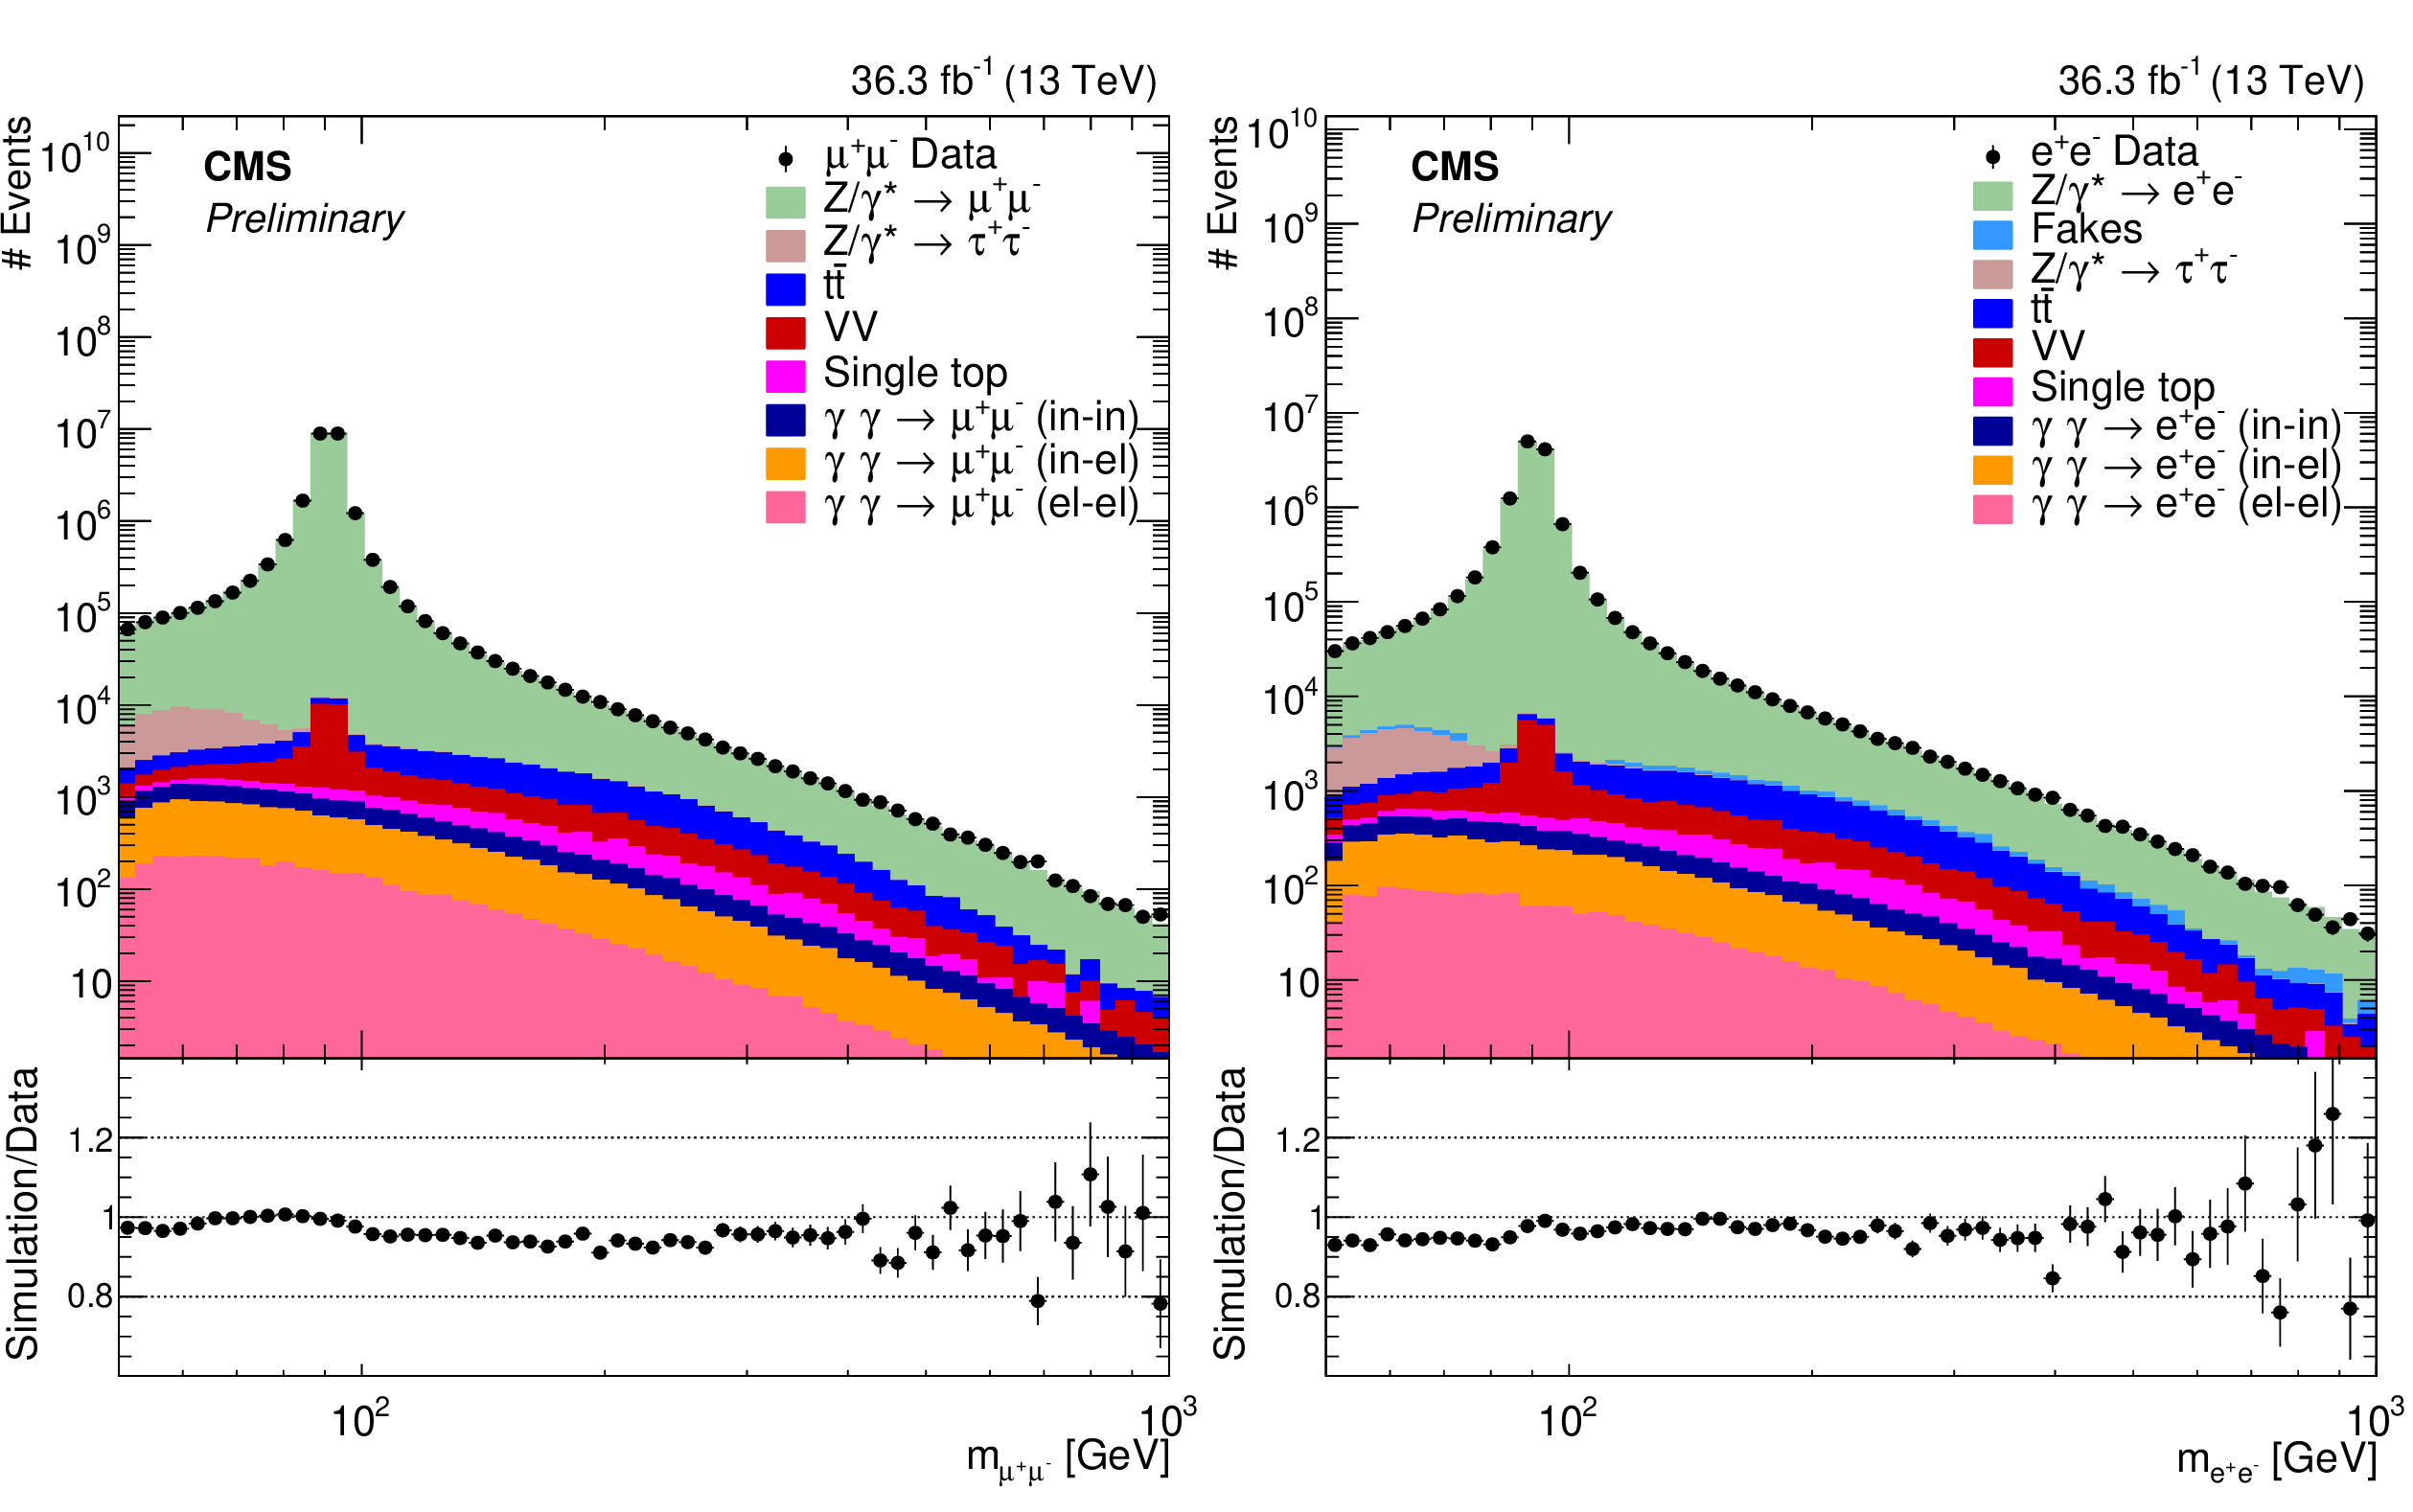
Figure 1:
Distributions of events passing the selection requirements in the muon channel (left) and electron channel (right). Each plot also presents in the lower part a ratio of simulation over data. Only statistical uncertainties on the data are shown, as error bars on the points. No bin width division is performed. The different background contributions are discussed in the text. |
png pdf |
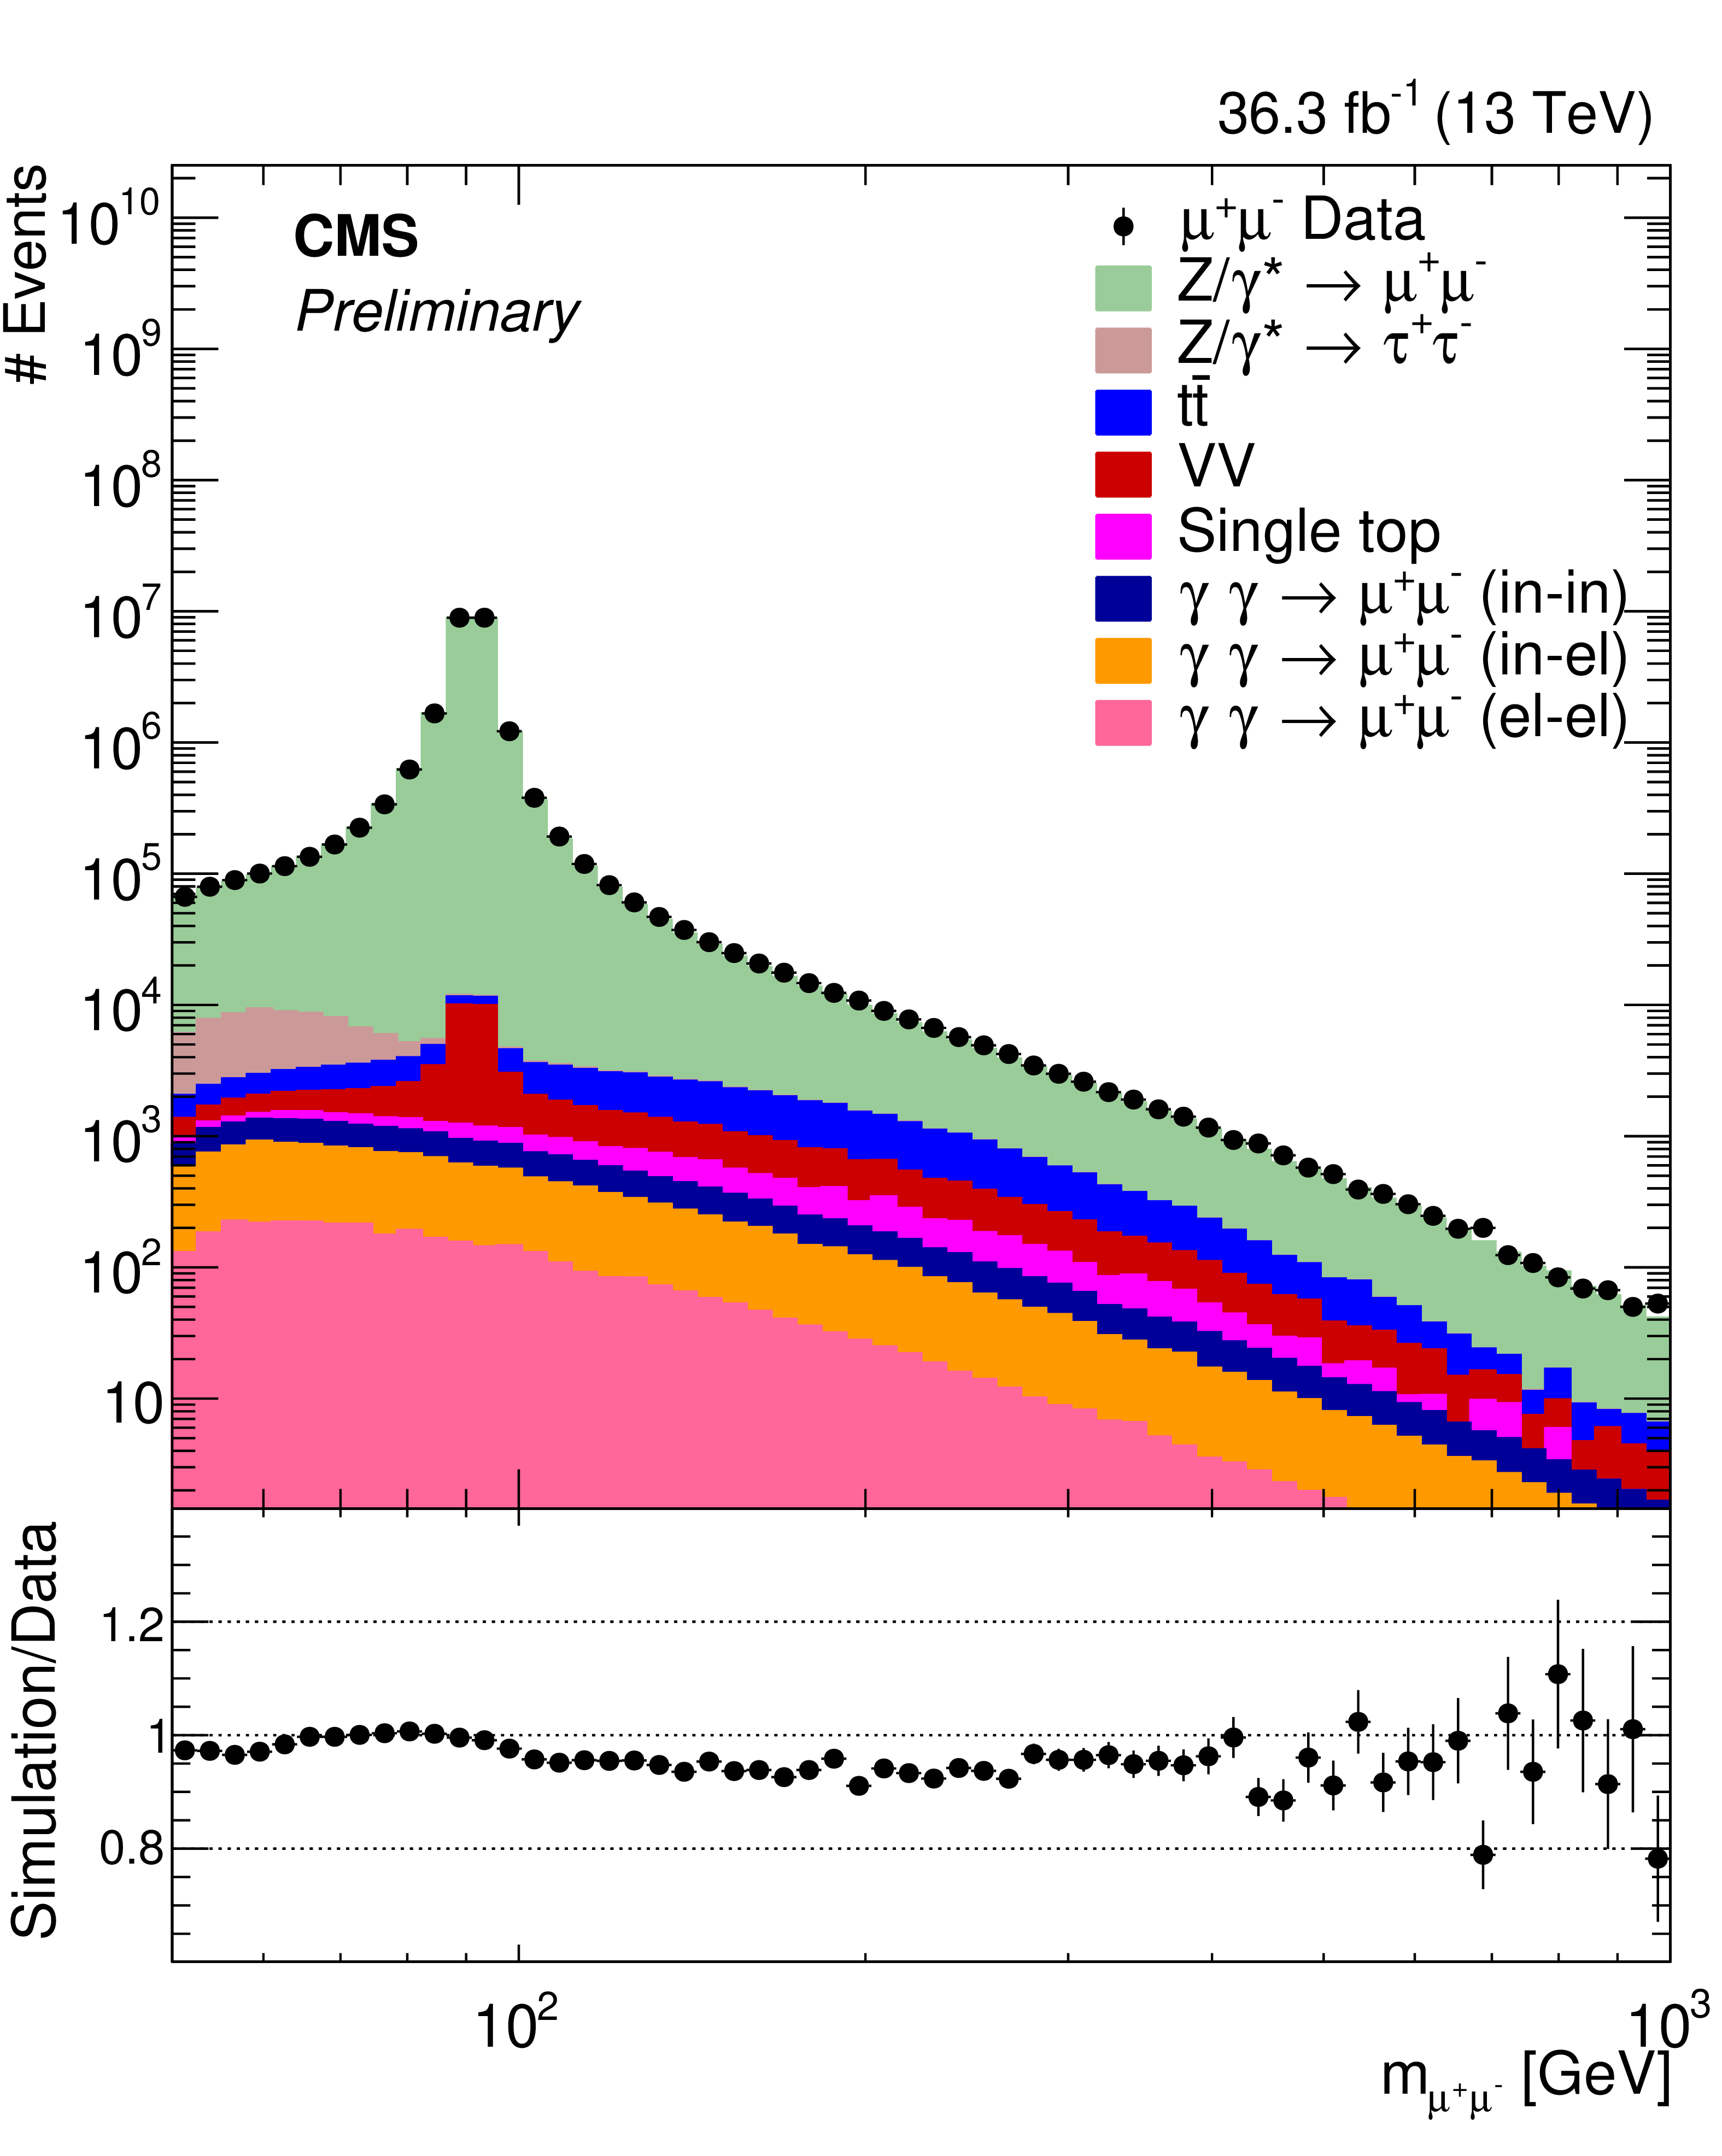
Figure 1-a:
Distributions of events passing the selection requirements in the muon channel (left) and electron channel (right). Each plot also presents in the lower part a ratio of simulation over data. Only statistical uncertainties on the data are shown, as error bars on the points. No bin width division is performed. The different background contributions are discussed in the text. |
png pdf |
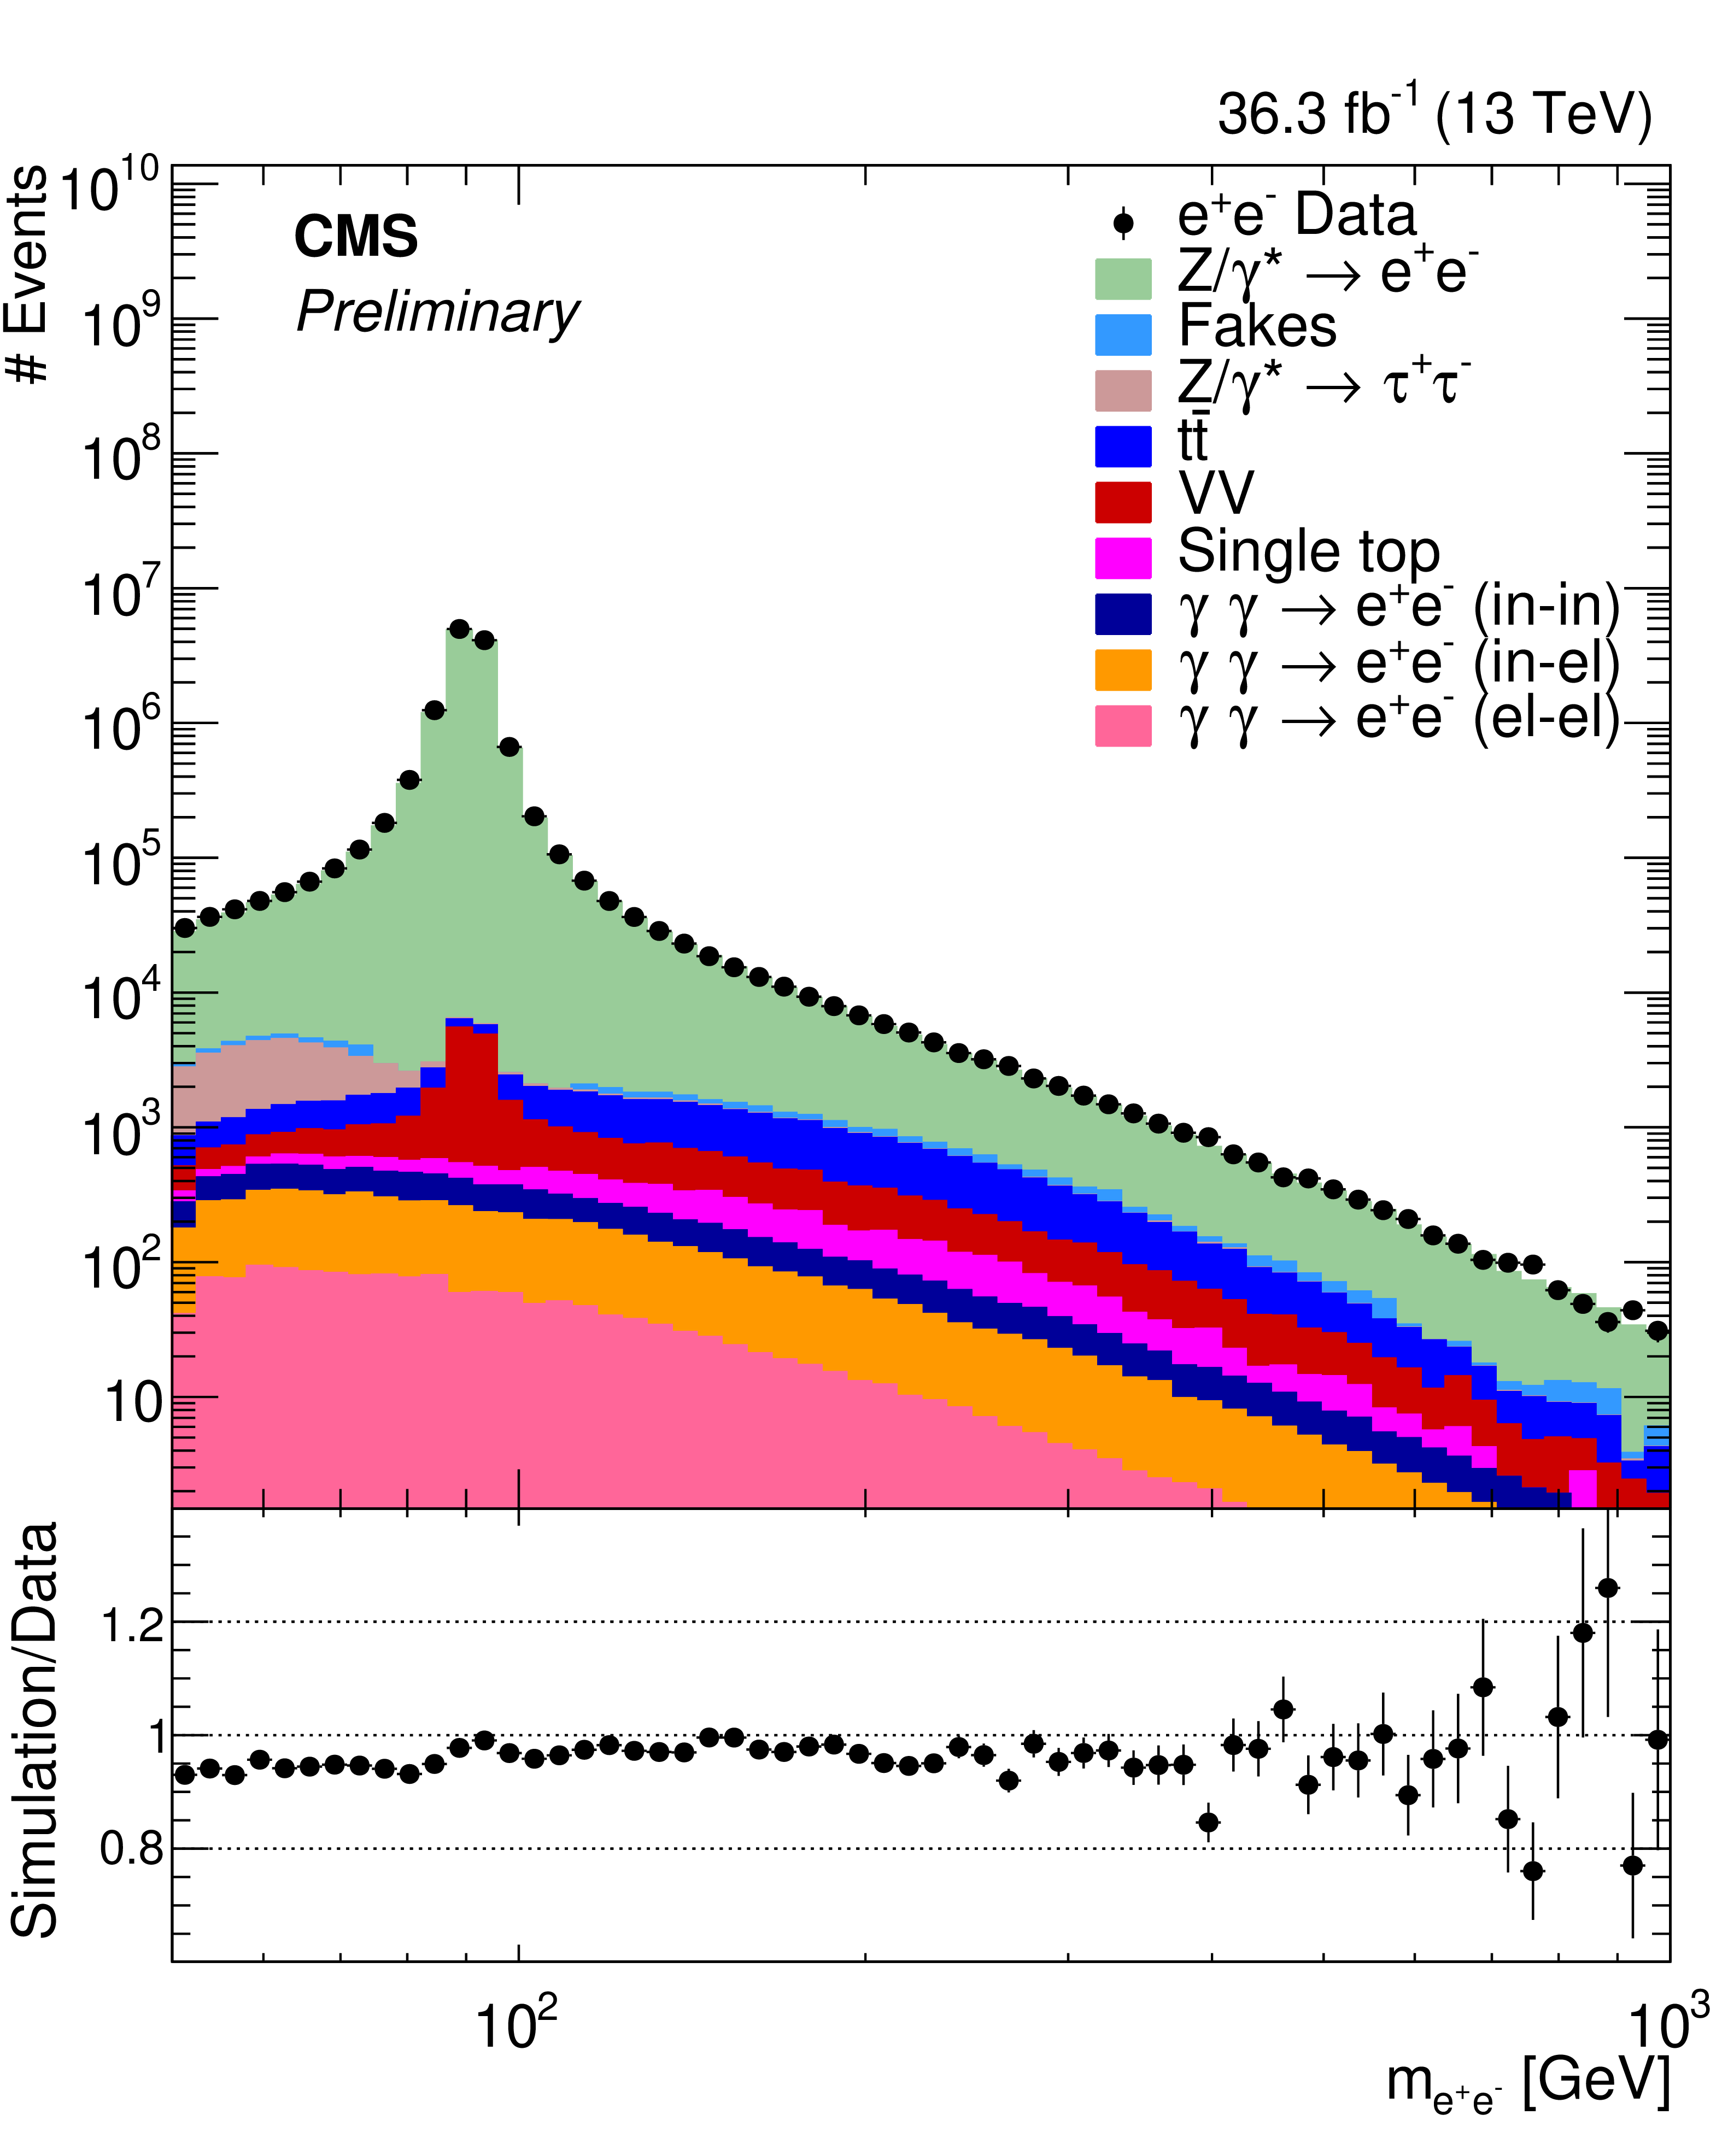
Figure 1-b:
Distributions of events passing the selection requirements in the muon channel (left) and electron channel (right). Each plot also presents in the lower part a ratio of simulation over data. Only statistical uncertainties on the data are shown, as error bars on the points. No bin width division is performed. The different background contributions are discussed in the text. |

png pdf |
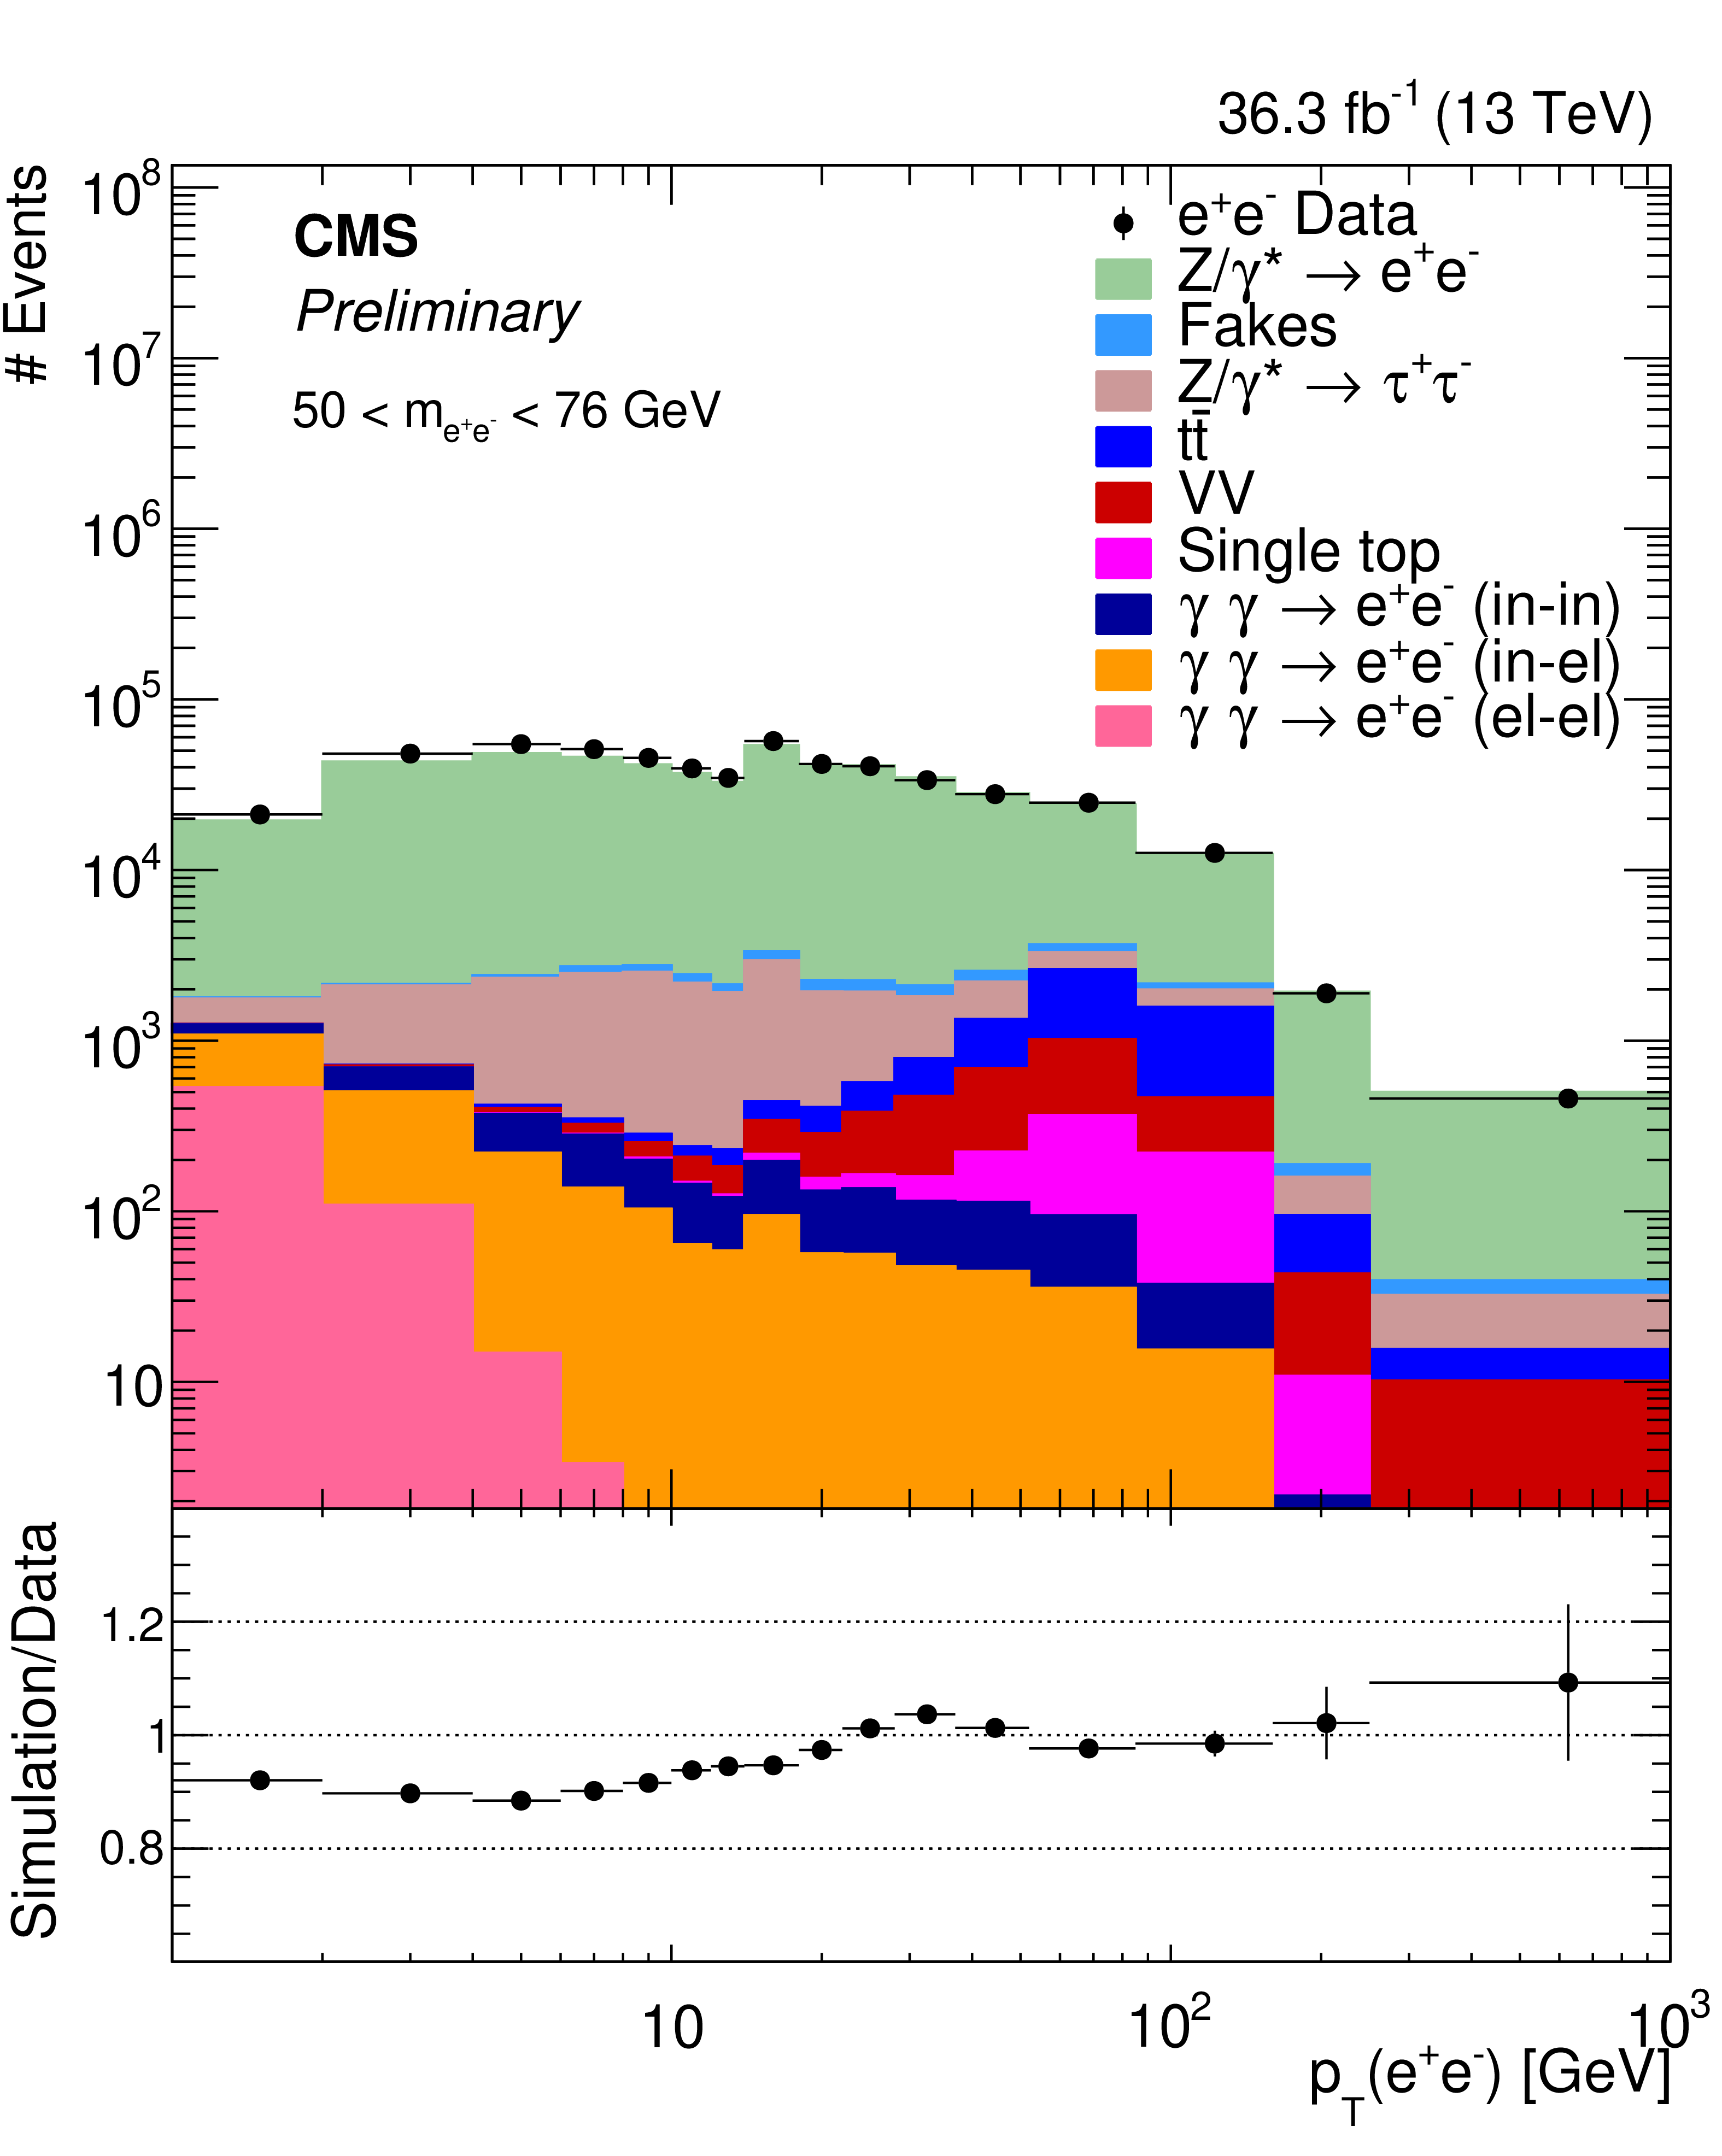
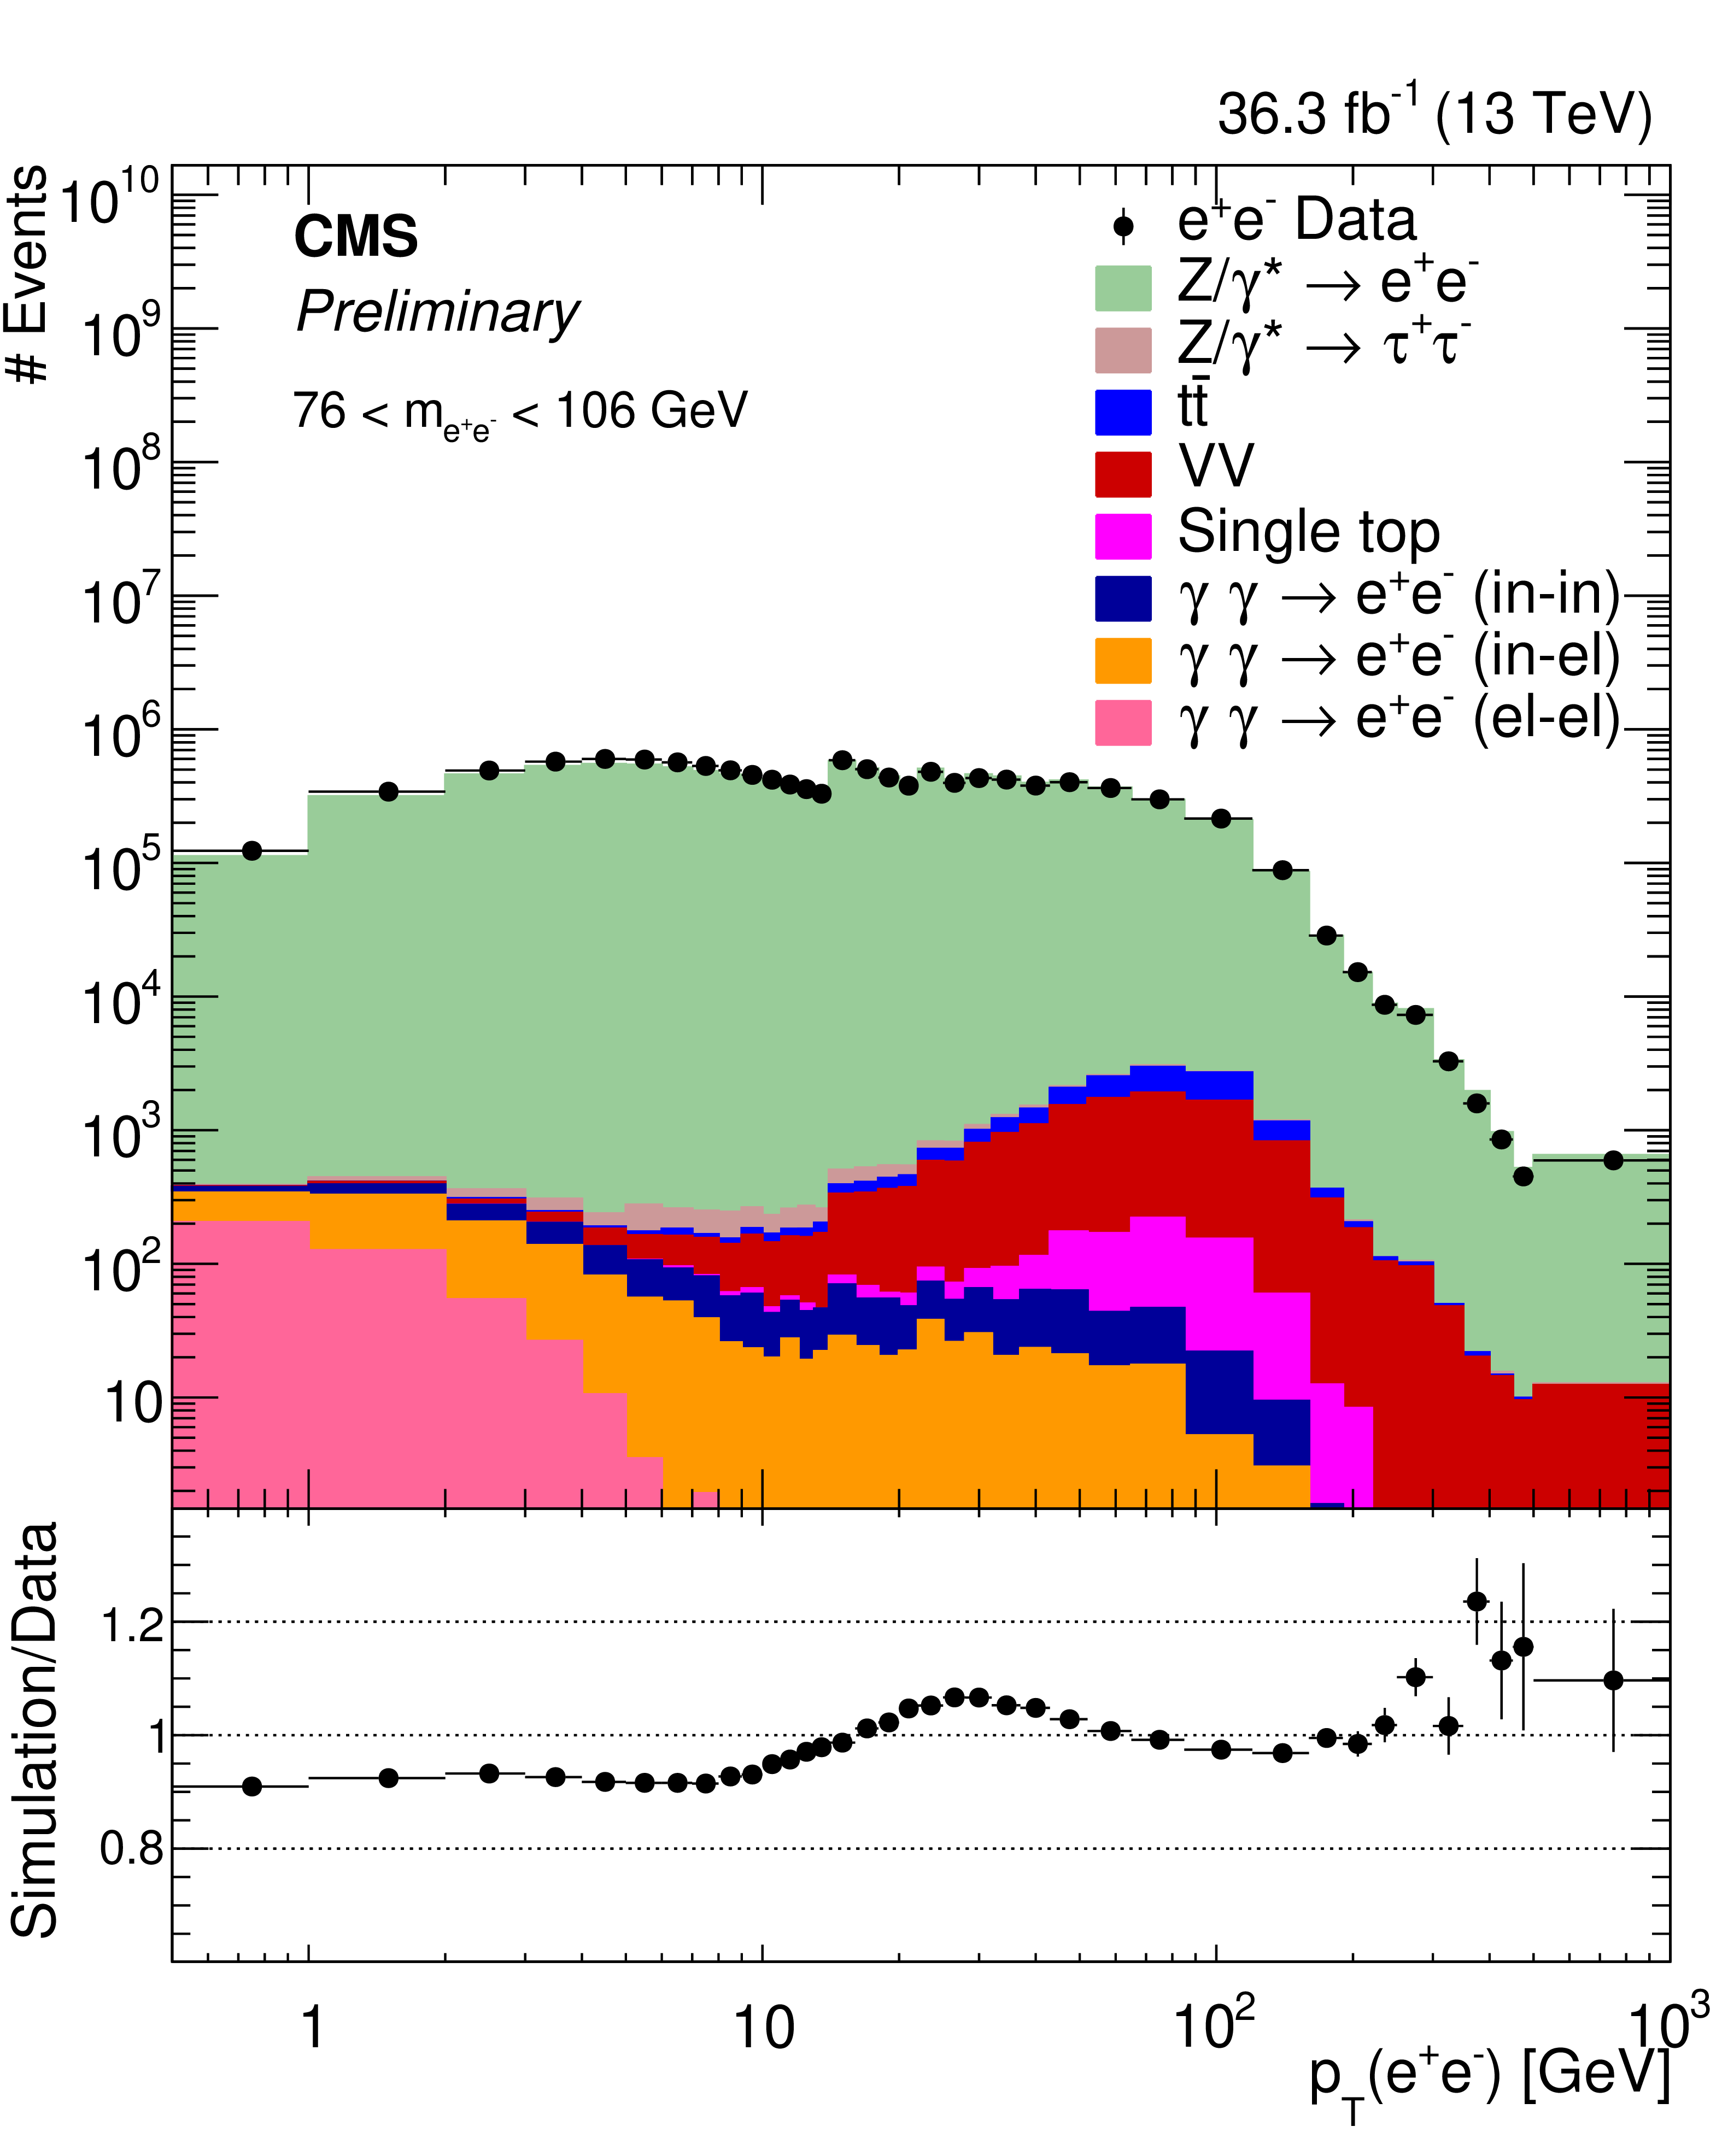
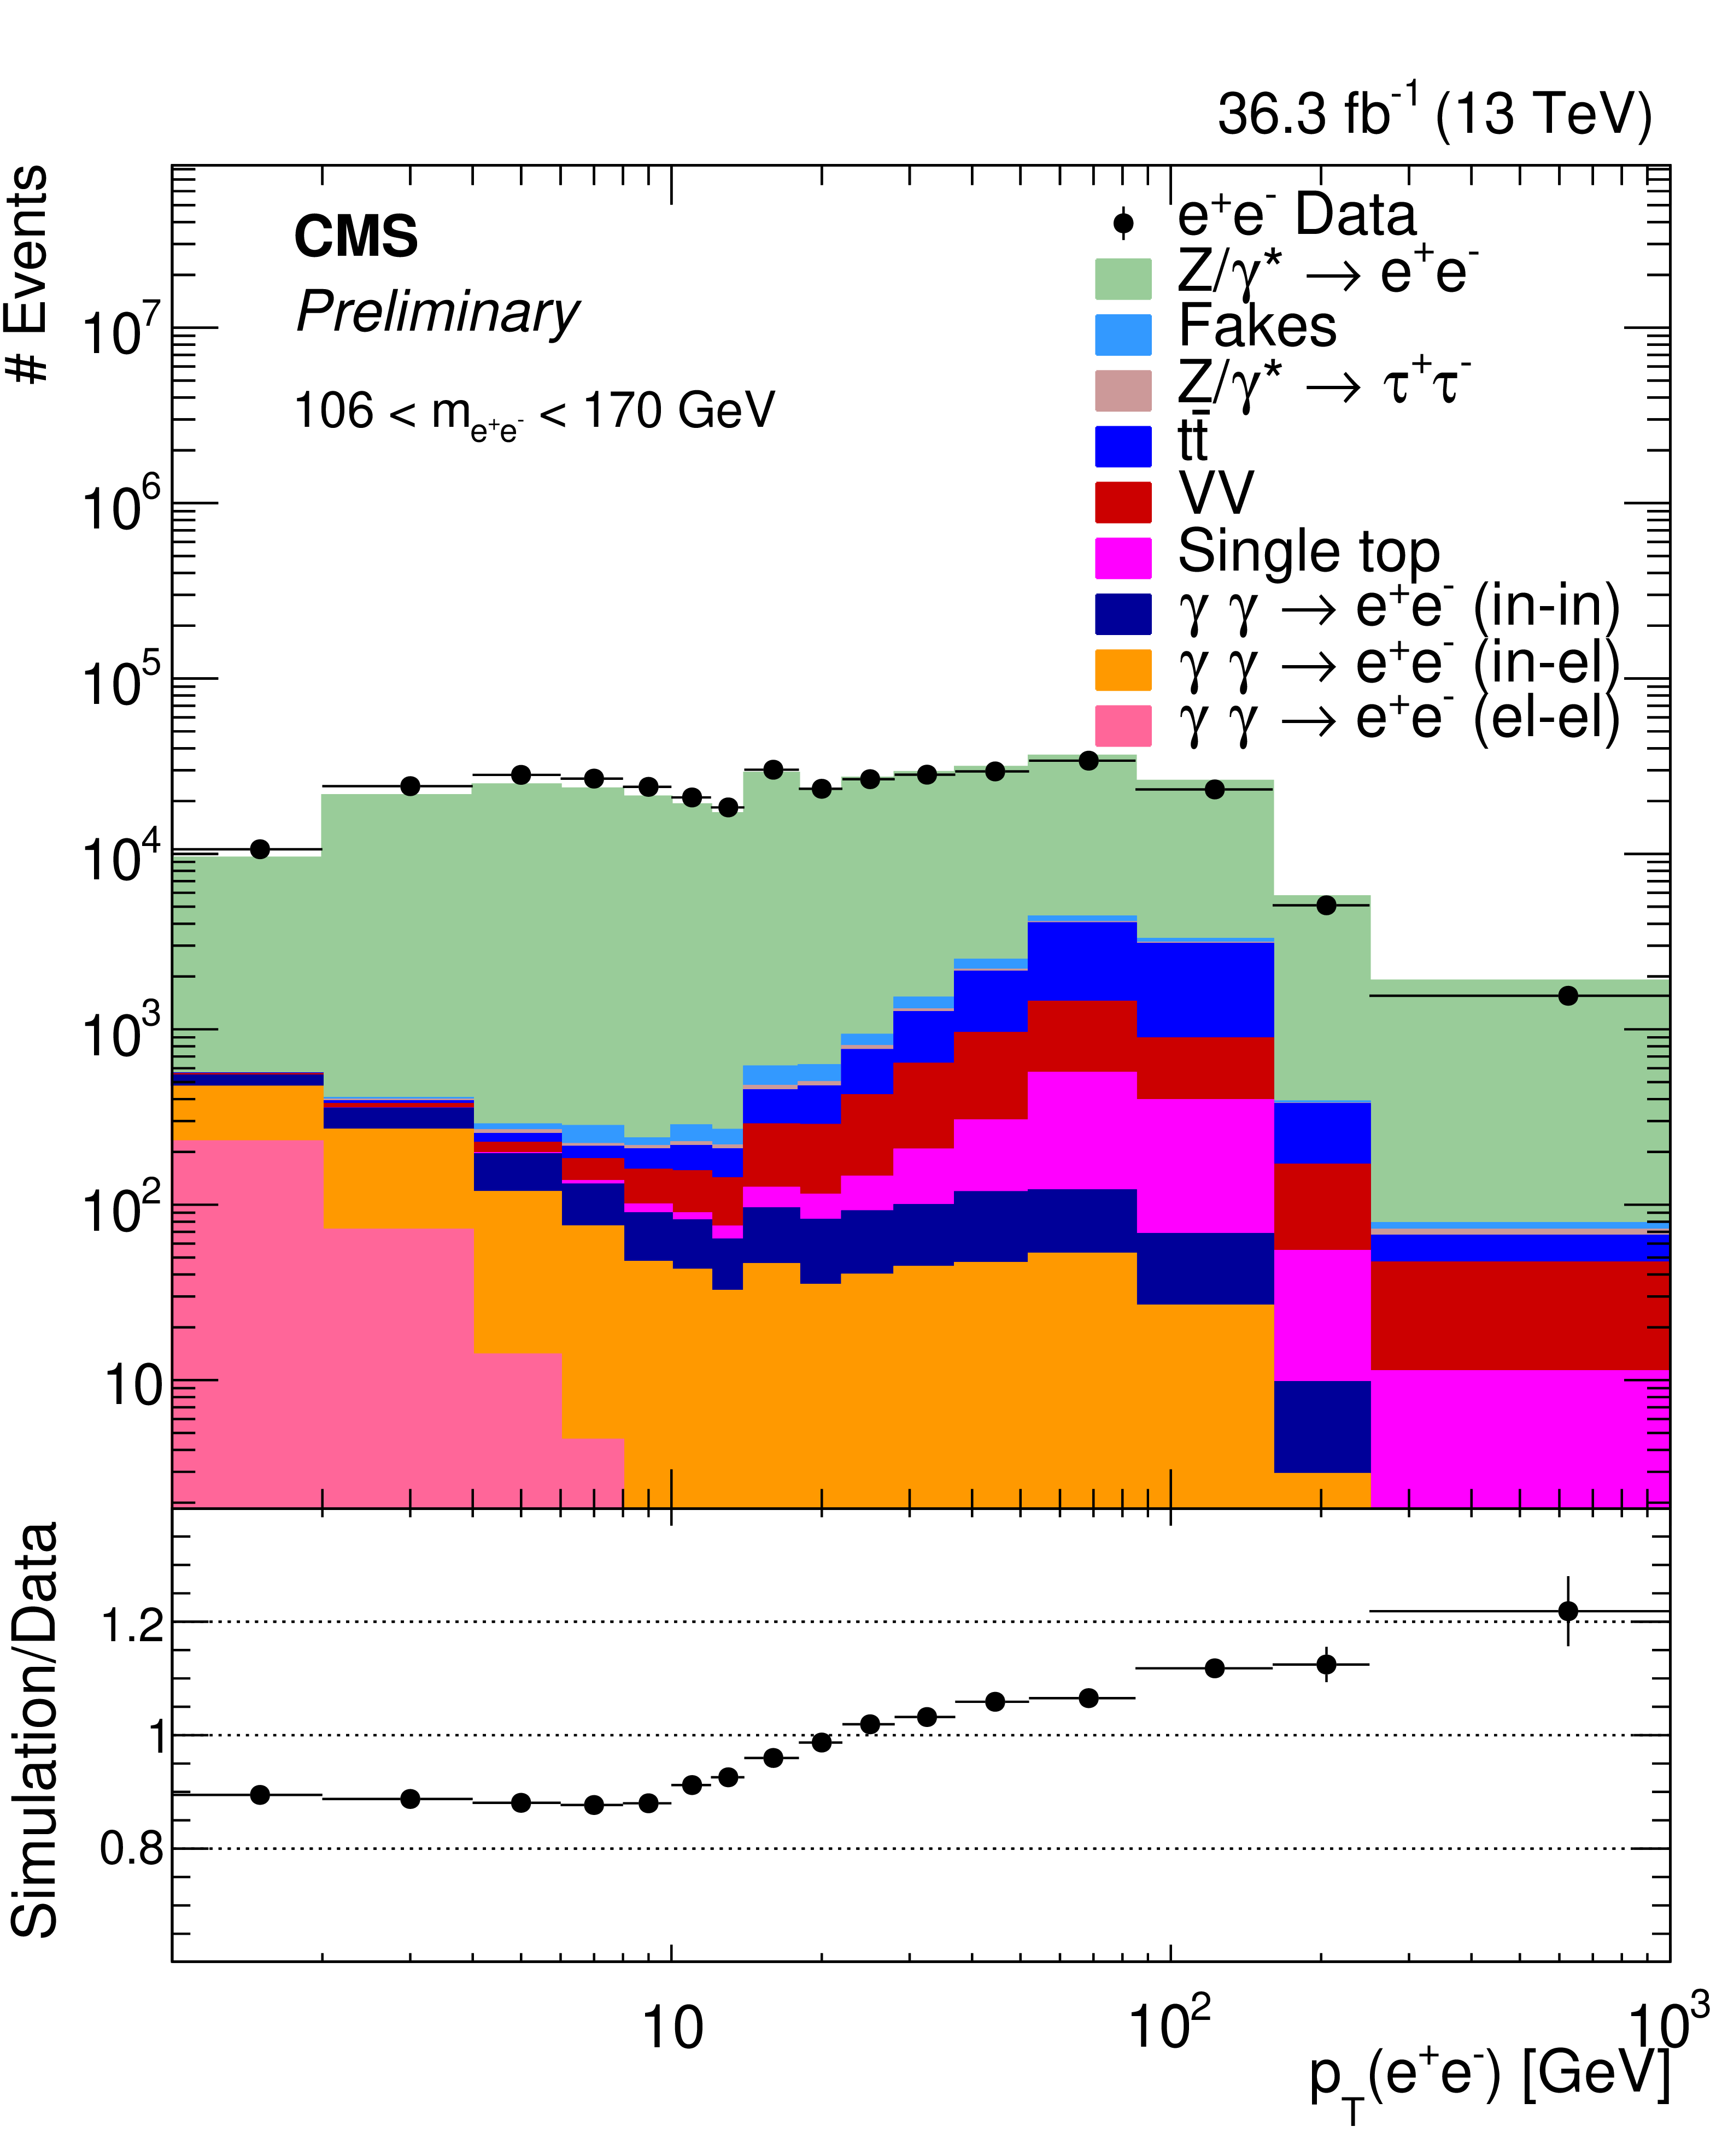
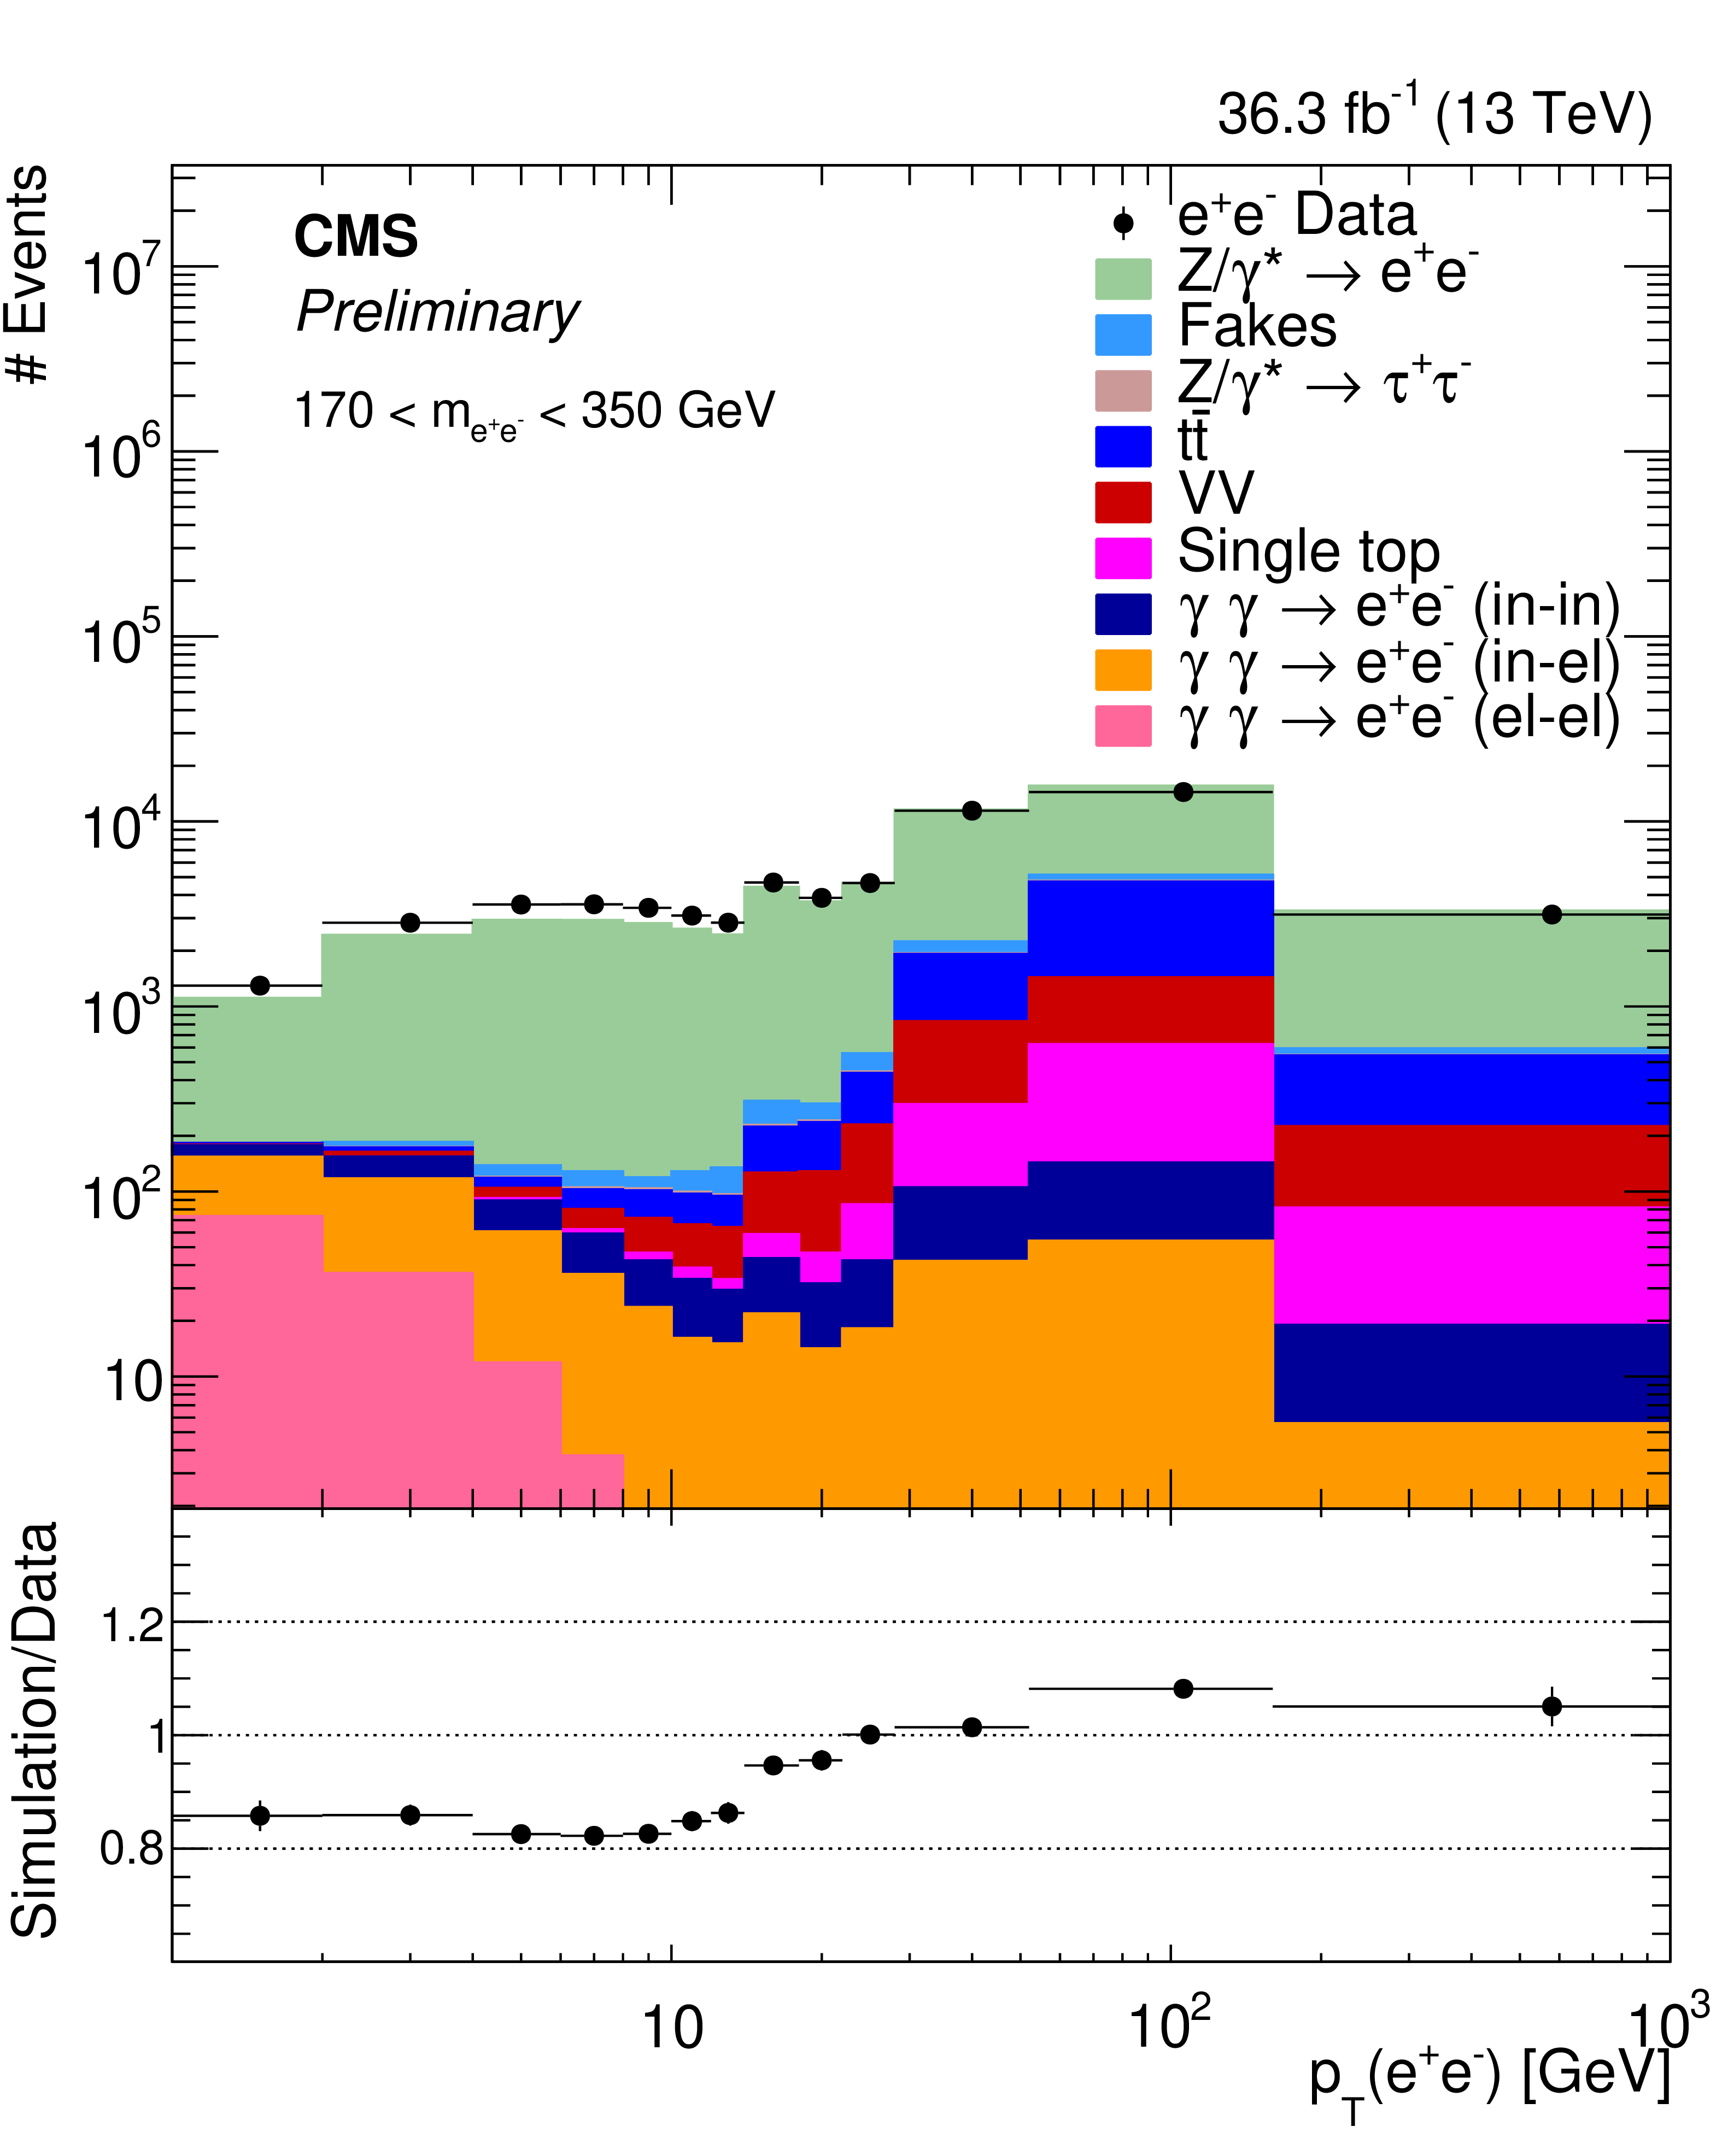
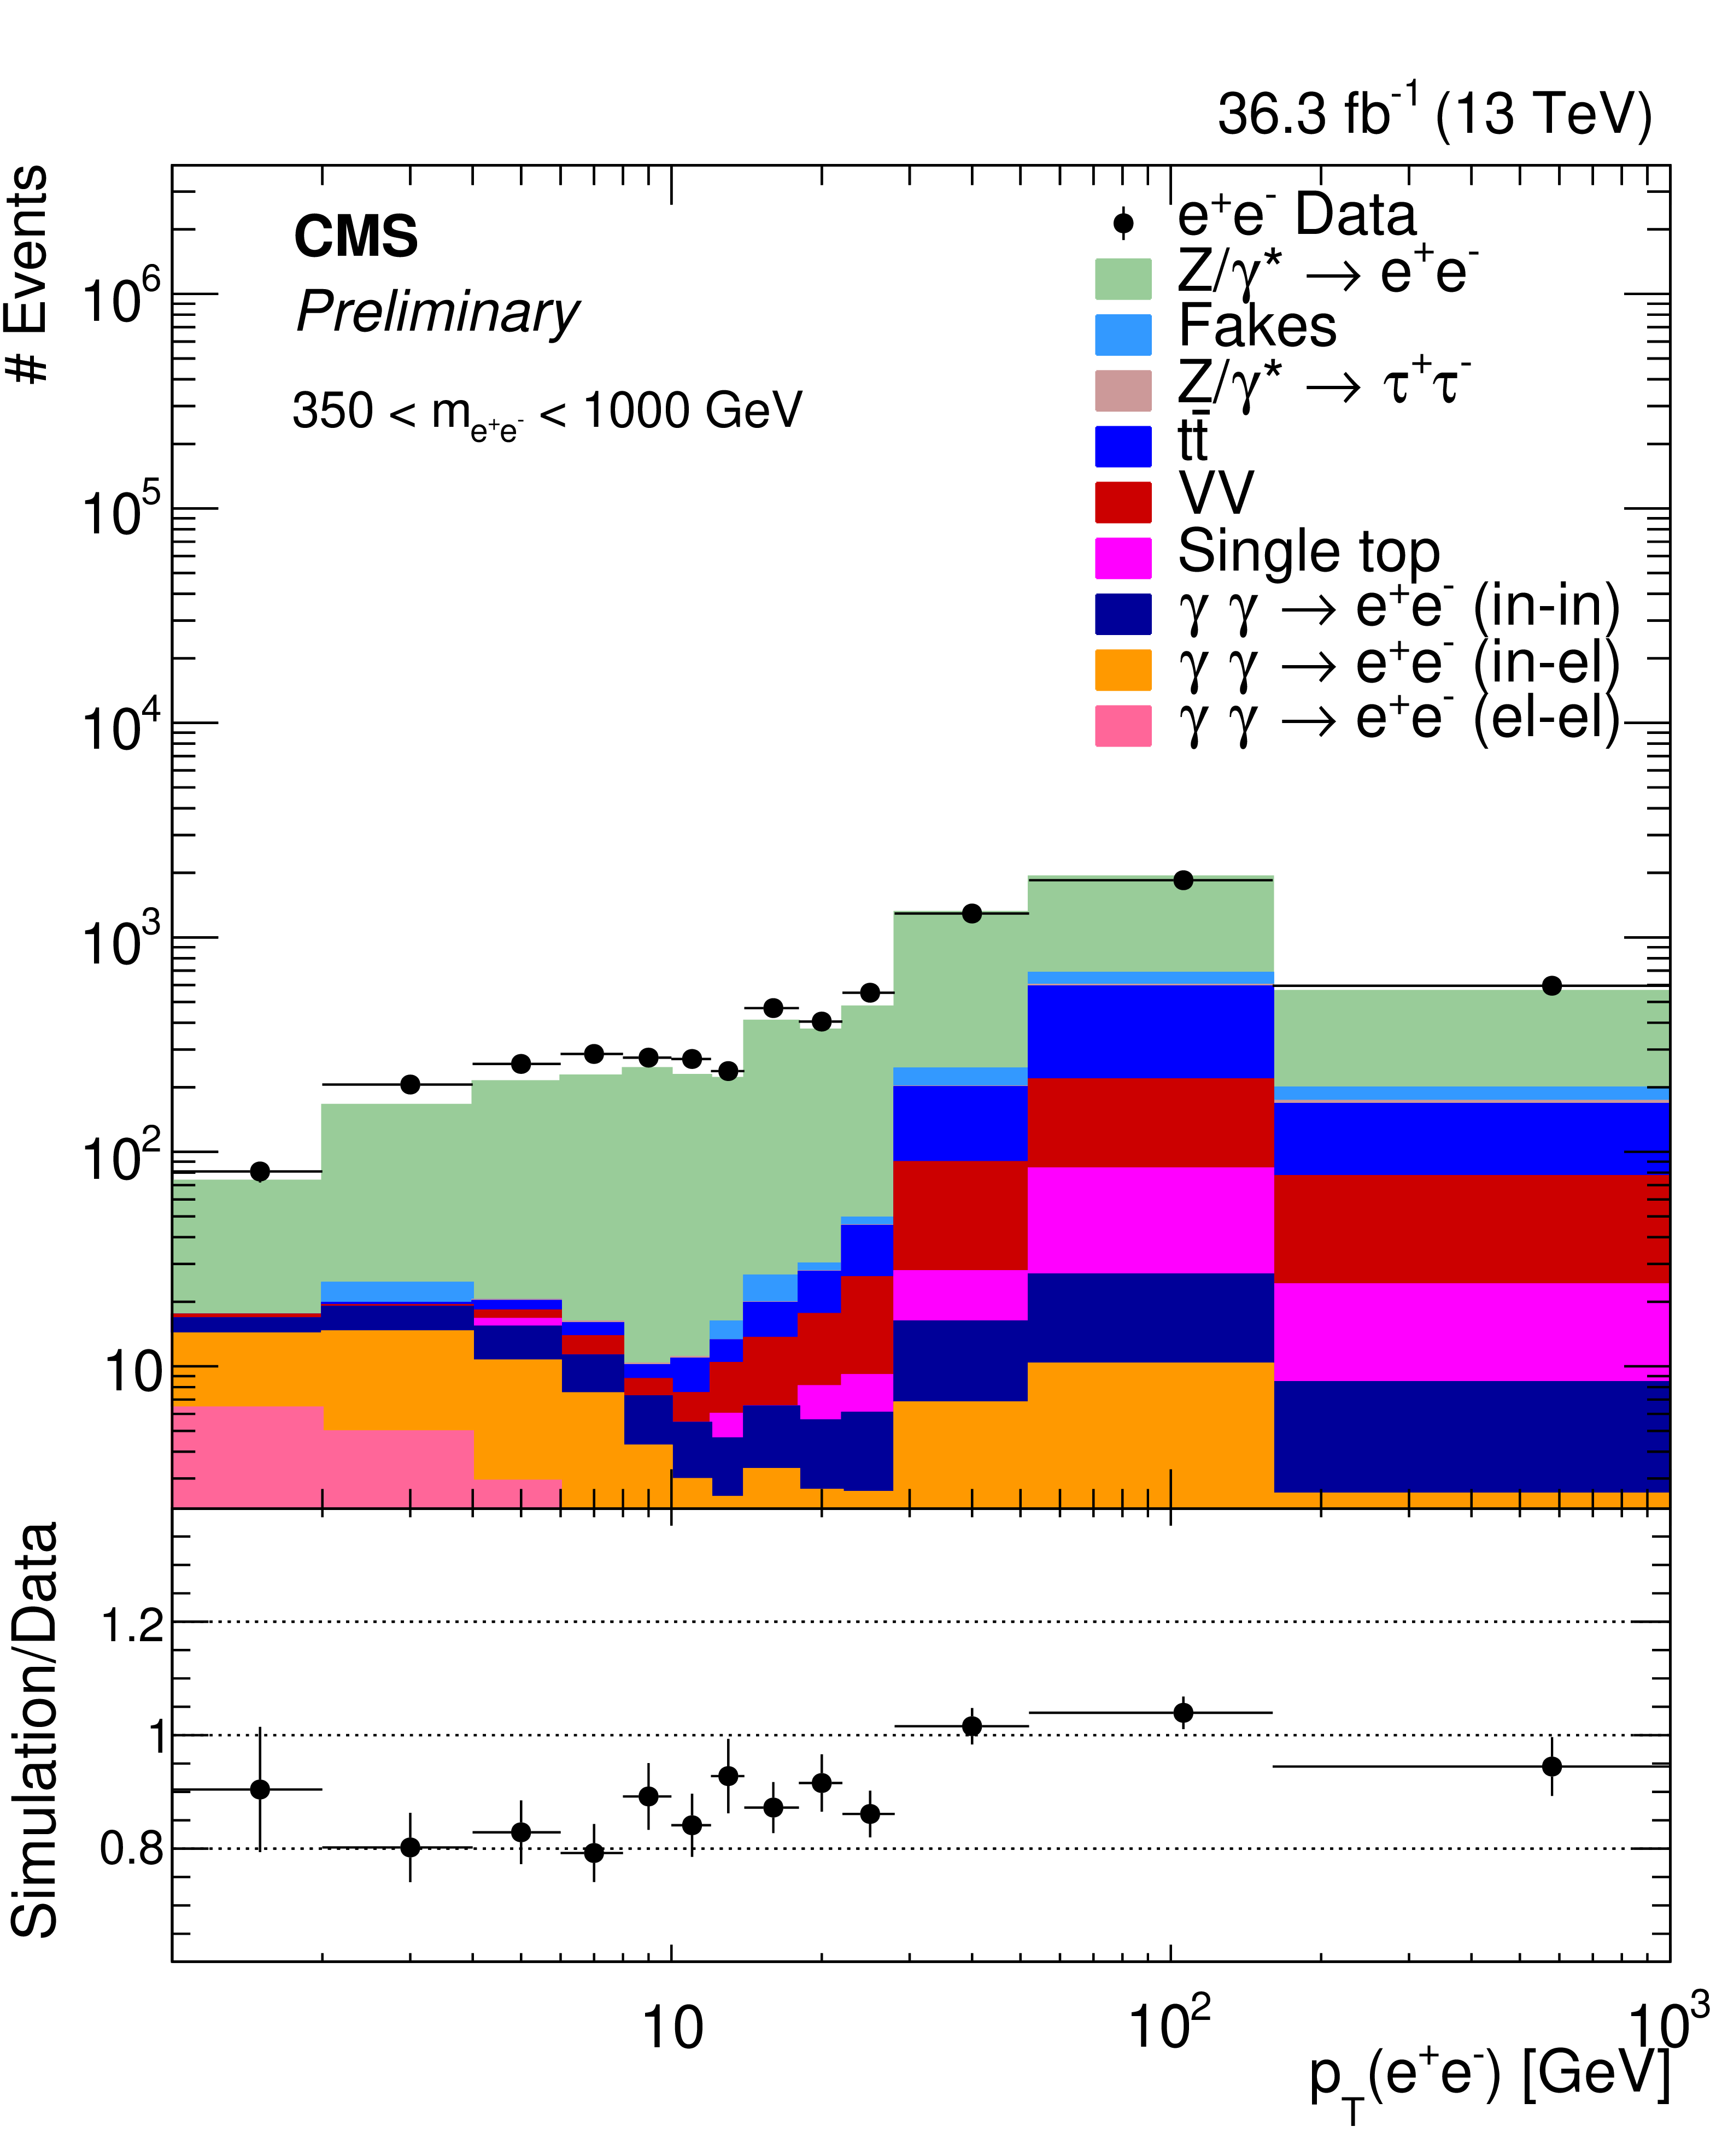
Figure 2:
Distributions of events passing the selection requirements in the electron channel as a function of the dilepton ${p_{\mathrm {T}}}$ in five ranges of invariant mass: 50 to 76 GeV (top left), 76 to 106 GeV (top middle), 106 to 170 GeV (top right), 170 to 350 GeV (bottom left), and 350 to 1000 GeV (bottom right). More details are given in Fig. 1. |
png pdf |
Figure 2-a:
Distributions of events passing the selection requirements in the electron channel as a function of the dilepton ${p_{\mathrm {T}}}$ in five ranges of invariant mass: 50 to 76 GeV (top left), 76 to 106 GeV (top middle), 106 to 170 GeV (top right), 170 to 350 GeV (bottom left), and 350 to 1000 GeV (bottom right). More details are given in Fig. 1. |
png pdf |
Figure 2-b:
Distributions of events passing the selection requirements in the electron channel as a function of the dilepton ${p_{\mathrm {T}}}$ in five ranges of invariant mass: 50 to 76 GeV (top left), 76 to 106 GeV (top middle), 106 to 170 GeV (top right), 170 to 350 GeV (bottom left), and 350 to 1000 GeV (bottom right). More details are given in Fig. 1. |
png pdf |
Figure 2-c:
Distributions of events passing the selection requirements in the electron channel as a function of the dilepton ${p_{\mathrm {T}}}$ in five ranges of invariant mass: 50 to 76 GeV (top left), 76 to 106 GeV (top middle), 106 to 170 GeV (top right), 170 to 350 GeV (bottom left), and 350 to 1000 GeV (bottom right). More details are given in Fig. 1. |
png pdf |
Figure 2-d:
Distributions of events passing the selection requirements in the electron channel as a function of the dilepton ${p_{\mathrm {T}}}$ in five ranges of invariant mass: 50 to 76 GeV (top left), 76 to 106 GeV (top middle), 106 to 170 GeV (top right), 170 to 350 GeV (bottom left), and 350 to 1000 GeV (bottom right). More details are given in Fig. 1. |
png pdf |
Figure 2-e:
Distributions of events passing the selection requirements in the electron channel as a function of the dilepton ${p_{\mathrm {T}}}$ in five ranges of invariant mass: 50 to 76 GeV (top left), 76 to 106 GeV (top middle), 106 to 170 GeV (top right), 170 to 350 GeV (bottom left), and 350 to 1000 GeV (bottom right). More details are given in Fig. 1. |
png pdf |
Figure 3:
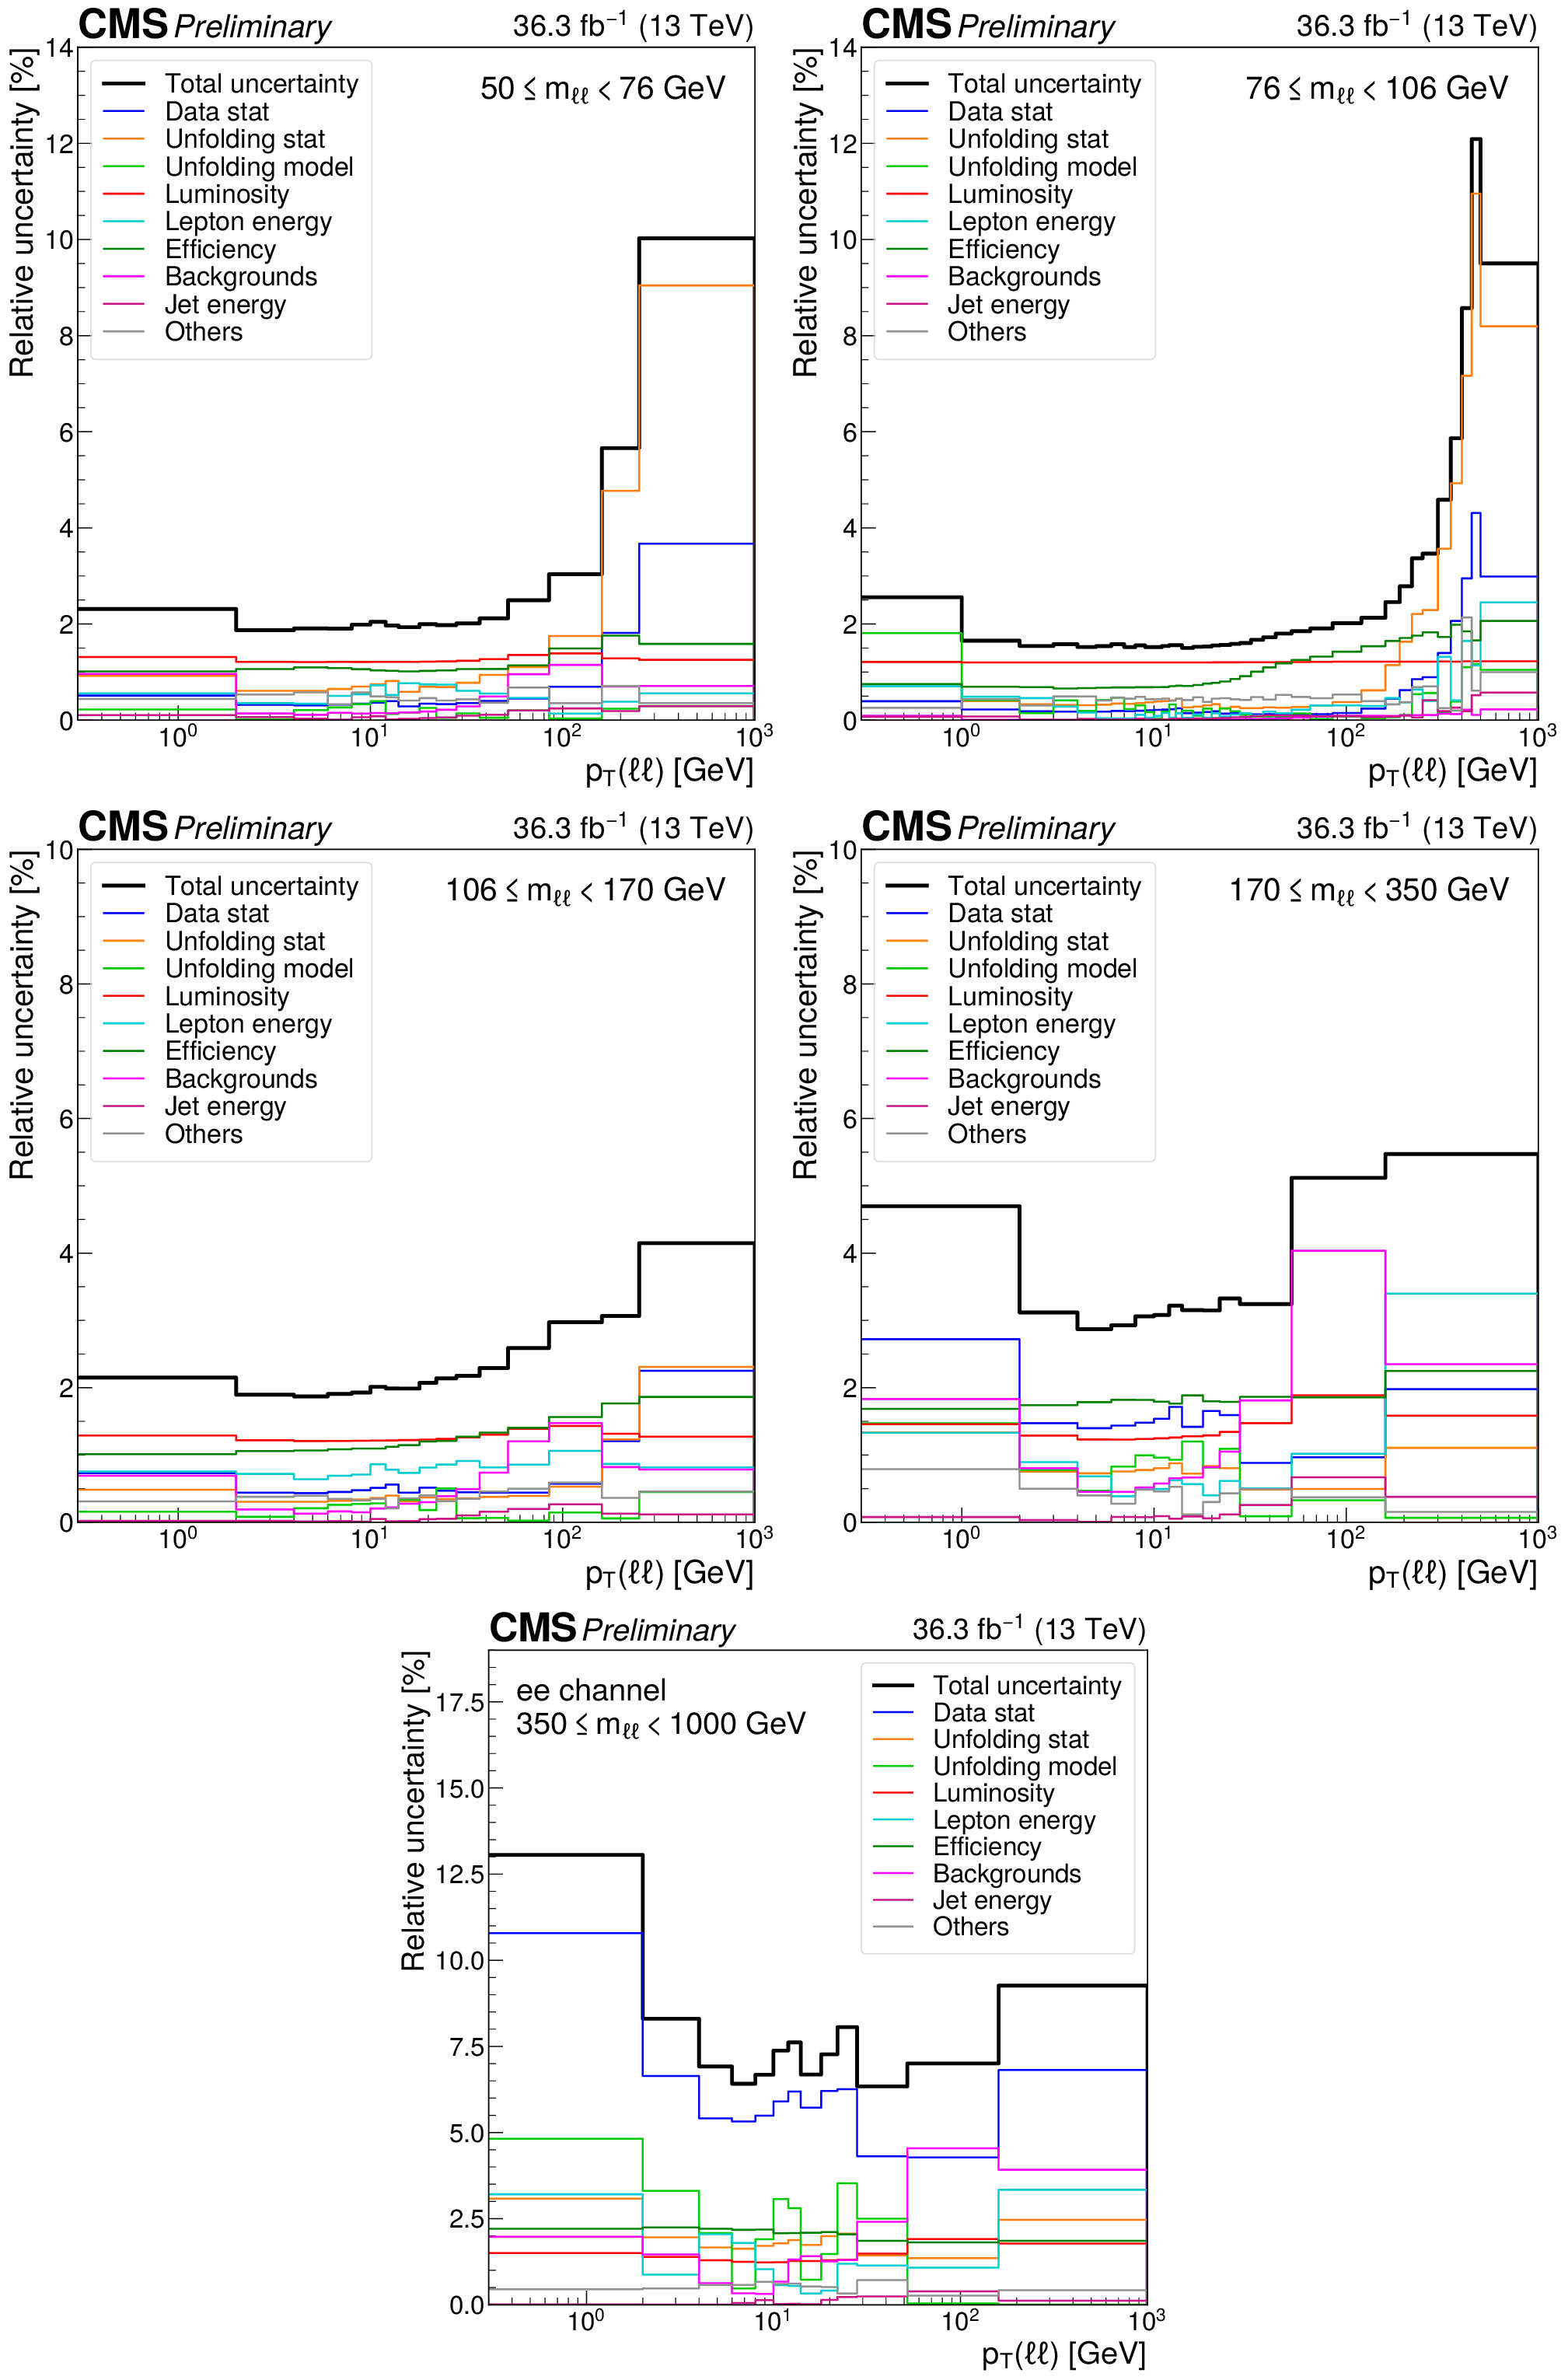
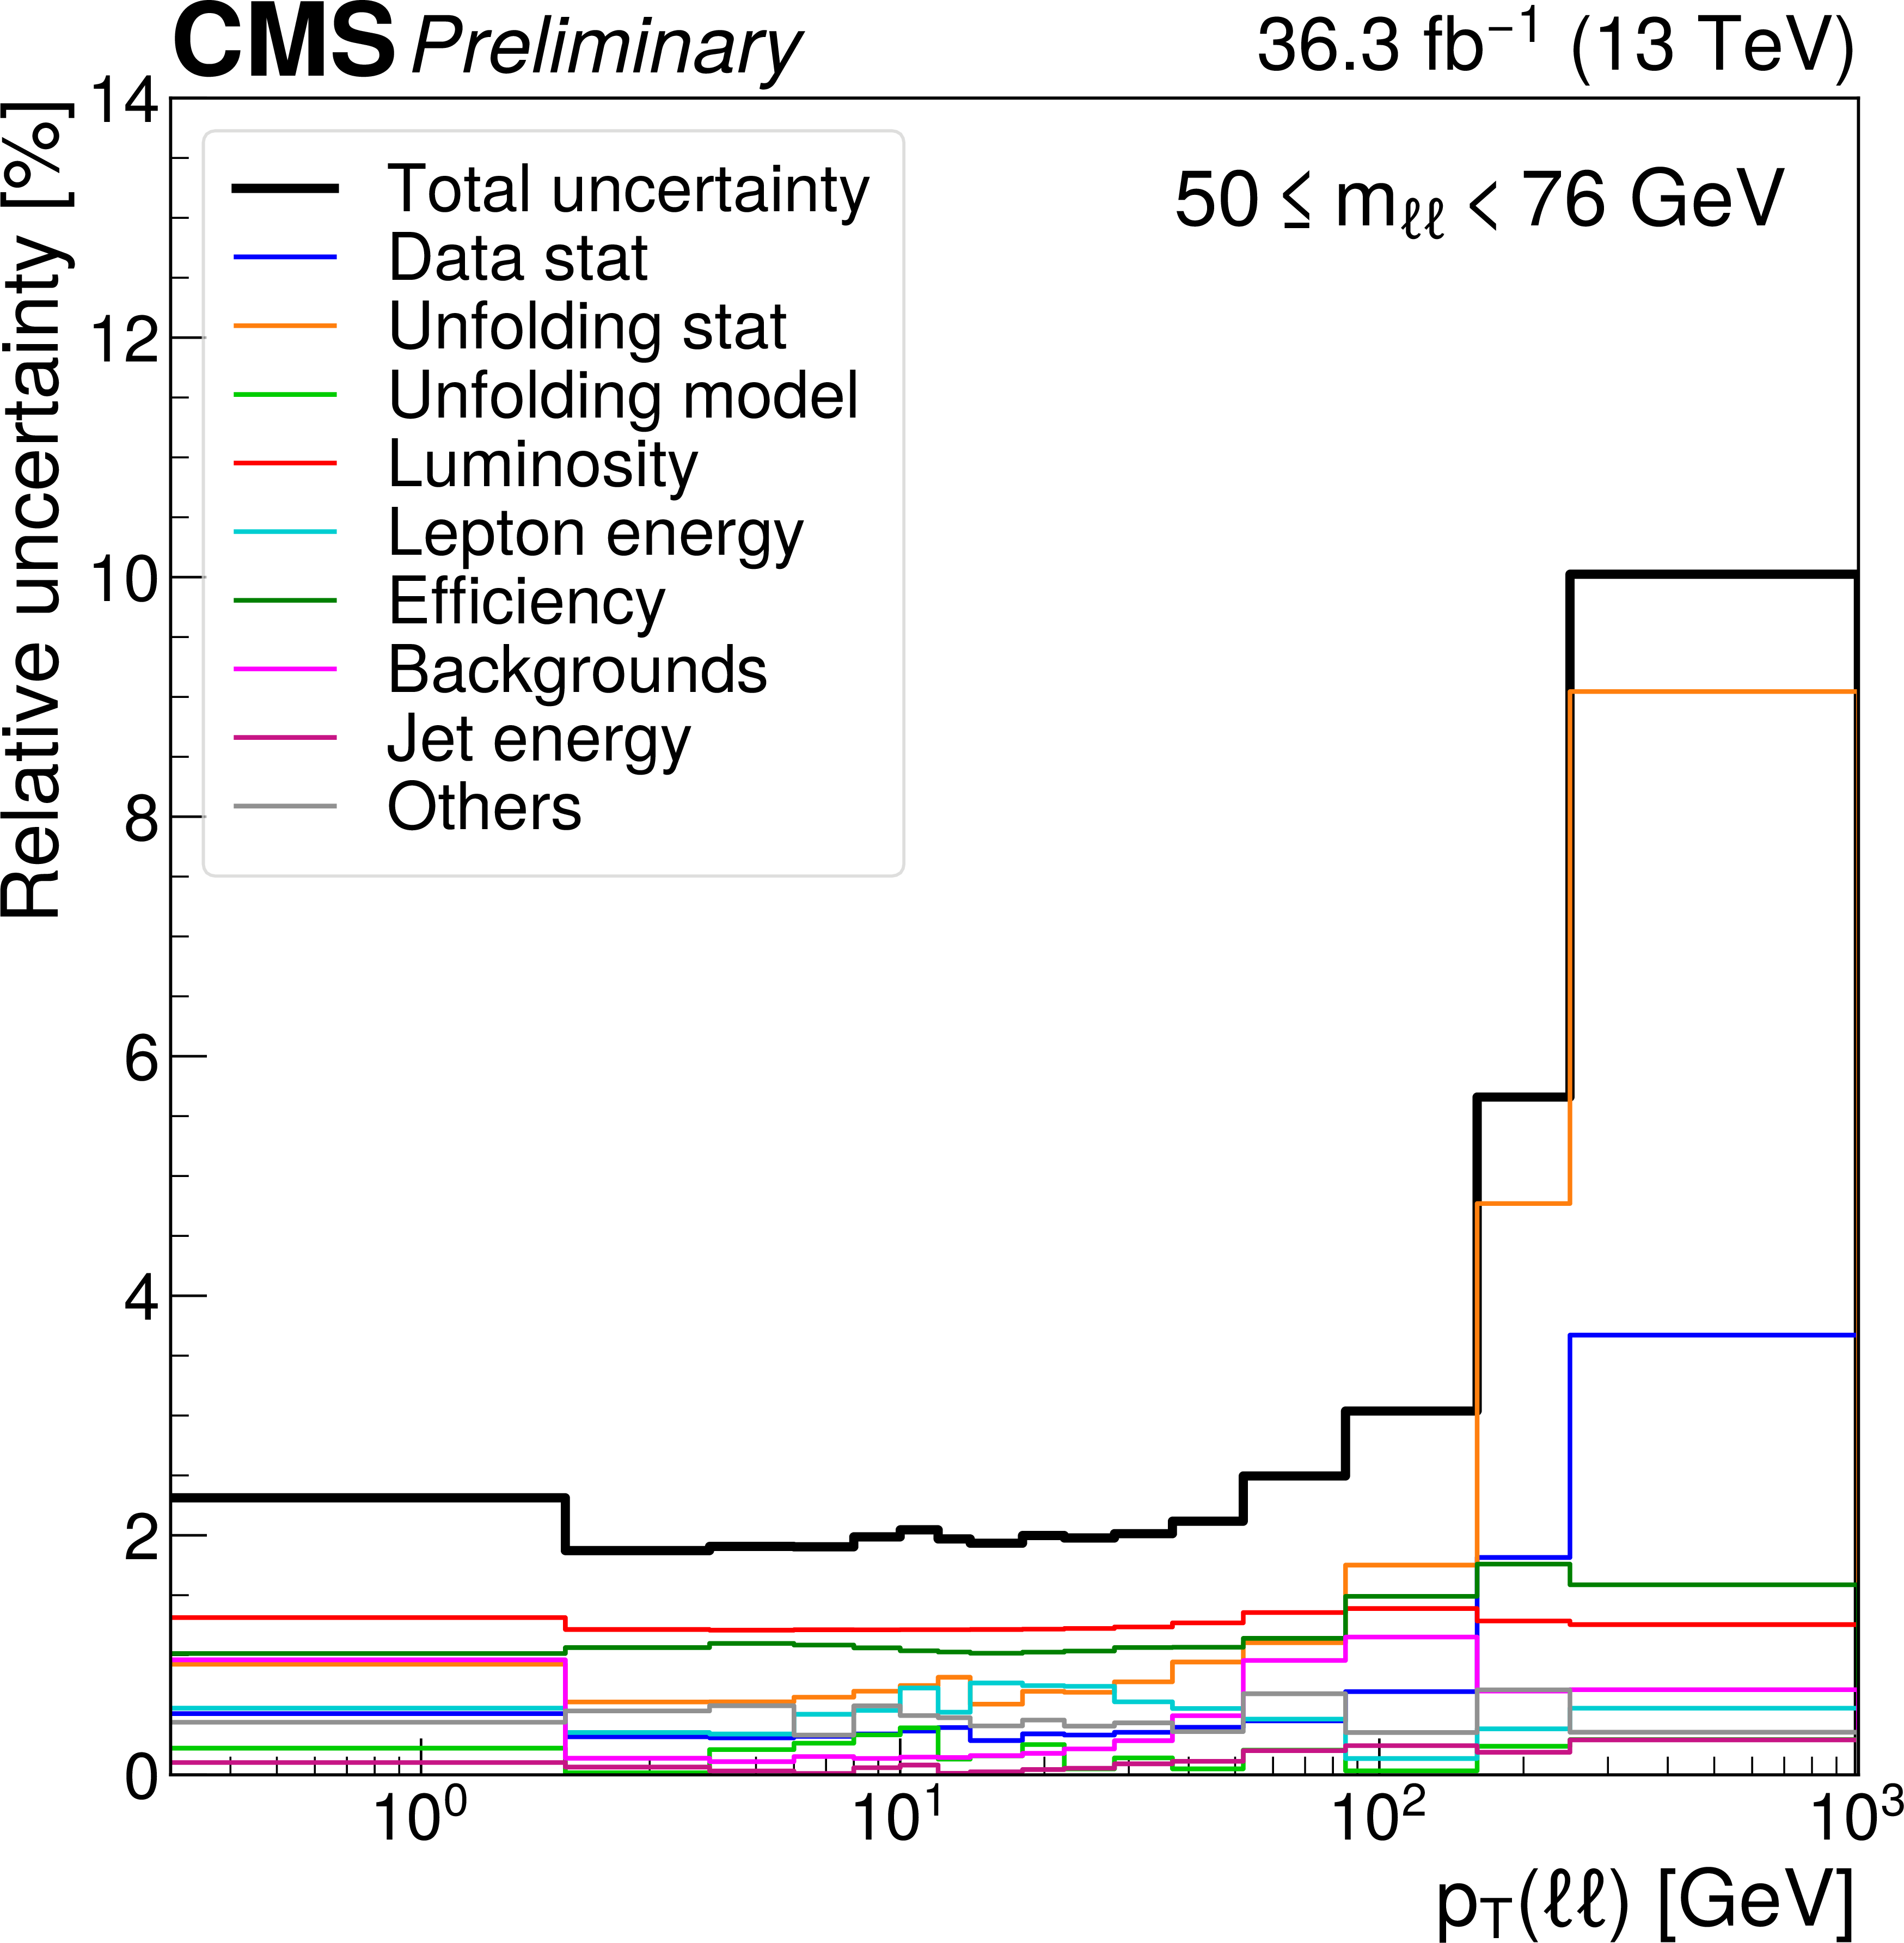
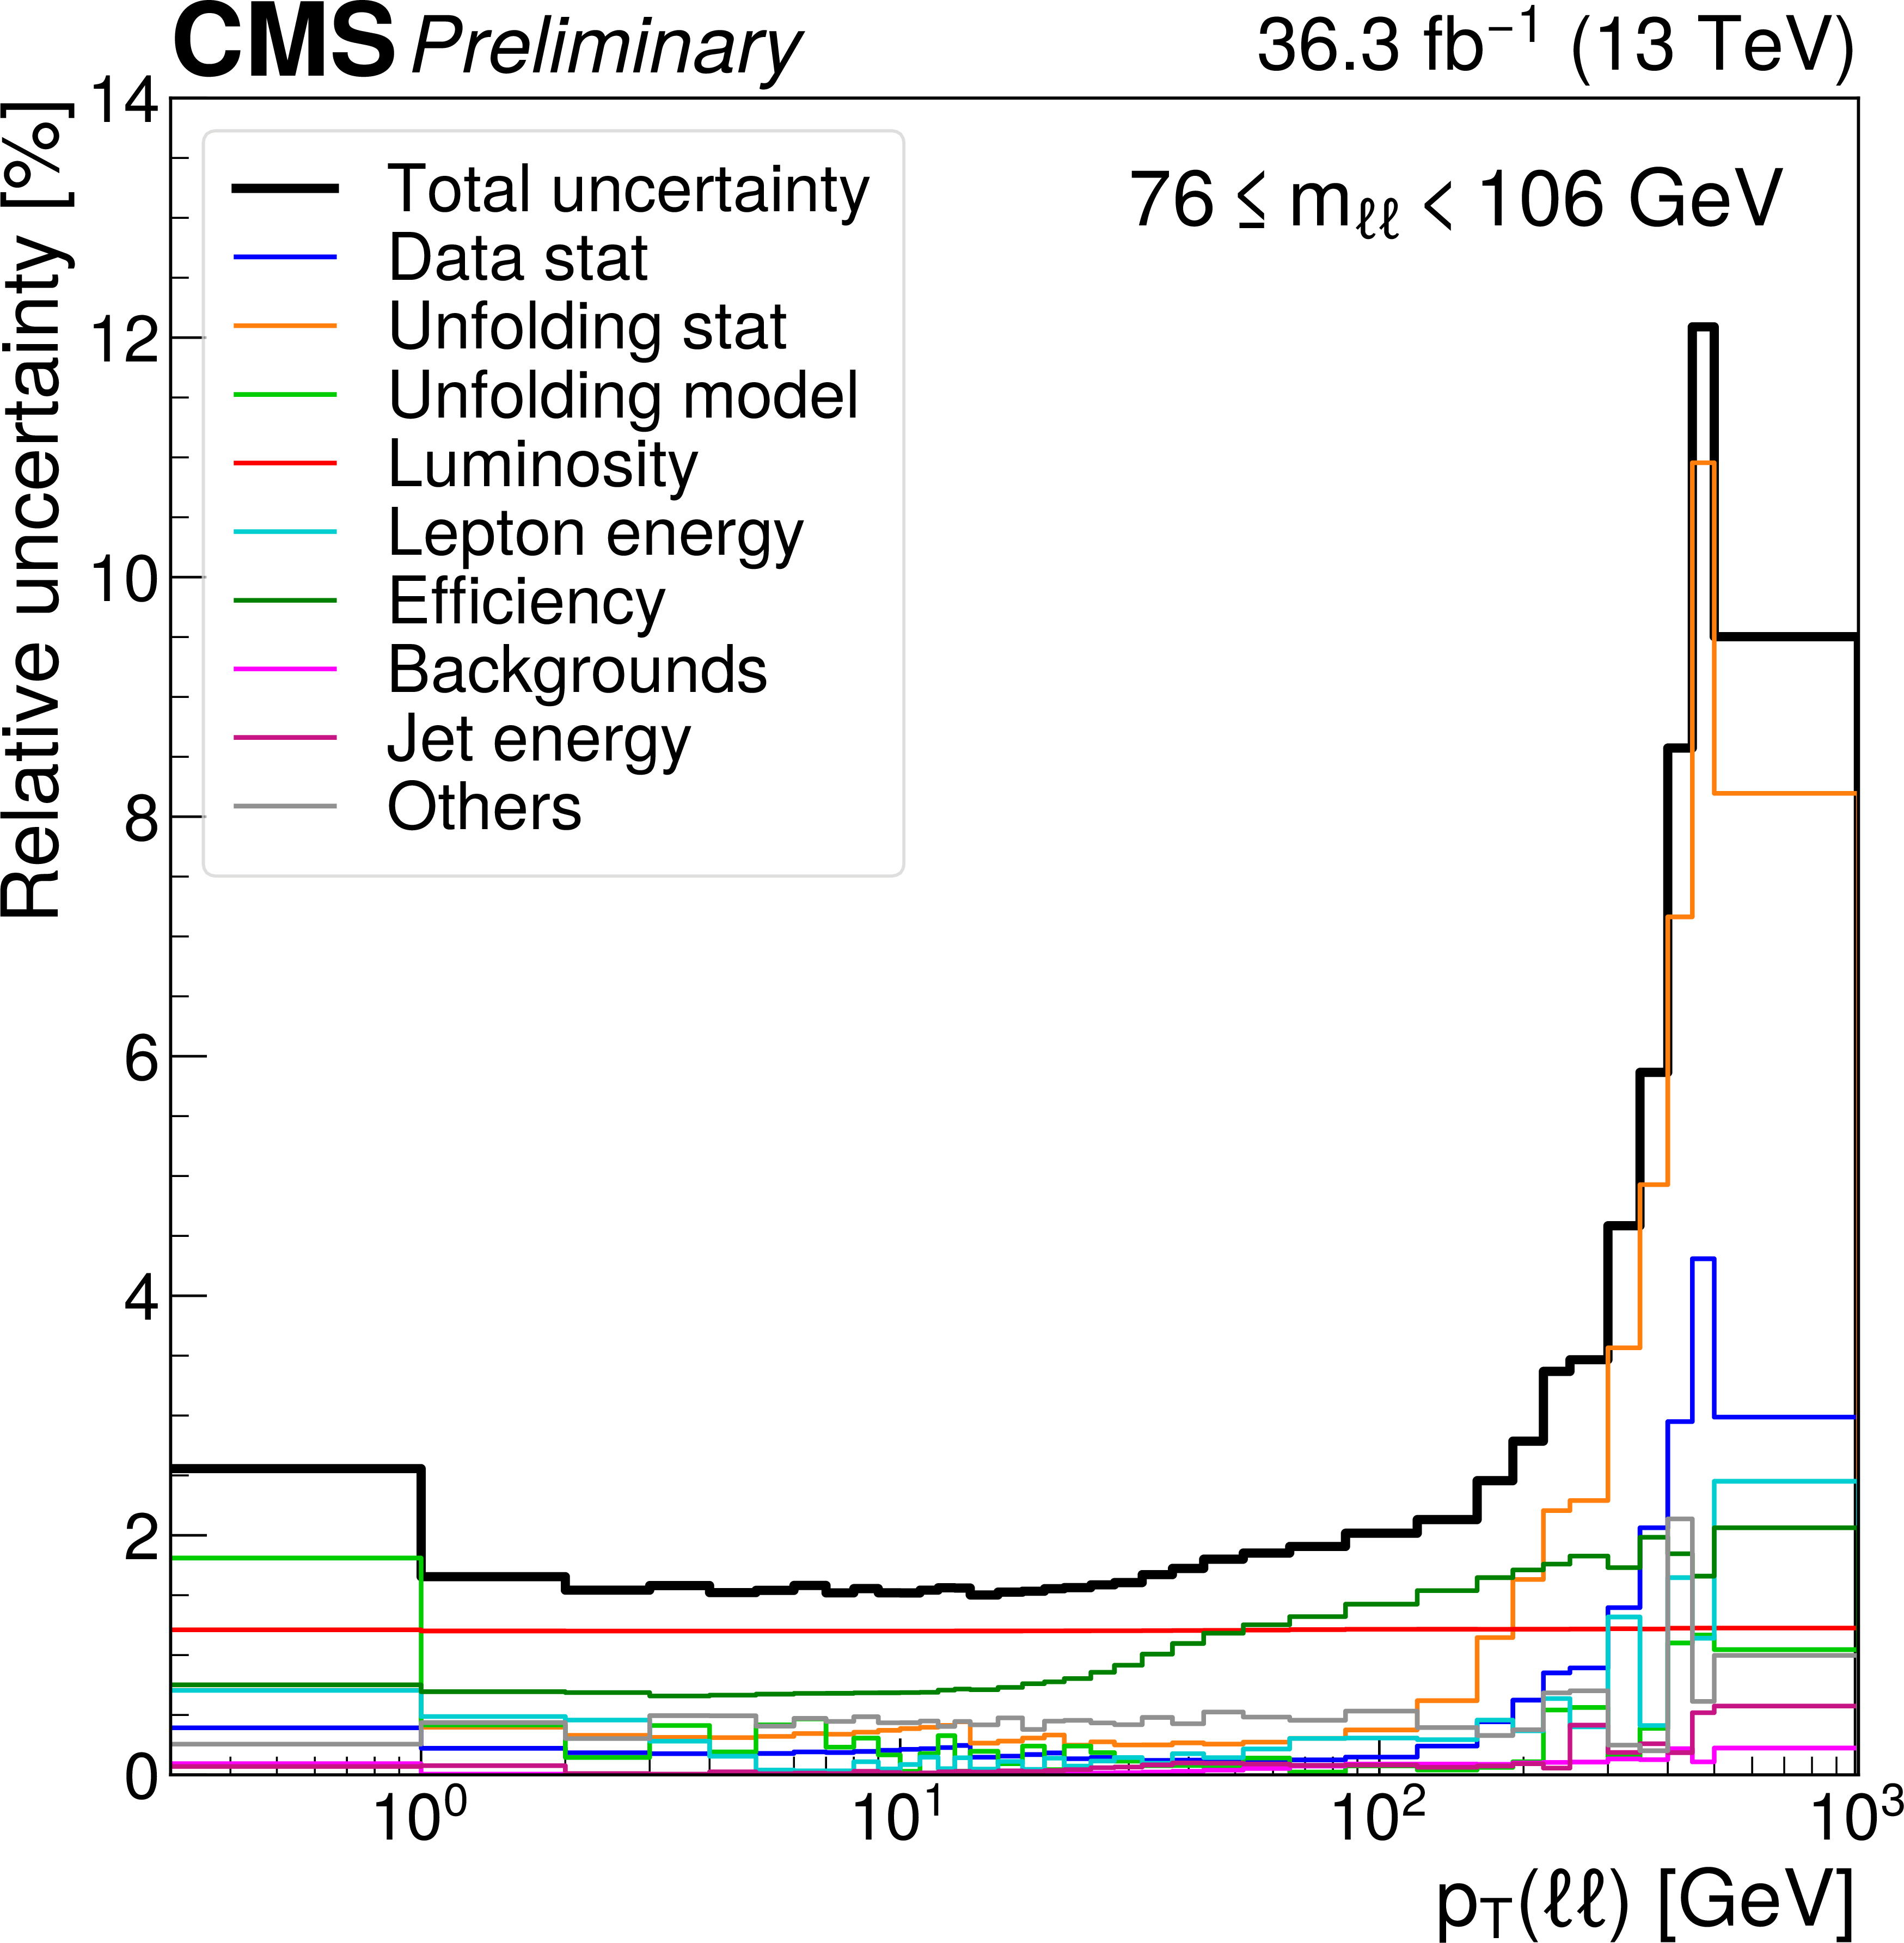
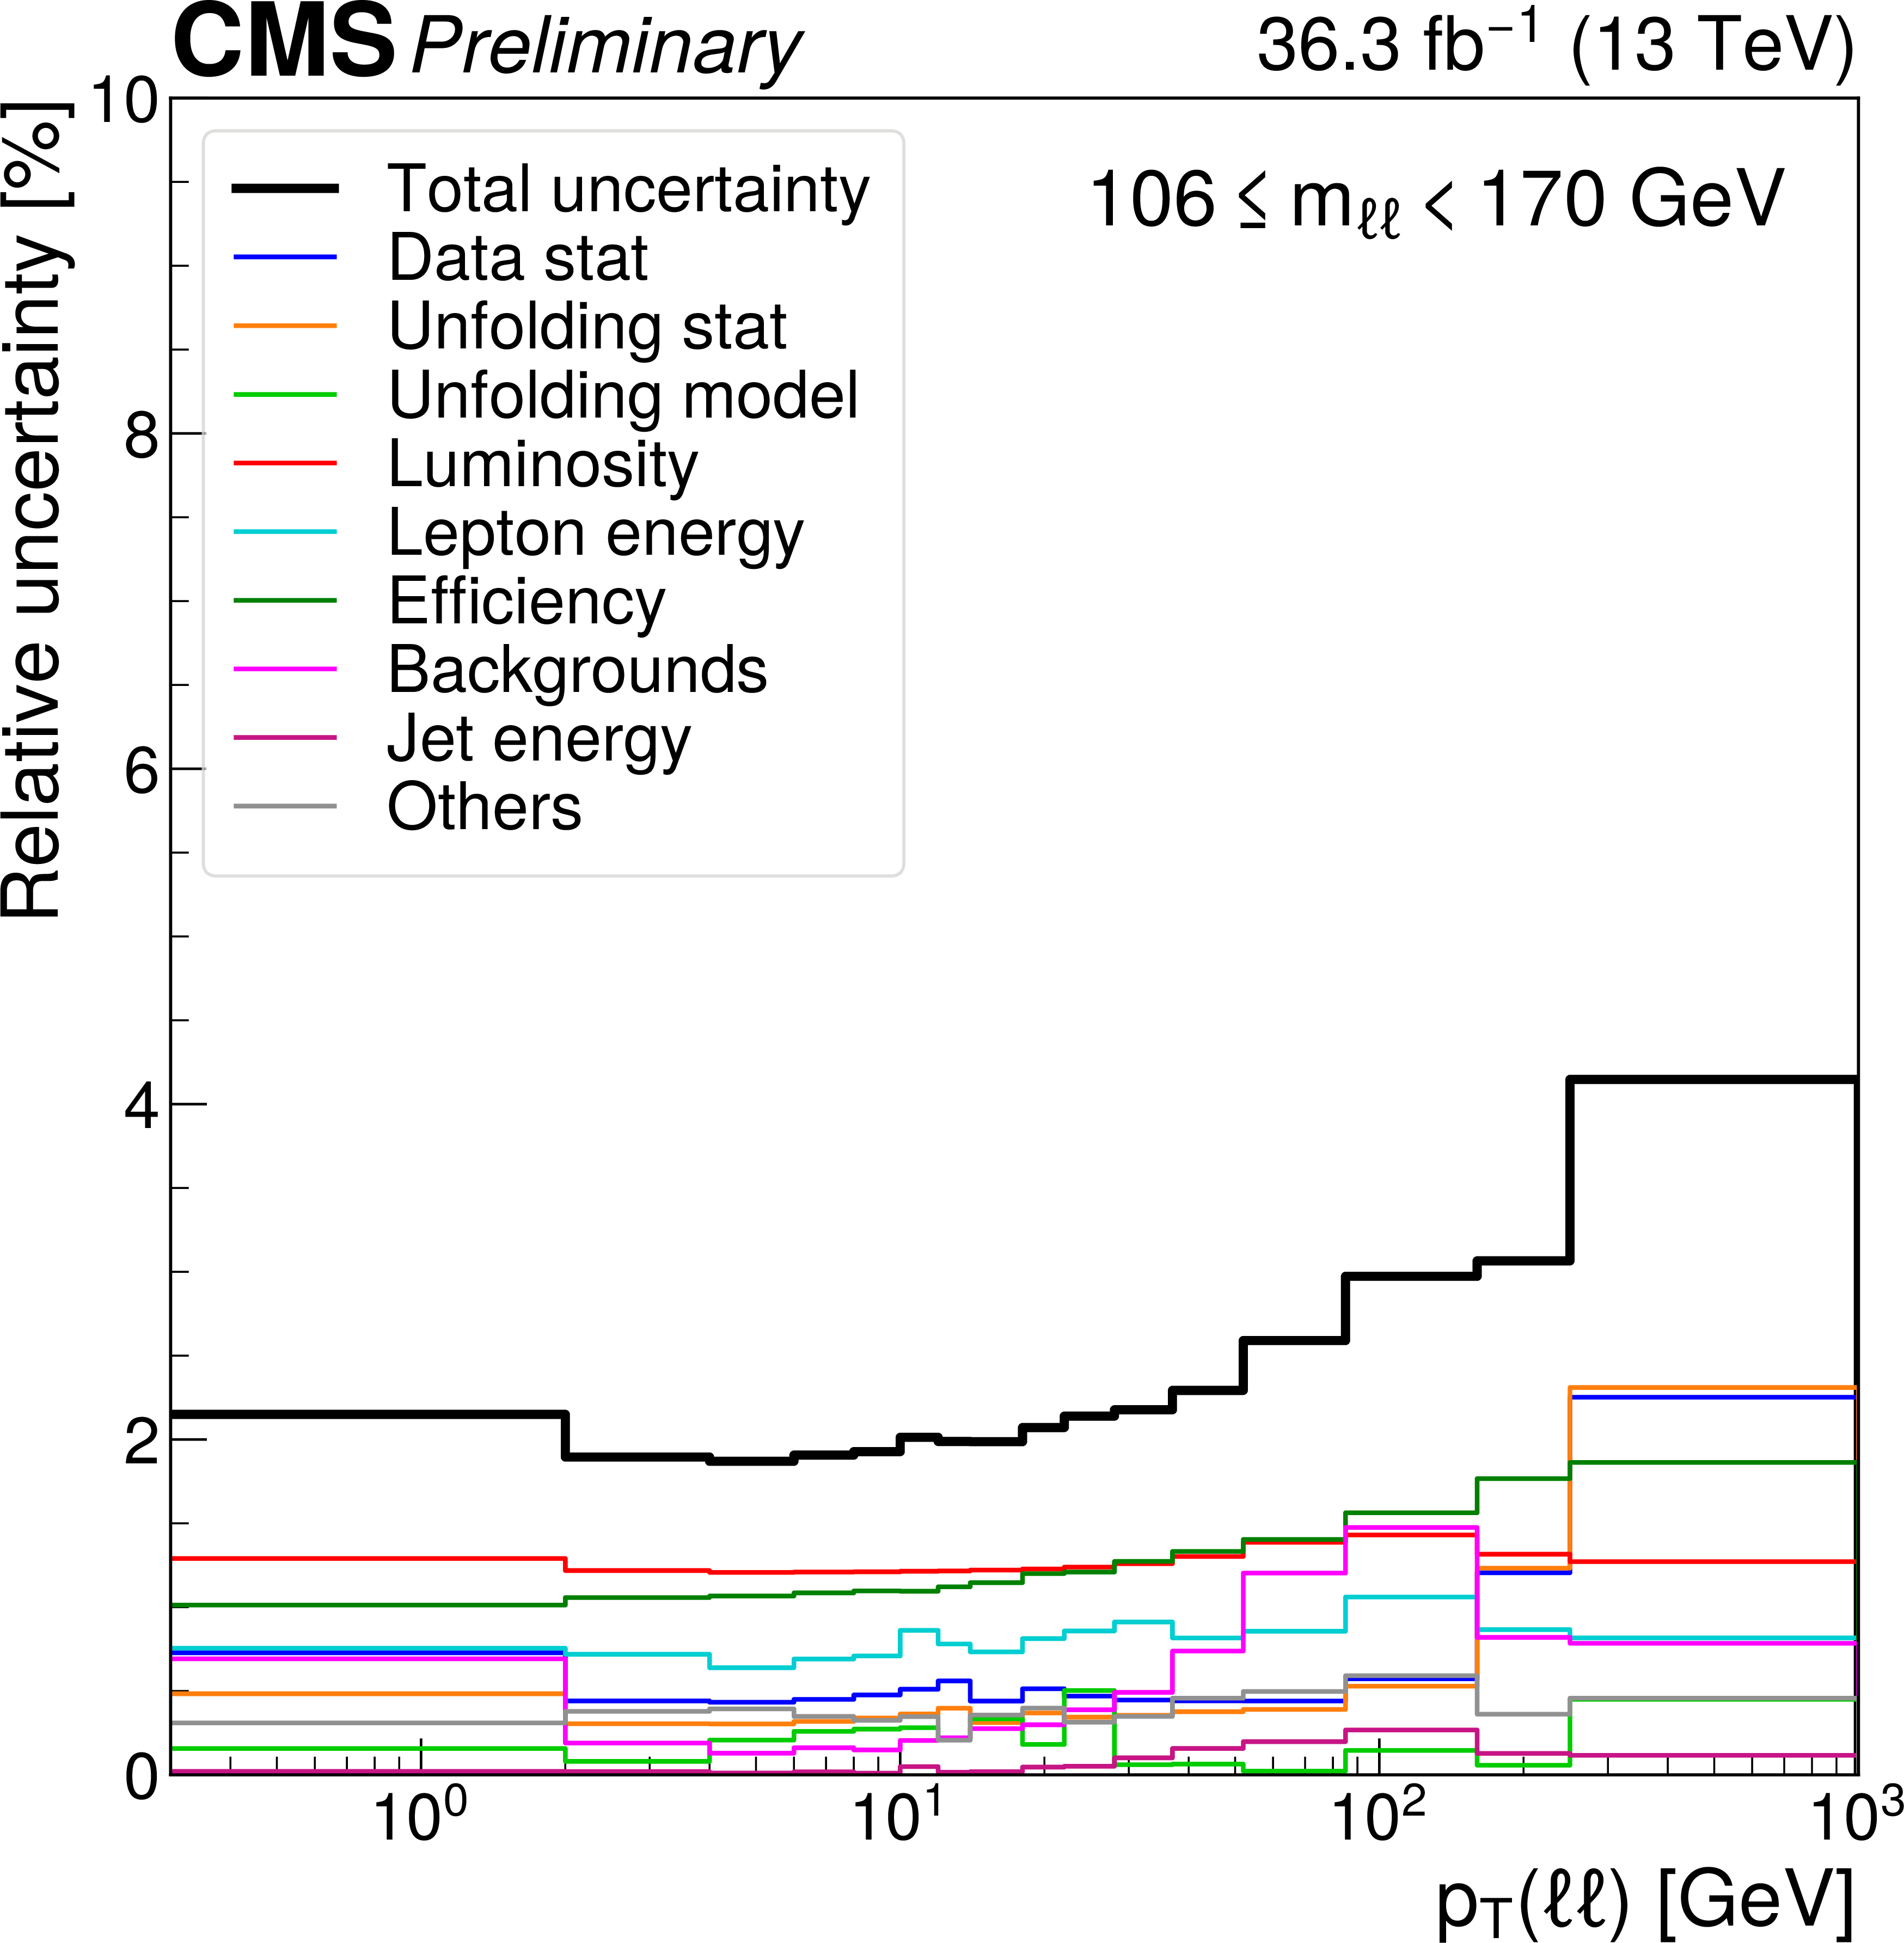
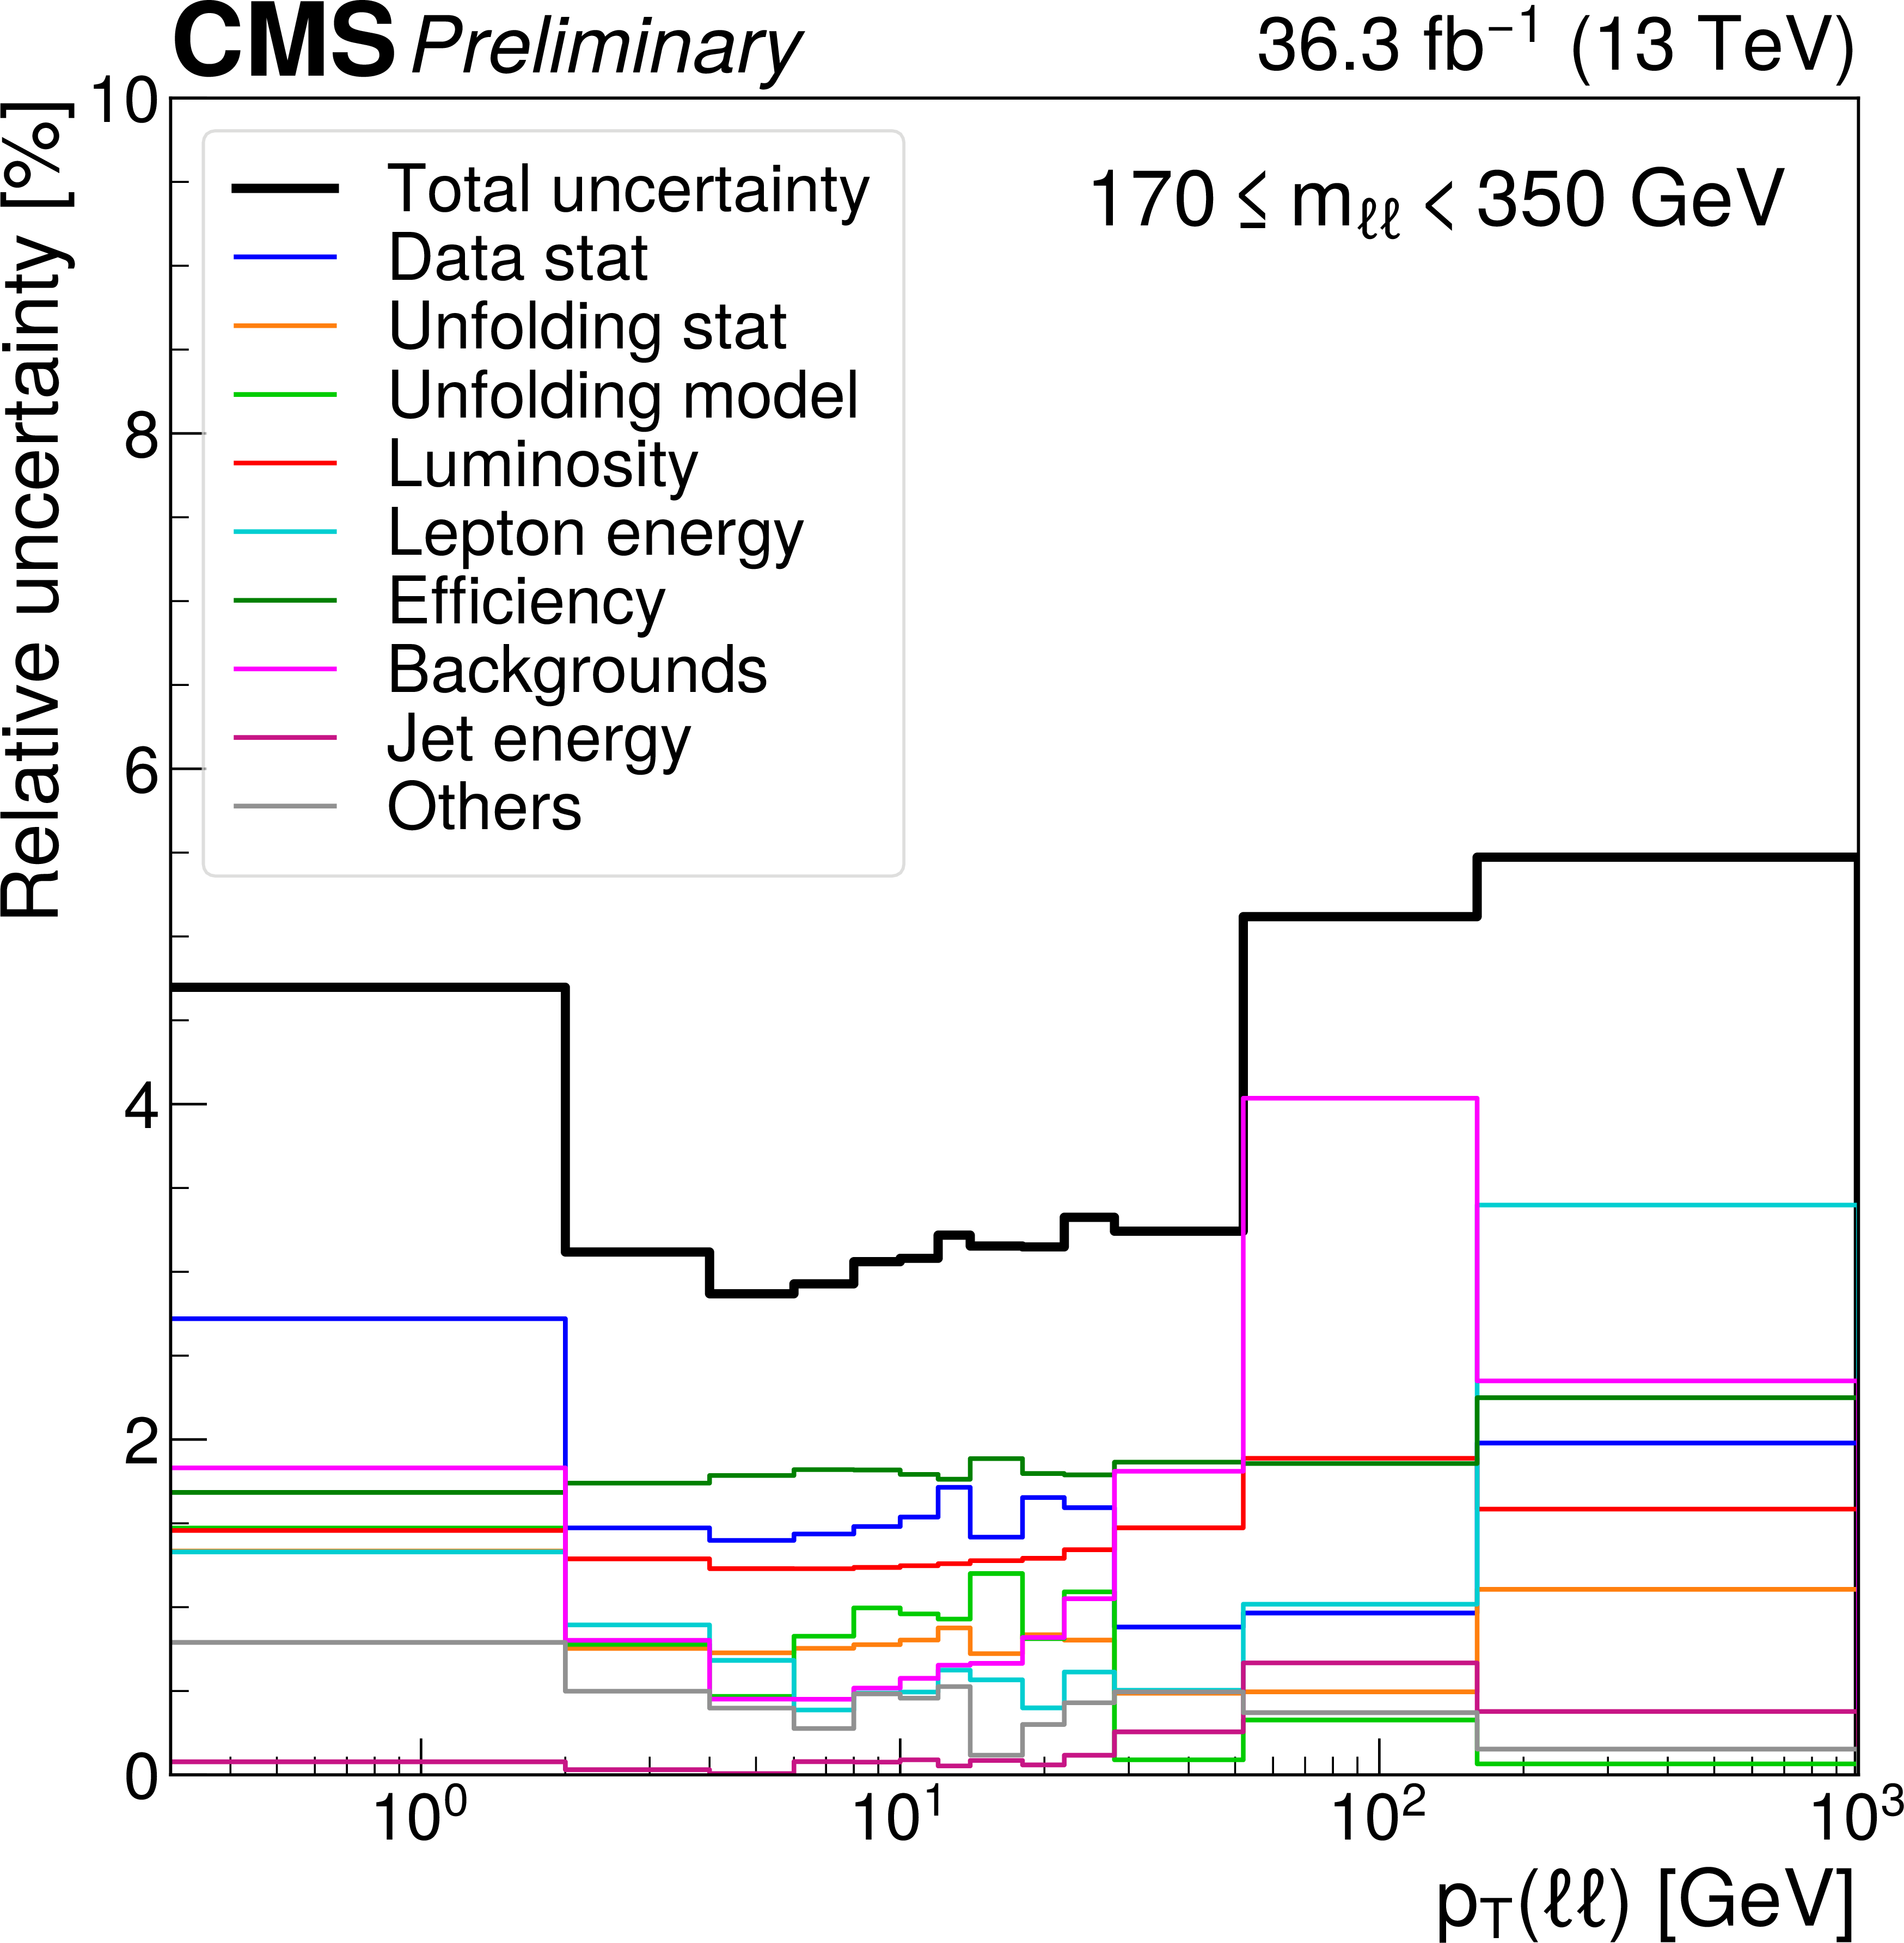
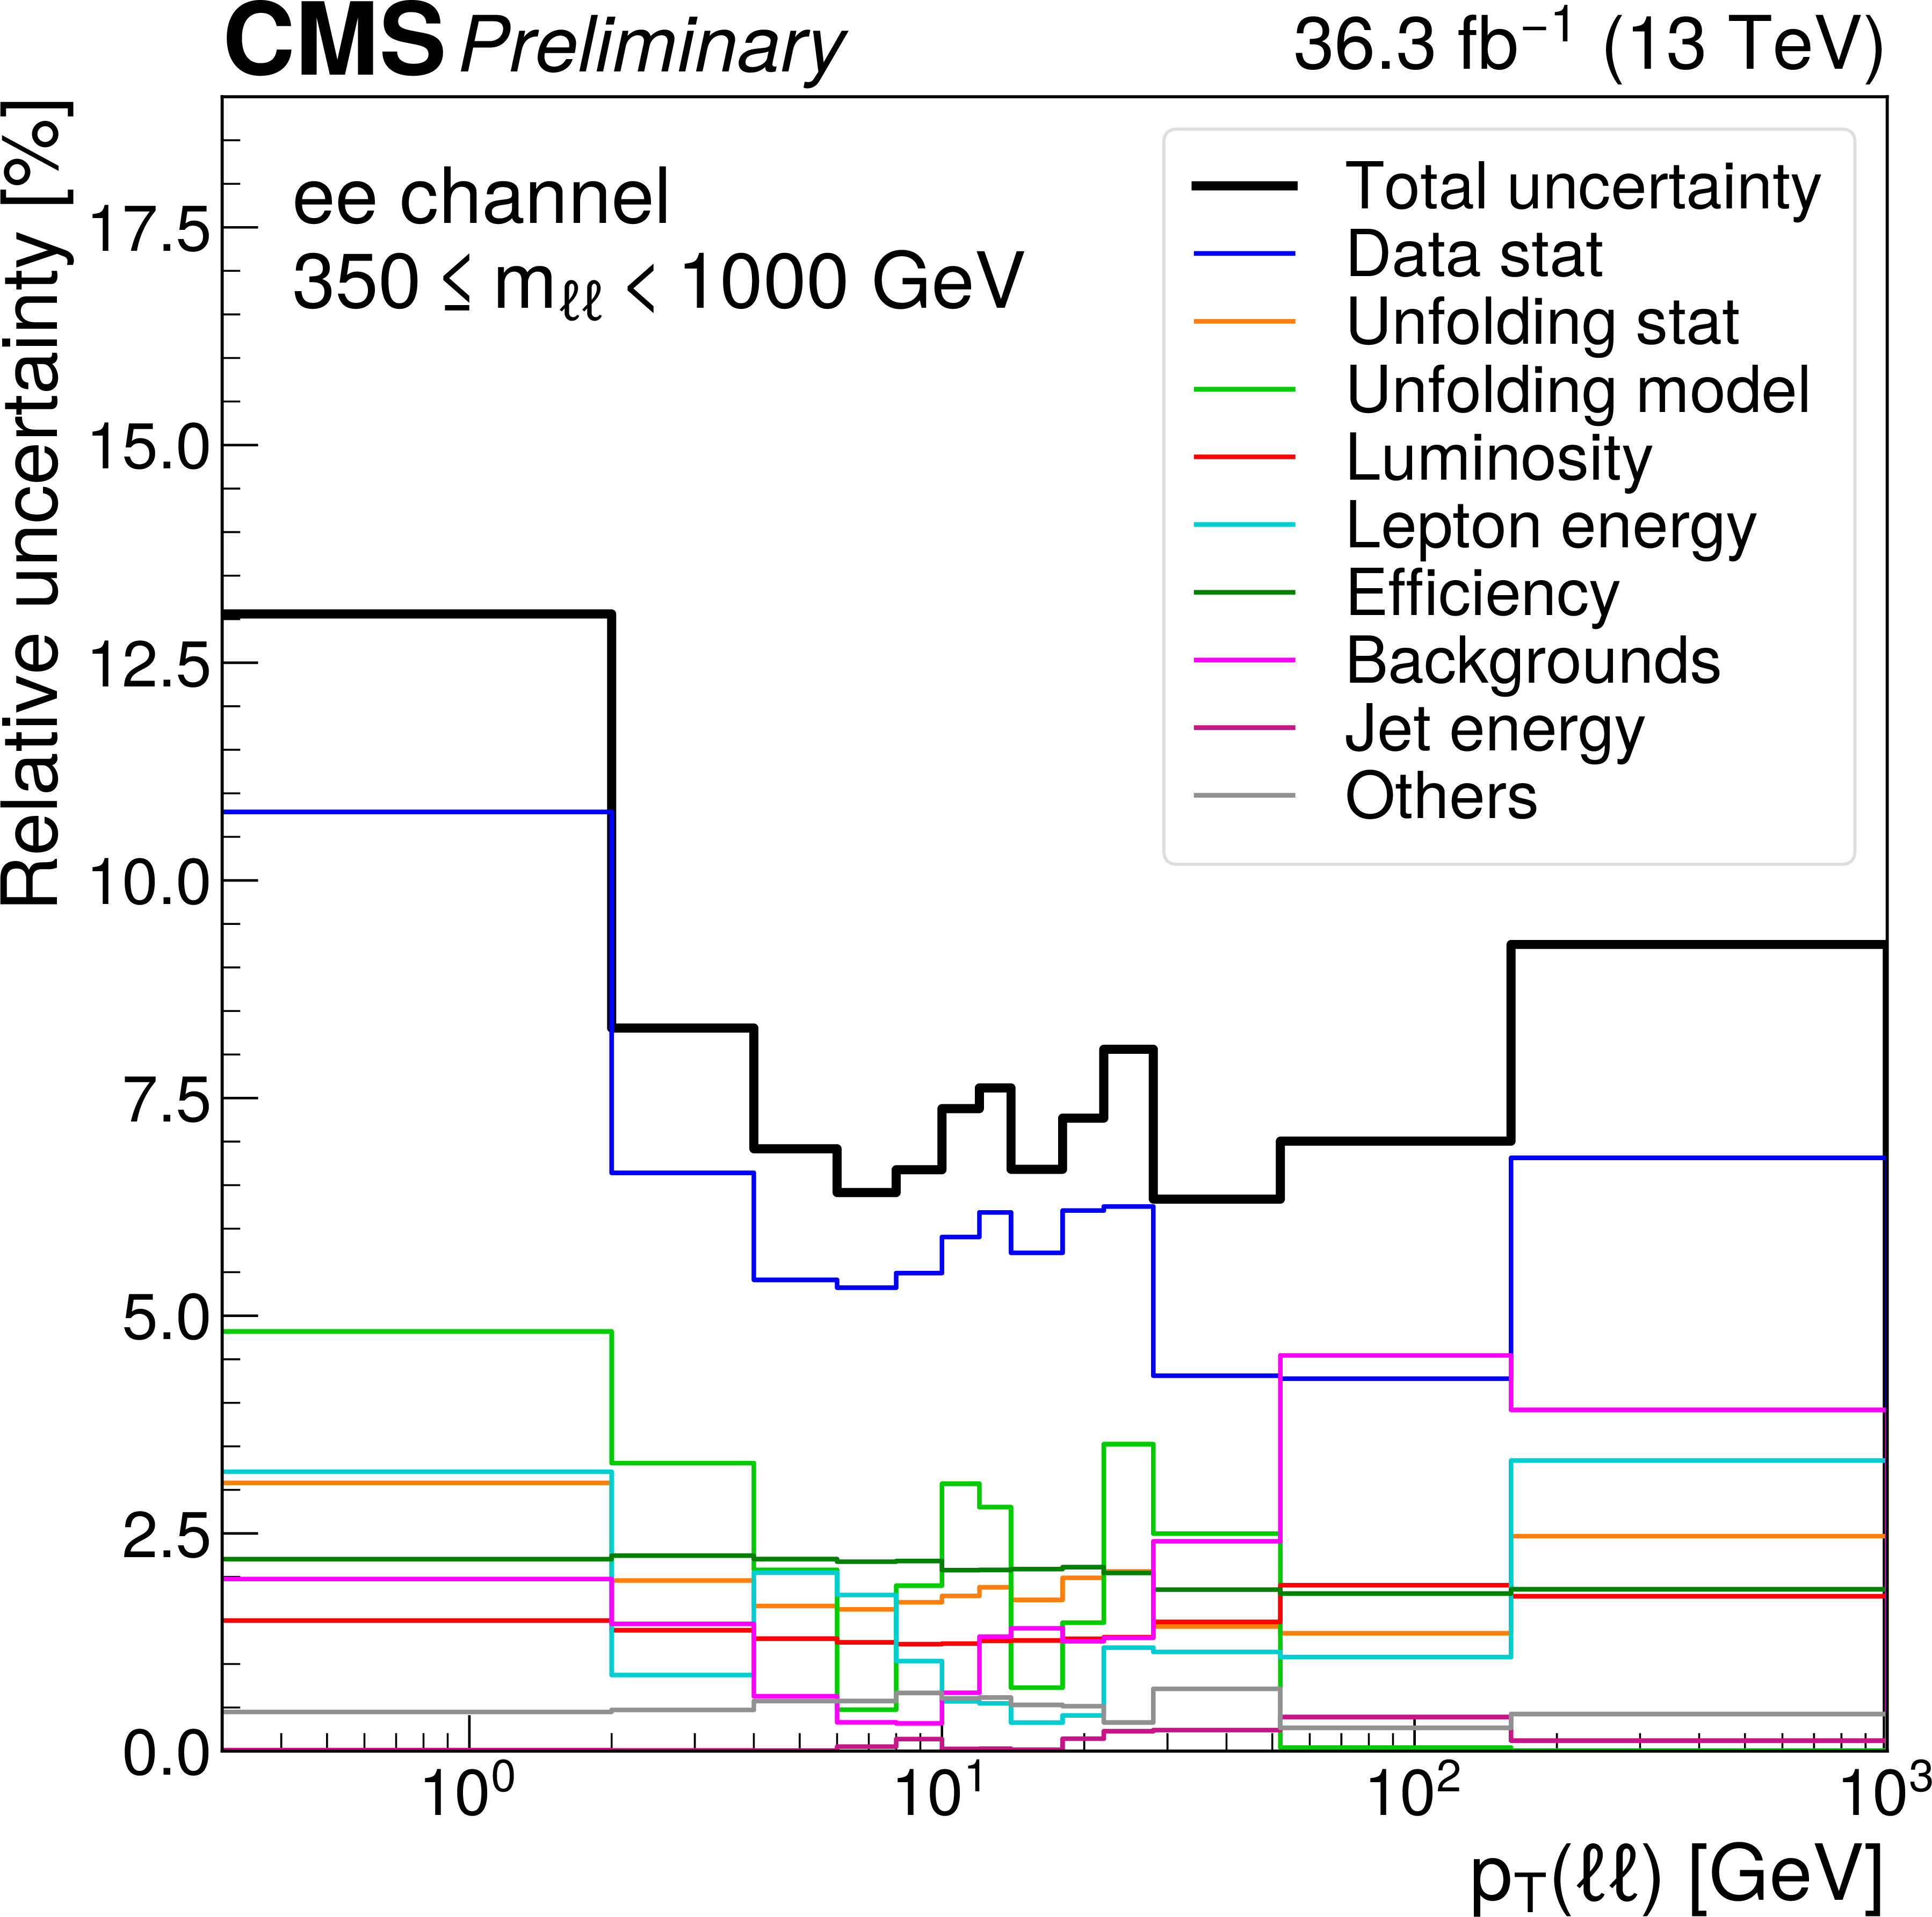
Systematics breakdown of differential cross sections in ${{p_{\mathrm {T}}} (\ell \ell)}$ in different invariant mass ranges: 50 $ < {m_{\ell \ell}} < $ 76 GeV (top left), 76 $ < {m_{\ell \ell}} < $ 106 GeV (top right), 106 $ < {m_{\ell \ell}} < $ 170 GeV (middle left), 170 $ < {m_{\ell \ell}} < $ 350 GeV (middle right), and 350 $ < {m_{\ell \ell}} < $ 1000 GeV (bottom). The black line is the quadratic sum of the colored lines. |
png pdf |
Figure 3-a:
Systematics breakdown of differential cross sections in ${{p_{\mathrm {T}}} (\ell \ell)}$ in different invariant mass ranges: 50 $ < {m_{\ell \ell}} < $ 76 GeV (top left), 76 $ < {m_{\ell \ell}} < $ 106 GeV (top right), 106 $ < {m_{\ell \ell}} < $ 170 GeV (middle left), 170 $ < {m_{\ell \ell}} < $ 350 GeV (middle right), and 350 $ < {m_{\ell \ell}} < $ 1000 GeV (bottom). The black line is the quadratic sum of the colored lines. |
png pdf |
Figure 3-b:
Systematics breakdown of differential cross sections in ${{p_{\mathrm {T}}} (\ell \ell)}$ in different invariant mass ranges: 50 $ < {m_{\ell \ell}} < $ 76 GeV (top left), 76 $ < {m_{\ell \ell}} < $ 106 GeV (top right), 106 $ < {m_{\ell \ell}} < $ 170 GeV (middle left), 170 $ < {m_{\ell \ell}} < $ 350 GeV (middle right), and 350 $ < {m_{\ell \ell}} < $ 1000 GeV (bottom). The black line is the quadratic sum of the colored lines. |
png pdf |
Figure 3-c:
Systematics breakdown of differential cross sections in ${{p_{\mathrm {T}}} (\ell \ell)}$ in different invariant mass ranges: 50 $ < {m_{\ell \ell}} < $ 76 GeV (top left), 76 $ < {m_{\ell \ell}} < $ 106 GeV (top right), 106 $ < {m_{\ell \ell}} < $ 170 GeV (middle left), 170 $ < {m_{\ell \ell}} < $ 350 GeV (middle right), and 350 $ < {m_{\ell \ell}} < $ 1000 GeV (bottom). The black line is the quadratic sum of the colored lines. |
png pdf |
Figure 3-d:
Systematics breakdown of differential cross sections in ${{p_{\mathrm {T}}} (\ell \ell)}$ in different invariant mass ranges: 50 $ < {m_{\ell \ell}} < $ 76 GeV (top left), 76 $ < {m_{\ell \ell}} < $ 106 GeV (top right), 106 $ < {m_{\ell \ell}} < $ 170 GeV (middle left), 170 $ < {m_{\ell \ell}} < $ 350 GeV (middle right), and 350 $ < {m_{\ell \ell}} < $ 1000 GeV (bottom). The black line is the quadratic sum of the colored lines. |
png pdf |
Figure 3-e:
Systematics breakdown of differential cross sections in ${{p_{\mathrm {T}}} (\ell \ell)}$ in different invariant mass ranges: 50 $ < {m_{\ell \ell}} < $ 76 GeV (top left), 76 $ < {m_{\ell \ell}} < $ 106 GeV (top right), 106 $ < {m_{\ell \ell}} < $ 170 GeV (middle left), 170 $ < {m_{\ell \ell}} < $ 350 GeV (middle right), and 350 $ < {m_{\ell \ell}} < $ 1000 GeV (bottom). The black line is the quadratic sum of the colored lines. |

png pdf |
Figure 4:
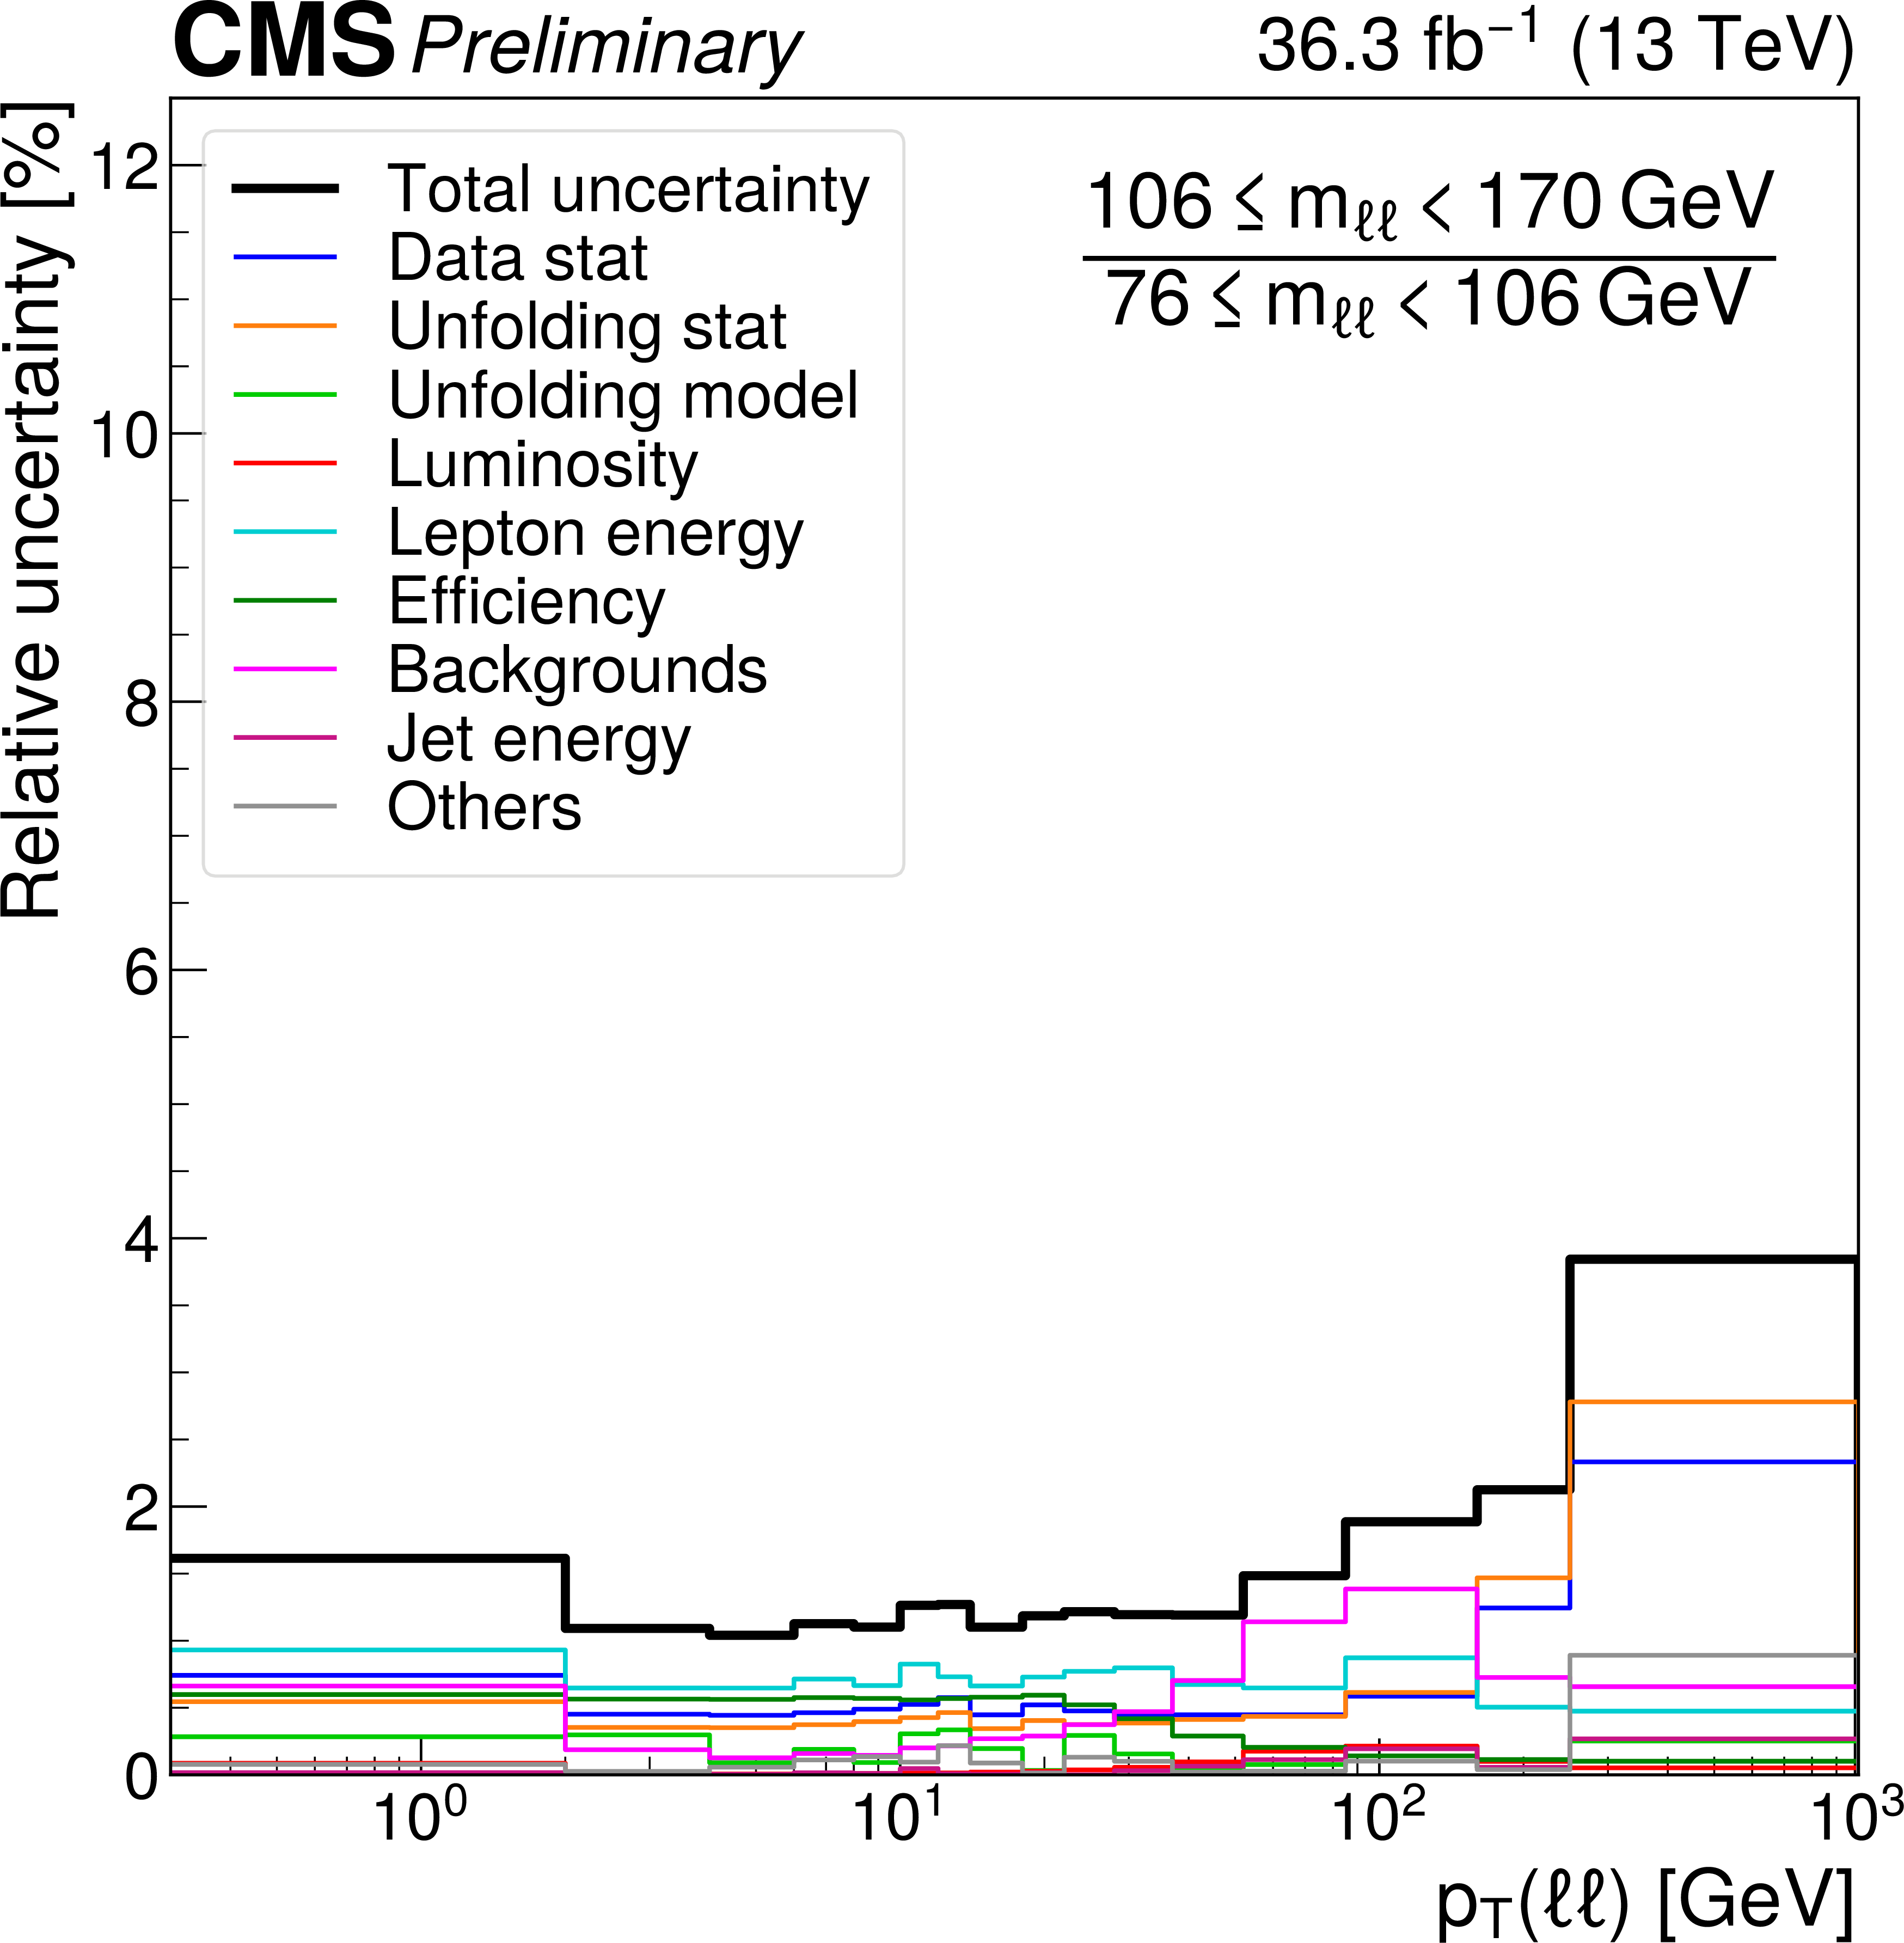
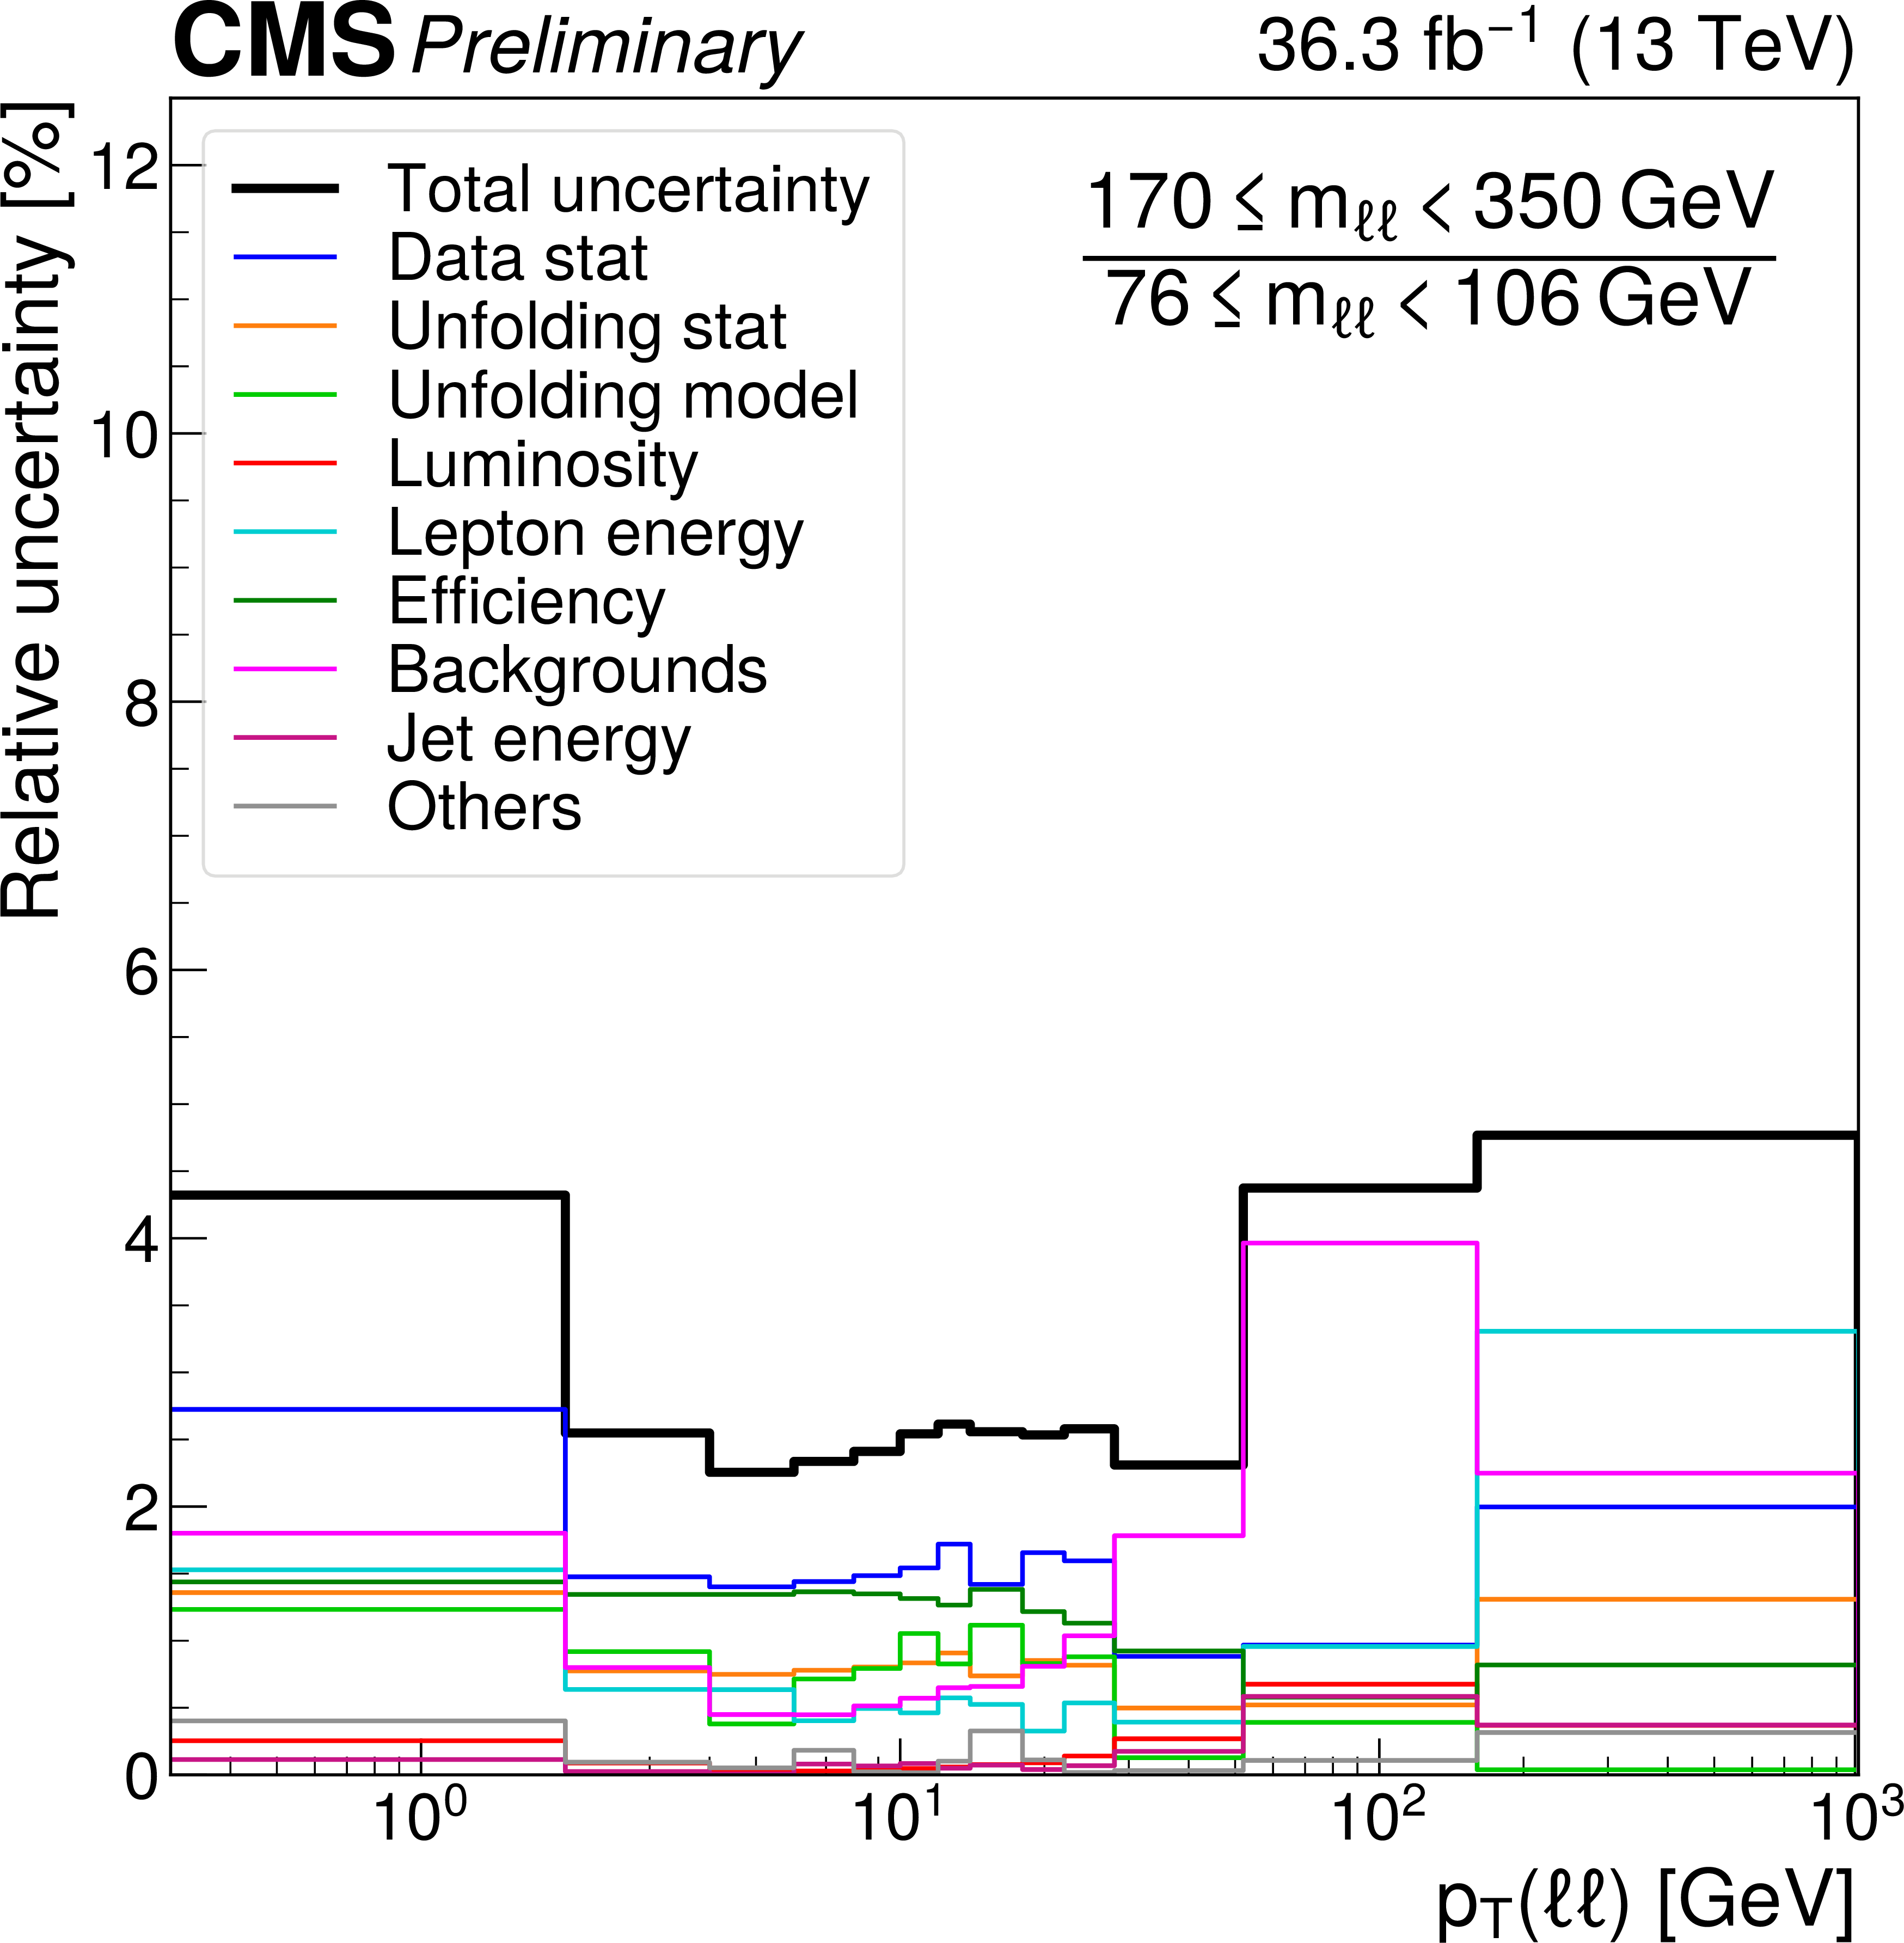
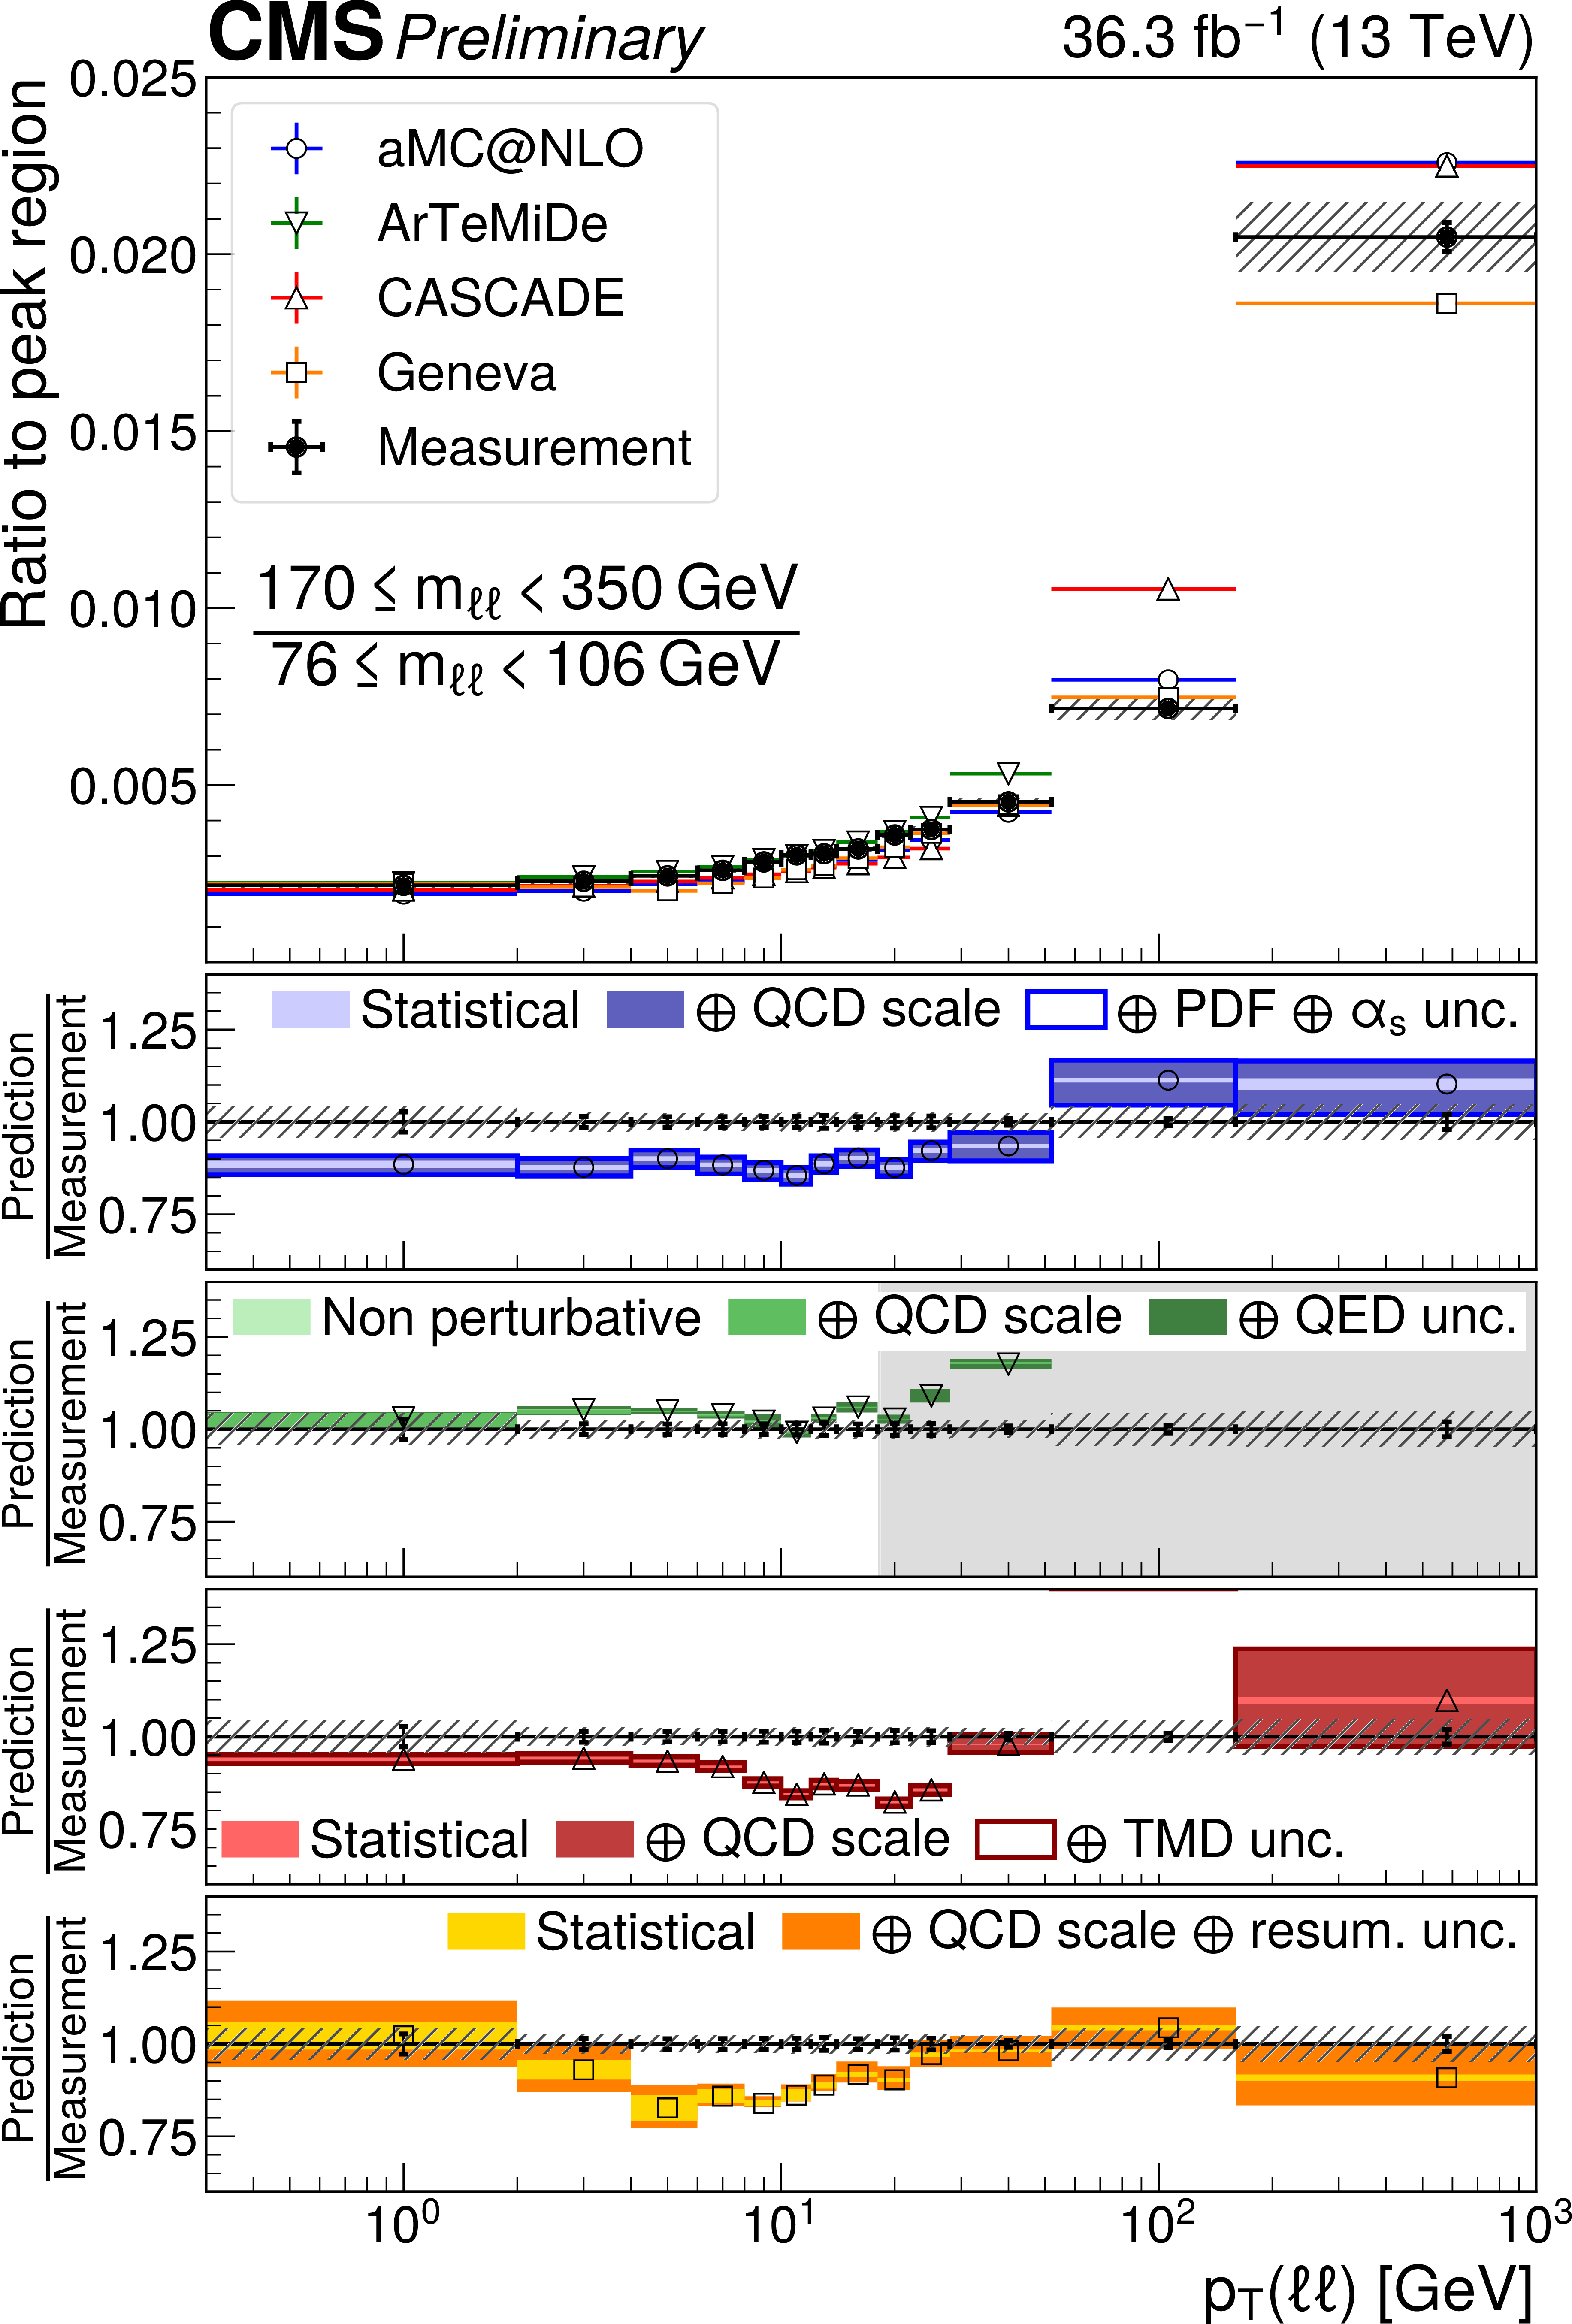
Systematic uncertainty breakdown of differential cross section ratios in ${{p_{\mathrm {T}}} (\ell \ell)}$ for invariant mass ranges with respect to the peak region 76 $ < {m_{\ell \ell}} < $ 106 GeV: 50 $ < {m_{\ell \ell}} < $ 76 GeV (top left), 106 $ < {m_{\ell \ell}} < $ 170 GeV (top right), 170 $ < {m_{\ell \ell}} < $ 350 GeV (bottom left), and 350 $ < {m_{\ell \ell}} < $ 1000 GeV (bottom right). The black line is the quadratic sum of the colored lines. |

png pdf |
Figure 4-a:
Systematic uncertainty breakdown of differential cross section ratios in ${{p_{\mathrm {T}}} (\ell \ell)}$ for invariant mass ranges with respect to the peak region 76 $ < {m_{\ell \ell}} < $ 106 GeV: 50 $ < {m_{\ell \ell}} < $ 76 GeV (top left), 106 $ < {m_{\ell \ell}} < $ 170 GeV (top right), 170 $ < {m_{\ell \ell}} < $ 350 GeV (bottom left), and 350 $ < {m_{\ell \ell}} < $ 1000 GeV (bottom right). The black line is the quadratic sum of the colored lines. |
png pdf |
Figure 4-b:
Systematic uncertainty breakdown of differential cross section ratios in ${{p_{\mathrm {T}}} (\ell \ell)}$ for invariant mass ranges with respect to the peak region 76 $ < {m_{\ell \ell}} < $ 106 GeV: 50 $ < {m_{\ell \ell}} < $ 76 GeV (top left), 106 $ < {m_{\ell \ell}} < $ 170 GeV (top right), 170 $ < {m_{\ell \ell}} < $ 350 GeV (bottom left), and 350 $ < {m_{\ell \ell}} < $ 1000 GeV (bottom right). The black line is the quadratic sum of the colored lines. |
png pdf |
Figure 4-c:
Systematic uncertainty breakdown of differential cross section ratios in ${{p_{\mathrm {T}}} (\ell \ell)}$ for invariant mass ranges with respect to the peak region 76 $ < {m_{\ell \ell}} < $ 106 GeV: 50 $ < {m_{\ell \ell}} < $ 76 GeV (top left), 106 $ < {m_{\ell \ell}} < $ 170 GeV (top right), 170 $ < {m_{\ell \ell}} < $ 350 GeV (bottom left), and 350 $ < {m_{\ell \ell}} < $ 1000 GeV (bottom right). The black line is the quadratic sum of the colored lines. |

png pdf |
Figure 4-d:
Systematic uncertainty breakdown of differential cross section ratios in ${{p_{\mathrm {T}}} (\ell \ell)}$ for invariant mass ranges with respect to the peak region 76 $ < {m_{\ell \ell}} < $ 106 GeV: 50 $ < {m_{\ell \ell}} < $ 76 GeV (top left), 106 $ < {m_{\ell \ell}} < $ 170 GeV (top right), 170 $ < {m_{\ell \ell}} < $ 350 GeV (bottom left), and 350 $ < {m_{\ell \ell}} < $ 1000 GeV (bottom right). The black line is the quadratic sum of the colored lines. |
png pdf |
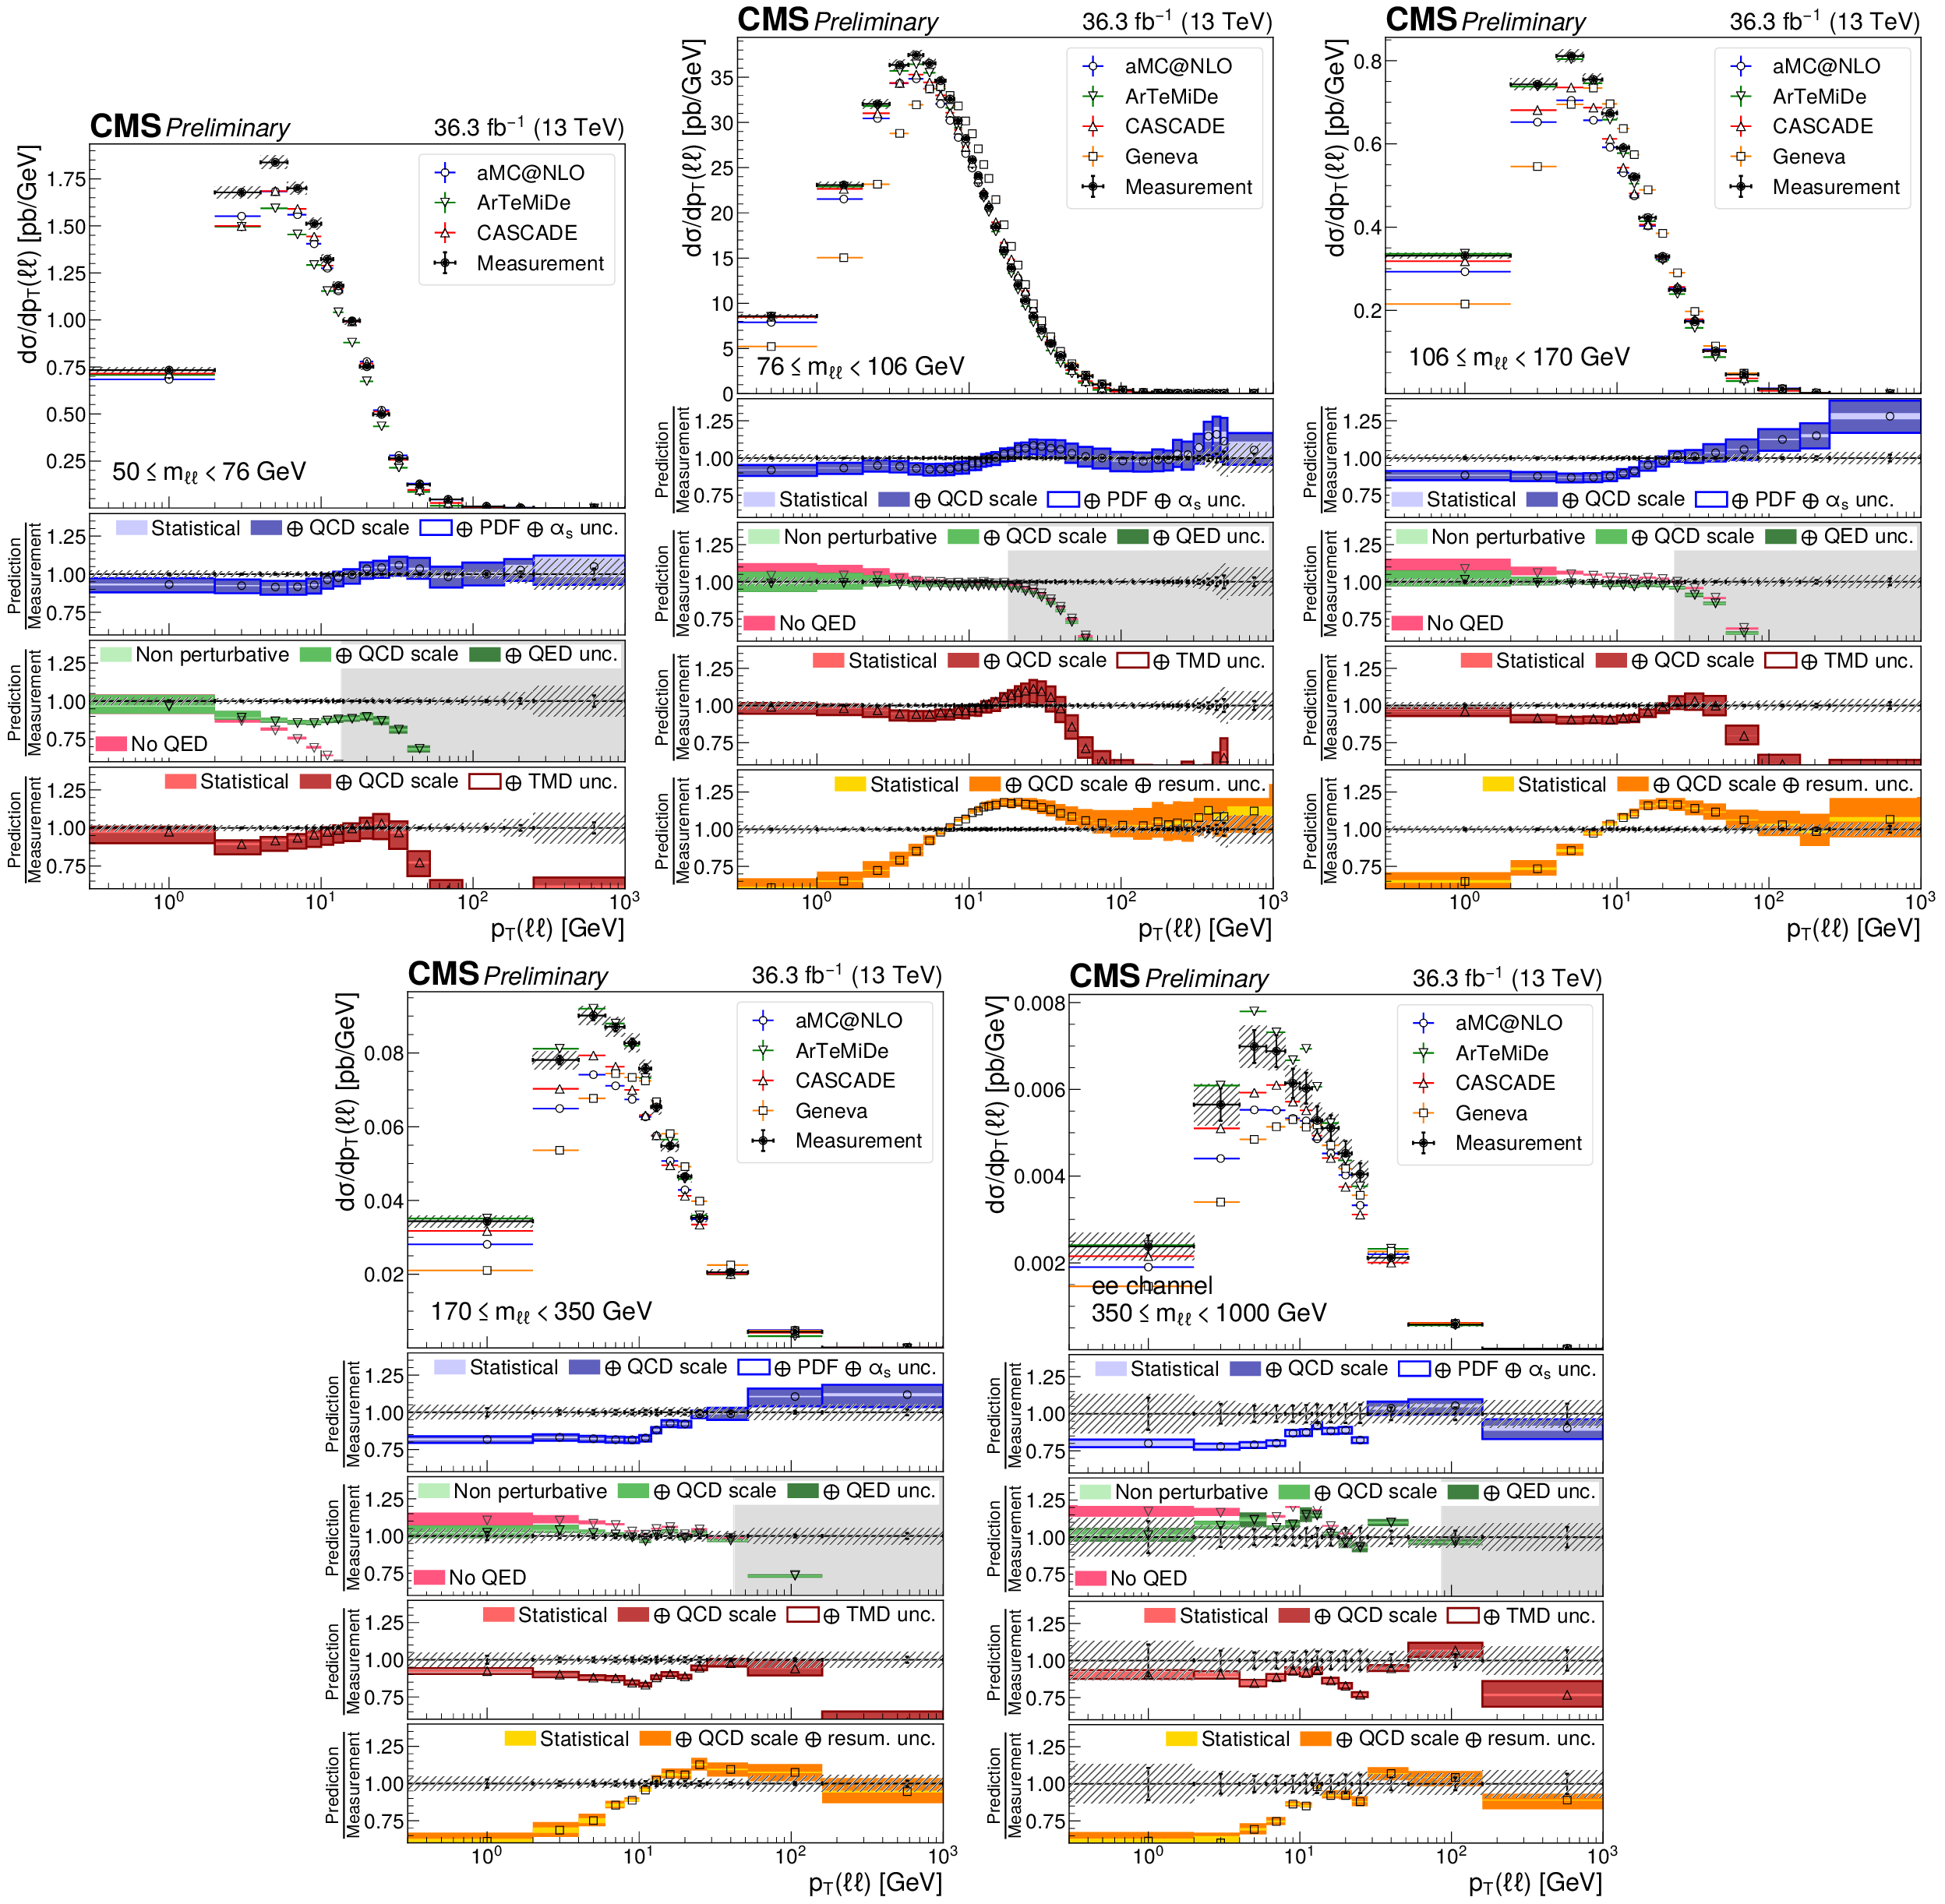
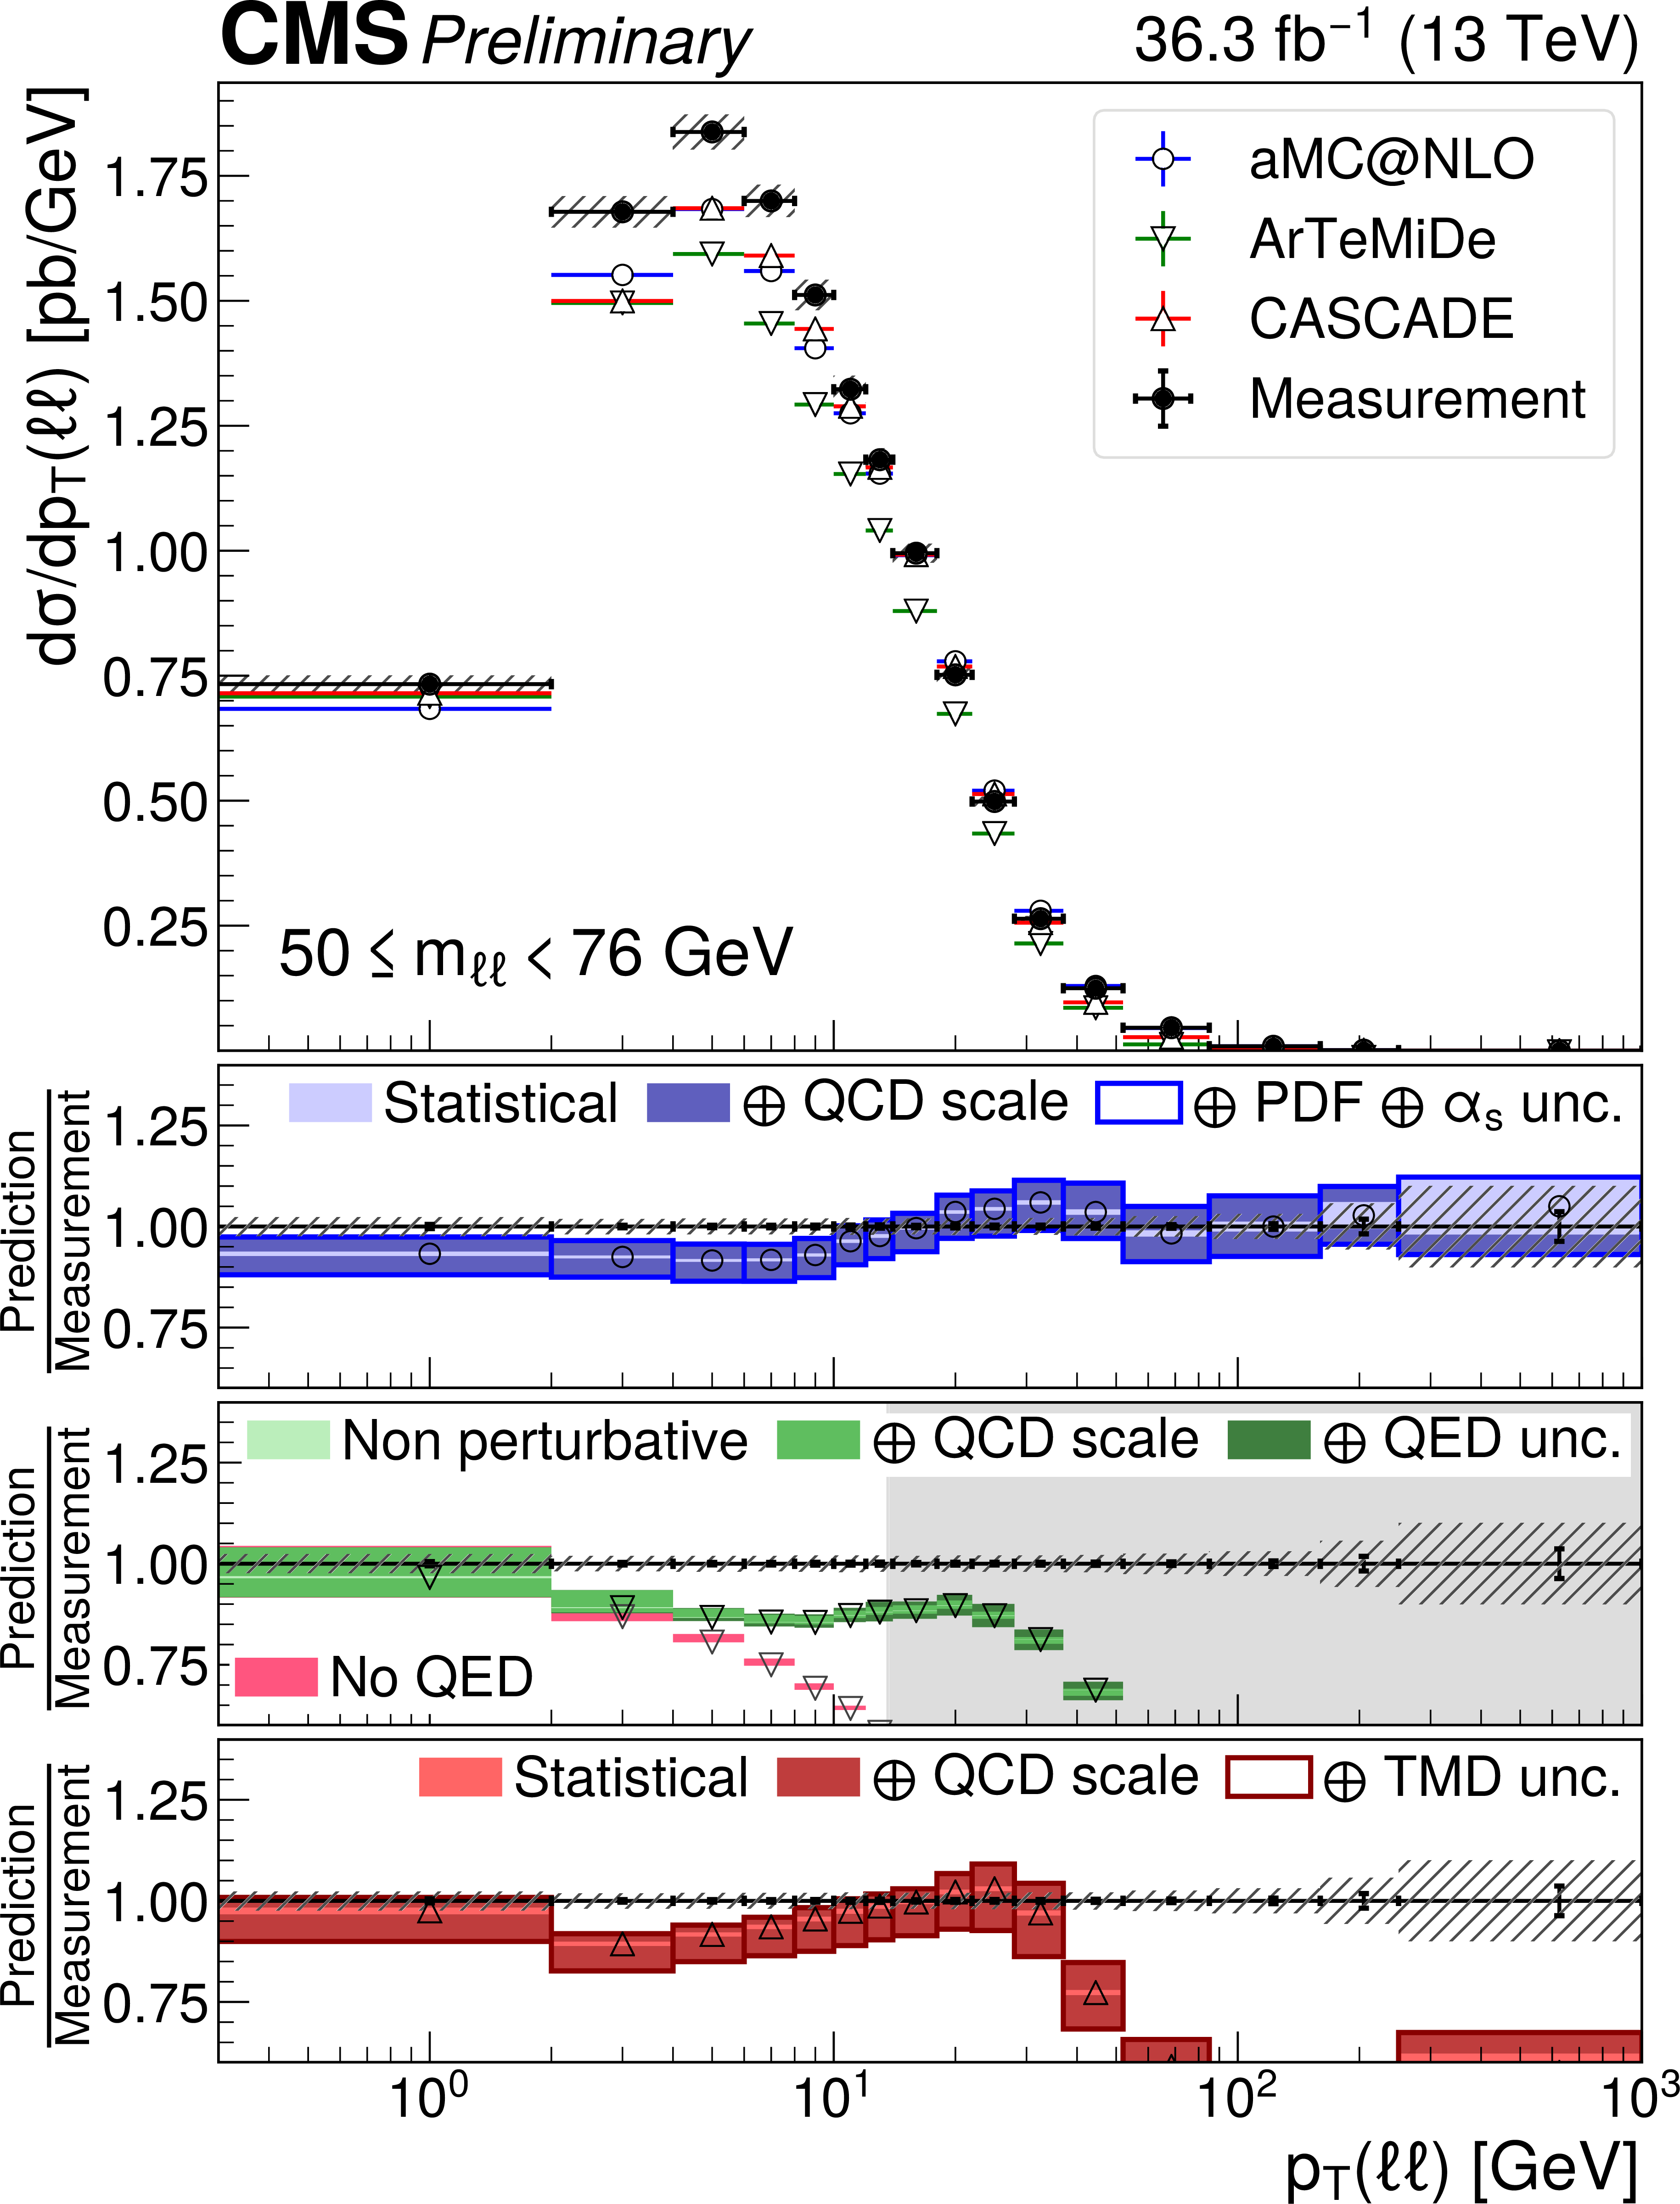
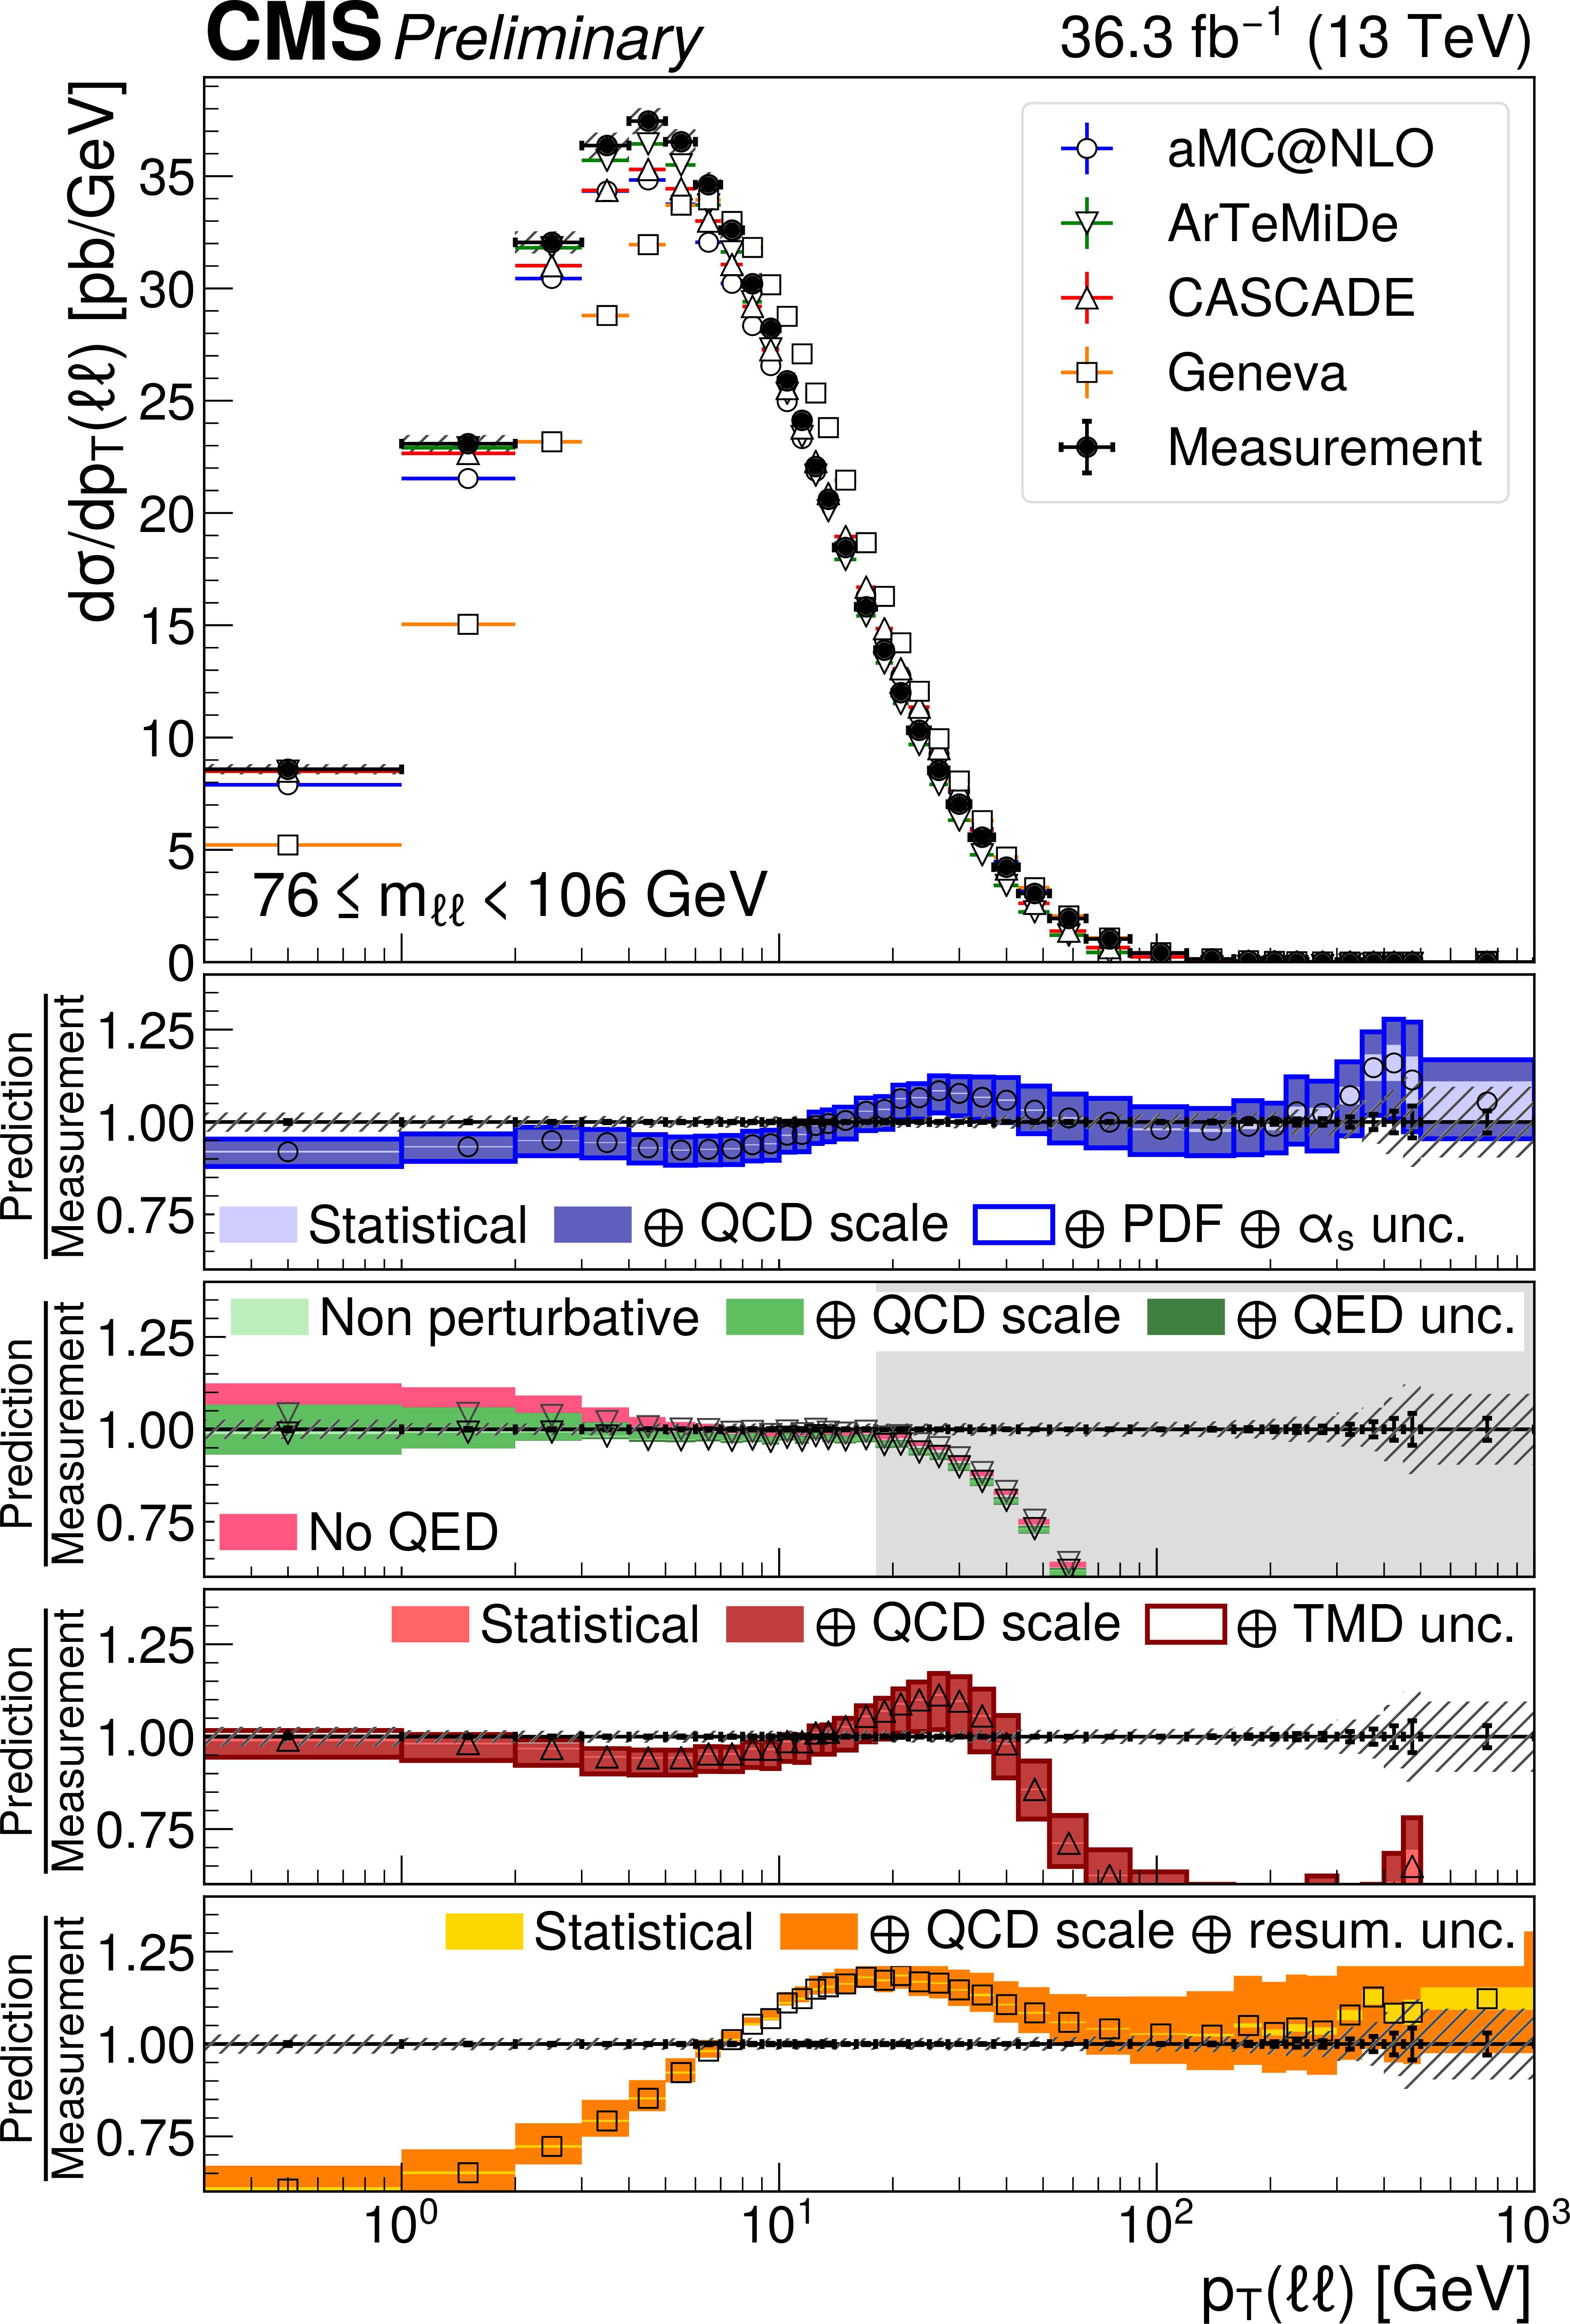
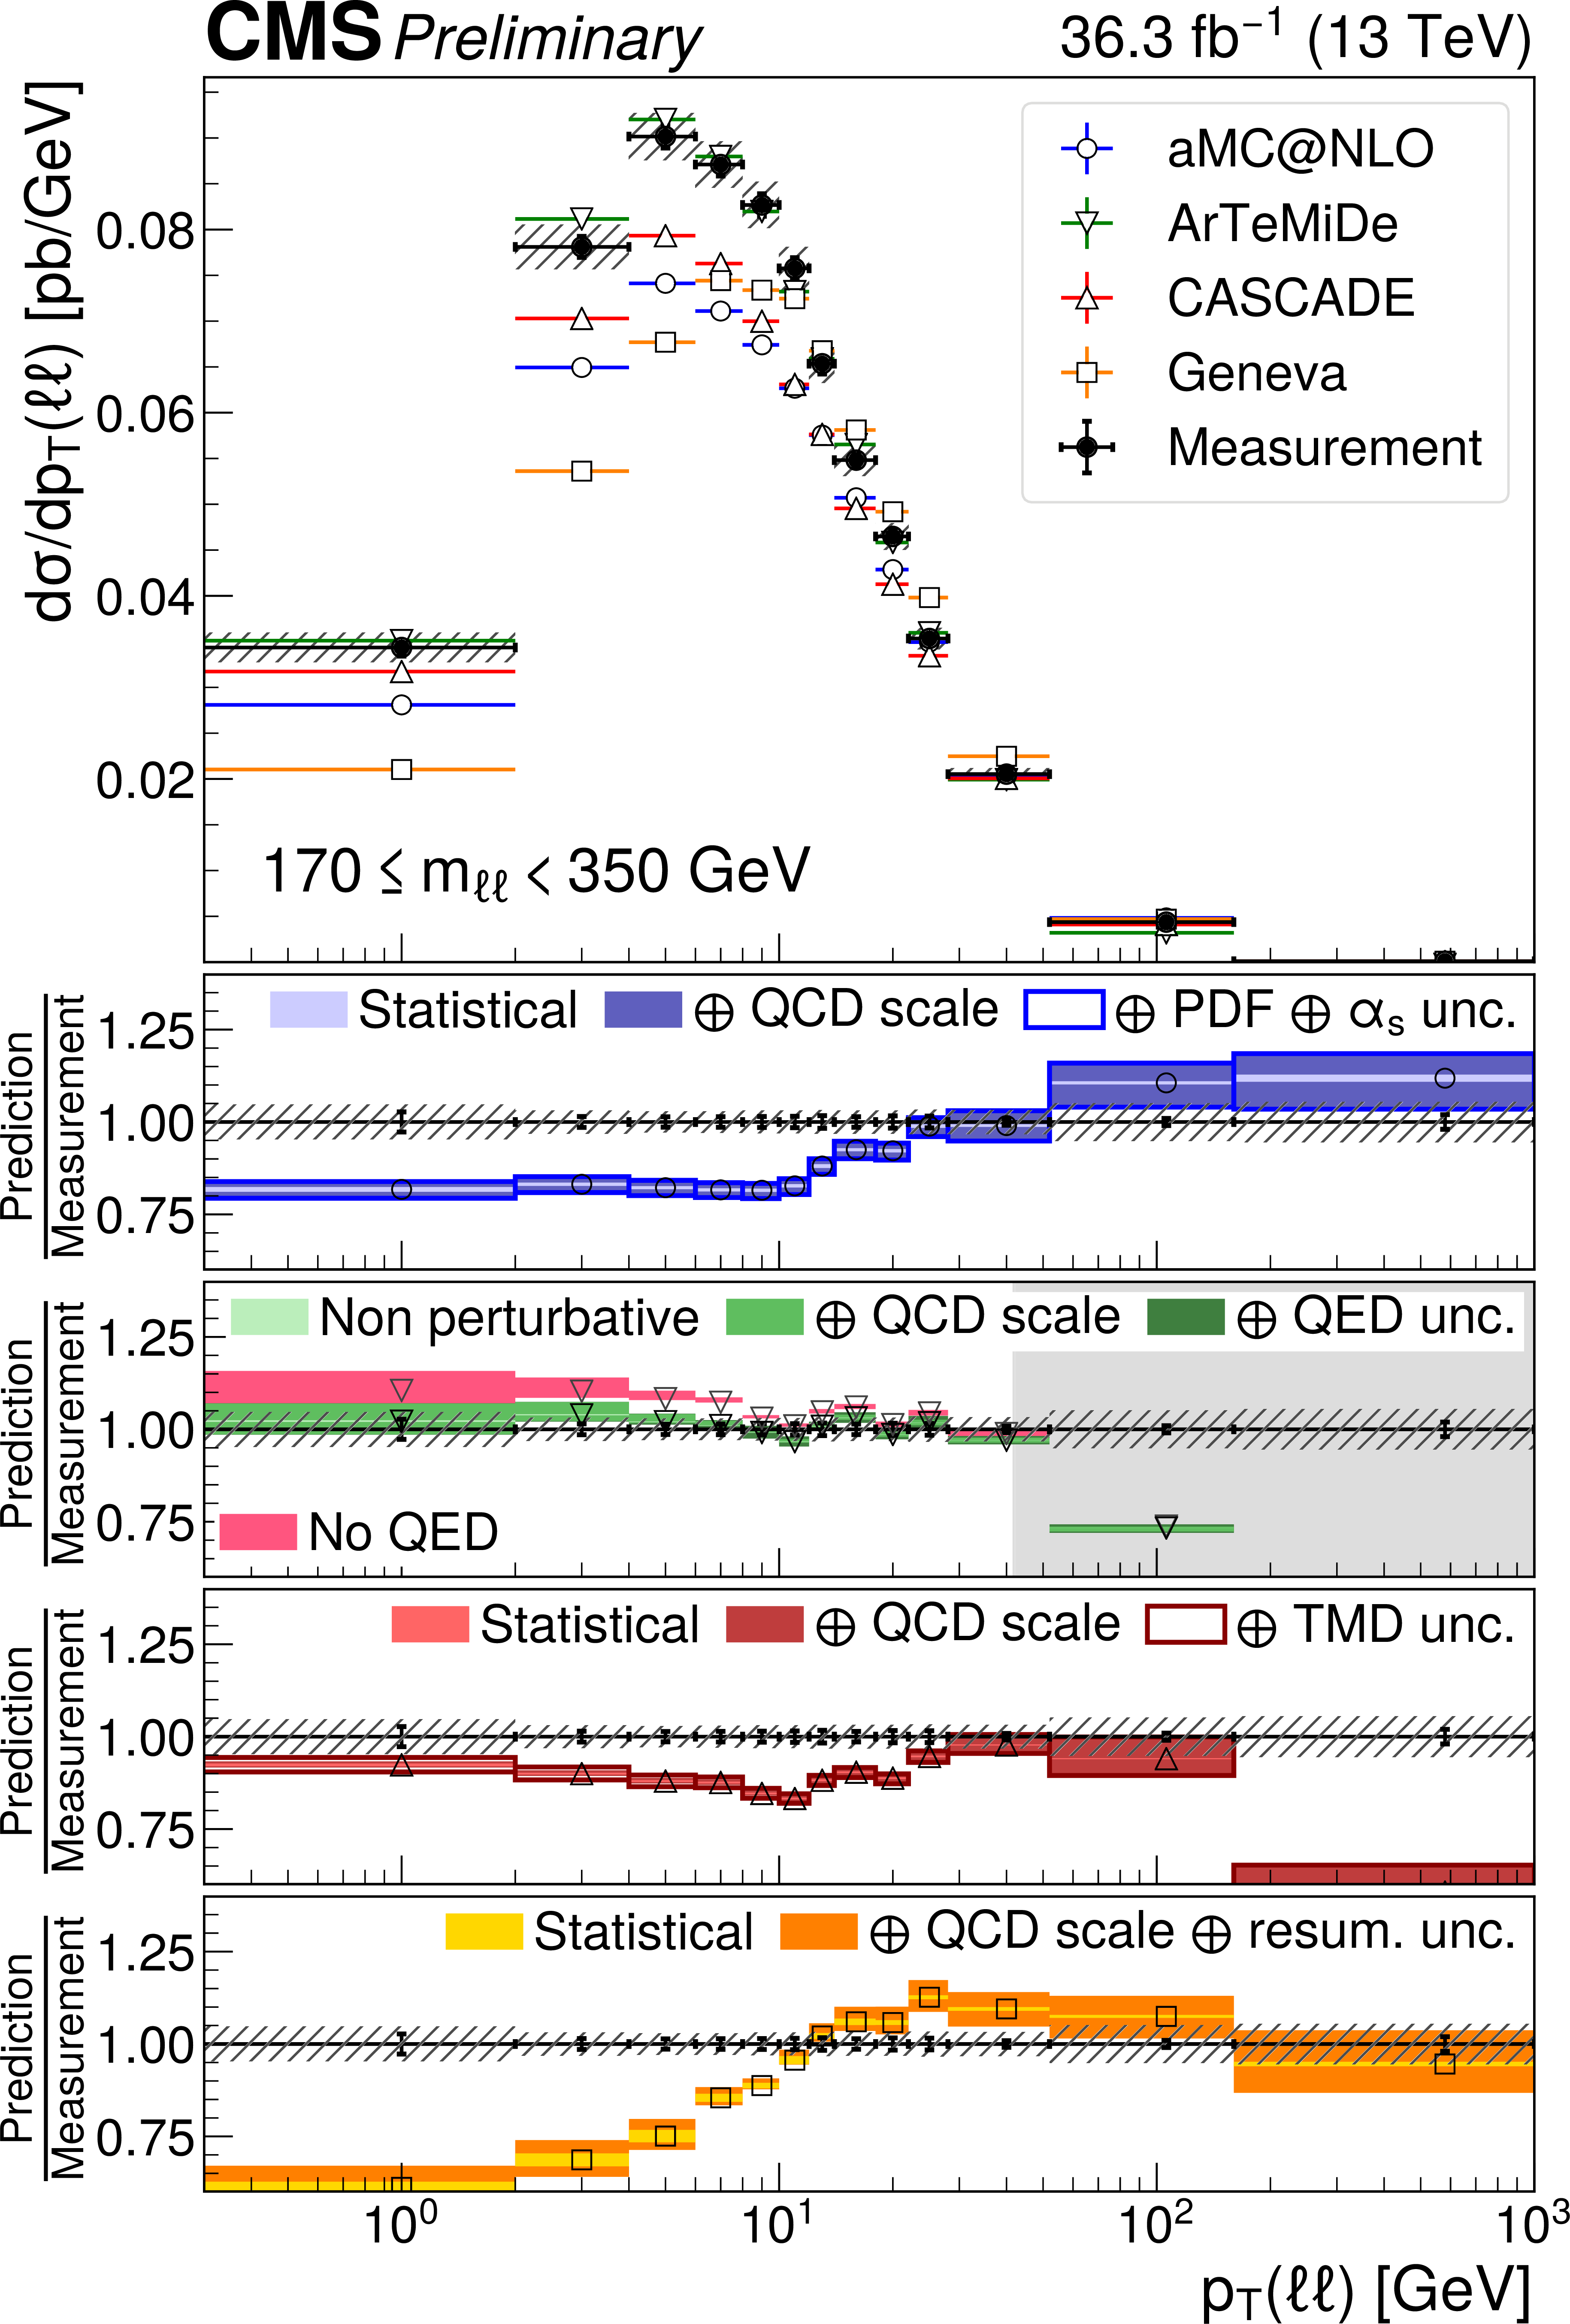
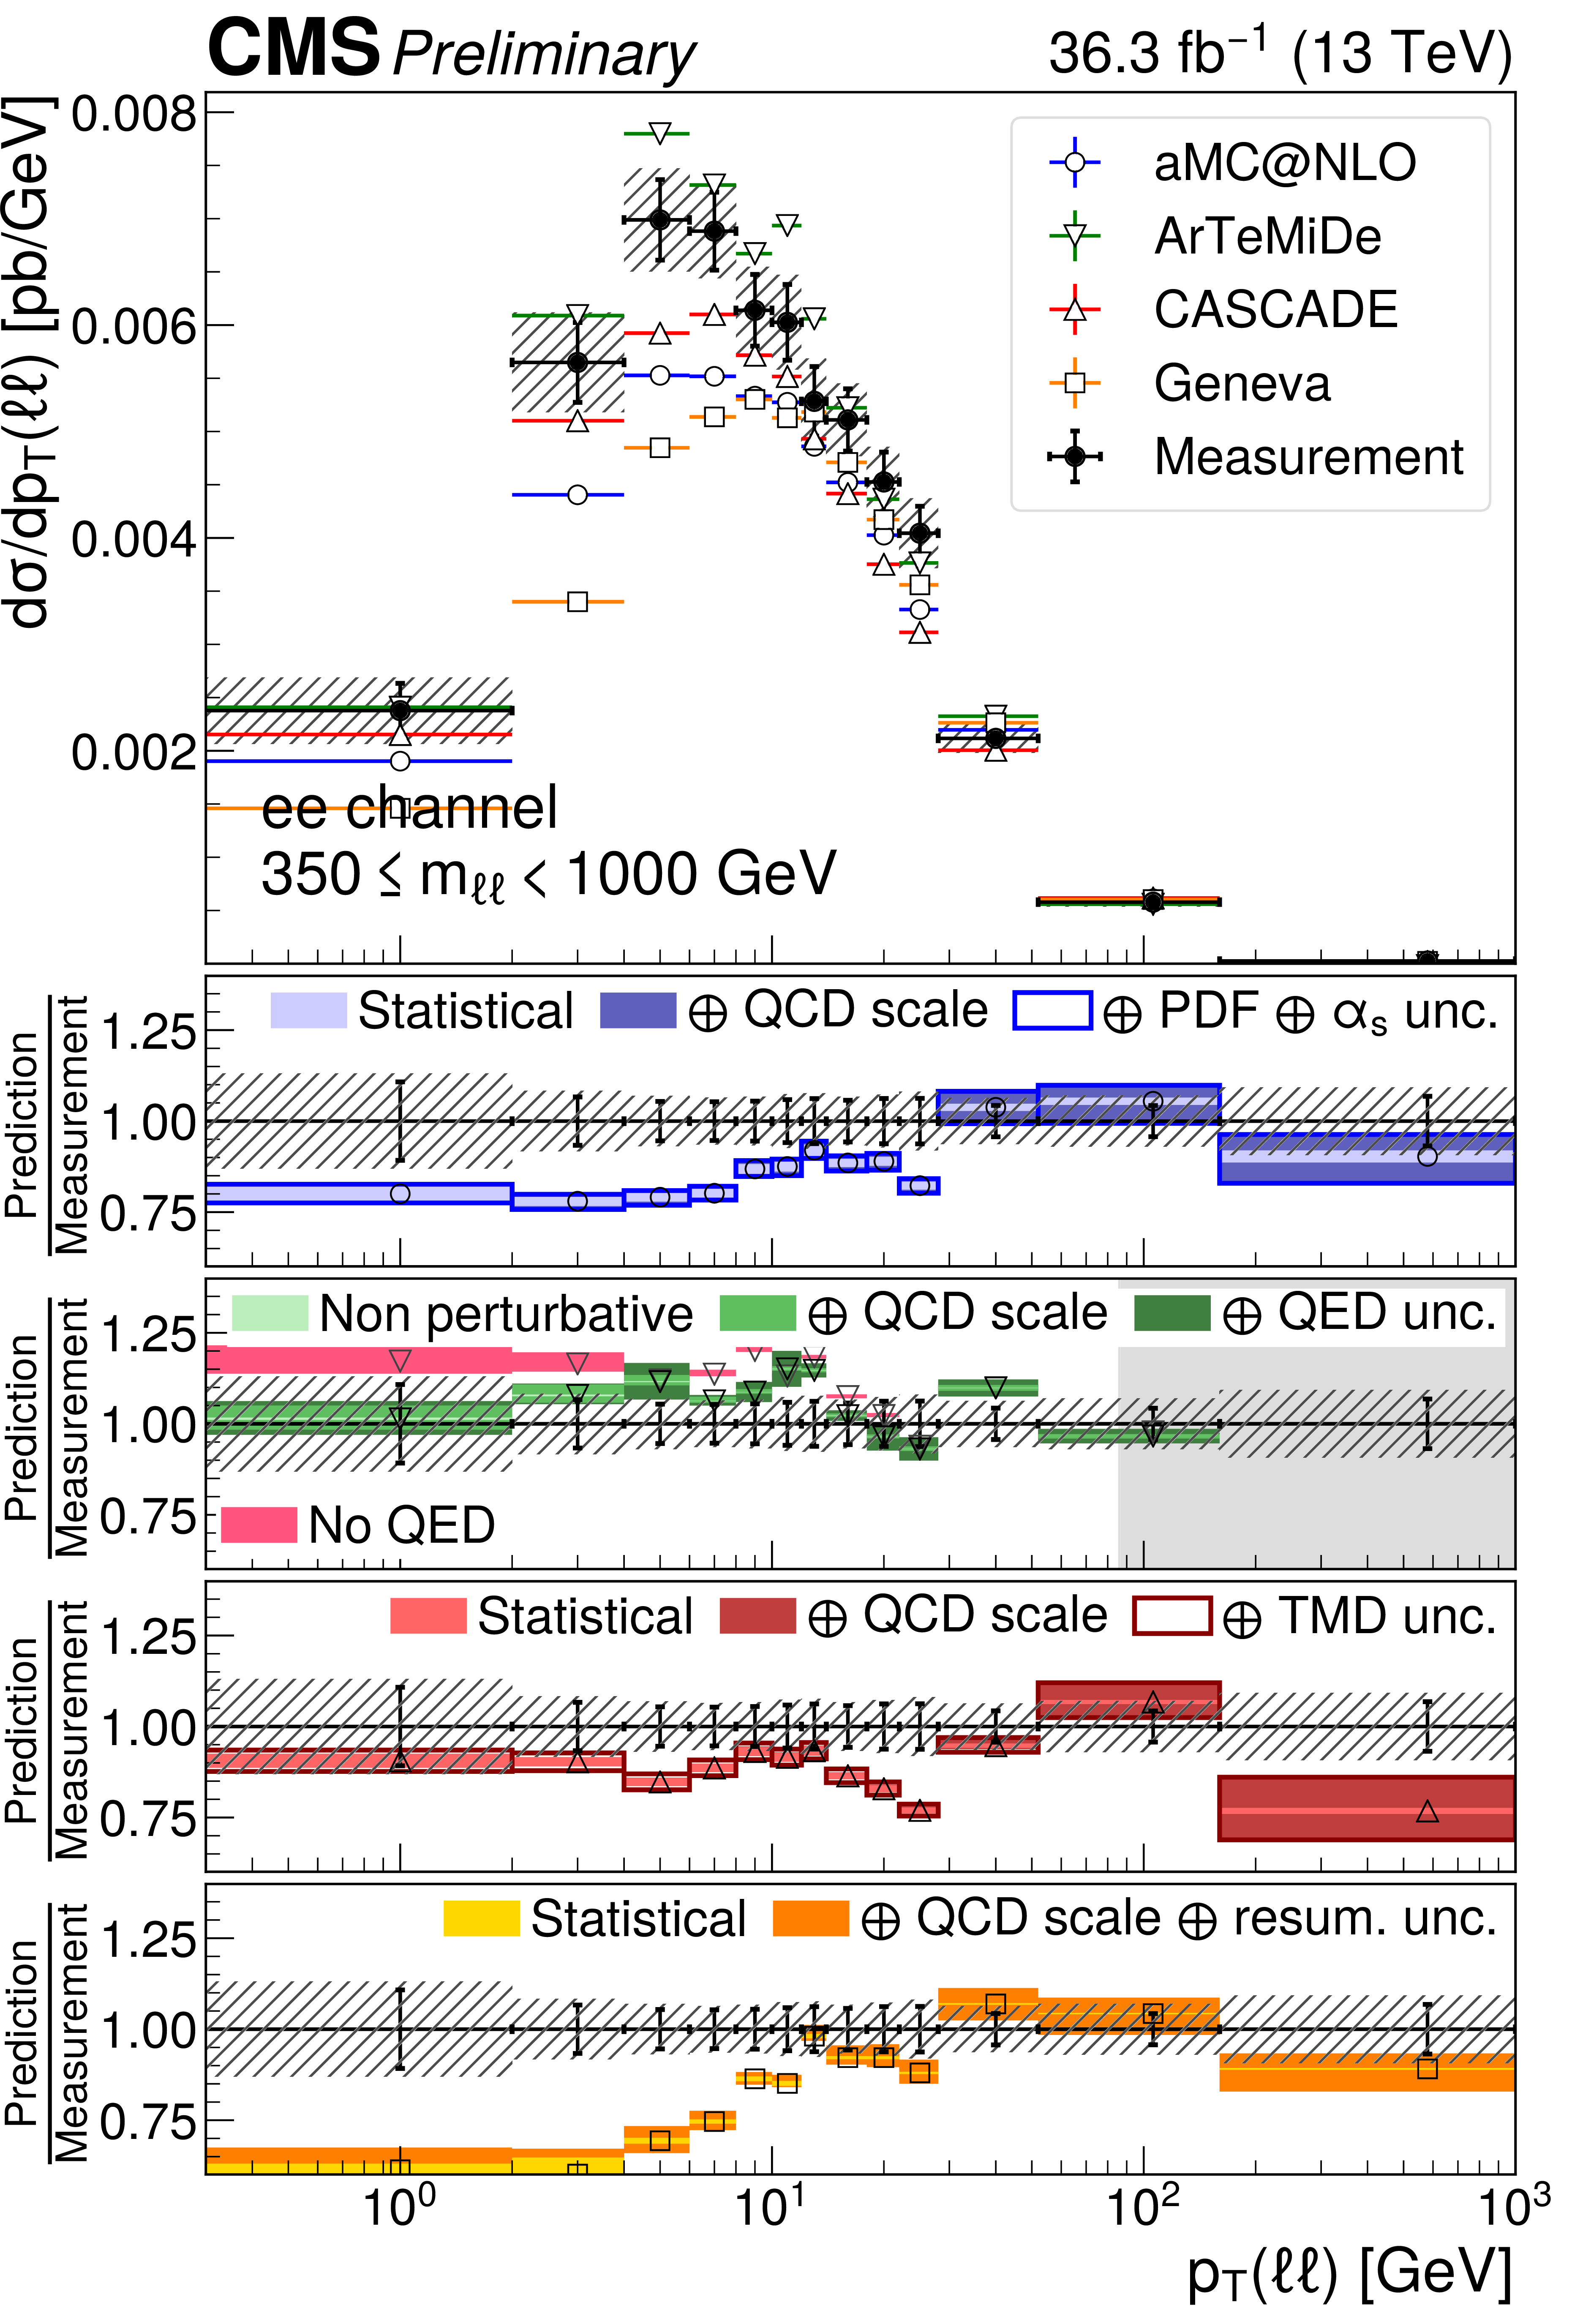
Figure 5:
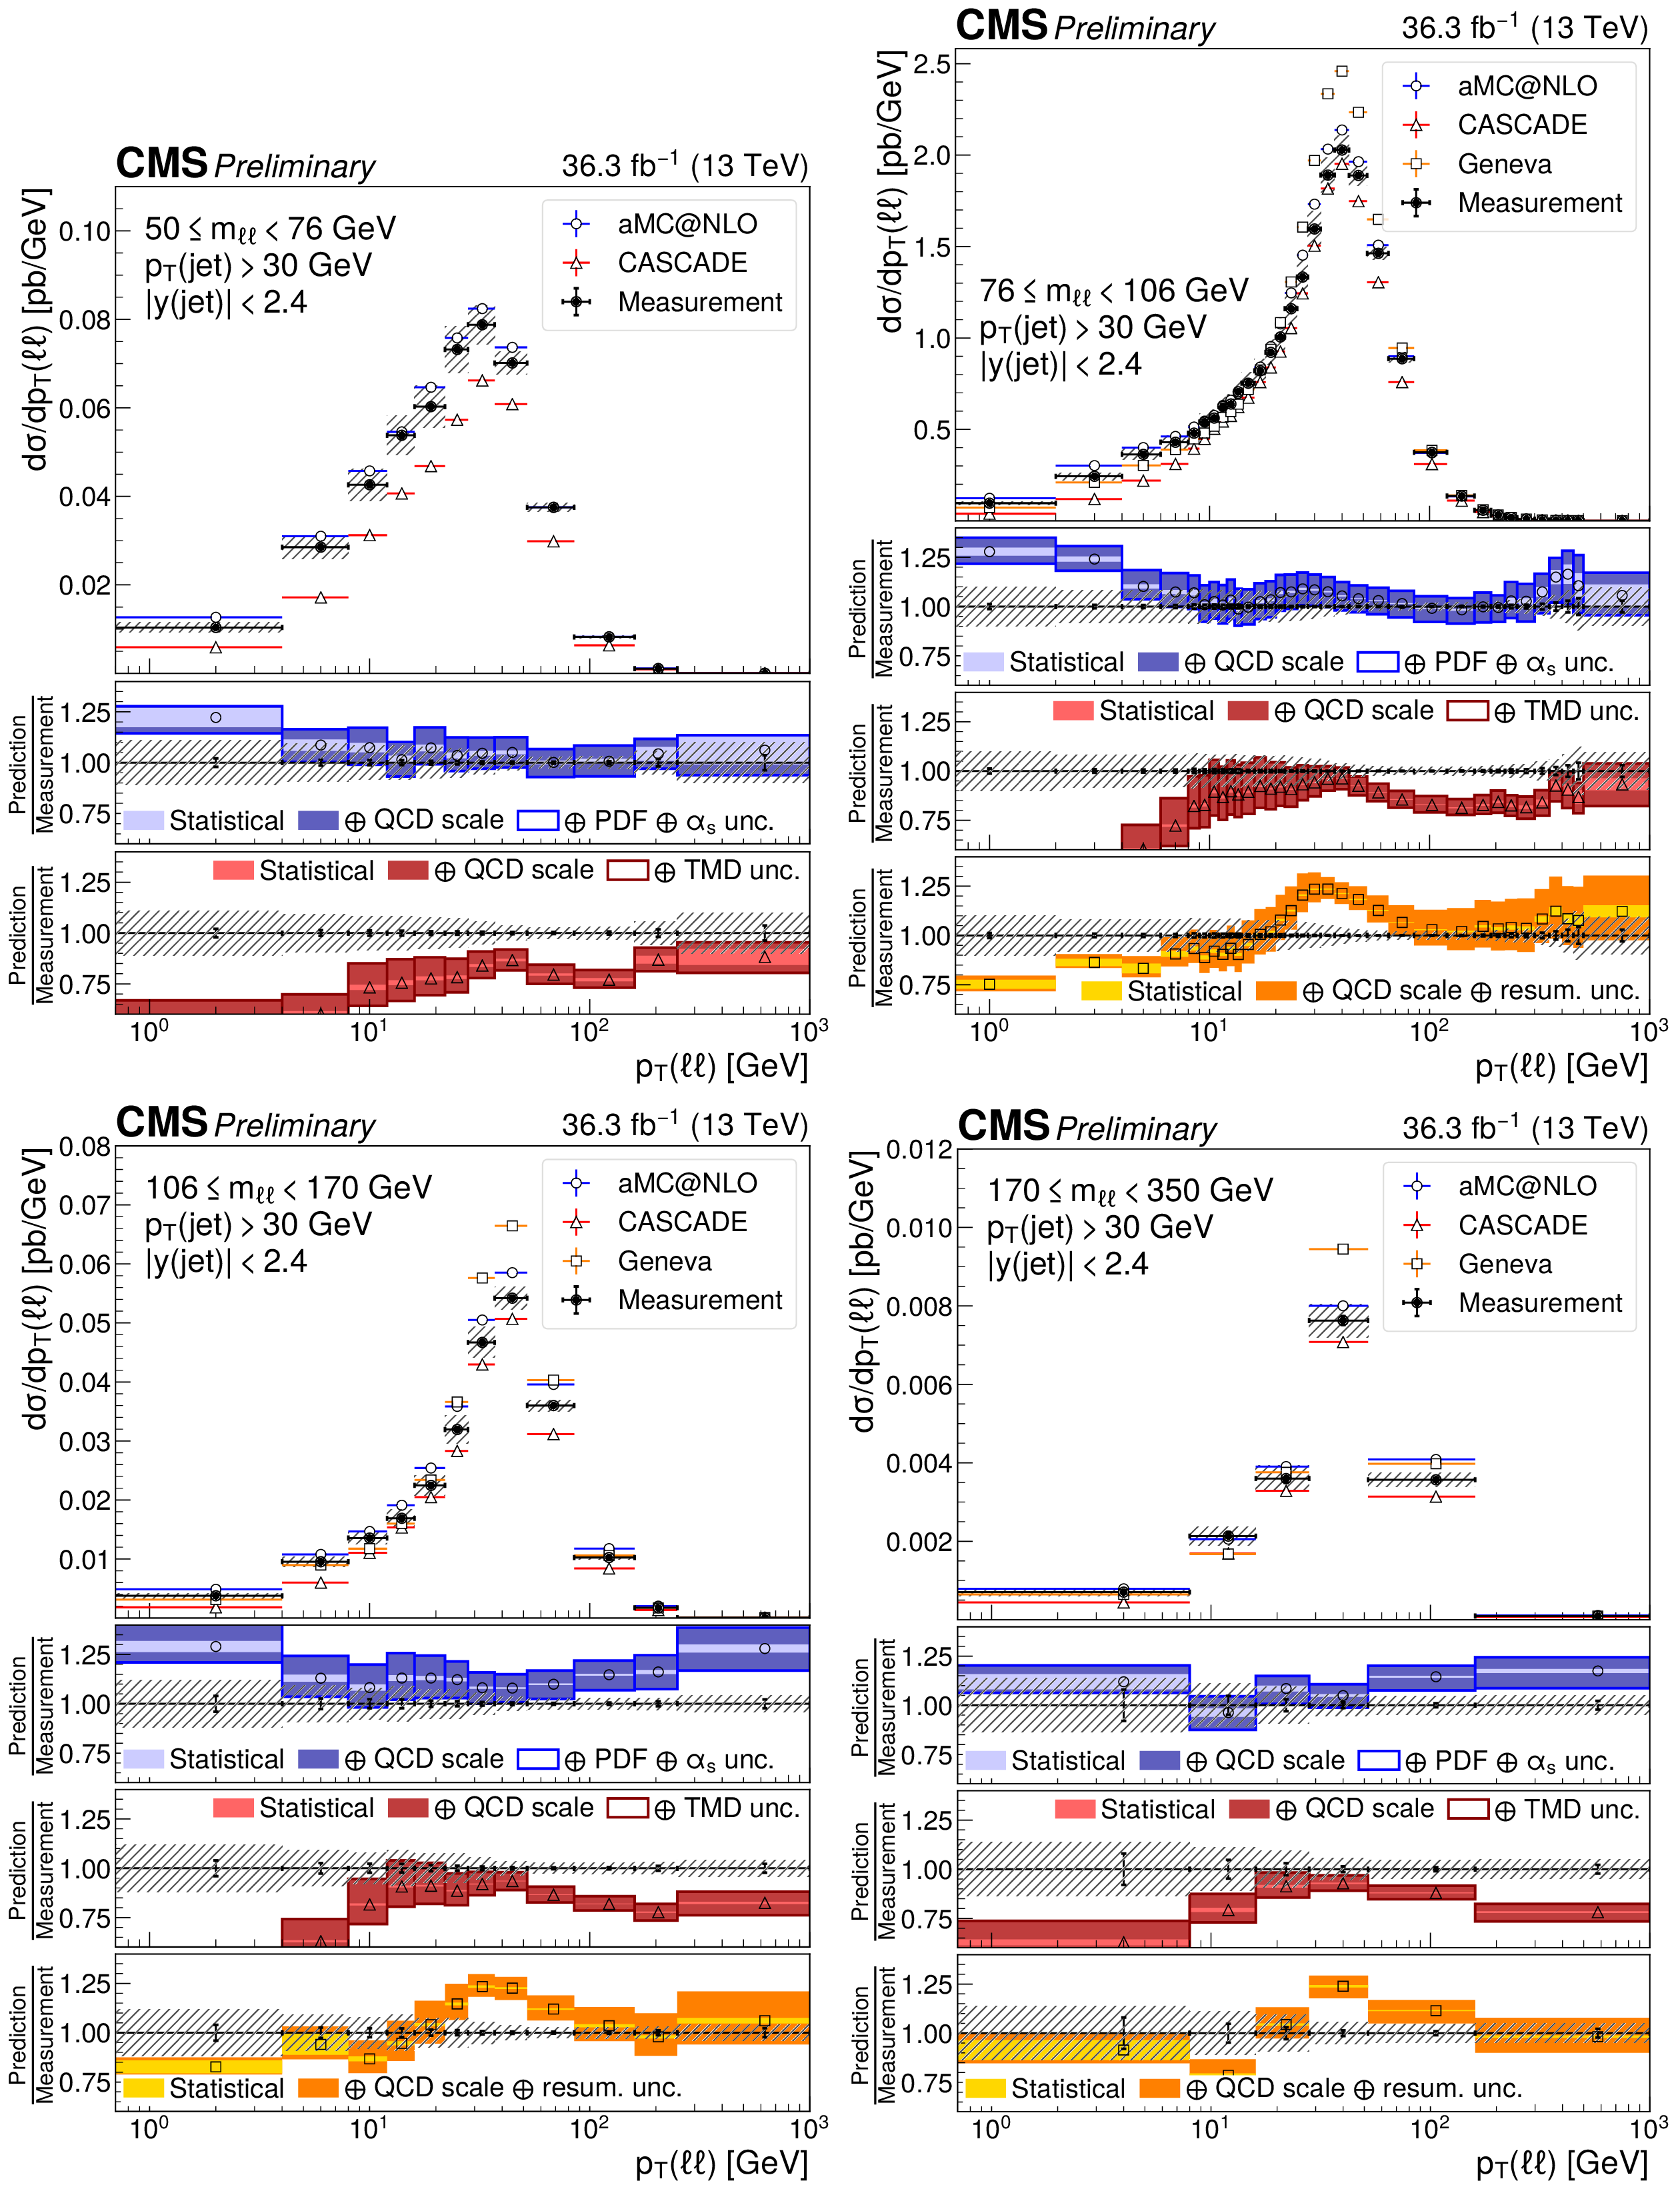
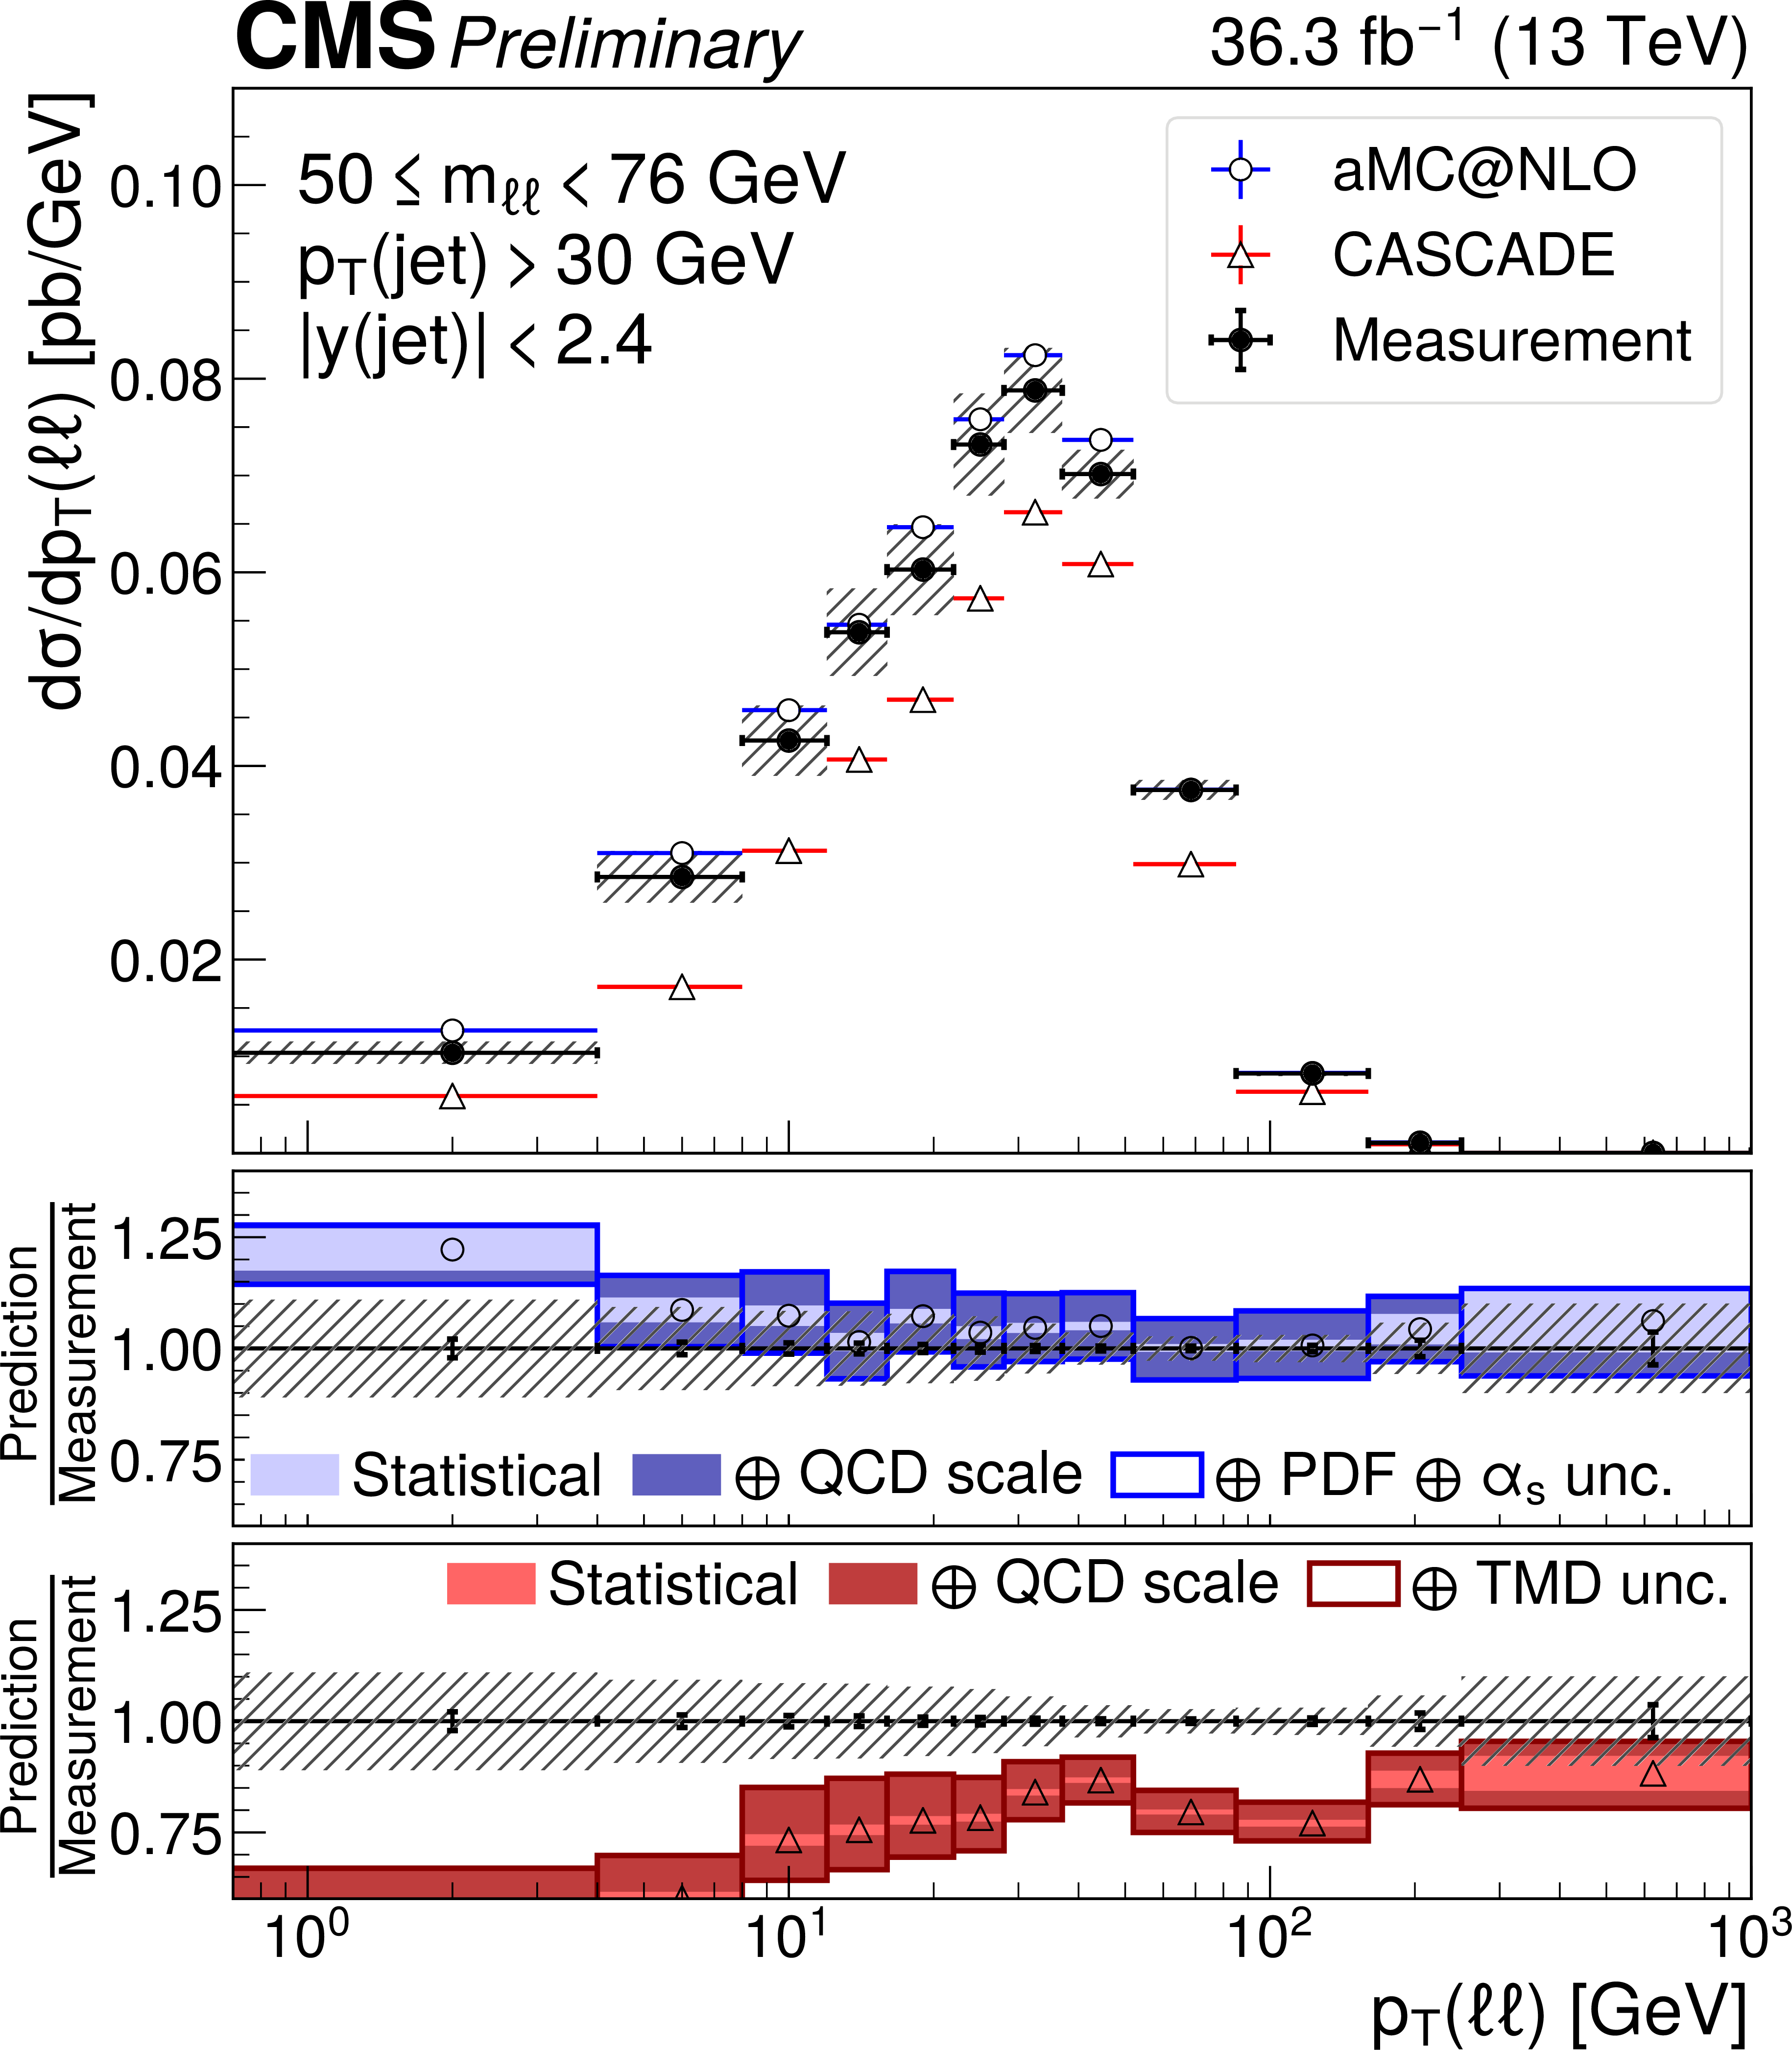
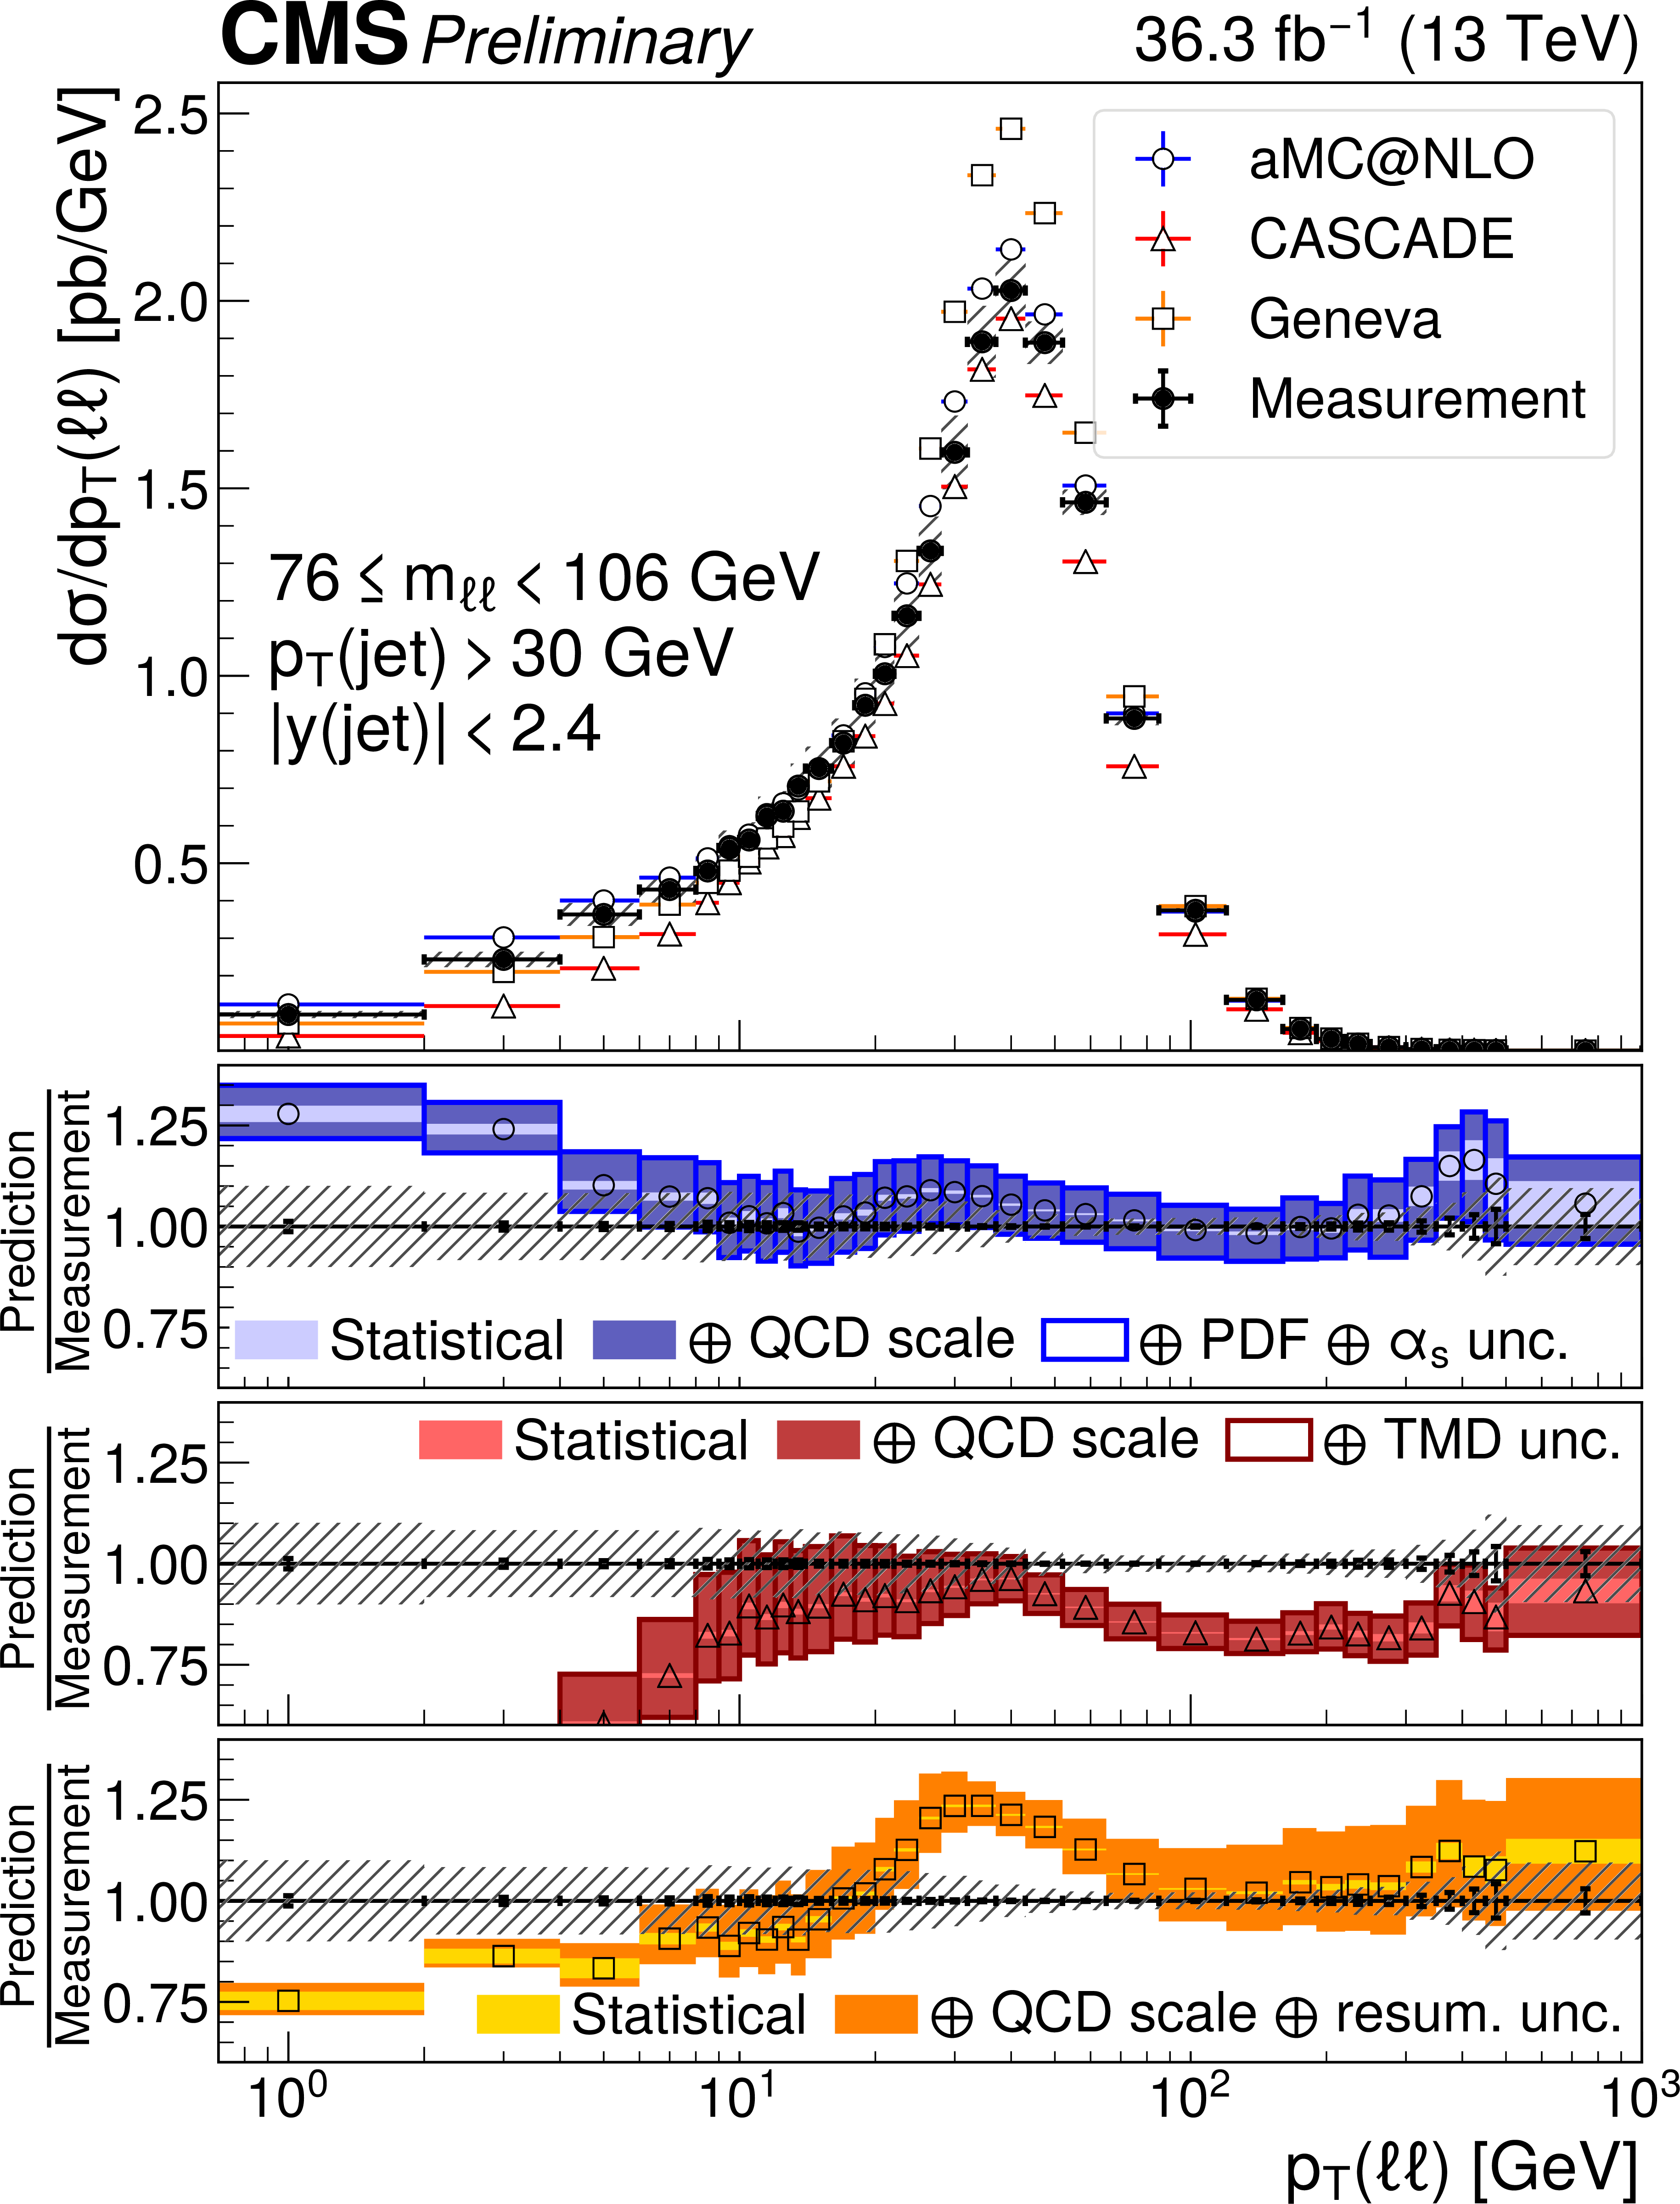
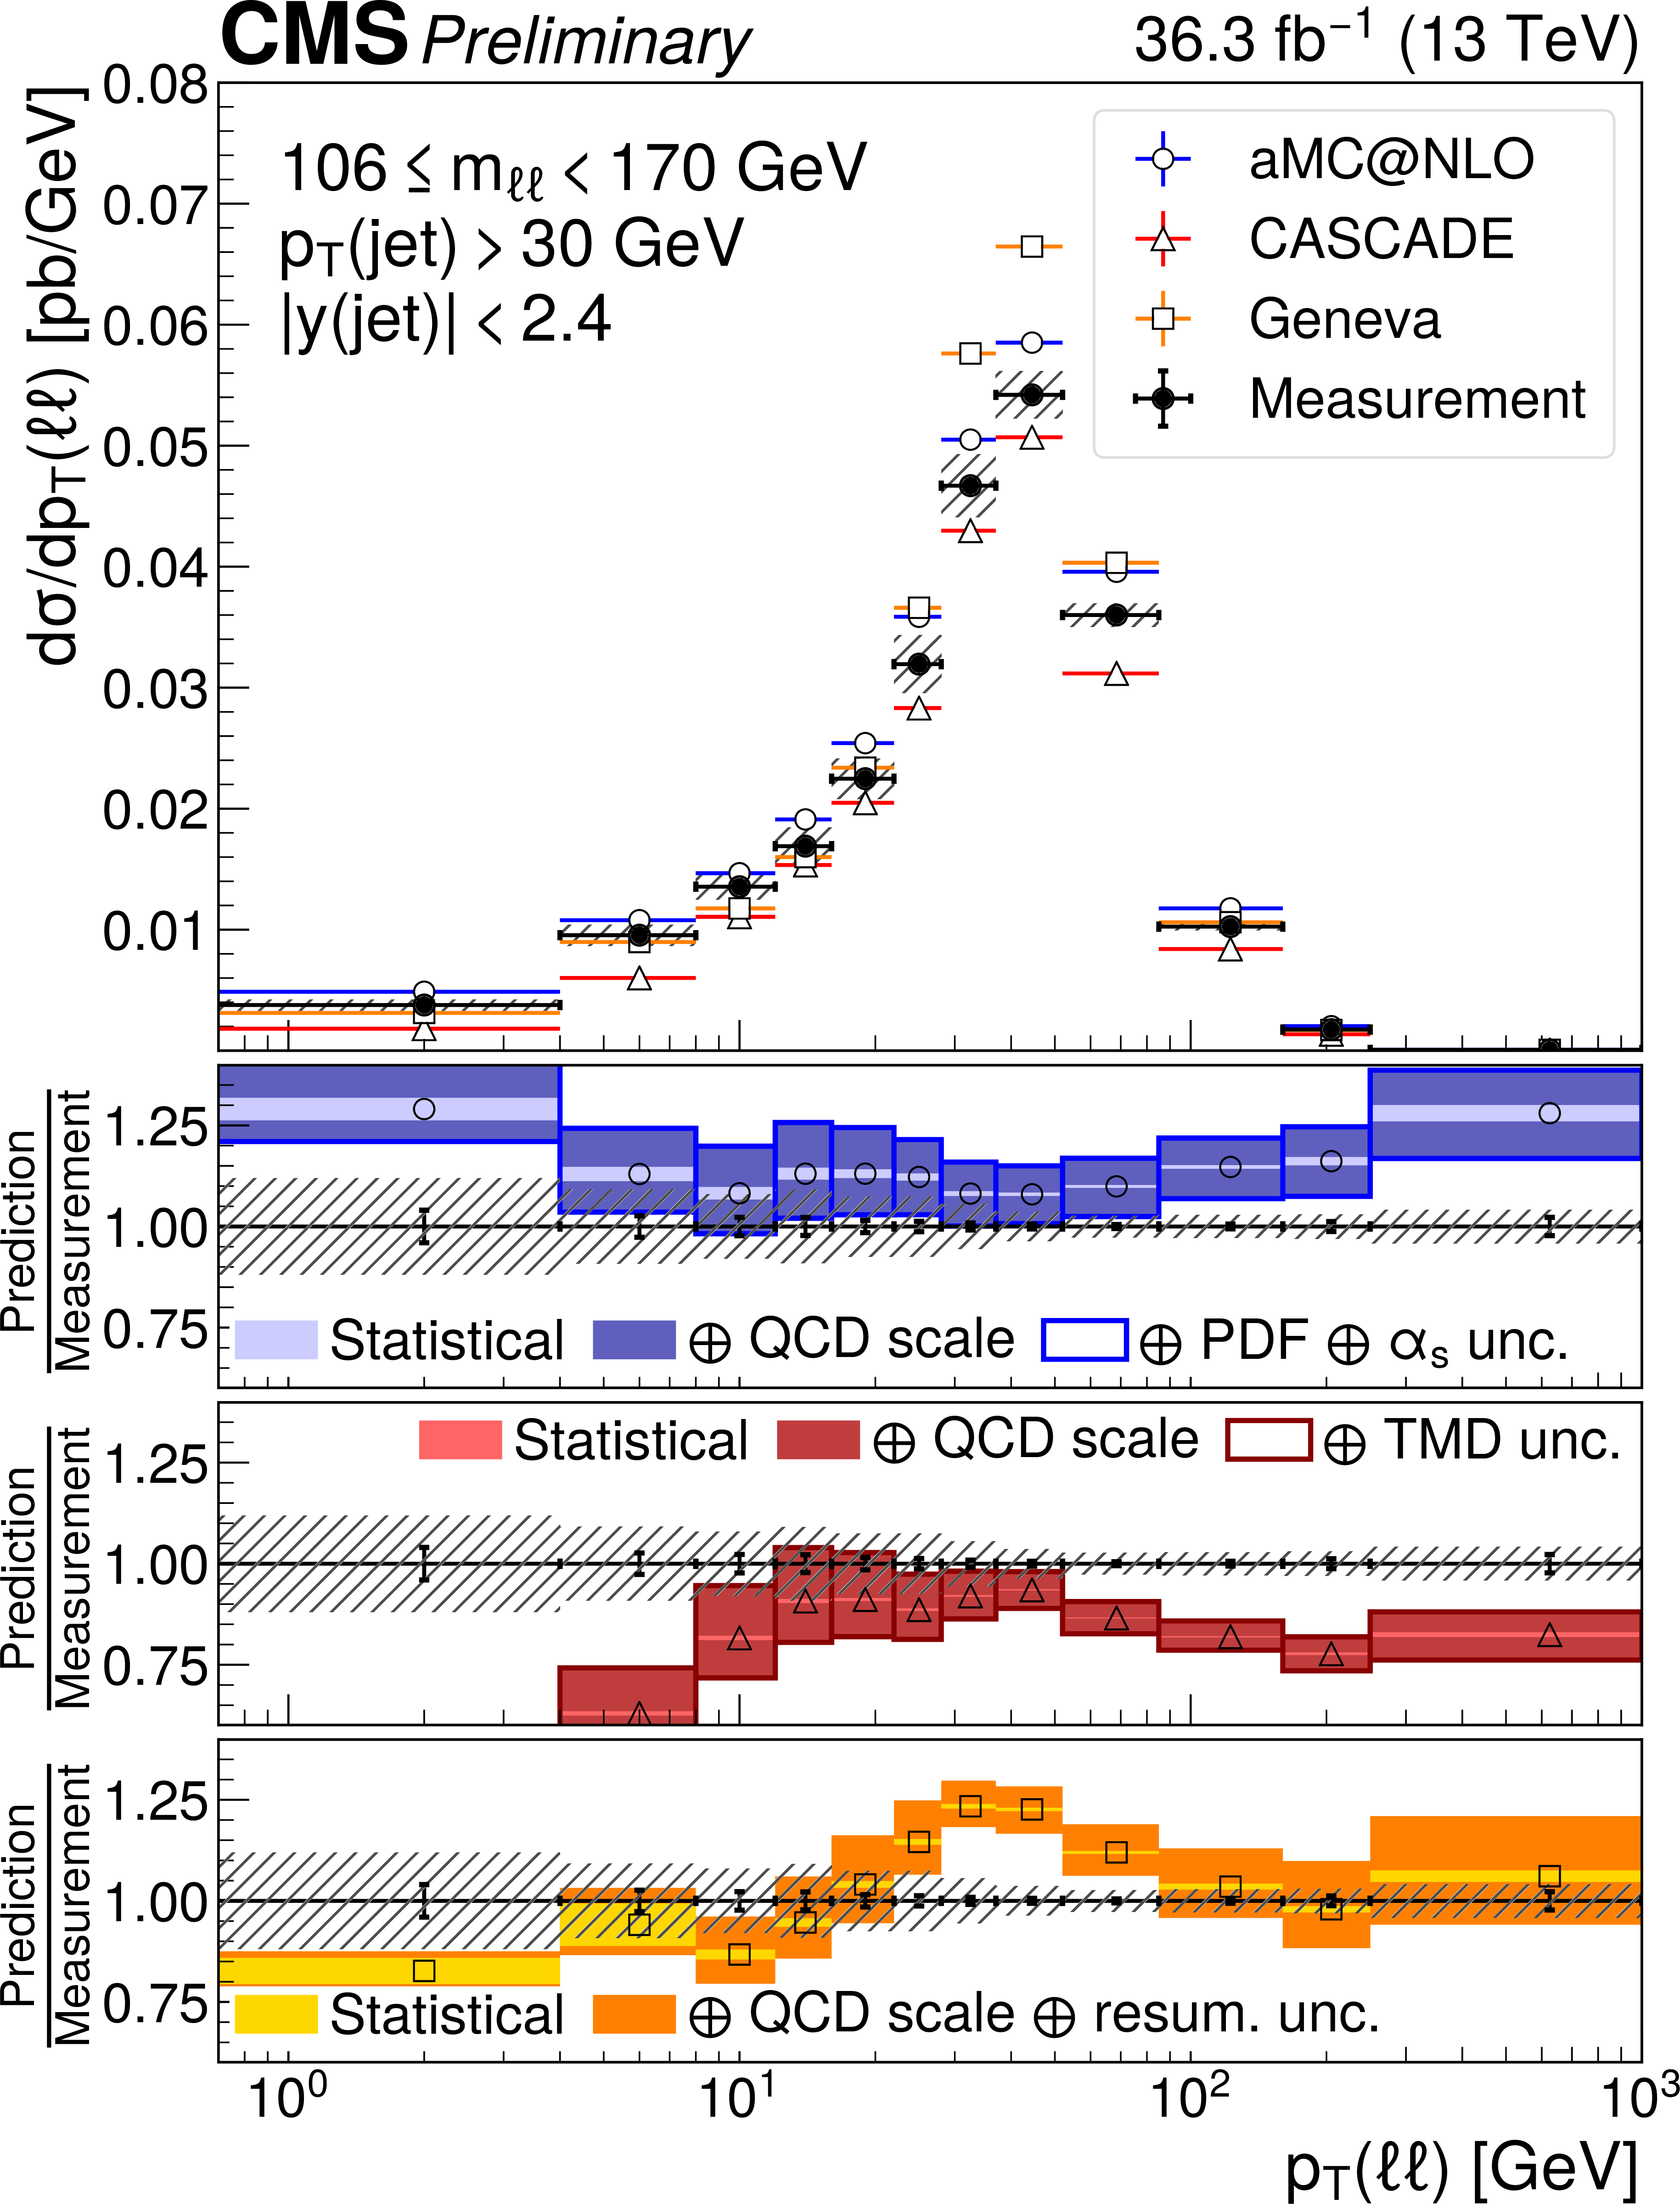
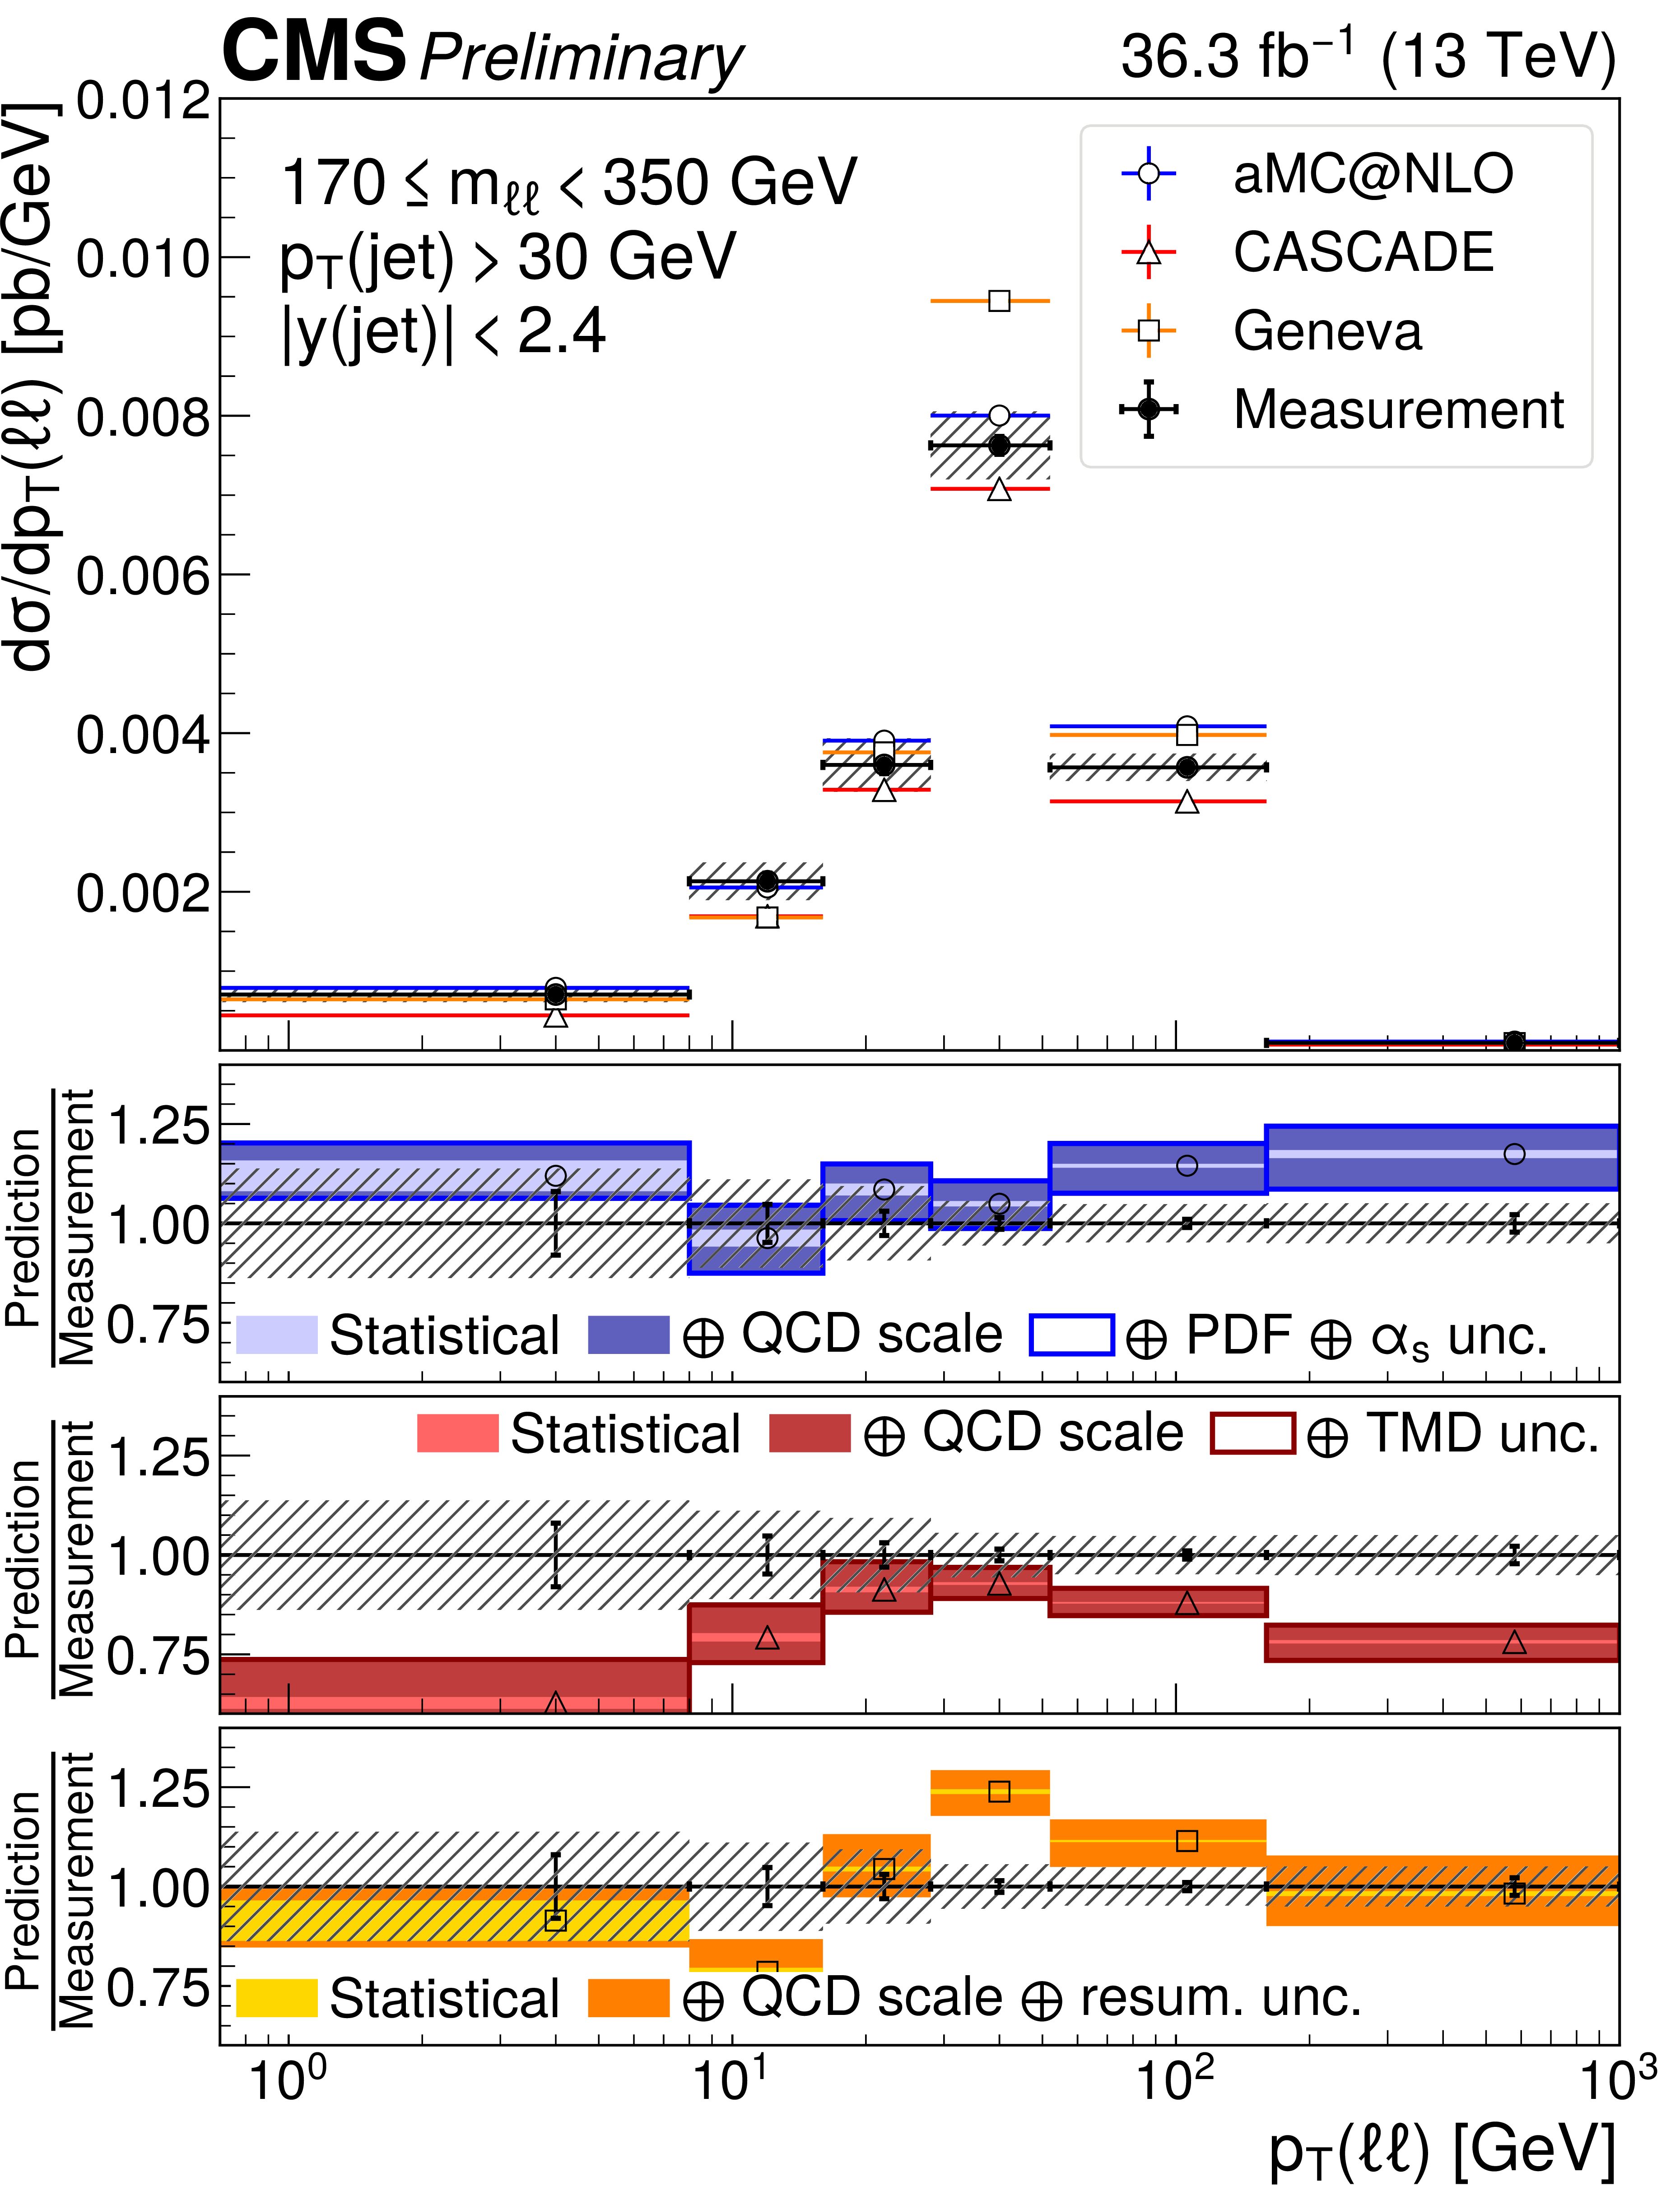
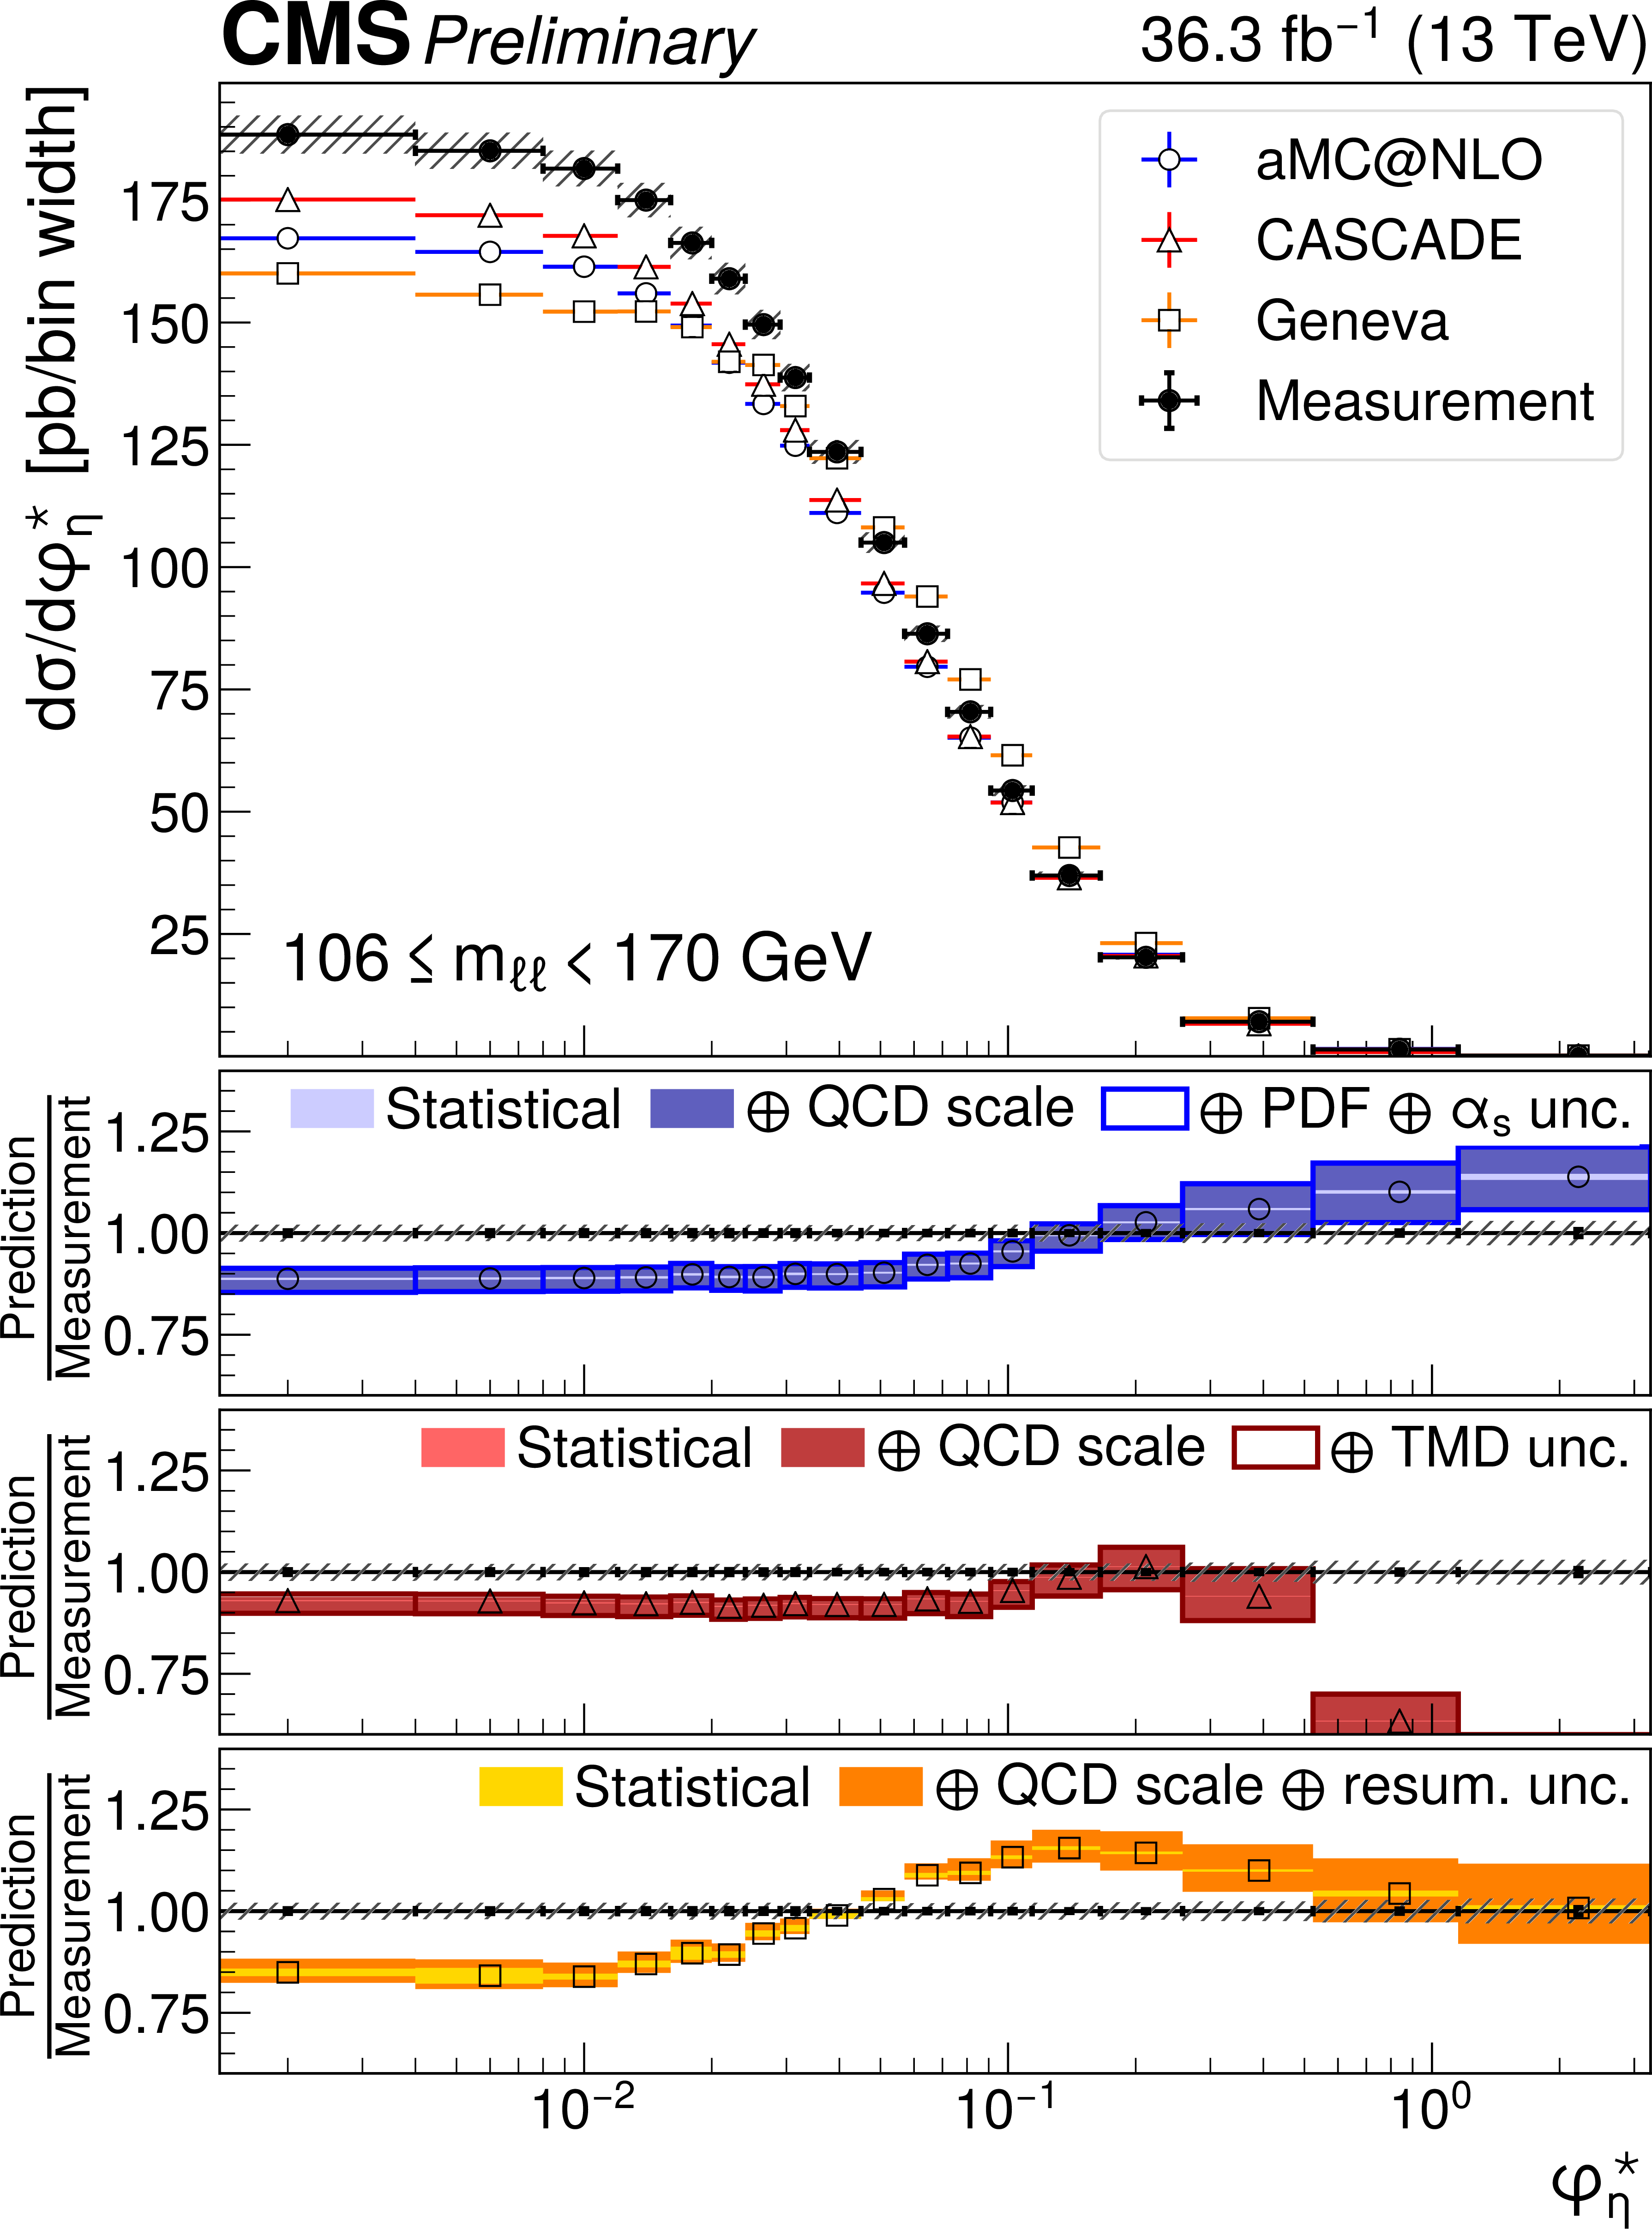
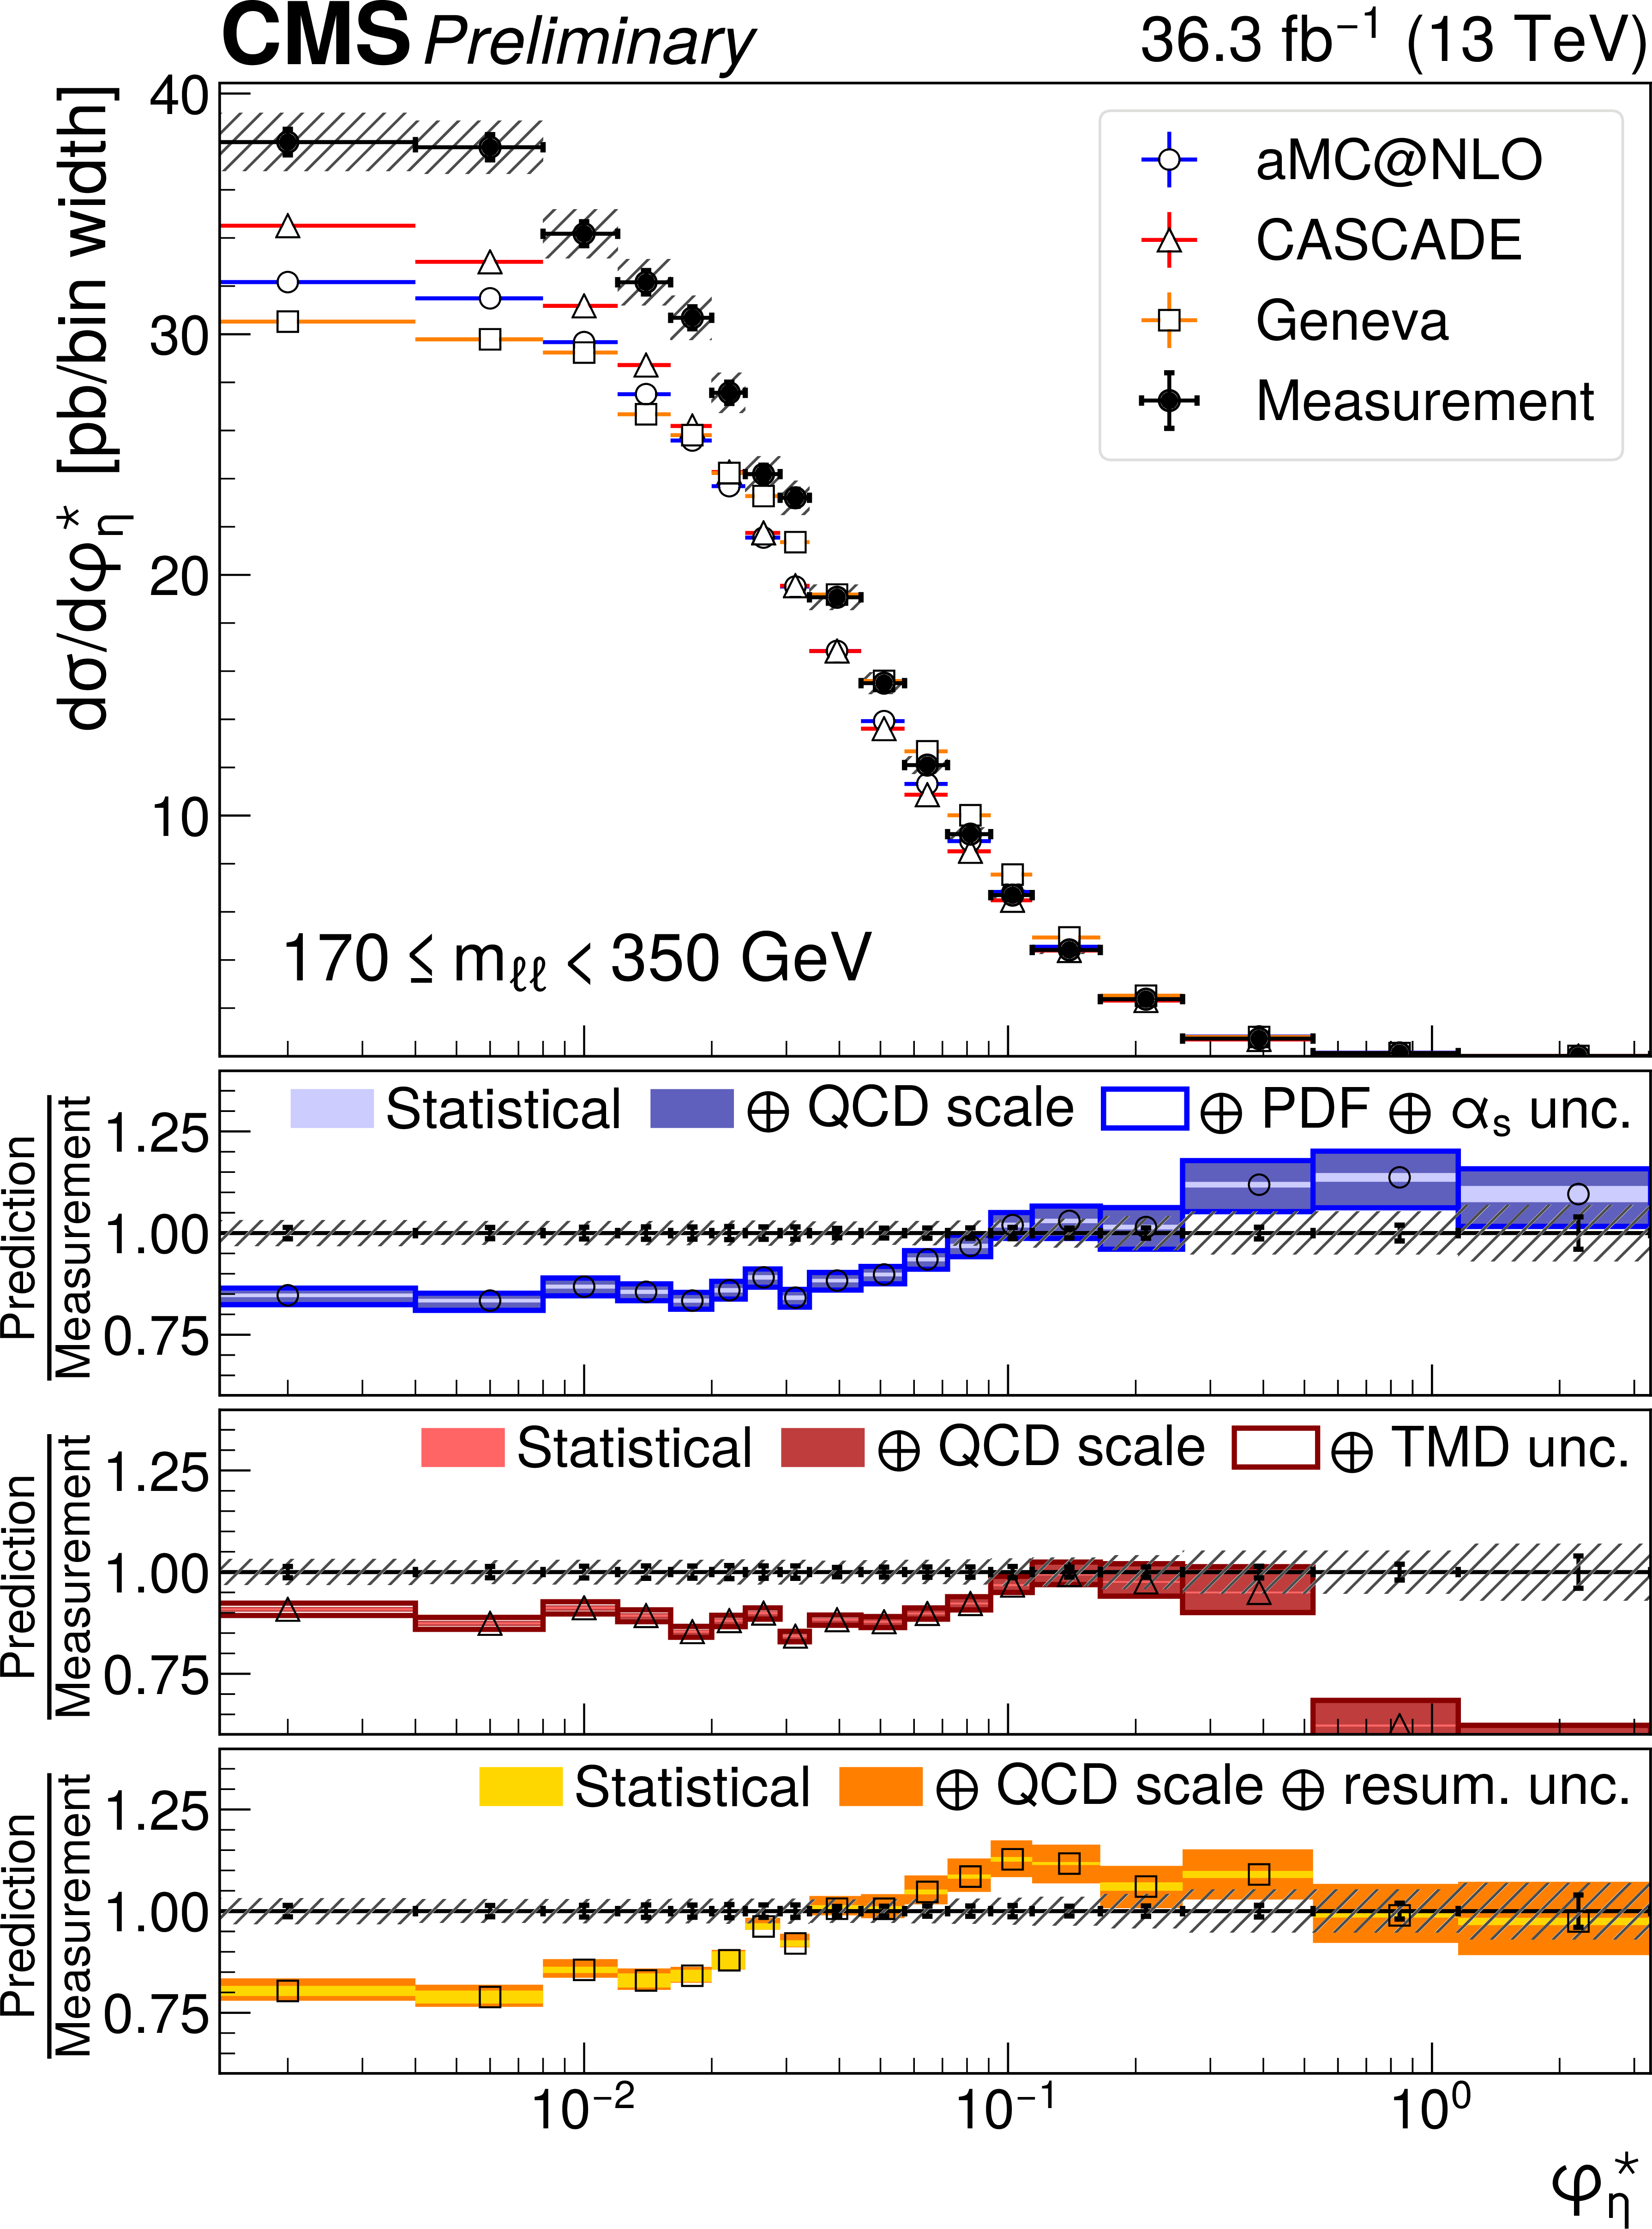
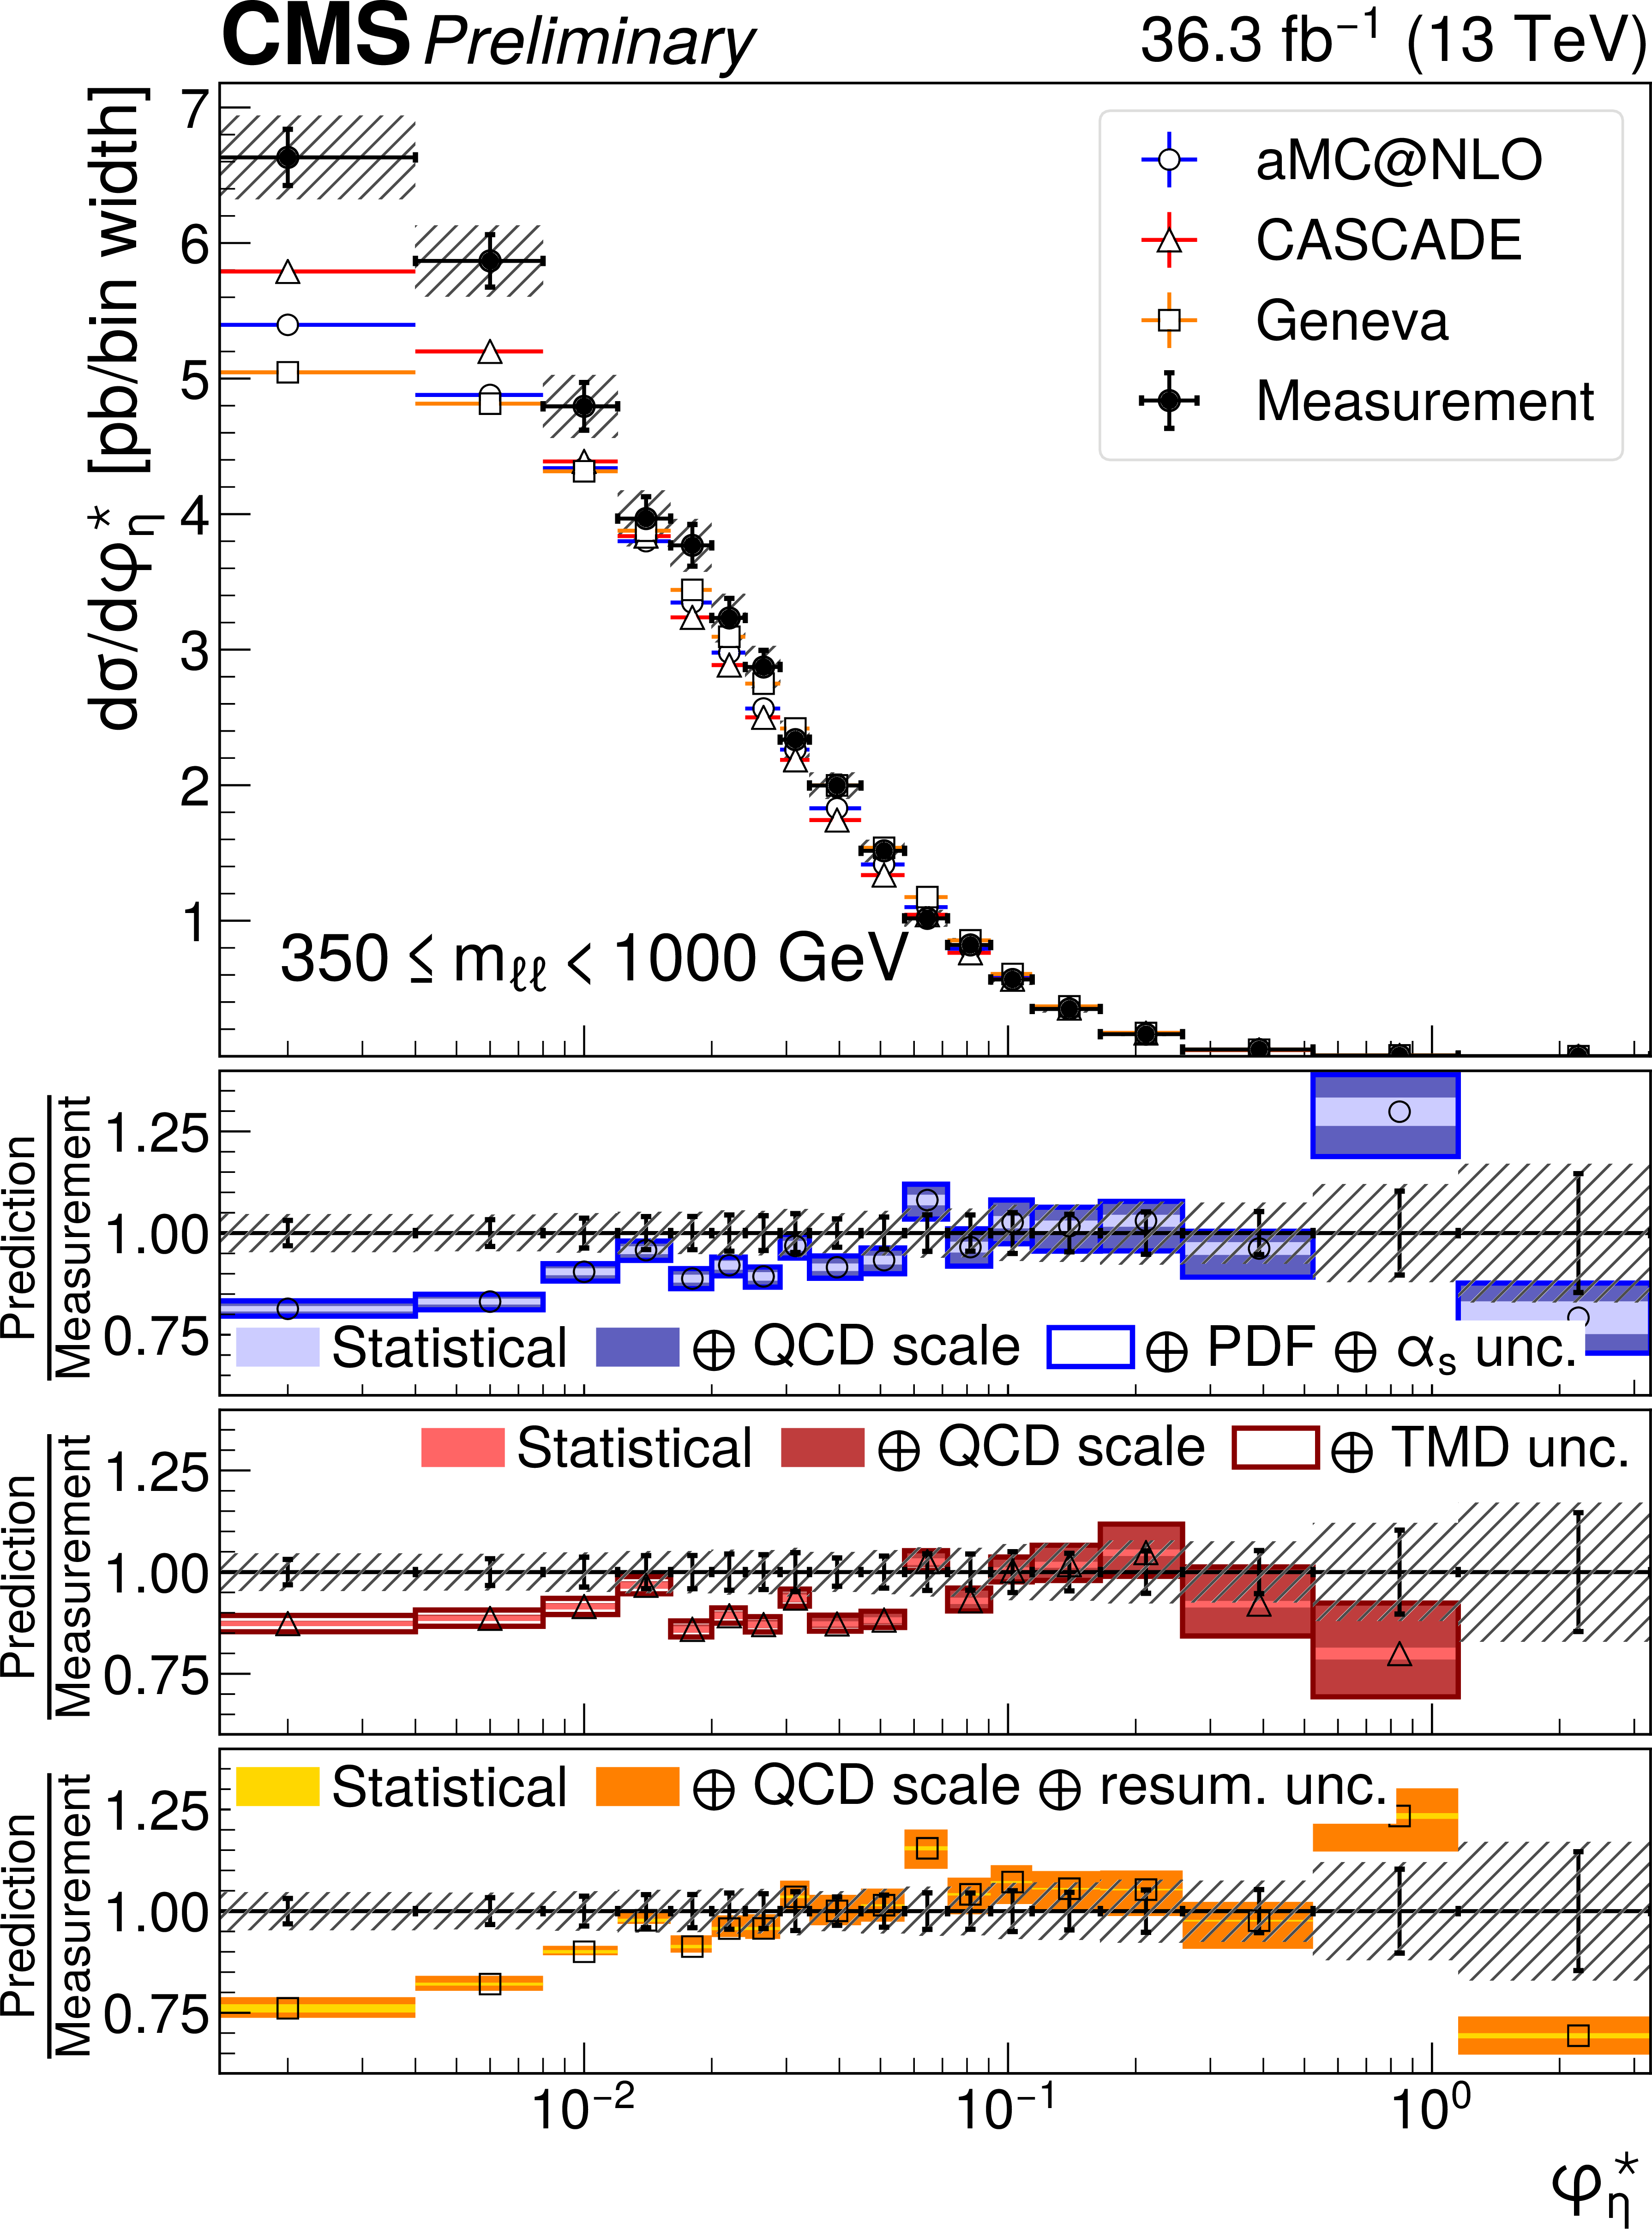
Differential unfolded cross sections in $ {{p_{\mathrm {T}}} (\ell \ell)} $ in different invariant mass ranges: 50 $ < {m_{\ell \ell}} < $ 76 GeV (top left), 76 $ < {m_{\ell \ell}} < $ 106 GeV (top center), 106 $ < {m_{\ell \ell}} < $ 170 GeV (top right), 170 $ < {m_{\ell \ell}} < $ 350 GeV (bottom left), and 350 $ < {m_{\ell \ell}} < $ 1000 GeV (bottom right). The error bars on data points (black dots) correspond to the statistical uncertainty and the shaded bands around the data points correspond to the total experimental uncertainty. The measurement is compared to aMC@NLO + PYTHIA 8 (blue dots), arTeMiDe (green triangles), aMC@NLO + PB (Cascade) (red triangles), and GENEVA (yellow dots). The light blue band around aMC@NLO corresponds to the statistical uncertainty of the simulation, the dark blue band includes the QCD scale uncertainty, and the largest band includes the PDF and $ {\alpha _S} $ uncertainties, added in quadrature. The light (dark) green band around arTeMiDe predictions represent the non-perturbative (QCD scale) uncertainties, the darker green representing the QED FSR correction uncertainties. The arTeMiDe predictions without QED FSR corrections are shown in pink. The range of invalidity of the arTeMiDe predictions is shaded with a grey band. The light (dark) red bands around Cascade represents the statistical (QCD scale) uncertainties of the simulation, where the TMD uncertainty is represented with empty red box. The yellow (orange) bands around GENEVA represents the statistical (QCD scale and resummation) uncertainties of the simulation. |
png pdf |
Figure 5-a:
Differential unfolded cross sections in $ {{p_{\mathrm {T}}} (\ell \ell)} $ in different invariant mass ranges: 50 $ < {m_{\ell \ell}} < $ 76 GeV (top left), 76 $ < {m_{\ell \ell}} < $ 106 GeV (top center), 106 $ < {m_{\ell \ell}} < $ 170 GeV (top right), 170 $ < {m_{\ell \ell}} < $ 350 GeV (bottom left), and 350 $ < {m_{\ell \ell}} < $ 1000 GeV (bottom right). The error bars on data points (black dots) correspond to the statistical uncertainty and the shaded bands around the data points correspond to the total experimental uncertainty. The measurement is compared to aMC@NLO + PYTHIA 8 (blue dots), arTeMiDe (green triangles), aMC@NLO + PB (Cascade) (red triangles), and GENEVA (yellow dots). The light blue band around aMC@NLO corresponds to the statistical uncertainty of the simulation, the dark blue band includes the QCD scale uncertainty, and the largest band includes the PDF and $ {\alpha _S} $ uncertainties, added in quadrature. The light (dark) green band around arTeMiDe predictions represent the non-perturbative (QCD scale) uncertainties, the darker green representing the QED FSR correction uncertainties. The arTeMiDe predictions without QED FSR corrections are shown in pink. The range of invalidity of the arTeMiDe predictions is shaded with a grey band. The light (dark) red bands around Cascade represents the statistical (QCD scale) uncertainties of the simulation, where the TMD uncertainty is represented with empty red box. The yellow (orange) bands around GENEVA represents the statistical (QCD scale and resummation) uncertainties of the simulation. |
png pdf |
Figure 5-b:
Differential unfolded cross sections in $ {{p_{\mathrm {T}}} (\ell \ell)} $ in different invariant mass ranges: 50 $ < {m_{\ell \ell}} < $ 76 GeV (top left), 76 $ < {m_{\ell \ell}} < $ 106 GeV (top center), 106 $ < {m_{\ell \ell}} < $ 170 GeV (top right), 170 $ < {m_{\ell \ell}} < $ 350 GeV (bottom left), and 350 $ < {m_{\ell \ell}} < $ 1000 GeV (bottom right). The error bars on data points (black dots) correspond to the statistical uncertainty and the shaded bands around the data points correspond to the total experimental uncertainty. The measurement is compared to aMC@NLO + PYTHIA 8 (blue dots), arTeMiDe (green triangles), aMC@NLO + PB (Cascade) (red triangles), and GENEVA (yellow dots). The light blue band around aMC@NLO corresponds to the statistical uncertainty of the simulation, the dark blue band includes the QCD scale uncertainty, and the largest band includes the PDF and $ {\alpha _S} $ uncertainties, added in quadrature. The light (dark) green band around arTeMiDe predictions represent the non-perturbative (QCD scale) uncertainties, the darker green representing the QED FSR correction uncertainties. The arTeMiDe predictions without QED FSR corrections are shown in pink. The range of invalidity of the arTeMiDe predictions is shaded with a grey band. The light (dark) red bands around Cascade represents the statistical (QCD scale) uncertainties of the simulation, where the TMD uncertainty is represented with empty red box. The yellow (orange) bands around GENEVA represents the statistical (QCD scale and resummation) uncertainties of the simulation. |

png pdf |
Figure 5-c:
Differential unfolded cross sections in $ {{p_{\mathrm {T}}} (\ell \ell)} $ in different invariant mass ranges: 50 $ < {m_{\ell \ell}} < $ 76 GeV (top left), 76 $ < {m_{\ell \ell}} < $ 106 GeV (top center), 106 $ < {m_{\ell \ell}} < $ 170 GeV (top right), 170 $ < {m_{\ell \ell}} < $ 350 GeV (bottom left), and 350 $ < {m_{\ell \ell}} < $ 1000 GeV (bottom right). The error bars on data points (black dots) correspond to the statistical uncertainty and the shaded bands around the data points correspond to the total experimental uncertainty. The measurement is compared to aMC@NLO + PYTHIA 8 (blue dots), arTeMiDe (green triangles), aMC@NLO + PB (Cascade) (red triangles), and GENEVA (yellow dots). The light blue band around aMC@NLO corresponds to the statistical uncertainty of the simulation, the dark blue band includes the QCD scale uncertainty, and the largest band includes the PDF and $ {\alpha _S} $ uncertainties, added in quadrature. The light (dark) green band around arTeMiDe predictions represent the non-perturbative (QCD scale) uncertainties, the darker green representing the QED FSR correction uncertainties. The arTeMiDe predictions without QED FSR corrections are shown in pink. The range of invalidity of the arTeMiDe predictions is shaded with a grey band. The light (dark) red bands around Cascade represents the statistical (QCD scale) uncertainties of the simulation, where the TMD uncertainty is represented with empty red box. The yellow (orange) bands around GENEVA represents the statistical (QCD scale and resummation) uncertainties of the simulation. |
png pdf |
Figure 5-d:
Differential unfolded cross sections in $ {{p_{\mathrm {T}}} (\ell \ell)} $ in different invariant mass ranges: 50 $ < {m_{\ell \ell}} < $ 76 GeV (top left), 76 $ < {m_{\ell \ell}} < $ 106 GeV (top center), 106 $ < {m_{\ell \ell}} < $ 170 GeV (top right), 170 $ < {m_{\ell \ell}} < $ 350 GeV (bottom left), and 350 $ < {m_{\ell \ell}} < $ 1000 GeV (bottom right). The error bars on data points (black dots) correspond to the statistical uncertainty and the shaded bands around the data points correspond to the total experimental uncertainty. The measurement is compared to aMC@NLO + PYTHIA 8 (blue dots), arTeMiDe (green triangles), aMC@NLO + PB (Cascade) (red triangles), and GENEVA (yellow dots). The light blue band around aMC@NLO corresponds to the statistical uncertainty of the simulation, the dark blue band includes the QCD scale uncertainty, and the largest band includes the PDF and $ {\alpha _S} $ uncertainties, added in quadrature. The light (dark) green band around arTeMiDe predictions represent the non-perturbative (QCD scale) uncertainties, the darker green representing the QED FSR correction uncertainties. The arTeMiDe predictions without QED FSR corrections are shown in pink. The range of invalidity of the arTeMiDe predictions is shaded with a grey band. The light (dark) red bands around Cascade represents the statistical (QCD scale) uncertainties of the simulation, where the TMD uncertainty is represented with empty red box. The yellow (orange) bands around GENEVA represents the statistical (QCD scale and resummation) uncertainties of the simulation. |
png pdf |
Figure 5-e:
Differential unfolded cross sections in $ {{p_{\mathrm {T}}} (\ell \ell)} $ in different invariant mass ranges: 50 $ < {m_{\ell \ell}} < $ 76 GeV (top left), 76 $ < {m_{\ell \ell}} < $ 106 GeV (top center), 106 $ < {m_{\ell \ell}} < $ 170 GeV (top right), 170 $ < {m_{\ell \ell}} < $ 350 GeV (bottom left), and 350 $ < {m_{\ell \ell}} < $ 1000 GeV (bottom right). The error bars on data points (black dots) correspond to the statistical uncertainty and the shaded bands around the data points correspond to the total experimental uncertainty. The measurement is compared to aMC@NLO + PYTHIA 8 (blue dots), arTeMiDe (green triangles), aMC@NLO + PB (Cascade) (red triangles), and GENEVA (yellow dots). The light blue band around aMC@NLO corresponds to the statistical uncertainty of the simulation, the dark blue band includes the QCD scale uncertainty, and the largest band includes the PDF and $ {\alpha _S} $ uncertainties, added in quadrature. The light (dark) green band around arTeMiDe predictions represent the non-perturbative (QCD scale) uncertainties, the darker green representing the QED FSR correction uncertainties. The arTeMiDe predictions without QED FSR corrections are shown in pink. The range of invalidity of the arTeMiDe predictions is shaded with a grey band. The light (dark) red bands around Cascade represents the statistical (QCD scale) uncertainties of the simulation, where the TMD uncertainty is represented with empty red box. The yellow (orange) bands around GENEVA represents the statistical (QCD scale and resummation) uncertainties of the simulation. |
png pdf |
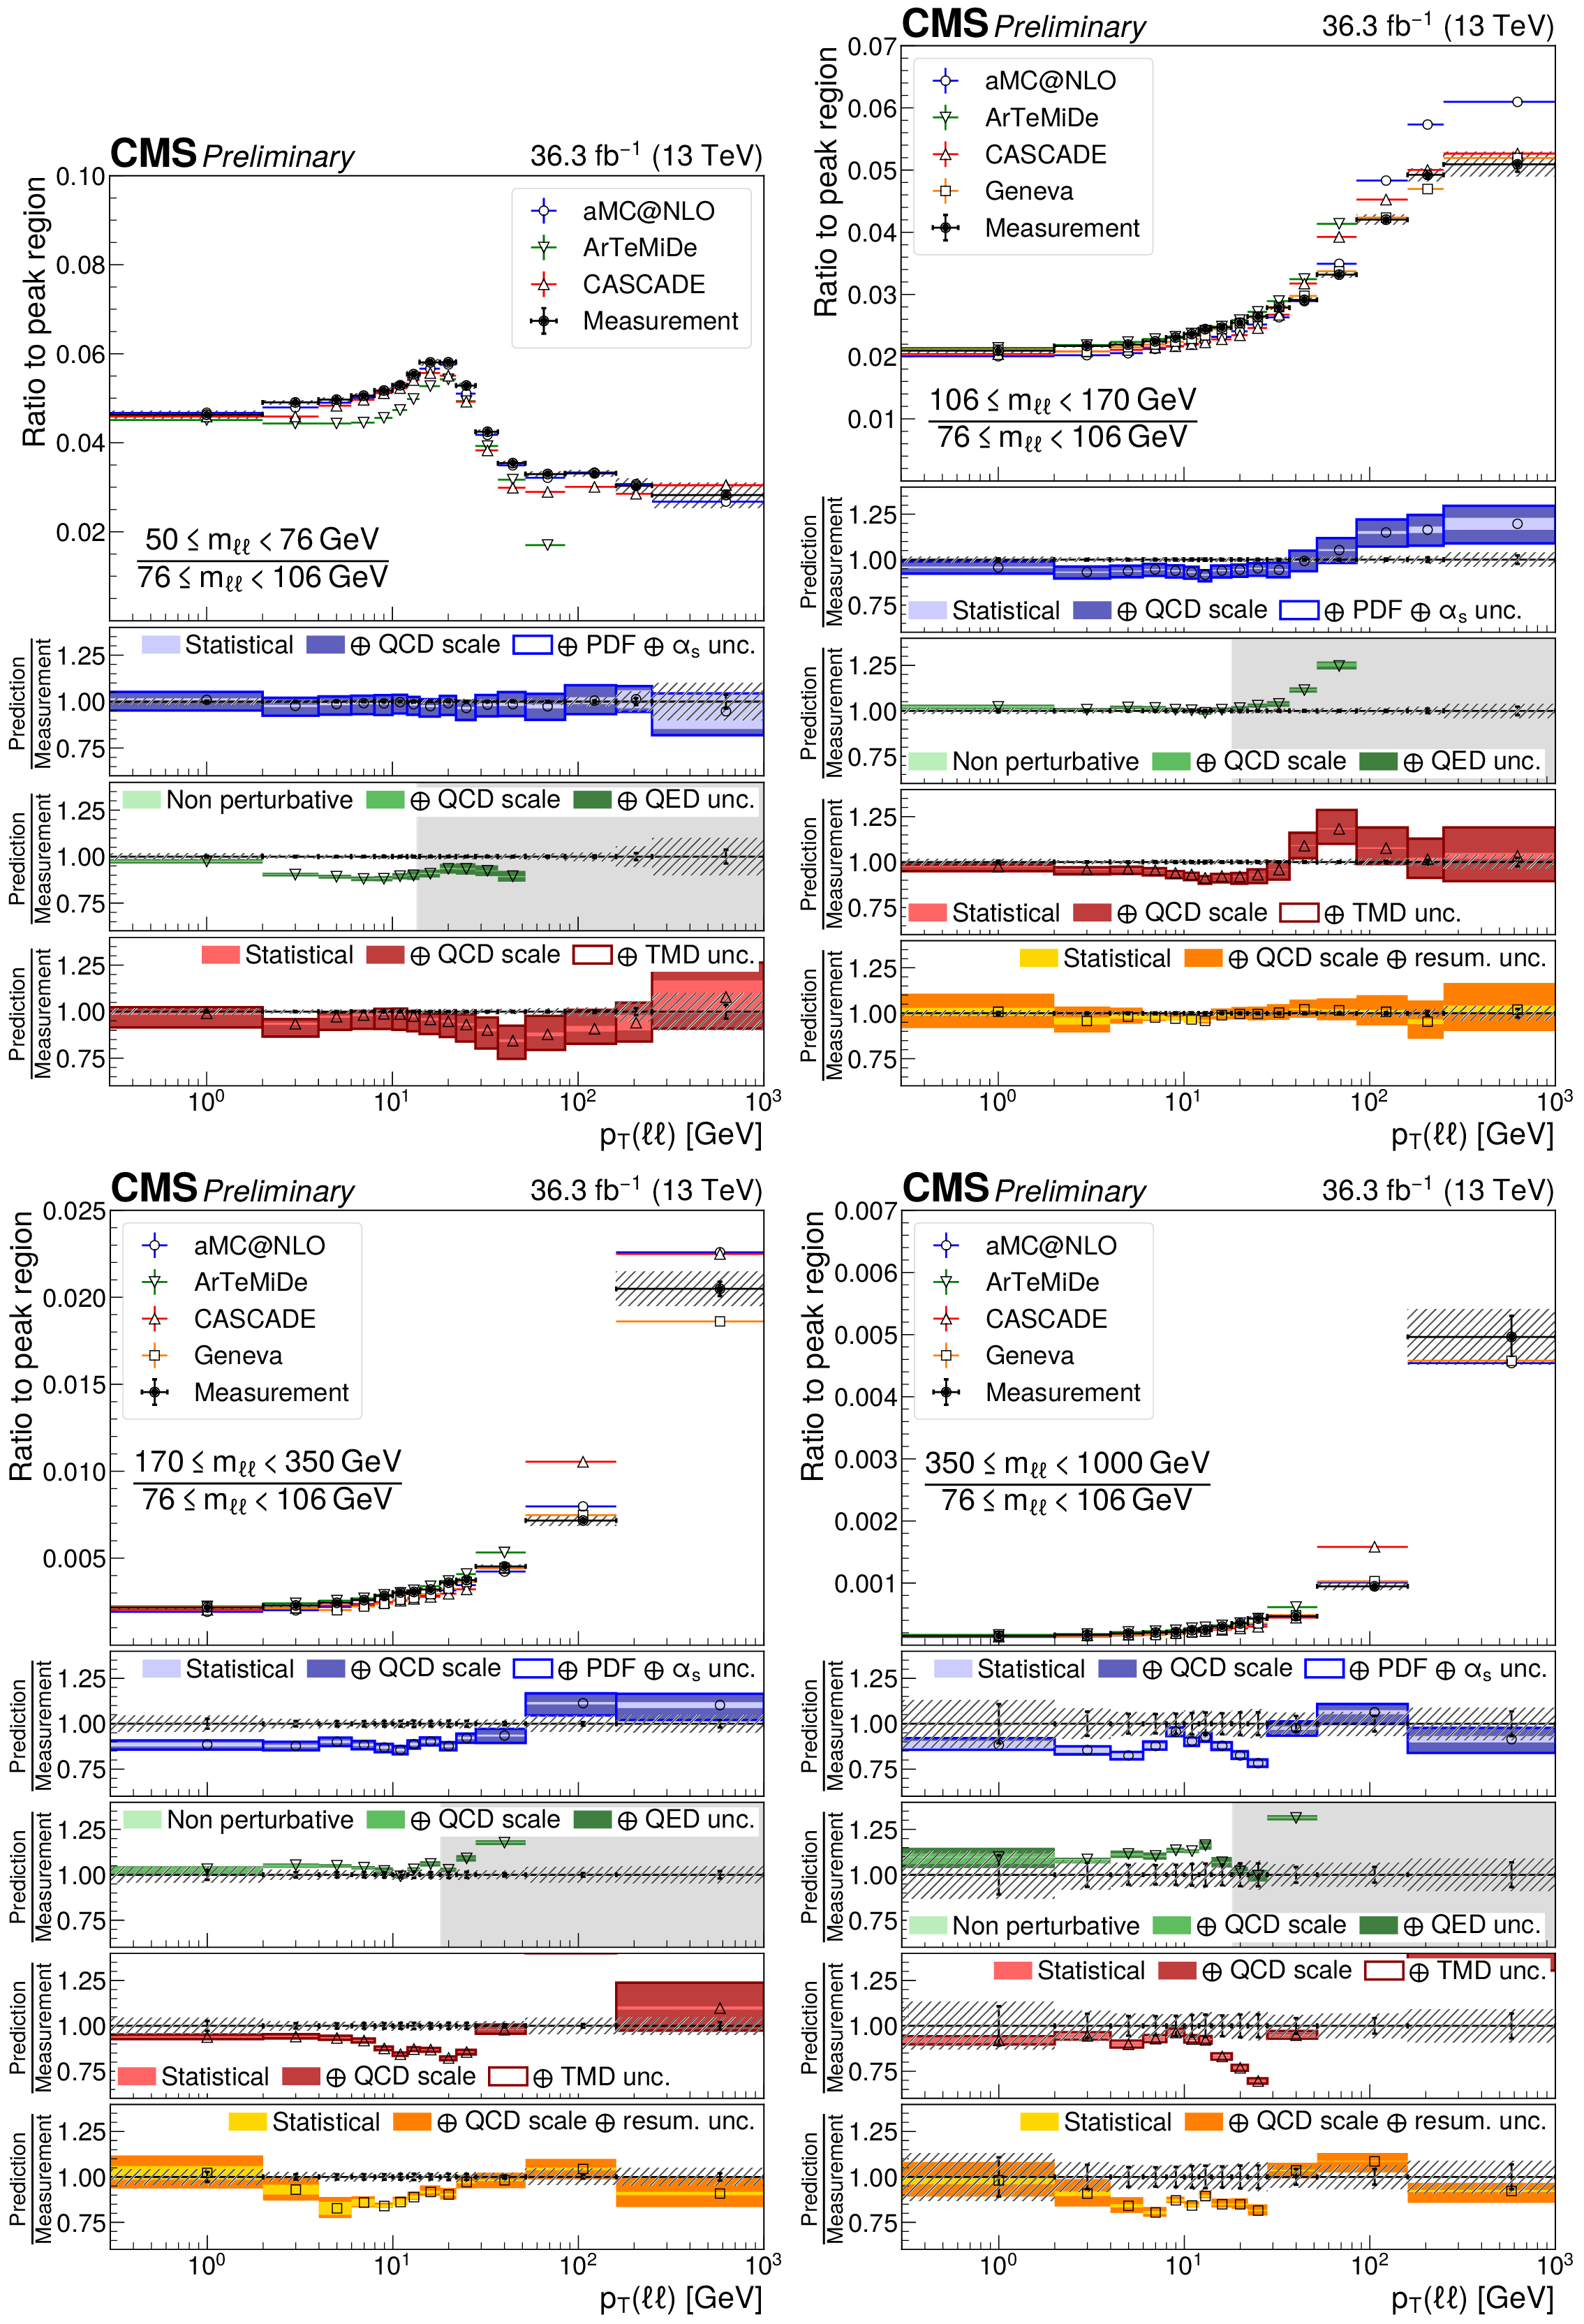
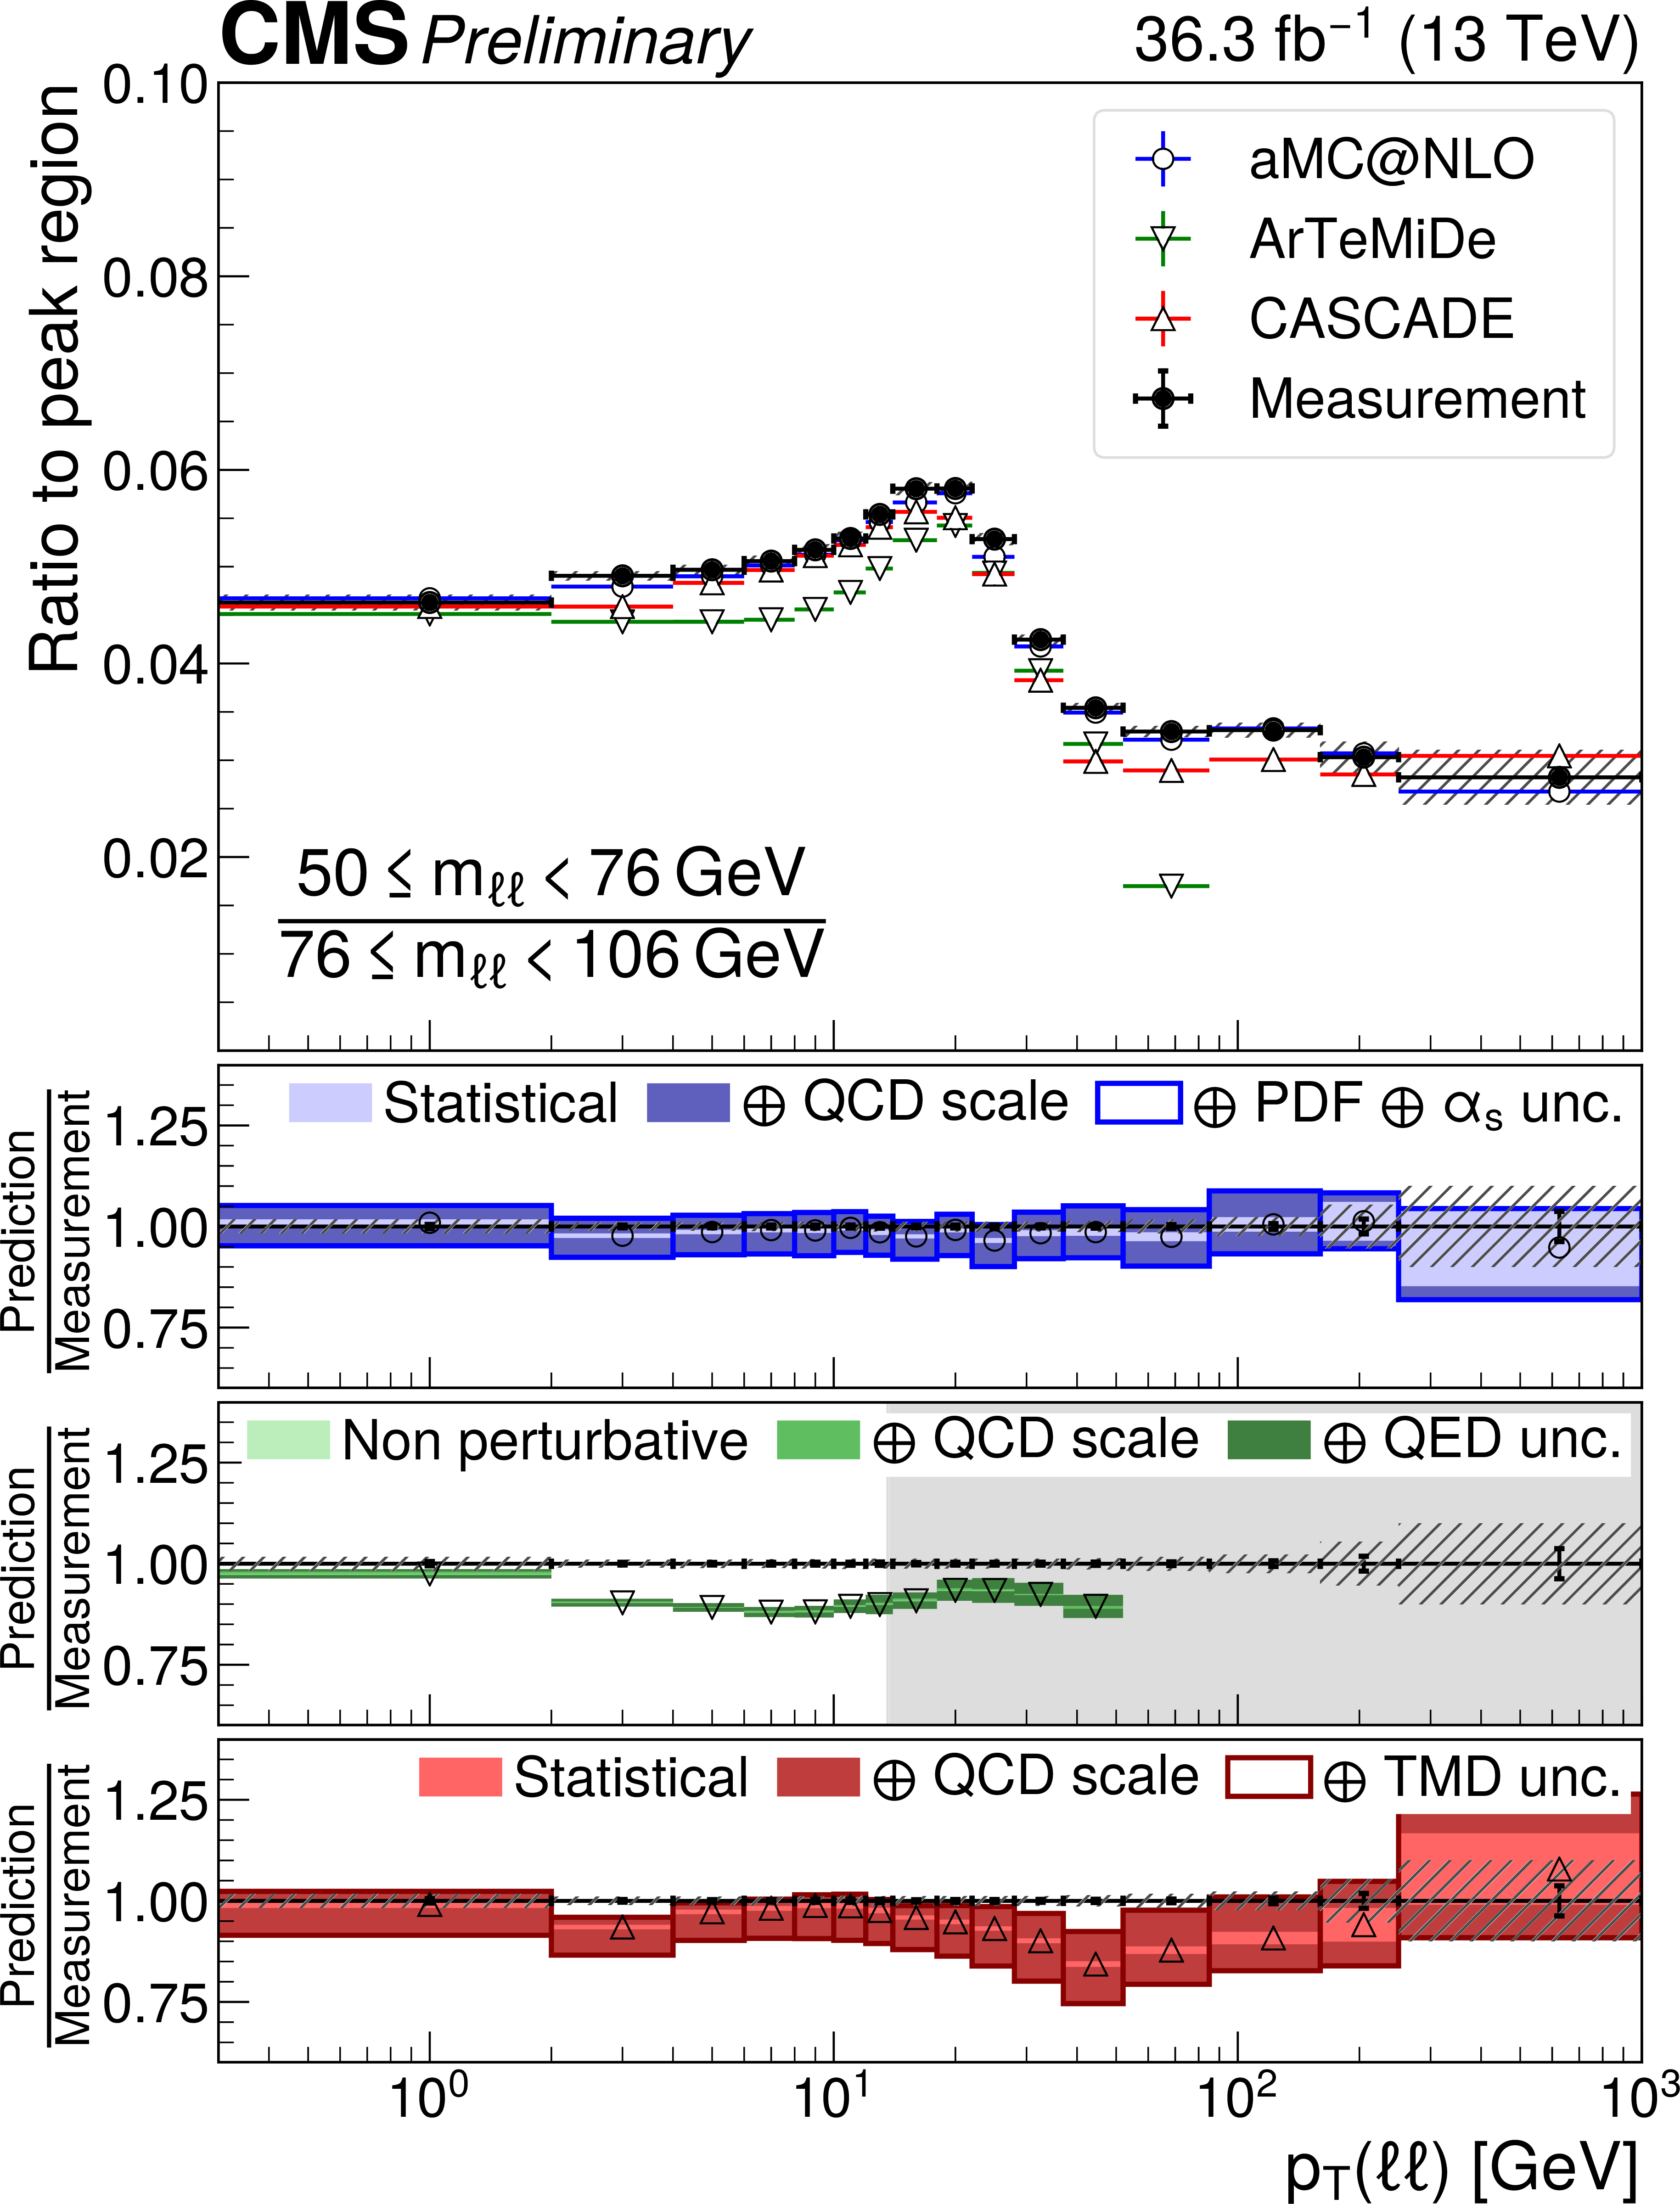
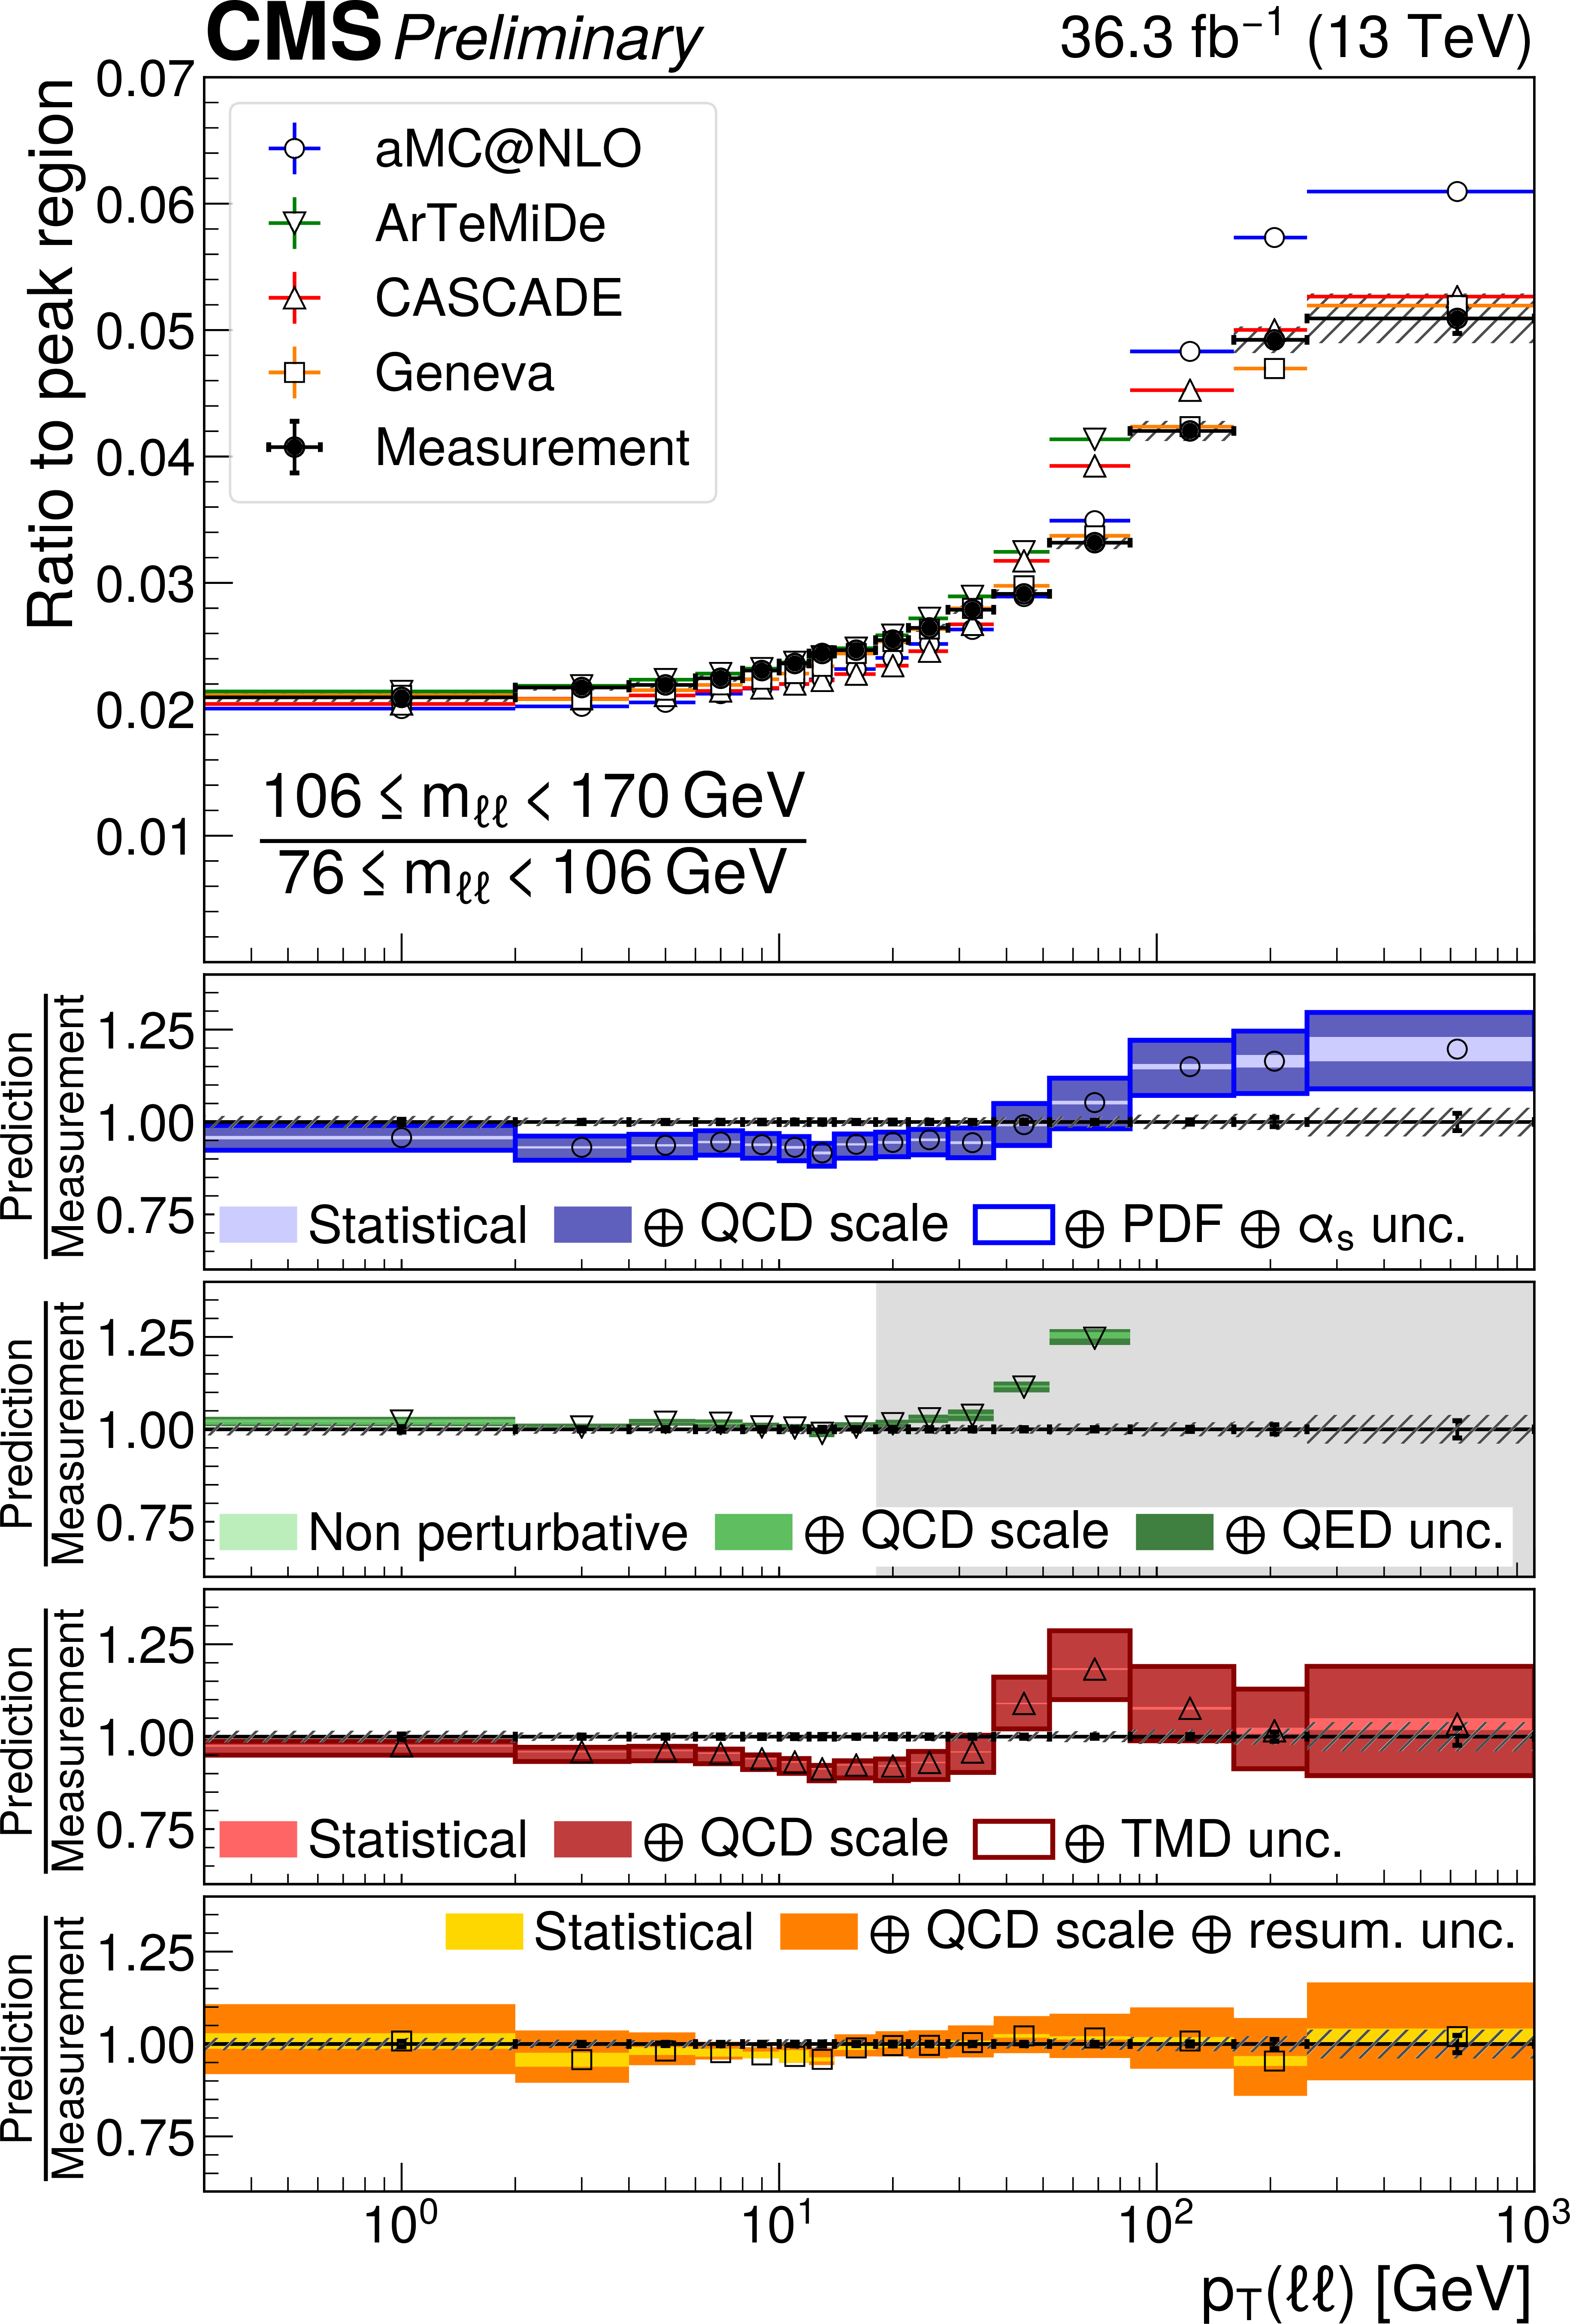
Figure 6:
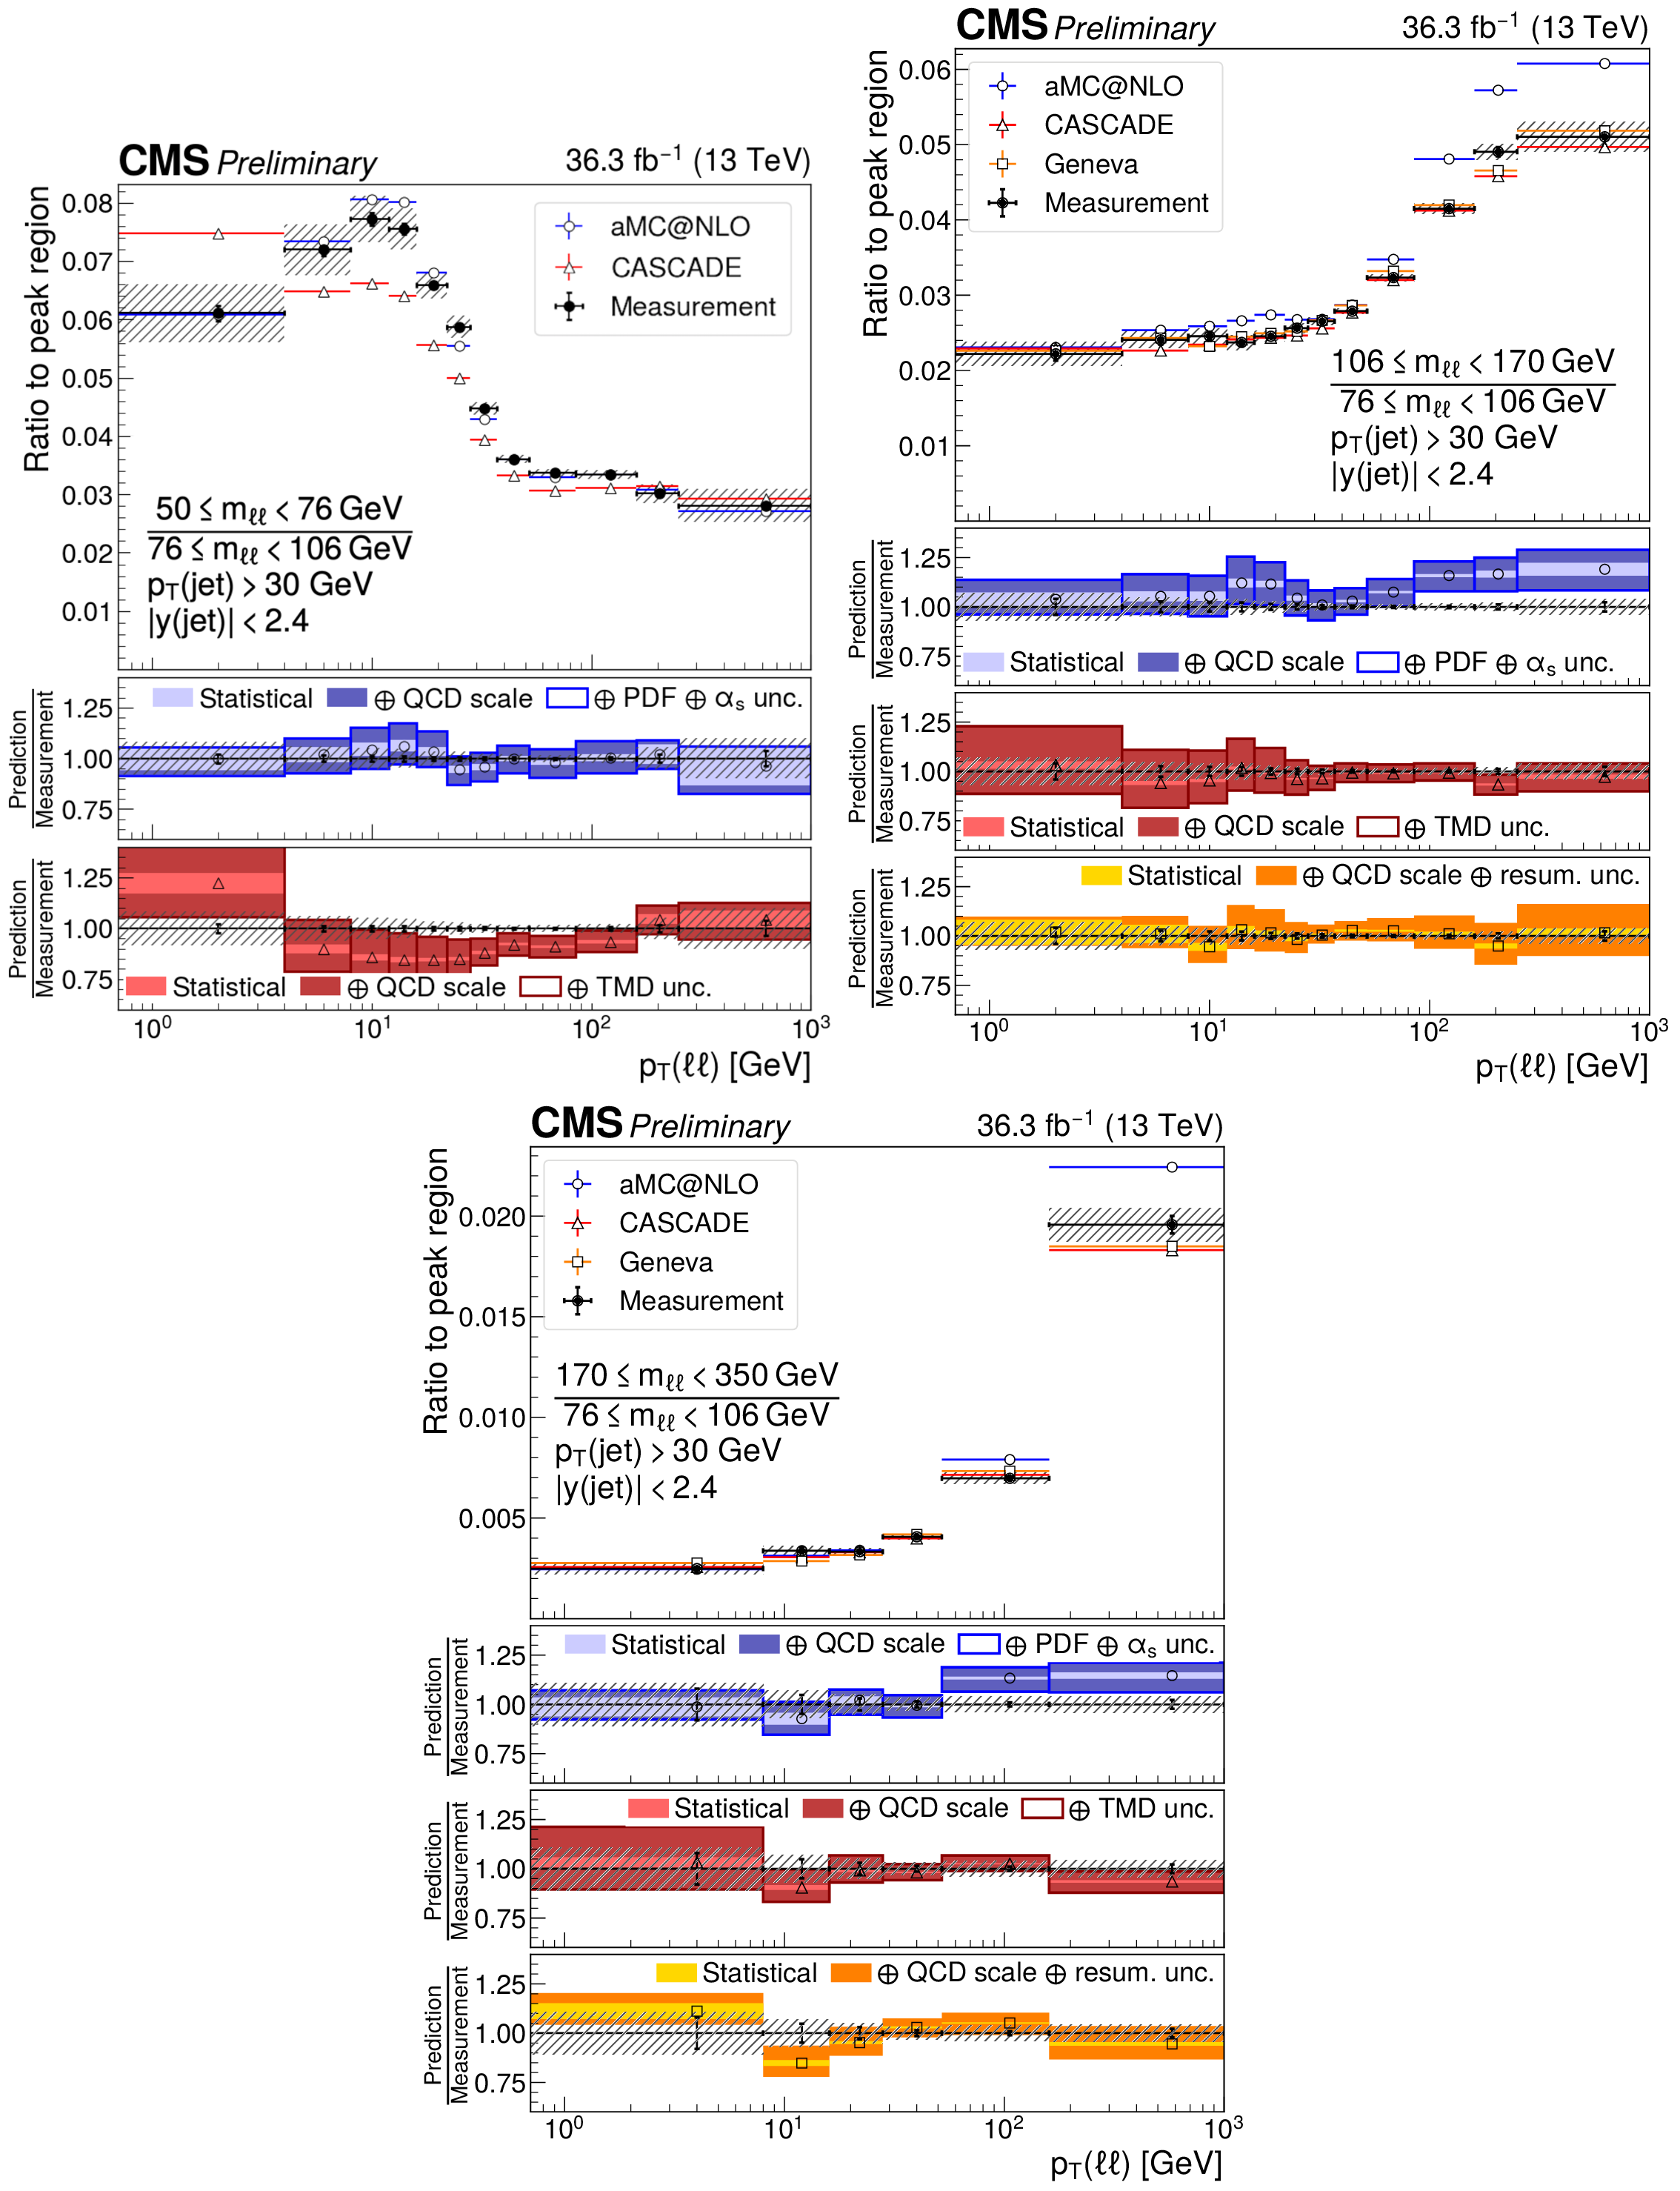
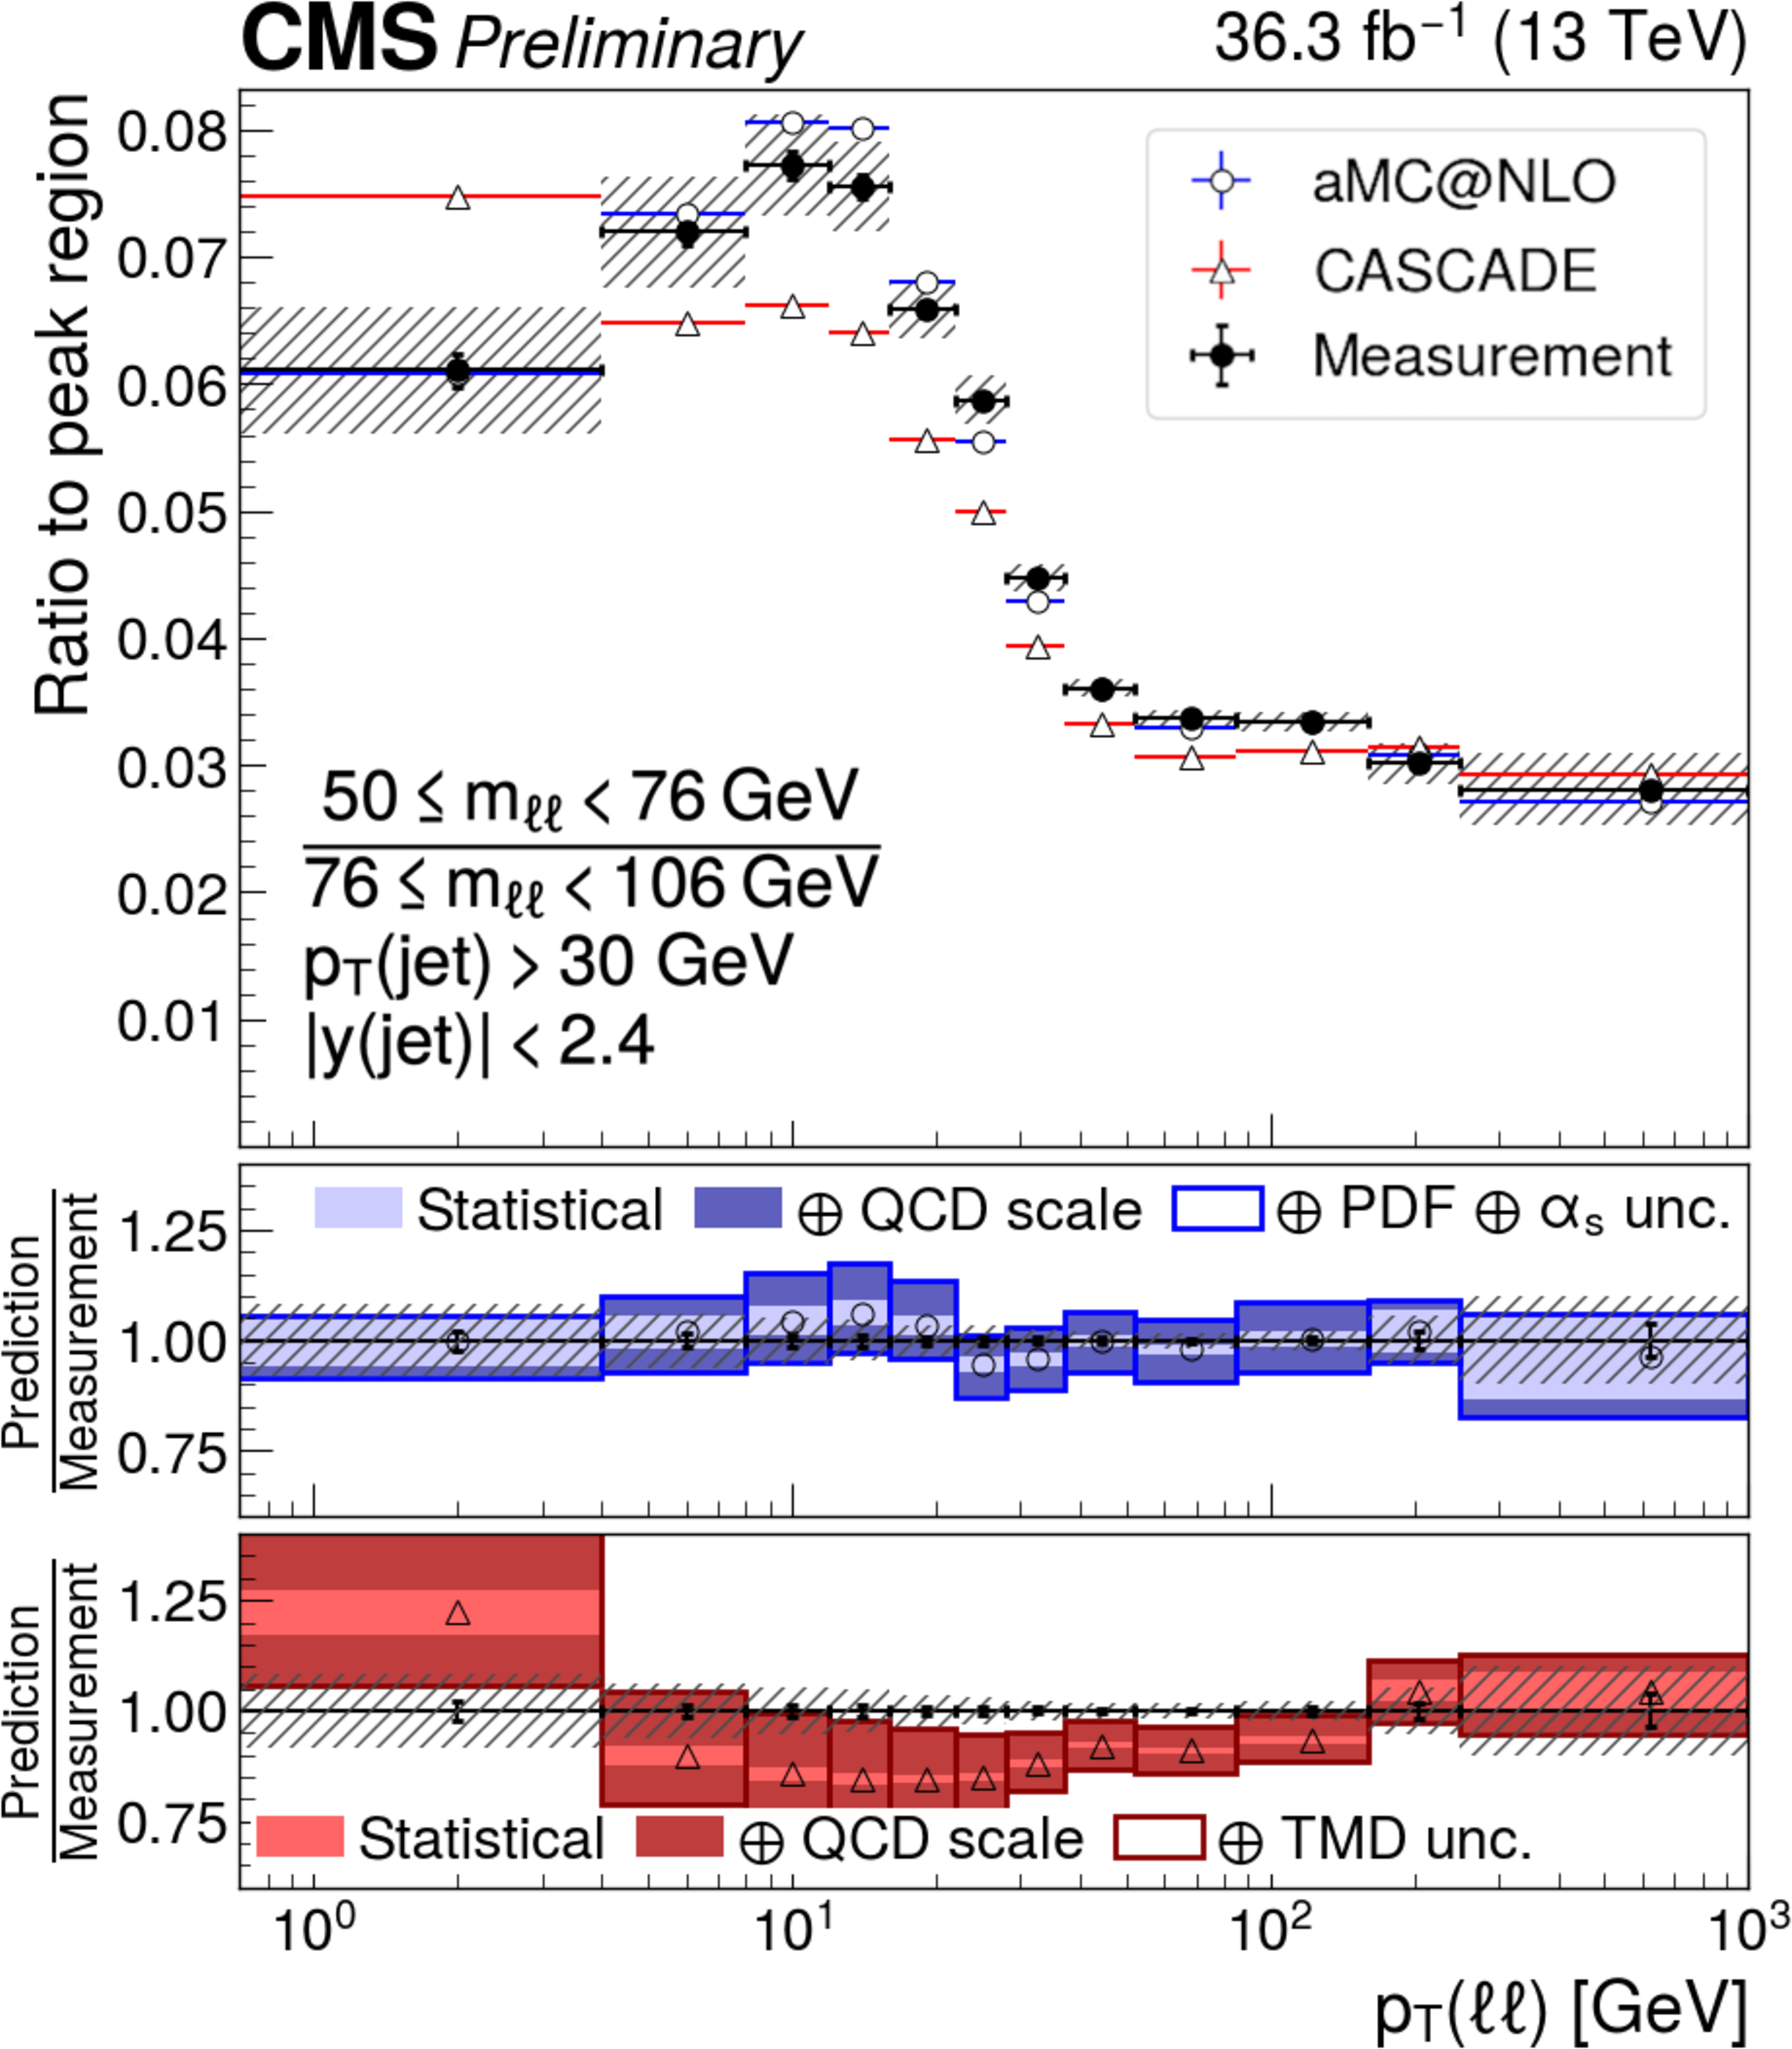
Ratios of differential unfolded cross sections in $ {{p_{\mathrm {T}}} (\ell \ell)} $ for invariant mass ranges with respect to the peak region 76 $ < {m_{\ell \ell}} < $ 106 GeV: 50 $ < {m_{\ell \ell}} < $ 76 GeV (top left), 106 $ < {m_{\ell \ell}} < $ 170 GeV (top right), 170 $ < {m_{\ell \ell}} < $ 350 GeV (bottom left), and 350 $ < {m_{\ell \ell}} < $ 1000 GeV (bottom right). Details on the presentation of the results is given in Fig. 5. |
png pdf |
Figure 6-a:
Ratios of differential unfolded cross sections in $ {{p_{\mathrm {T}}} (\ell \ell)} $ for invariant mass ranges with respect to the peak region 76 $ < {m_{\ell \ell}} < $ 106 GeV: 50 $ < {m_{\ell \ell}} < $ 76 GeV (top left), 106 $ < {m_{\ell \ell}} < $ 170 GeV (top right), 170 $ < {m_{\ell \ell}} < $ 350 GeV (bottom left), and 350 $ < {m_{\ell \ell}} < $ 1000 GeV (bottom right). Details on the presentation of the results is given in Fig. 5. |
png pdf |
Figure 6-b:
Ratios of differential unfolded cross sections in $ {{p_{\mathrm {T}}} (\ell \ell)} $ for invariant mass ranges with respect to the peak region 76 $ < {m_{\ell \ell}} < $ 106 GeV: 50 $ < {m_{\ell \ell}} < $ 76 GeV (top left), 106 $ < {m_{\ell \ell}} < $ 170 GeV (top right), 170 $ < {m_{\ell \ell}} < $ 350 GeV (bottom left), and 350 $ < {m_{\ell \ell}} < $ 1000 GeV (bottom right). Details on the presentation of the results is given in Fig. 5. |
png pdf |
Figure 6-c:
Ratios of differential unfolded cross sections in $ {{p_{\mathrm {T}}} (\ell \ell)} $ for invariant mass ranges with respect to the peak region 76 $ < {m_{\ell \ell}} < $ 106 GeV: 50 $ < {m_{\ell \ell}} < $ 76 GeV (top left), 106 $ < {m_{\ell \ell}} < $ 170 GeV (top right), 170 $ < {m_{\ell \ell}} < $ 350 GeV (bottom left), and 350 $ < {m_{\ell \ell}} < $ 1000 GeV (bottom right). Details on the presentation of the results is given in Fig. 5. |

png pdf |
Figure 6-d:
Ratios of differential unfolded cross sections in $ {{p_{\mathrm {T}}} (\ell \ell)} $ for invariant mass ranges with respect to the peak region 76 $ < {m_{\ell \ell}} < $ 106 GeV: 50 $ < {m_{\ell \ell}} < $ 76 GeV (top left), 106 $ < {m_{\ell \ell}} < $ 170 GeV (top right), 170 $ < {m_{\ell \ell}} < $ 350 GeV (bottom left), and 350 $ < {m_{\ell \ell}} < $ 1000 GeV (bottom right). Details on the presentation of the results is given in Fig. 5. |
png pdf |
Figure 7:
Differential unfolded cross sections in $ {{p_{\mathrm {T}}} (\ell \ell)} $ for one or more jets in different invariant mass ranges: 50 $ < {m_{\ell \ell}} < $ 76 GeV (top left), 76 $ < {m_{\ell \ell}} < $ 106 GeV (top right), 106 $ < {m_{\ell \ell}} < $ 170 GeV (bottom left), and 170 $ < {m_{\ell \ell}} < $ 350 GeV (bottom right). Details on the presentation of the results is given in Fig. 5. |
png pdf |
Figure 7-a:
Differential unfolded cross sections in $ {{p_{\mathrm {T}}} (\ell \ell)} $ for one or more jets in different invariant mass ranges: 50 $ < {m_{\ell \ell}} < $ 76 GeV (top left), 76 $ < {m_{\ell \ell}} < $ 106 GeV (top right), 106 $ < {m_{\ell \ell}} < $ 170 GeV (bottom left), and 170 $ < {m_{\ell \ell}} < $ 350 GeV (bottom right). Details on the presentation of the results is given in Fig. 5. |
png pdf |
Figure 7-b:
Differential unfolded cross sections in $ {{p_{\mathrm {T}}} (\ell \ell)} $ for one or more jets in different invariant mass ranges: 50 $ < {m_{\ell \ell}} < $ 76 GeV (top left), 76 $ < {m_{\ell \ell}} < $ 106 GeV (top right), 106 $ < {m_{\ell \ell}} < $ 170 GeV (bottom left), and 170 $ < {m_{\ell \ell}} < $ 350 GeV (bottom right). Details on the presentation of the results is given in Fig. 5. |
png pdf |
Figure 7-c:
Differential unfolded cross sections in $ {{p_{\mathrm {T}}} (\ell \ell)} $ for one or more jets in different invariant mass ranges: 50 $ < {m_{\ell \ell}} < $ 76 GeV (top left), 76 $ < {m_{\ell \ell}} < $ 106 GeV (top right), 106 $ < {m_{\ell \ell}} < $ 170 GeV (bottom left), and 170 $ < {m_{\ell \ell}} < $ 350 GeV (bottom right). Details on the presentation of the results is given in Fig. 5. |
png pdf |
Figure 7-d:
Differential unfolded cross sections in $ {{p_{\mathrm {T}}} (\ell \ell)} $ for one or more jets in different invariant mass ranges: 50 $ < {m_{\ell \ell}} < $ 76 GeV (top left), 76 $ < {m_{\ell \ell}} < $ 106 GeV (top right), 106 $ < {m_{\ell \ell}} < $ 170 GeV (bottom left), and 170 $ < {m_{\ell \ell}} < $ 350 GeV (bottom right). Details on the presentation of the results is given in Fig. 5. |
png pdf |
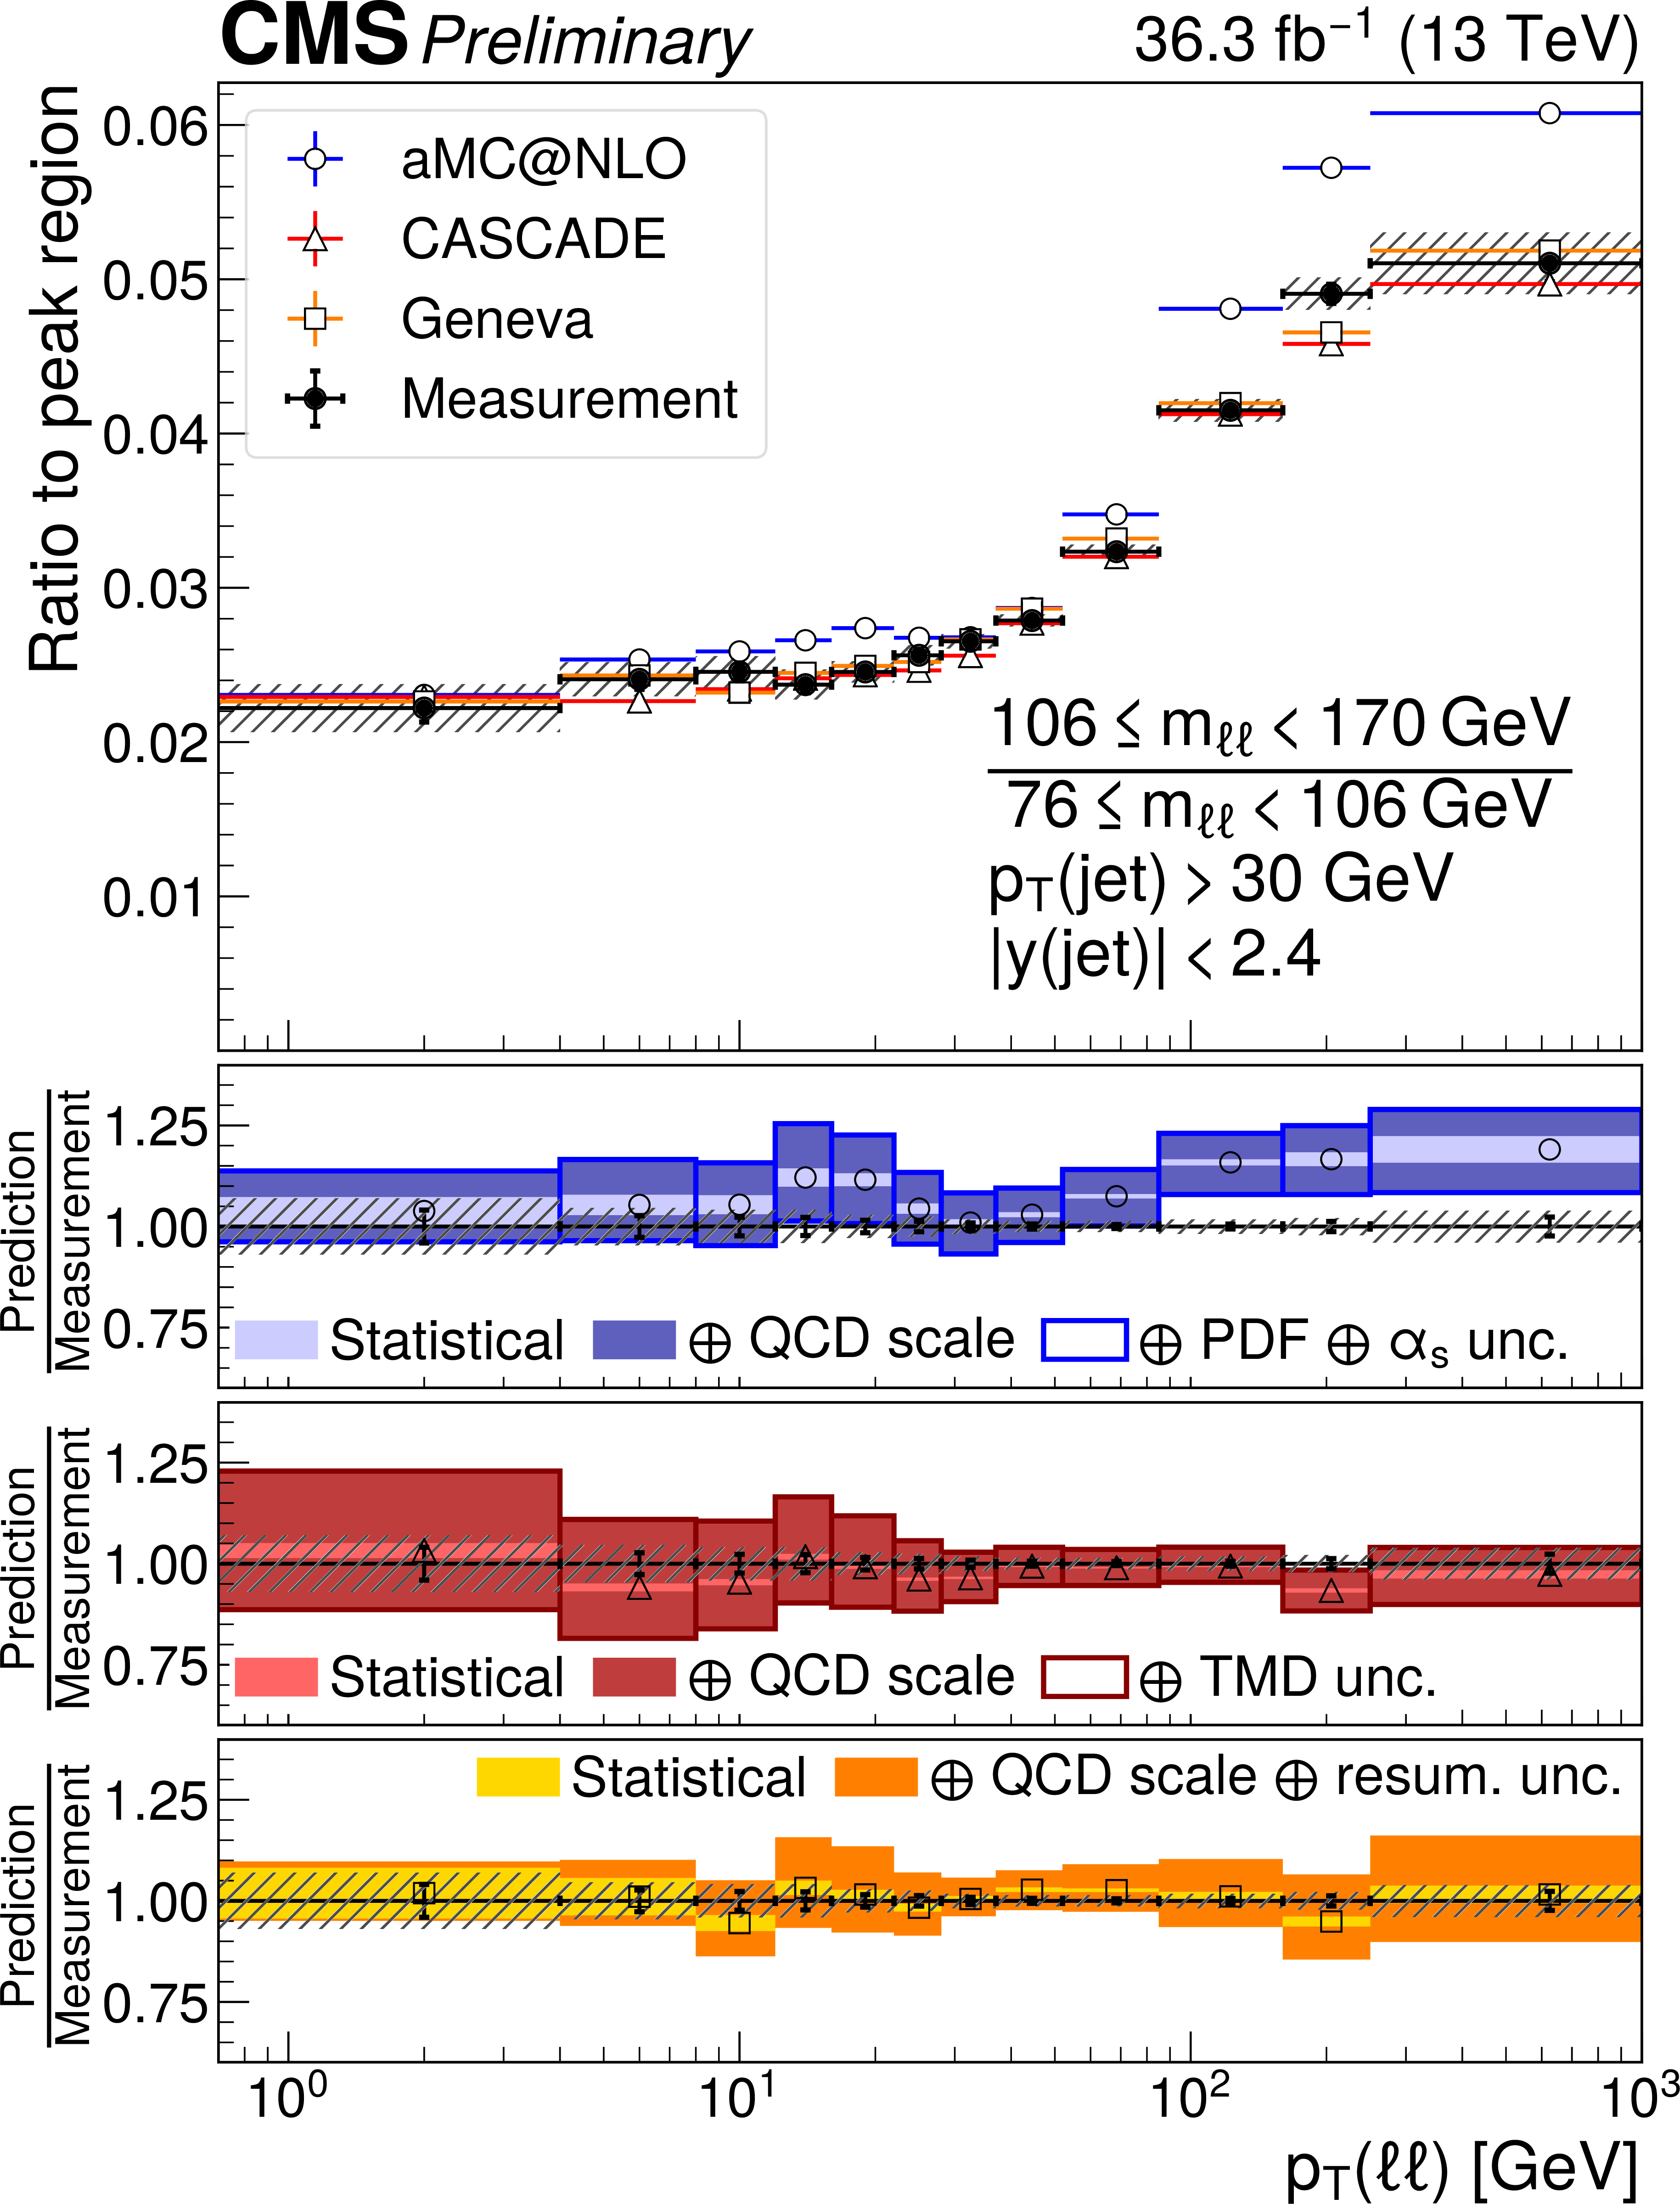
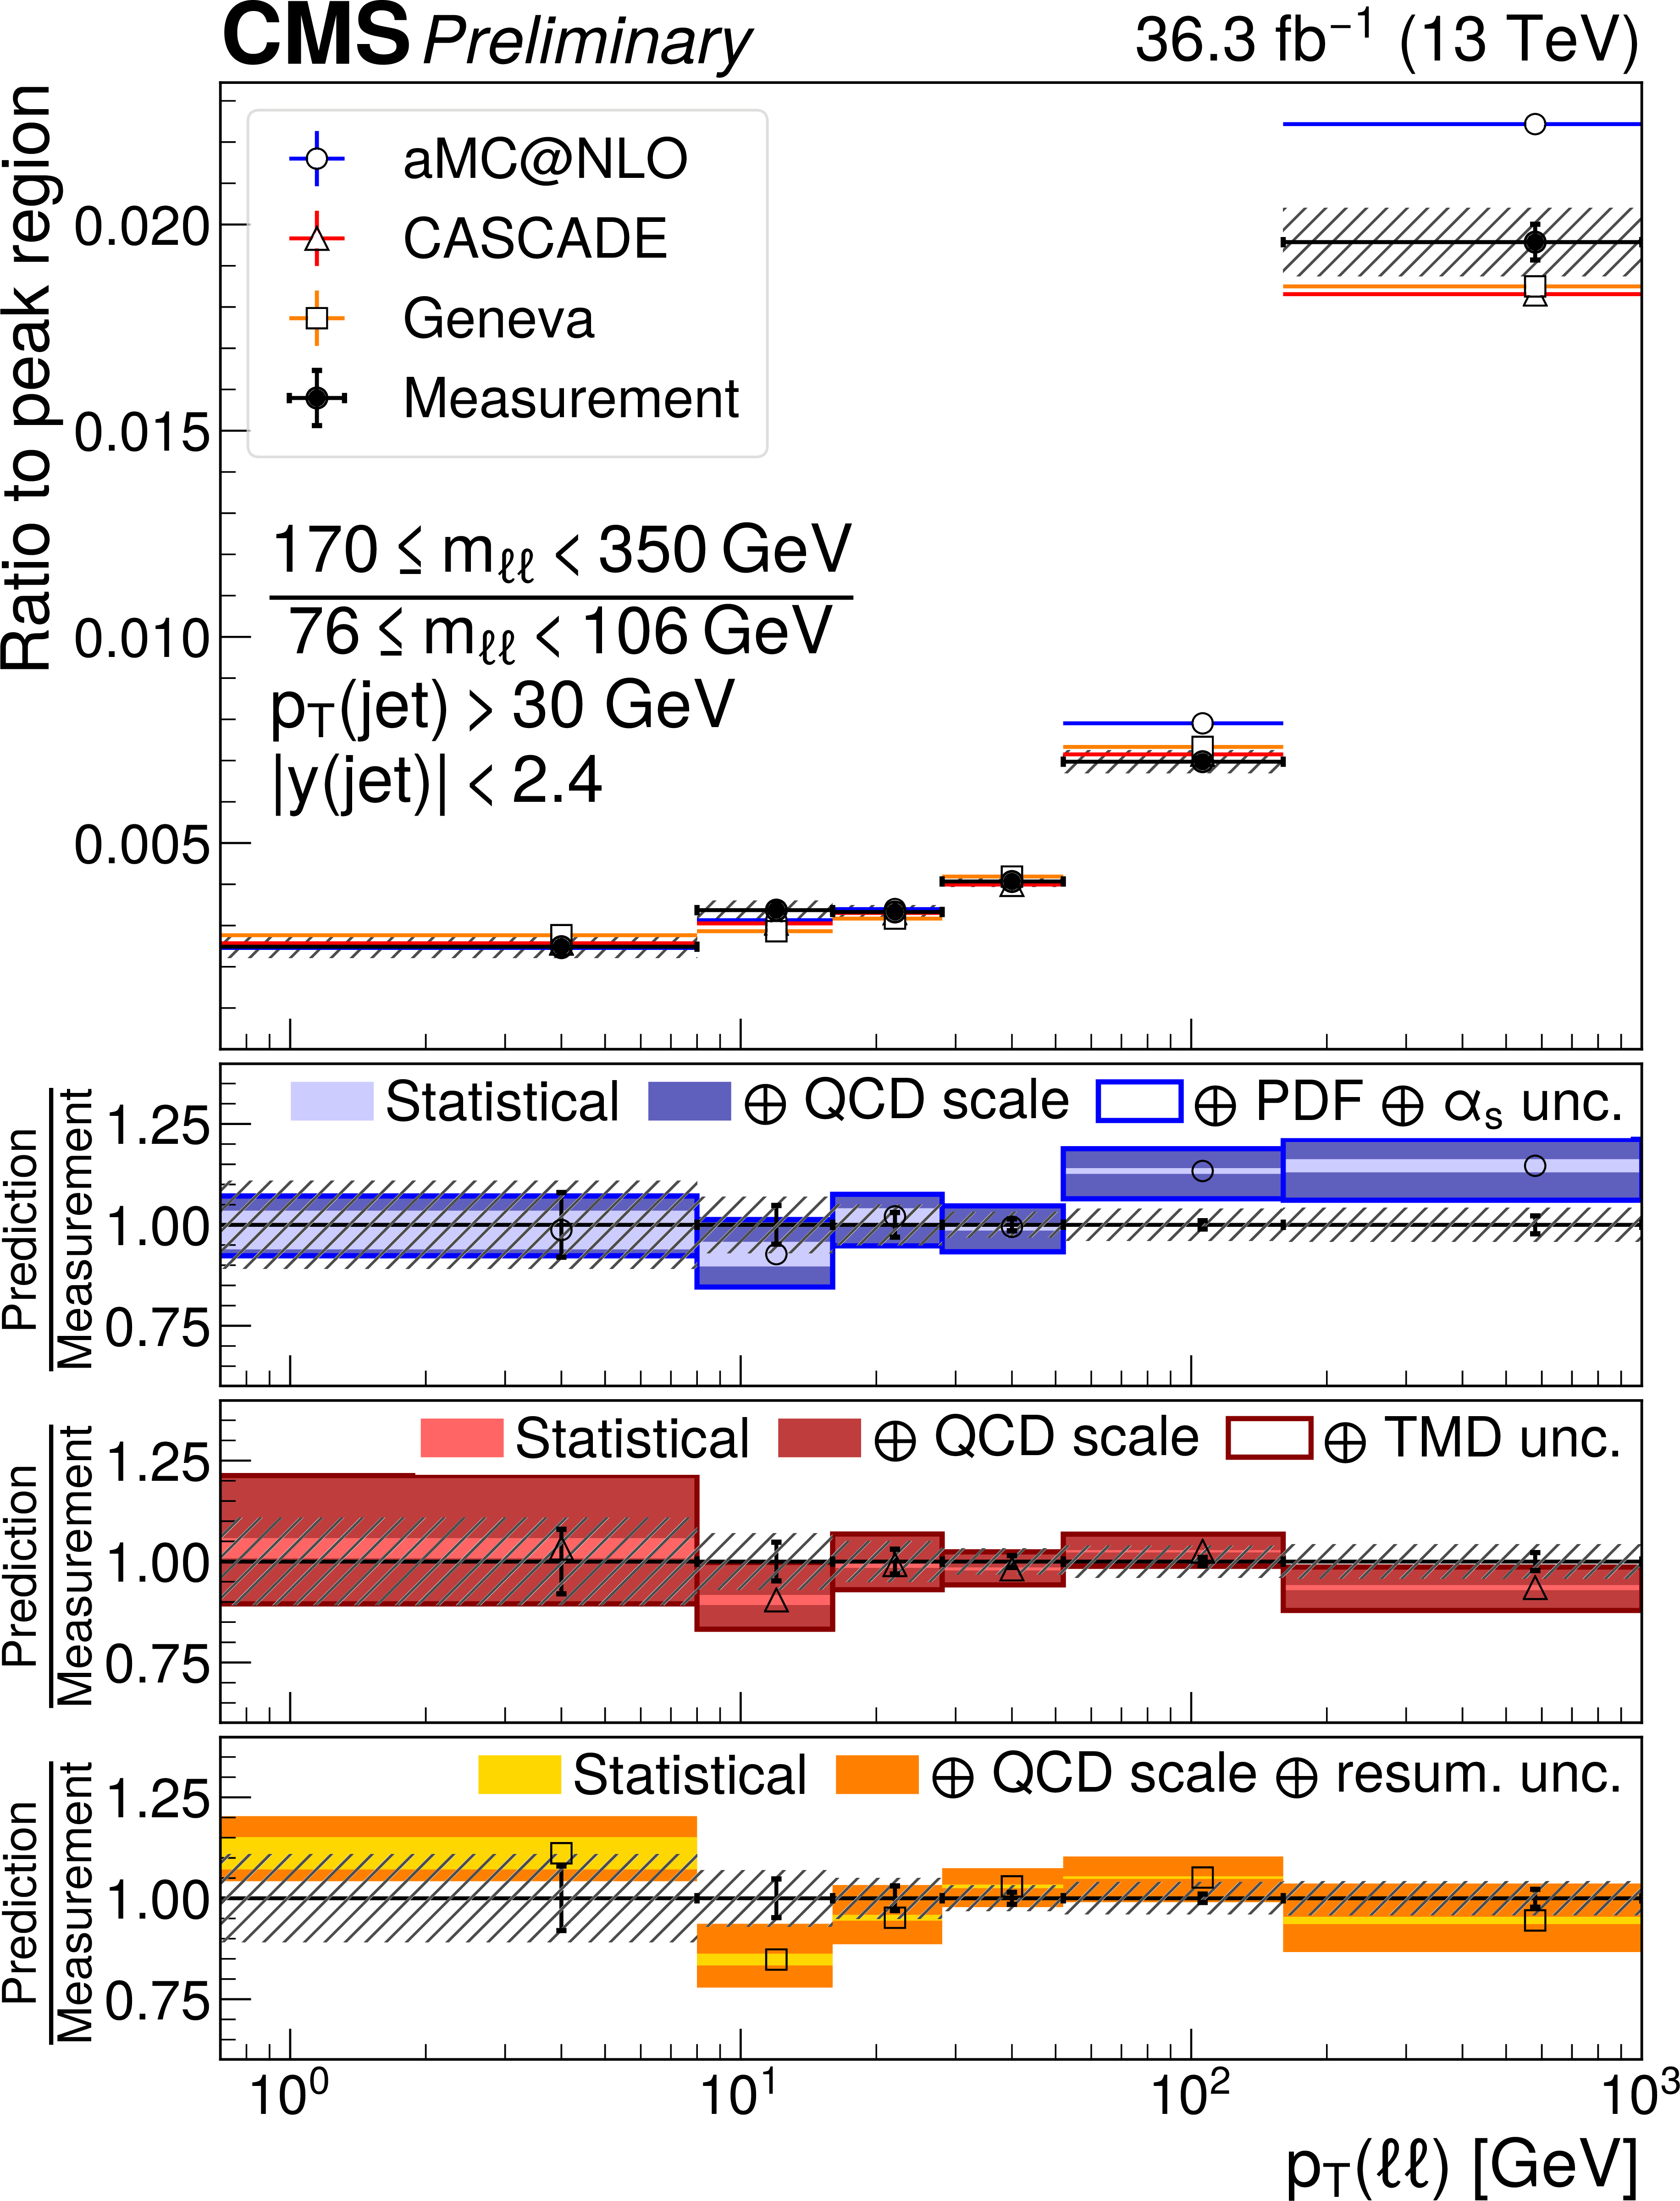
Figure 8:
Ratios of differential unfolded cross sections in $ {{p_{\mathrm {T}}} (\ell \ell)} $ for one or more jets in different for invariant mass ranges with respect to the peak region 76 $ < {m_{\ell \ell}} < $ 106 GeV: 50 $ < {m_{\ell \ell}} < $ 76 GeV (top left), 106 $ < {m_{\ell \ell}} < $ 170 GeV (top right), and 170 $ < {m_{\ell \ell}} < $ 350 GeV (bottom). Details on the presentation of the results is given in Fig. 5. |
png pdf |
Figure 8-a:
Ratios of differential unfolded cross sections in $ {{p_{\mathrm {T}}} (\ell \ell)} $ for one or more jets in different for invariant mass ranges with respect to the peak region 76 $ < {m_{\ell \ell}} < $ 106 GeV: 50 $ < {m_{\ell \ell}} < $ 76 GeV (top left), 106 $ < {m_{\ell \ell}} < $ 170 GeV (top right), and 170 $ < {m_{\ell \ell}} < $ 350 GeV (bottom). Details on the presentation of the results is given in Fig. 5. |
png pdf |
Figure 8-b:
Ratios of differential unfolded cross sections in $ {{p_{\mathrm {T}}} (\ell \ell)} $ for one or more jets in different for invariant mass ranges with respect to the peak region 76 $ < {m_{\ell \ell}} < $ 106 GeV: 50 $ < {m_{\ell \ell}} < $ 76 GeV (top left), 106 $ < {m_{\ell \ell}} < $ 170 GeV (top right), and 170 $ < {m_{\ell \ell}} < $ 350 GeV (bottom). Details on the presentation of the results is given in Fig. 5. |
png pdf |
Figure 8-c:
Ratios of differential unfolded cross sections in $ {{p_{\mathrm {T}}} (\ell \ell)} $ for one or more jets in different for invariant mass ranges with respect to the peak region 76 $ < {m_{\ell \ell}} < $ 106 GeV: 50 $ < {m_{\ell \ell}} < $ 76 GeV (top left), 106 $ < {m_{\ell \ell}} < $ 170 GeV (top right), and 170 $ < {m_{\ell \ell}} < $ 350 GeV (bottom). Details on the presentation of the results is given in Fig. 5. |
png pdf |
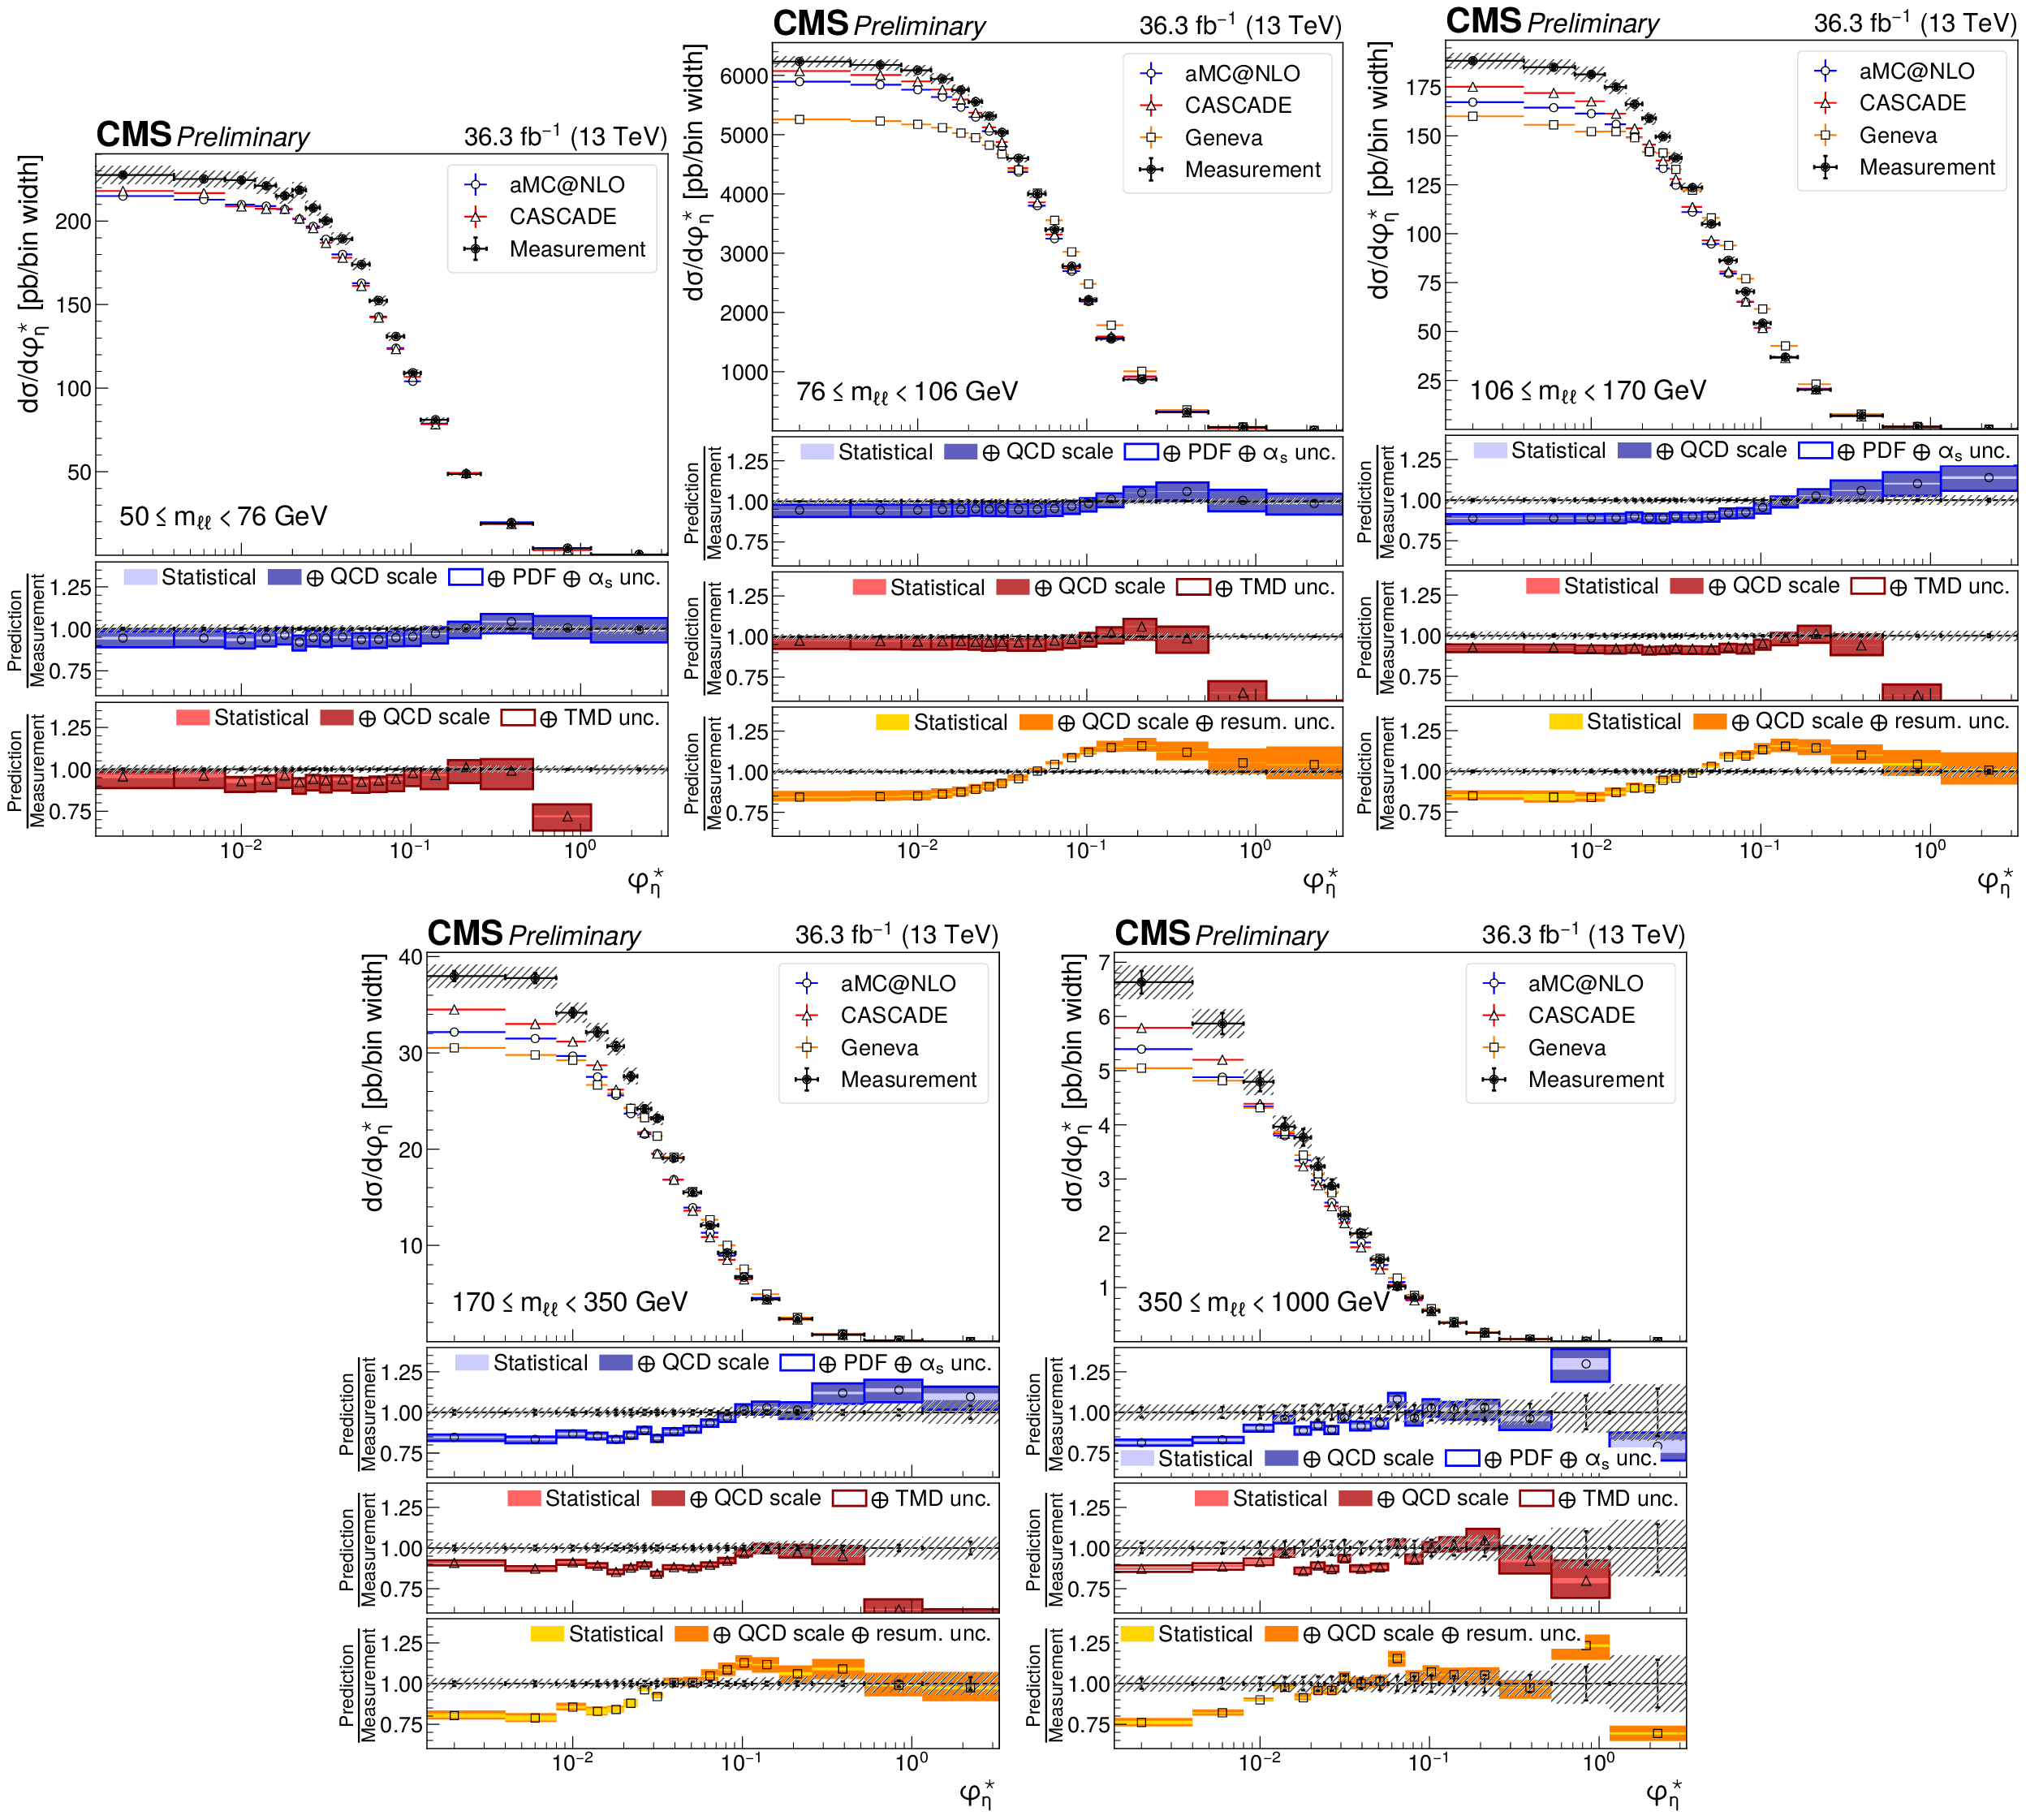
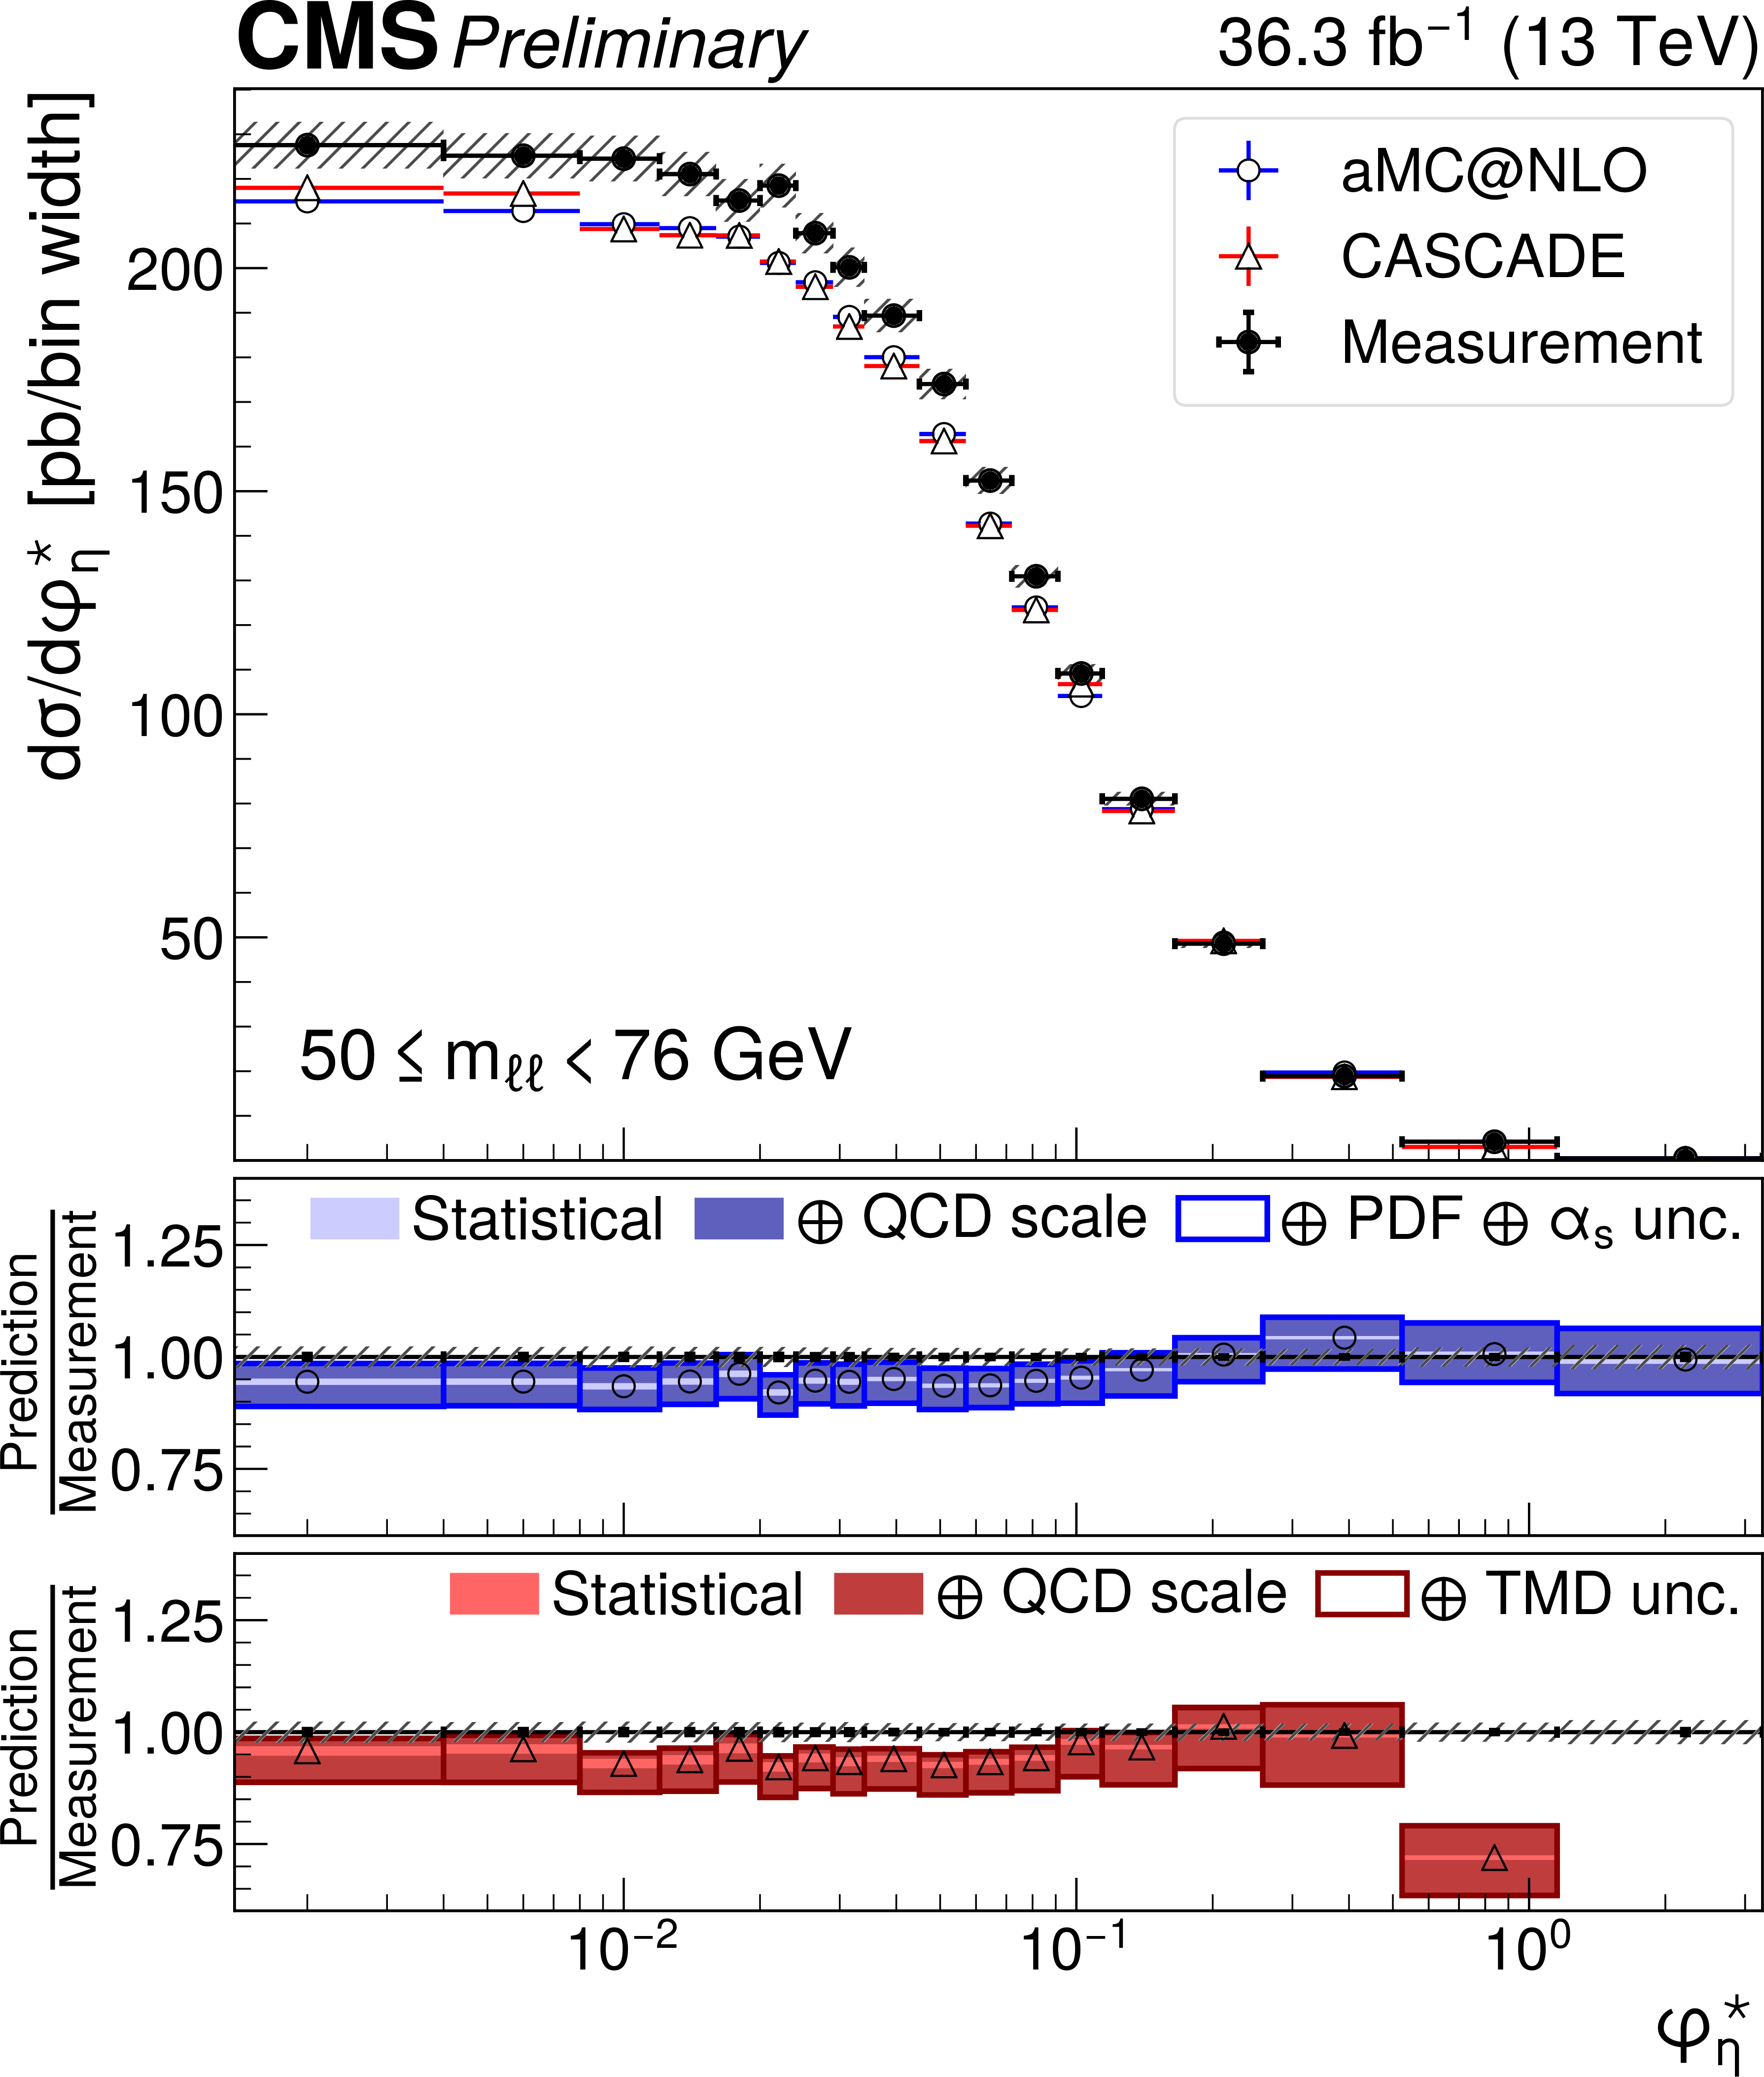
Figure 9:
Differential unfolded cross sections in $ {\varphi ^*} (\ell \ell)$ in different invariant mass ranges: 50 $ < {m_{\ell \ell}} < $ 76 GeV (top left), 76 $ < {m_{\ell \ell}} < $ 106 GeV (top center), 106 $ < {m_{\ell \ell}} < $ 170 GeV (top right), 170 $ < {m_{\ell \ell}} < $ 350 GeV (bottom left), and 350 $ < {m_{\ell \ell}} < $ 1000 GeV (bottom right). Details on the presentation of the results is given in Fig. 5 |
png pdf |
Figure 9-a:
Differential unfolded cross sections in $ {\varphi ^*} (\ell \ell)$ in different invariant mass ranges: 50 $ < {m_{\ell \ell}} < $ 76 GeV (top left), 76 $ < {m_{\ell \ell}} < $ 106 GeV (top center), 106 $ < {m_{\ell \ell}} < $ 170 GeV (top right), 170 $ < {m_{\ell \ell}} < $ 350 GeV (bottom left), and 350 $ < {m_{\ell \ell}} < $ 1000 GeV (bottom right). Details on the presentation of the results is given in Fig. 5 |

png pdf |
Figure 9-b:
Differential unfolded cross sections in $ {\varphi ^*} (\ell \ell)$ in different invariant mass ranges: 50 $ < {m_{\ell \ell}} < $ 76 GeV (top left), 76 $ < {m_{\ell \ell}} < $ 106 GeV (top center), 106 $ < {m_{\ell \ell}} < $ 170 GeV (top right), 170 $ < {m_{\ell \ell}} < $ 350 GeV (bottom left), and 350 $ < {m_{\ell \ell}} < $ 1000 GeV (bottom right). Details on the presentation of the results is given in Fig. 5 |
png pdf |
Figure 9-c:
Differential unfolded cross sections in $ {\varphi ^*} (\ell \ell)$ in different invariant mass ranges: 50 $ < {m_{\ell \ell}} < $ 76 GeV (top left), 76 $ < {m_{\ell \ell}} < $ 106 GeV (top center), 106 $ < {m_{\ell \ell}} < $ 170 GeV (top right), 170 $ < {m_{\ell \ell}} < $ 350 GeV (bottom left), and 350 $ < {m_{\ell \ell}} < $ 1000 GeV (bottom right). Details on the presentation of the results is given in Fig. 5 |
png pdf |
Figure 9-d:
Differential unfolded cross sections in $ {\varphi ^*} (\ell \ell)$ in different invariant mass ranges: 50 $ < {m_{\ell \ell}} < $ 76 GeV (top left), 76 $ < {m_{\ell \ell}} < $ 106 GeV (top center), 106 $ < {m_{\ell \ell}} < $ 170 GeV (top right), 170 $ < {m_{\ell \ell}} < $ 350 GeV (bottom left), and 350 $ < {m_{\ell \ell}} < $ 1000 GeV (bottom right). Details on the presentation of the results is given in Fig. 5 |
png pdf |
Figure 9-e:
Differential unfolded cross sections in $ {\varphi ^*} (\ell \ell)$ in different invariant mass ranges: 50 $ < {m_{\ell \ell}} < $ 76 GeV (top left), 76 $ < {m_{\ell \ell}} < $ 106 GeV (top center), 106 $ < {m_{\ell \ell}} < $ 170 GeV (top right), 170 $ < {m_{\ell \ell}} < $ 350 GeV (bottom left), and 350 $ < {m_{\ell \ell}} < $ 1000 GeV (bottom right). Details on the presentation of the results is given in Fig. 5 |
png pdf |
Figure 10:
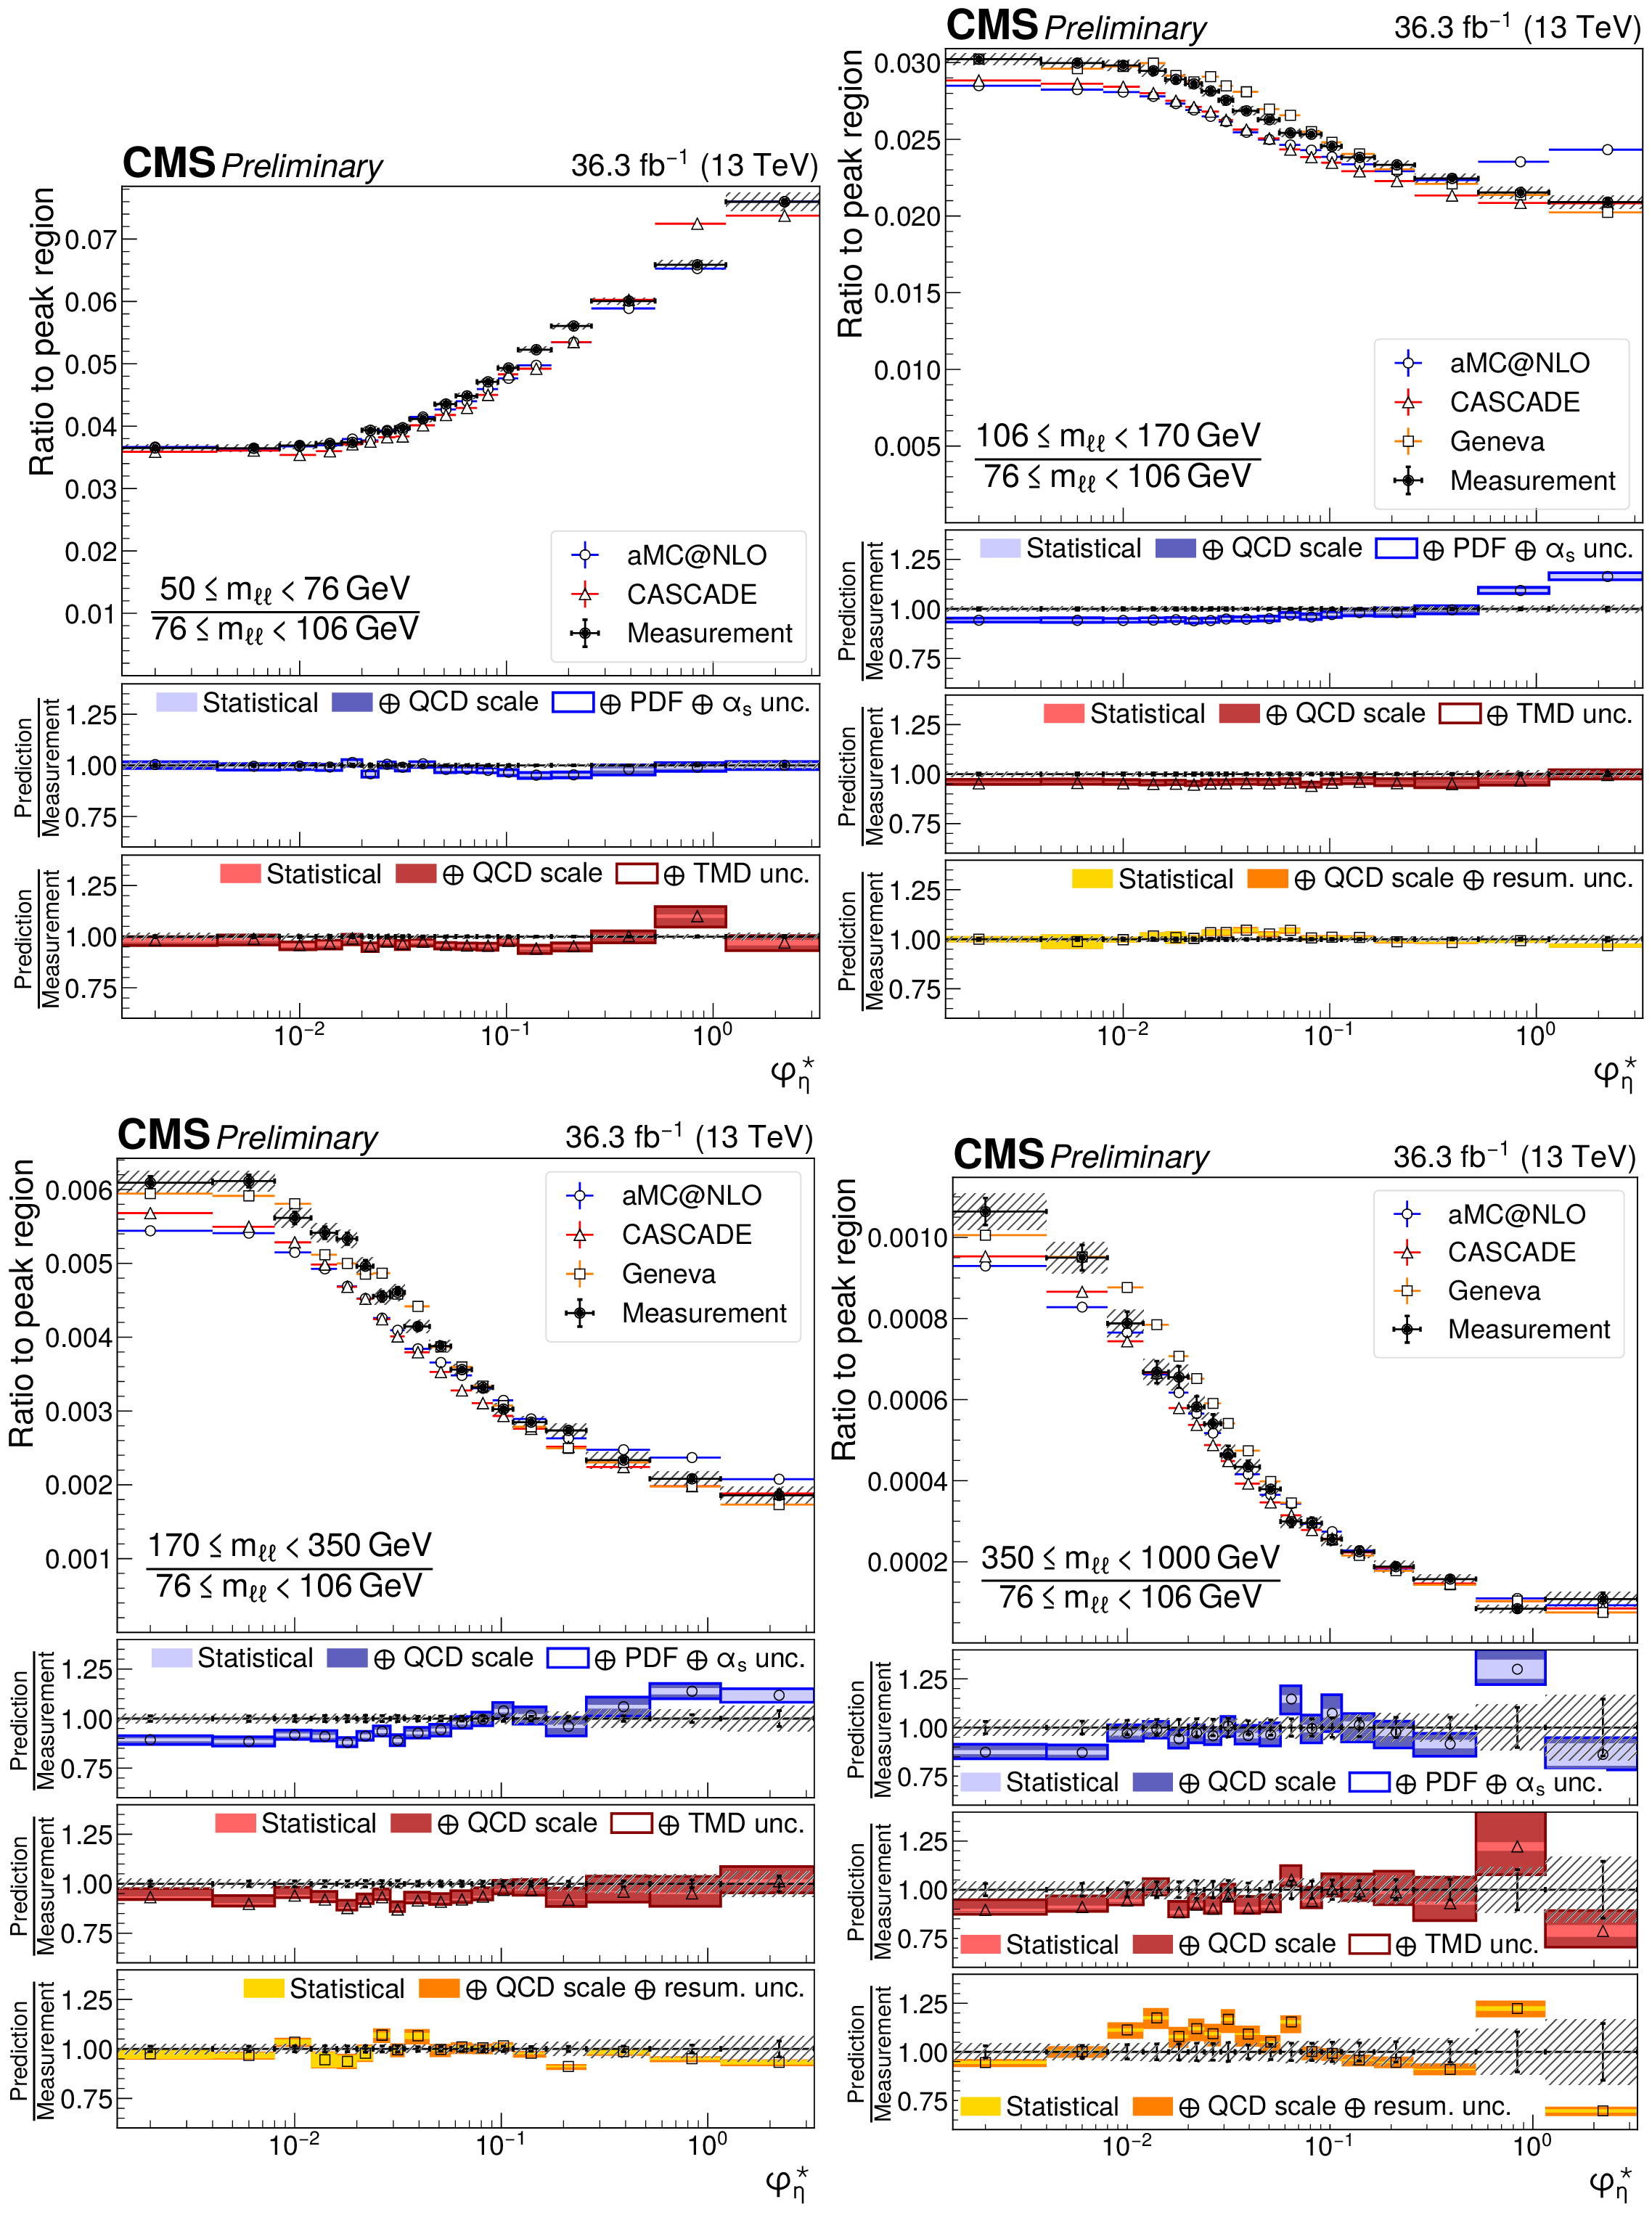
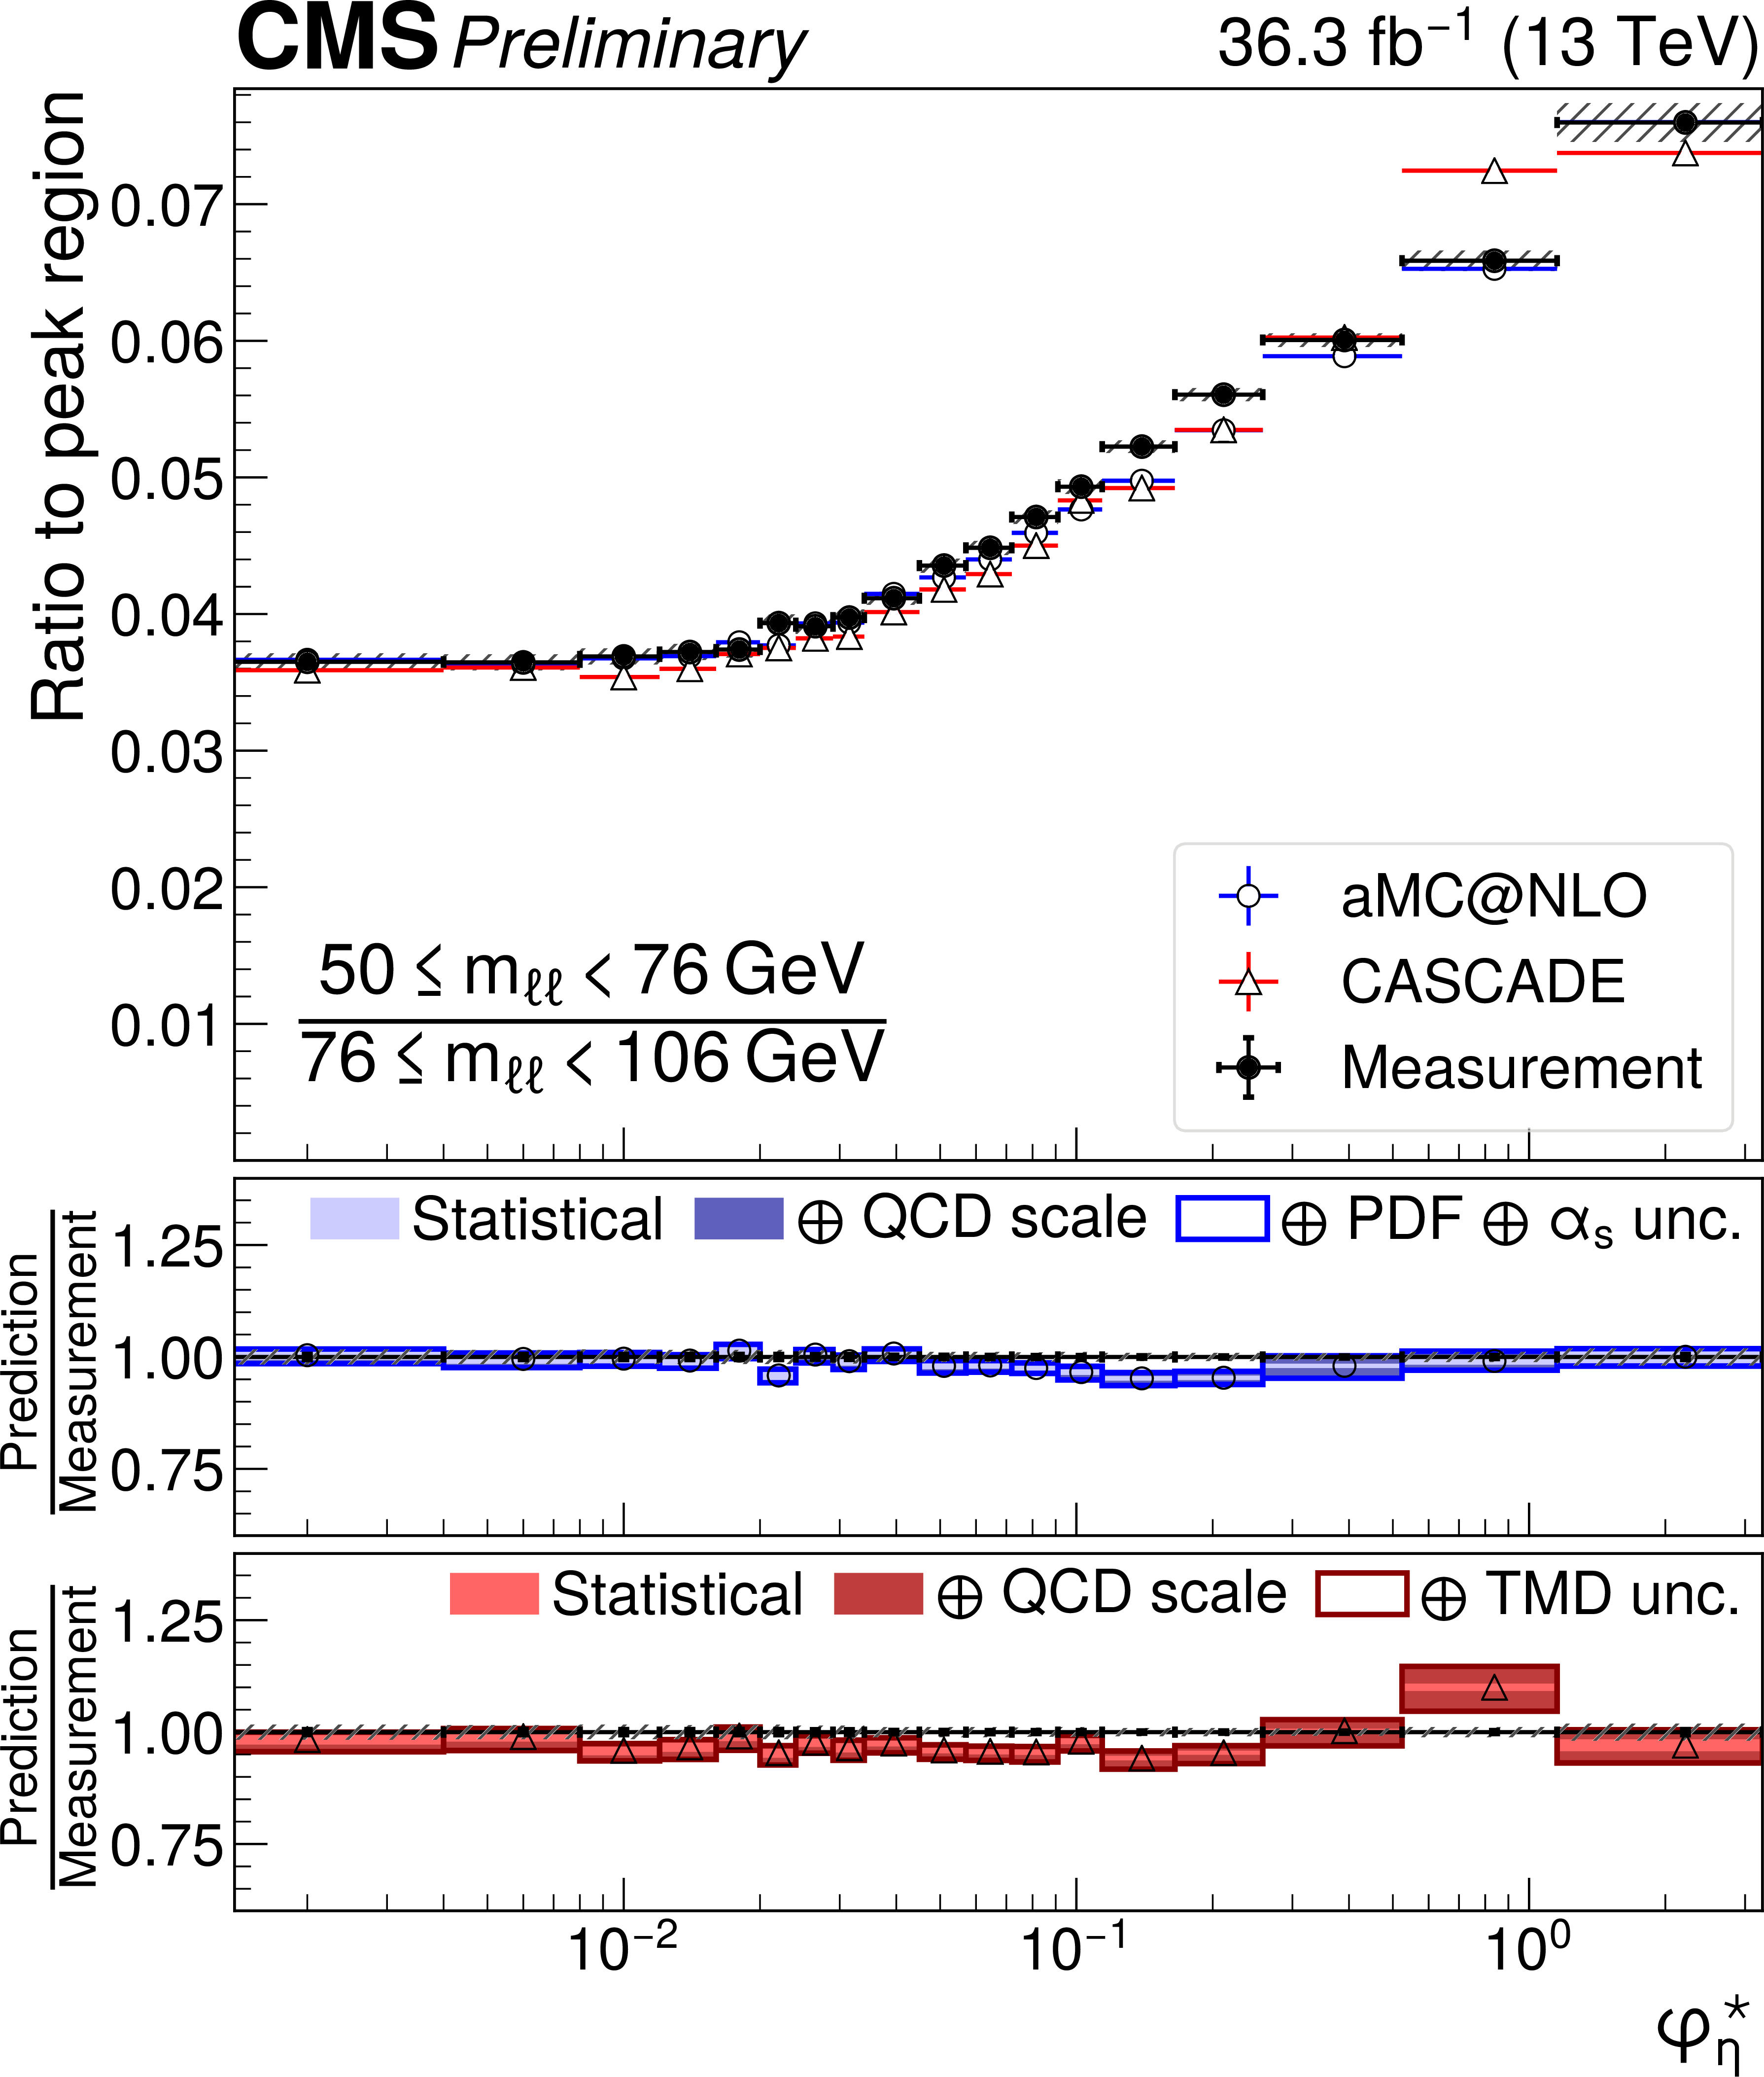
Ratios of differential unfolded cross sections in $ {\varphi ^*} (\ell \ell)$ for invariant mass ranges with respect to the peak region 76 $ < {m_{\ell \ell}} < $ 106 GeV: 50 $ < {m_{\ell \ell}} < $ 76 GeV (top left), 106 $ < {m_{\ell \ell}} < $ 170 GeV (top right), 170 $ < {m_{\ell \ell}} < $ 350 GeV (bottom left), and 350 $ < {m_{\ell \ell}} < $ 1000 GeV (bottom right). Details on the presentation of the results is given in Fig. 5. |
png pdf |
Figure 10-a:
Ratios of differential unfolded cross sections in $ {\varphi ^*} (\ell \ell)$ for invariant mass ranges with respect to the peak region 76 $ < {m_{\ell \ell}} < $ 106 GeV: 50 $ < {m_{\ell \ell}} < $ 76 GeV (top left), 106 $ < {m_{\ell \ell}} < $ 170 GeV (top right), 170 $ < {m_{\ell \ell}} < $ 350 GeV (bottom left), and 350 $ < {m_{\ell \ell}} < $ 1000 GeV (bottom right). Details on the presentation of the results is given in Fig. 5. |

png pdf |
Figure 10-b:
Ratios of differential unfolded cross sections in $ {\varphi ^*} (\ell \ell)$ for invariant mass ranges with respect to the peak region 76 $ < {m_{\ell \ell}} < $ 106 GeV: 50 $ < {m_{\ell \ell}} < $ 76 GeV (top left), 106 $ < {m_{\ell \ell}} < $ 170 GeV (top right), 170 $ < {m_{\ell \ell}} < $ 350 GeV (bottom left), and 350 $ < {m_{\ell \ell}} < $ 1000 GeV (bottom right). Details on the presentation of the results is given in Fig. 5. |

png pdf |
Figure 10-c:
Ratios of differential unfolded cross sections in $ {\varphi ^*} (\ell \ell)$ for invariant mass ranges with respect to the peak region 76 $ < {m_{\ell \ell}} < $ 106 GeV: 50 $ < {m_{\ell \ell}} < $ 76 GeV (top left), 106 $ < {m_{\ell \ell}} < $ 170 GeV (top right), 170 $ < {m_{\ell \ell}} < $ 350 GeV (bottom left), and 350 $ < {m_{\ell \ell}} < $ 1000 GeV (bottom right). Details on the presentation of the results is given in Fig. 5. |

png pdf |
Figure 10-d:
Ratios of differential unfolded cross sections in $ {\varphi ^*} (\ell \ell)$ for invariant mass ranges with respect to the peak region 76 $ < {m_{\ell \ell}} < $ 106 GeV: 50 $ < {m_{\ell \ell}} < $ 76 GeV (top left), 106 $ < {m_{\ell \ell}} < $ 170 GeV (top right), 170 $ < {m_{\ell \ell}} < $ 350 GeV (bottom left), and 350 $ < {m_{\ell \ell}} < $ 1000 GeV (bottom right). Details on the presentation of the results is given in Fig. 5. |
| Tables | |
png pdf |
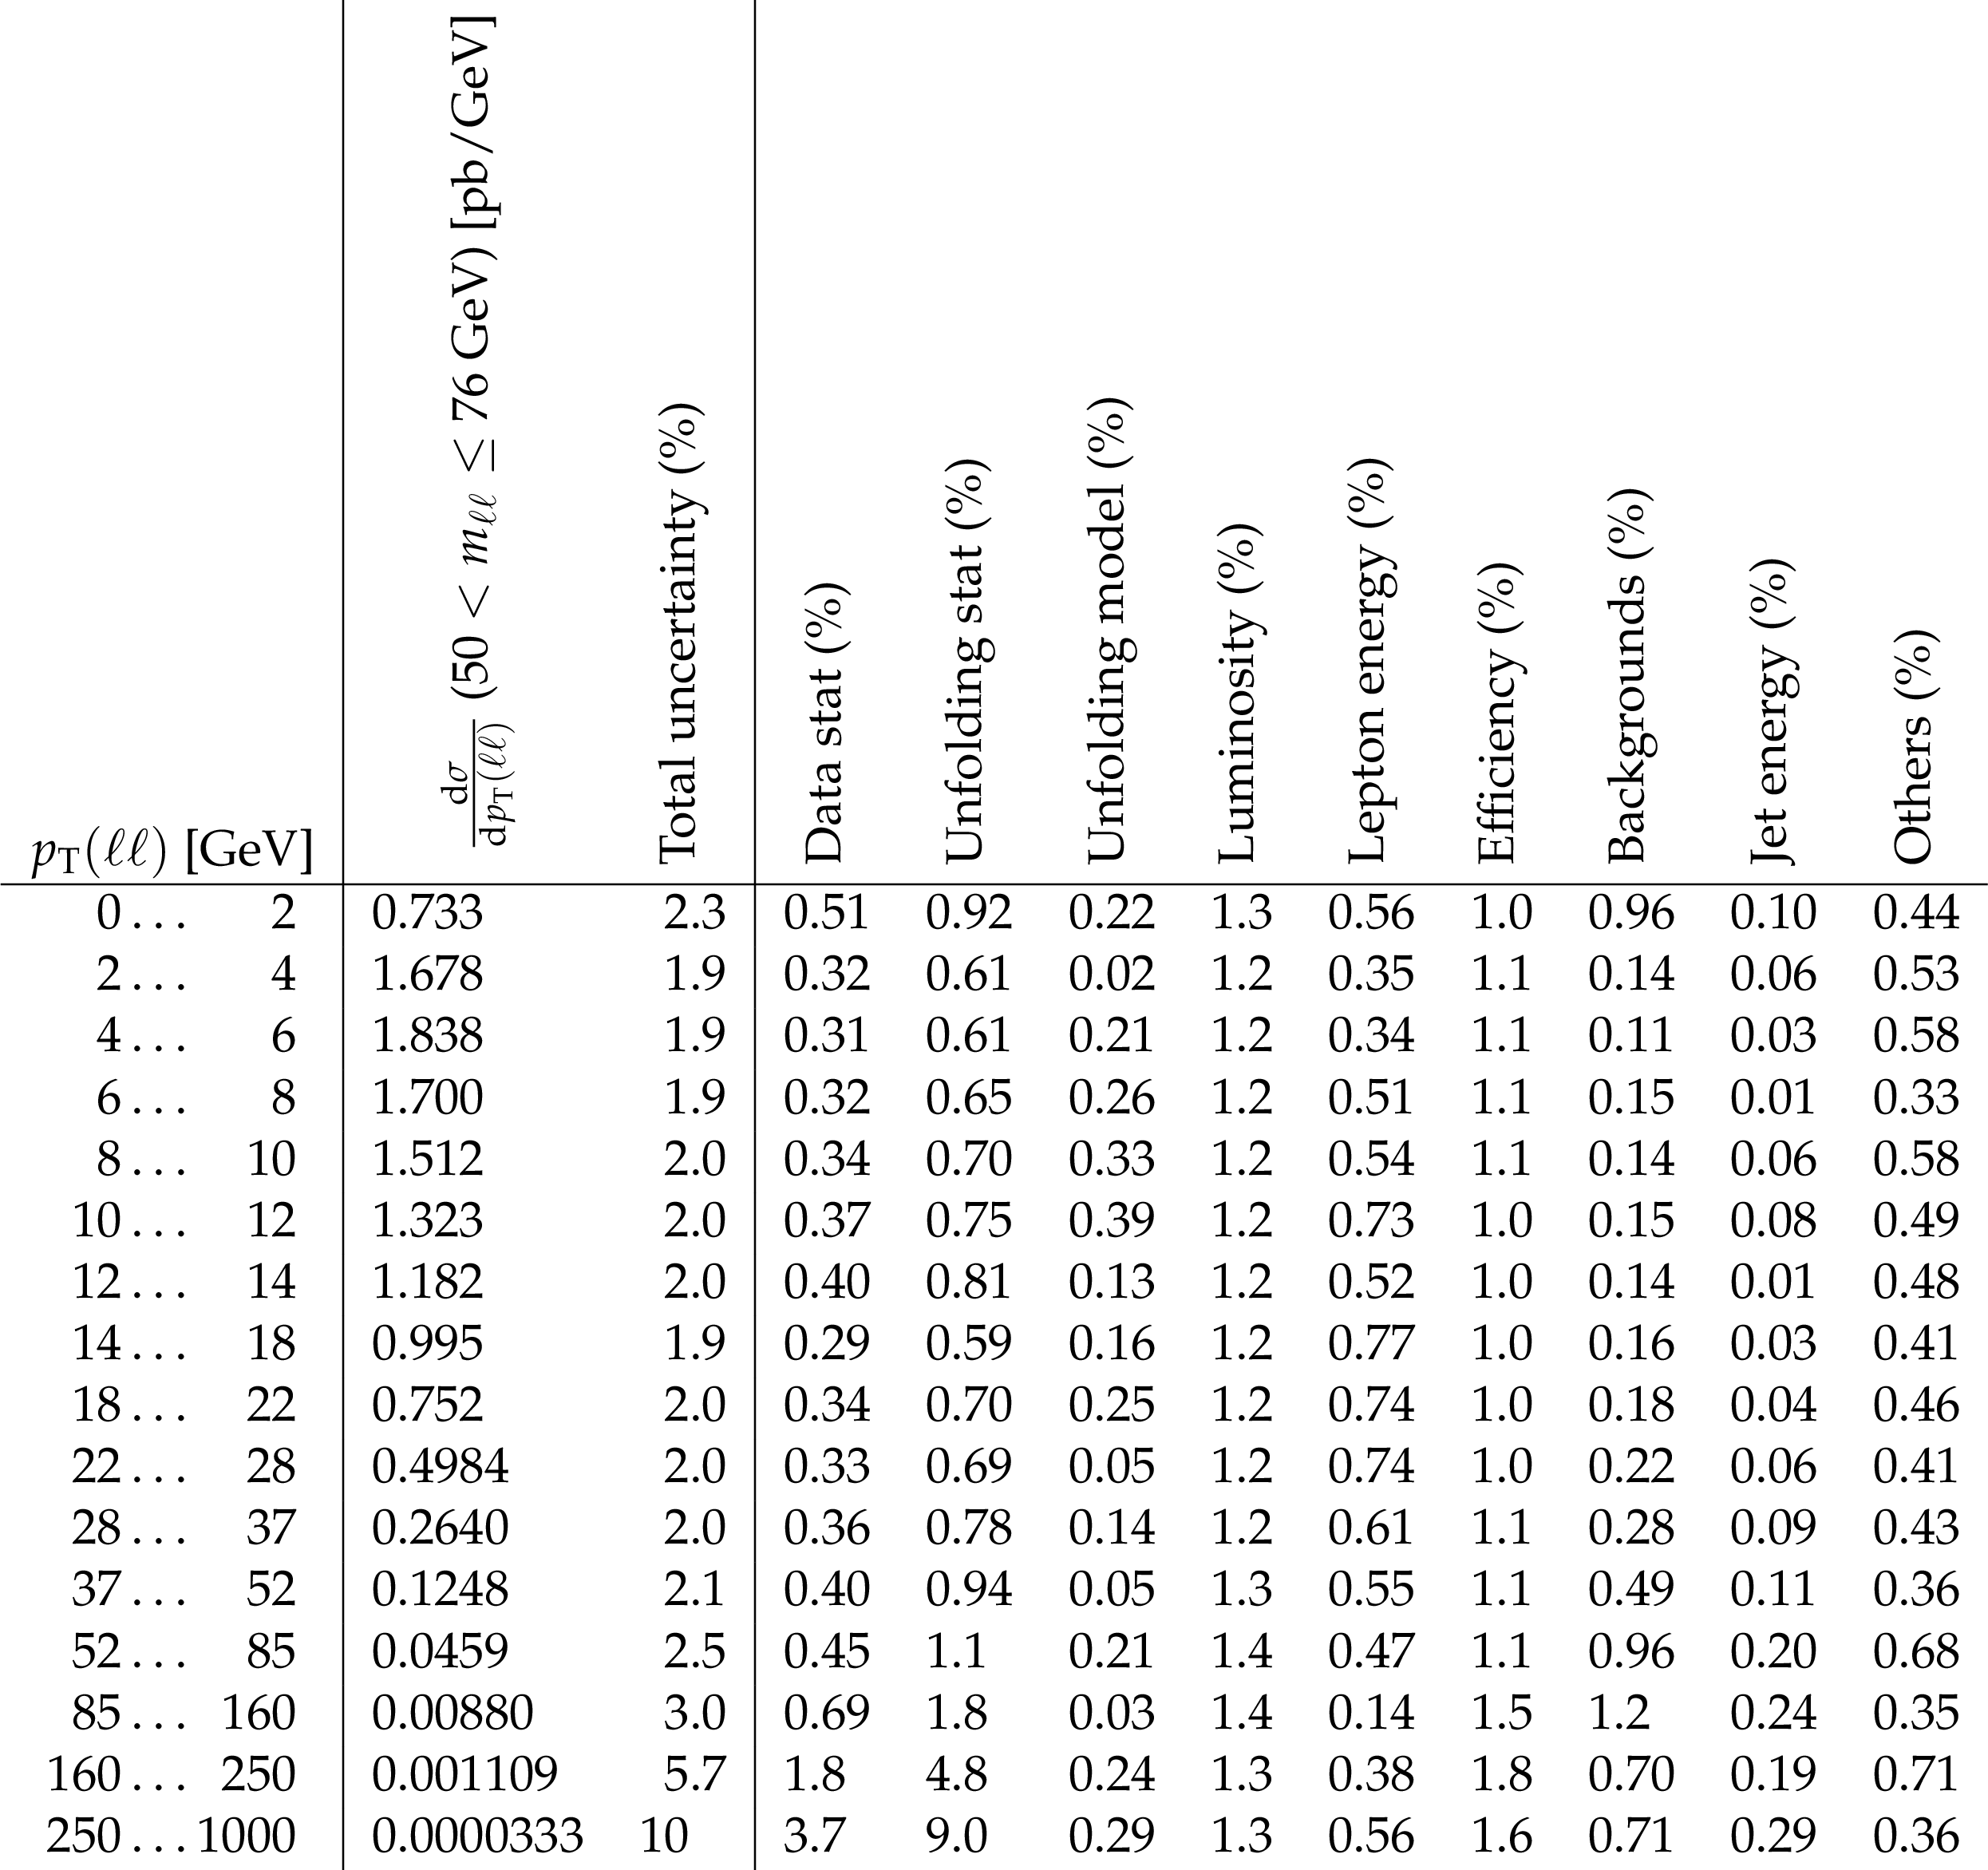
Table 1:
Differential cross section in $ {p_{\mathrm {T}}} (\ell \ell)$ for the 50 $ < m_{\ell \ell}\le $ 76 GeV mass window in the combination of the two channels, and breakdown of the uncertainties. A dash (-) in the table means the uncertainty is less than 0.01%. |
png pdf |
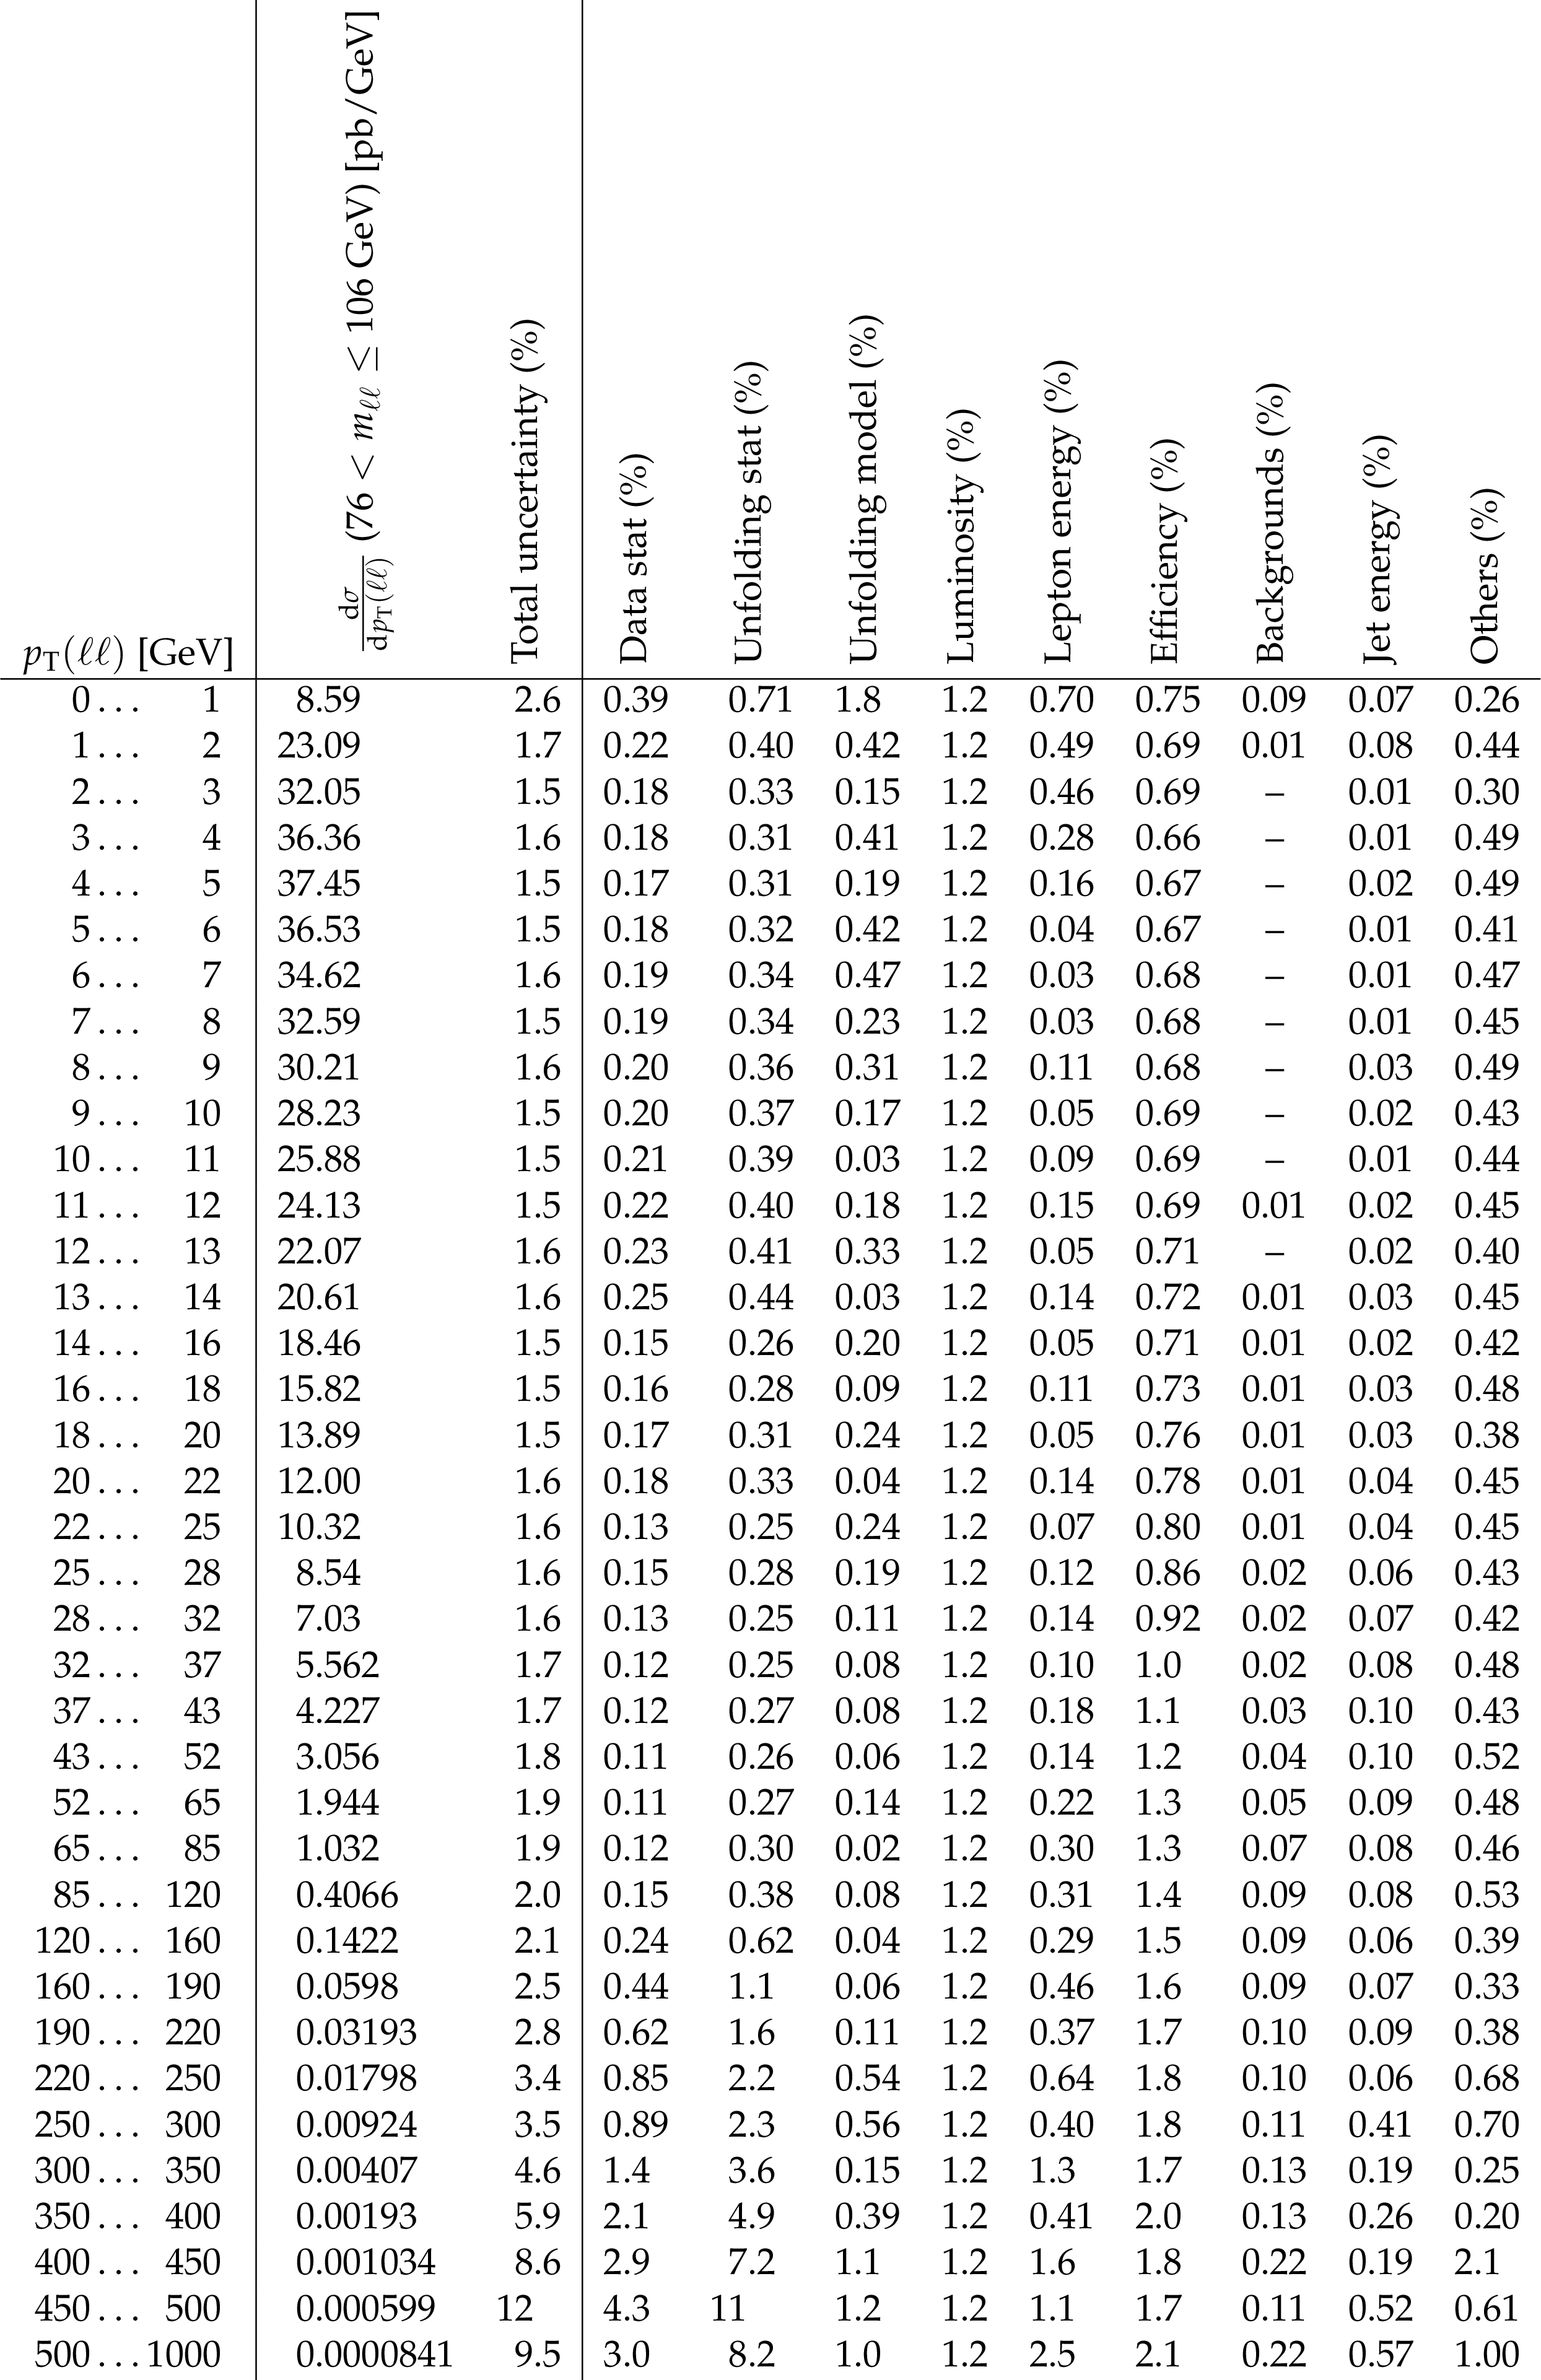
Table 2:
Differential cross section in $ {p_{\mathrm {T}}} (\ell \ell)$ for the 76 $ < m_{\ell \ell}\le $ 106 GeV mass window in the combination of the two channels, and breakdown of the uncertainties. A dash (-) in the table means the uncertainty is less than 0.01%. |

png pdf |
Table 3:
Differential cross section in $ {p_{\mathrm {T}}} (\ell \ell)$ for the 106 $ < m_{\ell \ell}\le $ 170 GeV mass window in the combination of the two channels, and breakdown of the uncertainties. A dash (-) in the table means the uncertainty is less than 0.01%. |
png pdf |
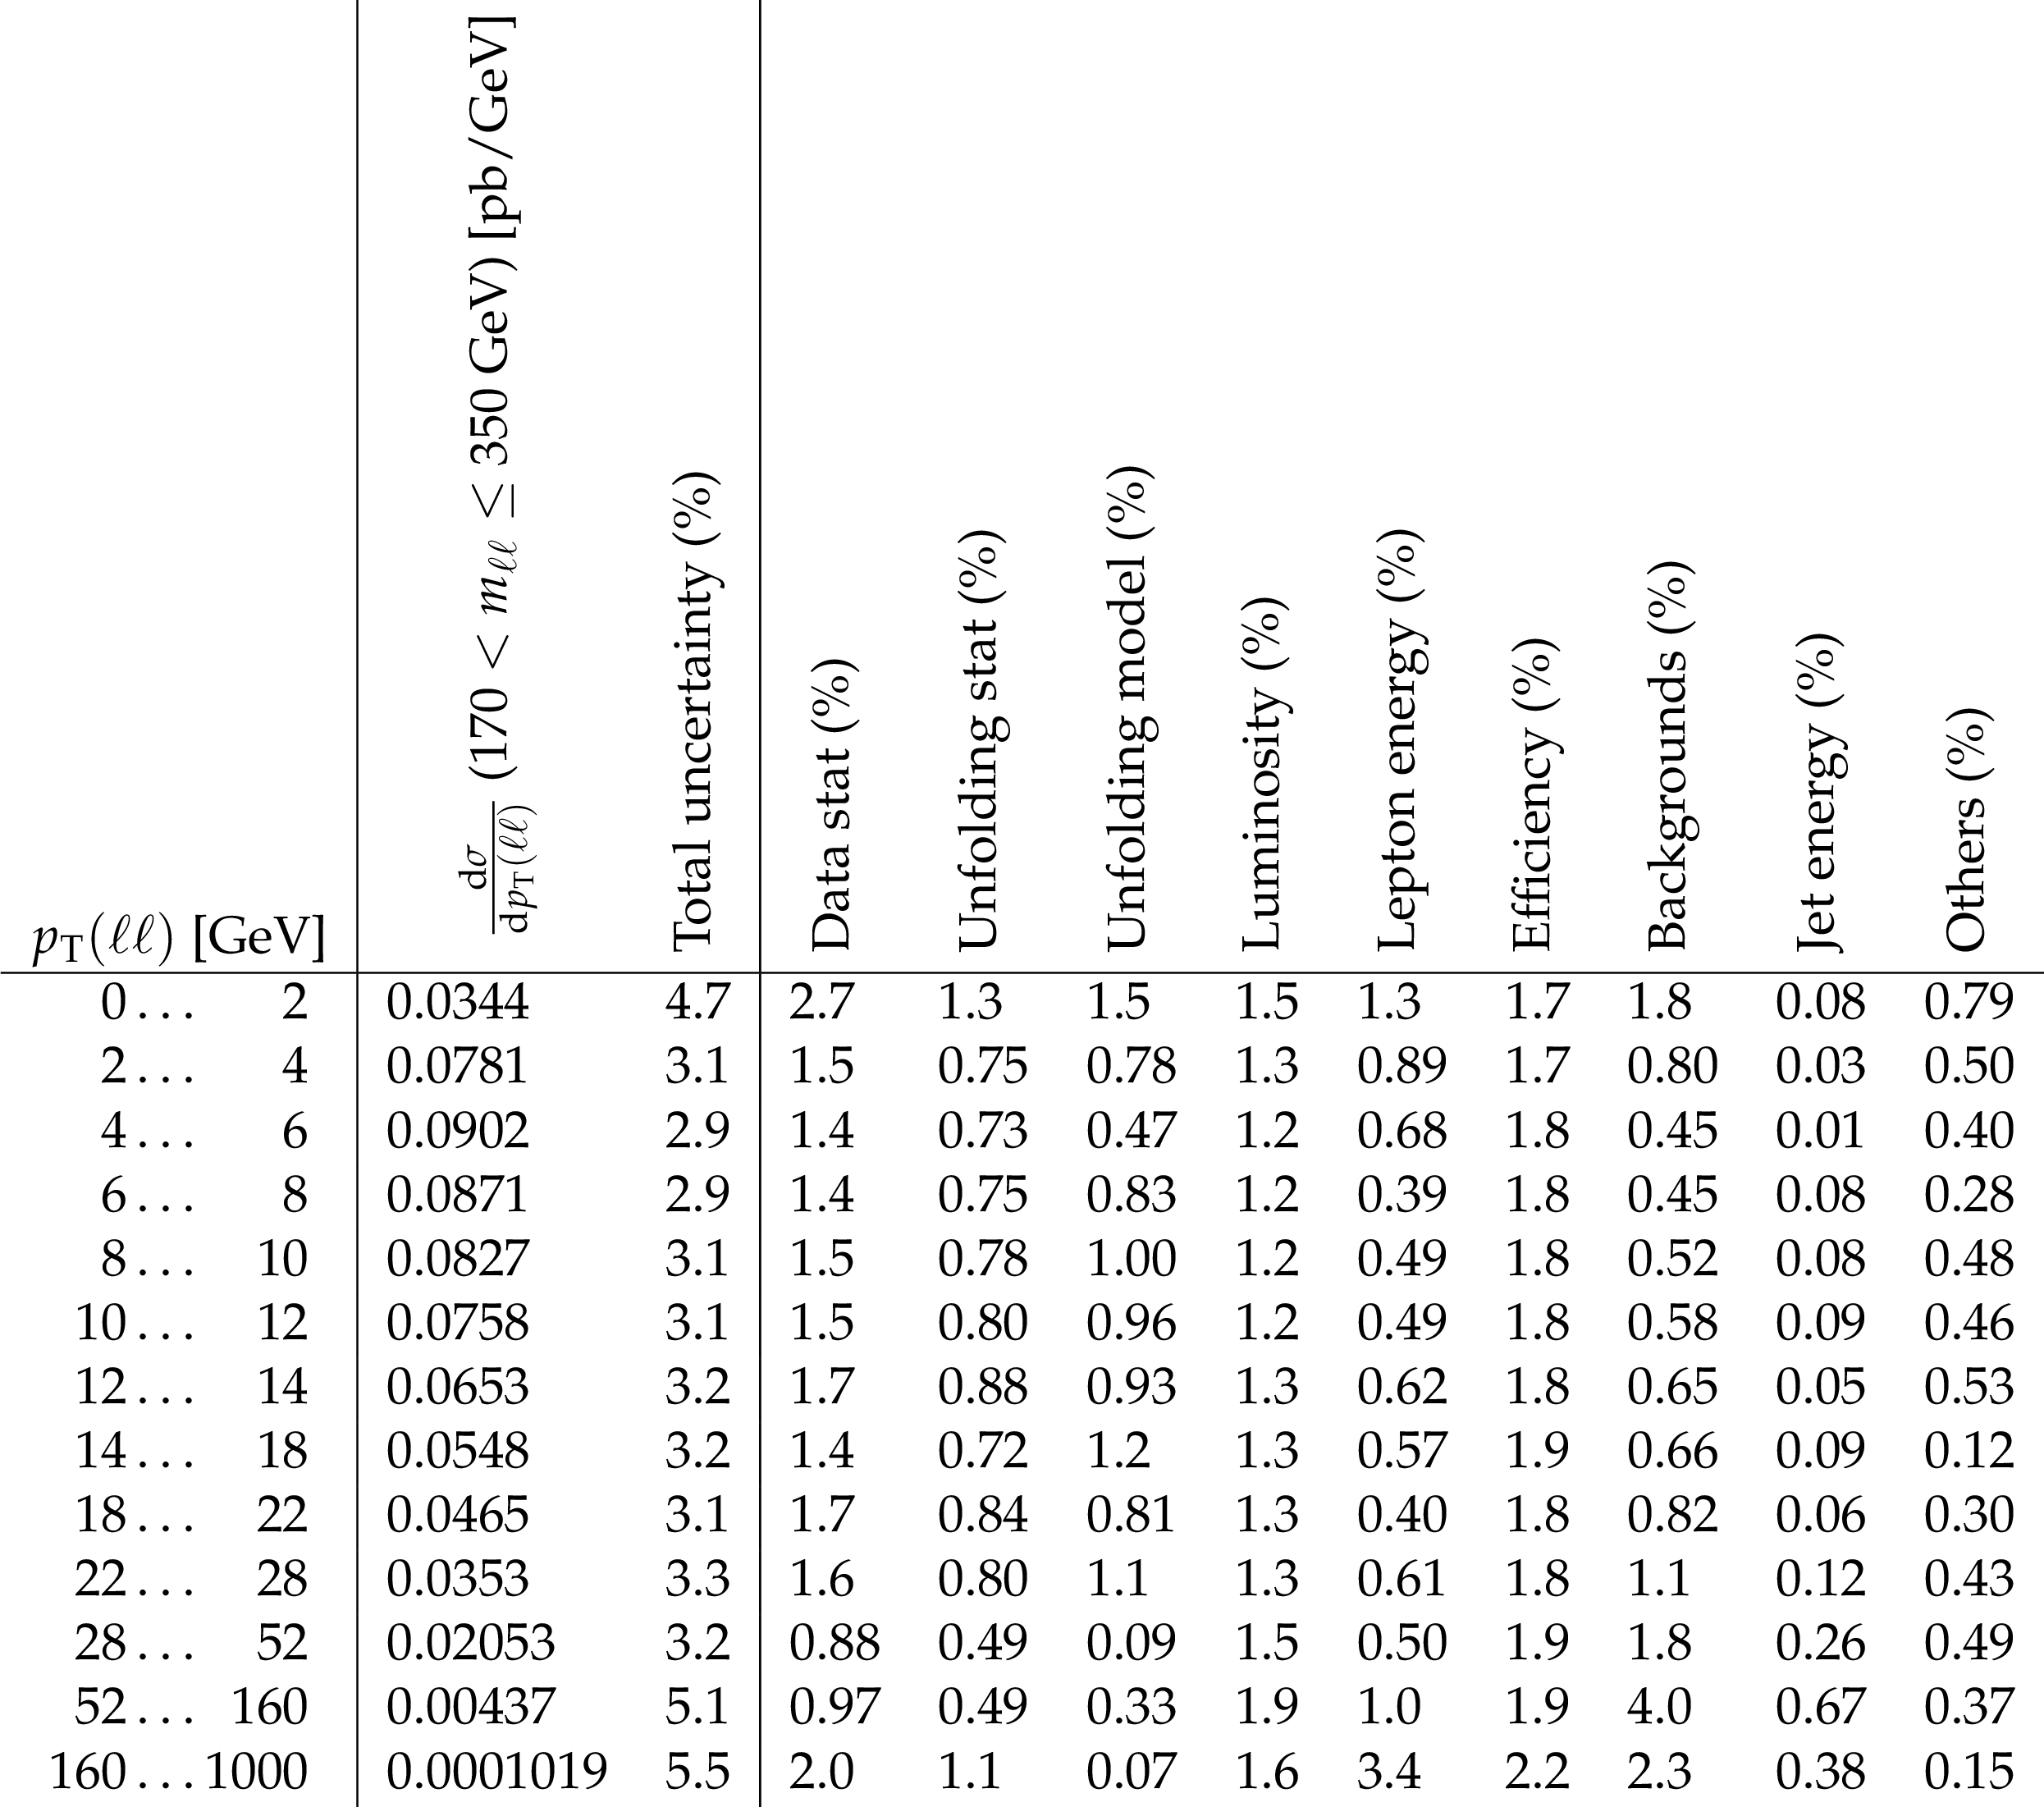
Table 4:
Differential cross section in $ {p_{\mathrm {T}}} (\ell \ell)$ for the 170 $ < m_{\ell \ell}\le $ 350 GeV mass window in the combination of the two channels, and breakdown of the uncertainties. A dash (-) in the table means the uncertainty is less than 0.01%. |
png pdf |
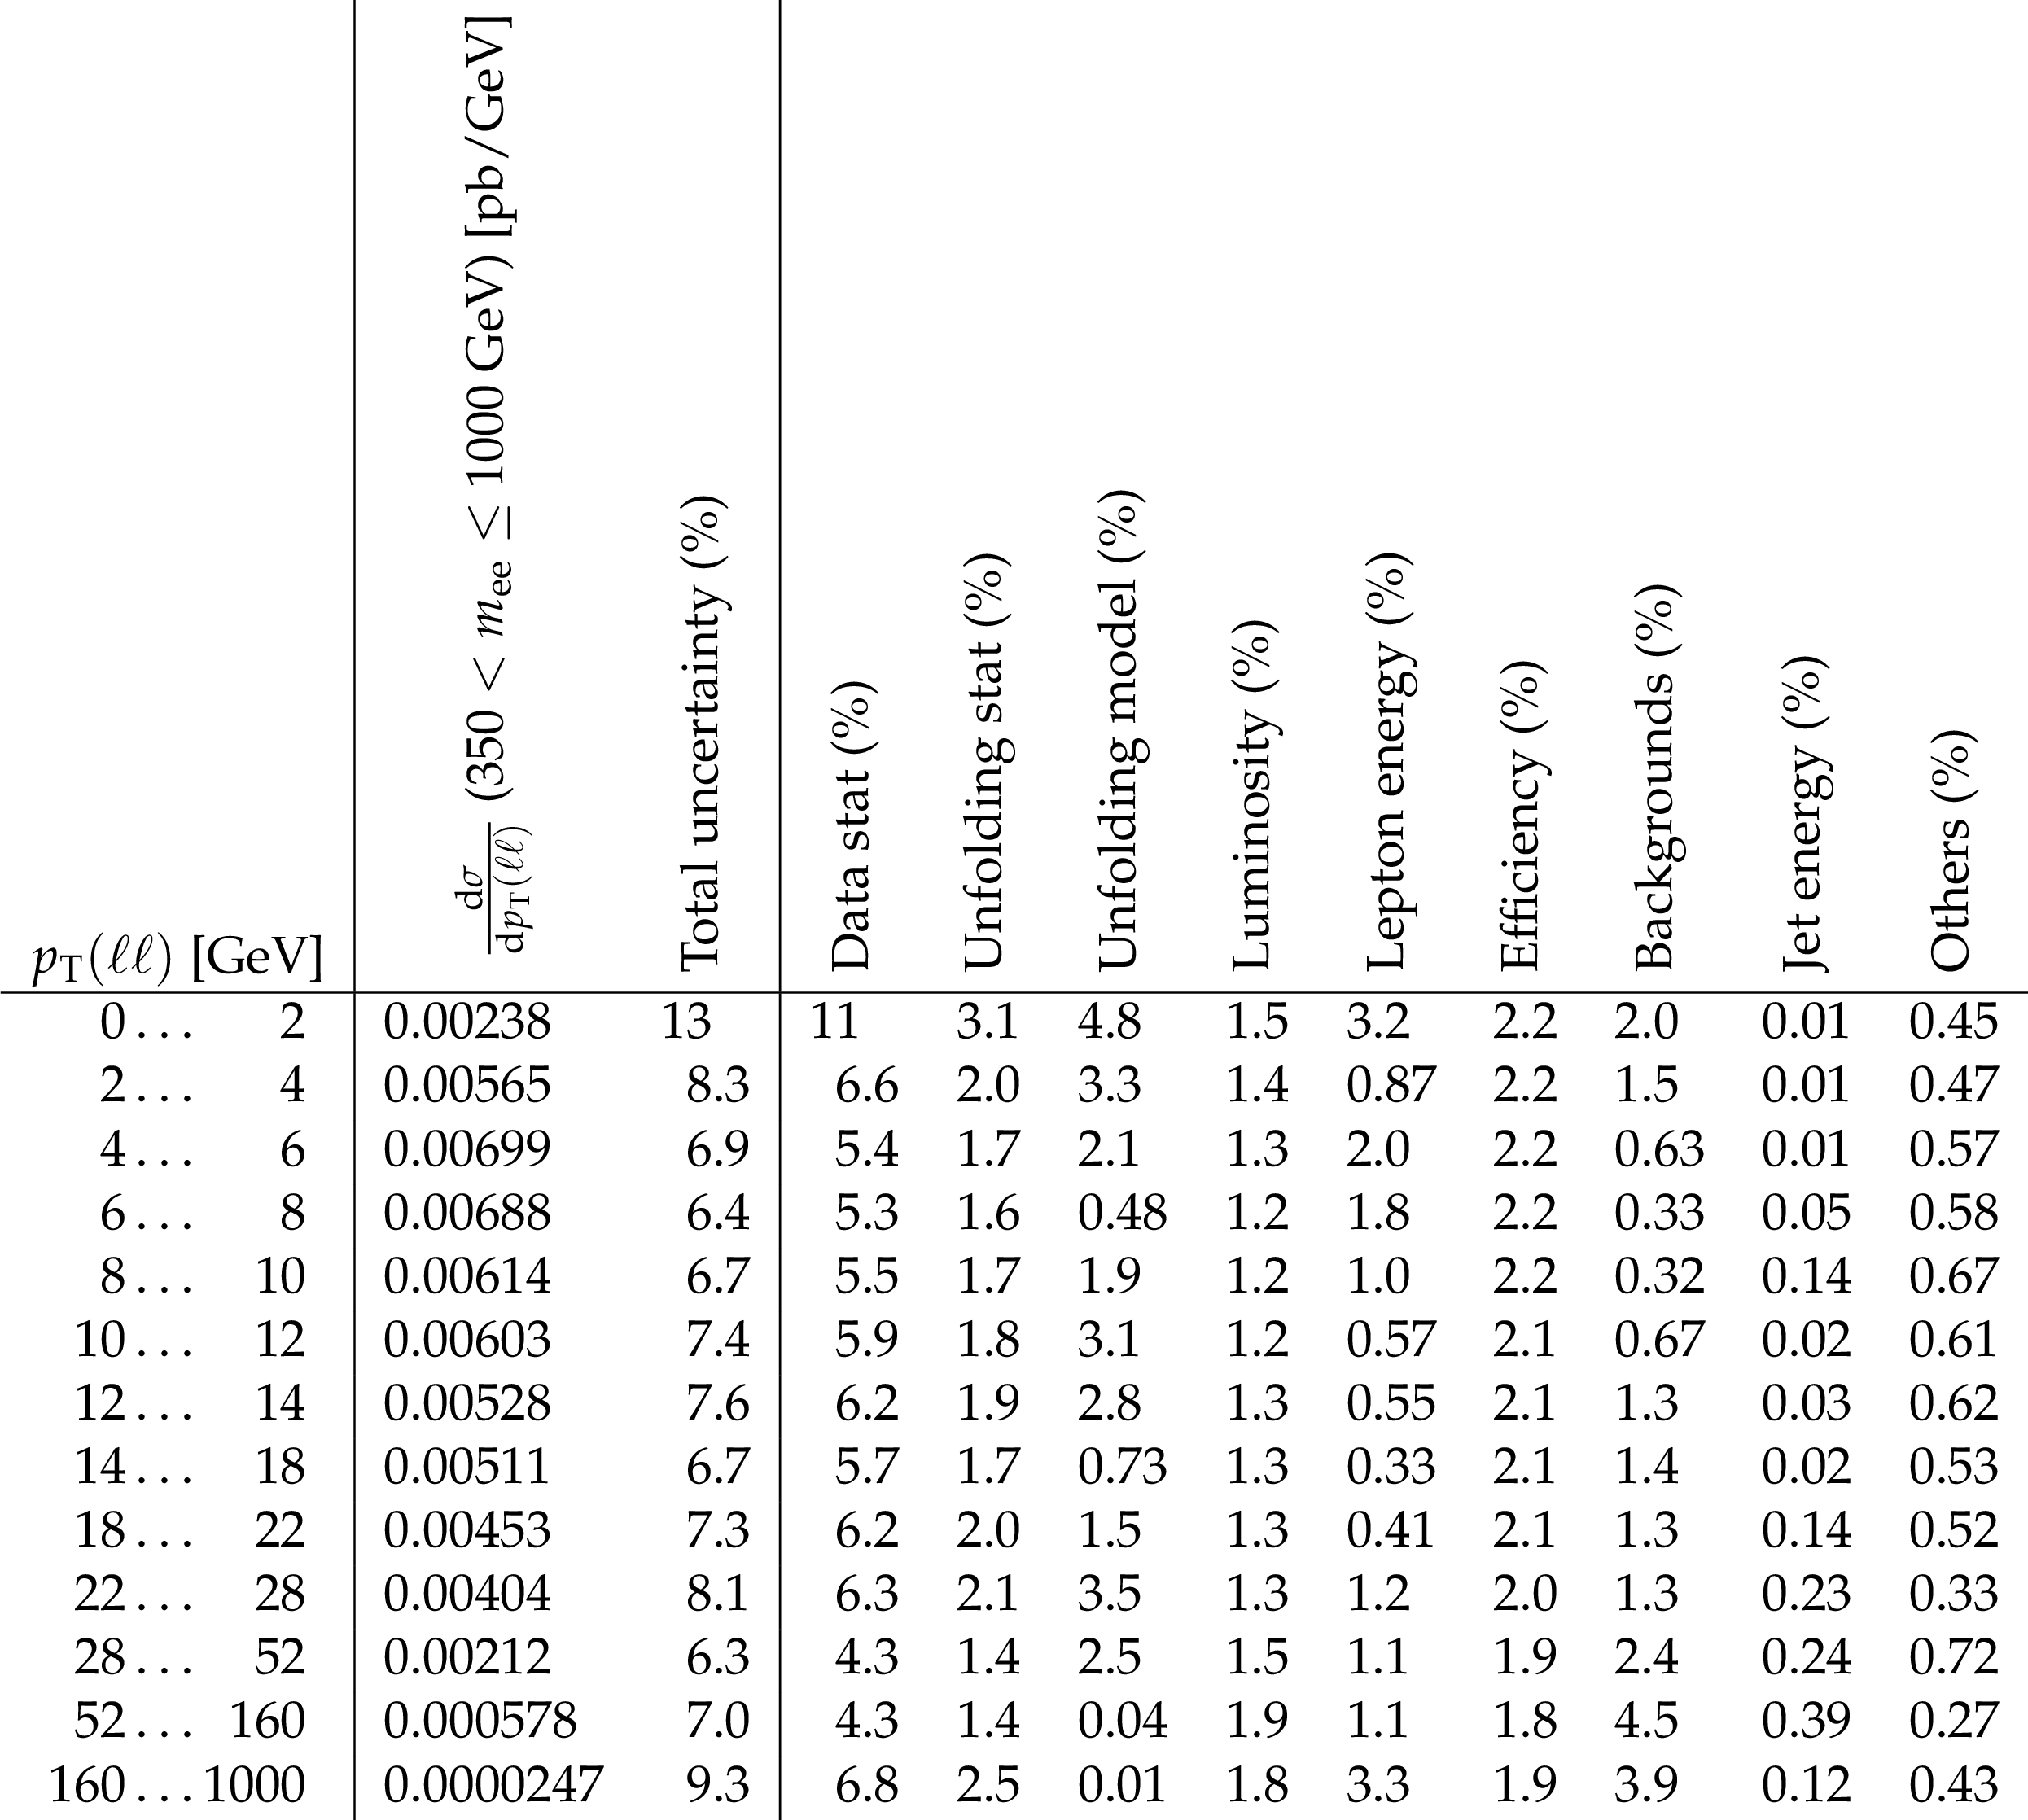
Table 5:
Differential cross section in $ {p_{\mathrm {T}}} (\ell \ell)$ for the 350 $ < m_{\mathrm{e} \mathrm{e}}\le $ 1000 GeV mass window in the electron channel, and breakdown of the uncertainties. A dash (-) in the table means the uncertainty is less than 0.01%. |

png pdf |
Table 6:
Differential cross section in $ {p_{\mathrm {T}}} (\ell \ell)$ for the 50 $ < m_{\ell \ell}\le $ 76 GeV mass window for Z + $\geq $ 1 jet case in the combination of the two channels, and breakdown of the uncertainties. A dash (-) in the table means the uncertainty is less than 0.01%. |

png pdf |
Table 7:
Differential cross section in $ {p_{\mathrm {T}}} (\ell \ell)$ for the 76 $ < m_{\ell \ell}\le $ 106 GeV mass window for Z + $\geq $ 1 jet case in the combination of the two channels, and breakdown of the uncertainties. A dash (-) in the table means the uncertainty is less than 0.01%. |

png pdf |
Table 8:
Differential cross section in $ {p_{\mathrm {T}}} (\ell \ell)$ for the 106 $ < m_{\ell \ell}\le $ 170 GeV mass window for Z + $\geq $ 1 jet case in the combination of the two channels, and breakdown of the uncertainties. A dash (-) in the table means the uncertainty is less than 0.01%. |

png pdf |
Table 9:
Differential cross section in $ {p_{\mathrm {T}}} (\ell \ell)$ for the 170 $ < m_{\ell \ell}\le $ 350 GeV mass window for Z + $\geq $ 1 jet case in the combination of the two channels, and breakdown of the uncertainties. A dash (-) in the table means the uncertainty is less than 0.01%. |

png pdf |
Table 10:
Differential cross section in $ {\varphi ^*} (\ell \ell)$ for the 50 $ < m_{\ell \ell}\le $ 76 GeV mass window in the combination of the two channels, and breakdown of the uncertainties. A dash (-) in the table means the uncertainty is less than 0.01%. |

png pdf |
Table 11:
Differential cross section in $ {\varphi ^*} (\ell \ell)$ for the 76 $ < m_{\ell \ell}\le $ 106 GeV mass window in the combination of the two channels, and breakdown of the uncertainties. A dash (-) in the table means the uncertainty is less than 0.01%. |

png pdf |
Table 12:
Differential cross section in $ {\varphi ^*} (\ell \ell)$ for the 106 $ < m_{\ell \ell}\le $ 170 GeV mass window in the combination of the two channels, and breakdown of the uncertainties. A dash (-) in the table means the uncertainty is less than 0.01%. |
png pdf |
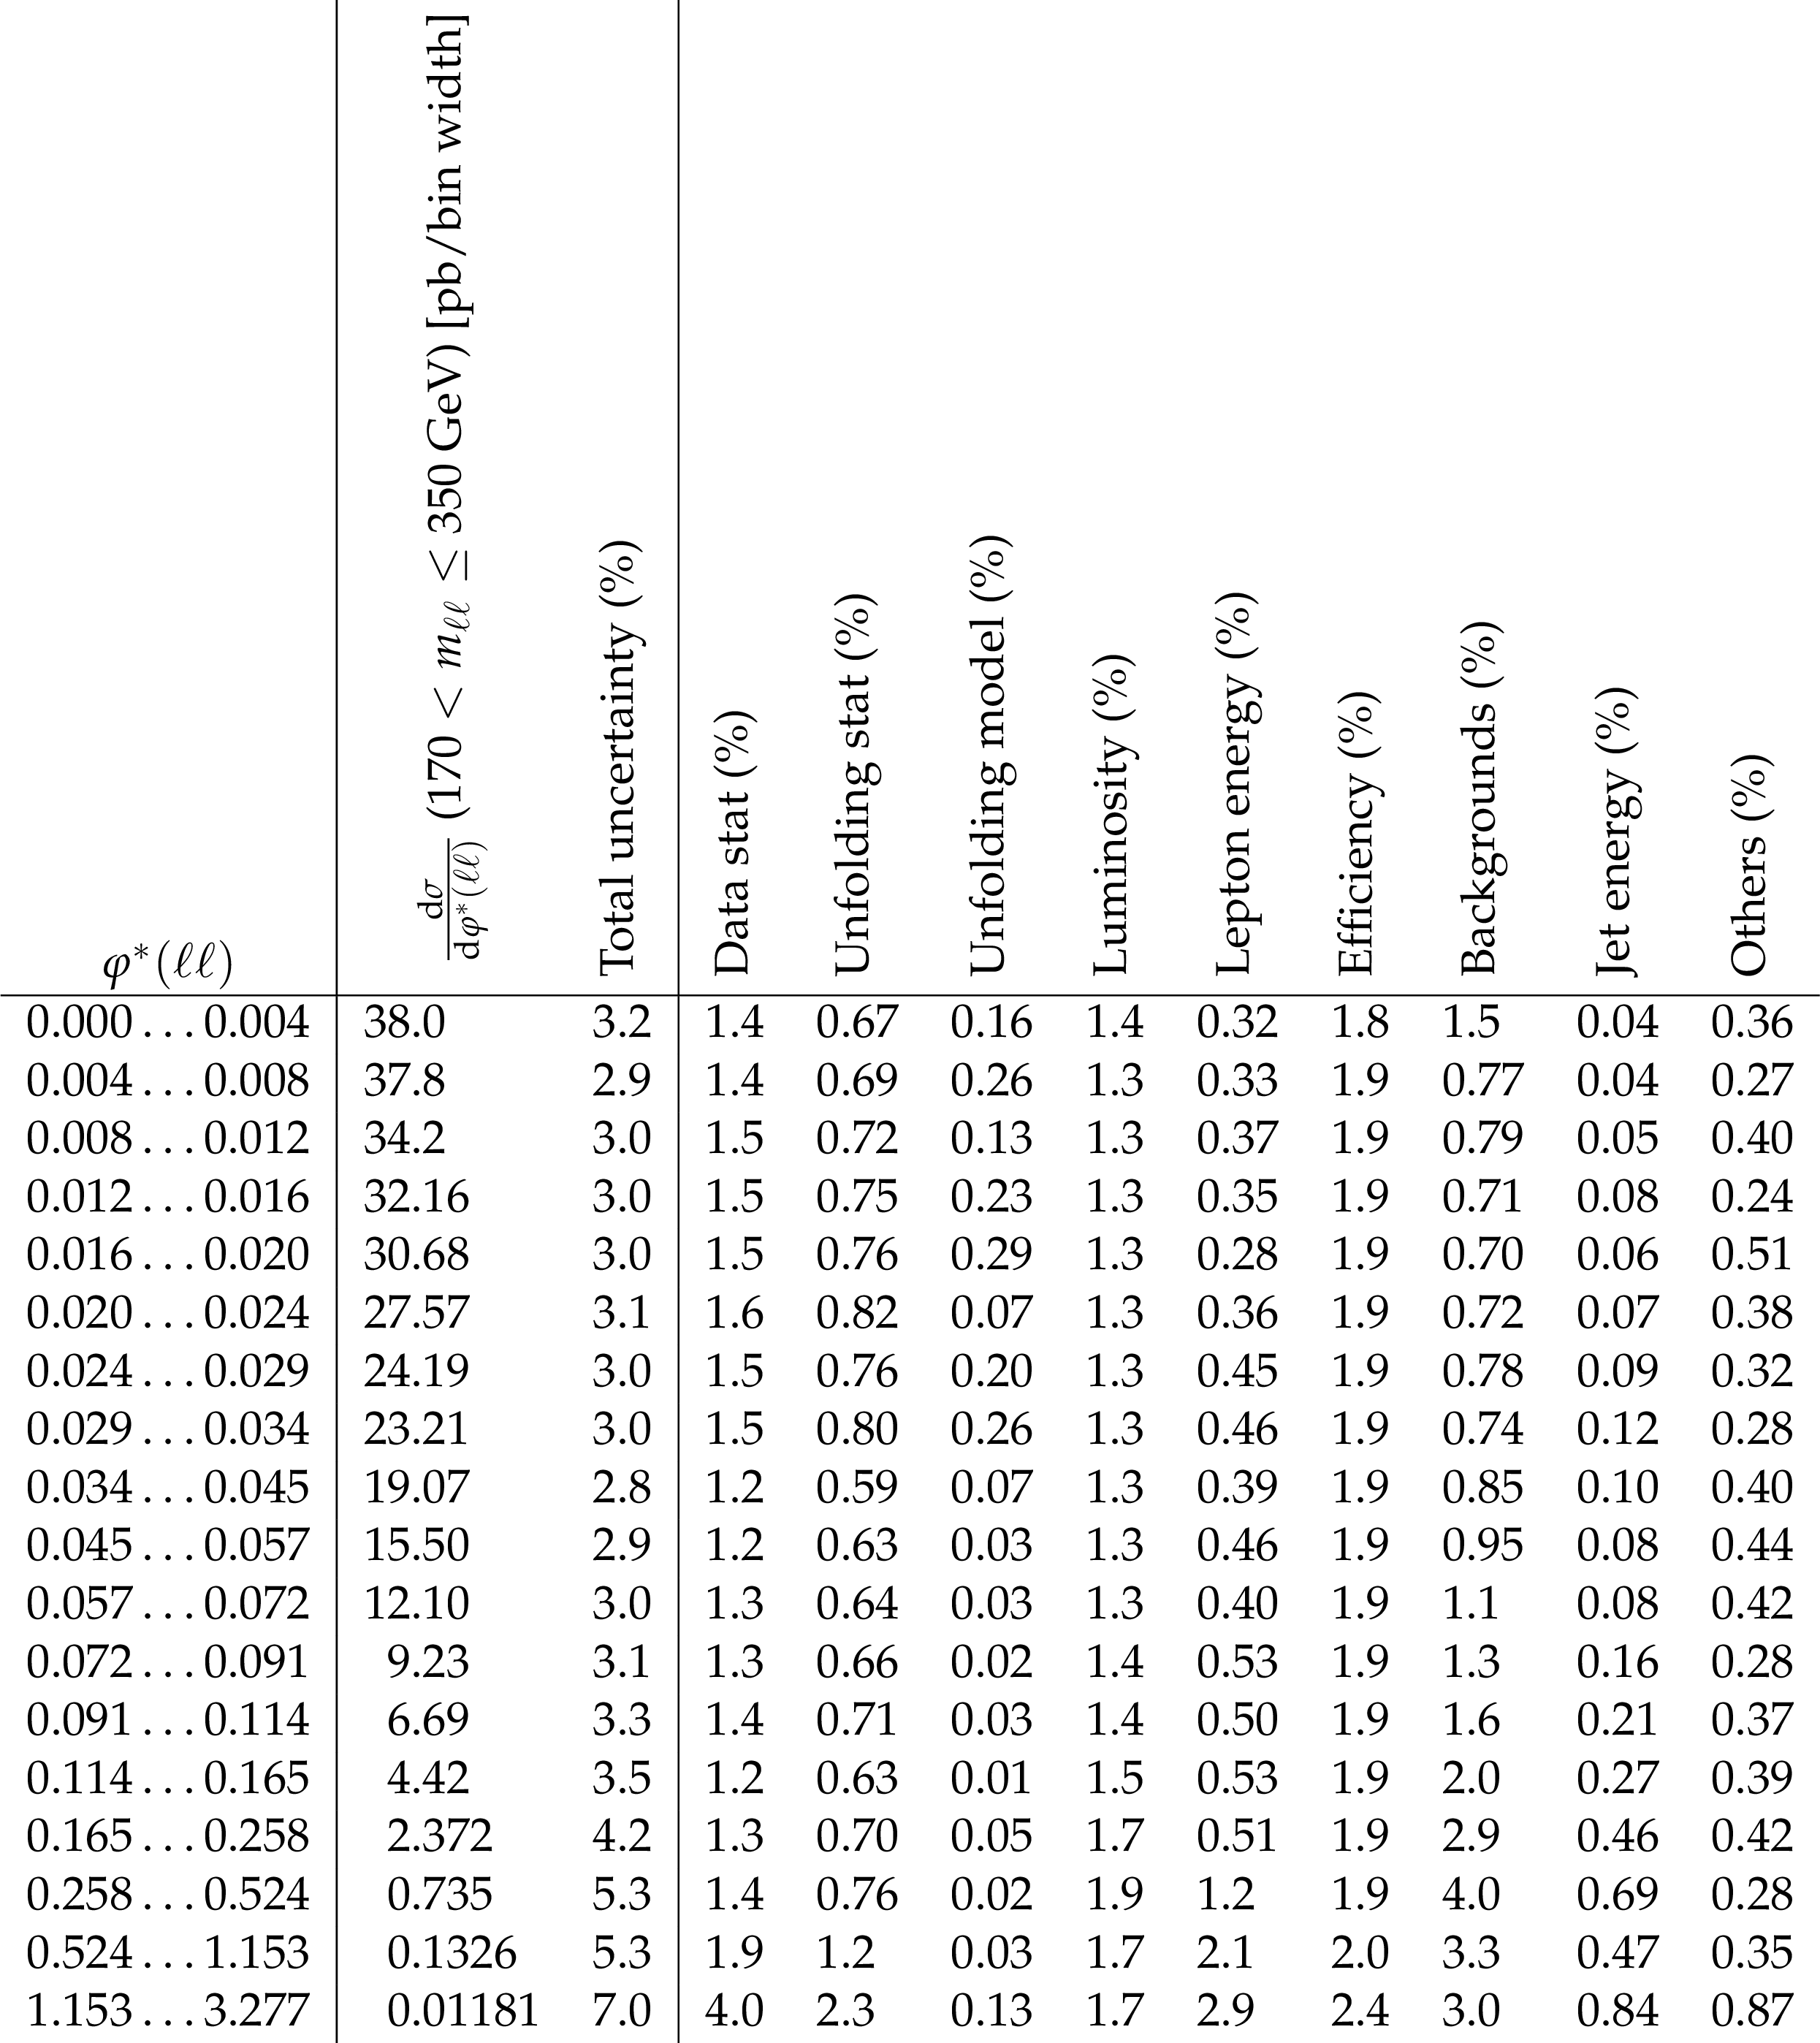
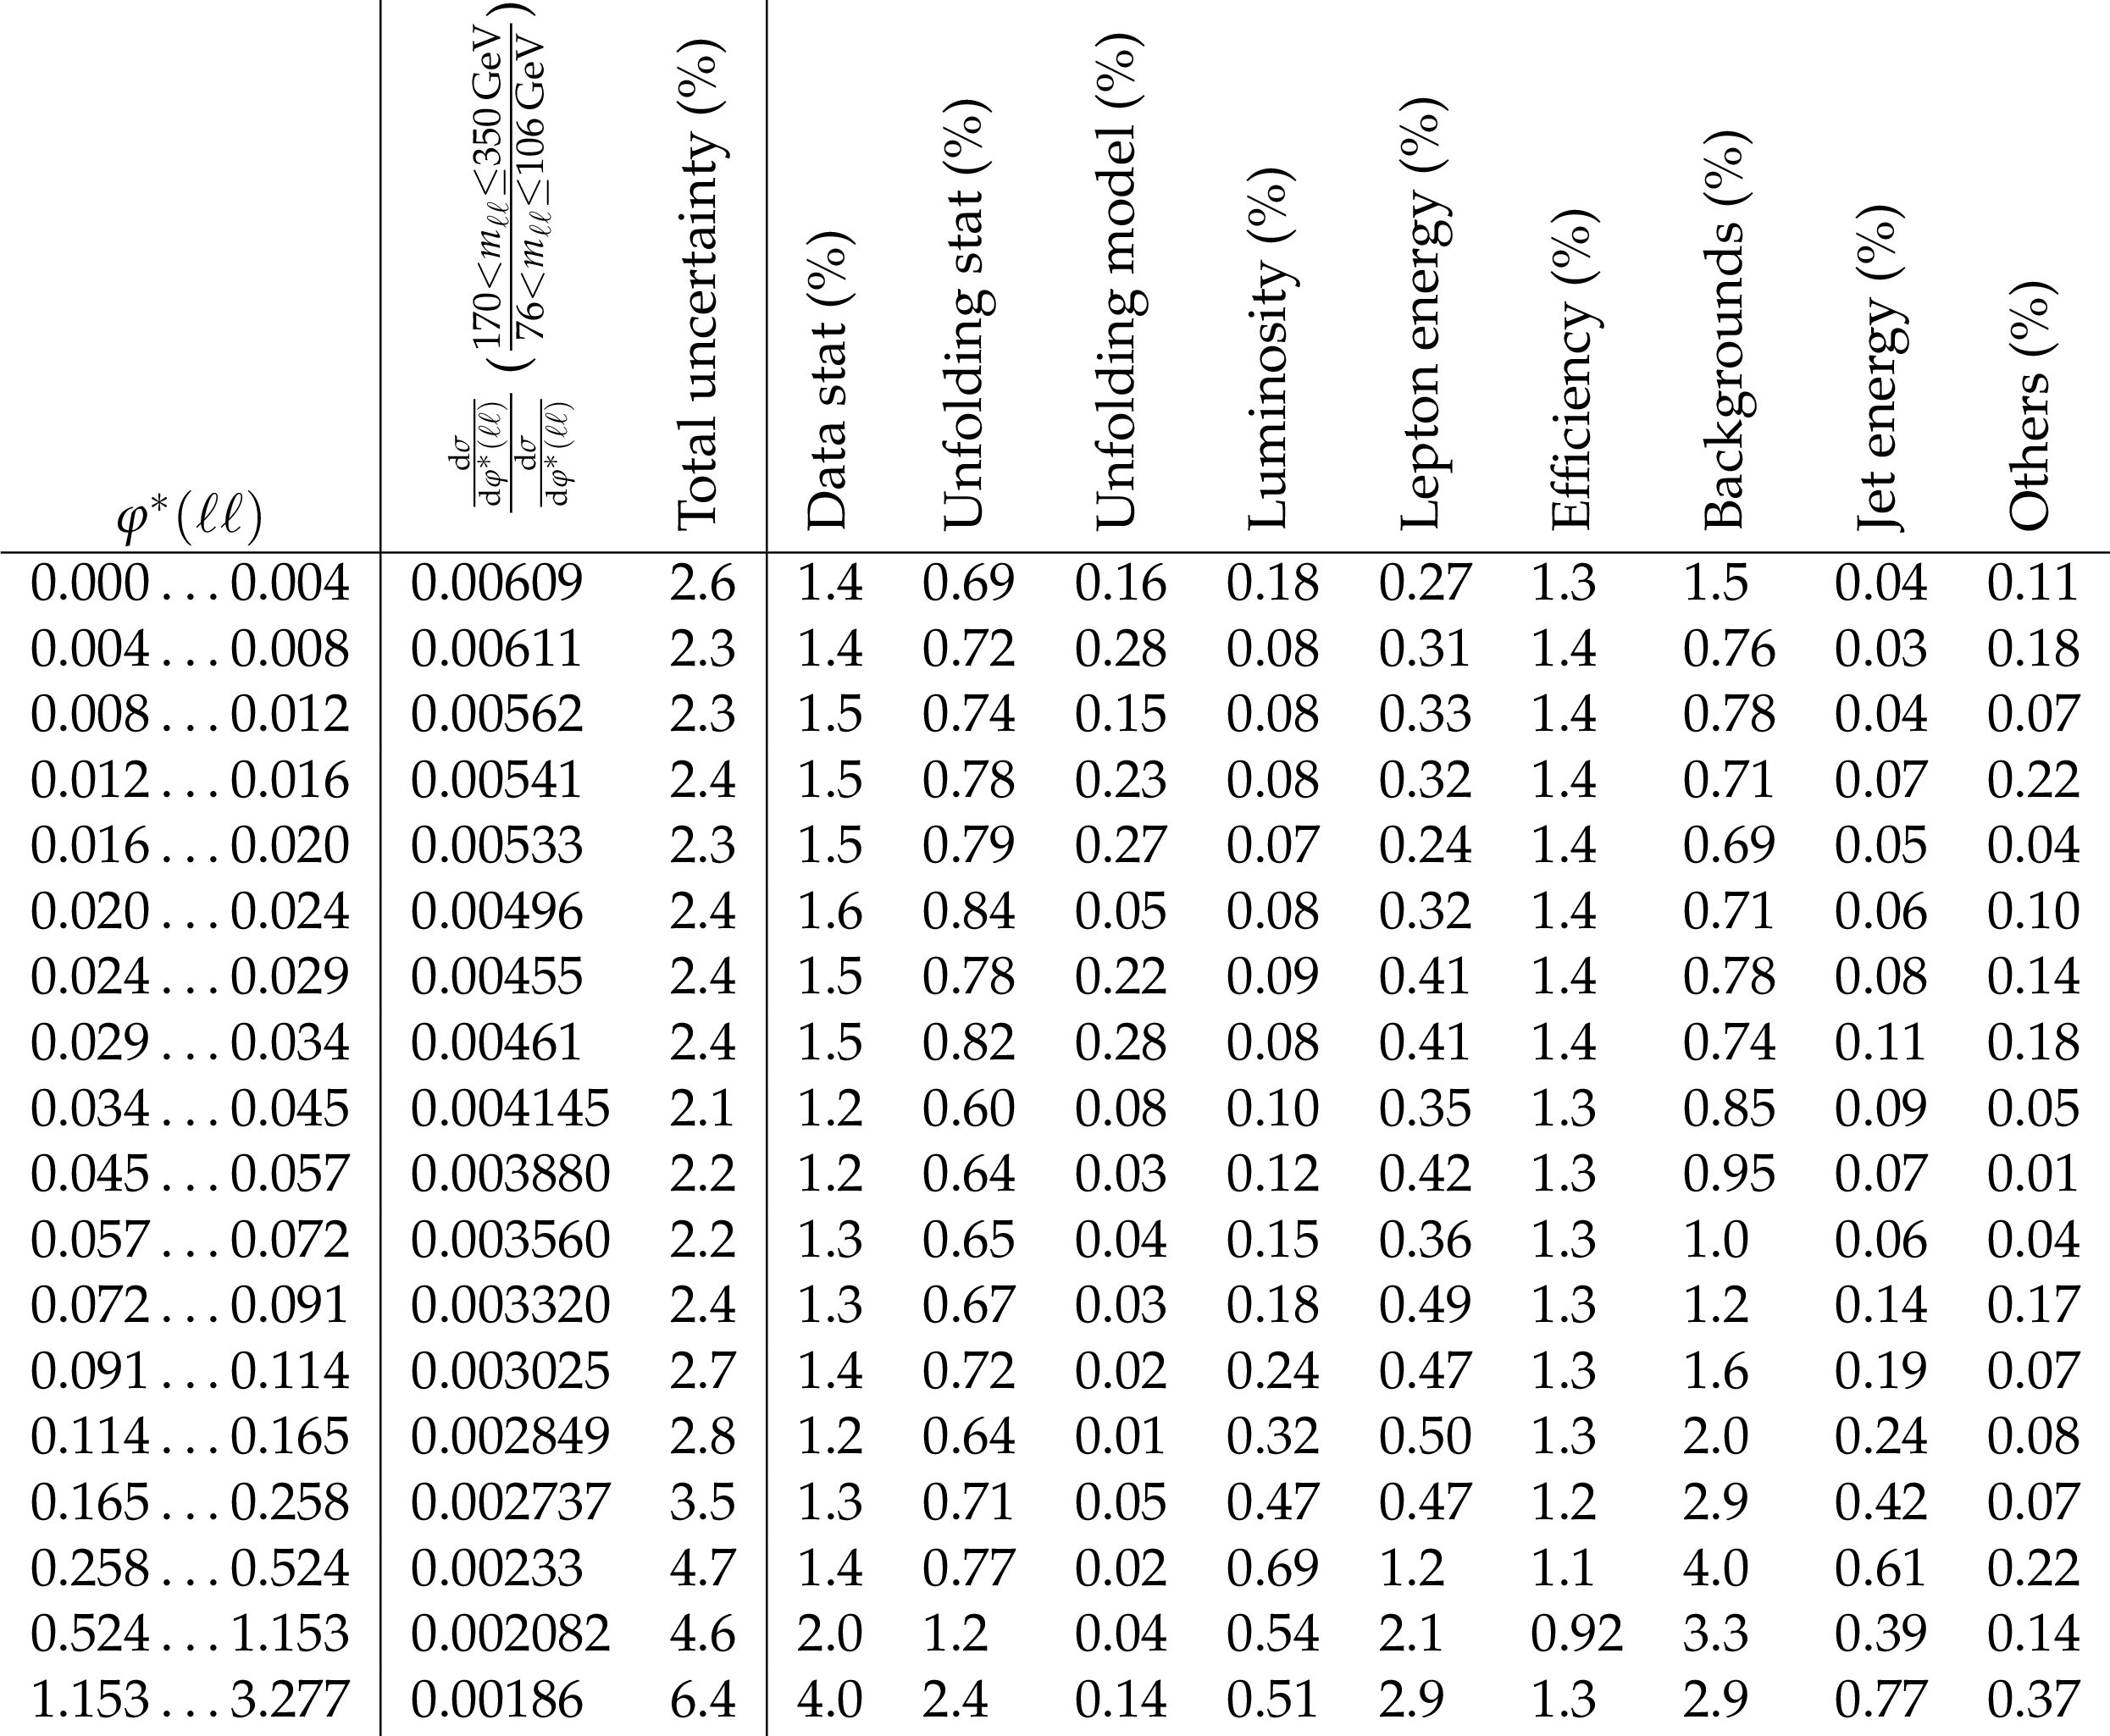
Table 13:
Differential cross section in $ {\varphi ^*} (\ell \ell)$ for the 170 $ < m_{\ell \ell}\le $ 350 GeV mass window in the combination of the two channels, and breakdown of the uncertainties. A dash (-) in the table means the uncertainty is less than 0.01%. |
png pdf |
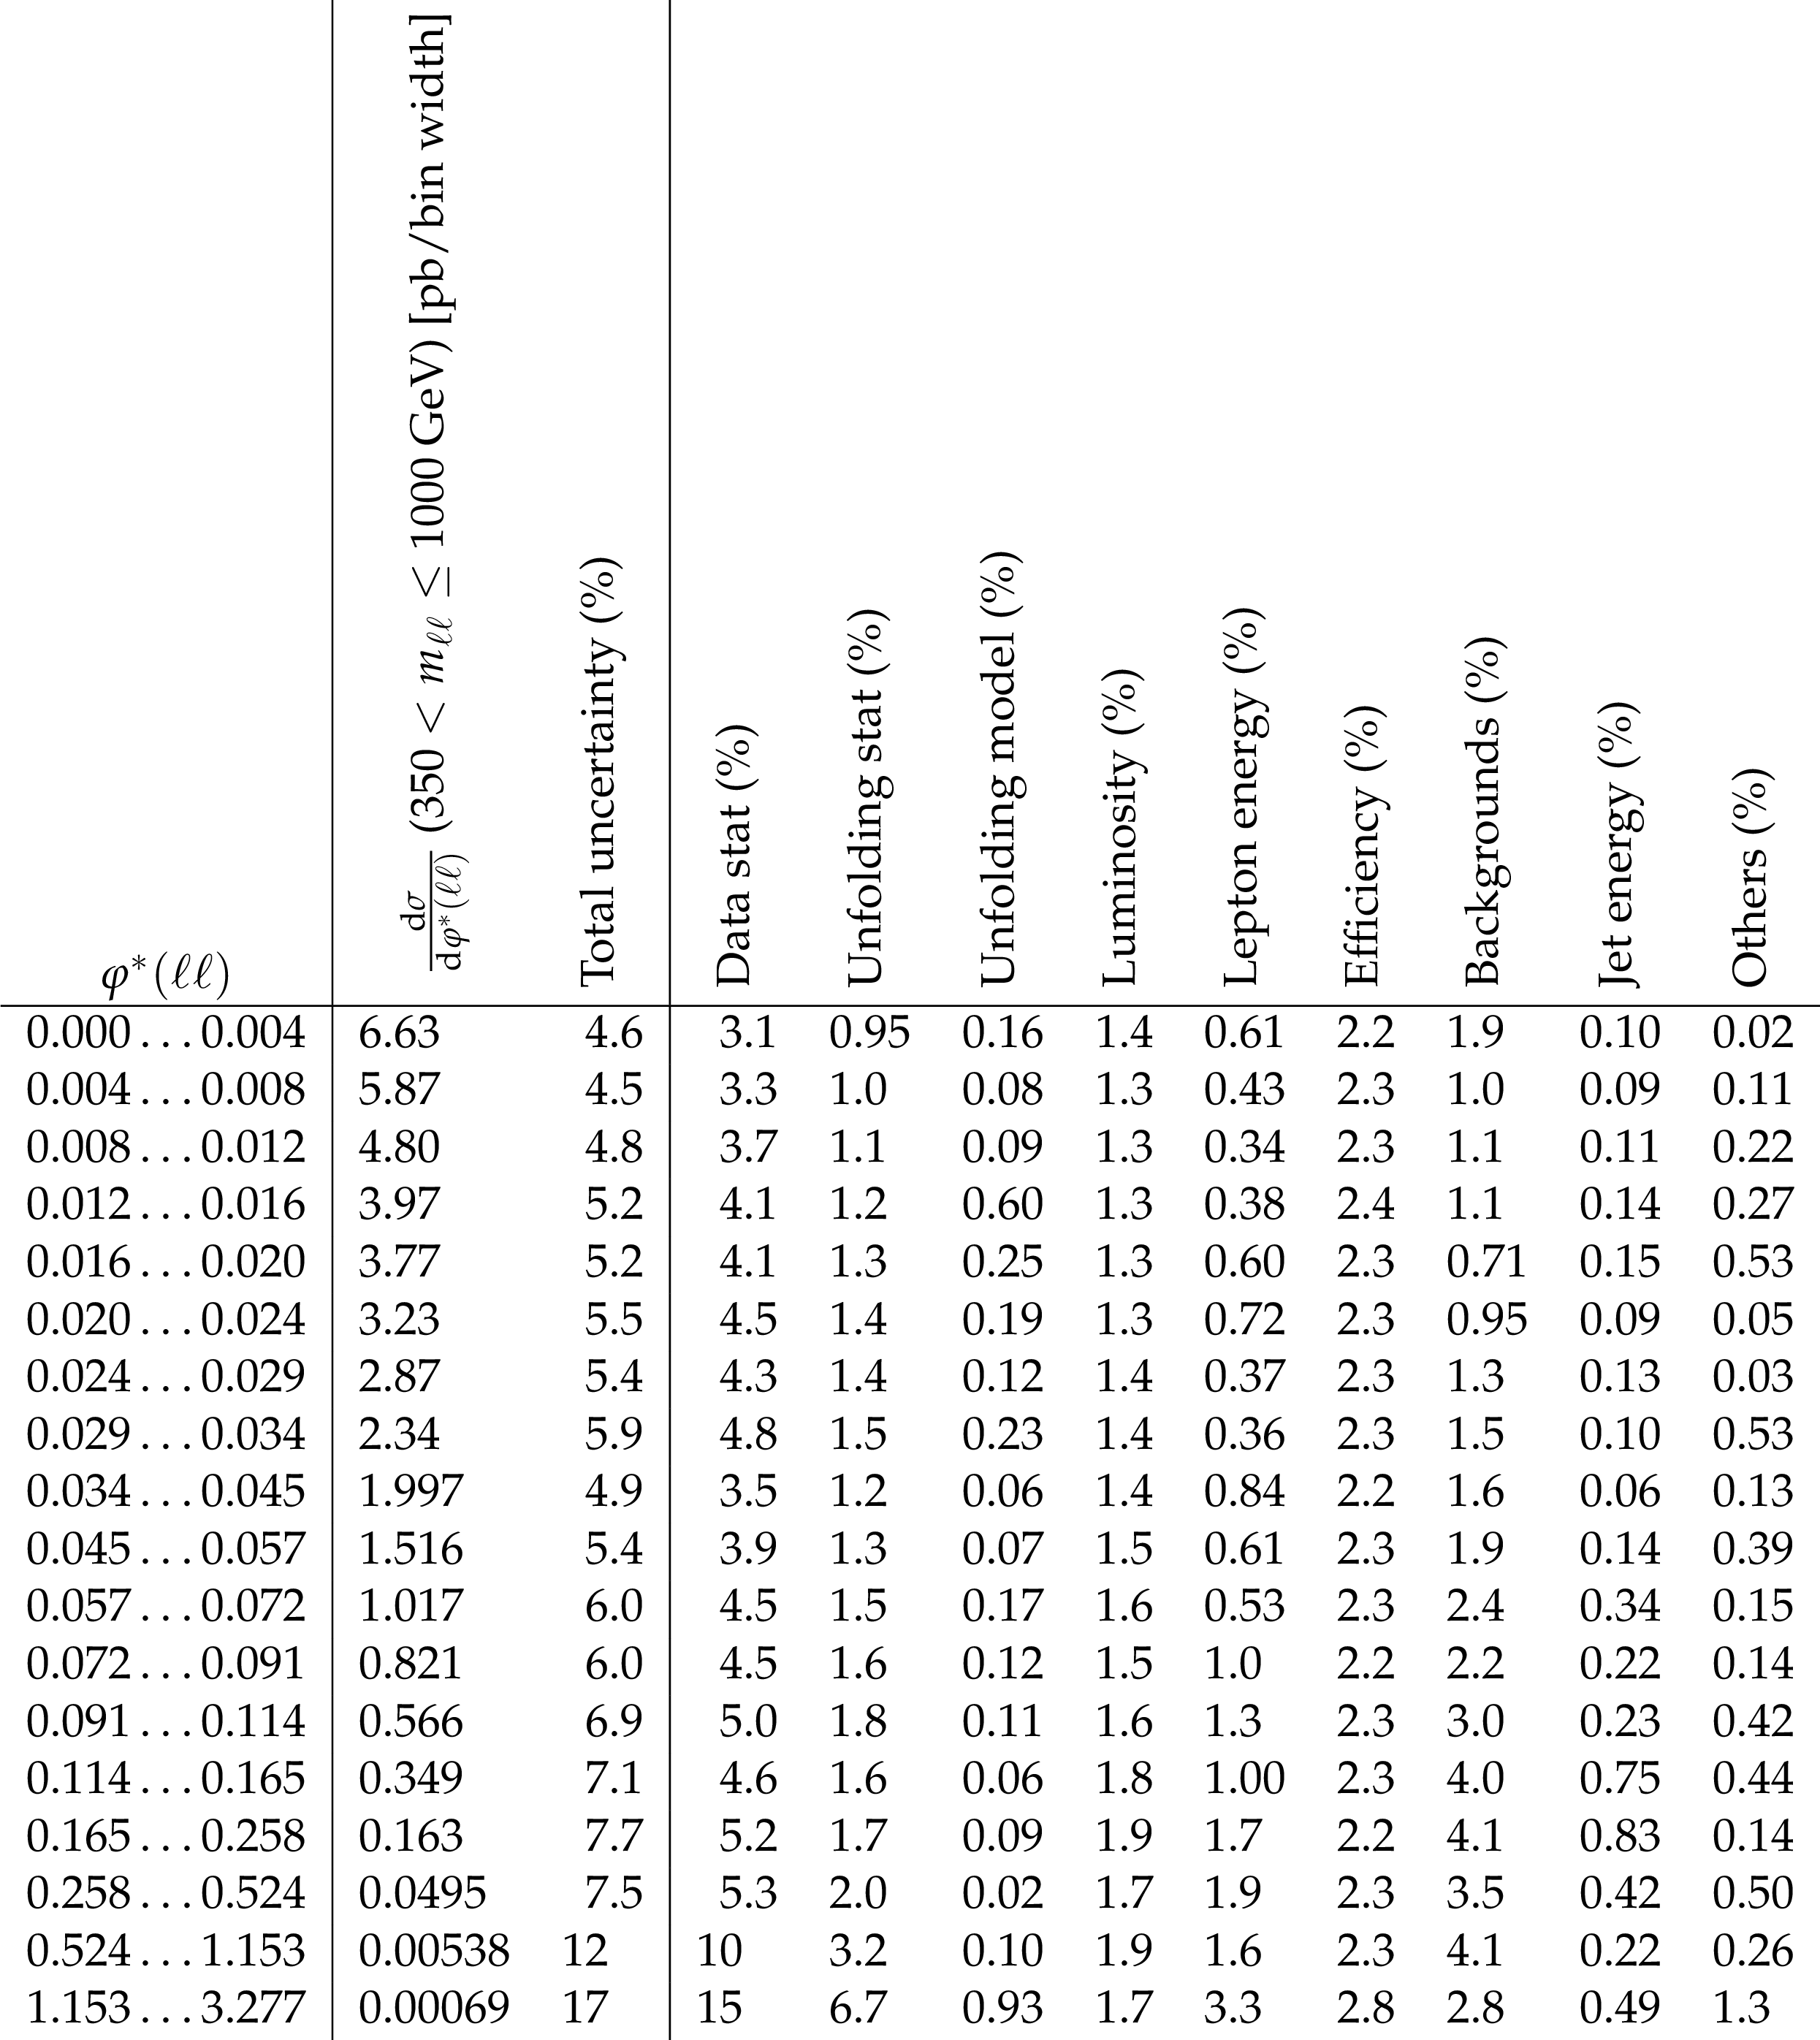
Table 14:
Differential cross section in $ {\varphi ^*} (\ell \ell)$ for the 350 $ < m_{\mathrm{e} \mathrm{e}} $ 1000 GeV mass window in the combination of the electron channel, and breakdown of the uncertainties. A dash (-) in the table means the uncertainty is less than 0.01%. |

png pdf |
Table 15:
Differential cross section ratio in $ {p_{\mathrm {T}}} (\ell \ell)$ of the 50 $ < m_{\ell \ell}\le $ 76 GeV mass window in the combination of the two channels to the 76 $ < {m_{\ell \ell}} \le $ 106 GeV, and breakdown of the uncertainties. A dash (-) in the table means the uncertainty is less than 0.01%. |
png pdf |
Table 16:
Differential cross section ratio in $ {p_{\mathrm {T}}} (\ell \ell)$ of the 106 $ < m_{\ell \ell}\le $ 170 GeV mass window in the combination of the two channels to the 76 $ < {m_{\ell \ell}} \le $ 106 GeV, and breakdown of the uncertainties. A dash (-) in the table means the uncertainty is less than 0.01%. |

png pdf |
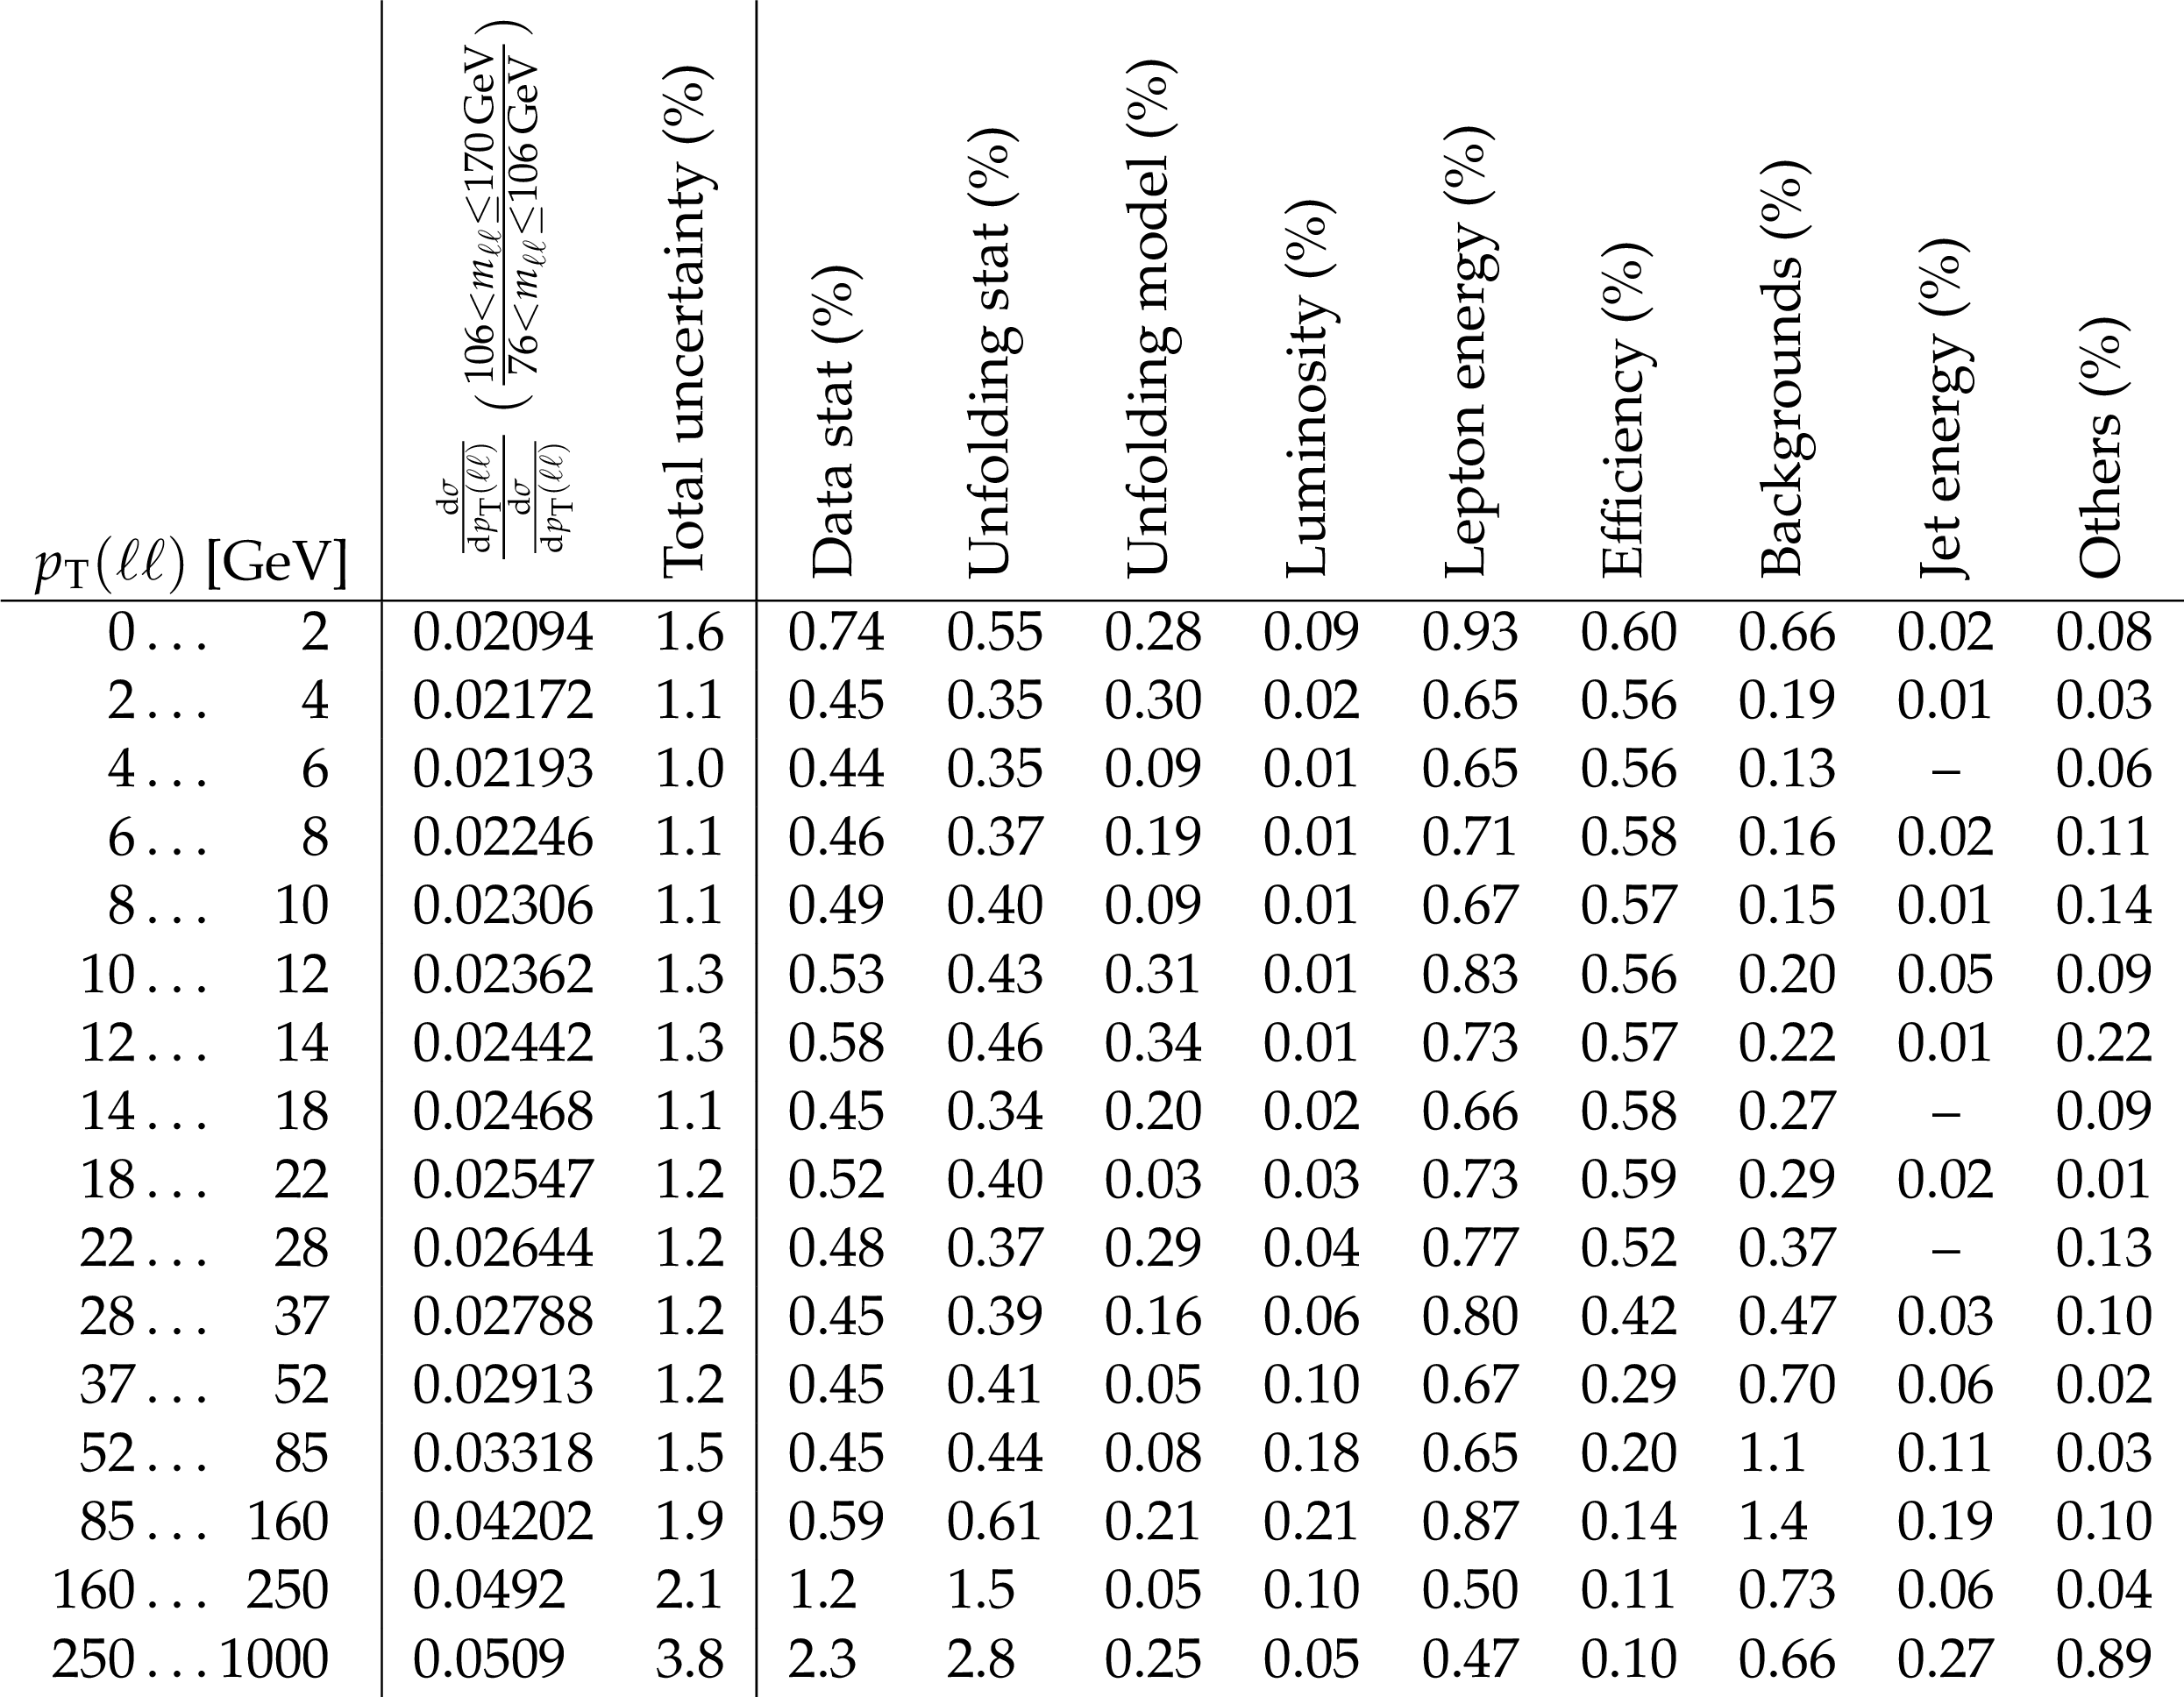
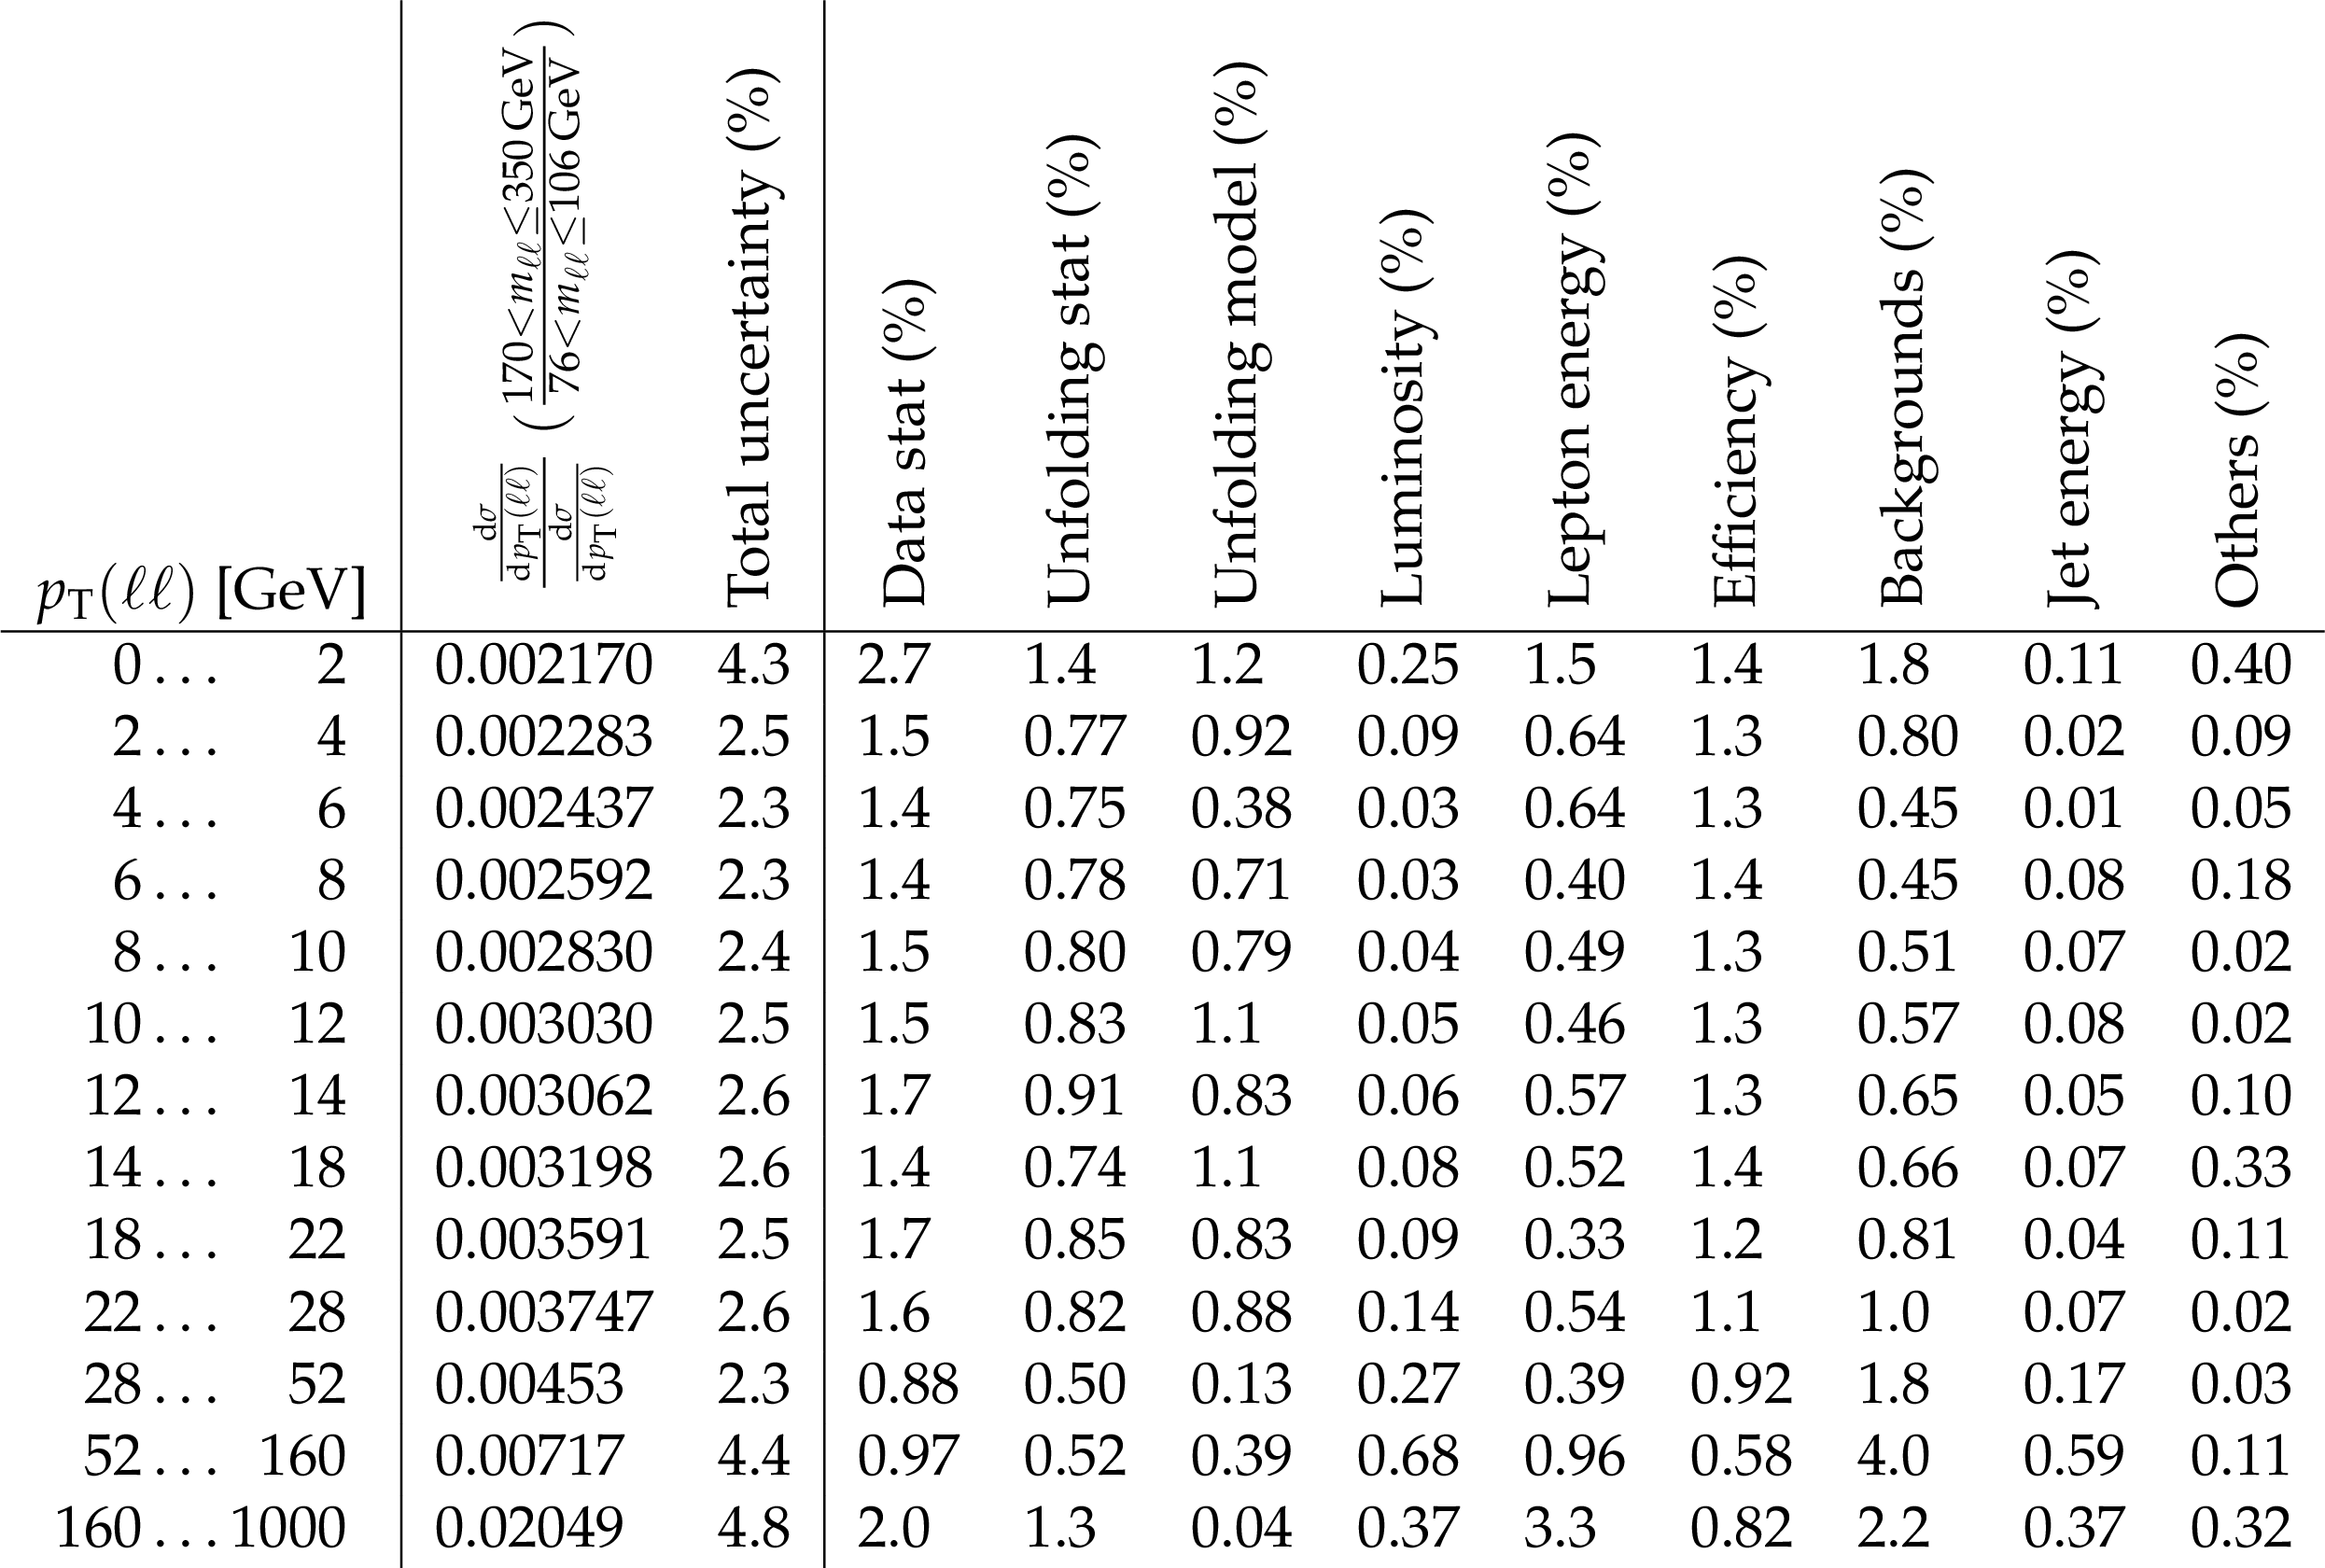
Table 17:
Differential cross section ratio in $ {p_{\mathrm {T}}} (\ell \ell)$ of the 170 $ < m_{\ell \ell}\le $ 350 GeV mass window in the combination of the two channels to the 76 $ < {m_{\ell \ell}} \le $ 106 GeV, and breakdown of the uncertainties. A dash (-) in the table means the uncertainty is less than 0.01%. |
png pdf |
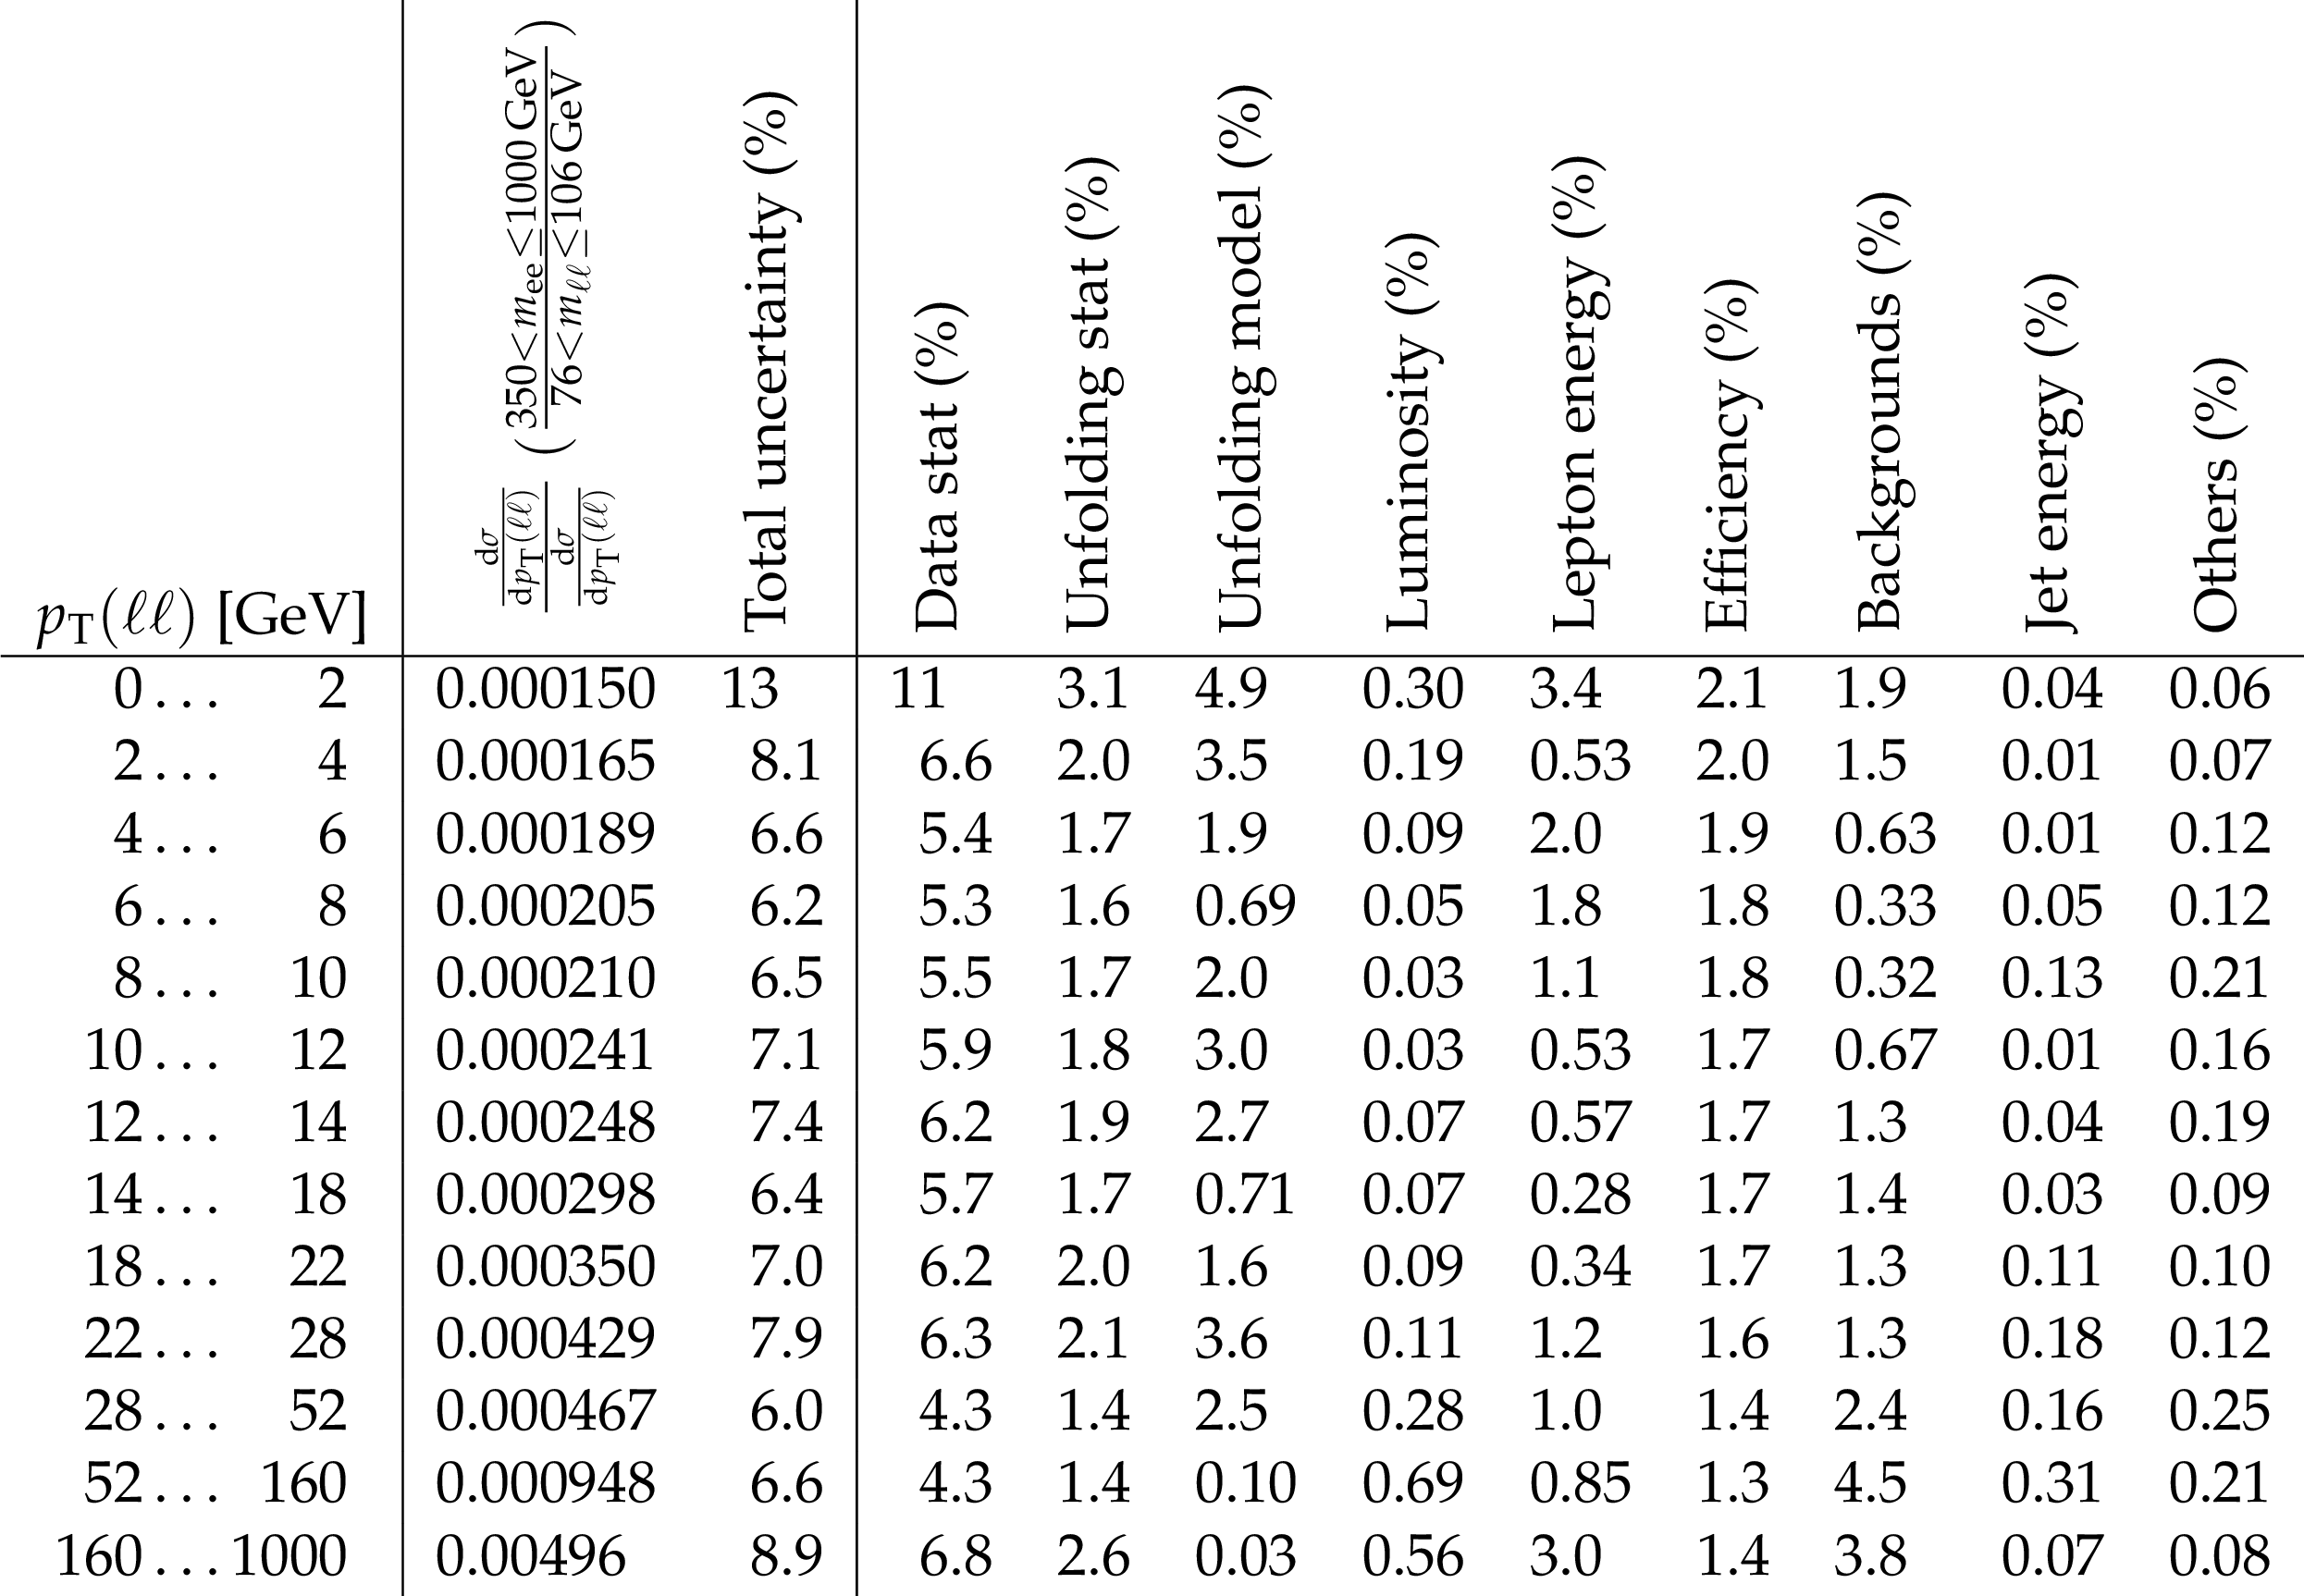
Table 18:
Differential cross section ratio in $ {p_{\mathrm {T}}} (\ell \ell)$ of the 350 $ < m_{\mathrm{e} \mathrm{e}}\le $ 1000 GeV mass window in the electron channel to the 76 $ < {m_{\ell \ell}} \le $ 106 GeV, and breakdown of the uncertainties. A dash (-) in the table means the uncertainty is less than 0.01%. |

png pdf |
Table 19:
Differential cross section ratio in $ {p_{\mathrm {T}}} (\ell \ell)$ of the 50 $ < m_{\ell \ell}\le $ 76 GeV mass window in the combination of the two channels for Z + $\geq $ 1 jet case to the 76 $ < {m_{\ell \ell}} \le $106 GeV for Z + $\geq $ 1 jet case, and breakdown of the uncertainties. A dash (-) in the table means the uncertainty is less than 0.01%. |

png pdf |
Table 20:
Differential cross section ratio in $ {p_{\mathrm {T}}} (\ell \ell)$ of the 106 $ < m_{\ell \ell}\le $ 170 GeV mass window in the combination of the two channels for Z + $\geq $ 1 jet case to the 76 $ < {m_{\ell \ell}} \le $106 GeV for Z + $\geq $ 1 jet case, and breakdown of the uncertainties. A dash (-) in the table means the uncertainty is less than 0.01%. |
png pdf |
Table 21:
Differential cross section ratio in $ {p_{\mathrm {T}}} (\ell \ell)$ of the 170 $ < m_{\ell \ell}\le $ 350 GeV mass window in the combination of the two channels for Z + $\geq $ 1 jet case to the 76 $ < {m_{\ell \ell}} \le $106 GeV for Z + $\geq $ 1 jet case, and breakdown of the uncertainties. A dash (-) in the table means the uncertainty is less than 0.01%. |
png pdf |
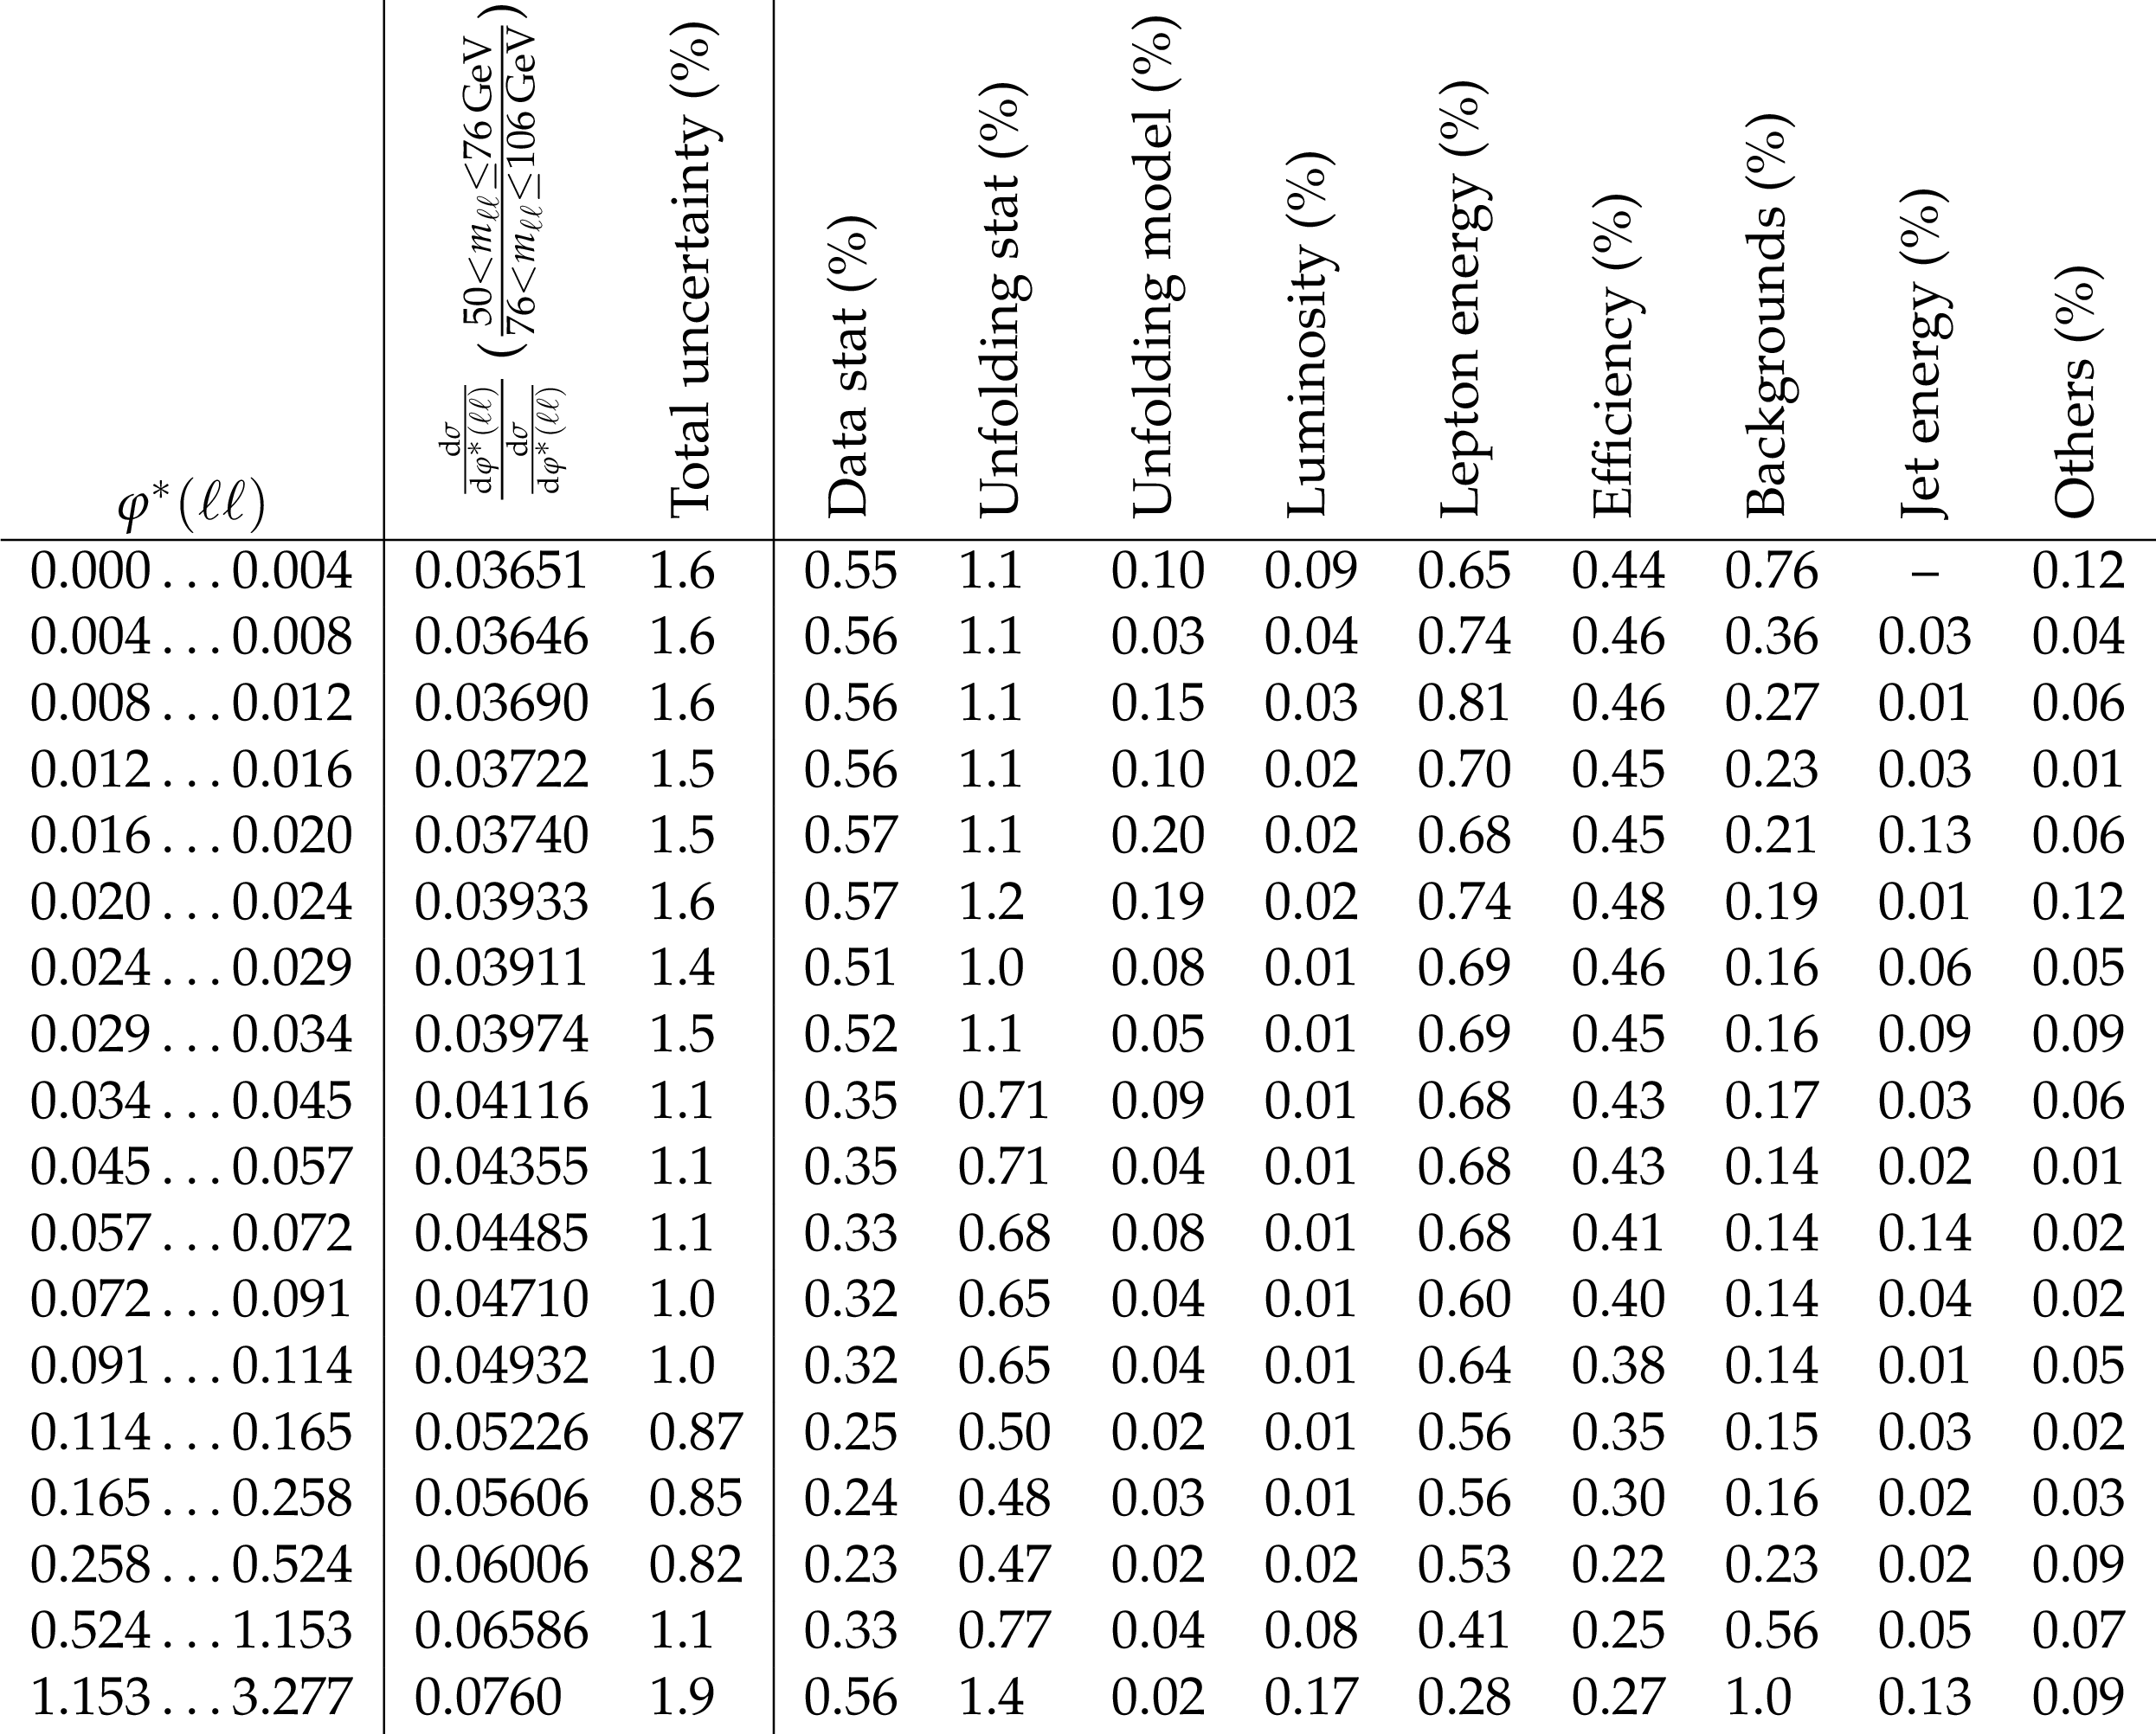
Table 22:
Differential cross section ratio in $ {\varphi ^*} (\ell \ell)$ of the 50 $ < m_{\ell \ell}\le $ 76 GeV mass window in the combination of the two channels to the 76 $ < {m_{\ell \ell}} \le $106 GeV, and breakdown of the uncertainties. A dash (-) in the table means the uncertainty is less than 0.01%. |
png pdf |
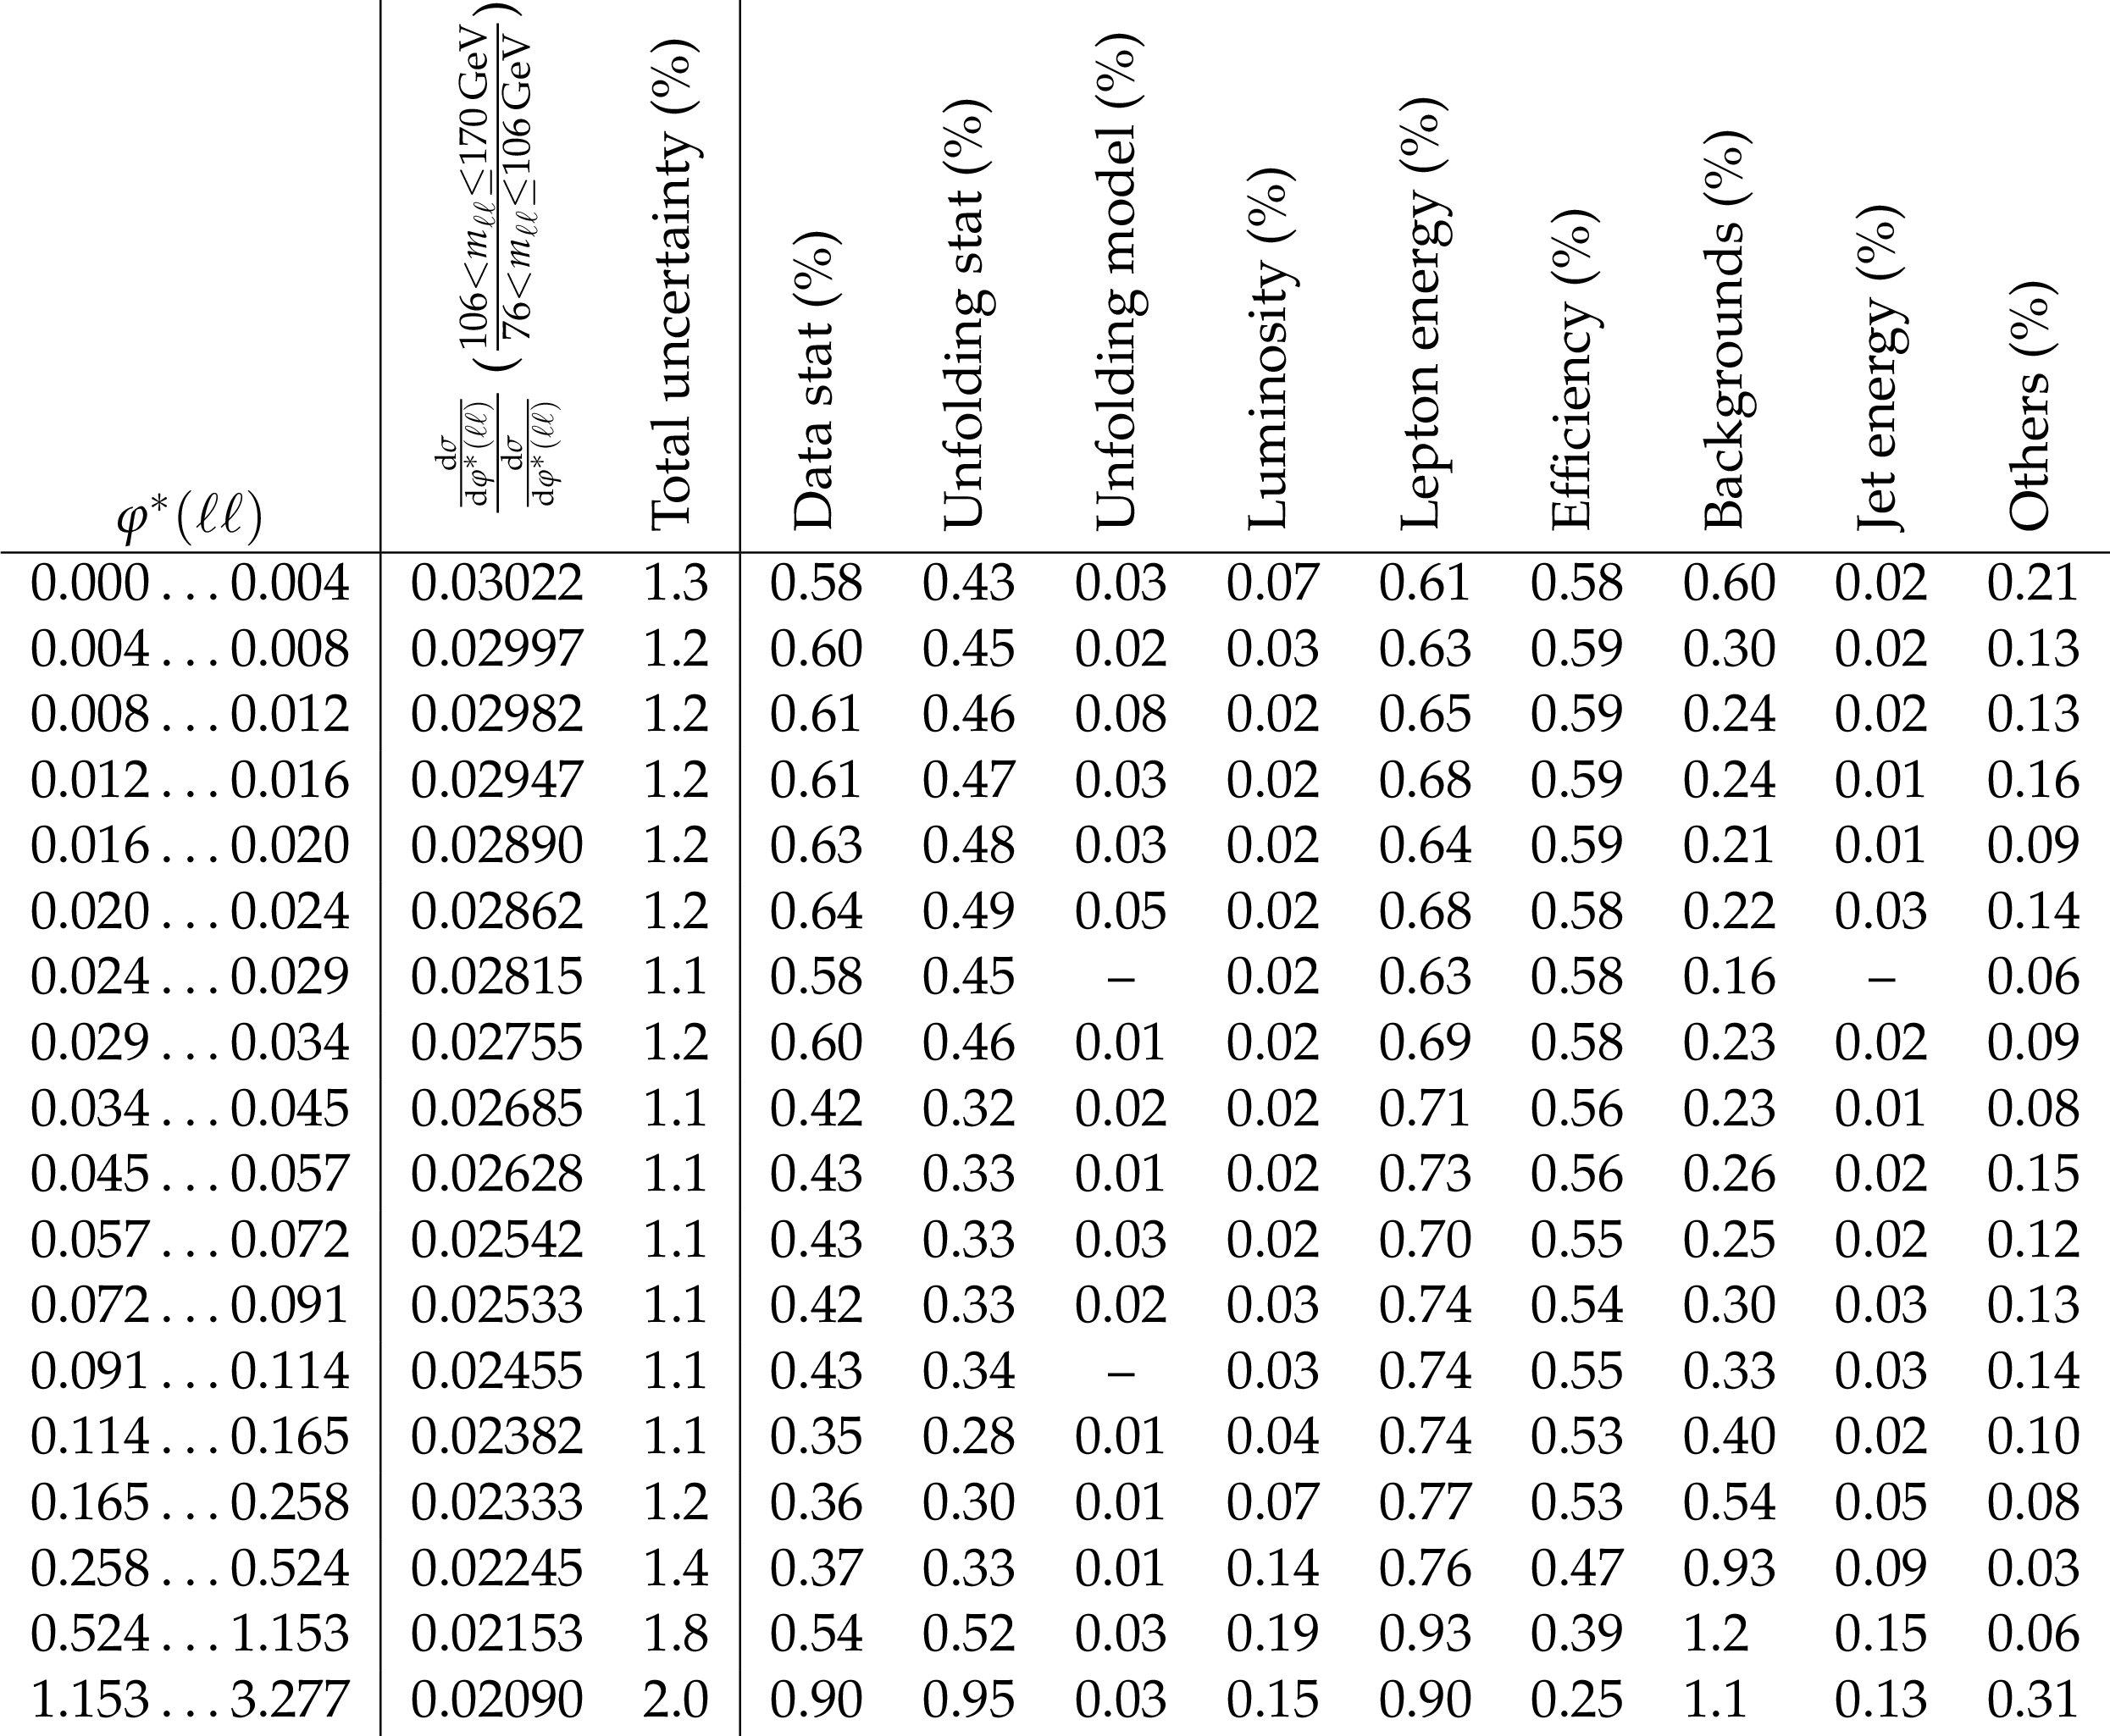
Table 23:
Differential cross section ratio in $ {\varphi ^*} (\ell \ell)$ of the 106 $ < m_{\ell \ell}\le $ 170 GeV mass window in the combination of the two channels to the 76 $ < {m_{\ell \ell}} \le $106 GeV, and breakdown of the uncertainties. A dash (-) in the table means the uncertainty is less than 0.01%. |
png pdf |
Table 24:
Differential cross section ratio in $ {\varphi ^*} (\ell \ell)$ of the 170 $ < m_{\ell \ell}\le $ 350 GeV mass window in the combination of the two channels to the 76 $ < {m_{\ell \ell}} \le $106 GeV, and breakdown of the uncertainties. A dash (-) in the table means the uncertainty is less than 0.01%. |
png pdf |
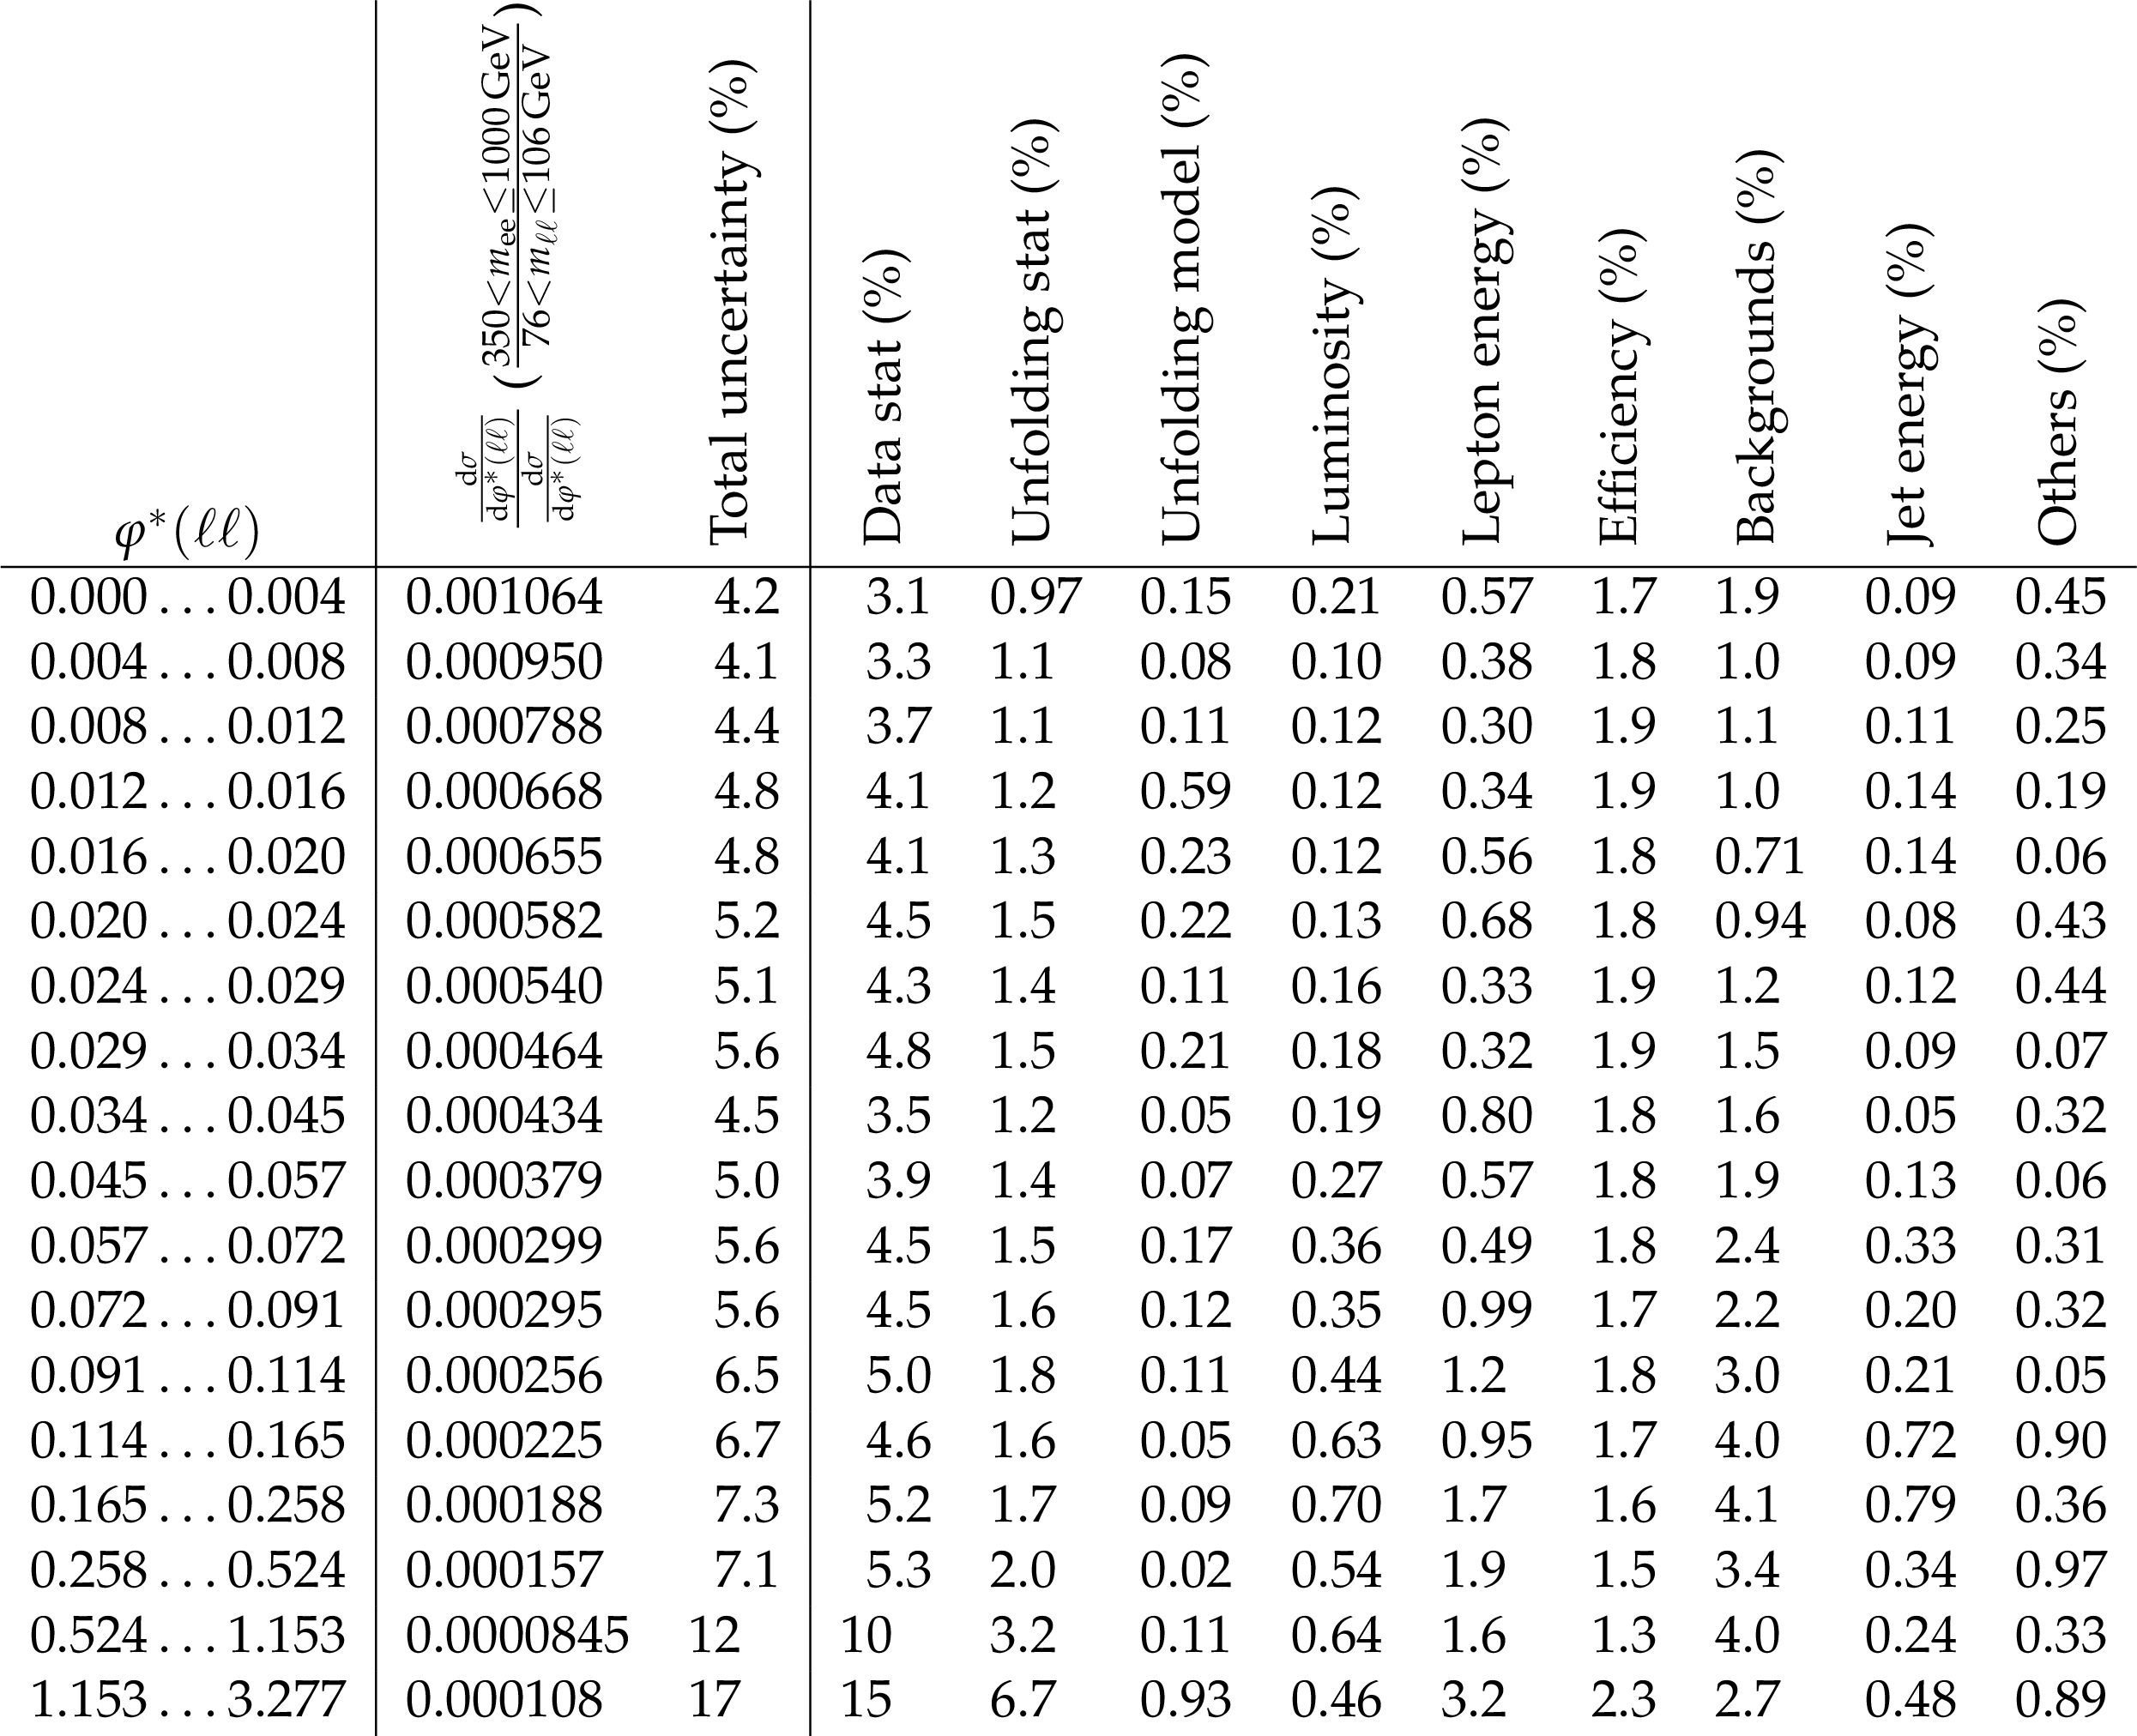
Table 25:
Differential cross section ratio in $ {\varphi ^*} (\ell \ell)$ of the 350 $ < m_{\mathrm{e} \mathrm{e}} $ 1000 GeV mass window in the electron channel to the 76 $ < {m_{\ell \ell}} \le $106 GeV, and breakdown of the uncertainties. A dash (-) in the table means the uncertainty is less than 0.01%. |
| Summary |
|
Measurements of differential Z/${\gamma^*}$ production cross sections in proton-proton collisions at $\sqrt{s} = $ 13 TeV in the dielectron and dimuon final states are presented, using the data collected with the CMS detector corresponding to an integrated luminosity of 36.3 fb$^{-1}$. The measurements have been corrected for detector effects and the two leptonic channels have been combined. Differential cross sections in the dilepton transverse momentum, ${p_{\mathrm{T}}(\ell\ell)}$, and in the lepton angular variable ${\varphi^*}$ are measured for different values of the dilepton mass, ${m_{\ell\ell}} $, between 50 GeV and 1 TeV. In addition, dilepton transverse momentum distributions are shown in presence of at least one jet in the detector acceptance. The rising behavior at small ${p_{\mathrm{T}}(\ell\ell)}$ is attributed to soft QCD radiation, while the tail at large ${p_{\mathrm{T}}(\ell\ell)}$ is only expected to be well described by models relying on higher order matrix element calculations. Therefore these measurements provide a good sensitivity to initial state QCD radiations and can be compared to different predictions resumming the initial state soft QCD radiations. The measurements are compared to NLO aMC@NLO Monte Carlo predictions using parton shower, showing a generally good agreement, except at ${p_{\mathrm{T}}(\ell\ell)}$ values below 10 GeV. This disagreement is enhanced for masses away from the Z mass peak and is more pronounced for the highest mass reaching 20% for the highest mass bin. On the contrary, TMD based approaches give a very good description of the low ${p_{\mathrm{T}}(\ell\ell)}$ distributions. These two predictions, arTeMiDe and Cascade , based on independent TMDs parametrisations, offer a valuable alternative to the Parton Shower approach, relying on less fitted parameters. Nevertheless the validity of the arTeMiDe approach, in its present treatment, is limited to transverse momenta lower than the QCD dominant scale (here the dilepton mass). The comparison to GENEVA prediction is not satisfying for low ${p_{\mathrm{T}}(\ell\ell)}$ values at any dilepton mass. This is partially due to the ${\alpha_S}$ value choice, as confirmed by the ratio of different dilepton masses measurements as a function of ${p_{\mathrm{T}}(\ell\ell)}$ where the dependence on the ${\alpha_S}$ value is largely reduced. The GENEVA high ${p_{\mathrm{T}}(\ell\ell)}$ prediction, based on NNLO matrix element, is the only prediction presented here in agreement with the measurement in all dilepton mass bins, showing the importance of higher order matrix element inclusion in that phase space region. The cross section measurement in presence of at least one hard jet provides additional constrains on the predictions. In particular the low ${p_{\mathrm{T}}(\ell\ell)}$ region exhibits a strong sensitivity to high order contributions. Given the strong correlation between the ${p_{\mathrm{T}}(\ell\ell)}$ and ${\varphi^*}$ variables the same kind of behavior is to be expected and is observed. The measurements of Z + 1 jet are in good agreement with the predictions for all masses. The measurements of the cross section as a function of ${\varphi^*}$ provide more precision both experimentally and for the predictions but less discrimination between the models. Overall, the predictions involving TMDs give a better description in the region of the phase-space sensitive to these effects. |
| References | ||||
| 1 | S. D. Drell and T.-M. Yan | Massive lepton pair production in hadron-hadron collisions at high-energies | PRL 25 (1970) 316 | |
| 2 | Y. L. Dokshitzer, D. Diakonov, and S. I. Troyan | On the transverse momentum distribution of massive lepton pairs | PLB 79 (1978) 269 | |
| 3 | J. C. Collins, D. E. Soper, and G. F. Sterman | Transverse momentum distribution in Drell-Yan pair and W and Z boson production | NPB 250 (1985) 199 | |
| 4 | R. Hamberg, W. L. van Neerven, and T. Matsuura | A complete calculation of the order $ \alpha_s^2 $ correction to the Drell-Yan $ K $-factor | NPB 359 (1991) 343 | |
| 5 | S. Catani et al. | Vector boson production at hadron colliders: a fully exclusive QCD calculation at NNLO | PRL 103 (2009) 082001 | 0903.2120 |
| 6 | S. Catani and M. Grazzini | An NNLO subtraction formalism in hadron collisions and its application to Higgs boson production at the LHC | PRL 98 (2007) 222002 | hep-ph/0703012 |
| 7 | K. Melnikov and F. Petriello | Electroweak gauge boson production at hadron colliders through $ \mathcal O(\alpha_s^2) $ | PRD 74 (2006) 114017 | hep-ph/0609070 |
| 8 | A. Banfi et al. | Optimisation of variables for studying dilepton transverse momentum distributions at hadron colliders | EPJC 71 (2011) 1600 | 1009.1580 |
| 9 | A. Banfi, M. Dasgupta, S. Marzani, and L. Tomlinson | Predictions for Drell-Yan $ \phi^* $ and $ Q_T $ observables at the LHC | PLB 715 (2012) 152 | 1205.4760 |
| 10 | S. Marzani | $ Q_T $ and $ \phi^* $ observables in Drell-Yan processes | EPJ Web Conf. 49 (2013) 14007 | |
| 11 | CMS Collaboration | Measurement of the inclusive $ W $ and $ Z $ production cross sections in $ \mathrm{pp} $ collisions at $ \sqrt{s}= $ 7 TeV | JHEP 10 (2011) 132 | CMS-EWK-10-005 1107.4789 |
| 12 | CMS Collaboration | Measurement of the Drell-Yan cross section in $ \mathrm{pp} $ collisions at $ \sqrt{s}= $ 7 TeV | JHEP 10 (2011) 007 | CMS-EWK-10-007 1108.0566 |
| 13 | CMS Collaboration | Measurement of the differential and double-differential Drell-Yan cross sections in proton-proton collisions at $ \sqrt{s} = $ 7 TeV | JHEP 12 (2013) 030 | CMS-SMP-13-003 1310.7291 |
| 14 | CMS Collaboration | Measurements of differential and double-differential Drell-Yan cross sections in proton-proton collisions at 8 TeV | EPJC 75 (2015) 147 | CMS-SMP-14-003 1412.1115 |
| 15 | CMS Collaboration | Measurement of the Z boson differential cross section in transverse momentum and rapidity in proton-proton collisions at 8 TeV | PLB 749 (2015) 187 | CMS-SMP-13-013 1504.03511 |
| 16 | CMS Collaboration | Measurement of the differential Drell-Yan cross section in proton-proton collisions at $ \sqrt{\mathrm{s}} = $ 13 TeV | JHEP 12 (2019) 059 | CMS-SMP-17-001 1812.10529 |
| 17 | CMS Collaboration | Measurements of differential Z boson production cross sections in proton-proton collisions at $ \sqrt{s} = $ 13 TeV | JHEP 12 (2019) 061 | CMS-SMP-17-010 1909.04133 |
| 18 | ATLAS Collaboration | Measurement of the inclusive $ W^\pm $ and $ Z/\gamma^* $ cross sections in the electron and muon decay channels in $ \mathrm{pp} $ collisions at $ \sqrt{s}= $ 7 TeV with the ATLAS detector | PRD 85 (2012) 072004 | 1109.5141 |
| 19 | ATLAS Collaboration | Measurement of the high-mass Drell--Yan differential cross-section in pp collisions at $ \sqrt s= $ 7 TeV with the ATLAS detector | PLB 725 (2013) 223 | 1305.4192 |
| 20 | ATLAS Collaboration | Measurement of the low-mass Drell-Yan differential cross section at $ \sqrt{s} = $ 7 TeV using the ATLAS detector | JHEP 06 (2014) 112 | 1404.1212 |
| 21 | ATLAS Collaboration | Measurement of the transverse momentum and $ \phi ^*_{\eta} $ distributions of Drell-Yan lepton pairs in proton-proton collisions at $ \sqrt{s}= $ 8 TeV with the ATLAS detector | EPJC 76 (2016) 291 | 1512.02192 |
| 22 | ATLAS Collaboration | Precision measurement and interpretation of inclusive $ W^+ $ , $ W^- $ and $ Z/\gamma ^* $ production cross sections with the ATLAS detector | EPJC 77 (2017) 367 | 1612.03016 |
| 23 | LHCb Collaboration | Inclusive $ W $ and $ Z $ production in the forward region at $ \sqrt{s} = $ 7 TeV | JHEP 06 (2012) 058 | 1204.1620 |
| 24 | LHCb Collaboration | Measurement of the cross-section for $ Z \to e^+e^- $ production in $ \mathrm{pp} $ collisions at $ \sqrt{s}= $ 7 TeV | JHEP 02 (2013) 106 | 1212.4620 |
| 25 | LHCb Collaboration | Measurement of the forward $ Z $ boson production cross-section in $ \mathrm{pp} $ collisions at $ \sqrt{s}= $ 7 TeV | JHEP 08 (2015) 039 | 1505.07024 |
| 26 | LHCb Collaboration | Measurement of forward W and Z boson production in $ \mathrm{pp} $ collisions at $ \sqrt{s}= $ 8 TeV | JHEP 01 (2016) 155 | 1511.08039 |
| 27 | LHCb Collaboration | Measurement of the forward Z boson production cross-section in $ \mathrm{pp} $ collisions at $ \sqrt{s} = $ 13 TeV | JHEP 09 (2016) 136 | 1607.06495 |
| 28 | CMS Collaboration | Particle-flow reconstruction and global event description with the CMS detector | JINST 12 (2017) P10003 | CMS-PRF-14-001 1706.04965 |
| 29 | CMS Collaboration | Electron and photon reconstruction and identification with the CMS experiment at the CERN LHC | Submitted to JHEP | CMS-EGM-17-001 2012.06888 |
| 30 | CMS Collaboration | Performance of the CMS muon detector and muon reconstruction with proton-proton collisions at $ \sqrt{s} = $ 13 TeV | JINST 13 (2018) P06015 | CMS-MUO-16-001 1804.04528 |
| 31 | A. Bodek et al. | Extracting muon momentum scale corrections for hadron collider experiments | EPJC 72 (2012) 2194 | 1208.3710 |
| 32 | M. Cacciari, G. P. Salam, and G. Soyez | The anti-$ k_t $ jet clustering algorithm | JHEP 04 (2008) 063 | 0802.1189 |
| 33 | M. Cacciari, G. P. Salam, and G. Soyez | FastJet user manual | EPJC 72 (2012) 1896 | 1111.6097 |
| 34 | CMS Collaboration | Performance of the CMS Level-1 trigger in proton-proton collisions at $ \sqrt{s} = $ 13 TeV | JINST 15 (2020) P10017 | CMS-TRG-17-001 2006.10165 |
| 35 | CMS Collaboration | The CMS trigger system | JINST 12 (2017) P01020 | CMS-TRG-12-001 1609.02366 |
| 36 | CMS Collaboration | The CMS experiment at the CERN LHC | JINST 3 (2008) S08004 | CMS-00-001 |
| 37 | CMS Collaboration | Identification of b quark jets at the CMS experiment in the LHC run 2 | CMS-PAS-BTV-15-001 | CMS-PAS-BTV-15-001 |
| 38 | CMS Collaboration | Identification of heavy-flavour jets with the CMS detector in pp collisions at 13 TeV | JINST 13 (2018) P05011 | CMS-BTV-16-002 1712.07158 |
| 39 | CMS Collaboration | Identification of b-quark jets with the CMS experiment | JINST 8 (2013) P04013 | CMS-BTV-12-001 1211.4462 |
| 40 | R. Frederix and S. Frixione | Merging meets matching in MC@NLO | JHEP 12 (2012) 061 | 1209.6215 |
| 41 | T. Sjostrand et al. | An introduction to PYTHIA 8.2 | CPC 191 (2015) 159 | 1410.3012 |
| 42 | CMS Collaboration | Event generator tunes obtained from underlying event and multiparton scattering measurements | EPJC 76 (2016) 155 | CMS-GEN-14-001 1512.00815 |
| 43 | NNPDF Collaboration | Parton distributions for the LHC Run II | JHEP 04 (2015) 040 | 1410.8849 |
| 44 | P. Nason | A new method for combining NLO QCD with shower Monte Carlo algorithms | JHEP 11 (2004) 040 | hep-ph/0409146 |
| 45 | S. Frixione, P. Nason, and C. Oleari | Matching NLO QCD computations with parton shower simulations: the POWHEG method | JHEP 11 (2007) 070 | 0709.2092 |
| 46 | S. Alioli, P. Nason, C. Oleari, and E. Re | A general framework for implementing NLO calculations in shower Monte Carlo programs: the POWHEG BOX | JHEP 06 (2010) 043 | 1002.2581 |
| 47 | S. Frixione, P. Nason, and G. Ridolfi | A positive-weight next-to-leading-order Monte Carlo for heavy flavour hadroproduction | JHEP 09 (2007) 126 | 0707.3088 |
| 48 | P. Nason and G. Zanderighi | $ \mathrm{W}^+ \mathrm{W}^- $, $ \mathrm{W} \mathrm{Z} $ and $ \mathrm{Z} \mathrm{Z} $ production in the powheg-box-v2 | EPJC 74 (2014) 2702 | 1311.1365 |
| 49 | J. A. M. Vermaseren | Two photon processes at very high-energies | NPB 229 (1983) 347 | |
| 50 | S. Baranov, O. Duenger, H. Shooshtari, and J. A. M. Vermaseren | LPAIR: A generator for lepton pair production | in Workshop on Physics at HERA, 1991 | |
| 51 | A. Suri and D. R. Yennie | The space-time phenomenology of photon absorption and inelastic electron scattering | Annals Phys. 72 (1972) 243 | |
| 52 | J. M. Campbell, R. K. Ellis, and W. T. Giele | A multi-threaded version of MCFM | EPJC 75 (2015) 246 | 1503.06182 |
| 53 | T. Gehrmann et al. | $ W^+W^- $ production at hadron colliders in next to next to leading order QCD | PRL 113 (2014) 212001 | 1408.5243 |
| 54 | M. Czakon and A. Mitov | Top++: A program for the calculation of the top-pair cross-section at hadron colliders | CPC 185 (2014) 2930 | 1112.5675 |
| 55 | G. D'Agostini | A multidimensional unfolding method based on Bayes' theorem | NIMA 362 (1995) 487 | |
| 56 | CMS Collaboration | Measurement of differential cross sections for Z boson production in association with jets in proton-proton collisions at $ \sqrt{s} = $ 13 TeV | EPJC 78 (2018) 965 | CMS-SMP-16-015 1804.05252 |
| 57 | CMS Collaboration | Precision luminosity measurement in proton-proton collisions at $ \sqrt{s} = $ 13 TeV in 2015 and 2016 at CMS | (04, 2021). Submitted to EPJC | CMS-LUM-17-003 2104.01927 |
| 58 | A. Manohar, P. Nason, G. P. Salam, and G. Zanderighi | How bright is the proton? A precise determination of the photon parton distribution function | PRL 117 (2016) 242002 | 1607.04266 |
| 59 | A. V. Manohar, P. Nason, G. P. Salam, and G. Zanderighi | The photon content of the proton | JHEP 12 (2017) 046 | 1708.01256 |
| 60 | ATLAS Collaboration | Measurement of the inelastic proton-proton cross section at $ \sqrt{s} = $ 13 TeV with the ATLAS detector at the LHC | PRL 117 (2016) 182002 | 1606.02625 |
| 61 | CMS Collaboration | Measurement of the inelastic proton-proton cross section at $ \sqrt{s}= $ 13 TeV | JHEP 07 (2018) 161 | CMS-FSQ-15-005 1802.02613 |
| 62 | F. Hautmann et al. | Soft-gluon resolution scale in QCD evolution equations | PLB 772 (2017) 446 | 1704.01757 |
| 63 | F. Hautmann et al. | Collinear and TMD quark and gluon densities from parton branching solution of QCD evolution equations | JHEP 01 (2018) 070 | 1708.03279 |
| 64 | H. Jung et al. | The CCFM Monte Carlo generator CASCADE version 2.2.03 | EPJC 70 (2010) 1237 | 1008.0152 |
| 65 | S. Baranov et al. | CASCADE3 A Monte Carlo event generator based on TMDs | 2101.10221 | |
| 66 | A. B. Martinez et al. | Collinear and TMD parton densities from fits to precision DIS measurements in the parton branching method | PRD 99 (2019) 074008 | 1804.11152 |
| 67 | T. Sjostrand, S. Mrenna, and P. Z. Skands | PYTHIA 6.4 Physics and Manual | JHEP 05 (2006) 026 | hep-ph/0603175 |
| 68 | I. Scimemi and A. Vladimirov | Analysis of vector boson production within TMD factorization | EPJC 78 (2018) 89 | 1706.01473 |
| 69 | I. Scimemi and A. Vladimirov | Non-perturbative structure of semi-inclusive deep-inelastic and Drell-Yan scattering at small transverse momentum | JHEP 06 (2020) 137 | 1912.06532 |
| 70 | A. Vladimirov | arTeMiDe-web | ||
| 71 | S. Alioli et al. | Combining higher-order resummation with multiple NLO calculations and parton showers in GENEVA | JHEP 09 (2013) 120 | 1211.7049 |
| 72 | S. Alioli et al. | Drell-Yan production at NNLL'+NNLO matched to parton showers | PRD 92 (2015) 094020 | 1508.01475 |
| 73 | I. W. Stewart, F. J. Tackmann, and W. J. Waalewijn | N-jettiness: An inclusive event shape to veto jets | PRL 105 (2010) 092002 | 1004.2489 |
| 74 | J. Butterworth et al. | PDF4LHC recommendations for LHC Run II | JPG 43 (2016) 023001 | 1510.03865 |
| 75 | CMS Collaboration | Measurements of differential production cross sections for a Z boson in association with jets in pp collisions at $ \sqrt{s}= $ 8 TeV | JHEP 04 (2017) 022 | CMS-SMP-14-013 1611.03844 |
|
|
Compact Muon Solenoid LHC, CERN |
|

|

|

|

|

|