

Compact Muon Solenoid
LHC, CERN
| CMS-PAS-HIN-21-011 | ||
| Measurement of two-particle Bose-Einstein momentum correlations and their Lévy parameters at ${\sqrt {\smash [b]{s_{_{\mathrm {NN}}}}}}=$ 5.02 TeV PbPb collisions | ||
| CMS Collaboration | ||
| April 2022 | ||
| Abstract: Charged hadron, two-particle Bose-Einstein momentum correlation functions in lead-lead (PbPb) collisions at an average center of mass energy per nucleon (${\sqrt {\smash [b]{s_{_{\mathrm {NN}}}}}}$) of 5.02 TeV are presented. The data were obtained in 2018 by the CMS experiment at the LHC. The experimental results are discussed in terms of theoretically derived correlation functions for Levy type source distributions. Using average pair transverse momentum and centrality binning, the source distribution parameters are extracted as a function of pair transverse mass $m_{\mathrm{T}}$ and collision centrality. These parameters include the correlation strength parameter $\lambda$, the Levy index or shape parameter $\alpha$, and the Levy scale parameter $R$. We find that the source shape, characterized by $\alpha$, is neither Cauchy nor Gaussian, implying the need for a full Levy analysis. A hydrodynamical scaling, previously shown to work for Gaussian radii, is also found to hold for $R$. | ||
|
Links:
CDS record (PDF) ;
CADI line (restricted) ;
These preliminary results are superseded in this paper, Submitted to PRC. The superseded preliminary plots can be found here. |
||
| Figures | |
png pdf |
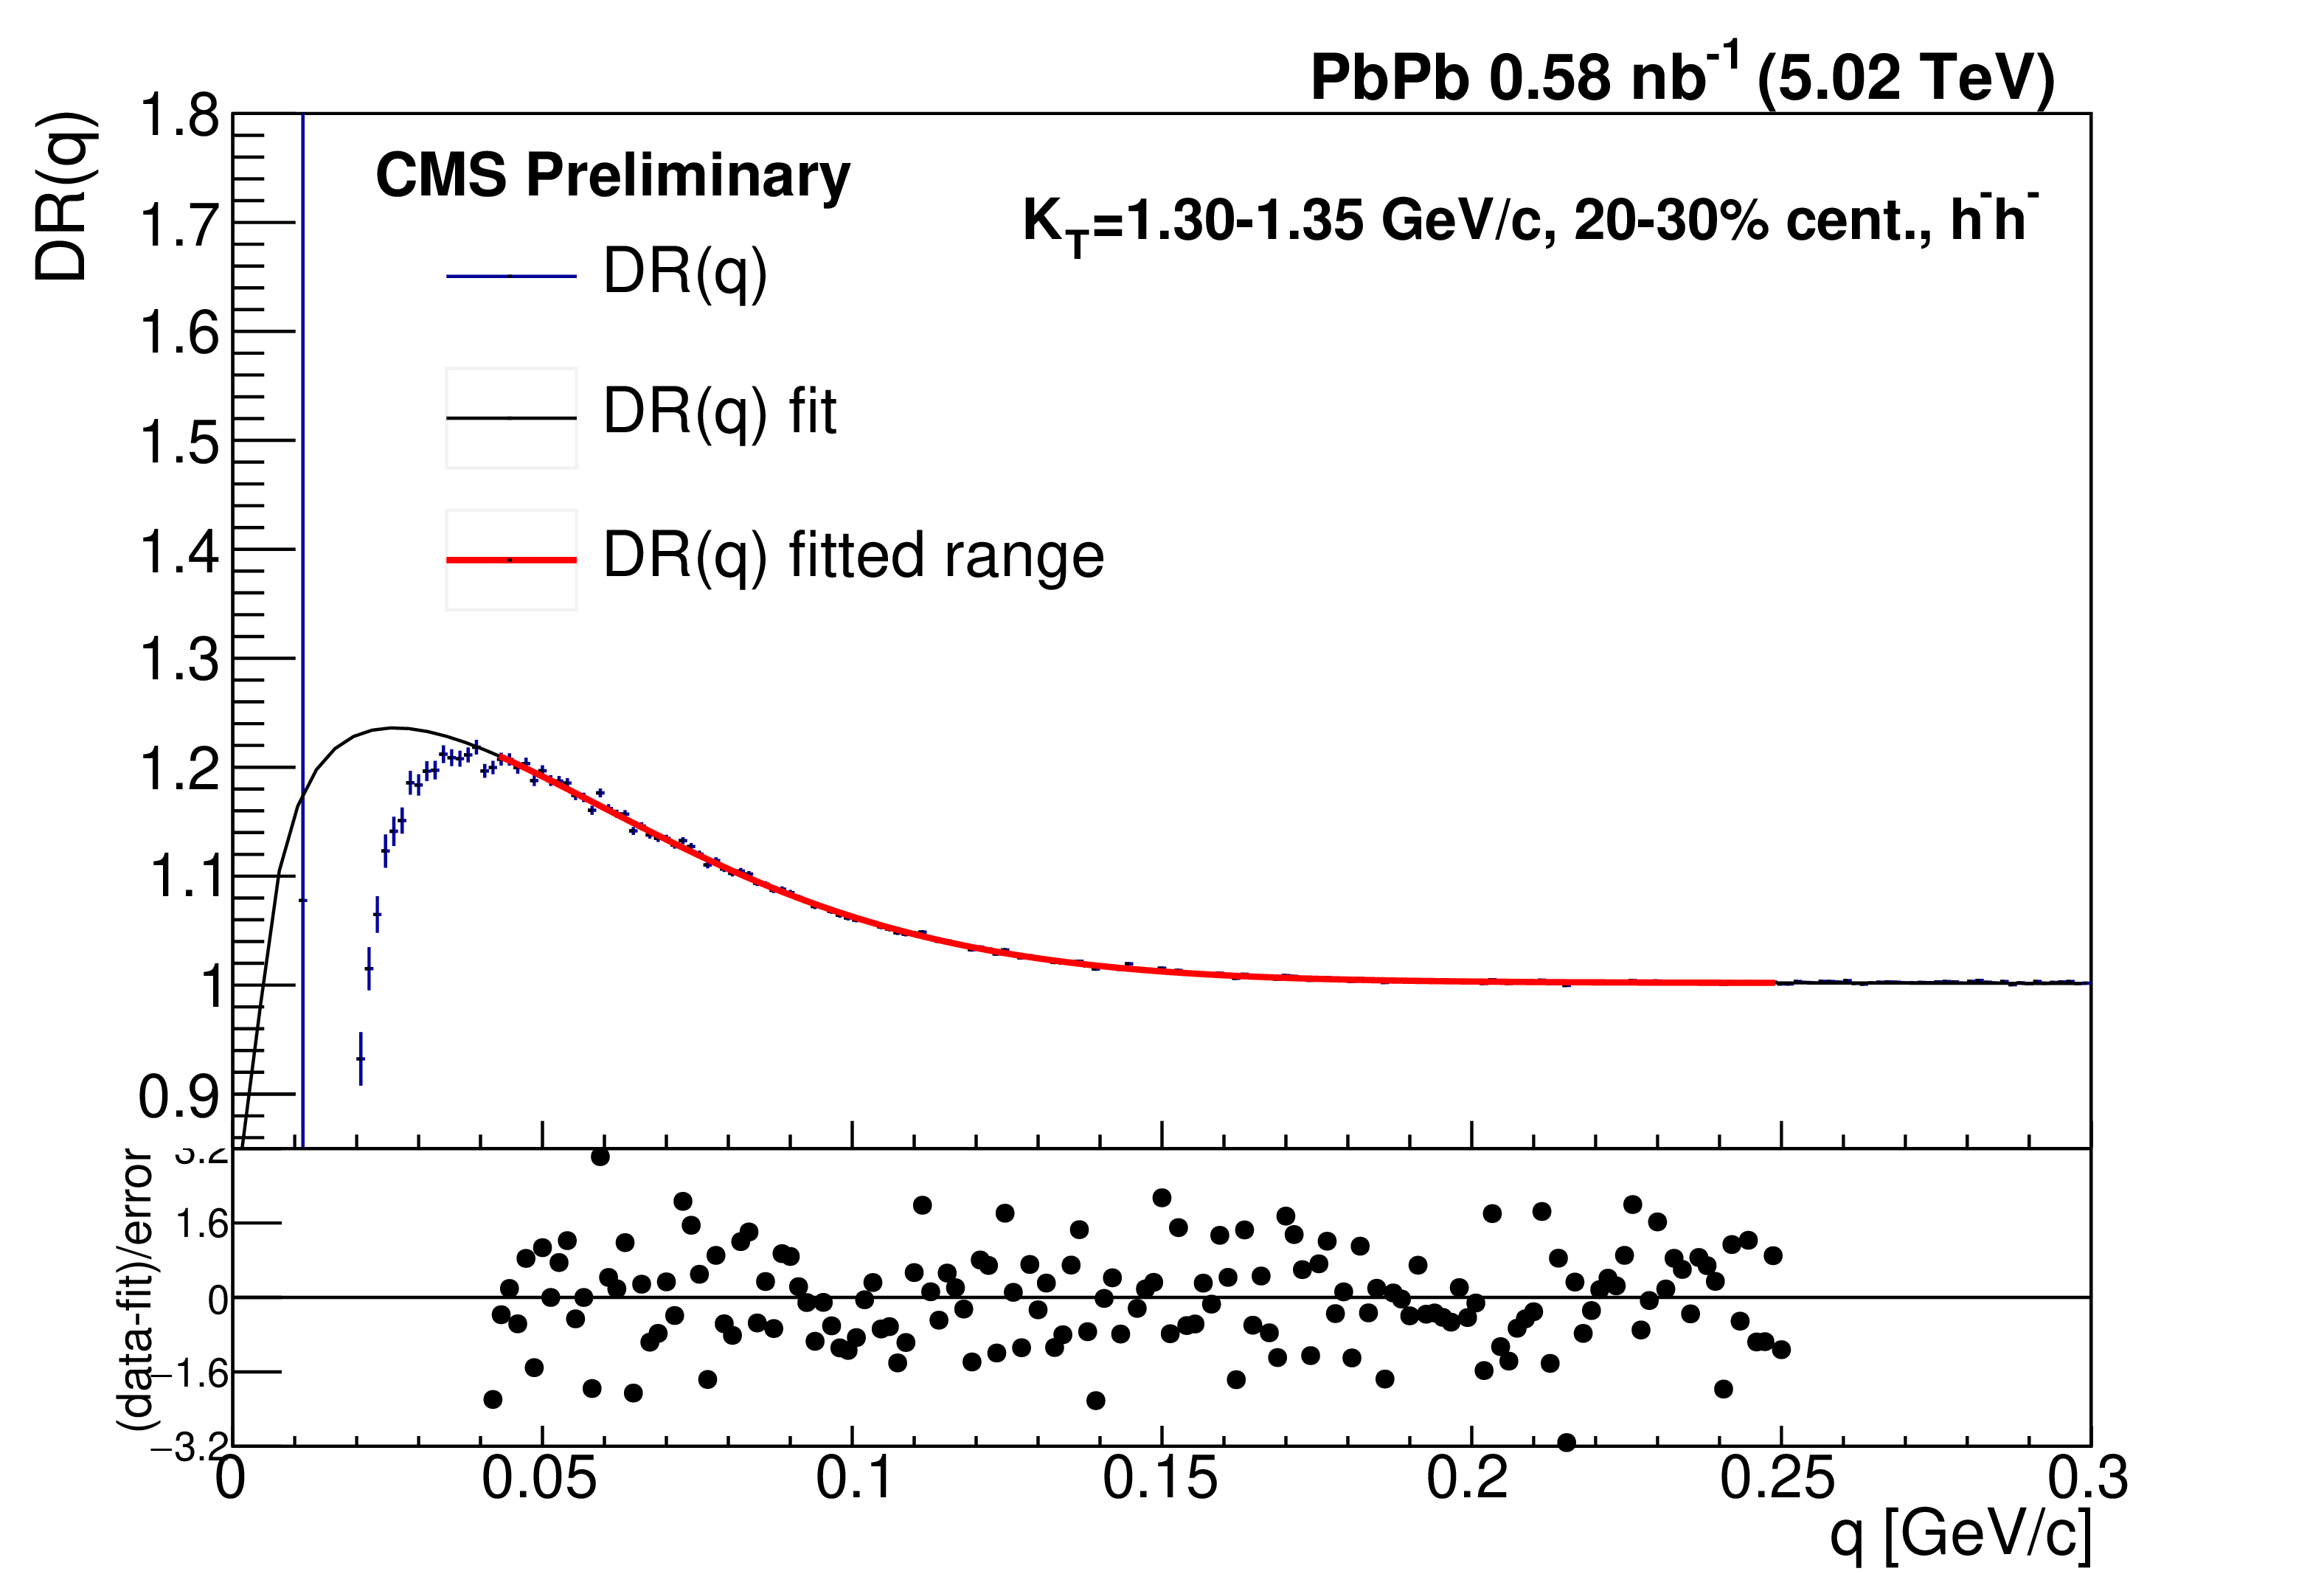
Figure 1:
An example fit to the double-ratio correlation function $DR(q)$. The fitted function is black, while the red overlay indicates the range used for the fit. The $K_{\mathrm {T}}$ and centrality class is visible in the legend. |

png pdf |
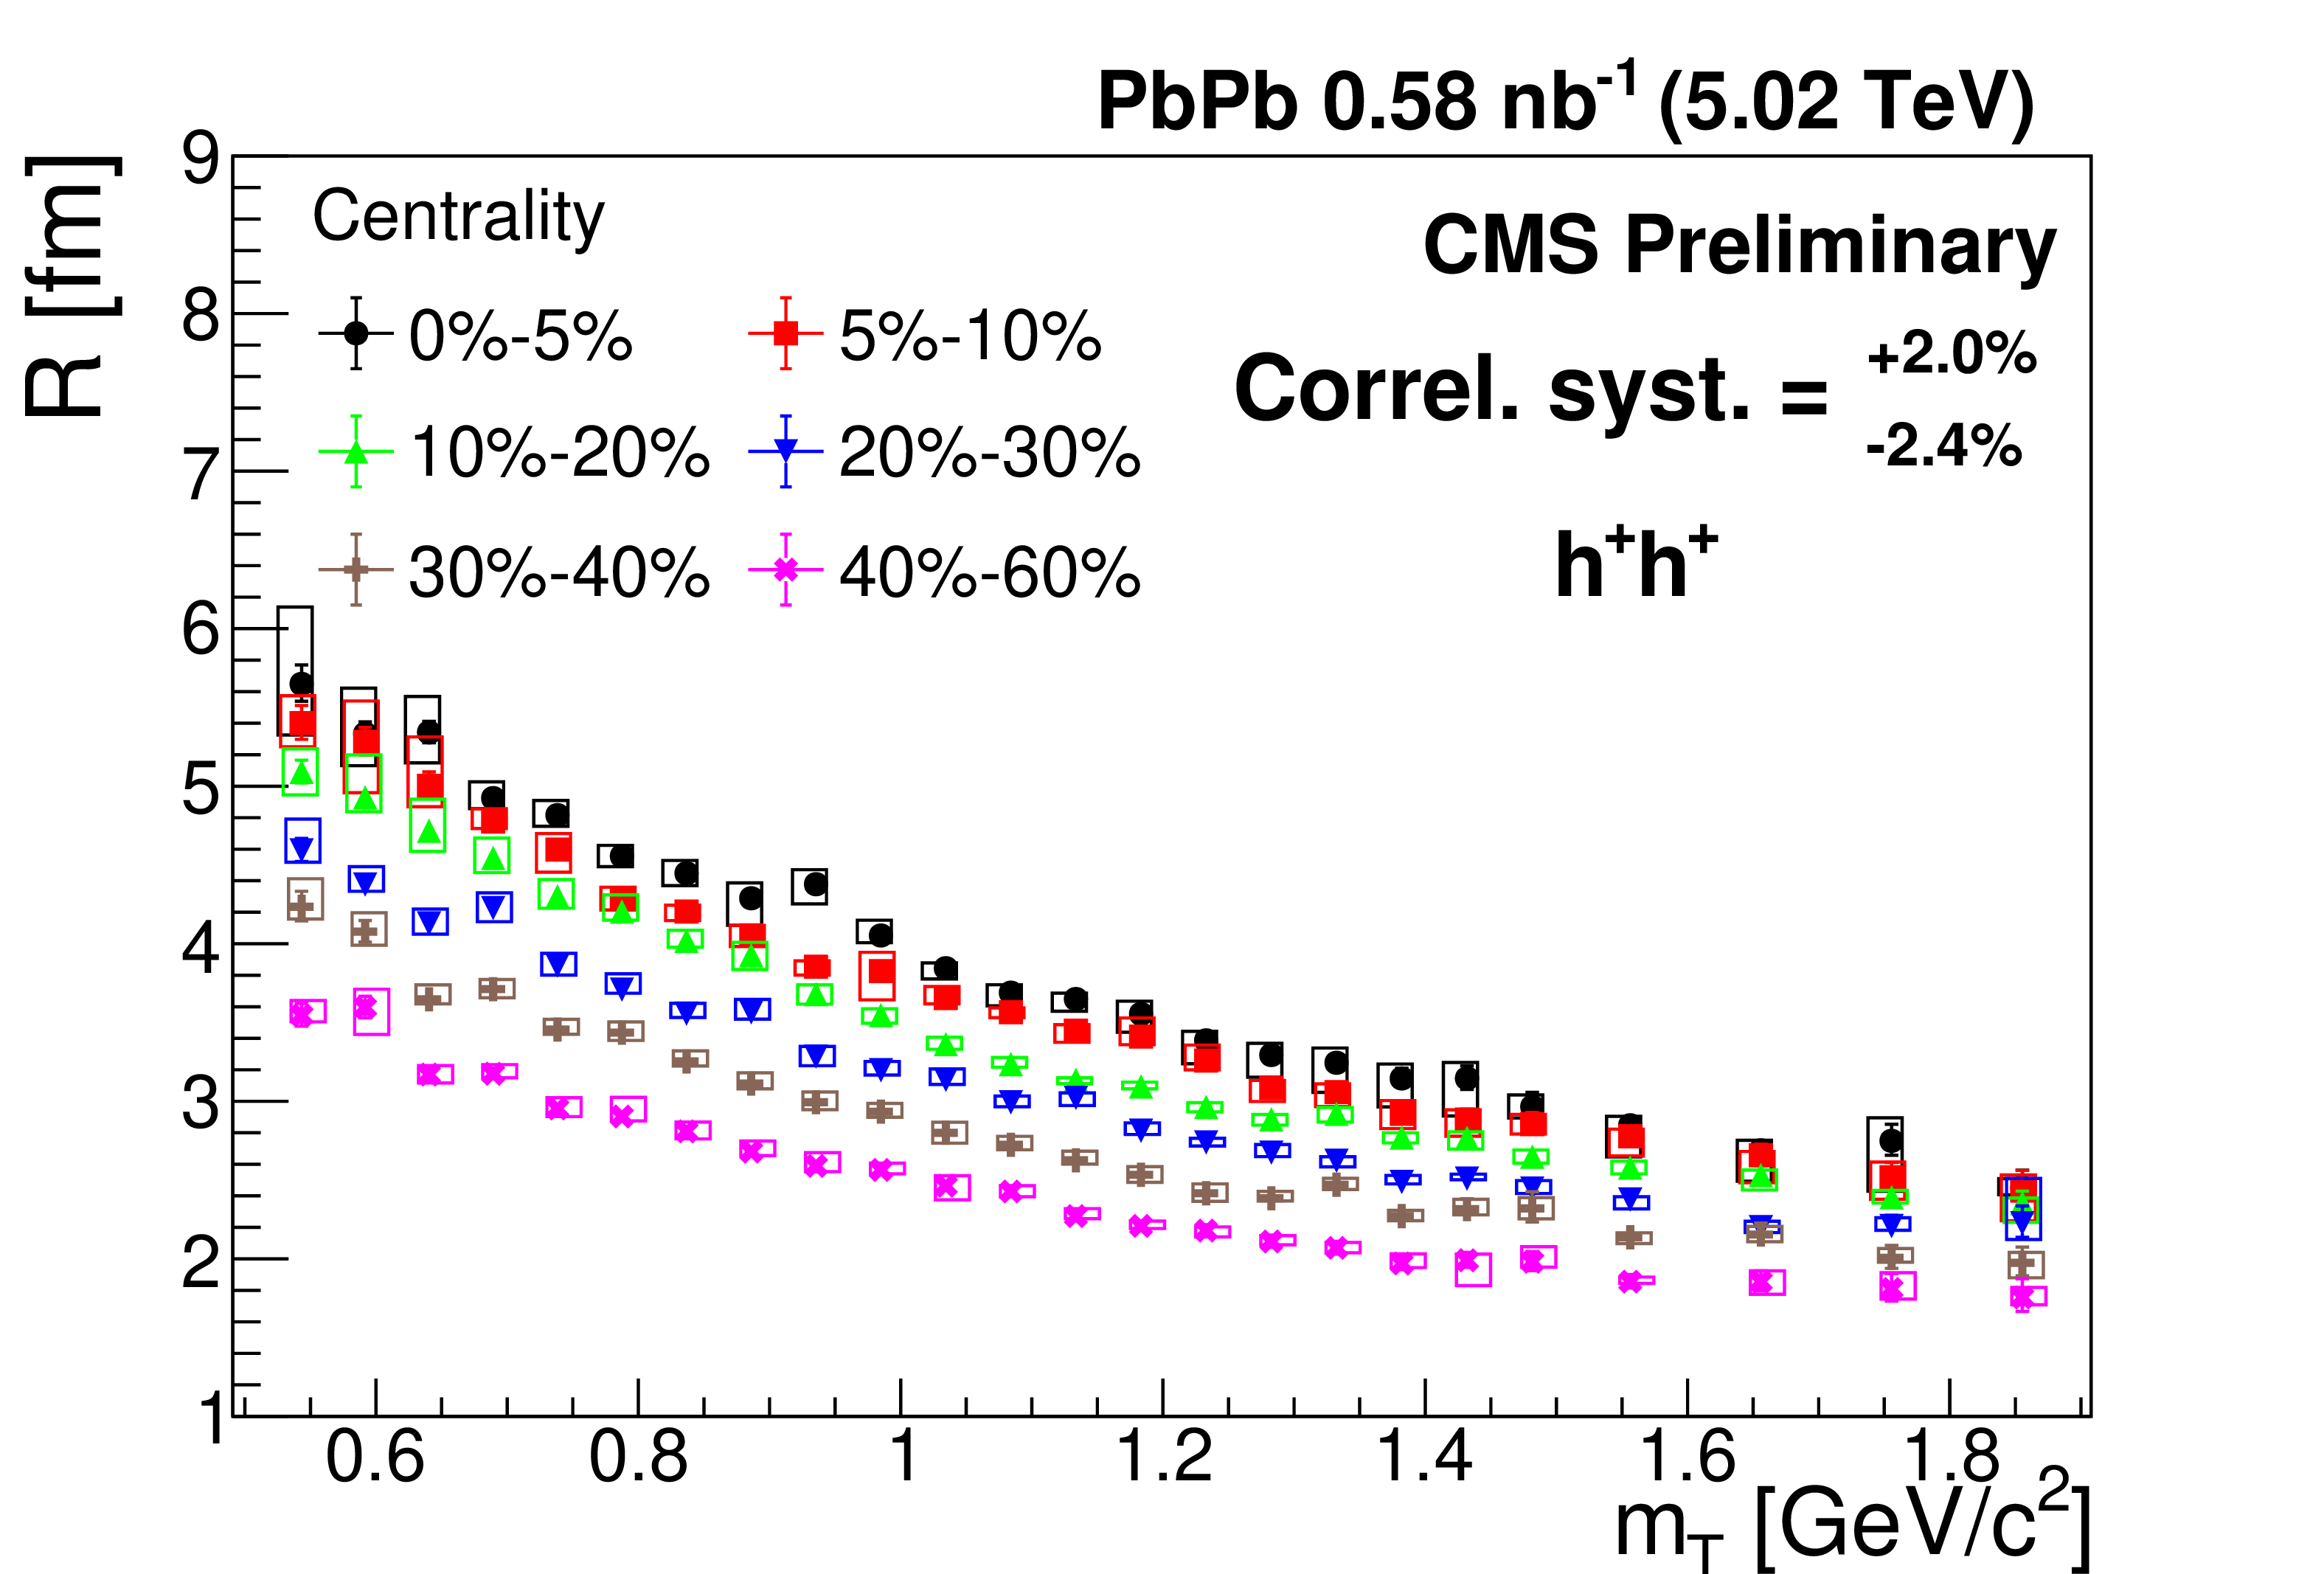
Figure 2:
The Lévy scale parameter $R$ versus the transverse mass $m_{\mathrm {T}}$ in different centrality classes for positive (left) and negative (right) hadron pairs. The error bars are the statistical uncertainties, while the boxes indicate the point-to-point systematic uncertainties. The correlated systematic uncertainty is also indicated. |
png pdf |
Figure 2-a:
The Lévy scale parameter $R$ versus the transverse mass $m_{\mathrm {T}}$ in different centrality classes for positive (left) and negative (right) hadron pairs. The error bars are the statistical uncertainties, while the boxes indicate the point-to-point systematic uncertainties. The correlated systematic uncertainty is also indicated. |

png pdf |
Figure 2-b:
The Lévy scale parameter $R$ versus the transverse mass $m_{\mathrm {T}}$ in different centrality classes for positive (left) and negative (right) hadron pairs. The error bars are the statistical uncertainties, while the boxes indicate the point-to-point systematic uncertainties. The correlated systematic uncertainty is also indicated. |
png pdf |
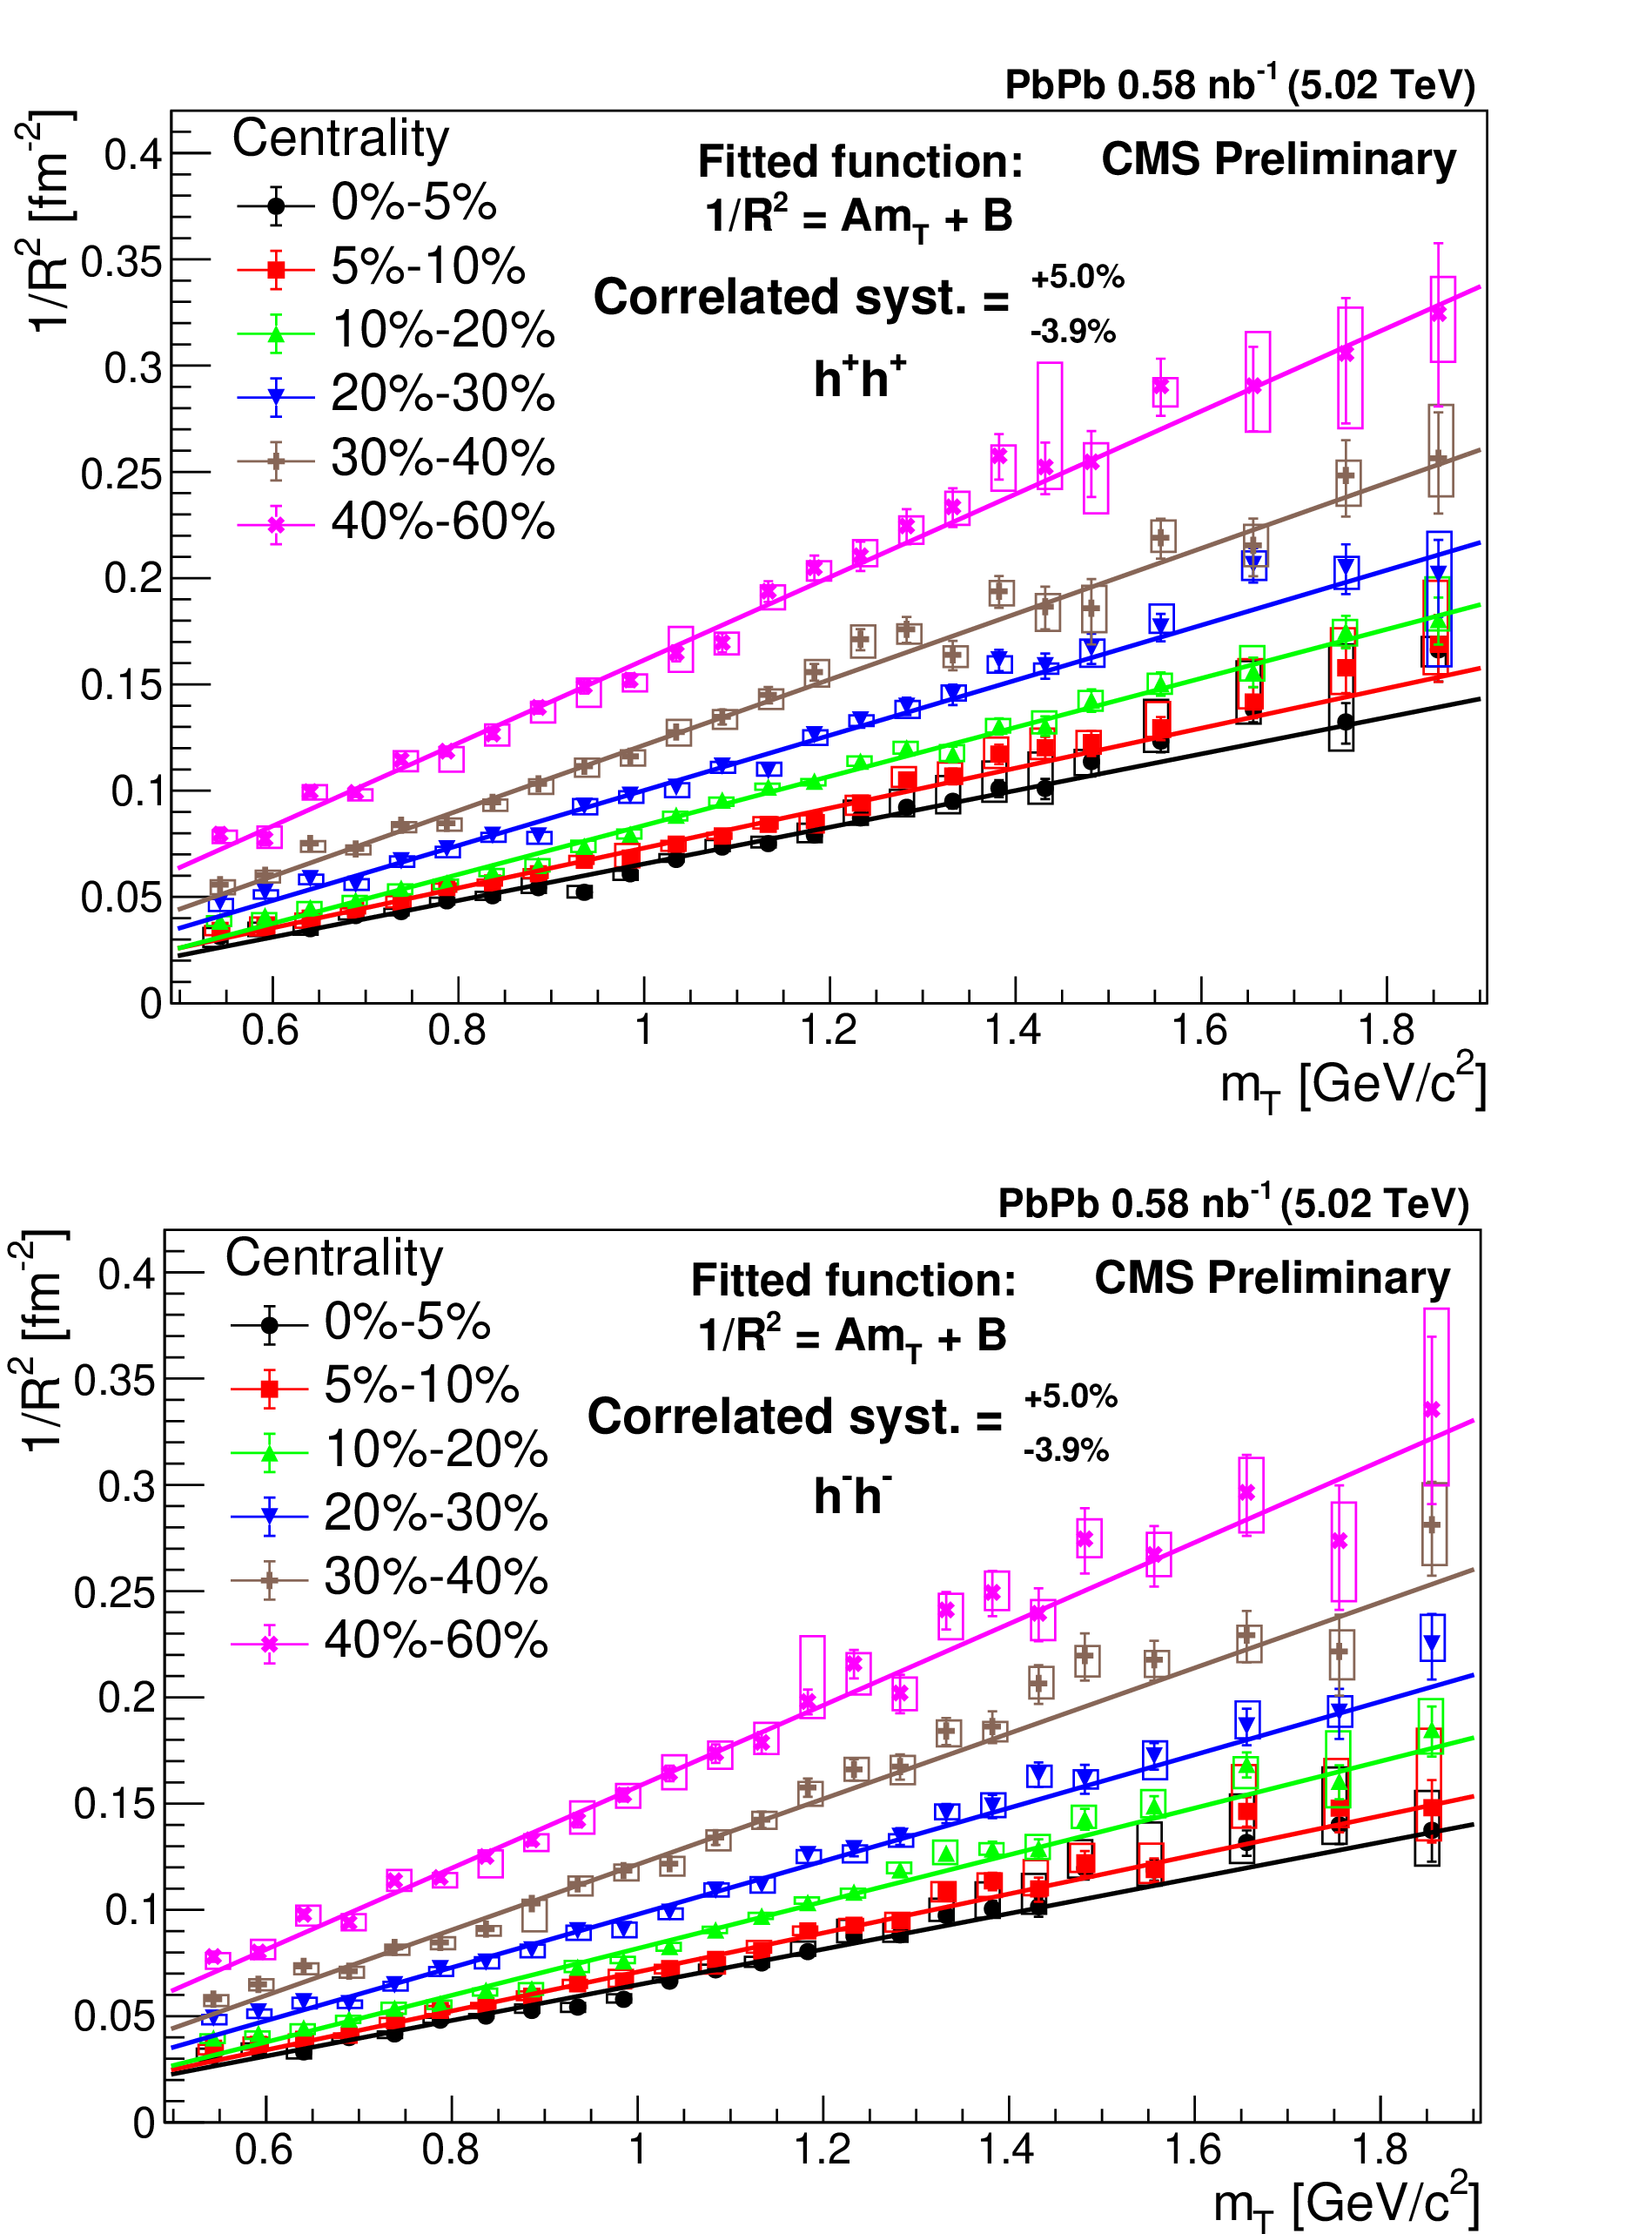
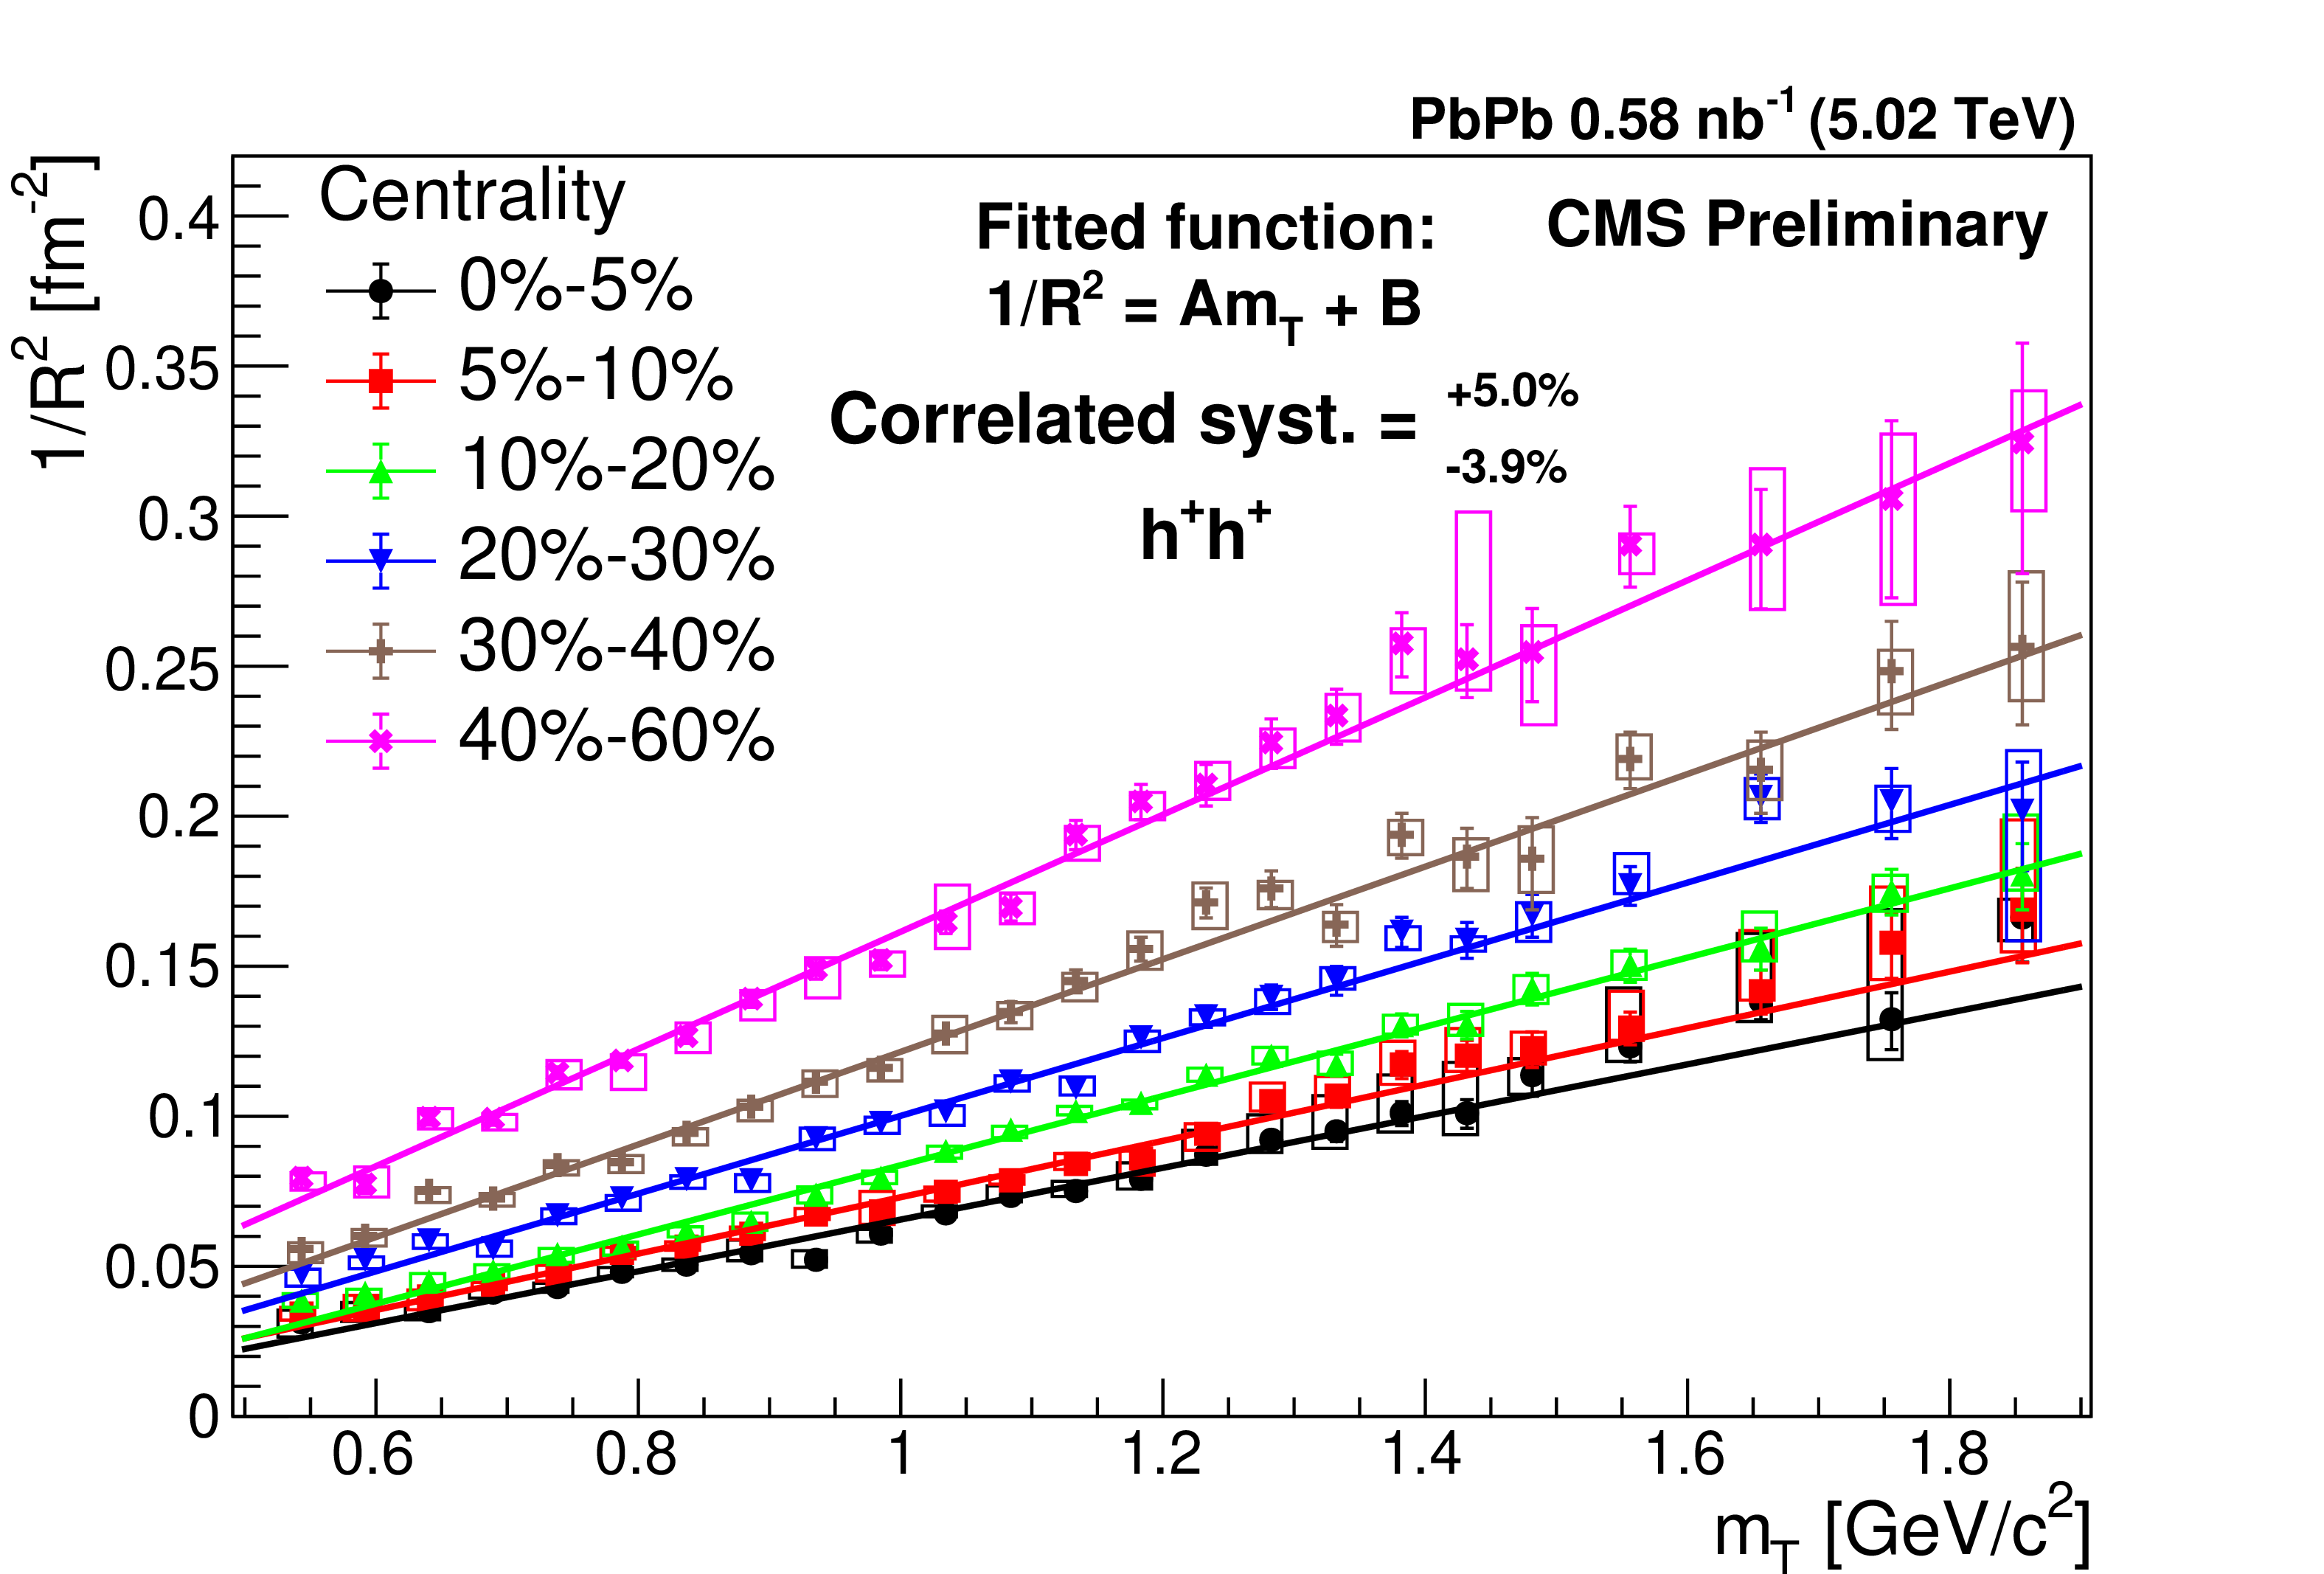
Figure 3:
$1/R^2$ versus the transverse mass $m_{\mathrm {T}}$ in different centrality classes for positive (top) and negative (bottom) hadron pairs. The error bars are the statistical uncertainties, while the boxes indicate the point-to-point systematic uncertainties. The correlated systematic uncertainty is also indicated. We fitted a line to the data for each centrality. The fit results are in Table 5. |
png pdf |
Figure 3-a:
$1/R^2$ versus the transverse mass $m_{\mathrm {T}}$ in different centrality classes for positive (top) and negative (bottom) hadron pairs. The error bars are the statistical uncertainties, while the boxes indicate the point-to-point systematic uncertainties. The correlated systematic uncertainty is also indicated. We fitted a line to the data for each centrality. The fit results are in Table 5. |

png pdf |
Figure 3-b:
$1/R^2$ versus the transverse mass $m_{\mathrm {T}}$ in different centrality classes for positive (top) and negative (bottom) hadron pairs. The error bars are the statistical uncertainties, while the boxes indicate the point-to-point systematic uncertainties. The correlated systematic uncertainty is also indicated. We fitted a line to the data for each centrality. The fit results are in Table 5. |
png pdf |
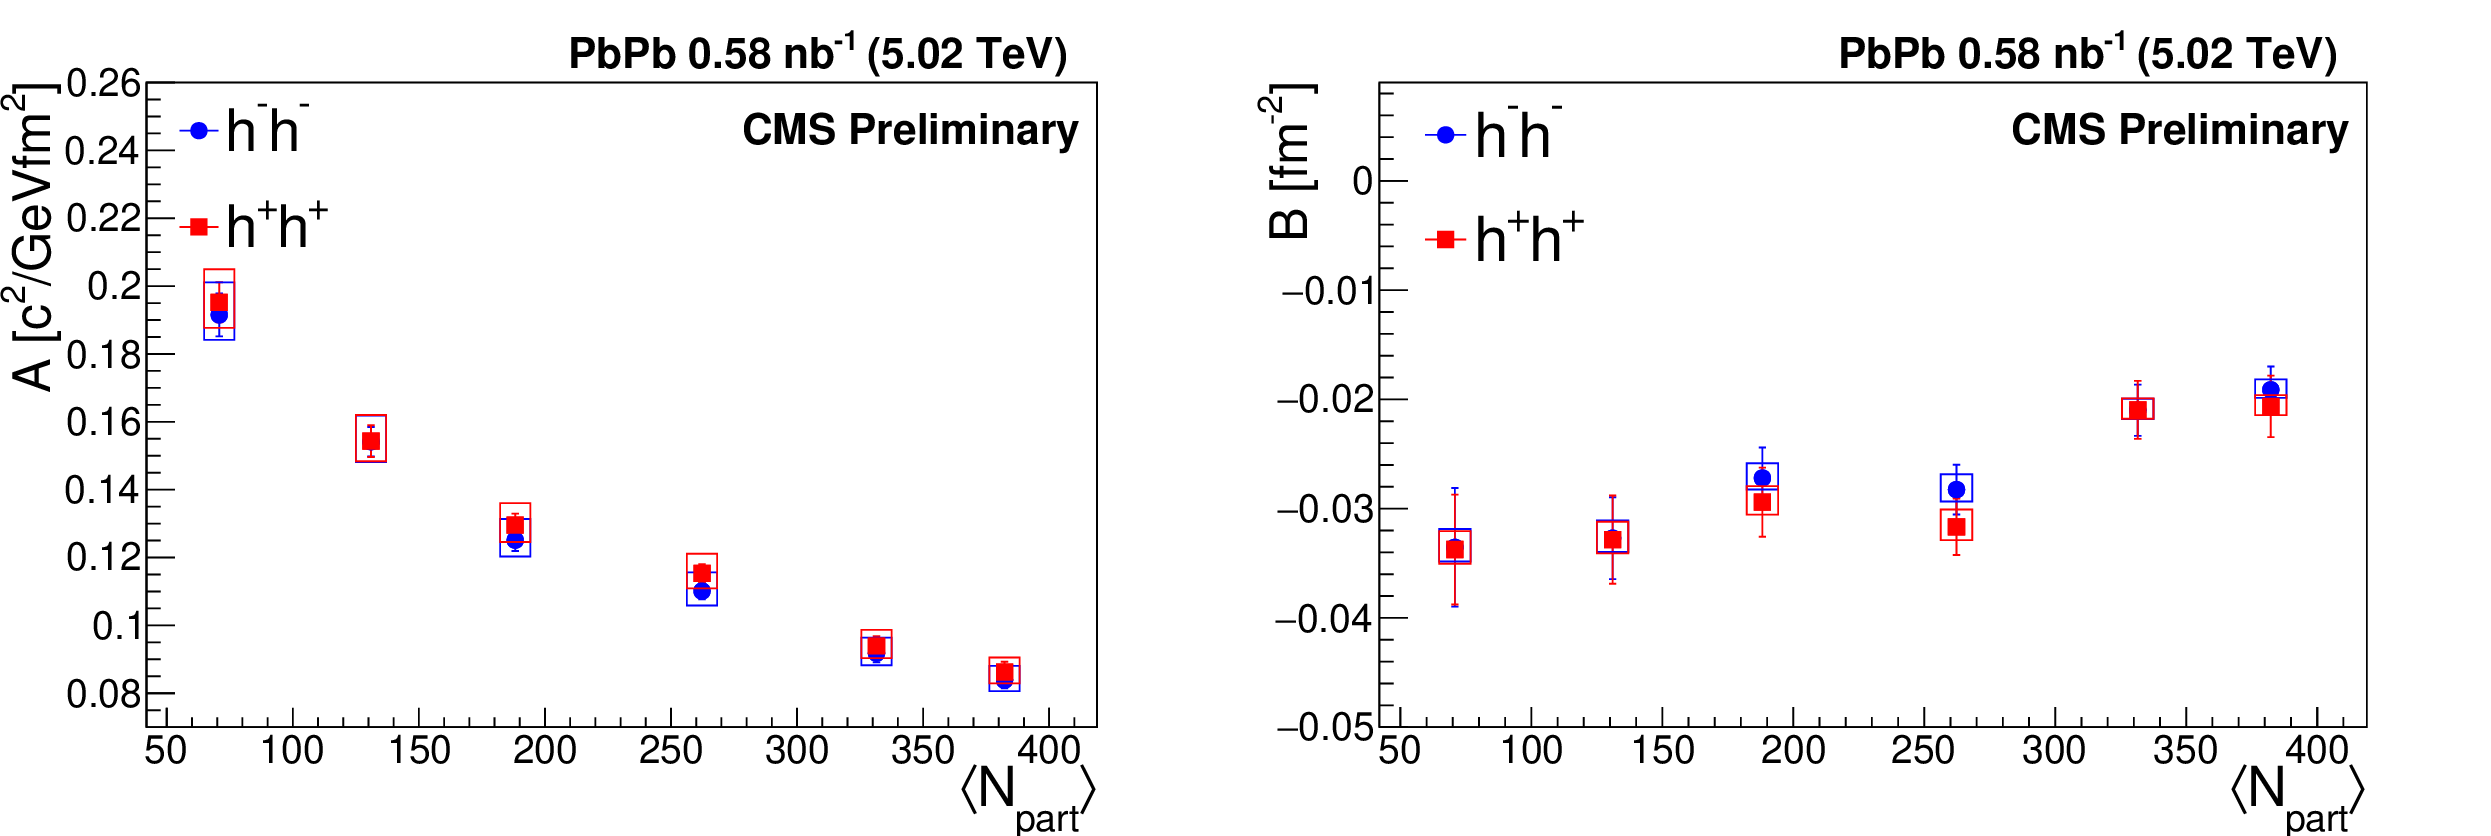
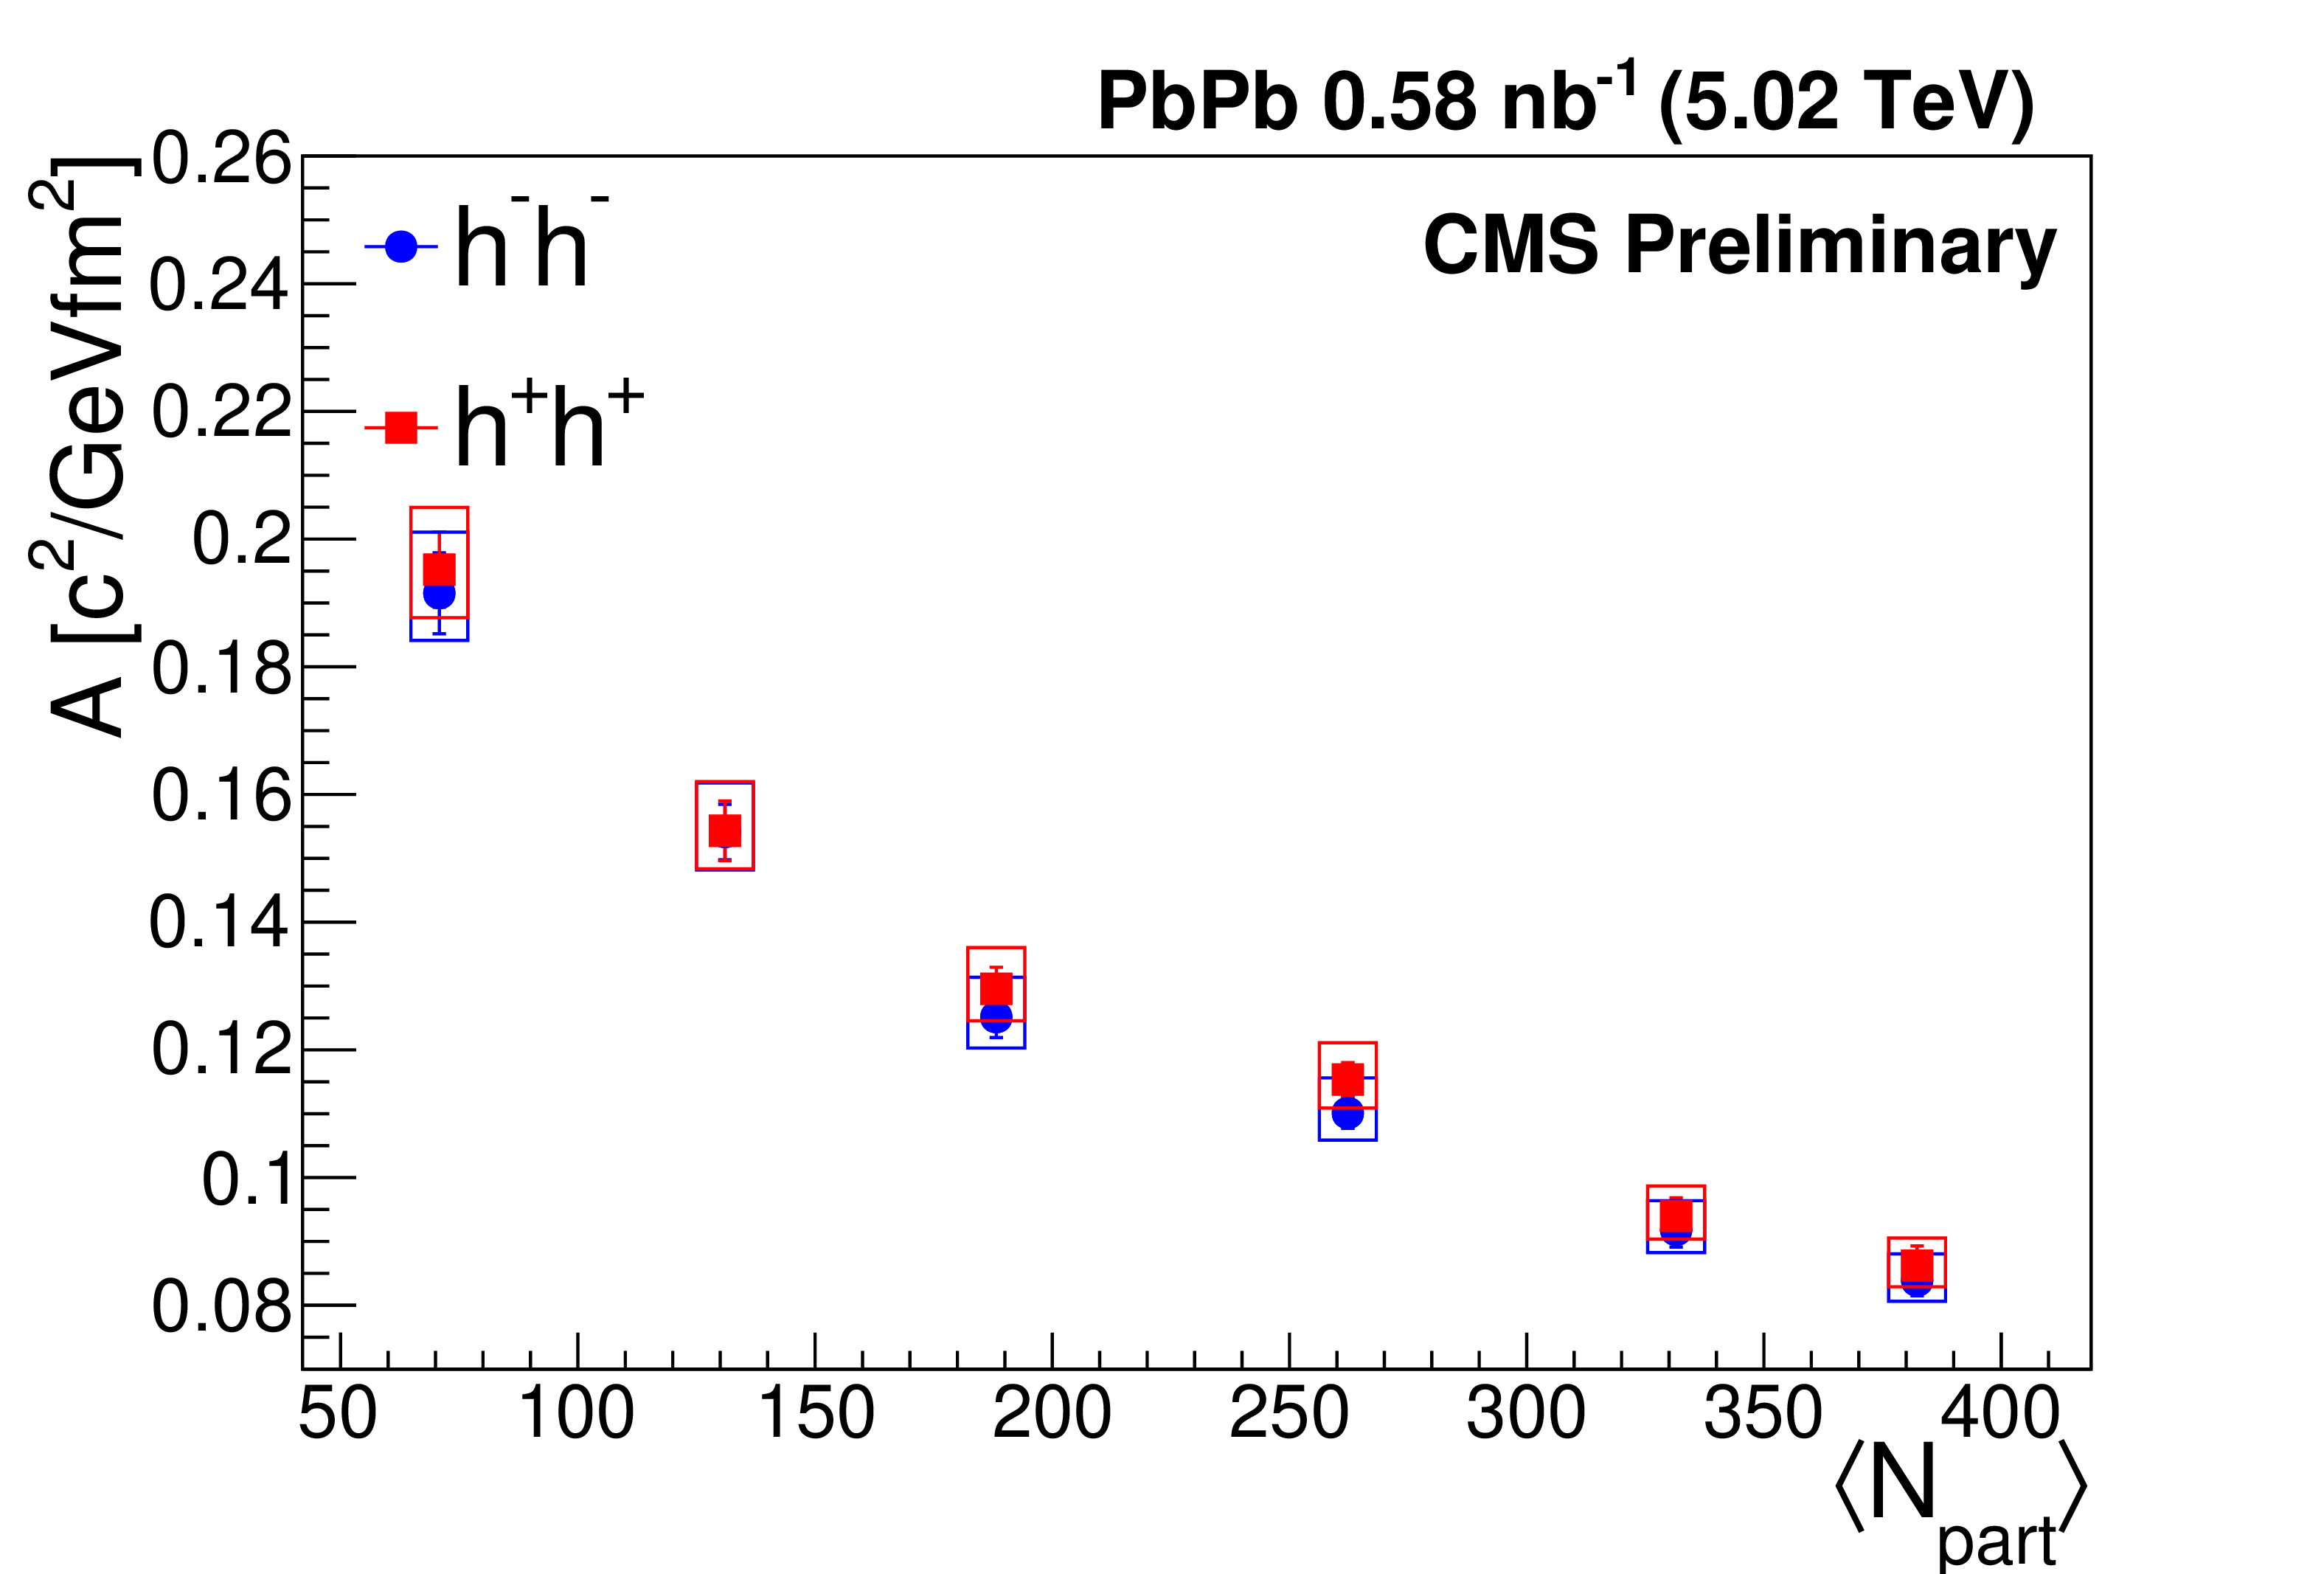
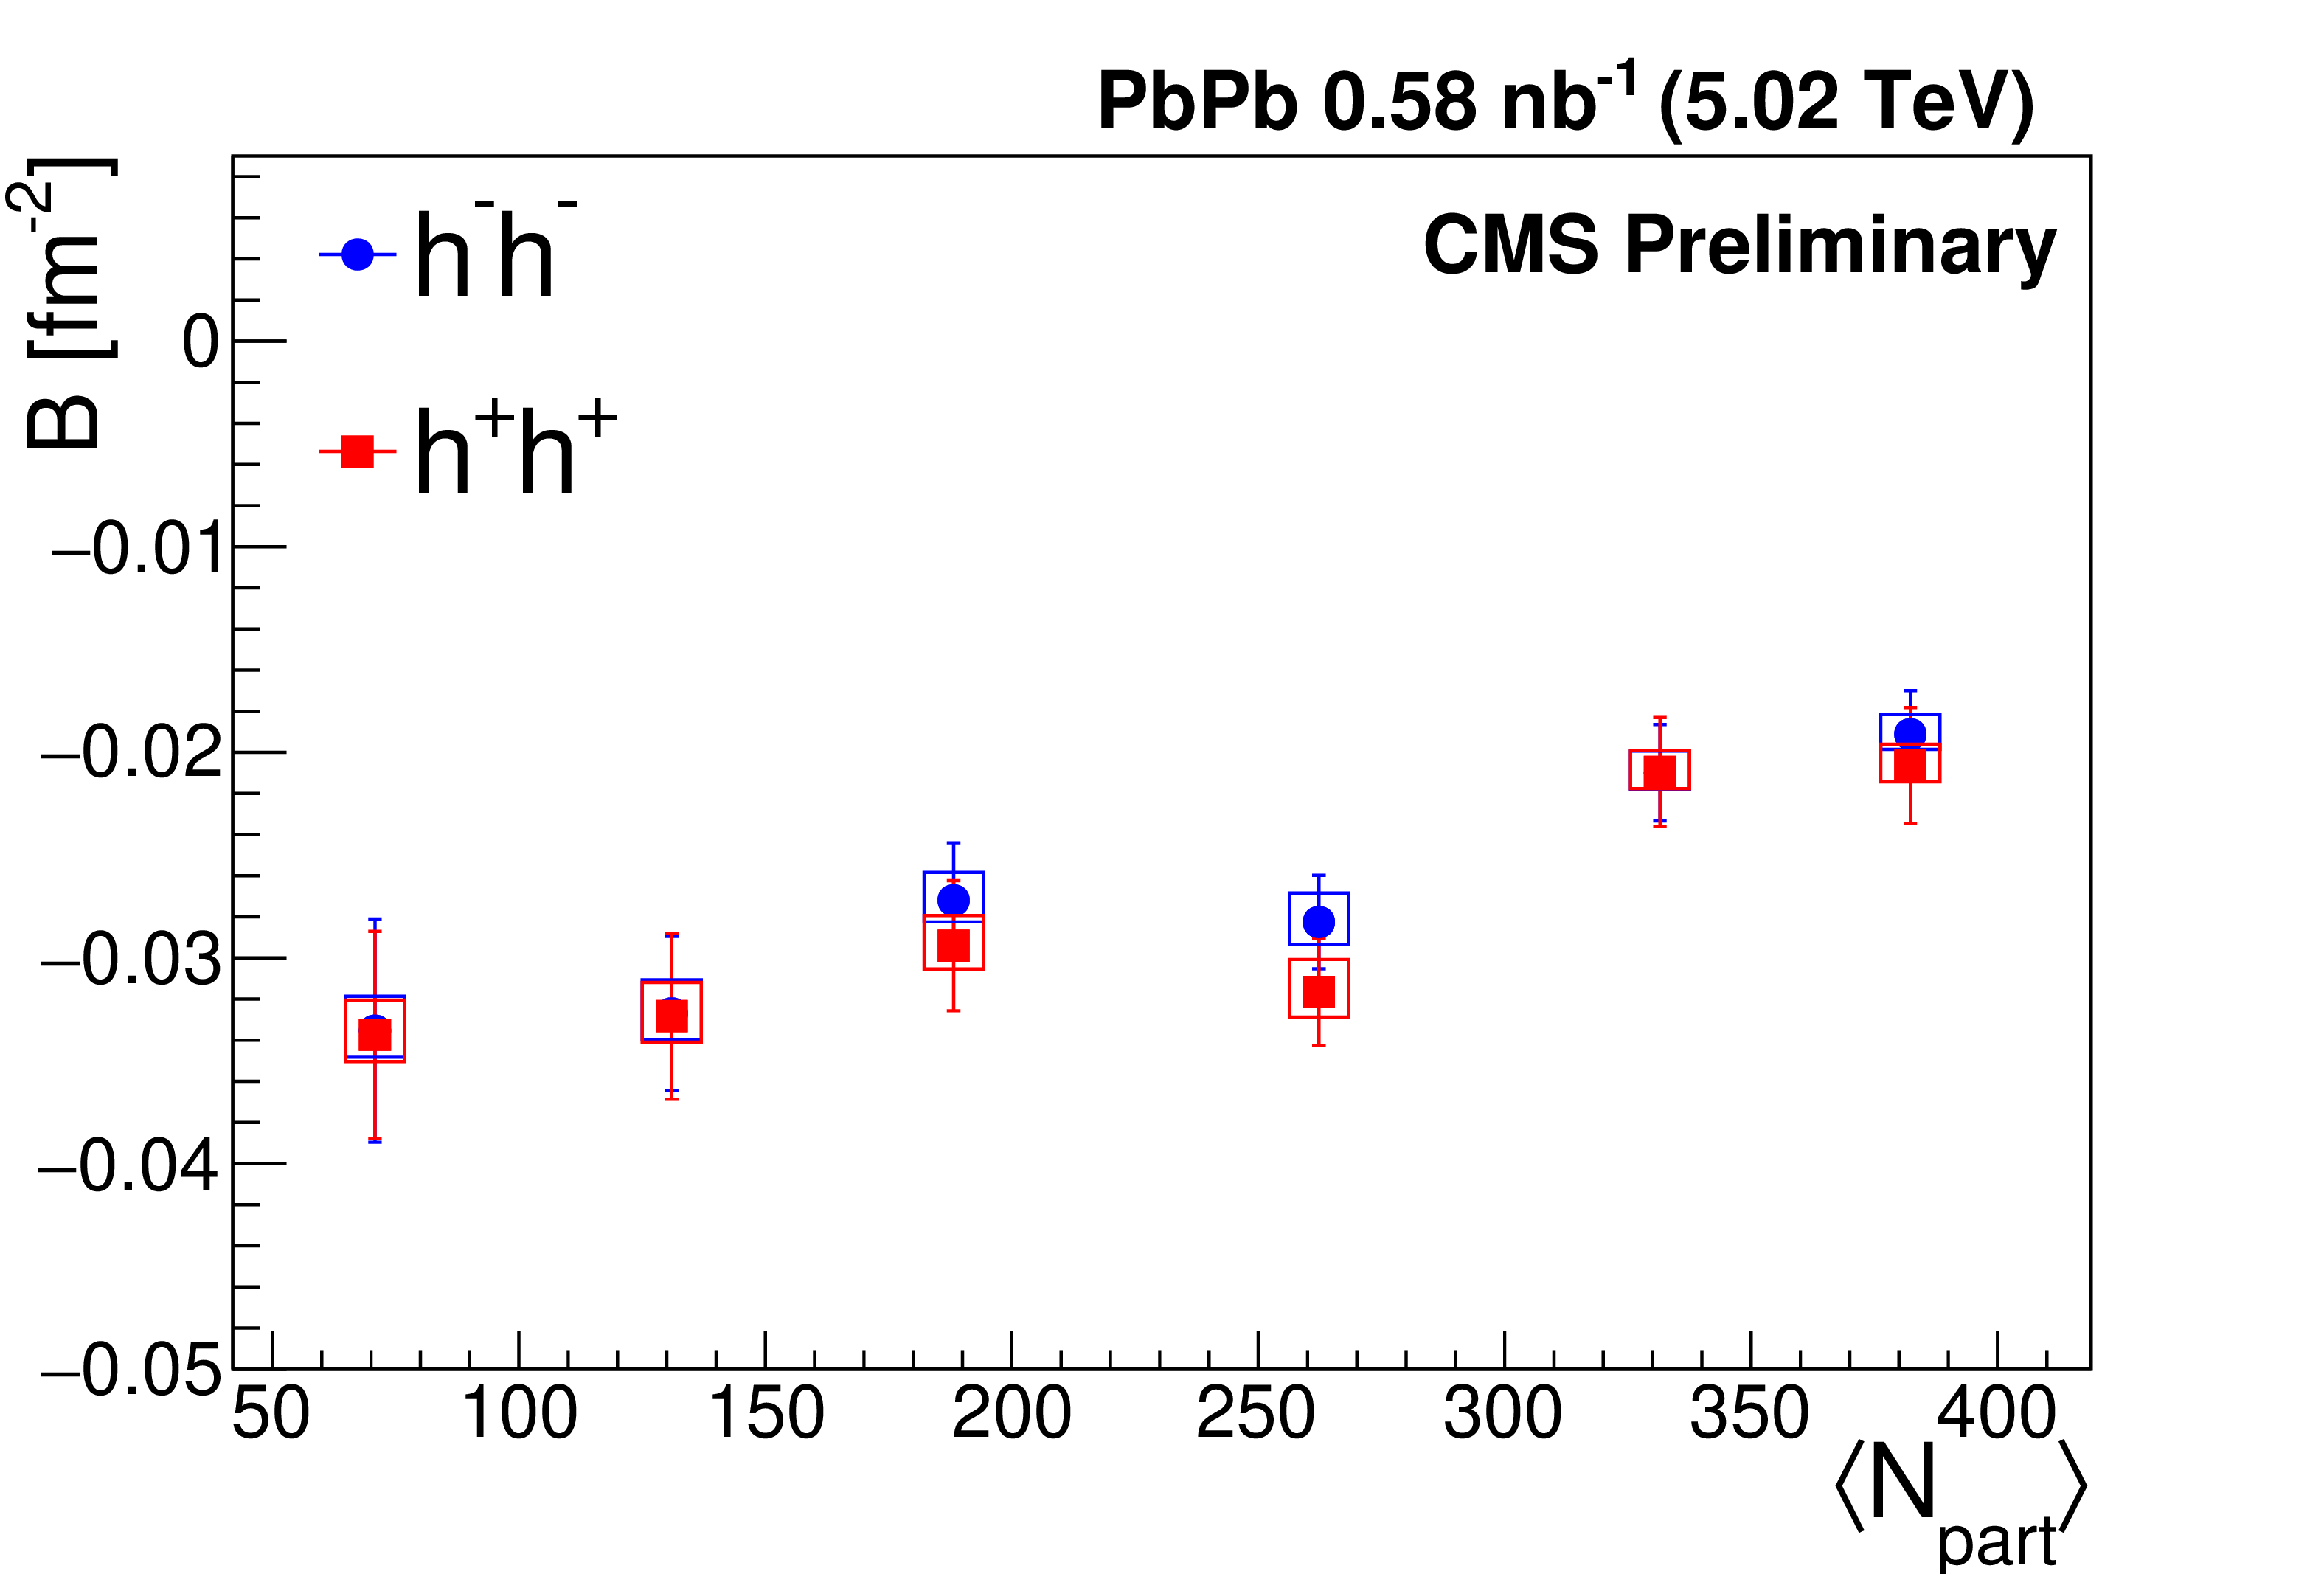
Figure 4:
The two fit parameters from the linear fit: the slope $A$ (left) and the intercept $B$ (right) versus $\langle N_{\text {part}}\rangle$ for negative and positive hadron pairs. The error bars are the statistical uncertainties, while the boxes indicate the systematic uncertainties which originate from the correlated systematic uncertainty of $R$. |
png pdf |
Figure 4-a:
The two fit parameters from the linear fit: the slope $A$ (left) and the intercept $B$ (right) versus $\langle N_{\text {part}}\rangle$ for negative and positive hadron pairs. The error bars are the statistical uncertainties, while the boxes indicate the systematic uncertainties which originate from the correlated systematic uncertainty of $R$. |
png pdf |
Figure 4-b:
The two fit parameters from the linear fit: the slope $A$ (left) and the intercept $B$ (right) versus $\langle N_{\text {part}}\rangle$ for negative and positive hadron pairs. The error bars are the statistical uncertainties, while the boxes indicate the systematic uncertainties which originate from the correlated systematic uncertainty of $R$. |
png pdf |
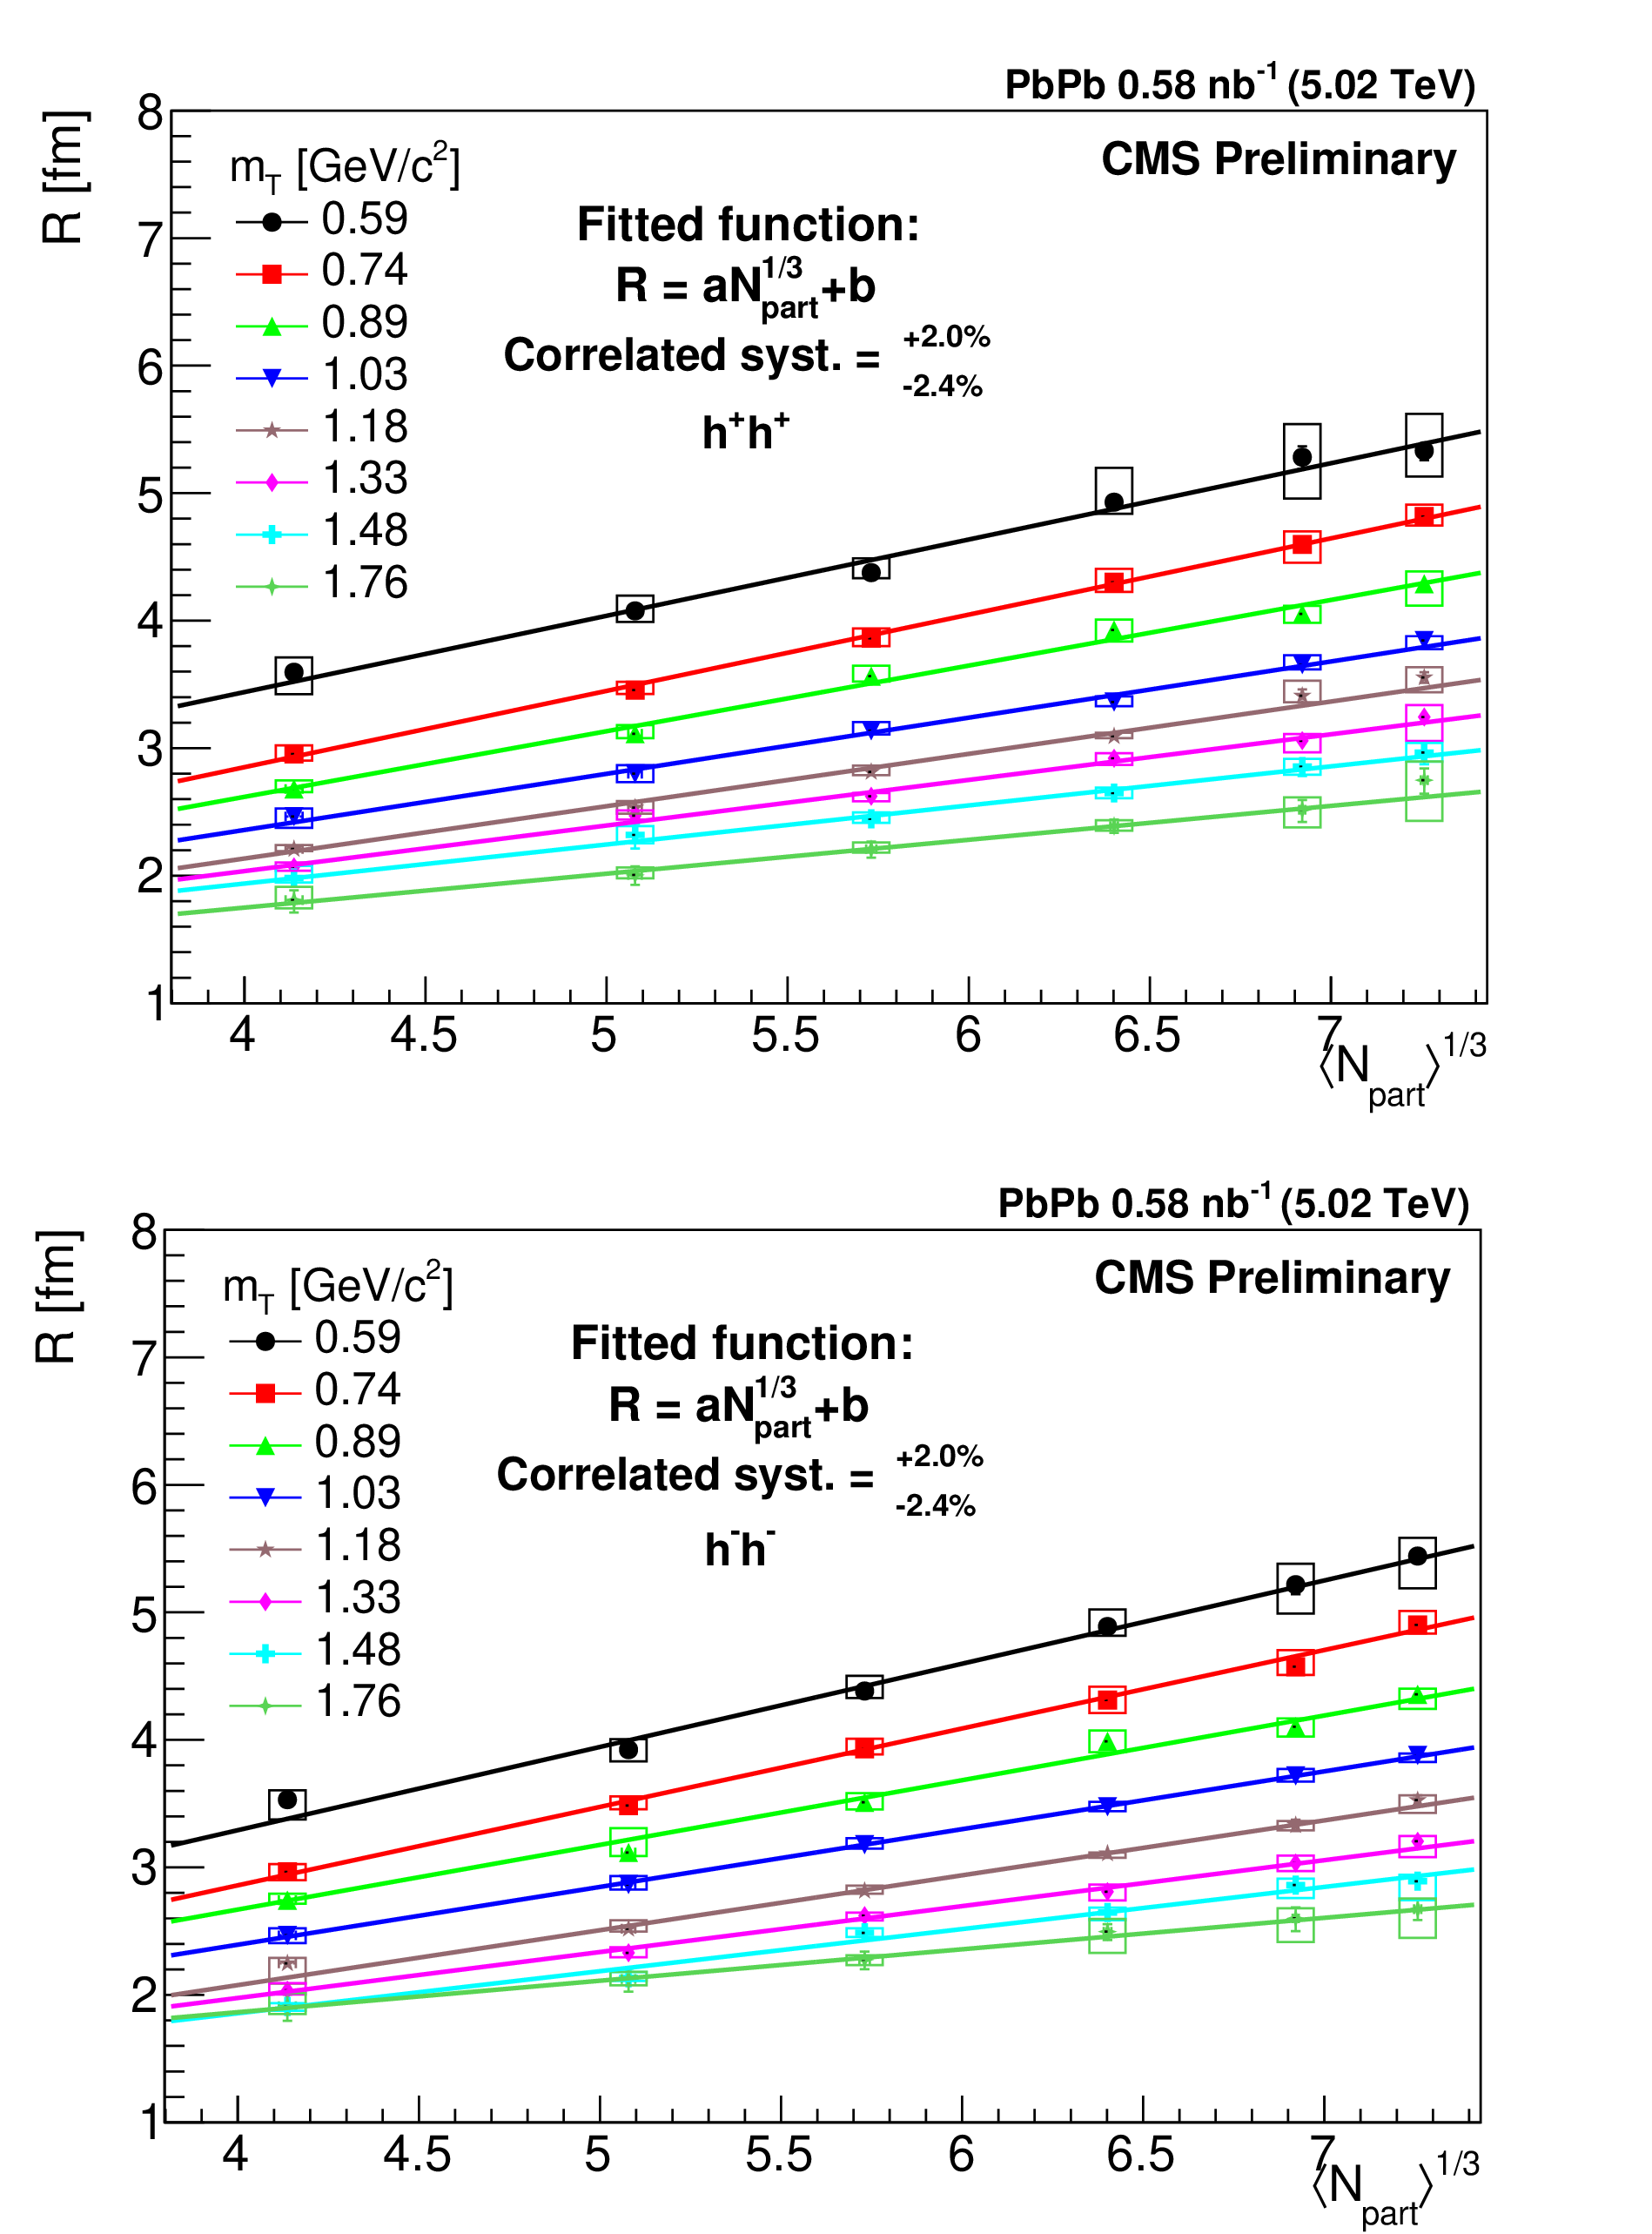
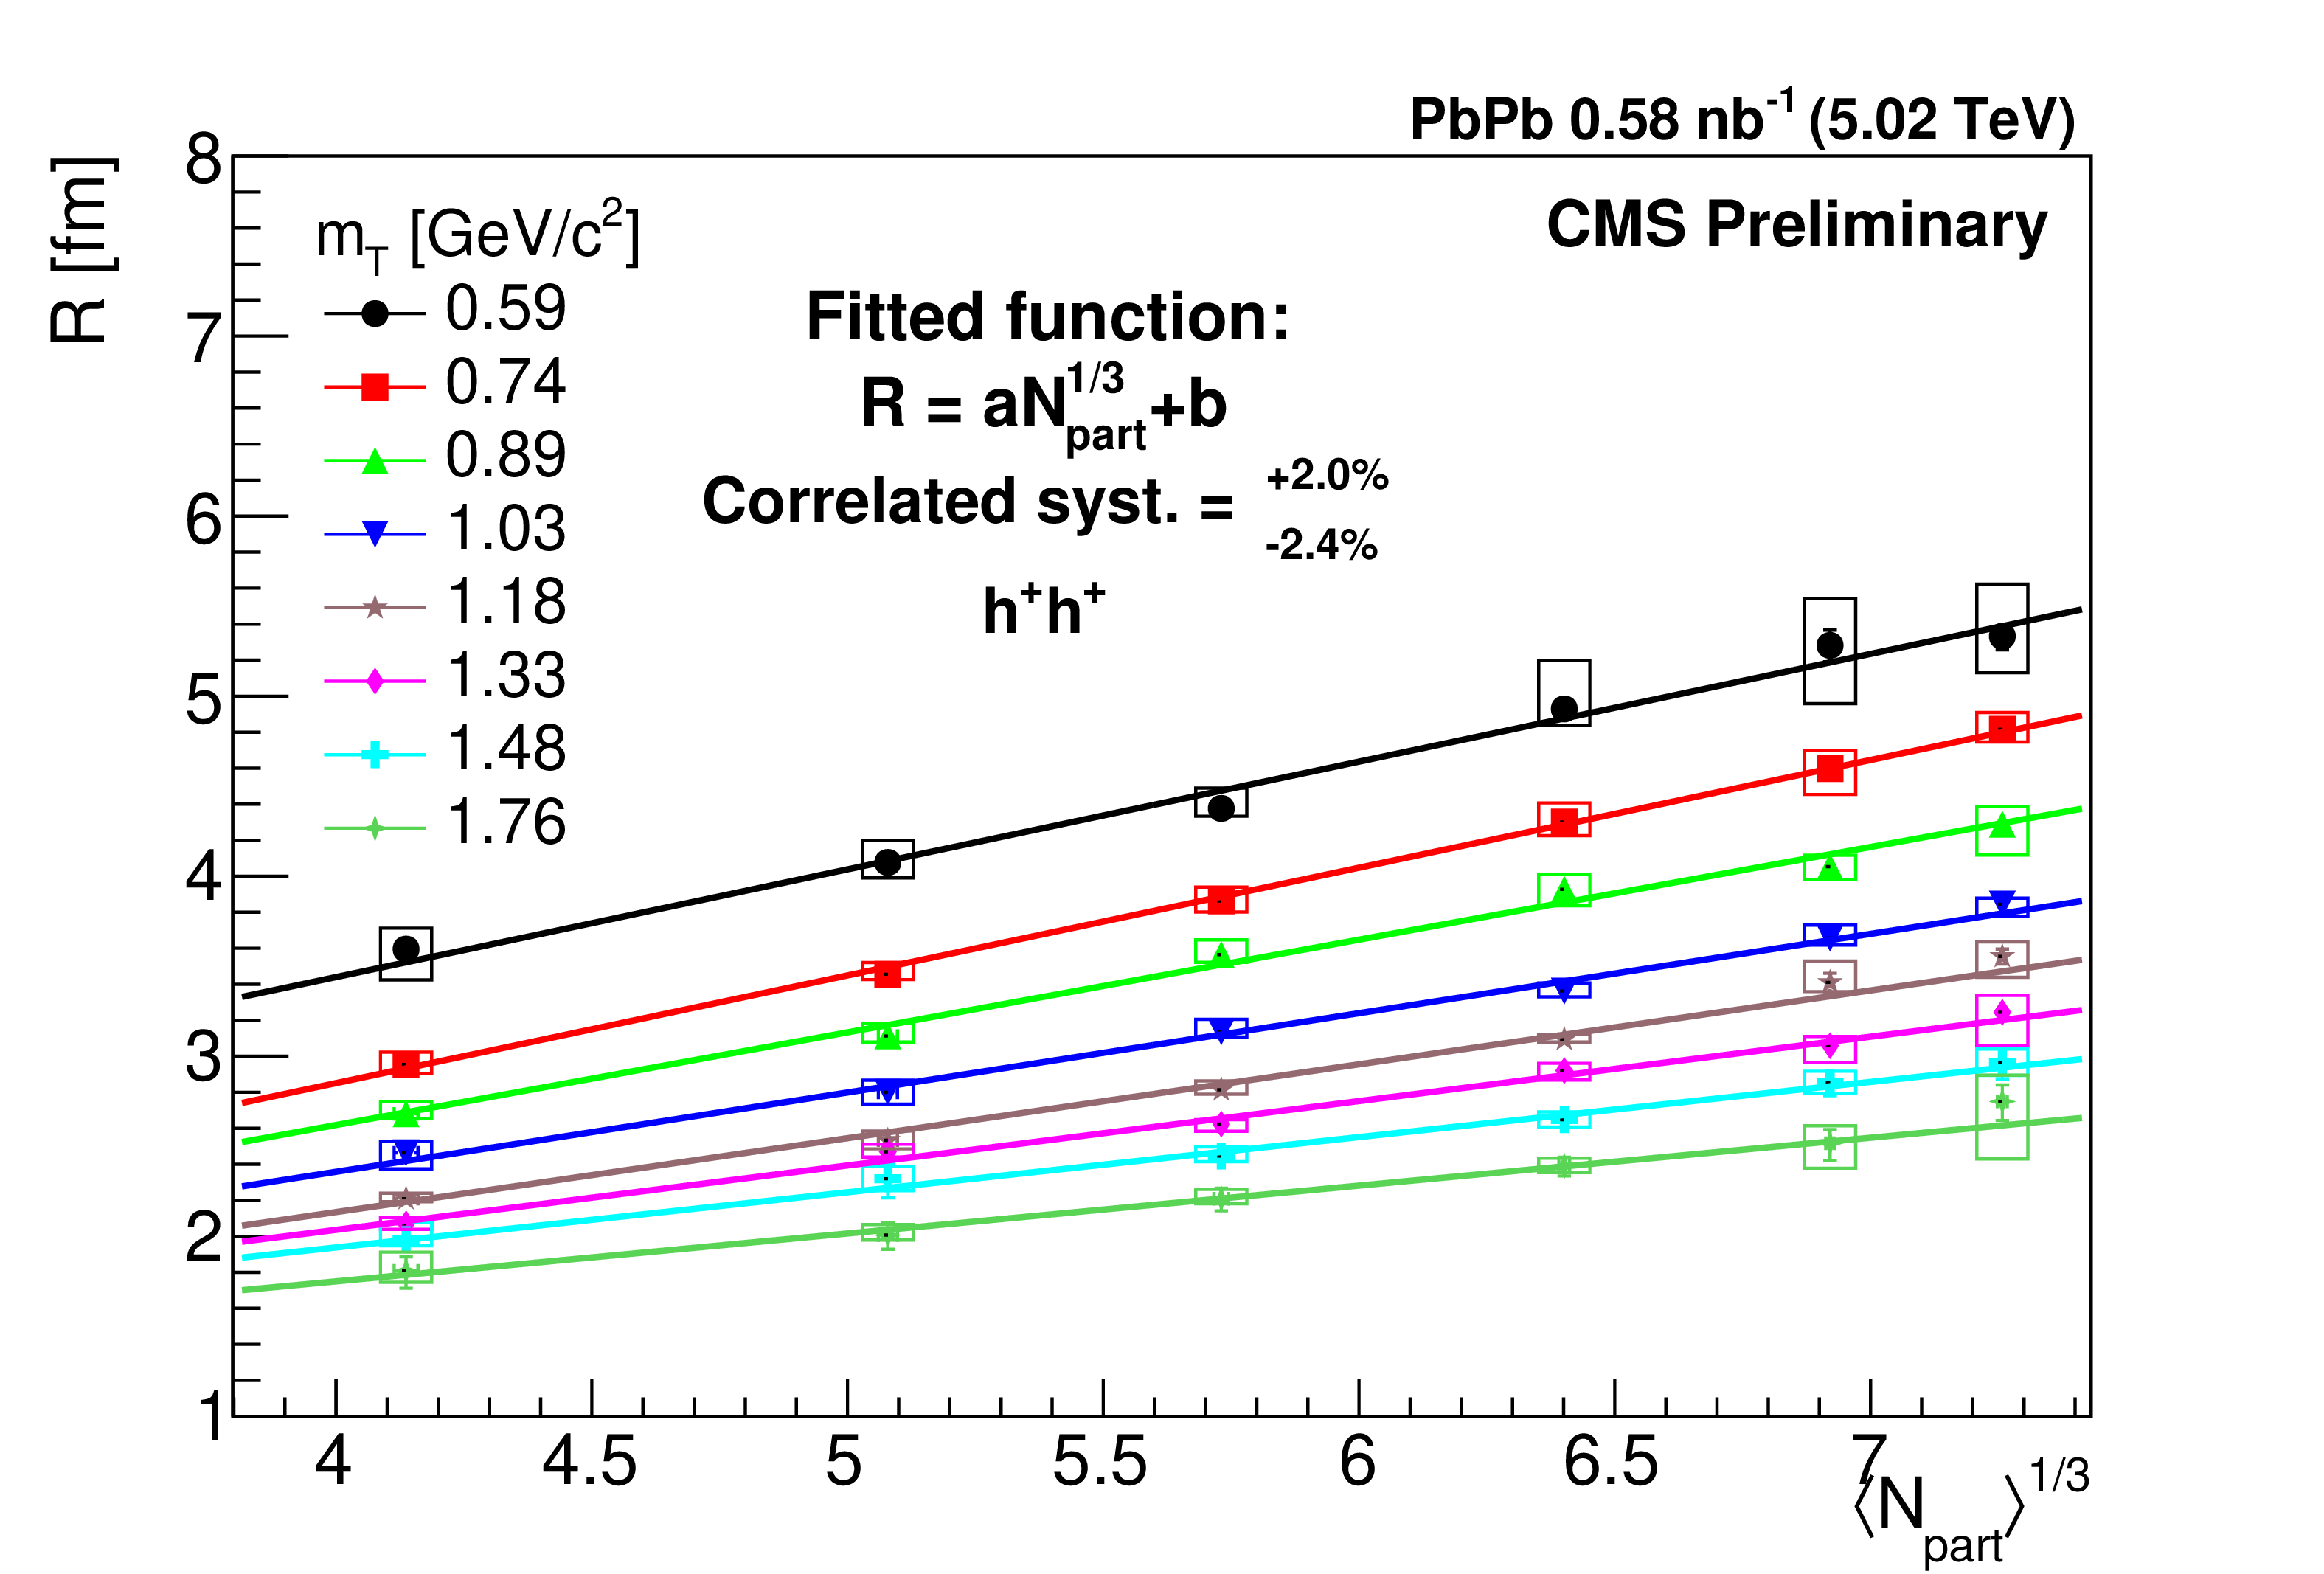
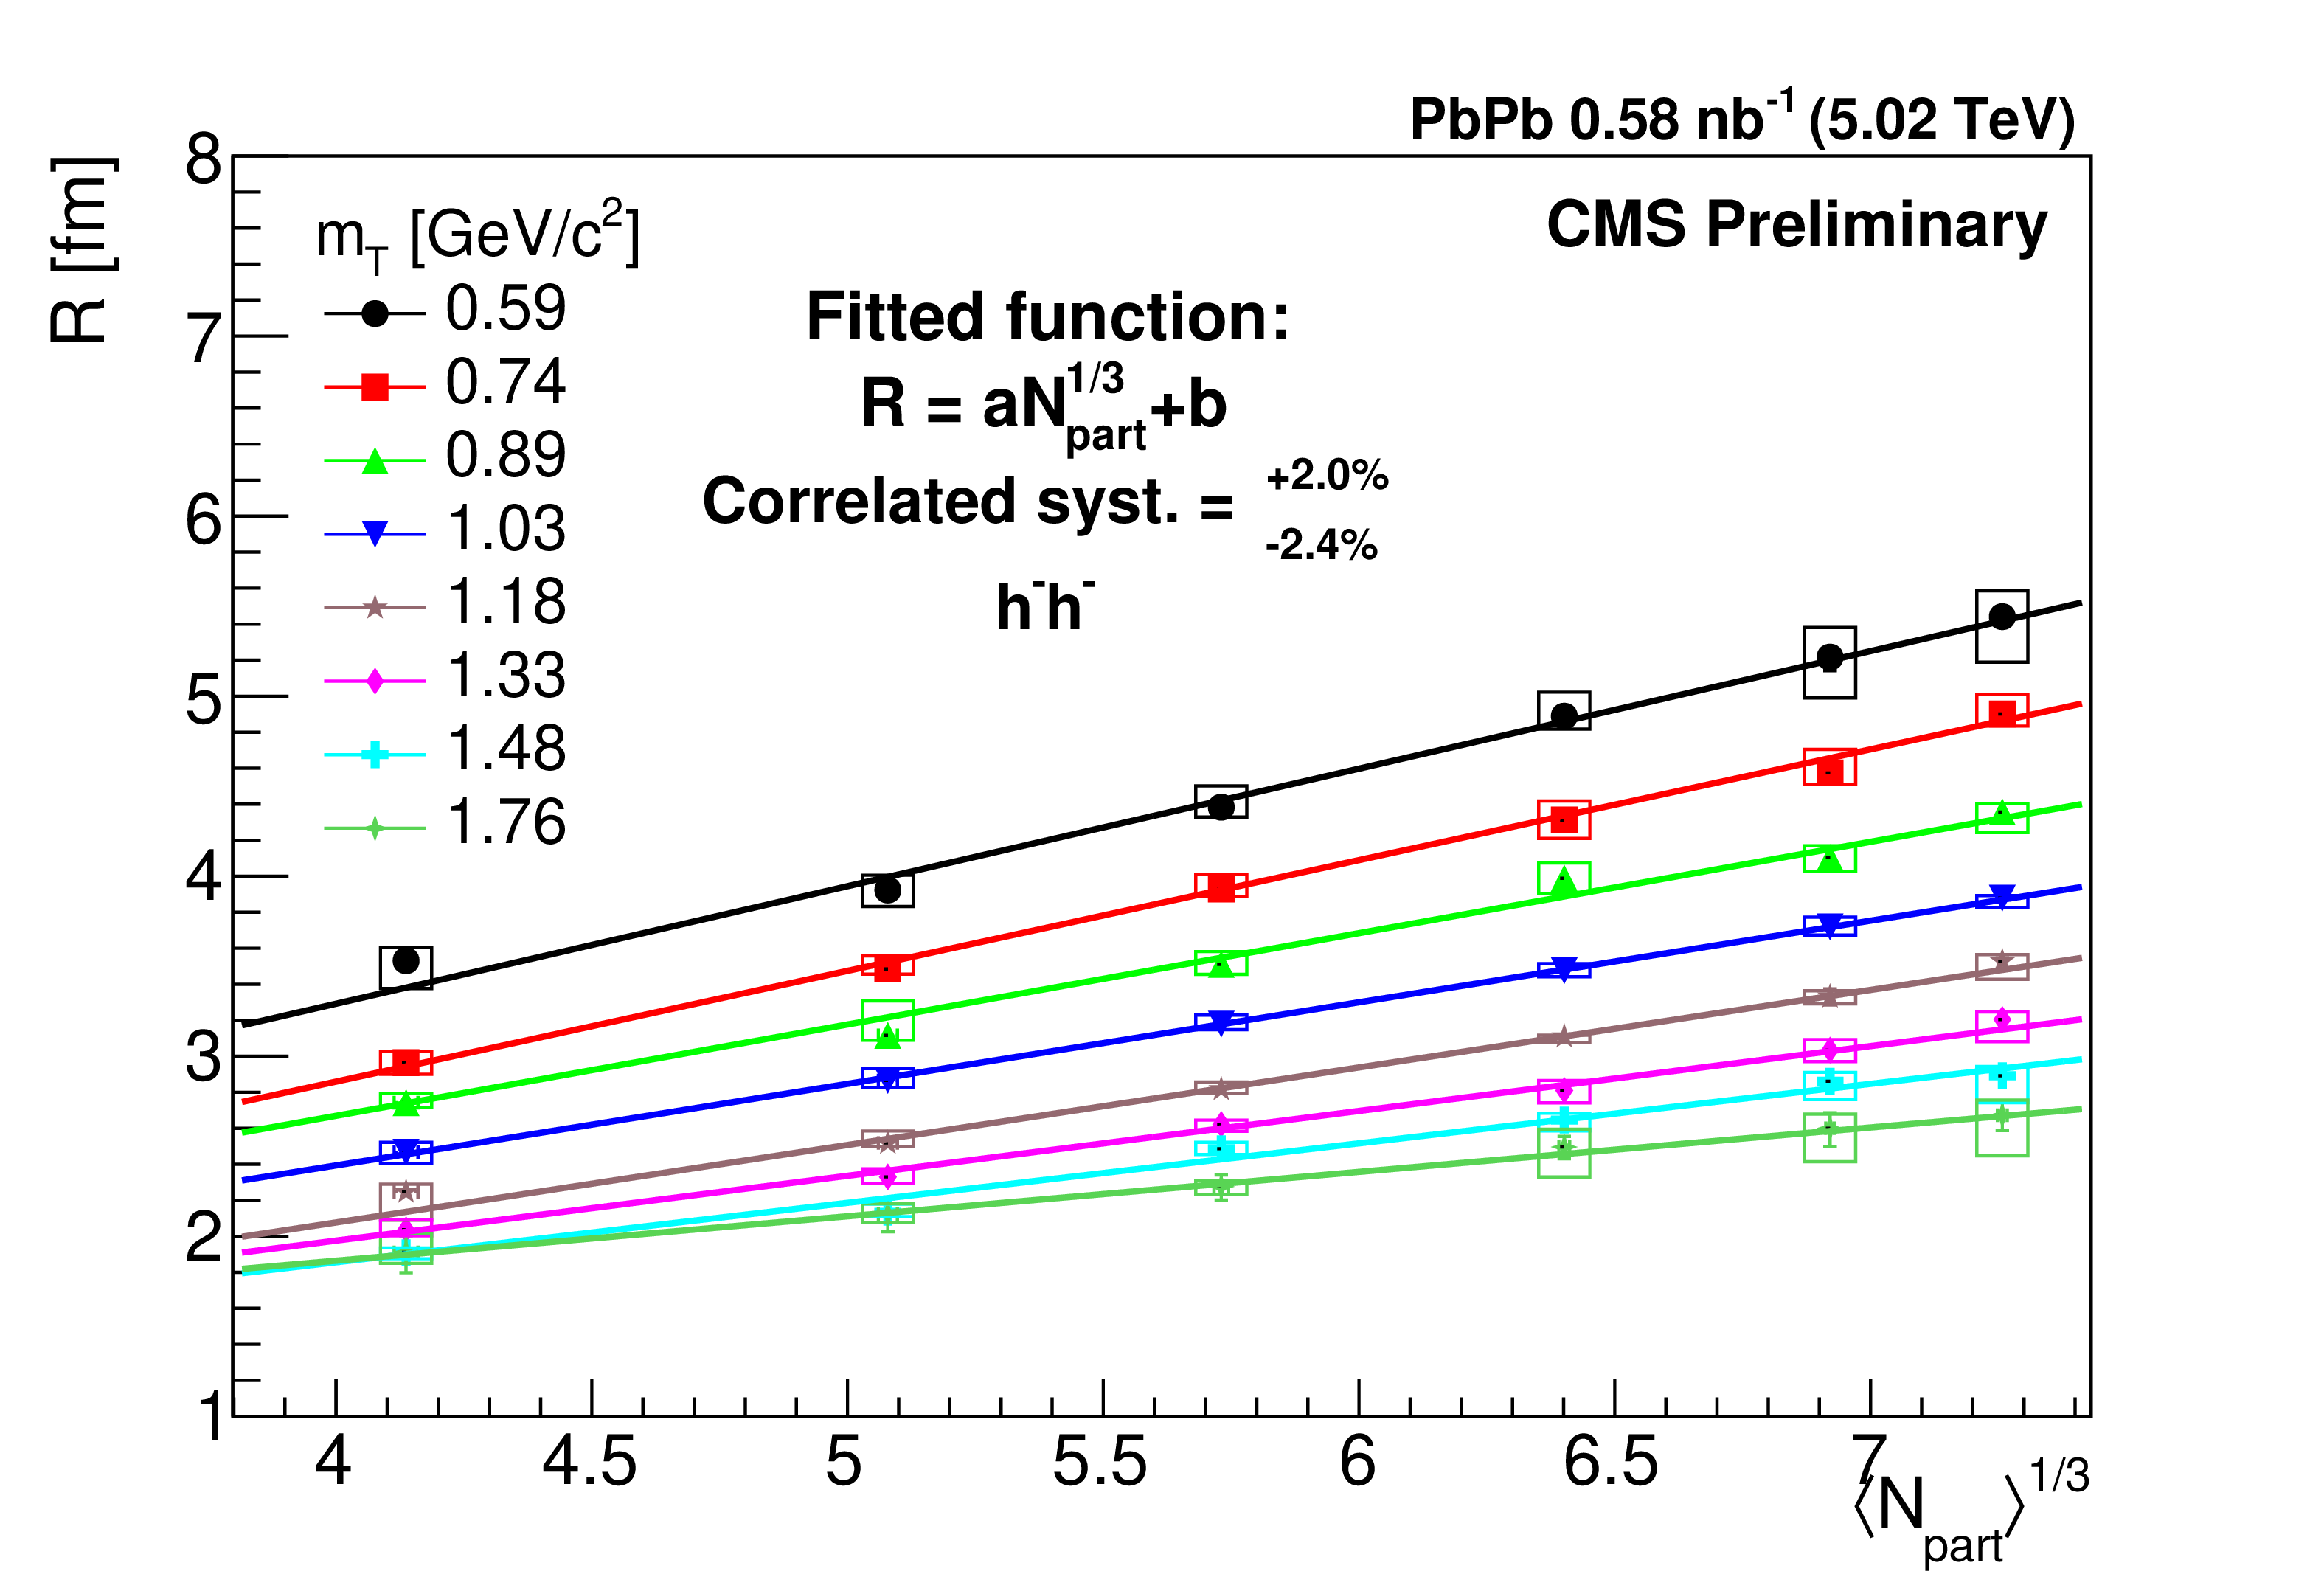
Figure 5:
The Lévy scale parameter $R$ versus $\langle N_{\text {part}}\rangle^{1/3}$ in different $m_{\mathrm {T}}$ classes for positive (top) and negative (bottom) hadron pairs. The error bars are the statistical uncertainties, while the boxes indicate the point-to-point systematic uncertainties. The correlated systematic uncertainty is also indicated. We fitted a line to the data for each $m_{\mathrm {T}}$ class. The fit results are in Table 6. |
png pdf |
Figure 5-a:
The Lévy scale parameter $R$ versus $\langle N_{\text {part}}\rangle^{1/3}$ in different $m_{\mathrm {T}}$ classes for positive (top) and negative (bottom) hadron pairs. The error bars are the statistical uncertainties, while the boxes indicate the point-to-point systematic uncertainties. The correlated systematic uncertainty is also indicated. We fitted a line to the data for each $m_{\mathrm {T}}$ class. The fit results are in Table 6. |
png pdf |
Figure 5-b:
The Lévy scale parameter $R$ versus $\langle N_{\text {part}}\rangle^{1/3}$ in different $m_{\mathrm {T}}$ classes for positive (top) and negative (bottom) hadron pairs. The error bars are the statistical uncertainties, while the boxes indicate the point-to-point systematic uncertainties. The correlated systematic uncertainty is also indicated. We fitted a line to the data for each $m_{\mathrm {T}}$ class. The fit results are in Table 6. |
png pdf |
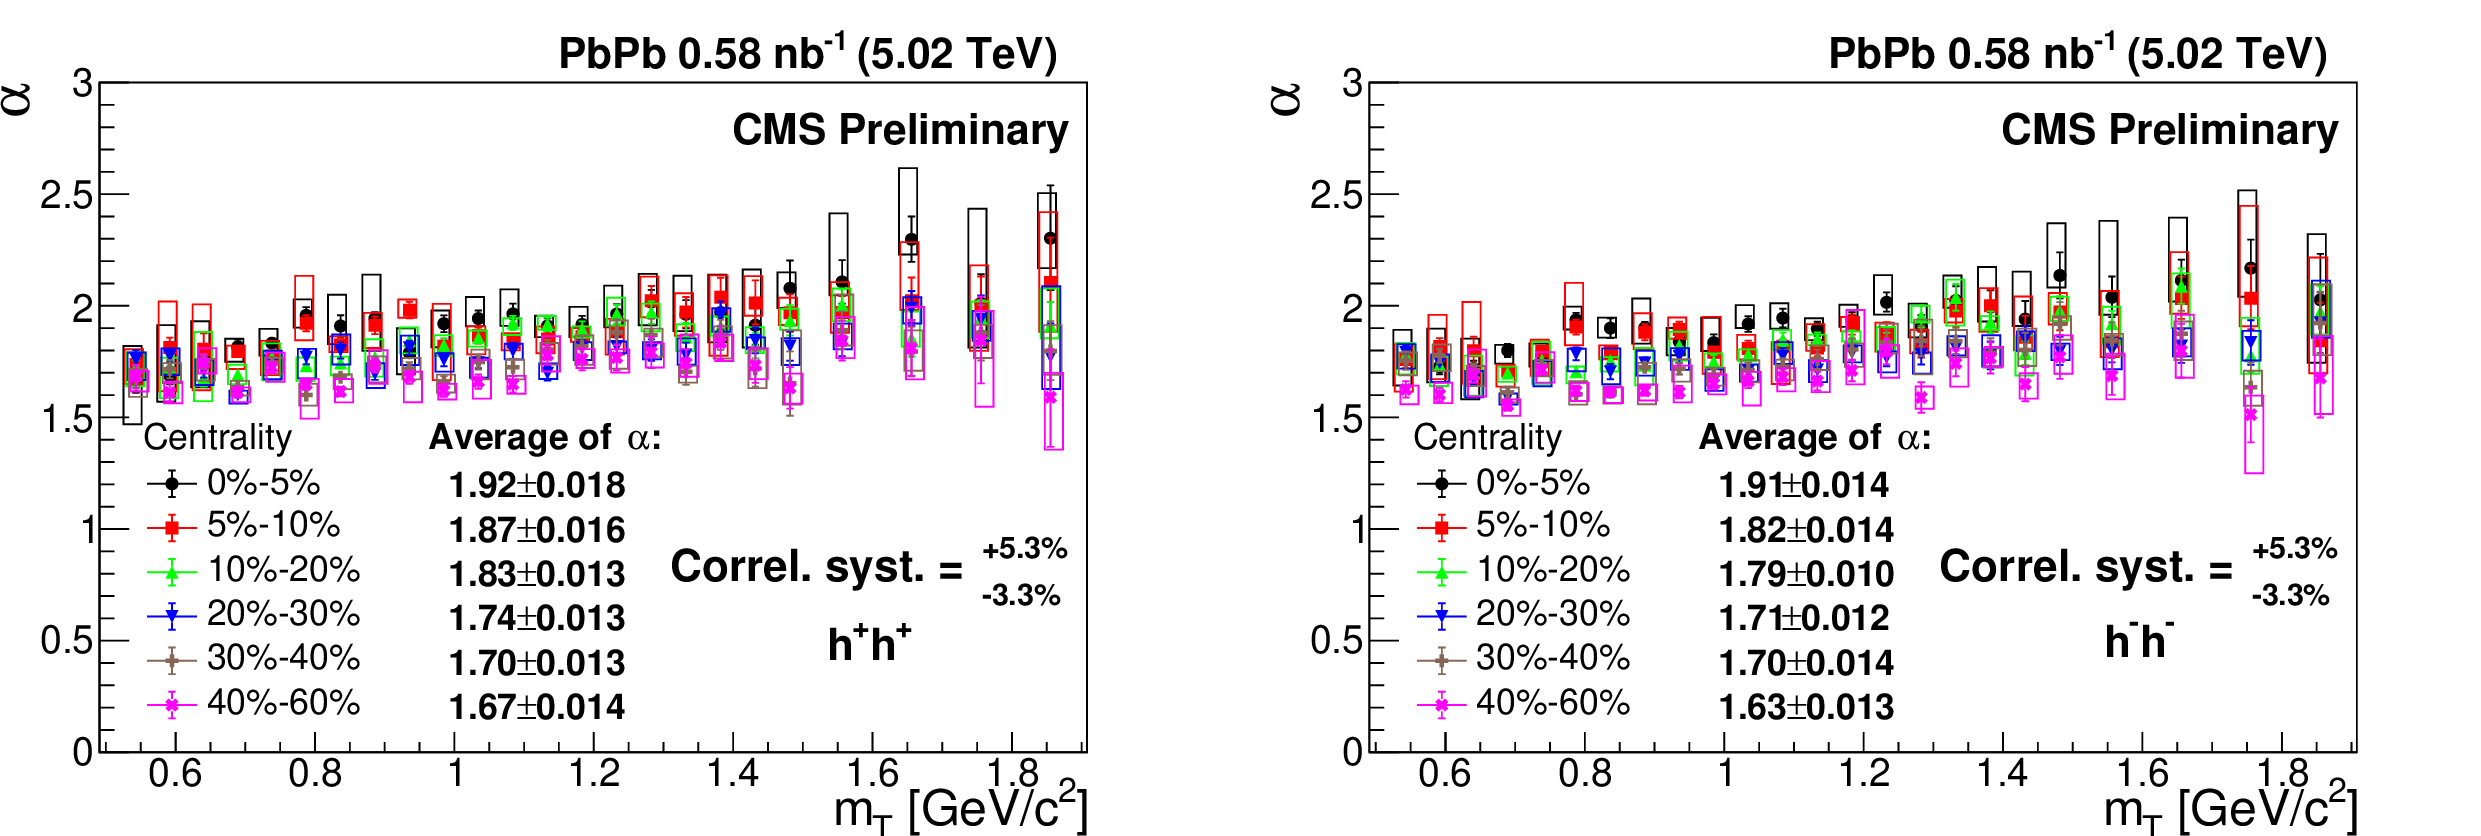
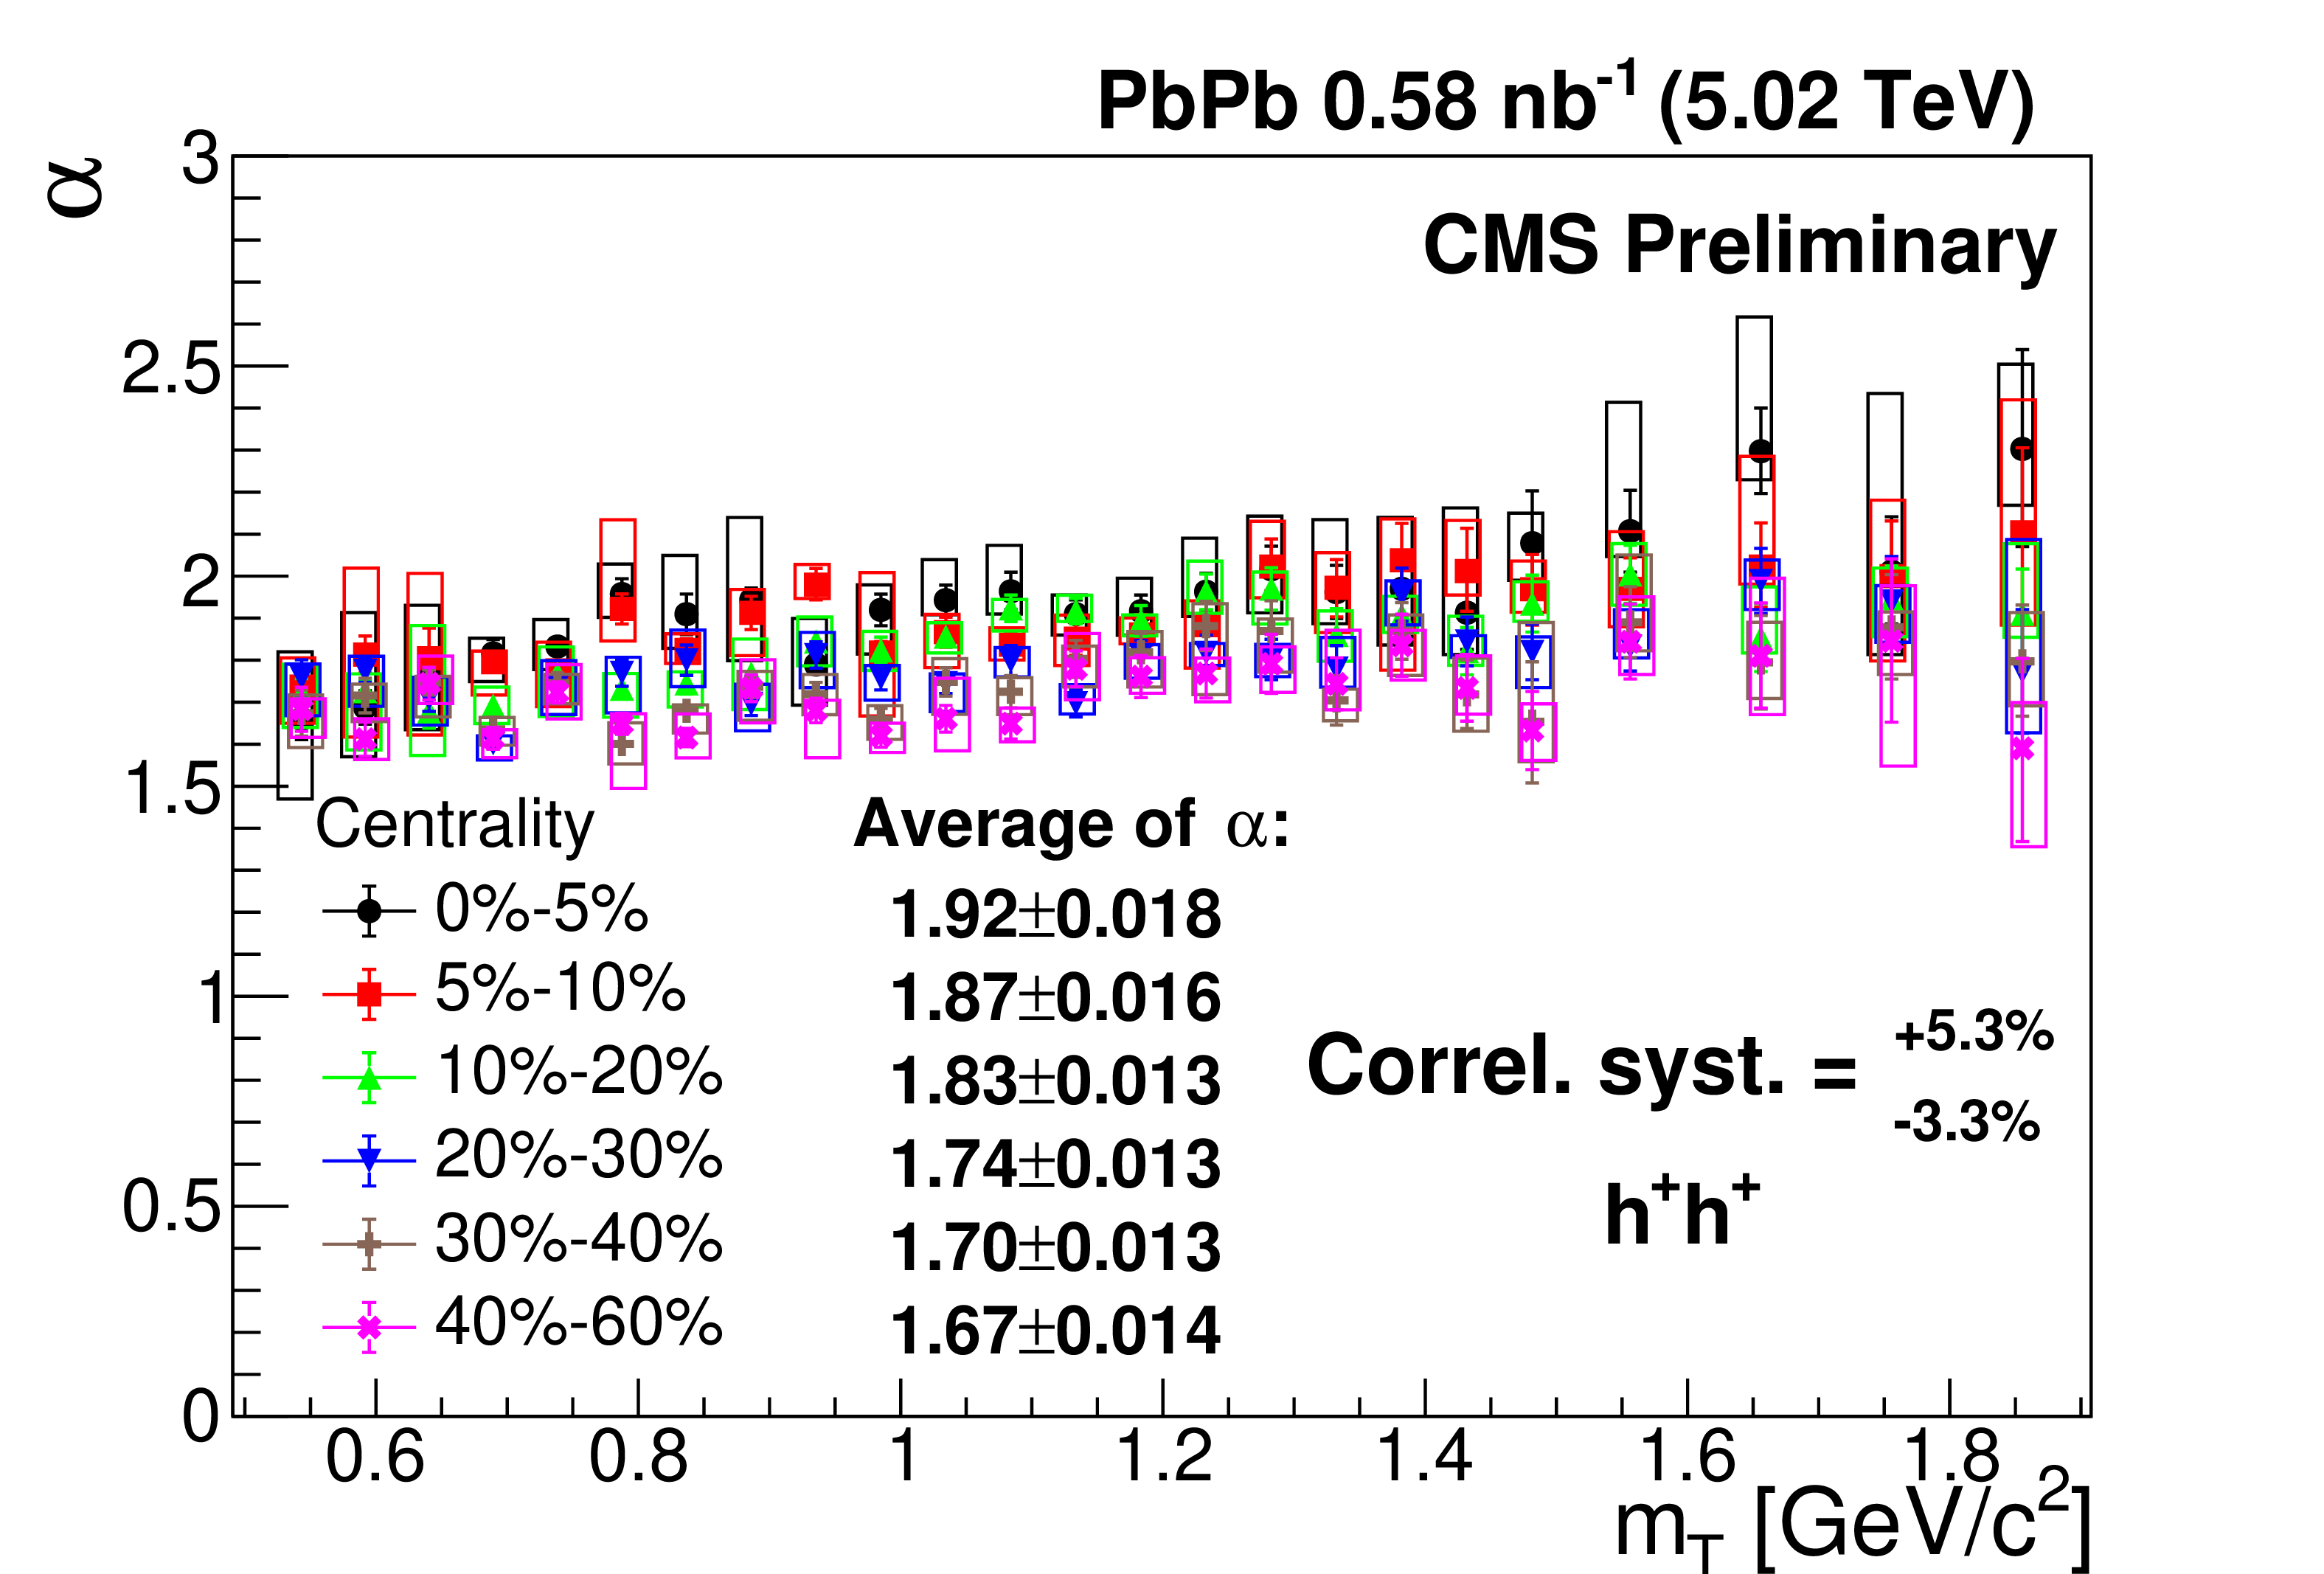
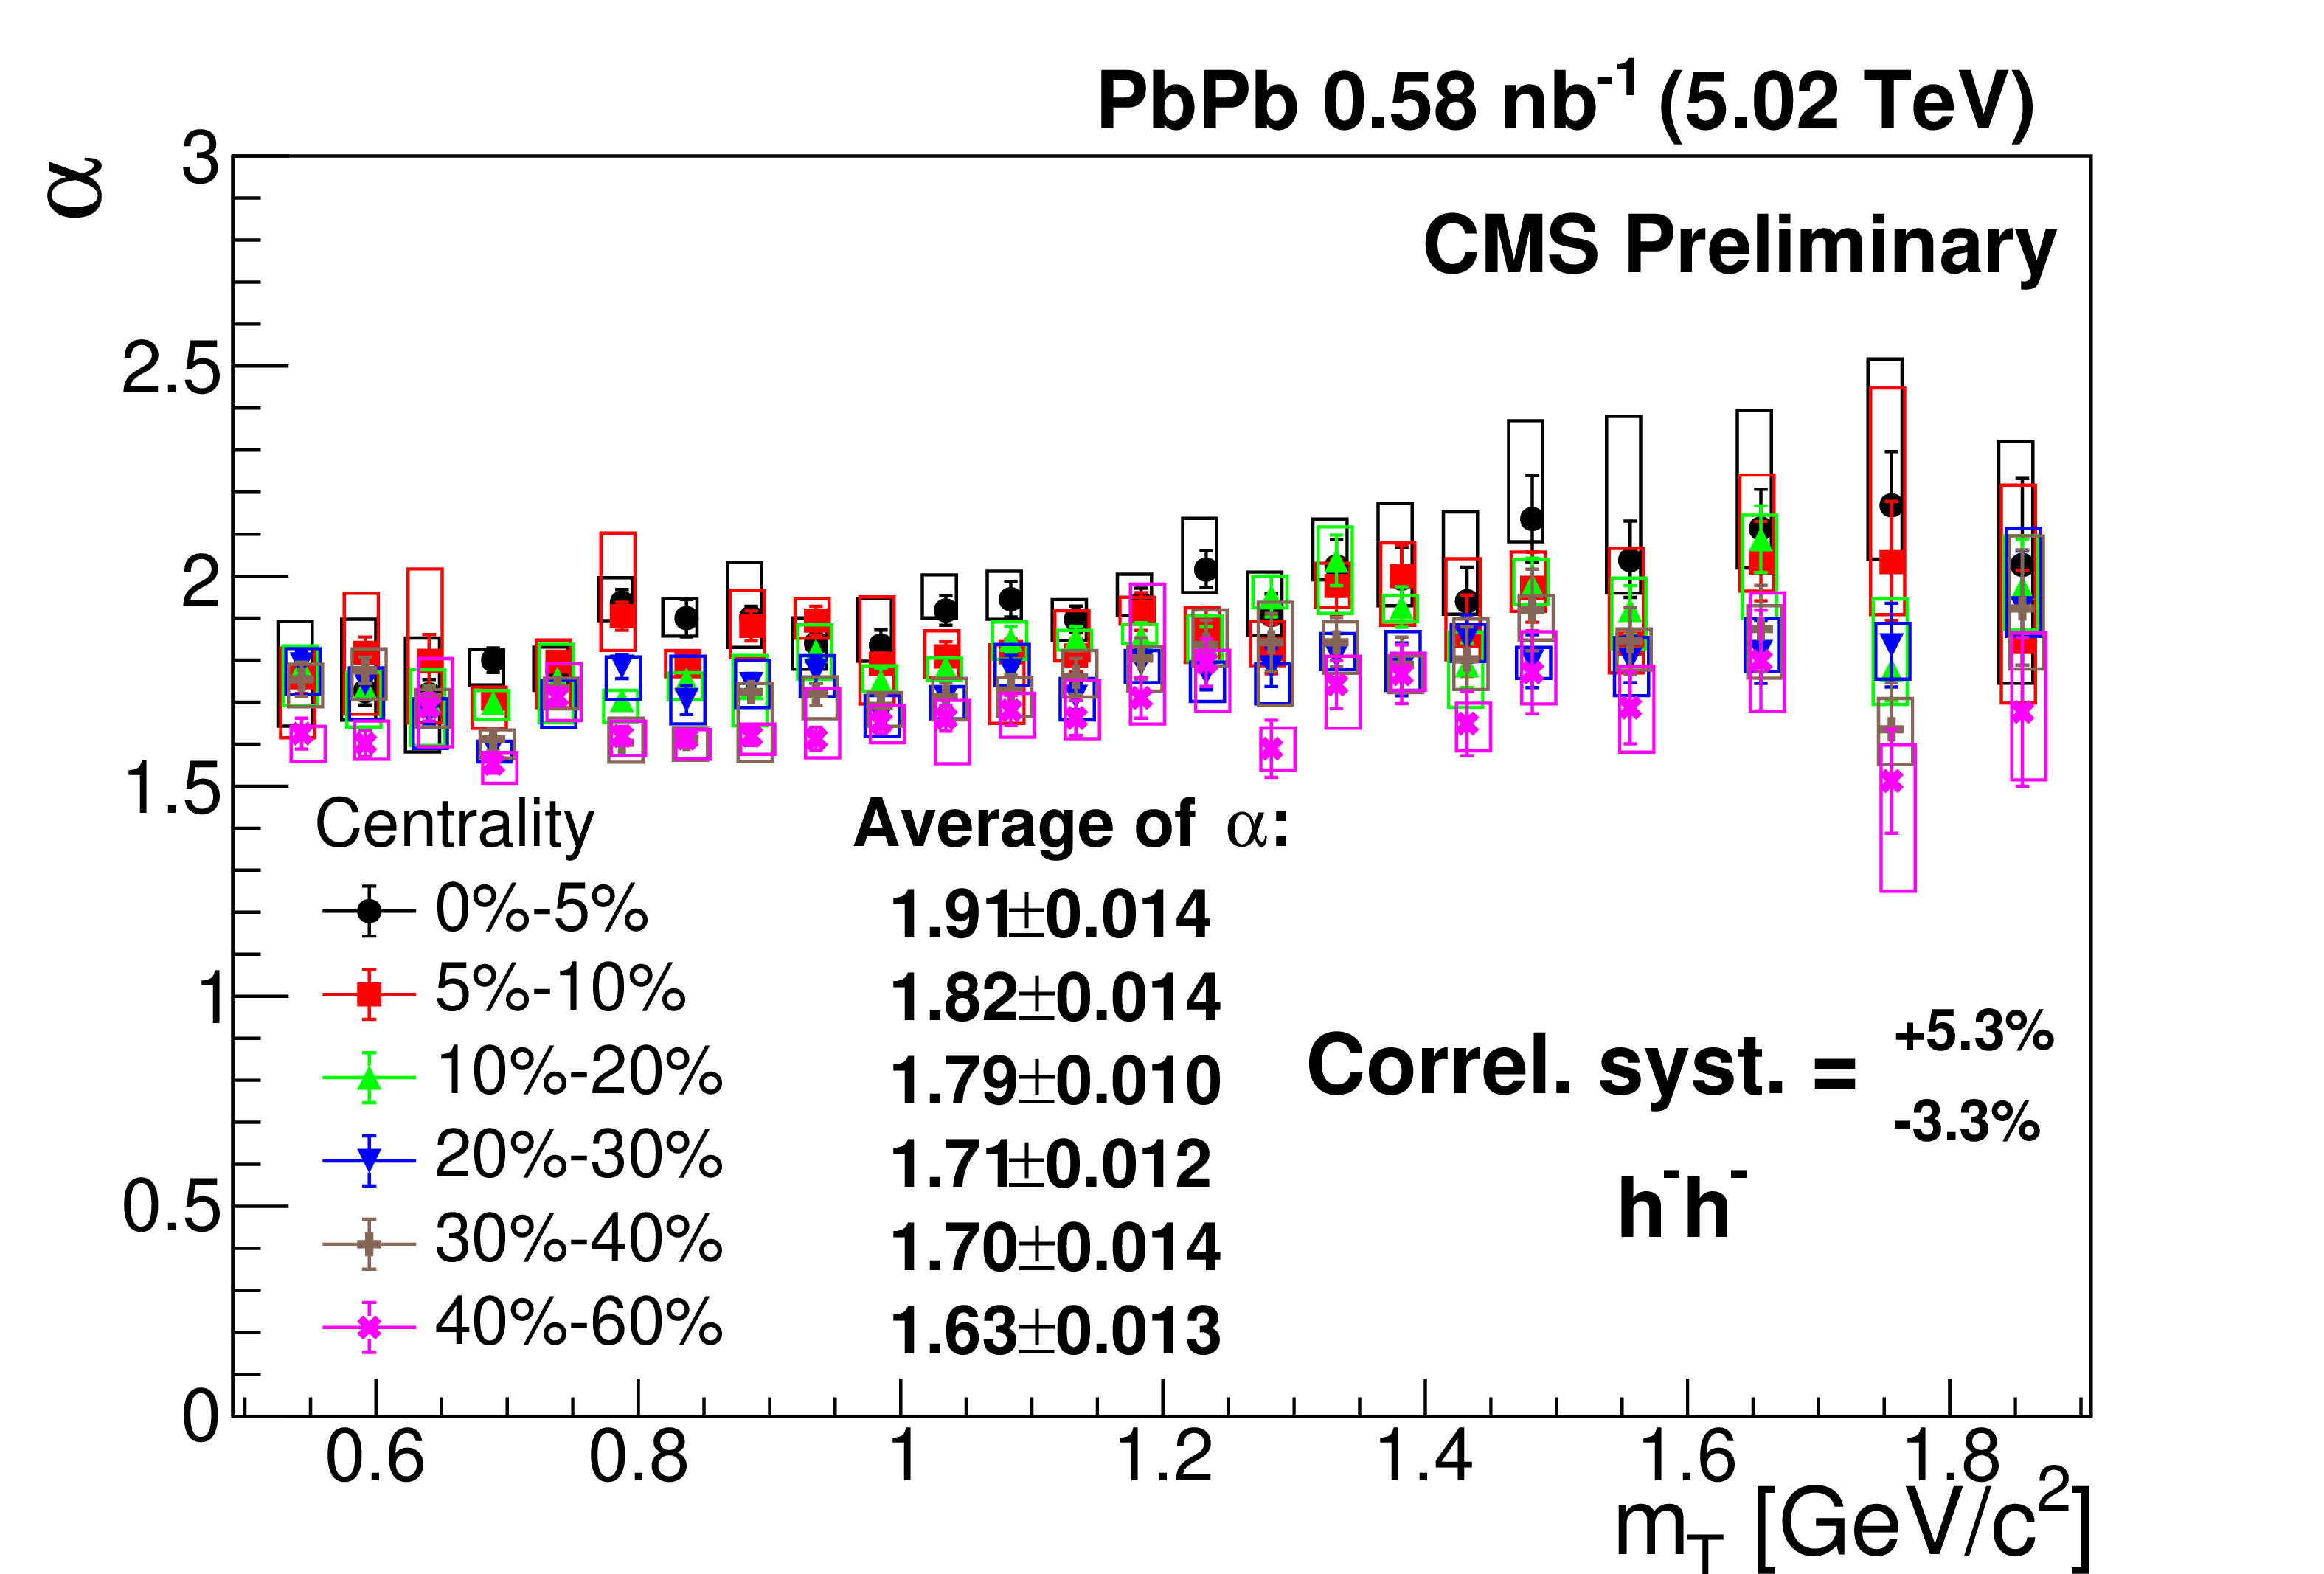
Figure 6:
The Lévy stability index $\alpha $ versus the transverse mass $m_{\mathrm {T}}$ in different centrality classes for positive (left) and negative (right) hadron pairs. The error bars are the statistical uncertainties, while the boxes indicate the point-to-point systematic uncertainties. The correlated systematic uncertainty is also indicated. |
png pdf |
Figure 6-a:
The Lévy stability index $\alpha $ versus the transverse mass $m_{\mathrm {T}}$ in different centrality classes for positive (left) and negative (right) hadron pairs. The error bars are the statistical uncertainties, while the boxes indicate the point-to-point systematic uncertainties. The correlated systematic uncertainty is also indicated. |
png pdf |
Figure 6-b:
The Lévy stability index $\alpha $ versus the transverse mass $m_{\mathrm {T}}$ in different centrality classes for positive (left) and negative (right) hadron pairs. The error bars are the statistical uncertainties, while the boxes indicate the point-to-point systematic uncertainties. The correlated systematic uncertainty is also indicated. |

png pdf |
Figure 7:
The average Lévy stability index $\langle \alpha \rangle$ versus $\langle N_{\text {part}}\rangle$ for both positive and negative hadron pairs. The error bars are the statistical uncertainties, while the boxes indicate the systematic uncertainties which originate from the correlated systematic uncertaity of $\alpha $. |

png pdf |
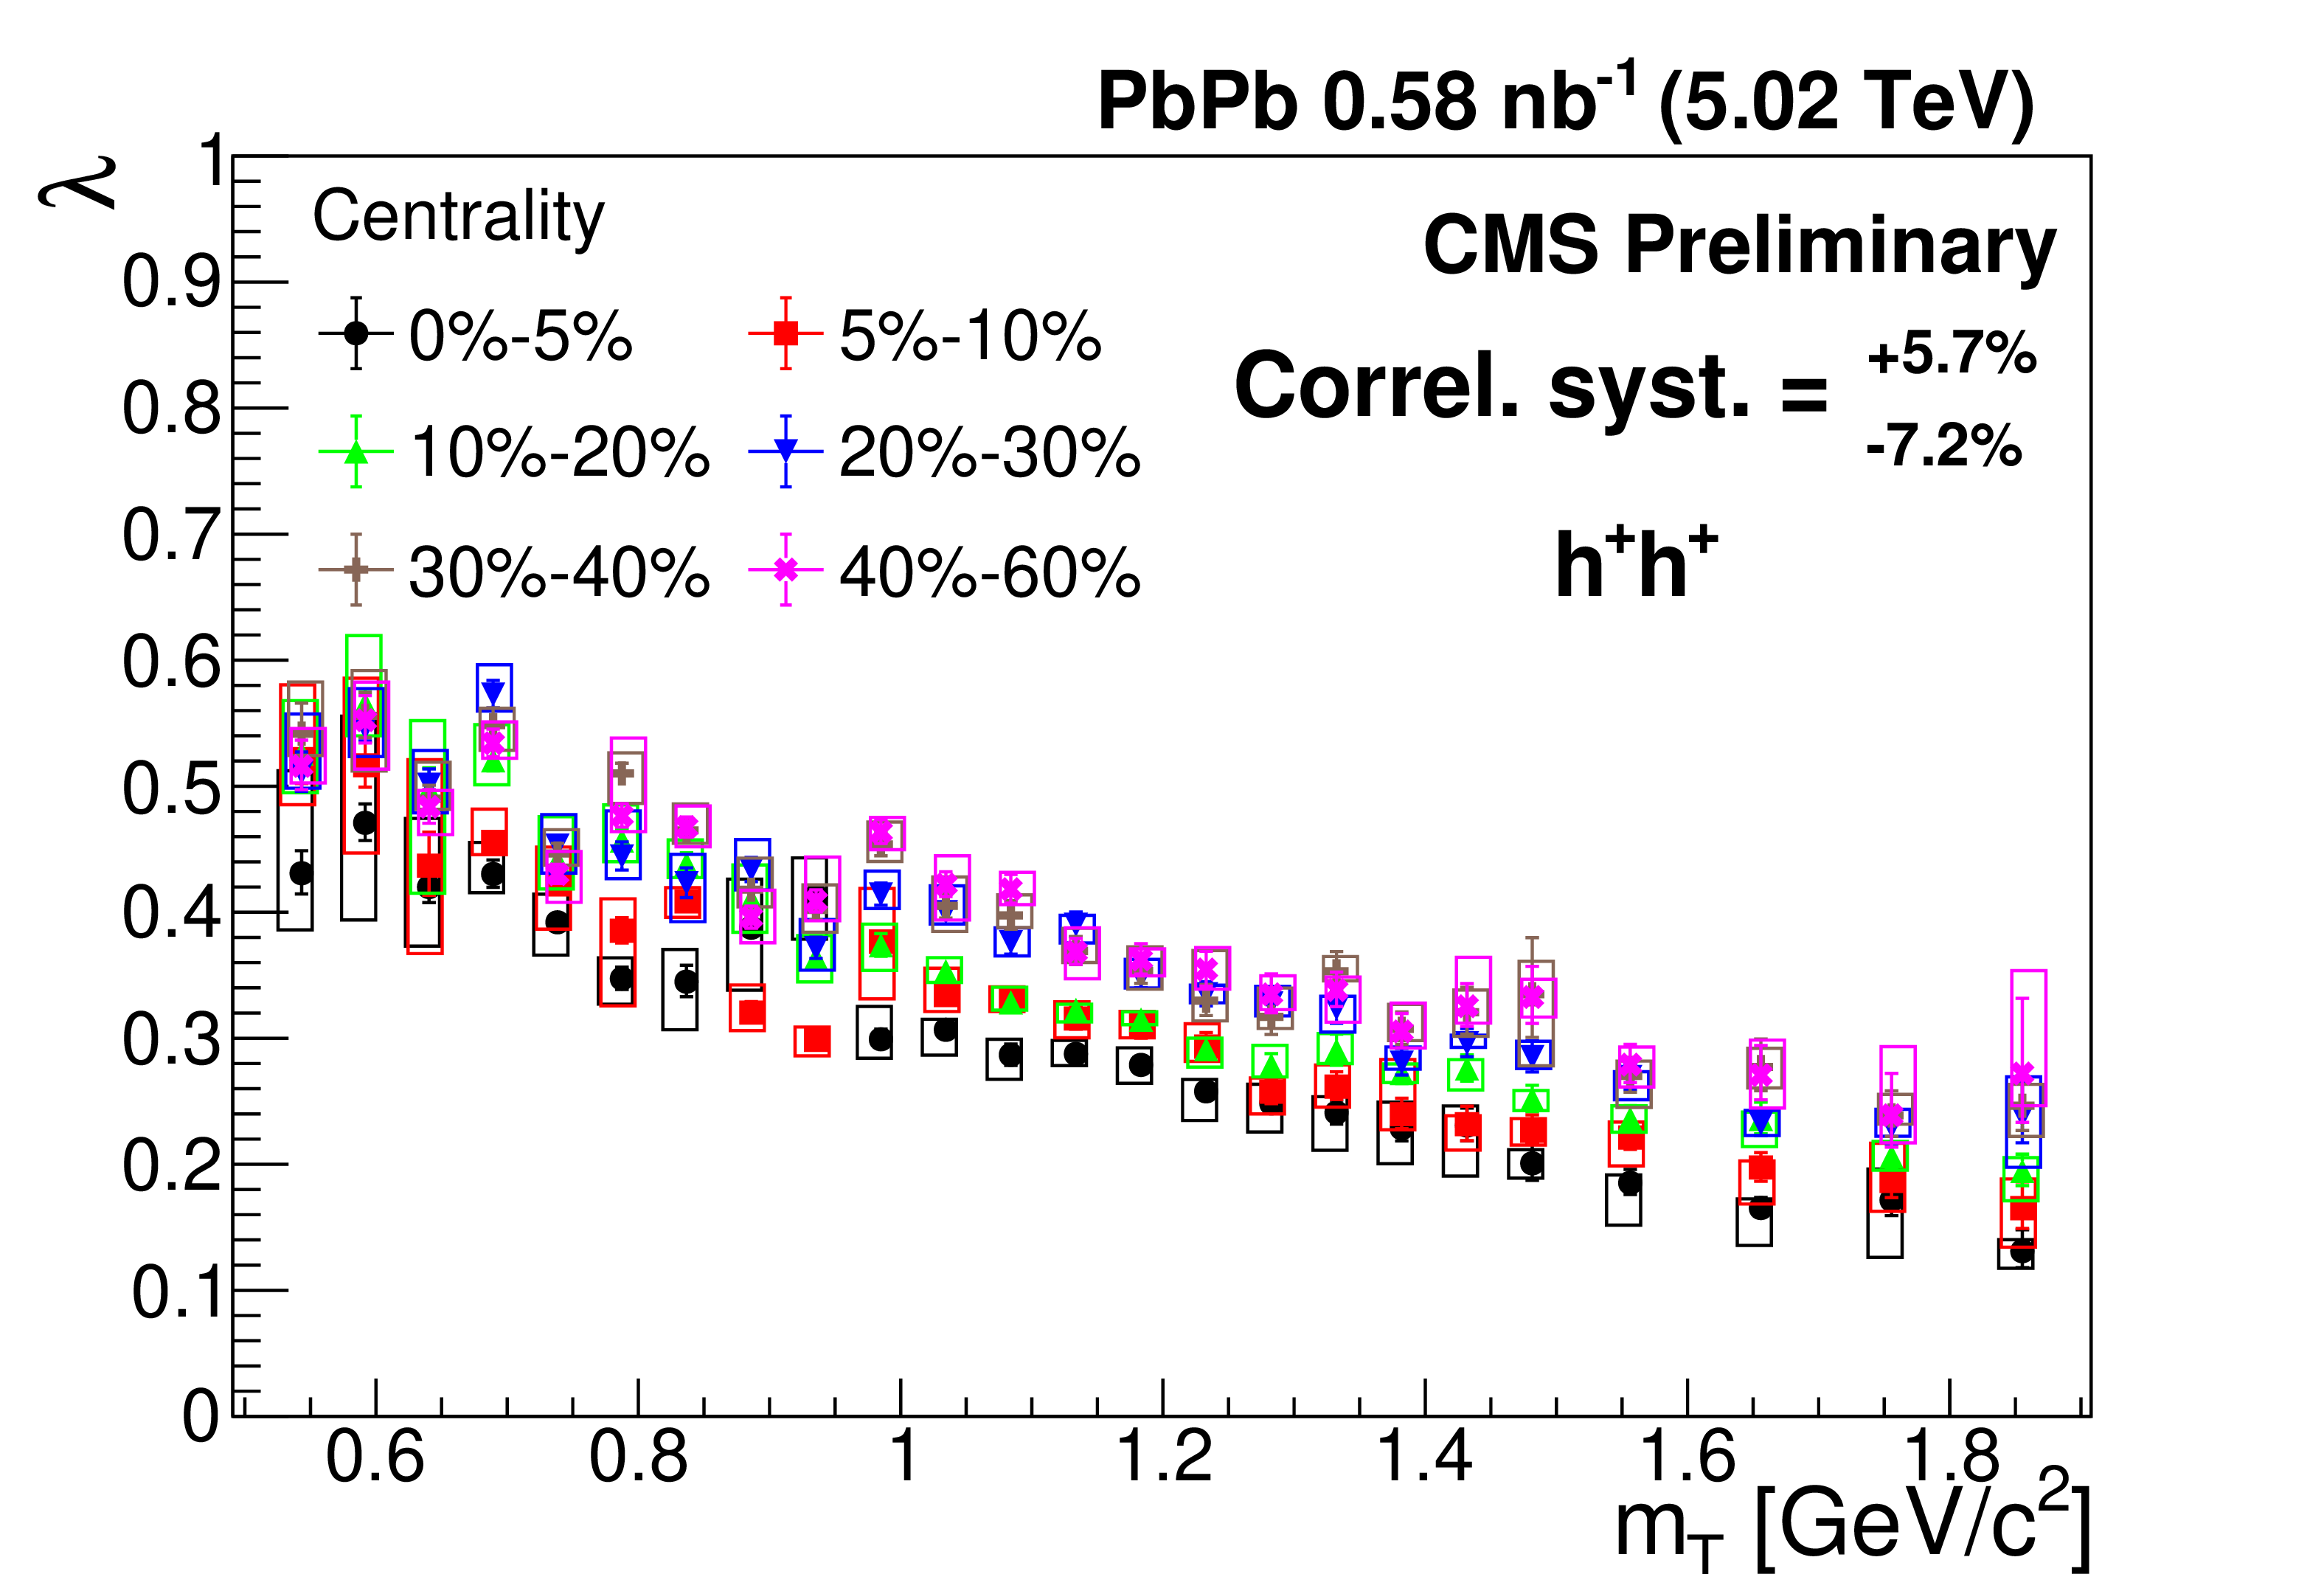
Figure 8:
The correlation strength $\lambda $ versus the transverse mass $m_{\mathrm {T}}$ in different centrality classes for positive (left) and negative (right) hadron pairs. The error bars are the statistical uncertainties, while the boxes indicate the point-to-point systematic uncertainties. The correlated systematic uncertainty is also indicated. |
png pdf |
Figure 8-a:
The correlation strength $\lambda $ versus the transverse mass $m_{\mathrm {T}}$ in different centrality classes for positive (left) and negative (right) hadron pairs. The error bars are the statistical uncertainties, while the boxes indicate the point-to-point systematic uncertainties. The correlated systematic uncertainty is also indicated. |

png pdf |
Figure 8-b:
The correlation strength $\lambda $ versus the transverse mass $m_{\mathrm {T}}$ in different centrality classes for positive (left) and negative (right) hadron pairs. The error bars are the statistical uncertainties, while the boxes indicate the point-to-point systematic uncertainties. The correlated systematic uncertainty is also indicated. |
png pdf |
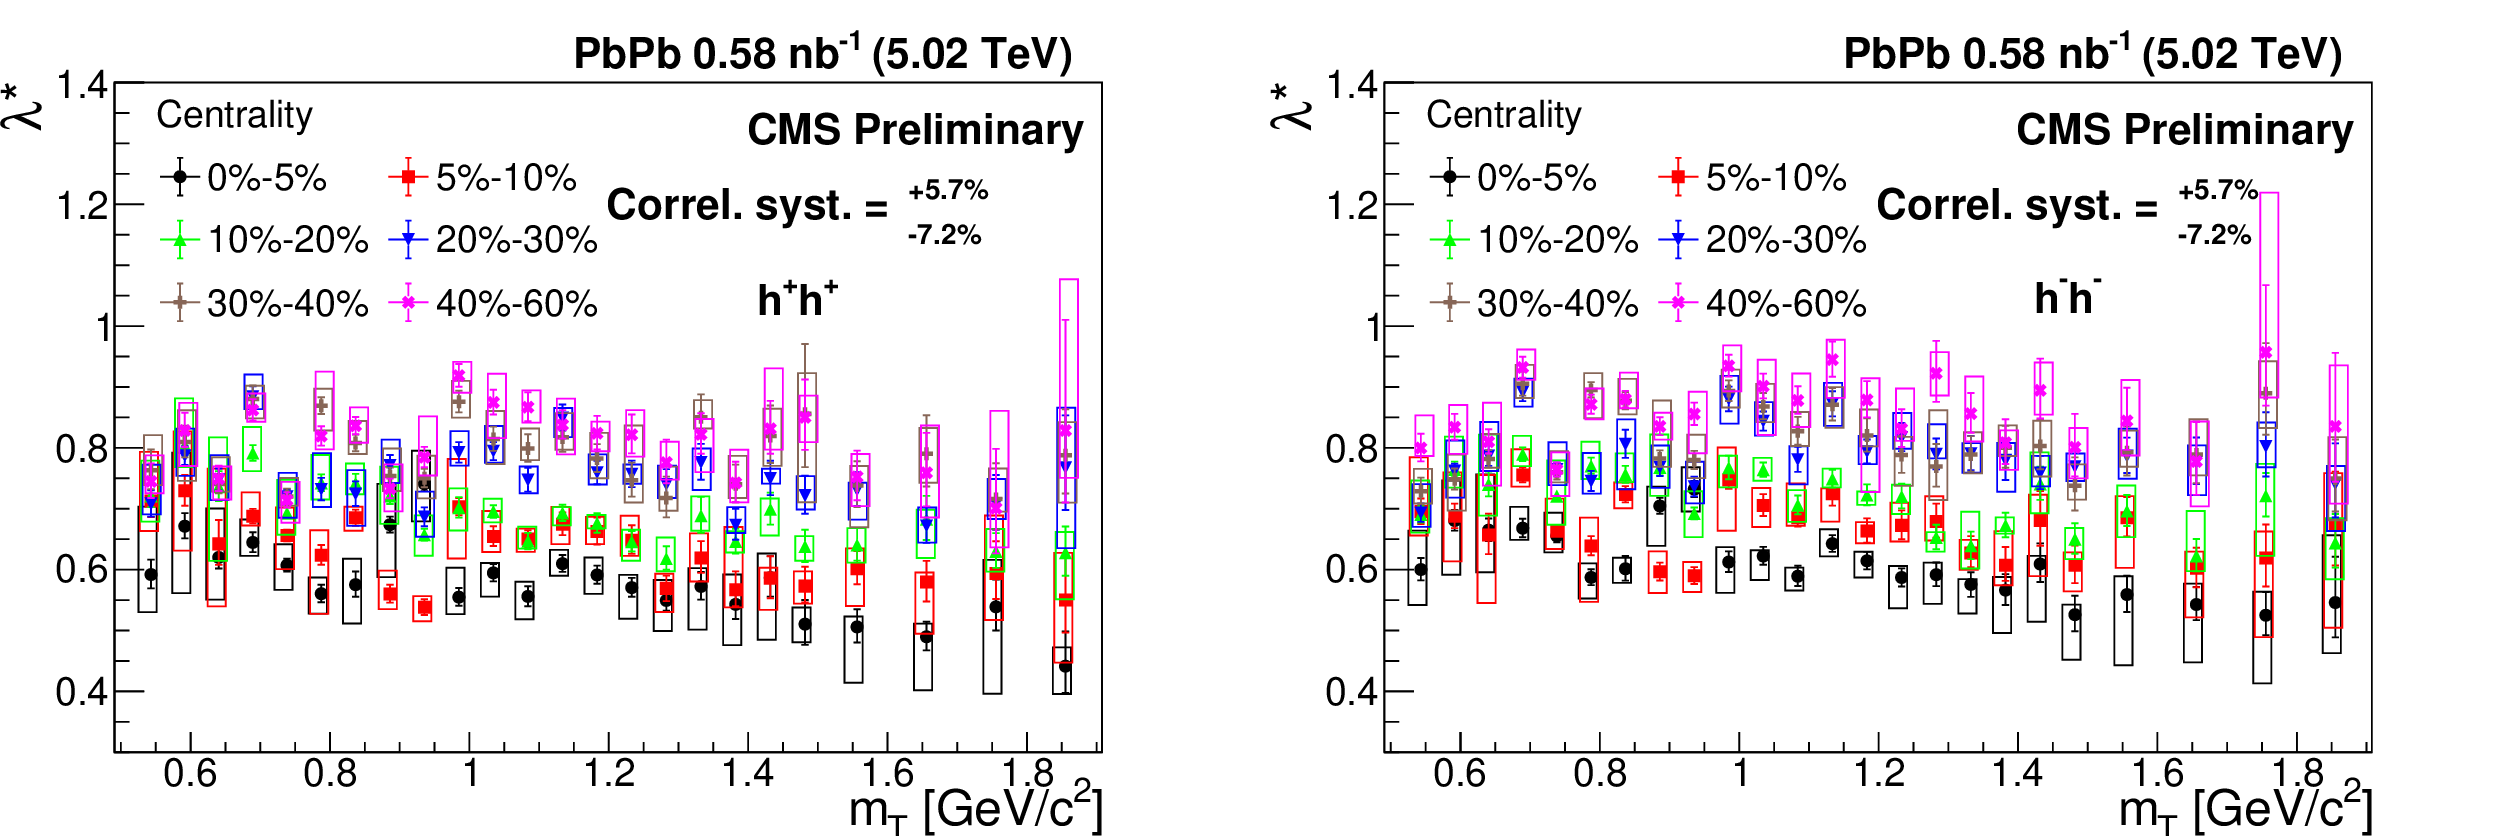
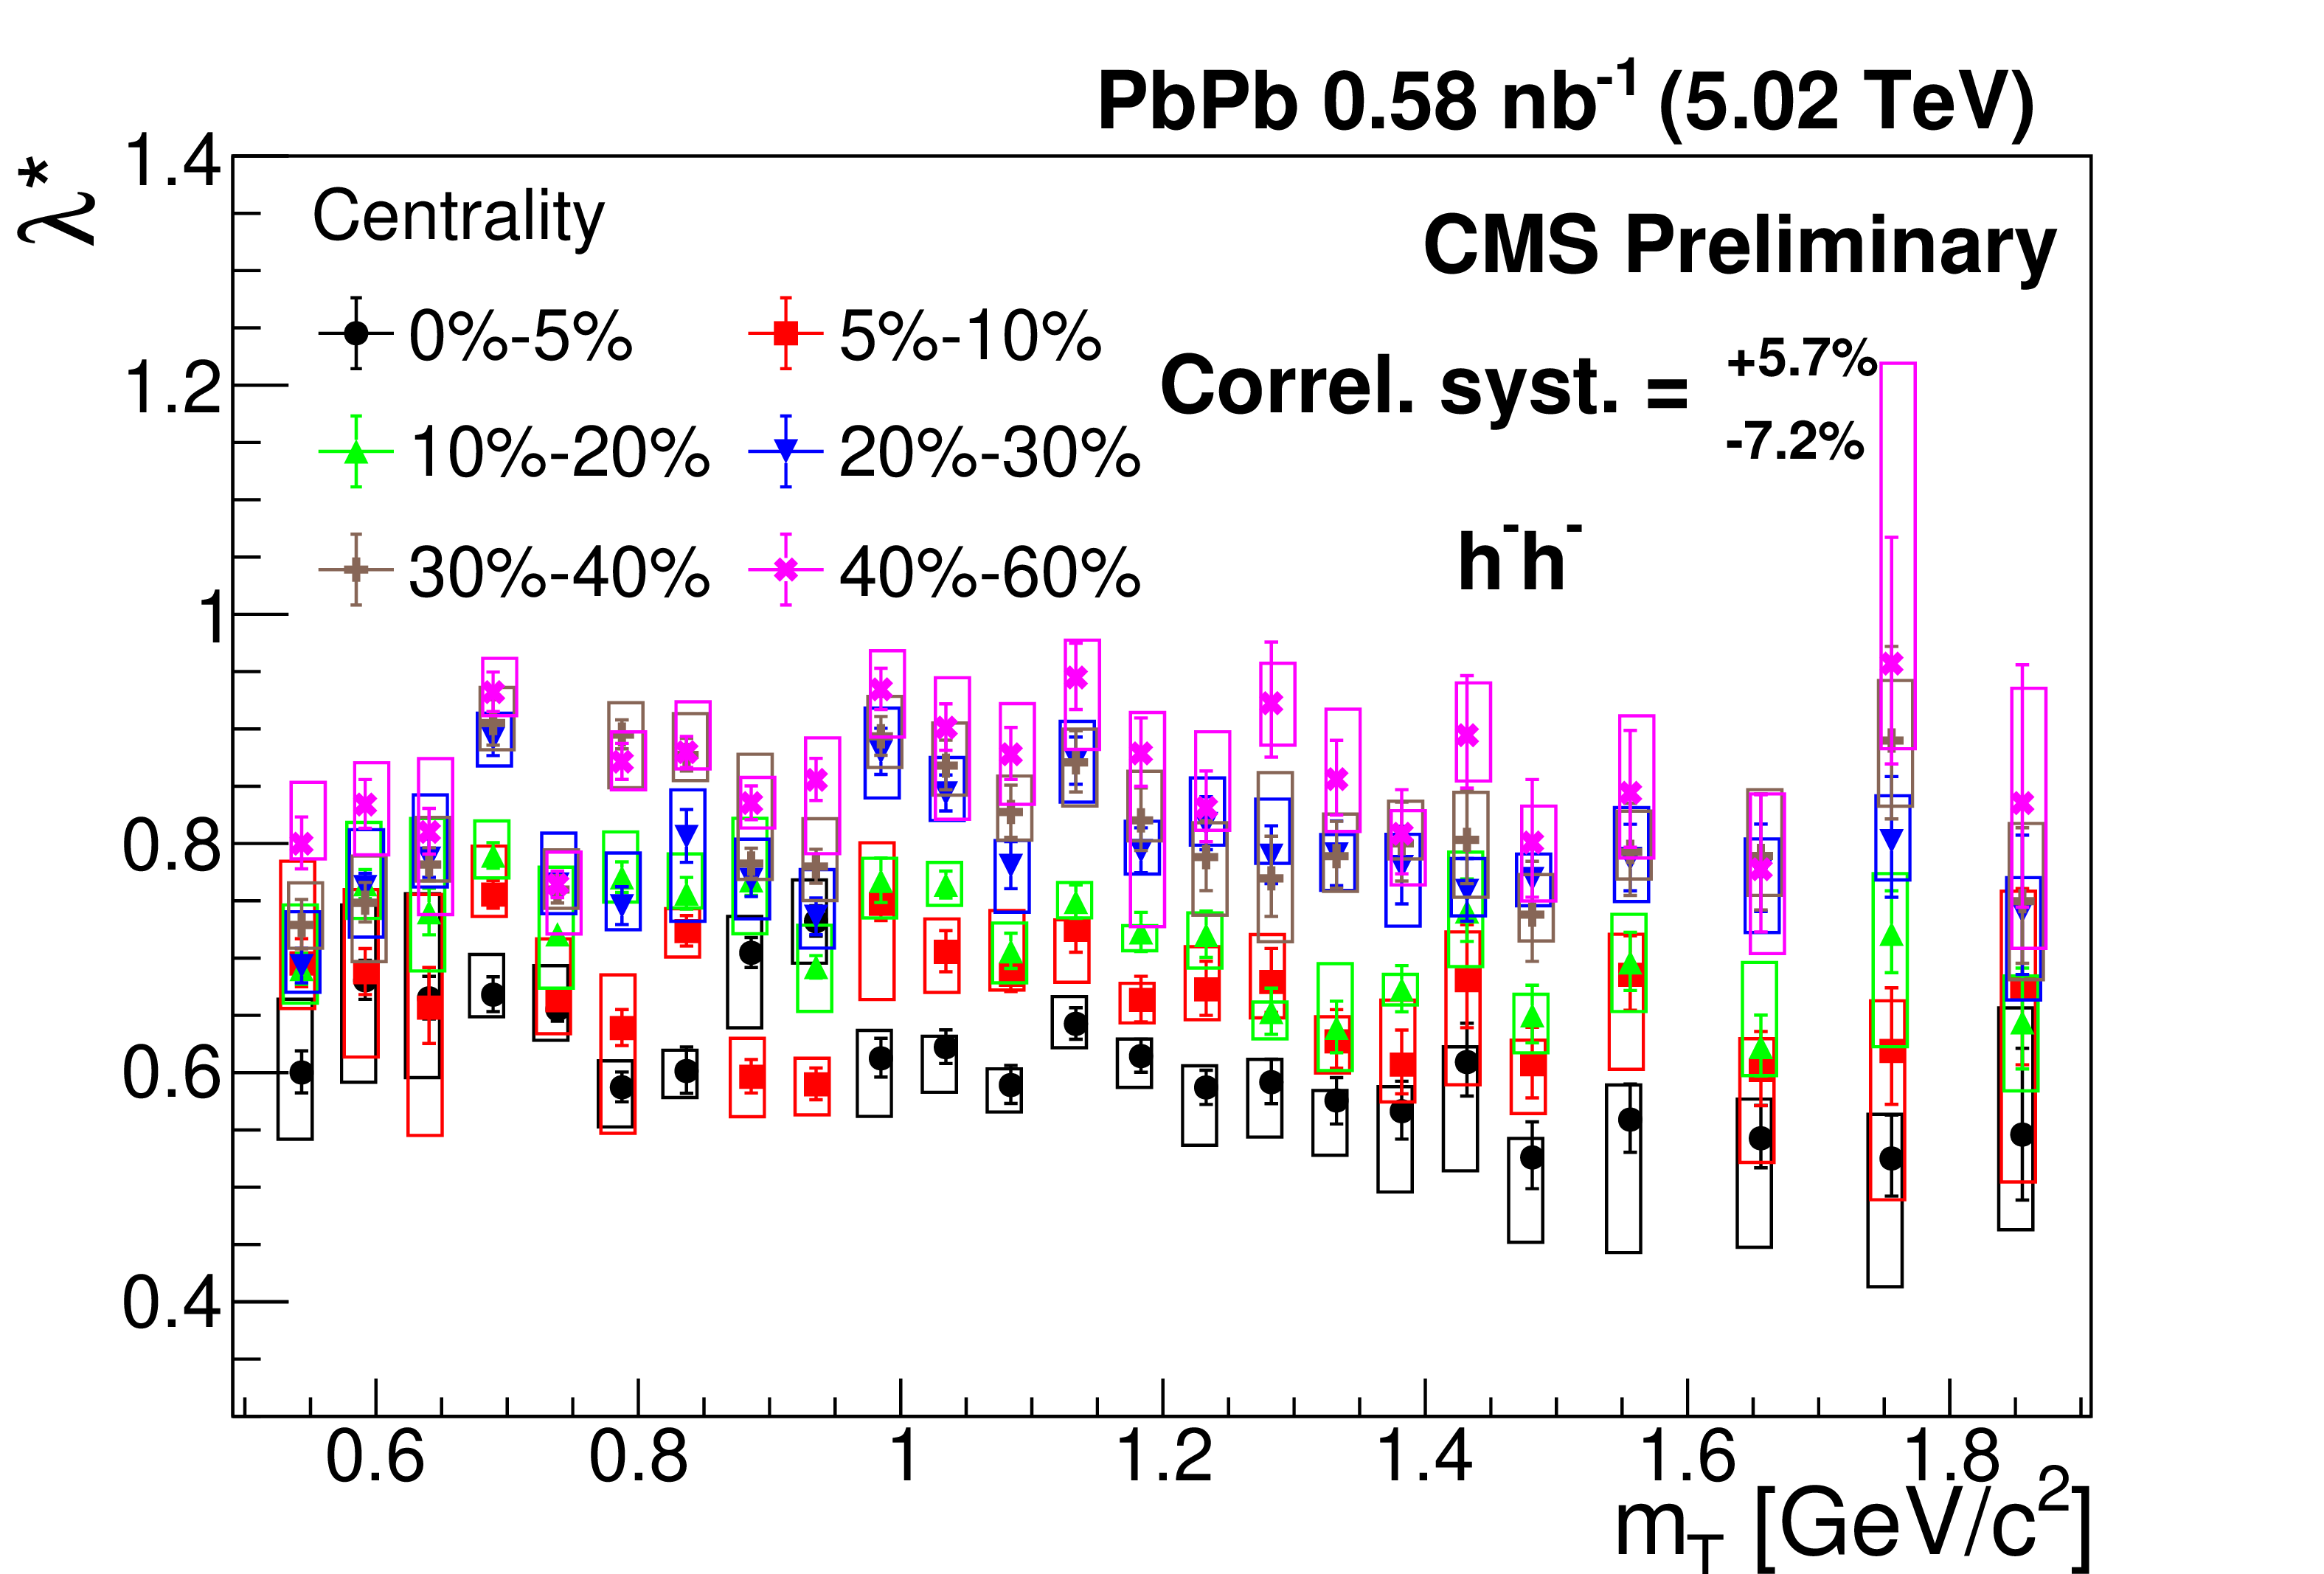
Figure 9:
The correlation strength re-scaled with the square of the pion ratio $\lambda ^*$ versus the transverse mass $m_{\mathrm {T}}$ in different centrality classes for positive (left) and negative (right) hadron pairs. The error bars are the statistical uncertainties, while the boxes indicate the point-to-point systematic uncertainties. The correlated systematic uncertainty is also indicated. |

png pdf |
Figure 9-a:
The correlation strength re-scaled with the square of the pion ratio $\lambda ^*$ versus the transverse mass $m_{\mathrm {T}}$ in different centrality classes for positive (left) and negative (right) hadron pairs. The error bars are the statistical uncertainties, while the boxes indicate the point-to-point systematic uncertainties. The correlated systematic uncertainty is also indicated. |
png pdf |
Figure 9-b:
The correlation strength re-scaled with the square of the pion ratio $\lambda ^*$ versus the transverse mass $m_{\mathrm {T}}$ in different centrality classes for positive (left) and negative (right) hadron pairs. The error bars are the statistical uncertainties, while the boxes indicate the point-to-point systematic uncertainties. The correlated systematic uncertainty is also indicated. |
| Tables | |
png pdf |
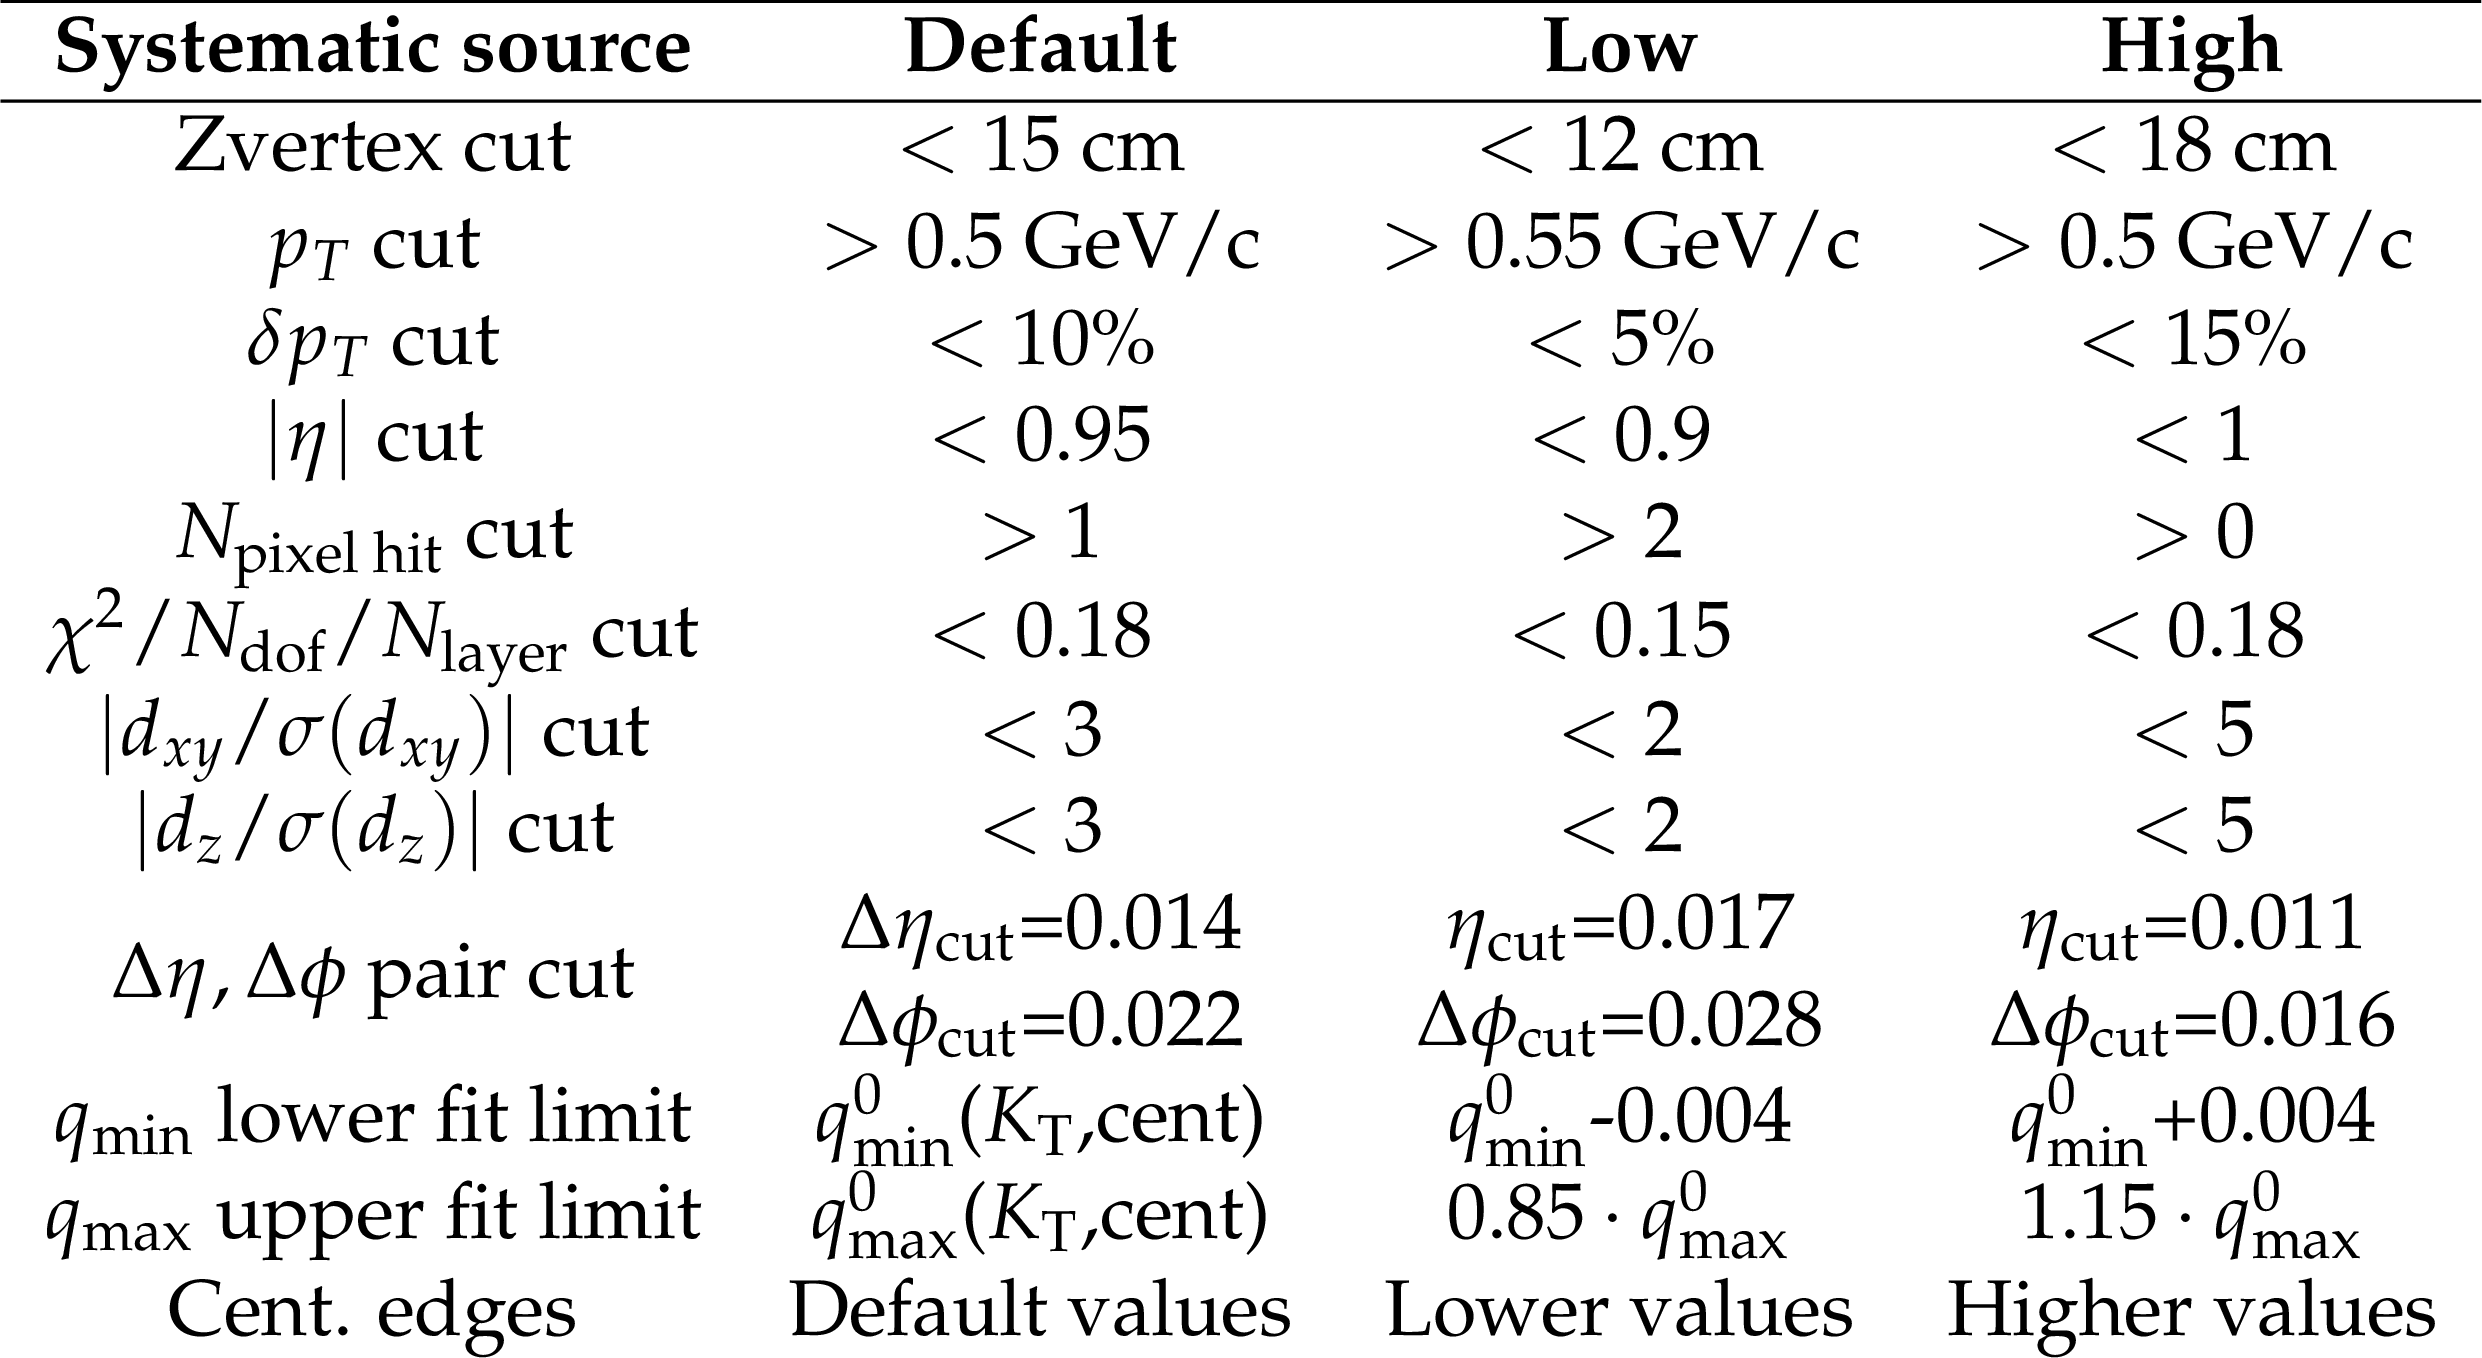
Table 1:
The sources of the systematic uncertainties with their values in the default and other two settings. The meaning of the analysis parameters are given in Subsections 4.1 and 4.2. |
png pdf |
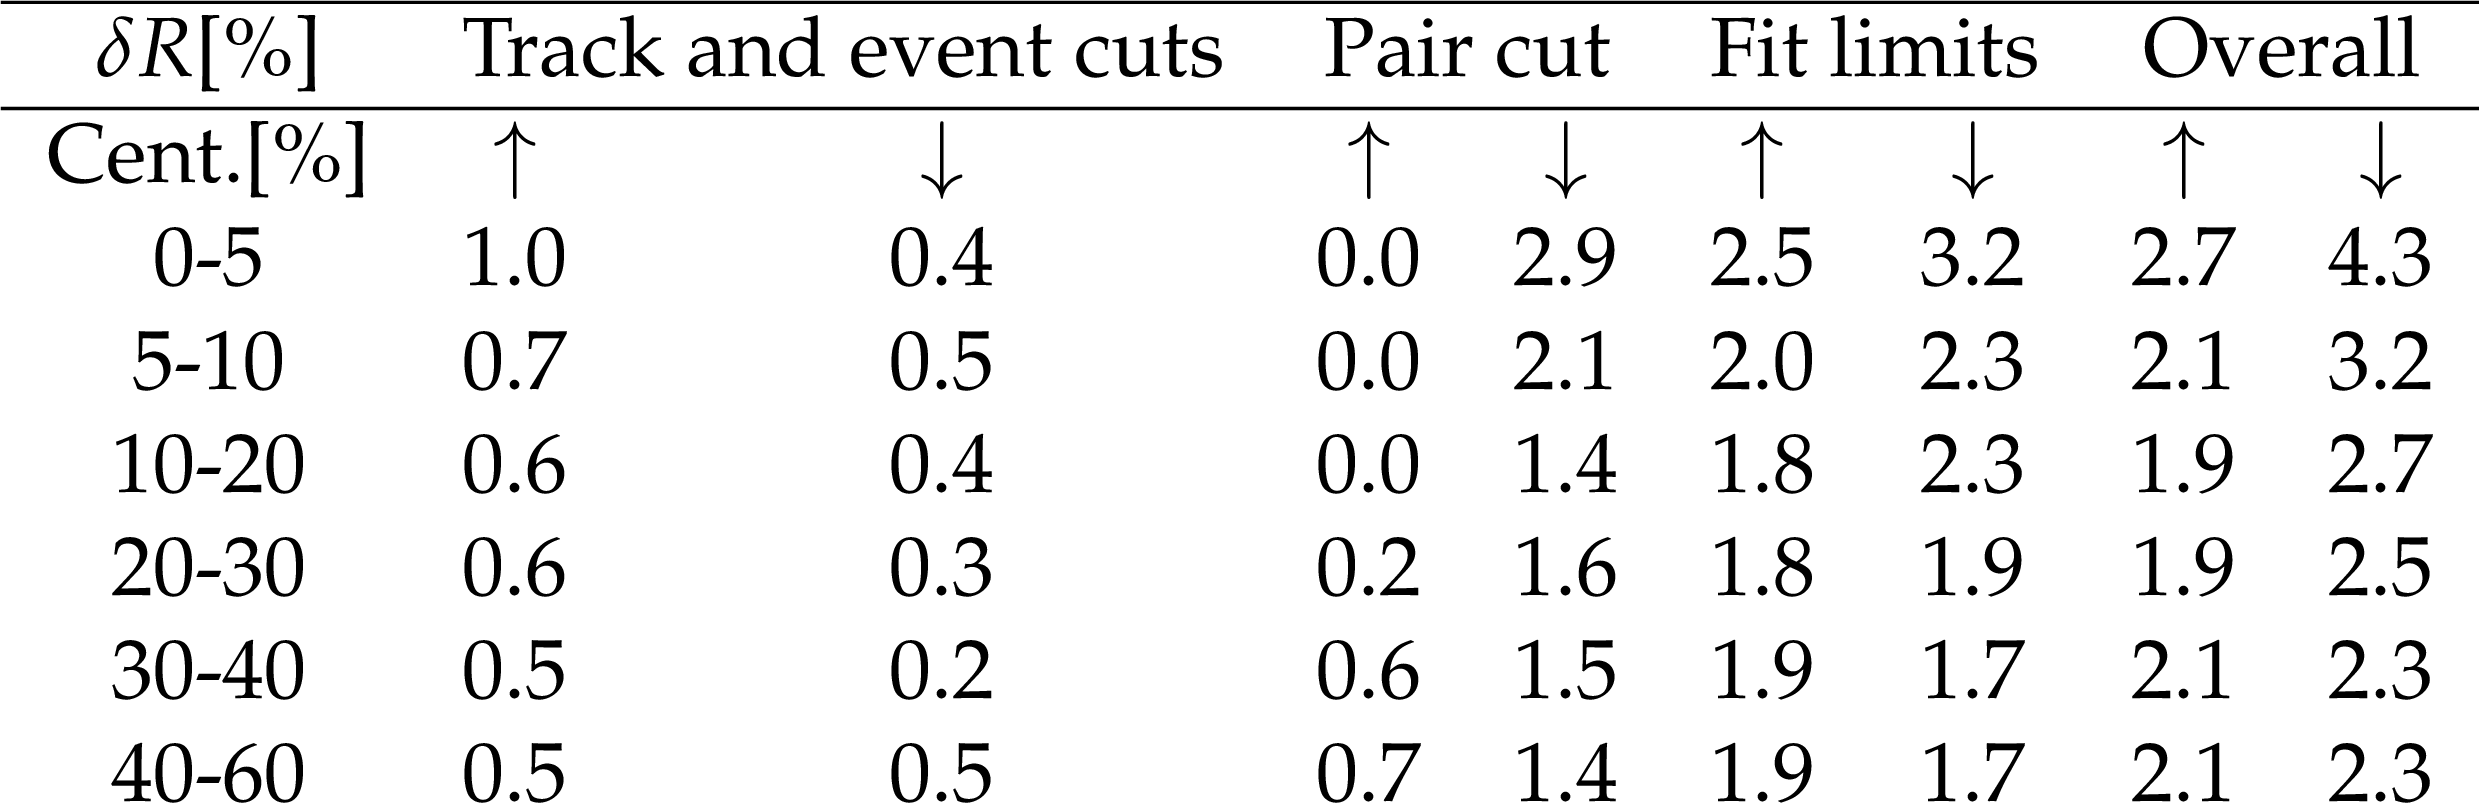
Table 2:
The relative effect of the different types of systematic sources in each centrality class for the $R$ parameter (in percentage). We averaged over $K_{\mathrm {T}}$ and the two charge setups. $\uparrow$ ($\downarrow$) represents positive (negative) modification in the value of the parameter. |
png pdf |
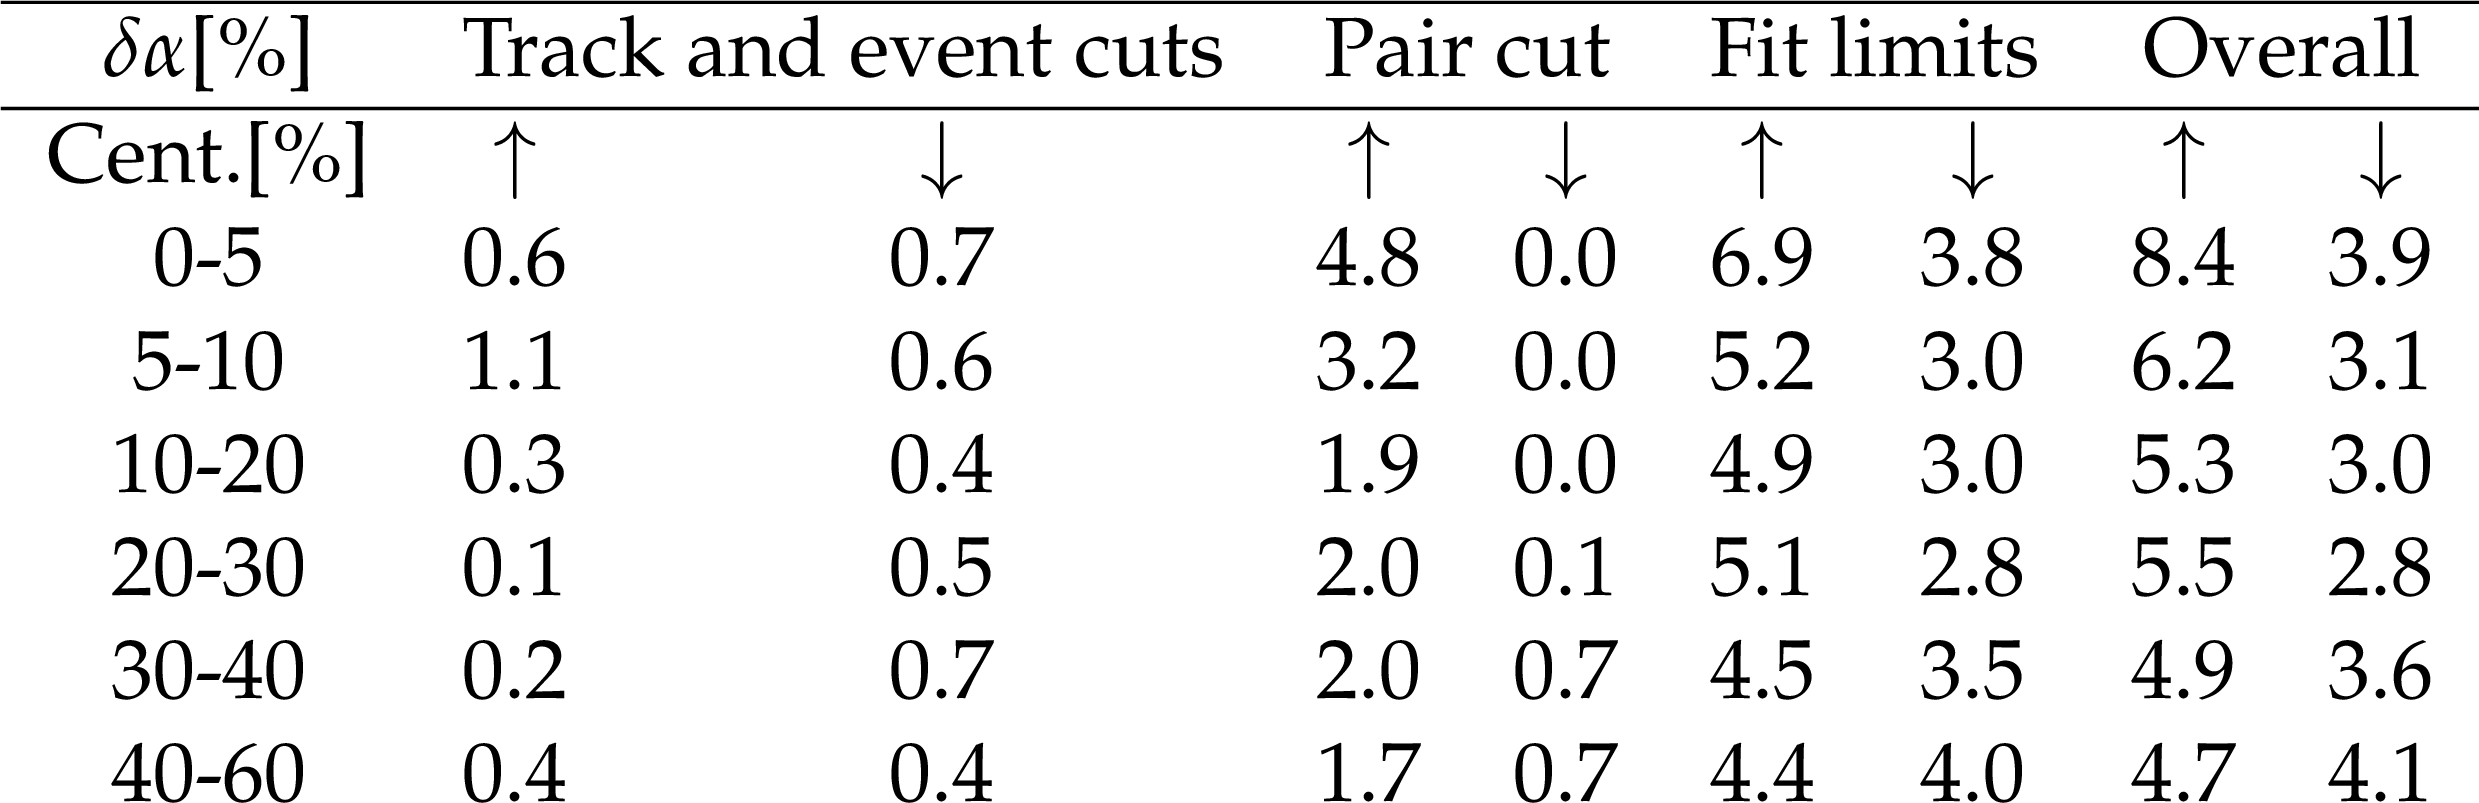
Table 3:
The relative effect of the different types of systematic sources in each centrality class for the $\alpha $ parameter (in percentage). We averaged over $K_{\mathrm {T}}$ and the two charge setups. $\uparrow$ ($\downarrow$) represents positive (negative) modification in the value of the parameter. |
png pdf |
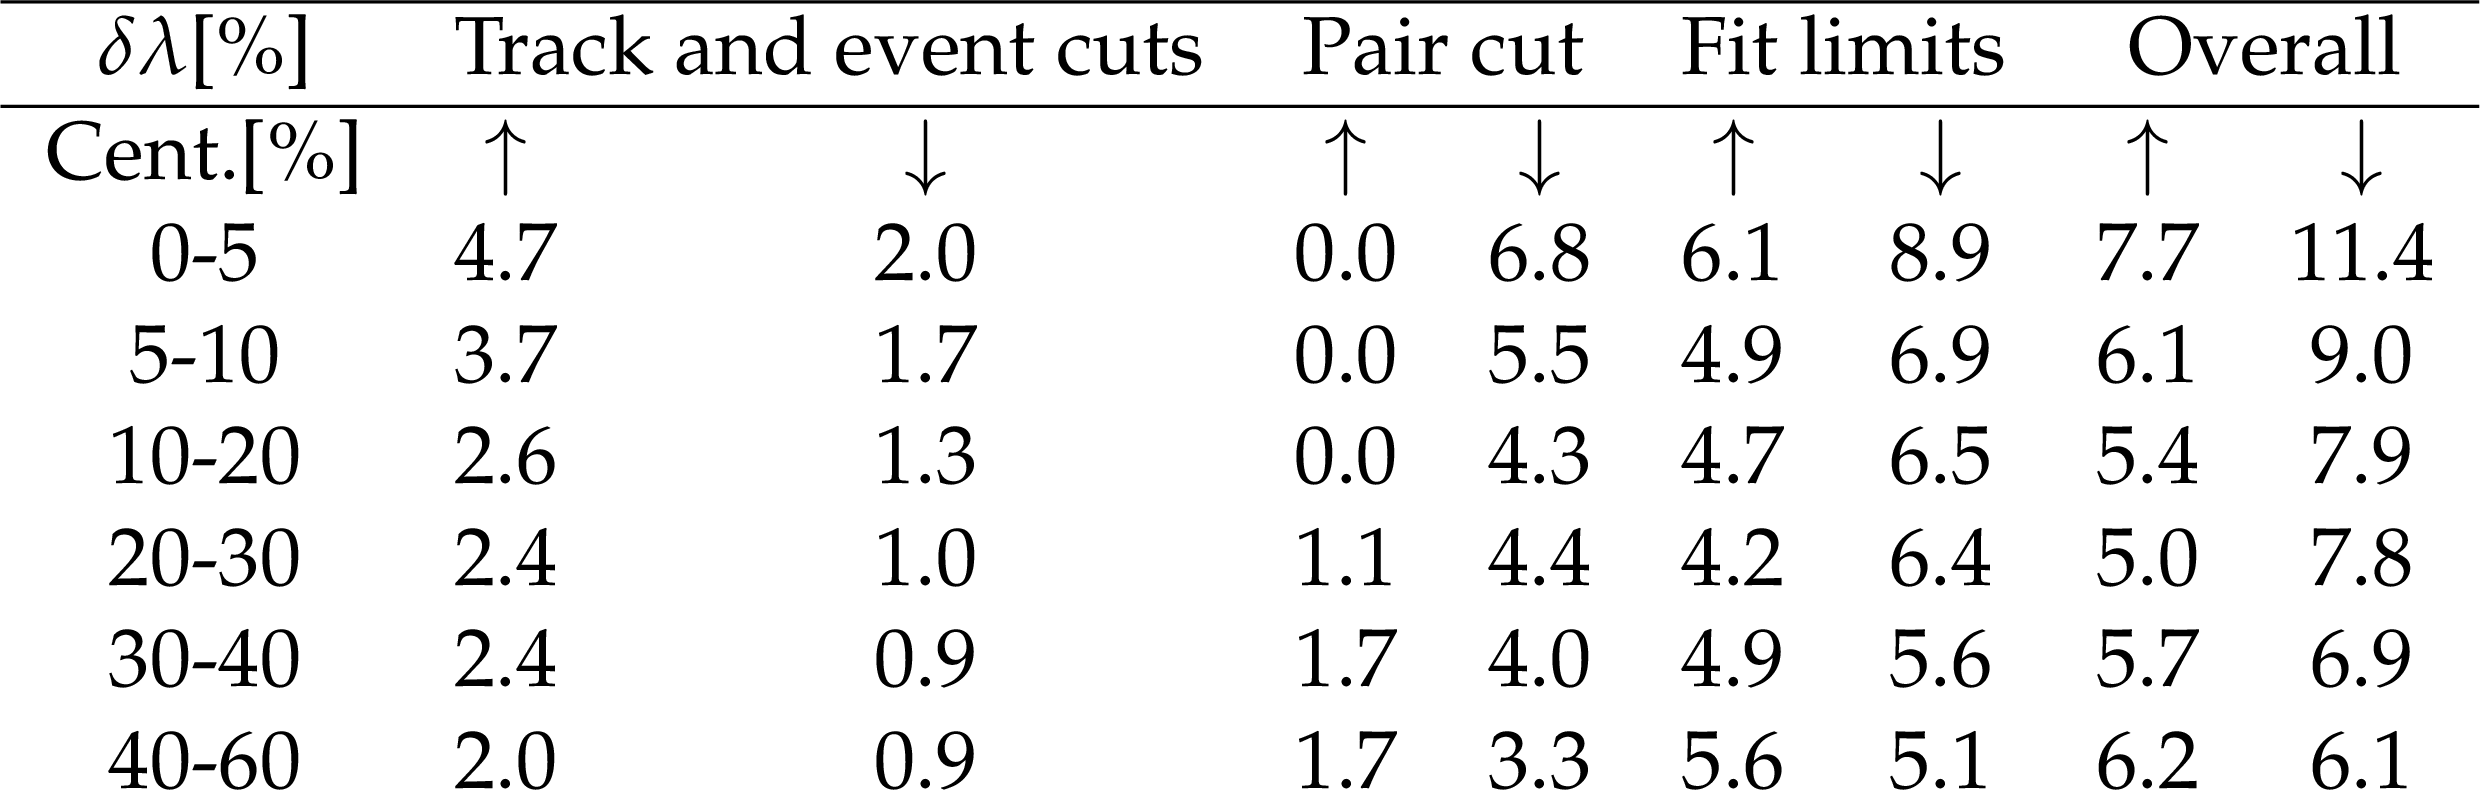
Table 4:
The relative effect of the different types of systematic sources in each centrality class for the $\lambda $ parameter (in percentage). We averaged over $K_{\mathrm {T}}$ and the two charge setups. $\uparrow$ ($\downarrow$) represents positive (negative) modification in the value of the parameter. |
png pdf |
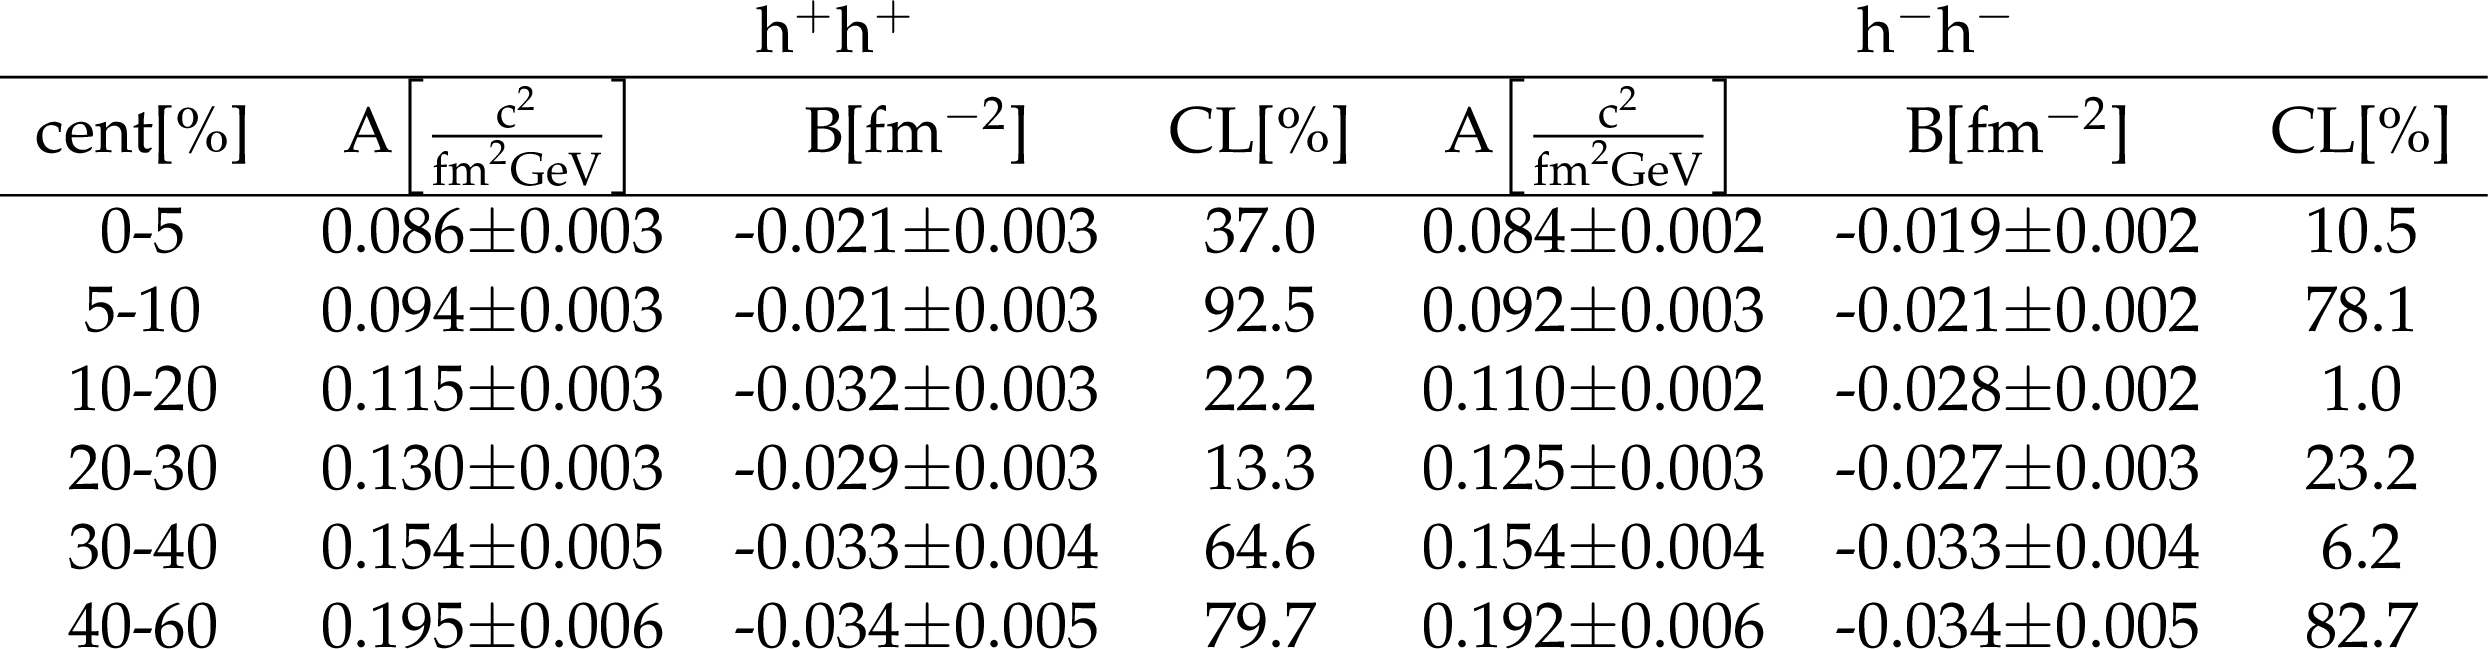
Table 5:
The fit parameters and the confidence levels of the linear fits to $1/R^2$ versus $m_{\mathrm {T}}$ for positive (left) and negative (right) hadron pairs. |
png pdf |
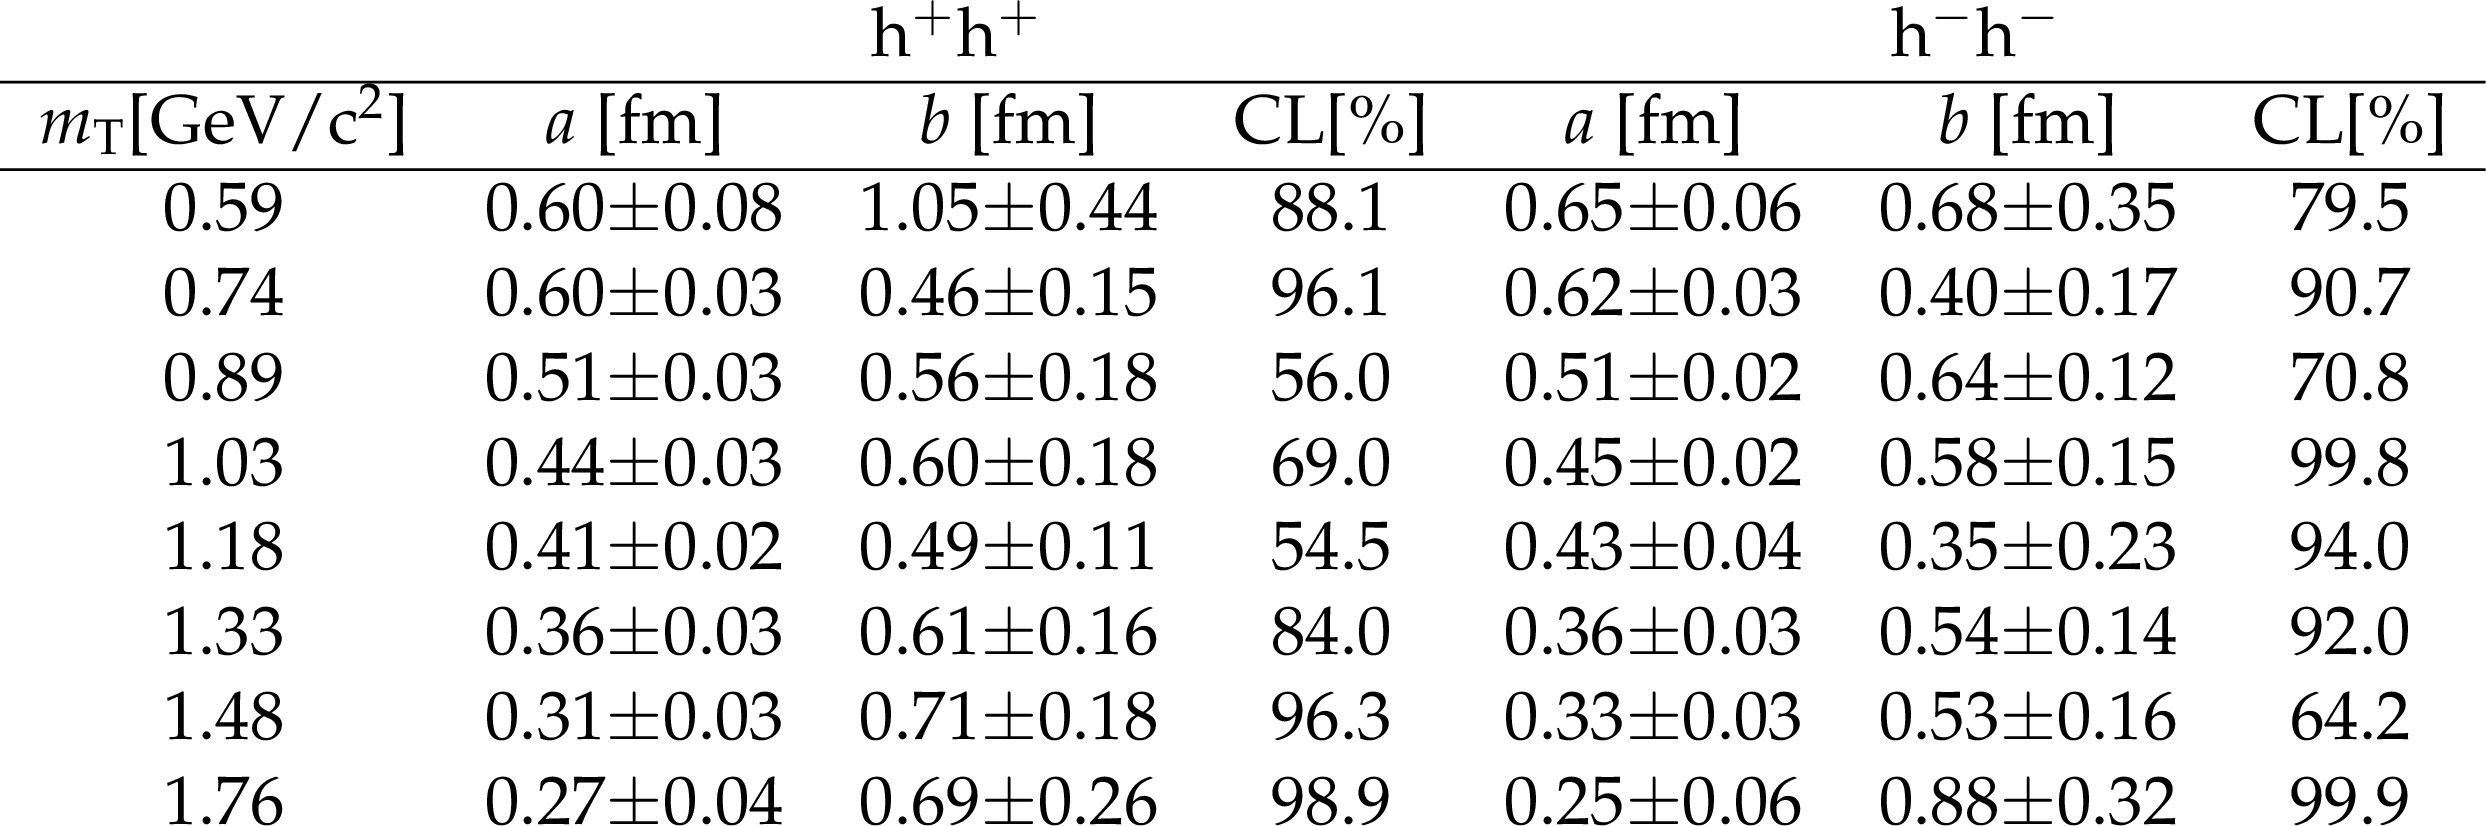
Table 6:
The fit parameters and the confidence levels of the linear fits to $R$ versus $\langle N_{\text {part}}\rangle^{1/3}$ for positive (left) and negative (right) hadron pairs. |
| Summary |
|
In this note we presented two-particle Bose-Einstein correlation function measurements based on approximately 2.65$\times $10$^9$ lead-lead (PbPb) events with ${\sqrt {\smash [b]{s_{_{\mathrm {NN}}}}}} = $ 5.02 TeV, recorded by CMS at the LHC. The correlation functions, found in different centrality and average transverse momentum ($K_{\mathrm{T}}$) classes, are analyzed in terms of stable Lévy sources within the core-halo model including Coulomb effects. The values of the Lévy scale parameter $R$, the Lévy stability index $\alpha$, correlation strength $\lambda$ are determined. The geometrical interpretation of the $R$ parameter is investigated by determining its dependence on the average number of participating nucleons in the collision ($\langle N_{\text{part}}\rangle$). A linear dependence of $1/R^2$ with the transverse mass ($m_{\mathrm{T}}$) assuming a pion mass for the charged particles is observed, consistent with having a hydrodynamic scaling even in the case of Lévy sources. Based on the observed linear behavior, it is estimated that the Hubble constant of the QGP created in 5.02 TeV PbPb collisions is between 0.12 c/fm and 0.18 c/fm. The $1/R^2$ intercept of the linear fits is negative in all cases. This requires further phenomenological studies. We found the $\alpha$ parameter to have little, if any, $m_{\mathrm{T}}$ dependence and to range between 1.6 and 2, increasing with centrality. We also measured a strong and decreasing trend for the $\lambda$ parameter as a function of $m_{\mathrm{T}}$. The $m_{\mathrm{T}}$ dependence is explained in terms of the lack of particle identification. After rescaling the $\lambda$ values to account for the pion fraction in each analysis range, a nearly constant trend of the mass fraction corrected $\lambda^*$ value with $m_{\mathrm{T}}$ is observed. The $\lambda^*$ values are found to decrease as the collisions become more central. Altogether, these results imply that the hadron emitting source in ${\sqrt {\smash [b]{s_{_{\mathrm {NN}}}}}}=$ 5.02 TeV PbPb collisions can be described by Lévy distributions in a statistically acceptable manner, making the above discussed interpretation of the Lévy source parameters possible. |
| References | ||||
| 1 | R. Hanbury Brown and R. Q. Twiss | A test of a new type of stellar interferometer on Sirius | Nature 178 (1956) 1046 | |
| 2 | R. J. Glauber | Photon correlations | PRL 10 (1963) 84 | |
| 3 | R. J. Glauber | Nobel lecture: One hundred years of light quanta | Rev. Mod. Phys. 78 (2006) 1267 | |
| 4 | R. J. Glauber | Quantum optics and heavy ion physics | NP A 774 (2006) 3 | nucl-th/0604021 |
| 5 | G. Goldhaber, W. B. Fowler, S. Goldhaber, and T. F. Hoang | Pion-pion correlations in antiproton annihilation events | PRL 3 (1959) 181 | |
| 6 | G. Goldhaber, S. Goldhaber, W.-Y. Lee, and A. Pais | Influence of Bose-Einstein statistics on the antiproton proton annihilation process | PR120 (1960) 300 | |
| 7 | PHENIX Collaboration | Bose-Einstein correlations of charged pion pairs in Au + Au collisions at $ {\sqrt {\smash [b]{s_{_{\mathrm {NN}}}}}} = $ 200 GeV | PRL 93 (2004) 152302 | nucl-ex/0401003 |
| 8 | PHENIX Collaboration | Kaon interferometric probes of space-time evolution in Au+Au collisions at $ {\sqrt {\smash [b]{s_{_{\mathrm {NN}}}}}} = $ 200 GeV | PRL 103 (2009) 142 | 0903.4863 |
| 9 | A. N. Makhlin and Y. M. Sinyukov | Hydrodynamics of hadron matter under pion interferometric microscope | Z. Phys. C 39 (1988) 69 | |
| 10 | T. Csörgó and B. Lörstad | Bose-Einstein correlations for three-dimensionally expanding, cylindrically symmetric, finite systems | PRC 54 (1996) 1390 | hep-ph/9509213 |
| 11 | STAR Collaboration | Pion interferometry in Au+Au collisions at $ {\sqrt {\smash [b]{s_{_{\mathrm {NN}}}}}} = $ 200 GeV | PRC 71 (2005) 044906 | nucl-ex/0411036 |
| 12 | ALICE Collaboration | One-dimensional pion, kaon, and proton femtoscopy in Pb-Pb collisions at $ {\sqrt {\smash [b]{s_{_{\mathrm {NN}}}}}} = $ 2.76 TeV | PRC 92 (2015) 054908 | 1506.07884 |
| 13 | CMS Collaboration | Bose-Einstein correlations in pp, pPb, and PbPb collisions at $ {\sqrt {\smash [b]{s_{_{\mathrm {NN}}}}}}=$ 0.9-7 TeV | PRC 97 (2018) 064912 | CMS-FSQ-14-002 1712.07198 |
| 14 | ATLAS Collaboration | Femtoscopy with identified charged pions in proton-lead collisions at $ {\sqrt {\smash [b]{s_{_{\mathrm {NN}}}}}}= $ 5.02 TeV with ATLAS | PRC 96 (2017) 064908 | 1704.01621 |
| 15 | T. Csörgó | Particle interferometry from 40 MeV to 40 TeV | Acta Phys. Hung. A 15 (2002) 1 | hep-ph/0001233 |
| 16 | U. A. Wiedemann and U. W. Heinz | Particle interferometry for relativistic heavy ion collisions | PR 319 (1999) 145 | nucl-th/9901094 |
| 17 | J. Bolz et al. | Resonance decays and partial coherence in Bose-Einstein correlations | PRD 47 (1993) 3860 | |
| 18 | T. Csörgó, B. Lörstad, and J. Zimànyi | Bose-Einstein correlations for systems with large halo | Z. Phys. C 71 (1996) 491 | hep-ph/9411307 |
| 19 | PHENIX Collaboration | Lévy-stable two-pion Bose-Einstein correlations in $ {\sqrt {\smash [b]{s_{_{\mathrm {NN}}}}}}= $ 200 GeV Au$ + $Au collisions | PRC 97 (2018) 064911 | 1709.05649 |
| 20 | R. Metzler, E. Barkai, and J. Klafter | Anomalous diffusion and relaxation close to thermal equilibrium: A fractional Fokker-Planck equation approach | PRL 82 (1999) 3563 | |
| 21 | T. Csörgó, S. Hegyi, and W. A. Zajc | Bose-Einstein correlations for Lévy stable source distributions | EPJC 36 (2004) 67 | nucl-th/0310042 |
| 22 | Y. Sinyukov et al. | Coulomb corrections for interferometry analysis of expanding hadron systems | PLB 432 (1998) 248 | |
| 23 | M. Csanàd, S. Lökös, and M. Nagy | Expanded empirical formula for Coulomb final state interaction in the presence of Lévy sources | Phys. Part. Nucl. 51 (2020) 238 | 1910.02231 |
| 24 | CMS Tracker Group Collaboration | The CMS phase-1 pixel detector upgrade | JINST 16 (2021) P02027 | 2012.14304 |
| 25 | CMS Collaboration | Track impact parameter resolution for the full pseudo rapidity coverage in the 2017 dataset with the CMS phase-1 pixel detector | CDS | |
| 26 | CMS Collaboration | The CMS trigger system | JINST 12 (2017) P01020 | CMS-TRG-12-001 1609.02366 |
| 27 | CMS Collaboration | The CMS experiment at the CERN LHC | JINST 3 (2008) S08004 | CMS-00-001 |
| 28 | CMS Collaboration | Description and performance of track and primary-vertex reconstruction with the CMS tracker | JINST 9 (2014) P10009 | CMS-TRK-11-001 1405.6569 |
| 29 | L3 Collaboration | Test of the $ \tau $-model of Bose-Einstein correlations and reconstruction of the source function in hadronic Z-boson decay at LEP | EPJC 71 (2011) 1648 | 1105.4788 |
| 30 | CMS Collaboration | Bose-Einstein correlations of charged hadrons in proton-proton collisions at $ \sqrt{s} = $ 13 TeV | JHEP 03 (2020) 014 | CMS-FSQ-15-009 1910.08815 |
| 31 | F. James and M. Roos | Minuit: A system for function minimization and analysis of the parameter errors and correlations | CPC 10 (1975) 343 | |
| 32 | D. Kincses, M. I. Nagy, and M. Csanàd | Coulomb and strong interactions in the final state of Hanbury-Brown-Twiss correlations for Lévy-type source functions | PRC 102 (2020) 064912 | 1912.01381 |
| 33 | M. Chojnacki, W. Florkowski, and T. Csörgó | On the formation of Hubble flow in little bangs | PRC 71 (2005) 044902 | nucl-th/0410036 |
| 34 | T. Csörgó | Simple analytic solution of fireball hydrodynamics | Central Eur. J. Phys. 2 (2004) 556 | nucl-th/9809011 |
| 35 | C. Loizides, J. Kamin, and D. d'Enterria | Improved Monte Carlo Glauber predictions at present and future nuclear colliders | PRC 97 (2018) 054910 | 1710.07098 |
| 36 | V. V. Uchaikin and V. M. Zolotarev | Chance and Stability: Stable Distributions and their Applications | De Gruyter, 2011 , ISBN 9783110935974 | |
| 37 | ALICE Collaboration | Production of charged pions, kaons, and (anti-)protons in Pb-Pb and inelastic pp collisions at $ {\sqrt {\smash [b]{s_{_{\mathrm {NN}}}}}} = $ 5.02 TeV | PRC 101 (2020) 044907 | 1910.07678 |
|
|
Compact Muon Solenoid LHC, CERN |
|

|

|

|

|

|