

Compact Muon Solenoid
LHC, CERN
| CMS-PAS-HIN-21-008 | ||
| Measurements of the azimuthal anisotropy of charmonia in PbPb collisions at $\sqrt{\smash[b]{s_{_{\mathrm{NN}}}}}= $ 5.02 TeV | ||
| CMS Collaboration | ||
| April 2022 | ||
| Abstract: The second-order ($v_{2}$) and third-order ($v_{3}$) Fourier coefficients describing the azimuthal anisotropy of prompt and nonprompt J/$\psi$ and prompt $\psi$(2S) mesons are measured in PbPb collisions at $\sqrt{\smash[b]{s_{_{\mathrm{NN}}}}}= $ 5.02 TeV. The analysis uses a dataset corresponding to an integrated luminosity of 1.6 nb$^{-1}$ recorded with the CMS detector in 2018. J/$\psi$ and $\psi$(2S) mesons are reconstructed using their dimuon decay channel. The $v_{2}$ and $v_{3}$ values are extracted using the scalar product method and studied as functions of meson transverse momentum and PbPb collision centrality. The measured $v_{2}$ values for the prompt J/$\psi$ mesons are larger than of those of nonprompt J/$\psi$ mesons. The study of azimuthal anisotropy for prompt $\psi$(2S) mesons is reported for the first time, showing $v_{2}$ larger than that of J/$\psi$ mesons. | ||
|
Links:
CDS record (PDF) ;
CADI line (restricted) ;
These preliminary results are superseded in this paper, Submitted to JHEP. The superseded preliminary plots can be found here. |
||
| Figures & Tables | Summary | Additional Figures | References | CMS Publications |
|---|
| Figures | |
png pdf |
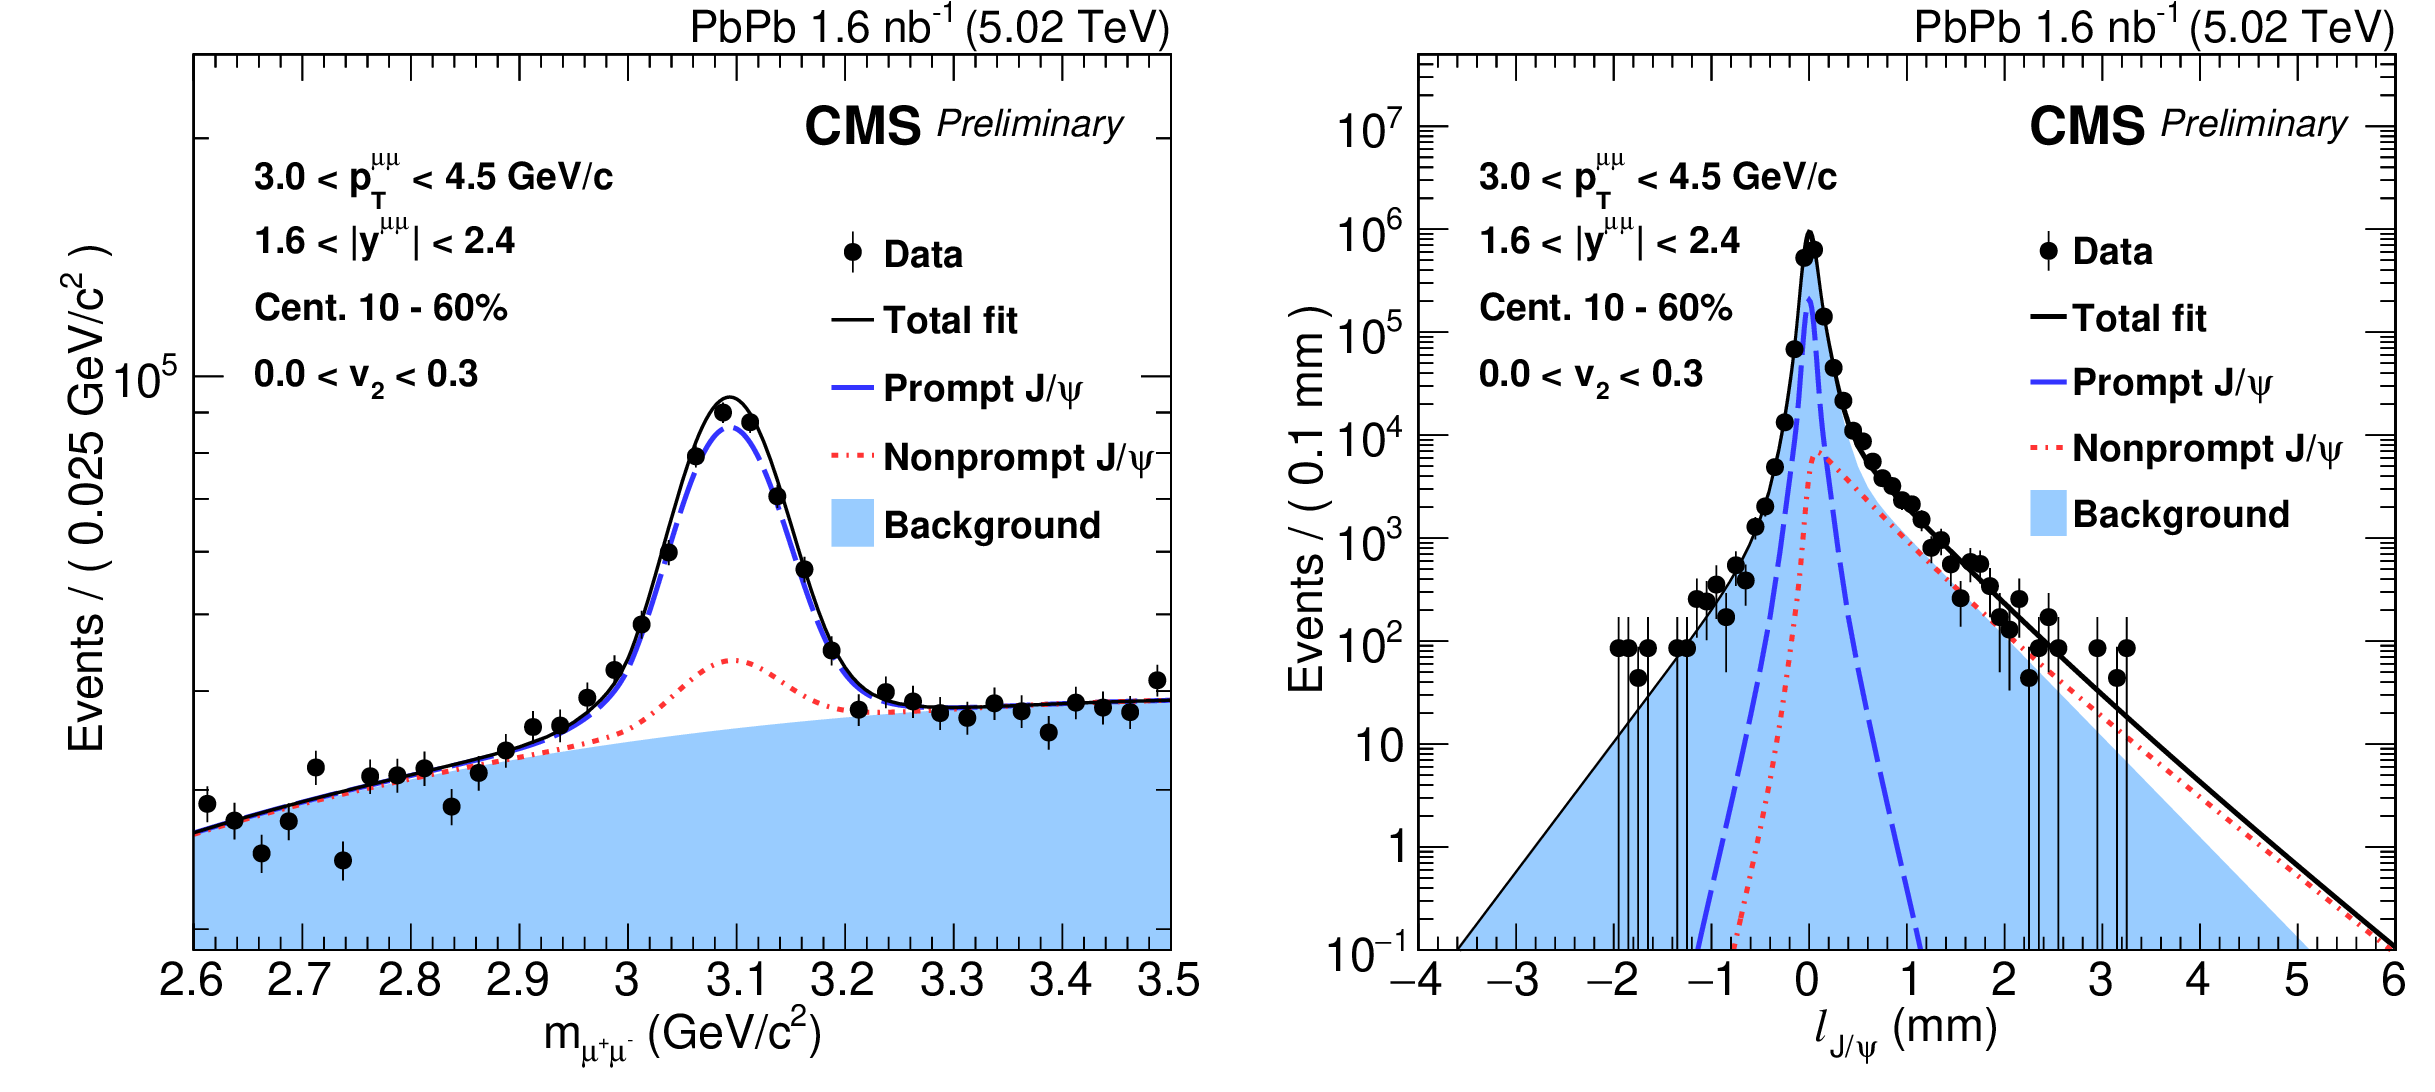
Figure 1:
Invariant mass (left) and $\ell _{\mathrm{J}/\psi}$ (right) distributions for the bin of 3 $ < {p_{\mathrm {T}}} < $ 4.5 GeV/$c$ and 0 $ < v_{2} < $ 0.3 in centrality 10-60%. The solid lines represent the total fit while the dashed and dashed-dotted lines represent the prompt and nonprompt components, respectively. The background dimuons are described by the shaded boxes. |
png pdf |
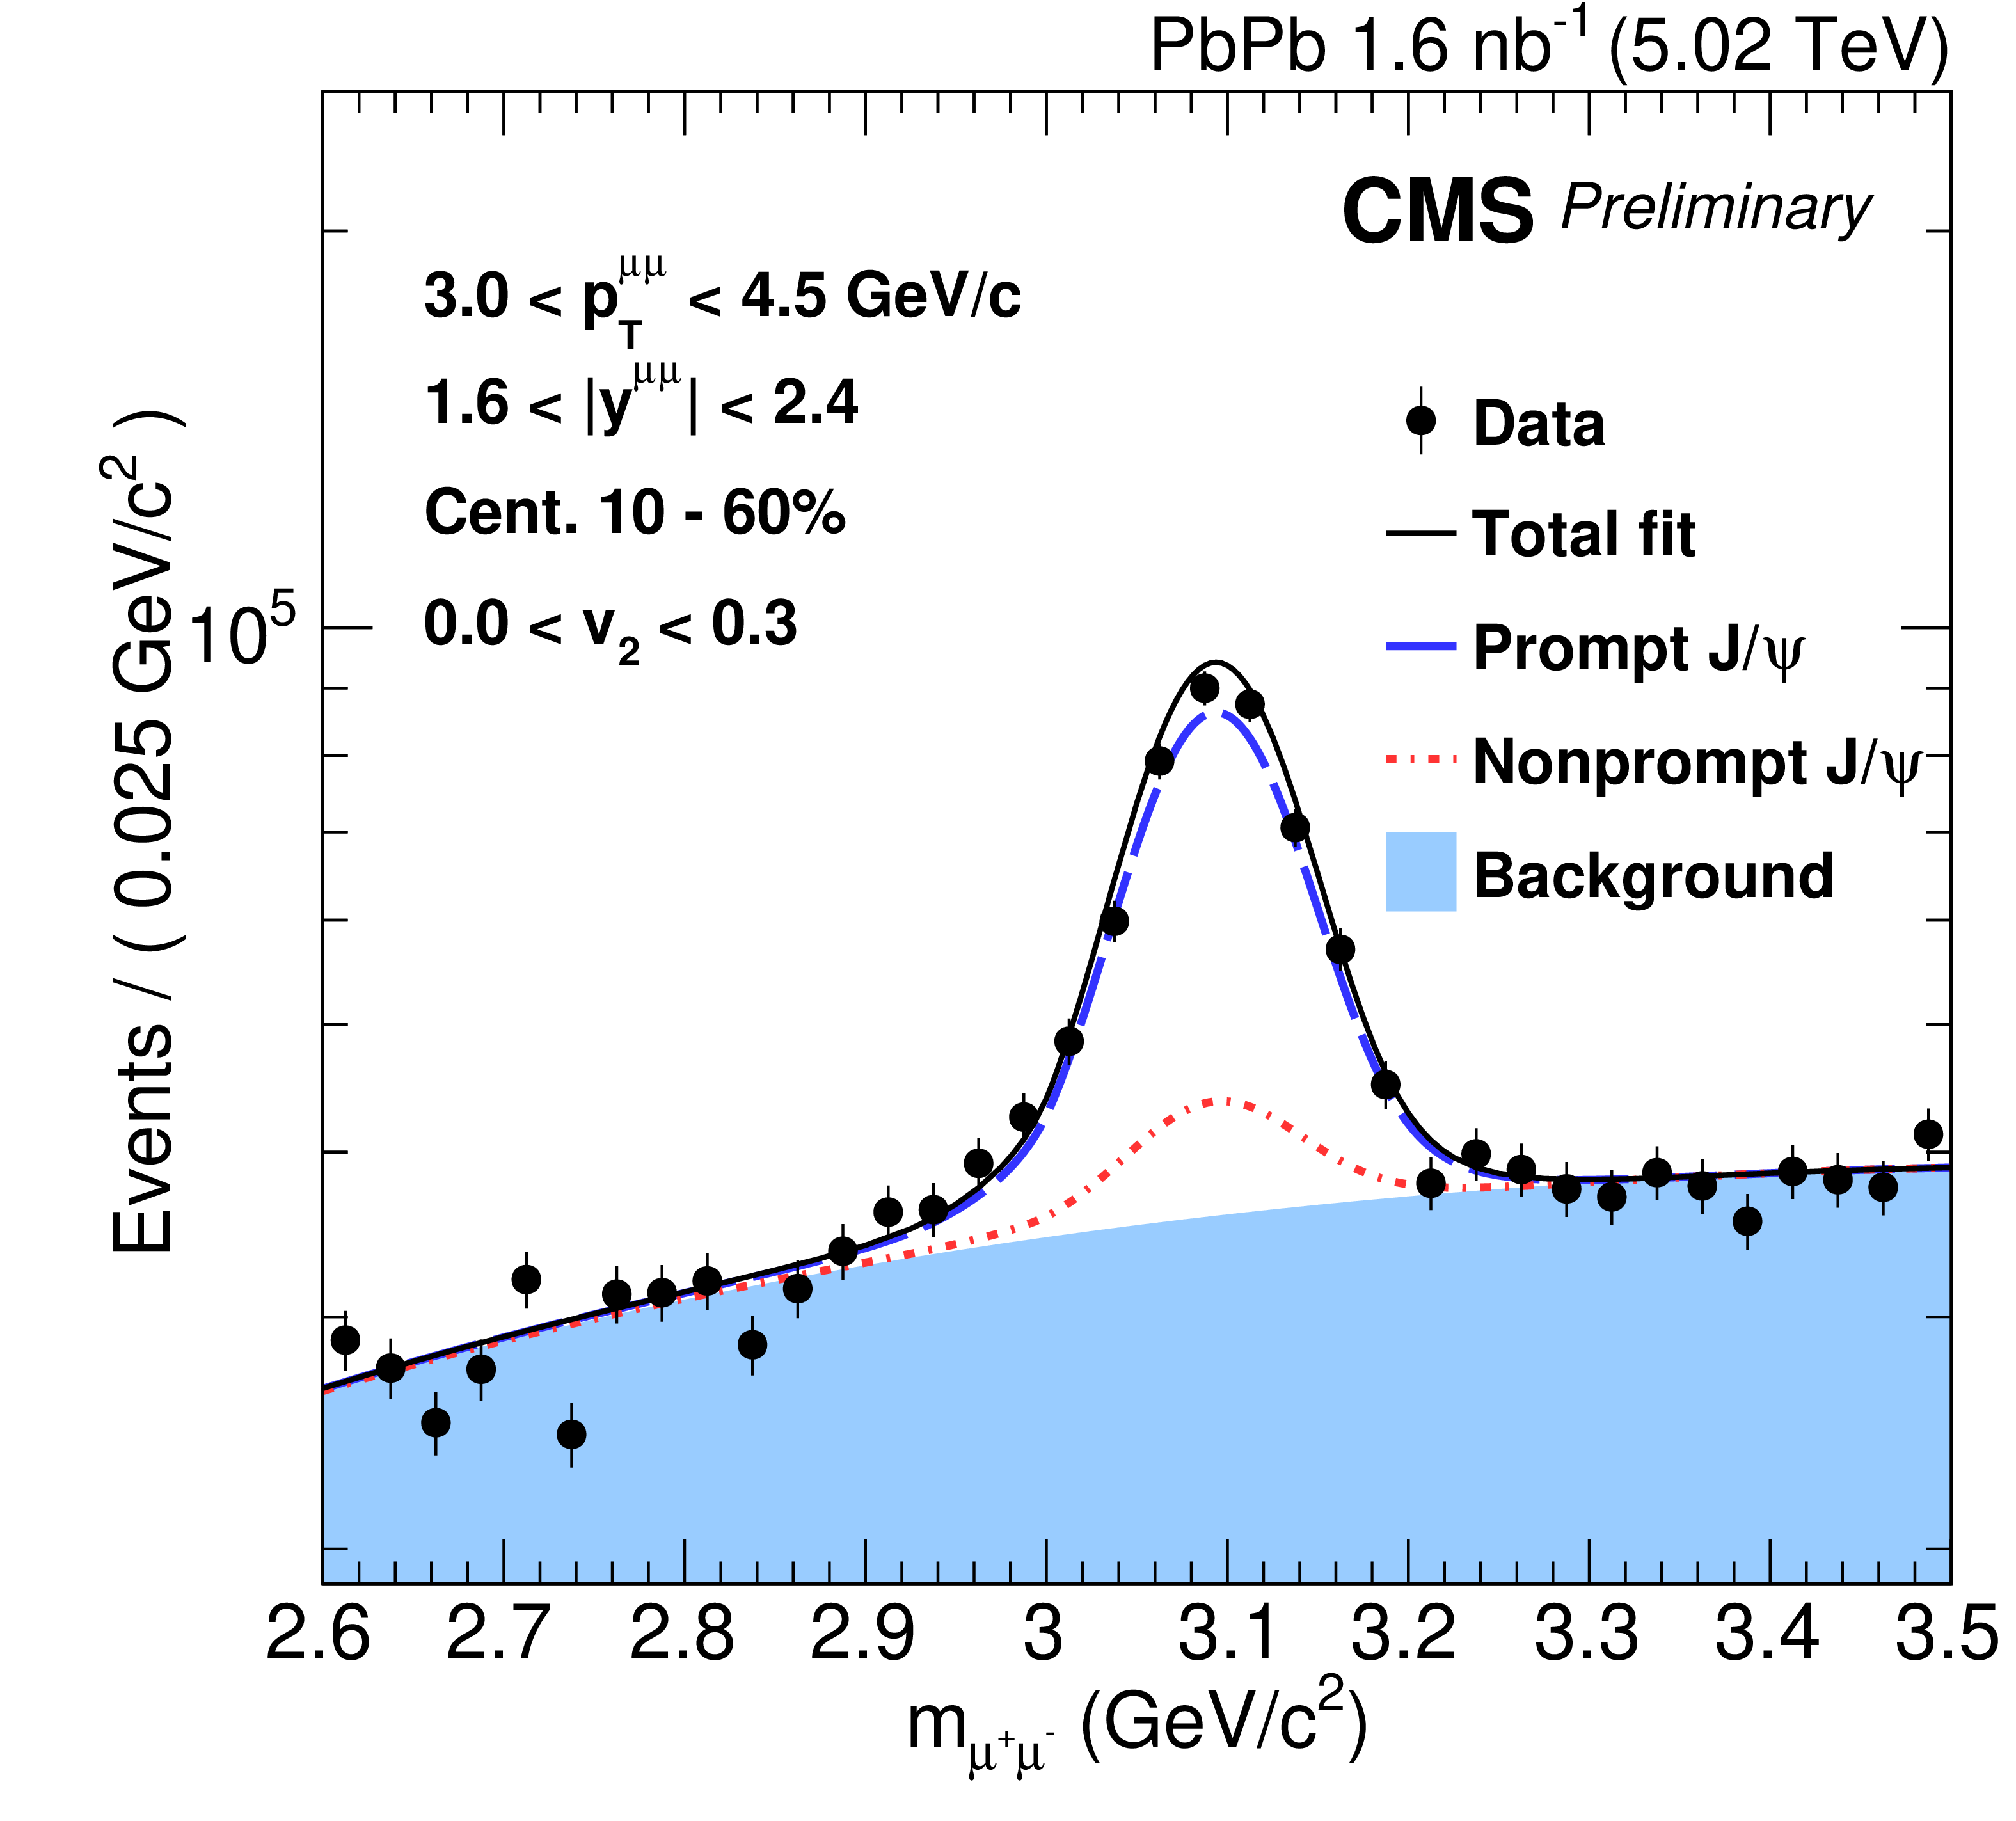
Figure 1-a:
Invariant mass (left) and $\ell _{\mathrm{J}/\psi}$ (right) distributions for the bin of 3 $ < {p_{\mathrm {T}}} < $ 4.5 GeV/$c$ and 0 $ < v_{2} < $ 0.3 in centrality 10-60%. The solid lines represent the total fit while the dashed and dashed-dotted lines represent the prompt and nonprompt components, respectively. The background dimuons are described by the shaded boxes. |
png pdf |
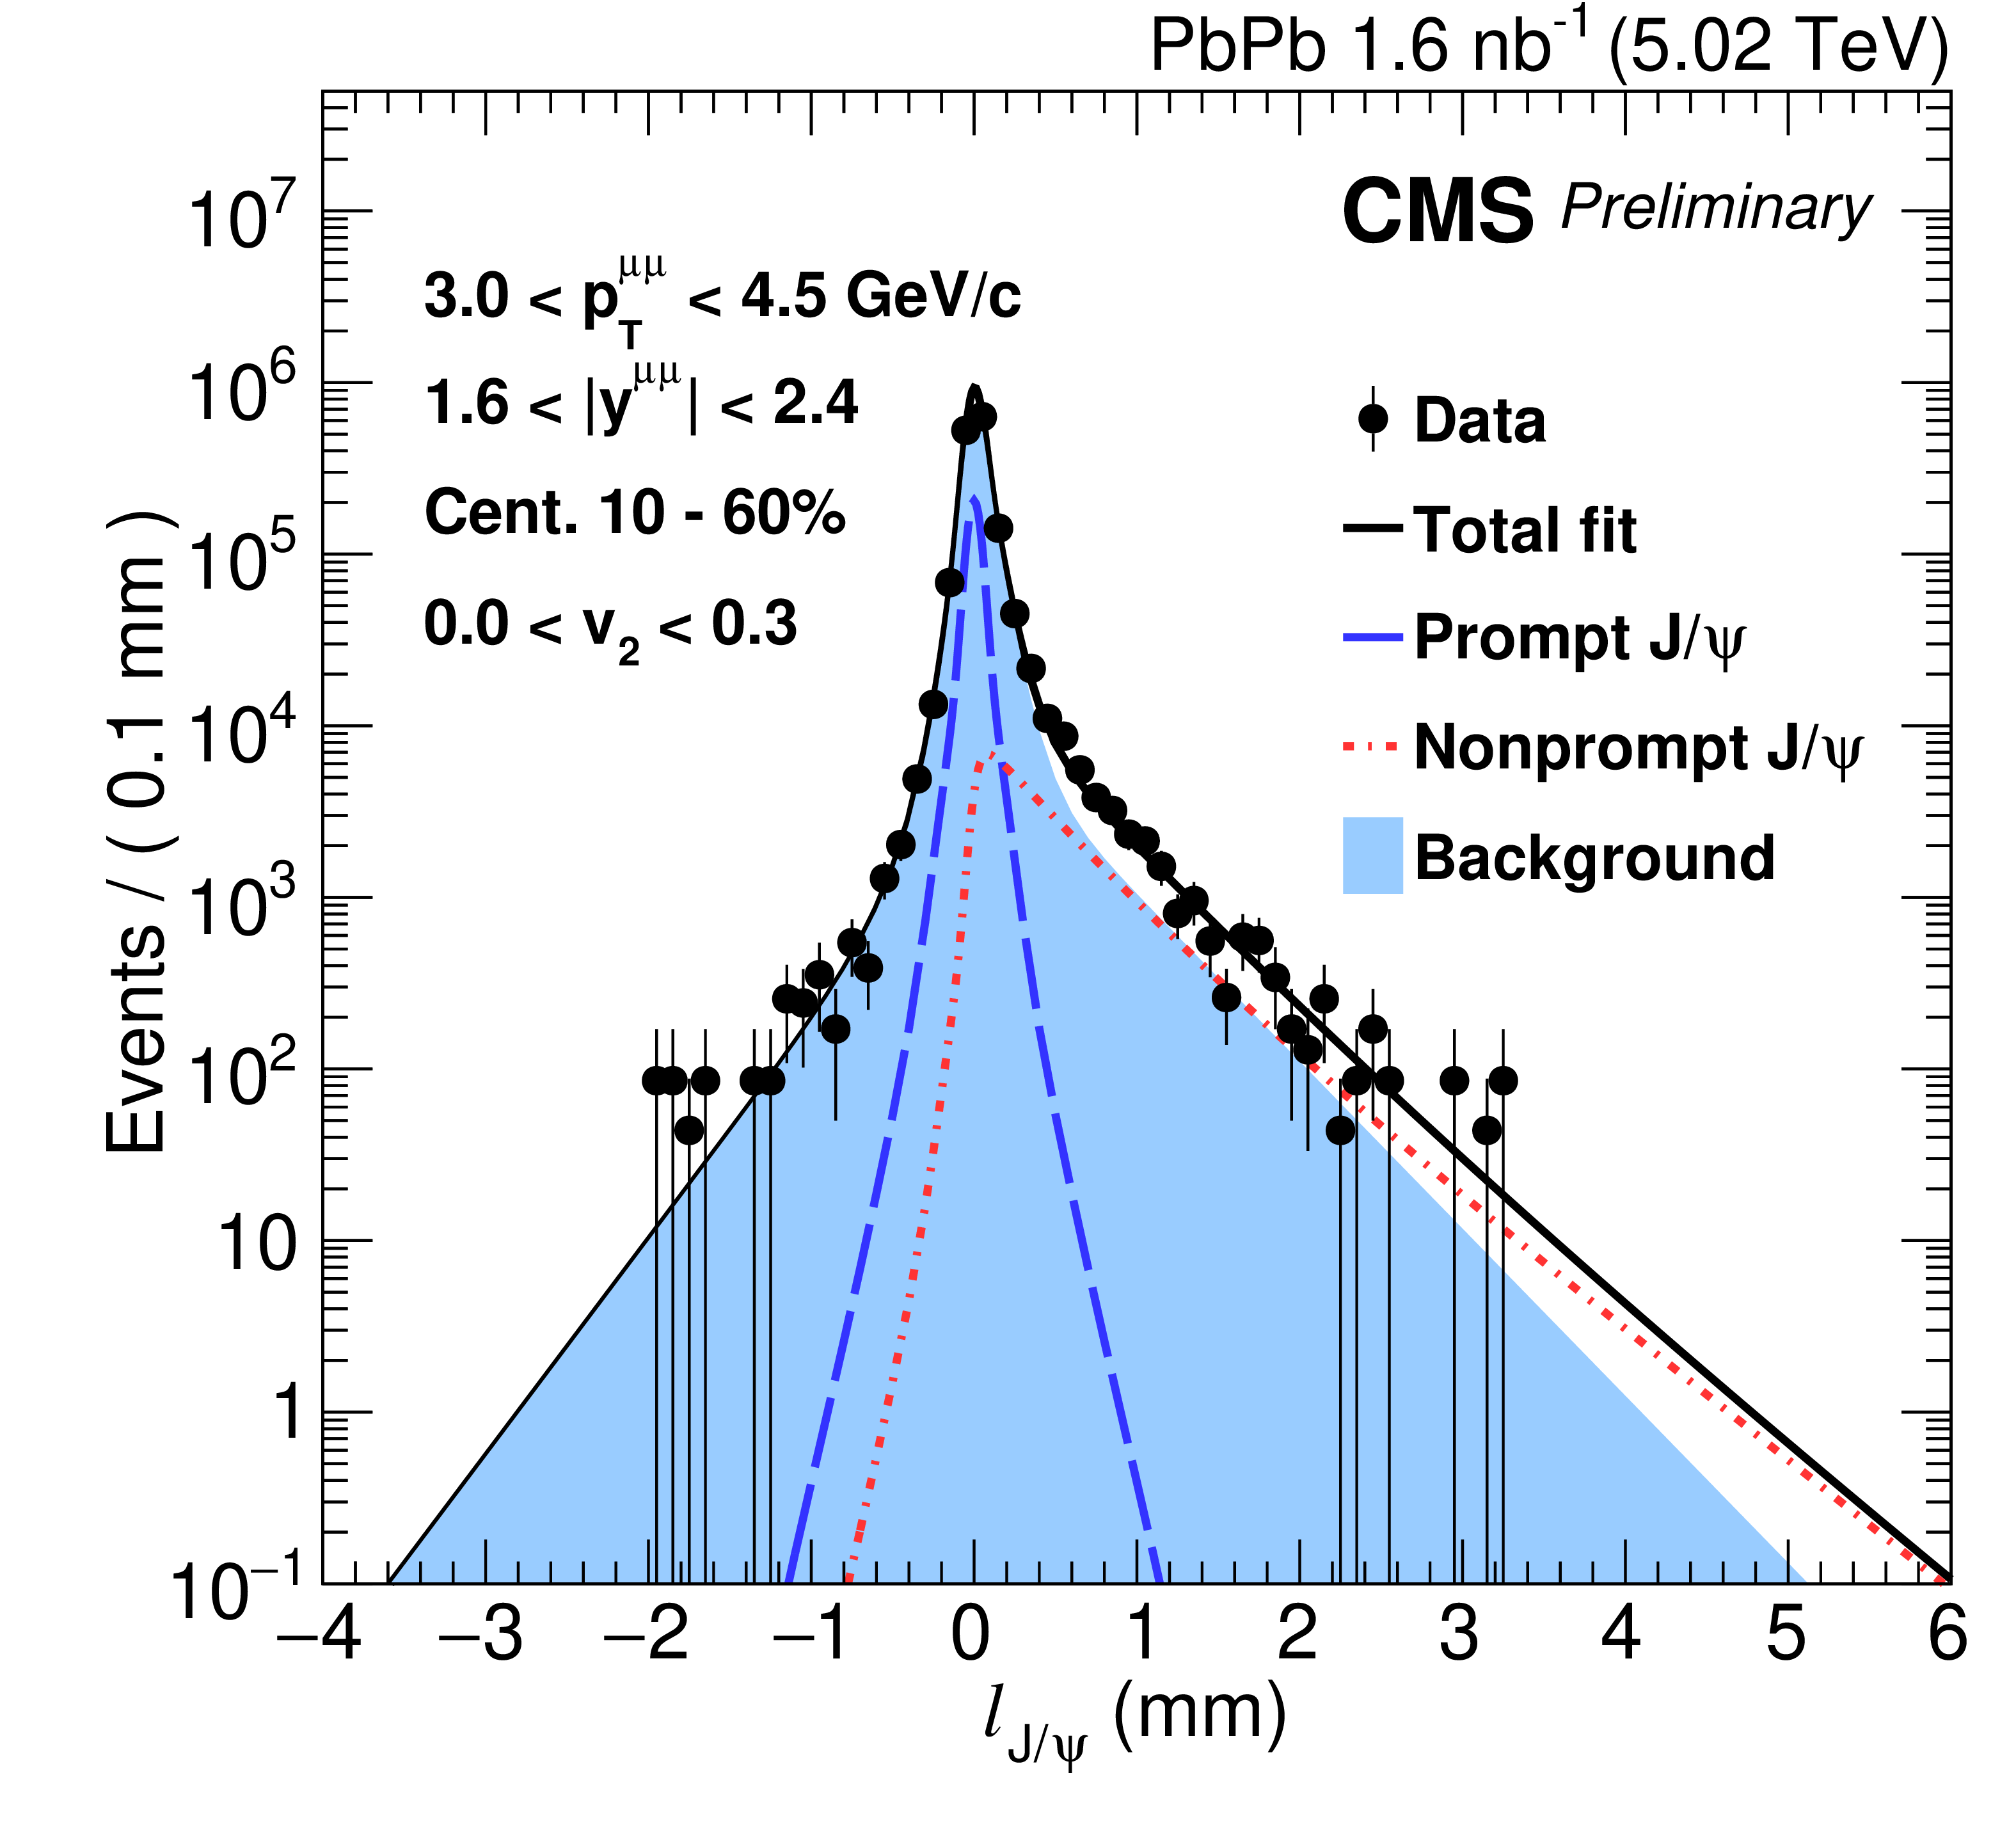
Figure 1-b:
Invariant mass (left) and $\ell _{\mathrm{J}/\psi}$ (right) distributions for the bin of 3 $ < {p_{\mathrm {T}}} < $ 4.5 GeV/$c$ and 0 $ < v_{2} < $ 0.3 in centrality 10-60%. The solid lines represent the total fit while the dashed and dashed-dotted lines represent the prompt and nonprompt components, respectively. The background dimuons are described by the shaded boxes. |

png pdf |
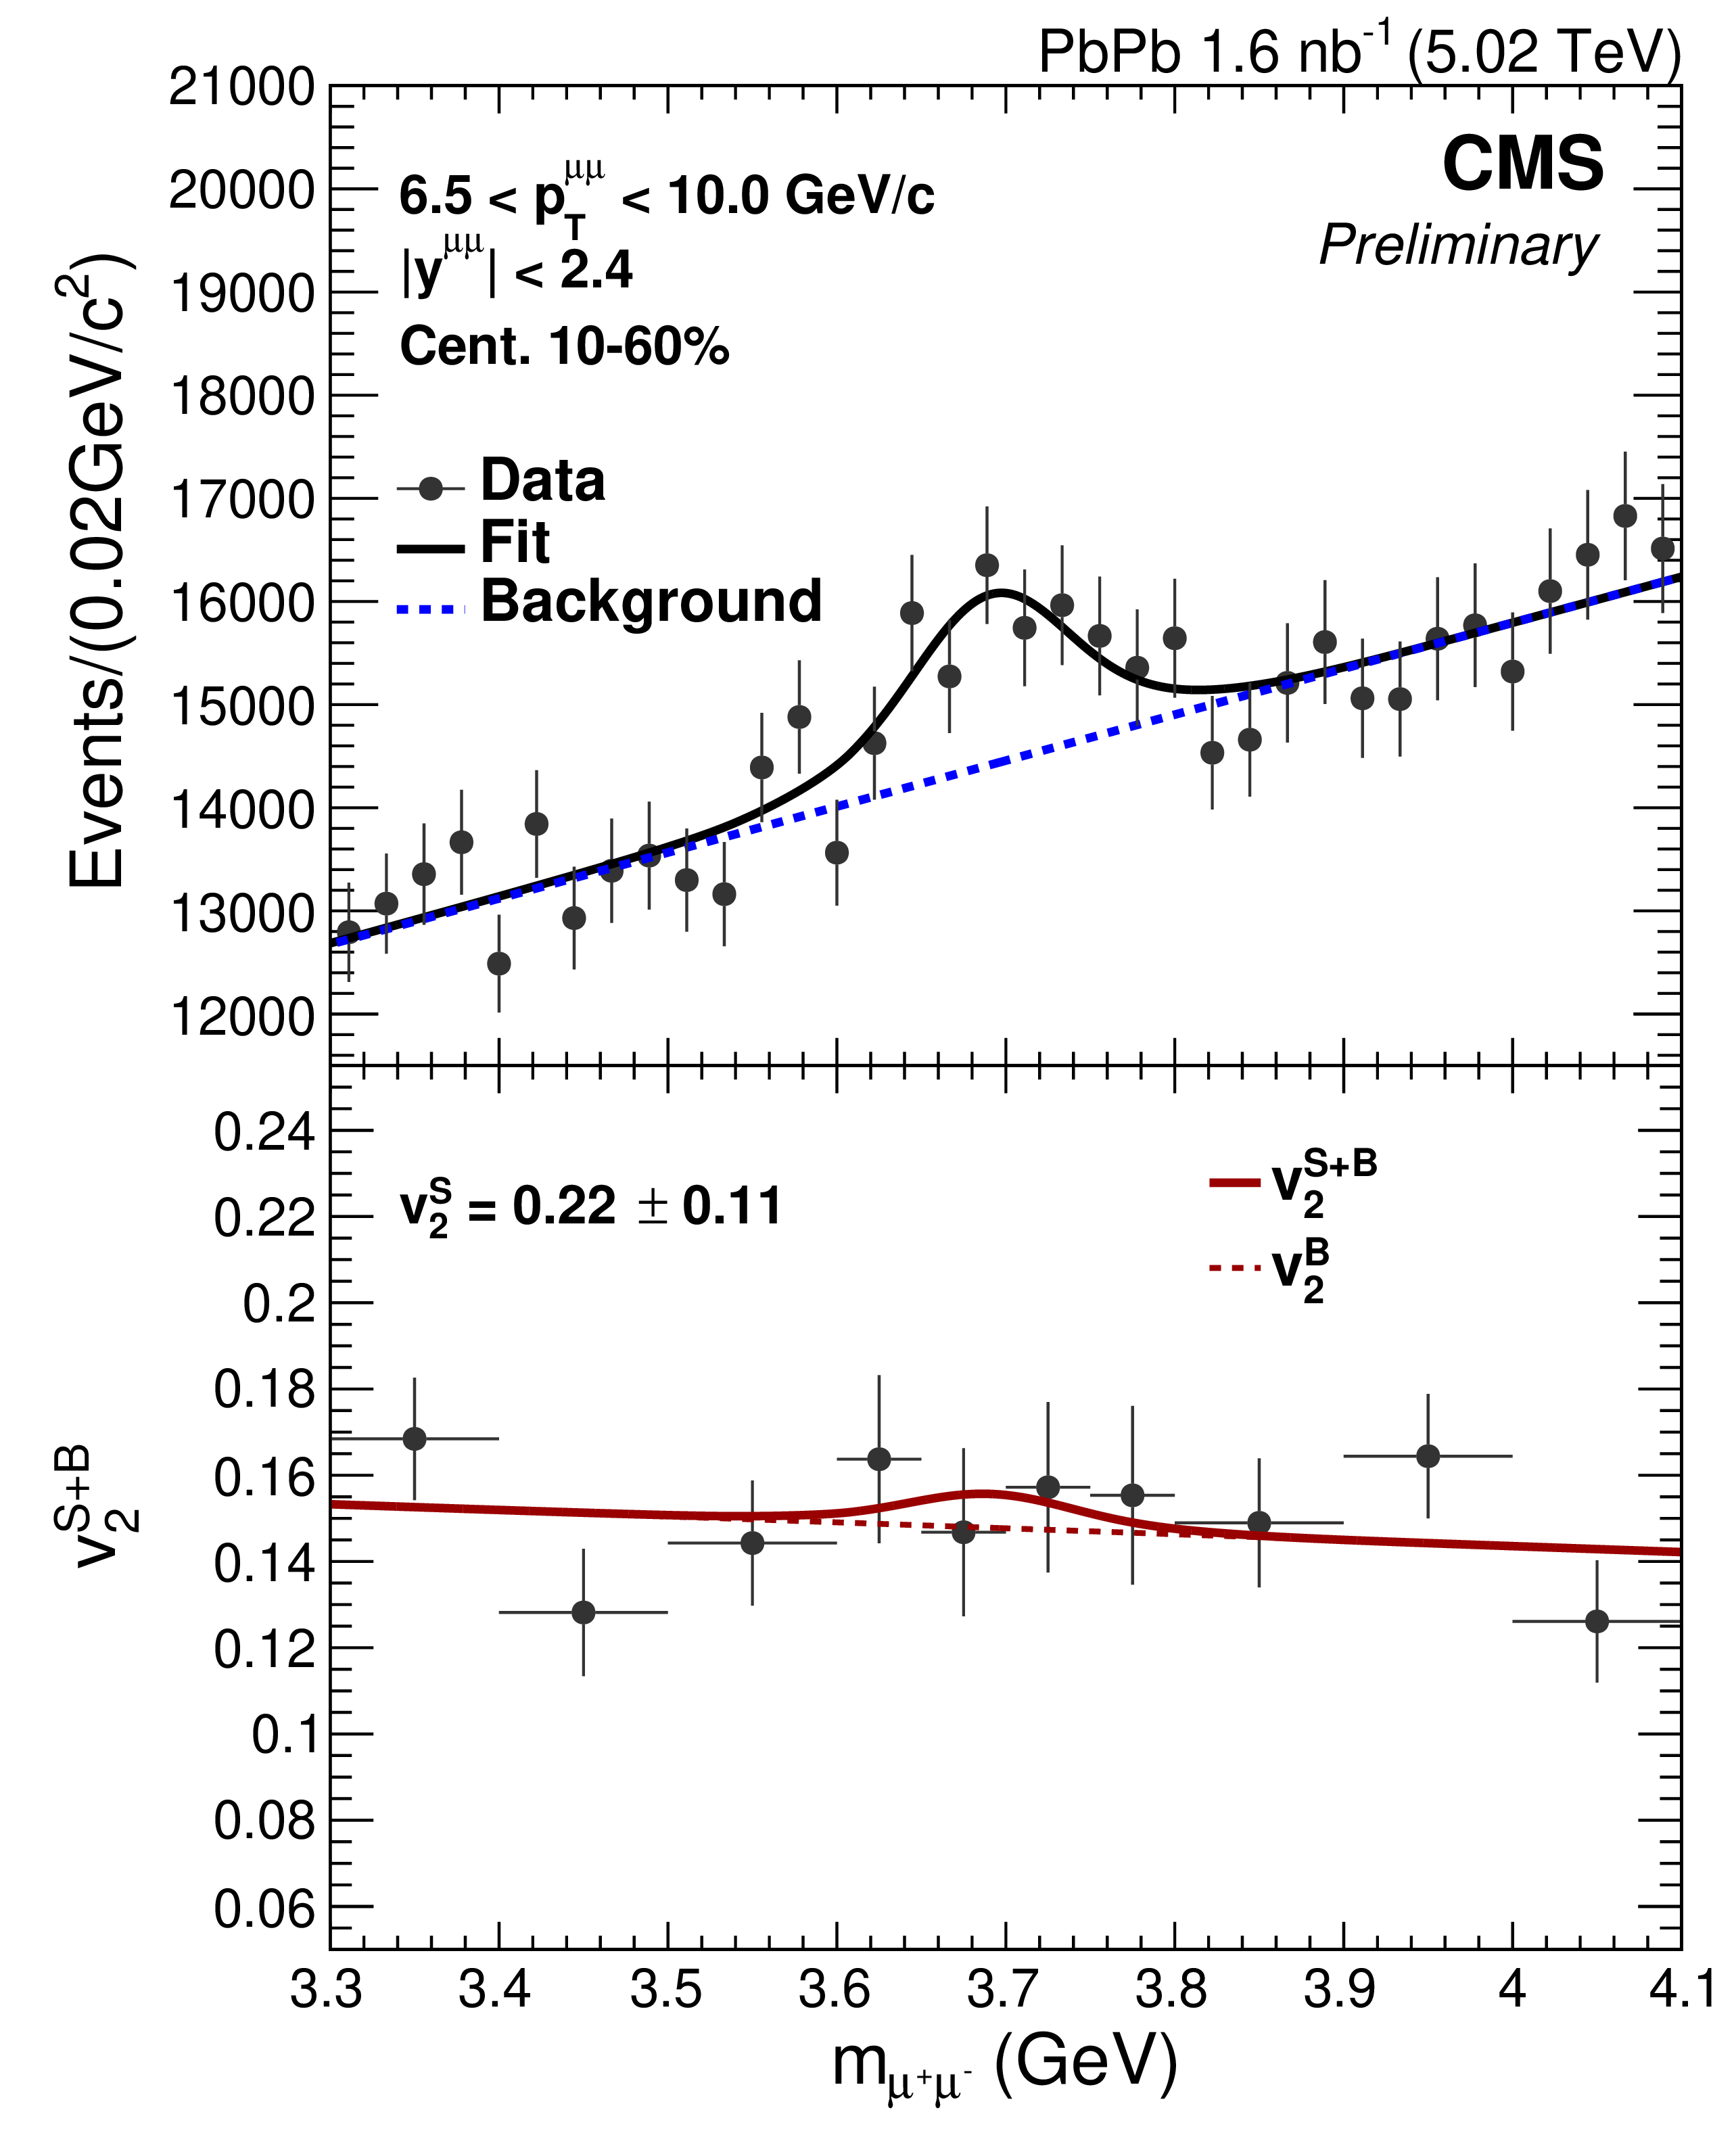
Figure 2:
Simultaneous fits of the dimuon invariant mass spectrum and the ${v_{2}} ^{S+B}$ (left) and $ {v_{3}} ^{S+B}$ (right) distributions for $\psi$(2S), as defined in Equation 4 for 6.5 $ < {p_{\mathrm {T}}} < $ 10 GeV/$c$ and centrality 10-60%. In the top panel, the solid (signal + background) and dashed (background only) blue lines show the result of the mass fit. In the bottom panel, the vertical lines of the $v^{s}_{n}$ points represent the statistical uncertainty. The solid ($v_{n}$ signal) and dashed ($v_{n}$ background) lines indicate the corresponding fit to the $v_{n}$ distributions. |
png pdf |
Figure 2-a:
Simultaneous fits of the dimuon invariant mass spectrum and the ${v_{2}} ^{S+B}$ (left) and $ {v_{3}} ^{S+B}$ (right) distributions for $\psi$(2S), as defined in Equation 4 for 6.5 $ < {p_{\mathrm {T}}} < $ 10 GeV/$c$ and centrality 10-60%. In the top panel, the solid (signal + background) and dashed (background only) blue lines show the result of the mass fit. In the bottom panel, the vertical lines of the $v^{s}_{n}$ points represent the statistical uncertainty. The solid ($v_{n}$ signal) and dashed ($v_{n}$ background) lines indicate the corresponding fit to the $v_{n}$ distributions. |

png pdf |
Figure 2-b:
Simultaneous fits of the dimuon invariant mass spectrum and the ${v_{2}} ^{S+B}$ (left) and $ {v_{3}} ^{S+B}$ (right) distributions for $\psi$(2S), as defined in Equation 4 for 6.5 $ < {p_{\mathrm {T}}} < $ 10 GeV/$c$ and centrality 10-60%. In the top panel, the solid (signal + background) and dashed (background only) blue lines show the result of the mass fit. In the bottom panel, the vertical lines of the $v^{s}_{n}$ points represent the statistical uncertainty. The solid ($v_{n}$ signal) and dashed ($v_{n}$ background) lines indicate the corresponding fit to the $v_{n}$ distributions. |
png pdf |
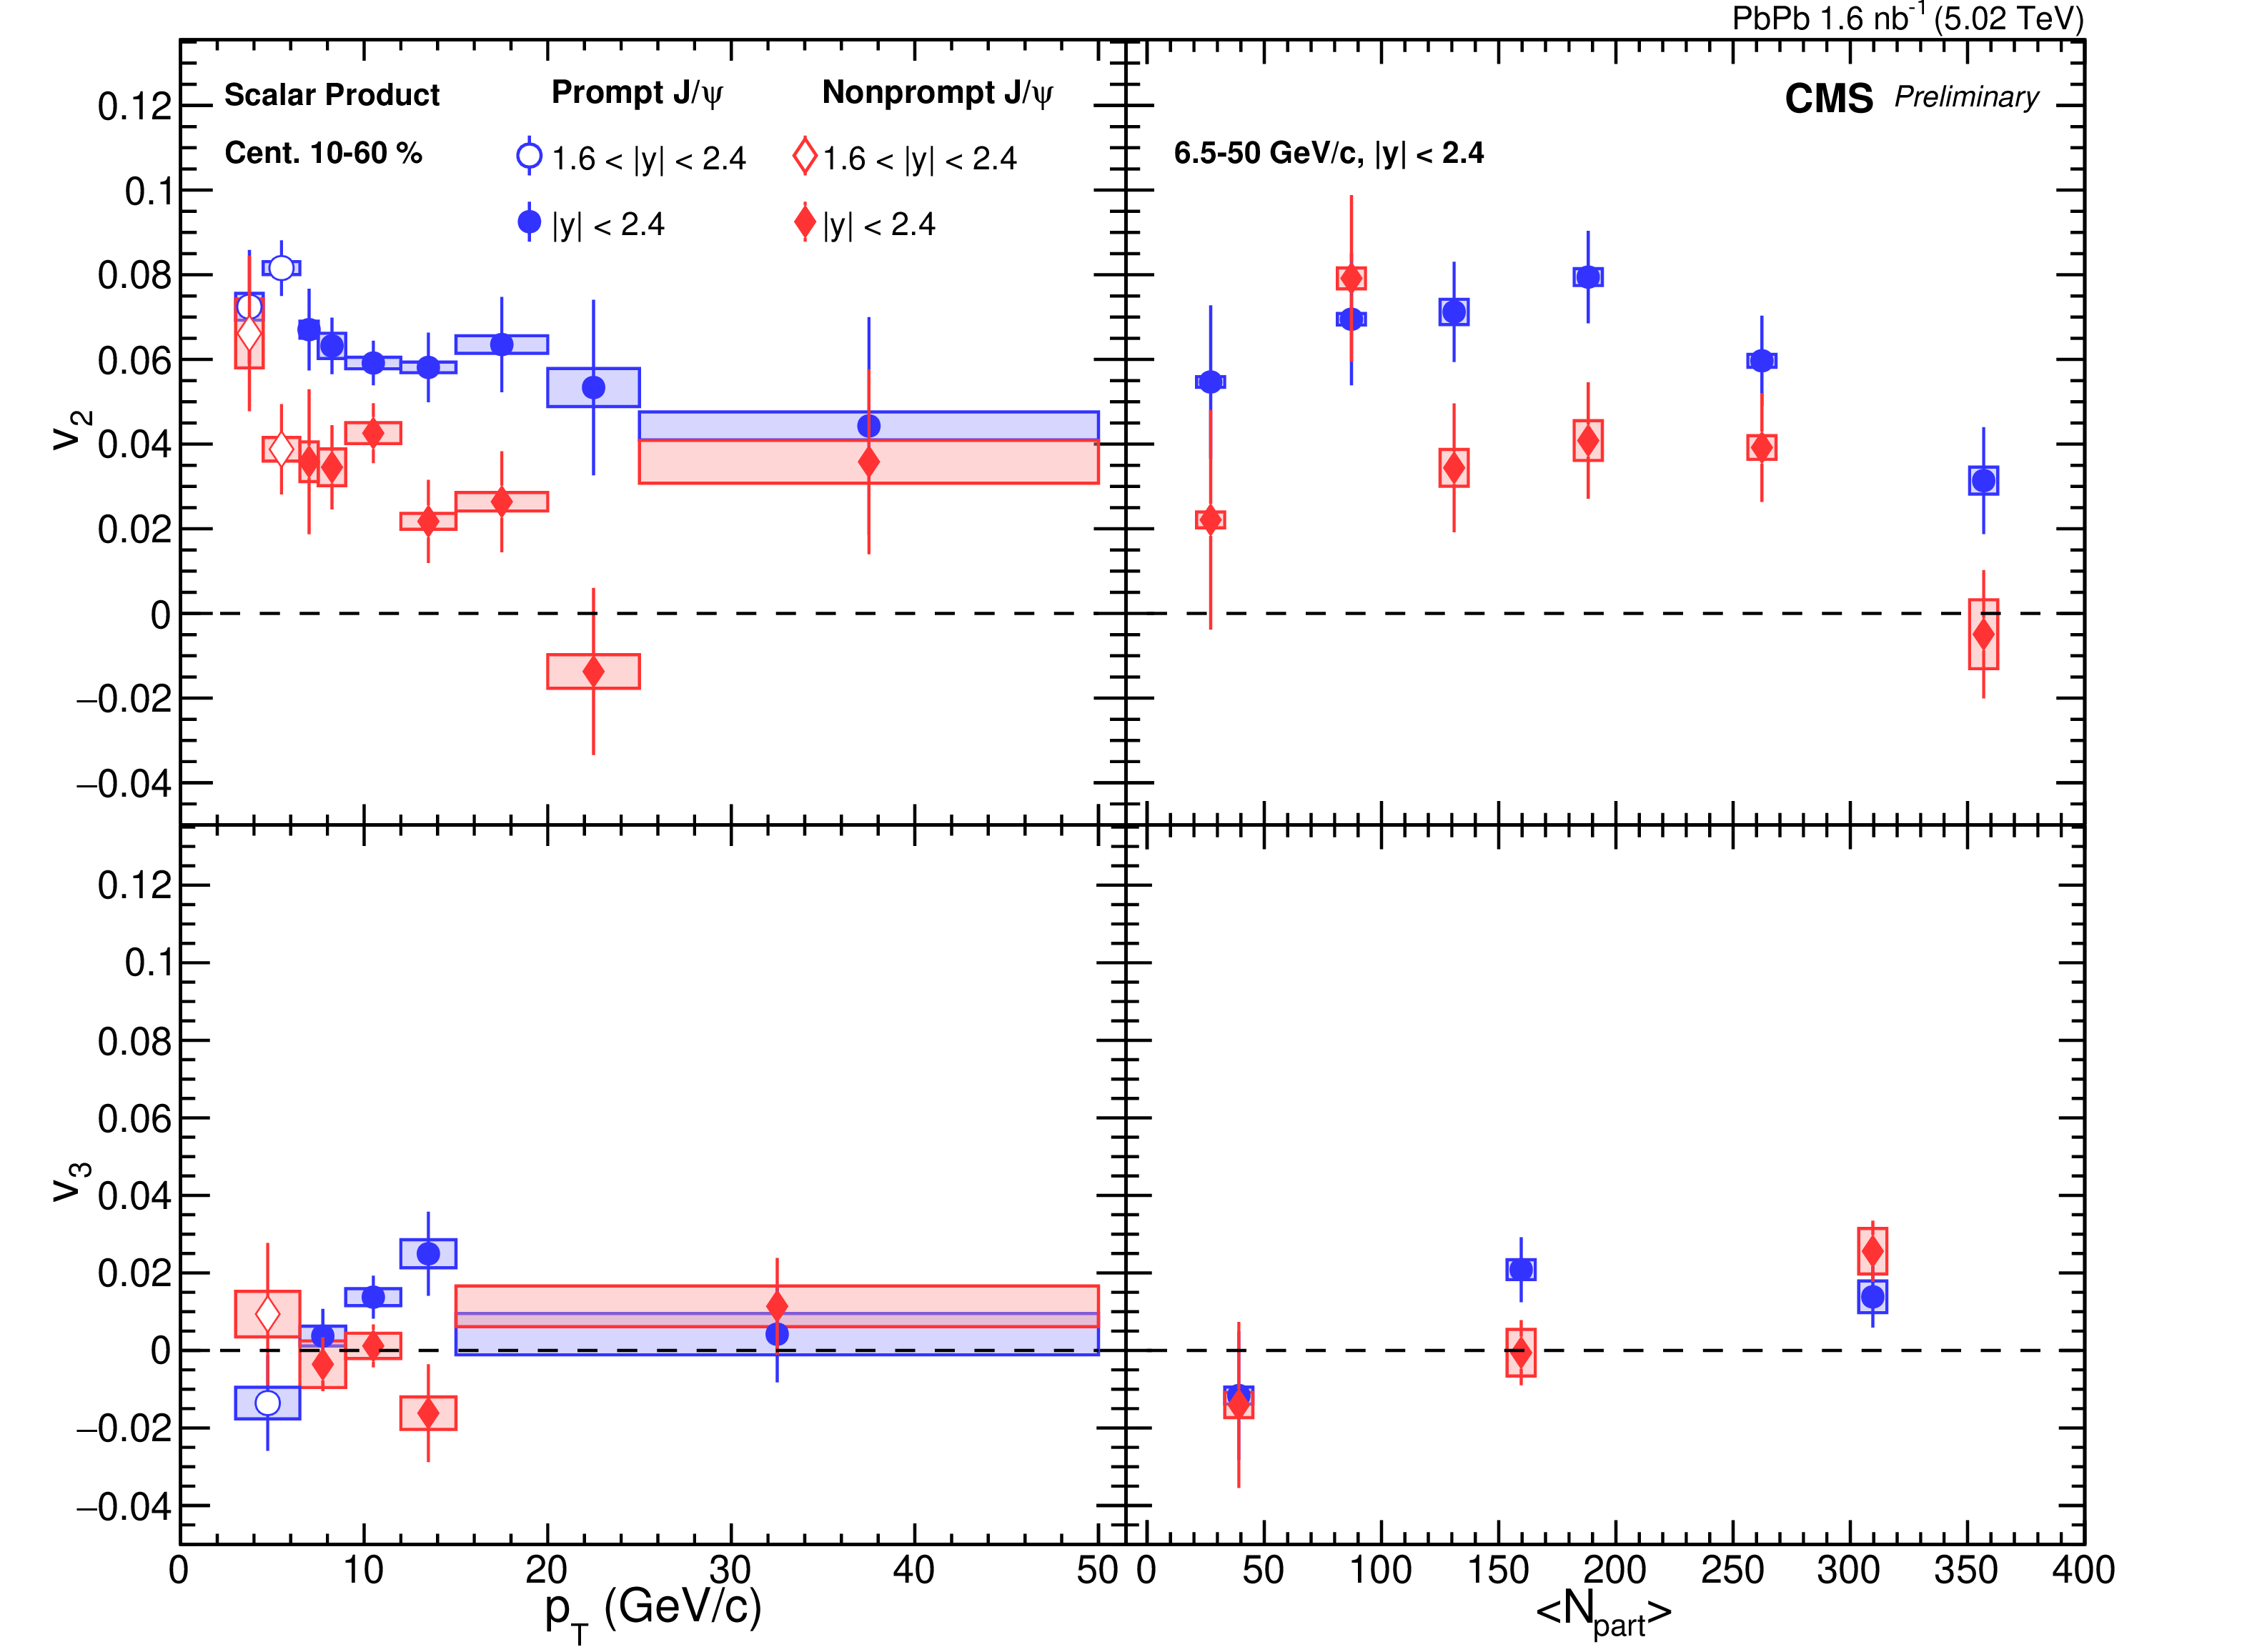
Figure 3:
$v_{2}$ (top) and $v_{3}$ (bottom) values as a function of ${p_{\mathrm {T}}}$ (left panel) and collision centrality (right panel) for prompt and nonprompt J/$\psi$ mesons. The results for ${p_{\mathrm {T}}}$ 3-6.5 and 6.5-50 GeV/$c$ are studied in the rapidity range of 1.6 $ < {| y |} < $ 2.4 and $ {| y |} < $ 2.4, respectively (left panel). The ${p_{\mathrm {T}}}$ range for the right panel is ${p_{\mathrm {T}}}$ 6.5-50 GeV/$c$ and rapidity of $ {| y |} < $ 2.4. The vertical bars denote the statistical uncertainties, and the rectangular bands show the systematic uncertainties. |
png pdf |
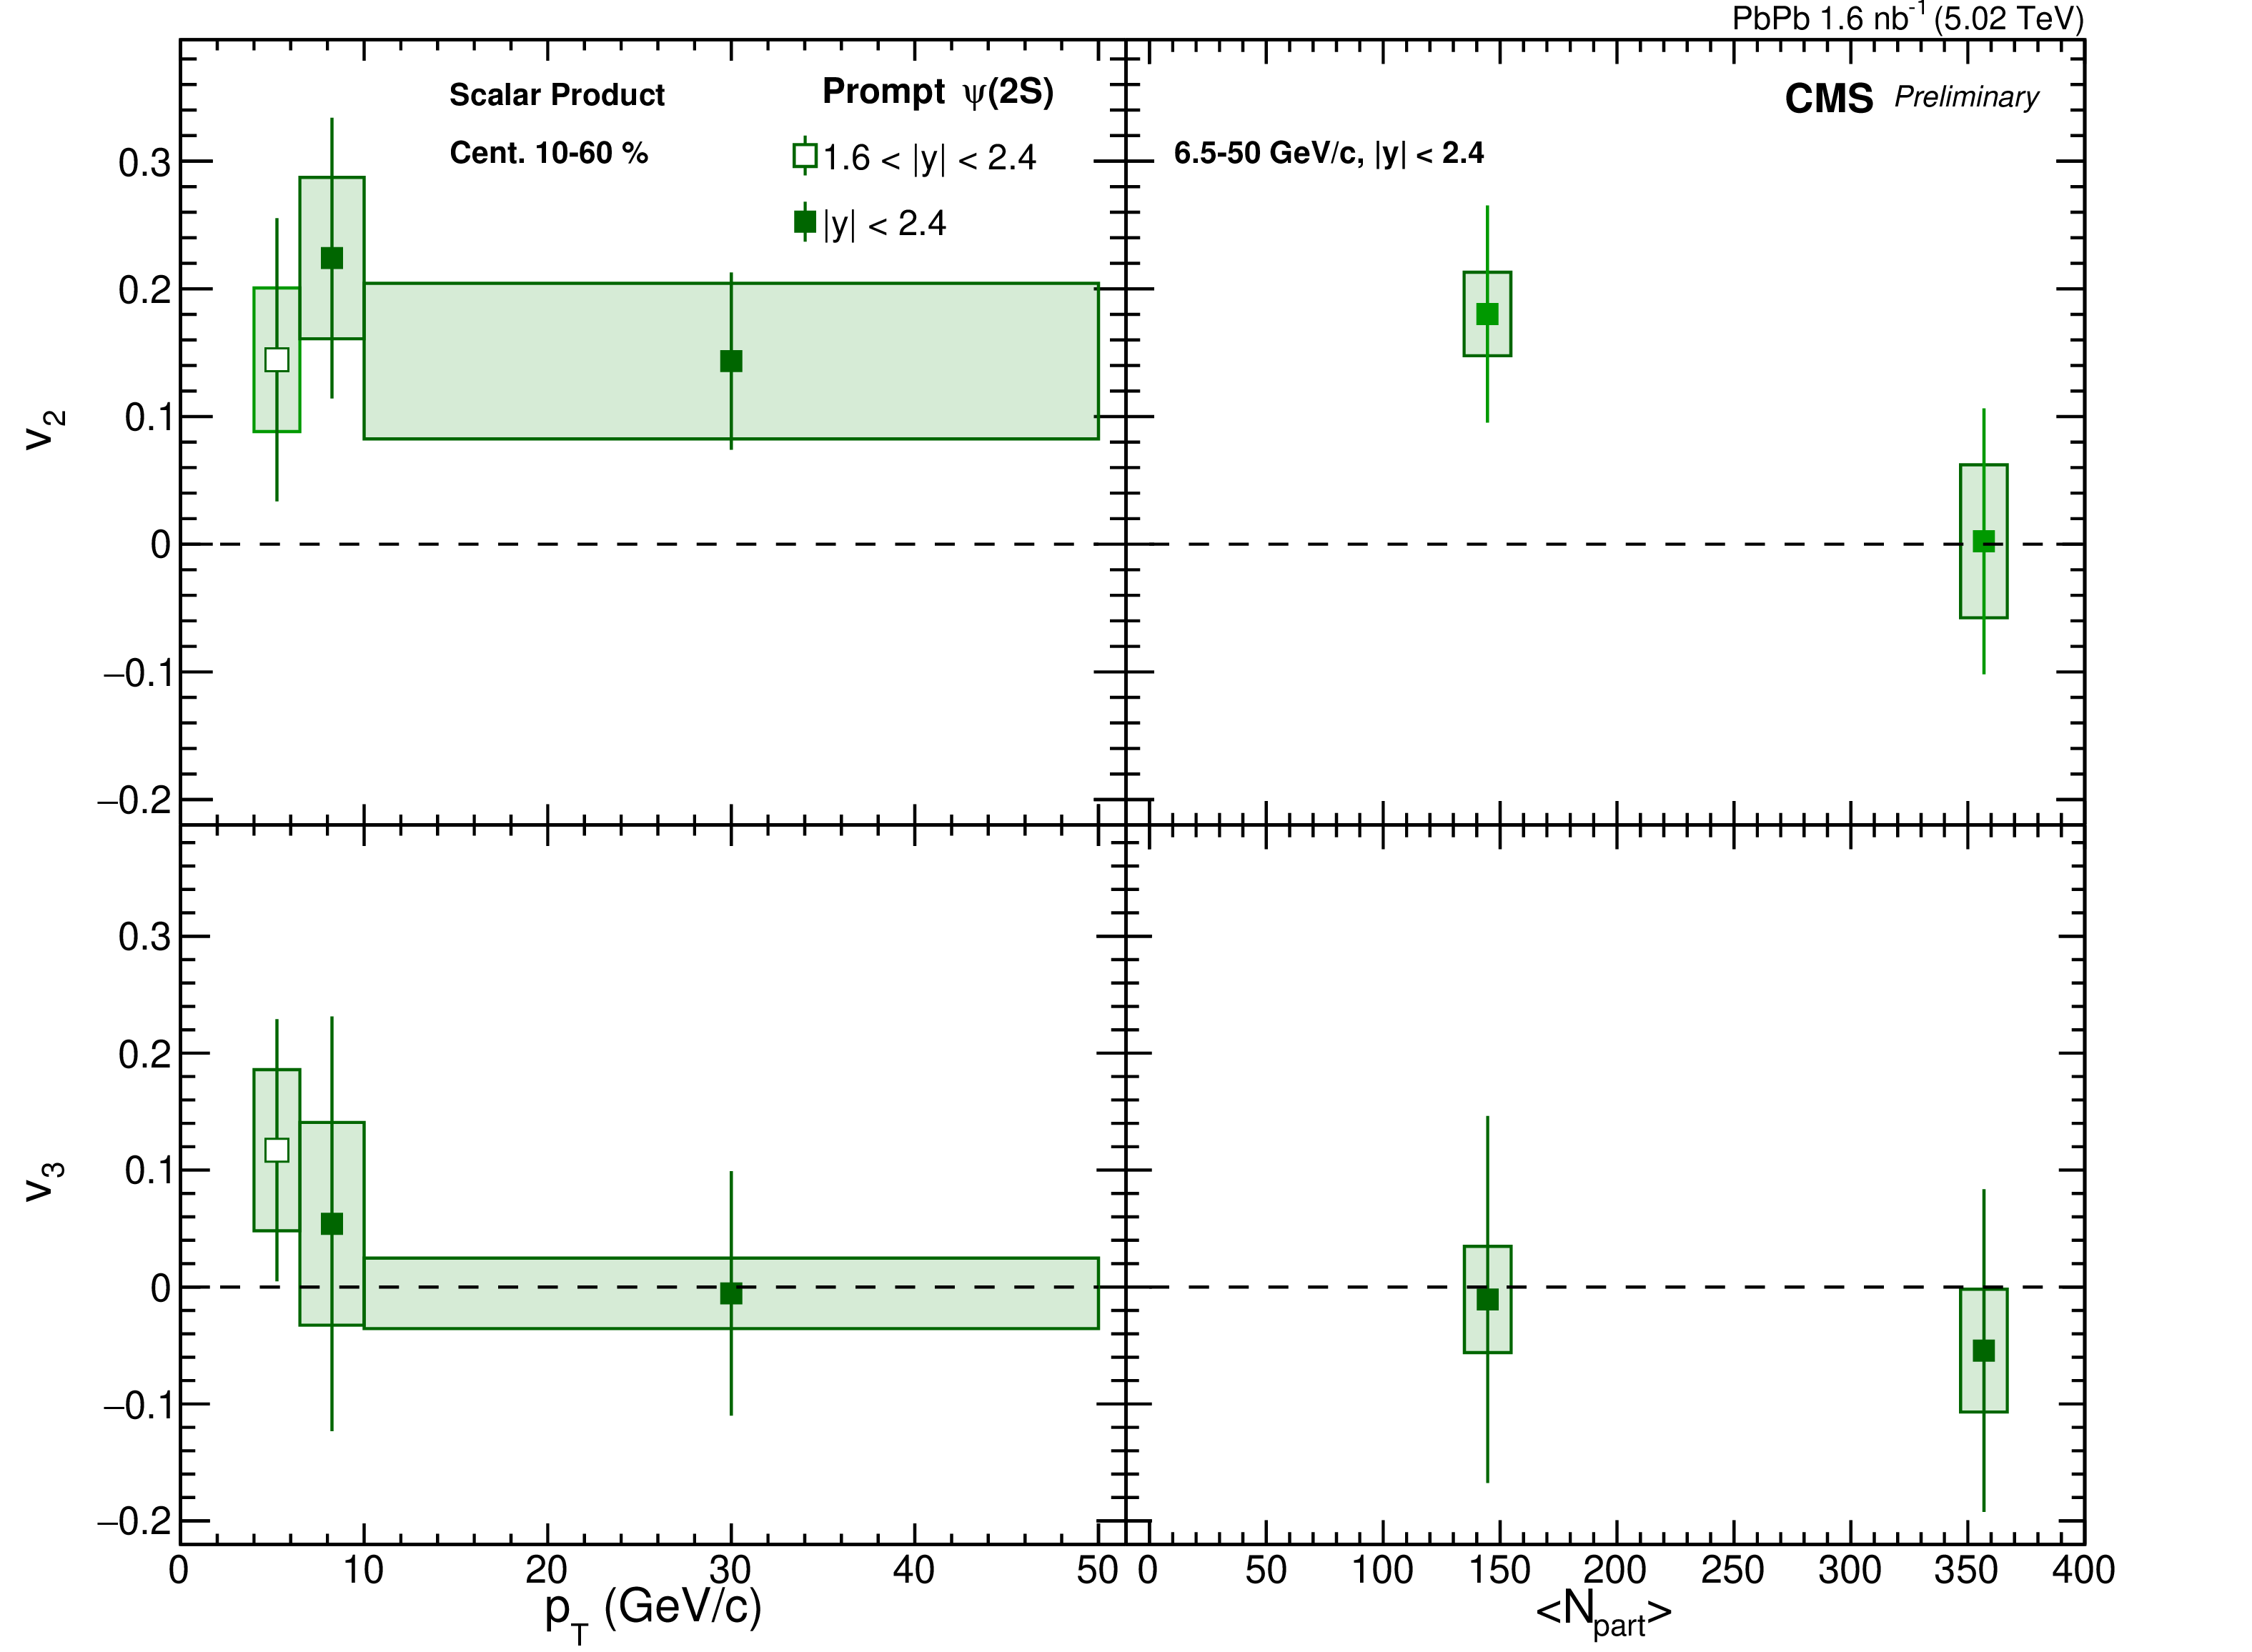
Figure 4:
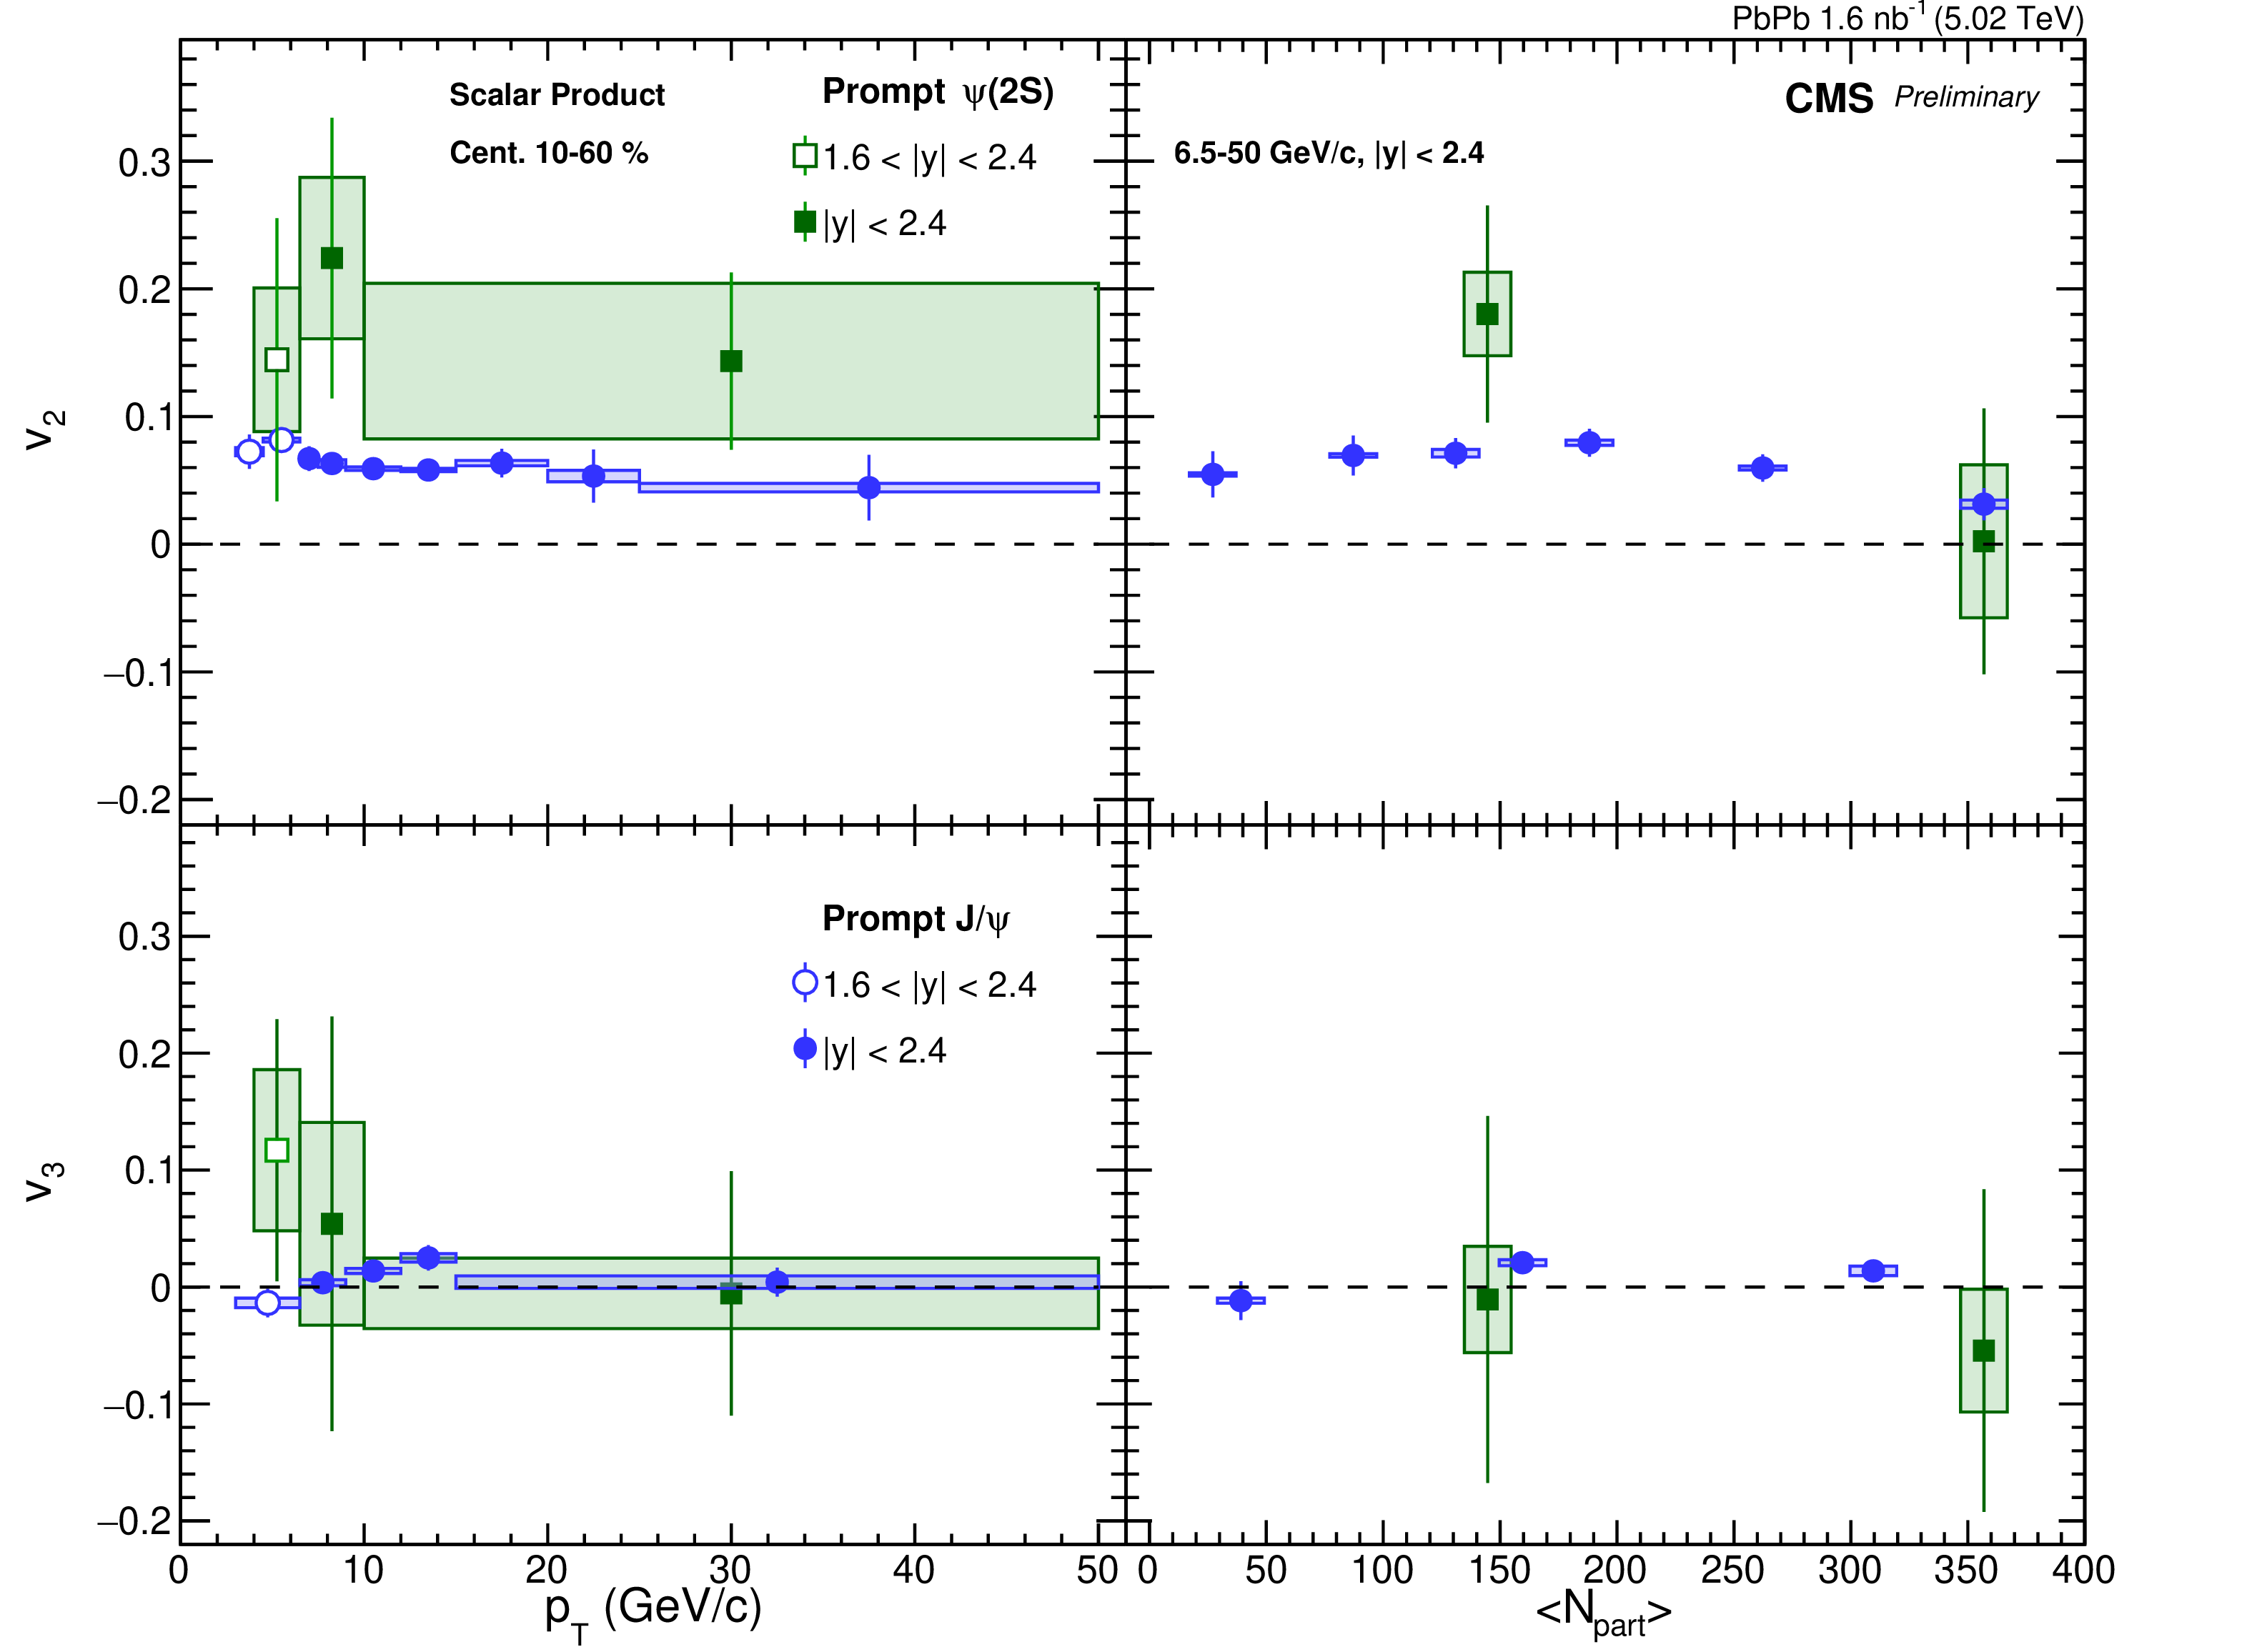
$v_{2}$ (top) and $v_{3}$ (bottom) values as a function of ${p_{\mathrm {T}}}$ (left panel) and $N_{part}$ (right panel) for prompt $\psi$(2S) mesons. The results for ${p_{\mathrm {T}}}$ 4-6.5 and 6.5-50 GeV/$c$ are studied in the rapidity range of 1.6 $ < {| y |} < $ 2.4 and $ {| y |} < $ 2.4, respectively (left panel). The ${p_{\mathrm {T}}}$ range for the right panel is ${p_{\mathrm {T}}}$ 6.5-50 GeV/$c$ and rapidity of $ {| y |} < $ 2.4. The vertical bars denote the statistical uncertainties, and the rectangular bands show the systematic uncertainties. |
| Tables | |
png pdf |
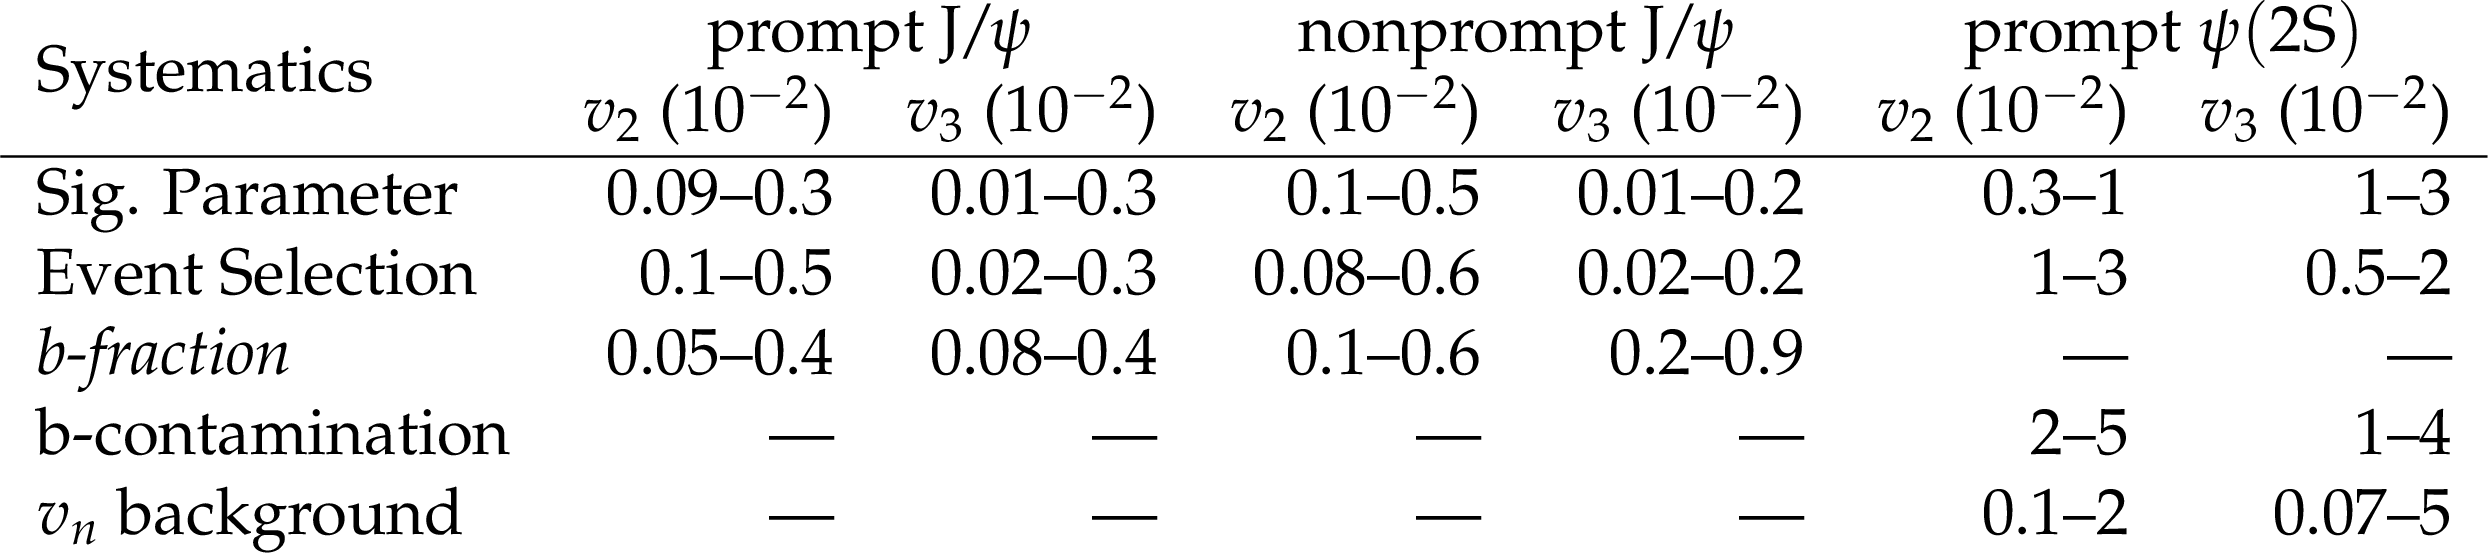
Table 1:
Summary of dominant systematic uncertainties |
| Summary |
| The second-order ($v_{2}$) and third-order ($v_{3}$) Fourier coefficients of the azimuthal distributions for prompt and nonprompt J/$\psi$ mesons and prompt $\psi$(2S) mesons are measured in PbPb collisions as functions of ${p_{\mathrm{T}}}$ and PbPb collision centrality. The $v_{2}$ values for prompt and nonprompt J/$\psi$ mesons both indicate a decreasing trend from mid-central towards central collision events. On the other hand, the $v_{2}$ is found to be flat for ${p_{\mathrm{T}}} > $ 9 GeV/$c$ for prompt J/$\psi$ mesons while the dependence on ${p_{\mathrm{T}}}$ is found to be weak for nonprompt J/$\psi$ mesons. The prompt J/$\psi$ $v_{2}$ values are found to be larger than that of nonprompt J/$\psi$ throughout studied kinematic region, suggesting different in-medium effects for charm and beauty quarks. The observation of sizable and flattened $v_{2}$ values at high-${p_{\mathrm{T}}}$ for prompt J/$\psi$ mesons provides a hint of the contribution of jet quenching for prompt J/$\psi$ suppression. The $v_{3}$ values of prompt and nonprompt J/$\psi$ are reported for the first time, where the results show consistency with zero in the measured ${p_{\mathrm{T}}}$ and centrality intervals. Also, the $v_{2}$ and $v_{3}$ values for prompt $\psi$(2S) mesons are measured for the first time. The results show larger $v_{2}$ values than J/$\psi$ mesons in mid-${p_{\mathrm{T}}}$ region, indicating different degrees of recombination contribution for J/$\psi$ and $\psi$(2S) mesons. The measured $v_{3}$ values for both J/$\psi$ and $\psi$(2S) are found to be consistent to zero within uncertainties in the overall kinematic range. These measurements provide a new insight in the understanding of the dynamics and in-medium effects of charmonia in heavy ion collisions. |
| Additional Figures | |

png pdf |
Additional Figure 1:
$v_{2}$ values for the prompt J/$\psi$ mesons as a function of ${p_{\mathrm {T}}}$ in the 10-60% centrality range measured at $ {\sqrt {\smash [b]{s_{_{\mathrm {NN}}}}}} = $ 5.02 TeV (blue circles) and $ {\sqrt {\smash [b]{s_{_{\mathrm {NN}}}}}} = $ 2.76 TeV (black squares) [20]. Both results are shown in rapidity 1.6 $ < |y| < $ 2.4 (open markers) and $|y| < $ 2.4 (closed markers). The error bars and boxes represent the statistical and systematic uncertainties, respectively. |

png pdf |
Additional Figure 2:
$v_{2}$ values for the nonprompt J/$\psi$ mesons as a function of ${p_{\mathrm {T}}}$ in the 10-60% centrality range measured at $ {\sqrt {\smash [b]{s_{_{\mathrm {NN}}}}}} = $ 5.02 TeV (red diamonds) and $ {\sqrt {\smash [b]{s_{_{\mathrm {NN}}}}}} = $ 2.76 TeV (black squares) [20]. Both results are shown in rapidity 1.6 $ < |y| < $ 2.4 (open markers) and $|y| < $ 2.4 (closed markers). The error bars and boxes represent the statistical and systematic uncertainties, respectively. |

png pdf |
Additional Figure 3:
$v_{2}$ values for the prompt J/$\psi$ mesons measured with CMS (blue circles) and ATLAS (green squares) [19], and inclusive J/$\psi$ mesons with ALICE (pink crosses) [21] as a function of ${p_{\mathrm {T}}}$ at $ {\sqrt {\smash [b]{s_{_{\mathrm {NN}}}}}} = $ 5.02 TeV. CMS results are shown in rapidity 1.6 $ < |y| < $ 2.4 (open markers) and $|y| < $ 2.4 (closed markers). The error bars and boxes represent the statistical and systematic uncertainties, respectively. |
png pdf |
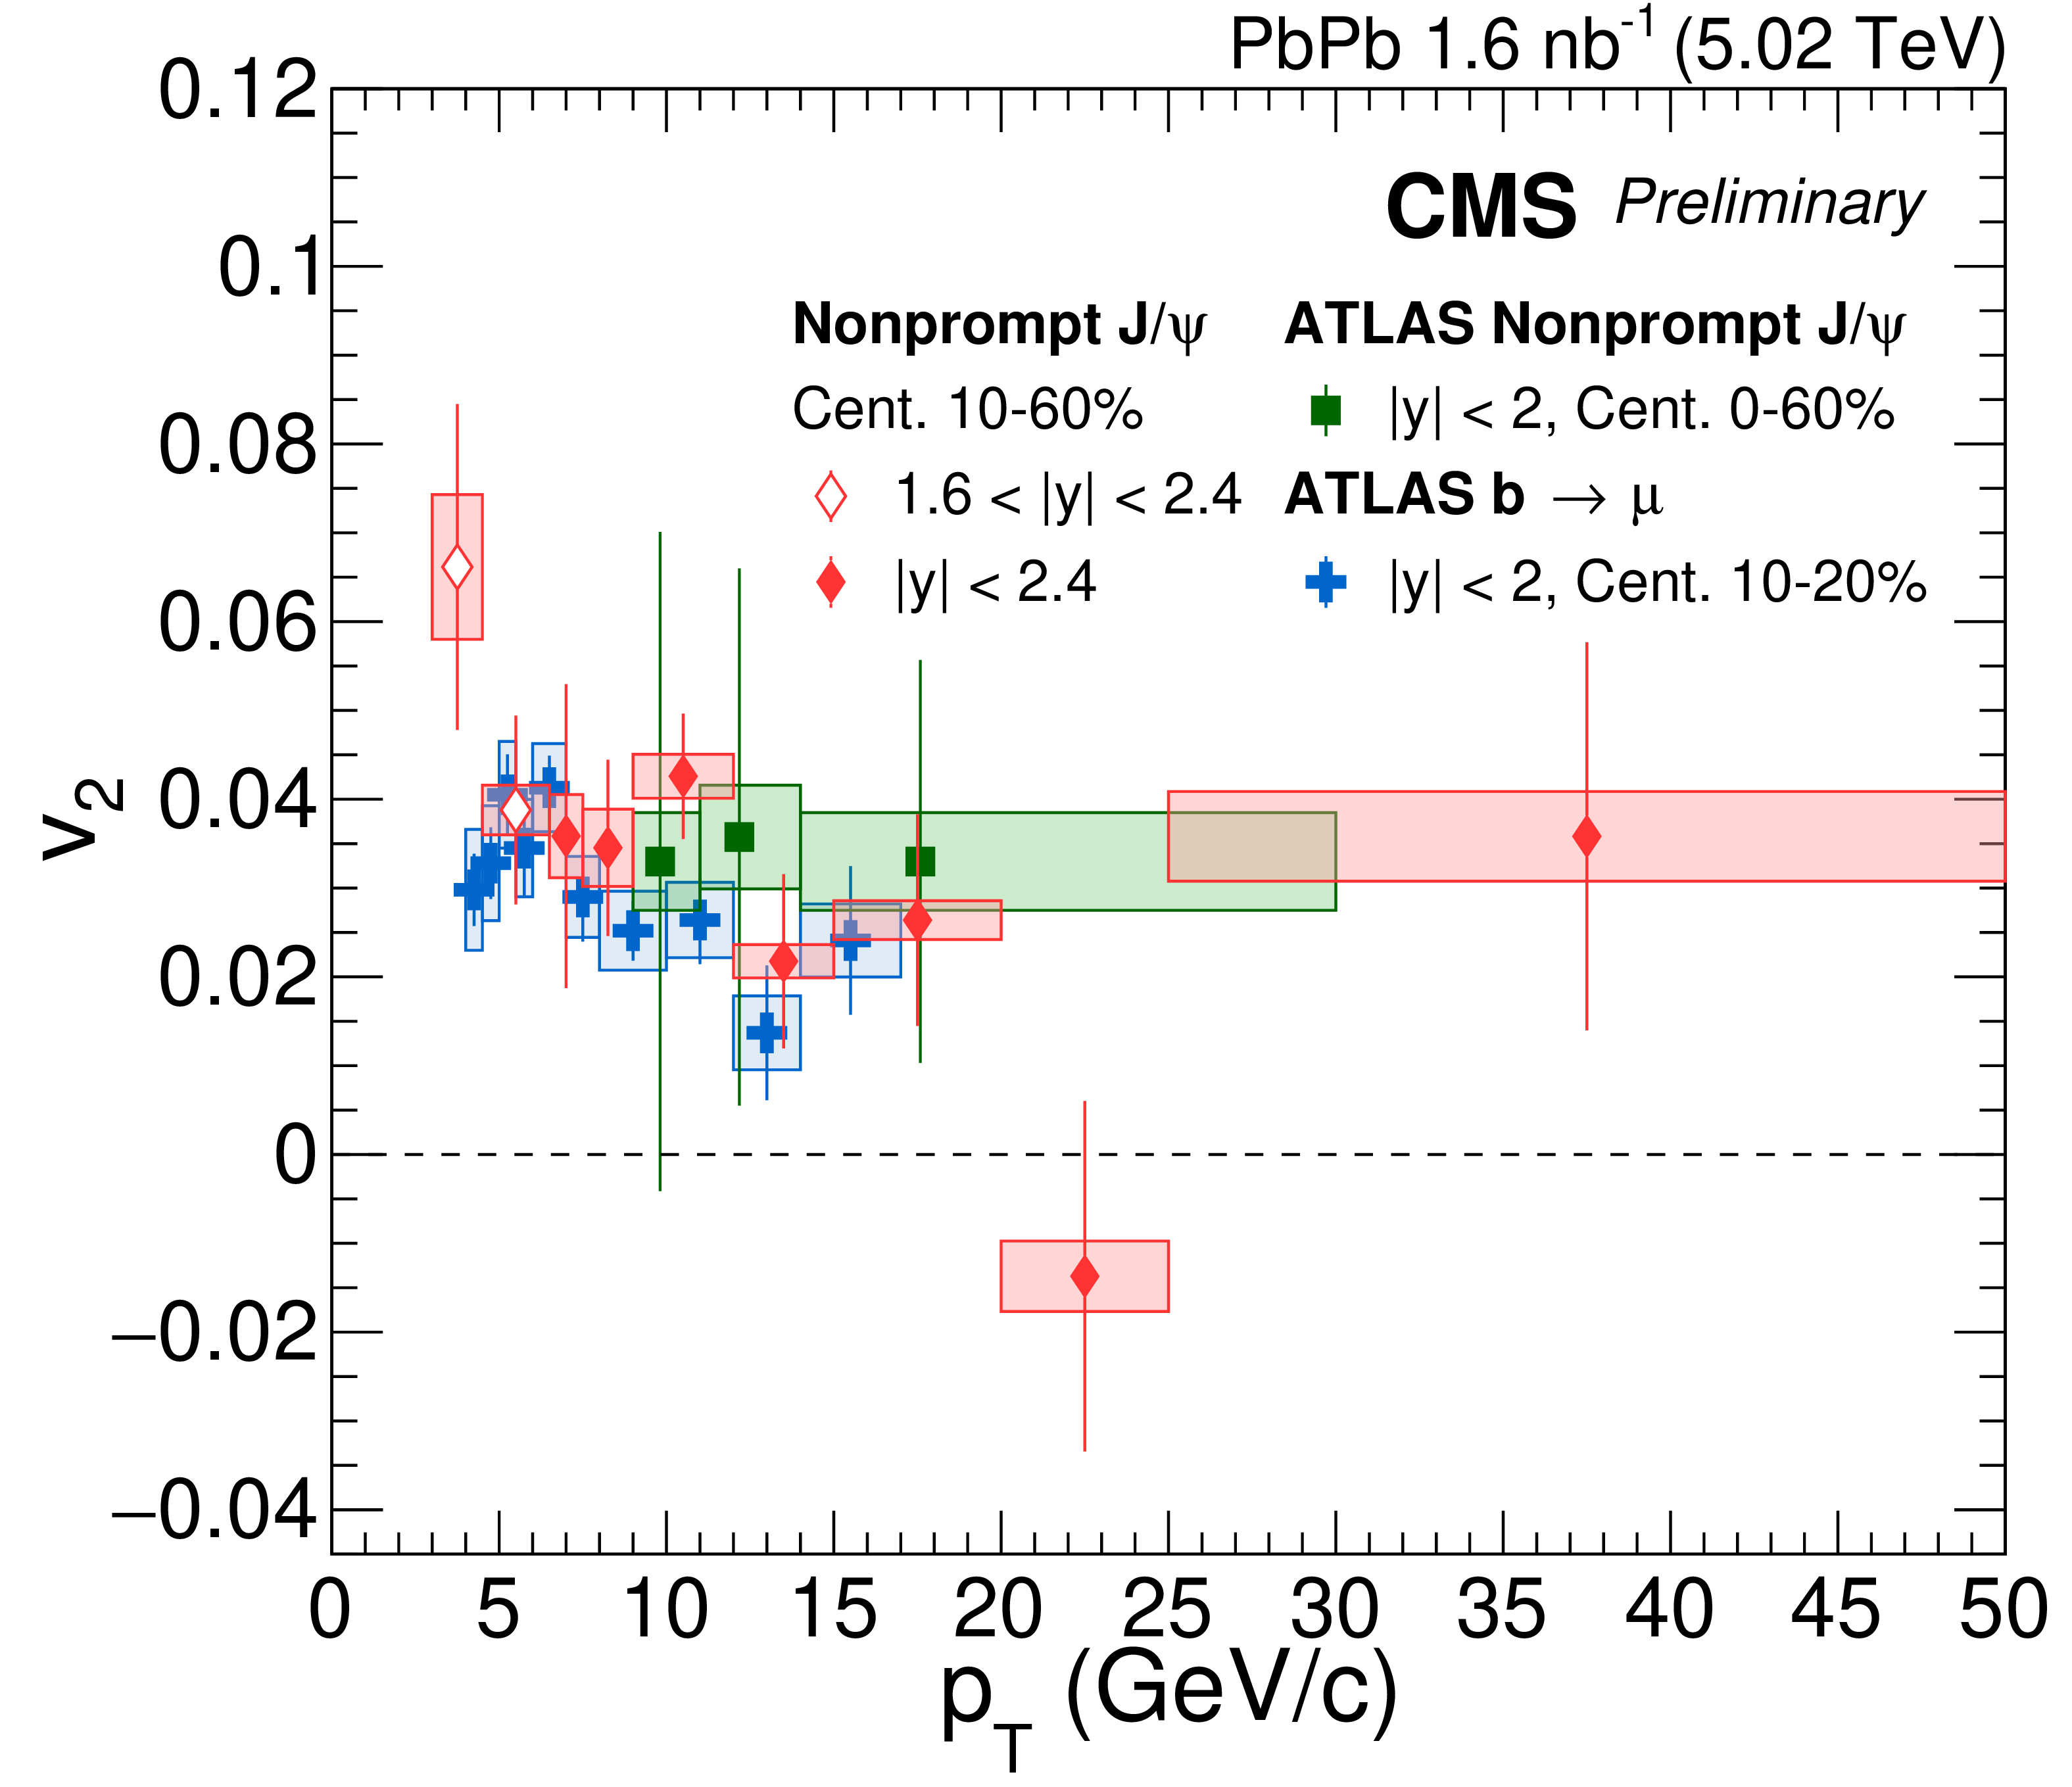
Additional Figure 4:
$v_{2}$ values as a function of ${p_{\mathrm {T}}}$ measured for nonprompt J/$\psi$ mesons with CMS (red diamonds) and ATLAS (green squares) [19], and for bottom hadron decay muons (blue crosses) with ATLAS [43] at $ {\sqrt {\smash [b]{s_{_{\mathrm {NN}}}}}} = $ 5.02 TeV. CMS results are shown in rapidity 1.6 $ < |y| < $ 2.4 (open markers) and $|y| < $ 2.4 (closed markers). The error bars and boxes represent the statistical and systematic uncertainties, respectively. |

png pdf |
Additional Figure 5:
$v_{3}$ values as a function of ${p_{\mathrm {T}}}$ measured for prompt J/$\psi$ mesons (blue circles) and prompt D$^{0}$ mesons (green squares) [40] with CMS, for inclusive J/$\psi$ mesons with ALICE (pink crosses) [21], and for charm hadron decay muons with ATLAS (brown triangles) [43] at $ {\sqrt {\smash [b]{s_{_{\mathrm {NN}}}}}} = $ 5.02 TeV. CMS results are shown in rapidity 1.6 $ < |y| < $ 2.4 (open markers) and $|y| < $ 2.4 (closed markers). The error bars and boxes represent the statistical and systematic uncertainties, respectively. |

png pdf |
Additional Figure 6:
$v_{3}$ values as a function of ${p_{\mathrm {T}}}$ measured for nonprompt J/$\psi$ mesons (red diamonds) and nonprompt D$^{0}$ mesons (green squares) [44] with CMS, and for bottom hadron decay muons with ATLAS (brown triangles) [43] at $ {\sqrt {\smash [b]{s_{_{\mathrm {NN}}}}}} = $ 5.02 TeV. CMS results are shown in rapidity 1.6 $ < |y| < $ 2.4 (open markers) and $|y| < $ 2.4 (closed markers). The error bars and boxes represent the statistical and systematic uncertainties, respectively. |
png pdf |
Additional Figure 7:
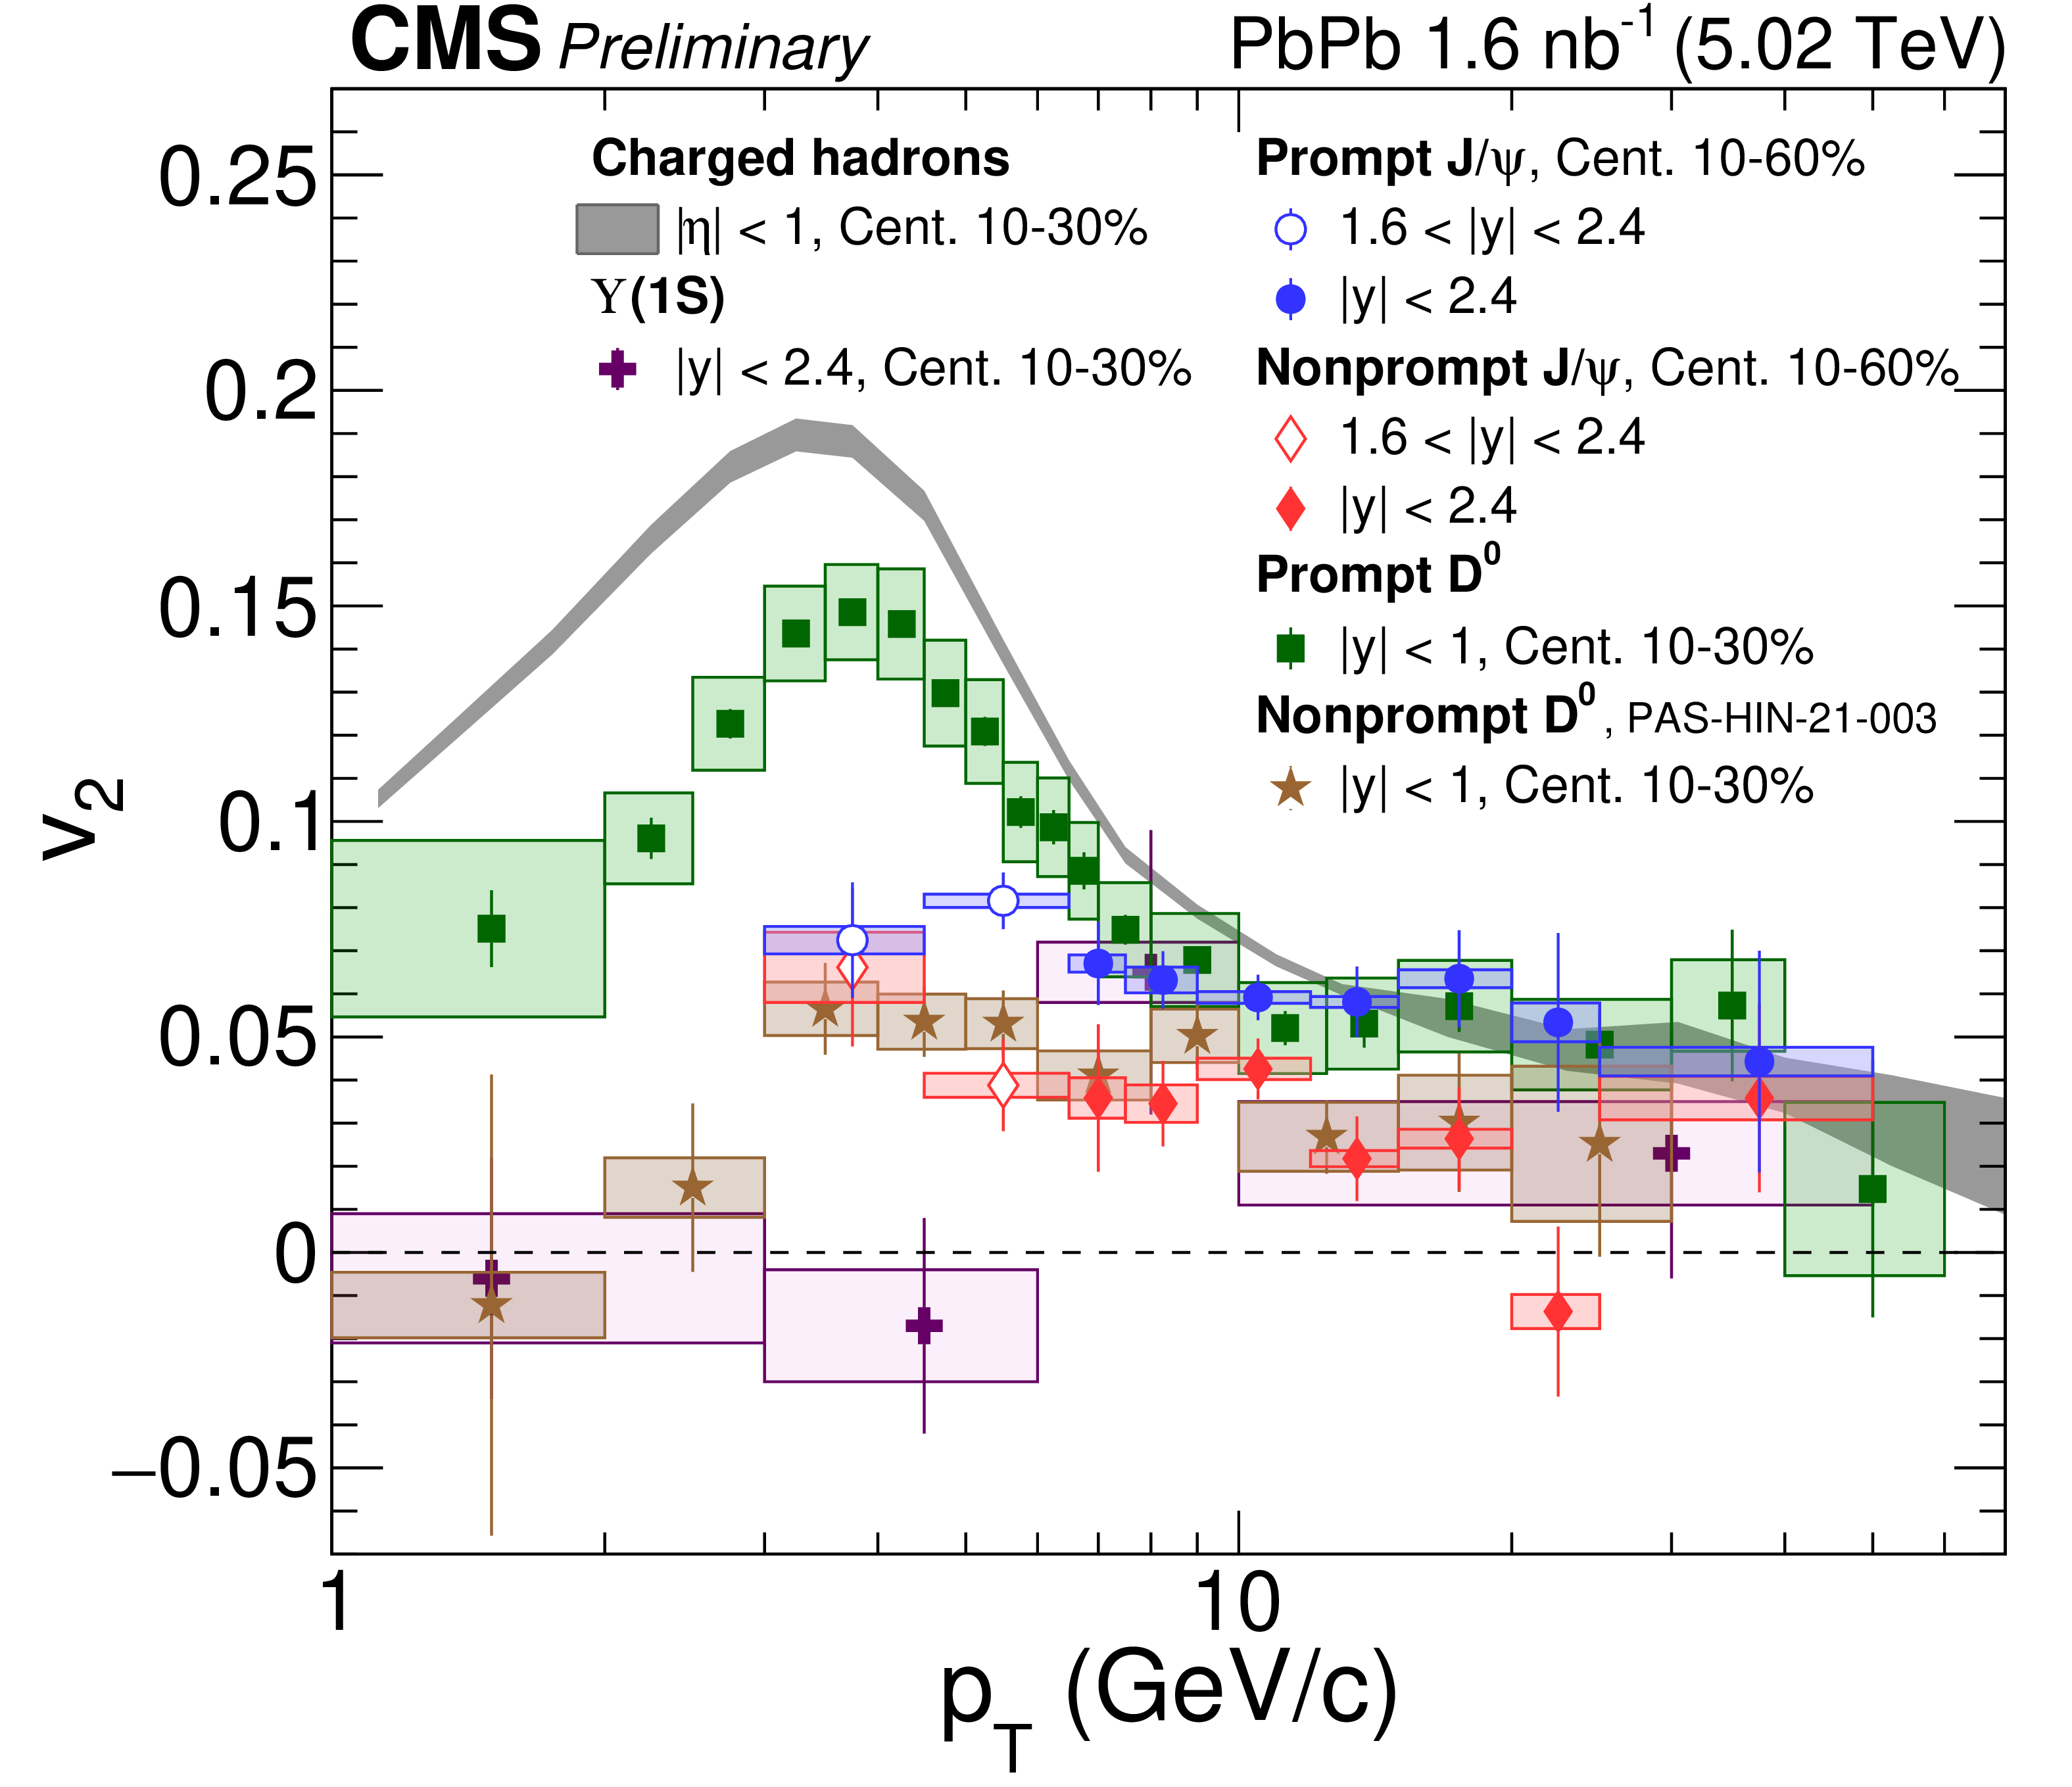
$v_{2}$ values as a function of ${p_{\mathrm {T}}}$ in the 10-60% centrality range for prompt J/$\psi$ mesons (blue circles), nonprompt J/$\psi$ mesons (red diamonds), prompt D$^{0}$ mesons (green squares) [40], nonprompt D$^{0}$ mesons (brown stars) [44], $\Upsilon$(1S) mesons (purple crosses) [23], and charged hadrons (gray band) [45] measured with CMS at $ {\sqrt {\smash [b]{s_{_{\mathrm {NN}}}}}} = $ 5.02 TeV. J/$\psi$ results are shown in rapidity 1.6 $ < |y| < $ 2.4 (open markers) and $|y| < $ 2.4 (closed markers). The error bars and boxes represent the statistical and systematic uncertainties, respectively. |

png pdf |
Additional Figure 8:
$v_{2}$ values for the prompt J/$\psi$ mesons (blue circles), nonprompt J/$\psi$ mesons (red diamonds) and prompt $\psi$(2S) mesons (green squares) as a function of $\langle N_{\mathrm {part}} \rangle $ for 6.5 $ < {p_{\mathrm {T}}} < $ 50 GeV/$c$. The error bars and boxes represent the statistical and systematic uncertainties, respectively. |

png pdf |
Additional Figure 9:
$v_{2}$ values for the prompt J/$\psi$ mesons (blue circles), nonprompt J/$\psi$ mesons (red diamonds) and prompt $\psi$(2S) (green squares) as a function of ${p_{\mathrm {T}}}$ in the 10-60% centrality range. All three results are shown in rapidity 1.6 $ < |y| < $ 2.4 (open markers) and $|y| < $ 2.4 (closed markers). The error bars and boxes represent the statistical and systematic uncertainties, respectively. |
png pdf |
Additional Figure 10:
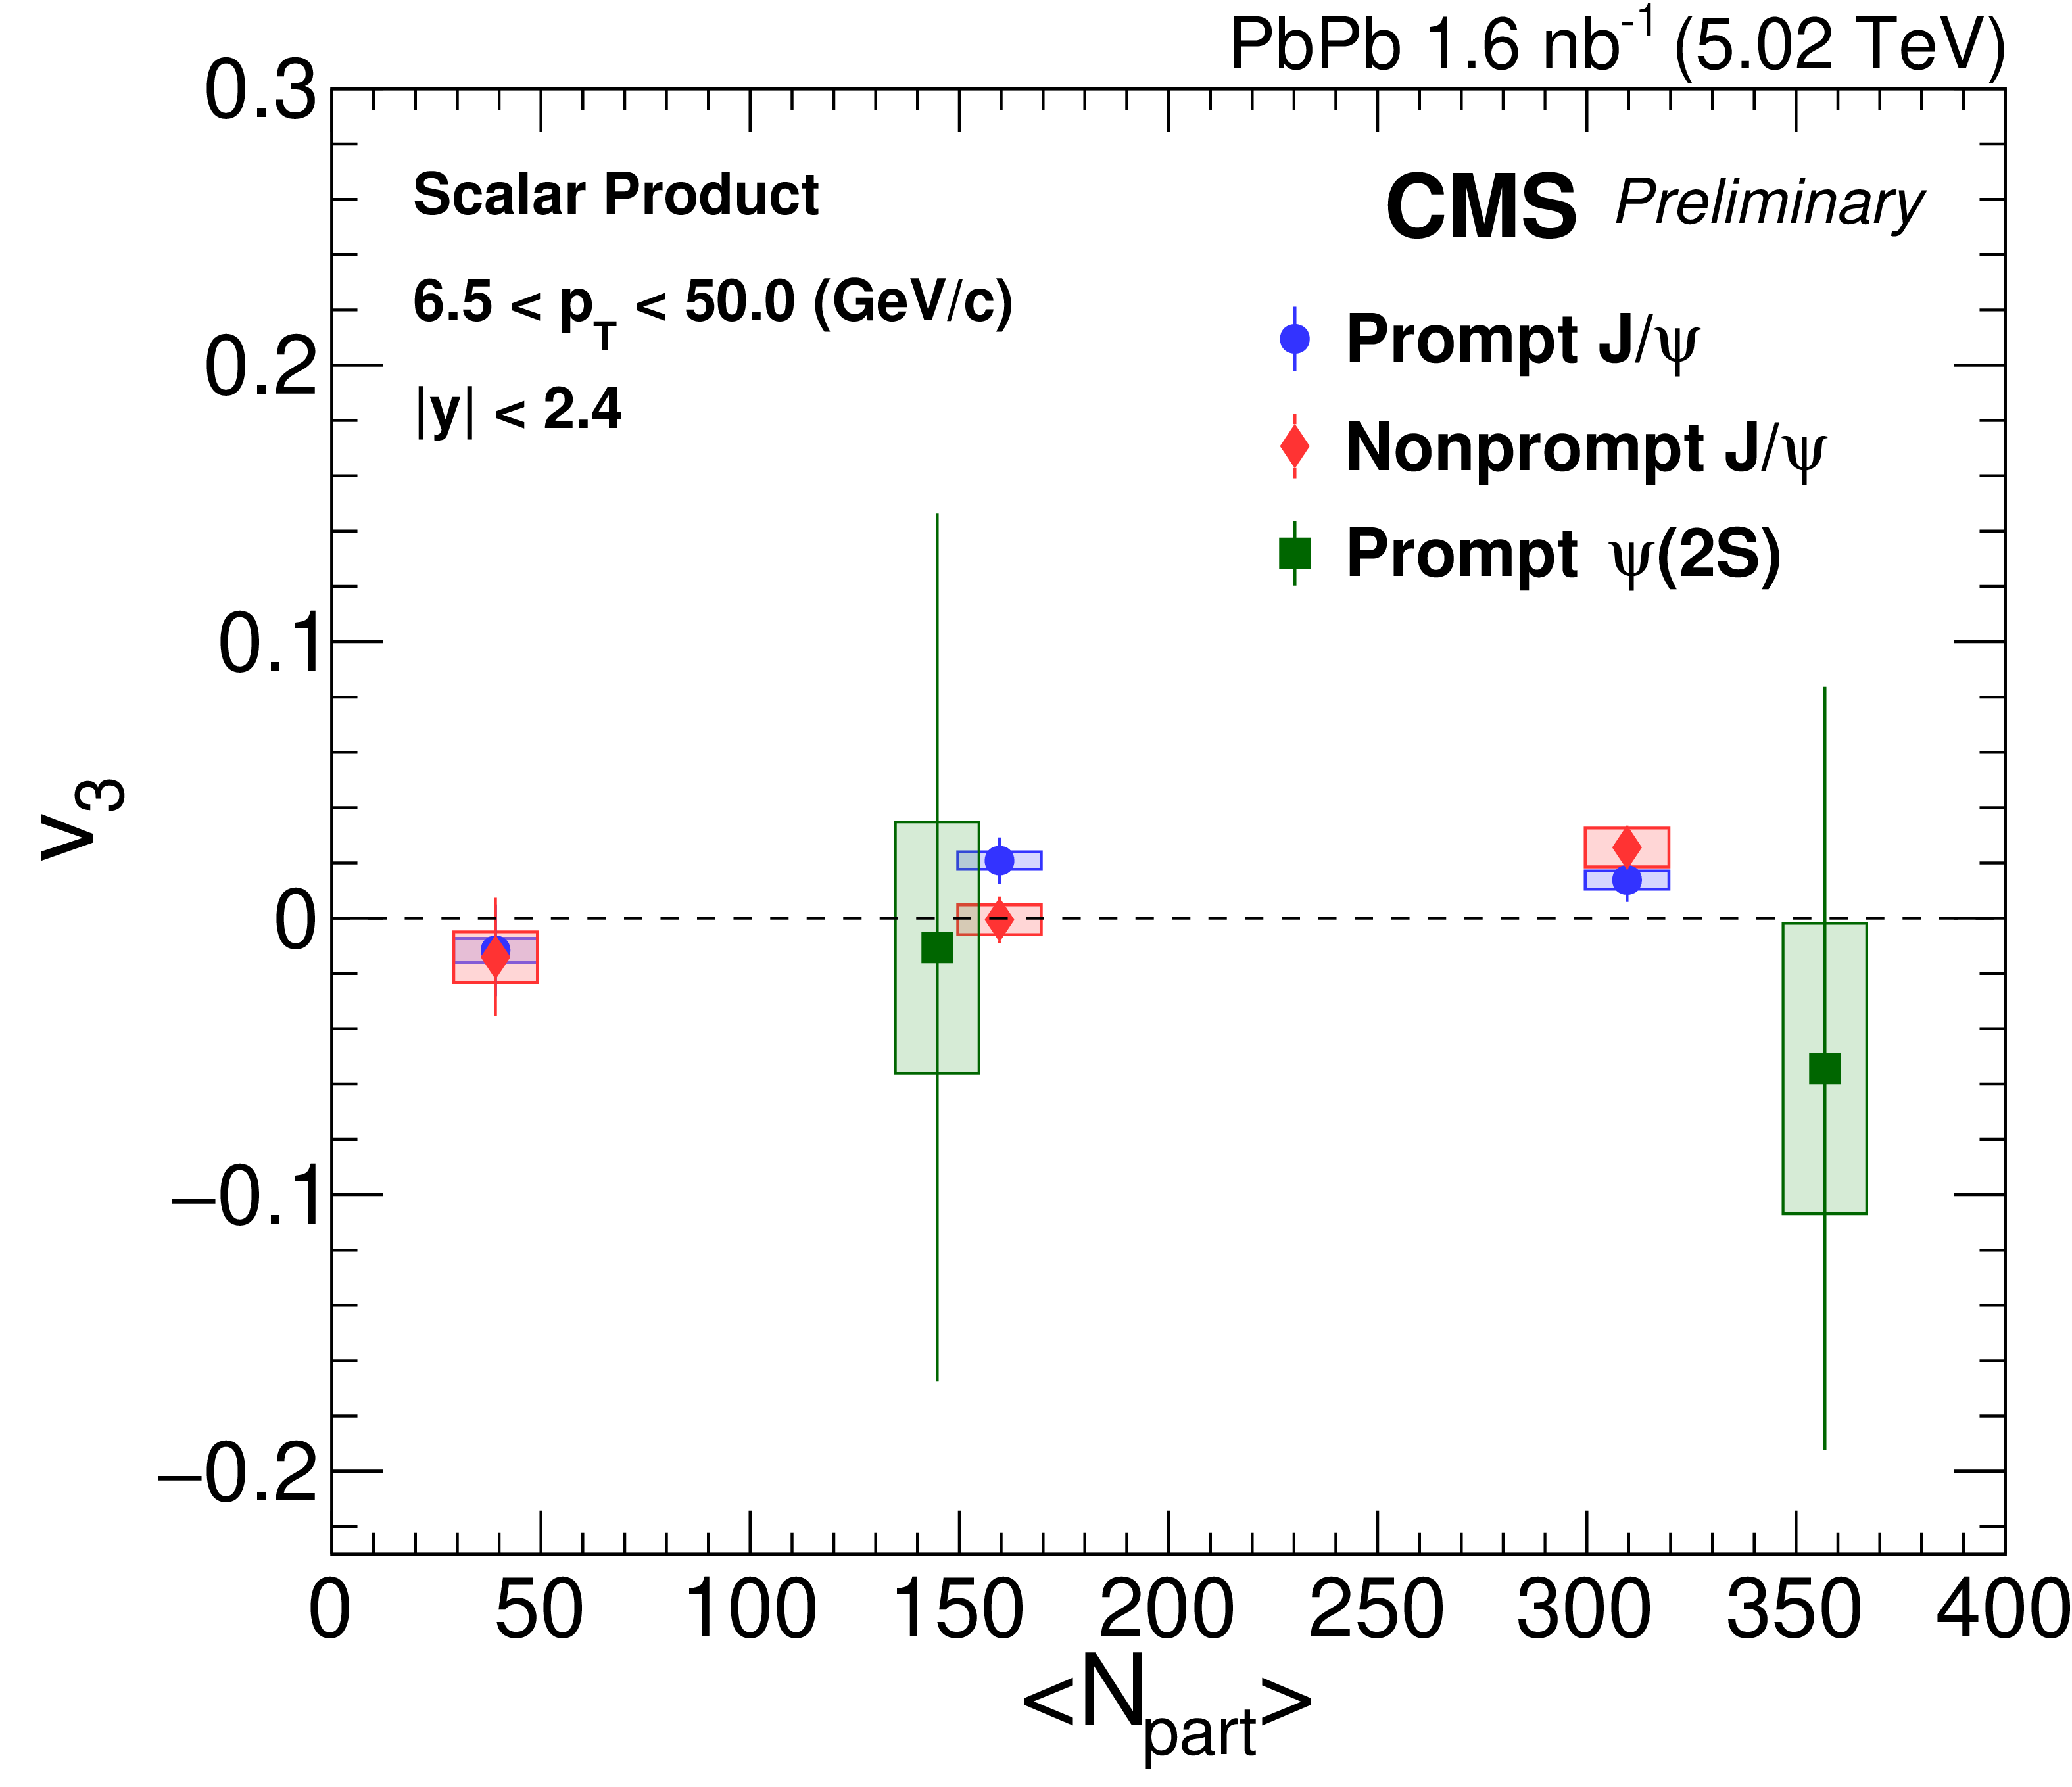
$v_{3}$ values for the prompt J/$\psi$ mesons (blue circles), nonprompt J/$\psi$ mesons (red diamonds) and prompt $\psi$(2S) mesons (green squares) as a function of $N_{\mathrm {part}}$ for 6.5 $ < {p_{\mathrm {T}}} < $ 50 GeV/$c$. The error bars and boxes represent the statistical and systematic uncertainties, respectively. |

png pdf |
Additional Figure 11:
$v_{3}$ values for the prompt J/$\psi$ mesons (blue circles), nonprompt J/$\psi$ mesons (red diamonds) and prompt $\psi$(2S) mesons (green squares) as a function of ${p_{\mathrm {T}}}$ in the 10-60% centrality range. All three results are shown in rapidity 1.6 $ < |y| < $ 2.4 (open markers) and $|y| < $ 2.4 (closed markers). The error bars and boxes represent the statistical and systematic uncertainties, respectively. |
png pdf |
Additional Figure 12:
$v_{2}$ (top) and $v_{3}$ (bottom) values of prompt J/$\psi$ mesons (blue circles) and prompt $\psi$(2S) mesons (green squares) as functions of ${p_{\mathrm {T}}}$ (left) and $\langle N_{\mathrm {part}} \rangle $. Both results are shown in rapidity 1.6 $ < |y| < $ 2.4 (open markers) and $|y| < $ 2.4 (closed markers). The error bars and boxes represent the statistical and systematic uncertainties, respectively. |
png pdf |
Additional Figure 13:
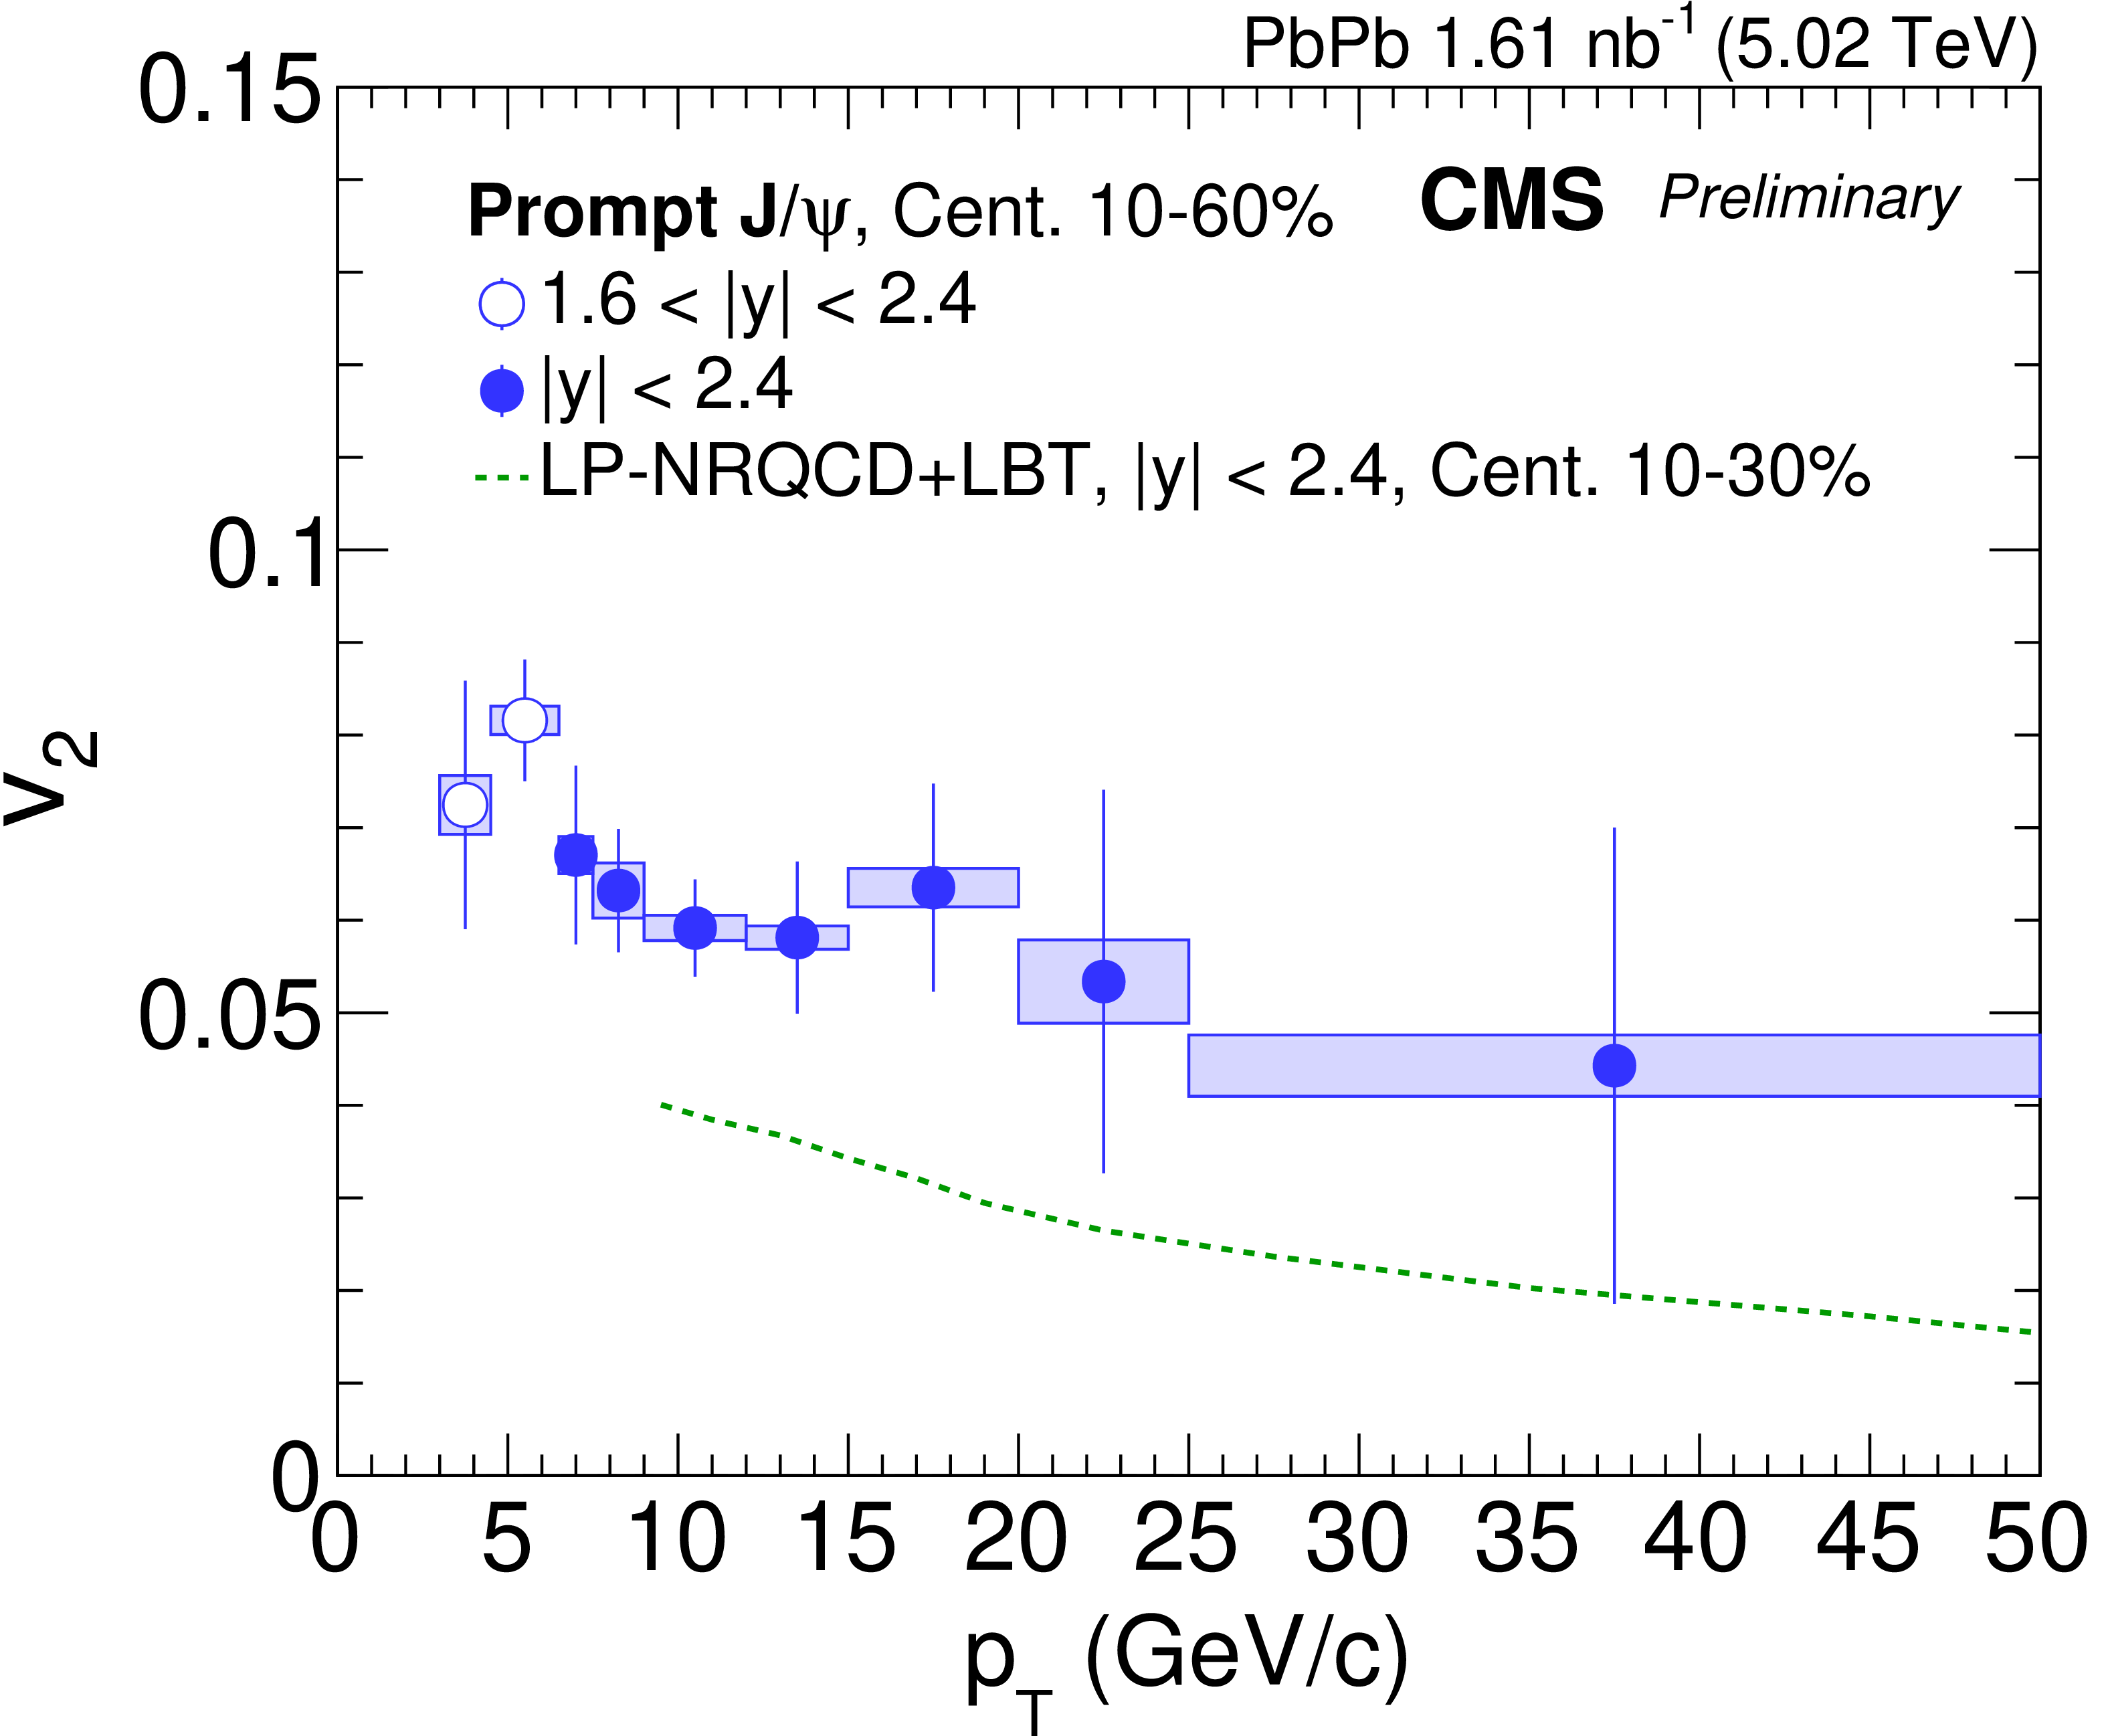
The $ v_{2} $ values of J/$ \psi $ mesons (blue circles) as a function of $ p_{\mathrm{T}} $ in the 10-60% centrality range compared with a theoretical calculation using leading power NRQCD and LBT model [46] (green dashed line). The results for 3 $ < p_{\mathrm{T}} < $ 6.5 and 6.5 $ < p_{\mathrm{T}} < $ 50 GeVc are studied in the rapidity range of 1.6 $ < |y| < $ 2.4 and $ |y| < $ 2.4, respectively. The vertical bars denote the statistical uncertainties, and the rectangular bands show the systematic uncertainties. |
| References | ||||
| 1 | T. Matsui and H. Satz | J/$\psi$ suppression by quark-gluon plasma formation | PLB 178 (1986) 416 | |
| 2 | S. Digal, P. Petreczky, and H. Satz | Quarkonium feed down and sequential suppression | PRD 64 (2001) 094015 | hep-ph/0106017 |
| 3 | M. Laine, O. Philipsen, P. Romatschke, and M. Tassler | Real-time static potential in hot QCD | JHEP 03 (2007) 054 | hep-ph/0611300 |
| 4 | N. Brambilla, J. Ghiglieri, A. Vairo, and P. Petreczky | Static quark-antiquark pairs at finite temperature | PRD 78 (2008) 014017 | 0804.0993 |
| 5 | N. Brambilla et al. | Heavy quarkonium in a weakly-coupled quark-gluon plasma below the melting temperature | JHEP 09 (2010) 038 | 1007.4156 |
| 6 | J.-P. Blaizot, D. De Boni, P. Faccioli, and G. Garberoglio | Heavy quark bound states in a quark-gluon plasma: Dissociation and recombination | NP A 946 (2016) 49 | 1503.03857 |
| 7 | A. Capella et al. | Nuclear Effects in J/$\psi$ Suppression | PLB 206 (1988) 354 | |
| 8 | PHENIX Collaboration | J/$\psi$ production versus centrality, transverse momentum, and rapidity in Au+Au collisions at $ \sqrt{\smash[b]{s_{_{\mathrm{NN}}}}} = $ 200 GeV | PRL 98 (2007) 232301 | nucl-ex/0611020 |
| 9 | PHENIX Collaboration | J/$\psi$ suppression at forward rapidity in Au+Au collisions at $ \sqrt{\smash[b]{s_{_{\mathrm{NN}}}}} = $ 200 GeV | PRC 84 (2011) 054912 | 1103.6269 |
| 10 | STAR Collaboration | J/$\psi$ production at low $ {p_{\mathrm{T}}} $ in Au + Au and Cu + Cu collisions at $ \sqrt{\smash[b]{s_{_{\mathrm{NN}}}}} = $ 200 GeV with the STAR detector | PRC 90 (2014) 024906 | 1310.3563 |
| 11 | STAR Collaboration | Energy dependence of J/$\psi$ production in Au+Au collisions at $ \sqrt{\smash[b]{s_{_{\mathrm{NN}}}}} = $ 39, 62.4 and 200 GeV | PLB 771 (2017) 13 | 1607.07517 |
| 12 | ALICE Collaboration | J/$\psi$ suppression at forward rapidity in Pb-Pb collisions at $ \sqrt{\smash[b]{s_{_{\mathrm{NN}}}}} = $ 2.76 TeV | PRL 109 (2012) 072301 | 1202.1383 |
| 13 | ALICE Collaboration | J/$\psi$ suppression at forward rapidity in Pb-Pb collisions at $ \sqrt{\smash[b]{s_{_{\mathrm{NN}}}}} = $ 5.02 TeV | PLB 766 (2017) 212 | 1609.08197 |
| 14 | CMS Collaboration | Measurement of prompt and nonprompt charmonium suppression in PbPb collisions at 5.02 TeV | EPJC 78 (2018) 509 | CMS-HIN-16-025 1712.08959 |
| 15 | X. Zhao and R. Rapp | Medium Modifications and Production of Charmonia at LHC | NP A 859 (2011) 114 | 1102.2194 |
| 16 | X. Du and R. Rapp | Sequential Regeneration of Charmonia in Heavy-Ion Collisions | NP A 943 (2015) 147 | 1504.00670 |
| 17 | Y. Liu, N. Xu, and P. Zhuang | J/$\psi$ elliptic flow in relativistic heavy ion collisions | NP A 834 (2010) 317C | 0910.0959 |
| 18 | ALICE Collaboration | J/$\psi$ elliptic flow in Pb-Pb collisions at suppression at $ \sqrt{\smash[b]{s_{_{\mathrm{NN}}}}} = $ 2.76 TeV | PRL 111 (2013) 162301 | 1330.5880 |
| 19 | ATLAS Collaboration | Prompt and non-prompt J/$\psi$ elliptic flow in Pb+Pb collisions at $ \sqrt{\smash[b]{s_{_{\mathrm{NN}}}}} = $ 5.02 TeV with the ATLAS detector | EPJC 78 (2018) 784 | 1807.05198 |
| 20 | CMS Collaboration | Suppression and azimuthal anisotropy of prompt and nonprompt J/$\psi$ production in PbPb collisions at $ \sqrt{\smash[b]{s_{_{\mathrm{NN}}}}} = $ 2.76 TeV | EPJC 77 (2017) 252 | CMS-HIN-14-005 1610.00613 |
| 21 | ALICE Collaboration | J/$\psi$ elliptic and triangular flow in Pb-Pb collisions at $ \sqrt{\smash[b]{s_{_{\mathrm{NN}}}}} = $ 5.02 TeV | JHEP 10 (2020) 141 | 2005.14518 |
| 22 | ALICE Collaboration | Measurement of $ \Upsilon${1S} elliptic flow at forward rapidity in Pb-Pb collisions at $ \sqrt{\smash[b]{s_{_{\mathrm{NN}}}}} = $ 5.02 TeV | PRL 123 (2019) 192301 | 1907.03169 |
| 23 | CMS Collaboration | Measurement of the azimuthal anisotropy of $ \Upsilon${1S} and $ \Upsilon${2S} mesons in PbPb collisions at $ \sqrt{\smash[b]{s_{_{\mathrm{NN}}}}} = $ 5.02 TeV | PLB 819 (2021) 136385 | CMS-HIN-19-002 2006.07707 |
| 24 | CMS Collaboration | Fragmentation of jets containing a prompt J/$\psi$ meson in PbPb and pp collisions at $ \sqrt{\smash[b]{s_{_{\mathrm{NN}}}}} = $ 5.02 TeV | PLB 825 (2022) 136842 | CMS-HIN-19-007 2106.13235 |
| 25 | CMS Collaboration | Performance of the CMS muon detector and muon reconstruction with proton-proton collisions at $ \sqrt{s}= $ 13 TeV | JINST 13 (2018) P06015 | CMS-MUO-16-001 1804.04528 |
| 26 | CMS Collaboration | The CMS experiment at the CERN LHC | JINST 3 (2008) S08004 | CMS-00-001 |
| 27 | CMS Collaboration | Performance of the CMS Level-1 trigger in proton-proton collisions at $ \sqrt{s} = $ 13 TeV | JINST 15 (2020) P10017 | CMS-TRG-17-001 2006.10165 |
| 28 | CMS Collaboration | The CMS trigger system | JINST 12 (2017) P01020 | CMS-TRG-12-001 1609.02366 |
| 29 | T. Sjostrand et al. | An Introduction to PYTHIA 8.2 | CPC 191 (2015) 159 | 1410.3012 |
| 30 | CMS Collaboration | Extraction and validation of a new set of CMS PYTHIA 8 tunes from underlying-event measurements | EPJC 80 (2020) 4 | CMS-GEN-17-001 1903.12179 |
| 31 | D. J. Lange | The EvtGen particle decay simulation package | NIMA 462 (2001) 152 | |
| 32 | C. Gale, S. Jeon, and B. Schenke | Hydrodynamic modeling of heavy-ion collisions | Int. J. Mod. Phys. A 28 (2013) 1340011 | 1301.5893 |
| 33 | GEANT4 Collaboration | GEANT4 --- A simulation toolkit | NIMA 506 (2003) 250 | |
| 34 | CMS Collaboration | Measurements of inclusive $ W $ and $ Z $ cross sections in pp collisions at $ \sqrt{s}= $ 7 TeV | JHEP 01 (2011) 080 | CMS-EWK-10-002 1012.2466 |
| 35 | CMS Collaboration | Suppression of non-prompt J/$\psi$, prompt J/$\psi$, and $ \Upsilon${1S} in PbPb collisions at $ \sqrt{\smash[b]{s_{_{\mathrm{NN}}}}} = $ 2.76 TeV | JHEP 05 (2012) 063 | CMS-HIN-10-006 1201.5069 |
| 36 | ALEPH Collaboration | Measurement of the anti-B$ ^{0} $ and B$ ^{-} $ meson lifetimes | PLB 307 (1993) 194 | |
| 37 | Particle Data Group Collaboration | Review of particle physics | CPC 40 (2016) 100001 | |
| 38 | M. J. Oreglia | A study of the reactions $\psi' \to \gamma\gamma \psi$ | PhD thesis, Stanford University, 1980 SLAC Report SLAC-R-236, see Appendix D | |
| 39 | M. Pivk and F. R. Le Diberder | sPlot: A statistical tool to unfold data distributions | NIMA 555 (2005) 356 | physics/0402083 |
| 40 | CMS Collaboration | Measurement of prompt D$^{0}$ meson azimuthal anisotropy in Pb-Pb collisions at $ \sqrt{\smash[b]{s_{_{\mathrm{NN}}}}} = $ 5.02 TeV | PRL 120 (2018) 202301 | CMS-HIN-16-007 1708.03497 |
| 41 | Matthew Luzum, Jean-Yves Ollitrault | Eliminating experimental bias in anisotropic-flow measurements of high-energy nuclear collisions | PRC 87 (2013) 044907 | 1209.2323 |
| 42 | B. Chen | Elliptic flow as a probe for $ \psi $(2S) production mechanism in relativistic heavy ion collisions | PRC 95 (2017) 034908 | 1608.02173 |
| 43 | ATLAS Collaboration | Measurement of azimuthal anisotropy of muons from charm and bottom hadrons in PbPb collisions at $ \sqrtsNN = $ 5.02 TeV with the ATLAS detector | PLB 807 (2020) 135595 | 2003.03565 |
| 44 | CMS Collaboration Collaboration | Azimuthal anisotropy of nonprompt D$^{0}$ mesons in PbPb collisions at $ \sqrt{\smash[b]{s_{_{\mathrm{NN}}}}} = $ 5.02 TeV | technical report, CERN, Geneva | |
| 45 | CMS Collaboration | Azimuthal anisotropy of charged particles with transverse momentum up to 100 GeV/$c$ in PbPb collisions at $ \sqrt{\smash[b]{s_{_{\mathrm{NN}}}}} = $ 5.02 TeV | PLB 776 (2018) 195 | CMS-HIN-15-014 1702.00630 |
|
|
Compact Muon Solenoid LHC, CERN |
|

|

|

|

|

|