

Compact Muon Solenoid
LHC, CERN
| CMS-PAS-HIN-15-015 | ||
| Measurement of the charged particle nuclear modification factor in PbPb collisions at $\sqrt{s_{\rm NN}}= $ 5.02 TeV | ||
| CMS Collaboration | ||
| May 2016 | ||
| Abstract: The nuclear modification factor, $R_{\rm AA}$, of charged particles produced in the $|\eta|< $ 1 pseudorapidity region is measured at $\sqrt{s_{\rm NN}}=$ 5.02 TeV using 404 $\mu$b$^{-1}$ of PbPb and 25.8 pb$^{-1}$ of pp data collected by the CMS experiment at the end of 2015. The $R_{\rm AA}$ is presented in several bins of collision centrality, over the transverse momentum range of 0.7-400 GeV. The measured $R_{\rm AA}$ in the 0-5% most central collision class shows a maximum suppression by a factor of approximately 7.5 in the 6-9 GeV $p_\mathrm{T}$ region, followed by a rising trend up to the highest transverse momenta measured in the analysis. The measurement is compared to earlier results at lower collision energies, and to theory predictions. | ||
|
Links:
CDS record (PDF) ;
CADI line (restricted) ;
These preliminary results are superseded in this paper, JHEP 04 (2017) 039. The superseded preliminary plots can be found here. |
||
| Figures | |

png pdf |
Figure 1-a:
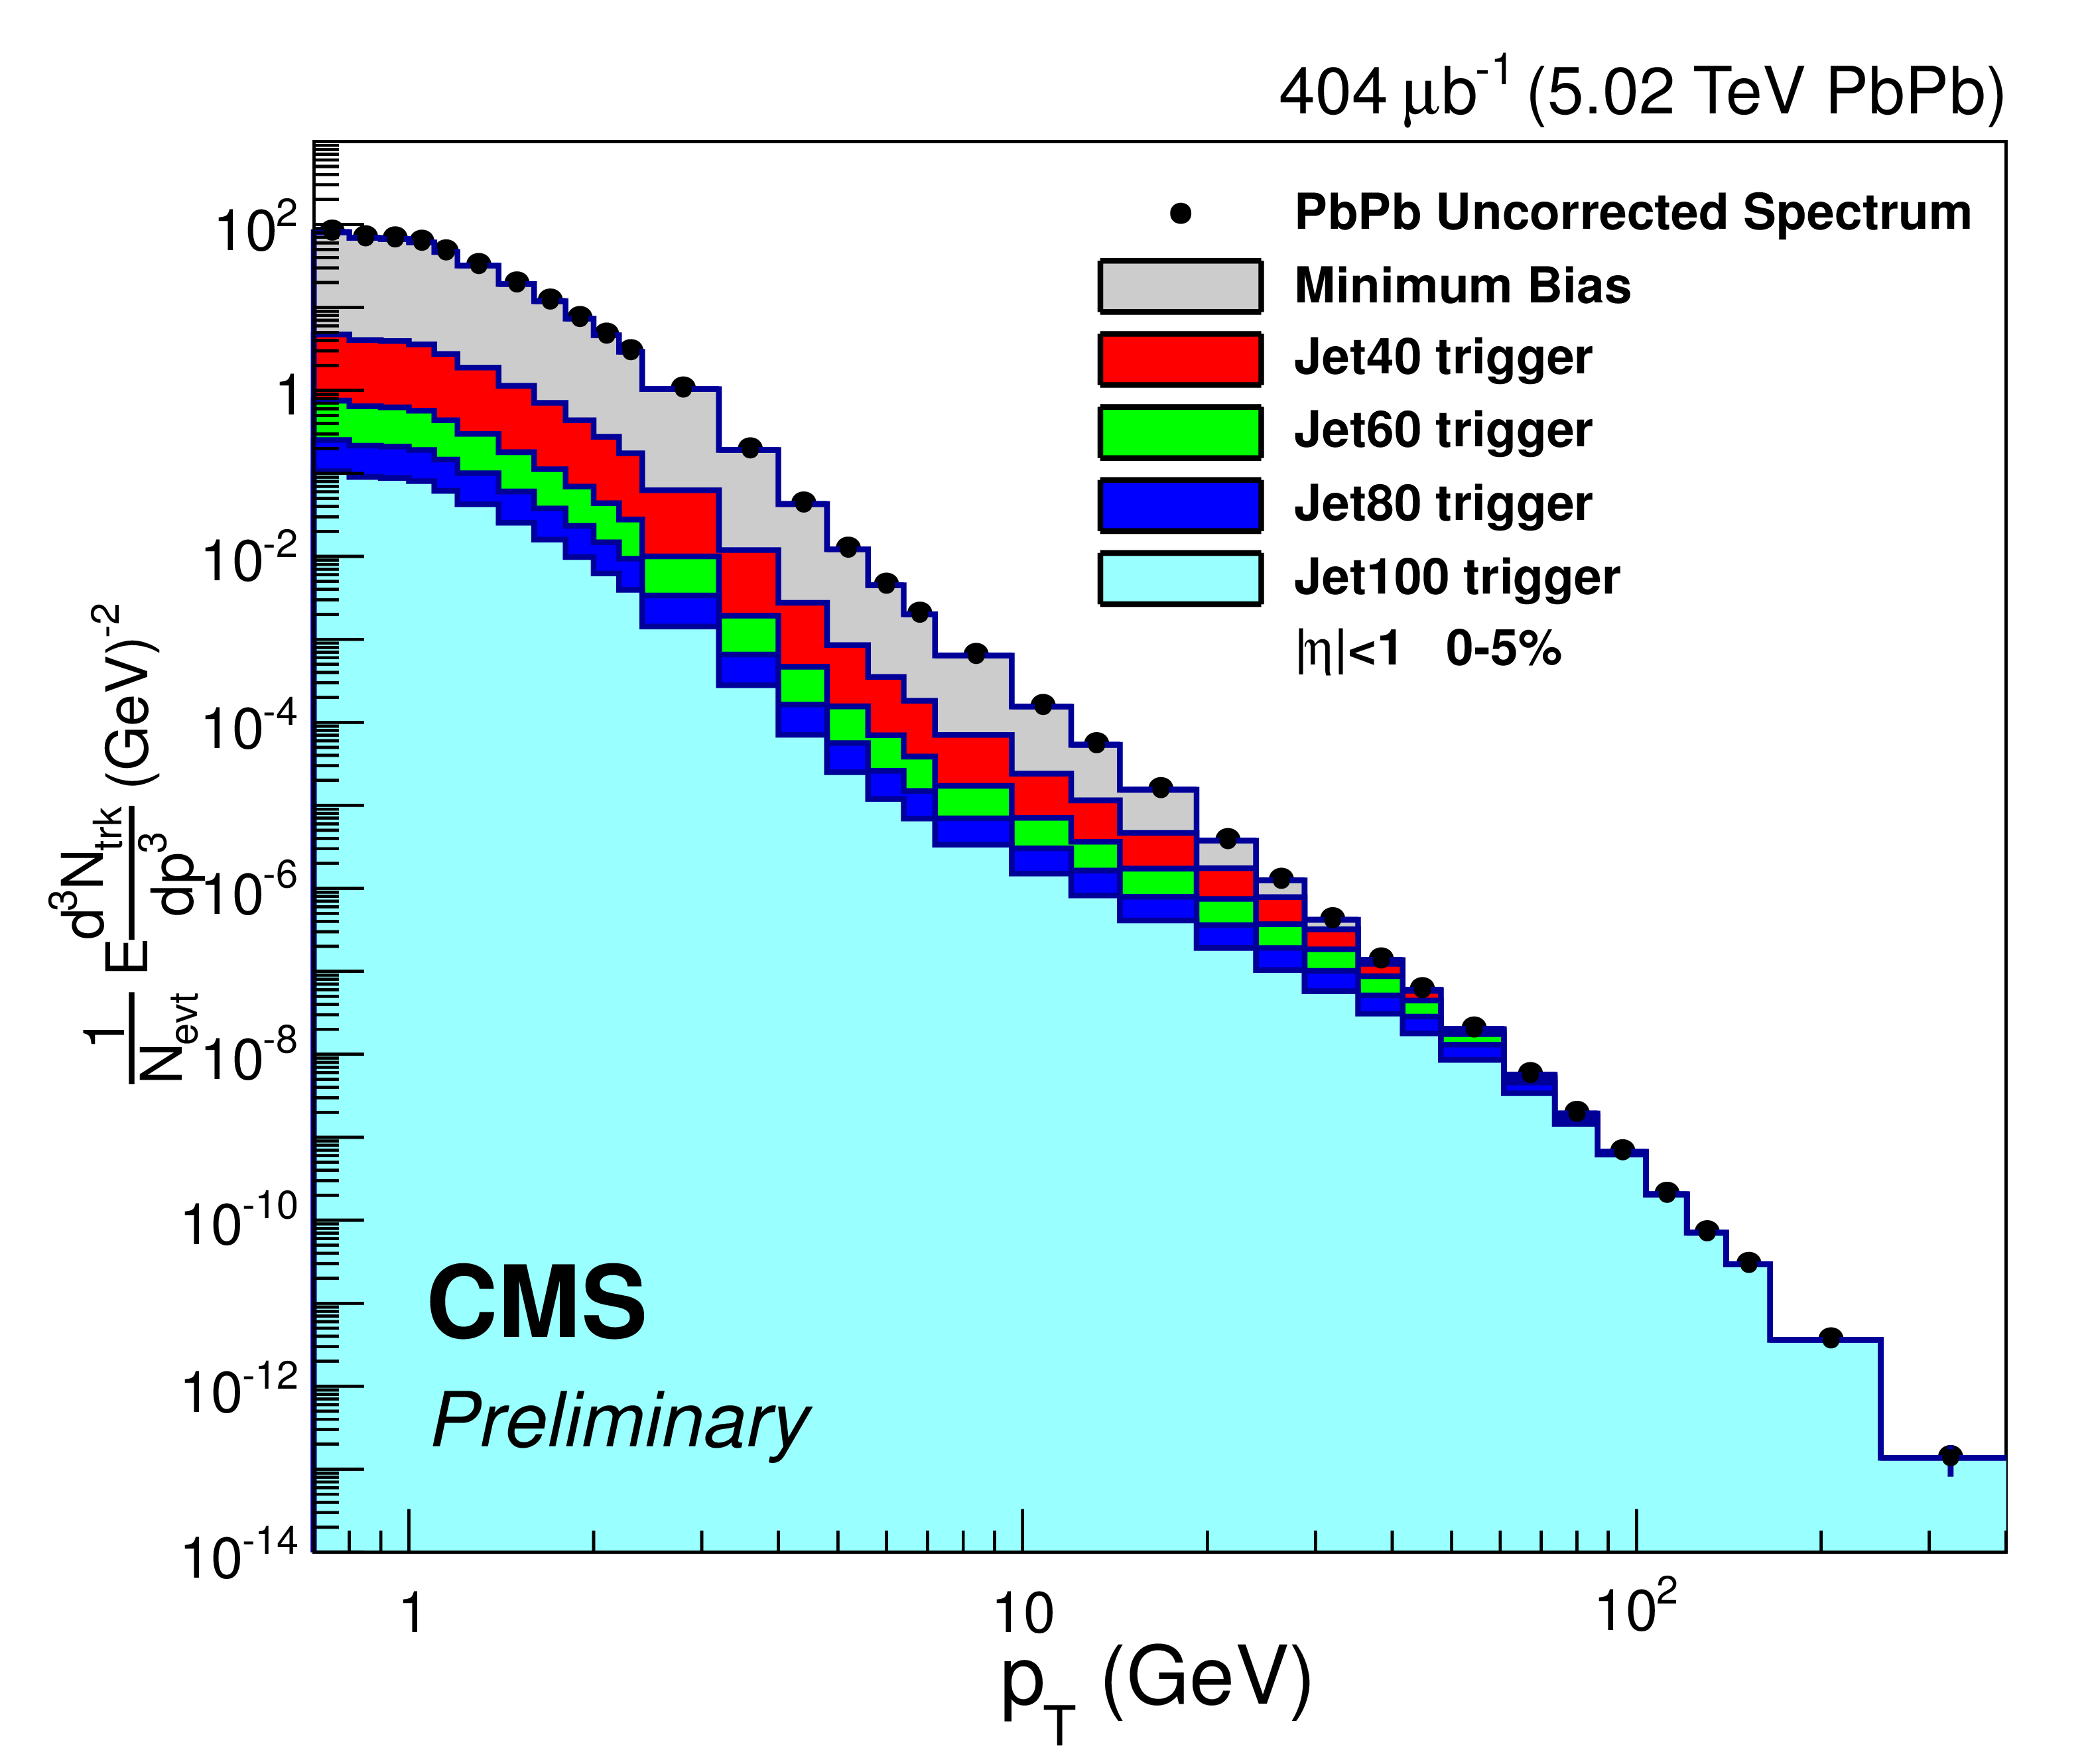
a: ratio of the leading-jet ${p_{\mathrm {T}}}$ distributions in PbPb collisions in the 0-30% centrality bin from various triggers, after the data have been normalized to one another. For better visibility, lines were added to guide the eye. b: contributions from the various jet triggers (colored histograms) to the combined, but otherwise uncorrected, track spectrum (black markers) in the 0-5% centrality bin. |
png pdf |
Figure 1-b:
a: ratio of the leading-jet ${p_{\mathrm {T}}}$ distributions in PbPb collisions in the 0-30% centrality bin from various triggers, after the data have been normalized to one another. For better visibility, lines were added to guide the eye. b: contributions from the various jet triggers (colored histograms) to the combined, but otherwise uncorrected, track spectrum (black markers) in the 0-5% centrality bin. |
png pdf |
Figure 2-a:
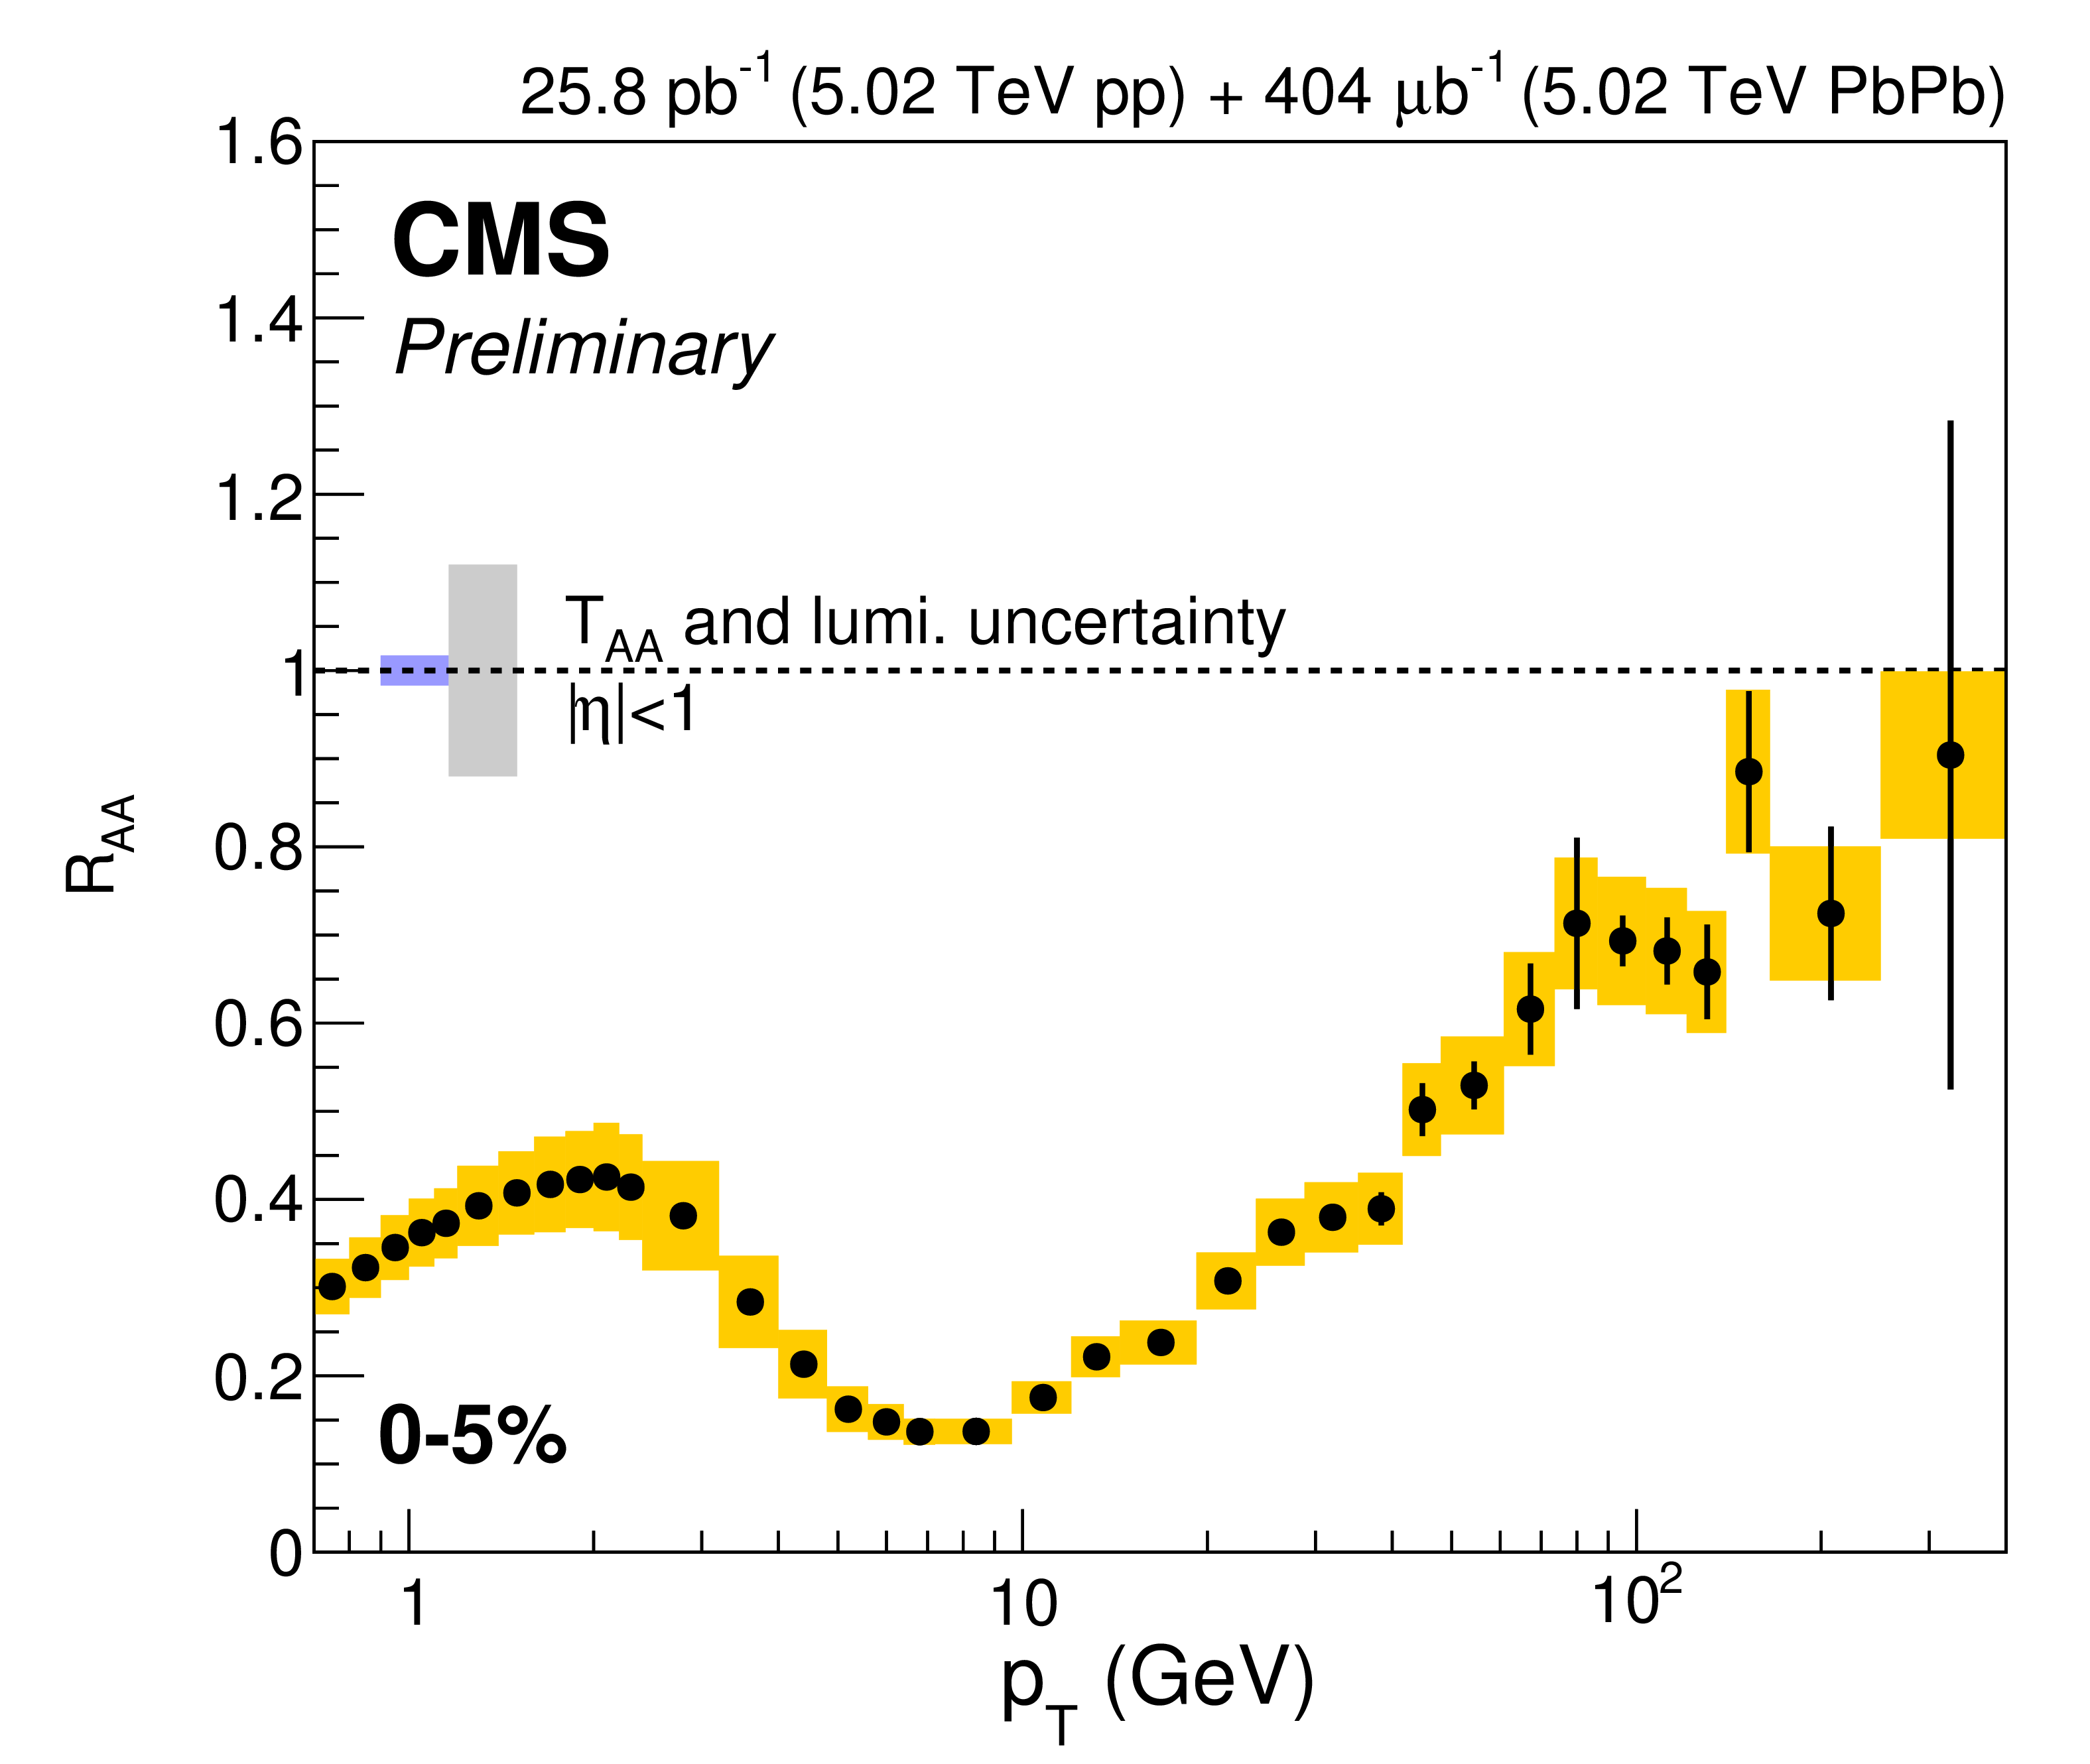
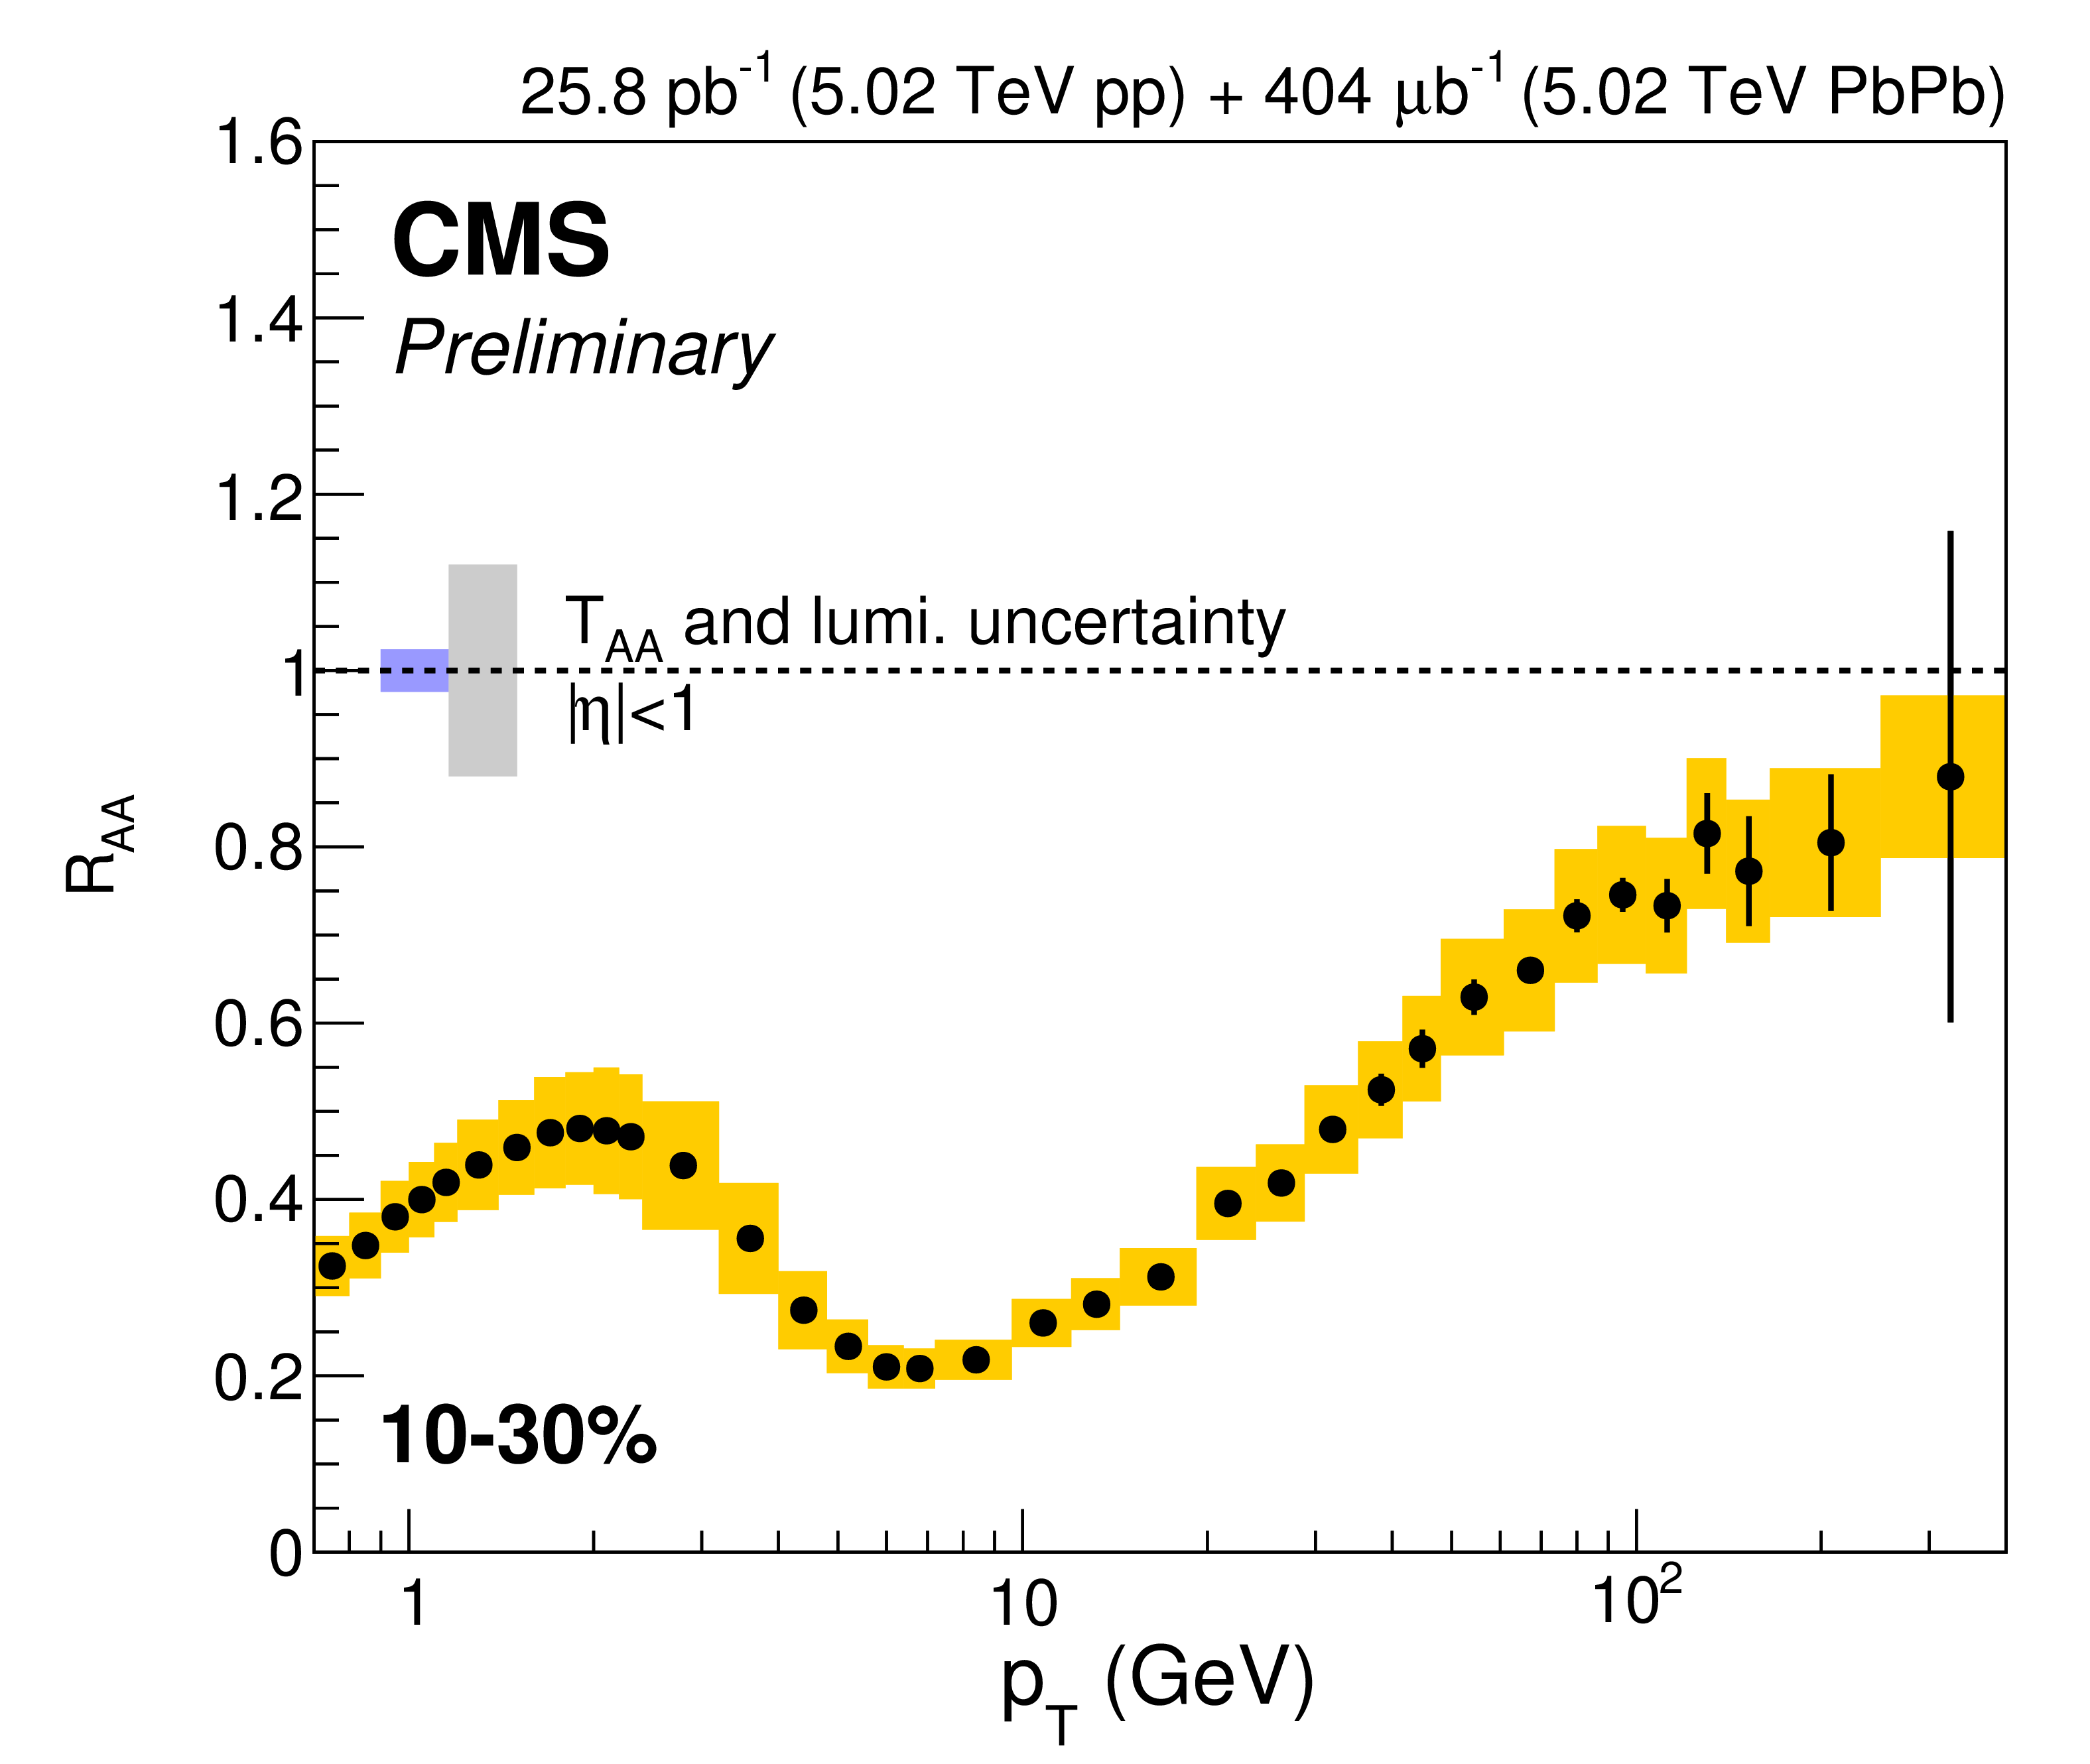
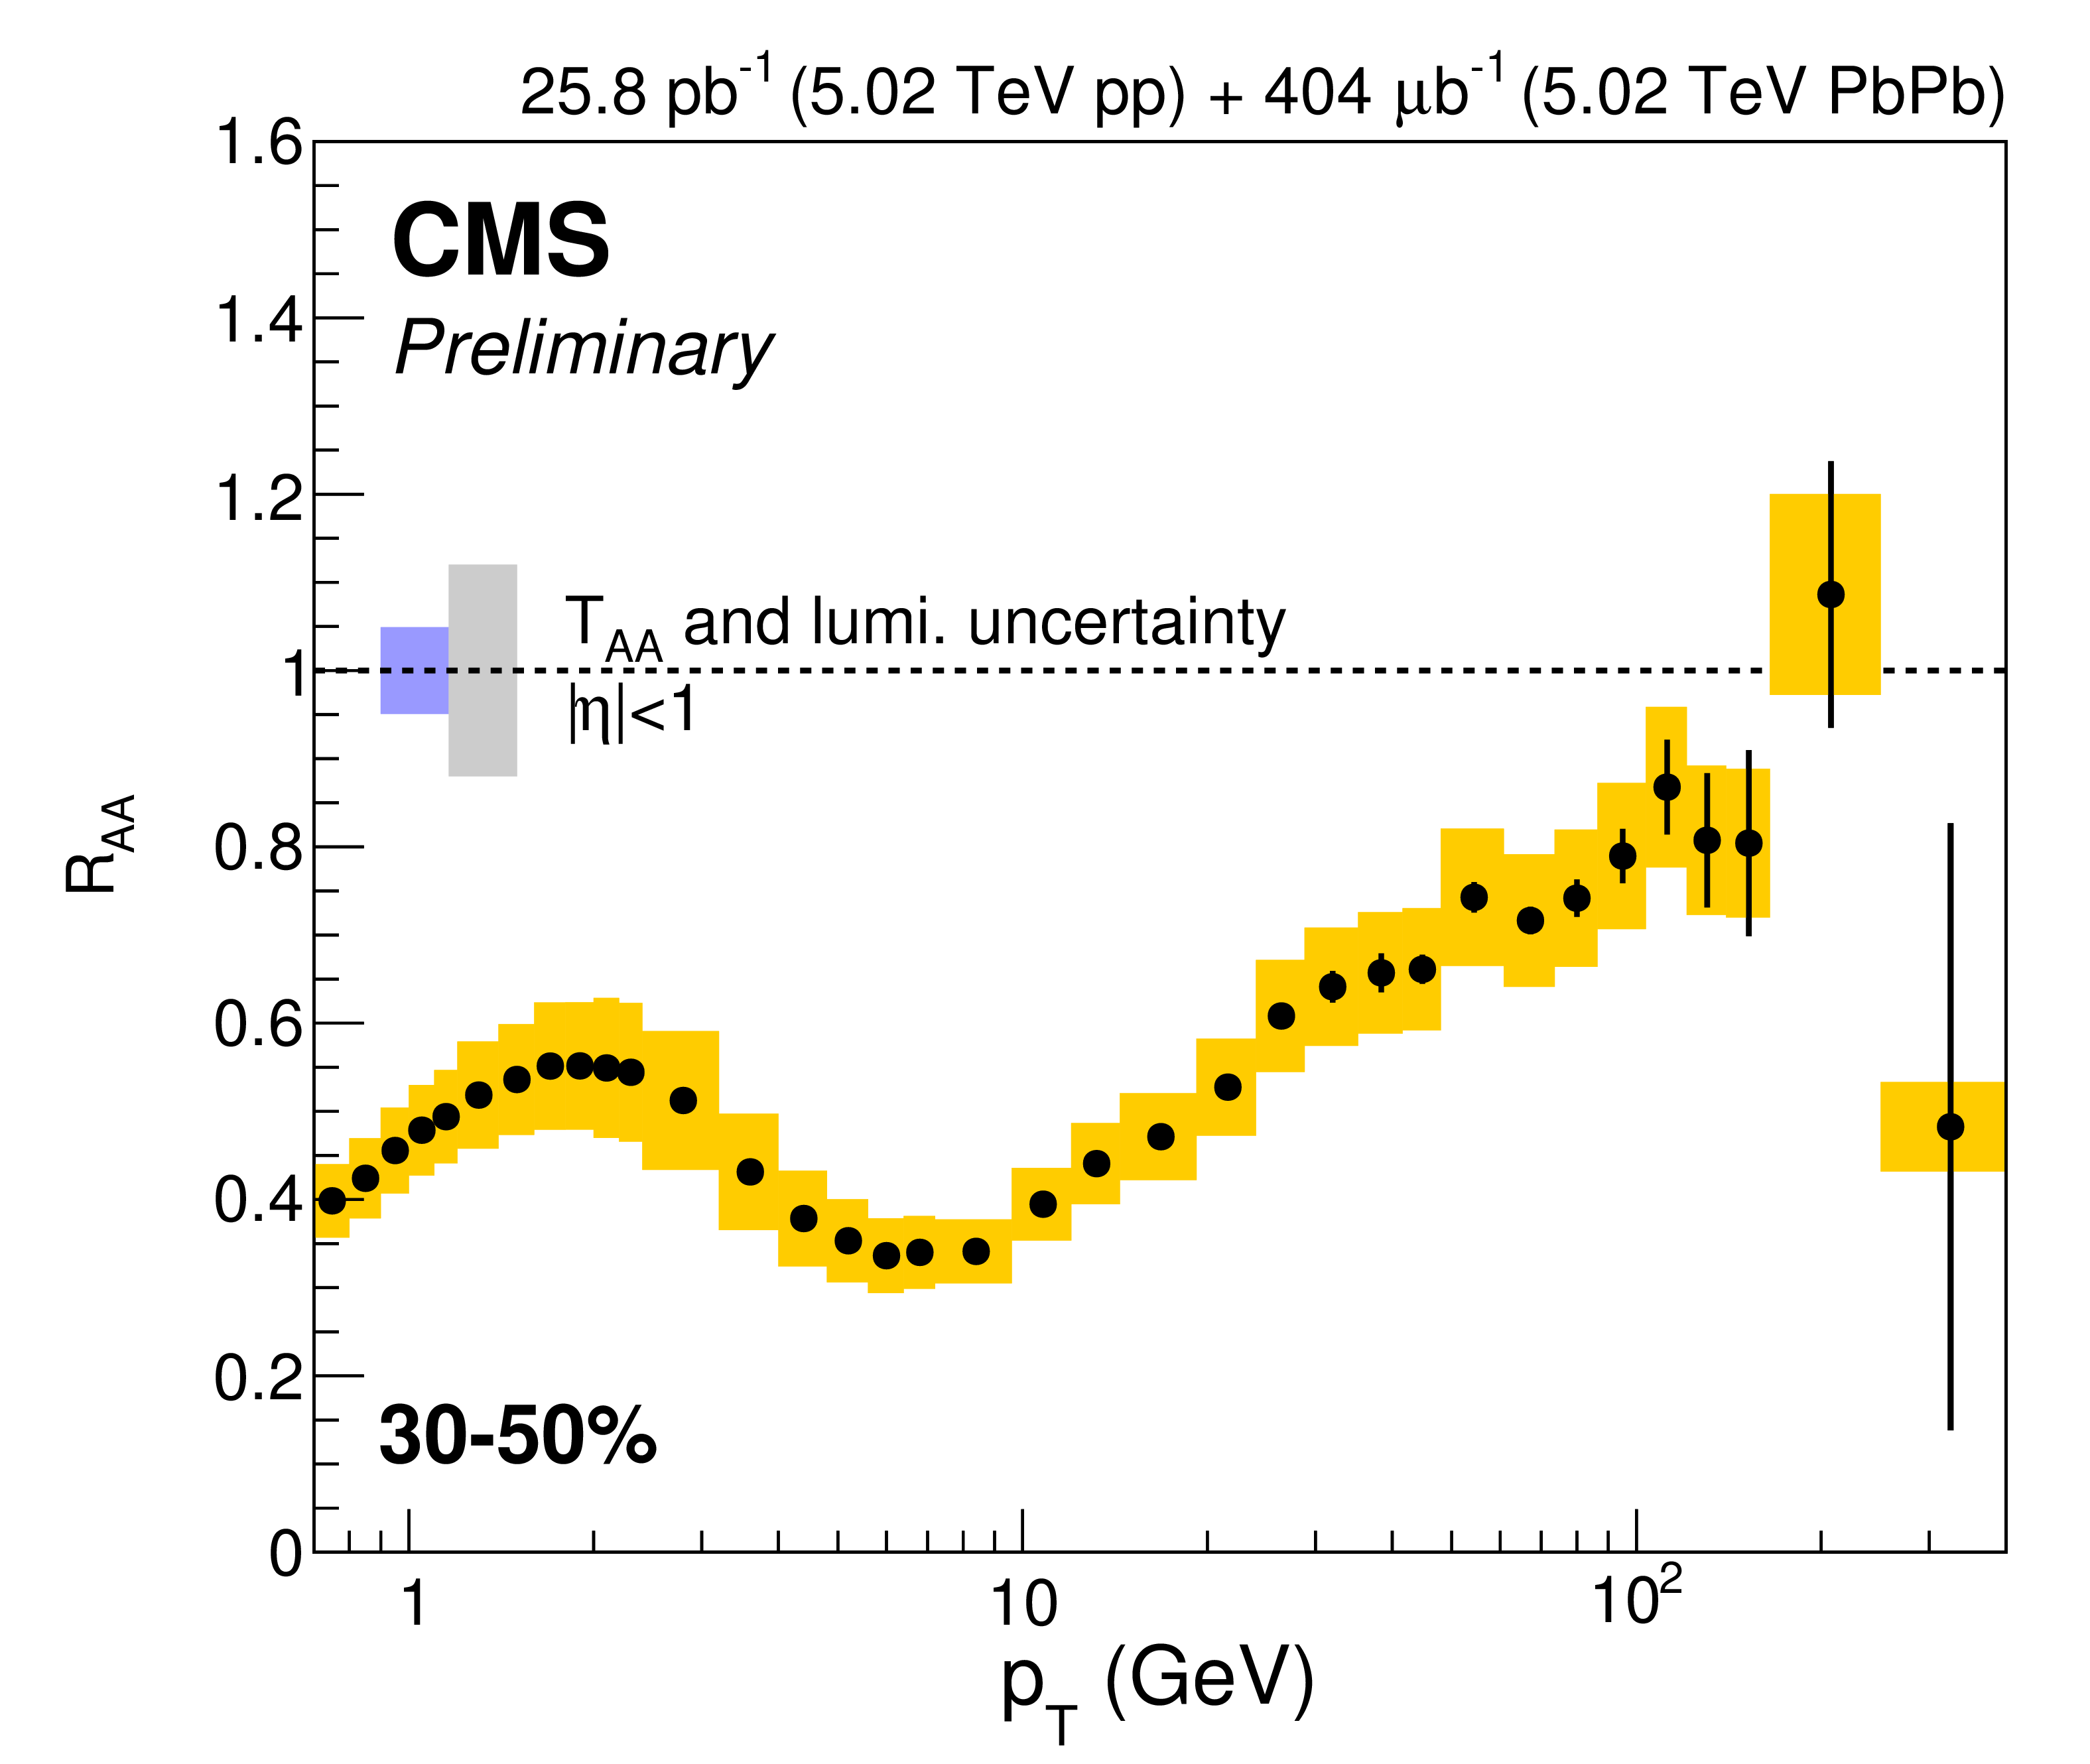
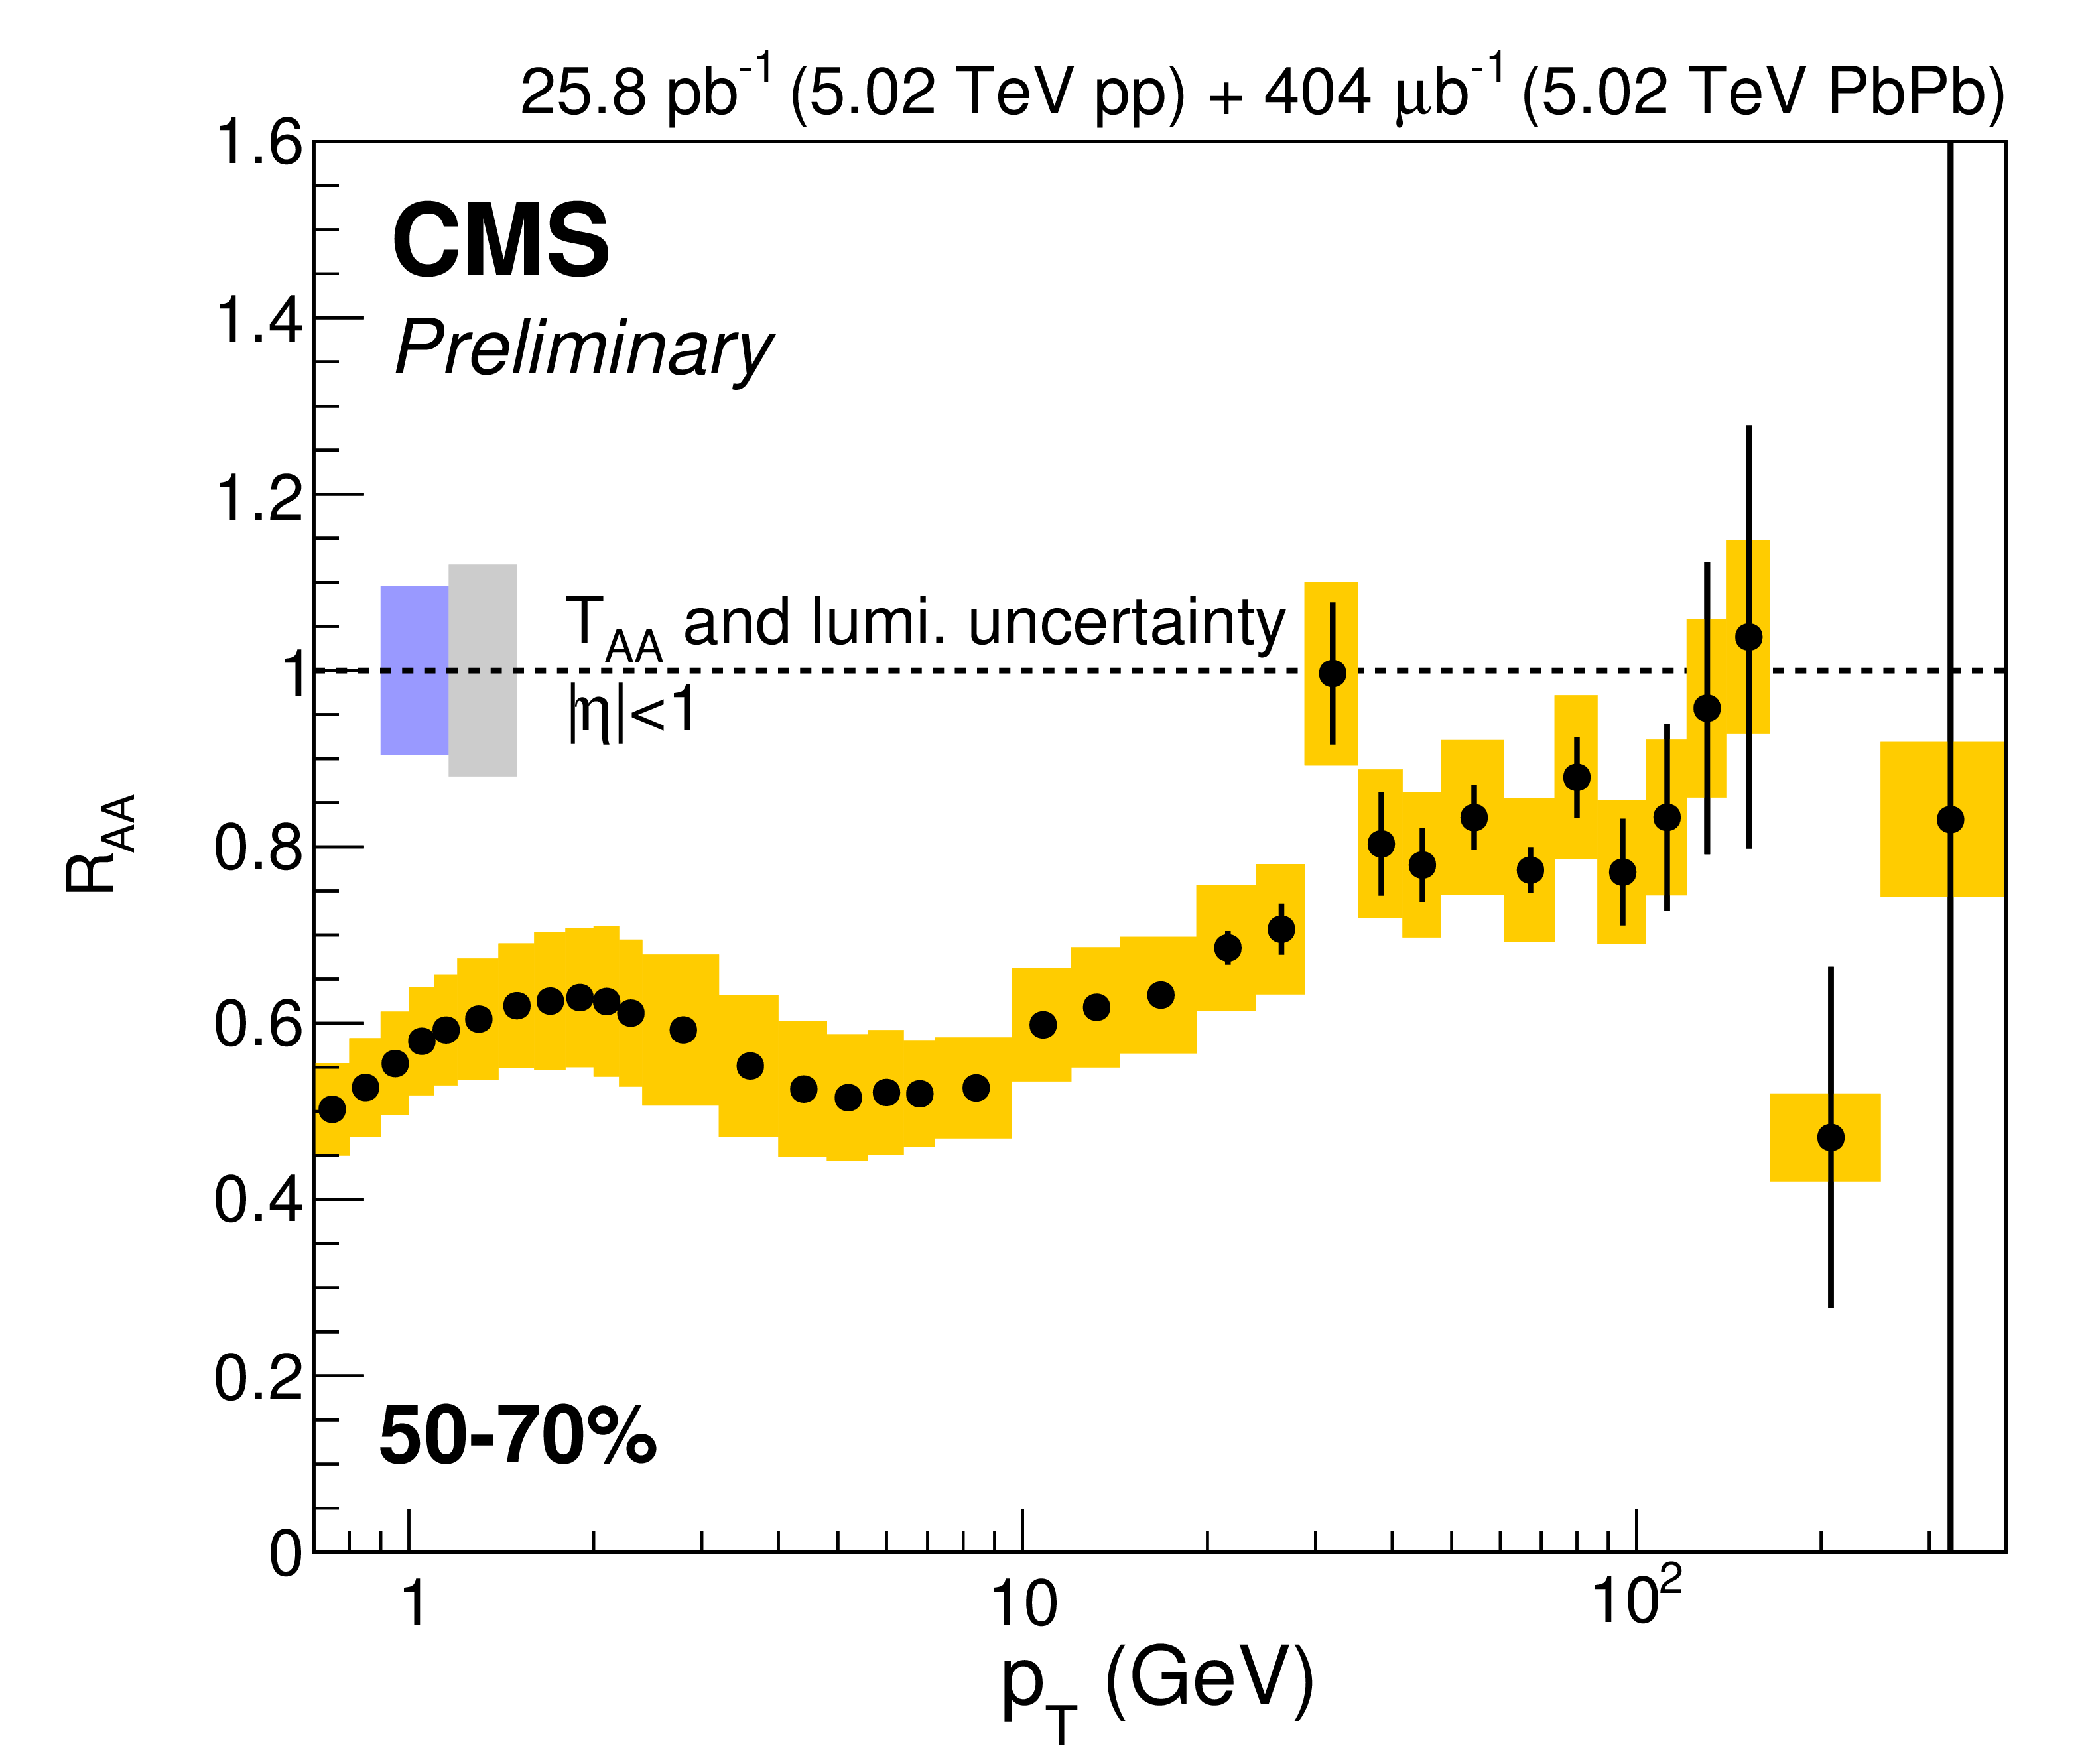
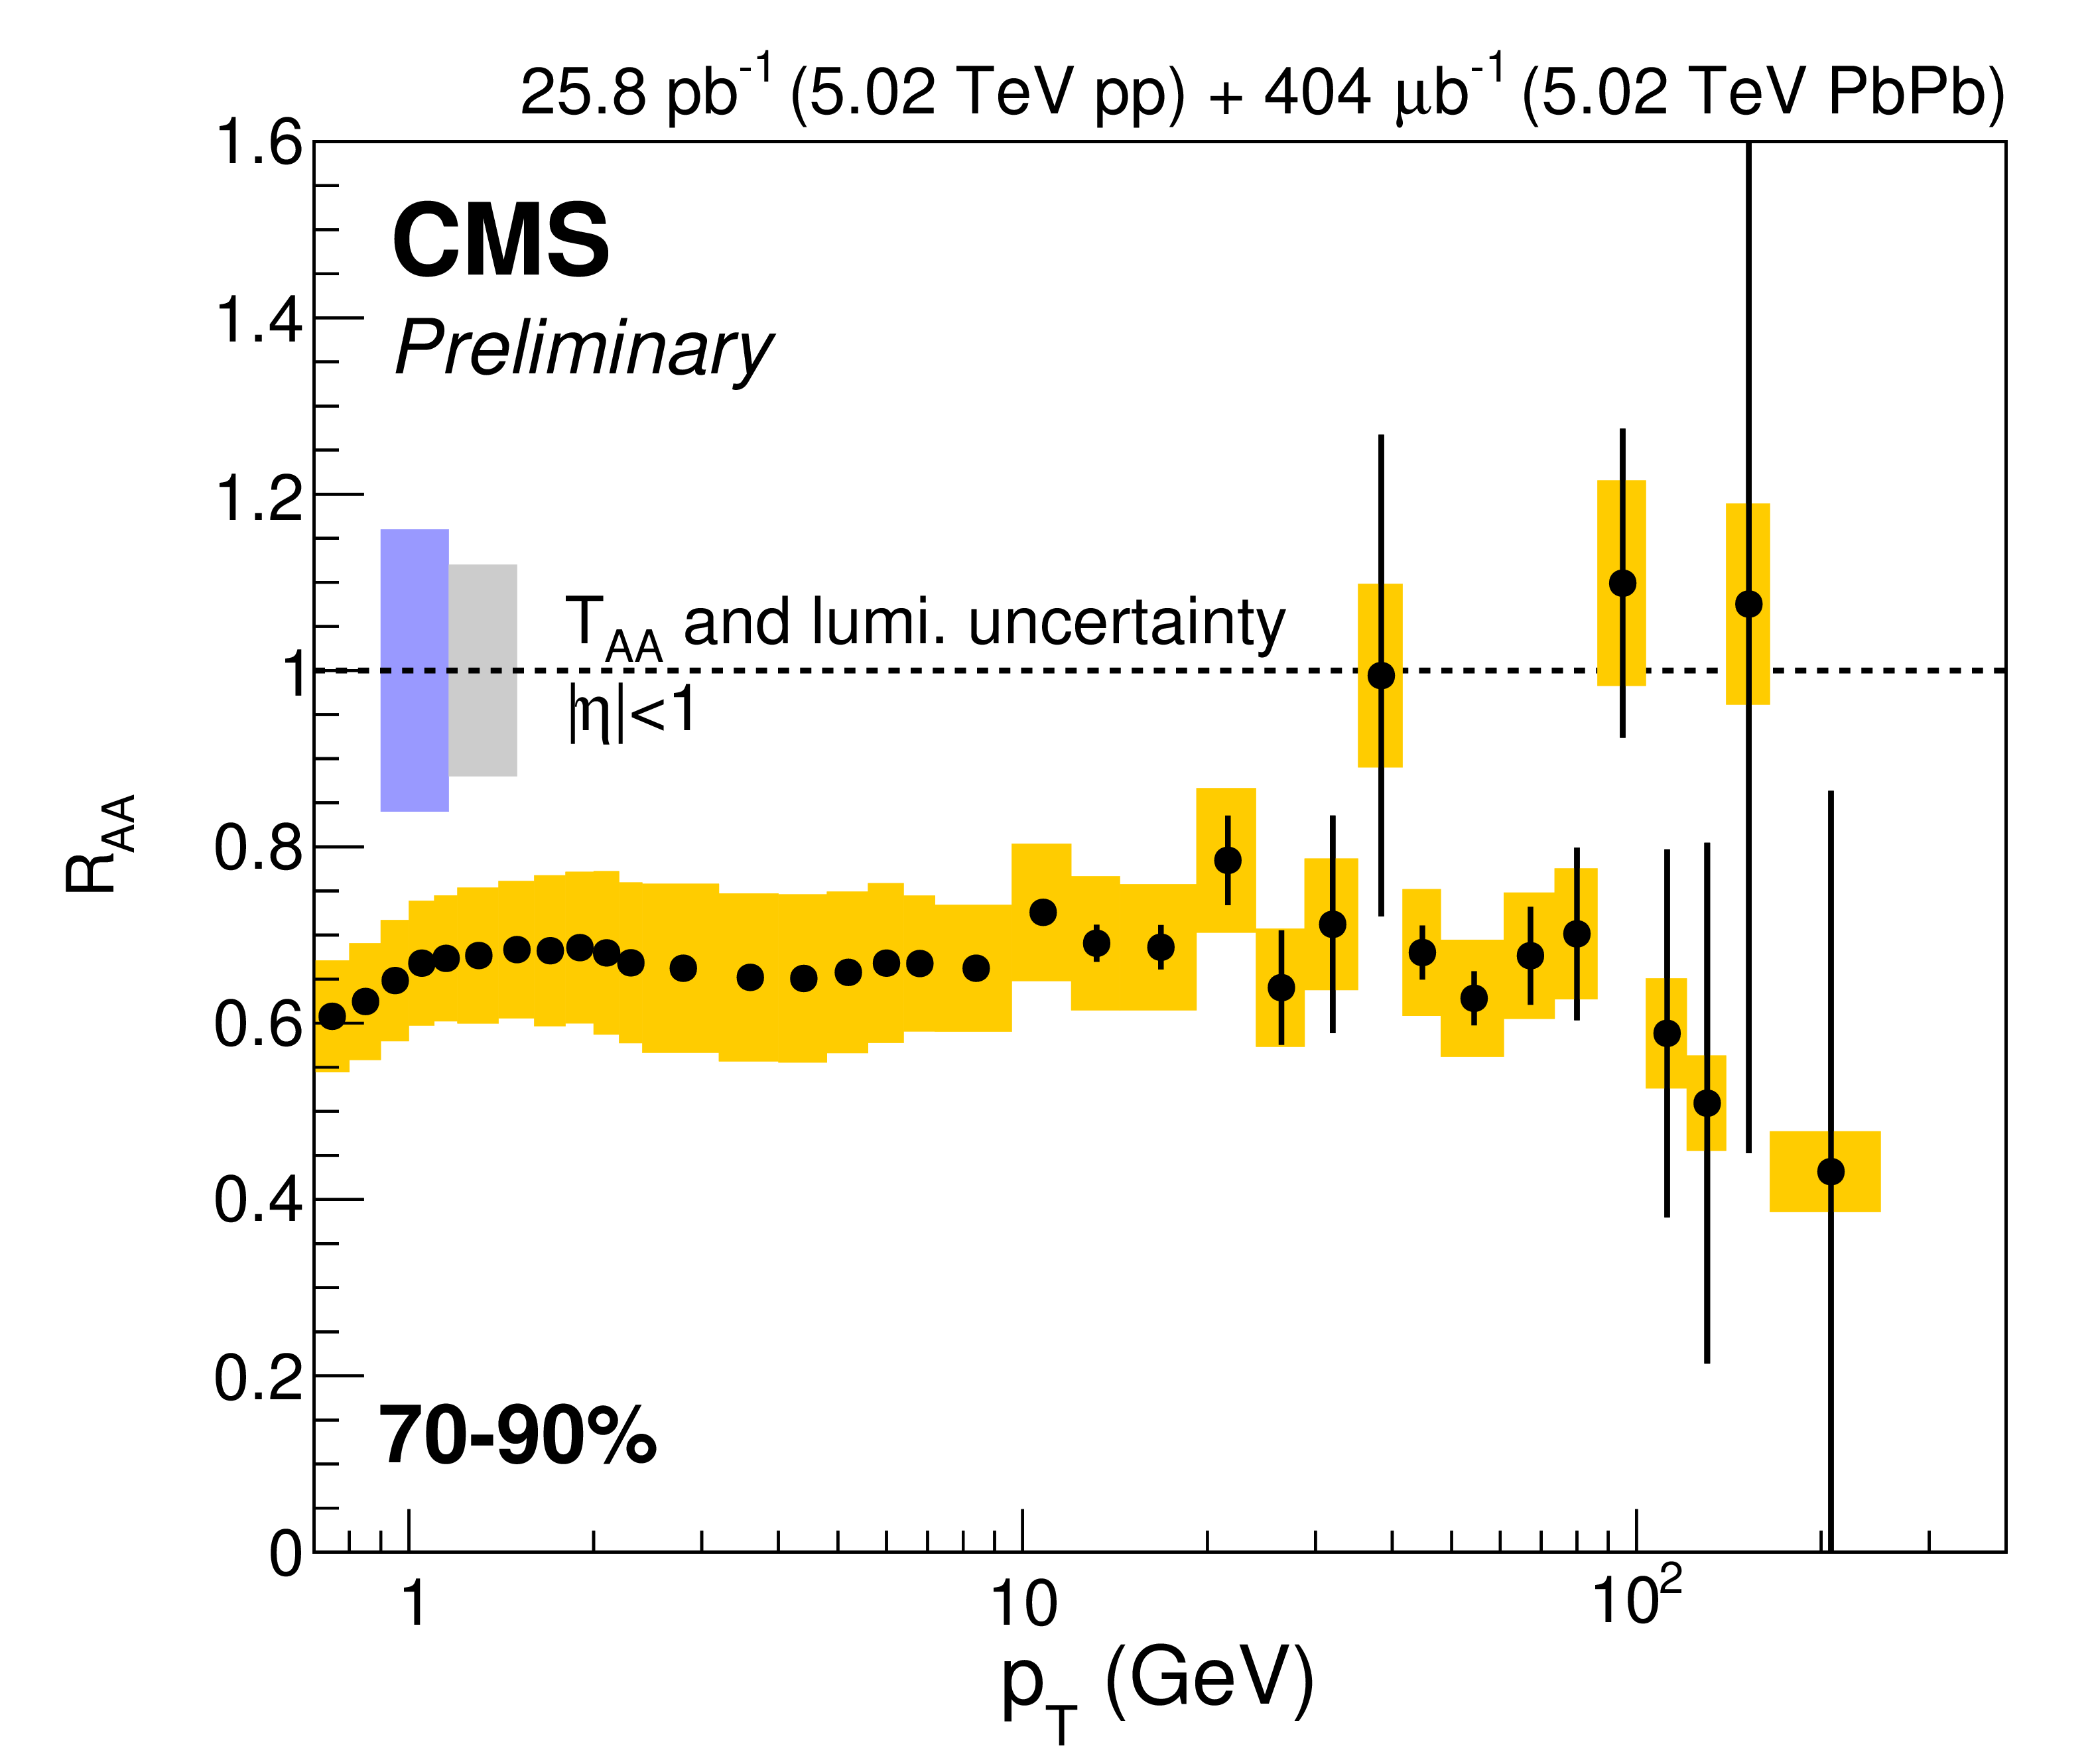
Charged particle $R_{\rm AA}$ measured in six different centrality ranges in PbPb collisions at $\sqrt {s_{\rm NN}}= $ 5.02 TeV collision energy. The error bars represent the statistical uncertainties, the blue and gray error boxes around 1 show the Glauber-model-related $T_{\rm AA}$ and the pp luminosity uncertainties, respectively, while the yellow band represents all other systematic uncertainties. |

png pdf |
Figure 2-b:
Charged particle $R_{\rm AA}$ measured in six different centrality ranges in PbPb collisions at $\sqrt {s_{\rm NN}}= $ 5.02 TeV collision energy. The error bars represent the statistical uncertainties, the blue and gray error boxes around 1 show the Glauber-model-related $T_{\rm AA}$ and the pp luminosity uncertainties, respectively, while the yellow band represents all other systematic uncertainties. |
png pdf |
Figure 2-c:
Charged particle $R_{\rm AA}$ measured in six different centrality ranges in PbPb collisions at $\sqrt {s_{\rm NN}}= $ 5.02 TeV collision energy. The error bars represent the statistical uncertainties, the blue and gray error boxes around 1 show the Glauber-model-related $T_{\rm AA}$ and the pp luminosity uncertainties, respectively, while the yellow band represents all other systematic uncertainties. |
png pdf |
Figure 2-d:
Charged particle $R_{\rm AA}$ measured in six different centrality ranges in PbPb collisions at $\sqrt {s_{\rm NN}}= $ 5.02 TeV collision energy. The error bars represent the statistical uncertainties, the blue and gray error boxes around 1 show the Glauber-model-related $T_{\rm AA}$ and the pp luminosity uncertainties, respectively, while the yellow band represents all other systematic uncertainties. |
png pdf |
Figure 2-e:
Charged particle $R_{\rm AA}$ measured in six different centrality ranges in PbPb collisions at $\sqrt {s_{\rm NN}}= $ 5.02 TeV collision energy. The error bars represent the statistical uncertainties, the blue and gray error boxes around 1 show the Glauber-model-related $T_{\rm AA}$ and the pp luminosity uncertainties, respectively, while the yellow band represents all other systematic uncertainties. |
png pdf |
Figure 2-f:
Charged particle $R_{\rm AA}$ measured in six different centrality ranges in PbPb collisions at $\sqrt {s_{\rm NN}}= $ 5.02 TeV collision energy. The error bars represent the statistical uncertainties, the blue and gray error boxes around 1 show the Glauber-model-related $T_{\rm AA}$ and the pp luminosity uncertainties, respectively, while the yellow band represents all other systematic uncertainties. |

png pdf |
Figure 3-a:
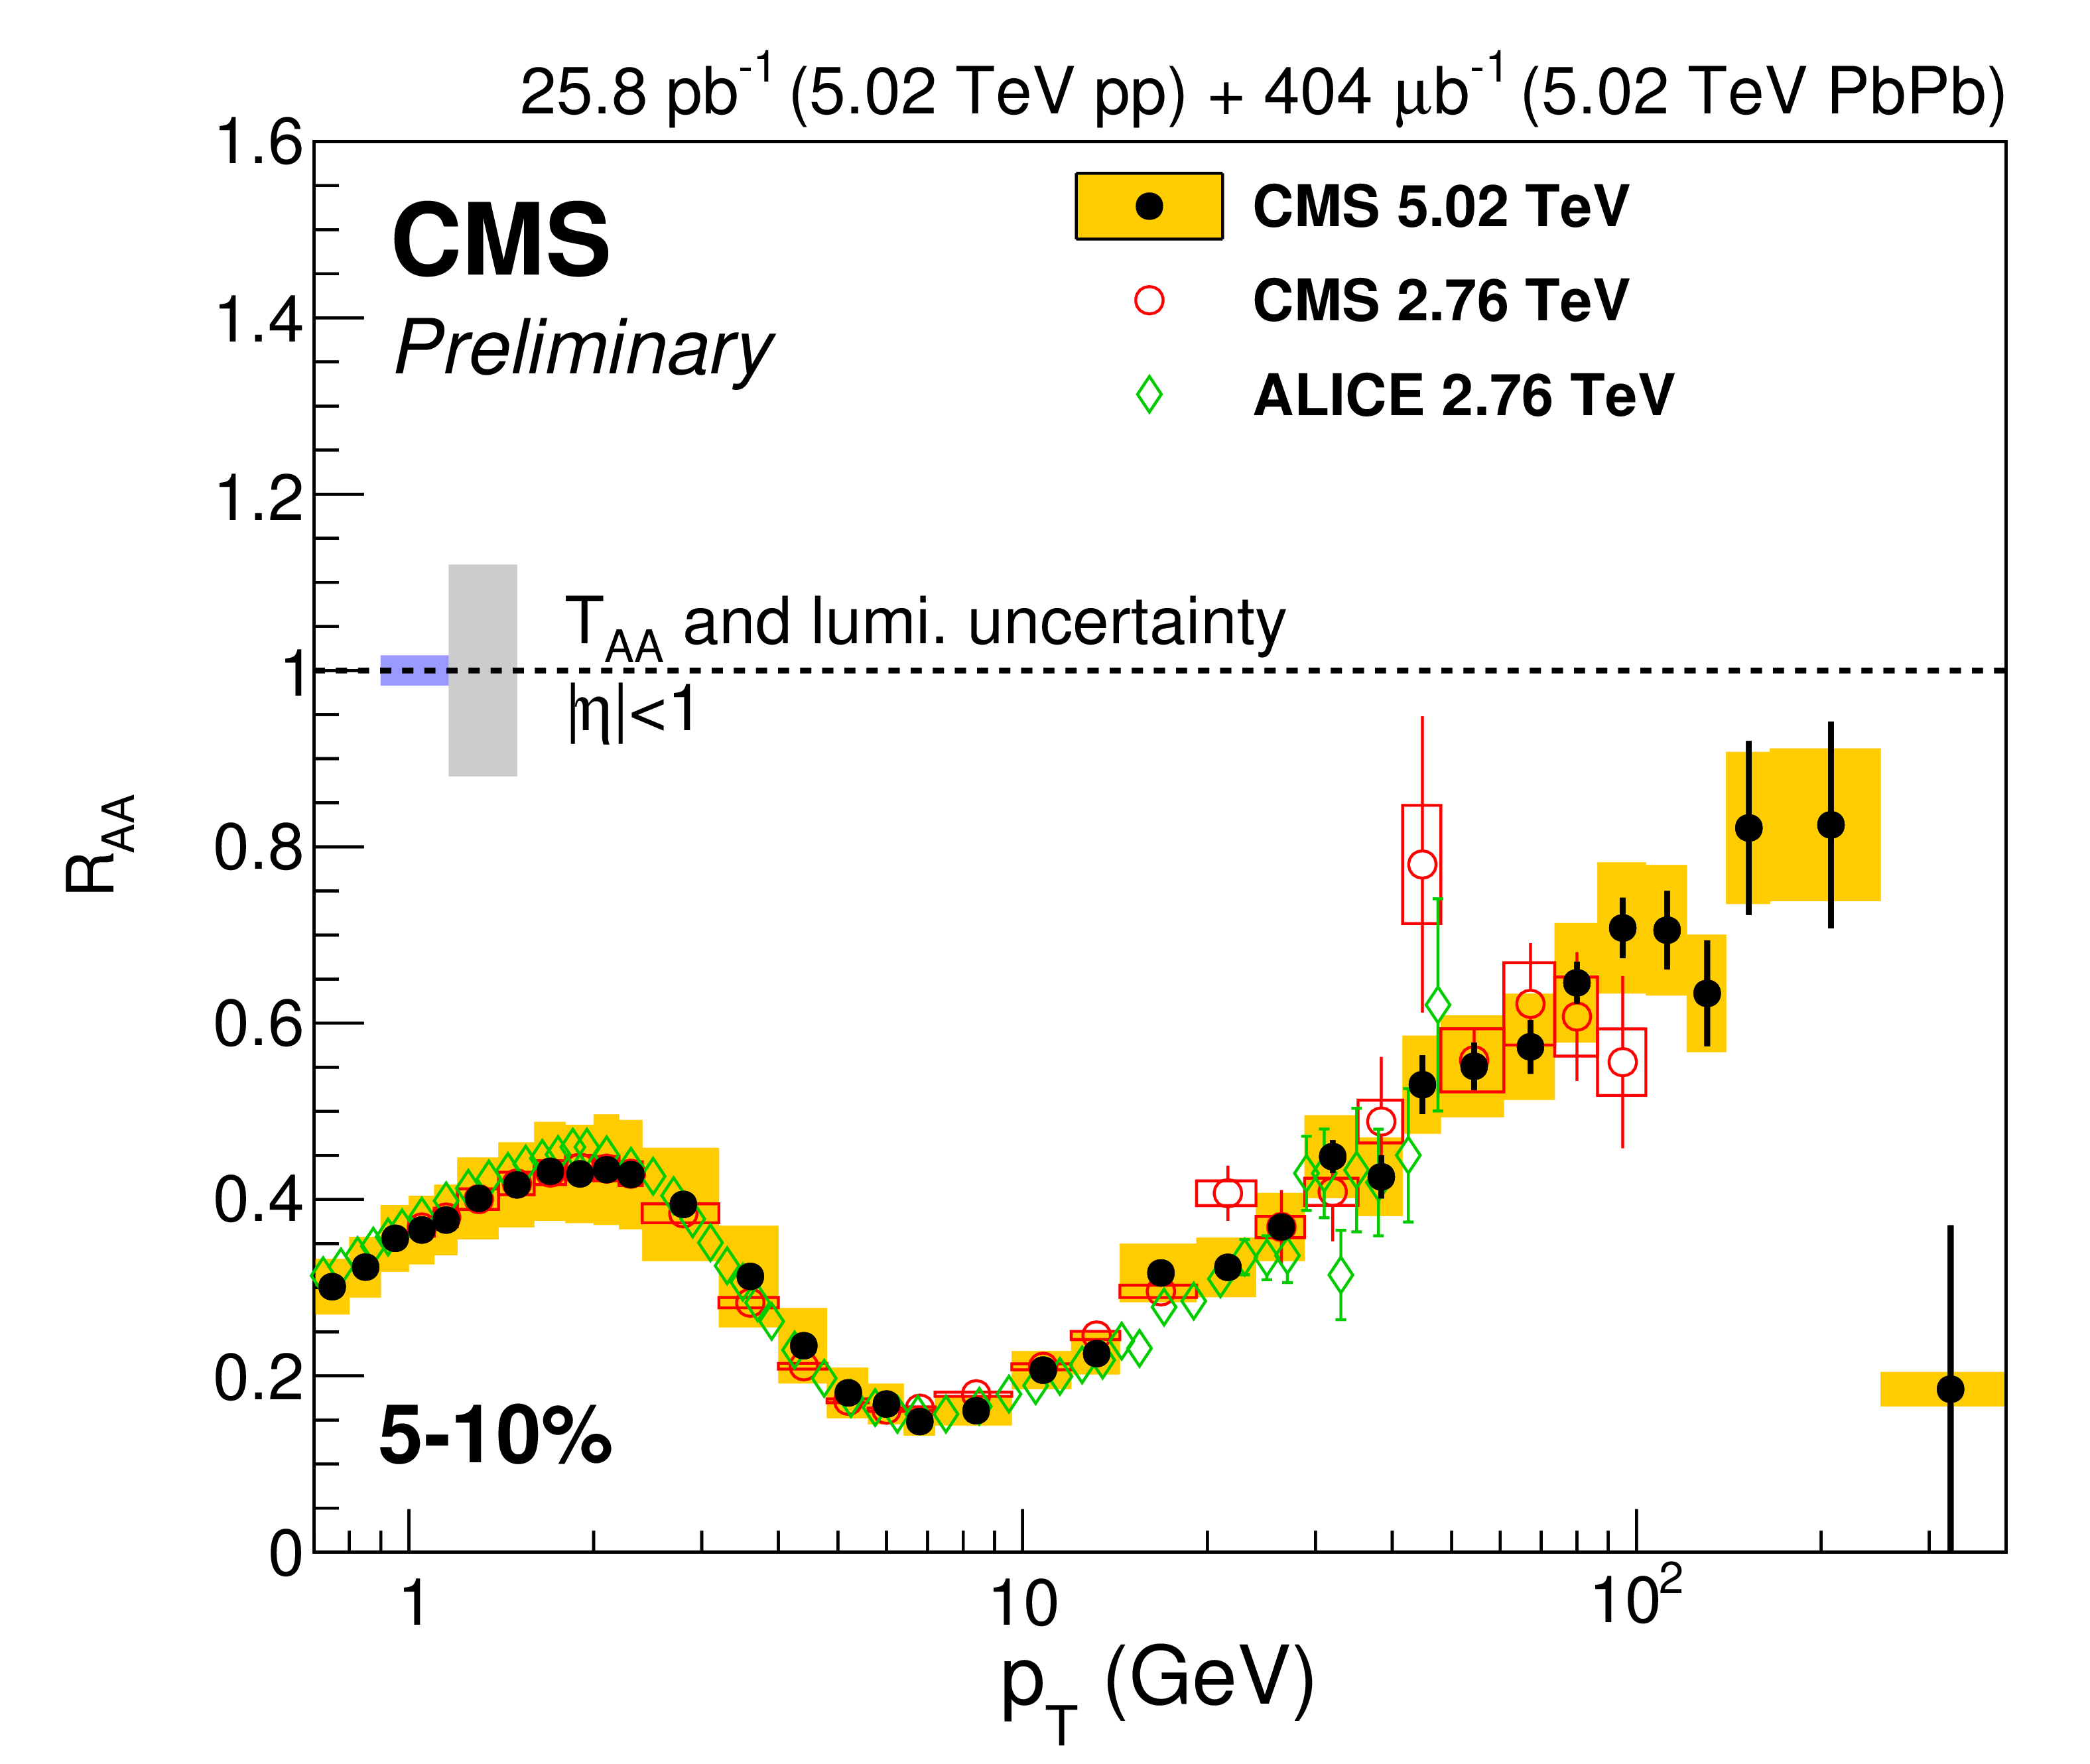
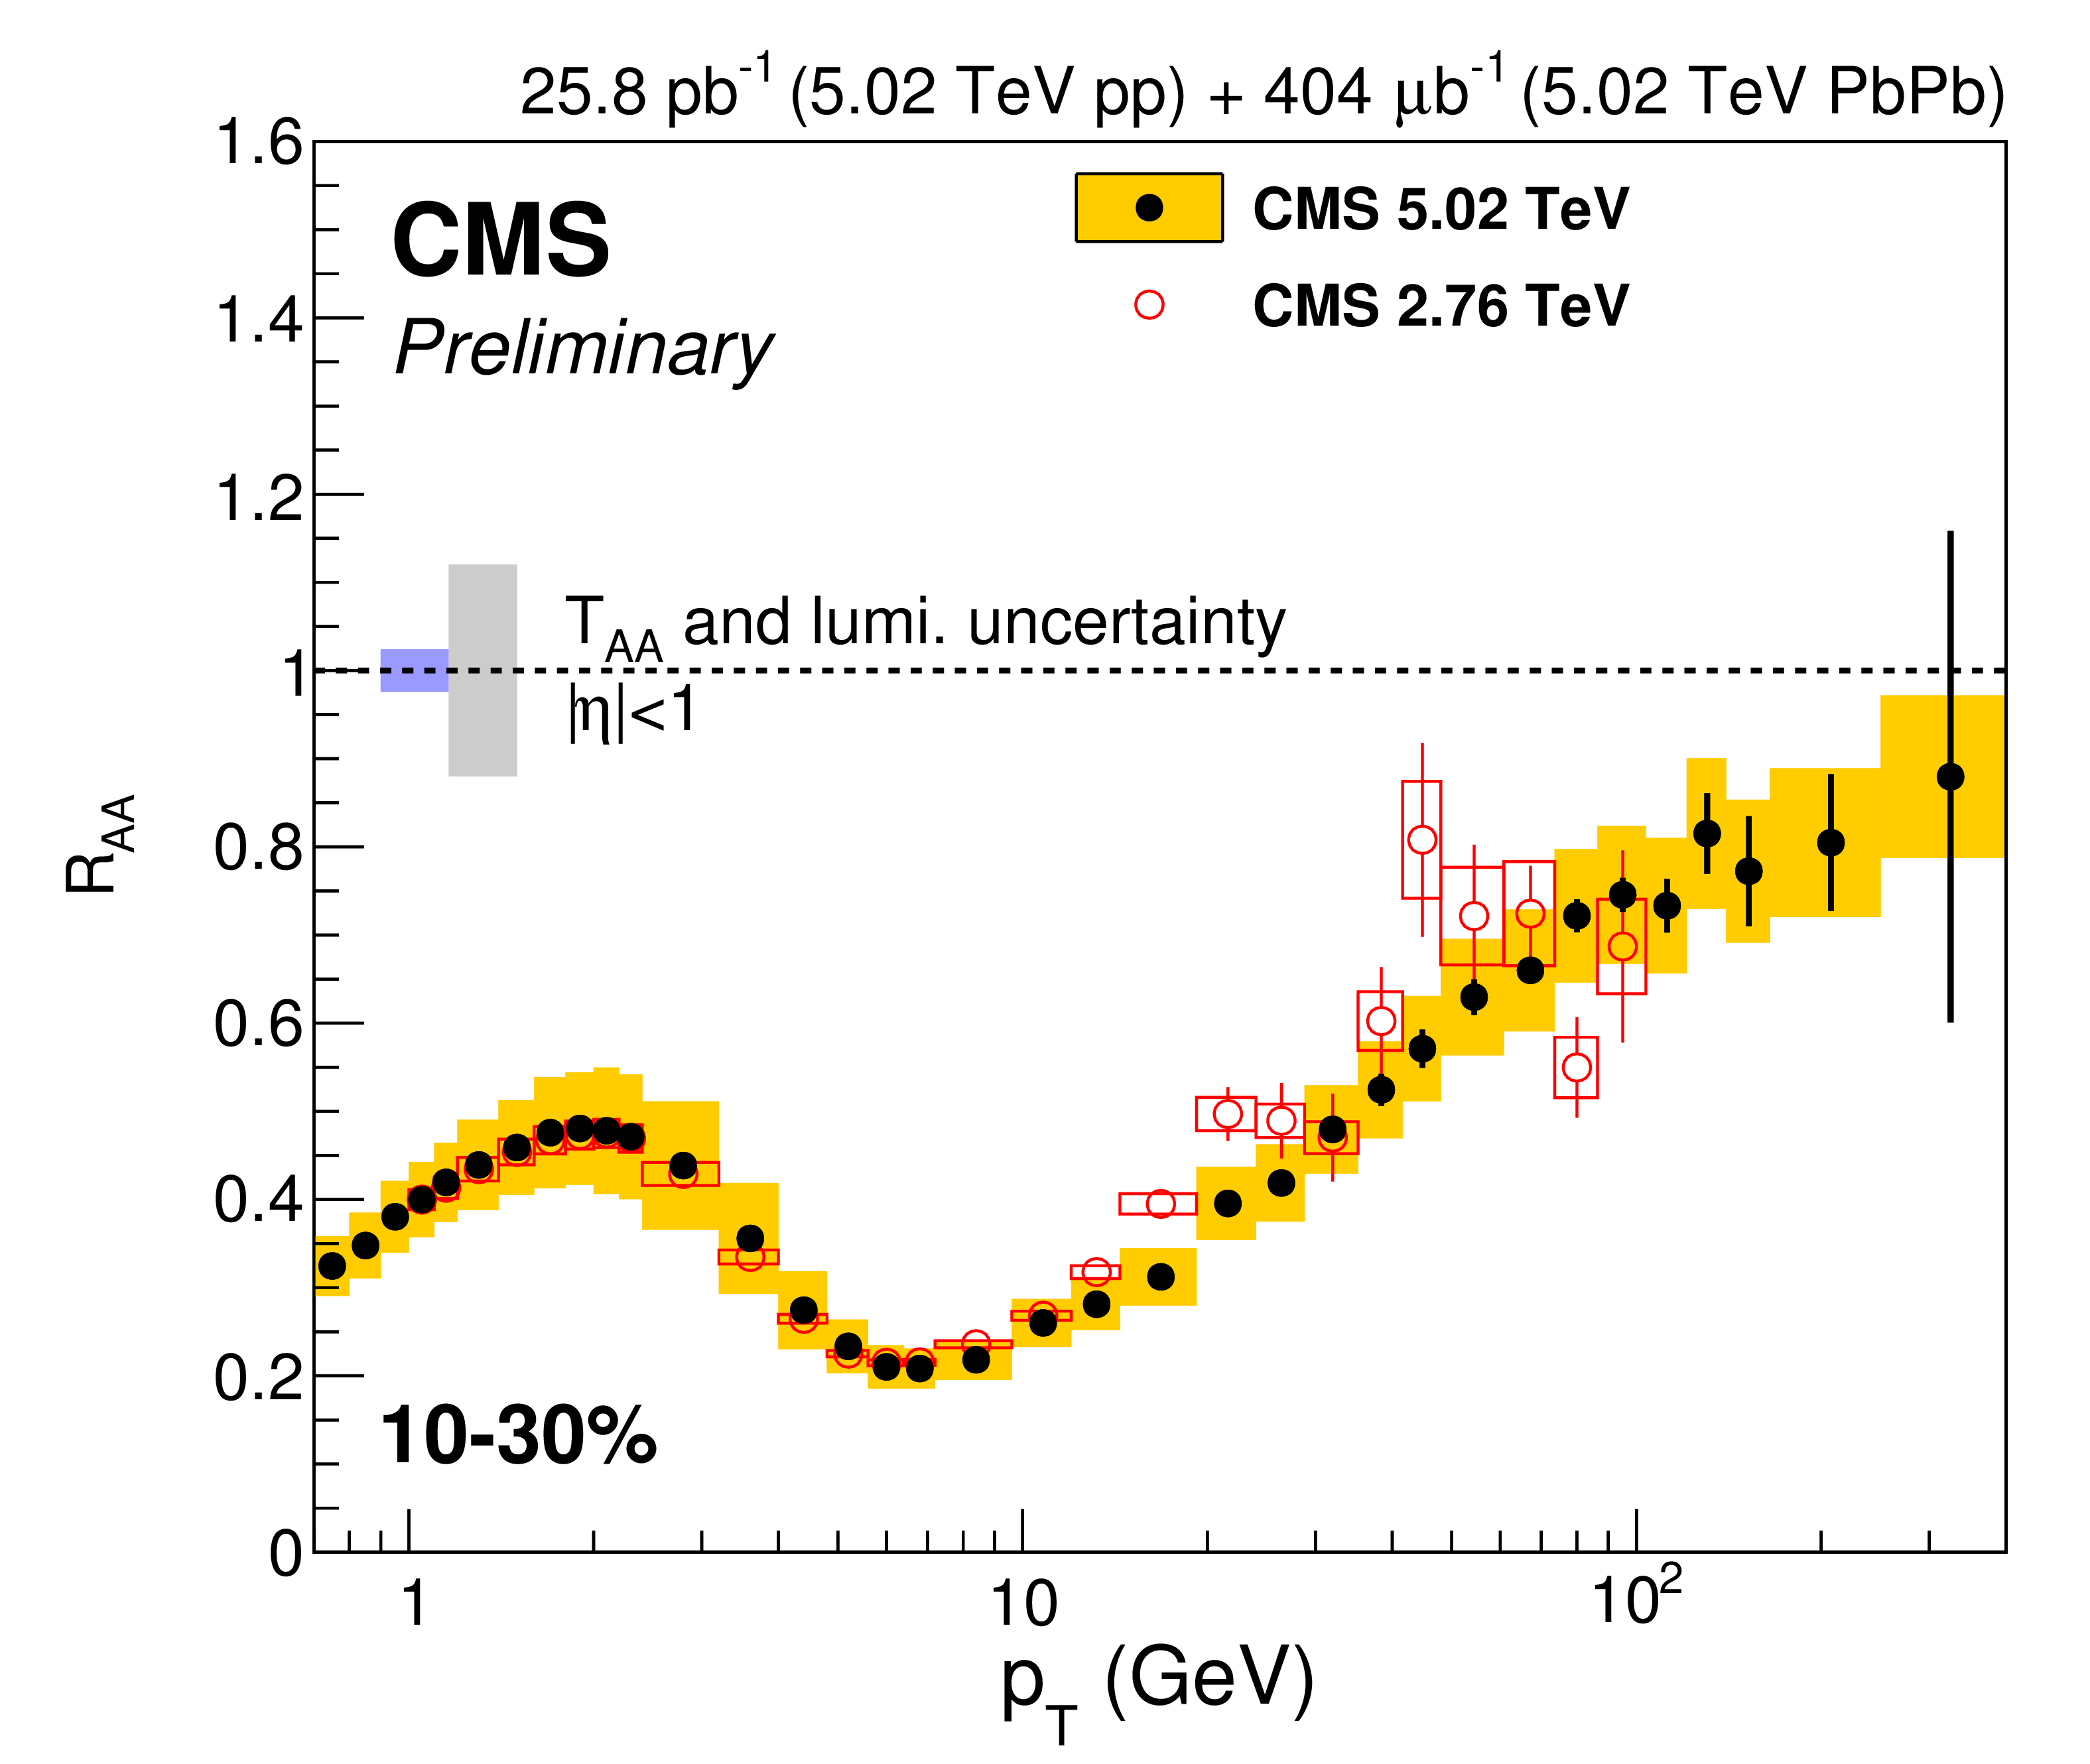
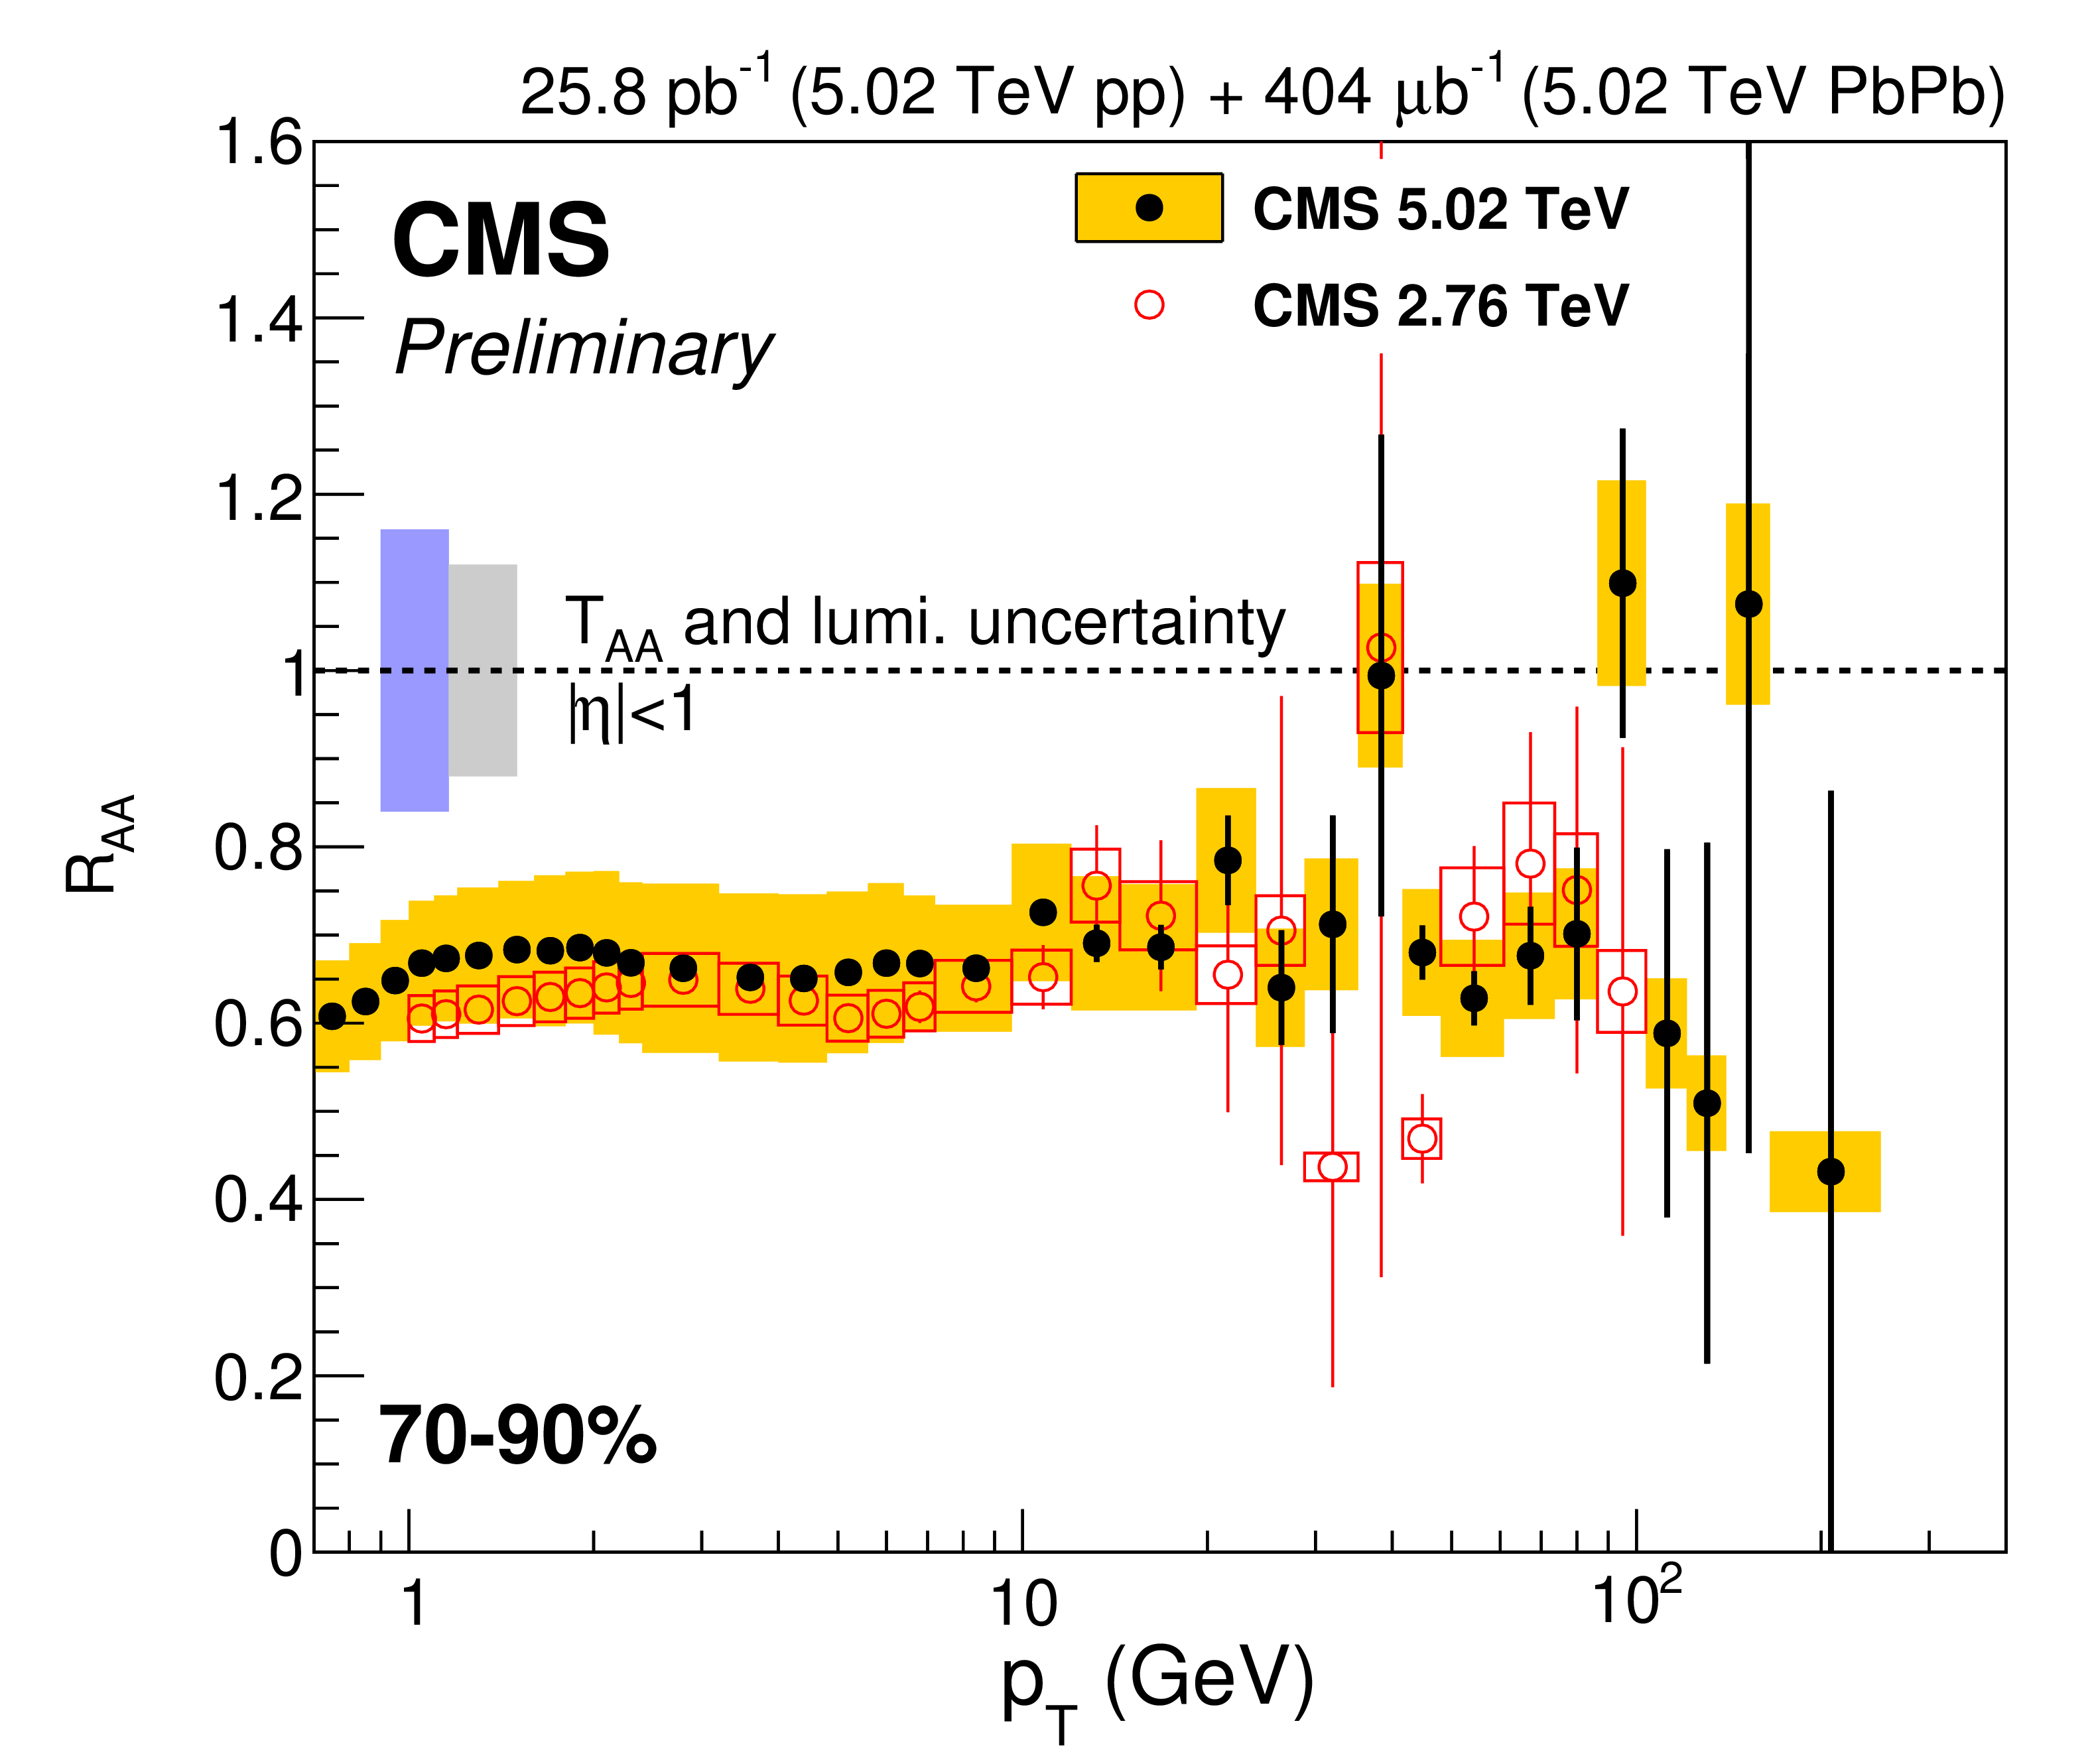
Charged particle $R_{\rm AA}$ measured in six different centrality ranges at $\sqrt {s_{\rm NN}}= $ 5.02 TeV compared to CMS [10] (all centrality bins), ALICE [8] (in the 0-5% and 5-10% centrality bins) and ATLAS [9] (in the 0-5% centrality bin) results at a center-of-mass energy per nucleon pair of 2.76 TeV. |
png pdf |
Figure 3-b:
Charged particle $R_{\rm AA}$ measured in six different centrality ranges at $\sqrt {s_{\rm NN}}= $ 5.02 TeV compared to CMS [10] (all centrality bins), ALICE [8] (in the 0-5% and 5-10% centrality bins) and ATLAS [9] (in the 0-5% centrality bin) results at a center-of-mass energy per nucleon pair of 2.76 TeV. |
png pdf |
Figure 3-c:
Charged particle $R_{\rm AA}$ measured in six different centrality ranges at $\sqrt {s_{\rm NN}}= $ 5.02 TeV compared to CMS [10] (all centrality bins), ALICE [8] (in the 0-5% and 5-10% centrality bins) and ATLAS [9] (in the 0-5% centrality bin) results at a center-of-mass energy per nucleon pair of 2.76 TeV. |

png pdf |
Figure 3-d:
Charged particle $R_{\rm AA}$ measured in six different centrality ranges at $\sqrt {s_{\rm NN}}= $ 5.02 TeV compared to CMS [10] (all centrality bins), ALICE [8] (in the 0-5% and 5-10% centrality bins) and ATLAS [9] (in the 0-5% centrality bin) results at a center-of-mass energy per nucleon pair of 2.76 TeV. |
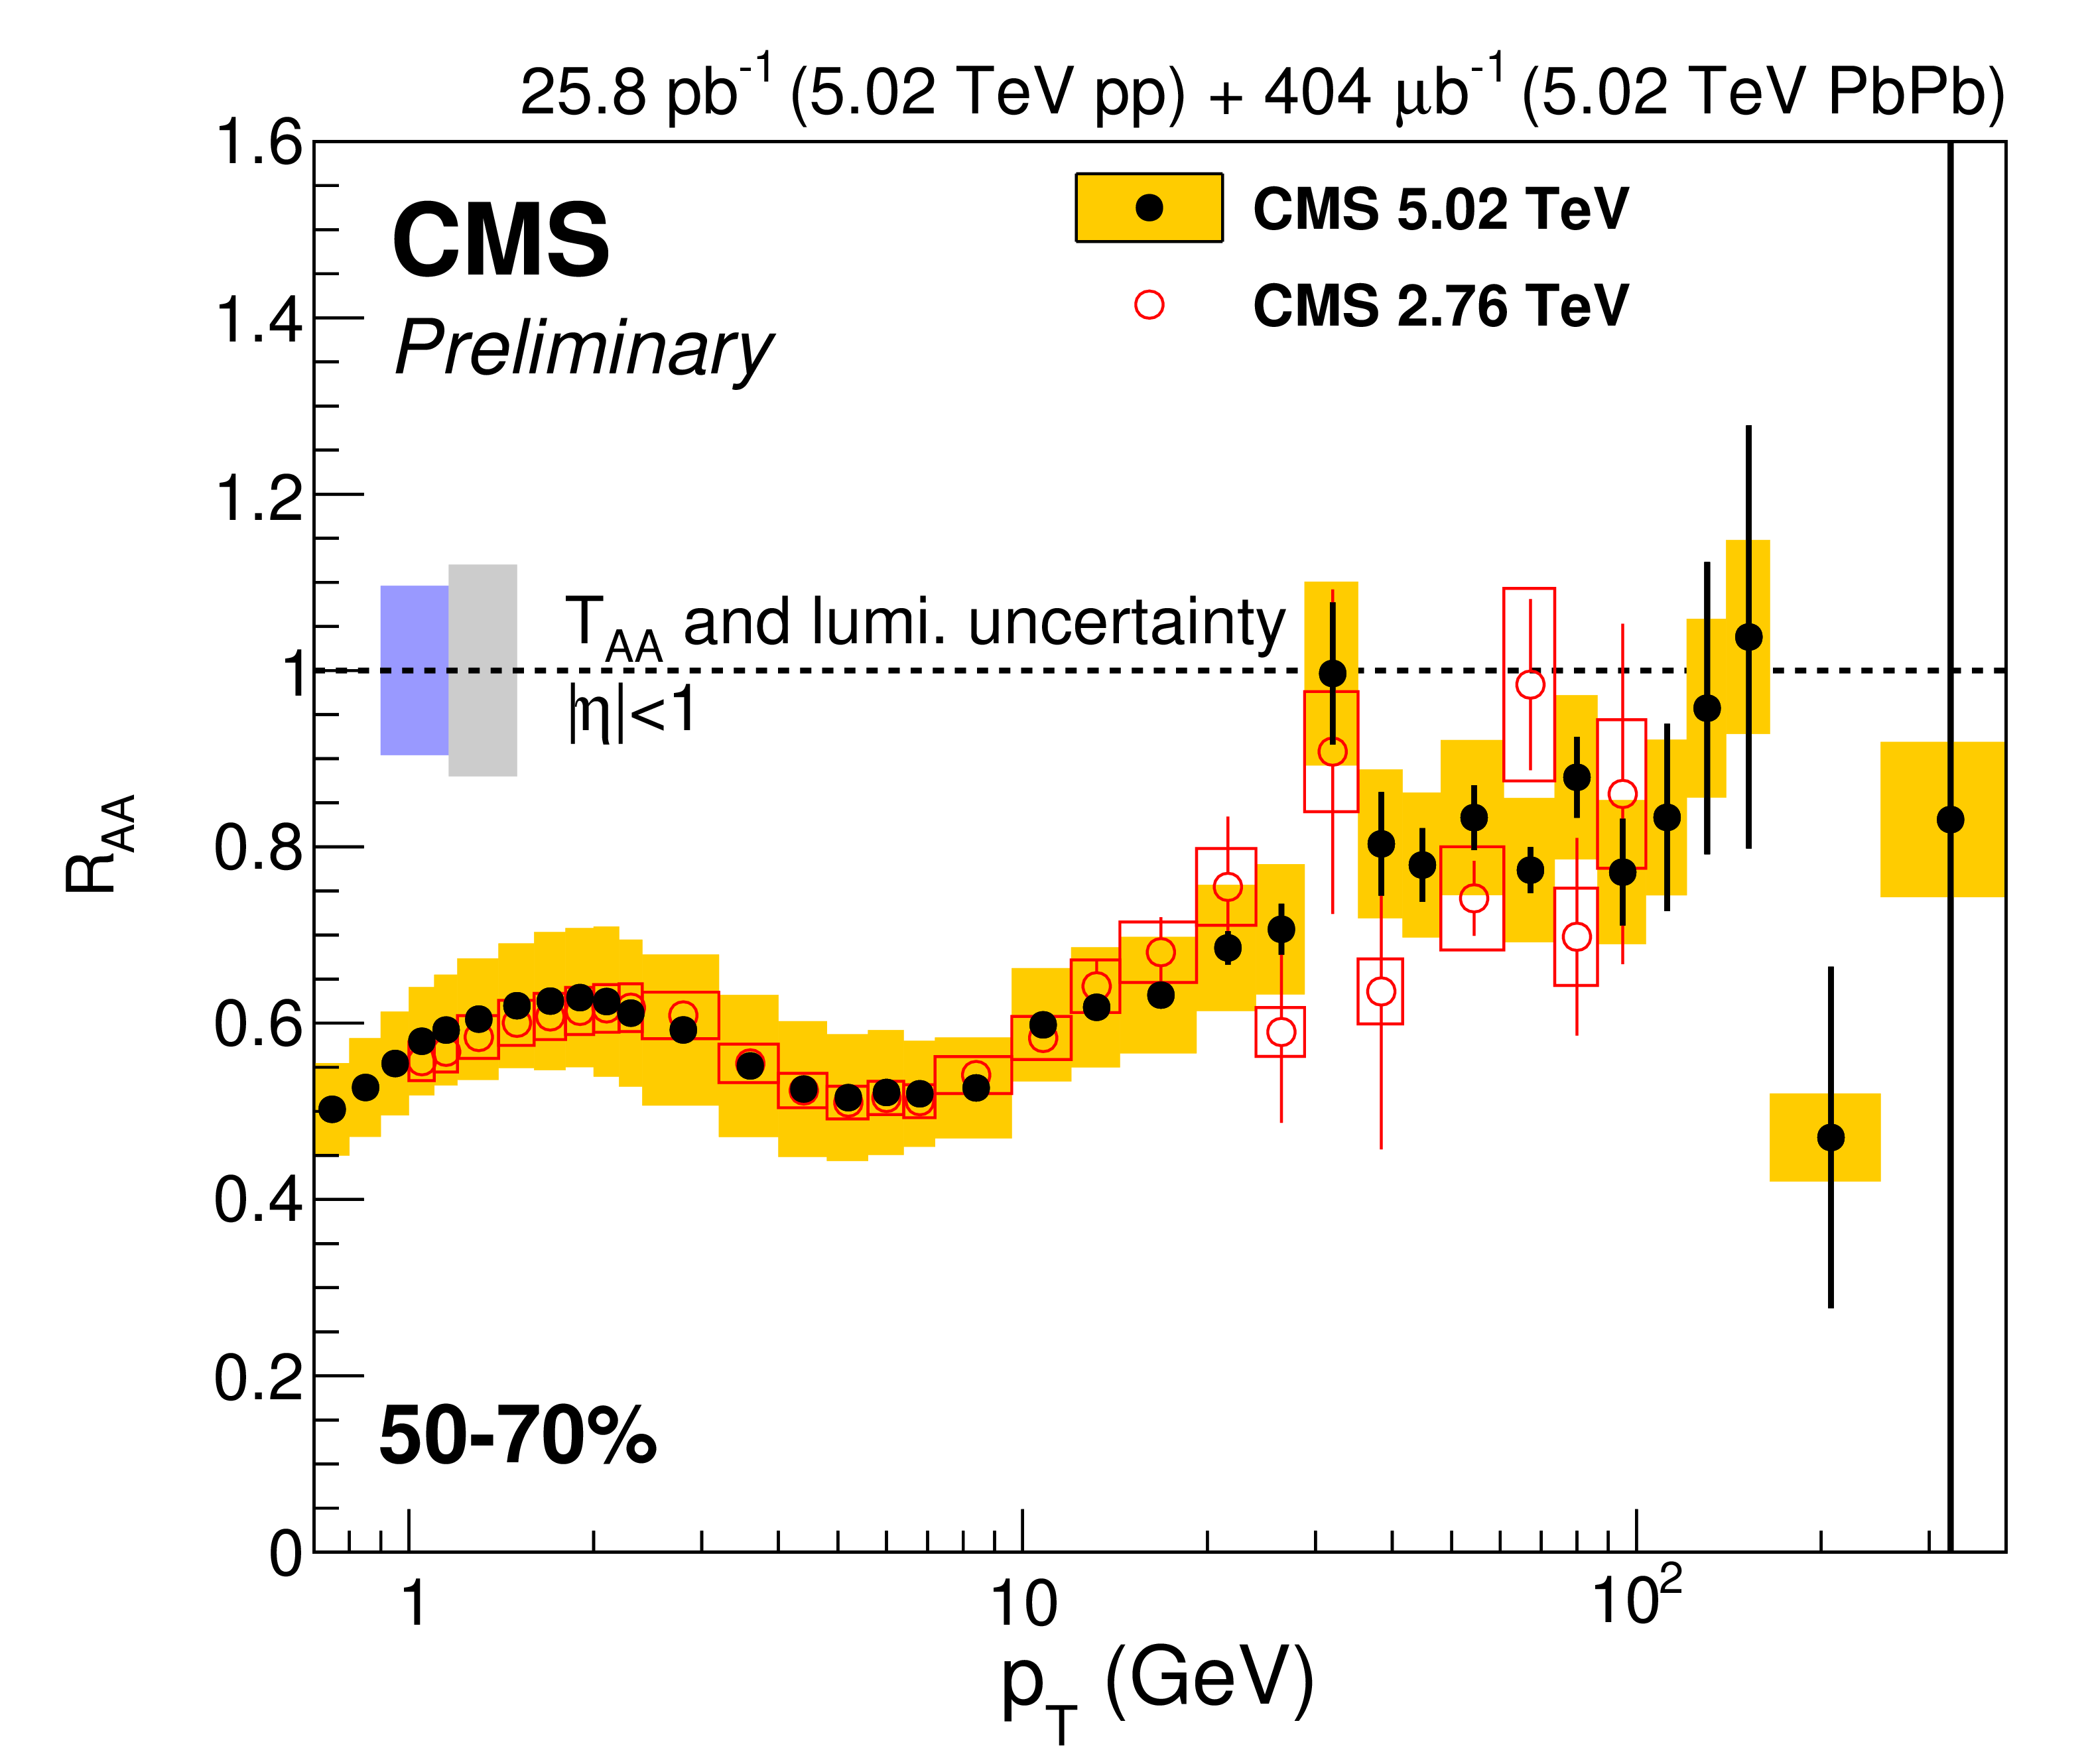
png pdf |
Figure 3-e:
Charged particle $R_{\rm AA}$ measured in six different centrality ranges at $\sqrt {s_{\rm NN}}= $ 5.02 TeV compared to CMS [10] (all centrality bins), ALICE [8] (in the 0-5% and 5-10% centrality bins) and ATLAS [9] (in the 0-5% centrality bin) results at a center-of-mass energy per nucleon pair of 2.76 TeV. |
png pdf |
Figure 3-f:
Charged particle $R_{\rm AA}$ measured in six different centrality ranges at $\sqrt {s_{\rm NN}}= $ 5.02 TeV compared to CMS [10] (all centrality bins), ALICE [8] (in the 0-5% and 5-10% centrality bins) and ATLAS [9] (in the 0-5% centrality bin) results at a center-of-mass energy per nucleon pair of 2.76 TeV. |
png pdf |
Figure 4-a:
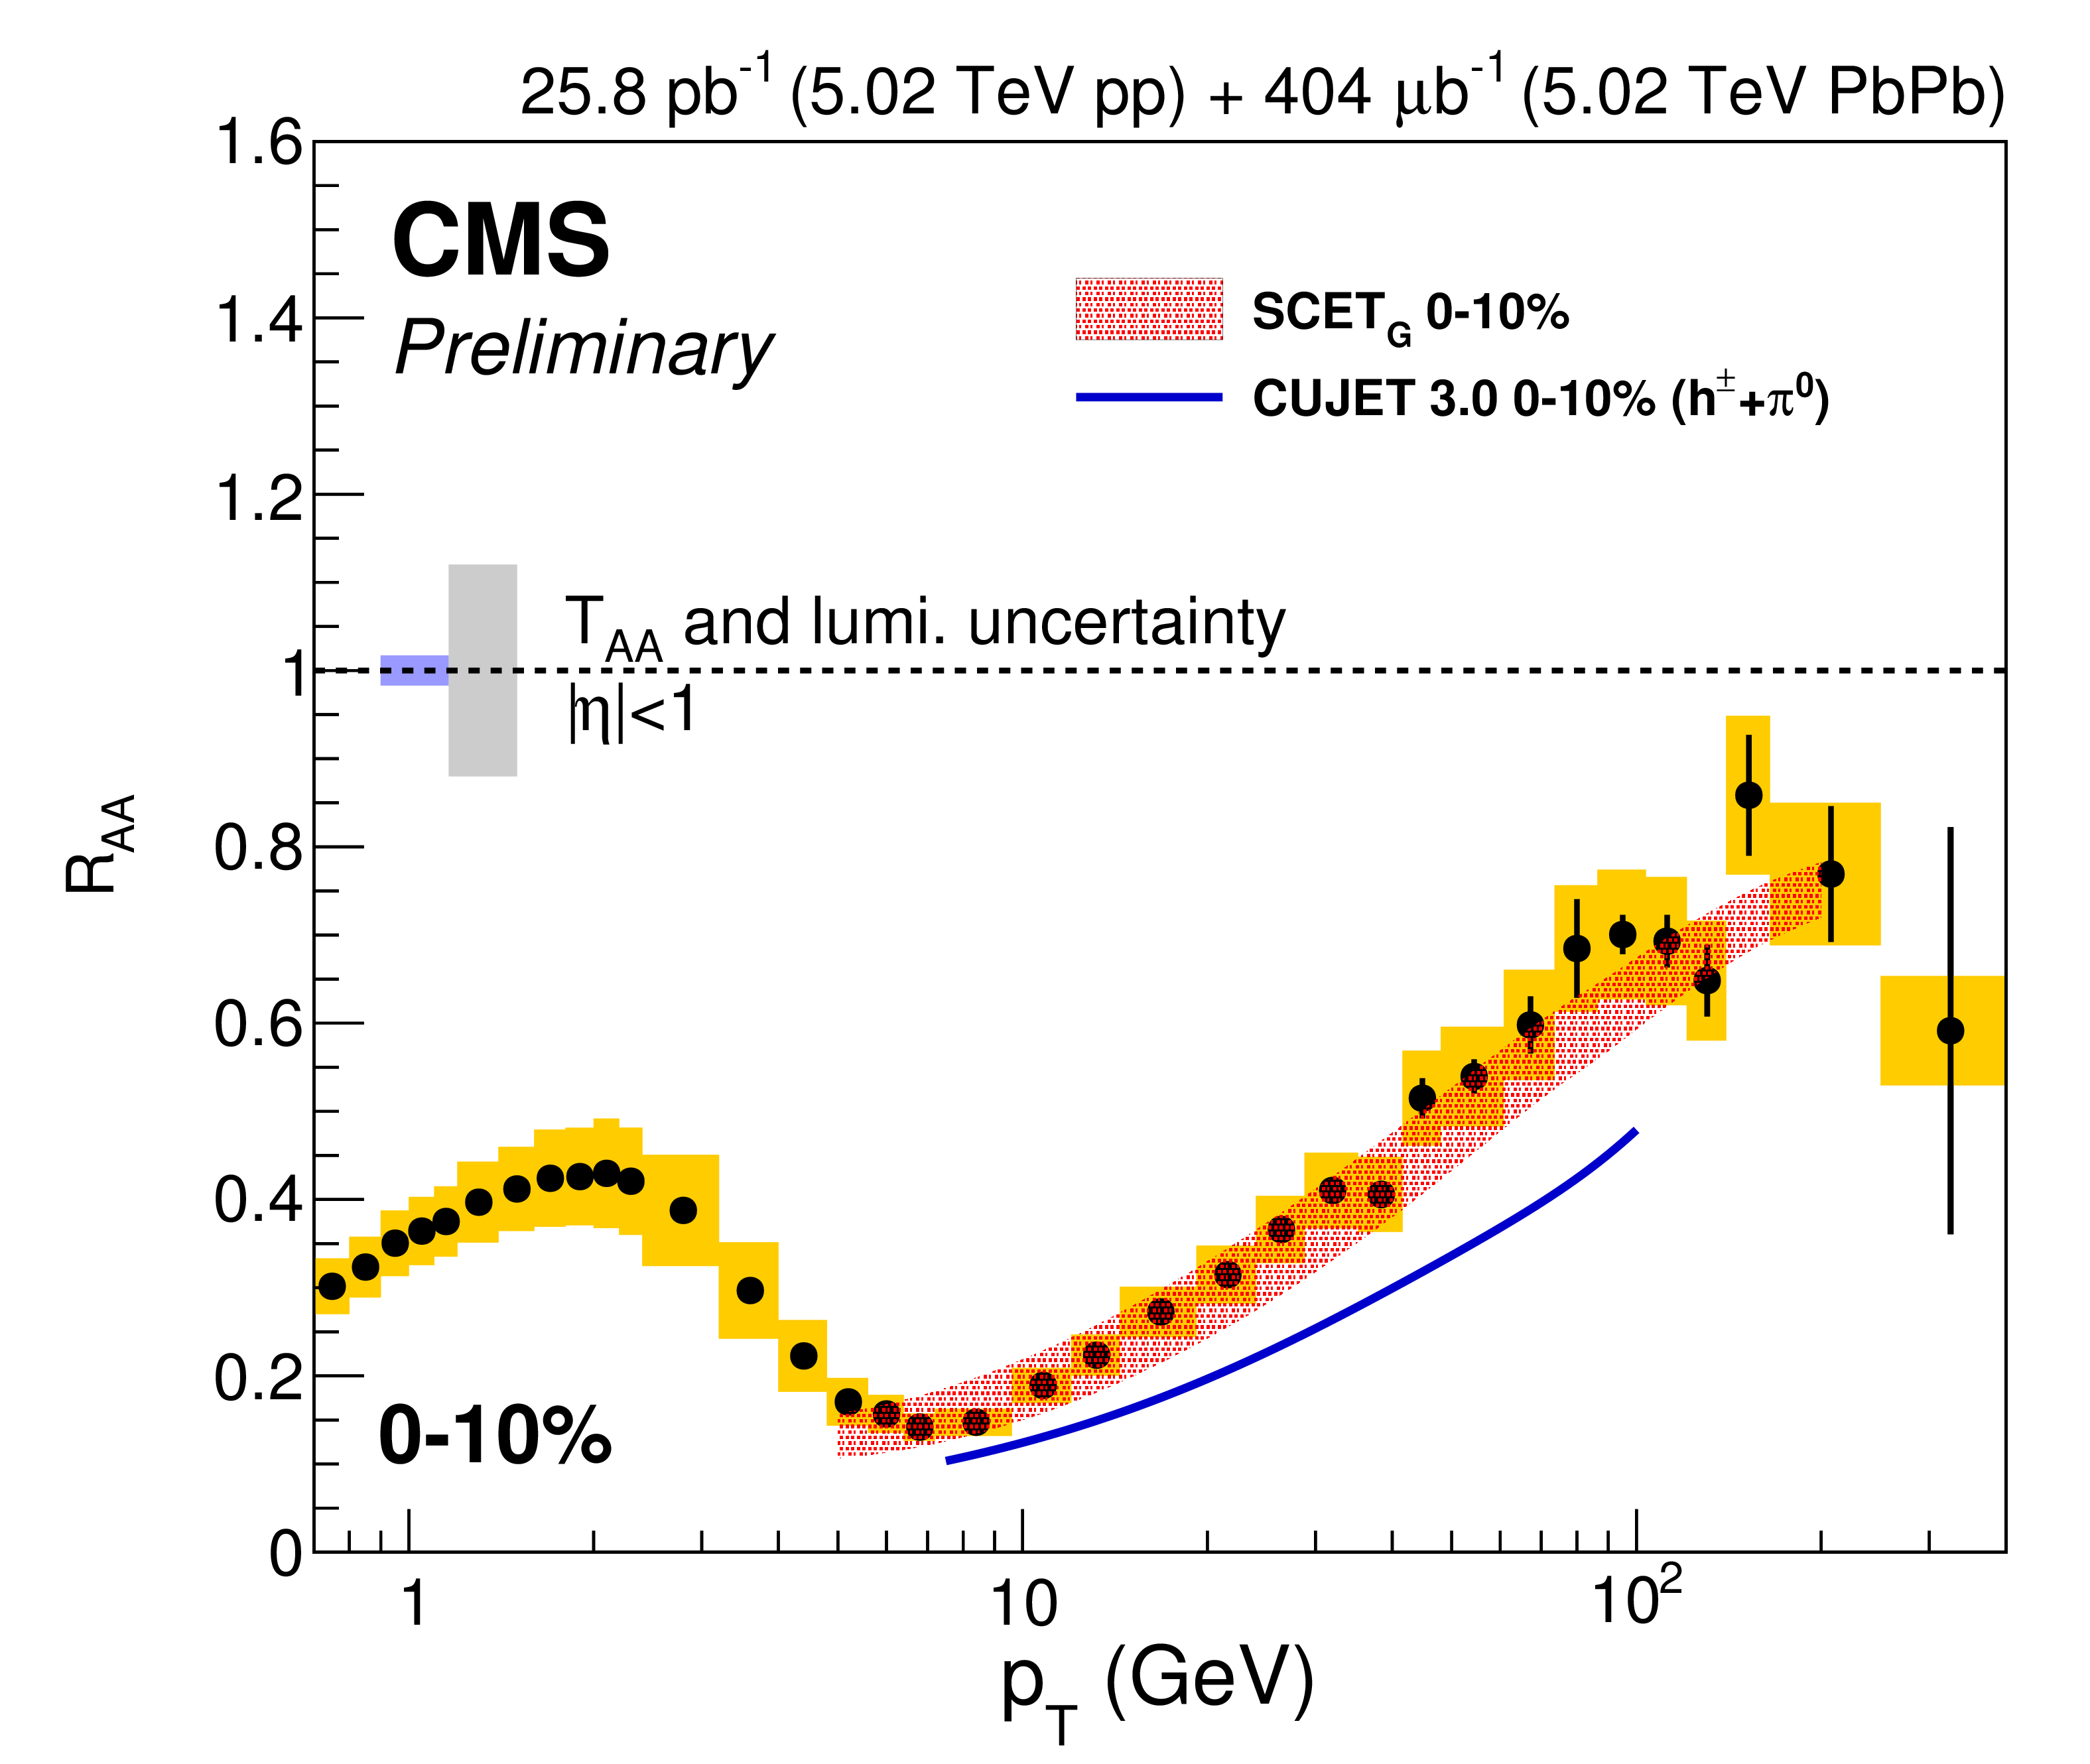
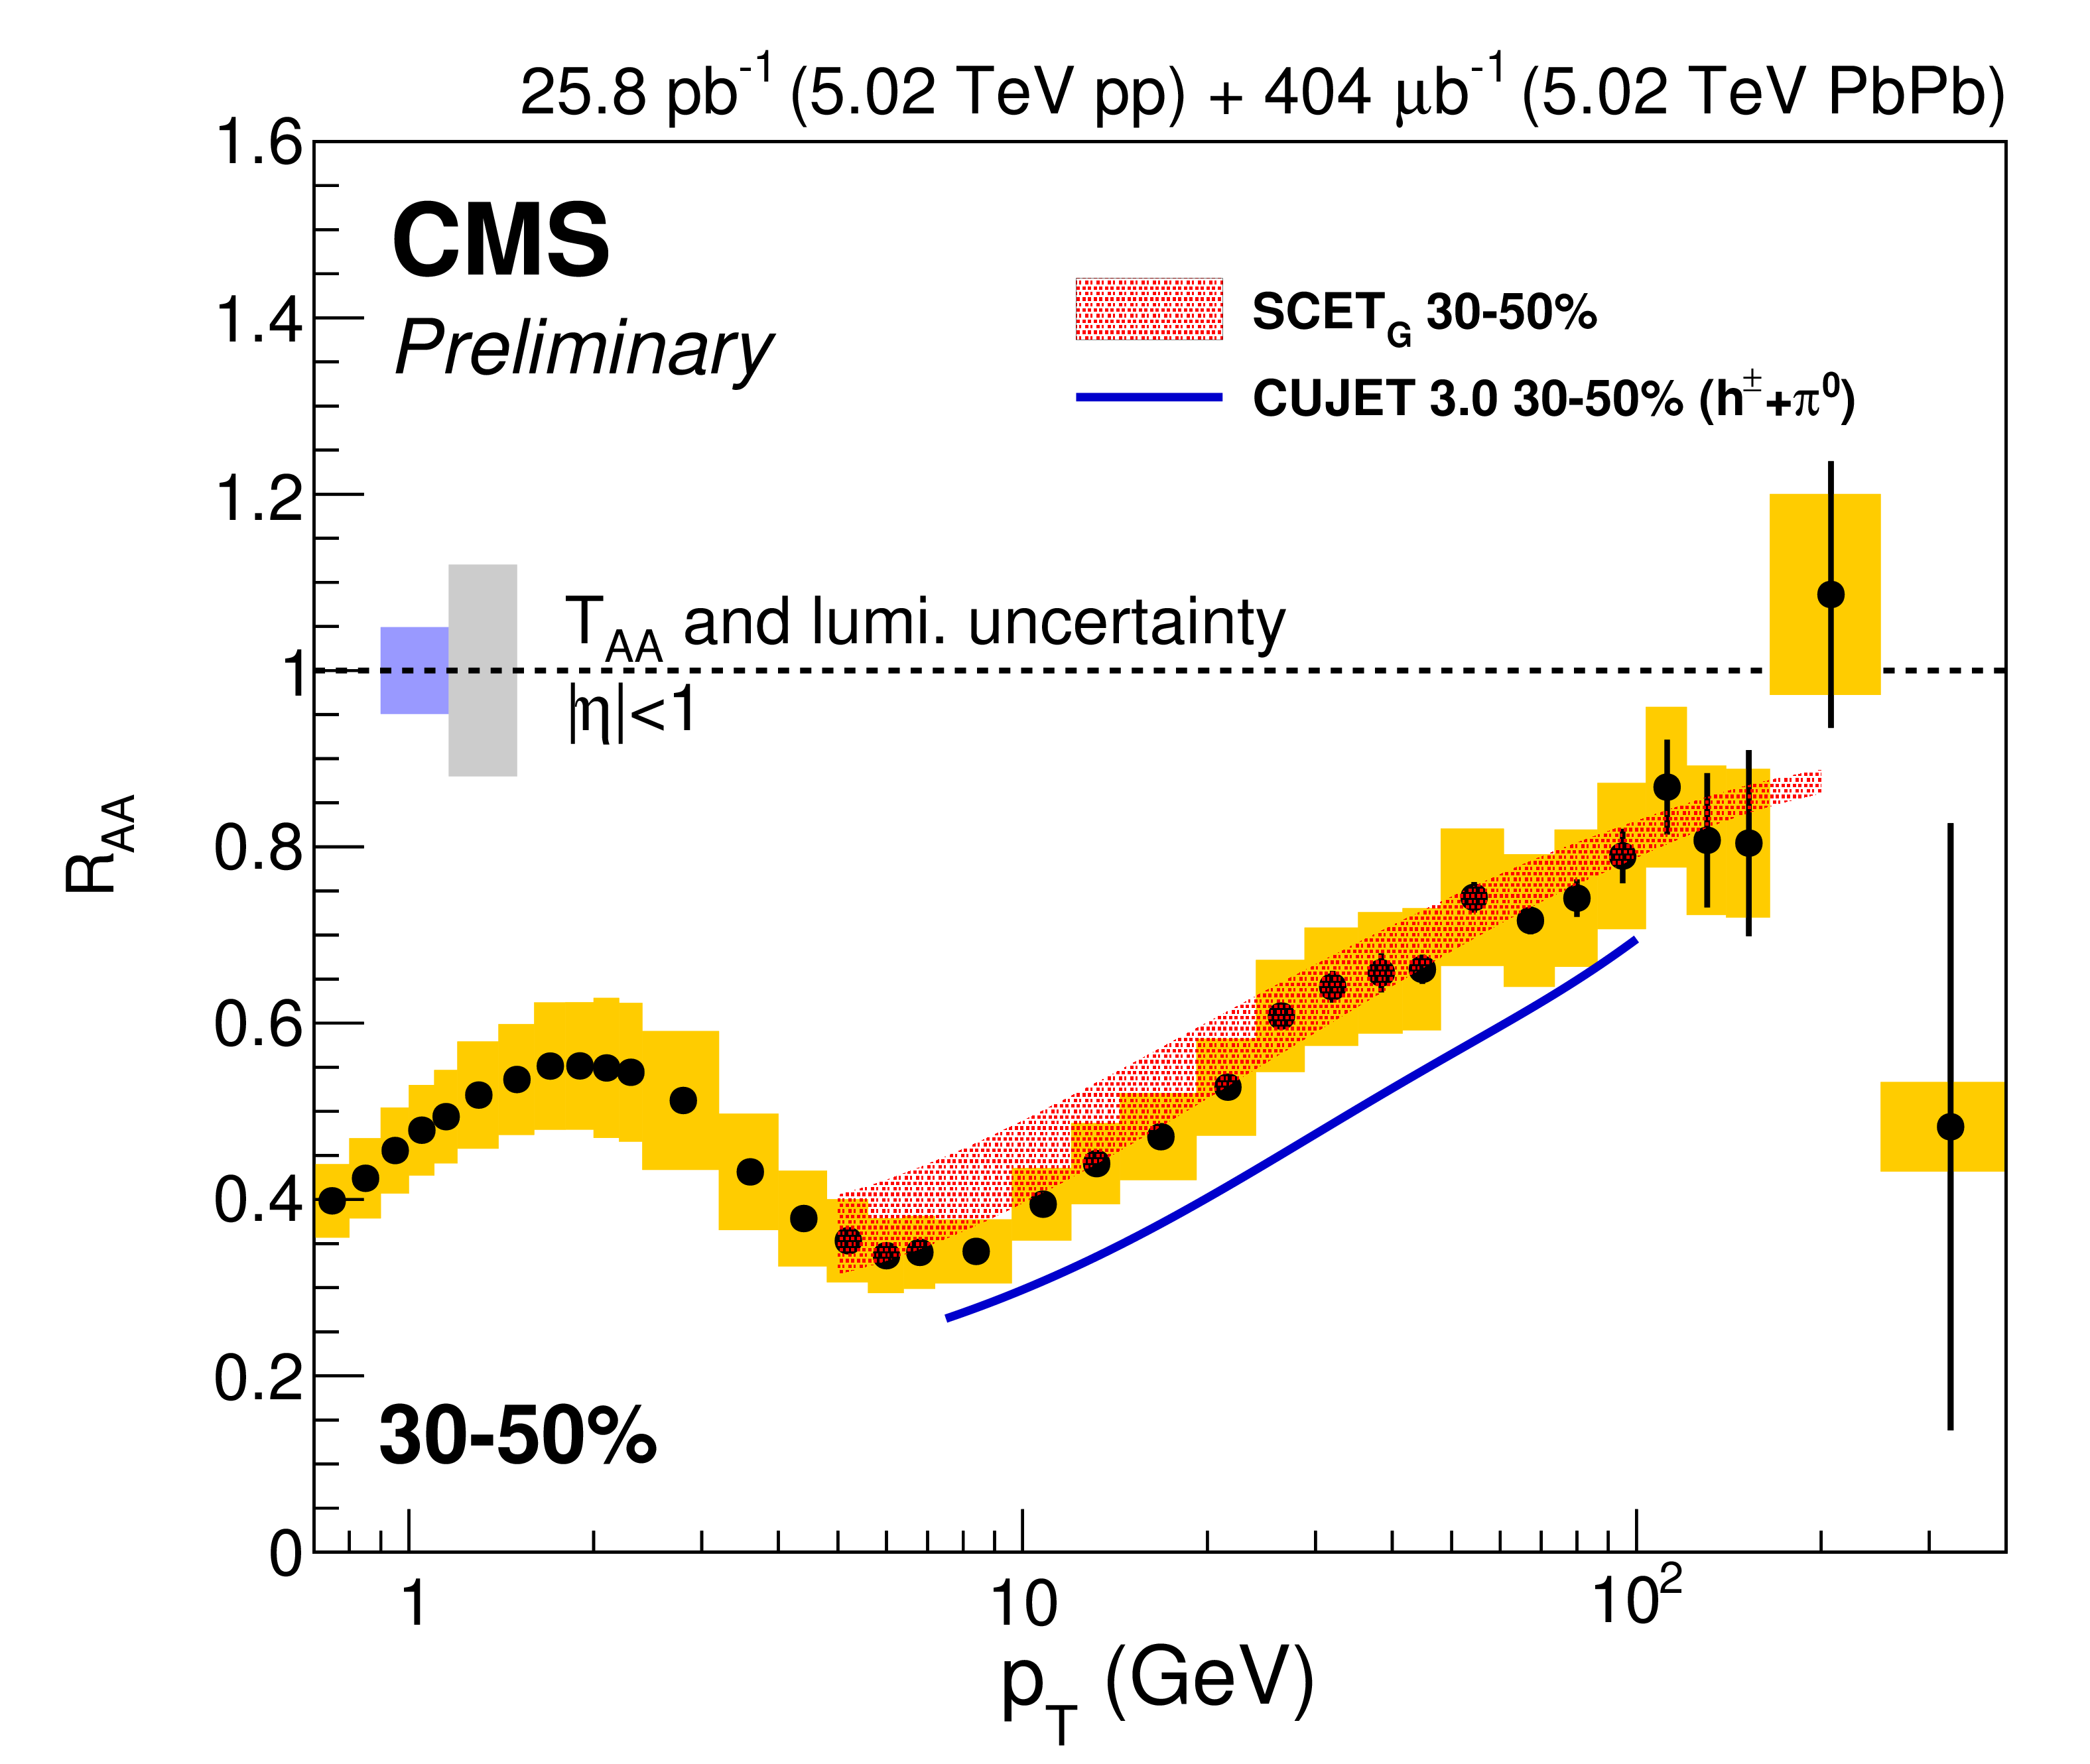
Charged particle $R_{\rm AA}$ measured in the 0-10% (a) and 30-50% (b) centrality ranges at $\sqrt {s_{\rm NN}}= $ 5.02 TeV compared to predictions of models from Refs. [26] and [27]. |
png pdf |
Figure 4-b:
Charged particle $R_{\rm AA}$ measured in the 0-10% (a) and 30-50% (b) centrality ranges at $\sqrt {s_{\rm NN}}= $ 5.02 TeV compared to predictions of models from Refs. [26] and [27]. |
png pdf |
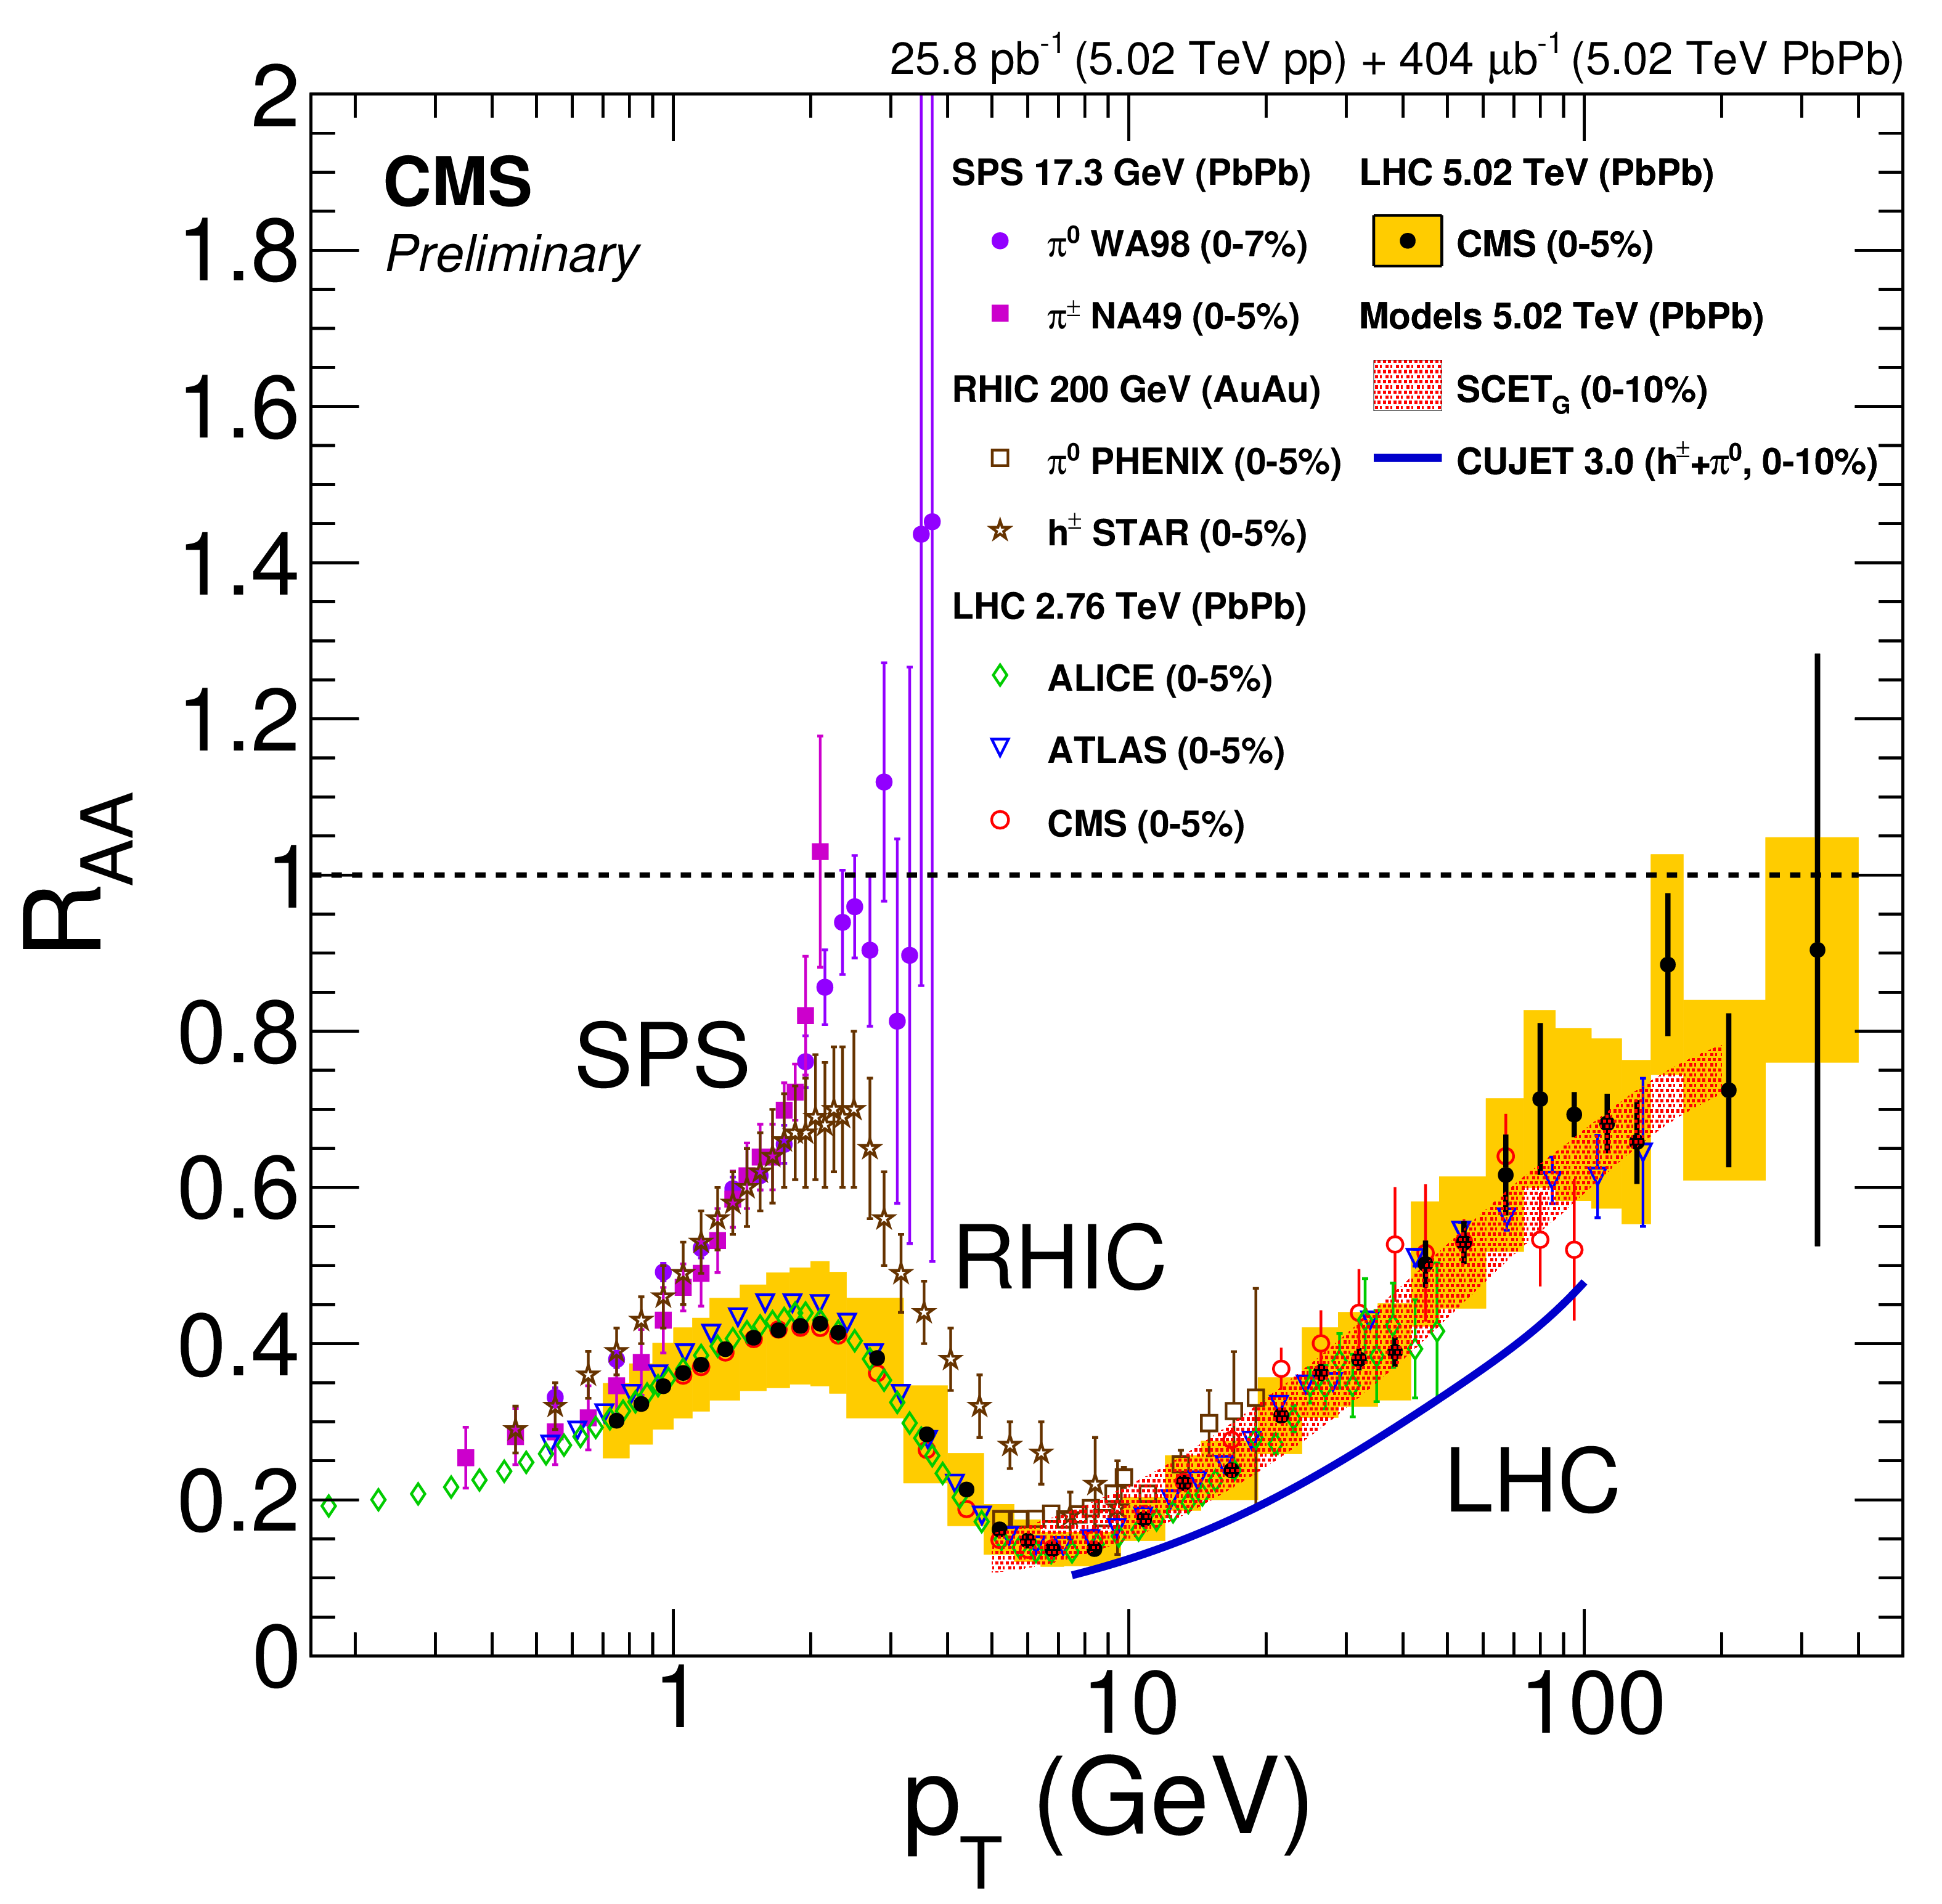
Figure 5:
Measurements of the nuclear modification factors in central heavy-ion collisions at four different center-of-mass energies, for neutral pions ($\pi ^{0}$) (SPS, RHIC), charged hadrons ($h^{\pm }$) (SPS, RHIC), and charged particles (LHC), from Refs. [28-32,8-10], compared to predictions of two models from Refs. [26,27]. The error bars represent the statistical uncertainties. The yellow band around the 5TeV CMS data shows the systematic uncertainties of the measurement, including that of the luminosity. The $T_{\rm AA}$ uncertainties, of the order of $\pm$5%, are not shown. |
png pdf |
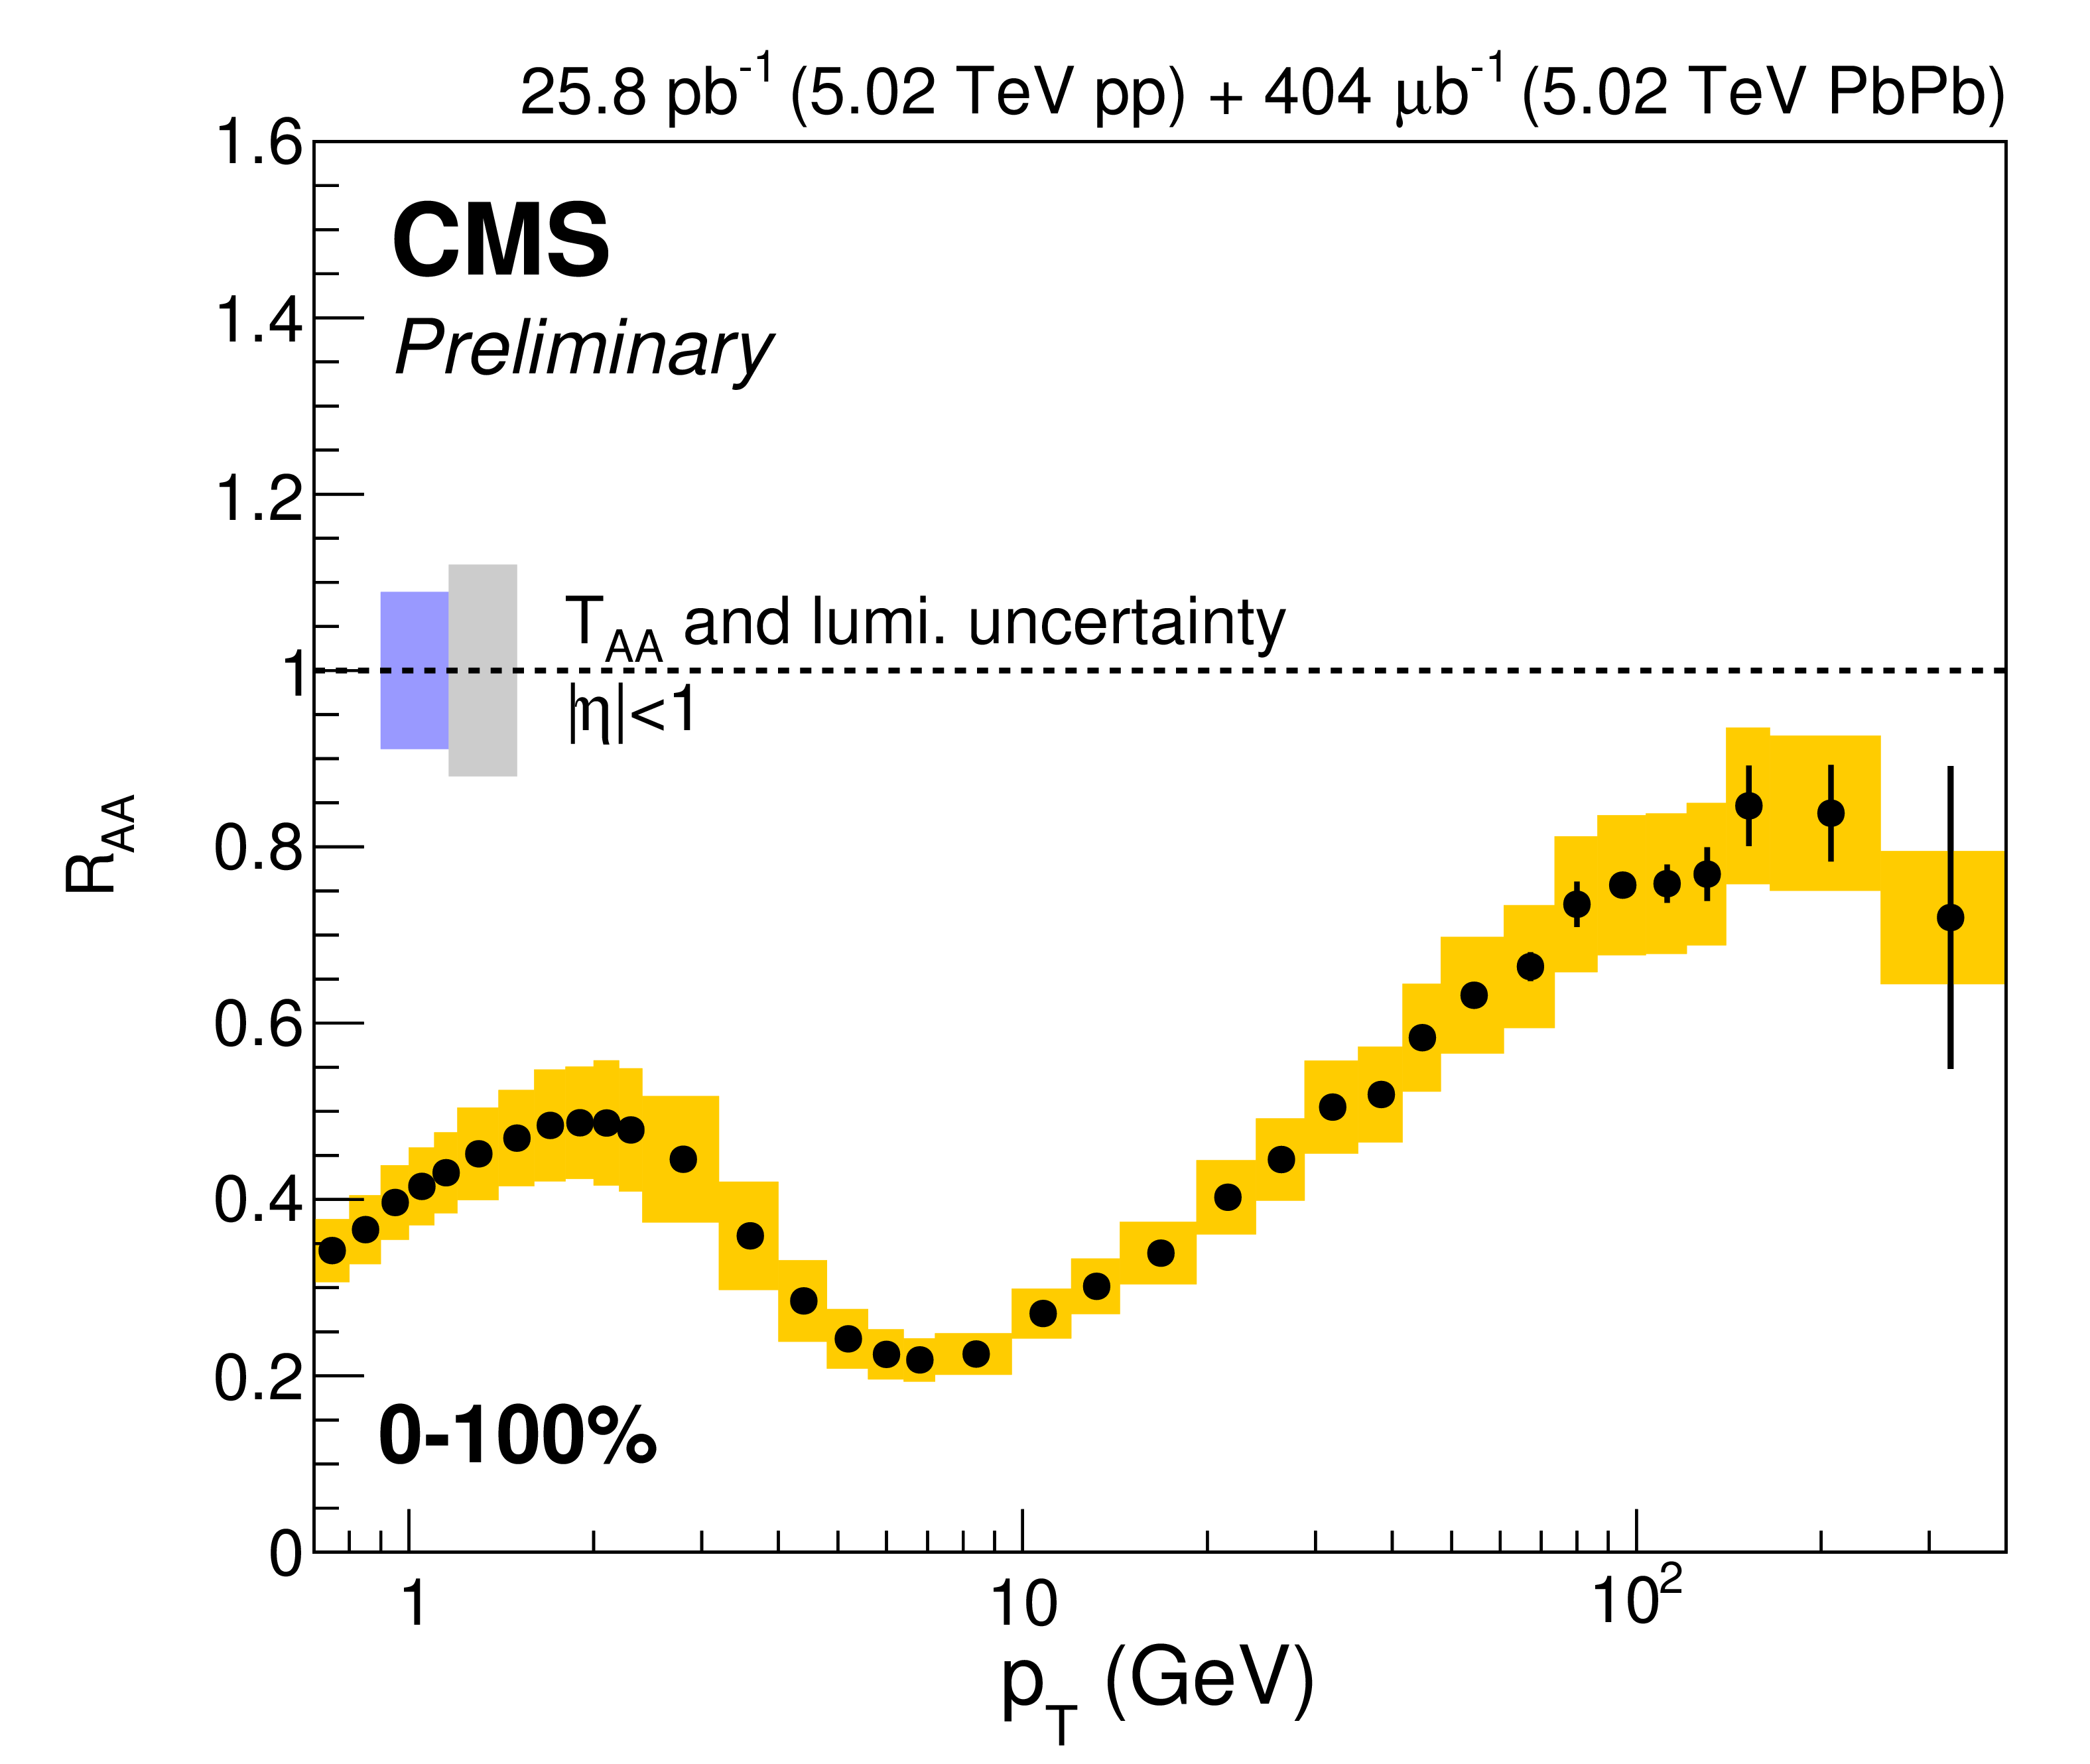
Figure 6:
Charged particle $R_{\rm AA}$ measured in the inclusive 0-100% centrality range in PbPb collisions at $\sqrt {s_{\rm NN}}= $ 5.02 TeV collision energy. The error bars represent the statistical uncertainties, the blue and gray error boxes around unity show the Glauber-model-related $T_{\rm AA}$ and the pp luminosity uncertainties, respectively, while the yellow band represents all other systematic uncertainties. |
| Tables | |

png pdf |
Table 1:
Summary of the $N_{\rm coll}$ and $T_{\rm AA}$ values and their uncertainties in $\sqrt {s_{NN}}= $ 5.02 TeV PbPb collisions for the centrality bins used in this report. |
png pdf |
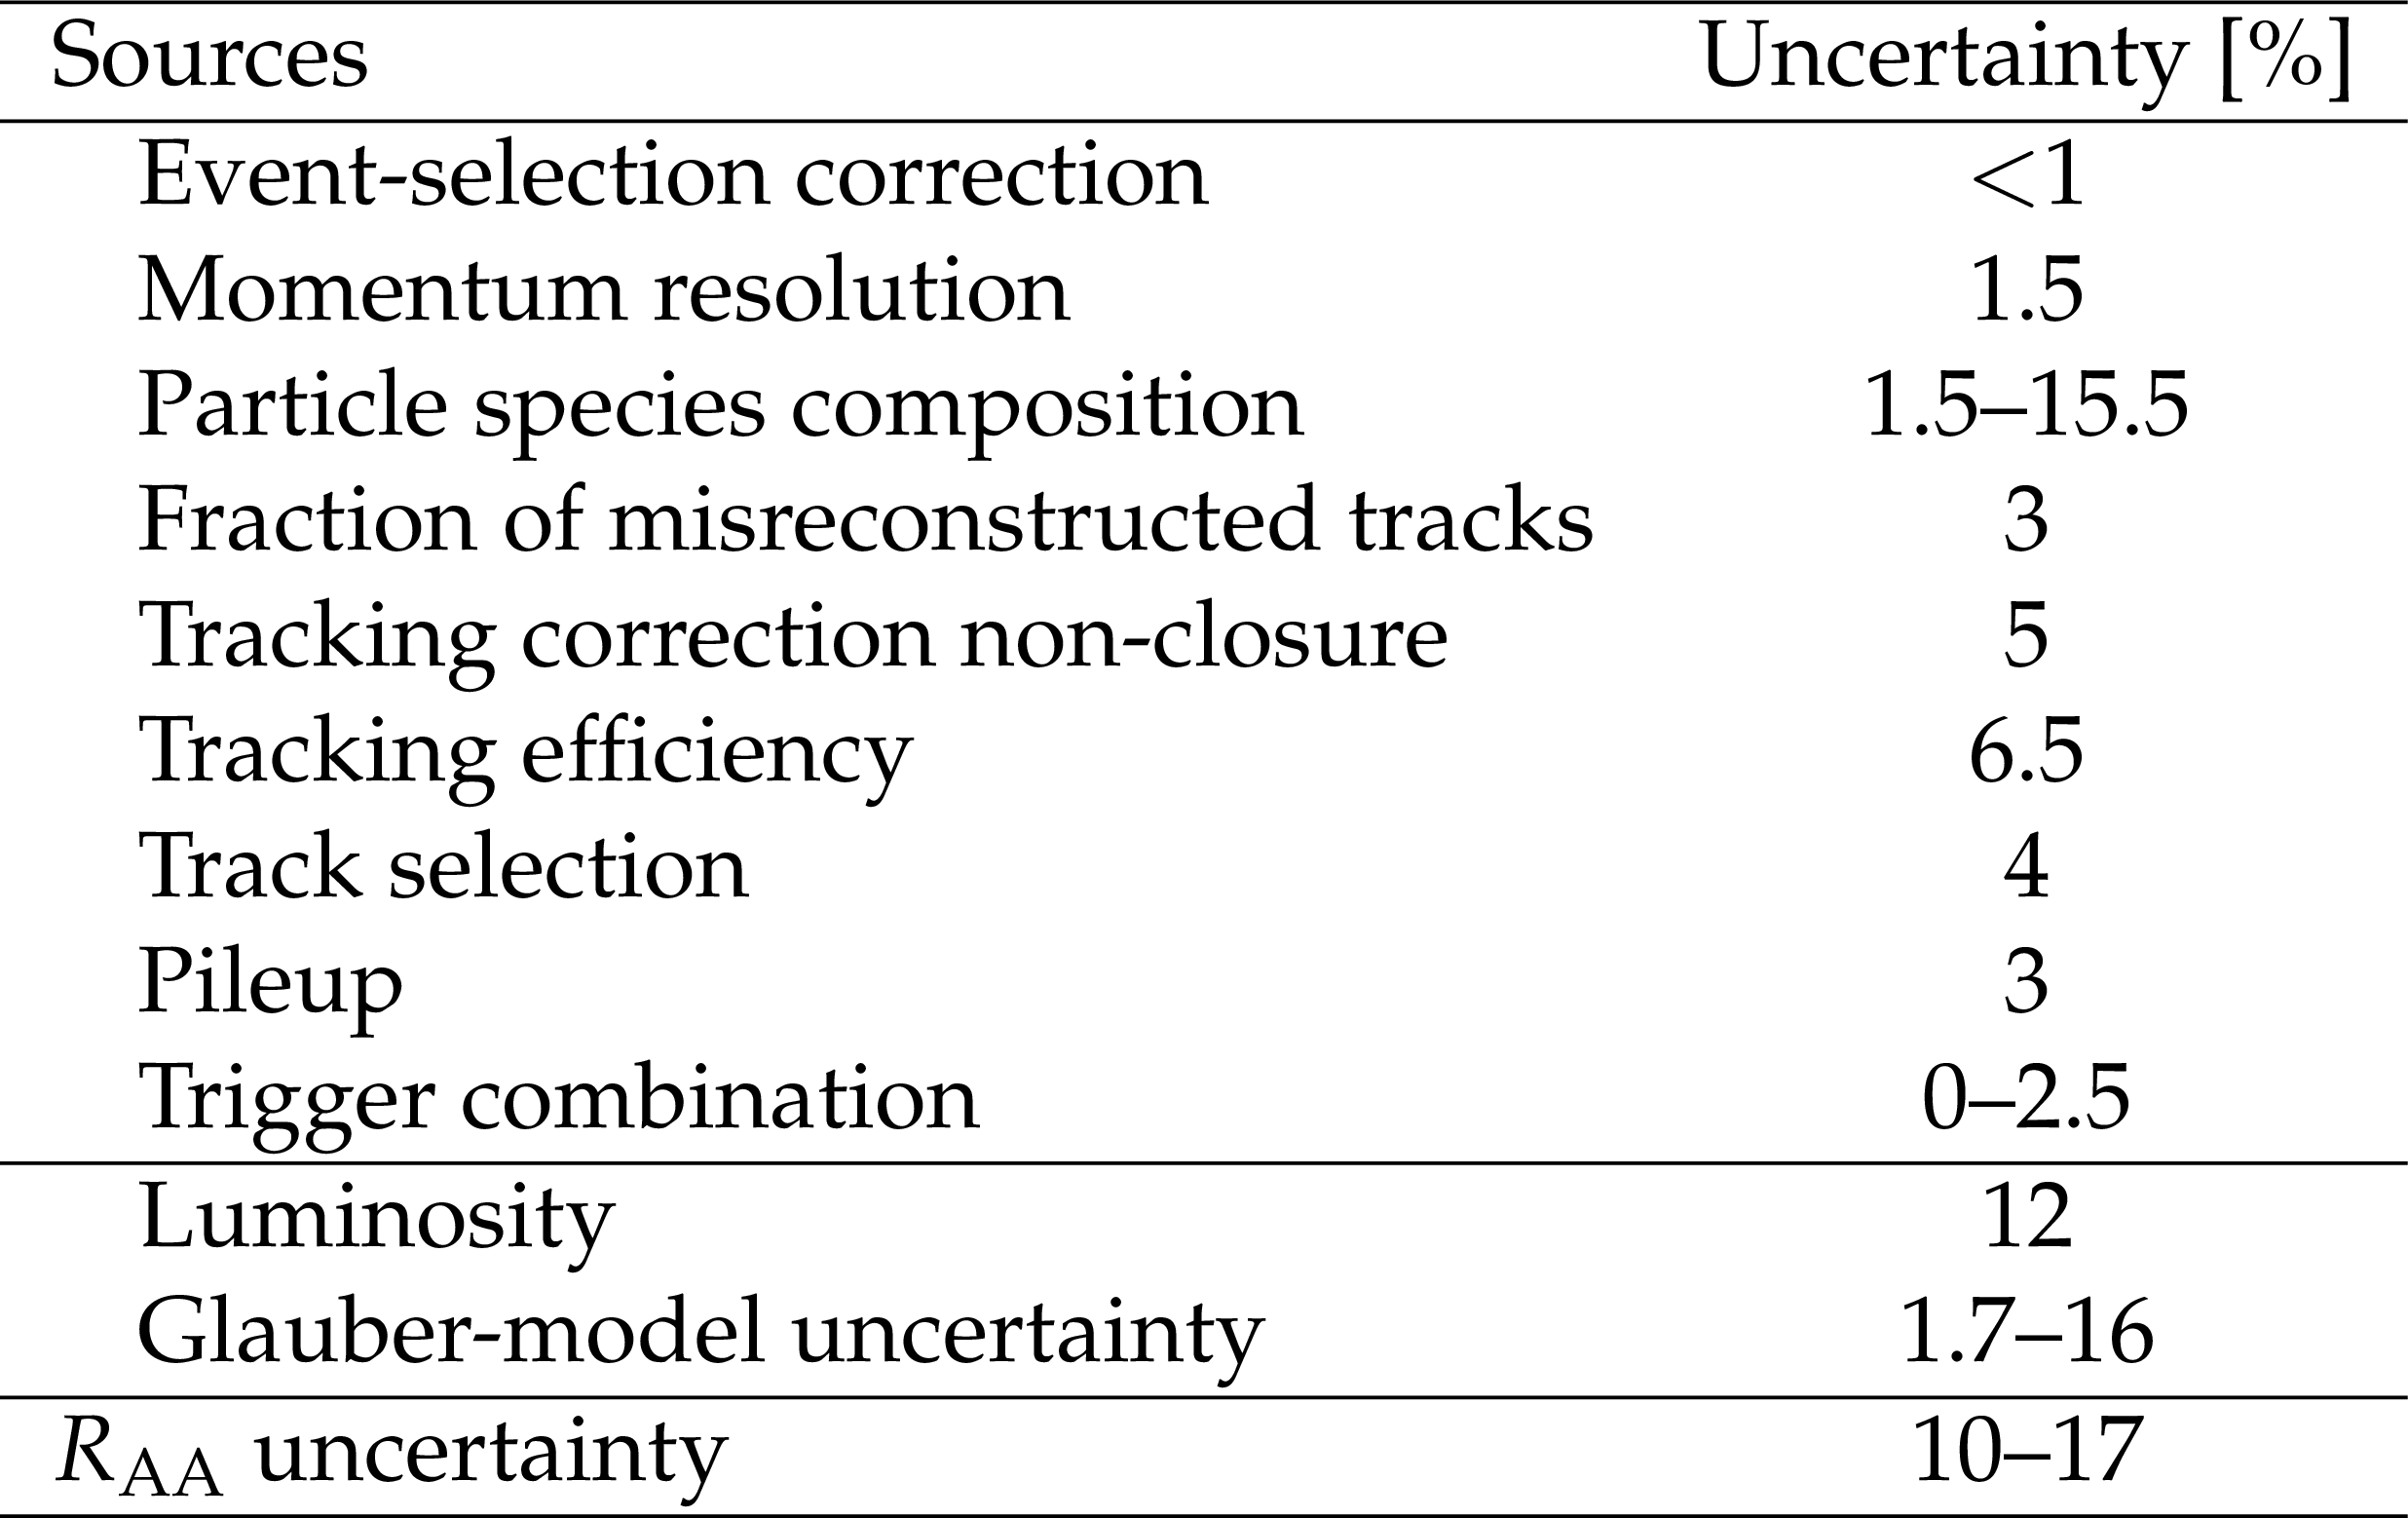
Table 2:
Systematic uncertainties associated with the charged particle $R_{\rm AA}$ measurement. The ranges quoted cover both the ${p_{\mathrm {T}}} $ and the centrality dependence of the uncertainties. The uncertainty of $R_{\rm AA}$ quoted in the table does not include the luminosity and the $T_{\rm AA}$ uncertainties. |
| Summary |
| The presented charged particle $R_{\rm AA}$ distributions help to illuminate the mechanisms for jet quenching and the properties of the medium produced in heavy-ion collisions. Together with measurements on high-$p_\mathrm{T}$ charged particle azimuthal anisotropies, inclusive jet spectra, fragmentation functions, $\gamma$-jet and Z-jet correlations, it constrains the possible phase space of parameters for models aiming to describe the main features of heavy-ion collisions. |
| References | ||||
| 1 | D. d'Enterria | Jet quenching | Landolt-Bornstein 23 (2010) 471 | 0902.2011 |
| 2 | M. L. Miller, K. Reygers, S. J. Sanders, and P. Steinberg | Glauber modeling in high energy nuclear collisions | Ann. Rev. Nucl. Part. Sci. 57 (2007) 205 | nucl-ex/0701025 |
| 3 | B. Alver et al. | Importance of correlations and fluctuations on the initial source eccentricity in high-energy nucleus-nucleus collisions | PRC 77 (2008) 014906 | 0711.3724 |
| 4 | BRAHMS Collaboration | Quark Gluon Plasma an Color Glass Condensate at RHIC? The perspective from the BRAHMS experiment | Nucl. Phys. A 757 (2005) 1 | nucl-ex/0410020 |
| 5 | PHENIX Collaboration | Formation of dense partonic matter in relativistic nucleus nucleus collisions at RHIC: Experimental evaluation by the PHENIX collaboration | Nucl. Phys. A 757 (2005) 184 | nucl-ex/0410003 |
| 6 | STAR Collaboration | Experimental and theoretical challenges in the search for the quark gluon plasma: The STAR collaboration's critical assessment of the evidence from RHIC collisions | Nucl. Phys. A 757 (2005) 102 | nucl-ex/0501009 |
| 7 | B. B. Back et al. | The PHOBOS perspective on discoveries at RHIC | Nucl. Phys. A 757 (2005) 28 | nucl-ex/0410022 |
| 8 | ALICE Collaboration | Centrality Dependence of Charged Particle Production at Large Transverse Momentum in Pb--Pb Collisions at $ \sqrt{s_{\rm{NN}}} = $ 2.76 TeV | PLB 720 (2013) 52 | 1208.2711 |
| 9 | ATLAS Collaboration | Measurement of charged-particle spectra in Pb+Pb collisions at $ \sqrt{{s}_\mathsf{{NN}}} = $ 2.76 TeV with the ATLAS detector at the LHC | JHEP 09 (2015) 050 | 1504.04337 |
| 10 | CMS Collaboration | Study of high-pT charged particle suppression in PbPb compared to pp collisions at $ \sqrt{s_{NN}}= $ 2.76 TeV | EPJC 72 (2012) 1945 | CMS-HIN-10-005 1202.2554 |
| 11 | CMS Collaboration | The CMS experiment at the CERN LHC | JINST 3 (2008) S08004 | CMS-00-001 |
| 12 | GEANT4 Collaboration | GEANT4: A Simulation toolkit | NIMA 506 (2003) 250 | |
| 13 | M. Cacciari, G. P. Salam, and G. Soyez | The anti-$ k_t $ jet clustering algorithm | JHEP 04 (2008) 063 | 0802.1189 |
| 14 | O. Kodolova, I. Vardanian, A. Nikitenko, and A. Oulianov | The performance of the jet identification and reconstruction in heavy ions collisions with CMS detector | EPJC 50 (2007) 117 | |
| 15 | CMS Collaboration | Run 2 Upgrades to the CMS Level-1 Calorimeter Trigger | JINST 11 (2016) C01051 | 1511.05855 |
| 16 | T. Sjostrand, S. Mrenna, and P. Z. Skands | A Brief Introduction to PYTHIA 8.1 | CPC 178 (2008) 852 | 0710.3820 |
| 17 | CMS Collaboration | Event generator tunes obtained from underlying event and multiparton scattering measurements | EPJC 76 (2016) 155 | CMS-GEN-14-001 1512.00815 |
| 18 | I. P. Lokhtin and A. M. Snigirev | A Model of jet quenching in ultrarelativistic heavy ion collisions and high-p(T) hadron spectra at RHIC | EPJC 45 (2006) 211 | hep-ph/0506189 |
| 19 | CMS Collaboration | Observation and studies of jet quenching in PbPb collisions at nucleon-nucleon center-of-mass energy = 2.76 TeV | PRC 84 (2011) 024906 | CMS-HIN-10-004 1102.1957 |
| 20 | CMS Collaboration | Measurement of transverse momentum relative to dijet systems in PbPb and pp collisions at $ \sqrt{s_{\mathrm{NN}}}= $ 2.76 TeV | JHEP 01 (2016) 006 | CMS-HIN-14-010 1509.09029 |
| 21 | CMS Collaboration | Tracking and Vertexing Results from First Collisions | CMS-PAS-PAS-TRK-10-001 | |
| 22 | K. Werner, F.-M. Liu, and T. Pierog | Parton ladder splitting and the rapidity dependence of transverse momentum spectra in deuteron-gold collisions at RHIC | PRC 74 (2006) 044902 | hep-ph/0506232 |
| 23 | T. Pierog et al. | EPOS LHC: Test of collective hadronization with data measured at the CERN Large Hadron Collider | PRC 92 (2015) 034906 | 1306.0121 |
| 24 | CMS Collaboration | Nuclear Effects on the Transverse Momentum Spectra of Charged Particles in pPb Collisions at $ \sqrt{s_{_\mathrm {NN}}} =$ 5.02 TeV | EPJC 75 (2015) 237 | CMS-HIN-12-017 1502.05387 |
| 25 | CMS Collaboration | Measurement of Tracking Efficiency | CMS-PAS-PAS-TRK-10-002 | |
| 26 | Y.-T. Chien et al. | Jet Quenching from QCD Evolution | PRD 93 (2016) 074030 | 1509.02936 |
| 27 | J. Xu, J. Liao, and M. Gyulassy | Bridging Soft-Hard Transport Properties of Quark-Gluon Plasmas with CUJET3.0 | JHEP 02 (2016) 169 | 1508.00552 |
| 28 | WA98 Collaboration | Transverse mass distributions of neutral pions from Pb-208 induced reactions at 158-A-GeV | EPJC 23 (2002) 225 | nucl-ex/0108006 |
| 29 | D. G. d'Enterria | Indications of suppressed high $ p_{\rm T} $ hadron production in nucleus - nucleus collisions at CERN-SPS | PLB 596 (2004) 32 | nucl-ex/0403055 |
| 30 | PHENIX Collaboration | Neutral pion production with respect to centrality and reaction plane in Au$ + $Au collisions at $ \sqrt{s_{NN}} $ = 200 GeV | PRC 87 (2013) 034911 | 1208.2254 |
| 31 | STAR Collaboration | Transverse momentum and collision energy dependence of high $ p_{\rm T} $ hadron suppression in Au+Au collisions at ultrarelativistic energies | PRL 91 (2003) 172302 | nucl-ex/0305015 |
| 32 | NA49 Collaboration | High transverse momentum hadron spectra at $ \sqrt{s_{NN}} = $ 17.3 GeV, in Pb+Pb and p+p collisions | PRC 77 (2008) 034906 | 0711.0547 |
|
|
Compact Muon Solenoid LHC, CERN |
|

|

|

|

|

|