

Compact Muon Solenoid
LHC, CERN
| CMS-HIN-12-017 ; CERN-PH-EP-2014-282 | ||
| Nuclear effects on the transverse momentum spectra of charged particles in pPb collisions at $\sqrt{s_{\mathrm{NN}}}$ = 5.02 TeV | ||
| CMS Collaboration | ||
| 19 February 2015 | ||
| Eur. Phys. J. C 75 (2015) 237 | ||
| Abstract: Transverse momentum spectra of charged particles are measured by the CMS experiment at the CERN LHC in pPb collisions at $\sqrt{s_{\mathrm{NN}}}$ = 5.02 TeV, in the range of $p_\mathrm{T}$ between 0.4 and 120 GeV/$c$ and pseudorapidity $|\eta_\mathrm{CM}|$ lower than 1.8 in the proton-nucleon center-of-mass frame. For $p_\mathrm{T}$ lower than 10 GeV/$c$, the charged-particle production is asymmetric about $|\eta_\mathrm{CM}|$ = 0, with smaller yield observed in the direction of the proton beam, qualitatively consistent with expectations from shadowing in nuclear parton distribution functions (nPDF). A pp reference spectrum at $\sqrt{s}$ =5.02 TeV is obtained by interpolation from previous measurements at higher and lower center-of-mass energies. The $p_\mathrm{T}$ distribution measured in pPb collisions shows an enhancement of charged particles with $p_\mathrm{T}$ larger than 20 GeV/$c$ compared to expectations from the pp reference. The enhancement is larger than predicted by perturbative quantum chromodynamic calculations that include antishadowing modifications of nPDFs. | ||
| Links: e-print arXiv:1502.05387 [nucl-ex] (PDF) ; CDS record ; inSPIRE record ; Public twiki page ; CADI line (restricted) ; | ||
| Figures | |
png pdf |
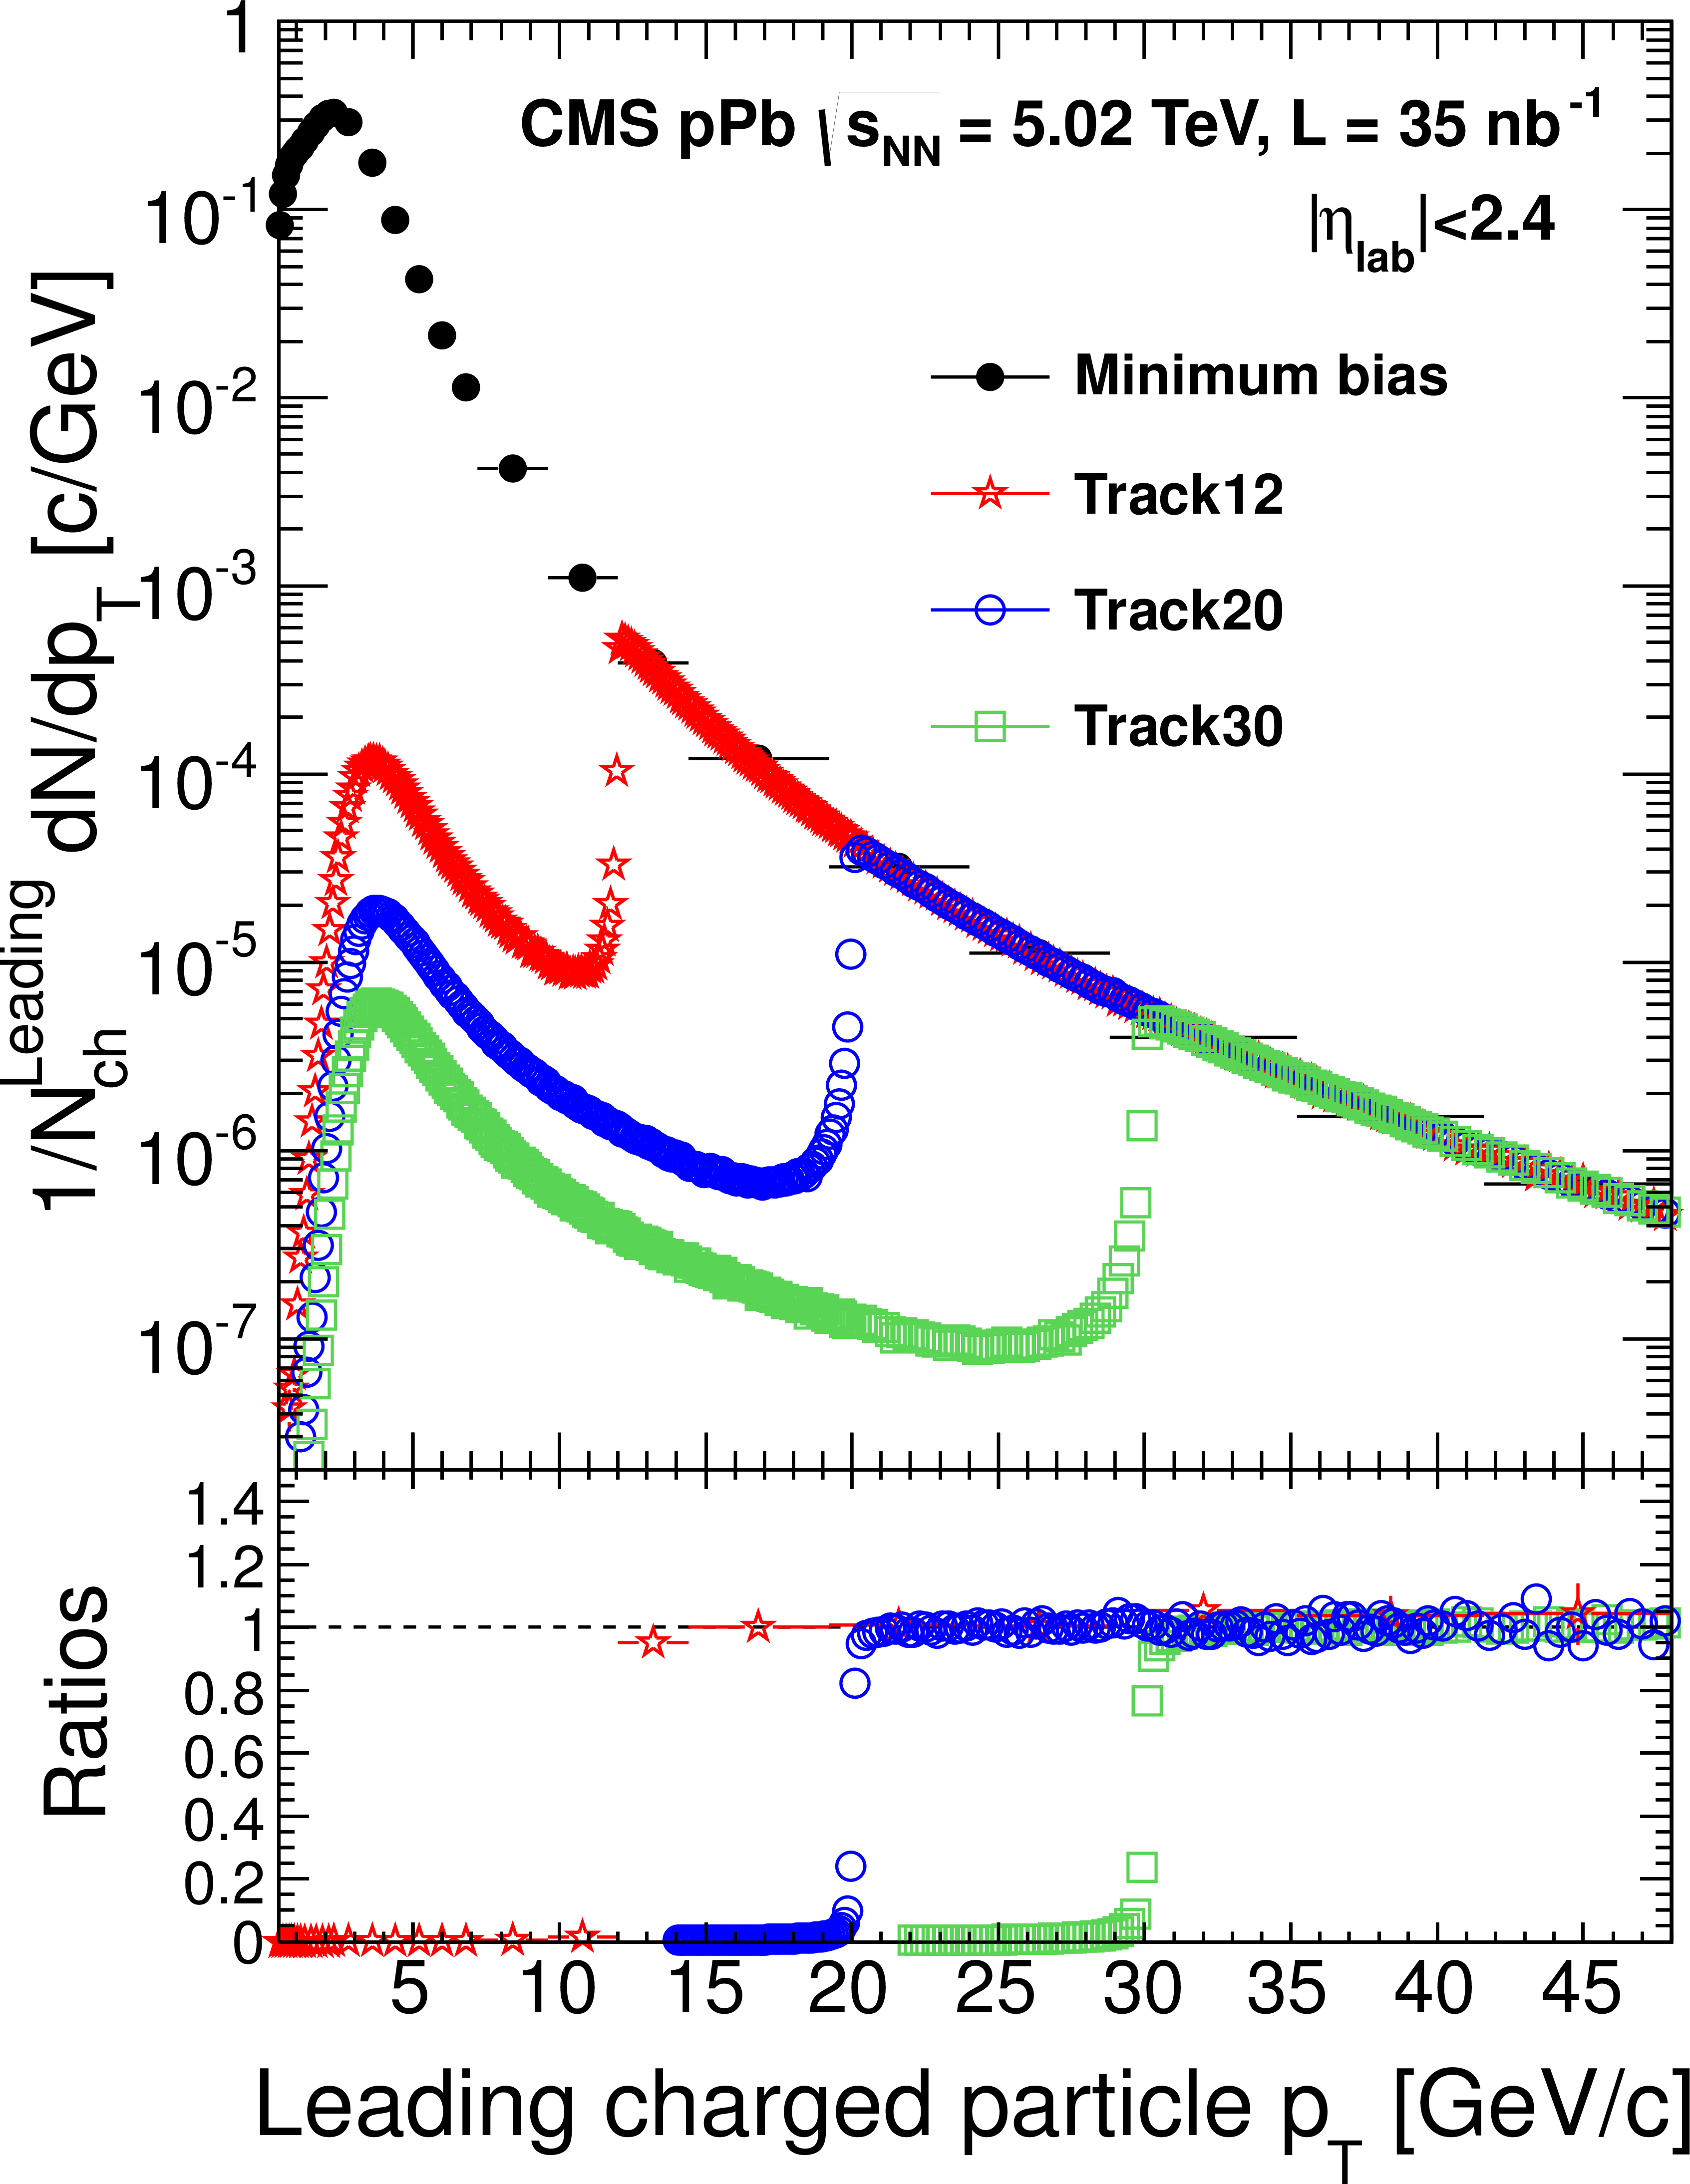
Figure 1:
Top: Charged-particle yields for the different triggers normalized to the number of leading charged particles with $ {p_{\mathrm {T}}} >$ 0.4 GeV/$c$ in double-sided events, $N_\text {ch}^\text {Leading}$, as a function of leading-track $ {p_{\mathrm {T}}} $. The track-triggered distributions are normalized by the number of leading tracks in regions not affected by the rapid rise of the trigger efficiency near threshold. Bottom: Ratios of the leading-track $ {p_{\mathrm {T}}} $ distributions for the four different triggers. The stars indicate the ratio of the 12 GeV/$c$ over the minimum-bias samples, the circles the 20 over the 12 GeV/$c$ samples, and the squares the ratio of the 30 over the 20 GeV/$c$ track-triggered spectra. |
png pdf |
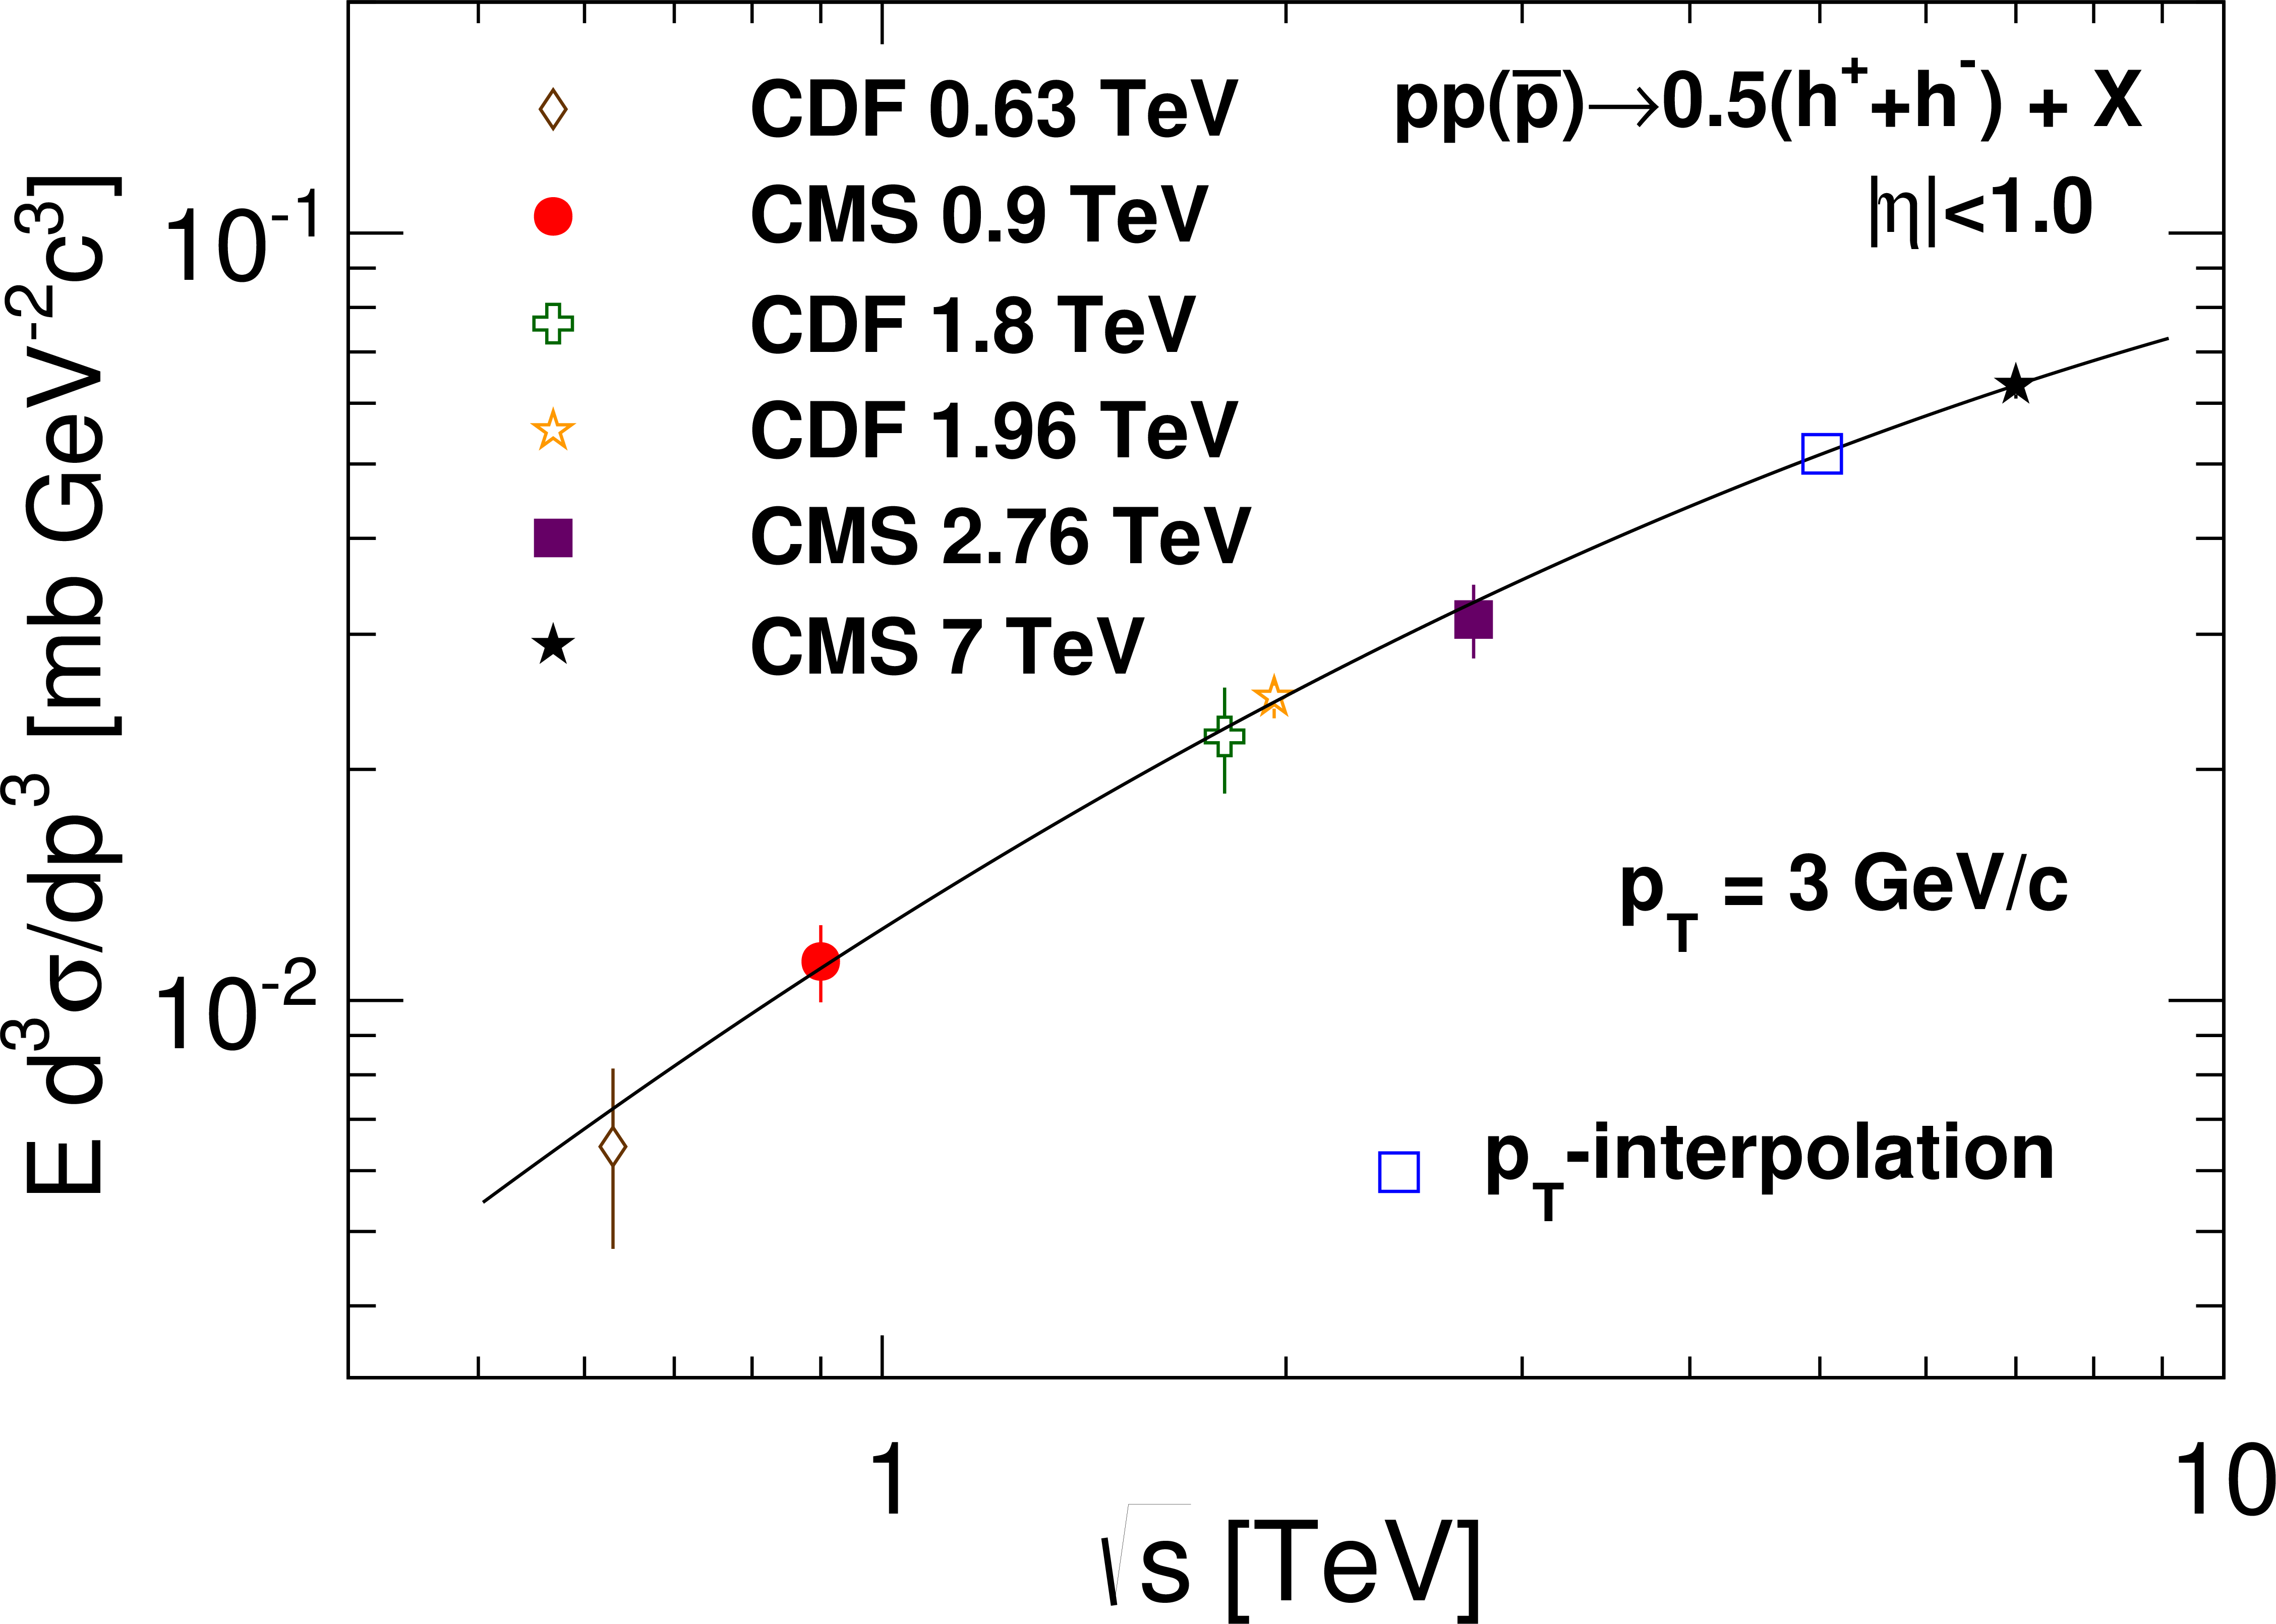
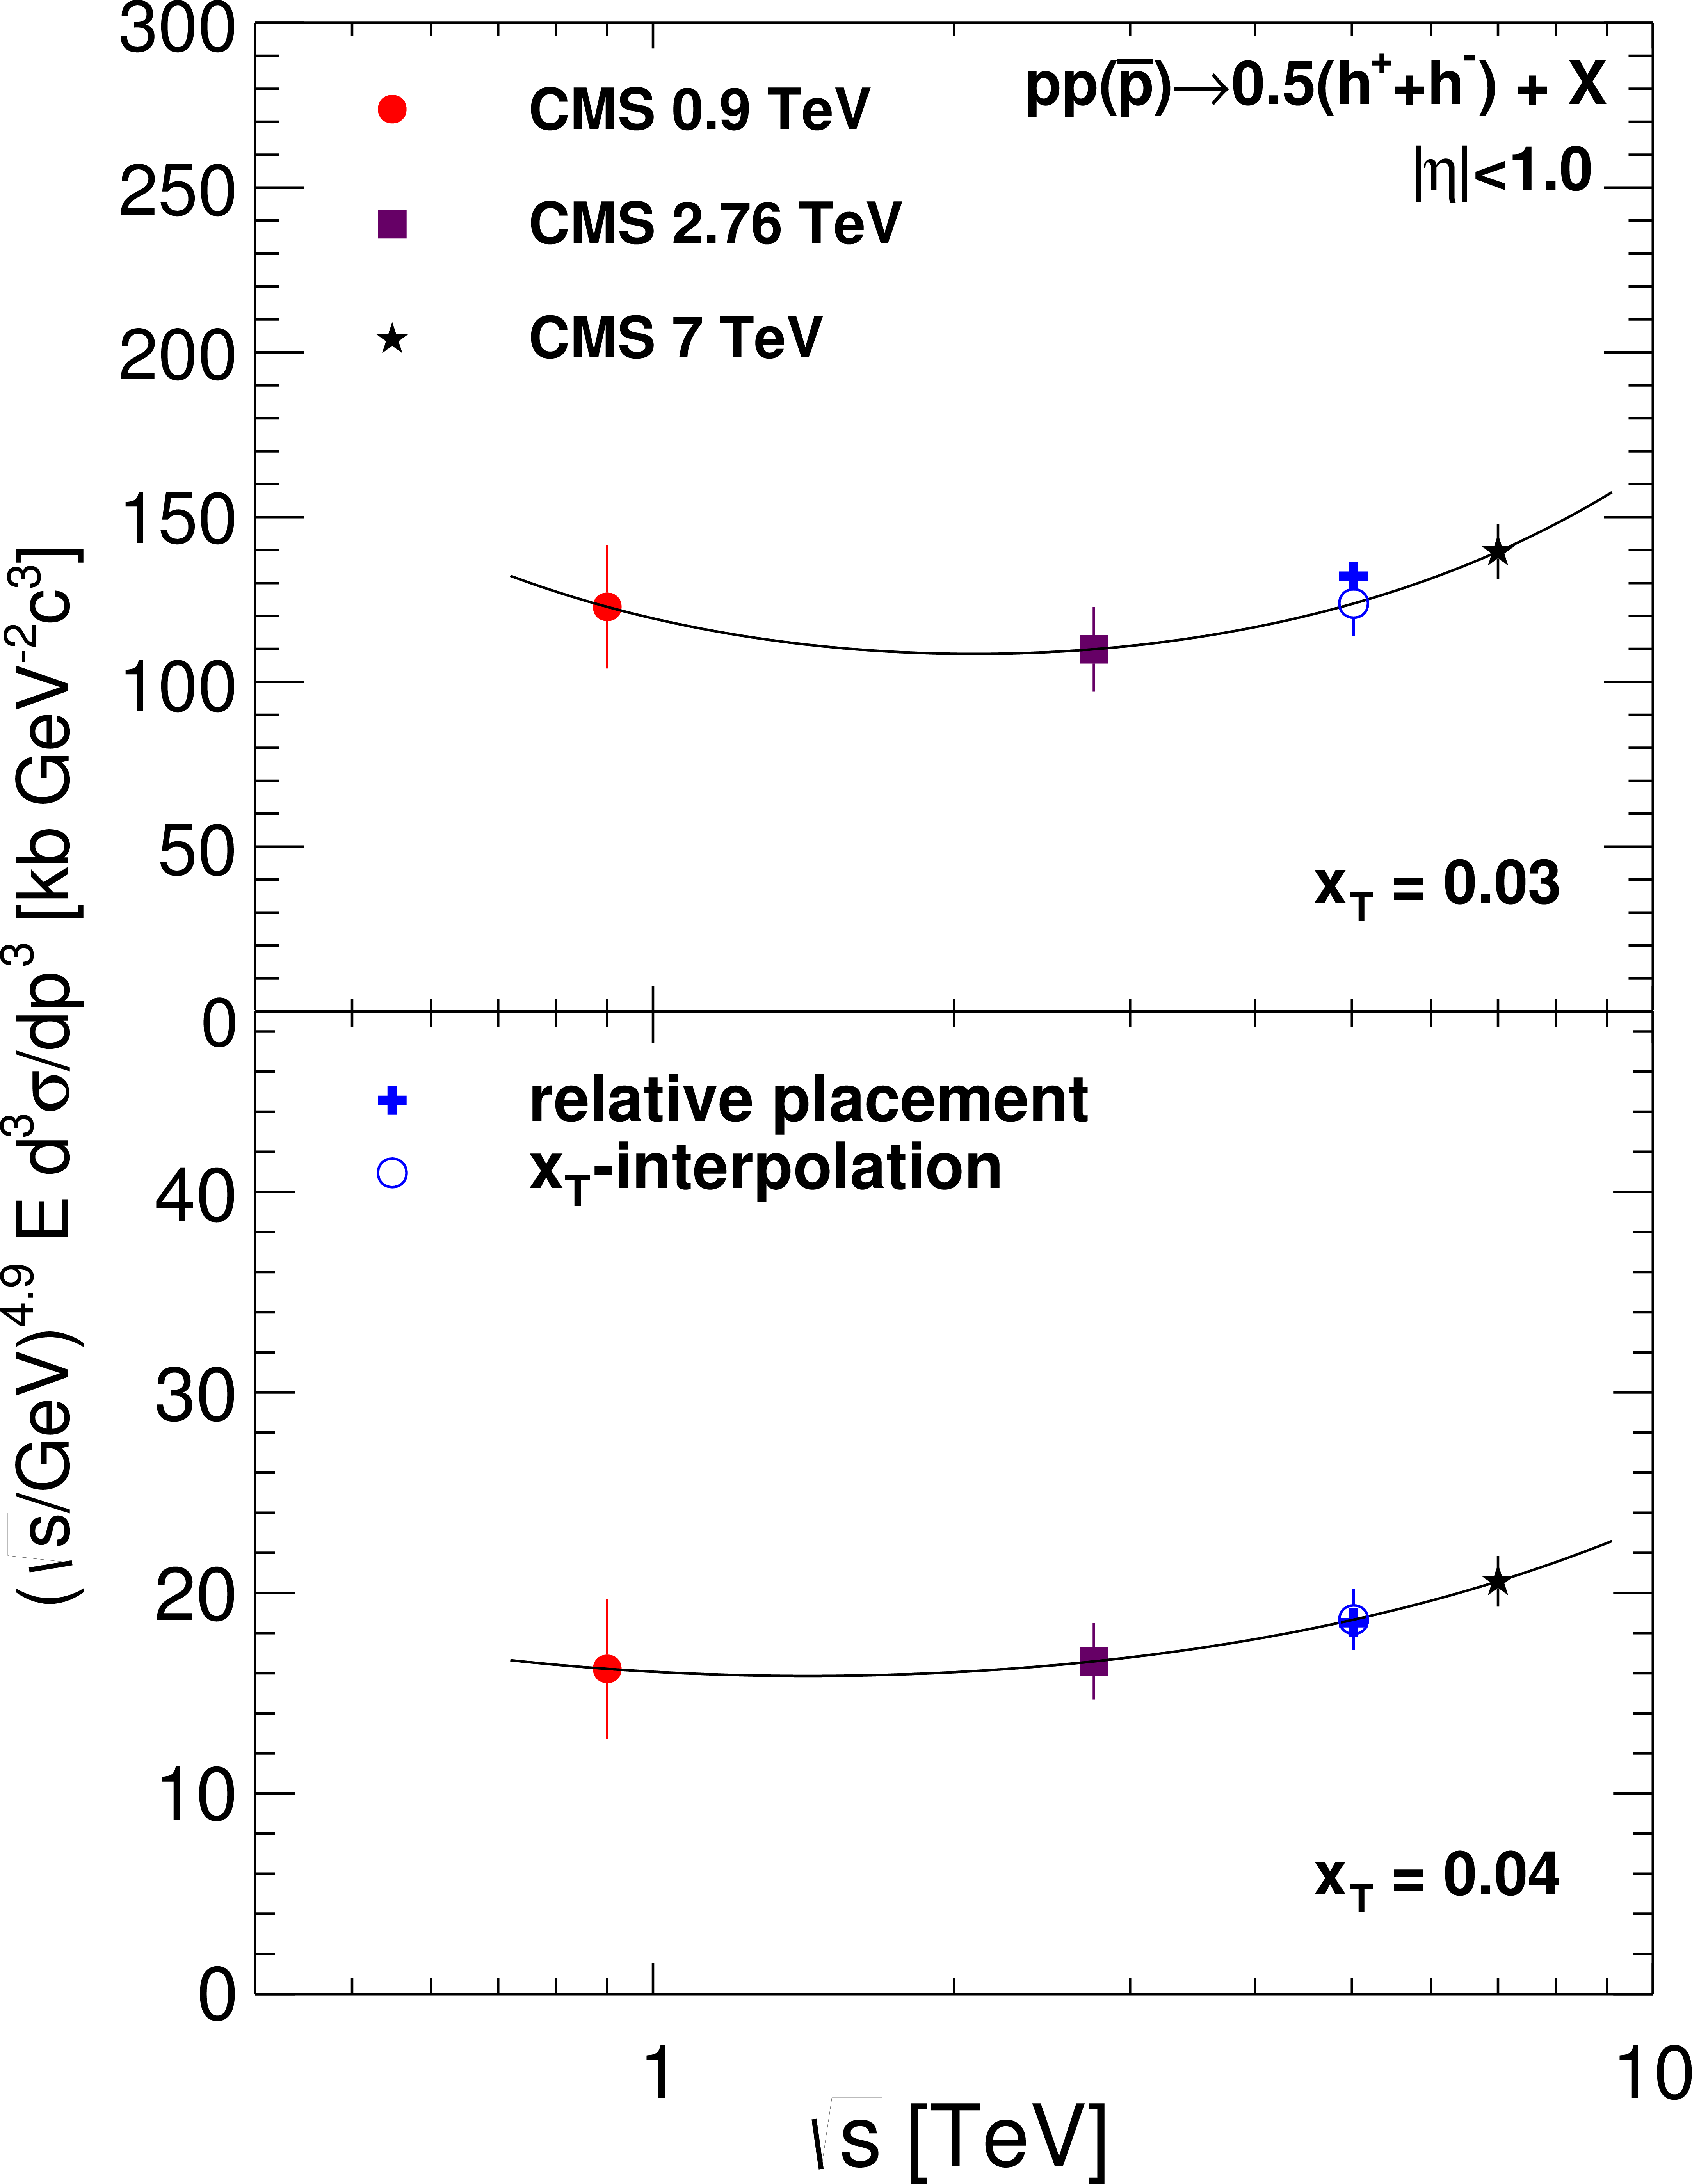
Figure 2-a:
Examples of interpolations between measured charged-particle differential cross sections at different $\sqrt {s}$ for $ {p_{\mathrm {T}}} $ values of 3 and 15 GeV/$c$ (a and b), $x_\mathrm {T}$ values of 0.01 and 0.02 (c), and $x_\mathrm {T}$ values of 0.03 and 0.04 (d). These $x_\mathrm {T}$ values correspond to $ {p_{\mathrm {T}}} \approx $ 25, 50, 75, and 100 GeV/$c$ at $\sqrt {s}=$ 5.02 TeV. The second-order polynomial fits, performed in the plane of the log-log invariant production vs. $\sqrt {s}$, are shown by the solid lines. The open squares and circles, and the filled crosses represent interpolated cross section values at 5.02 TeV using different methods: $ {p_{\mathrm {T}}} $-based interpolation, $x_\mathrm {T}$-based interpolation, and relative placement, respectively. The error bars on the interpolated points represent the uncertainties in the fit. |
png pdf |
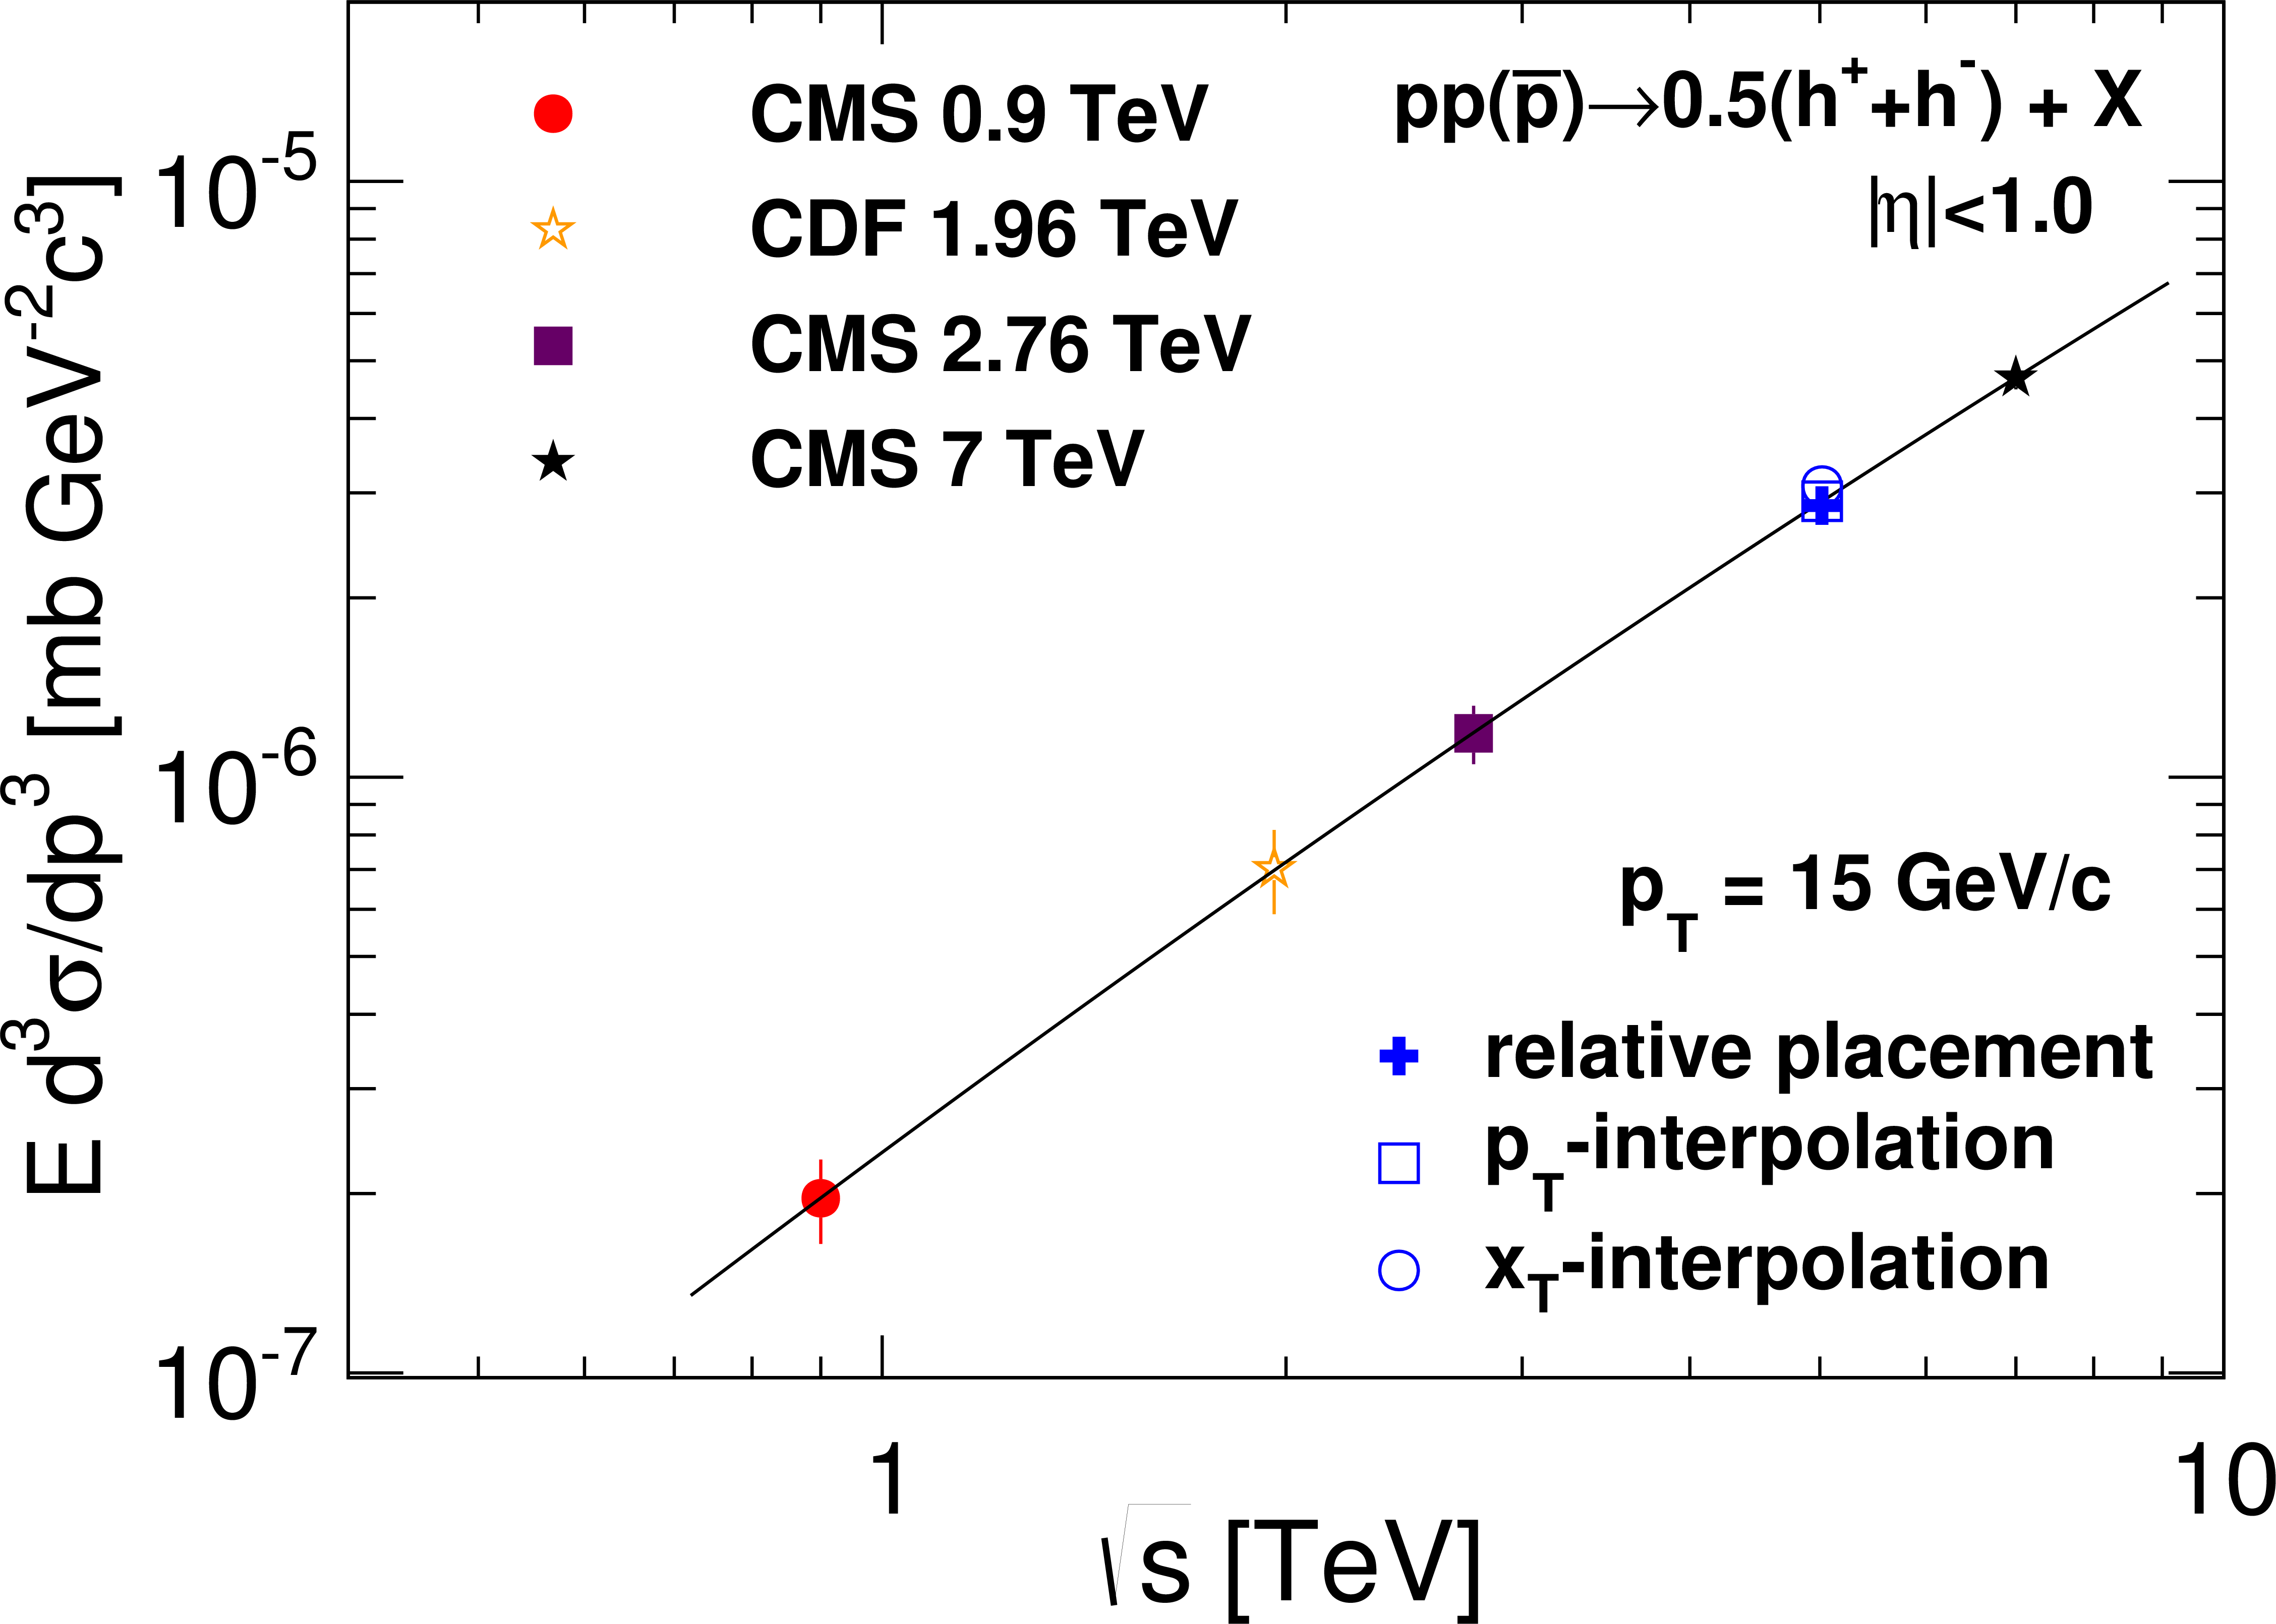
Figure 2-b:
Examples of interpolations between measured charged-particle differential cross sections at different $\sqrt {s}$ for $ {p_{\mathrm {T}}} $ values of 3 and 15 GeV/$c$ (a and b), $x_\mathrm {T}$ values of 0.01 and 0.02 (c), and $x_\mathrm {T}$ values of 0.03 and 0.04 (d). These $x_\mathrm {T}$ values correspond to $ {p_{\mathrm {T}}} \approx $ 25, 50, 75, and 100 GeV/$c$ at $\sqrt {s}=$ 5.02 TeV. The second-order polynomial fits, performed in the plane of the log-log invariant production vs. $\sqrt {s}$, are shown by the solid lines. The open squares and circles, and the filled crosses represent interpolated cross section values at 5.02 TeV using different methods: $ {p_{\mathrm {T}}} $-based interpolation, $x_\mathrm {T}$-based interpolation, and relative placement, respectively. The error bars on the interpolated points represent the uncertainties in the fit. |
png pdf |
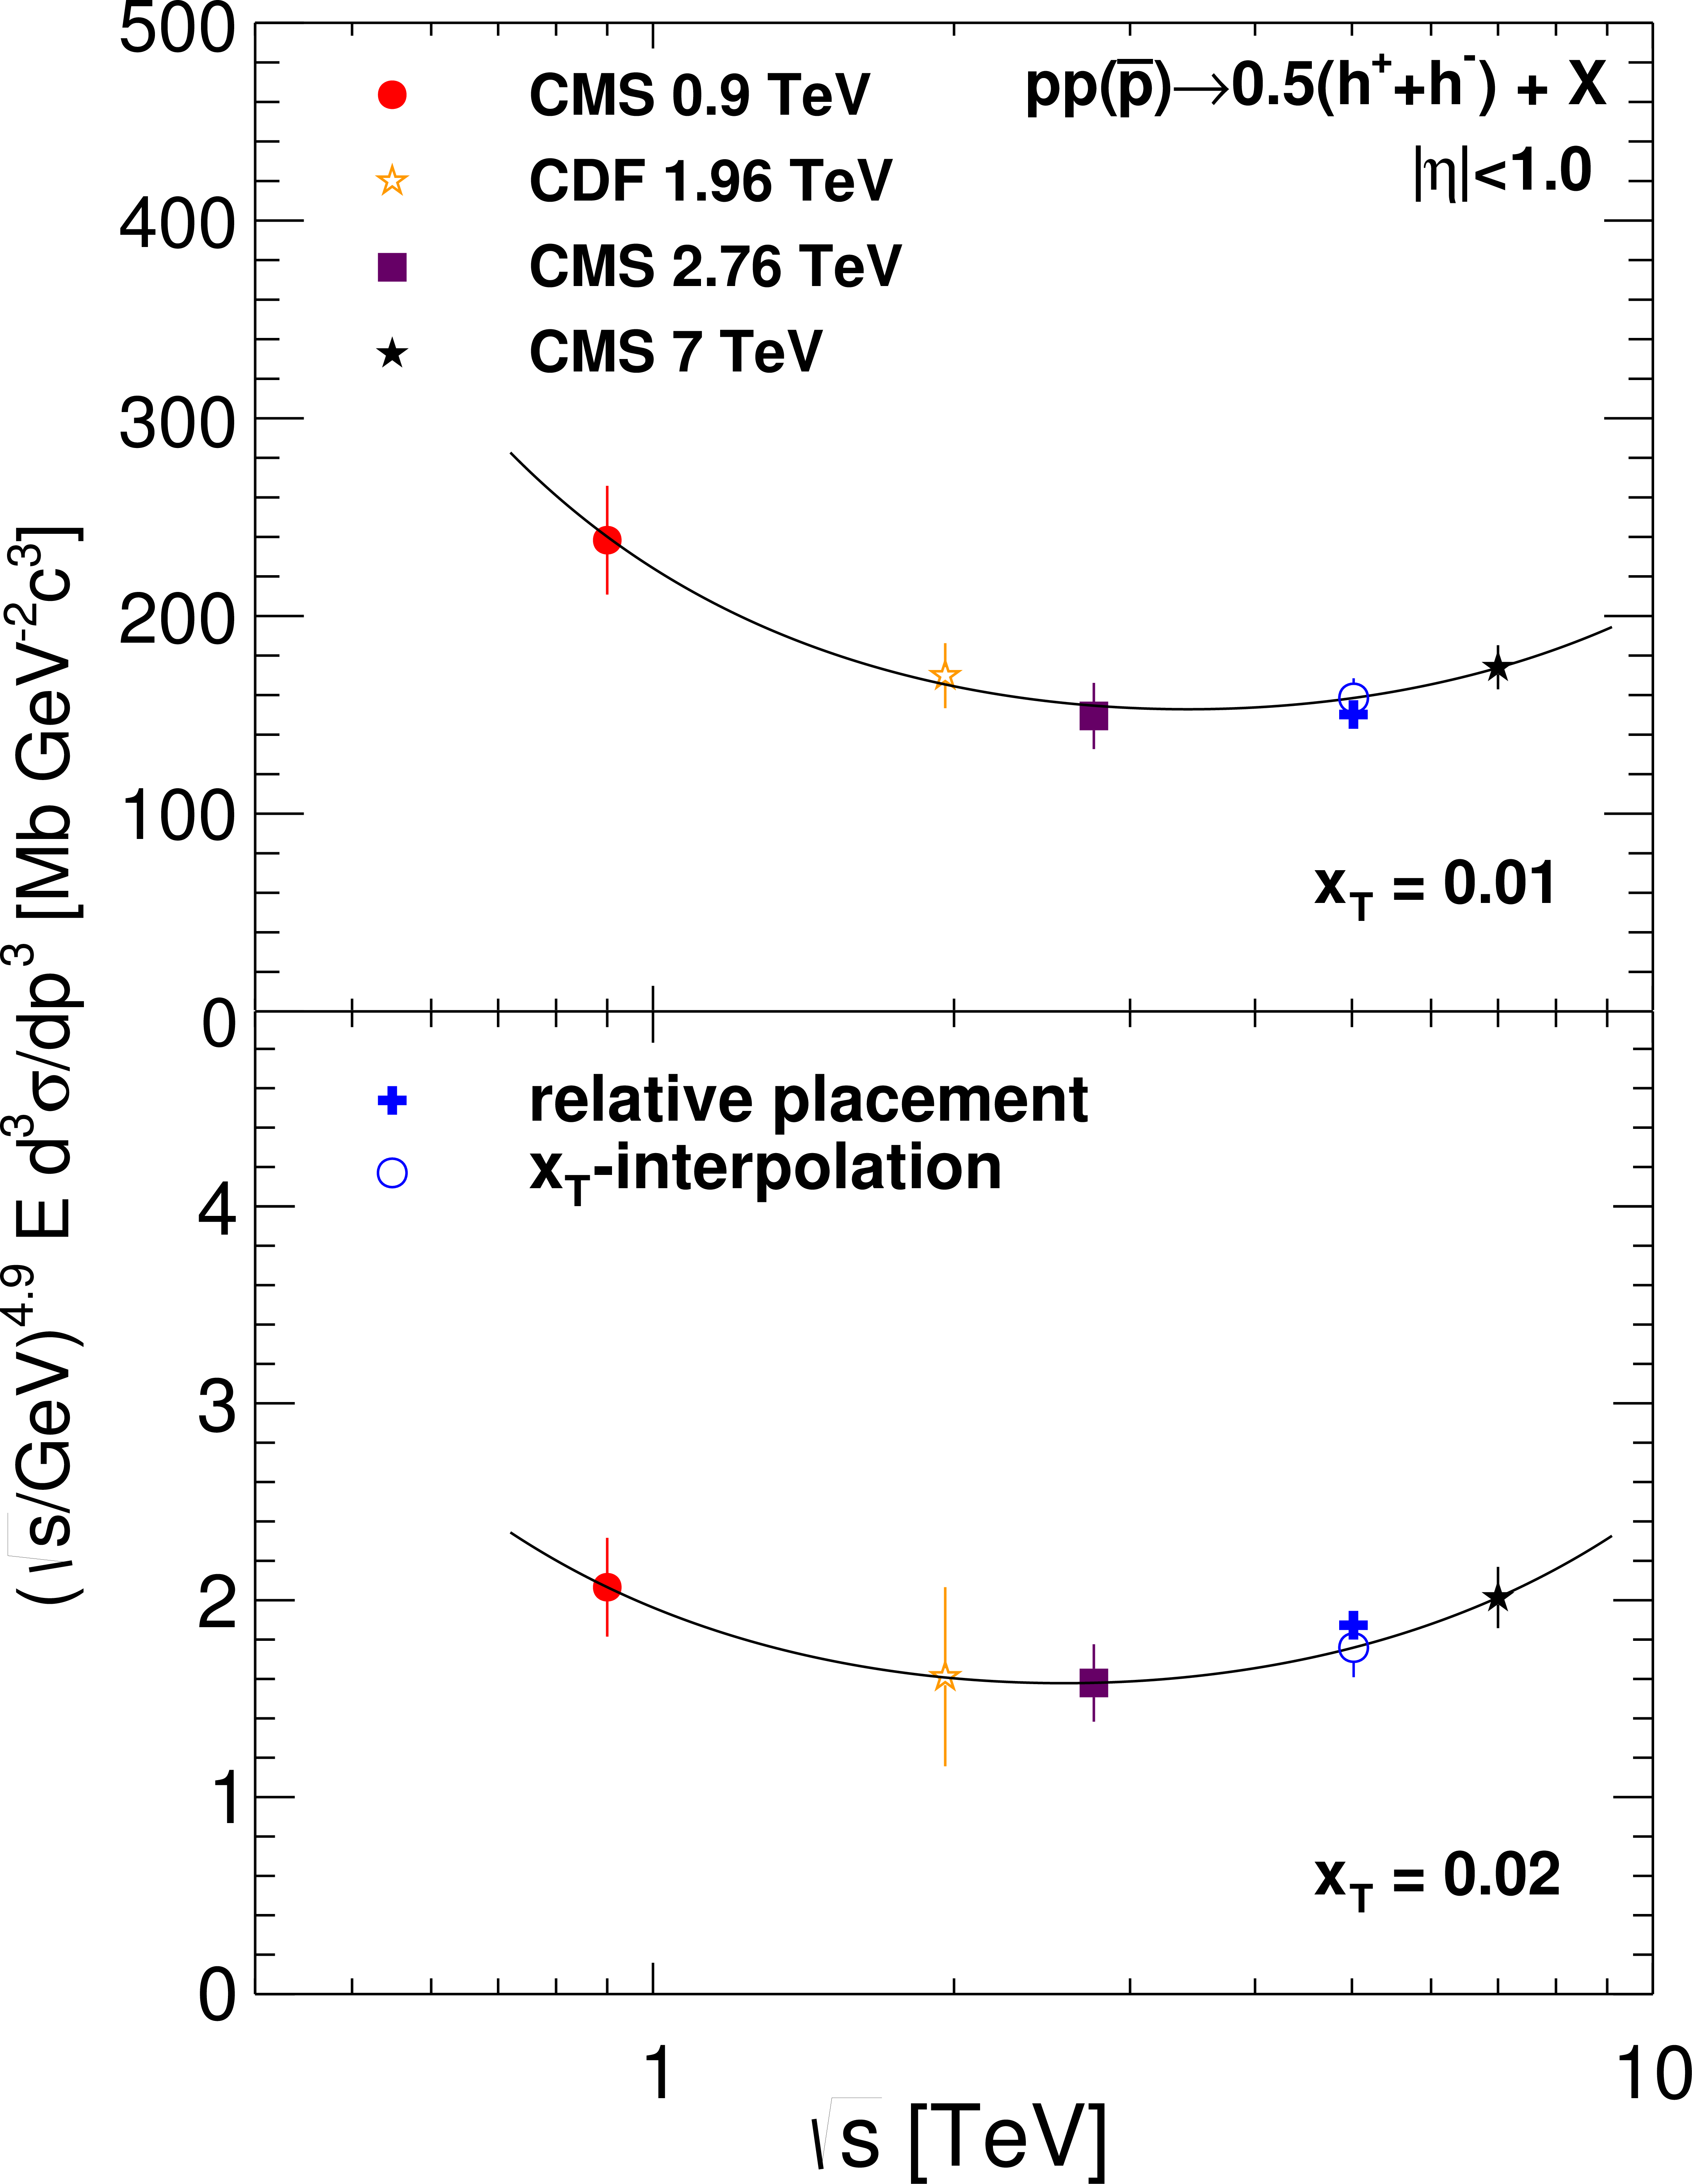
Figure 2-c:
Examples of interpolations between measured charged-particle differential cross sections at different $\sqrt {s}$ for $ {p_{\mathrm {T}}} $ values of 3 and 15 GeV/$c$ (a and b), $x_\mathrm {T}$ values of 0.01 and 0.02 (c), and $x_\mathrm {T}$ values of 0.03 and 0.04 (d). These $x_\mathrm {T}$ values correspond to $ {p_{\mathrm {T}}} \approx $ 25, 50, 75, and 100 GeV/$c$ at $\sqrt {s}=$ 5.02 TeV. The second-order polynomial fits, performed in the plane of the log-log invariant production vs. $\sqrt {s}$, are shown by the solid lines. The open squares and circles, and the filled crosses represent interpolated cross section values at 5.02 TeV using different methods: $ {p_{\mathrm {T}}} $-based interpolation, $x_\mathrm {T}$-based interpolation, and relative placement, respectively. The error bars on the interpolated points represent the uncertainties in the fit. |
png pdf |
Figure 2-d:
Examples of interpolations between measured charged-particle differential cross sections at different $\sqrt {s}$ for $ {p_{\mathrm {T}}} $ values of 3 and 15 GeV/$c$ (a and b), $x_\mathrm {T}$ values of 0.01 and 0.02 (c), and $x_\mathrm {T}$ values of 0.03 and 0.04 (d). These $x_\mathrm {T}$ values correspond to $ {p_{\mathrm {T}}} \approx $ 25, 50, 75, and 100 GeV/$c$ at $\sqrt {s}=$ 5.02 TeV. The second-order polynomial fits, performed in the plane of the log-log invariant production vs. $\sqrt {s}$, are shown by the solid lines. The open squares and circles, and the filled crosses represent interpolated cross section values at 5.02 TeV using different methods: $ {p_{\mathrm {T}}} $-based interpolation, $x_\mathrm {T}$-based interpolation, and relative placement, respectively. The error bars on the interpolated points represent the uncertainties in the fit. |
png pdf |
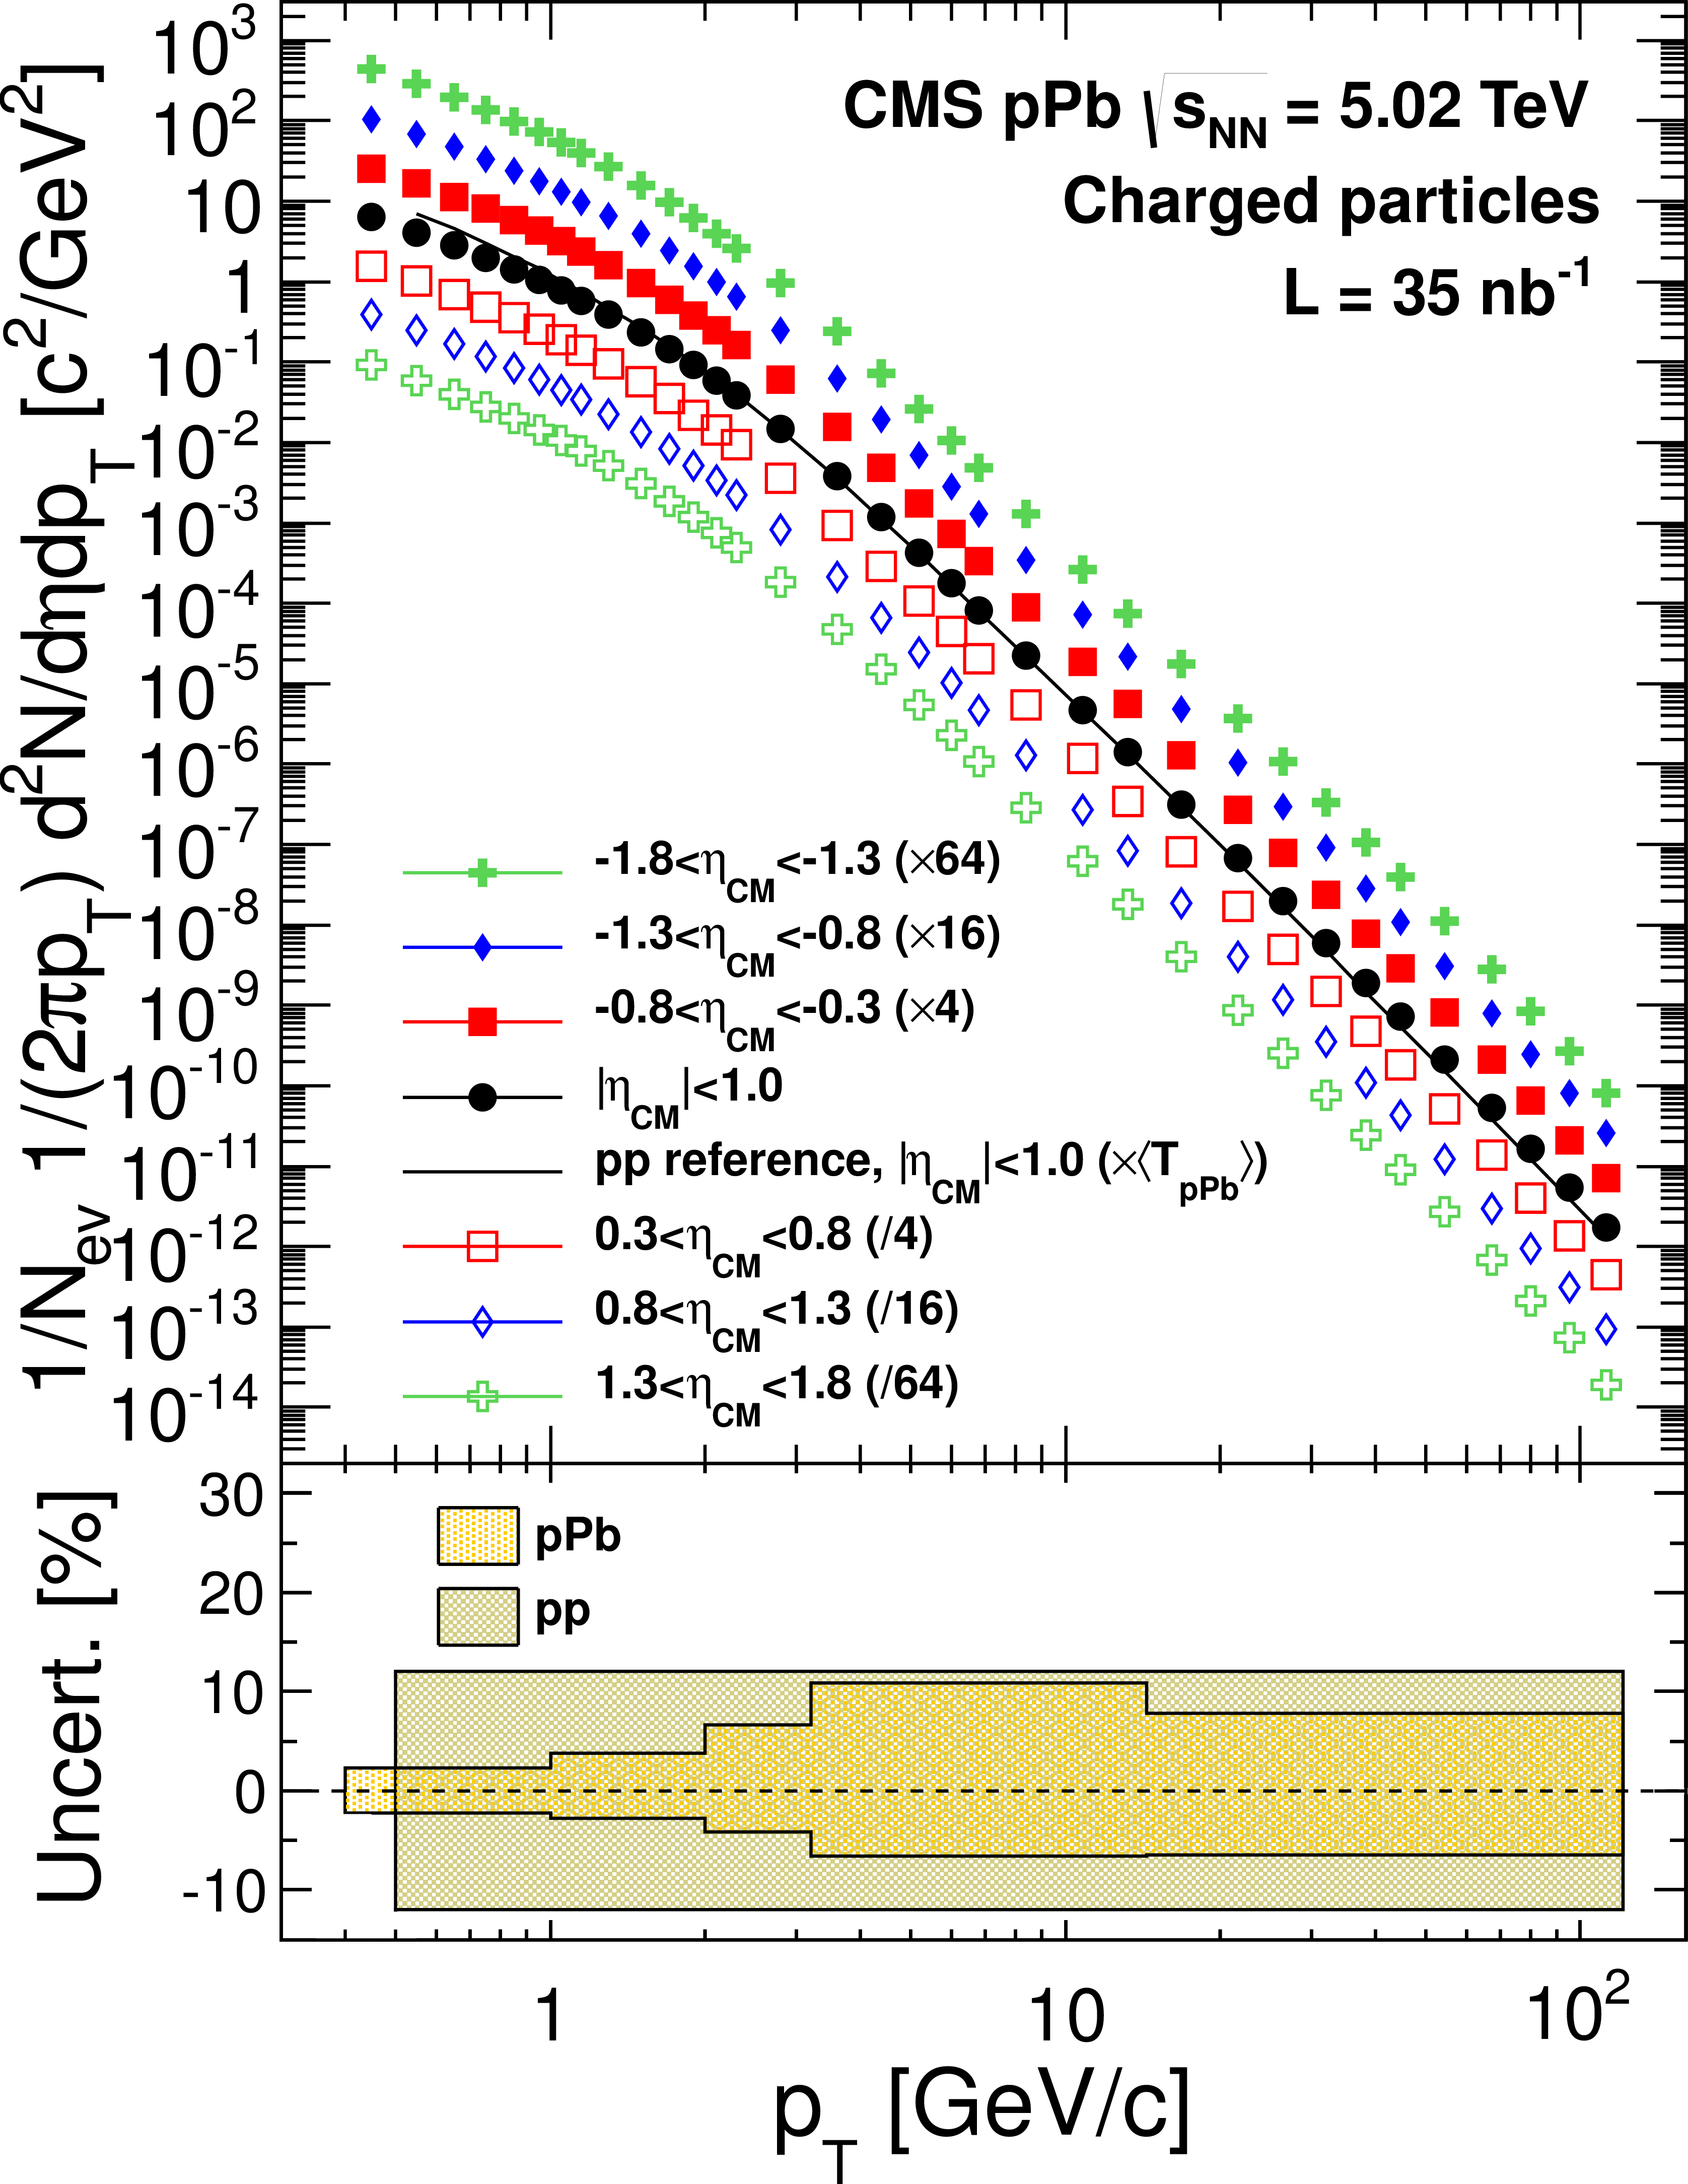
Figure 3:
Top: Measured charged-particle transverse momentum spectra in pPb collisions at $ {\sqrt {s_{_\mathrm {NN}}}} = $ 5.02 TeV for: $ {| {\eta _\text {cm} } | }<1.0$, $0.3<\pm {\eta _\text {cm} }<0.8$, $0.8<\pm {\eta _\text {cm} }<1.3$, and $1.3<\pm {\eta _\text {cm} }<1.8$, and the interpolated pp reference spectrum in $ {| {\eta _\text {cm} } | }<1$, normalized to the number of double-sided events. Positive pseudorapidity values correspond to the proton beam direction. The spectra have been scaled by the quoted factors to provide better visibility. Bottom: Systematic uncertainties in the measured pPb and interpolated pp spectra, as a function of $ {p_{\mathrm {T}}} $ (see text). |

png pdf |
Figure 4:
Measured nuclear modification factor as a function of $ {p_{\mathrm {T}}} $ for charged particles produced in $ {| {\eta _\text {cm} } | }<1$. The shaded band at unity and $ {p_{\mathrm {T}}} \approx 0.6$ represents the uncertainty in the Glauber calculation of $< \mathrm {T}_\mathrm {pPb} > $. The smaller uncertainty band around the data points shows the uncertainty from effects (combining spectra, track selection, and trigger efficiency) that are fully correlated in specific $ {p_{\mathrm {T}}} $ regions. The total systematic uncertainties, dominated by uncertainty in the pp interpolation, are shown by the larger band (see Table 1, Systematics). |
png pdf |
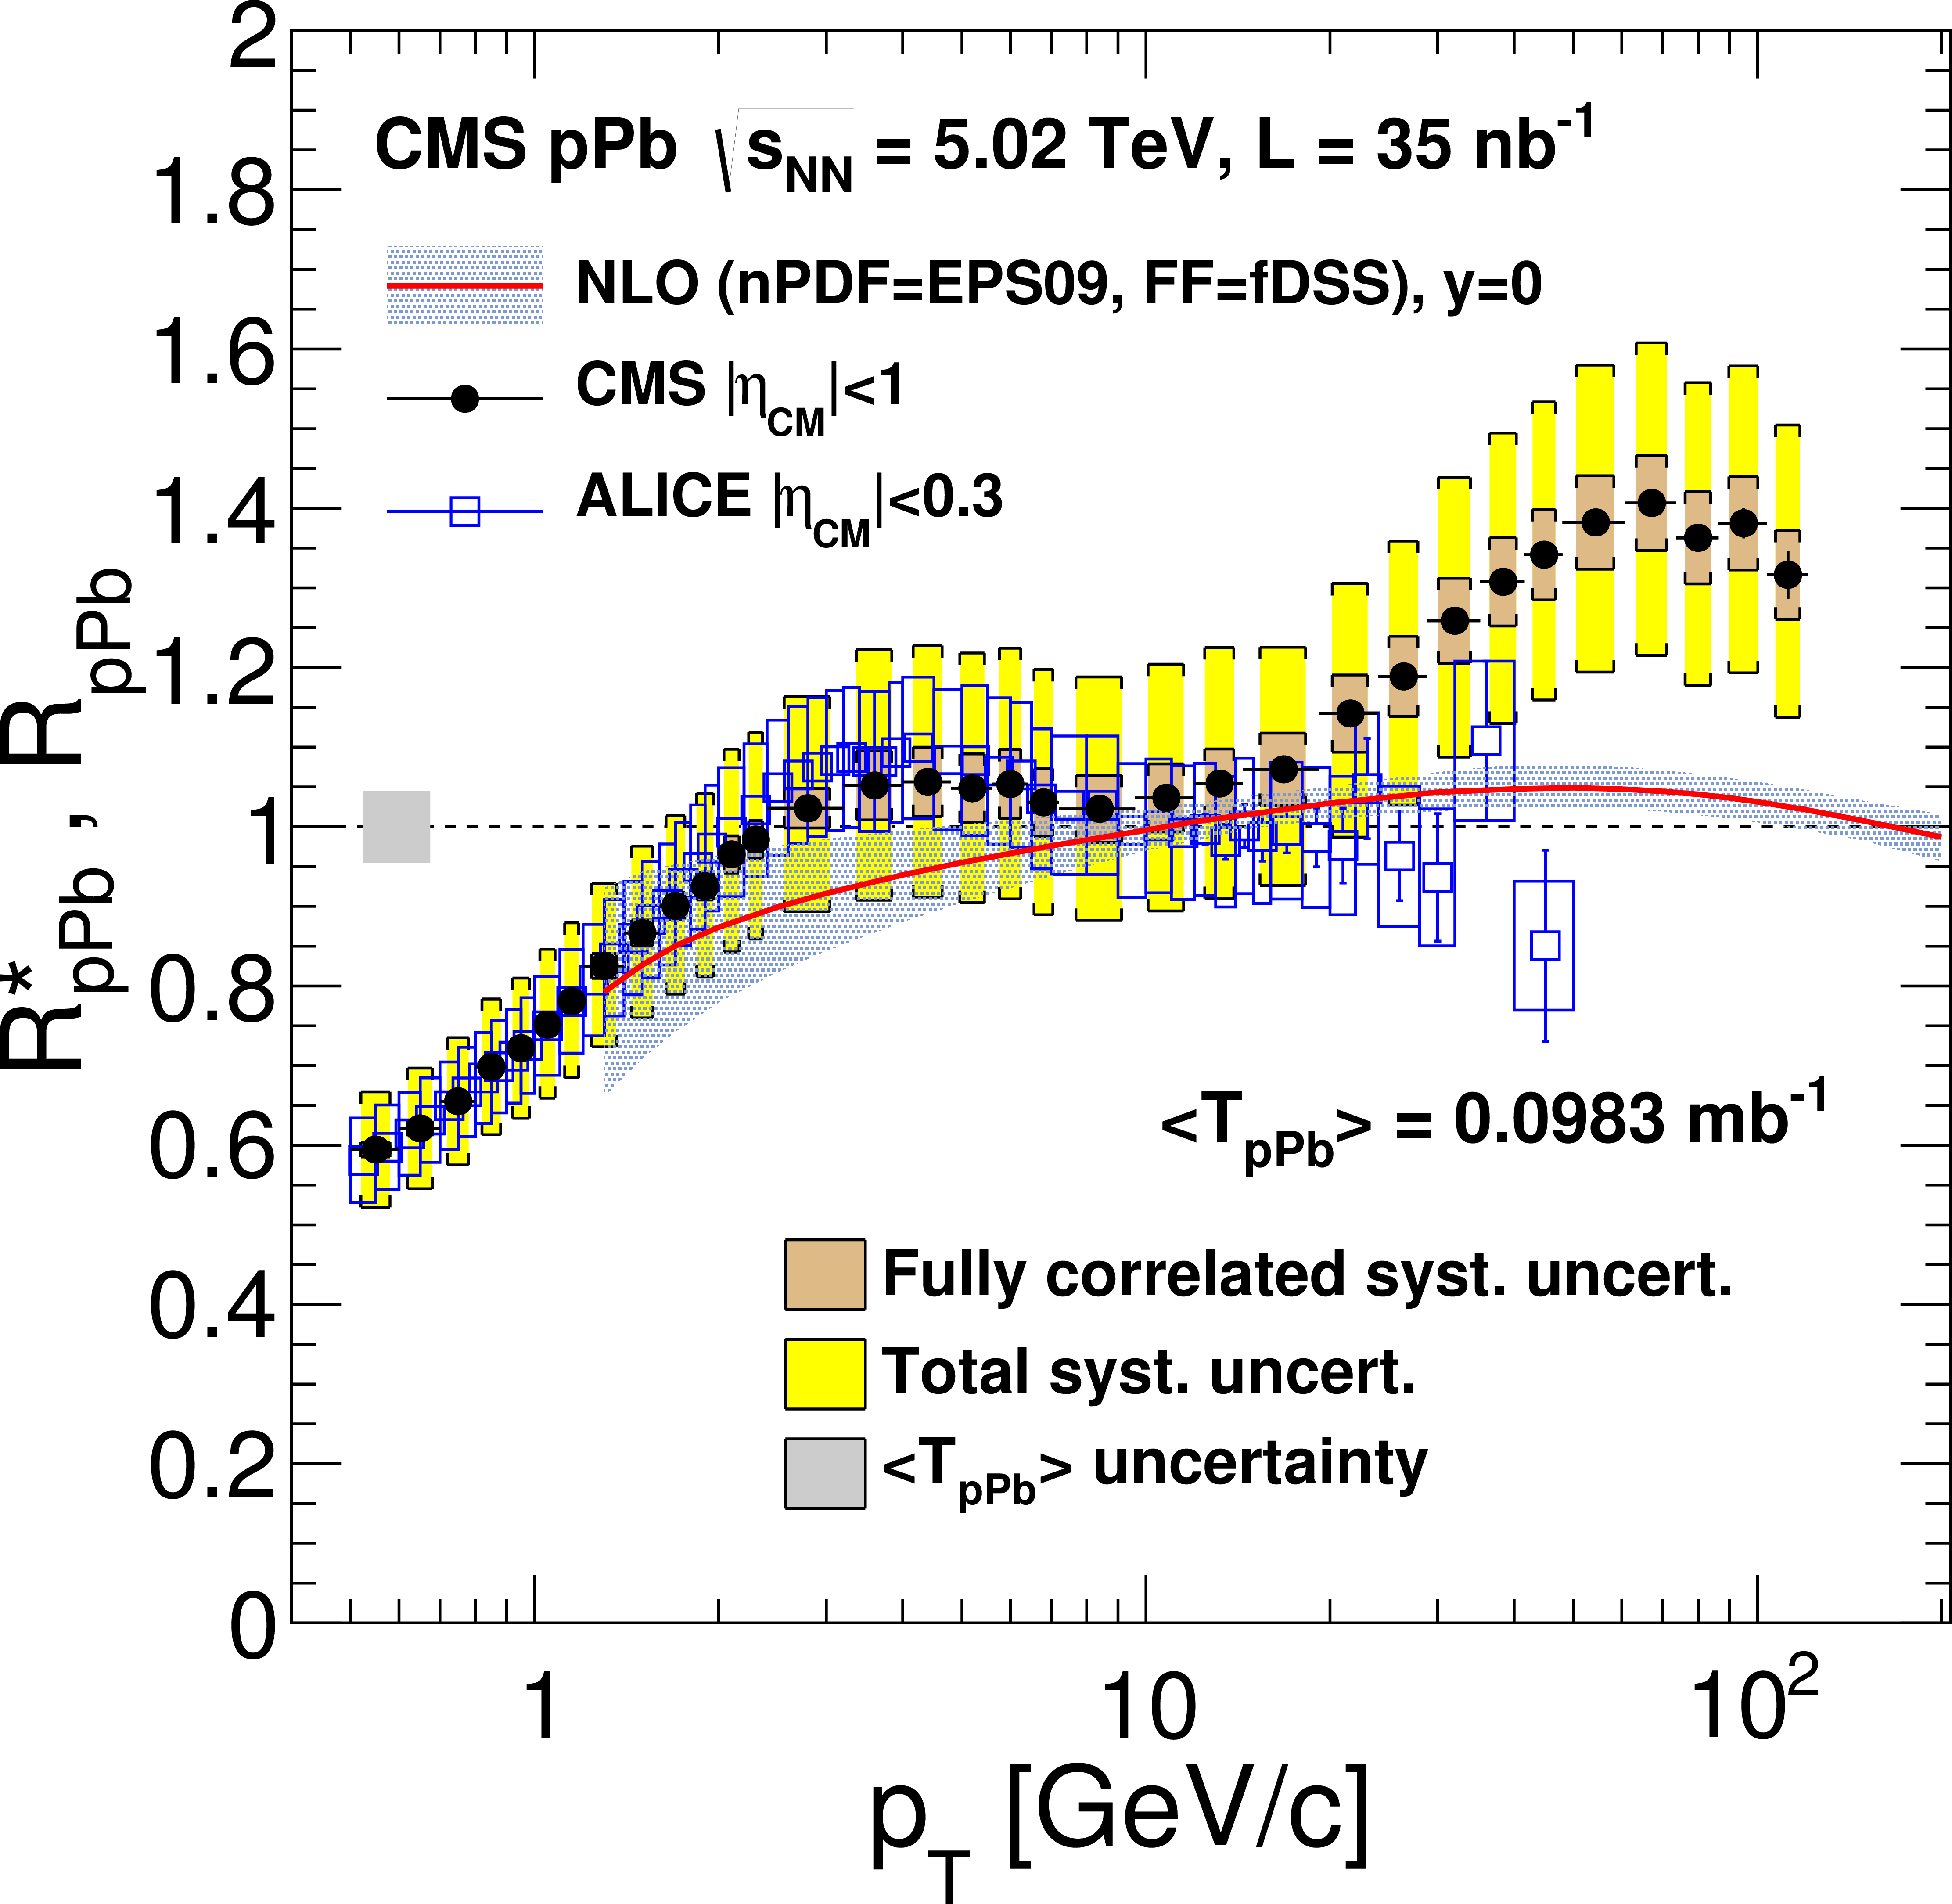
Figure 5:
Charged-particle nuclear modification factors measured by CMS in $ {| {\eta _\text {cm} } | }<1$ (filled circles), and by ALICE in $ {| {\eta _\text {cm} } | }<0.3 $ (open squares), are compared to the NLO pQCD prediction of Ref.[53]. The theoretical uncertainty is based on the EPS09 error sets. For the CMS measurement, the shaded band at unity and $ {p_{\mathrm {T}}} \approx 0.6$ represents the uncertainty in the Glauber calculation of $< \mathrm {T}_\mathrm {pPb} >$, the smaller uncertainty band around the data points shows the fully correlated uncertainties and the total systematic uncertainty is shown by the larger band (see Table 1, Systematics). For the ALICE measurement, the total systematic uncertainties, excluding the normalization uncertainty of 6%, are shown with open boxes. |
png pdf |
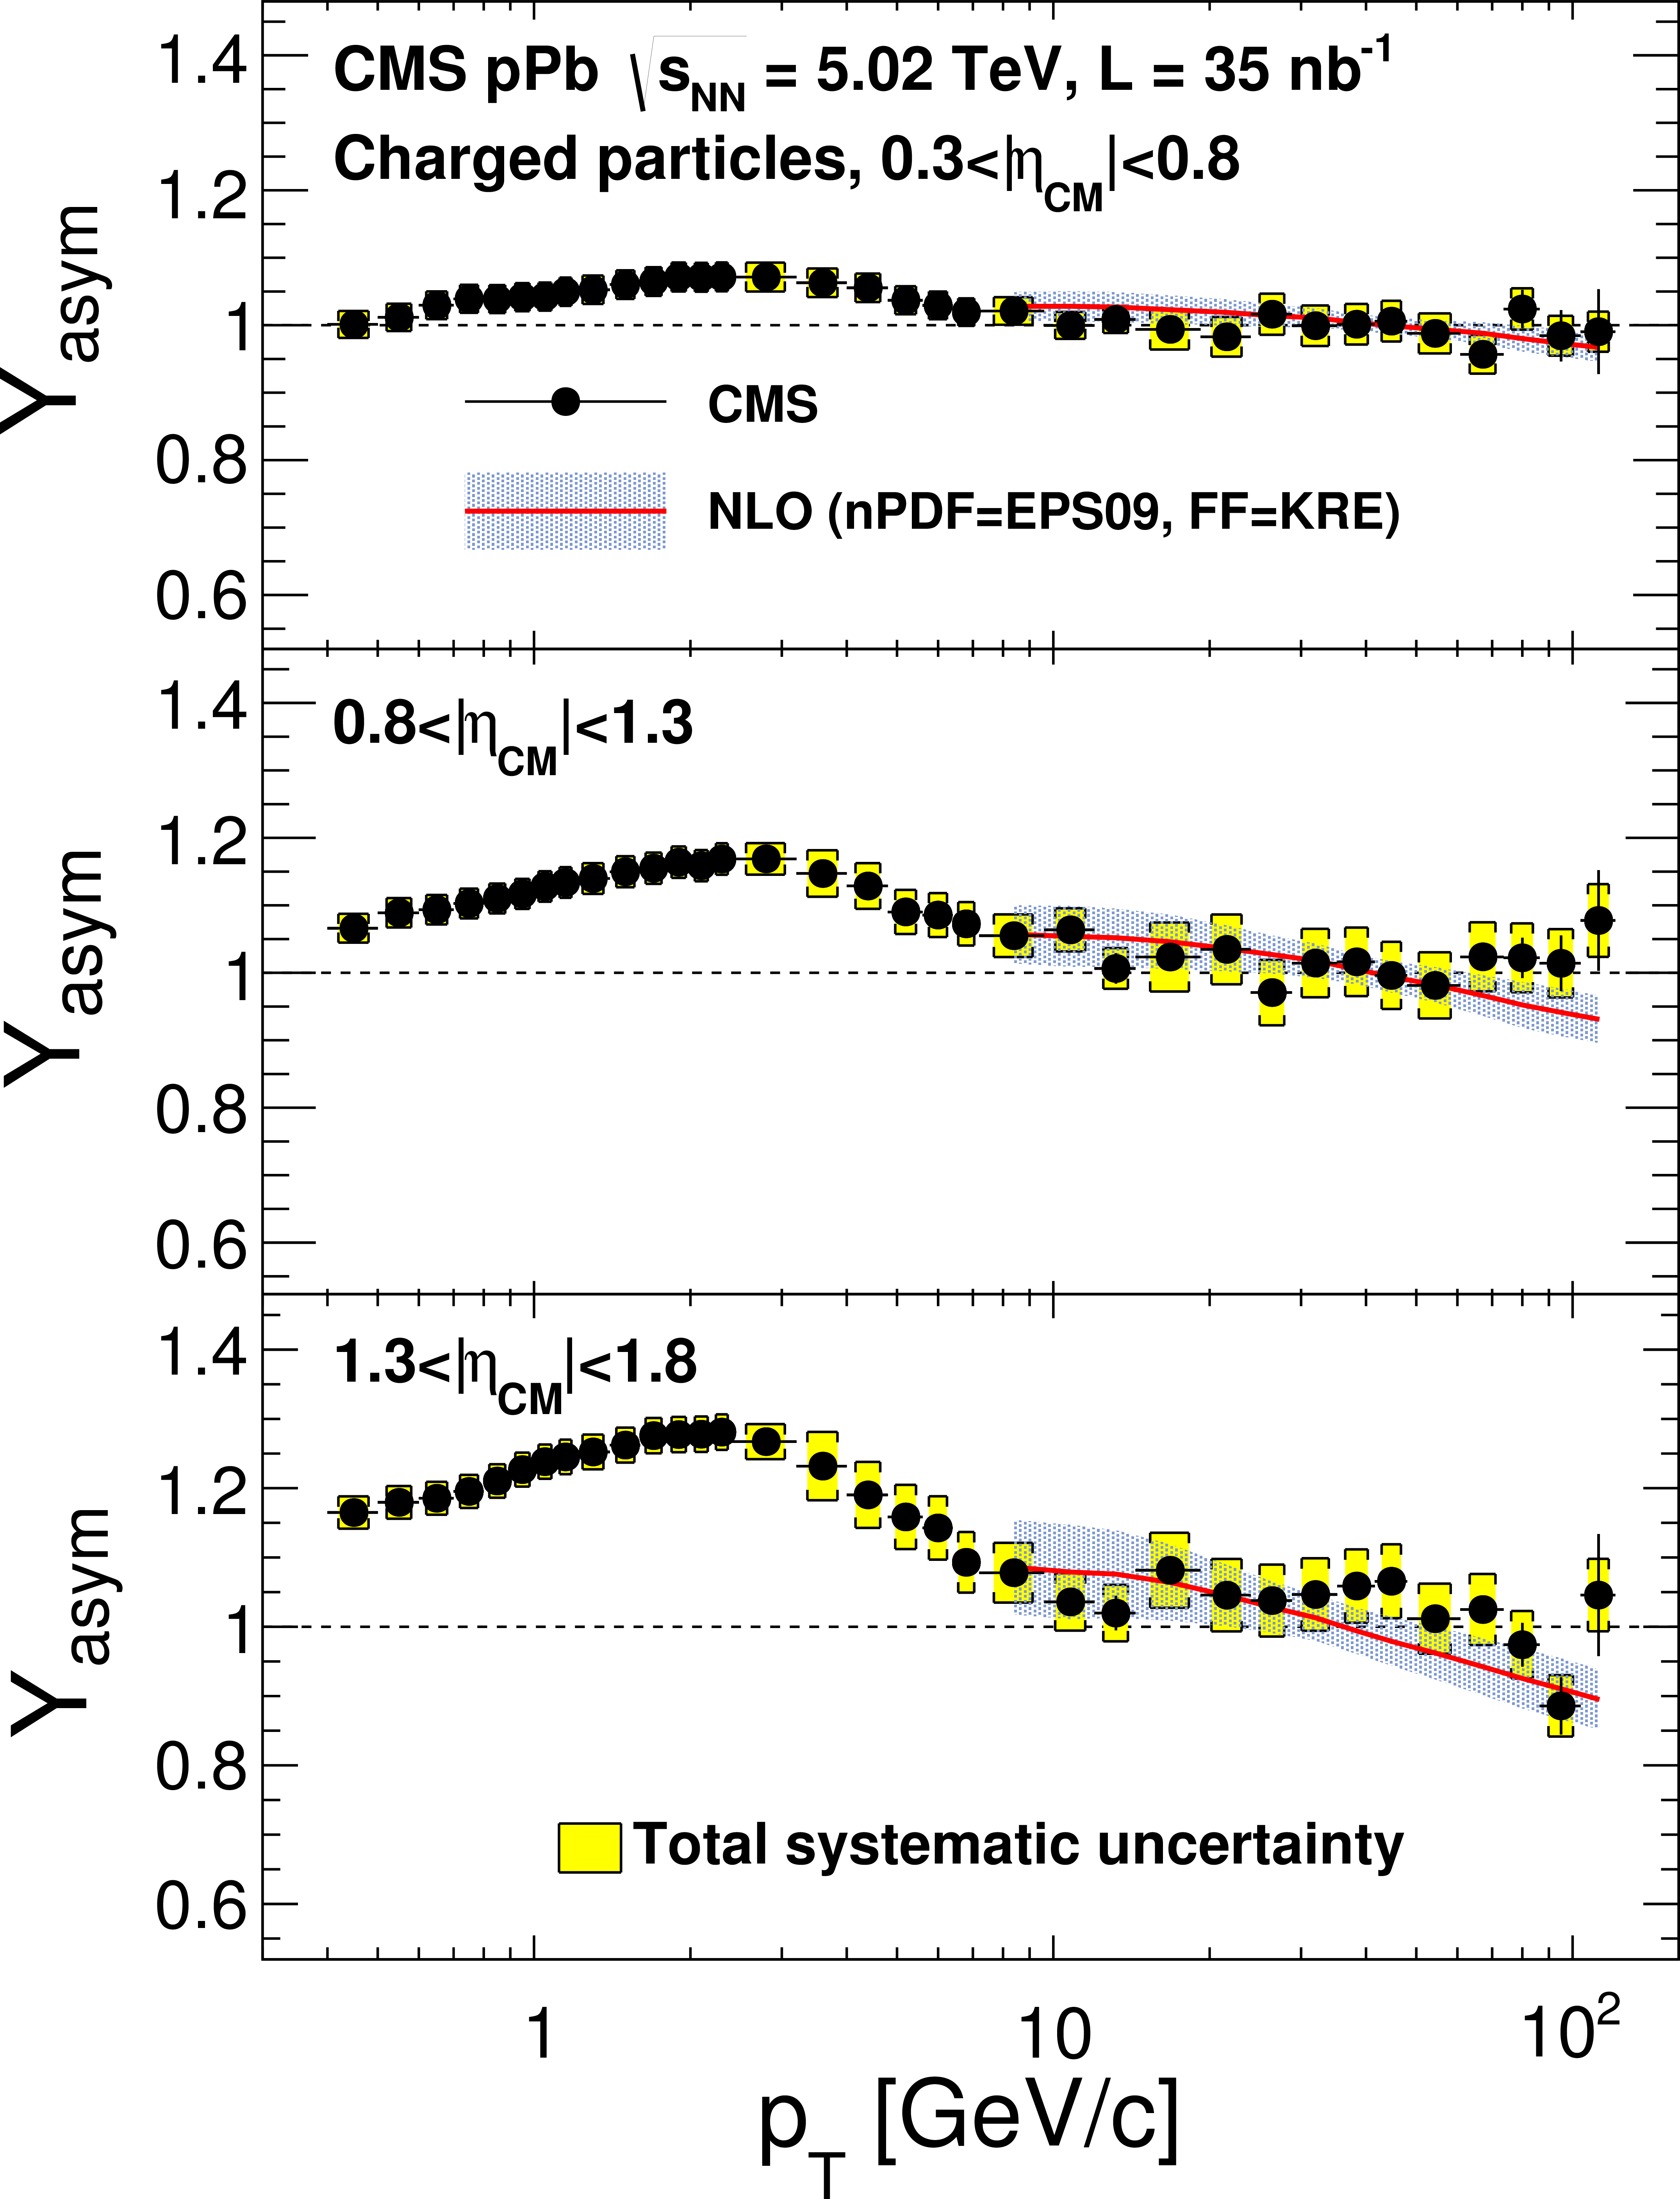
Figure 6:
Charged-particle forward-backward yield asymmetry as a function of $ {p_{\mathrm {T}}} $ for $0.3< {| {\eta _\text {cm} } | }<0.8$ (top), $0.8< {| {\eta _\text {cm} } | }<1.3$ (middle), and $1.3< {| {\eta _\text {cm} } | }<1.8$ (bottom). The asymmetry is computed as the charged-particle yields in the direction of the Pb beam divided by those of the proton beam. The solid curves are NLO pQCD theoretical calculations including nPDFs modifications [53]. The theoretical uncertainty is based on the EPS09 error sets. |
|
|
Compact Muon Solenoid LHC, CERN |
|

|

|

|

|

|