

Compact Muon Solenoid
LHC, CERN
| CMS-PAS-HIG-19-004 | ||
| A measurement of the Higgs boson mass in the diphoton decay channel | ||
| CMS Collaboration | ||
| September 2019 | ||
| Abstract: A measurement of the mass of the Higgs boson in the diphoton decay channel is presented. This analysis is based on 35.9 fb$^{-1}$ of proton-proton collision data collected in 2016 with the CMS detector at a center-of-mass energy of 13 TeV. The Higgs boson mass is measured to be $m_\text{H}$ = 125.78 $\pm$ 0.26 GeV. This is combined with a measurement of $m_\text{H}$ already performed in the $\mathrm{H} \rightarrow \mathrm{ZZ}^{*} \rightarrow 4\ell$ decay channel using the same dataset, giving $m_\text{H}$ = 125.46 $\pm$ 0.17 GeV. This result, when combined with an earlier measurement of the Higgs boson mass using data collected in 2011 and 2012 with the CMS detector, gives a value for the Higgs boson mass of $m_\text{H}$ = 125.35 $\pm$ 0.15 GeV. In this note we summarize the strategy of this measurement in the $\mathrm{H}\rightarrow \gamma \gamma$ final state emphasizing the methods employed to mitigate and to quantify the main sources of systematic uncertainty. The combination strategy is also described. | ||
|
Links:
CDS record (PDF) ;
CADI line (restricted) ;
These preliminary results are superseded in this paper, PLB 805 (2020) 135425. The superseded preliminary plots can be found here. |
||
| Figures | |
png pdf |
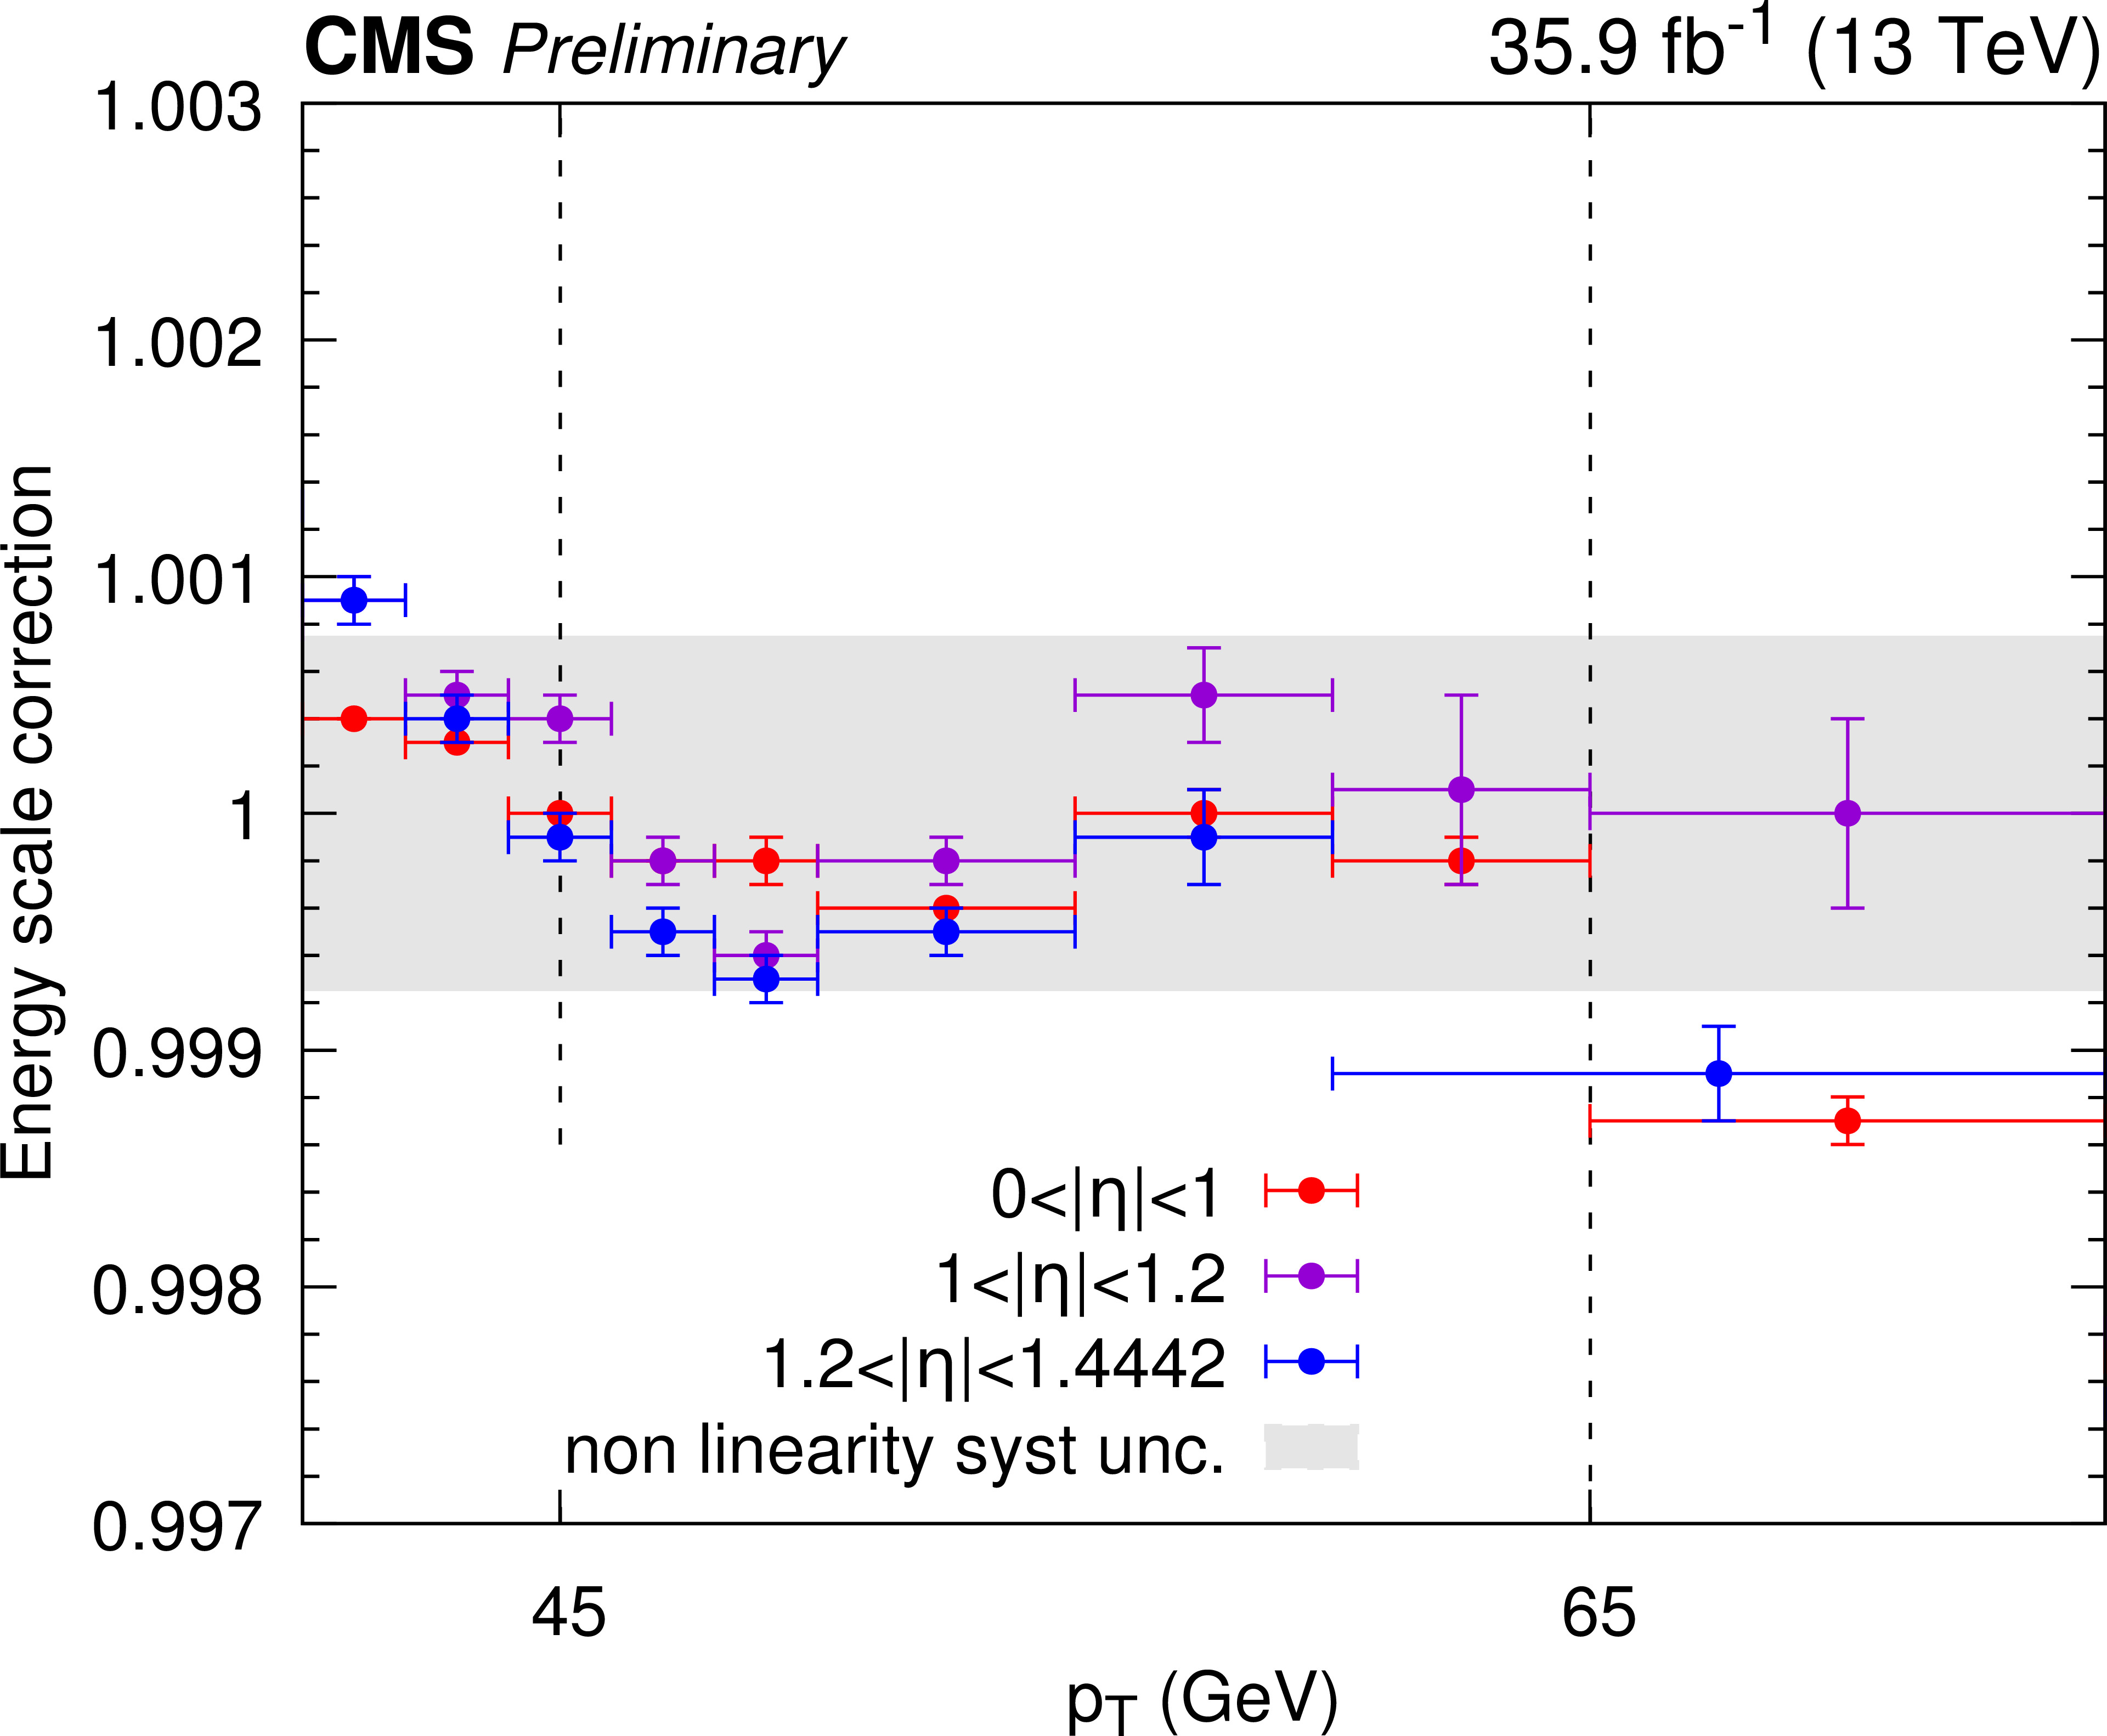
Figure 1:
Energy scale corrections applied to data as function of the ${p_{\mathrm{T}}}$ of the photon. The systematic uncertainty associated to this correction is approximately the maximum deviation observed in the ${p_{\mathrm{T}}}$ range between 45 and 65 GeV for electrons in the ECAL barrel region. |
png pdf |
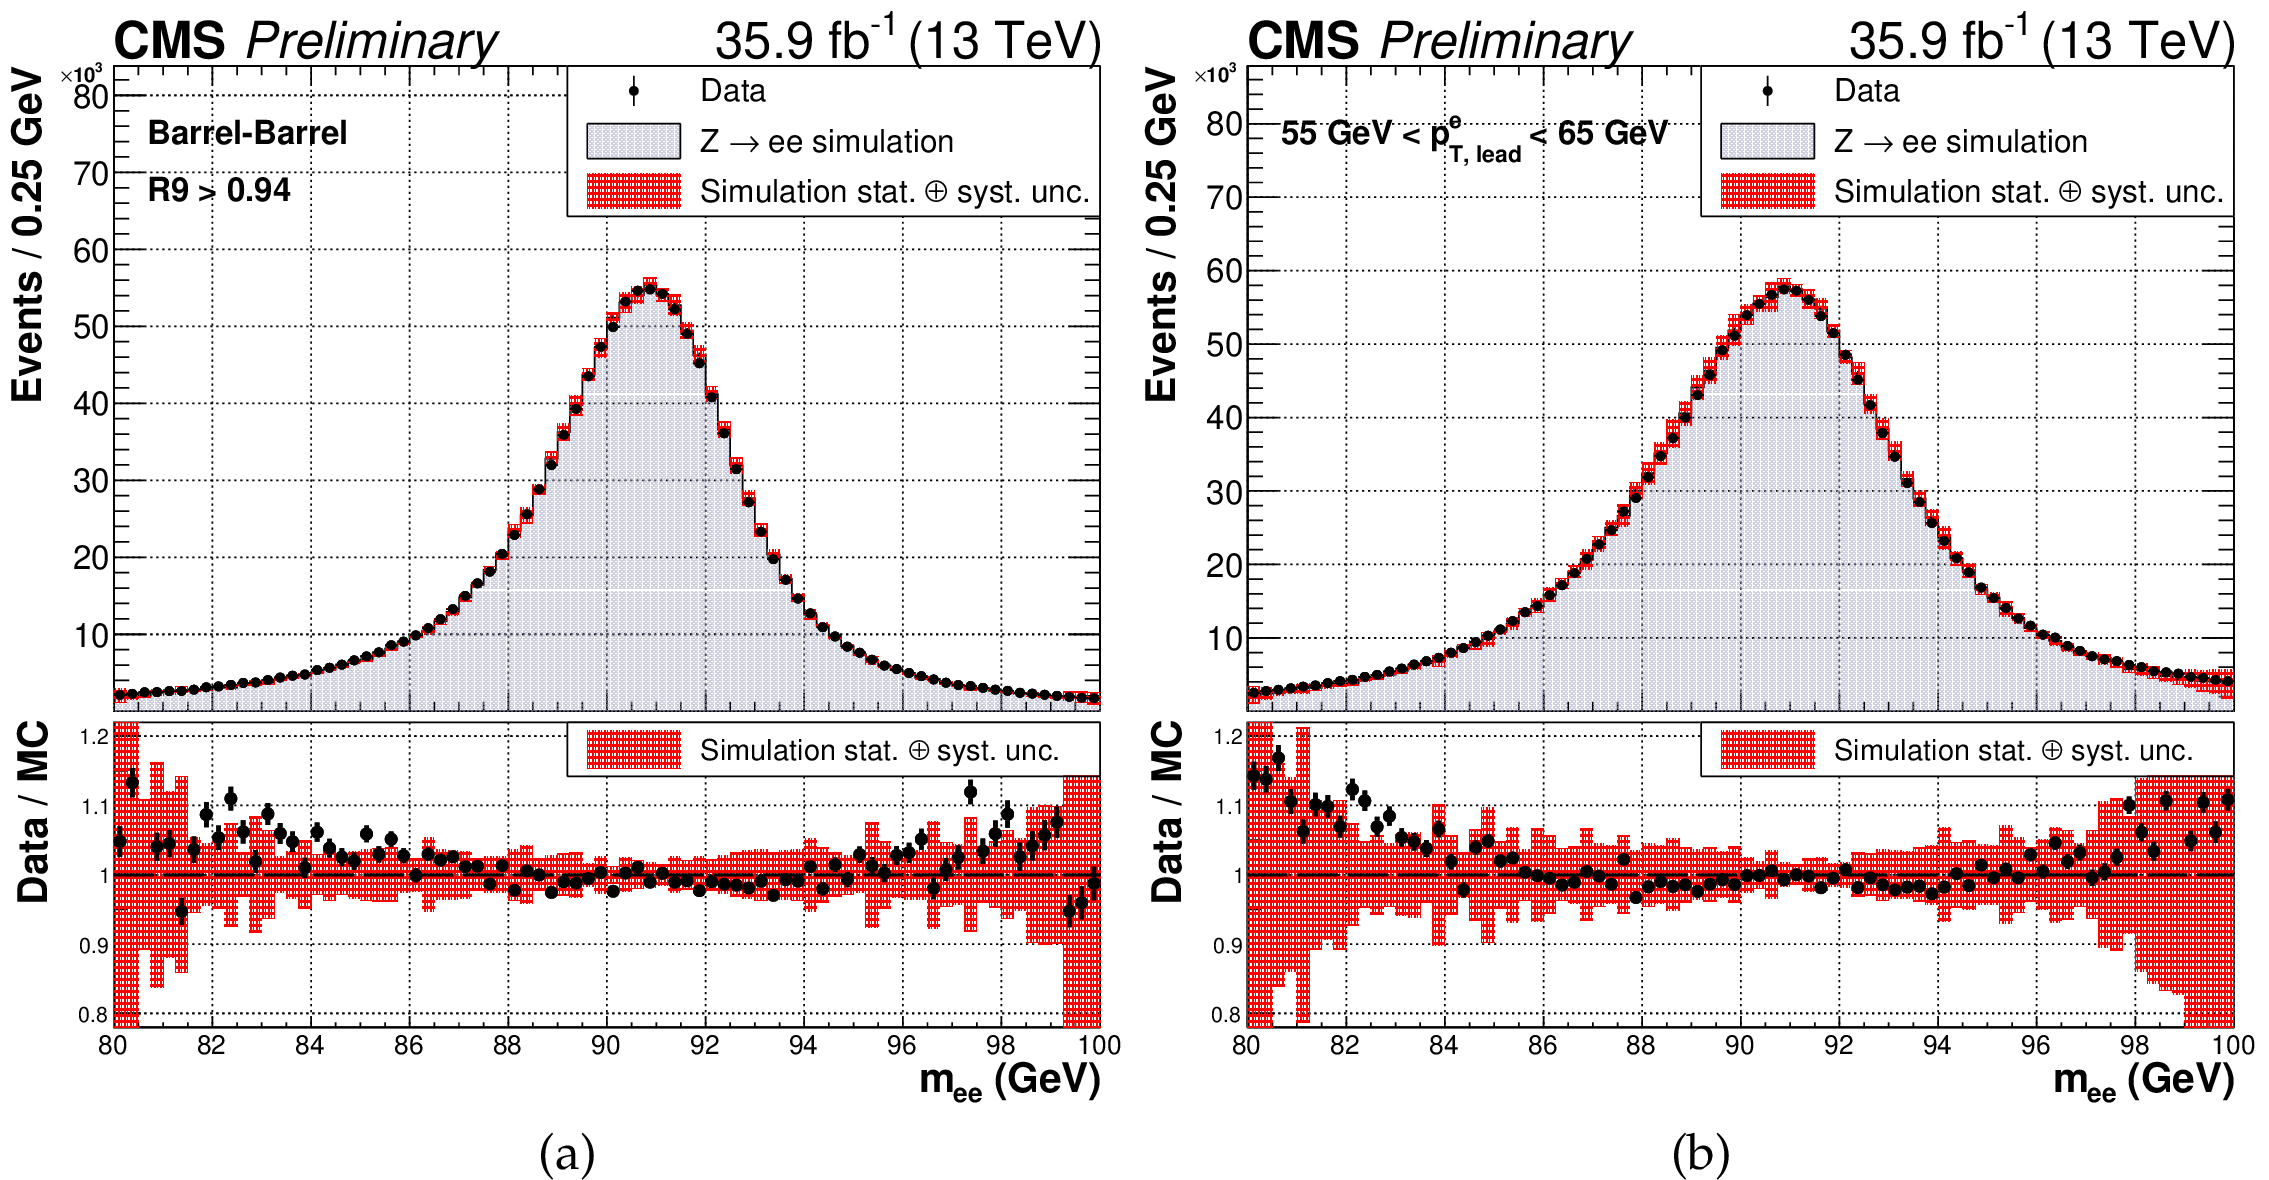
Figure 2:
Comparison of the distributions of the invariant mass of the dielectrons in data and simulation in ${\mathrm{Z} \rightarrow \mathrm{e^{+}e^{-}}}$ events after application of energy corrections in two representative categories. Left: Both electrons are in the ECAL barrel and satisfy $ {R_\mathrm {9}} > $ 0.94. Right: The leading electron has a transverse momentum between 55 and 65 GeV, without a requirement on the second electron. The systematic uncertainty in the error band in the plots include only the uncertainties on the derived energy scale corrections. |
png pdf |
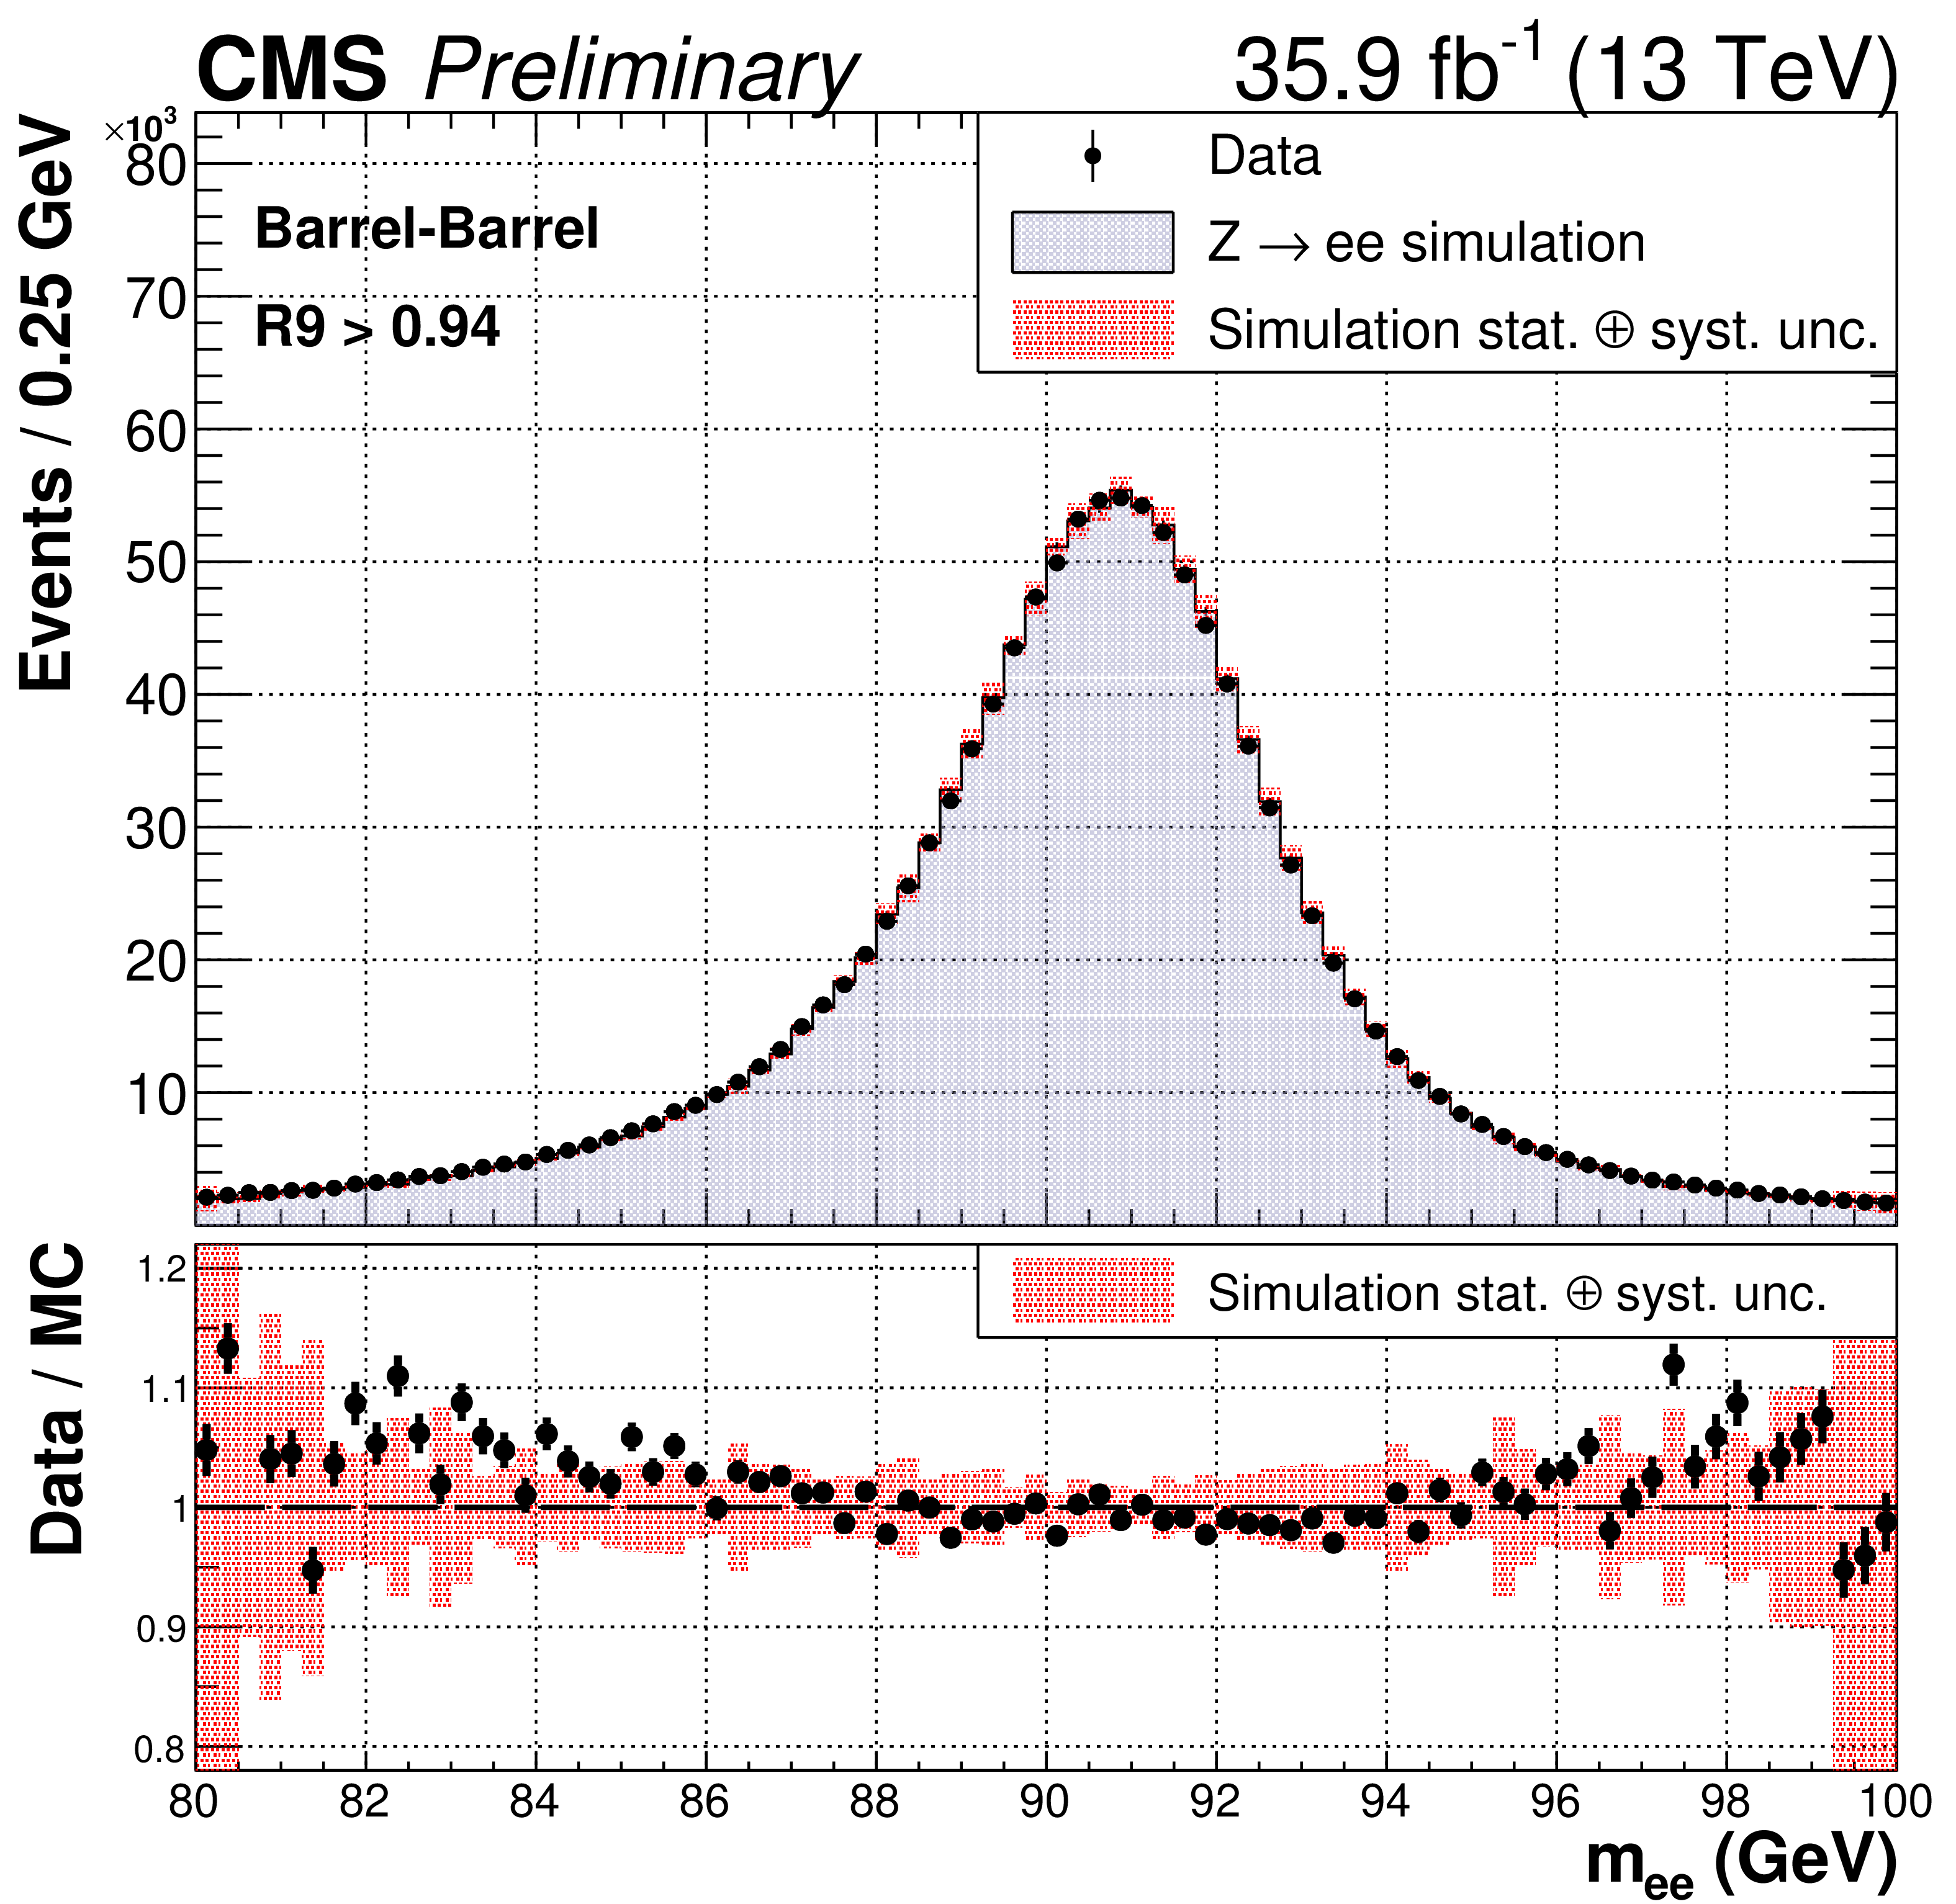
Figure 2-a:
Comparison of the distributions of the invariant mass of the dielectrons in data and simulation in ${\mathrm{Z} \rightarrow \mathrm{e^{+}e^{-}}}$ events after application of energy corrections in the category with both electrons in the ECAL barrel and satisfy $ {R_\mathrm {9}} > $ 0.94. The systematic uncertainty in the error band includes only the uncertainties on the derived energy scale corrections. |
png pdf |
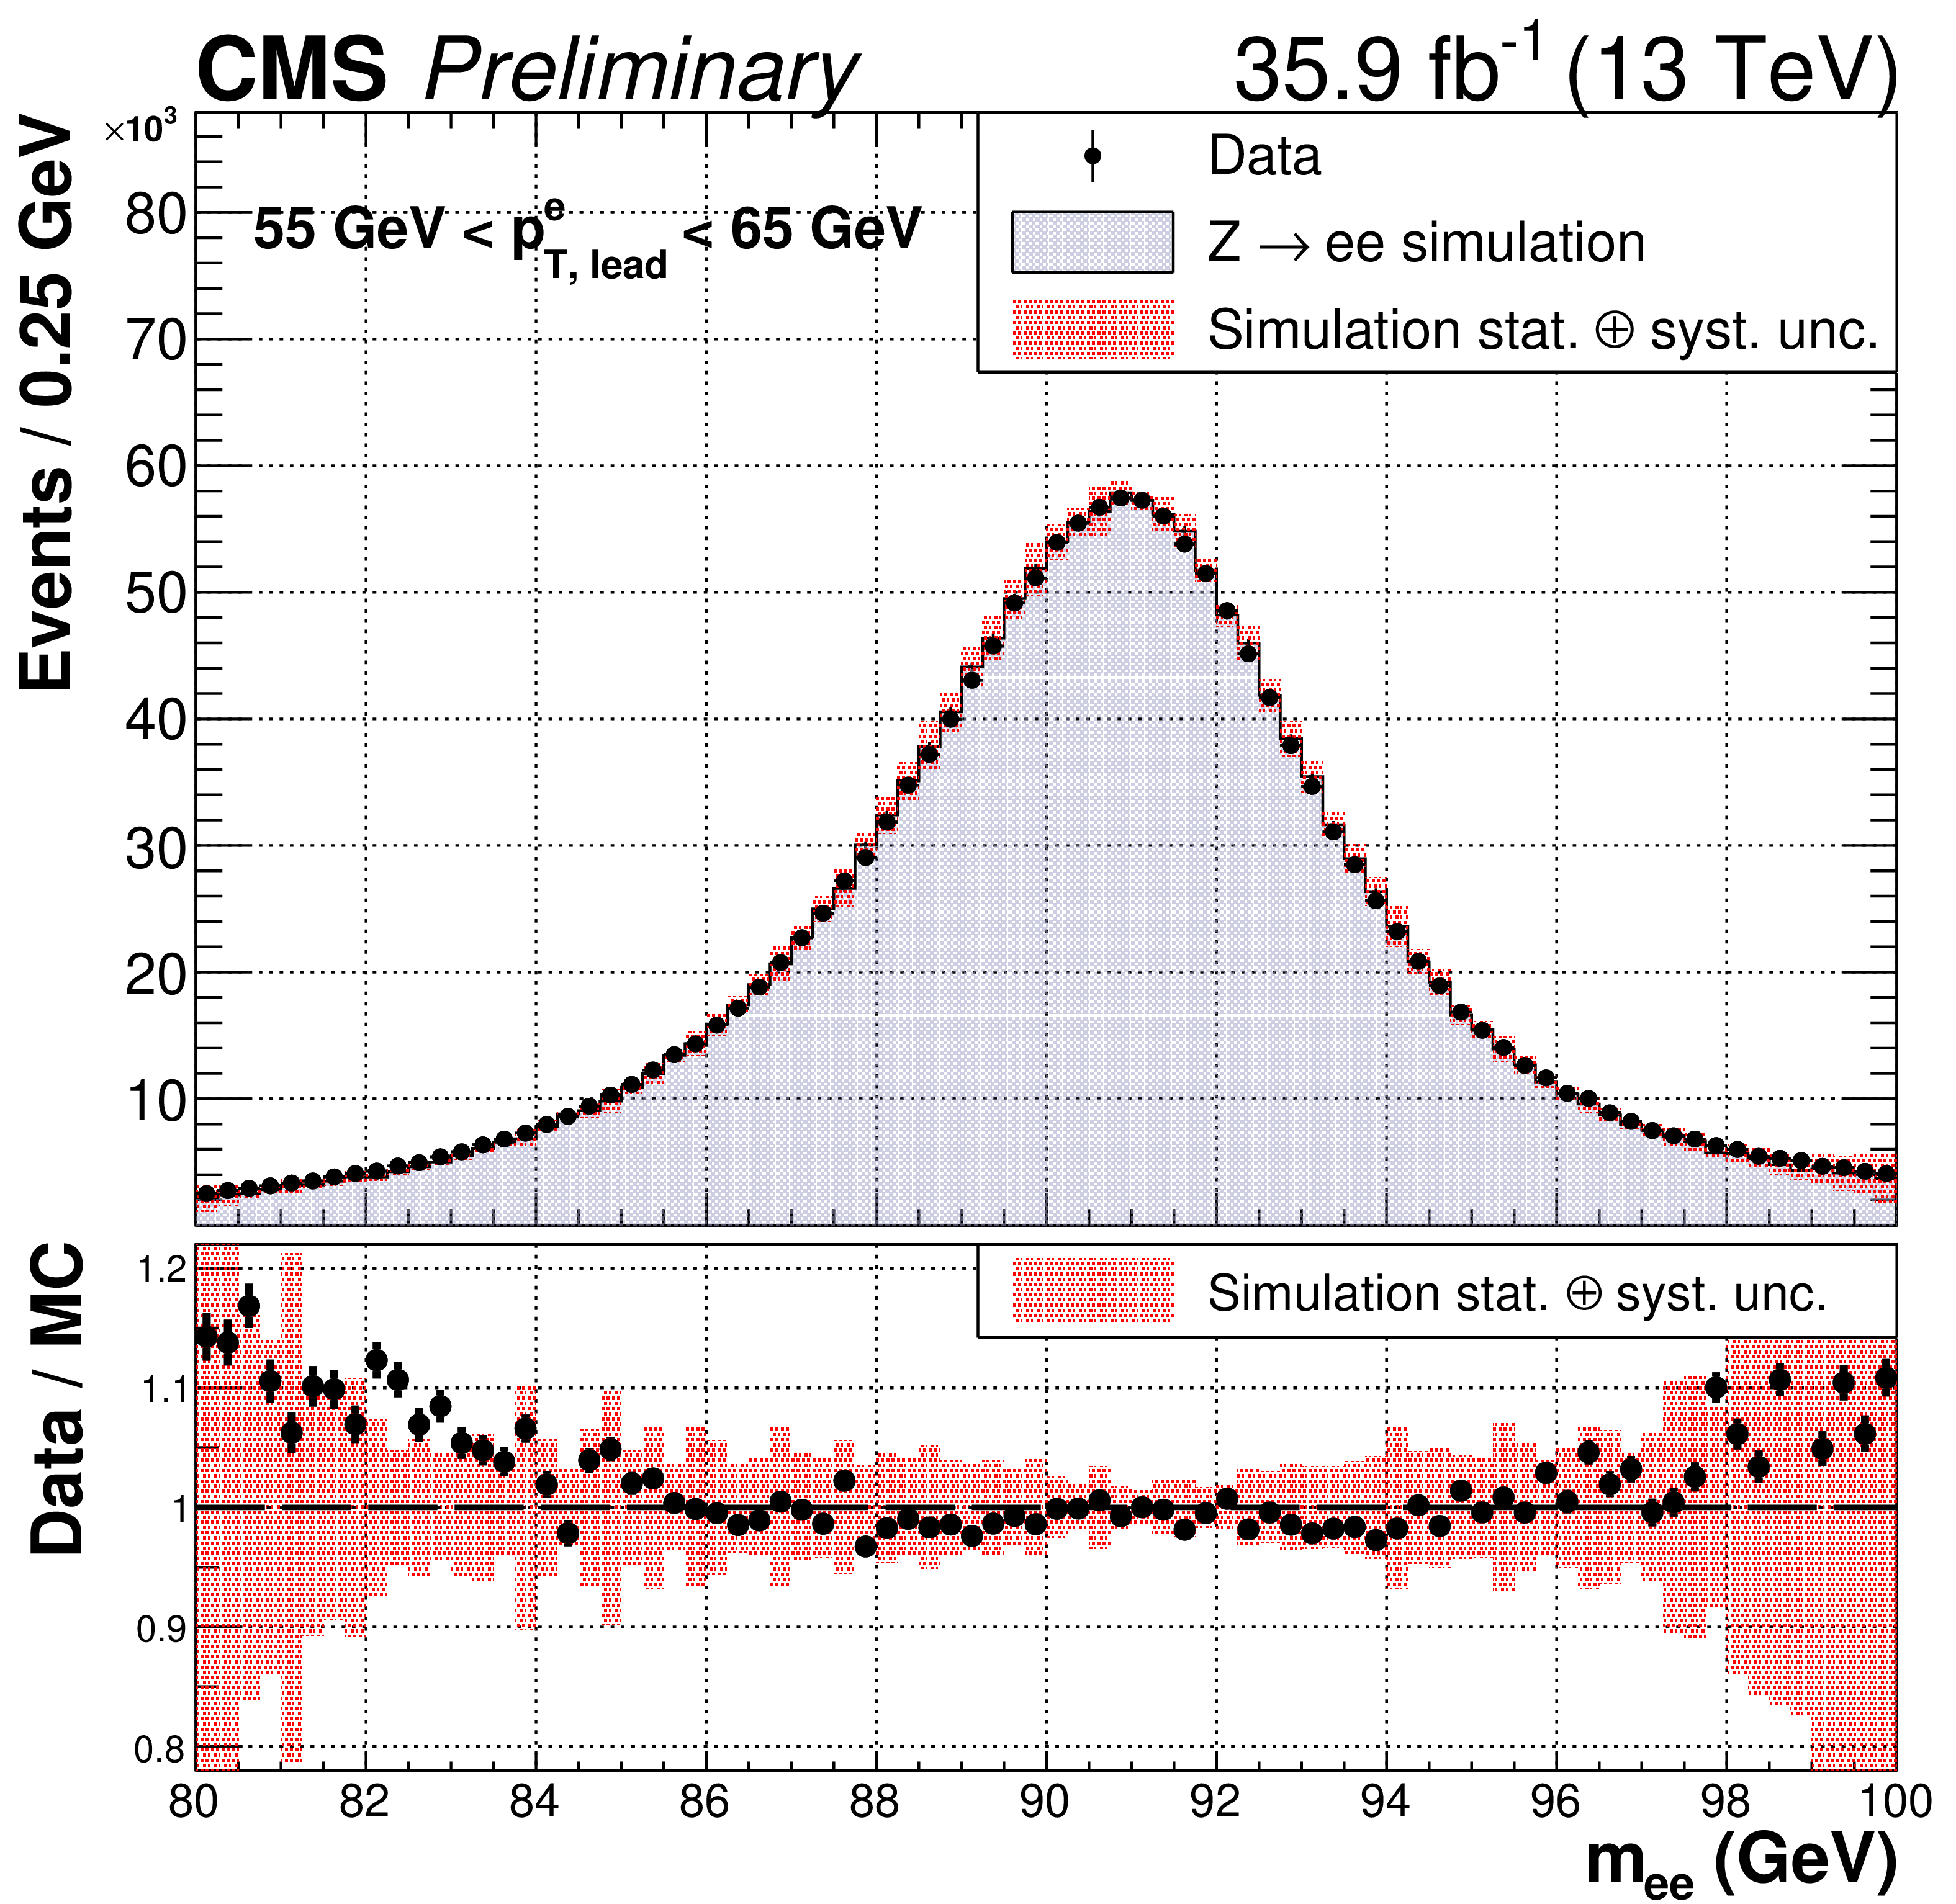
Figure 2-b:
Comparison of the distributions of the invariant mass of the dielectrons in data and simulation in ${\mathrm{Z} \rightarrow \mathrm{e^{+}e^{-}}}$ events after application of energy corrections in the category for which the leading electron has a transverse momentum between 55 and 65 GeV, without a requirement on the second electron. The systematic uncertainty in the error band includes only the uncertainties on the derived energy scale corrections. |
png pdf |
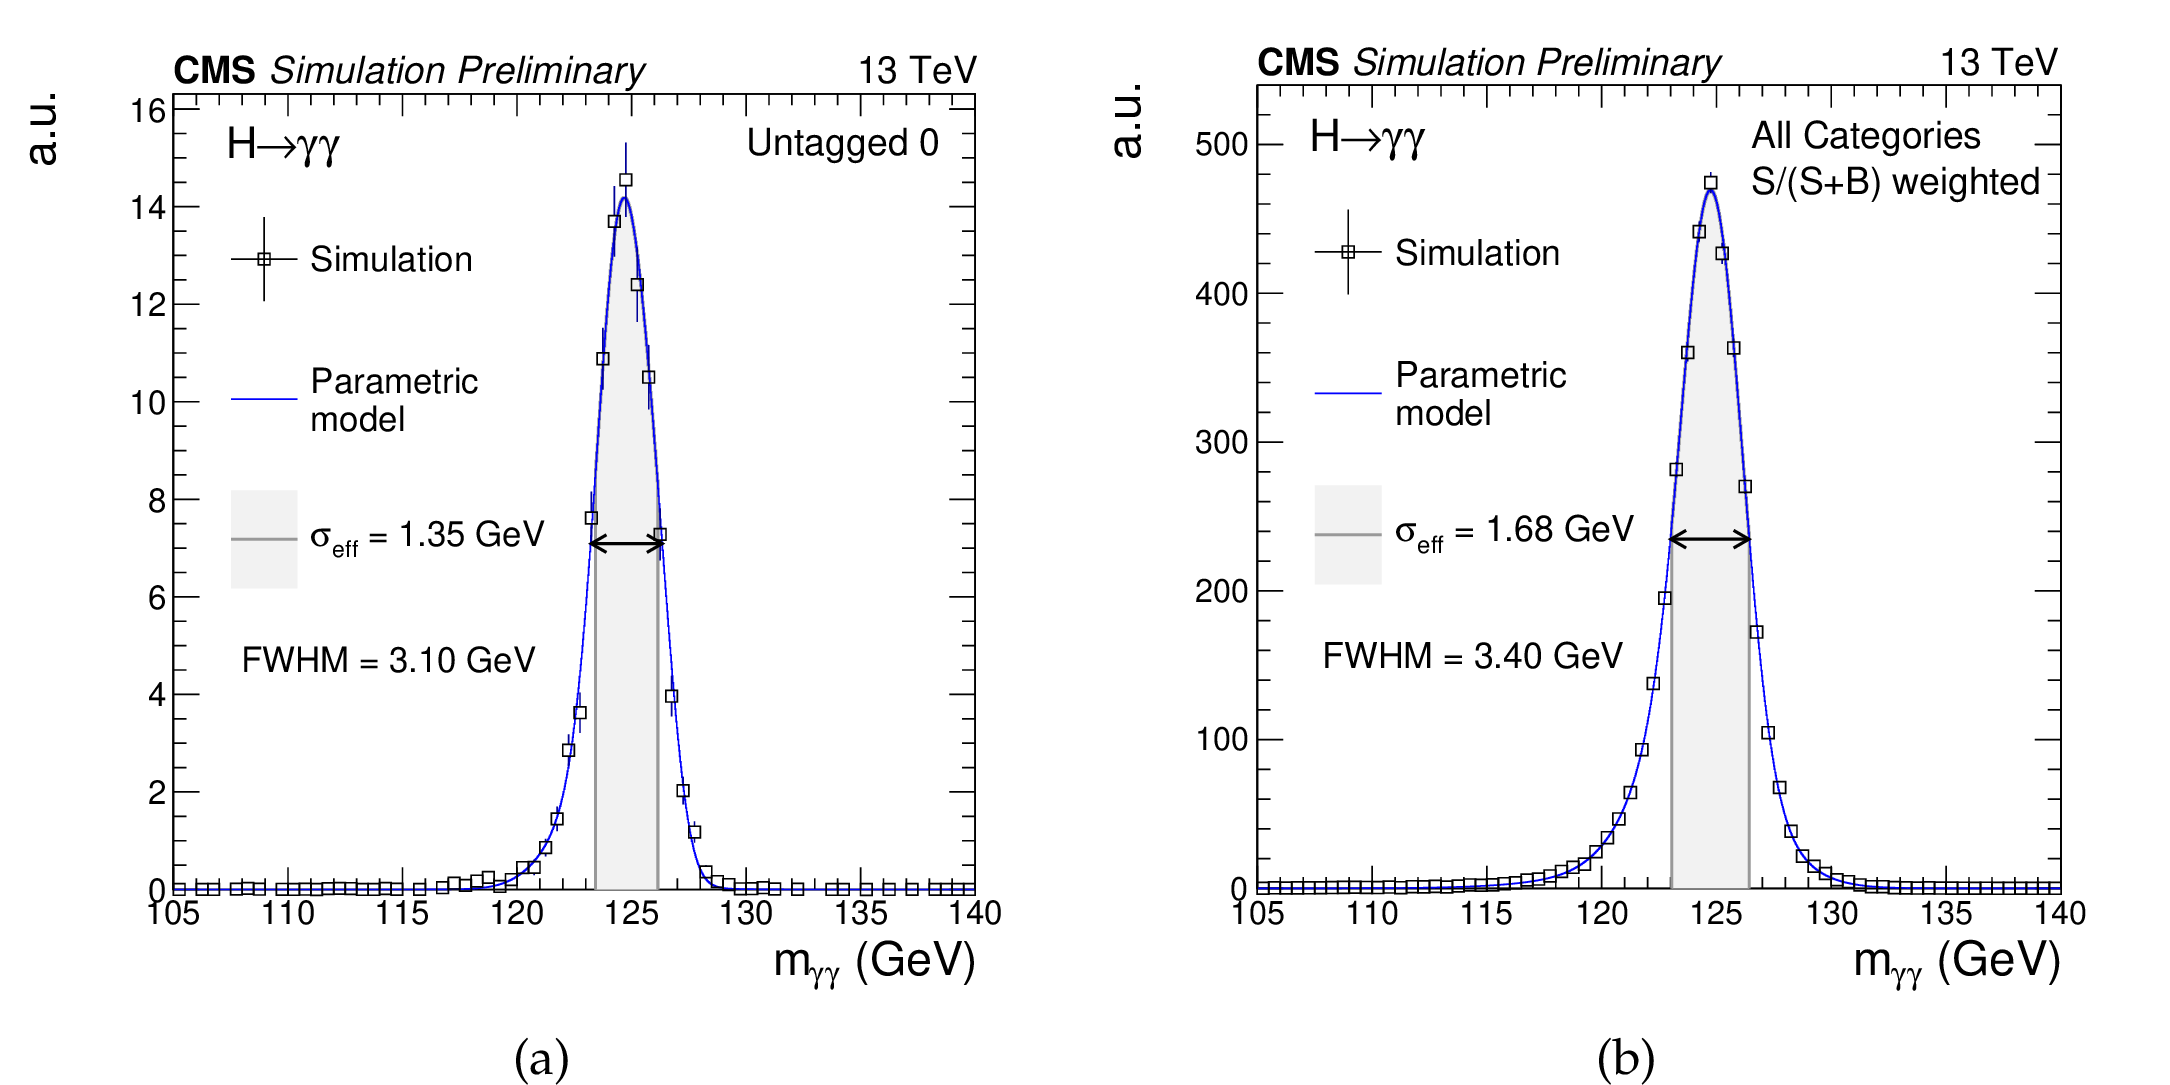
Figure 3:
The signal shape models for the highest resolution analysis category (left), and the sum of all categories combined together after scaling each of them by the corresponding S/(S+B) ratio (right) for a simulated ${\mathrm{H} \rightarrow \gamma \gamma}$ signal sample with ${m_\mathrm{H}} =$ 125 GeV. The open squares represent weighted simulation events and the blue line the corresponding model. Also shown is the $\sigma _\text {eff}$ value (half the width of the narrowest interval containing 68.3% of the invariant mass distribution) and the full width at half of the maximum (FWHM). |
png pdf |
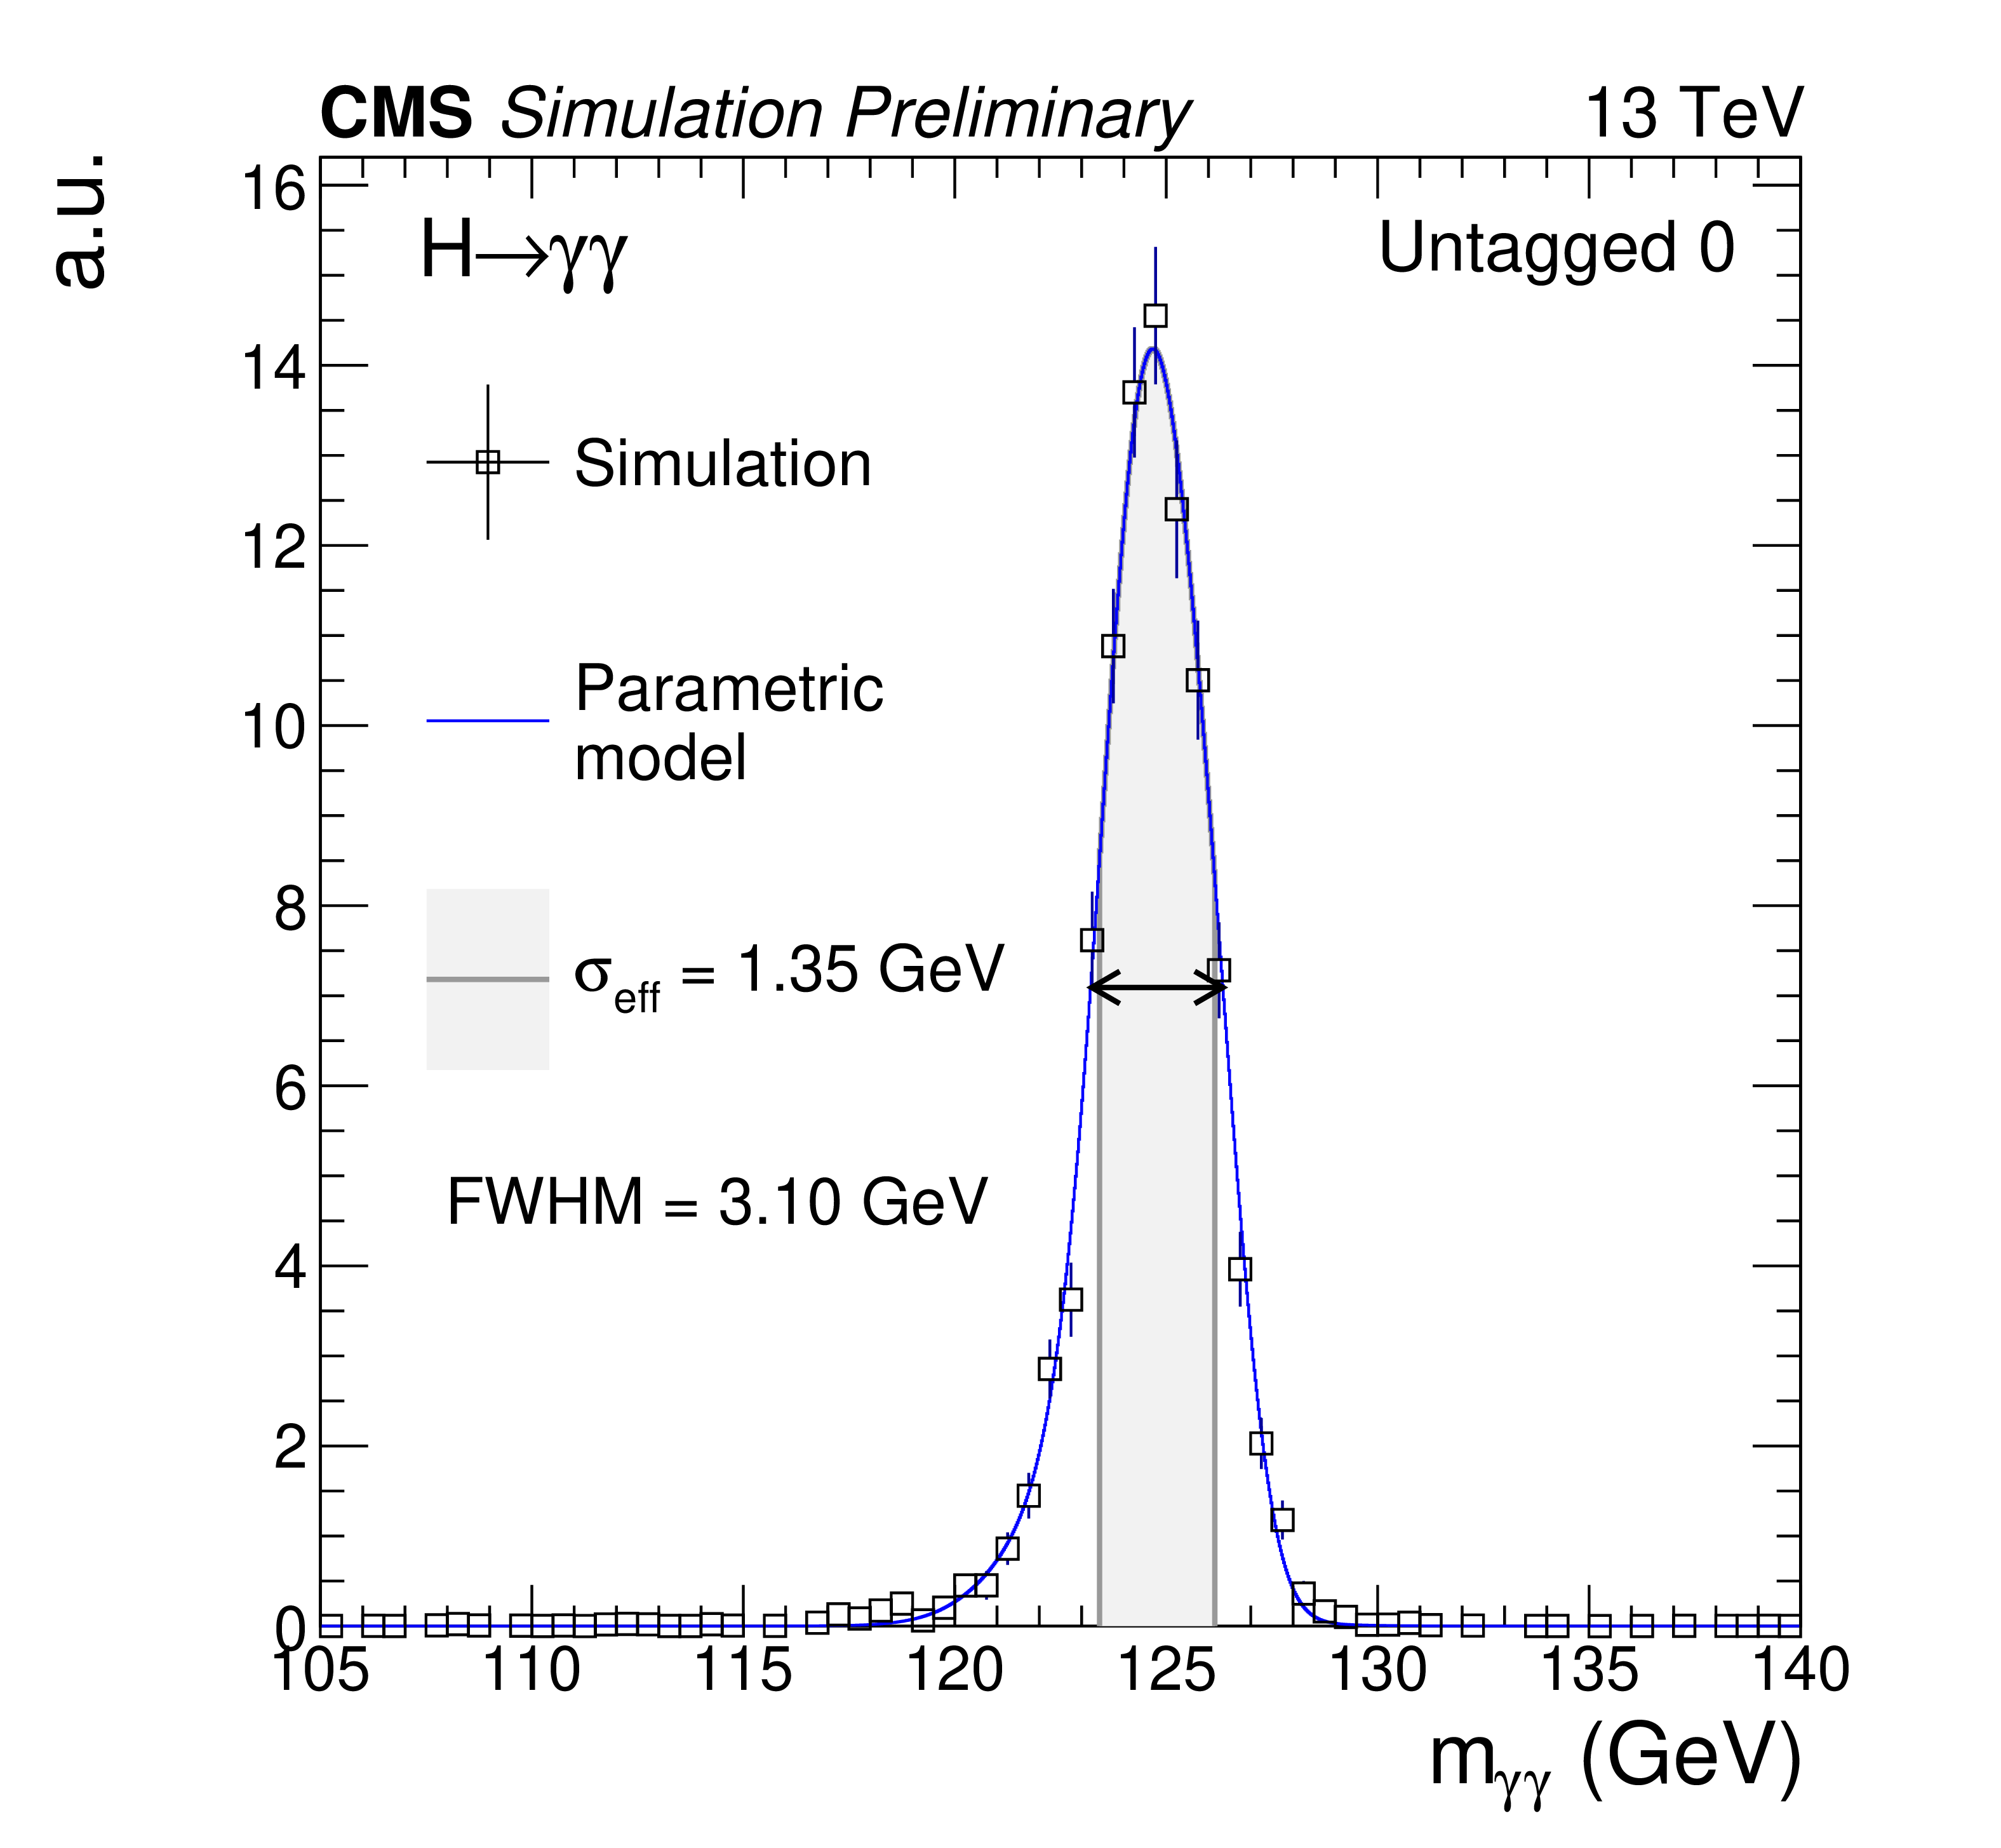
Figure 3-a:
The signal shape models for the highest resolution analysis category (left), and the sum of all categories combined together after scaling each of them by the corresponding S/(S+B) ratio (right) for a simulated ${\mathrm{H} \rightarrow \gamma \gamma}$ signal sample with ${m_\mathrm{H}} =$ 125 GeV. The open squares represent weighted simulation events and the blue line the corresponding model. Also shown is the $\sigma _\text {eff}$ value (half the width of the narrowest interval containing 68.3% of the invariant mass distribution) and the full width at half of the maximum (FWHM). |
png pdf |
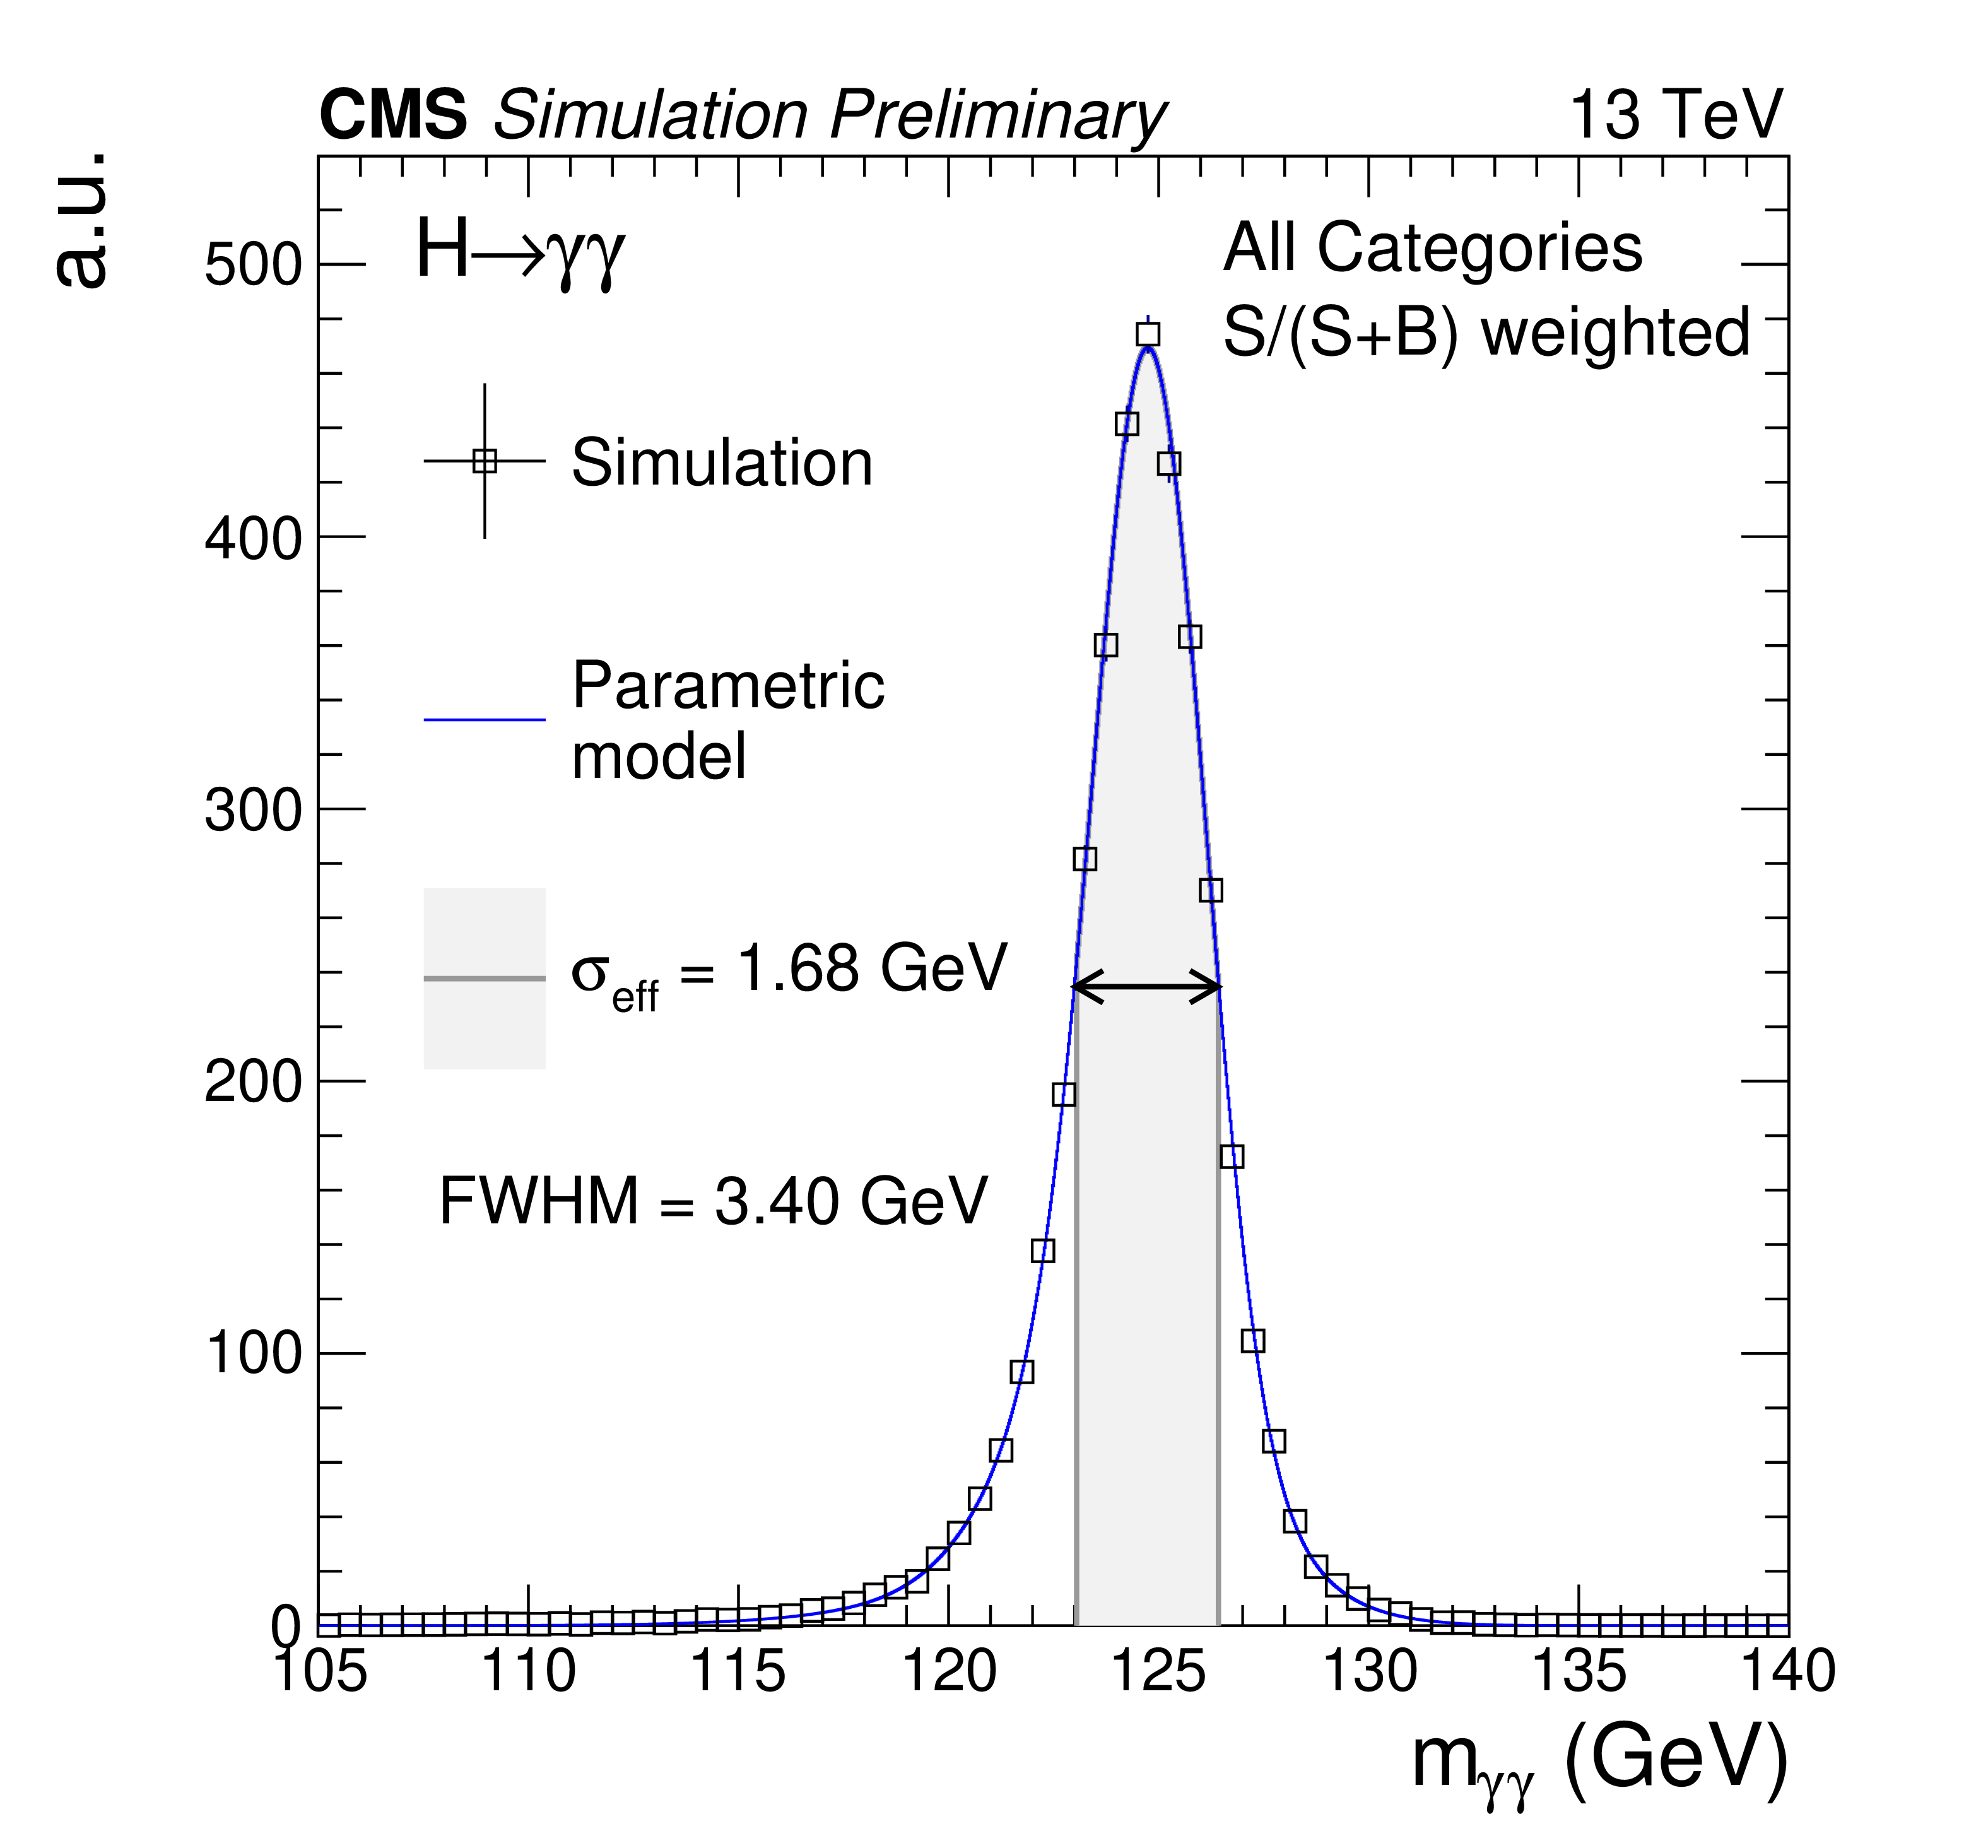
Figure 3-b:
The signal shape models for the highest resolution analysis category (left), and the sum of all categories combined together after scaling each of them by the corresponding S/(S+B) ratio (right) for a simulated ${\mathrm{H} \rightarrow \gamma \gamma}$ signal sample with ${m_\mathrm{H}} =$ 125 GeV. The open squares represent weighted simulation events and the blue line the corresponding model. Also shown is the $\sigma _\text {eff}$ value (half the width of the narrowest interval containing 68.3% of the invariant mass distribution) and the full width at half of the maximum (FWHM). |
png pdf |
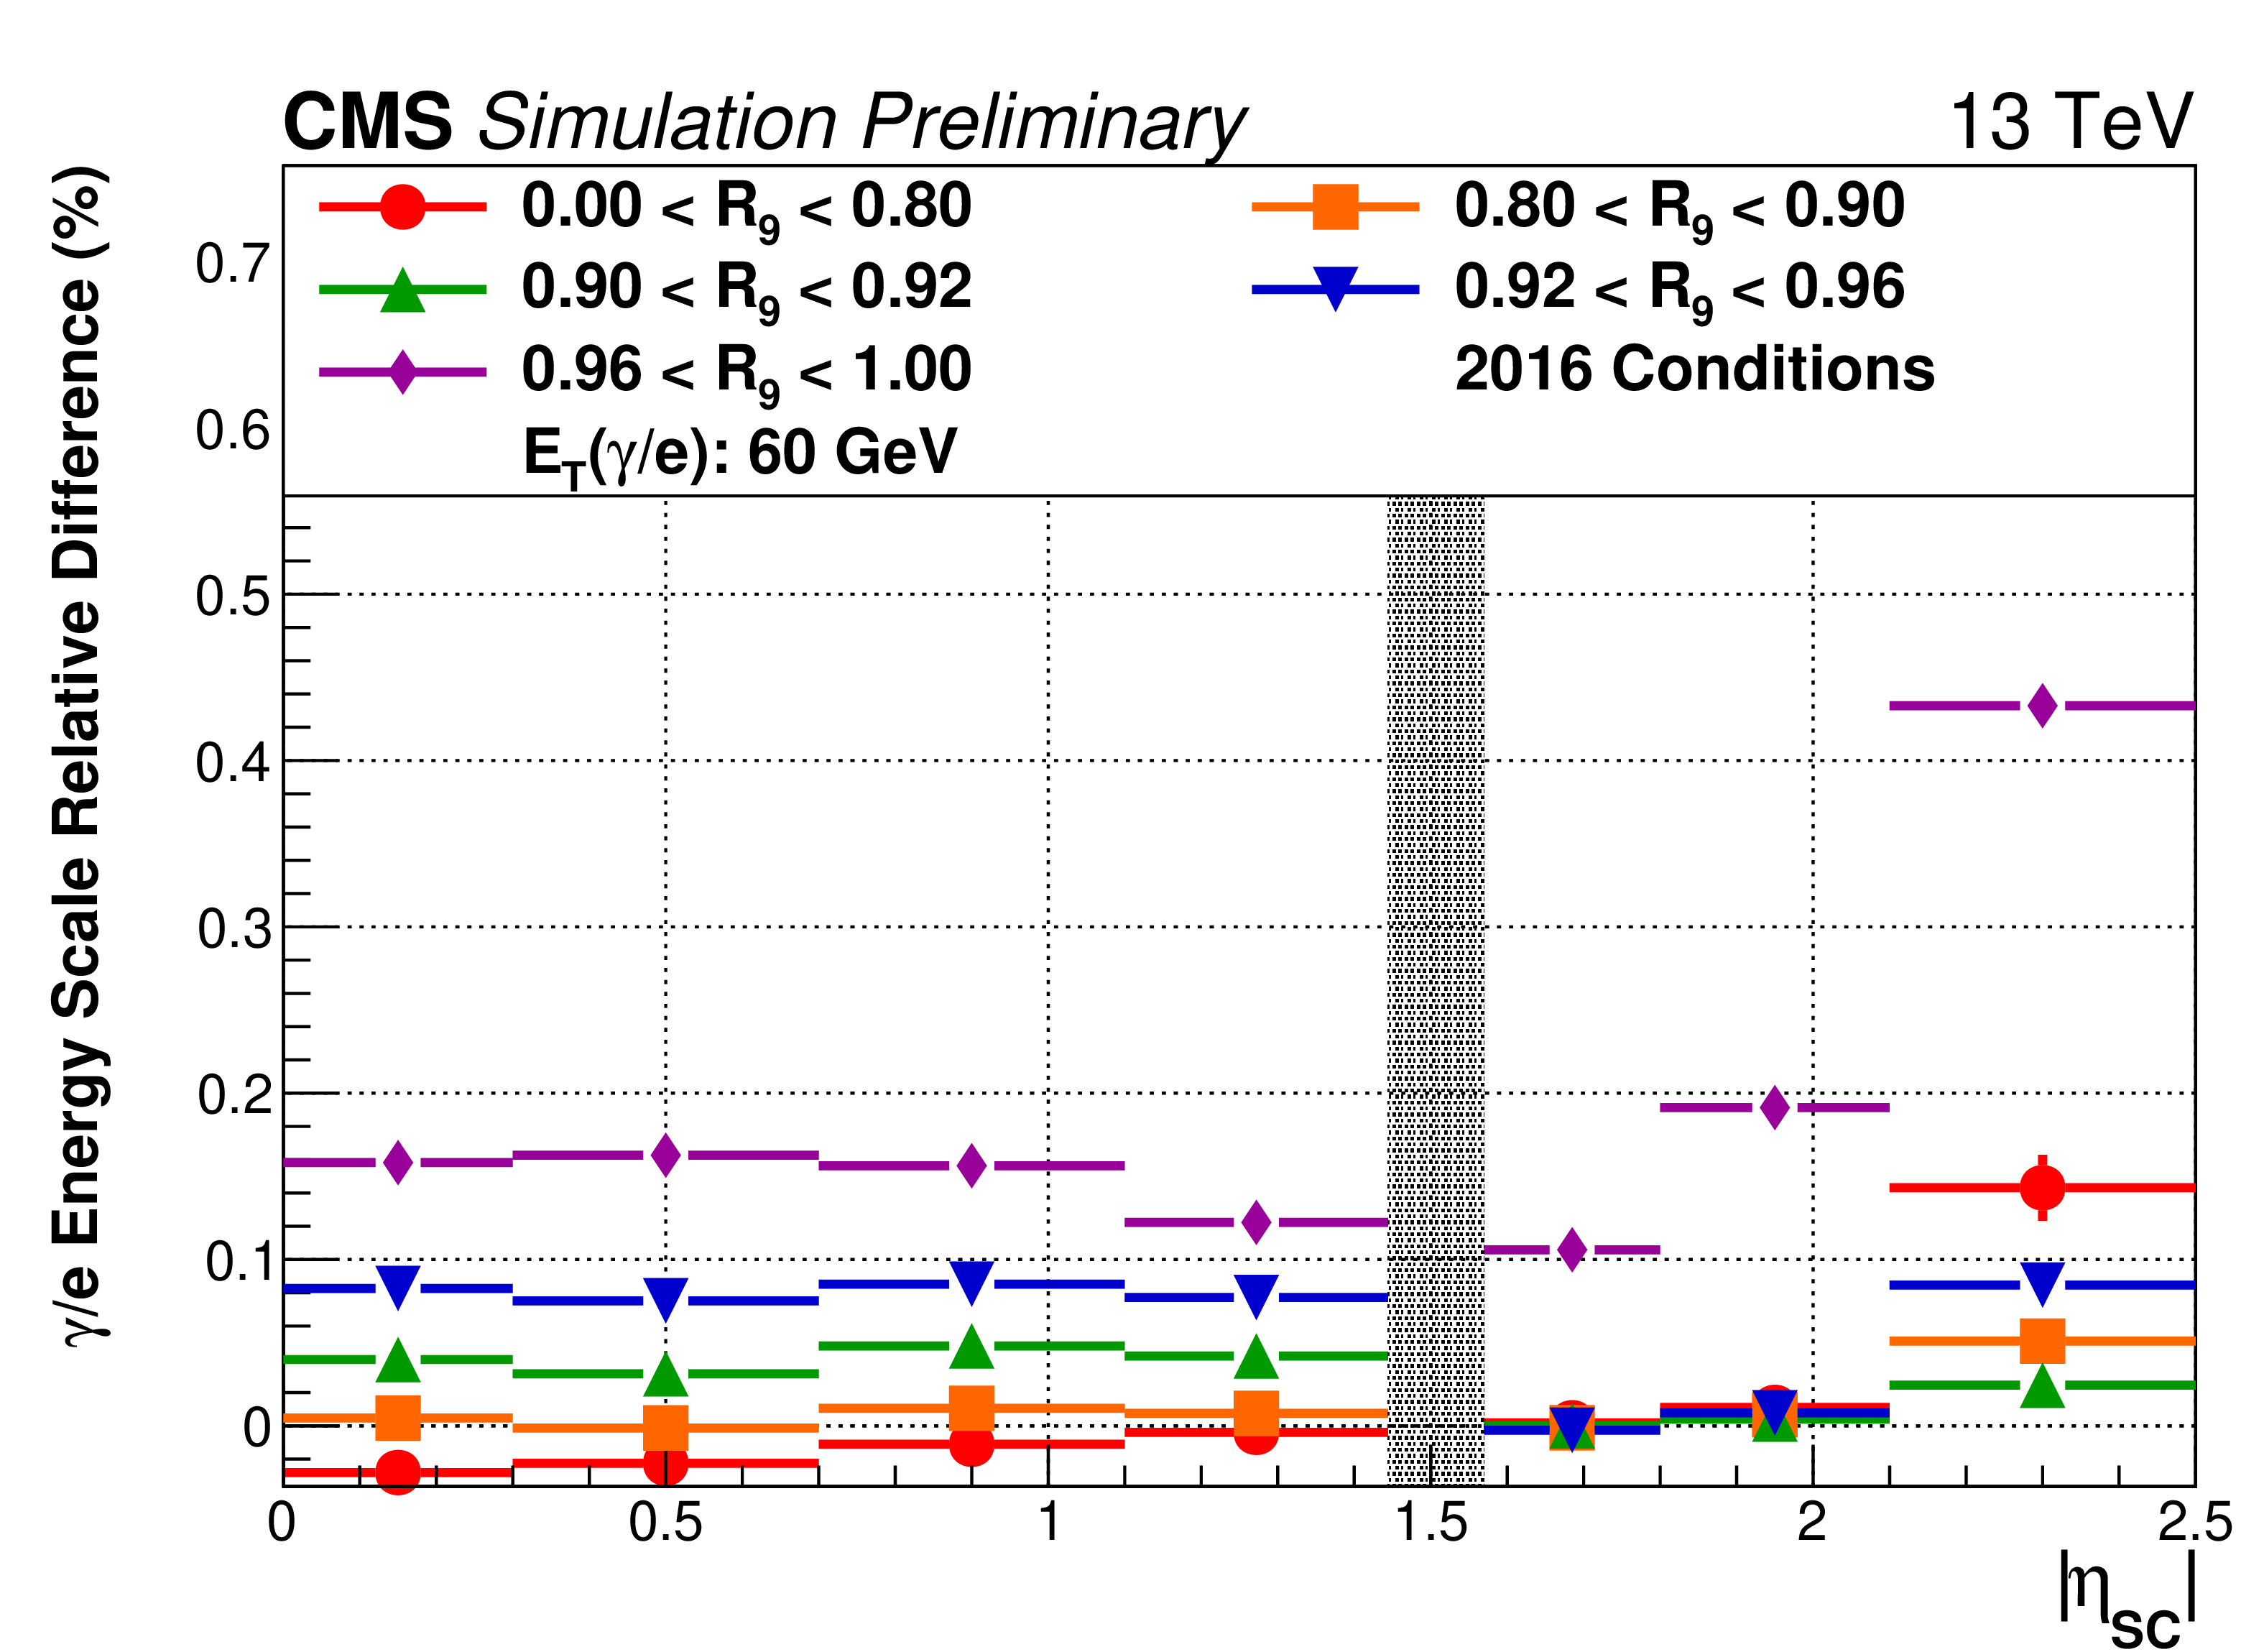
Figure 4:
The systematic uncertainty due to the difference between the electron and photon energy scale due to radiation damage induced non-uniformity of light collection in ECAL crystals in different supercluster $ {| \eta _{SC} |}$ and ${R_\mathrm {9}}$ categories. The method used to evaluate this is described in Section 8.2. |
png pdf |
Figure 5:
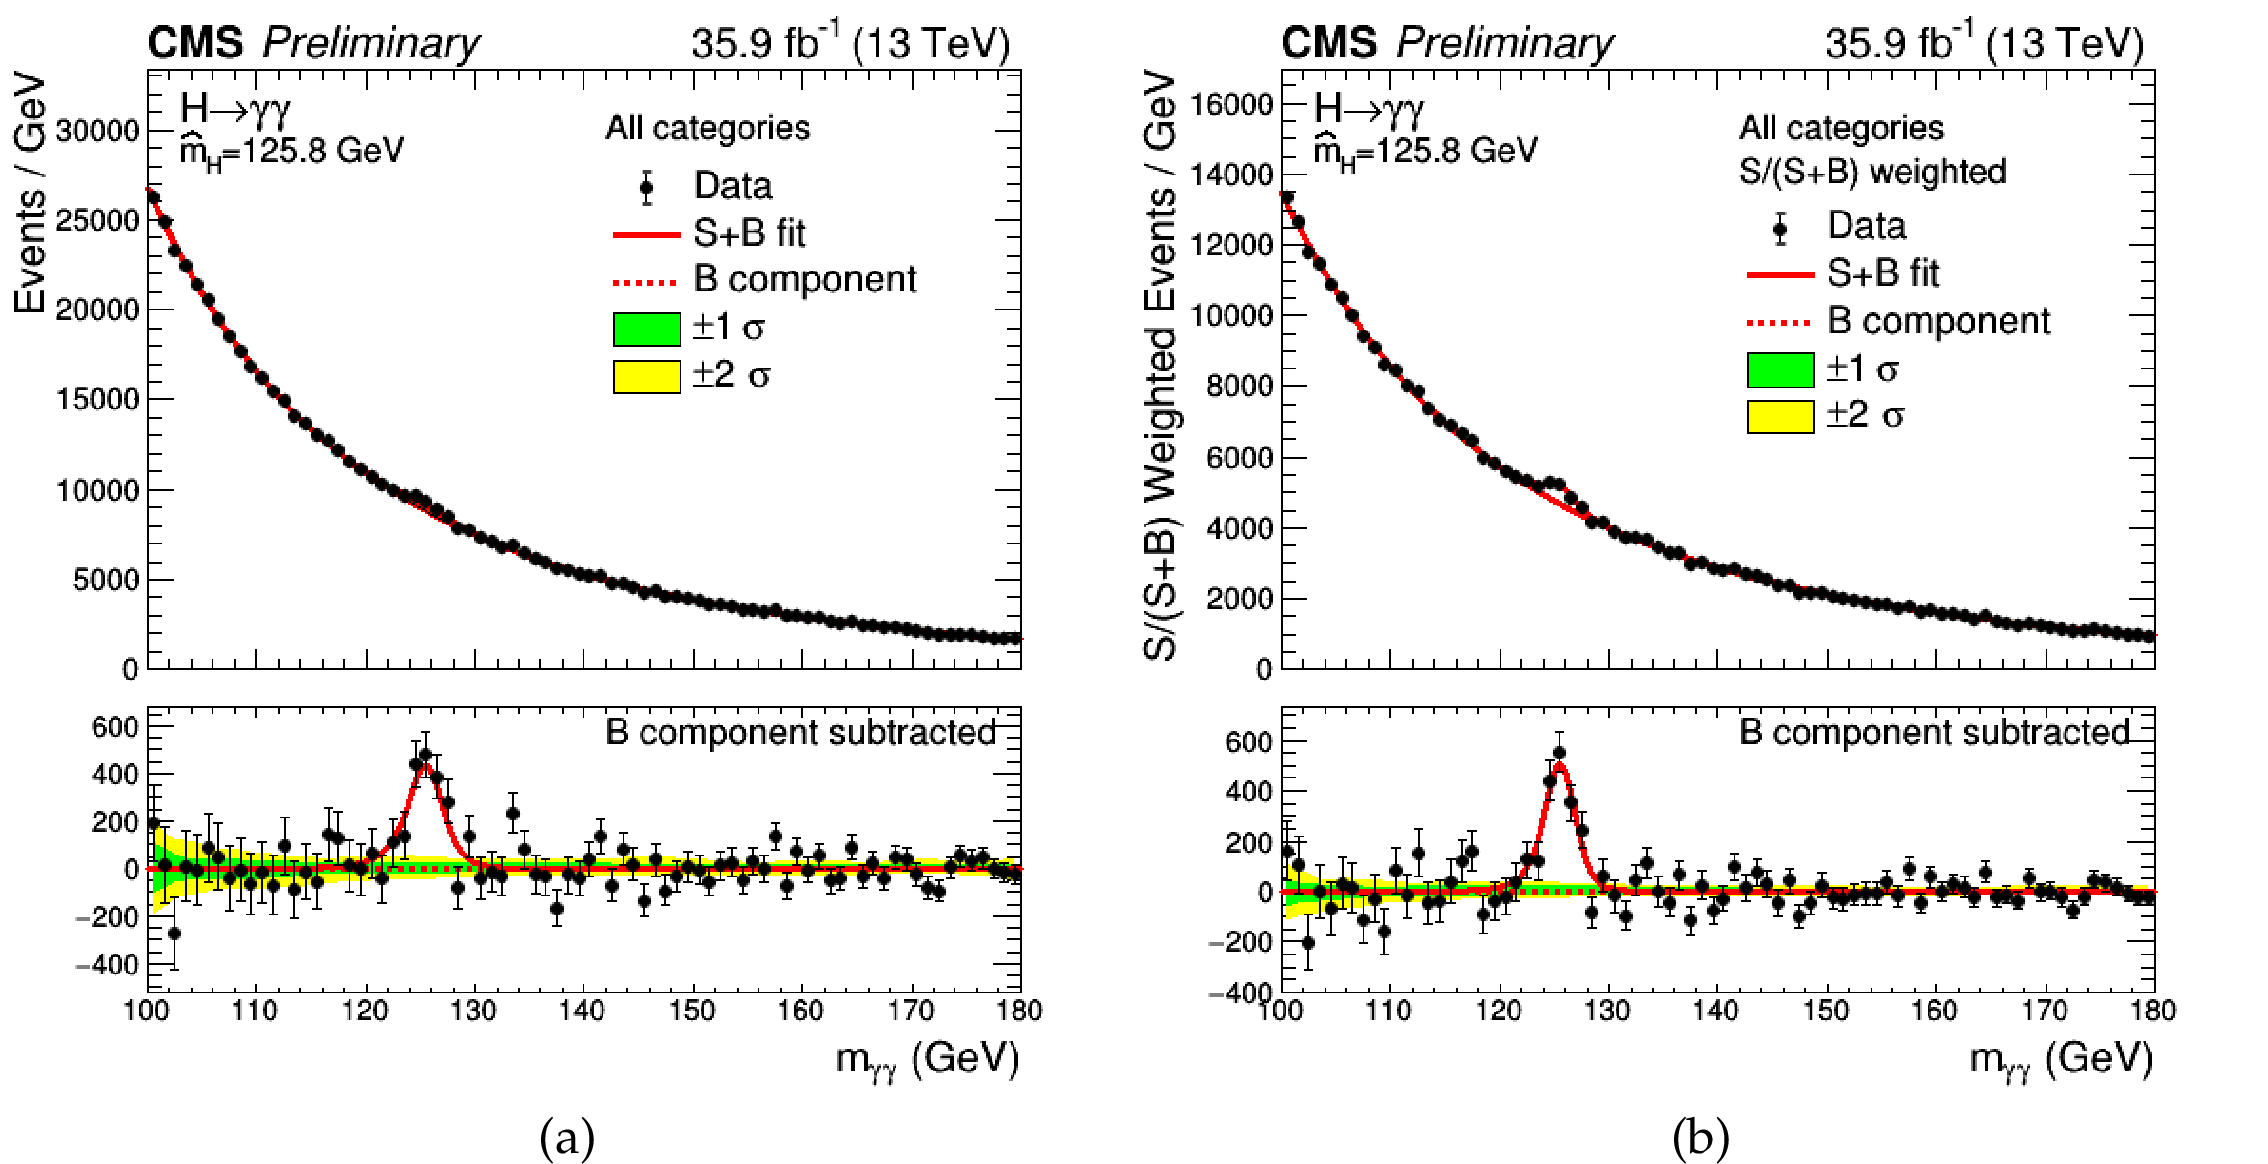
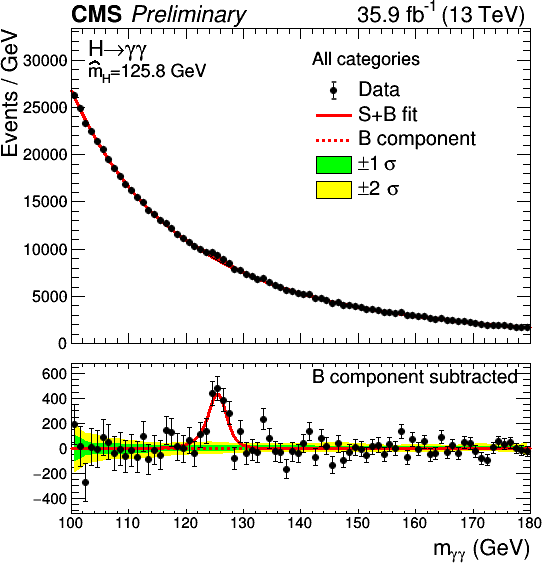
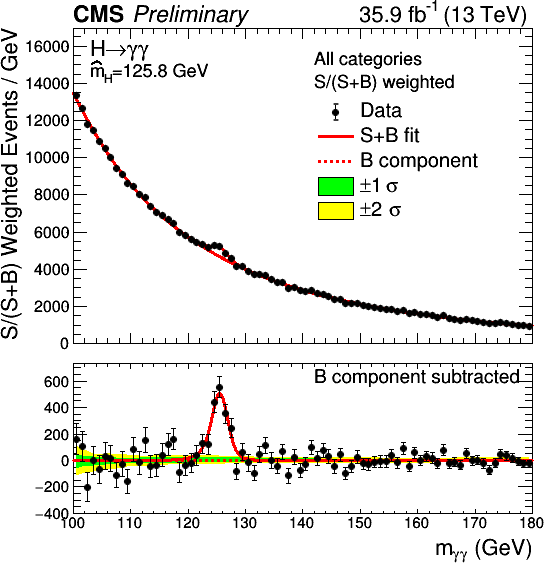
Data and signal-plus-background model fits for all categories summed (left) and where the categories are summed weighted by their sensitivity (right). The one (green) and two (yellow) standard deviation bands include the uncertainties in the background component of the fit. The lower panel in each plot shows the residuals after the background subtraction. |
png pdf |
Figure 5-a:
Data and signal-plus-background model fits for all categories summed. The one (green) and two (yellow) standard deviation bands include the uncertainties in the background component of the fit. The lower panel shows the residuals after the background subtraction. |
png pdf |
Figure 5-b:
Data and signal-plus-background model fits where the categories are summed weighted by their sensitivity. The one (green) and two (yellow) standard deviation bands include the uncertainties in the background component of the fit. The lower panel shows the residuals after the background subtraction. |
png pdf |
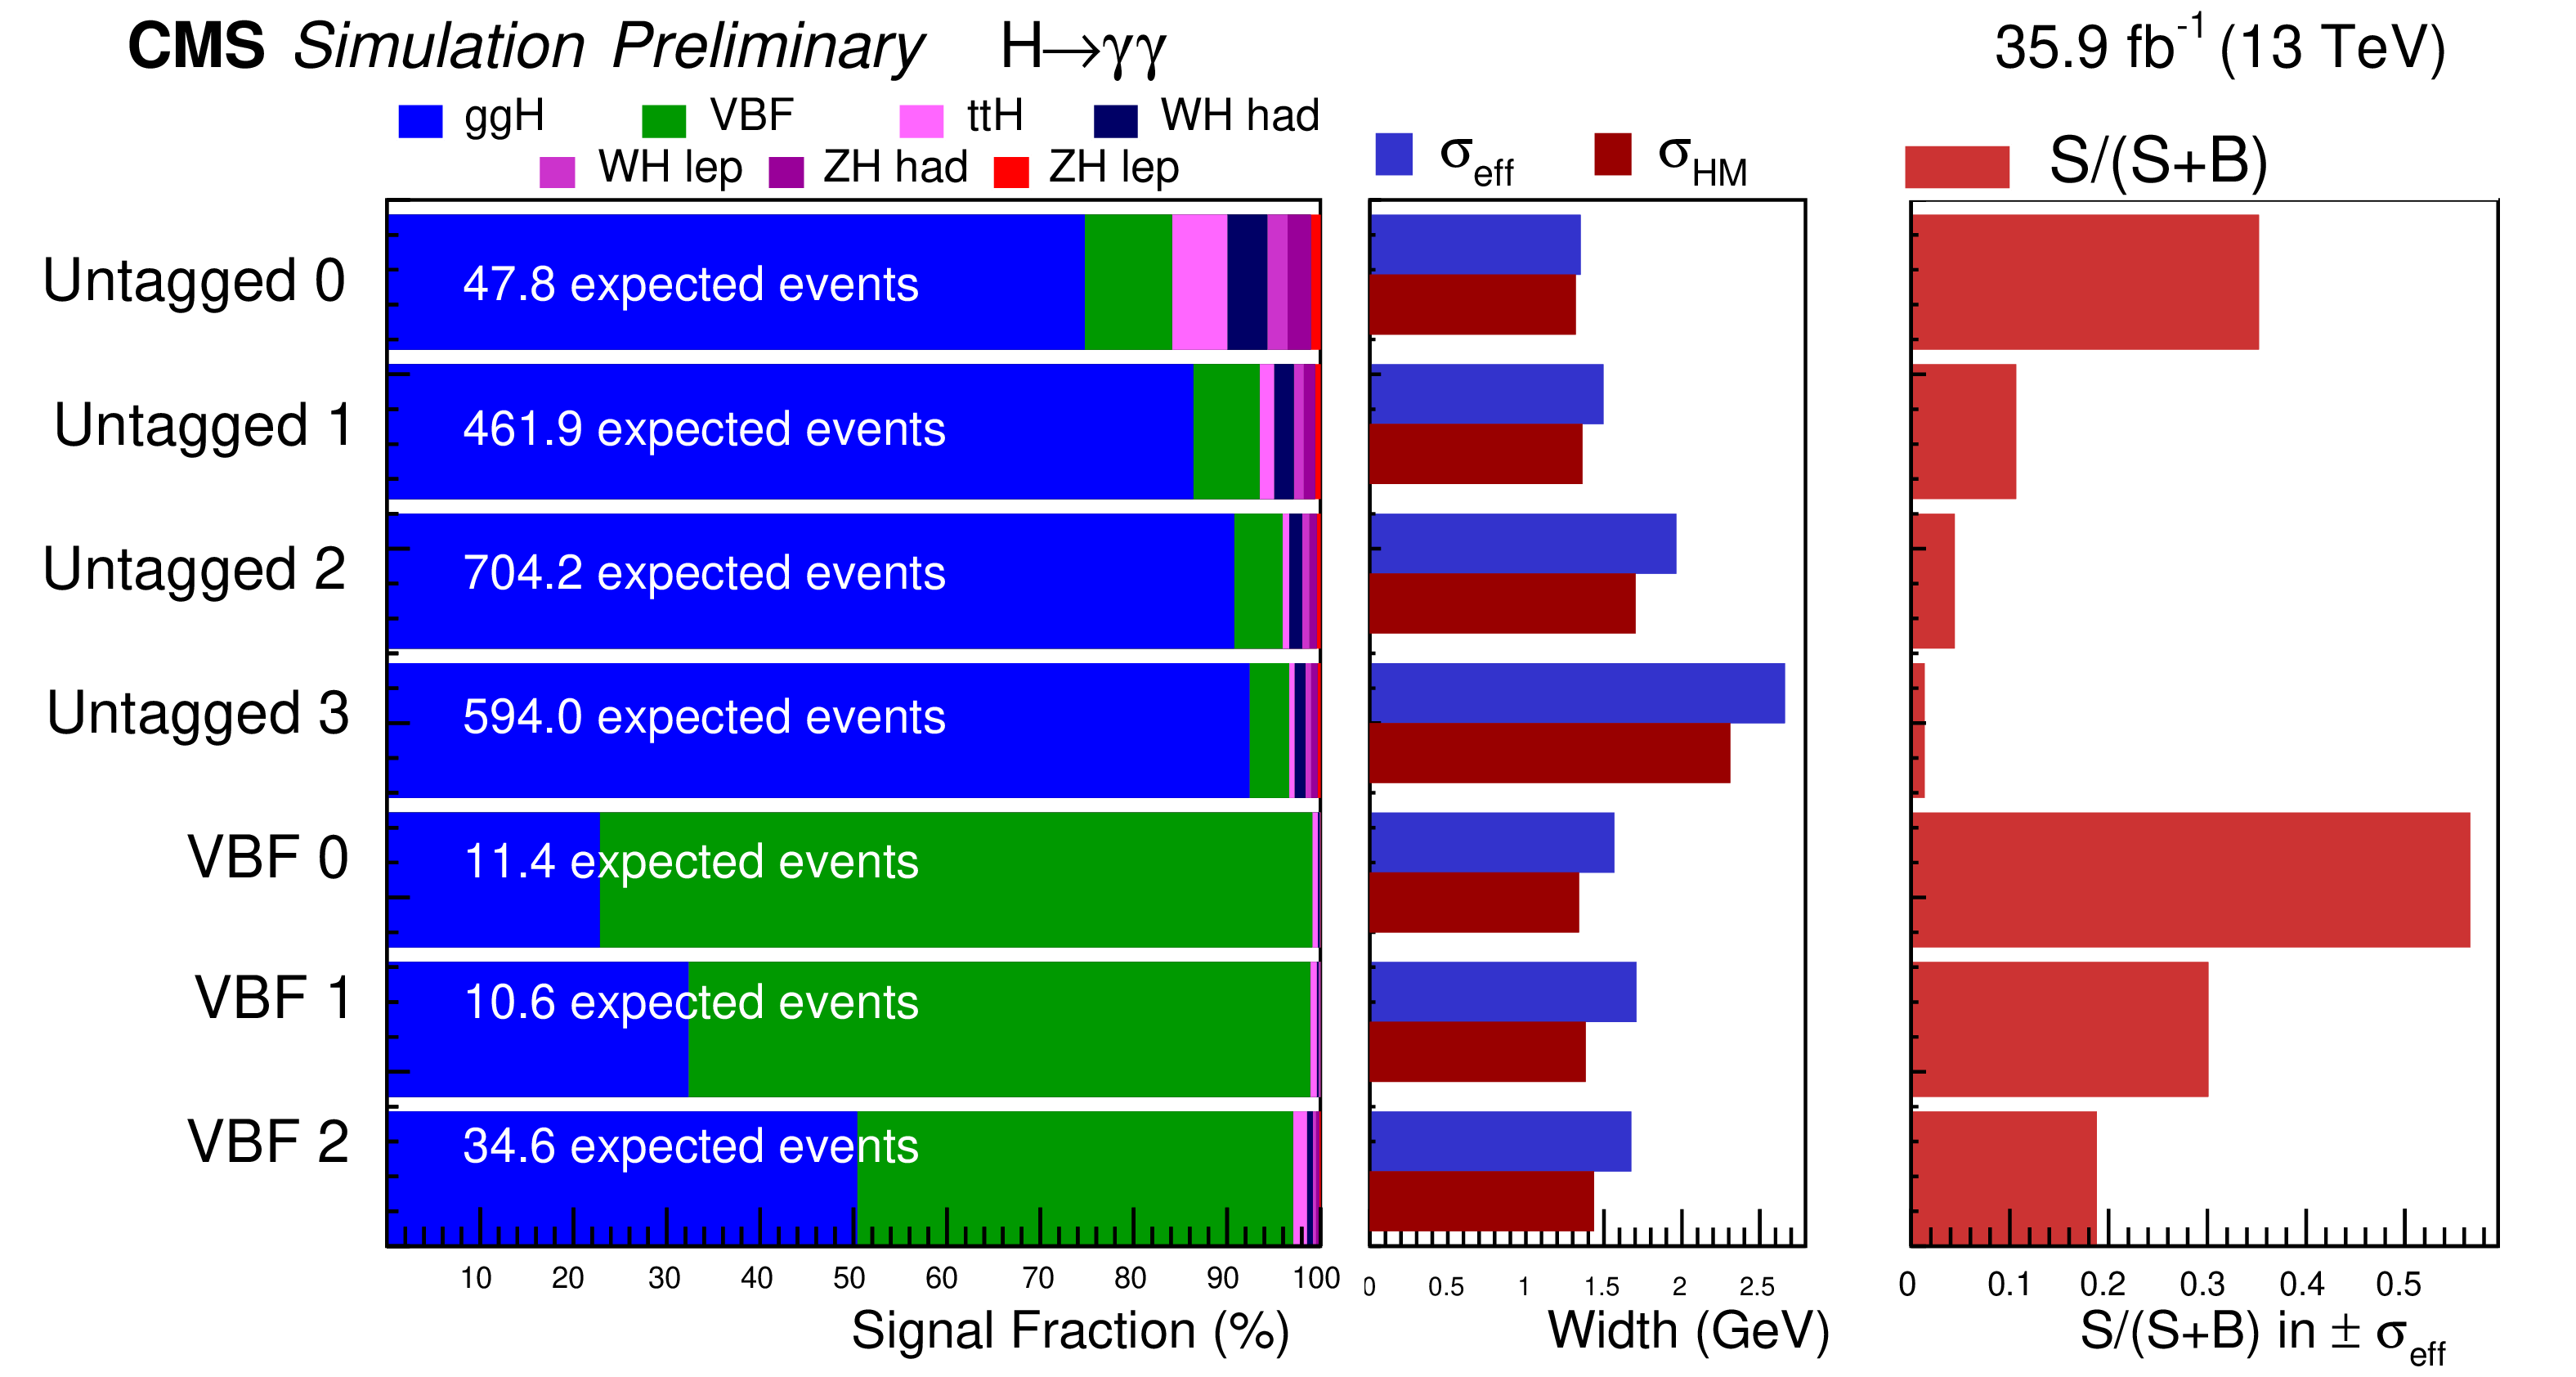
Figure 6:
The expected number of signal events per category and the percentage breakdown per production mode. The $\sigma _\text {eff}$ value (half the width of the narrowest interval containing 68.3% of the invariant mass distribution) is also shown as an estimate of the $m_{\gamma \gamma}$ resolution in that category and compared directly to the $\sigma _\text {HM}$. The ratio of the number of signal events (S) to the number of signal plus background events (S+B) is shown on the right hand side. |
png pdf |
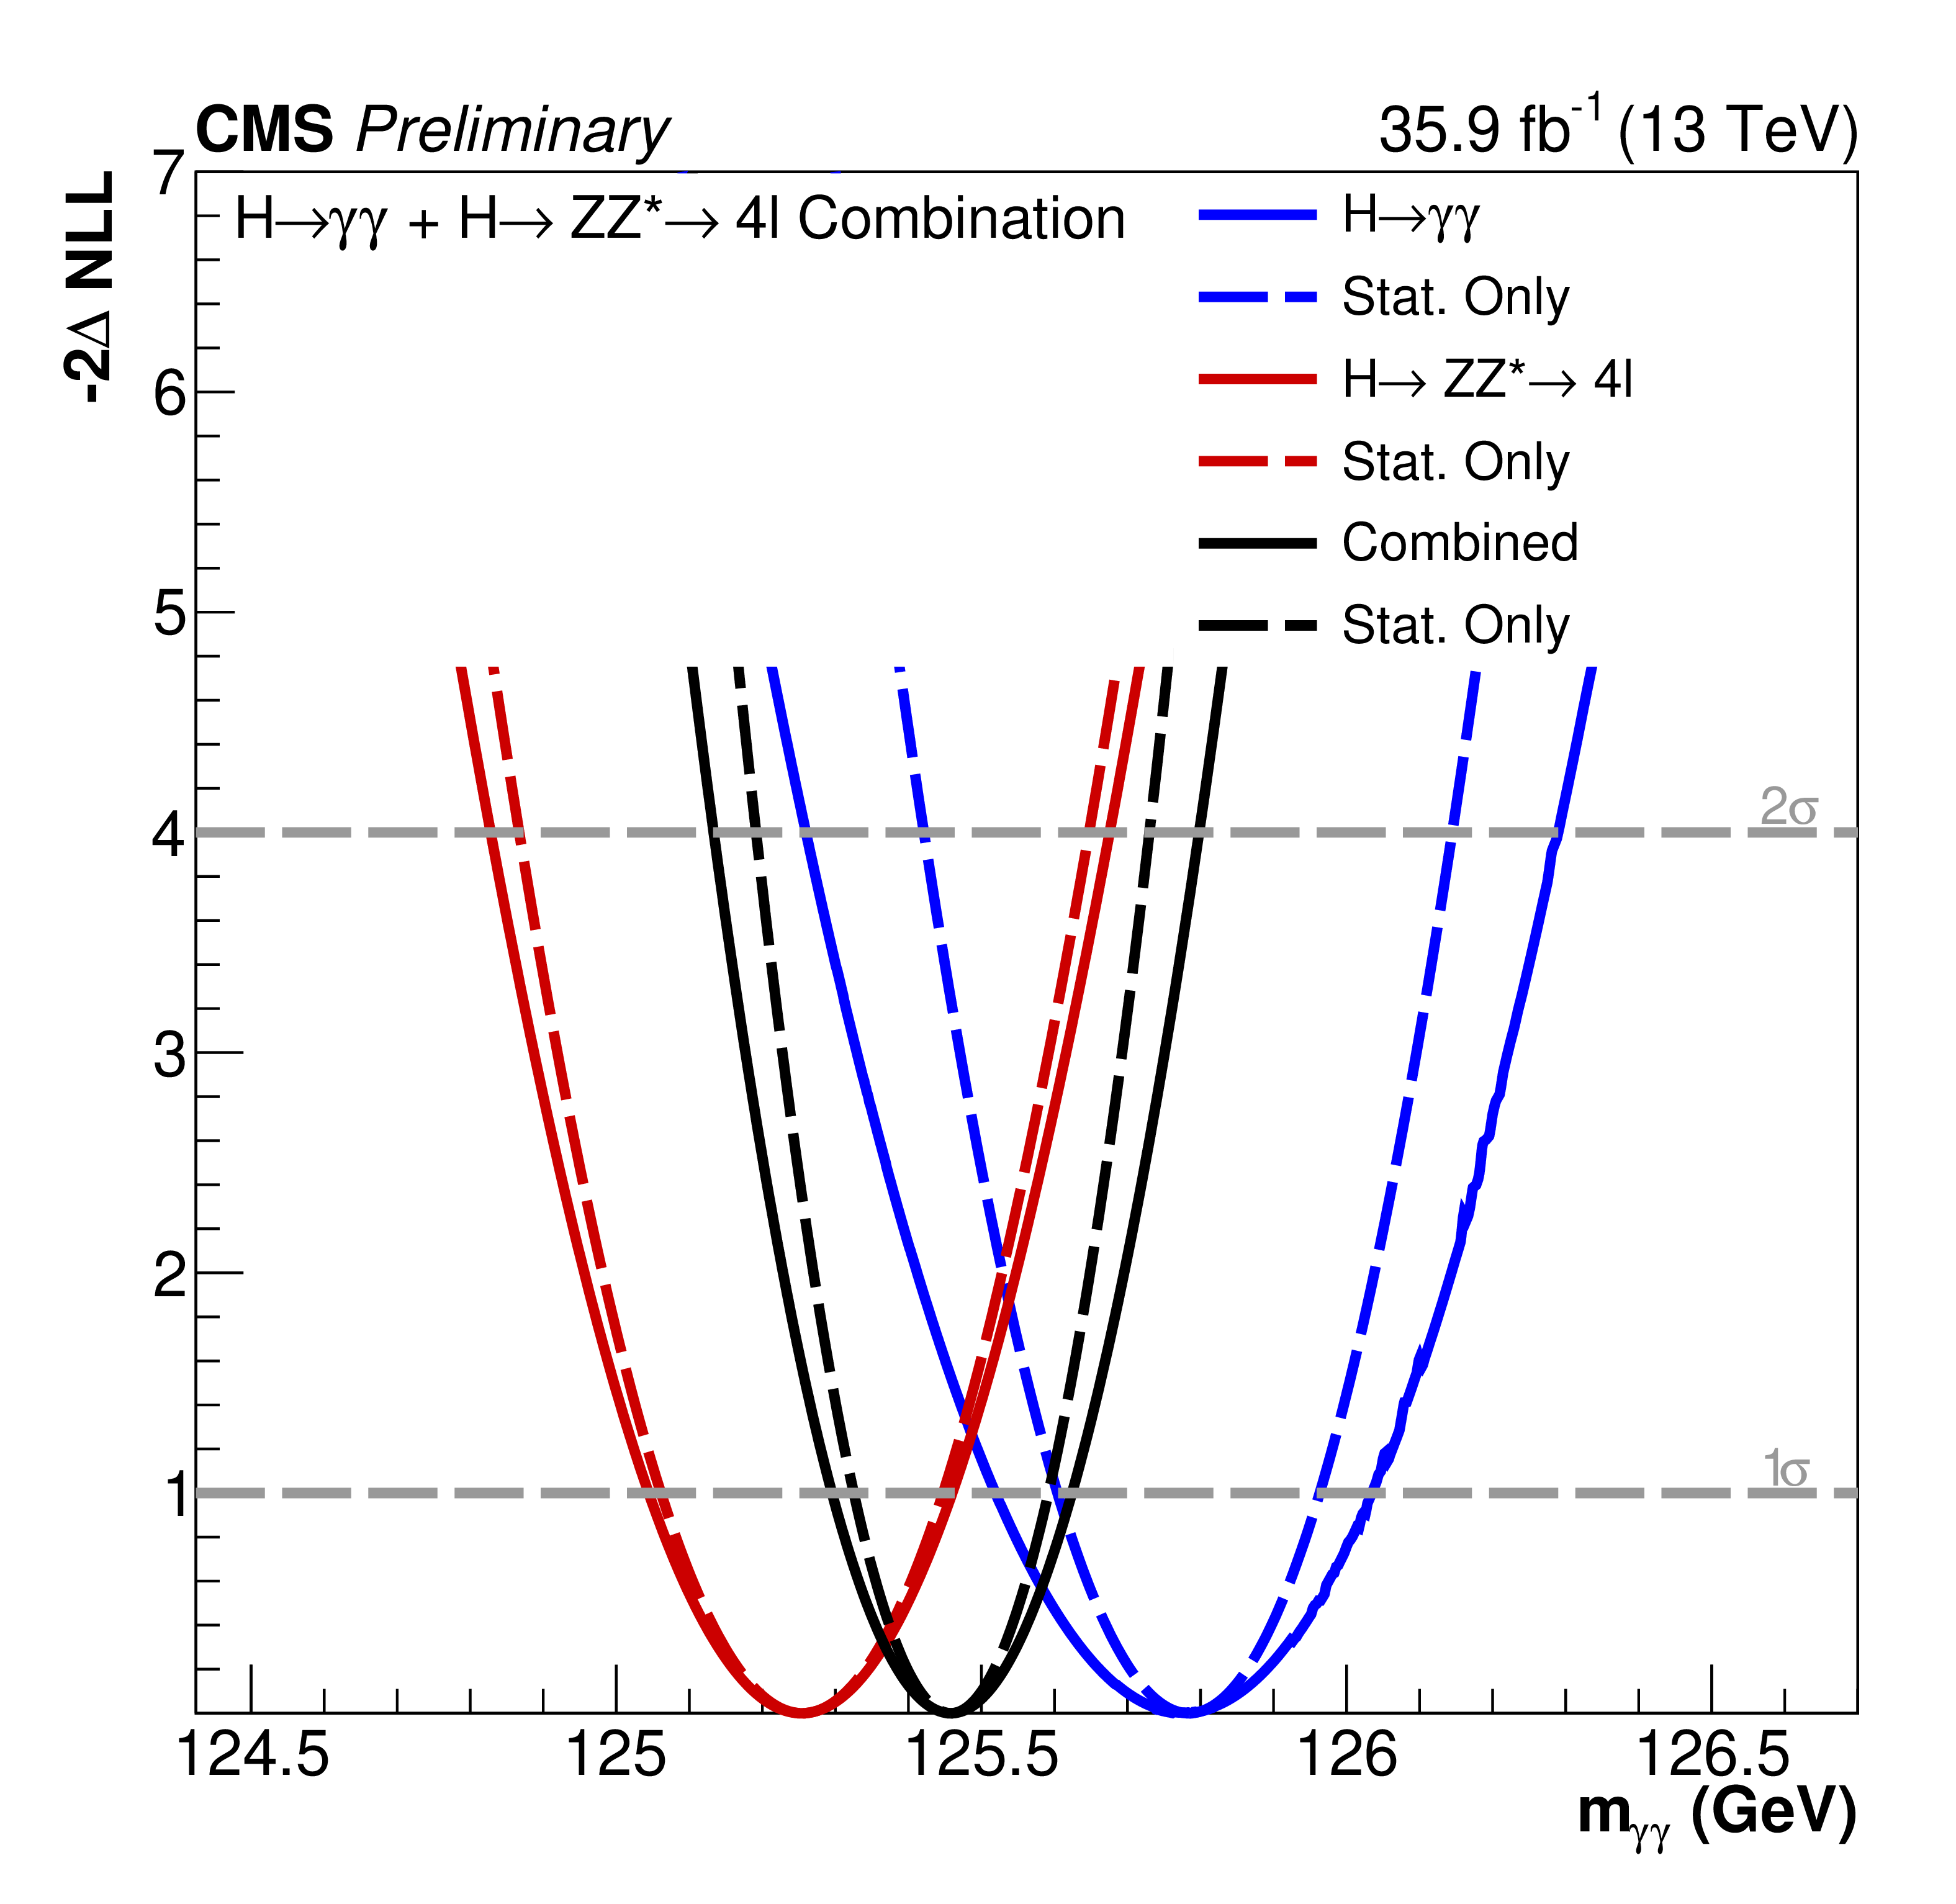
Figure 7:
The likelihood scan of the measured Higgs boson mass in the ${\mathrm{H} \rightarrow \gamma \gamma}$ and ${\mathrm{H} \rightarrow \mathrm{ZZ}^{*} \rightarrow 4\ell}$ decay channels individually and for the combination with the 2016 data set. The solid lines are for the full likelihood scan including all systematic uncertainties, while the dashed lines denote the same with the statistical uncertainty only. The additional 5% uncertainty due to treating the electron and photon energy scales as uncorrelated between the two decay channels for the combination is not included in the combined likelihood scan. |
png pdf |
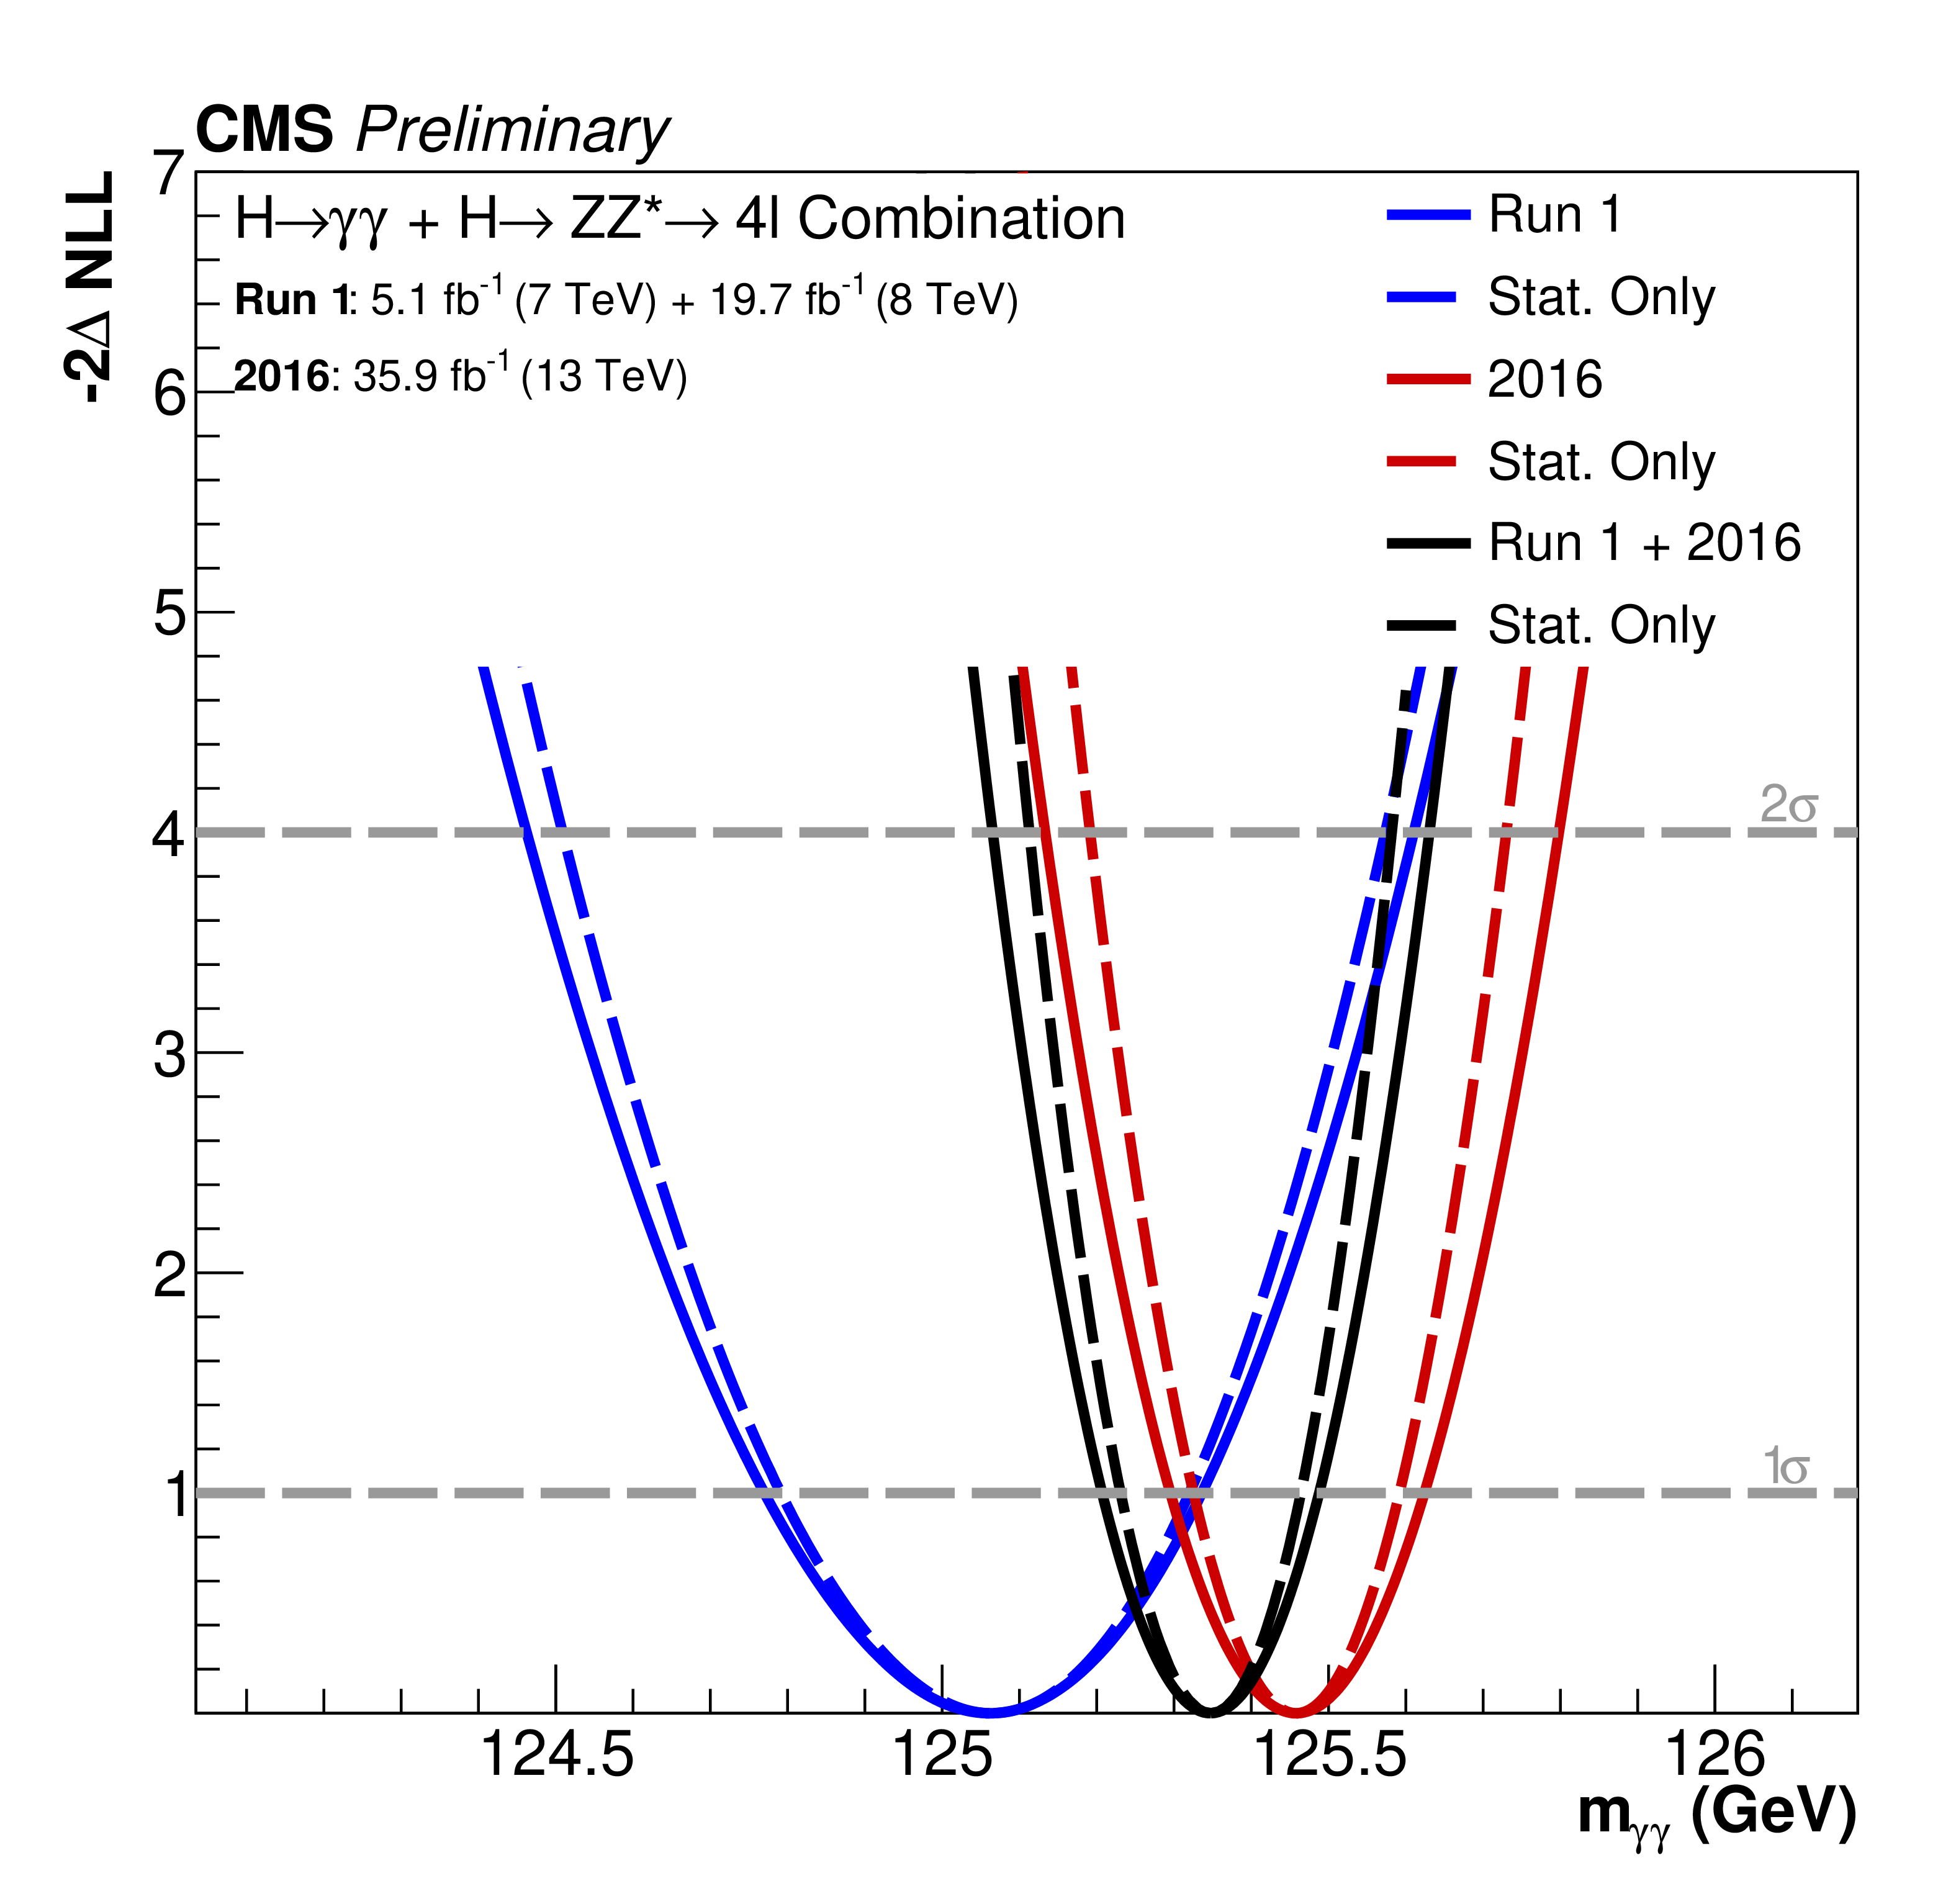
Figure 8:
The likelihood scan of the combined Higgs boson mass in the ${\mathrm{H} \rightarrow \gamma \gamma}$ and ${\mathrm{H} \rightarrow \mathrm{ZZ}^{*} \rightarrow 4\ell}$ decay channels with the Run 1 and 2016 data sets individually and the same combining the two data sets. The solid lines are for the full likelihood scan including all systematic uncertainties, while the dashed lines denote the same with the statistical uncertainty only. The additional 5% uncertainty due to treating the electron and photon energy scales as uncorrelated between the two decay channels for the combination with the 2016 data set and the Run 1 + 2016 data sets is not included in the corresponding combined likelihood scans. |
png pdf |
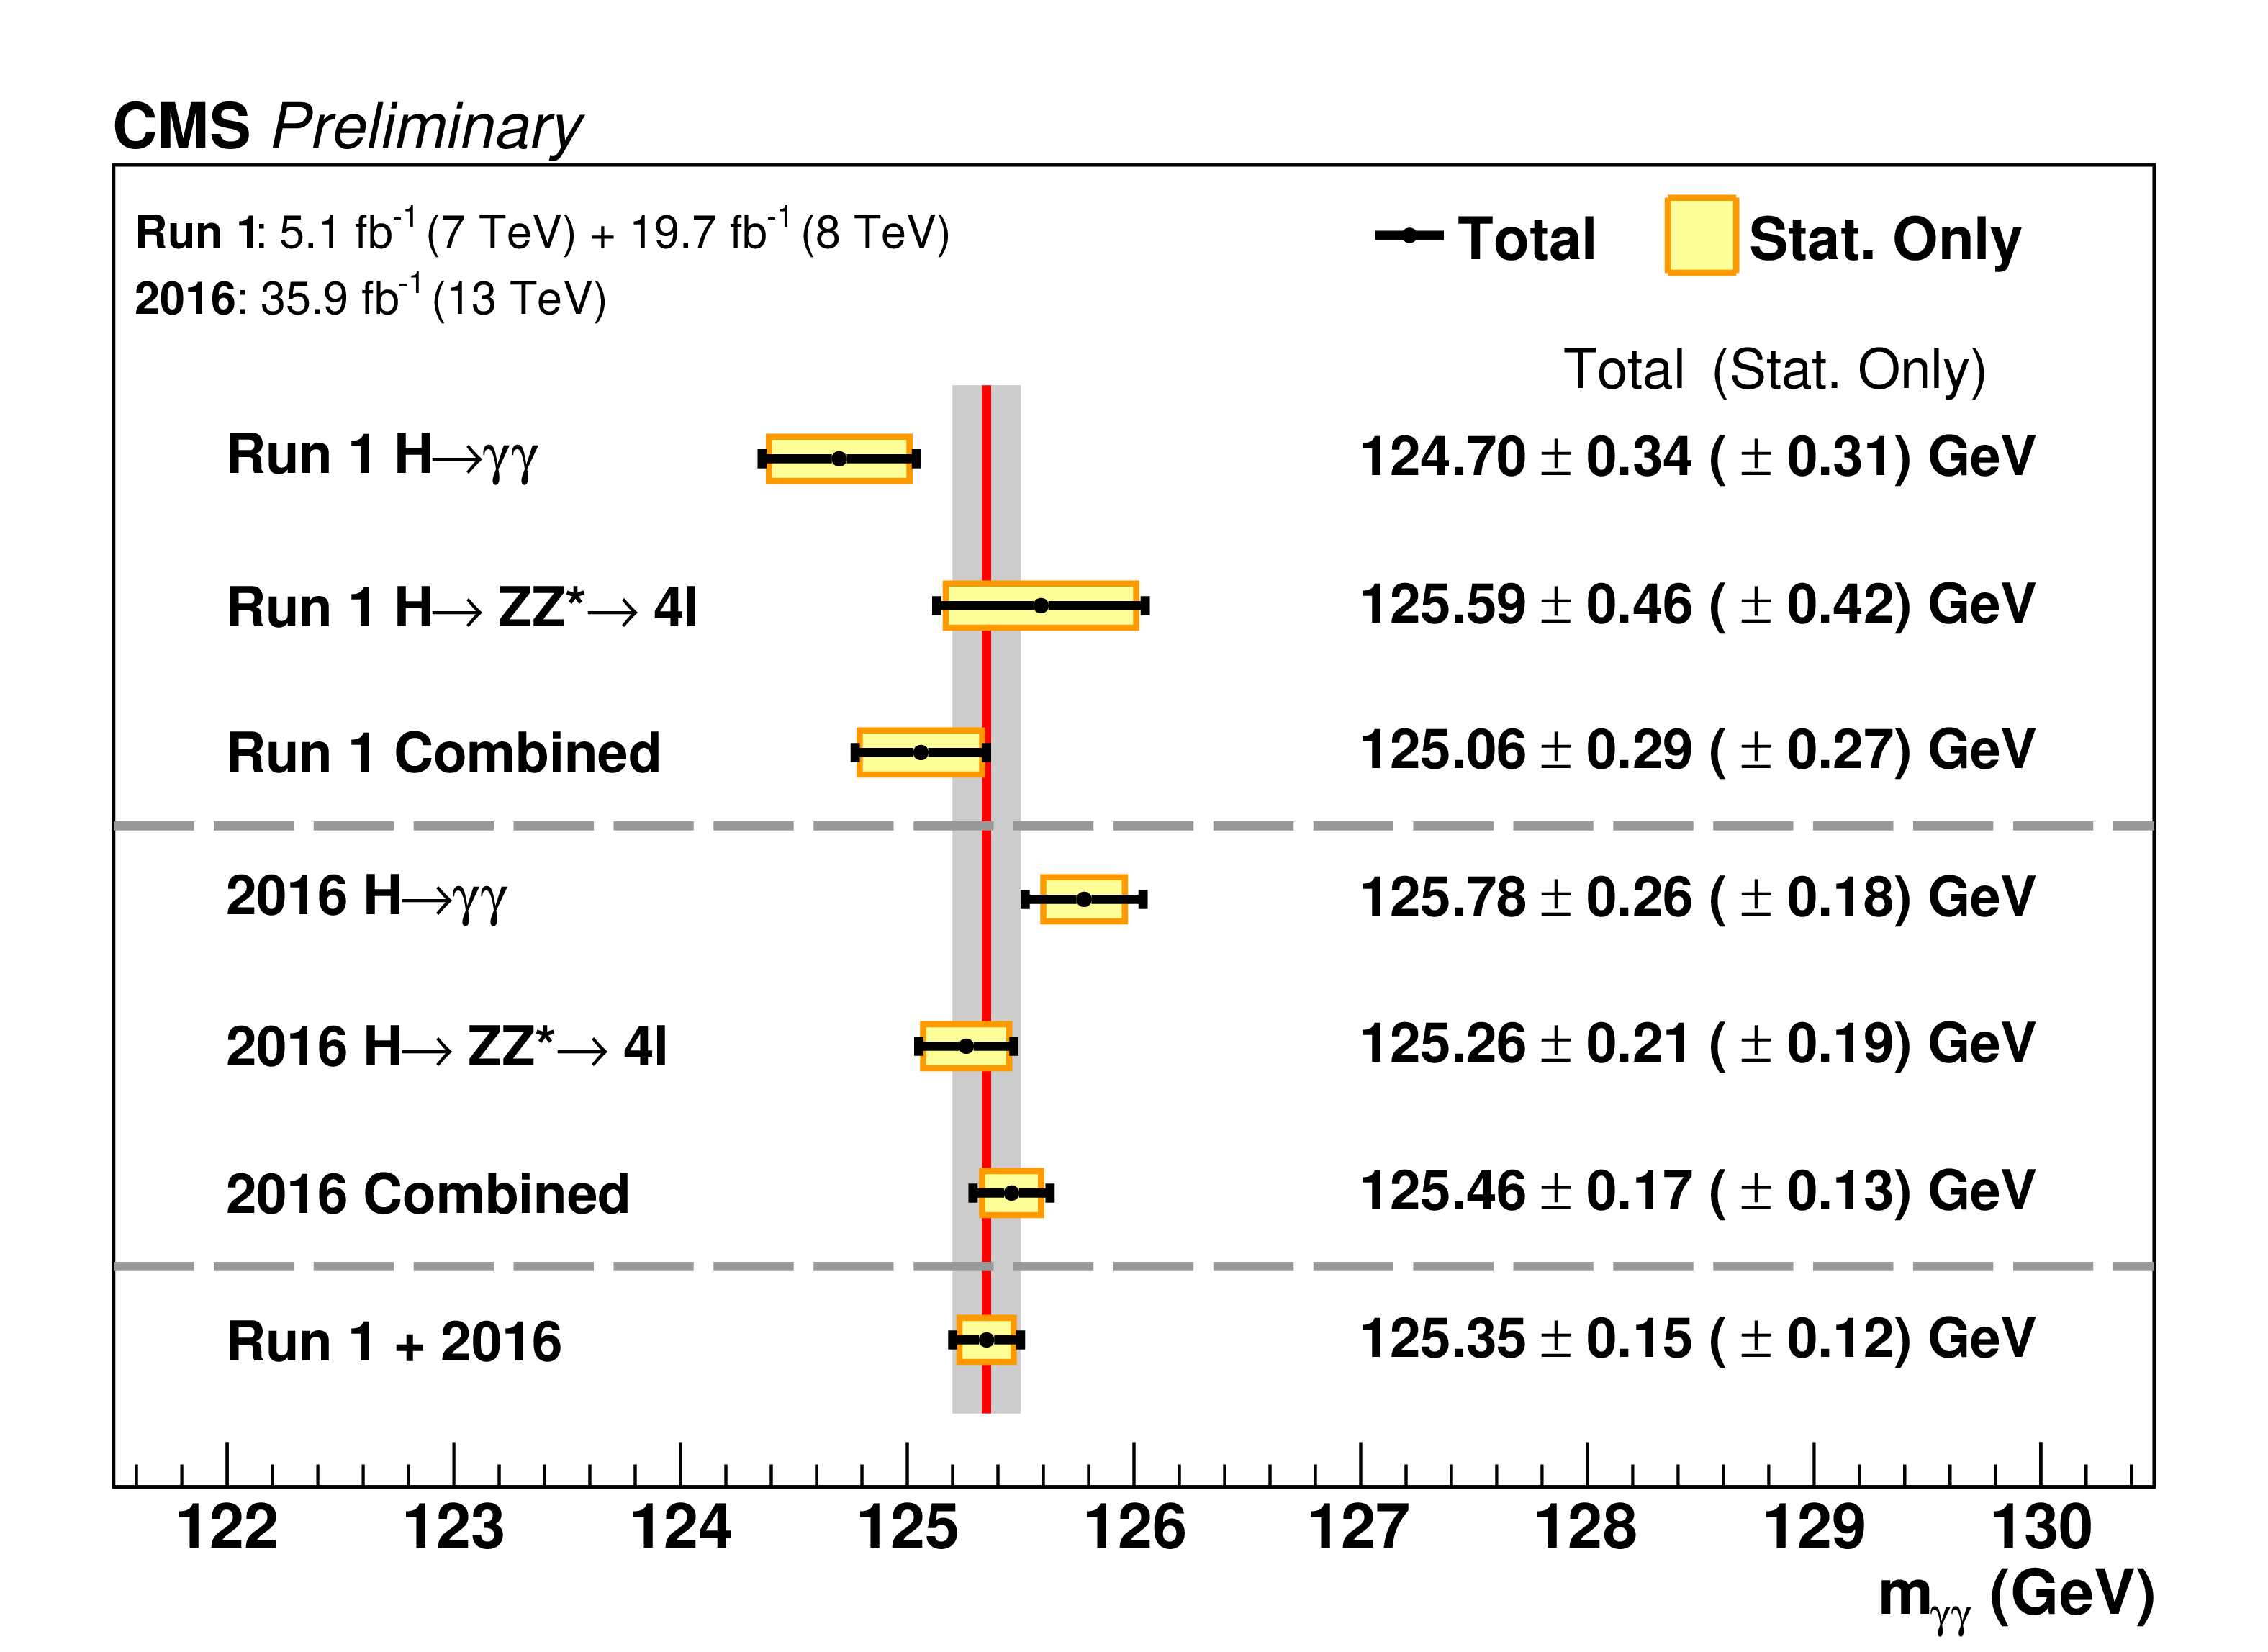
Figure 9:
A summary of the measured Higgs boson mass individually in the ${\mathrm{H} \rightarrow \gamma \gamma}$ and ${\mathrm{H} \rightarrow \mathrm{ZZ}^{*} \rightarrow 4\ell}$ decay channels, and for the combination of the two is presented here. The statistical (wider, yellow-shaded bands), and total (black error bars) uncertainties are indicated. The (red) vertical line and corresponding (gray) shaded column indicate the central value and the total uncertainty of the Run 1 + 2016 combined measurement, respectively. |
| Tables | |
png pdf |
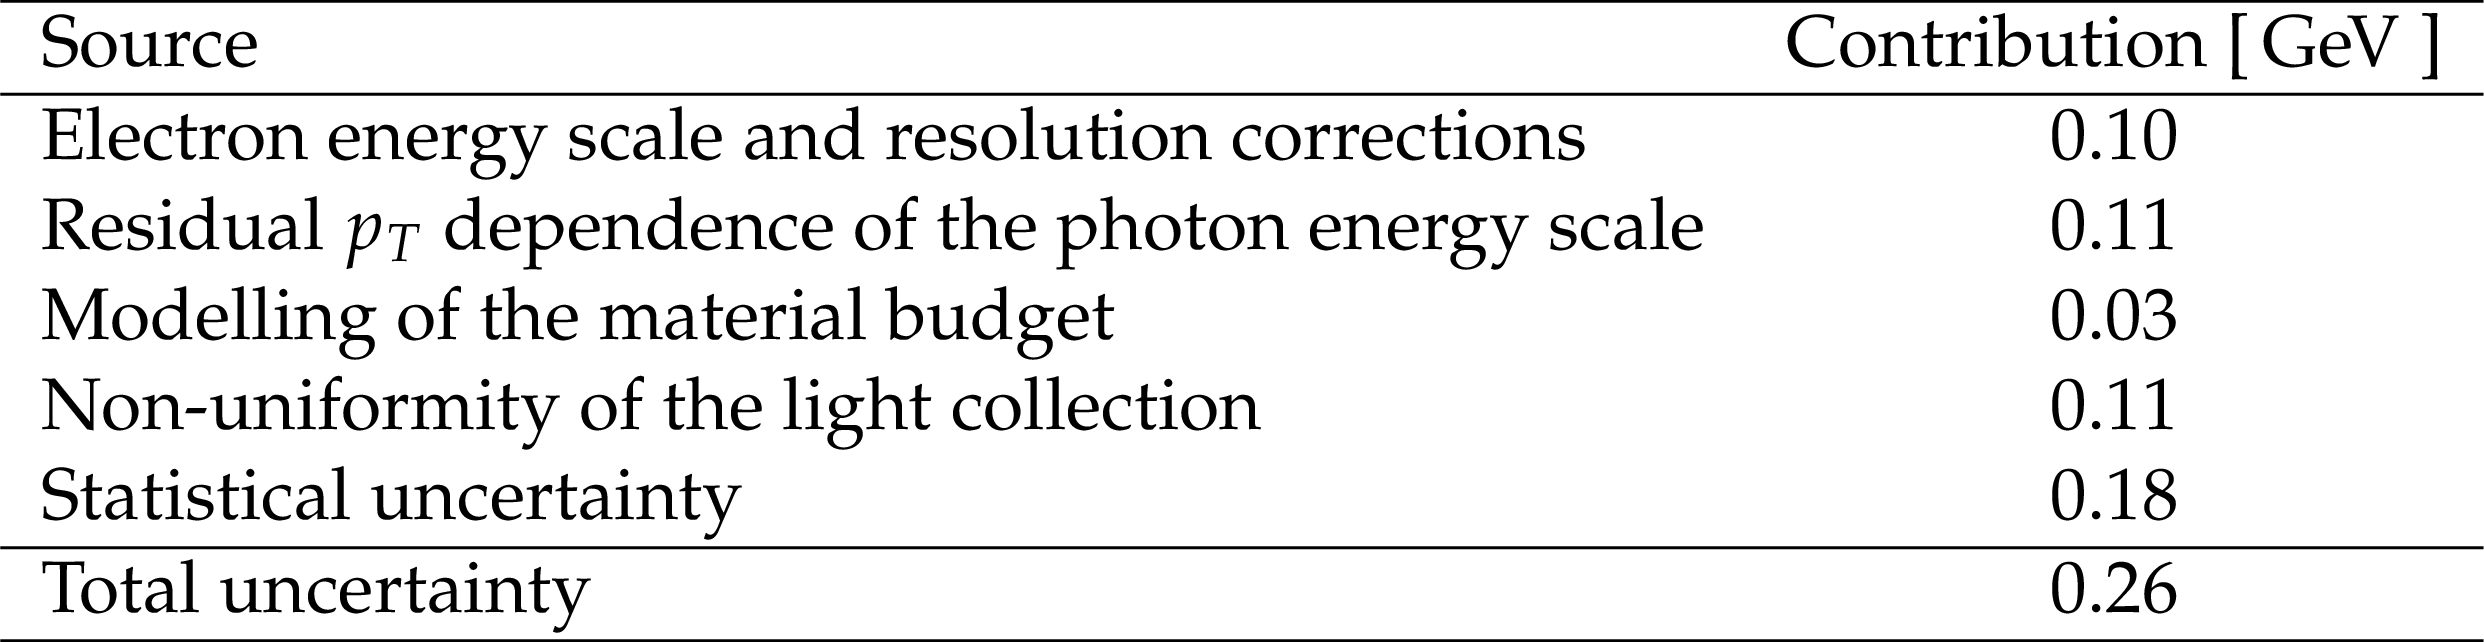
Table 1:
The observed impact of the different sources of systematic uncertainty on the measurement of ${m_\mathrm{H}}$. |
| Summary |
| In this note we have described a measurement of the Higgs boson mass in the diphoton decay channel. This analysis has taken advantage of the higher integrated luminosity data collected in 2016 at $\sqrt{s} = $ 13 TeV at the CERN LHC. New analysis techniques have been introduced to improve the precision of the measurement and we have used an improved detector calibration. The techniques that are new with respect to the previous analysis in the diphoton decay channel [7] are the introduction of residual energy corrections in much finer bins of the shower-shape variable, ${R_\mathrm{9}} $, and $\eta$, and the development of a procedure to derive ${p_{\mathrm{T}}}$ dependent corrections to the photon energy scale. We have also employed a new method to estimate the systematic uncertainty due to changes in the transparency of the ECAL crystals with radiation damage. The measured value of the Higgs boson mass in the diphoton decay channel is found to be ${m_\mathrm{H}} =$ 125.78 $\pm$ 0.26 GeV. This measurement has been combined with a recent measurement by CMS of the same quantity in the $\mathrm{H} \rightarrow \mathrm{ZZ}^{*} \rightarrow 4\ell$ decay channel [5] to obtain a value of ${m_\mathrm{H}} =$ 125.46 $\pm$ 0.17 GeV. Furthermore, when the Run 2 result with the 2016 data set is combined with the same measurement performed in Run 1 at 7 and 8 TeV the value of the Higgs boson mass is found to be ${m_\mathrm{H}} =$ 125.35 $\pm$ 0.15 GeV. |
| References | ||||
| 1 | CMS Collaboration | Observation of a new boson at a mass of 125 GeV with the CMS experiment at the LHC | PLB 716 (2012) 30 | CMS-HIG-12-028 1207.7235 |
| 2 | ATLAS Collaboration | Observation of a new particle in the search for the Standard Model Higgs boson with the ATLAS detector at the LHC | PLB 716 (2012) 1 | 1207.7214 |
| 3 | ATLAS, CMS Collaboration | Combined Measurement of the Higgs Boson Mass in $ pp $ Collisions at $ \sqrt{s}= $ 7 and 8 TeV with the ATLAS and CMS Experiments | PRL 114 (2015) 191803 | 1503.07589 |
| 4 | ATLAS Collaboration | Measurement of the Higgs boson mass in the $ H\rightarrow ZZ^* \rightarrow 4\ell $ and $ H \rightarrow \gamma\gamma $ channels with $ \sqrt{s}=$ 13 TeV pp collisions using the ATLAS detector | PLB 784 (2018) 345 | 1806.00242 |
| 5 | CMS Collaboration | Measurements of properties of the Higgs boson decaying into the four-lepton final state in pp collisions at $ \sqrt{s}= $ 13 TeV | JHEP 11 (2017) 047 | CMS-HIG-16-041 1706.09936 |
| 6 | CMS Collaboration | The CMS experiment at the CERN LHC | JINST 3 (2008) S08004 | CMS-00-001 |
| 7 | CMS Collaboration | Measurements of Higgs boson properties in the diphoton decay channel in proton-proton collisions at $ \sqrt{s} = $ 13 TeV | JHEP 11 (2018) 185 | CMS-HIG-16-040 1804.02716 |
| 8 | CMS Collaboration | Observation of the diphoton decay of the Higgs boson and measurement of its properties | EPJC 74 (2014) 3076 | CMS-HIG-13-001 1407.0558 |
| 9 | J. Alwall et al. | The automated computation of tree-level and next-to-leading order differential cross sections, and their matching to parton shower simulations | JHEP 07 (2014) 079 | 1405.0301 |
| 10 | T. Sjöstrand, S. Mrenna, and P. Skands | A Brief Introduction to PYTHIA 8.1 | CPC 178 (2007) 852 | 0710.3820 |
| 11 | CMS Collaboration | Event generator tunes obtained from underlying event and multiparton scattering measurements | EPJC 76 (2016) 155 | CMS-GEN-14-001 1512.00815 |
| 12 | T. Gleisberg et al. | Event generation with SHERPA 1.1 | JHEP 02 (2009) 007 | 0811.4622 |
| 13 | J. Alwall et al. | MadGraph 5 : Going Beyond | JHEP 06 (2011) 128 | 1106.0522 |
| 14 | GEANT4 Collaboration | GEANT4--a simulation toolkit | NIMA 506 (2003) 250 | |
| 15 | CMS Collaboration | Energy Calibration and Resolution of the CMS Electromagnetic Calorimeter in $ pp $ Collisions at $ \sqrt{s} = $ 7 TeV | JINST 8 (2013) P09009 | CMS-EGM-11-001 1306.2016 |
| 16 | CMS Collaboration | Performance of Photon Reconstruction and Identification with the CMS Detector in Proton-Proton Collisions at $ \sqrt(s) = $ 8 TeV | JINST 10 (2015) P08010 | CMS-EGM-14-001 1502.02702 |
| 17 | P. D. Dauncey, M. Kenzie, N. Wardle, and G. J. Davies | Handling uncertainties in background shapes: the discrete profiling method | JINST 10 (2015) P04015 | 1408.6865 |
| 18 | R. A. Fisher | On the interpretation of $ \chi^2 $ from contingency tables, and the calculation of P | Journal of the Royal Statistical Society 85 (1922) 87 | |
| 19 | T. Adams et al. | Beam test evaluation of electromagnetic calorimeter modules made from proton-damaged PbWO$ _4 $ crystals | Journal of Instrumentation 11 P04012 | |
| 20 | F. Gentit | Litrani: a general purpose monte-carlo program simulating light propagation in isotropic or anisotropic media | Nucl. Inst. Meth. A 486 (2002) 35 | |
| 21 | T. Junk | Confidence level computation for combining searches with small statistics | NIMA 434 (1999) 435 | hep-ex/9902006 |
| 22 | A. L. Read | Presentation of search results: the CLs technique | Journal of Physics G: Nuclear and Particle Physics 28 (2002) 2693 | |
| 23 | G. Cowan, K. Cranmer, E. Gross, and O. Vitells | Asymptotic formulae for likelihood-based tests of new physics | EPJC 71 (2011) 1554 | 1007.1727 |
| 24 | CMS Collaboration | Precise determination of the mass of the Higgs boson and tests of compatibility of its couplings with the standard model predictions using proton collisions at 7 and 8 TeV | EPJC 75 (2015) 212 | CMS-HIG-14-009 1412.8662 |
|
|
Compact Muon Solenoid LHC, CERN |
|

|

|

|

|

|