

Compact Muon Solenoid
LHC, CERN
| CMS-PAS-HIG-19-003 | ||
| Inclusive search for a highly boosted Higgs boson decaying to a bottom quark-antiquark pair at $\sqrt{s} = $ 13 TeV with 137 fb$^{-1}$ | ||
| CMS Collaboration | ||
| April 2020 | ||
| Abstract: An inclusive search for the standard model Higgs boson produced with large transverse momentum ($p_\mathrm{T}$) and decaying to a bottom quark-antiquark pair is performed using pp collisions data collected by the CMS experiment at the LHC at $\sqrt{s}= $ 13 TeV. The data sample corresponds to an integrated luminosity of 137 fb$^{-1}$. Highly Lorentz-boosted Higgs bosons decaying to $\mathrm{b}\overline{\mathrm{b}}$ are reconstructed as single, large radius jets, and are identified using jet substructure and dedicated b tagging techniques based on a deep neural network. The method is validated with $\mathrm{Z}\to\mathrm{b}\overline{\mathrm{b}}$ decays. For a Higgs boson mass of 125 GeV, an excess of events above the expected background is observed with a local significance of 2.54 standard deviations, where the expectation is 0.71. The corresponding signal strength is $\mu_\mathrm{H} = $ 3.68 $\pm$ 1.20 (stat) $_{-0.66}^{+0.63}$ (syst) $_{-0.46}^{+0.81}$ (theo) with respect to the standard model expectation. Additionally, an unfolded differential cross section as a function of Higgs boson $p_\mathrm{T}$ is presented. With respect to the previous CMS result, the relative precision of the Higgs boson signal strength measurement improves by approximately a factor of two. The improvement is due to the increased integrated luminosity, improved b tagging, and smaller theoretical uncertainties. | ||
|
Links:
CDS record (PDF) ;
CADI line (restricted) ;
These preliminary results are superseded in this paper, JHEP 12 (2020) 085. The superseded preliminary plots can be found here. |
||
| Figures & Tables | Summary | Additional Figures | References | CMS Publications |
|---|
| Figures | |

png pdf |
Figure 1:
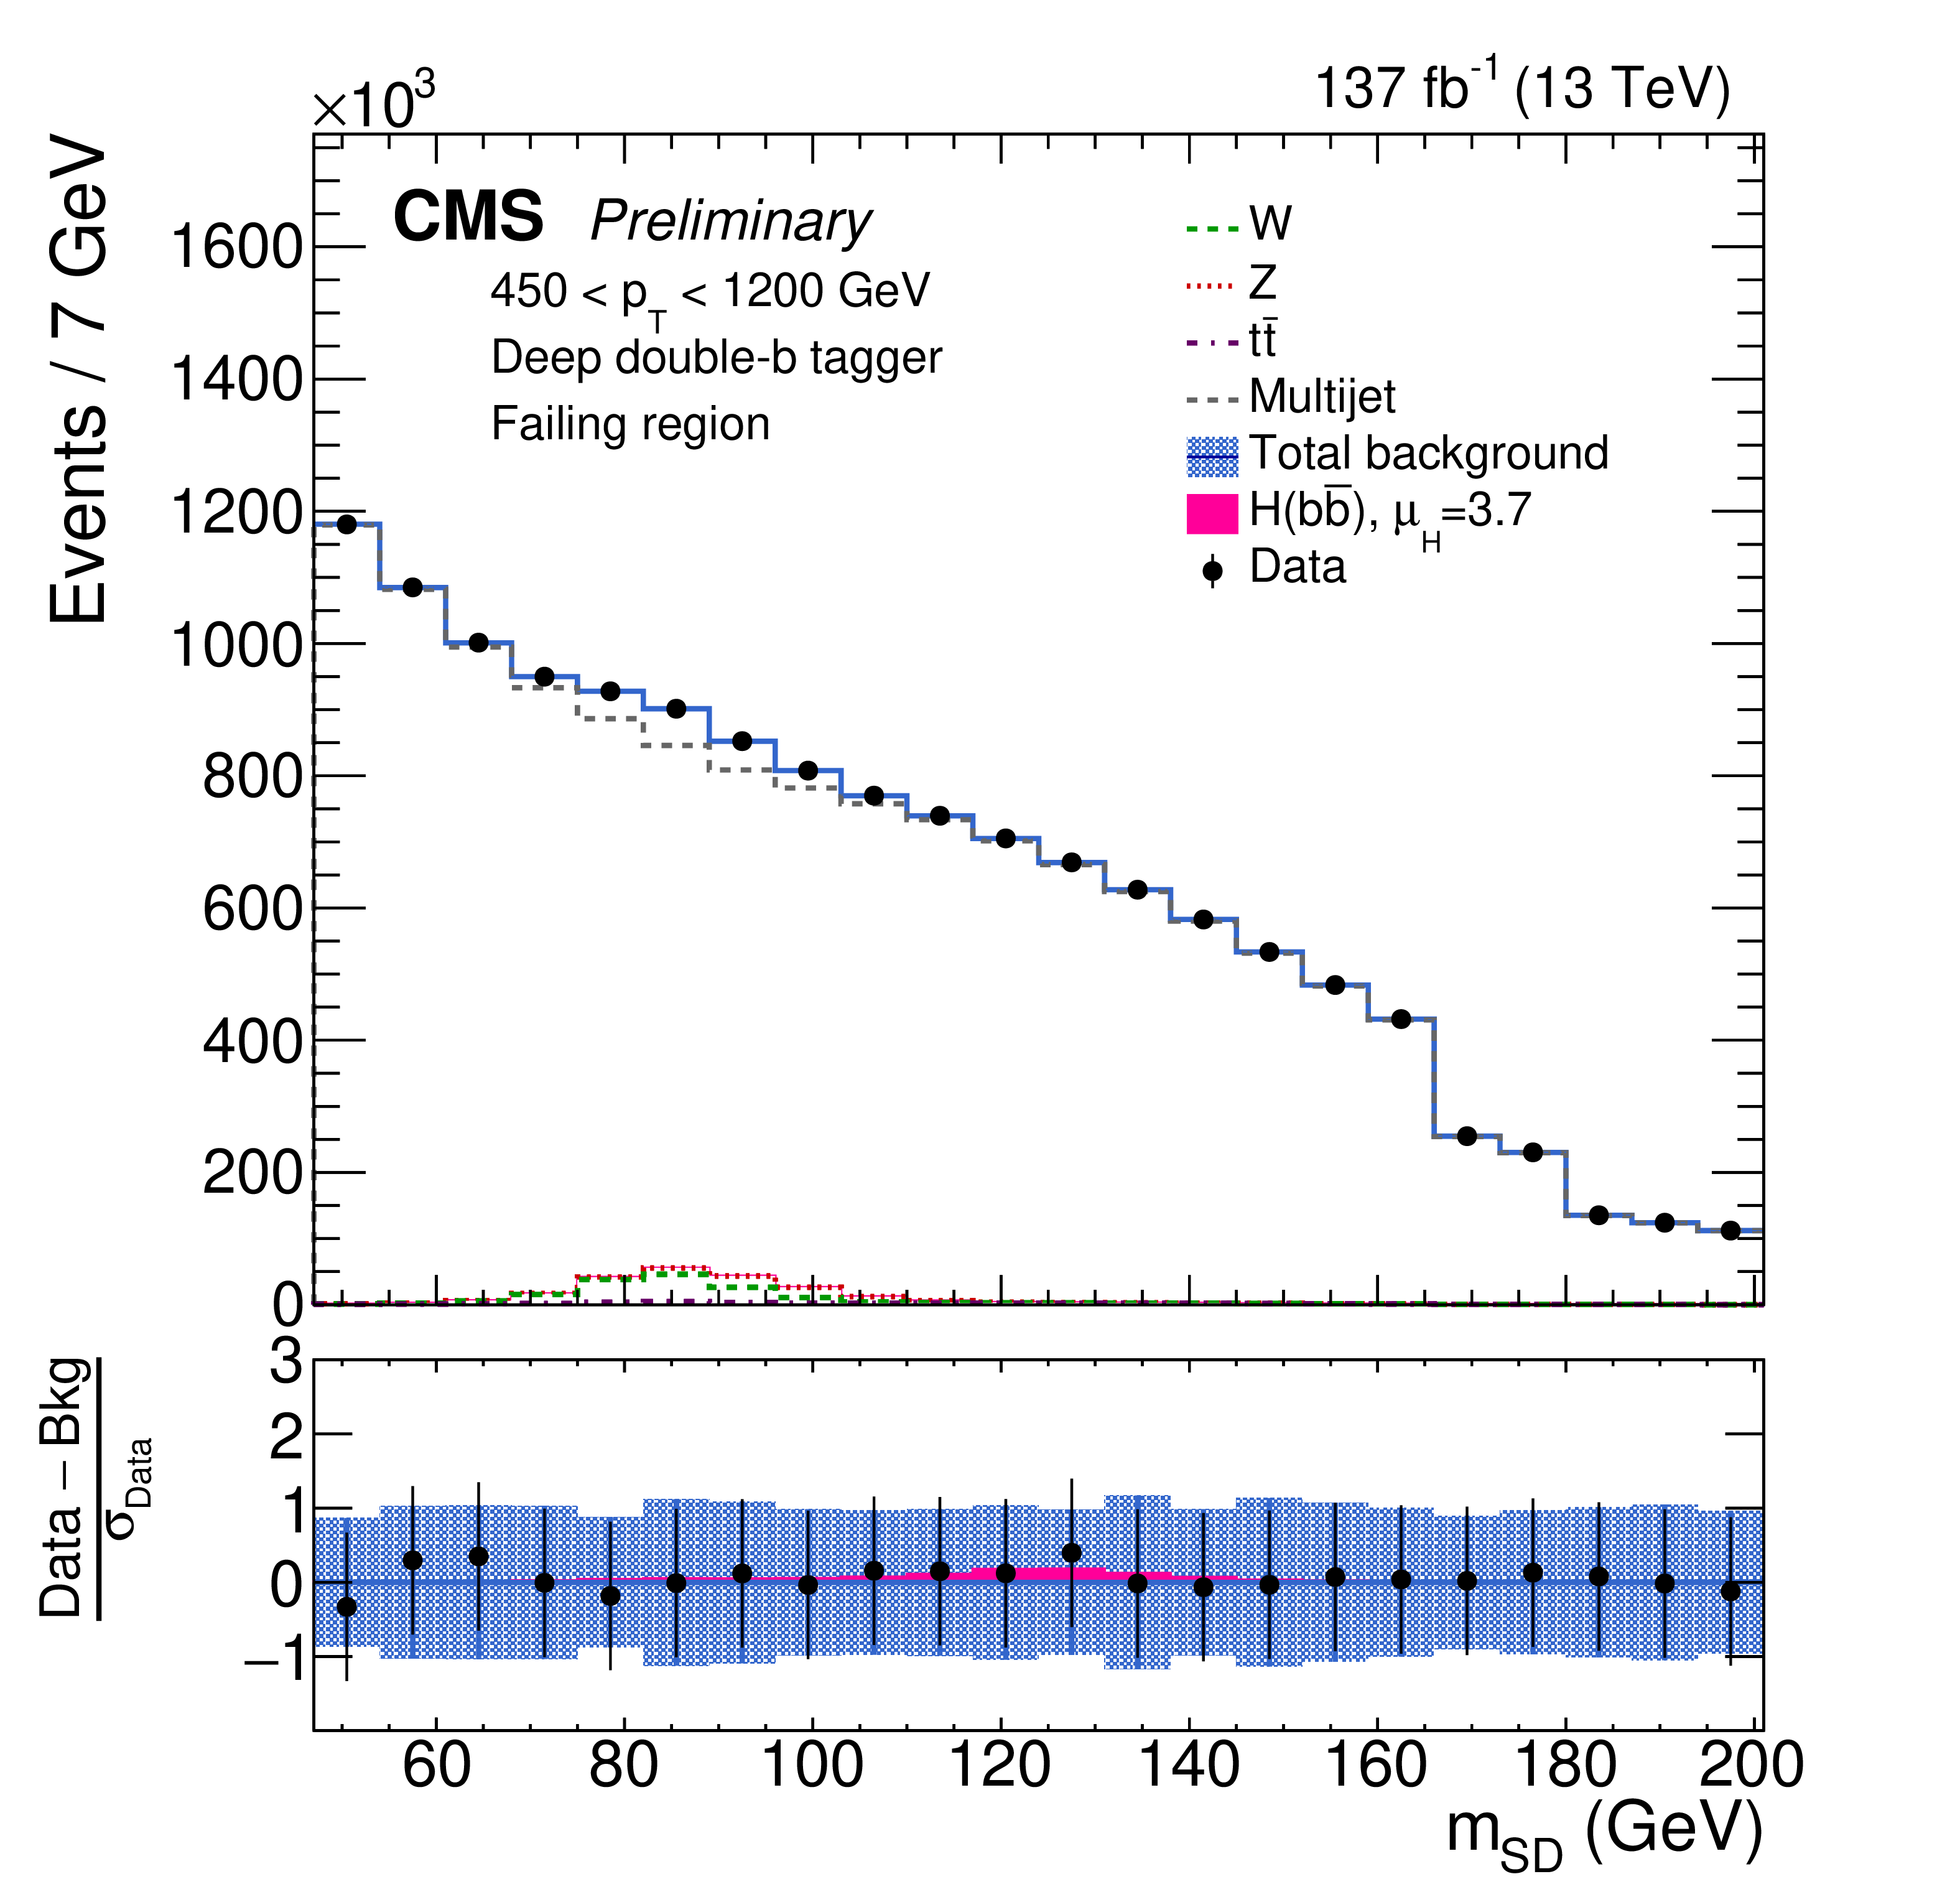
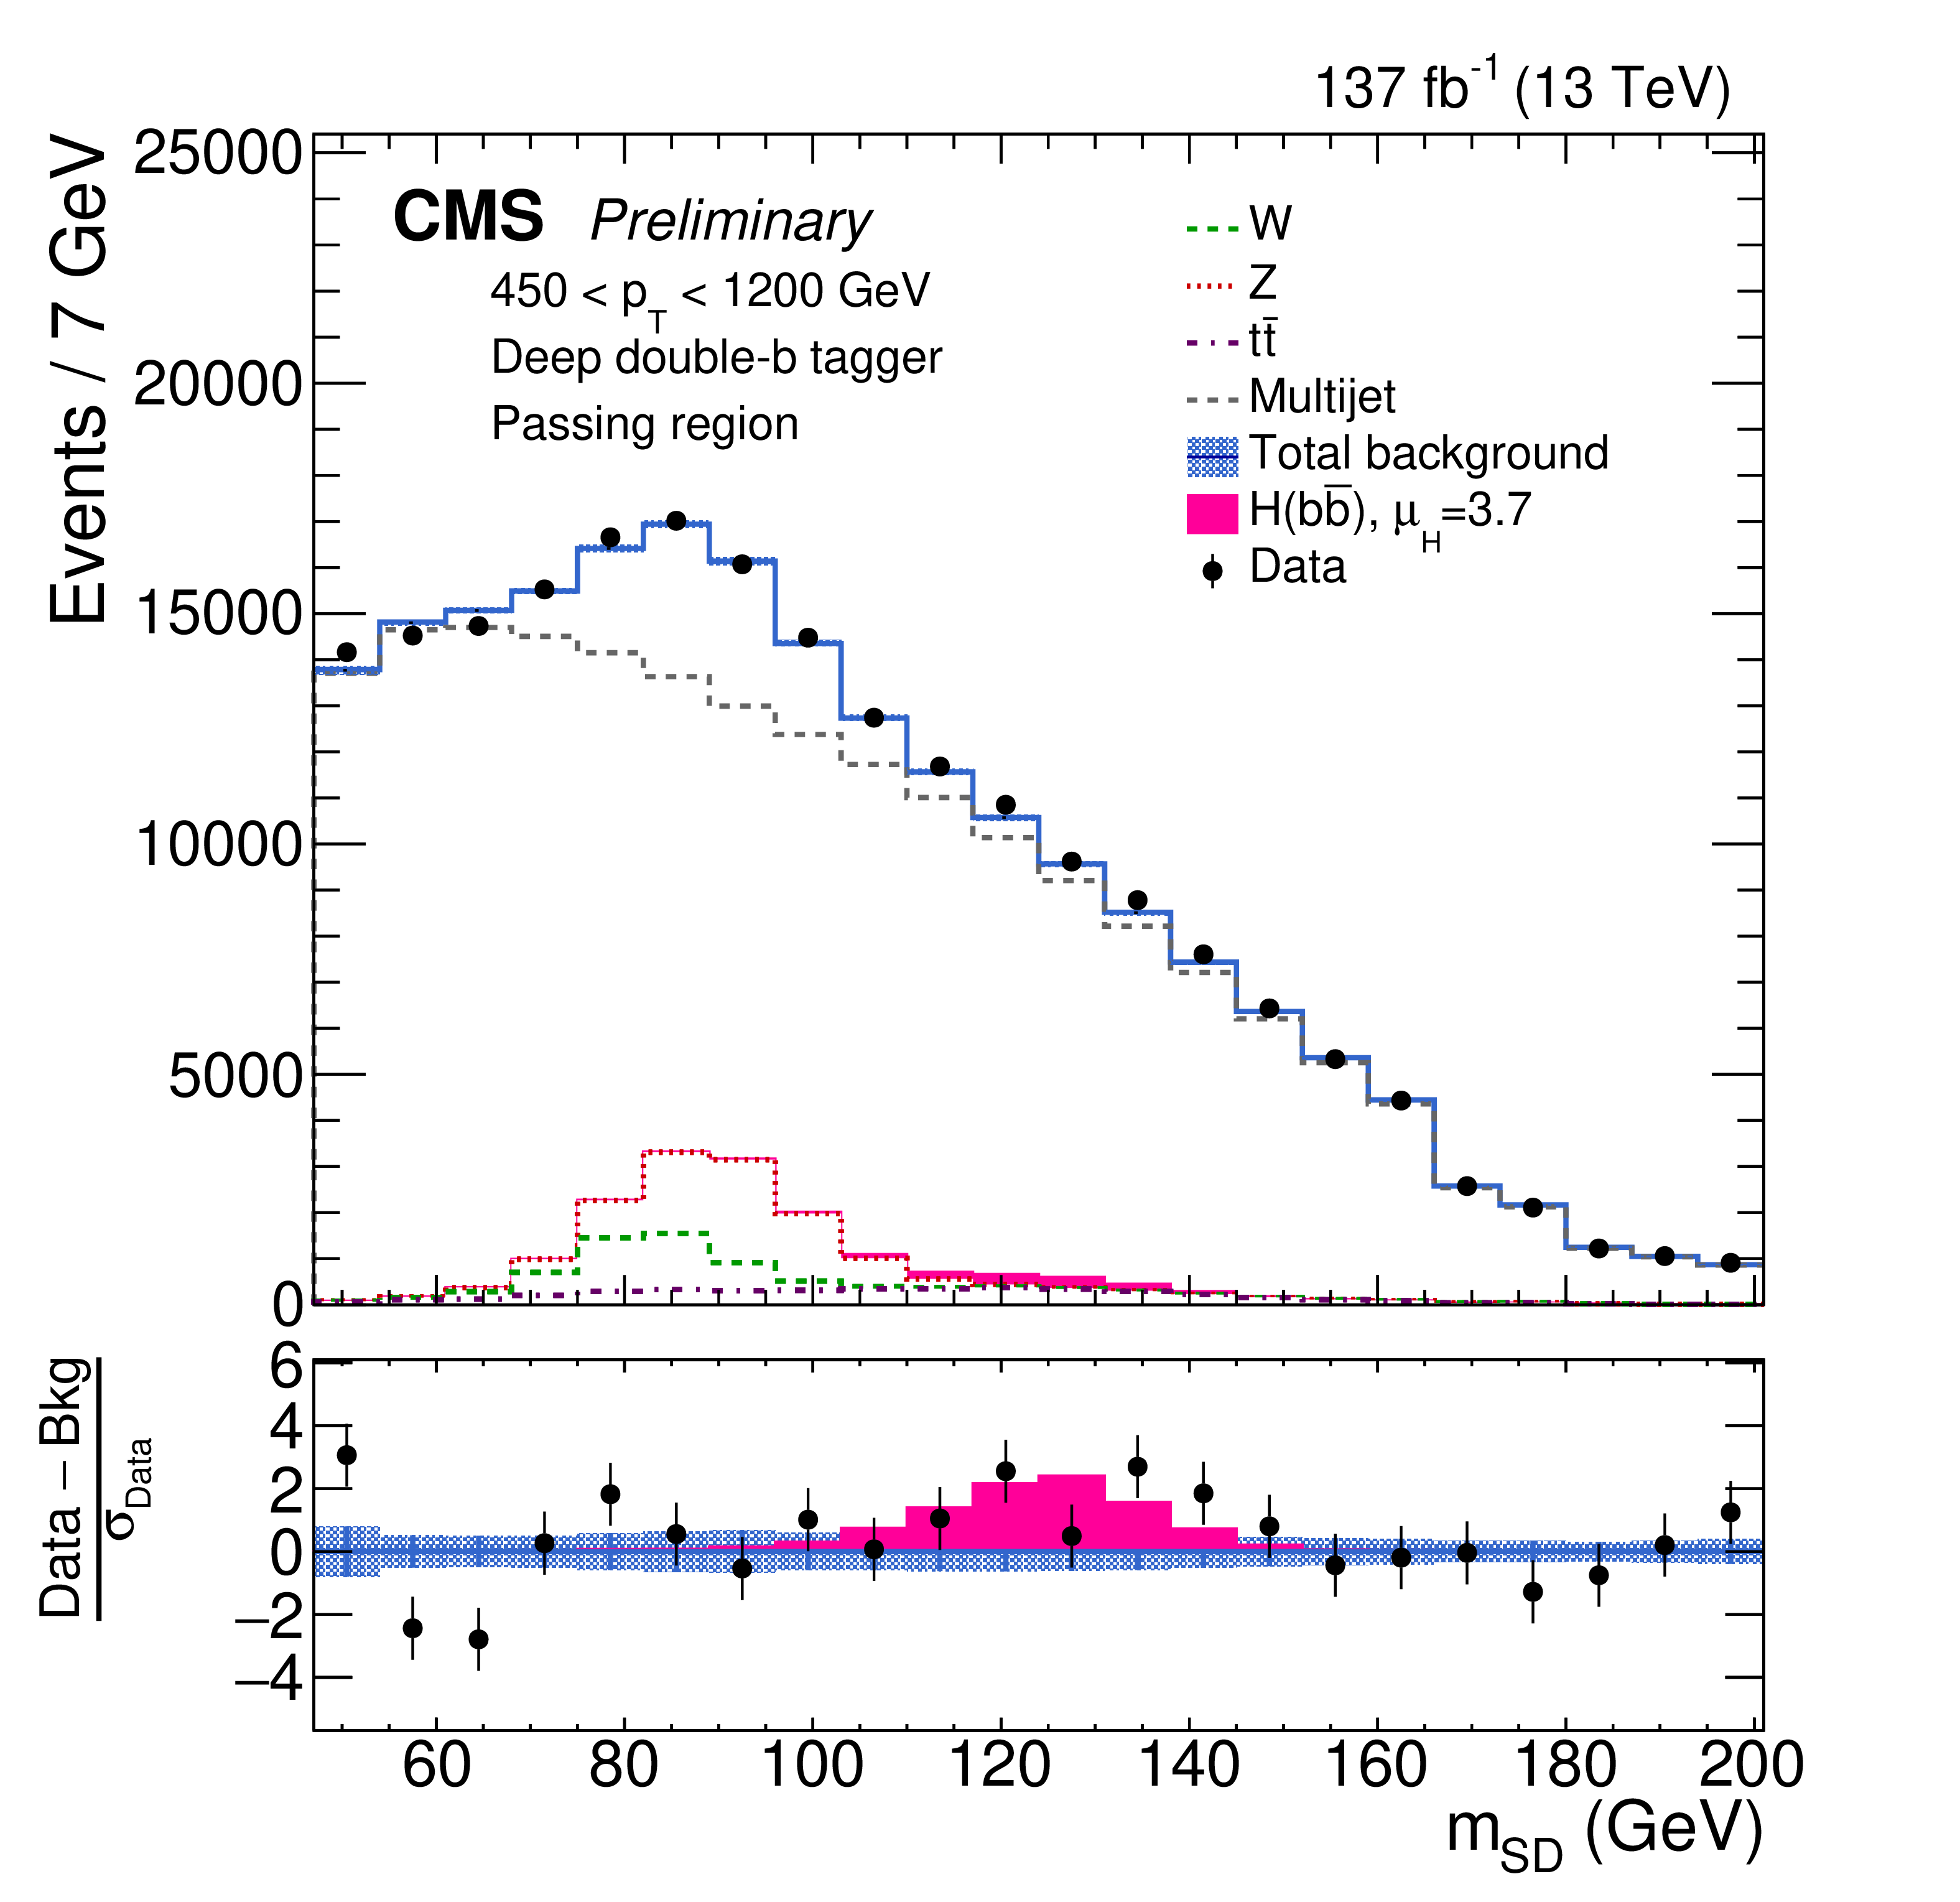
The observed and fitted background $ {m_{\mathrm {SD}}} $ distributions for the failing (left) and passing (right) regions, combining all the $ {p_{\mathrm {T}}} $ categories, and three data collection years. The fit is performed under the signal-plus-background hypothesis with one inclusive $\mathrm{H} (\mathrm{b} {}\mathrm{\bar{b}} $) signal strength parameter floating in all the $ {p_{\mathrm {T}}} $ categories. Because of the finite $\rho $ acceptance, some $ {m_{\mathrm {SD}}} $ bins within a given $ {p_{\mathrm {T}}} $ category may be removed, giving rise to the features at 166 and 180 GeV. The shaded blue band shows the systematic uncertainty in the total background prediction. The bottom panel shows the difference between the data and the total background prediction, divided by the statistical uncertainty in the data. |
png pdf |
Figure 1-a:
The observed and fitted background $ {m_{\mathrm {SD}}} $ distributions for the failing (left) and passing (right) regions, combining all the $ {p_{\mathrm {T}}} $ categories, and three data collection years. The fit is performed under the signal-plus-background hypothesis with one inclusive $\mathrm{H} (\mathrm{b} {}\mathrm{\bar{b}} $) signal strength parameter floating in all the $ {p_{\mathrm {T}}} $ categories. Because of the finite $\rho $ acceptance, some $ {m_{\mathrm {SD}}} $ bins within a given $ {p_{\mathrm {T}}} $ category may be removed, giving rise to the features at 166 and 180 GeV. The shaded blue band shows the systematic uncertainty in the total background prediction. The bottom panel shows the difference between the data and the total background prediction, divided by the statistical uncertainty in the data. |
png pdf |
Figure 1-b:
The observed and fitted background $ {m_{\mathrm {SD}}} $ distributions for the failing (left) and passing (right) regions, combining all the $ {p_{\mathrm {T}}} $ categories, and three data collection years. The fit is performed under the signal-plus-background hypothesis with one inclusive $\mathrm{H} (\mathrm{b} {}\mathrm{\bar{b}} $) signal strength parameter floating in all the $ {p_{\mathrm {T}}} $ categories. Because of the finite $\rho $ acceptance, some $ {m_{\mathrm {SD}}} $ bins within a given $ {p_{\mathrm {T}}} $ category may be removed, giving rise to the features at 166 and 180 GeV. The shaded blue band shows the systematic uncertainty in the total background prediction. The bottom panel shows the difference between the data and the total background prediction, divided by the statistical uncertainty in the data. |
png pdf |
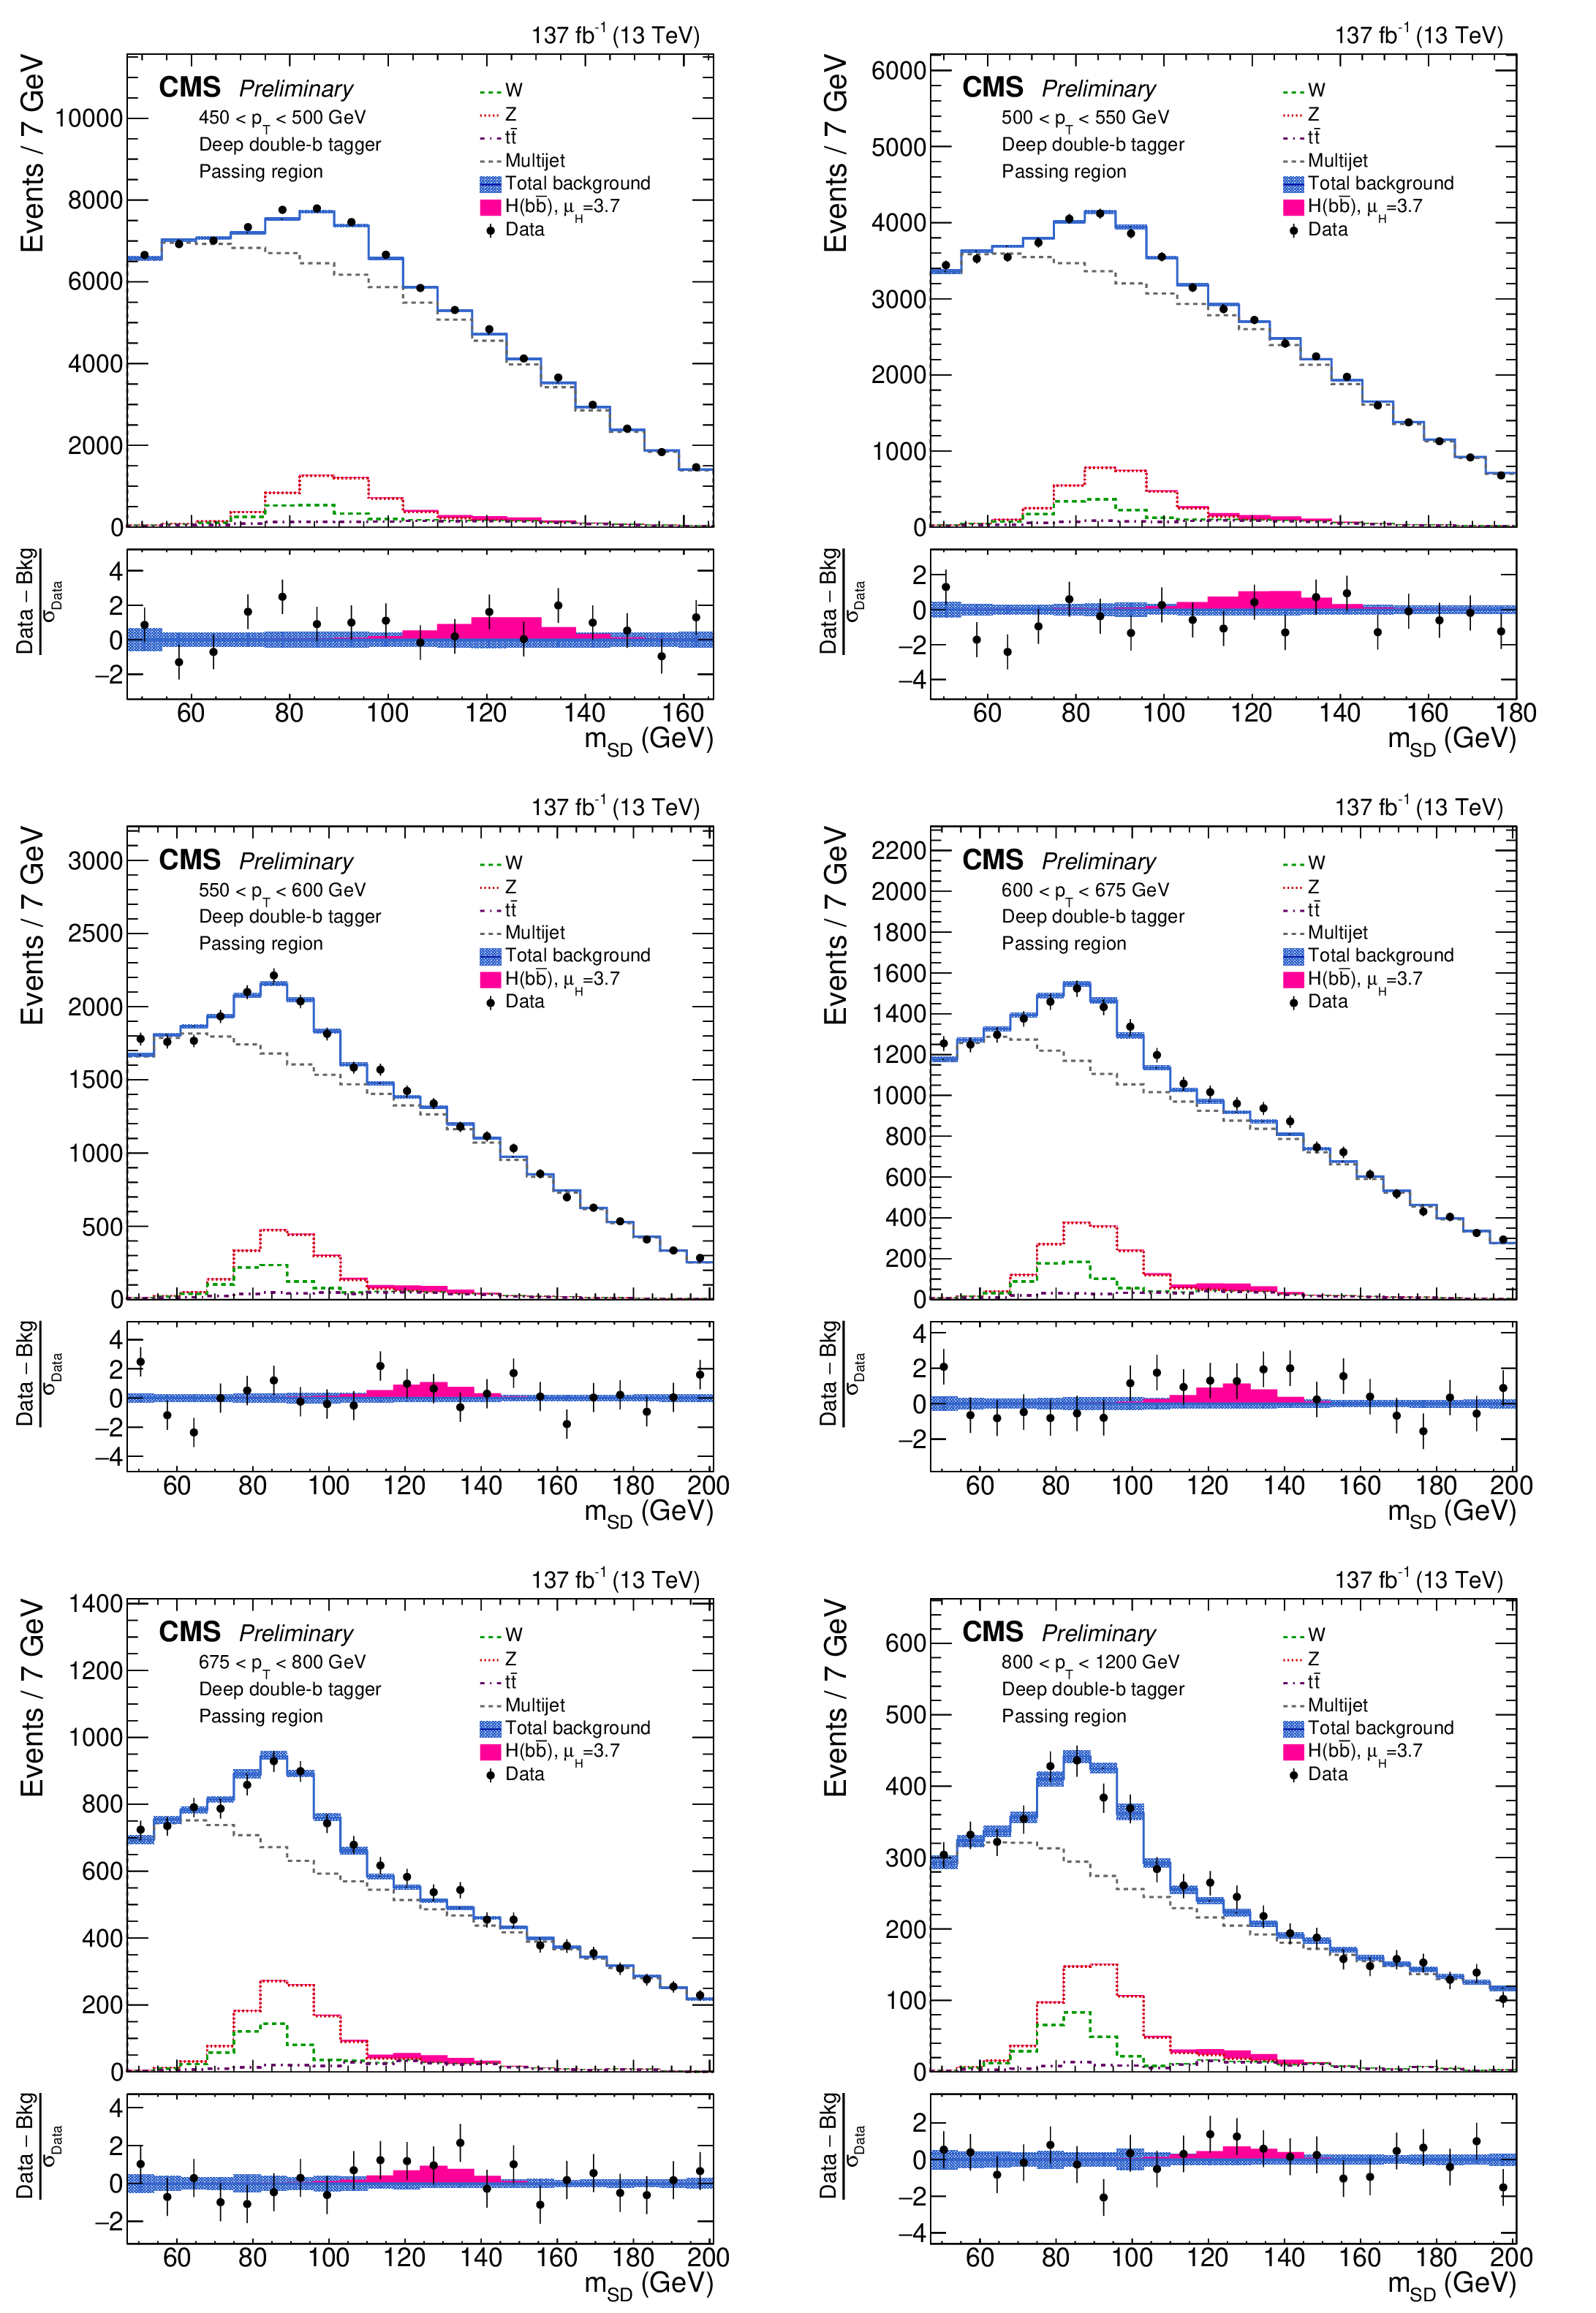
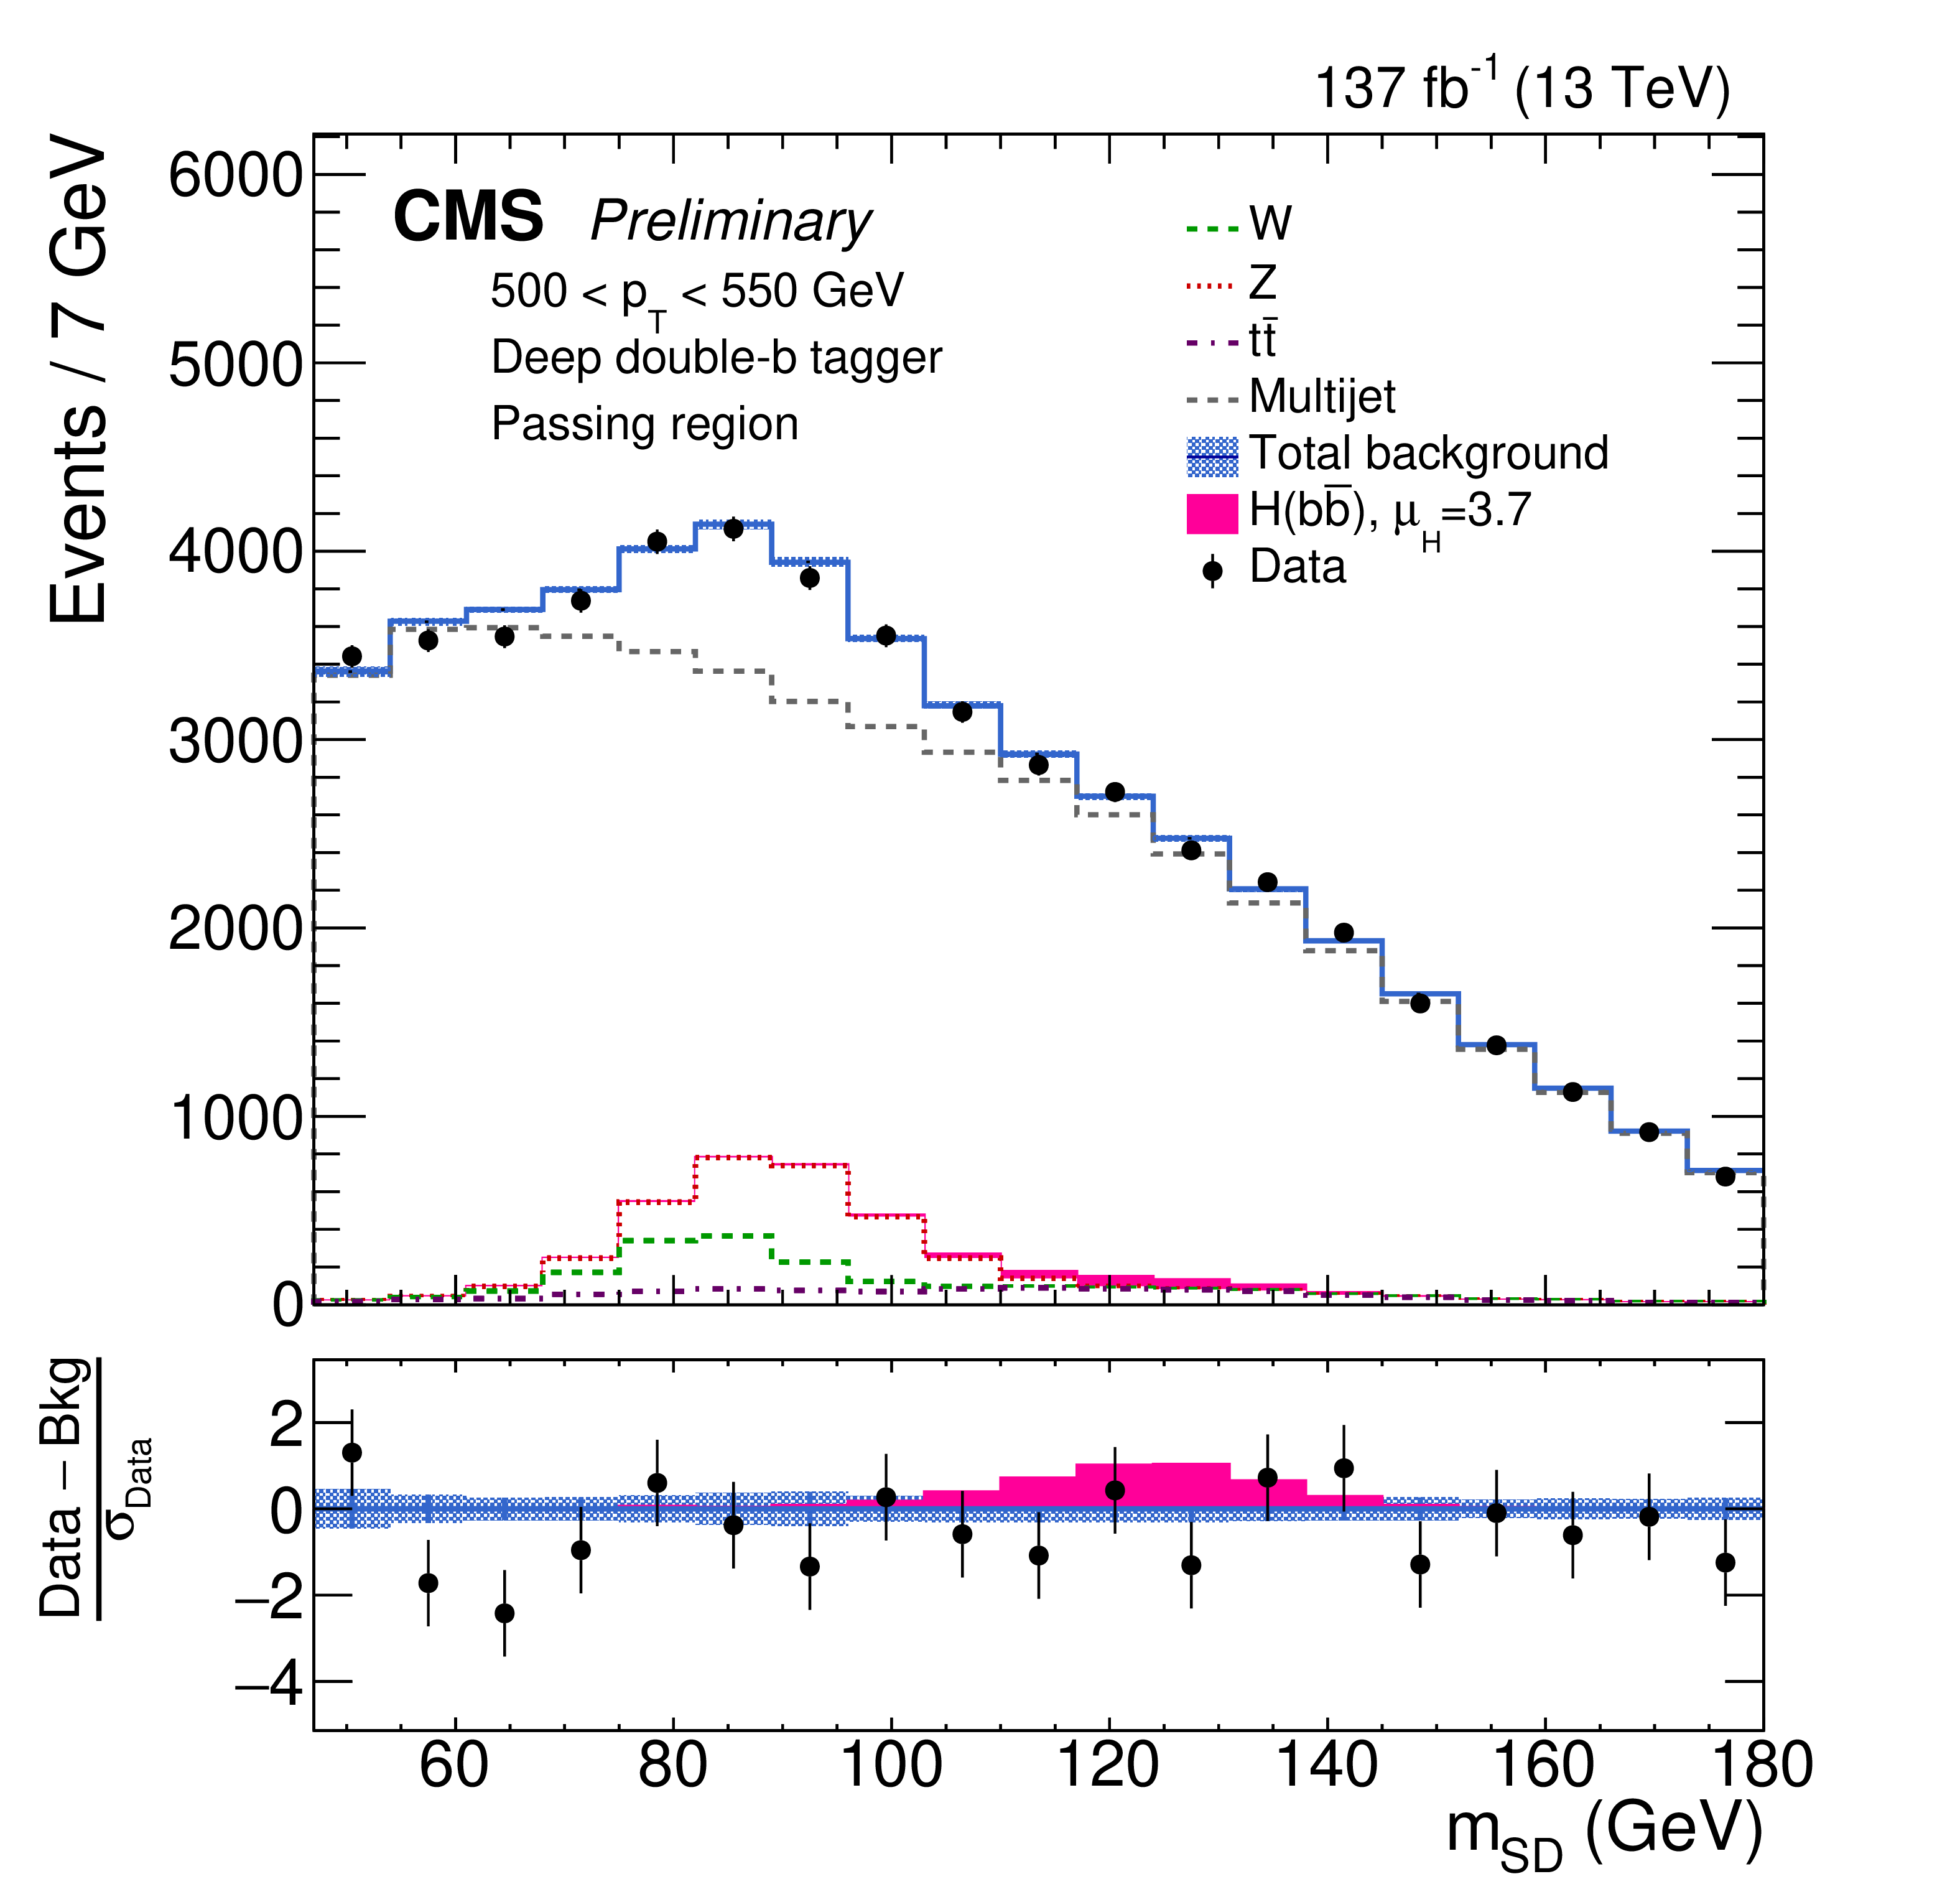
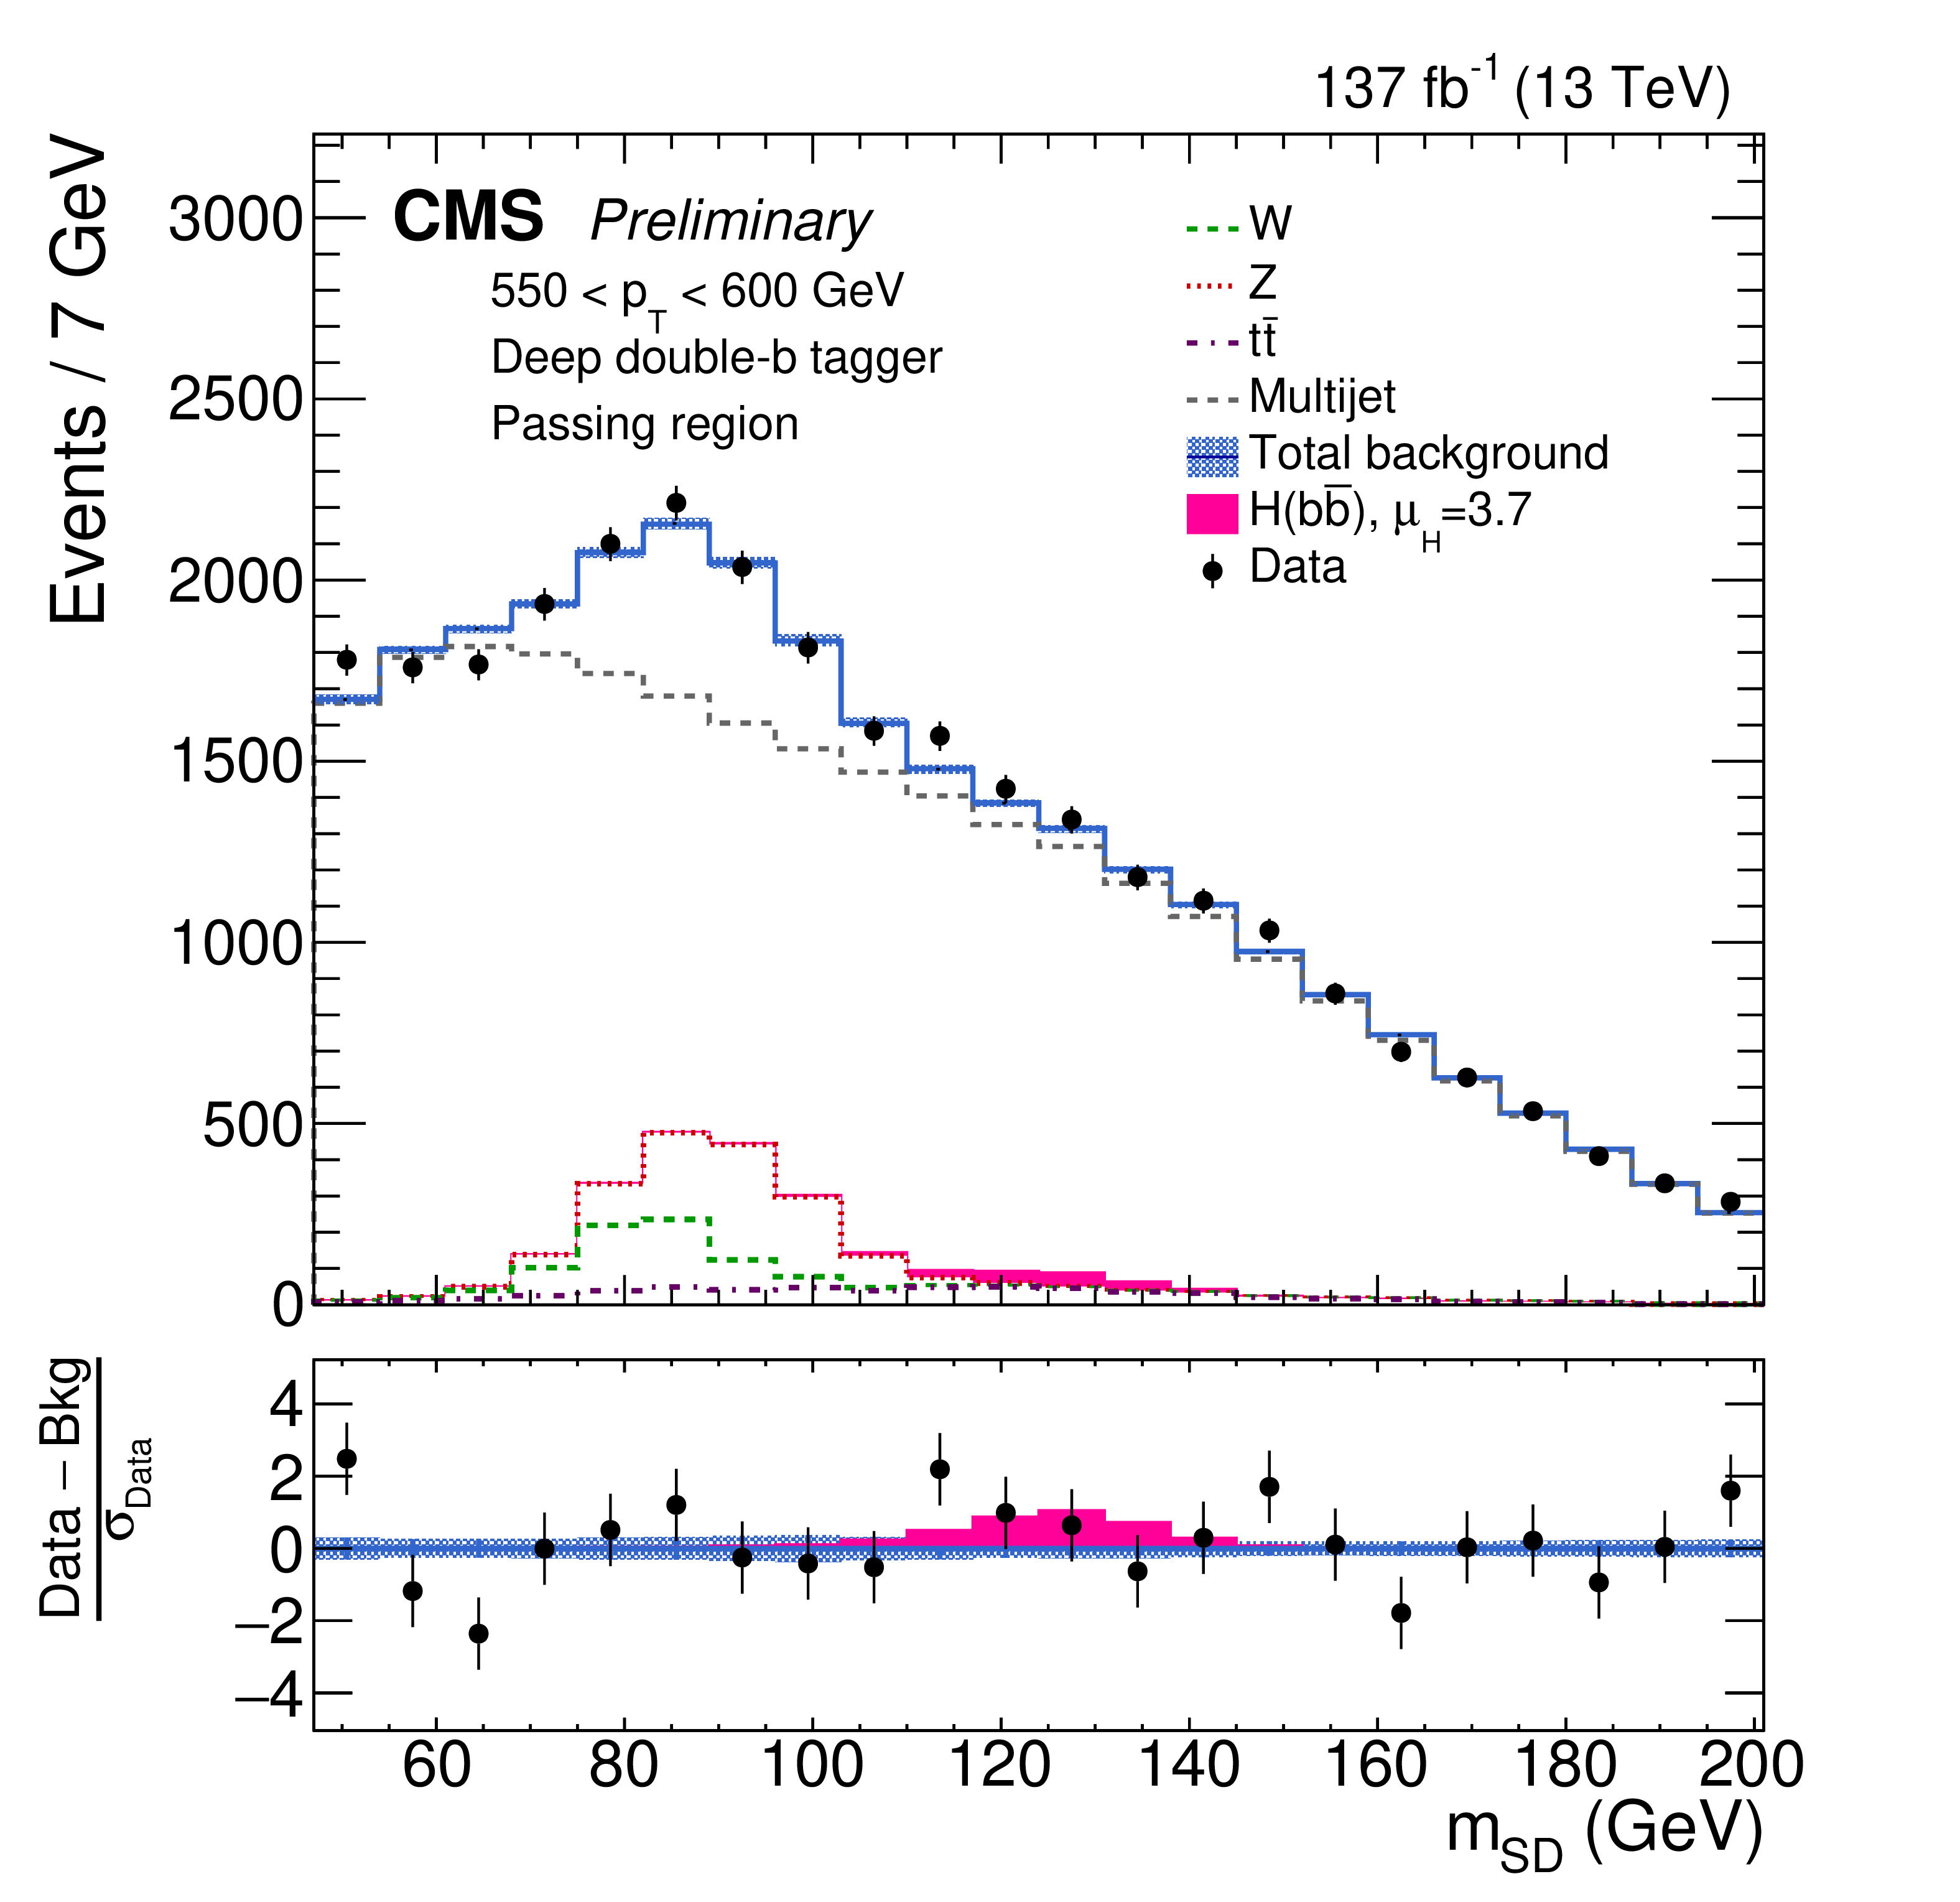
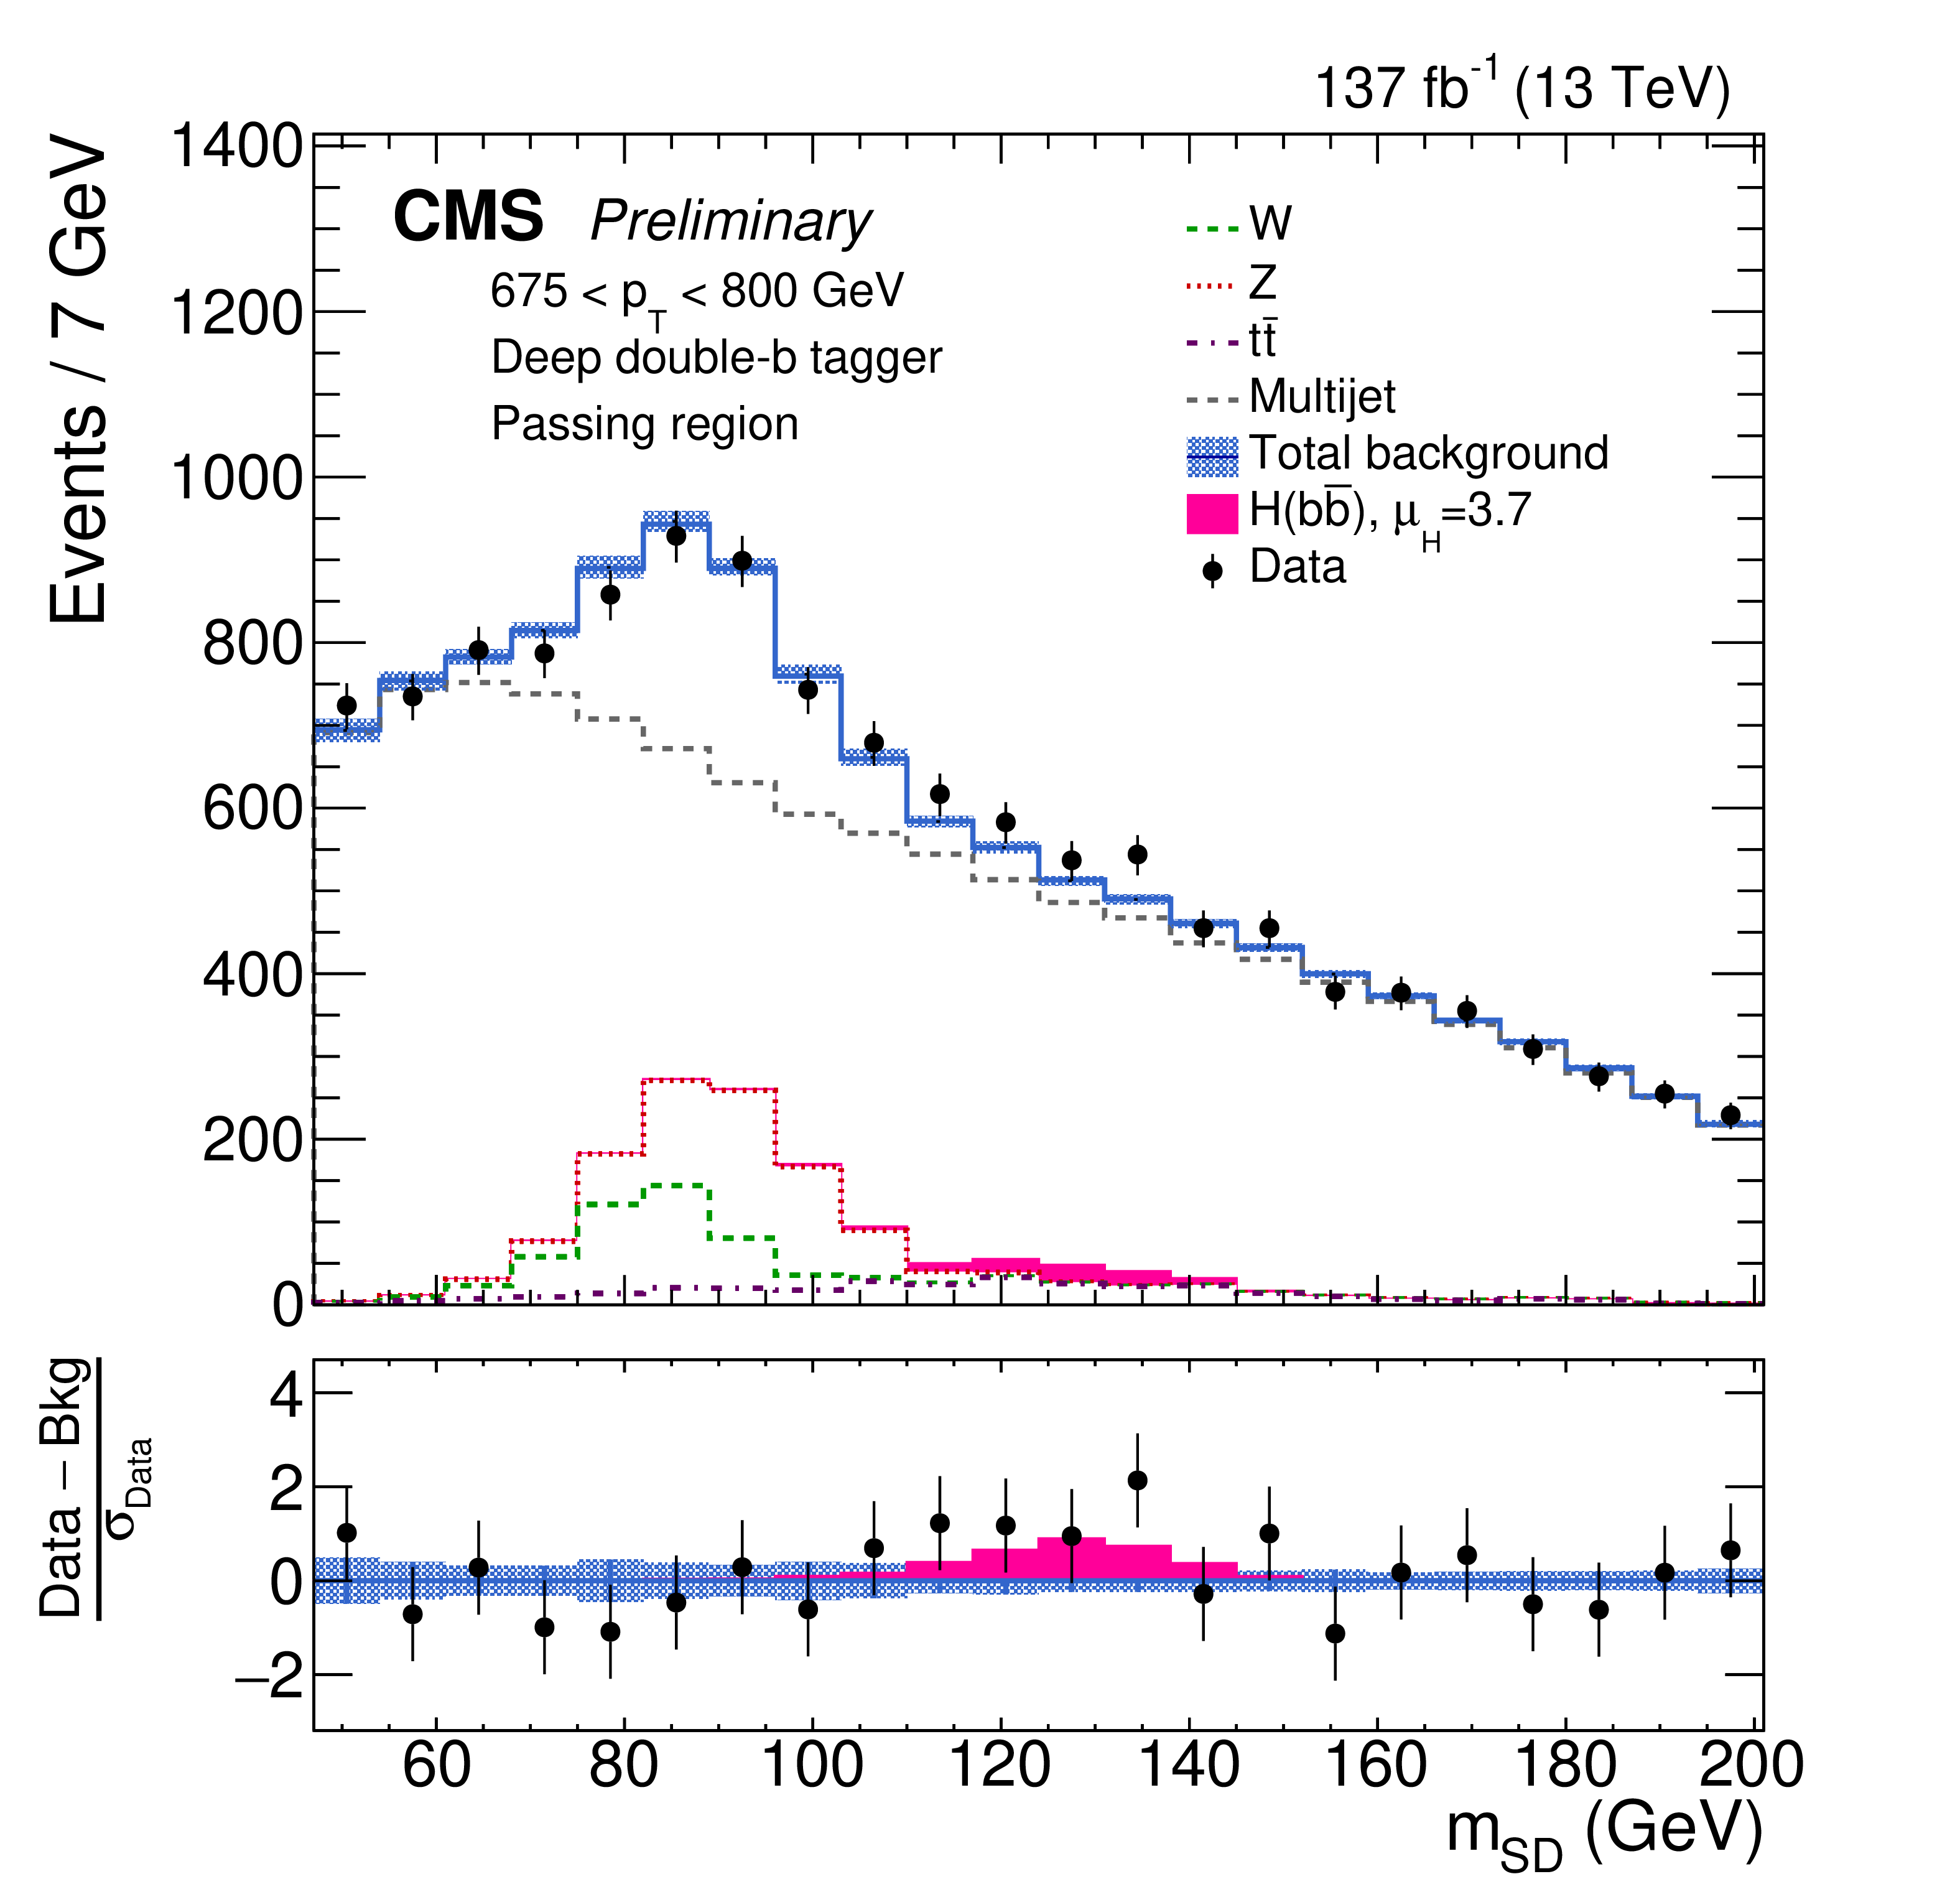
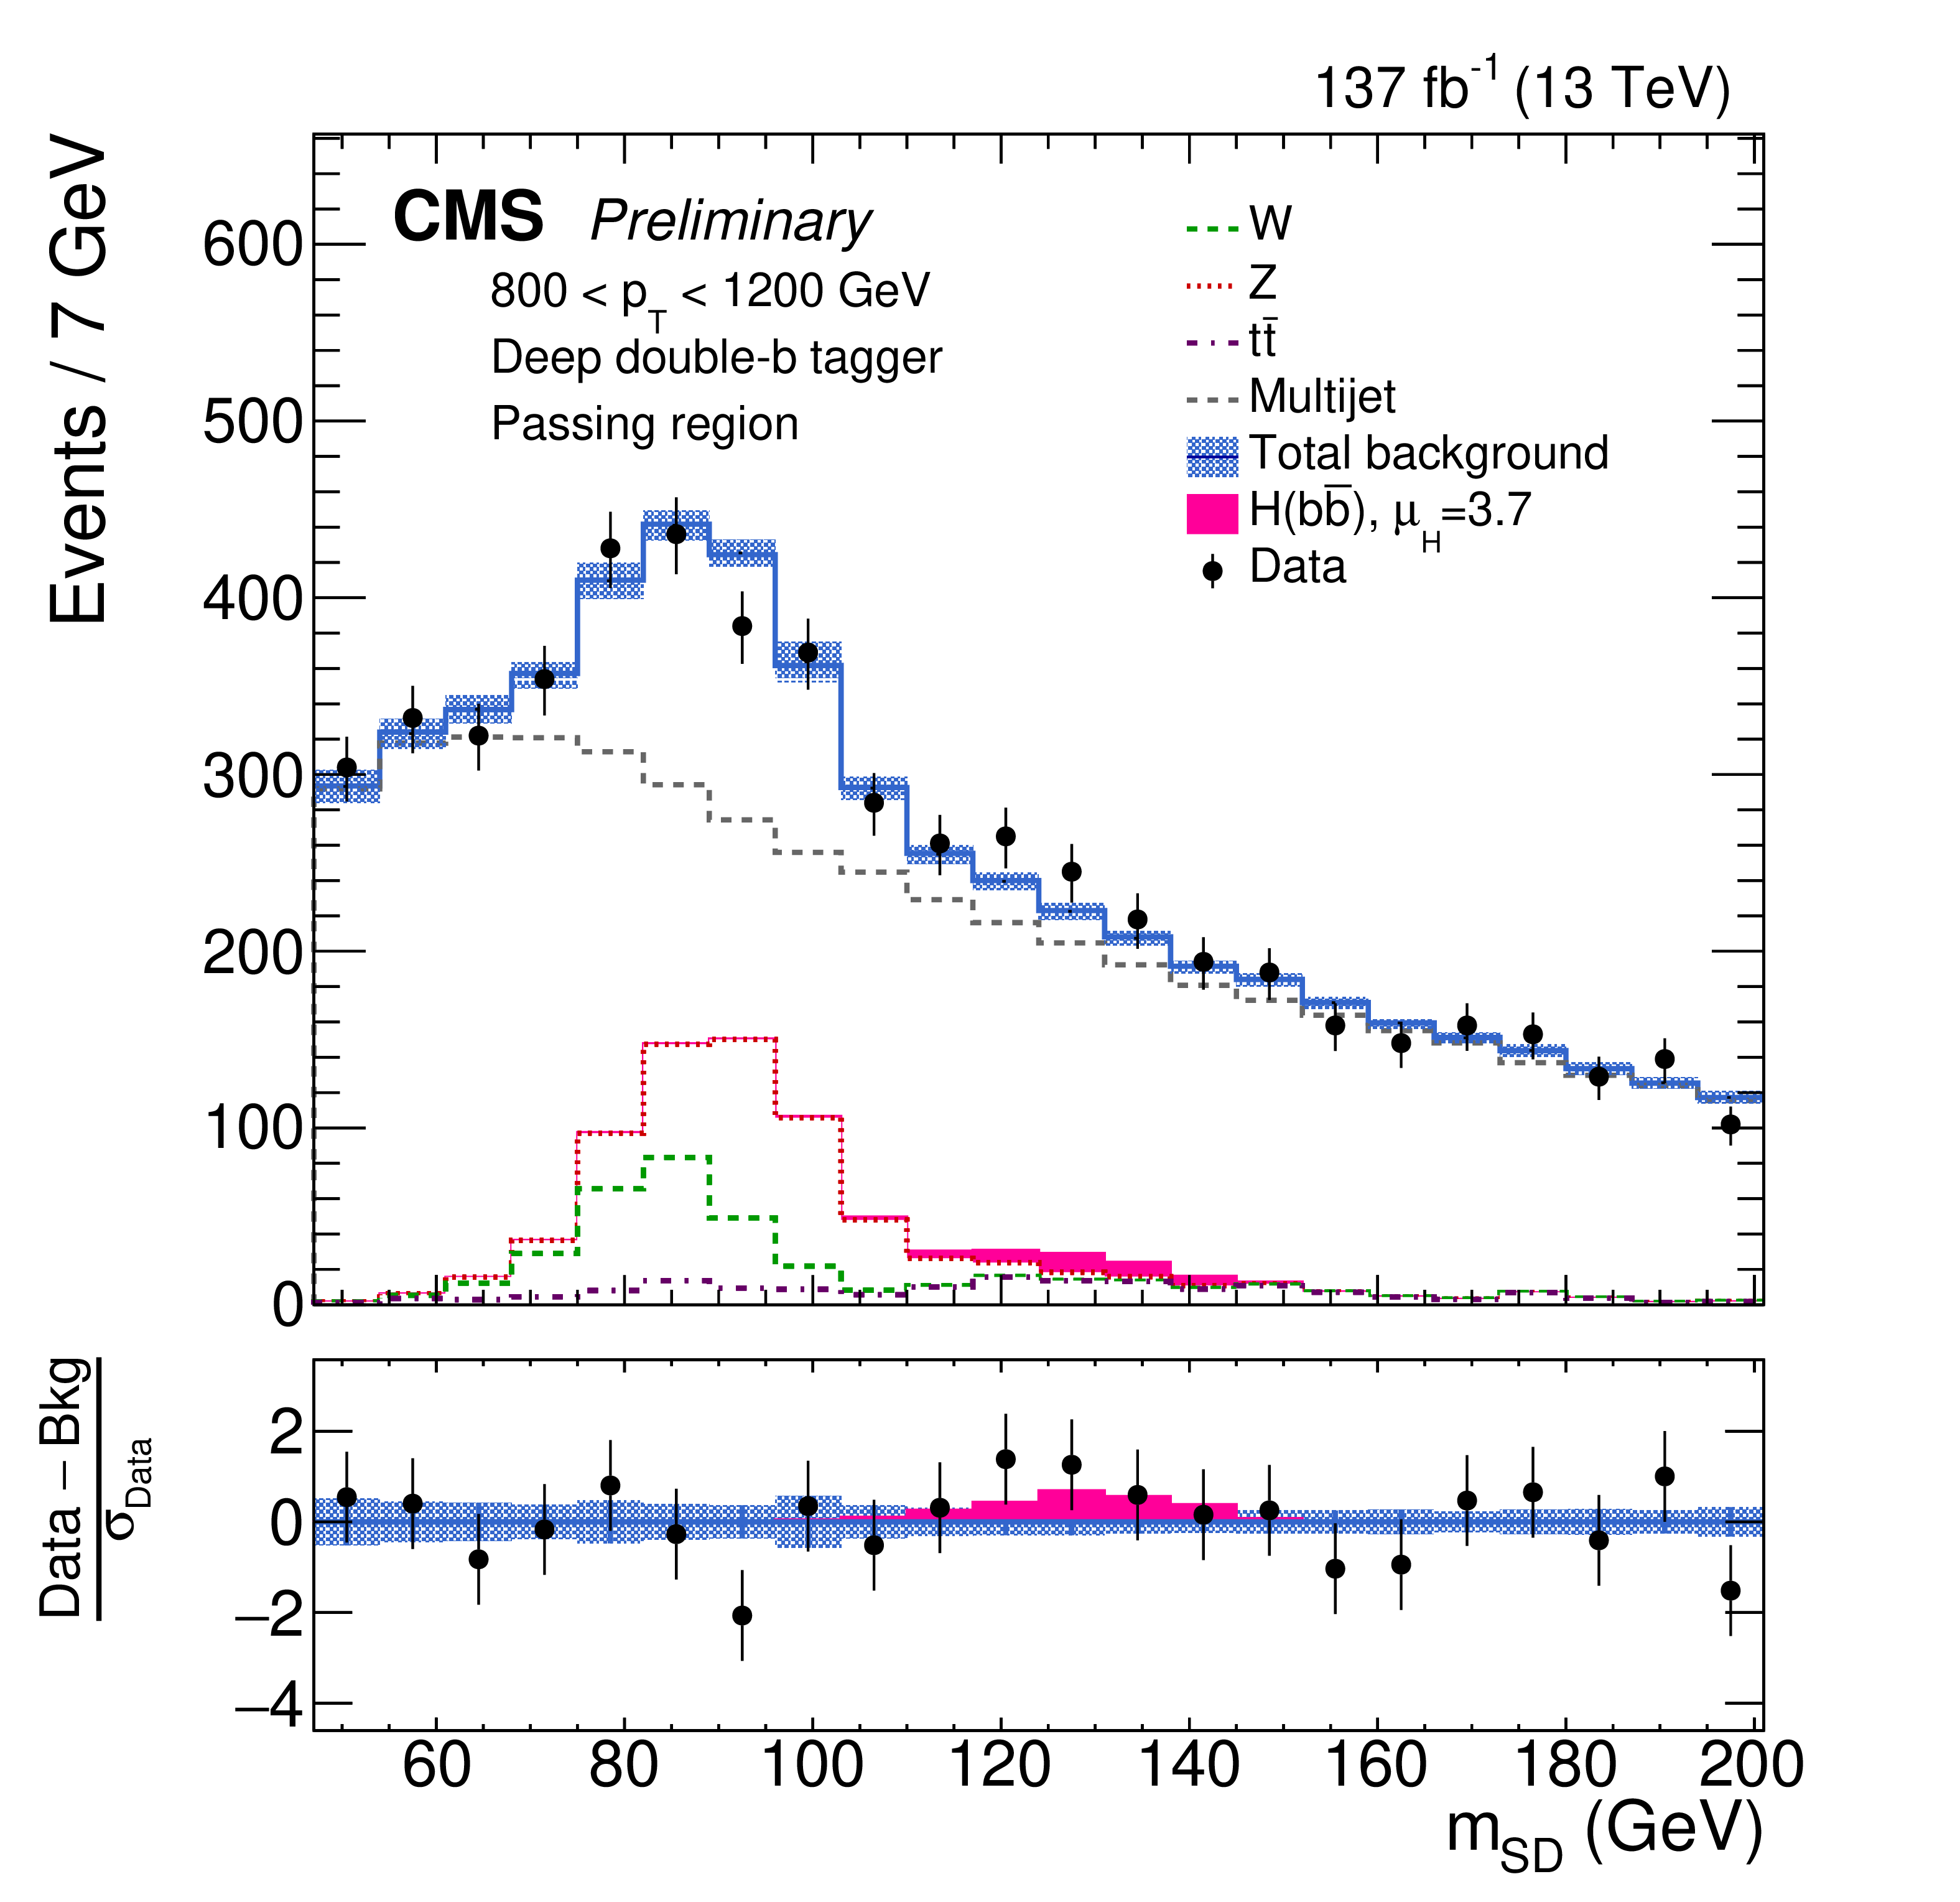
Figure 2:
The observed and fitted background $ {m_{\mathrm {SD}}} $ distributions in each $ {p_{\mathrm {T}}} $ category in the passing regions. The fit is performed under the signal-plus-background hypothesis with one inclusive $\mathrm{H} (\mathrm{b} {}\mathrm{\bar{b}} $) signal strength parameter floating in all the $ {p_{\mathrm {T}}} $ categories. The shaded blue band shows the systematic uncertainty in the total background prediction. The bottom panel shows the difference between the data and the total background prediction, divided by the statistical uncertainty in the data. |

png pdf |
Figure 2-a:
The observed and fitted background $ {m_{\mathrm {SD}}} $ distributions in each $ {p_{\mathrm {T}}} $ category in the passing regions. The fit is performed under the signal-plus-background hypothesis with one inclusive $\mathrm{H} (\mathrm{b} {}\mathrm{\bar{b}} $) signal strength parameter floating in all the $ {p_{\mathrm {T}}} $ categories. The shaded blue band shows the systematic uncertainty in the total background prediction. The bottom panel shows the difference between the data and the total background prediction, divided by the statistical uncertainty in the data. |
png pdf |
Figure 2-b:
The observed and fitted background $ {m_{\mathrm {SD}}} $ distributions in each $ {p_{\mathrm {T}}} $ category in the passing regions. The fit is performed under the signal-plus-background hypothesis with one inclusive $\mathrm{H} (\mathrm{b} {}\mathrm{\bar{b}} $) signal strength parameter floating in all the $ {p_{\mathrm {T}}} $ categories. The shaded blue band shows the systematic uncertainty in the total background prediction. The bottom panel shows the difference between the data and the total background prediction, divided by the statistical uncertainty in the data. |
png pdf |
Figure 2-c:
The observed and fitted background $ {m_{\mathrm {SD}}} $ distributions in each $ {p_{\mathrm {T}}} $ category in the passing regions. The fit is performed under the signal-plus-background hypothesis with one inclusive $\mathrm{H} (\mathrm{b} {}\mathrm{\bar{b}} $) signal strength parameter floating in all the $ {p_{\mathrm {T}}} $ categories. The shaded blue band shows the systematic uncertainty in the total background prediction. The bottom panel shows the difference between the data and the total background prediction, divided by the statistical uncertainty in the data. |

png pdf |
Figure 2-d:
The observed and fitted background $ {m_{\mathrm {SD}}} $ distributions in each $ {p_{\mathrm {T}}} $ category in the passing regions. The fit is performed under the signal-plus-background hypothesis with one inclusive $\mathrm{H} (\mathrm{b} {}\mathrm{\bar{b}} $) signal strength parameter floating in all the $ {p_{\mathrm {T}}} $ categories. The shaded blue band shows the systematic uncertainty in the total background prediction. The bottom panel shows the difference between the data and the total background prediction, divided by the statistical uncertainty in the data. |
png pdf |
Figure 2-e:
The observed and fitted background $ {m_{\mathrm {SD}}} $ distributions in each $ {p_{\mathrm {T}}} $ category in the passing regions. The fit is performed under the signal-plus-background hypothesis with one inclusive $\mathrm{H} (\mathrm{b} {}\mathrm{\bar{b}} $) signal strength parameter floating in all the $ {p_{\mathrm {T}}} $ categories. The shaded blue band shows the systematic uncertainty in the total background prediction. The bottom panel shows the difference between the data and the total background prediction, divided by the statistical uncertainty in the data. |
png pdf |
Figure 2-f:
The observed and fitted background $ {m_{\mathrm {SD}}} $ distributions in each $ {p_{\mathrm {T}}} $ category in the passing regions. The fit is performed under the signal-plus-background hypothesis with one inclusive $\mathrm{H} (\mathrm{b} {}\mathrm{\bar{b}} $) signal strength parameter floating in all the $ {p_{\mathrm {T}}} $ categories. The shaded blue band shows the systematic uncertainty in the total background prediction. The bottom panel shows the difference between the data and the total background prediction, divided by the statistical uncertainty in the data. |
png pdf |
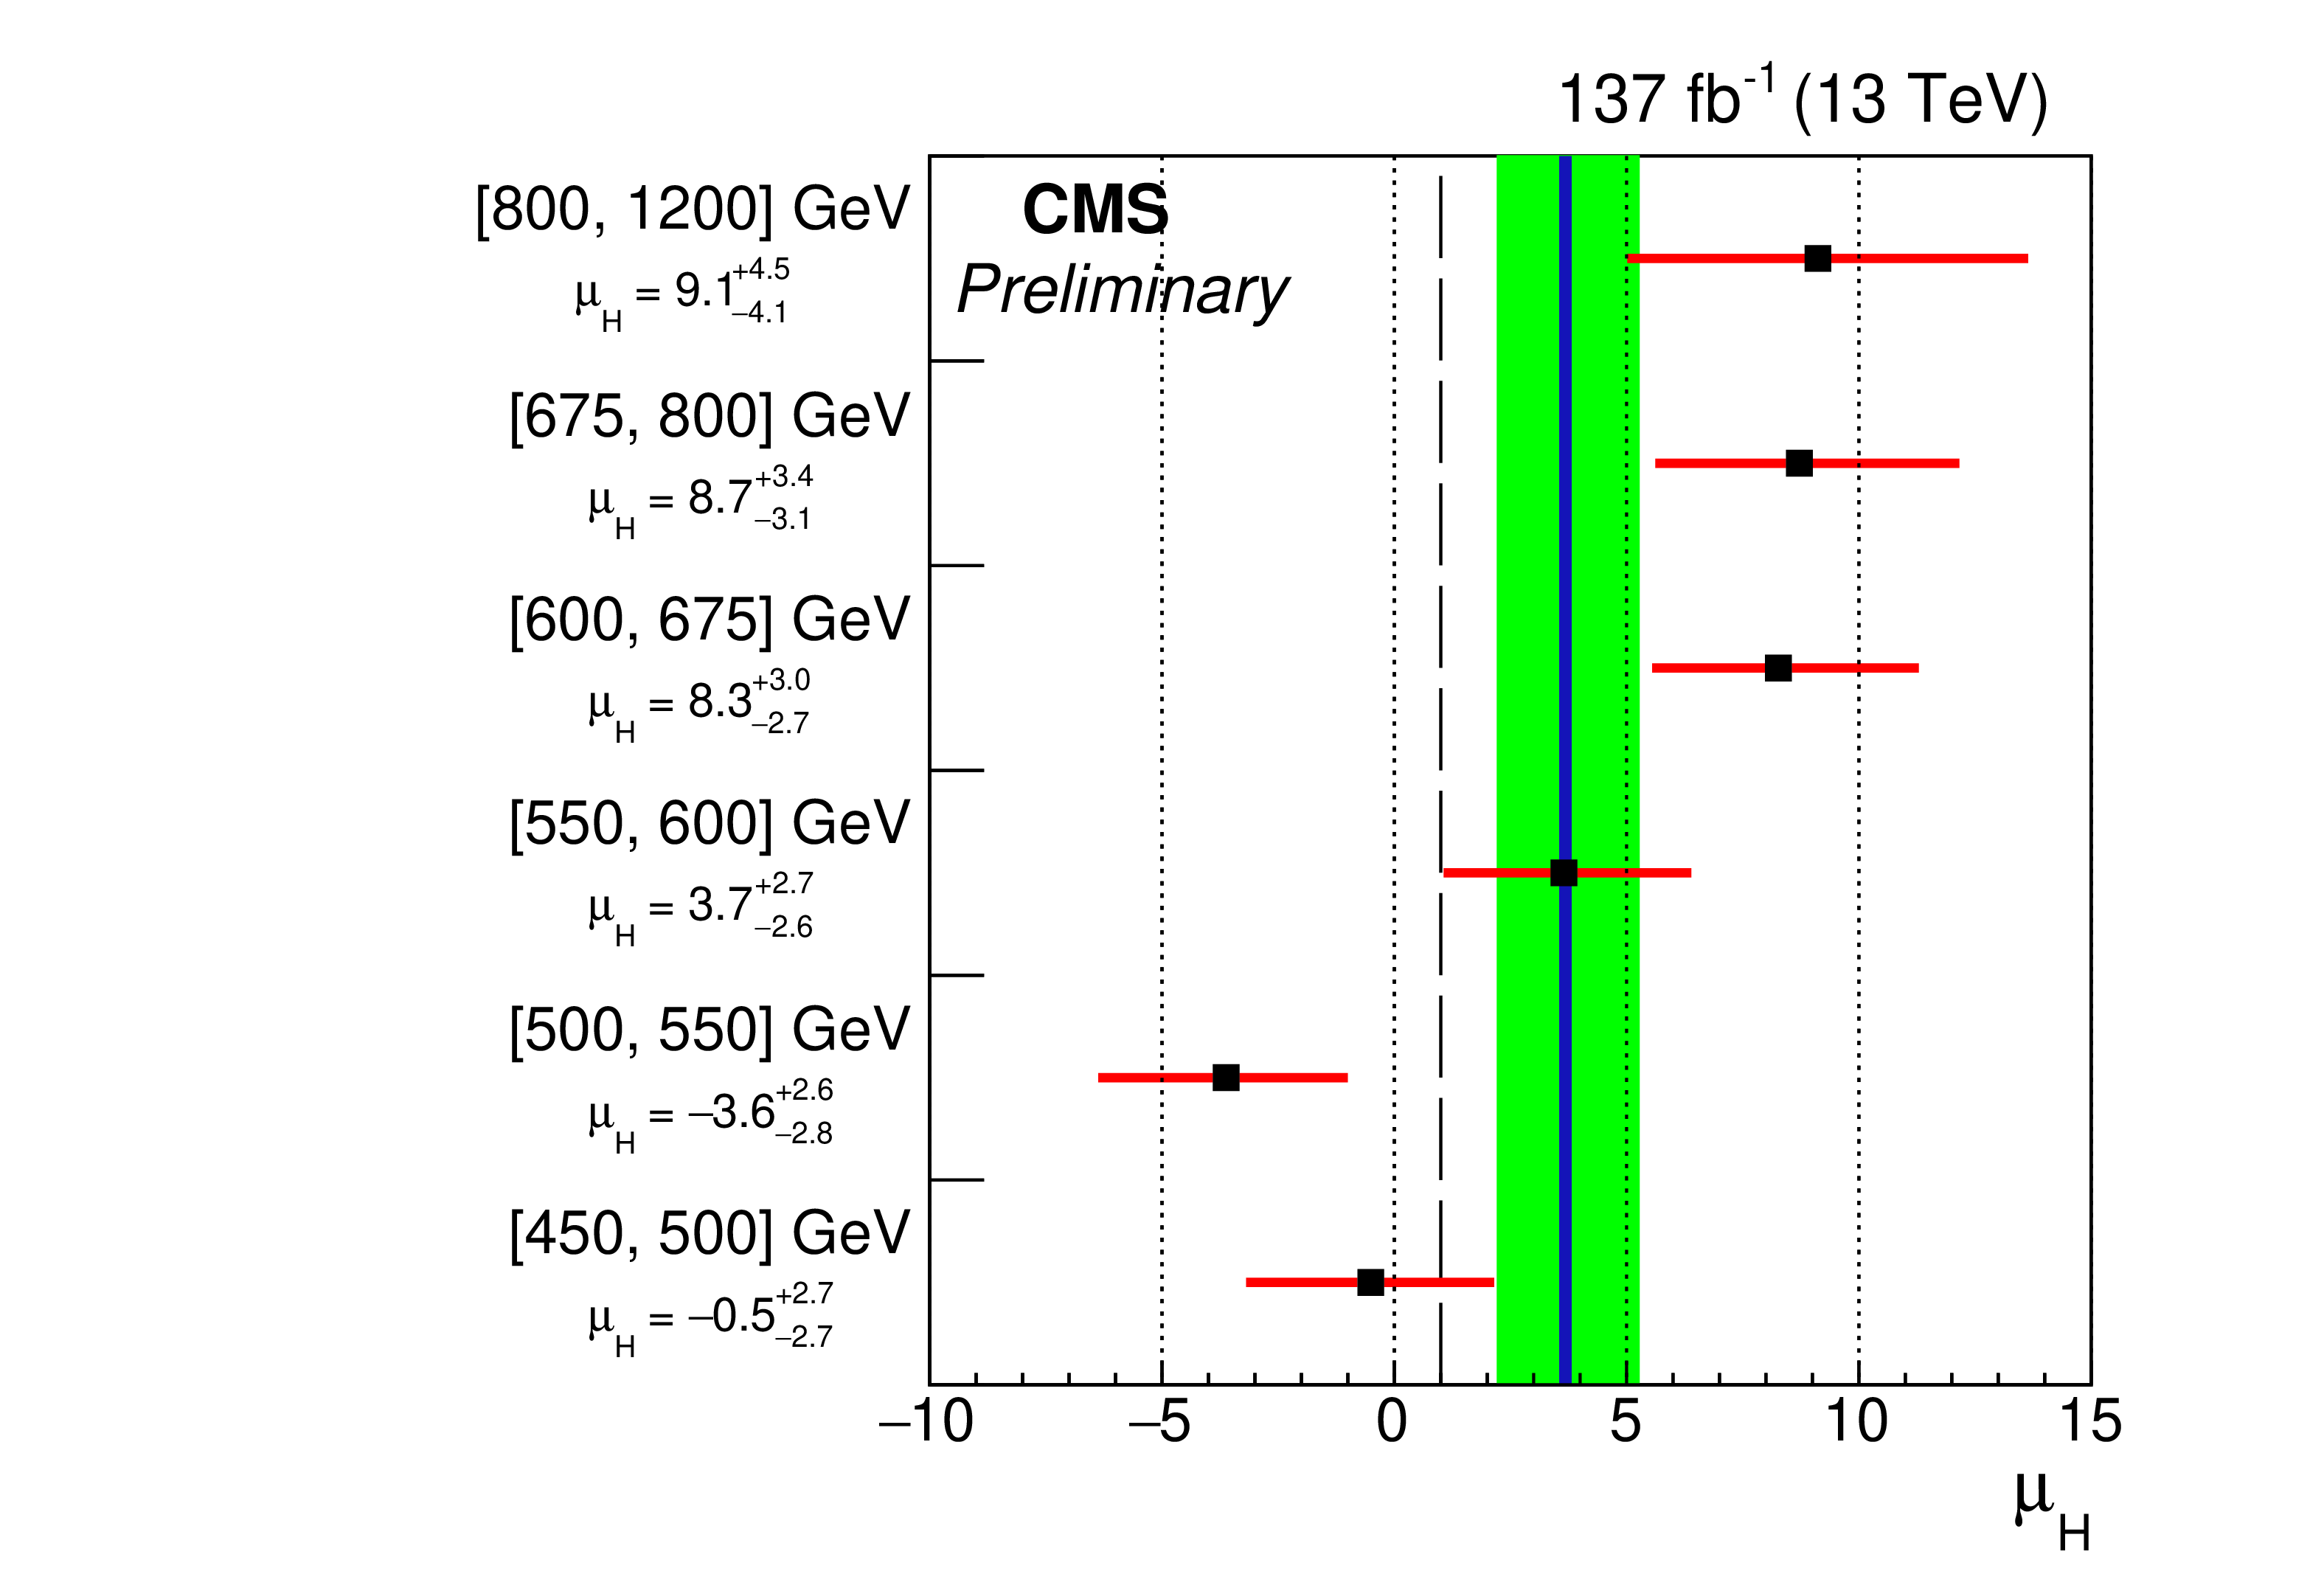
Figure 3:
The best-fit signal strength $\mu _{\mathrm{H}}$ (black squares) and uncertainty (red lines) per $ {p_{\mathrm {T}}} $ category based on the {HJ-MiNLO} [21,22] prediction. The dashed black line indicates the SM expectation. The solid blue line and green band represents the combined best-fit signal strength and uncertainty, respectively, of $\mu _{\mathrm{H}} = {3.68} _{- {1.46}}^{+ {1.58}}$ extracted from a simultaneous fit of all channels. |
png pdf |
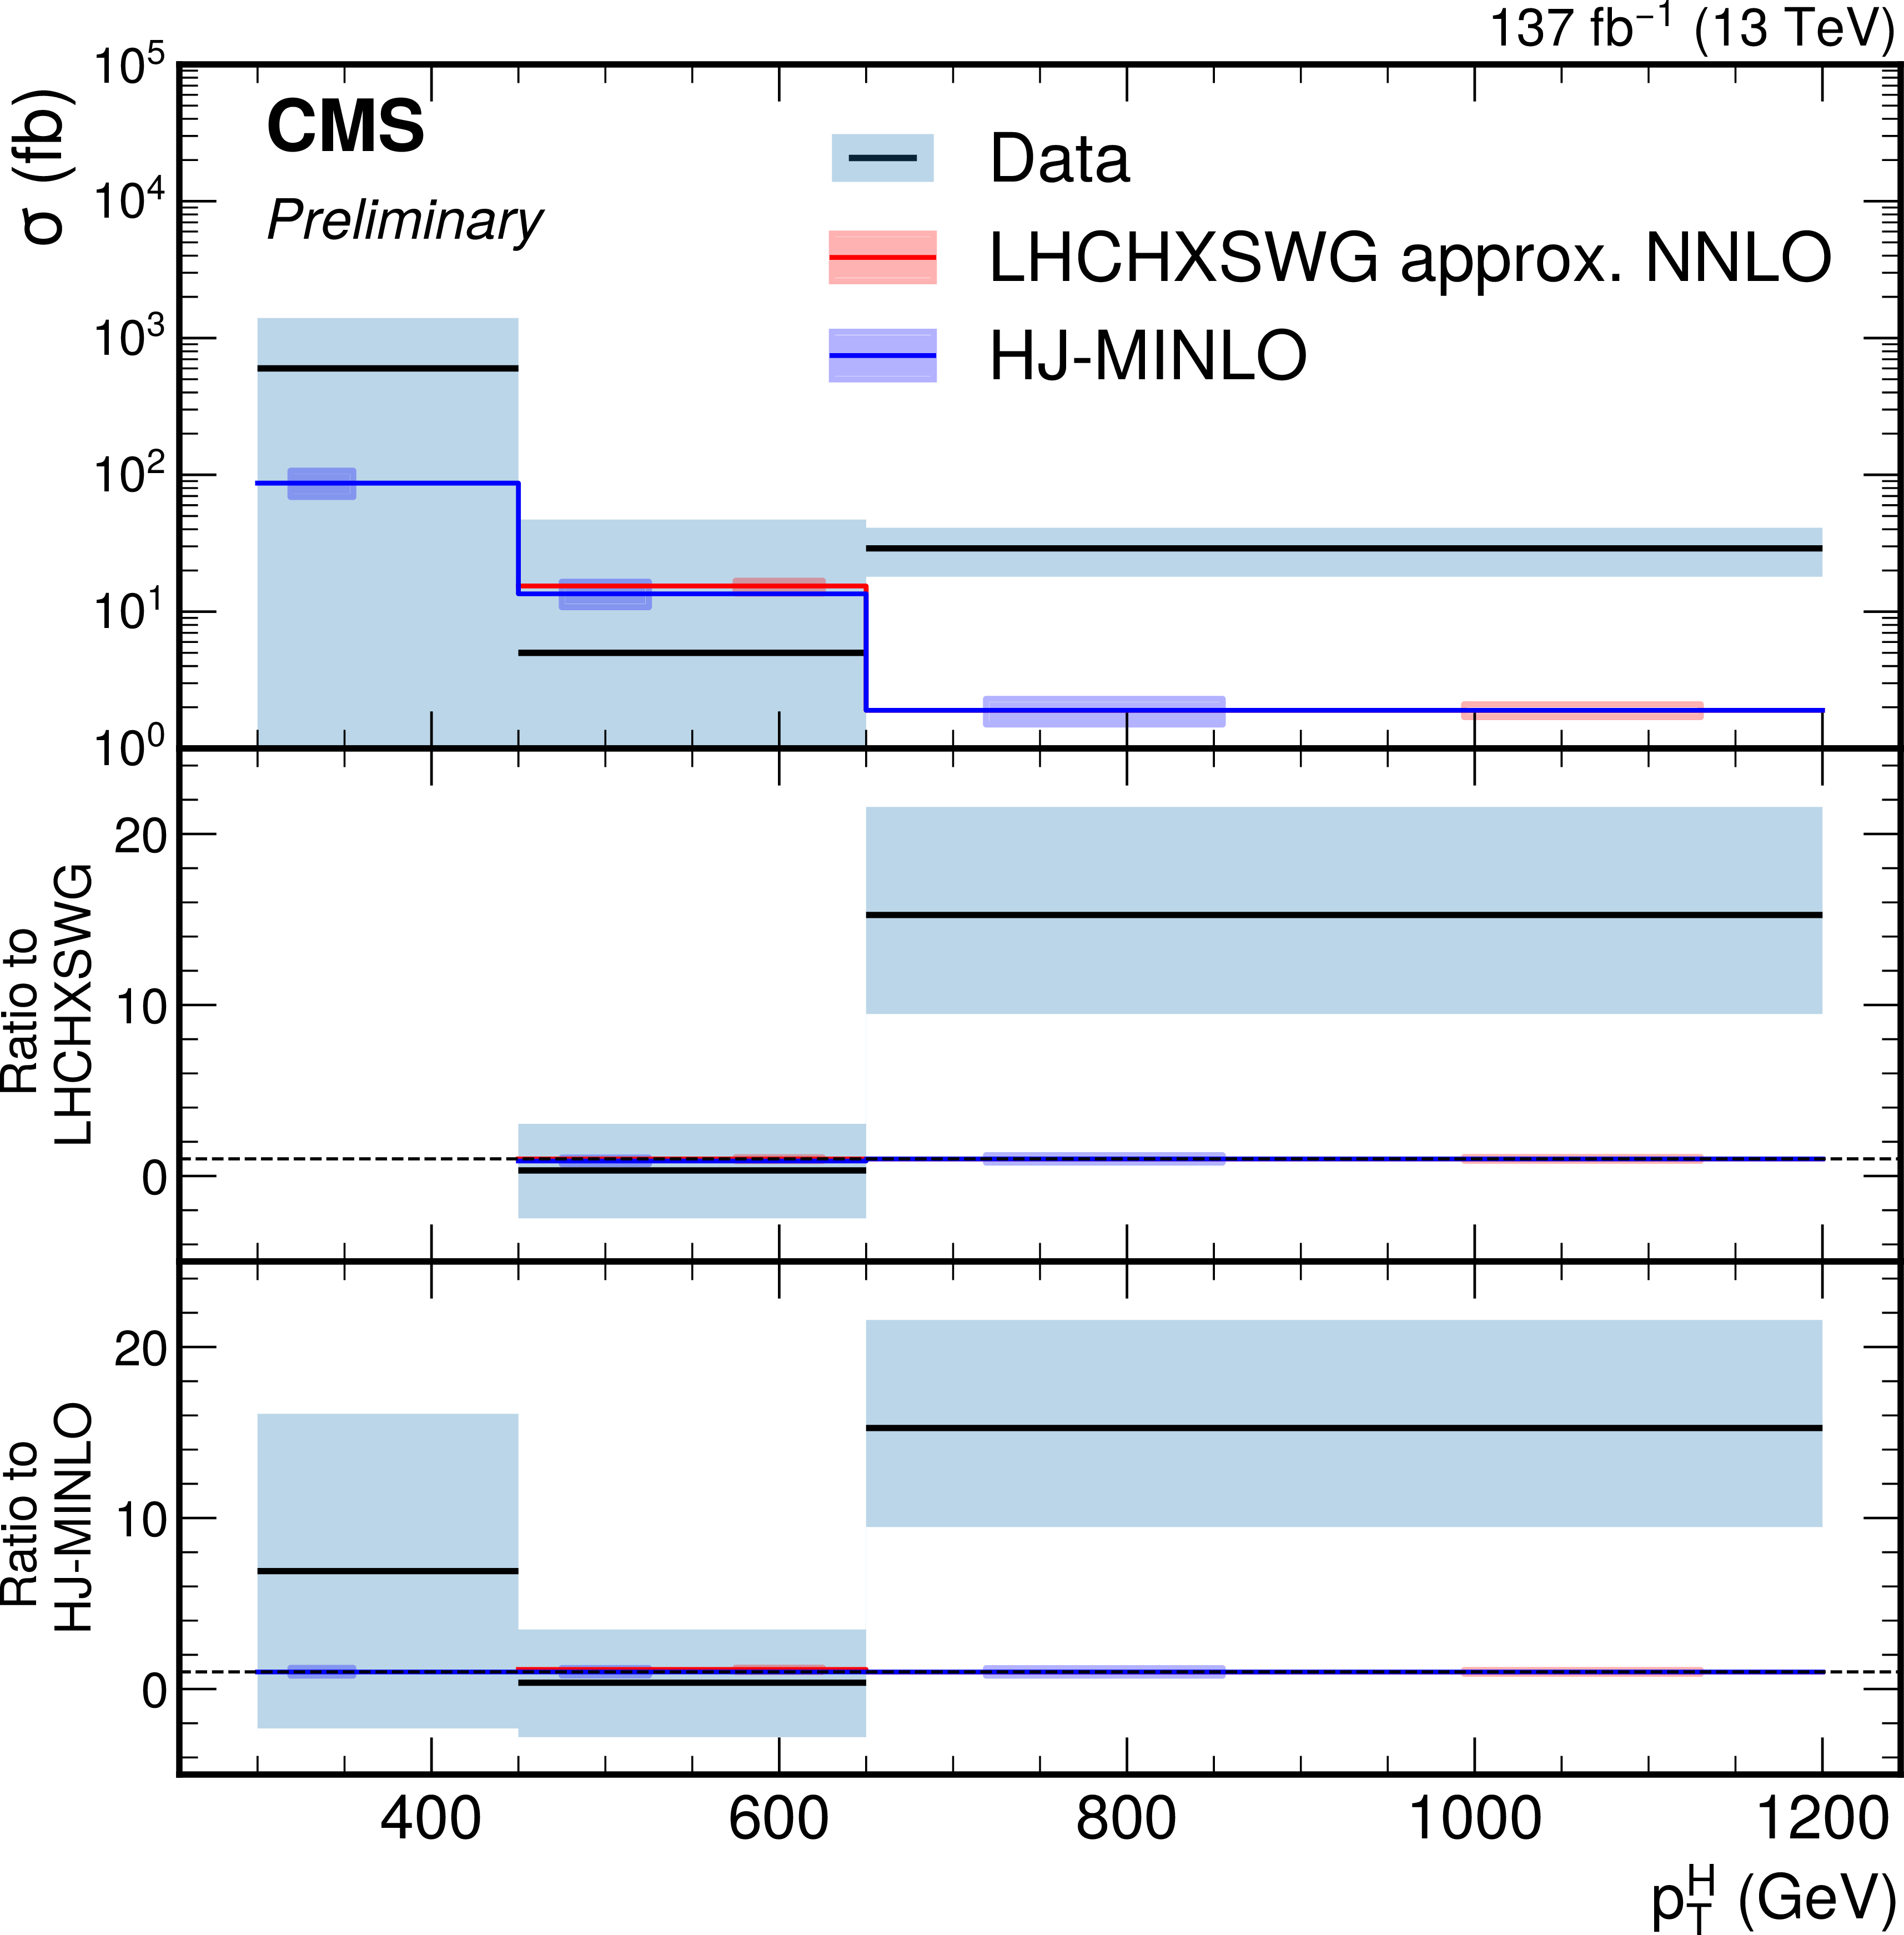
Figure 4:
Measured differential fiducial cross section as a function of Higgs boson $ {p_{\mathrm {T}}} $, in comparison to the predictions of Ref. [22], shown in red, and {HJ-MiNLO} [21], shown in blue. The two predictions are nearly identical. In the bottom two panels, the dotted line corresponds to a ratio of one. The measured cross section uncertainty in the first bin is larger because of limited acceptance. The cross section measurements in the first and second bins have a mild anti-correlation, primarily due to jet energy scale uncertainties, which inflates the corresponding uncertainties. The observed cross section in the third bin has a smaller relative uncertainty than that in the second bin because of the larger magnitude of the central value in that bin. The relative uncertainties in the predictions of Ref. [22] and {HJ-MiNLO} are approximately 10% and 20%, respectively. |
| Tables | |
png pdf |
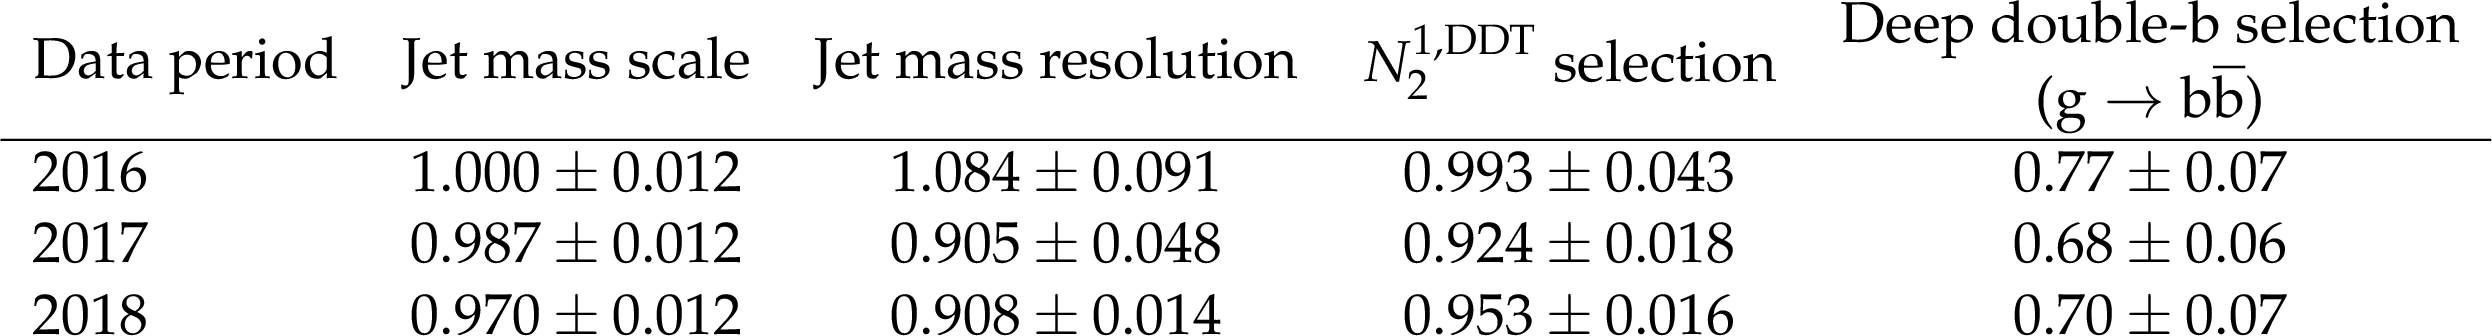
Table 1:
Summary of measured data-to-simulation scale factors for jet mass scale, jet mass resolution, $ {N_{2}^{1\mathrm {,DDT}}} $ selection, and deep double-$\mathrm{b} $ selection for different data taking periods. |
png pdf |
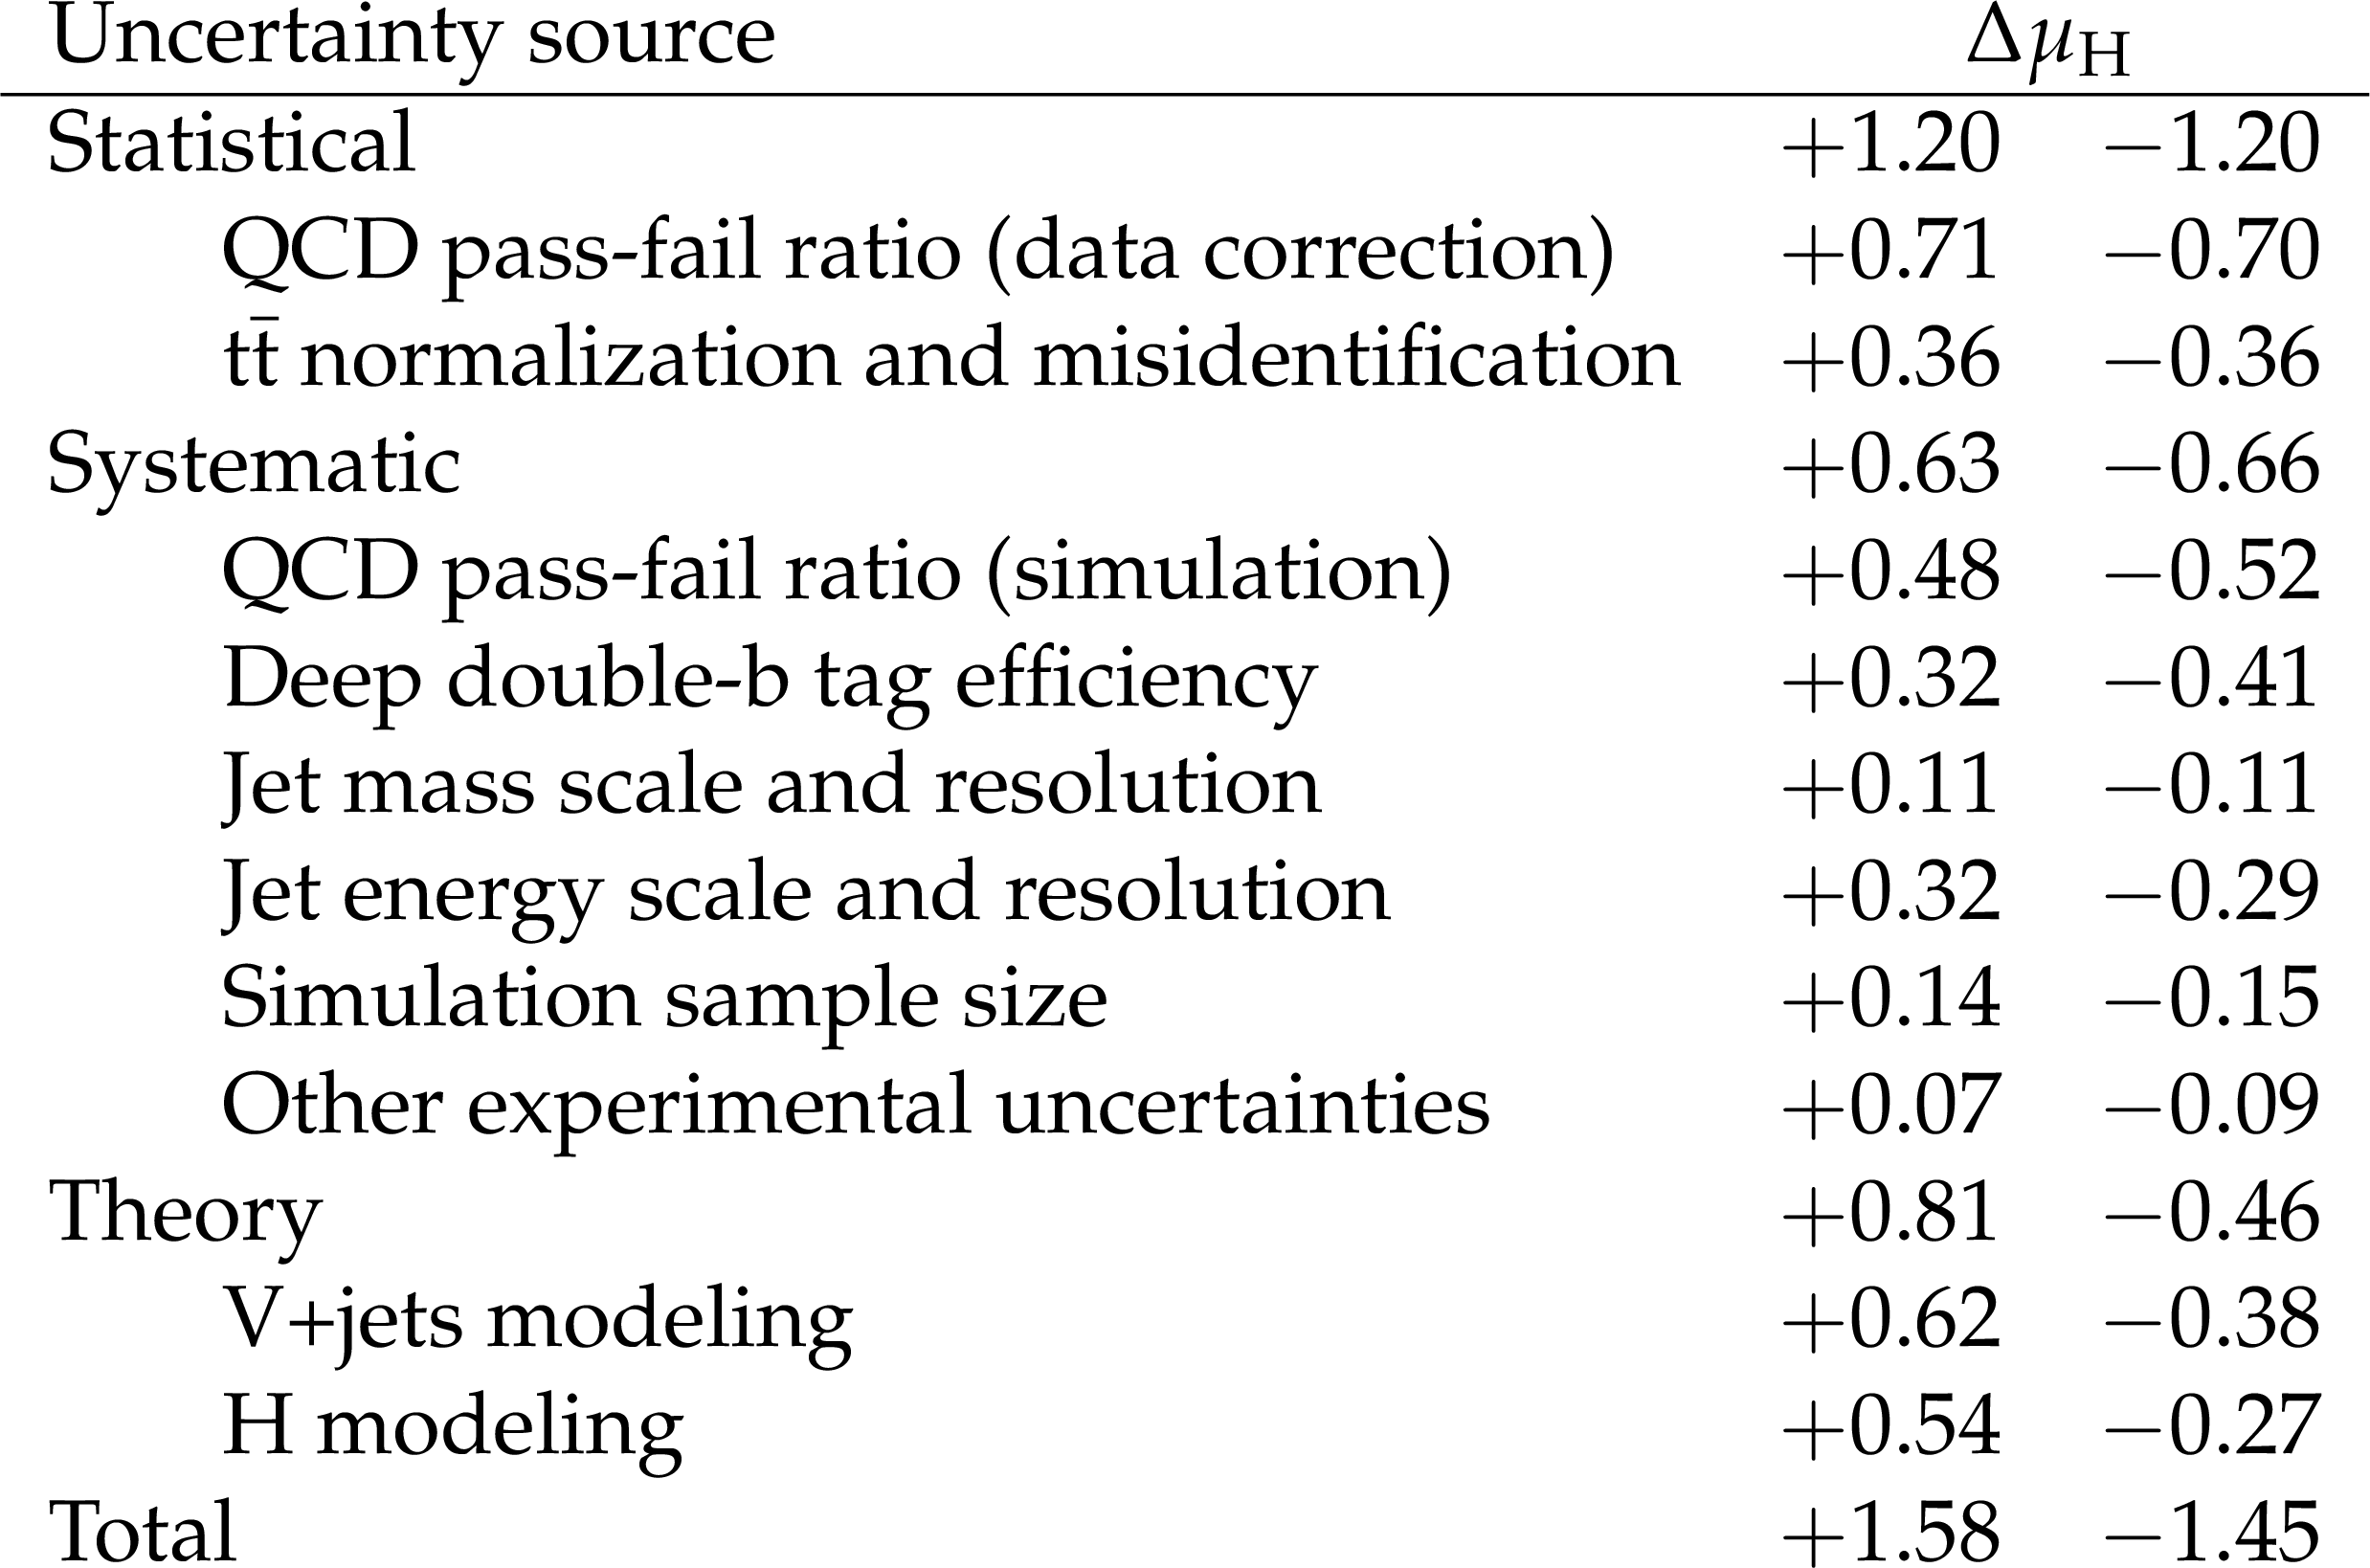
Table 2:
Major sources of uncertainty in the measurement of the signal strength $\mu _{\mathrm{H}}$ based on the {HJ-MiNLO} prediction, and their observed impact ($\Delta \mu _{\mathrm{H}}$) from a fit to the combined data set, are listed. The total uncertainty is separated into three components: statistical, systematic, and theory. Detailed decompositions of the statistical, systematic, and theory components are specified. The impact of each uncertainty is evaluated considering only that source. The sum in quadrature for each source does not in general equal the total uncertainty of each component because of correlations in the combined fit between nuisance parameters in different sources. |
png pdf |
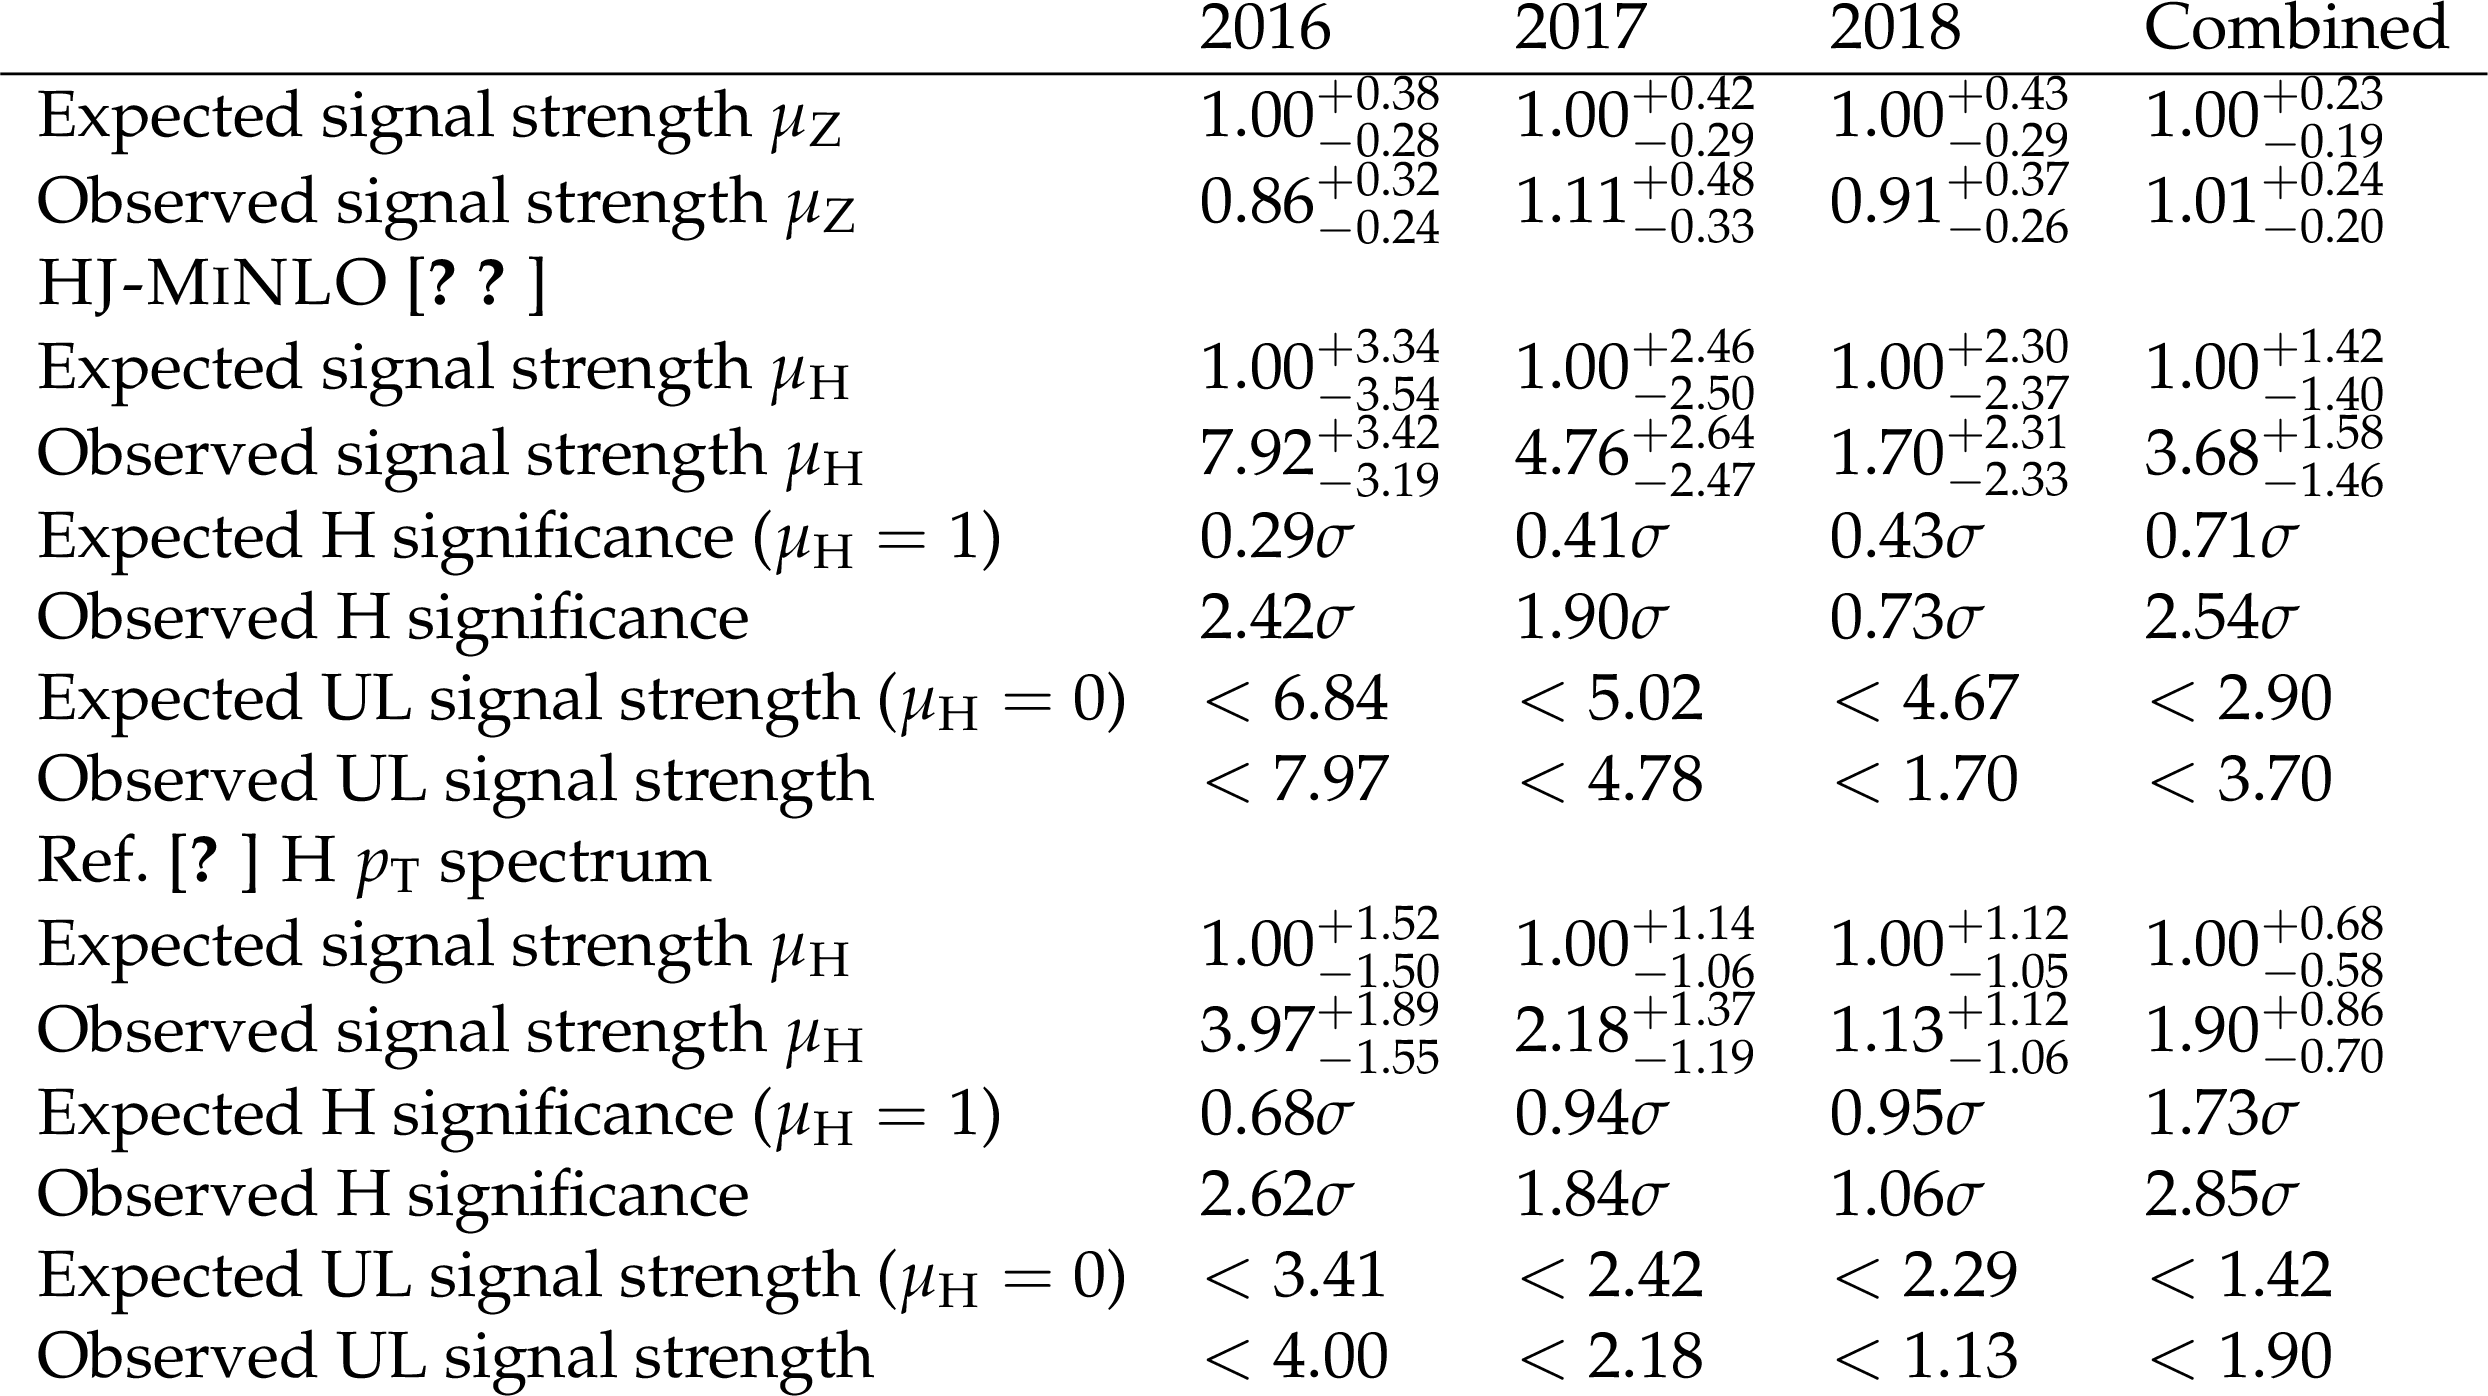
Table 3:
Fitted signal strength, expected and observed significance of the Higgs and Z boson signals. The Higgs boson results are presented with two gluon fusion signal models, one using the nominal {HJ-MiNLO} sample and the other simulated with the same procedure described in Ref. [16]. The 95% confidence level upper limit (UL) on the Higgs boson signal strength is also listed. In the results for the Higgs boson, the Z boson yield is fixed to the SM prediction value with the corresponding theoretical uncertainties to better constrain in situ the data-to-simulation scale factor of the deep double-$\mathrm{b} $ tagger. For the expected and observed signal strength of the Z boson, the Higgs boson signal strength is freely floating. |
png pdf |
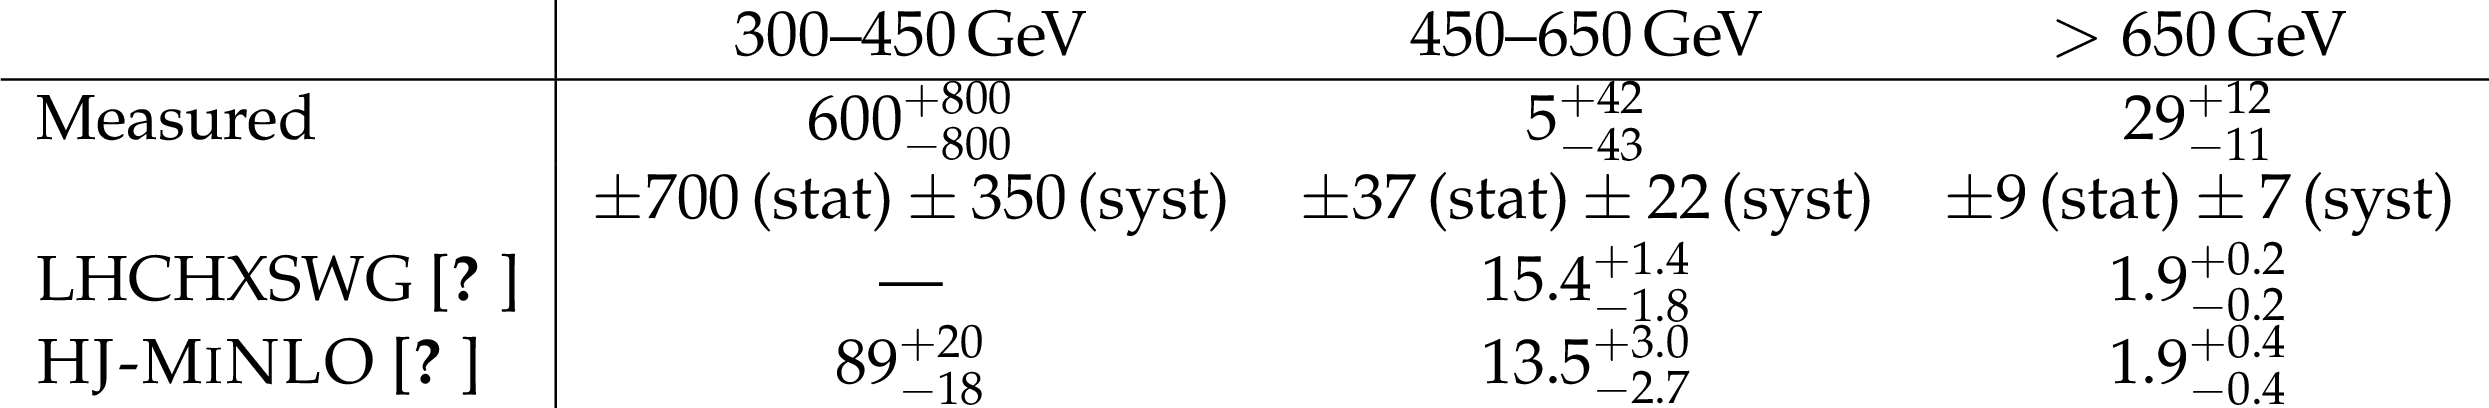
Table 4:
Measured and predicted differential fiducial cross section as a function of Higgs boson $ {p_{\mathrm {T}}} $. All cross sections are in units of fb. |
png pdf |
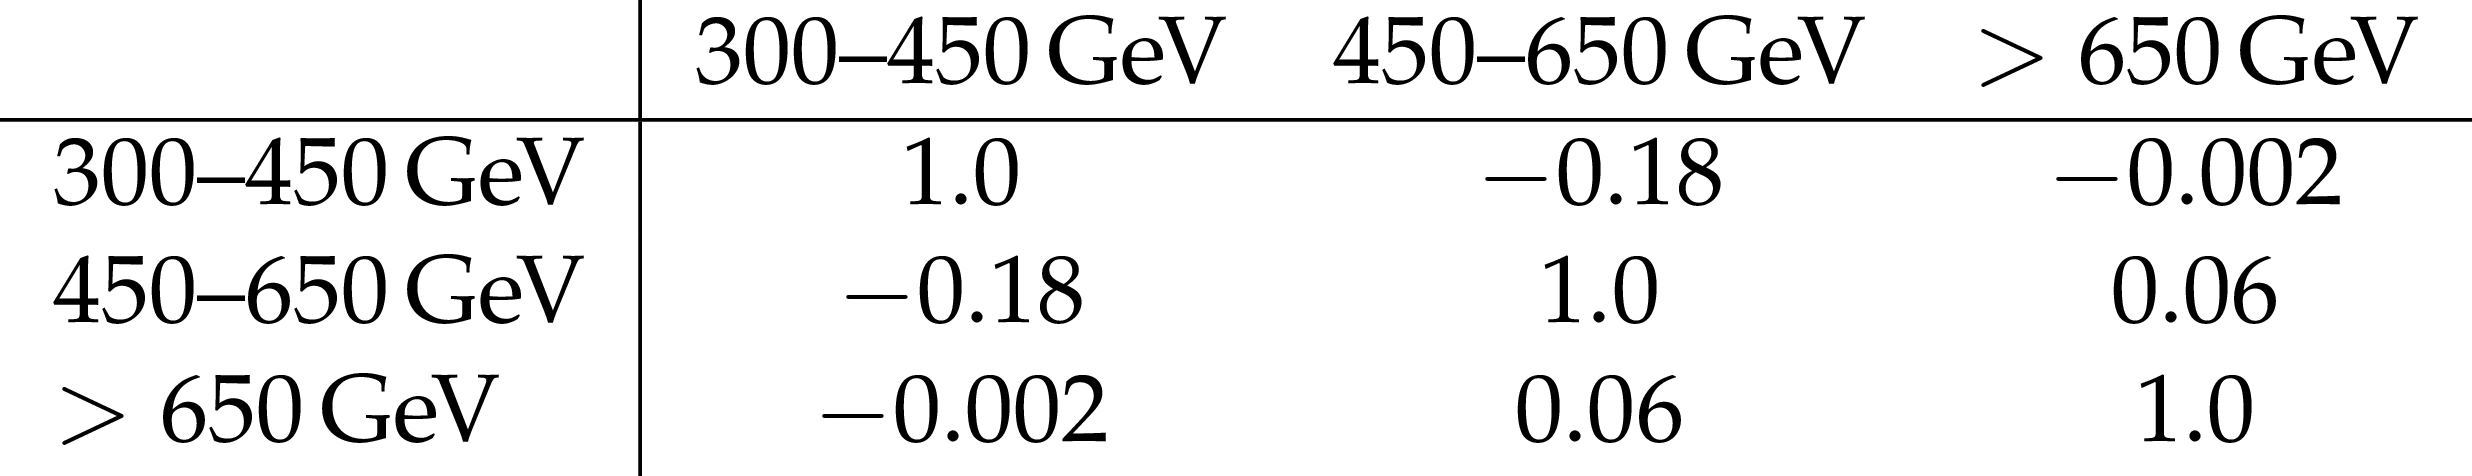
Table 5:
Correlation coefficients between the three $ {p_{\mathrm {T}}} ^{\mathrm{H}}$ bins of the unfolded Higgs boson differential cross section measurement. |
| Summary |
| An inclusive search for the standard model Higgs boson decaying to bottom quark-antiquark pairs and reconstructed as a single, large-radius jet with ${p_{\mathrm{T}}} > $ 450 GeV has been presented. The search uses a data sample of proton-proton collisions at $\sqrt{s} = $ 13 TeV corresponding to an integrated luminosity of 137 fb$^{-1}$. The Z+jets process is used to validate the method and is measured to be consistent with the standard model prediction. The Higgs boson signal strength is measured to be $\mu_{\mathrm{H}} = $ 3.68 $\pm$ 1.20 (stat) $_{-{0.66} }^{+{0.63}}$ (syst) $_{-{0.46} }^{+{0.81} }$ (theo) $=$ 3.68$ _{-{1.46} }^{+{1.58} }$ based on the theoretical prediction from the HJMINLO generator. The measured signal strength corresponds to an observed significance of 2.54$ \sigma$ with respect to the background-only hypothesis, where the expected significance of the standard model signal is 0.71$\sigma$. The significance of the observed excess with respect to the standard model expectation is 1.85$ \sigma$. With respect to the previous CMS result, the relative precision of the Higgs boson signal strength measurement improves by approximately a factor of two because of the increased integrated luminosity, improved b tagging based on a deep neural network, and smaller theoretical uncertainties. Finally, the differential cross section for the Higgs boson transverse momentum in the phase space regions recommended by the LHC simplified template cross section framework has also been presented. |
| Additional Figures | |

png pdf |
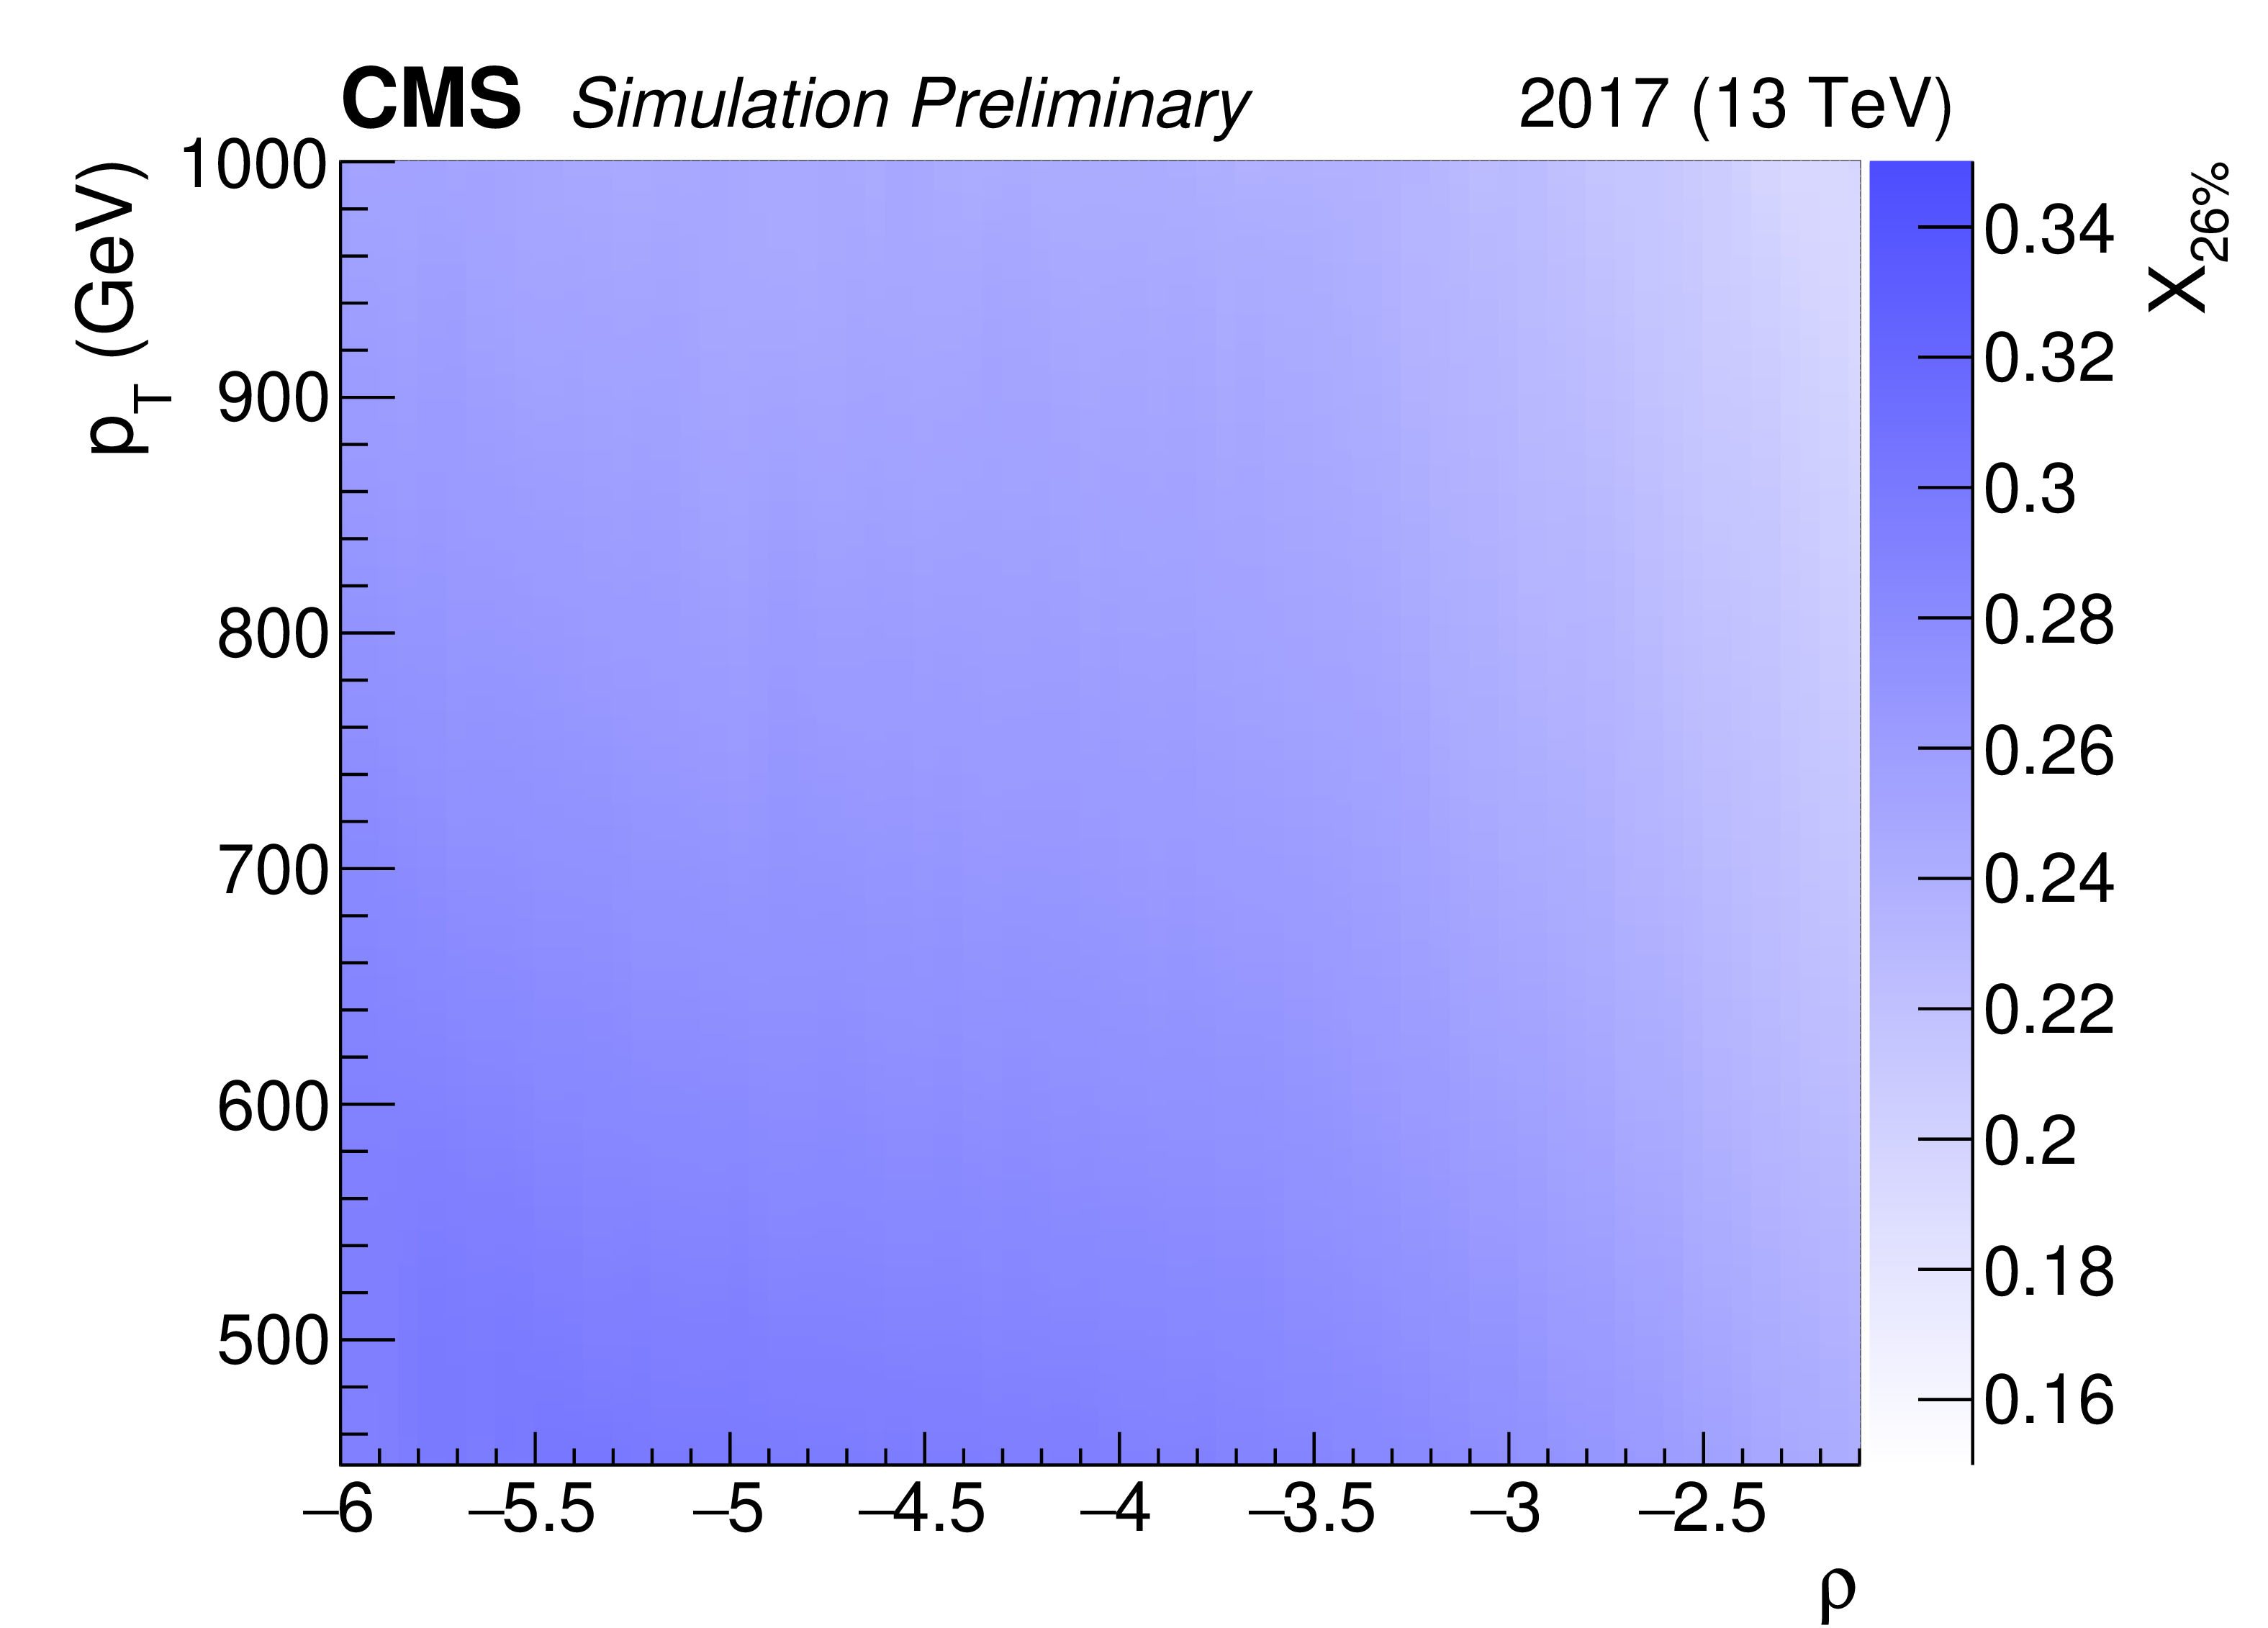
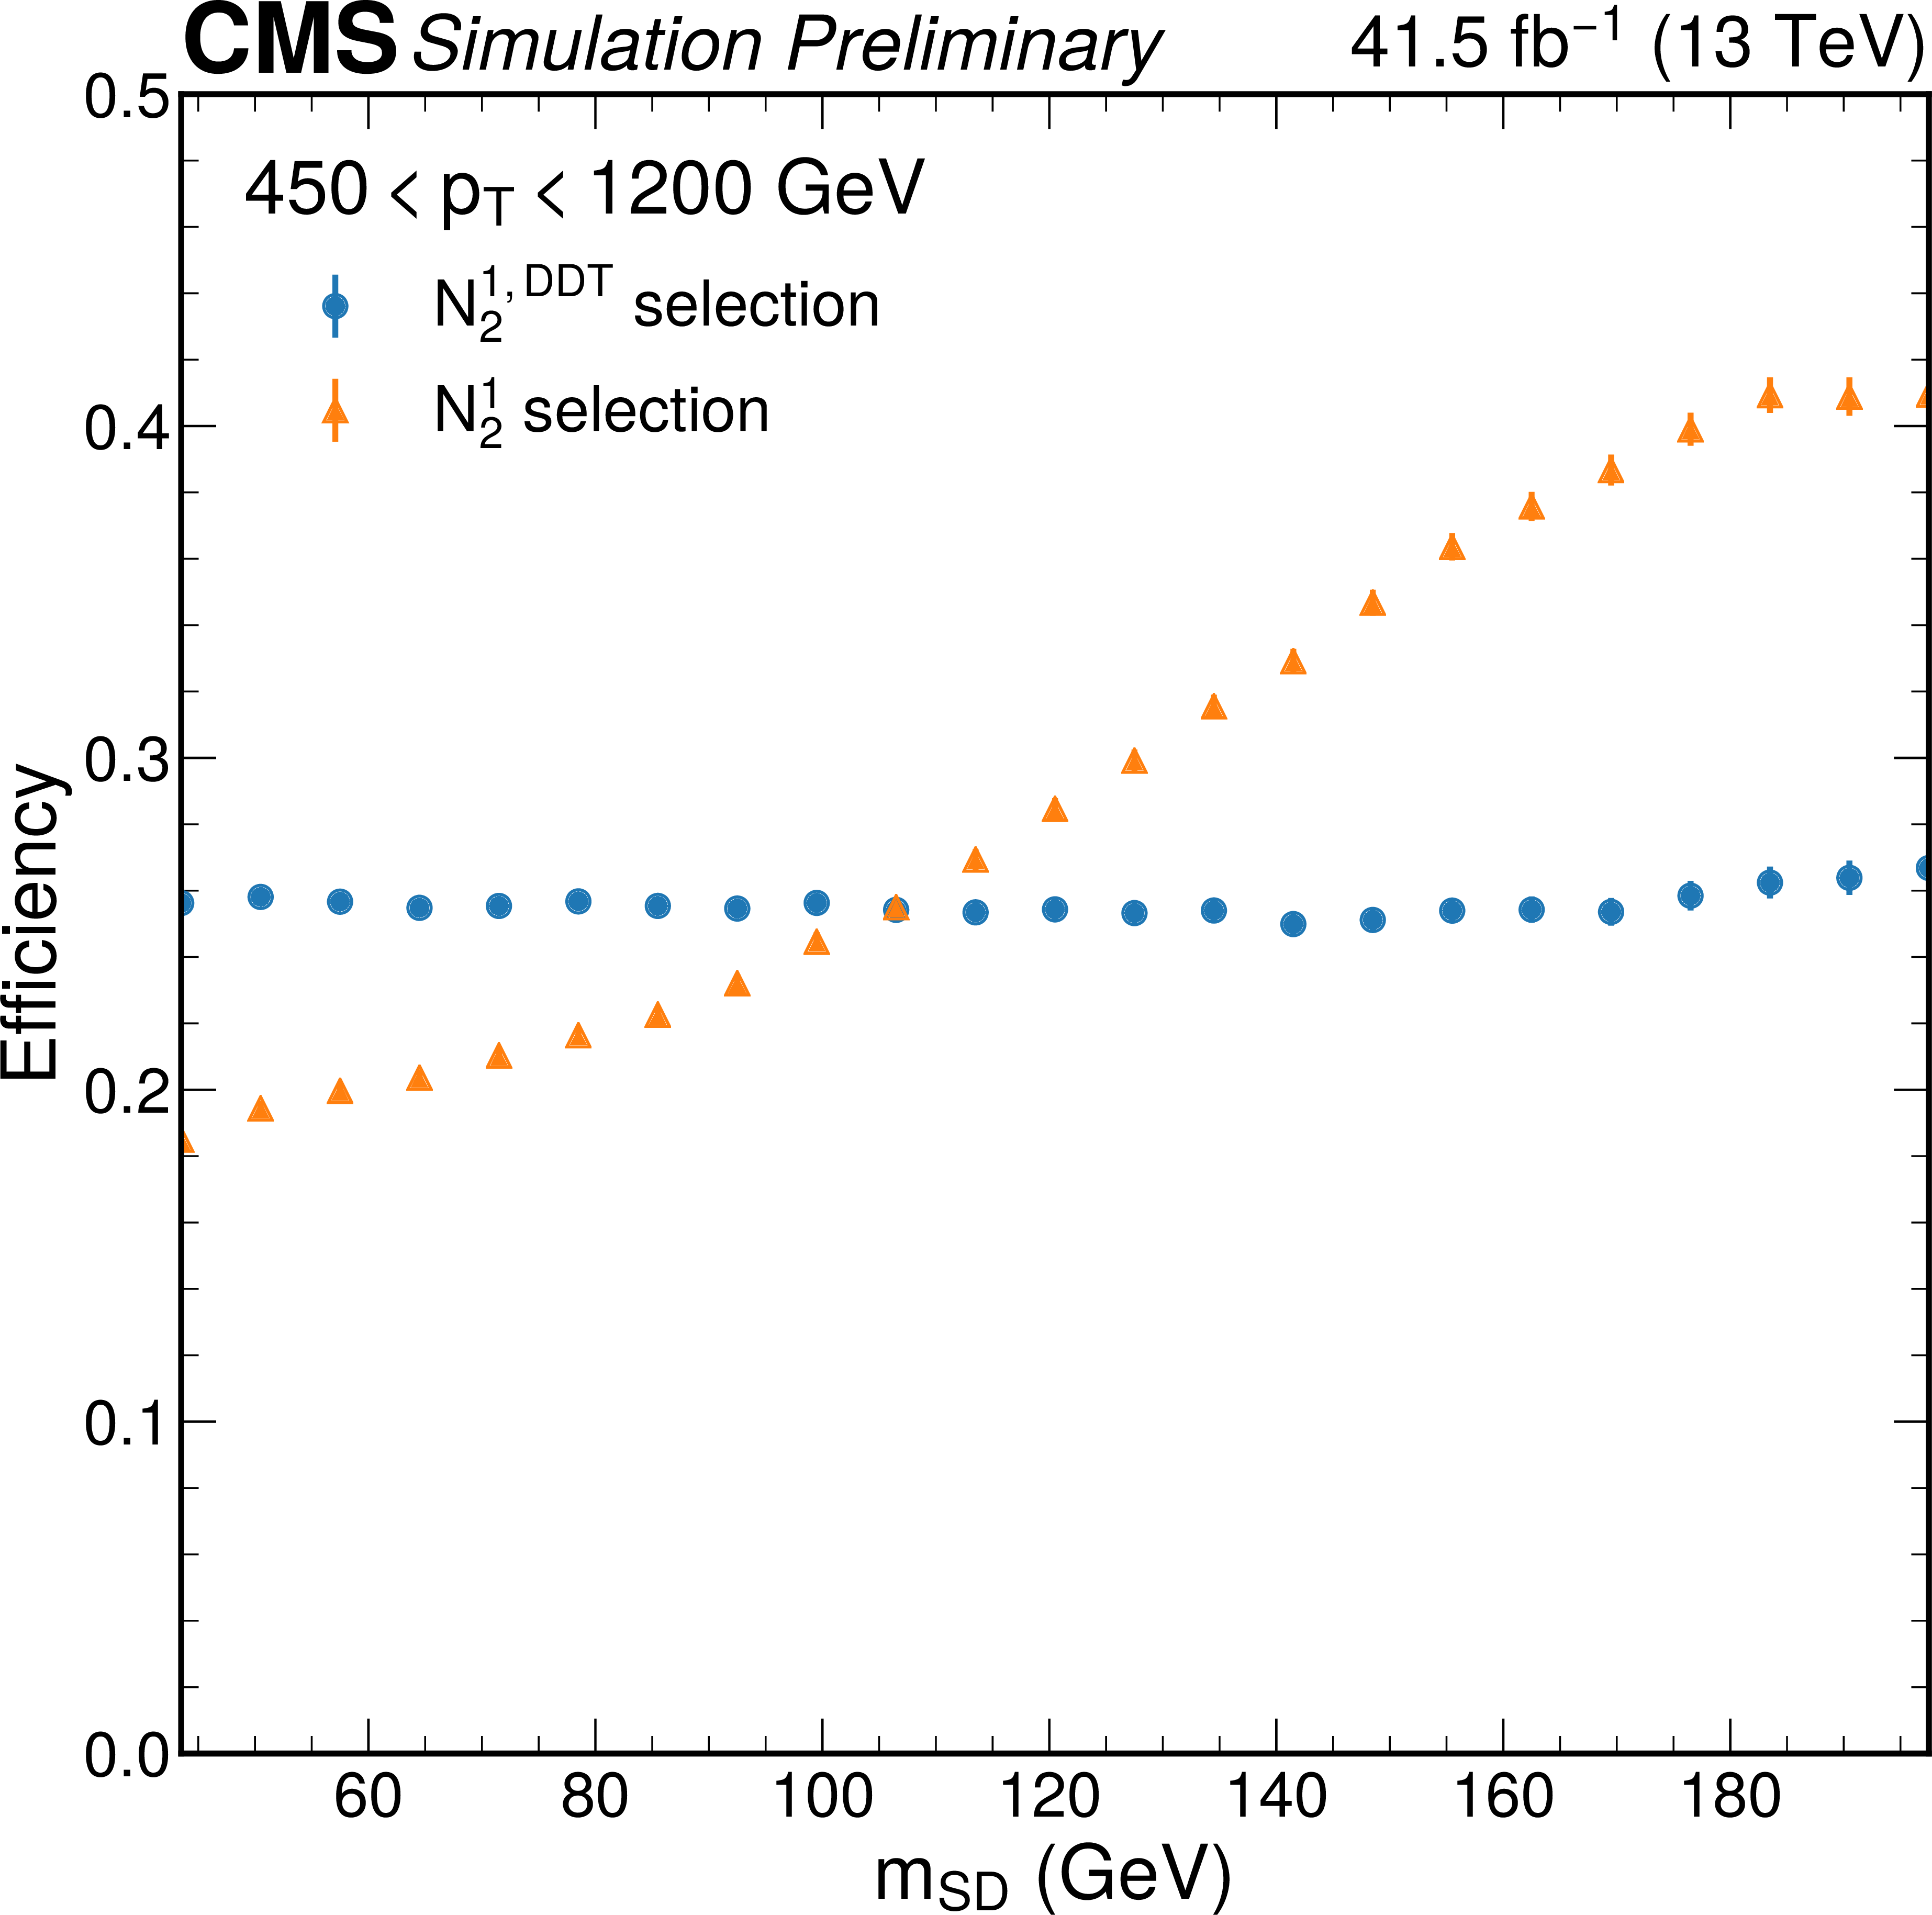
Additional Figure 1:
The map of $X_{(26\%)}$ used to define the $N_2^{1,\mathrm {DDT}}$ variable, corresponding to the 26% quantile of the $N_{2}^{1}$ distribution in simulated QCD multijet events (a). The map is shown as a function of jet $\rho $ and $ {p_{\mathrm {T}}} $ for simulation corresponding to detector conditions in 2017. The efficiency as a function of jet $m_\mathrm {SD}$ for simulated QCD multijet events to pass the $N_2^{1,\mathrm {DDT}}$ selection as compared to the equivalent $N_{2}^{1}$ selection, which corresponds to 26% efficiency in the full kinematic phase space considered in this analysis (b). Only the statistical uncertainty is shown. After the decorrelation procedure, the $N_2^{1,\mathrm {DDT}}$ selection efficiency is constant as a function of jet $m_\mathrm {SD}$. |
png pdf |
Additional Figure 1-a:
The map of $X_{(26\%)}$ used to define the $N_2^{1,\mathrm {DDT}}$ variable, corresponding to the 26% quantile of the $N_{2}^{1}$ distribution in simulated QCD multijet events. Only the statistical uncertainty is shown. After the decorrelation procedure, the $N_2^{1,\mathrm {DDT}}$ selection efficiency is constant as a function of jet $m_\mathrm {SD}$. The map is shown as a function of jet $\rho $ and $ {p_{\mathrm {T}}} $ for simulation corresponding to detector conditions in 2017. |
png pdf |
Additional Figure 1-b:
The efficiency as a function of jet $m_\mathrm {SD}$ for simulated QCD multijet events to pass the $N_2^{1,\mathrm {DDT}}$ selection as compared to the equivalent $N_{2}^{1}$ selection, which corresponds to 26% efficiency in the full kinematic phase space considered in this analysis. Only the statistical uncertainty is shown. After the decorrelation procedure, the $N_2^{1,\mathrm {DDT}}$ selection efficiency is constant as a function of jet $m_\mathrm {SD}$. |
png pdf |
Additional Figure 2:
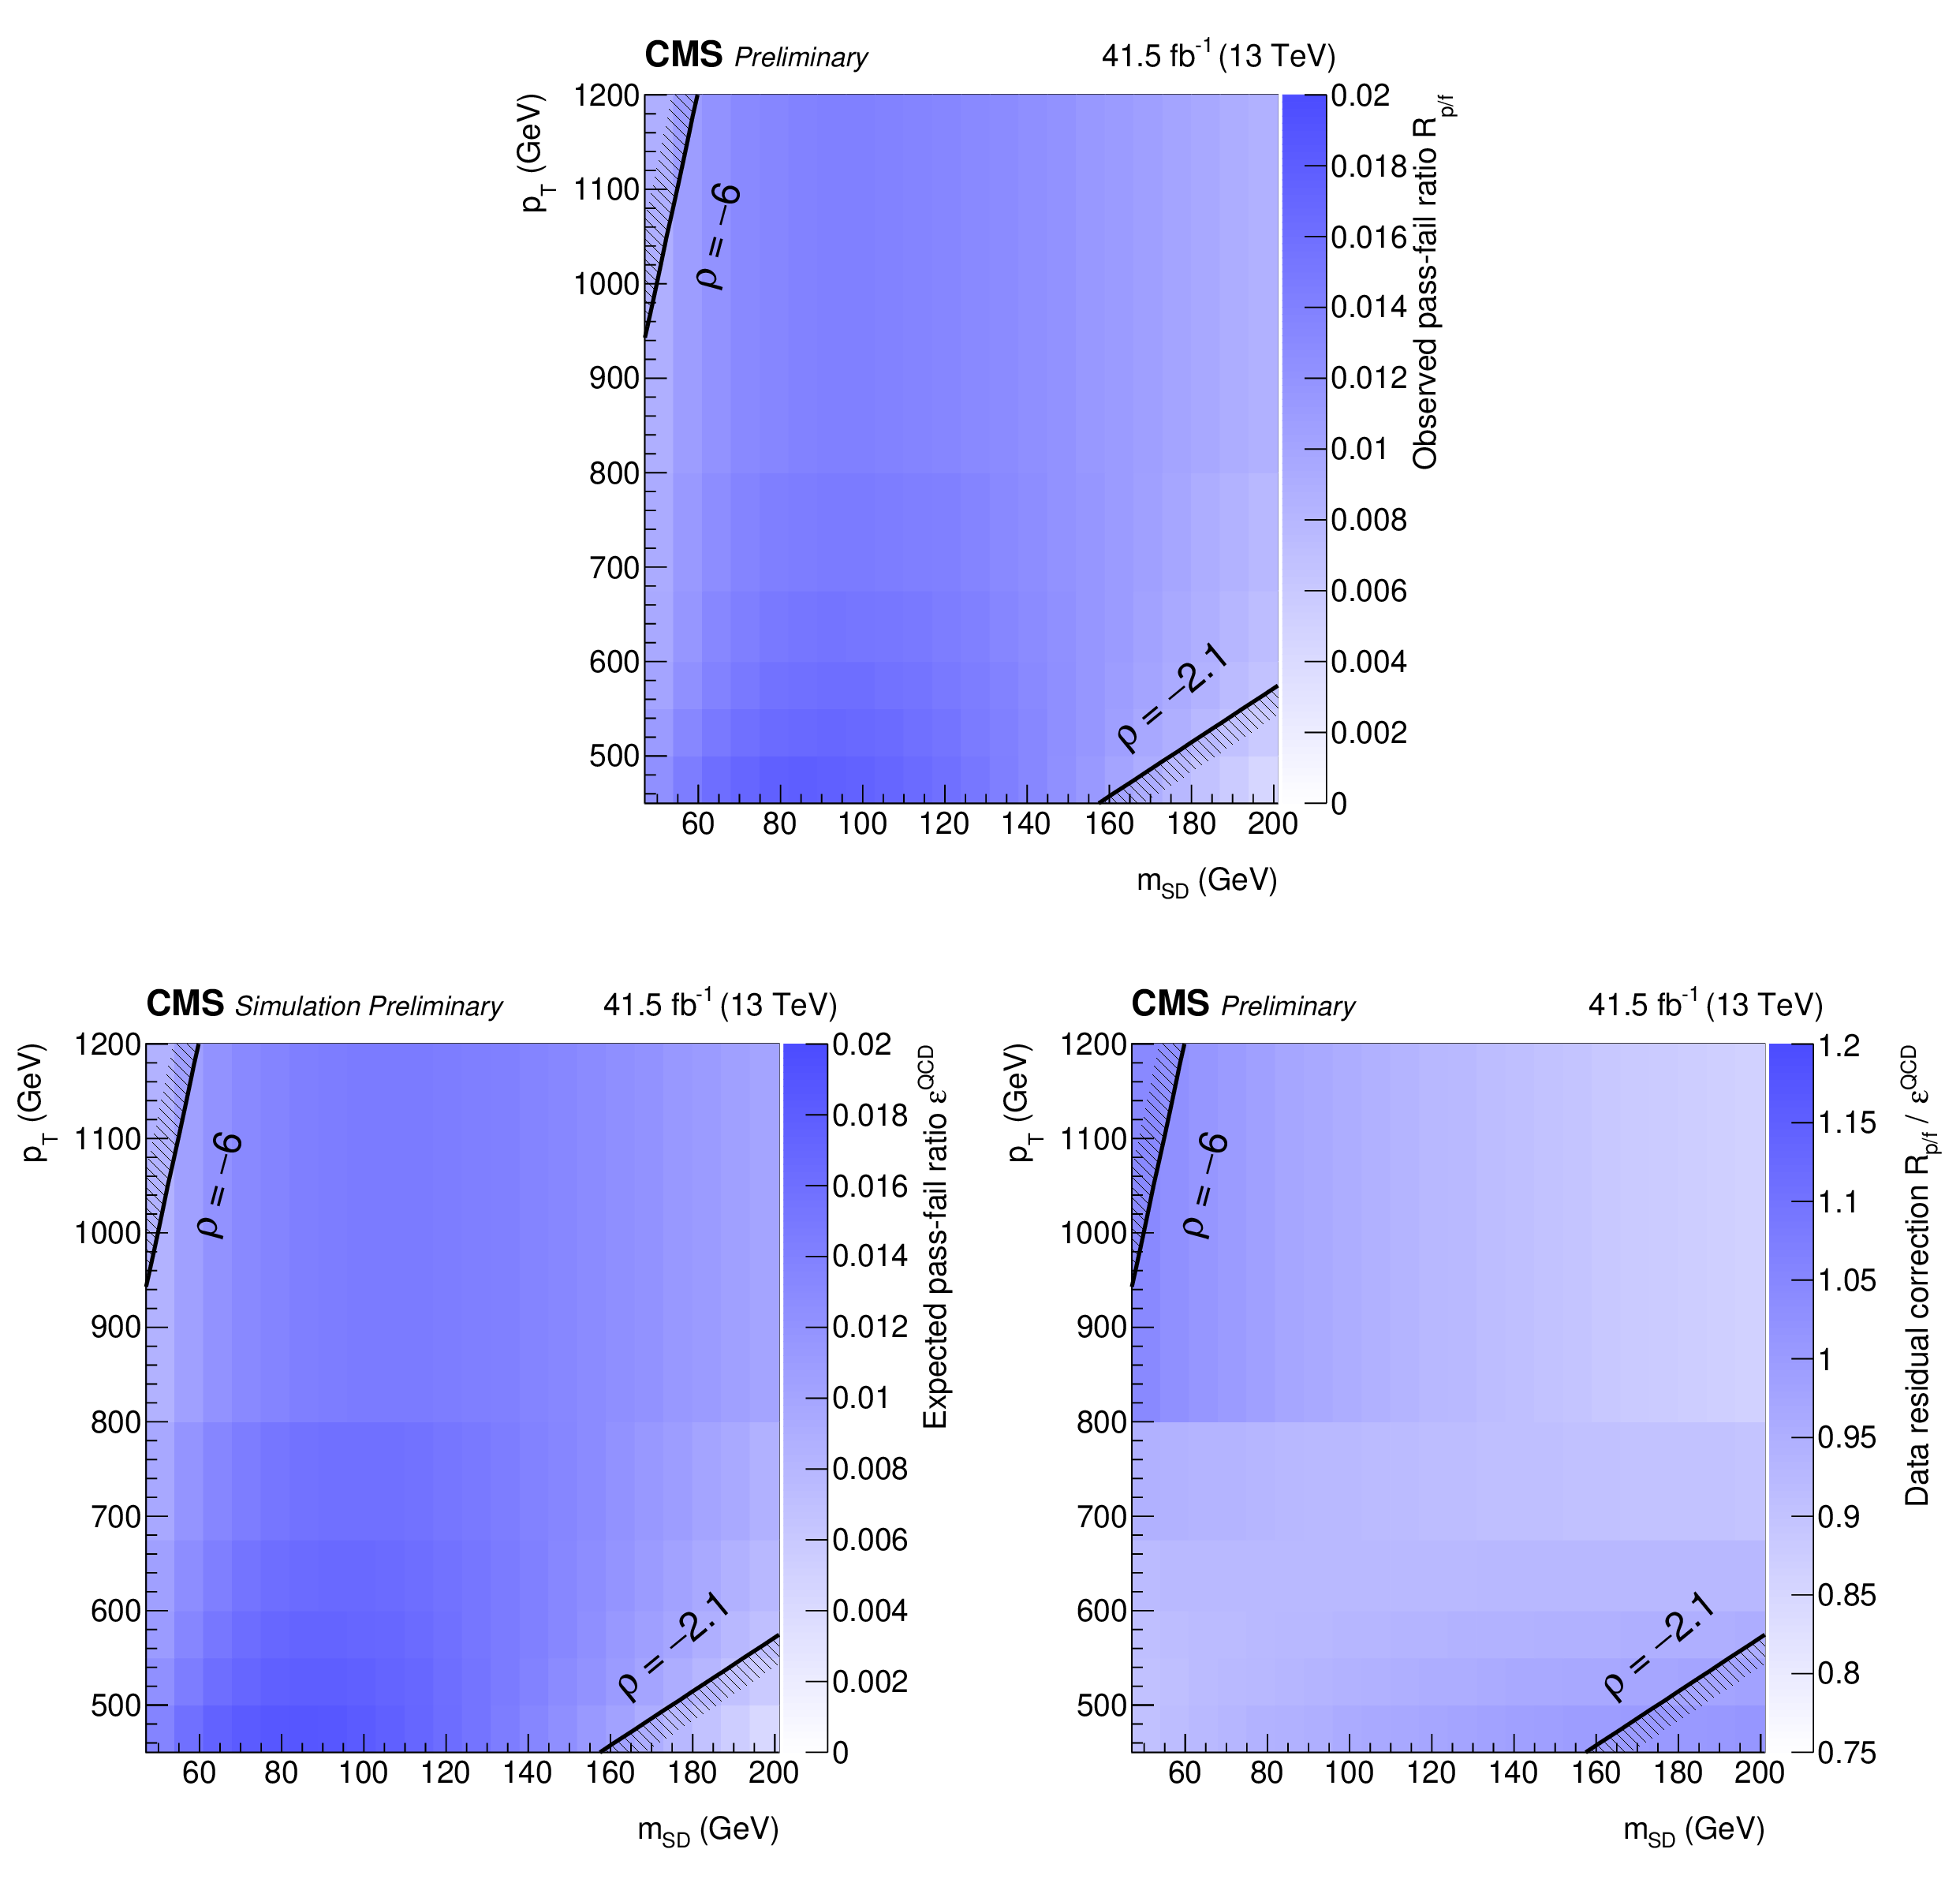
The observed pass-fail ratio $R_{\mathrm {p}/\mathrm {f}}$ as a function of jet $ {p_{\mathrm {T}}} $ and $m_\mathrm {SD}$ for data collected in 2017 (a). The ratio relates the QCD multijet event yield in the passing region to that of the failing region. The pass-fail ratio is factorized into two components. The first component accounts for the expected pass-fail ratio from simulated QCD multijet events, $\epsilon ^\mathrm {QCD}$ (b). The second component corrects for residual differences between data and simulation (c). The complete pass-fail ratio is given by the product of these two factors. |
png pdf |
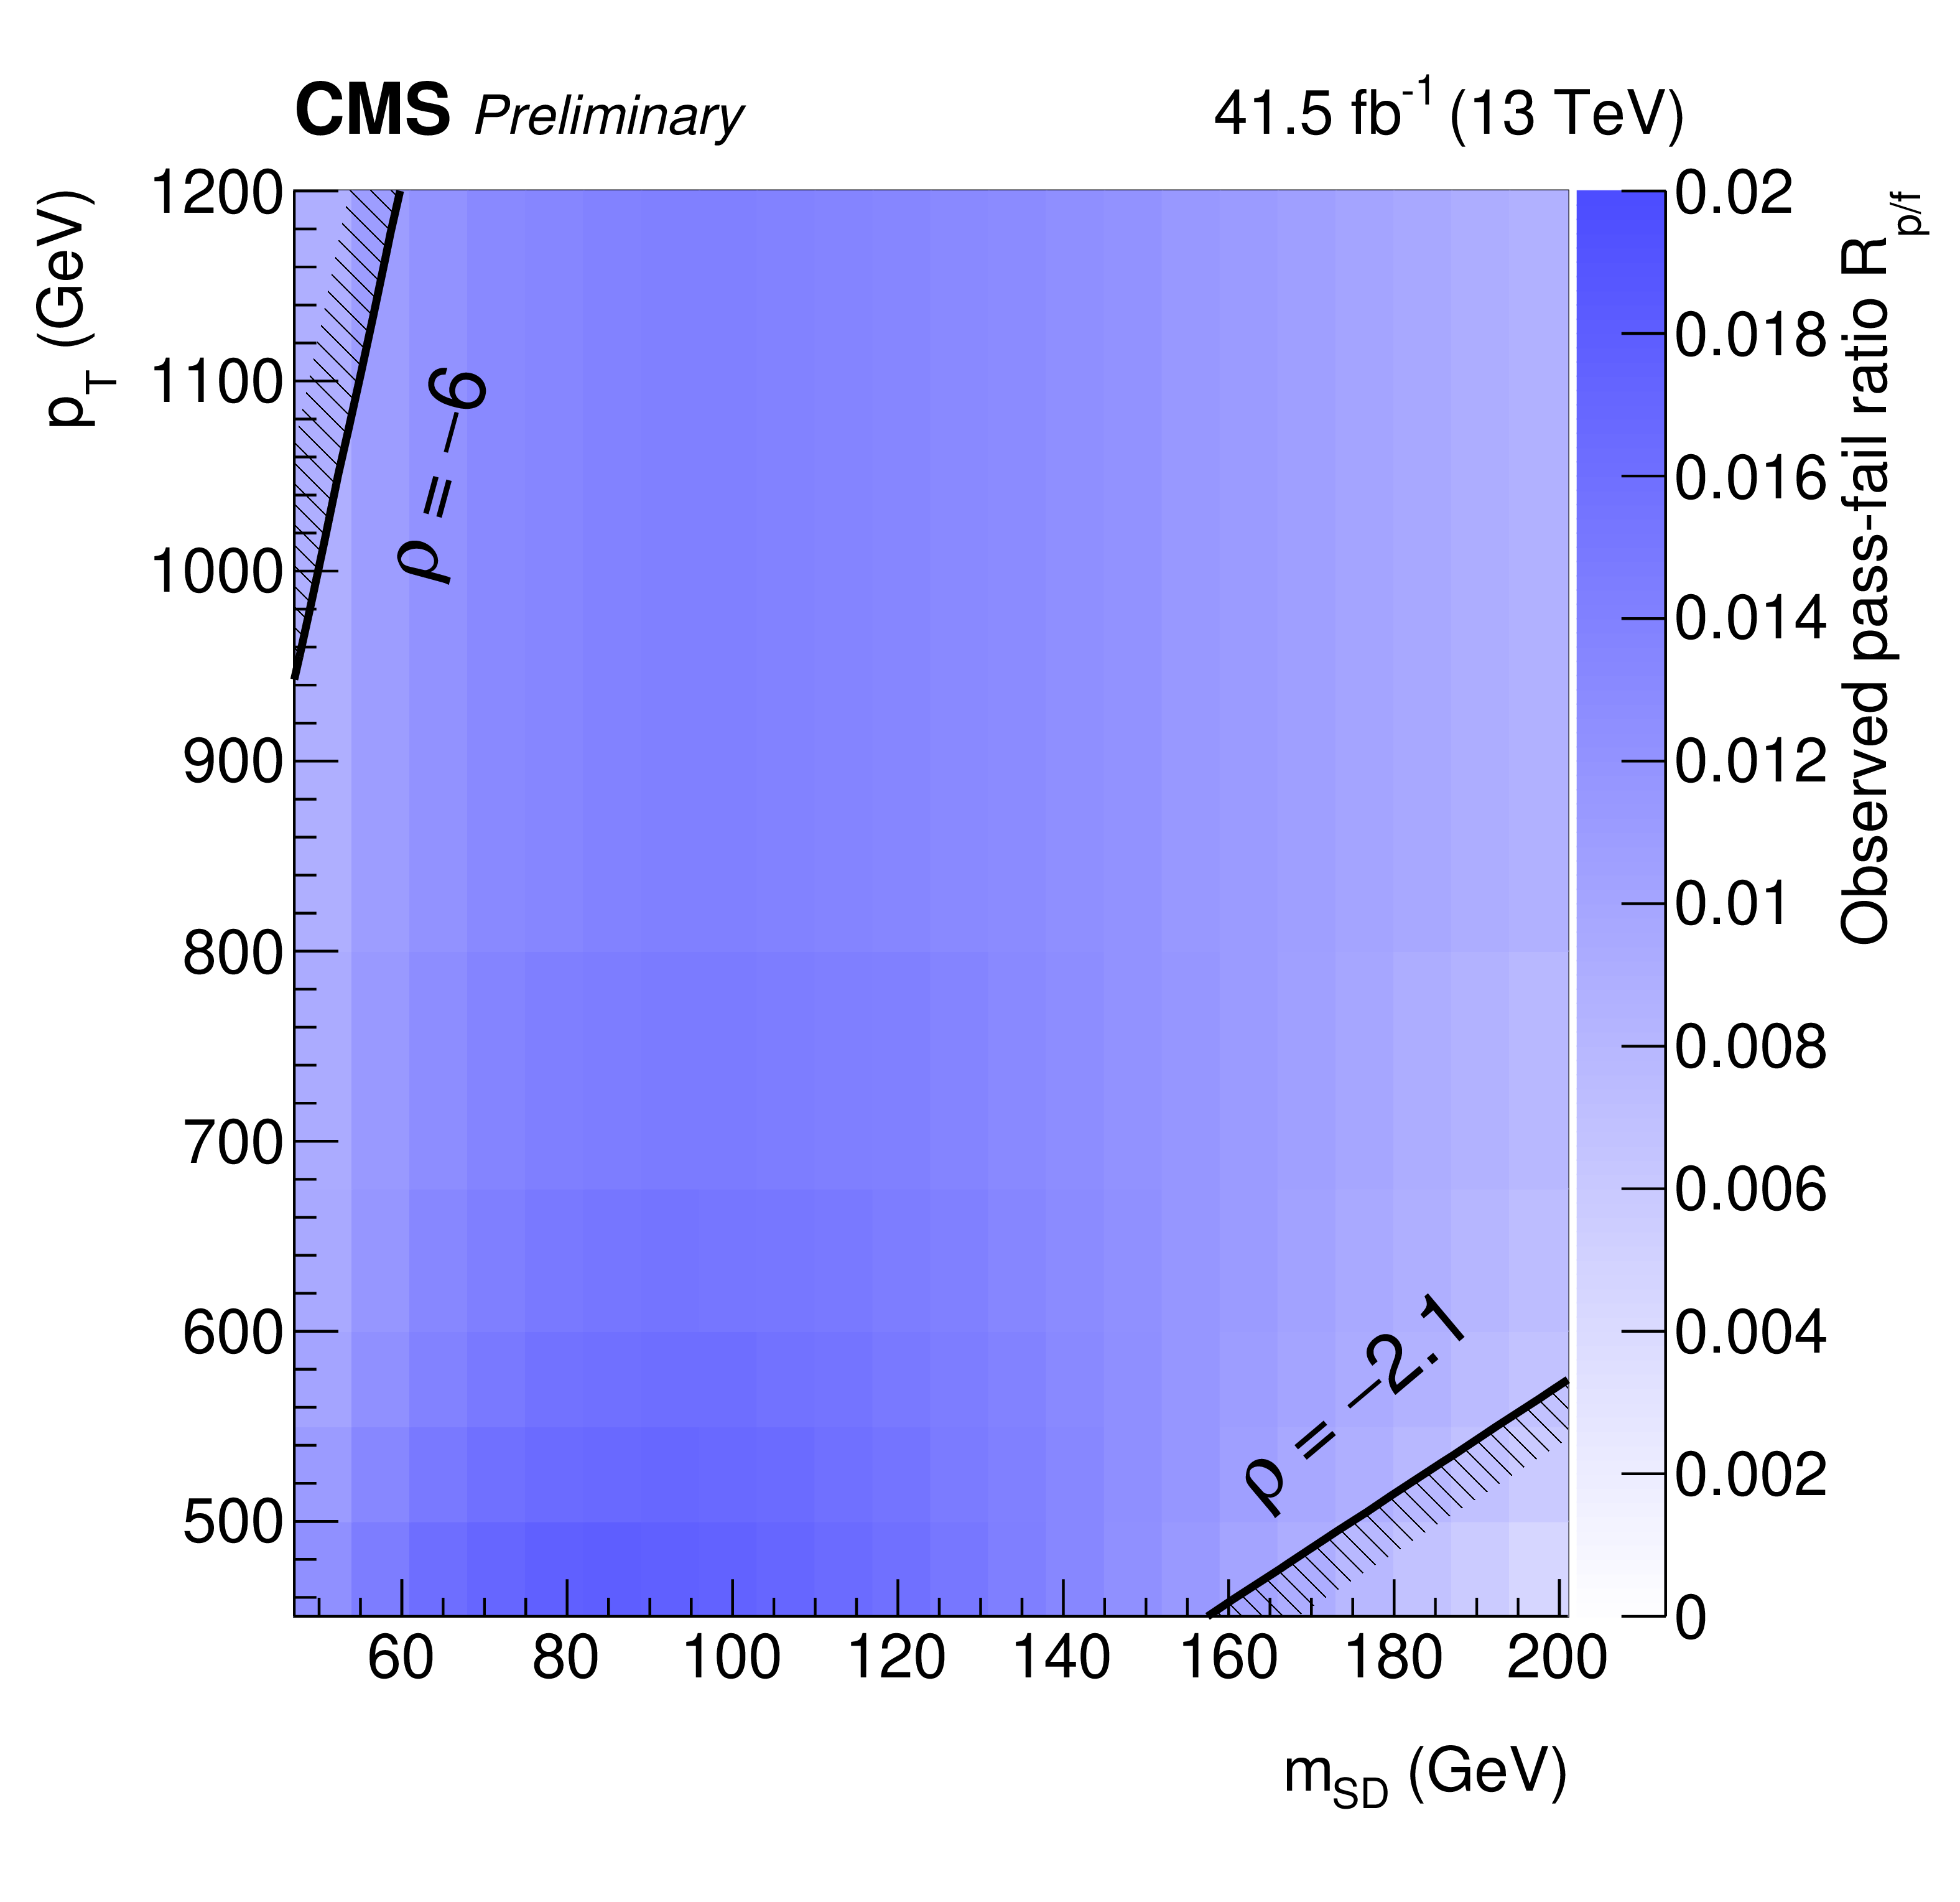
Additional Figure 2-a:
The observed pass-fail ratio $R_{\mathrm {p}/\mathrm {f}}$ as a function of jet $ {p_{\mathrm {T}}} $ and $m_\mathrm {SD}$ for data collected in 2017. The ratio relates the QCD multijet event yield in the passing region to that of the failing region. The pass-fail ratio is factorized into two components. The first component accounts for the expected pass-fail ratio from simulated QCD multijet events, $\epsilon ^\mathrm {QCD}$. |
png pdf |
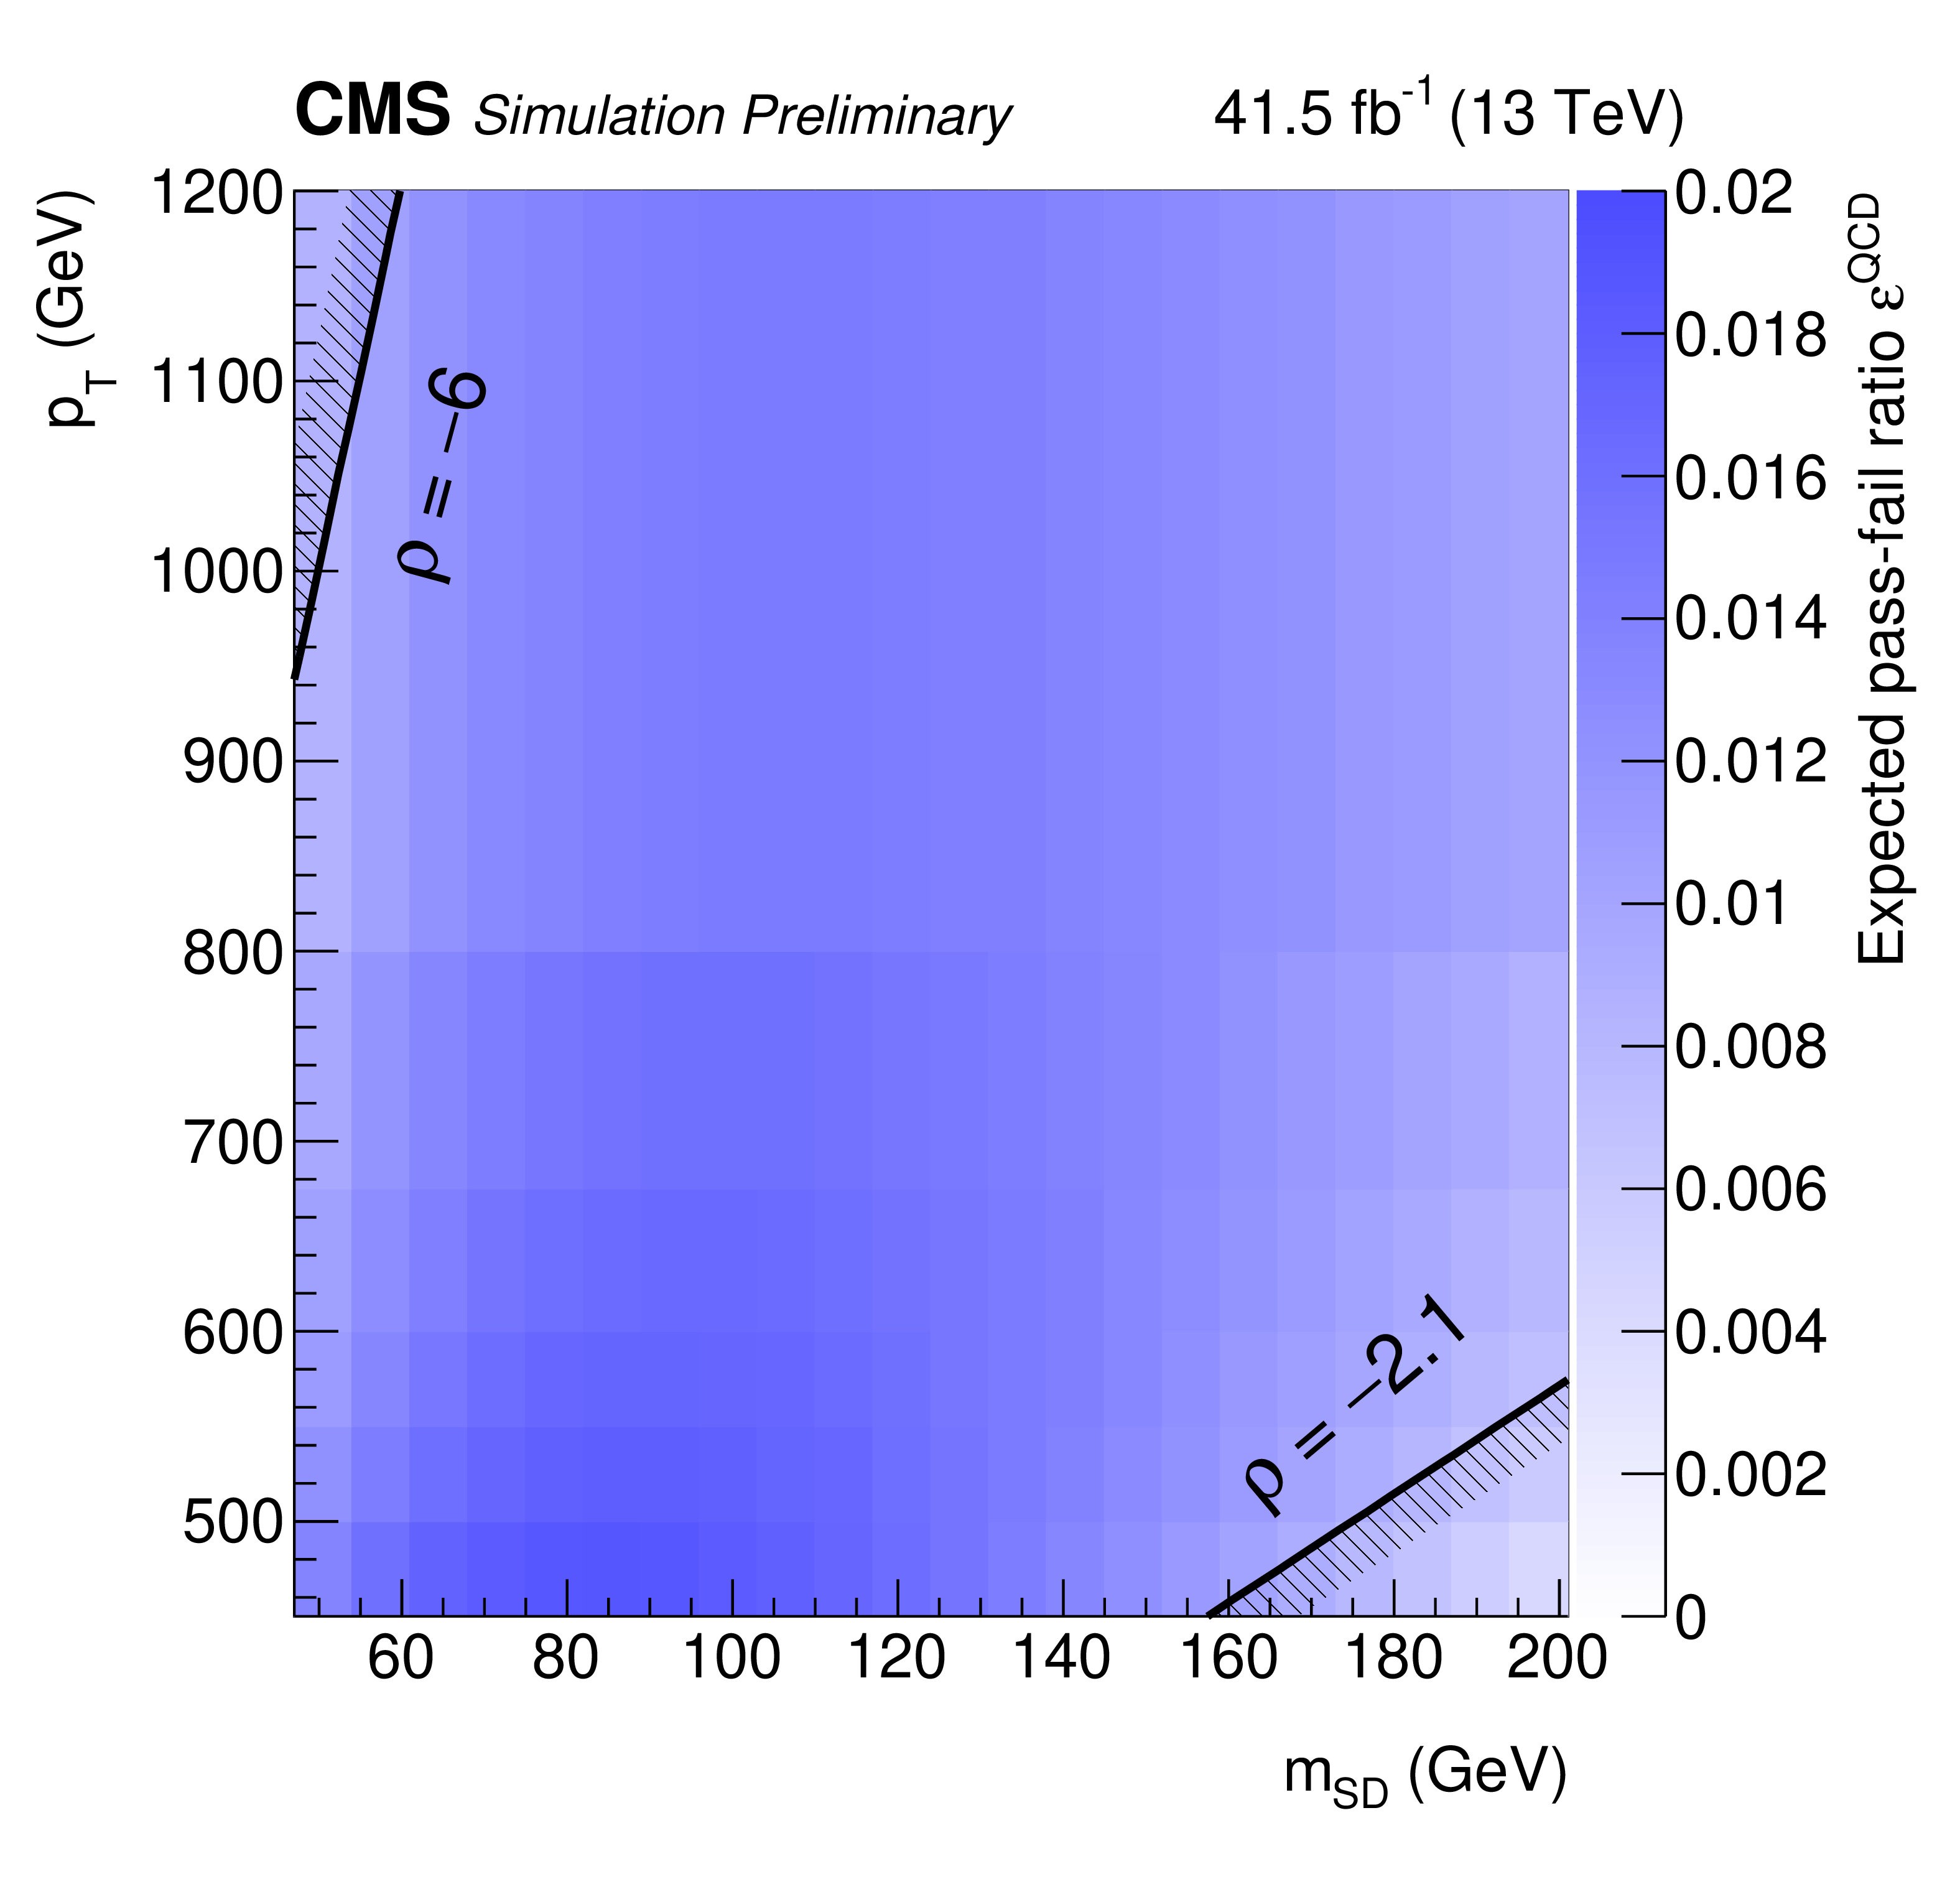
Additional Figure 2-b:
The second component corrects for residual differences between data and simulation. |
png pdf |
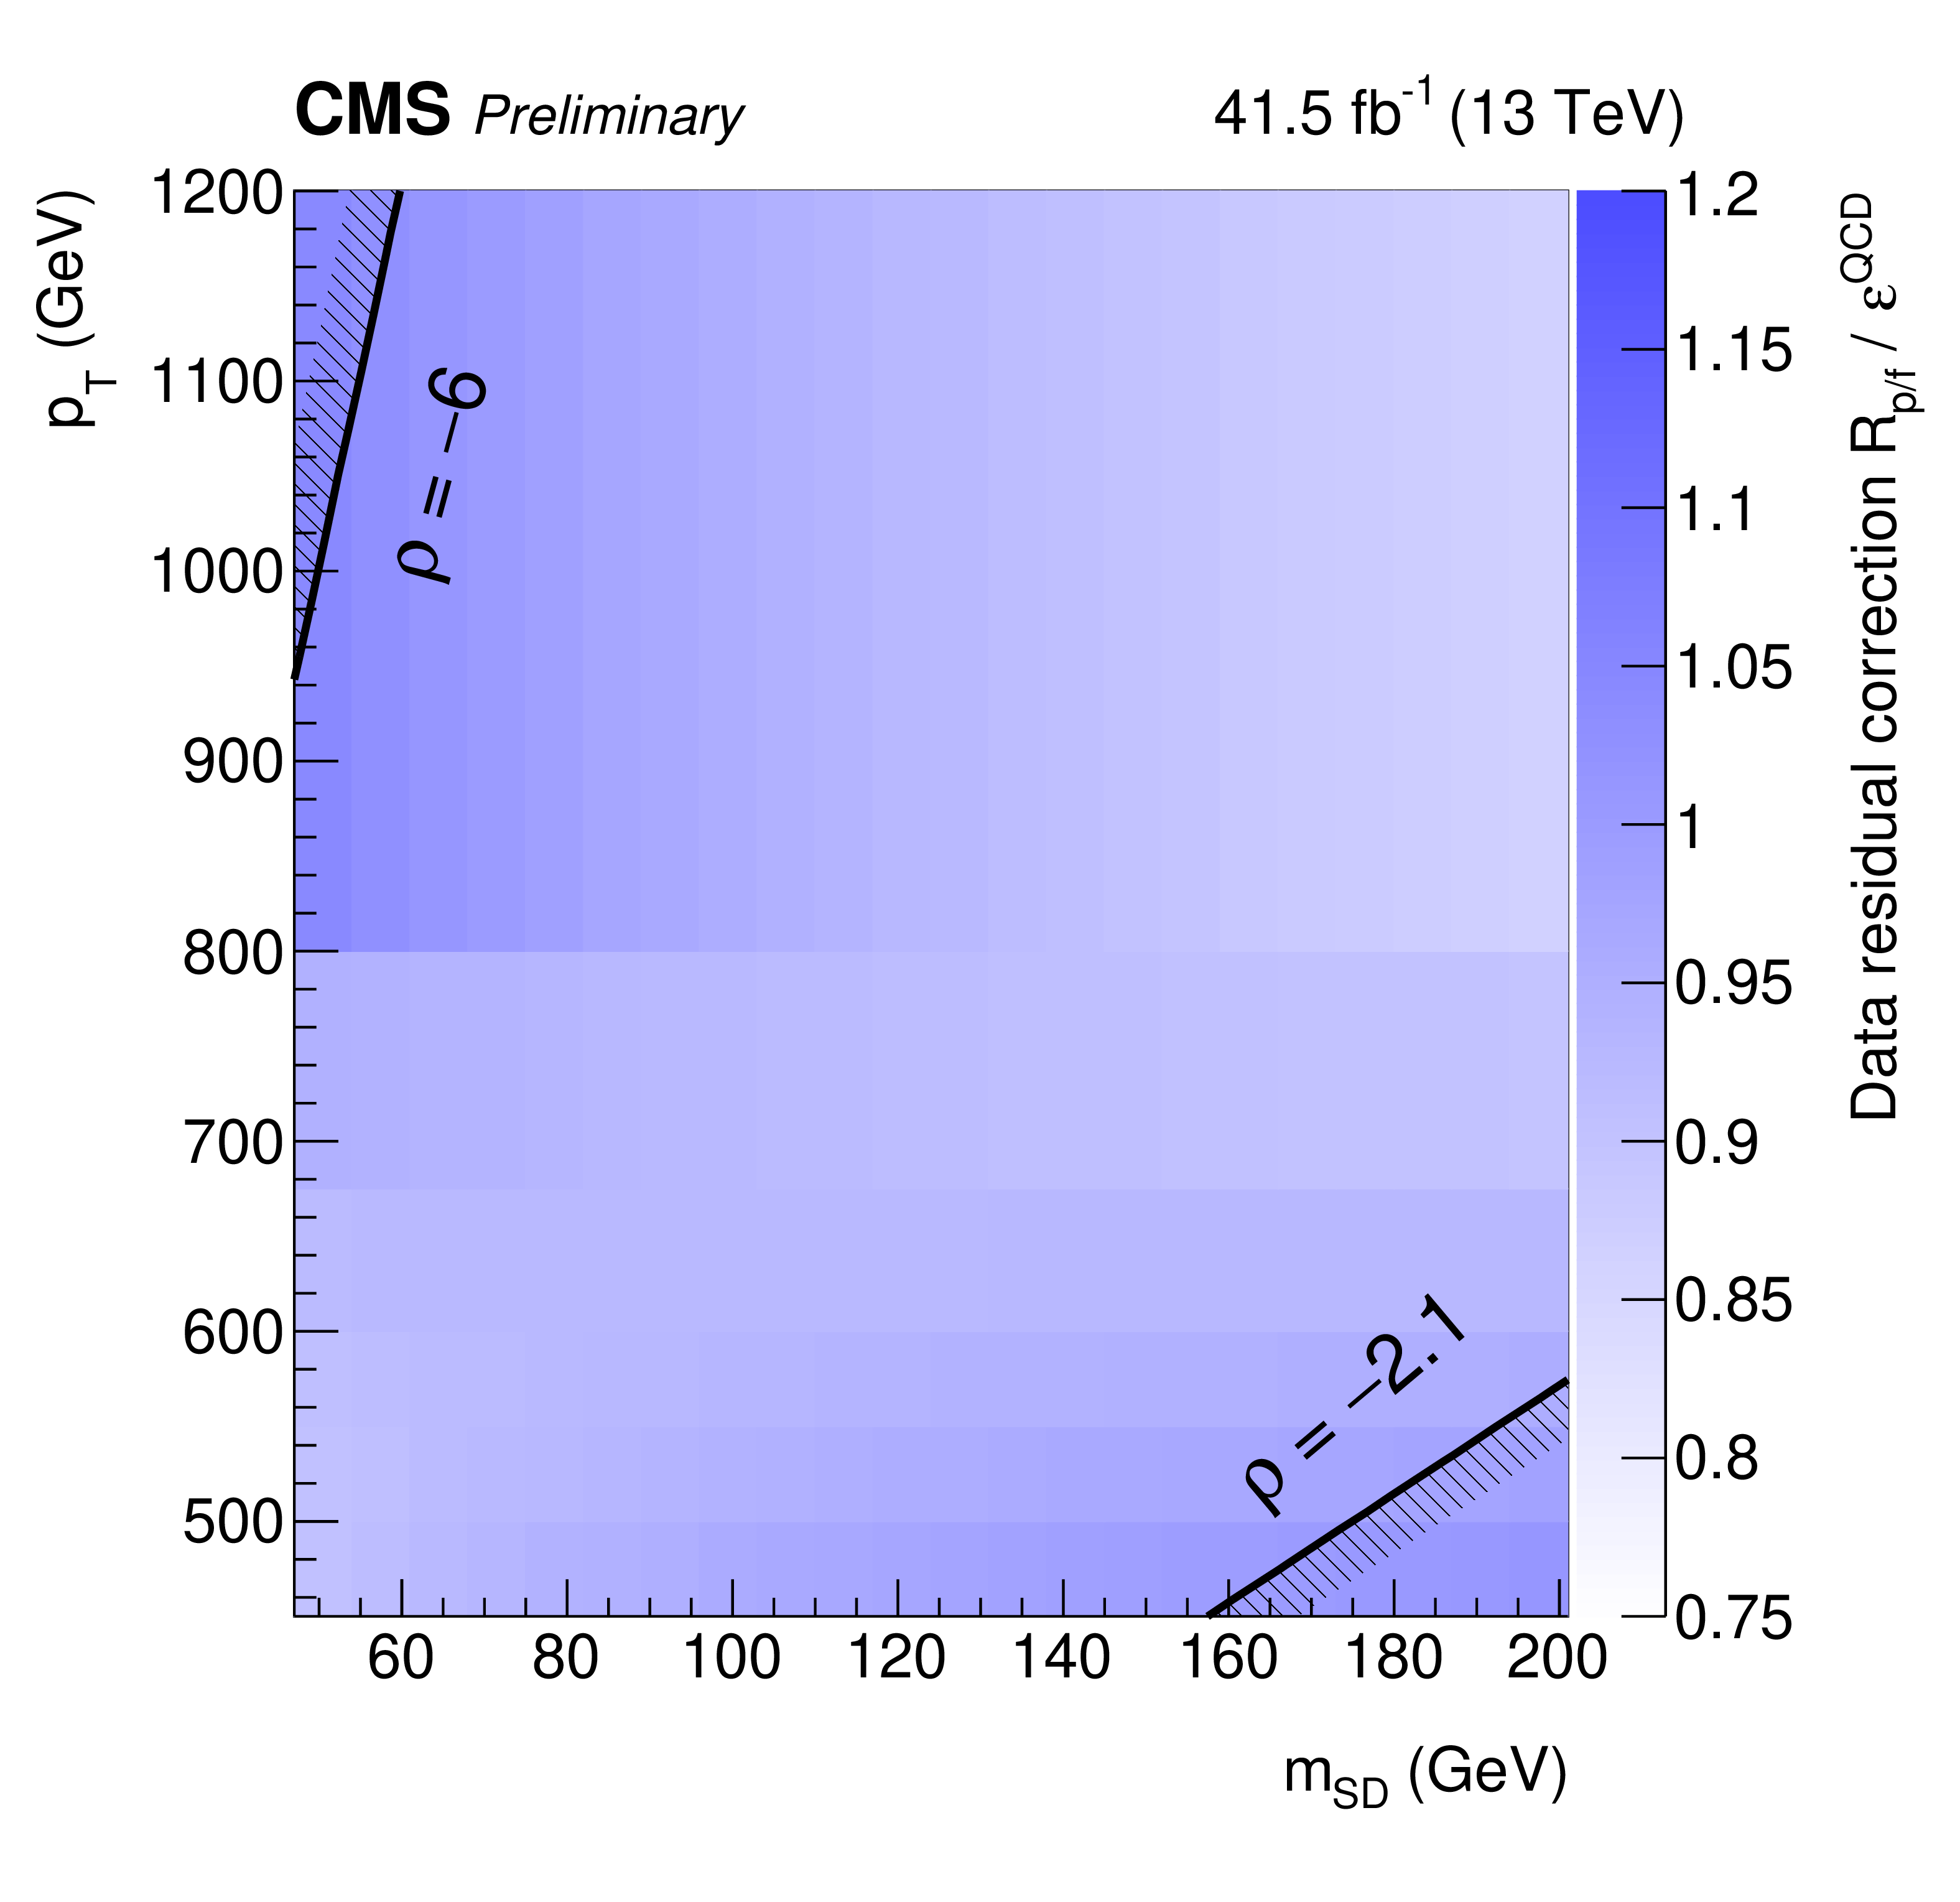
Additional Figure 2-c:
The complete pass-fail ratio is given by the product of the previous two factors. |
png pdf |
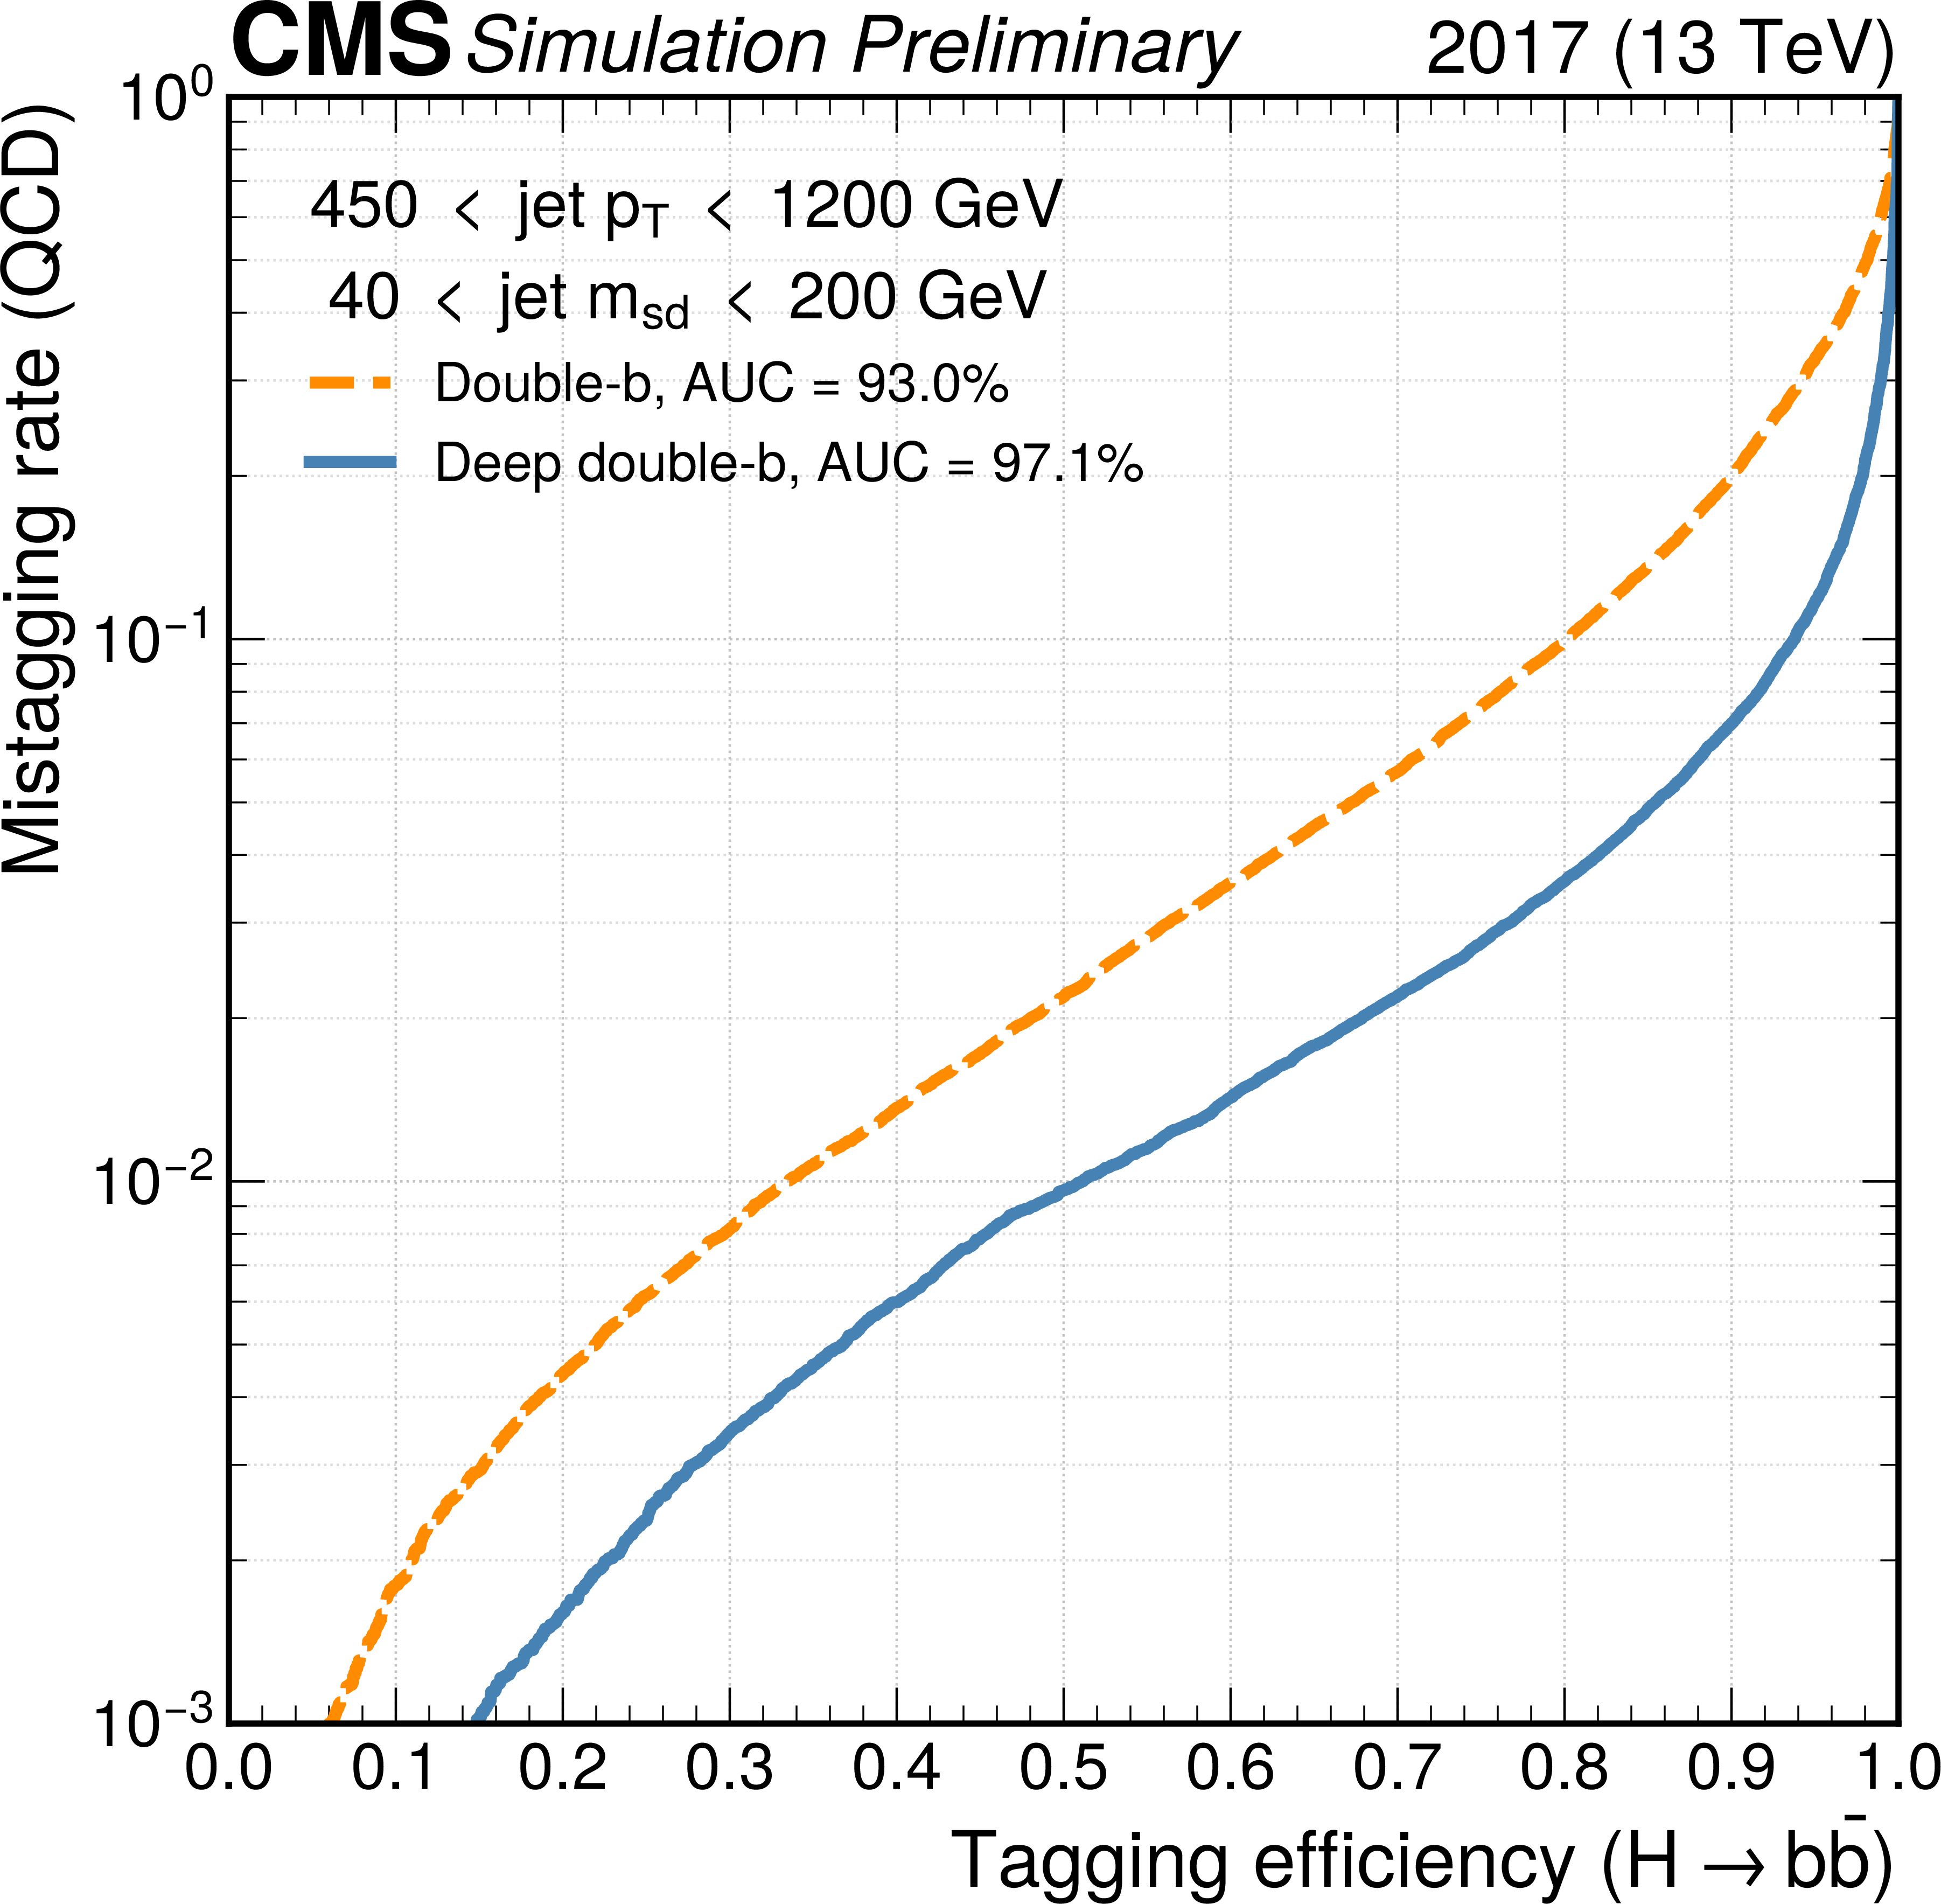
Additional Figure 3:
The receiver operating characteristic (ROC) curves of misidentification probability for jets originating from QCD multijet production versus the identification probability for $ {\mathrm {H}} ({{\mathrm {b}} {\overline {\mathrm {b}}}})$ jets for the double-b tagger (orange, dashed line) used in a prior CMS result and the deep double-b tagger (blue, solid line). The curves are evaluated with simulation corresponding to the detector conditions in 2017. Jets are required to have $ {p_{\mathrm {T}}} $ in the range 450-1200 GeV and $m_\mathrm {SD}$ in the range 40-200 GeV. Compared to the double-b tagger, the deep double-b tagger improves the $ {\mathrm {H}} ({{\mathrm {b}} {\overline {\mathrm {b}}}})$ tagging efficiency by a factor of about 1.5 for a QCD misidentification probability of 1%. |
png pdf |
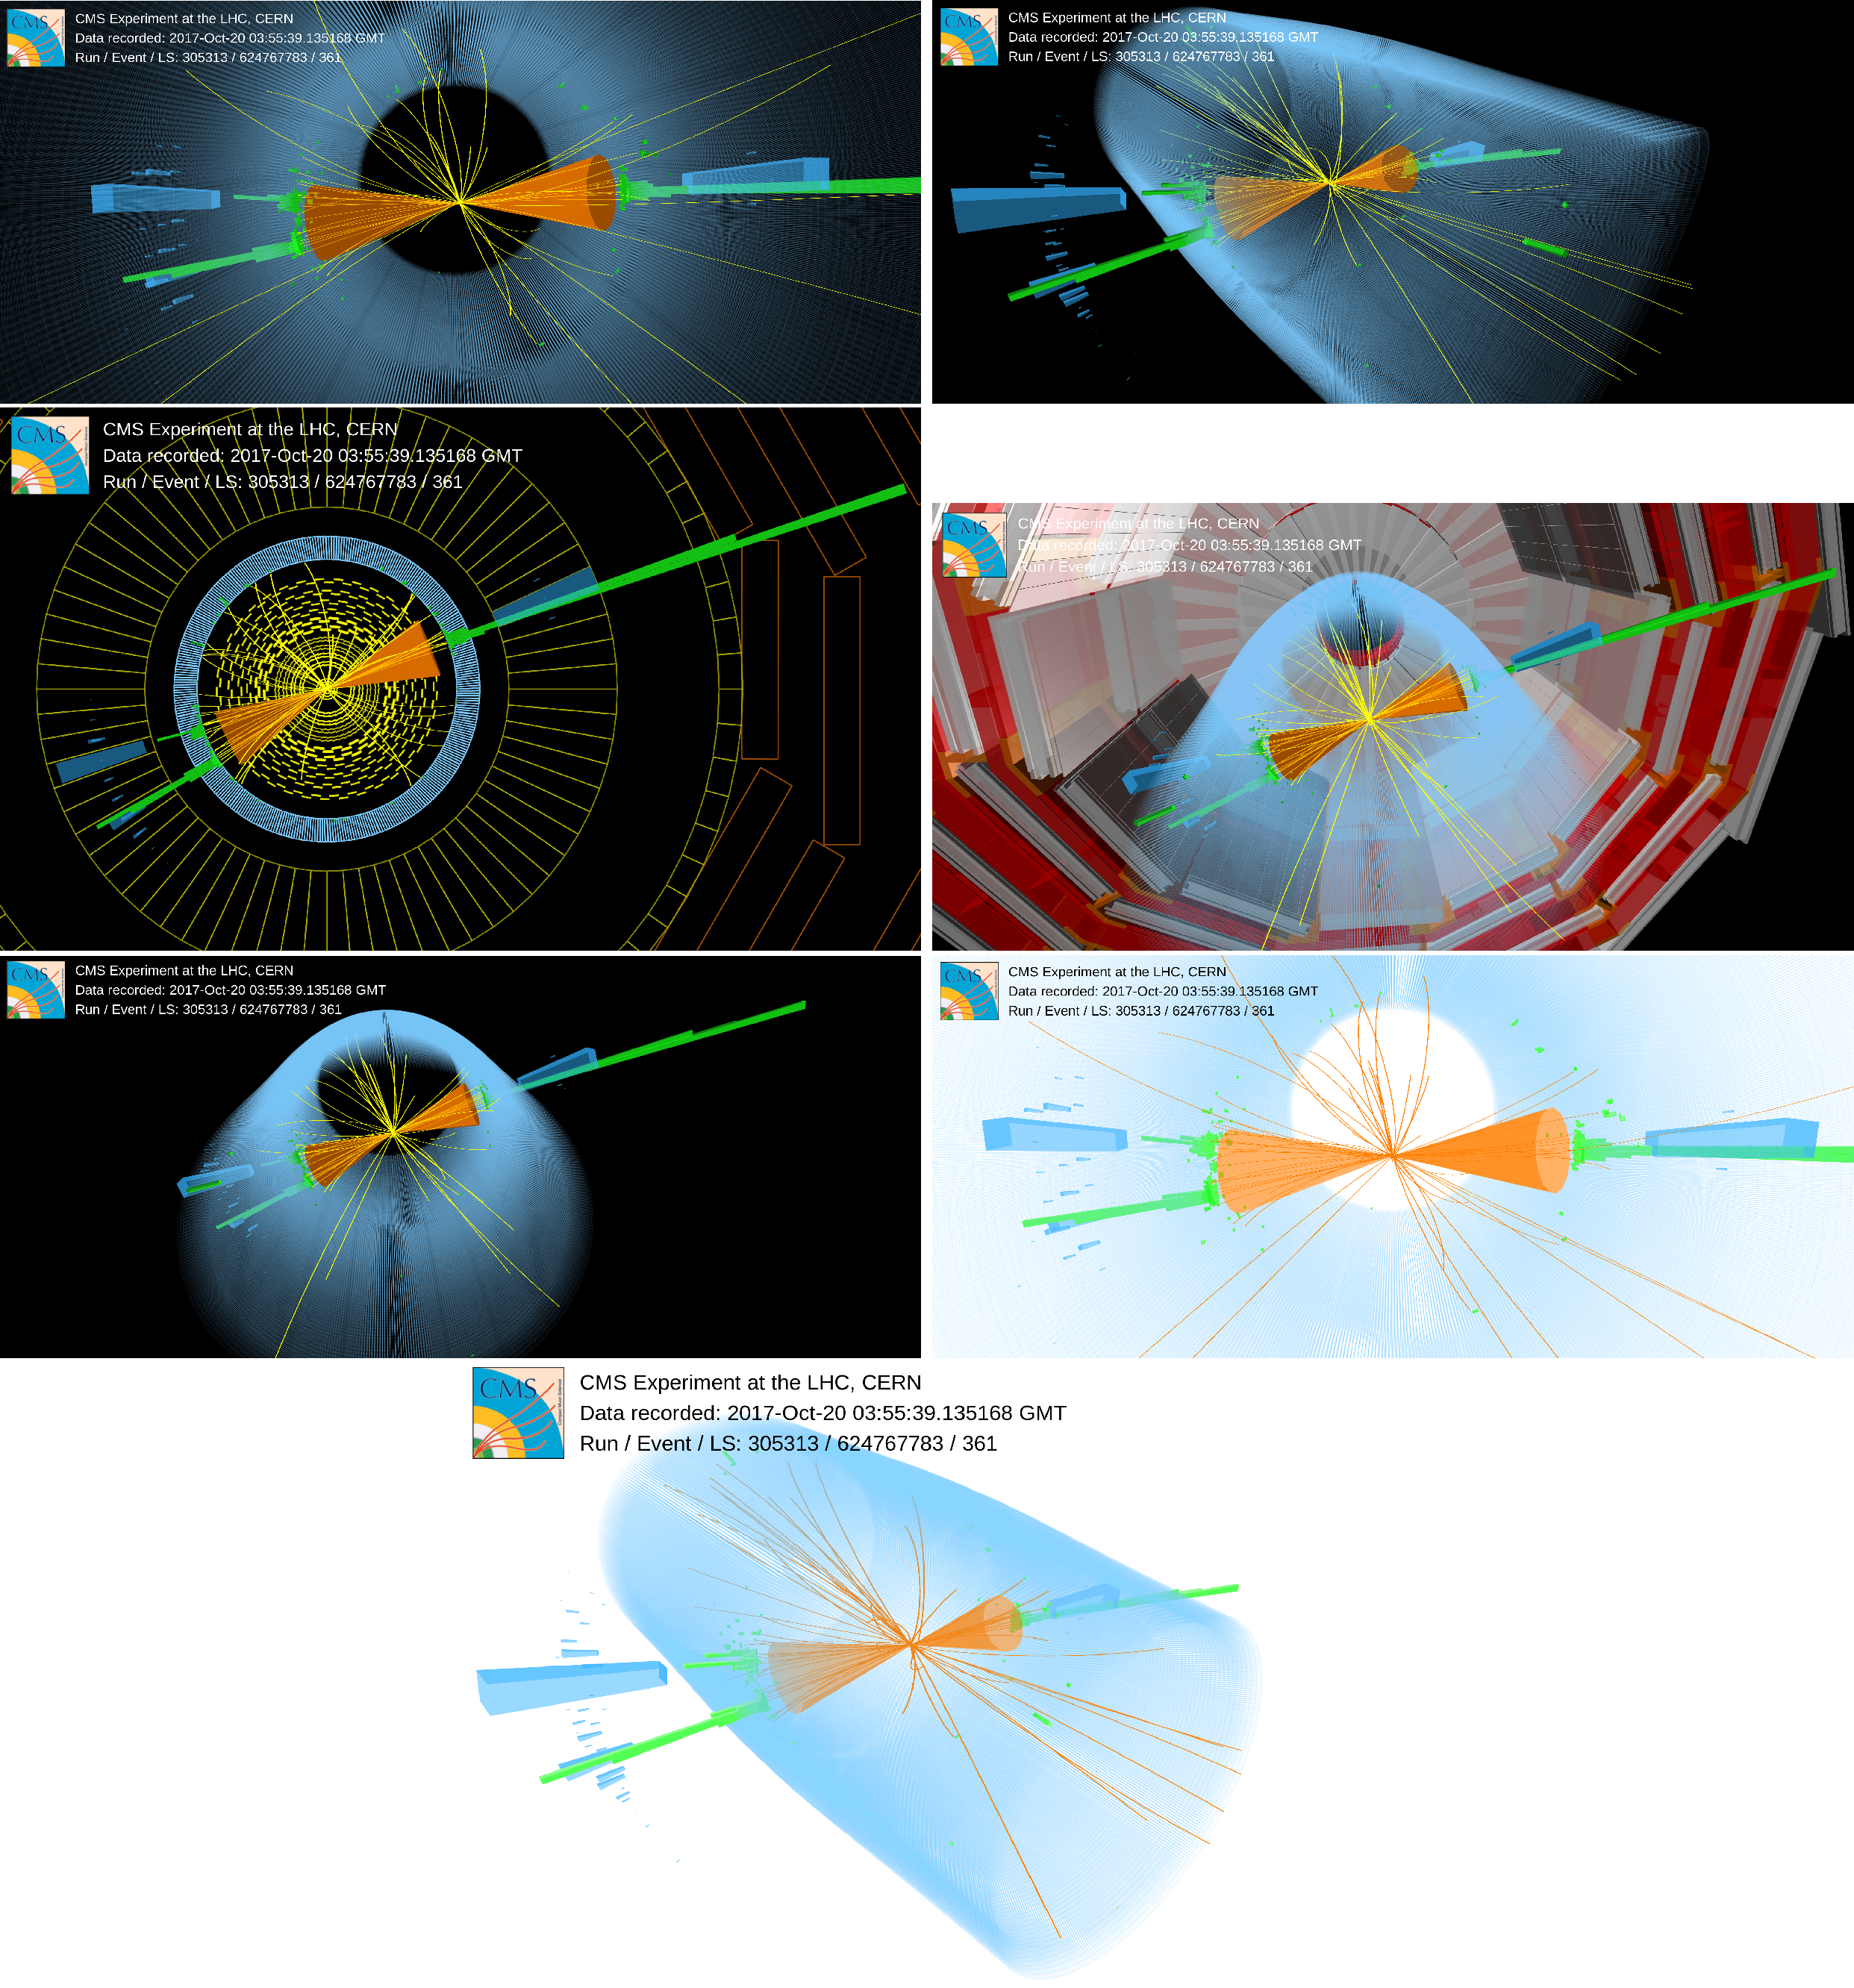
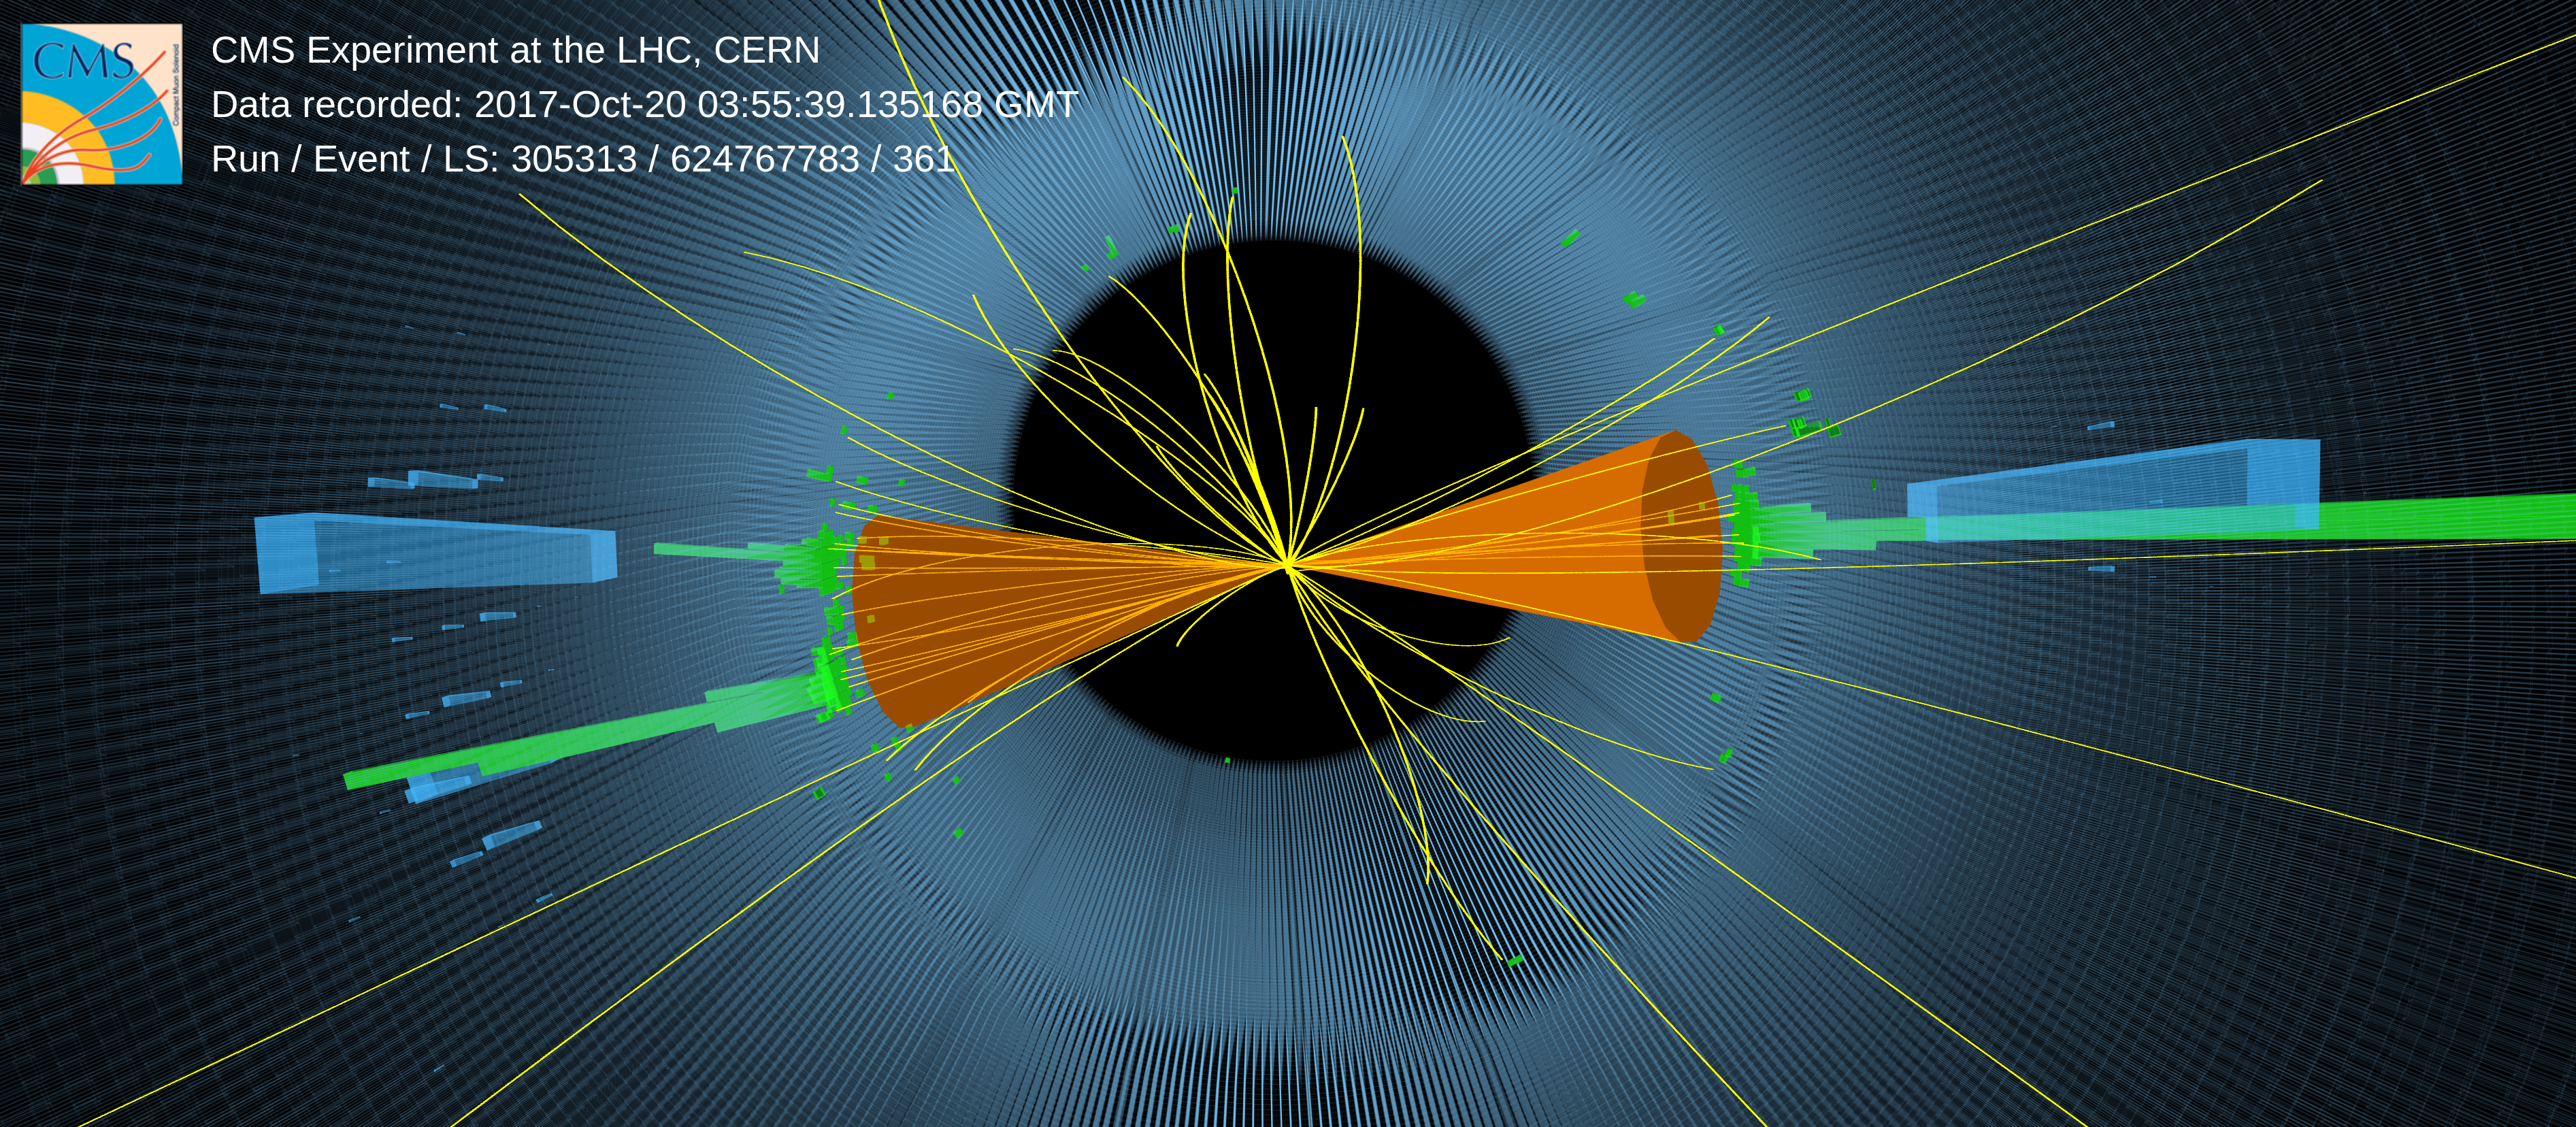
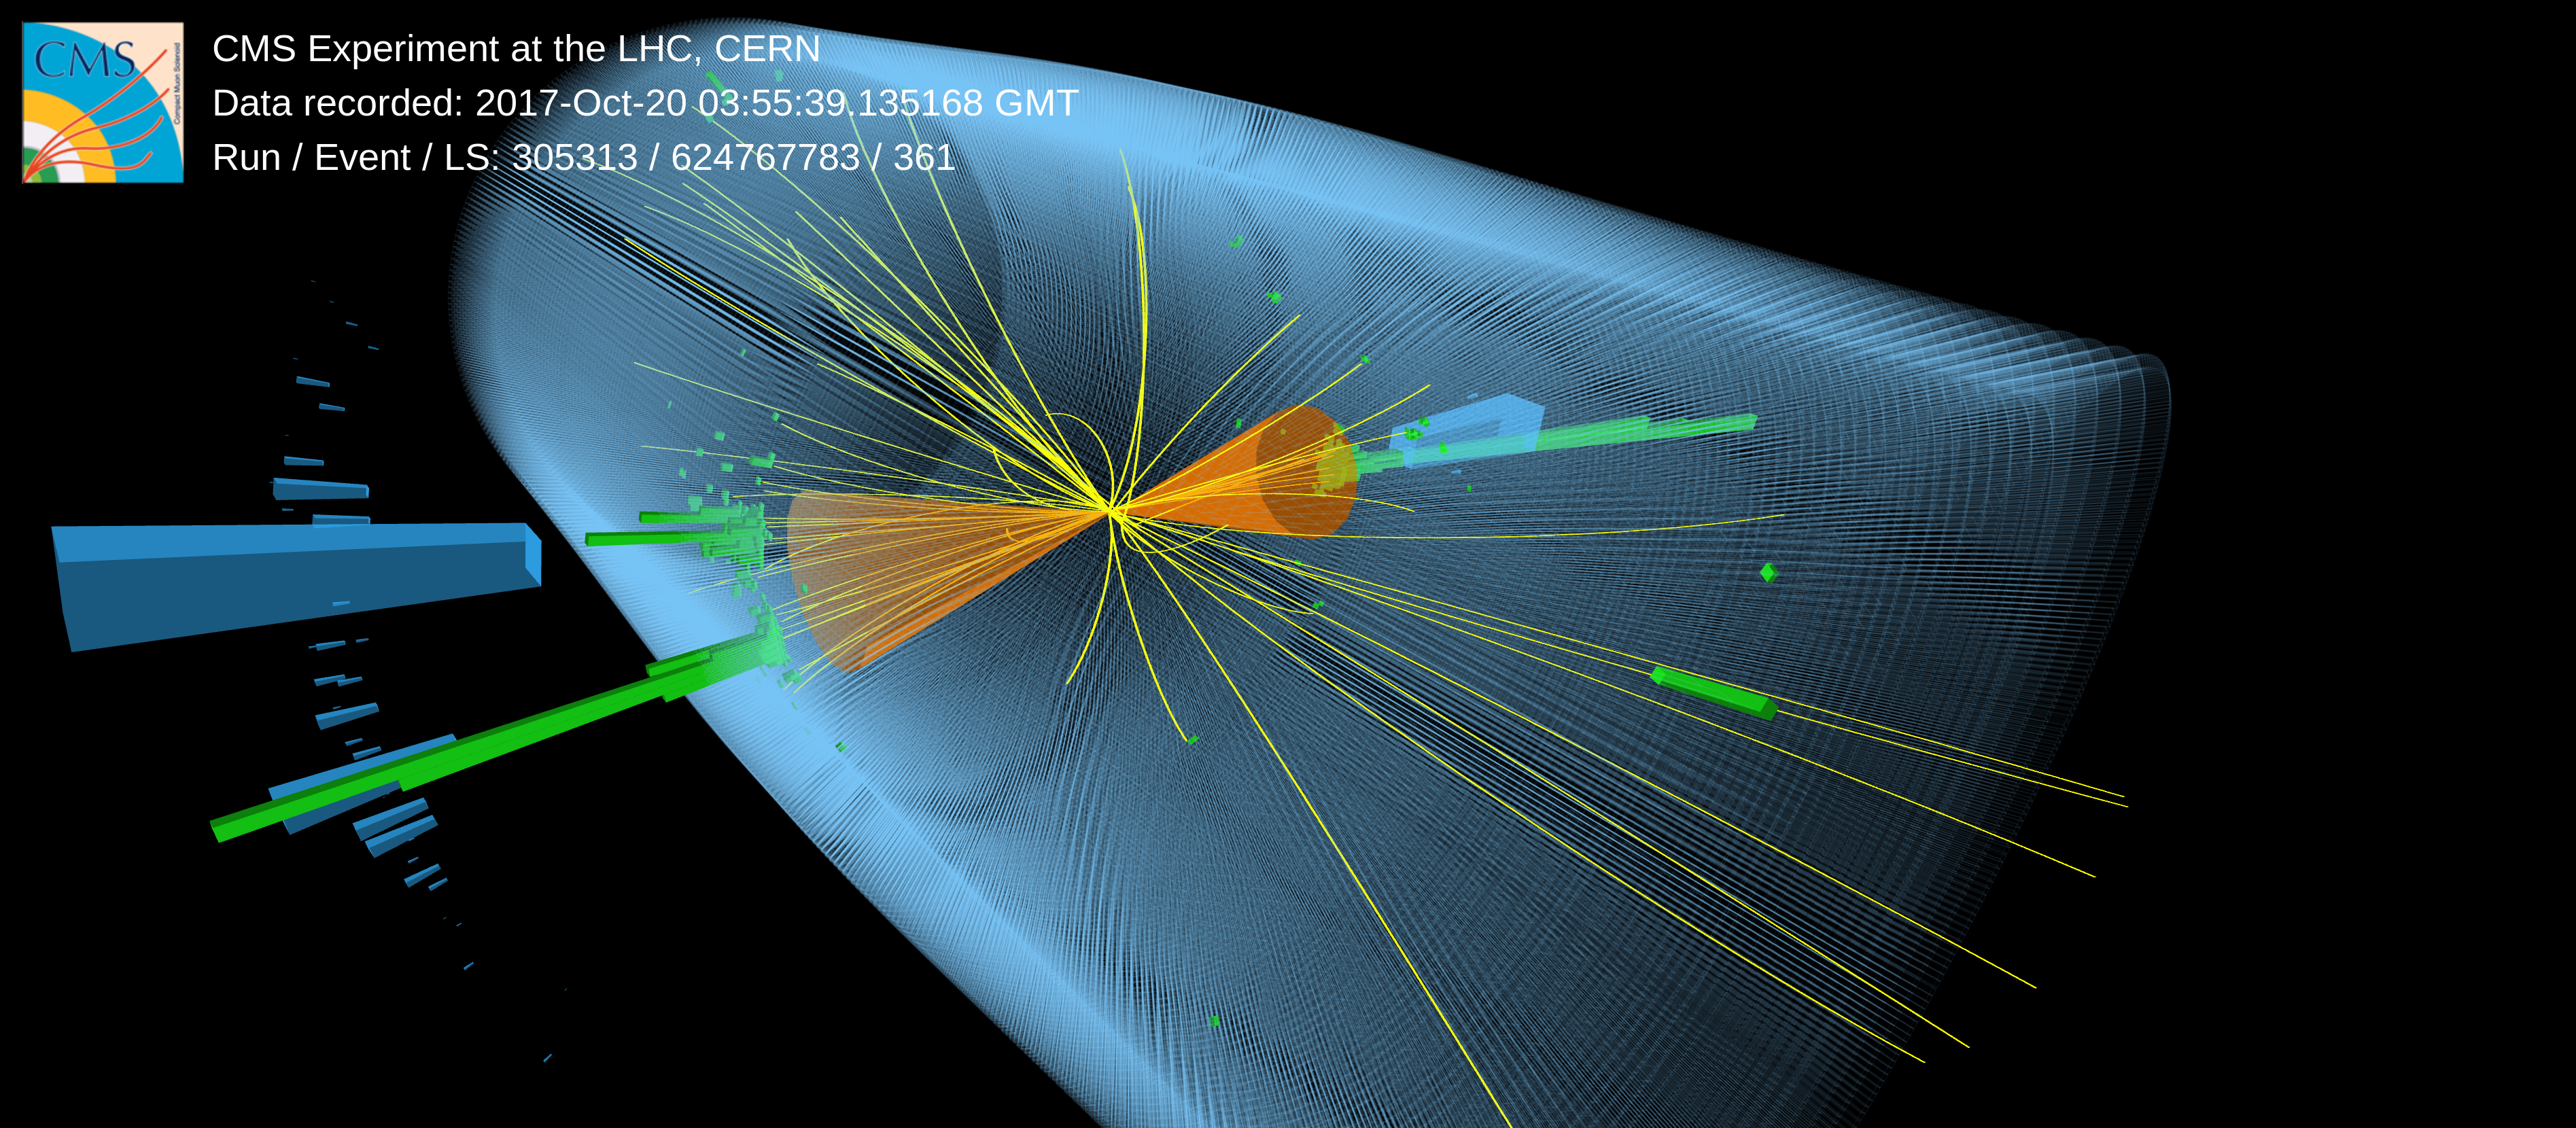
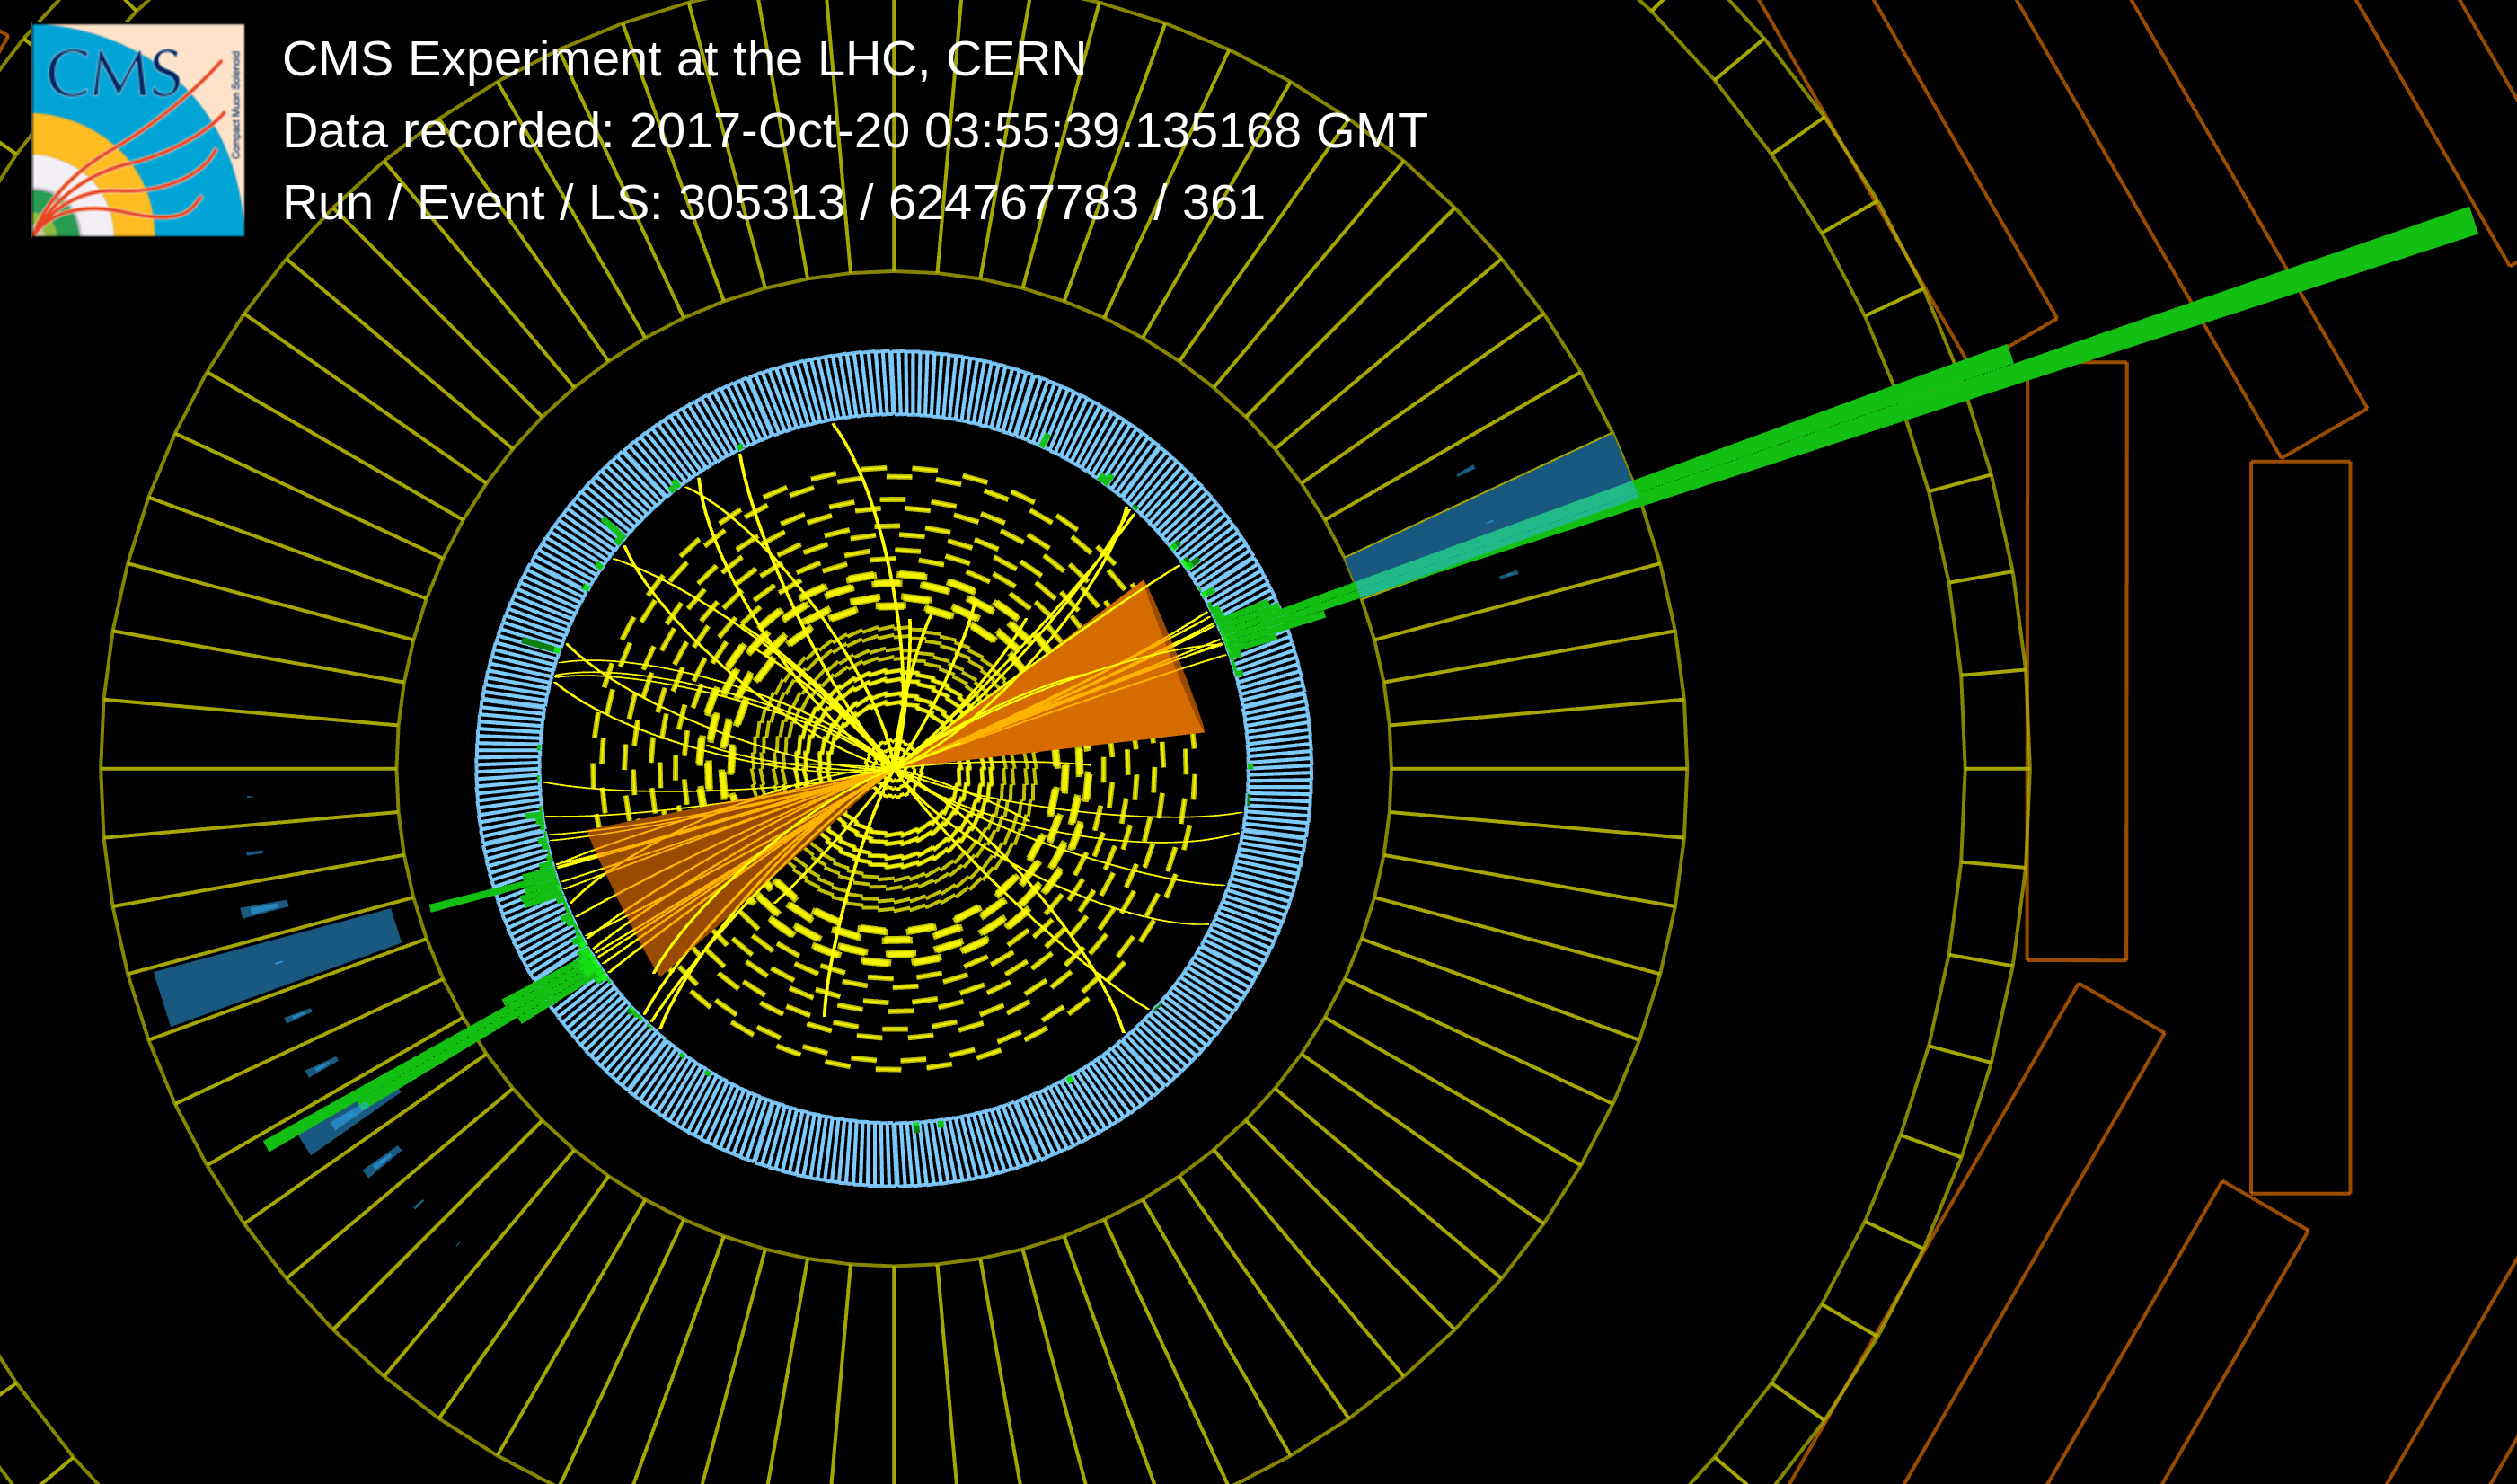
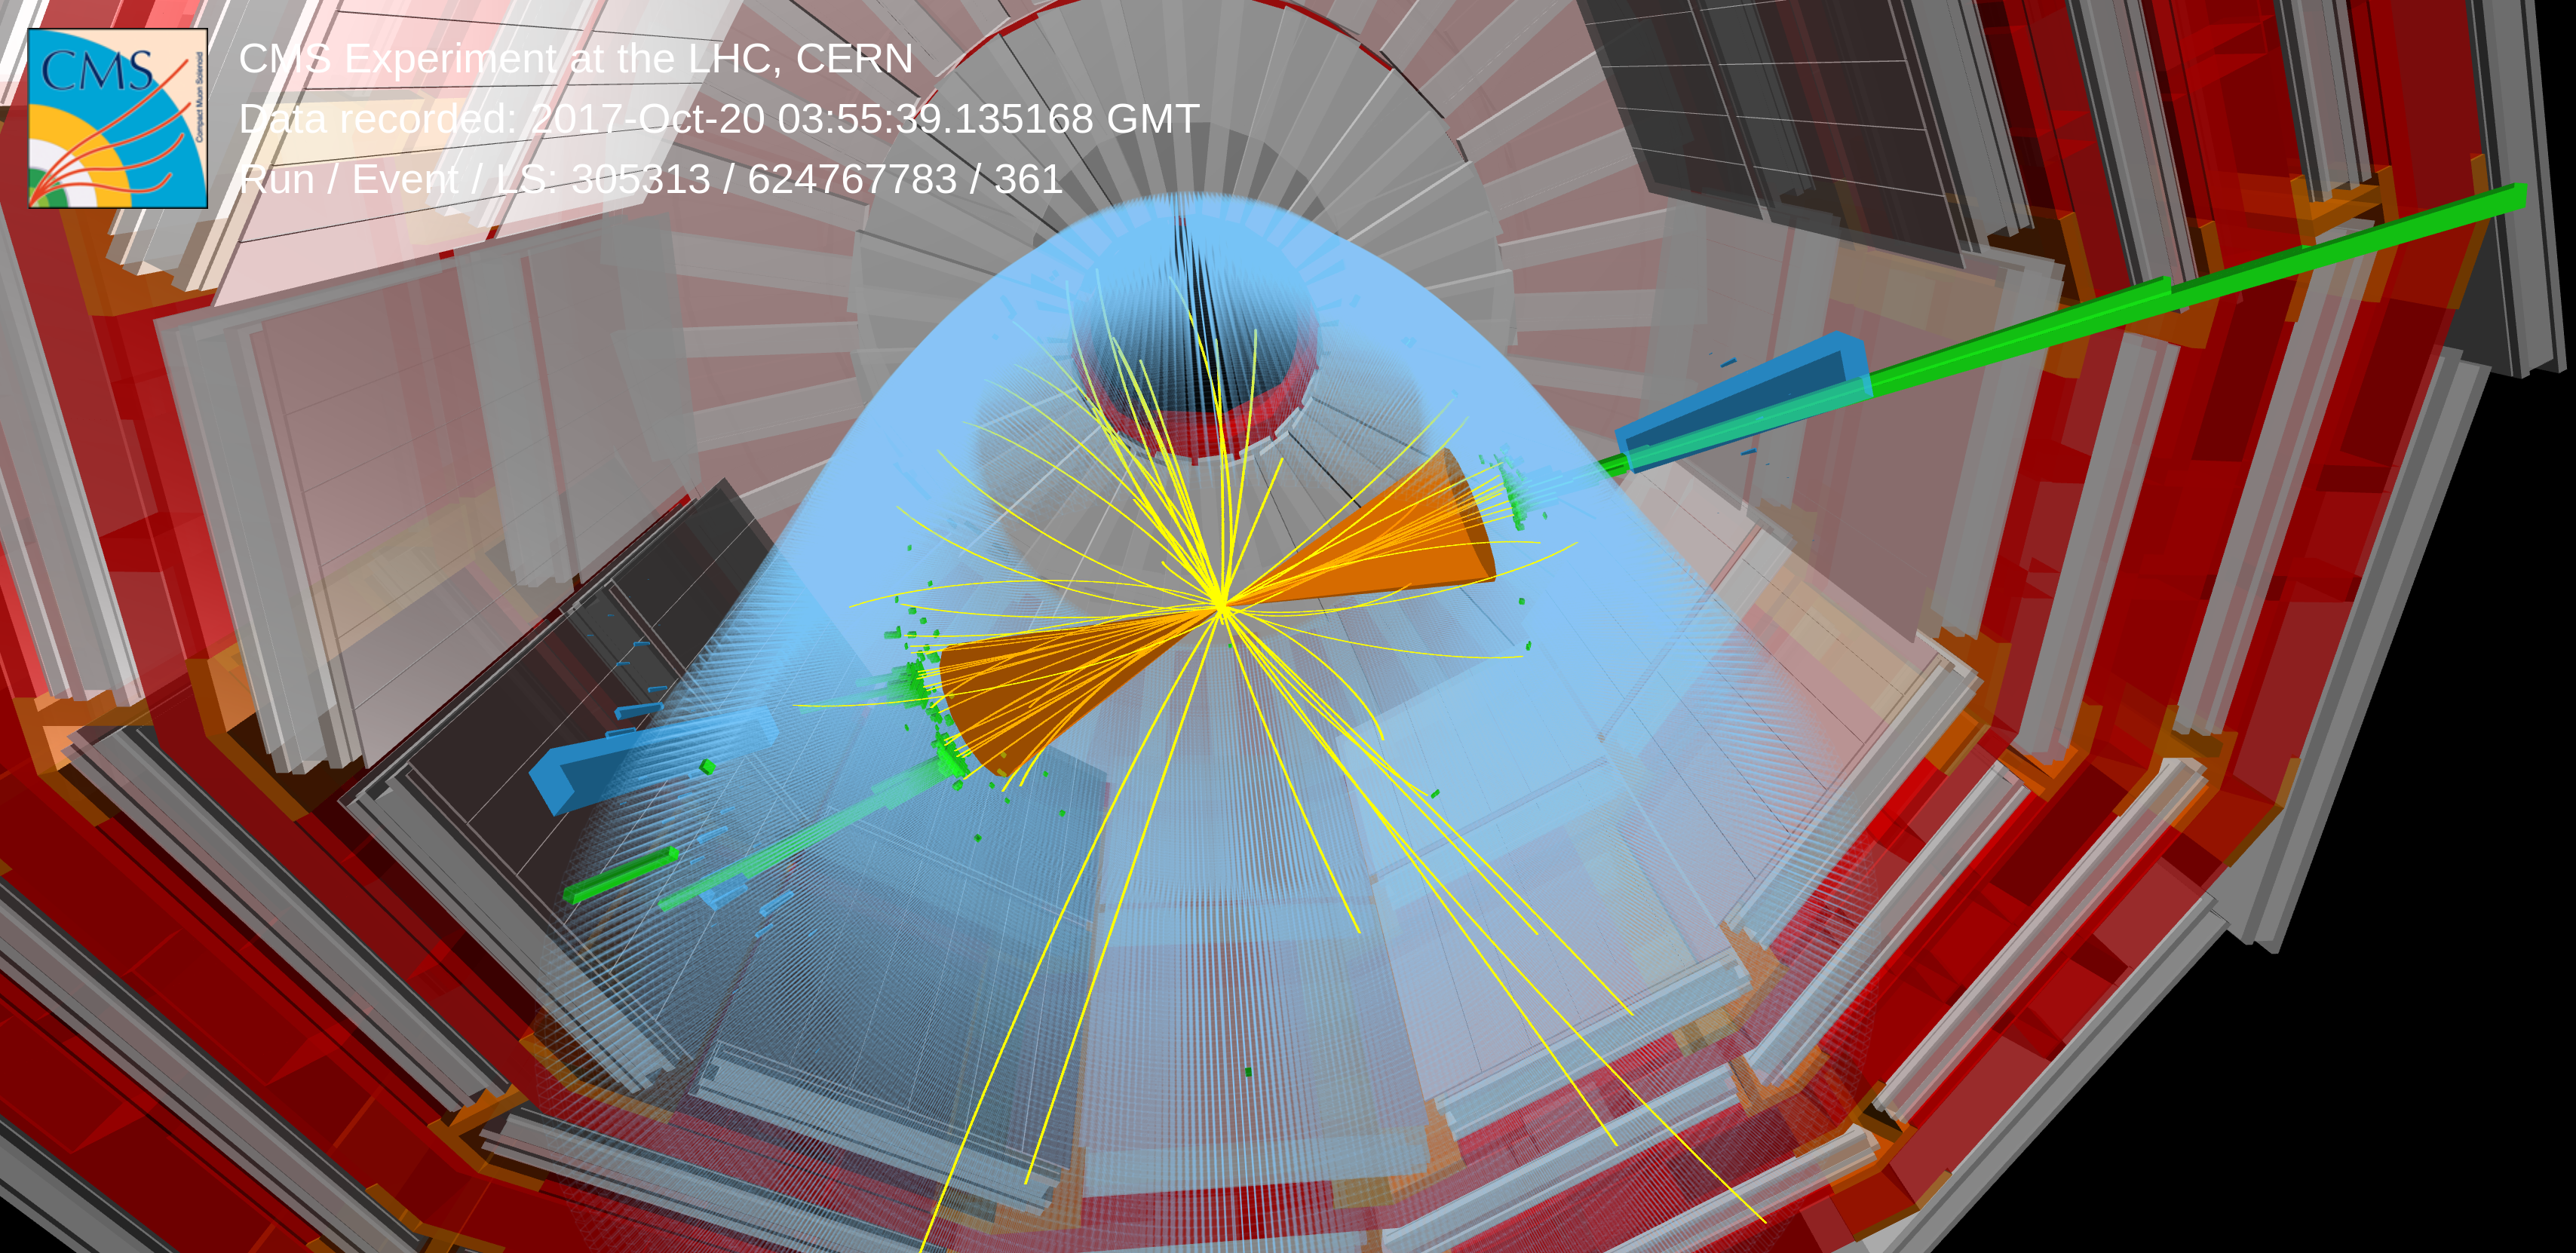
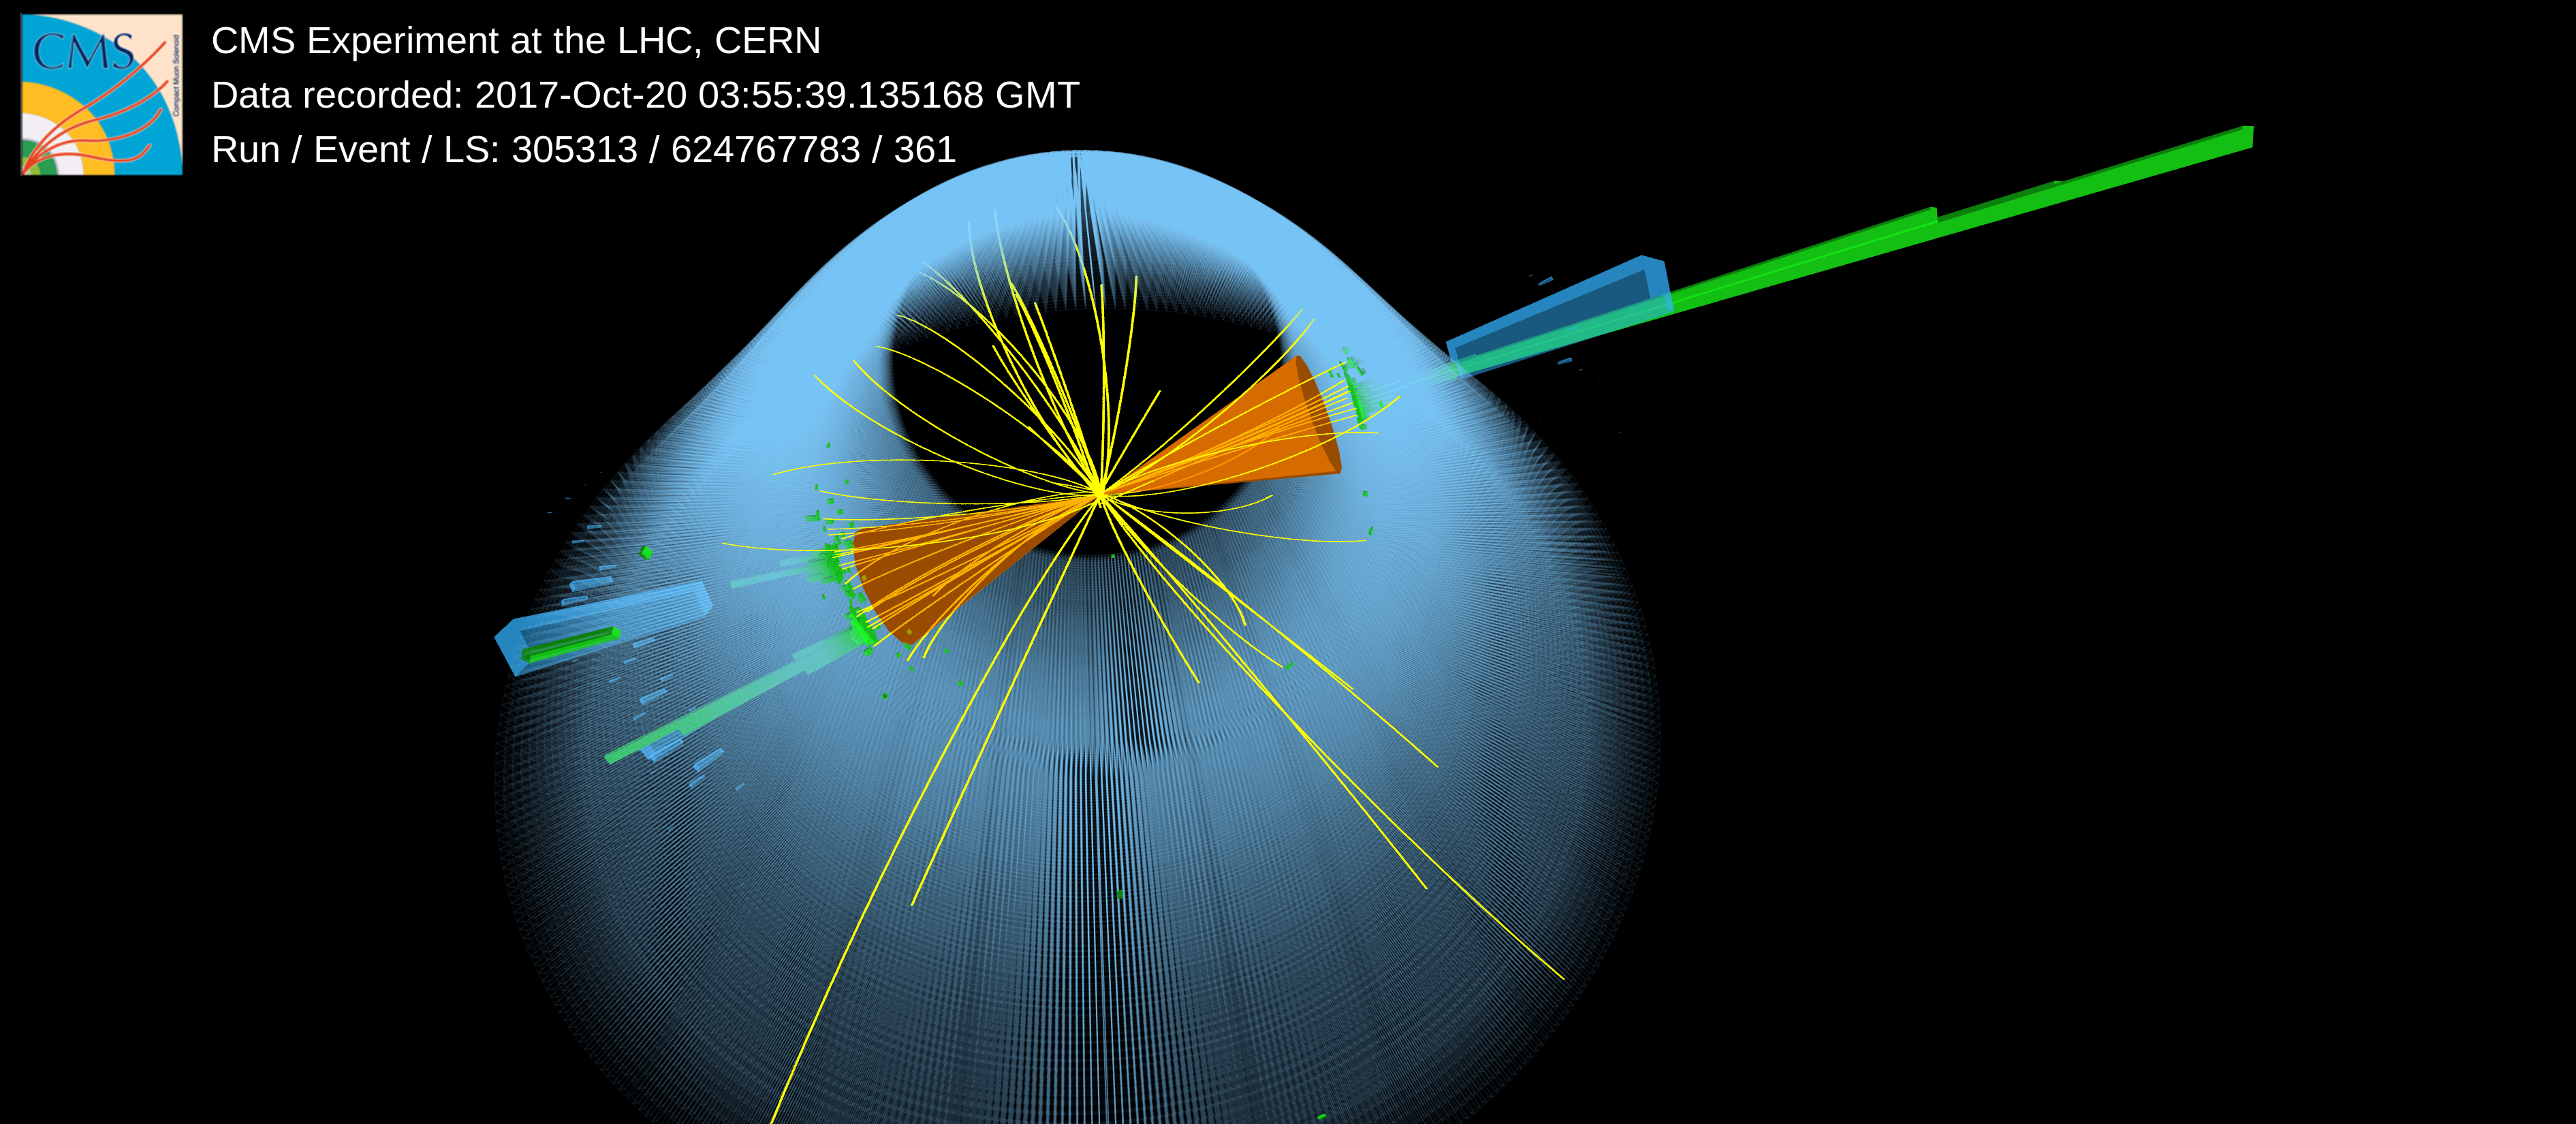
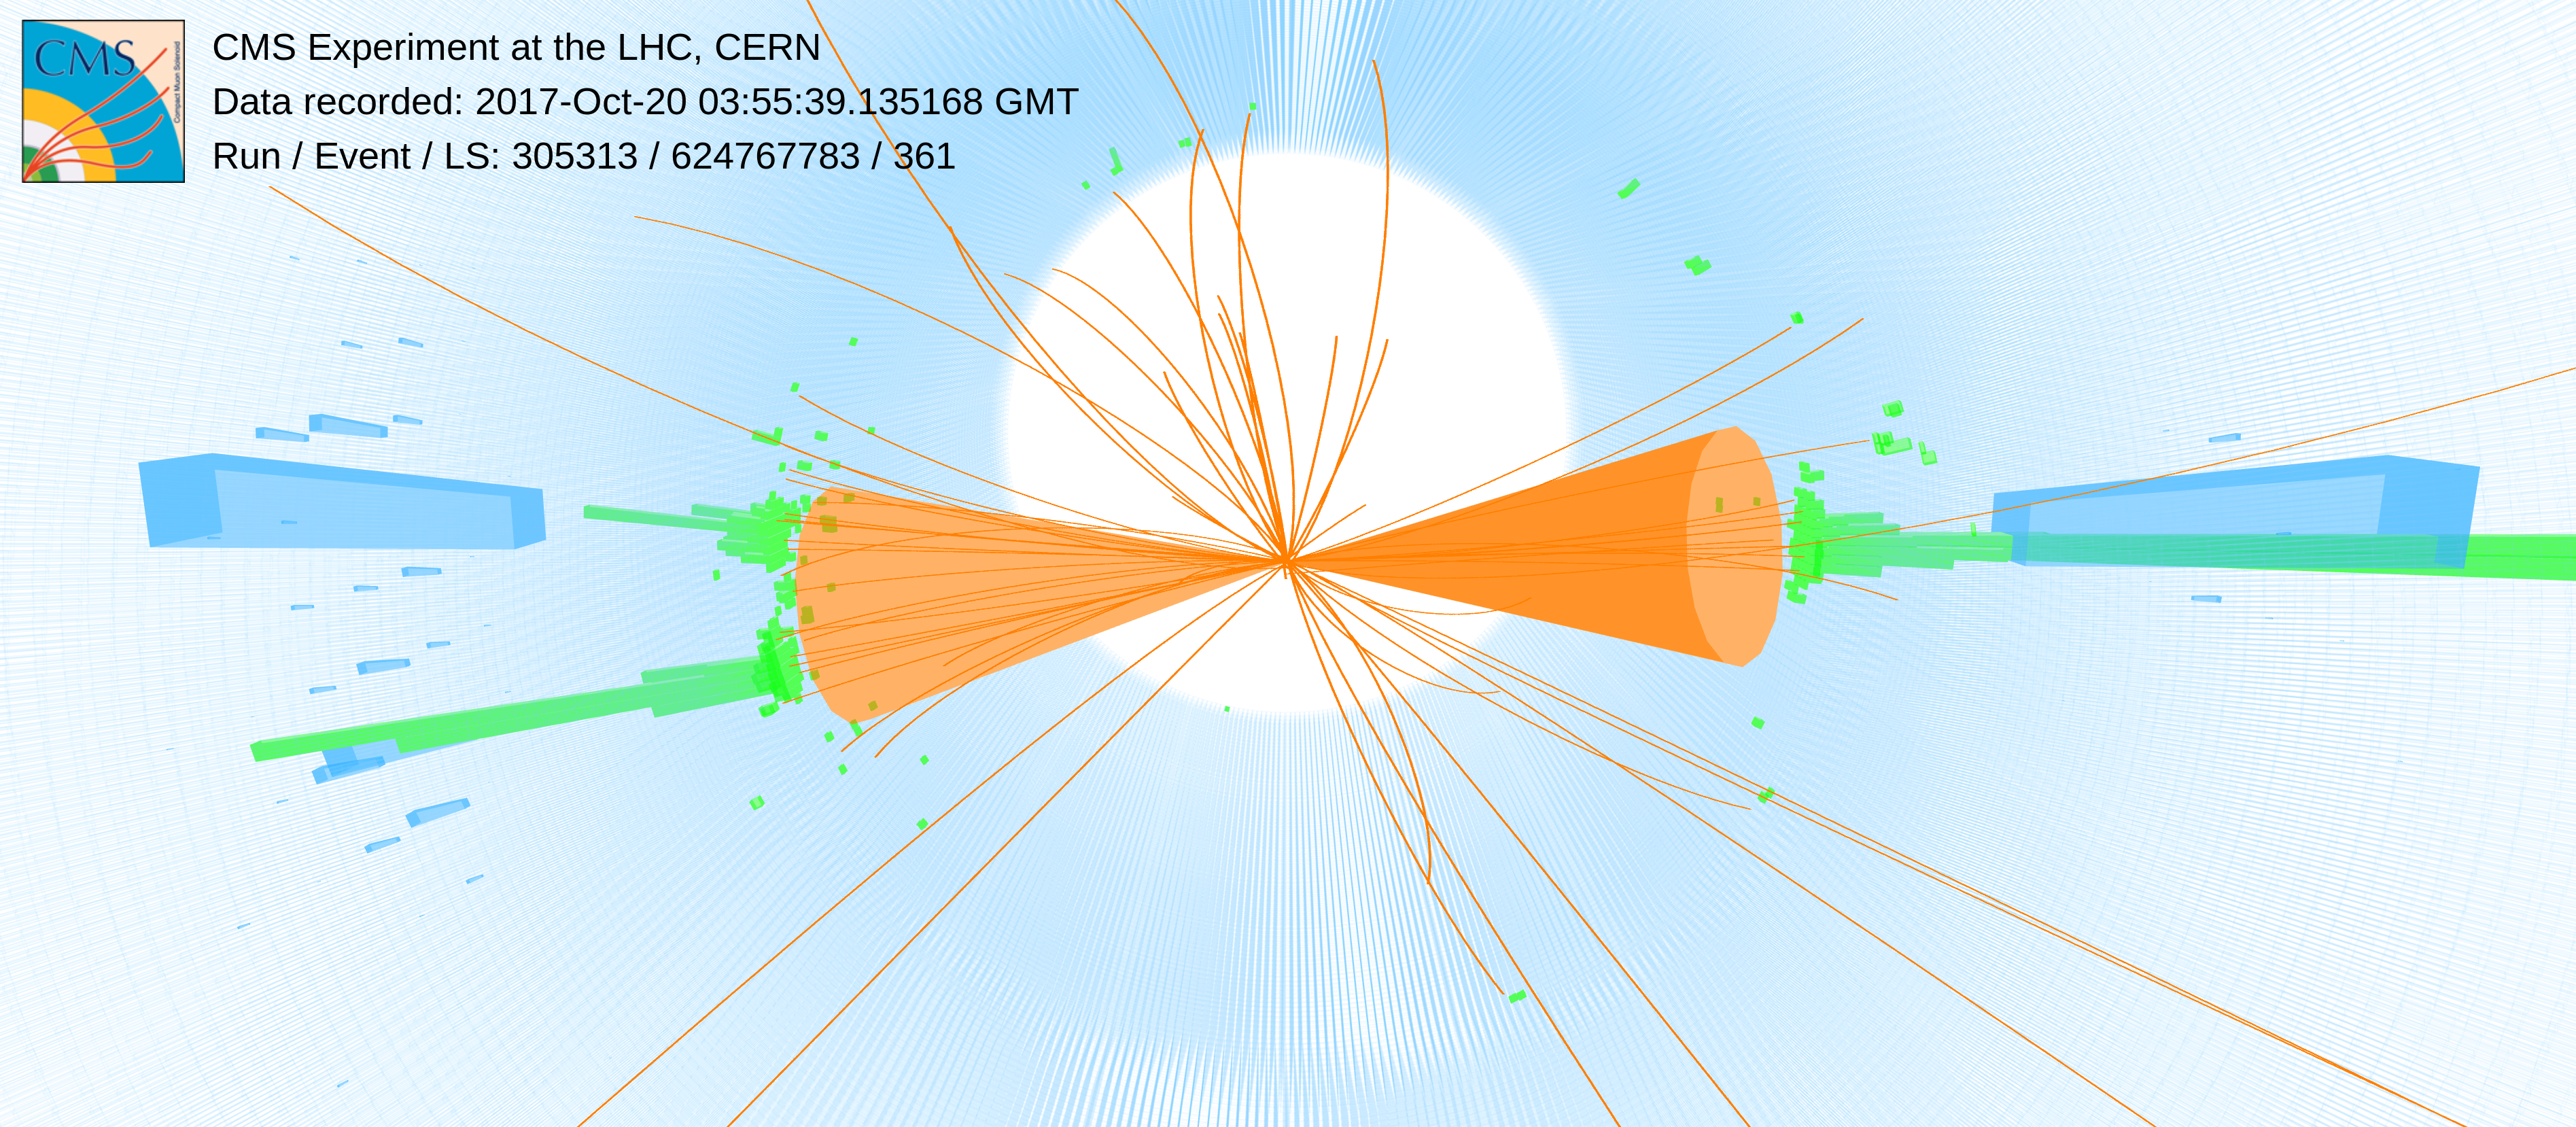
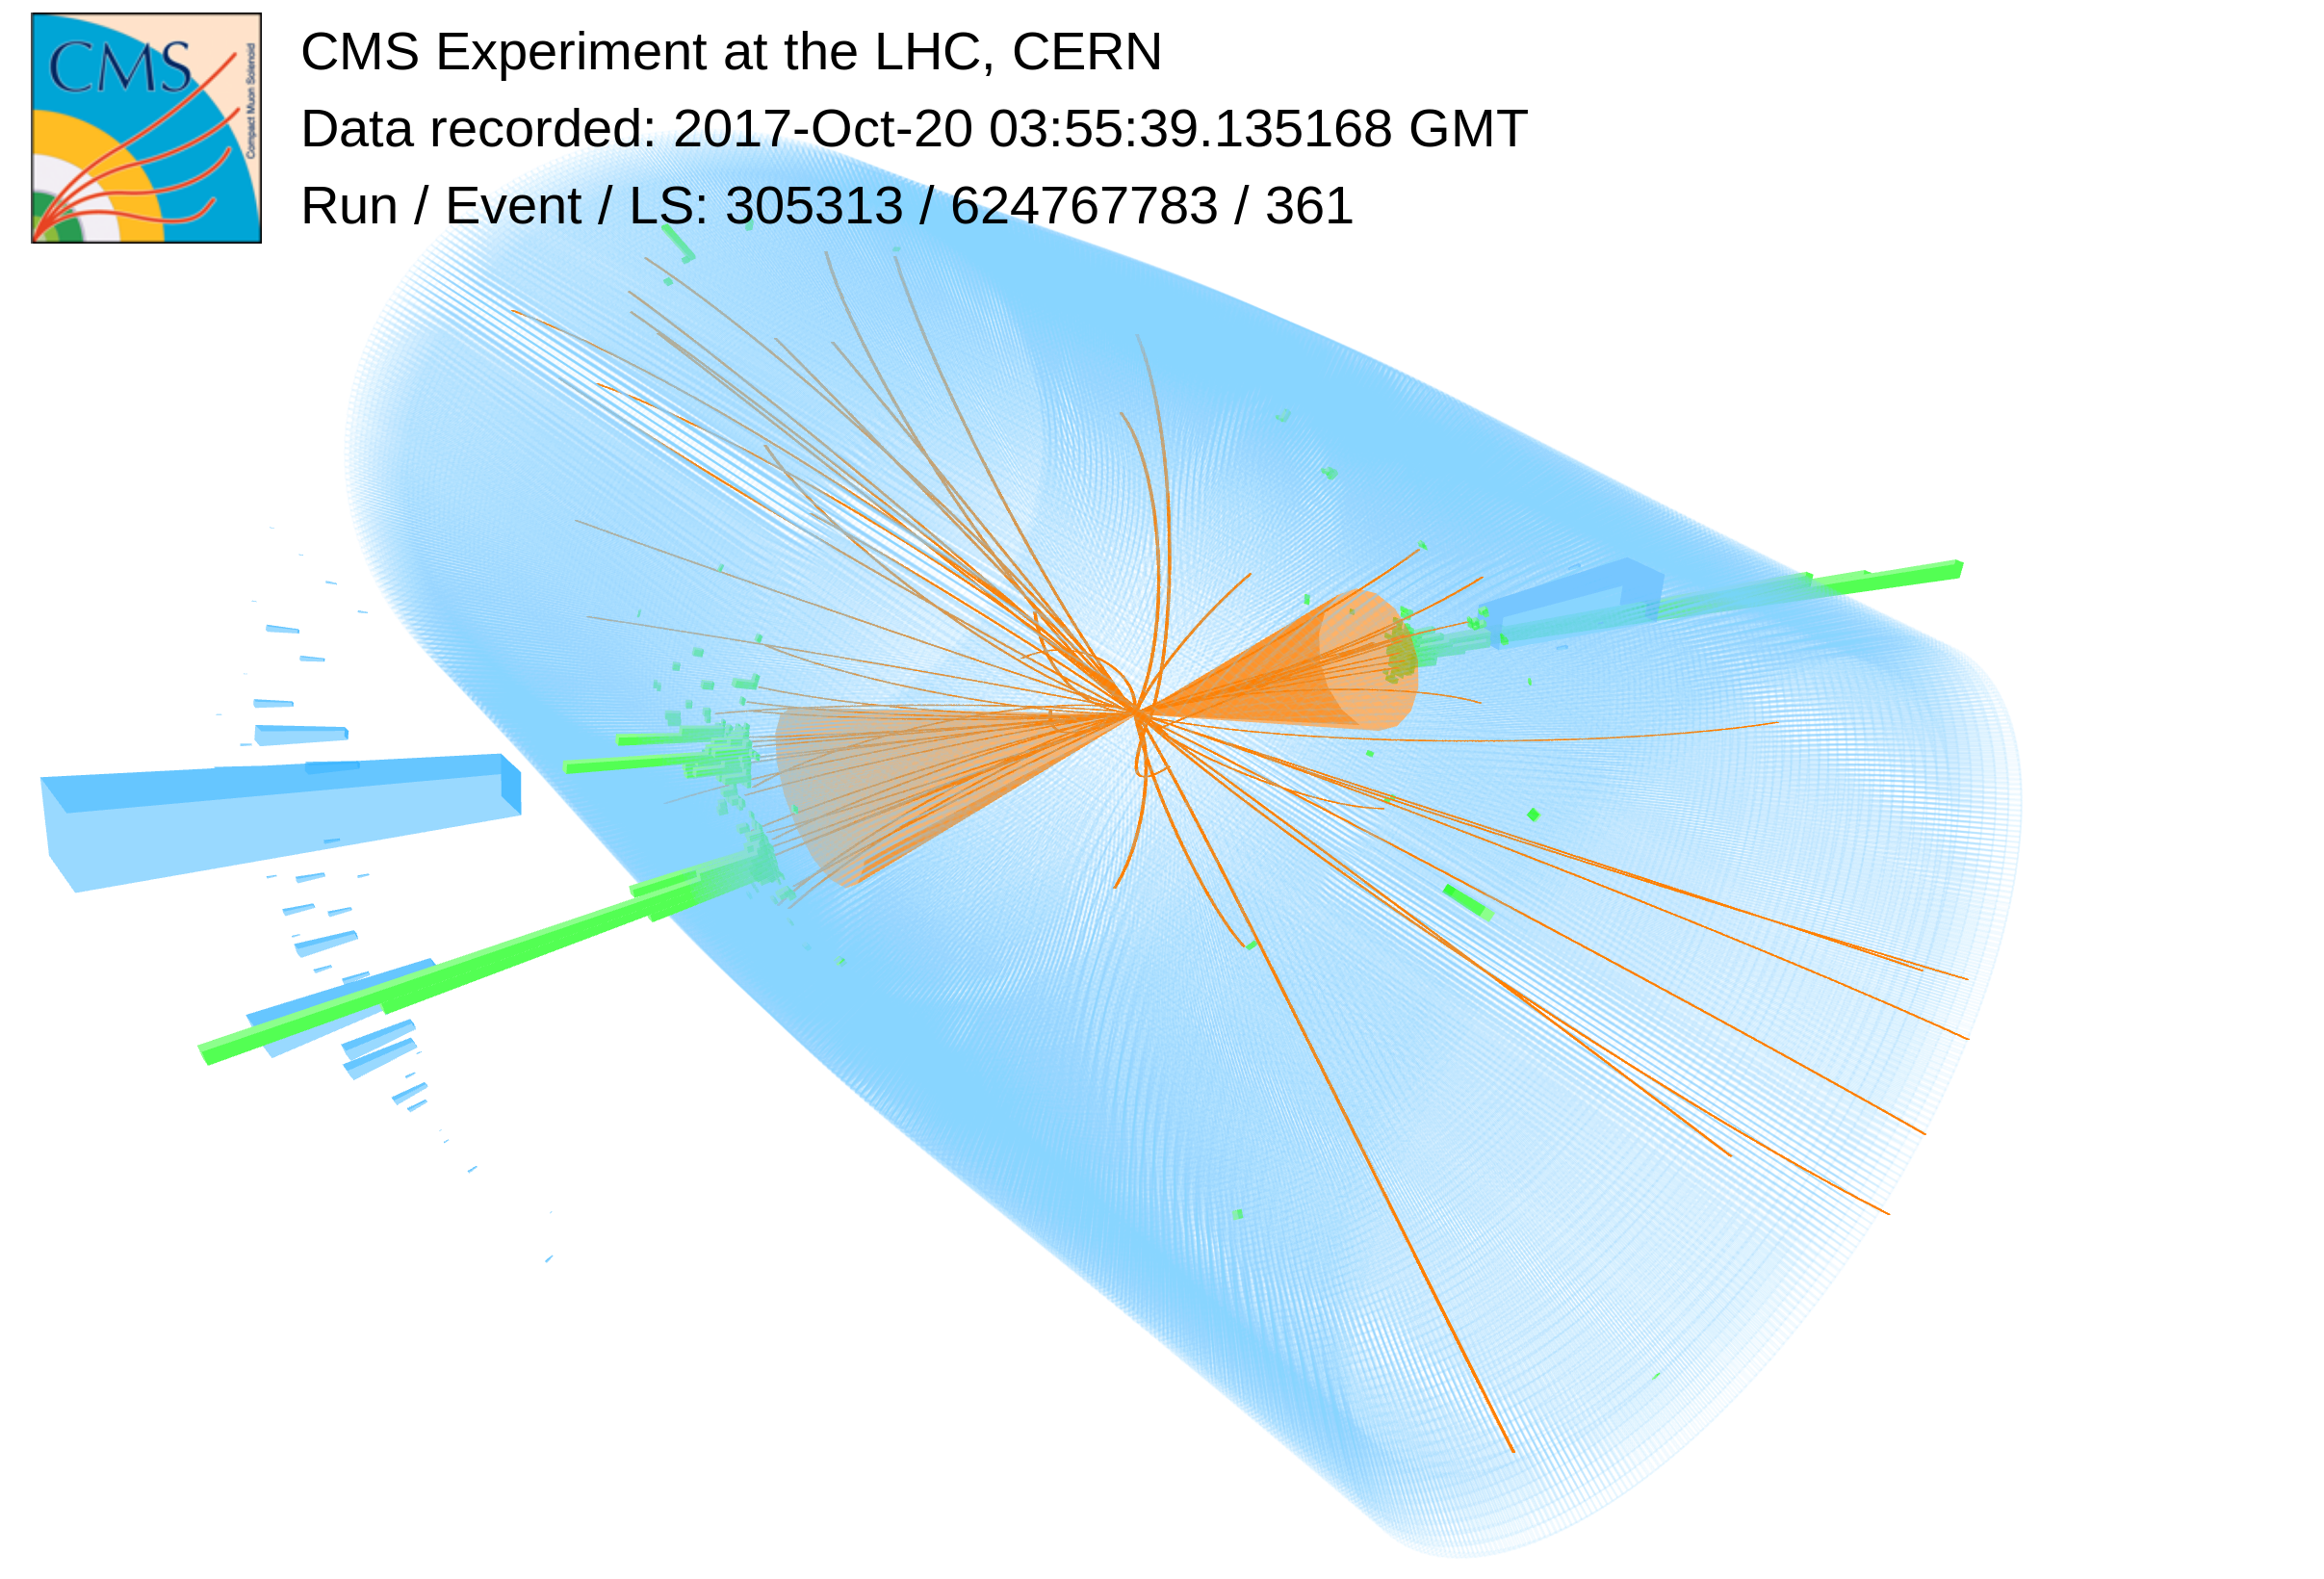
Additional Figure 4:
Candidate event in which a Higgs boson produced at large transverse momentum decays into a collimated bottom quark-antiquark pair, which are reconstructed as a single large-radius jet with two-prong substructure, represented by the orange cone on the left part of the display. The Higgs boson is recoiling against a jet, represented by the orange cone on the right side of the display. The electromagnetic and hadronic contributions are represented by green and blue boxes, respectively. The event signature is consistent with standard model processes. |
png |
Additional Figure 4-a:
Candidate event in which a Higgs boson produced at large transverse momentum decays into a collimated bottom quark-antiquark pair, which are reconstructed as a single large-radius jet with two-prong substructure, represented by the orange cone on the left part of the display. The Higgs boson is recoiling against a jet, represented by the orange cone on the right side of the display. The electromagnetic and hadronic contributions are represented by green and blue boxes, respectively. The event signature is consistent with standard model processes. |
png |
Additional Figure 4-b:
Candidate event in which a Higgs boson produced at large transverse momentum decays into a collimated bottom quark-antiquark pair, which are reconstructed as a single large-radius jet with two-prong substructure, represented by the orange cone on the left part of the display. The Higgs boson is recoiling against a jet, represented by the orange cone on the right side of the display. The electromagnetic and hadronic contributions are represented by green and blue boxes, respectively. The event signature is consistent with standard model processes. |
png |
Additional Figure 4-c:
Candidate event in which a Higgs boson produced at large transverse momentum decays into a collimated bottom quark-antiquark pair, which are reconstructed as a single large-radius jet with two-prong substructure, represented by the orange cone on the left part of the display. The Higgs boson is recoiling against a jet, represented by the orange cone on the right side of the display. The electromagnetic and hadronic contributions are represented by green and blue boxes, respectively. The event signature is consistent with standard model processes. |
png |
Additional Figure 4-d:
Candidate event in which a Higgs boson produced at large transverse momentum decays into a collimated bottom quark-antiquark pair, which are reconstructed as a single large-radius jet with two-prong substructure, represented by the orange cone on the left part of the display. The Higgs boson is recoiling against a jet, represented by the orange cone on the right side of the display. The electromagnetic and hadronic contributions are represented by green and blue boxes, respectively. The event signature is consistent with standard model processes. |
png |
Additional Figure 4-e:
Candidate event in which a Higgs boson produced at large transverse momentum decays into a collimated bottom quark-antiquark pair, which are reconstructed as a single large-radius jet with two-prong substructure, represented by the orange cone on the left part of the display. The Higgs boson is recoiling against a jet, represented by the orange cone on the right side of the display. The electromagnetic and hadronic contributions are represented by green and blue boxes, respectively. The event signature is consistent with standard model processes. |
png |
Additional Figure 4-f:
Candidate event in which a Higgs boson produced at large transverse momentum decays into a collimated bottom quark-antiquark pair, which are reconstructed as a single large-radius jet with two-prong substructure, represented by the orange cone on the left part of the display. The Higgs boson is recoiling against a jet, represented by the orange cone on the right side of the display. The electromagnetic and hadronic contributions are represented by green and blue boxes, respectively. The event signature is consistent with standard model processes. |
png |
Additional Figure 4-g:
Candidate event in which a Higgs boson produced at large transverse momentum decays into a collimated bottom quark-antiquark pair, which are reconstructed as a single large-radius jet with two-prong substructure, represented by the orange cone on the left part of the display. The Higgs boson is recoiling against a jet, represented by the orange cone on the right side of the display. The electromagnetic and hadronic contributions are represented by green and blue boxes, respectively. The event signature is consistent with standard model processes. |
| References | ||||
| 1 | A. Salam | Weak and electromagnetic interactions | in Elementary particle physics: relativistic groups and analyticity, Almqvist \& Wiksell, Stockholm, 1968, Proceedings of the eighth Nobel symposium | |
| 2 | S. L. Glashow | Partial-symmetries of weak interactions | NP 22 (1961) 579 | |
| 3 | S. Weinberg | A model of leptons | PRL 19 (1967) 1264 | |
| 4 | F. Englert and R. Brout | Broken symmetry and the mass of gauge vector mesons | PRL 13 (1964) 321 | |
| 5 | P. W. Higgs | Broken symmetries, massless particles and gauge fields | PRL 12 (1964) 132 | |
| 6 | P. W. Higgs | Broken symmetries and the masses of gauge bosons | PRL 13 (1964) 508 | |
| 7 | P. W. Higgs | Spontaneous symmetry breakdown without massless bosons | PRL 145 (1966) 1156 | |
| 8 | G. S. Guralnik, C. R. Hagen, and T. W. B. Kibble | Global conservation laws and massless particless | PRL 13 (1964) 585 | |
| 9 | ATLAS Collaboration | Observation of a new particle in the search for the standard model Higgs boson with the ATLAS detector at the LHC | PLB 716 (2012) 1 | 1207.7214 |
| 10 | CMS Collaboration | Observation of a new boson at a mass of 125 GeV with the CMS experiment at the LHC | PLB 716 (2012) 30 | CMS-HIG-12-028 1207.7235 |
| 11 | CMS Collaboration | Observation of a new boson with mass near 125 GeV in pp collisions at $ \sqrt{s} = $ 7 and 8 TeV | JHEP 06 (2013) 081 | CMS-HIG-12-036 1303.4571 |
| 12 | CMS Collaboration | Observation of Higgs boson decay to bottom quarks | PRL 121 (2018) 121801 | CMS-HIG-18-016 1808.08242 |
| 13 | ATLAS Collaboration | Observation of $ \mathrm{H} \rightarrow \mathrm{b\bar{b}} $ decays and $ \mathrm{V}\mathrm{H} $ production with the ATLAS detector | PLB 786 (2018) 59 | 1808.08238 |
| 14 | ATLAS Collaboration | Measurements of $ \mathrm{W}\mathrm{H} $ and $ \mathrm{Z}\mathrm{H} $ production in the $ \mathrm{H}\to\mathrm{b\bar{b}} $ decay channel in $ {\mathrm{p}}{\mathrm{p}} $ collisions at 13 TeV with the ATLAS detector | ATLAS Conference Note ATLAS-CONF-2020-006 | |
| 15 | LHC Higgs Cross Section Working Group | Handbook of LHC Higgs cross sections: 4. deciphering the nature of the Higgs sector | CERN (2016) | 1610.07922 |
| 16 | CMS Collaboration | Inclusive search for a highly boosted Higgs boson decaying to a bottom quark-antiquark pair | PRL 120 (2018) 071802 | CMS-HIG-17-010 1709.05543 |
| 17 | ATLAS Collaboration | Search for boosted resonances decaying to two b-quarks and produced in association with a jet at $ \sqrt{s}= $ 13 TeV with the ATLAS detector | ATLAS Conference Note ATLAS-CONF-2018-052 | |
| 18 | CMS Collaboration | Measurement and interpretation of differential cross sections for Higgs boson production at $ \sqrt{s} = $ 13 TeV | PLB 792 (2019) 369 | CMS-HIG-17-028 1812.06504 |
| 19 | C. Grojean, E. Salvioni, M. Schlaffer, and A. Weiler | Very boosted Higgs in gluon fusion | JHEP 05 (2014) 022 | 1312.3317 |
| 20 | J. M. Butterworth, A. R. Davison, M. Rubin, and G. P. Salam | Jet substructure as a new Higgs-search channel at the Large Hadron Collider | PRL 100 (2008) 242001 | 0802.2470 |
| 21 | K. Hamilton, P. Nason, C. Oleari, and G. Zanderighi | Merging $ \mathrm{H} $/W/Z + 0 and 1 jet at NLO with no merging scale: a path to parton shower + NNLO matching | JHEP 05 (2013) 082 | 1212.4504 |
| 22 | LHC Higgs Cross Section Working Group | Recommended predictions for the boosted-Higgs cross section | technical report | |
| 23 | S. P. Jones, M. Kerner, and G. Luisoni | Next-to-leading-order QCD corrections to Higgs boson plus jet production with full top-quark mass dependence | PRL 120 (2018) 162001 | 1802.00349 |
| 24 | J. M. Lindert, K. Kudashkin, K. Melnikov, and C. Wever | Higgs bosons with large transverse momentum at the LHC | PLB 782 (2018) 210 | 1801.08226 |
| 25 | CMS Collaboration | The CMS trigger system | JINST 12 (2017) P01020 | CMS-TRG-12-001 1609.02366 |
| 26 | CMS Collaboration | The CMS experiment at the CERN LHC | JINST 3 (2008) S08004 | CMS-00-001 |
| 27 | GEANT4 Collaboration | GEANT4--a simulation toolkit | NIMA 506 (2003) 250 | |
| 28 | J. Alwall et al. | The automated computation of tree-level and next-to-leading order differential cross sections, and their matching to parton shower simulations | JHEP 07 (2014) 079 | 1405.0301 |
| 29 | J. Alwall et al. | Comparative study of various algorithms for the merging of parton showers and matrix elements in hadronic collisions | EPJC 53 (2008) 473 | 0706.2569 |
| 30 | P. Nason | A new method for combining NLO QCD with shower Monte Carlo algorithms | JHEP 11 (2004) 040 | hep-ph/0409146 |
| 31 | S. Frixione, P. Nason, and C. Oleari | Matching NLO QCD computations with parton shower simulations: the POWHEG method | JHEP 11 (2007) 070 | 0709.2092 |
| 32 | S. Alioli, P. Nason, C. Oleari, and E. Re | A general framework for implementing NLO calculations in shower Monte Carlo programs: the POWHEG BOX | JHEP 06 (2010) 043 | 1002.2581 |
| 33 | S. Frixione, P. Nason, and G. Ridolfi | A Positive-weight next-to-leading-order Monte Carlo for heavy flavour hadroproduction | JHEP 09 (2007) 126 | 0707.3088 |
| 34 | R. Frederix, E. Re, and P. Torrielli | Single-top $ \mathrm{t} $-channel hadroproduction in the four-flavour scheme with POWHEG and aMC@NLO | JHEP 09 (2012) 130 | 1207.5391 |
| 35 | E. Re | Single-top $ \mathrm{W}\mathrm{t} $-channel production matched with parton showers using the POWHEG method | EPJC 71 (2011) 1547 | 1009.2450 |
| 36 | T. Sjostrand et al. | An introduction to PYTHIA 8.2 | CPC 191 (2015) 159 | 1410.3012 |
| 37 | G. Luisoni, P. Nason, C. Oleari, and F. Tramontano | $ \mathrm{H}\mathrm{W}^{\pm} $/$ \mathrm{H}\mathrm{Z} $+0 and 1 jet at NLO with the POWHEG box interfaced to GoSam and their merging within MINLO | JHEP 10 (2013) 083 | 1306.2542 |
| 38 | P. Nason and C. Oleari | NLO Higgs boson production via vector-boson fusion matched with shower in POWHEG | JHEP 02 (2010) 037 | 0911.5299 |
| 39 | H. B. Hartanto, B. Jager, L. Reina, and D. Wackeroth | Higgs boson production in association with top quarks in the POWHEG BOX | PRD 91 (2015) 094003 | 1501.04498 |
| 40 | M. Cacciari et al. | Fully differential vector-boson-fusion Higgs production at next-to-next-to-leading order | PRL 115 (2015) 082002 | 1506.02660 |
| 41 | F. A. Dreyer and A. Karlberg | Vector-boson fusion Higgs production at three loops in qcd | PRL 117 (2016) 072001 | 1606.00840 |
| 42 | CMS Collaboration | Event generator tunes obtained from underlying event and multiparton scattering measurements | EPJC 76 (2016) 155 | CMS-GEN-14-001 1512.00815 |
| 43 | CMS Collaboration | Extraction and validation of a new set of CMS PYTHIA 8 tunes from underlying-event measurements | EPJC 80 (2020) 4 | CMS-GEN-17-001 1903.12179 |
| 44 | NNPDF Collaboration | Parton distributions for the LHC run II | JHEP 04 (2015) 040 | 1410.8849 |
| 45 | NNPDF Collaboration | Parton distributions from high-precision collider data | EPJC 77 (2017) 663 | 1706.00428 |
| 46 | J. M. Campbell and R. K. Ellis | $ MCFM $ for the Tevatron and the LHC | NPPS 205-206 (2010) 10 | 1007.3492 |
| 47 | S. Kallweit et al. | NLO electroweak automation and precise predictions for W+multijet production at the LHC | JHEP 04 (2015) 012 | 1412.5157 |
| 48 | S. Kallweit et al. | NLO QCD+EW predictions for V+jets including off-shell vector-boson decays and multijet merging | JHEP 04 (2016) 021 | 1511.08692 |
| 49 | S. Kallweit et al. | NLO QCD+EW automation and precise predictions for V+multijet production | in Proceedings, 50th Rencontres de Moriond, QCD and high energy interactions, p. 121 2015 | 1505.05704 |
| 50 | J. M. Lindert et al. | Precise predictions for V+jets dark matter backgrounds | EPJC 77 (2017) 829 | 1705.04664 |
| 51 | CMS Collaboration | Particle-flow reconstruction and global event description with the CMS detector | JINST 12 (2017) P10003 | CMS-PRF-14-001 1706.04965 |
| 52 | M. Cacciari, G. P. Salam, and G. Soyez | The anti-$ {k_{\mathrm{T}}} $ jet clustering algorithm | JHEP 04 (2008) 063 | 0802.1189 |
| 53 | M. Cacciari, G. P. Salam, and G. Soyez | FastJet user manual | EPJC 72 (2012) 1896 | 1111.6097 |
| 54 | D. Bertolini, P. Harris, M. Low, and N. Tran | Pileup per particle identification | JHEP 10 (2014) 059 | 1407.6013 |
| 55 | CMS Collaboration | Jet energy scale and resolution in the CMS experiment in pp collisions at 8 TeV | JINST 12 (2017) P02014 | CMS-JME-13-004 1607.03663 |
| 56 | D. Krohn, J. Thaler, and L. Wang | Jet trimming | JHEP 02 (2010) 084 | 0912.1342 |
| 57 | CMS Collaboration | Performance of electron reconstruction and selection with the CMS detector in proton-proton collisions at $ \sqrt{s}= $ 8 TeV | JINST 10 (2015) P06005 | CMS-EGM-13-001 1502.02701 |
| 58 | CMS Collaboration | Performance of the CMS muon detector and muon reconstruction with proton-proton collisions at $ \sqrt{s}= $ 13 TeV | JINST 13 (2018) P06015 | CMS-MUO-16-001 1804.04528 |
| 59 | CMS Collaboration | Identification of heavy-flavour jets with the CMS detector in pp collisions at 13 TeV | JINST 13 (2018) P05011 | CMS-BTV-16-002 1712.07158 |
| 60 | A. J. Larkoski, S. Marzani, G. Soyez, and J. Thaler | Soft drop | JHEP 05 (2014) 146 | 1402.2657 |
| 61 | M. Dasgupta, A. Fregoso, S. Marzani, and G. P. Salam | Towards an understanding of jet substructure | JHEP 09 (2013) 029 | 1307.0007 |
| 62 | CMS Collaboration | Jet algorithms performance in 13 TeV data | CMS-PAS-JME-16-003 | CMS-PAS-JME-16-003 |
| 63 | J. Dolen et al. | Thinking outside the ROCs: Designing decorrelated taggers (DDT) for jet substructure | JHEP 05 (2016) 156 | 1603.00027 |
| 64 | I. Moult, L. Necib, and J. Thaler | New angles on energy correlation functions | JHEP 12 (2016) 153 | 1609.07483 |
| 65 | A. J. Larkoski, G. P. Salam, and J. Thaler | Energy correlation functions for jet substructure | JHEP 06 (2013) 108 | 1305.0007 |
| 66 | J. Thaler and K. Van Tilburg | Identifying boosted objects with N-subjettiness | JHEP 03 (2011) 015 | 1011.2268 |
| 67 | CMS Collaboration | Performance of deep tagging algorithms for boosted double quark jet topology in proton-proton collisions at 13 TeV with the Phase-0 CMS detector | CDS | |
| 68 | R. A. Fisher | On the interpretation of $ \chi^{2} $ from contingency tables, and the calculation of P | Journal of the Royal Statistical Society 85 (1922) 87 | |
| 69 | CMS Collaboration | Search for new physics in final states with an energetic jet or a hadronically decaying W or Z boson and transverse momentum imbalance at $ \sqrt{s} = $ 13 TeV | PRD 97 (2018) 092005 | CMS-EXO-16-048 1712.02345 |
| 70 | A. Denner, S. Dittmaier, T. Kasprzik, and A. Muck | Electroweak corrections to W+jet hadroproduction including leptonic W-boson decays | JHEP 08 (2009) 075 | 0906.1656 |
| 71 | A. Denner, S. Dittmaier, T. Kasprzik, and A. Muck | Electroweak corrections to dilepton+jet production at hadron colliders | JHEP 06 (2011) 069 | 1103.0914 |
| 72 | A. Denner, S. Dittmaier, T. Kasprzik, and A. Maeck | Electroweak corrections to monojet production at the LHC | EPJC 73 (2013) 2297 | 1211.5078 |
| 73 | J. H. Kuhn, A. Kulesza, S. Pozzorini, and M. Schulze | Electroweak corrections to hadronic photon production at large transverse momenta | JHEP 03 (2006) 059 | hep-ph/0508253 |
| 74 | CMS Collaboration | Determination of jet energy calibration and transverse momentum resolution in CMS | JINST 6 (2011) 11002 | CMS-JME-10-011 1107.4277 |
| 75 | CMS Collaboration | CMS luminosity measurements for the 2016 data taking period | CMS-PAS-LUM-17-001 | CMS-PAS-LUM-17-001 |
| 76 | LHC Higgs Cross Section Working Group | Simplified template cross sections---stage 1.1 | LHCHXSWG-2019-003 | 1906.02754 |
|
|
Compact Muon Solenoid LHC, CERN |
|

|

|

|

|

|