

Compact Muon Solenoid
LHC, CERN
| CMS-PAS-HIG-18-013 | ||
| Search for the resonant production of a pair of Higgs bosons decaying to the $ \mathrm{ b\bar{b} ZZ } $ final state | ||
| CMS Collaboration | ||
| July 2019 | ||
| Abstract: A search for the production of two Higgs bosons decaying to $ \mathrm{ b\bar{b} ZZ } $ is presented. The analysis is based on data collected by the CMS detector during the 2016 proton-proton running of the LHC, corresponding to an integrated luminosity of 35.9 fb$^{-1}$. The $ \mathrm{ b\bar{b} ZZ } $ final states considered are the ones where one Z decays leptonically into two oppositely charged leptons (either two muons or two electrons), and the other Z decays either to two neutrinos or hadronically into two or more jets. Upper limits at 95% confidence level are placed on the production of a narrow-width spin-0 or spin-2 particle decaying to a pair of Higgs bosons. This is the first search for Higgs boson resonant pair production in the final state where the other Z boson decays hadronically into two or more jets. | ||
|
Links:
CDS record (PDF) ;
CADI line (restricted) ;
These preliminary results are superseded in this paper, PRD 102 (2020) 032003. The superseded preliminary plots can be found here. |
||
| Figures | |
png pdf |
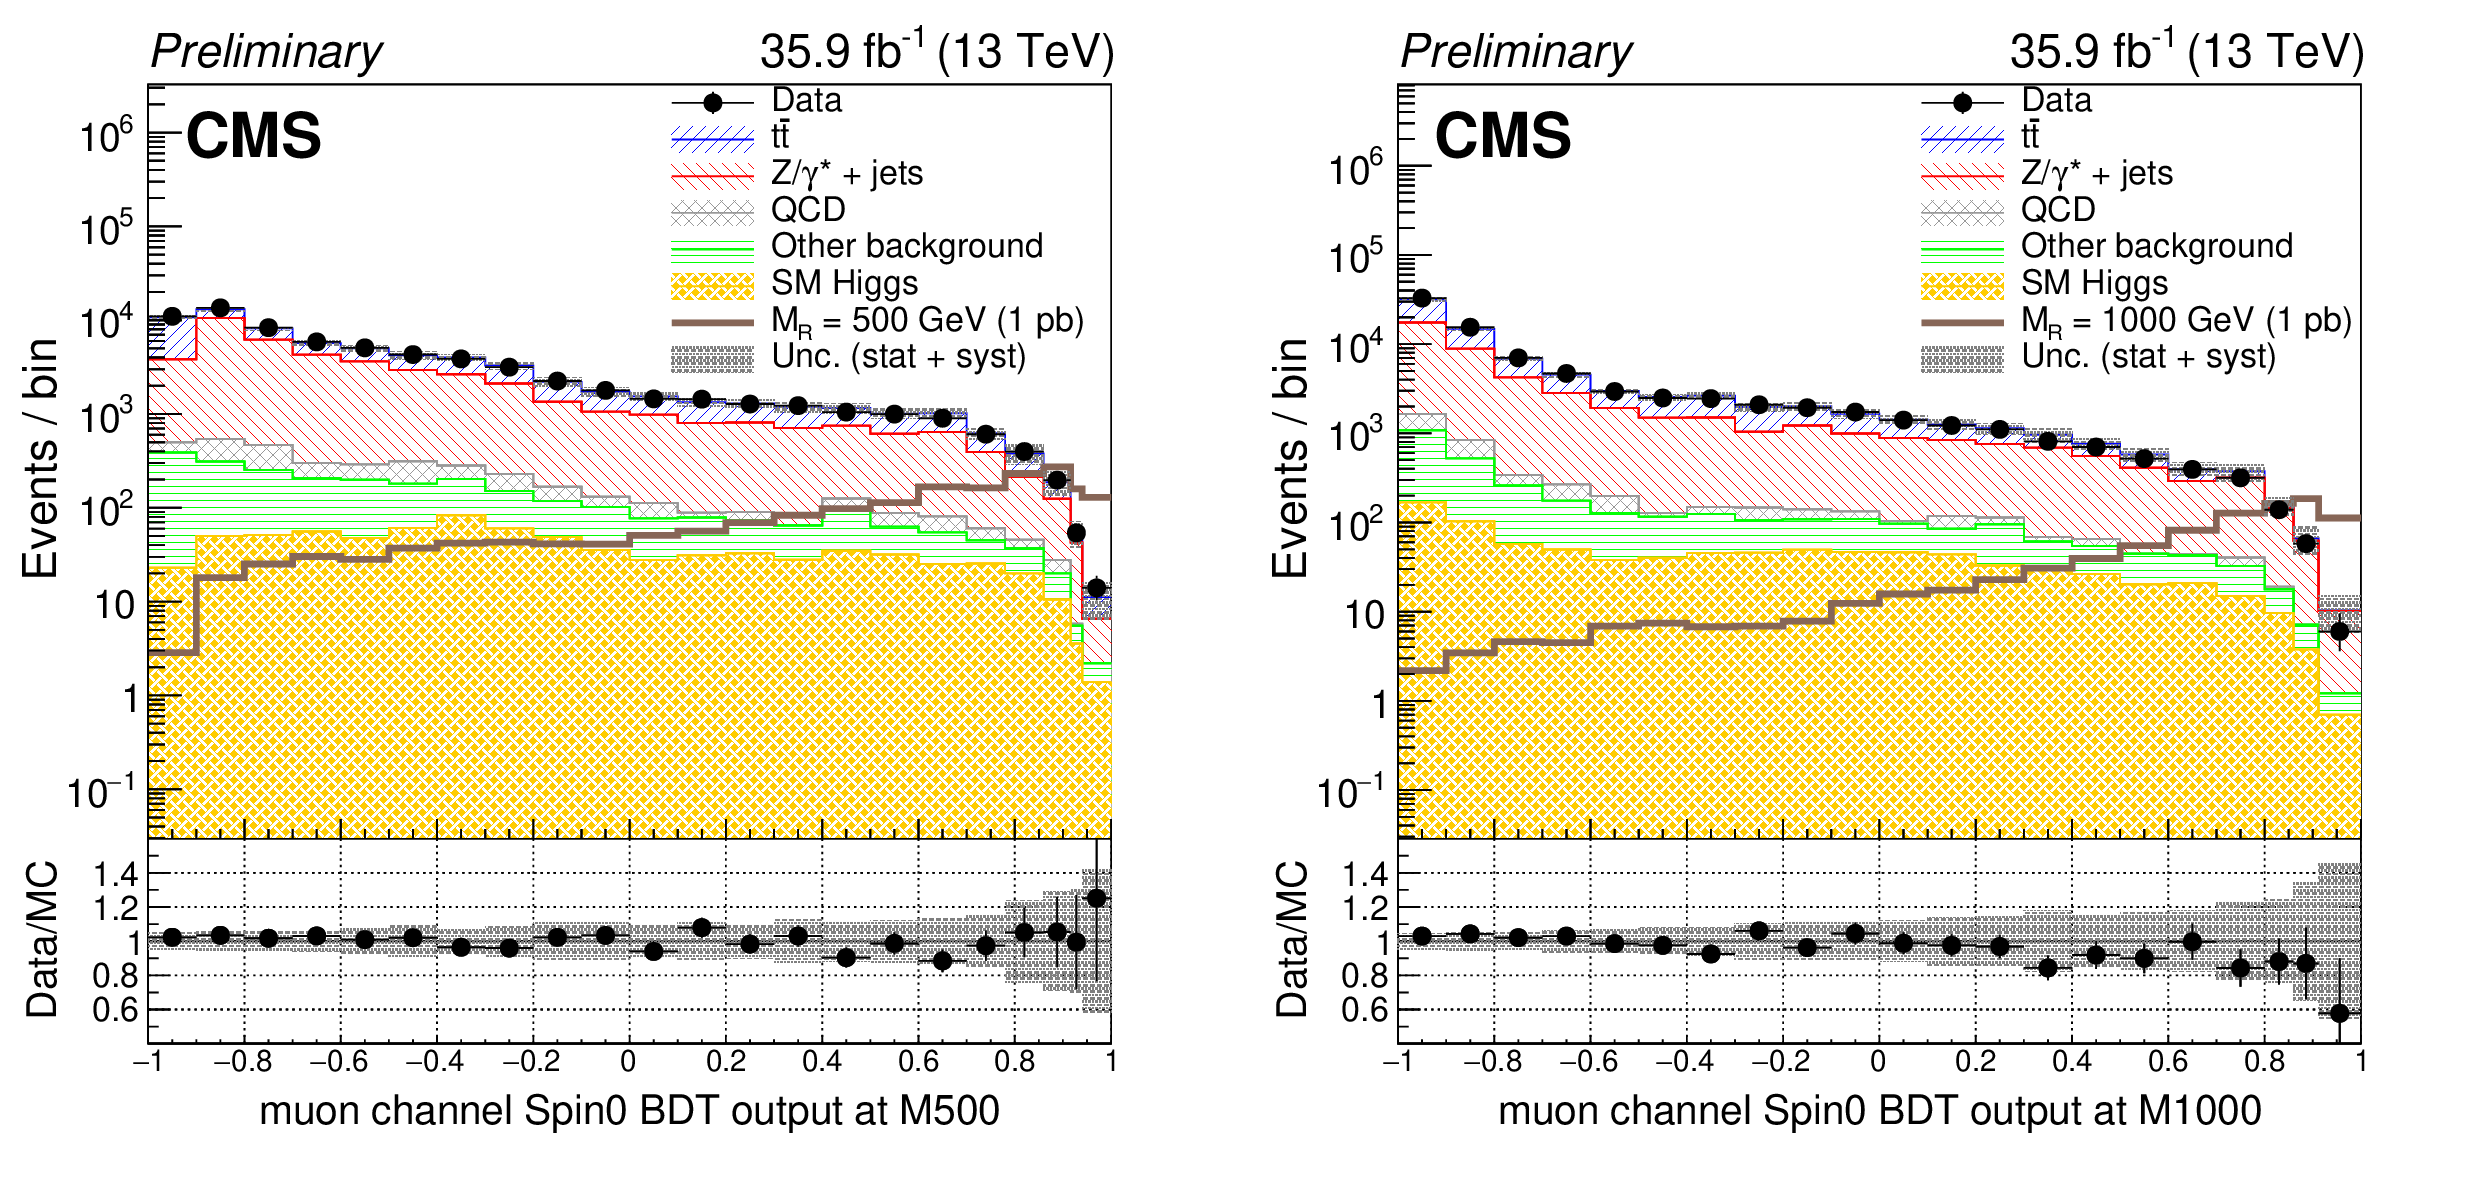
Figure 1:
Comparison of the BDT discriminant for $m_{\mathrm{X}} = $ 500 GeV and $m_{\mathrm{X}} = $ 1000 GeV at final selection level in the muon channel of the $\mathrm{b\bar{b}}\ell \ell {\mathrm{jj}}$ channel. The signals of an RS1 radion with mass of 500 (left) and 1000 GeV (right) are normalized to 1 pb for the $ \mathrm{HH} \to \mathrm{b\bar{b}}\mathrm{Z} \mathrm{Z} \to \mathrm{b\bar{b}}\ell \ell {\mathrm{jj}}$ process. The shaded area represents the combined statistical and systematic uncertainties. |
png pdf |
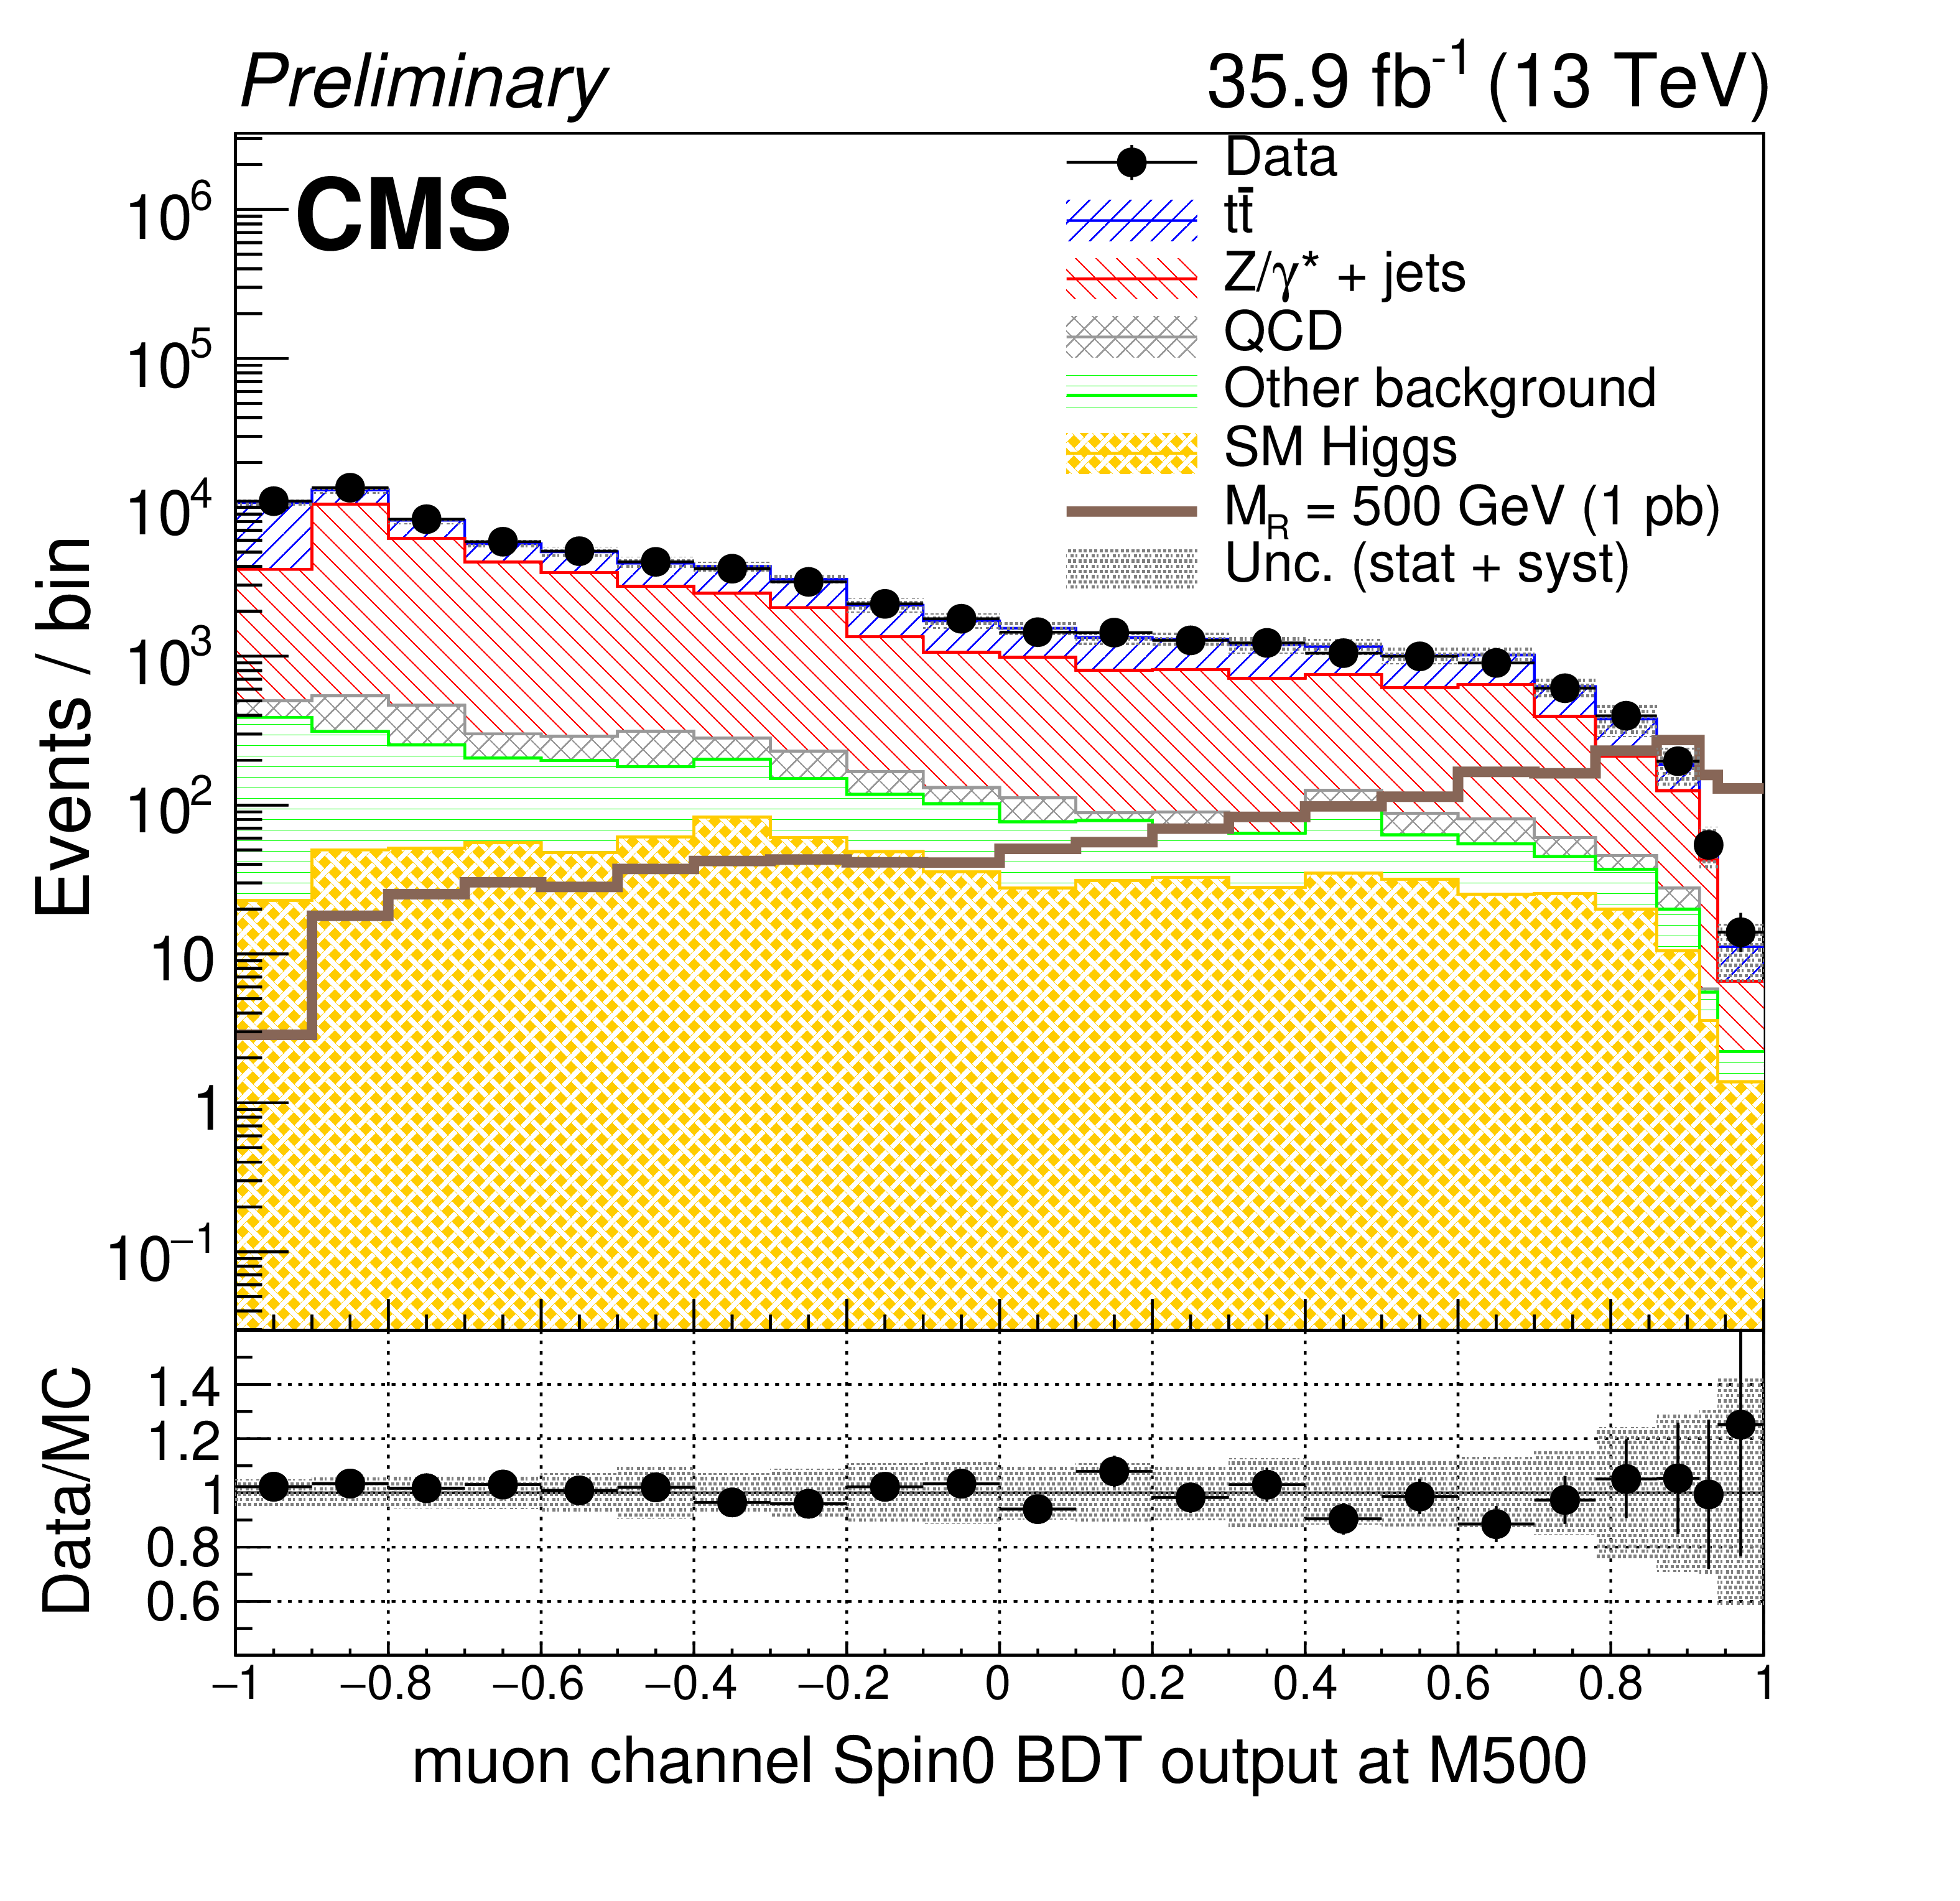
Figure 1-a:
Comparison of the BDT discriminant for $m_{\mathrm{X}} = $ 500 GeV and $m_{\mathrm{X}} = $ 1000 GeV at final selection level in the muon channel of the $\mathrm{b\bar{b}}\ell \ell {\mathrm{jj}}$ channel. The signals of an RS1 radion with mass of 500 GeV are normalized to 1 pb for the $ \mathrm{HH} \to \mathrm{b\bar{b}}\mathrm{Z} \mathrm{Z} \to \mathrm{b\bar{b}}\ell \ell {\mathrm{jj}}$ process. The shaded area represents the combined statistical and systematic uncertainties. |
png pdf |
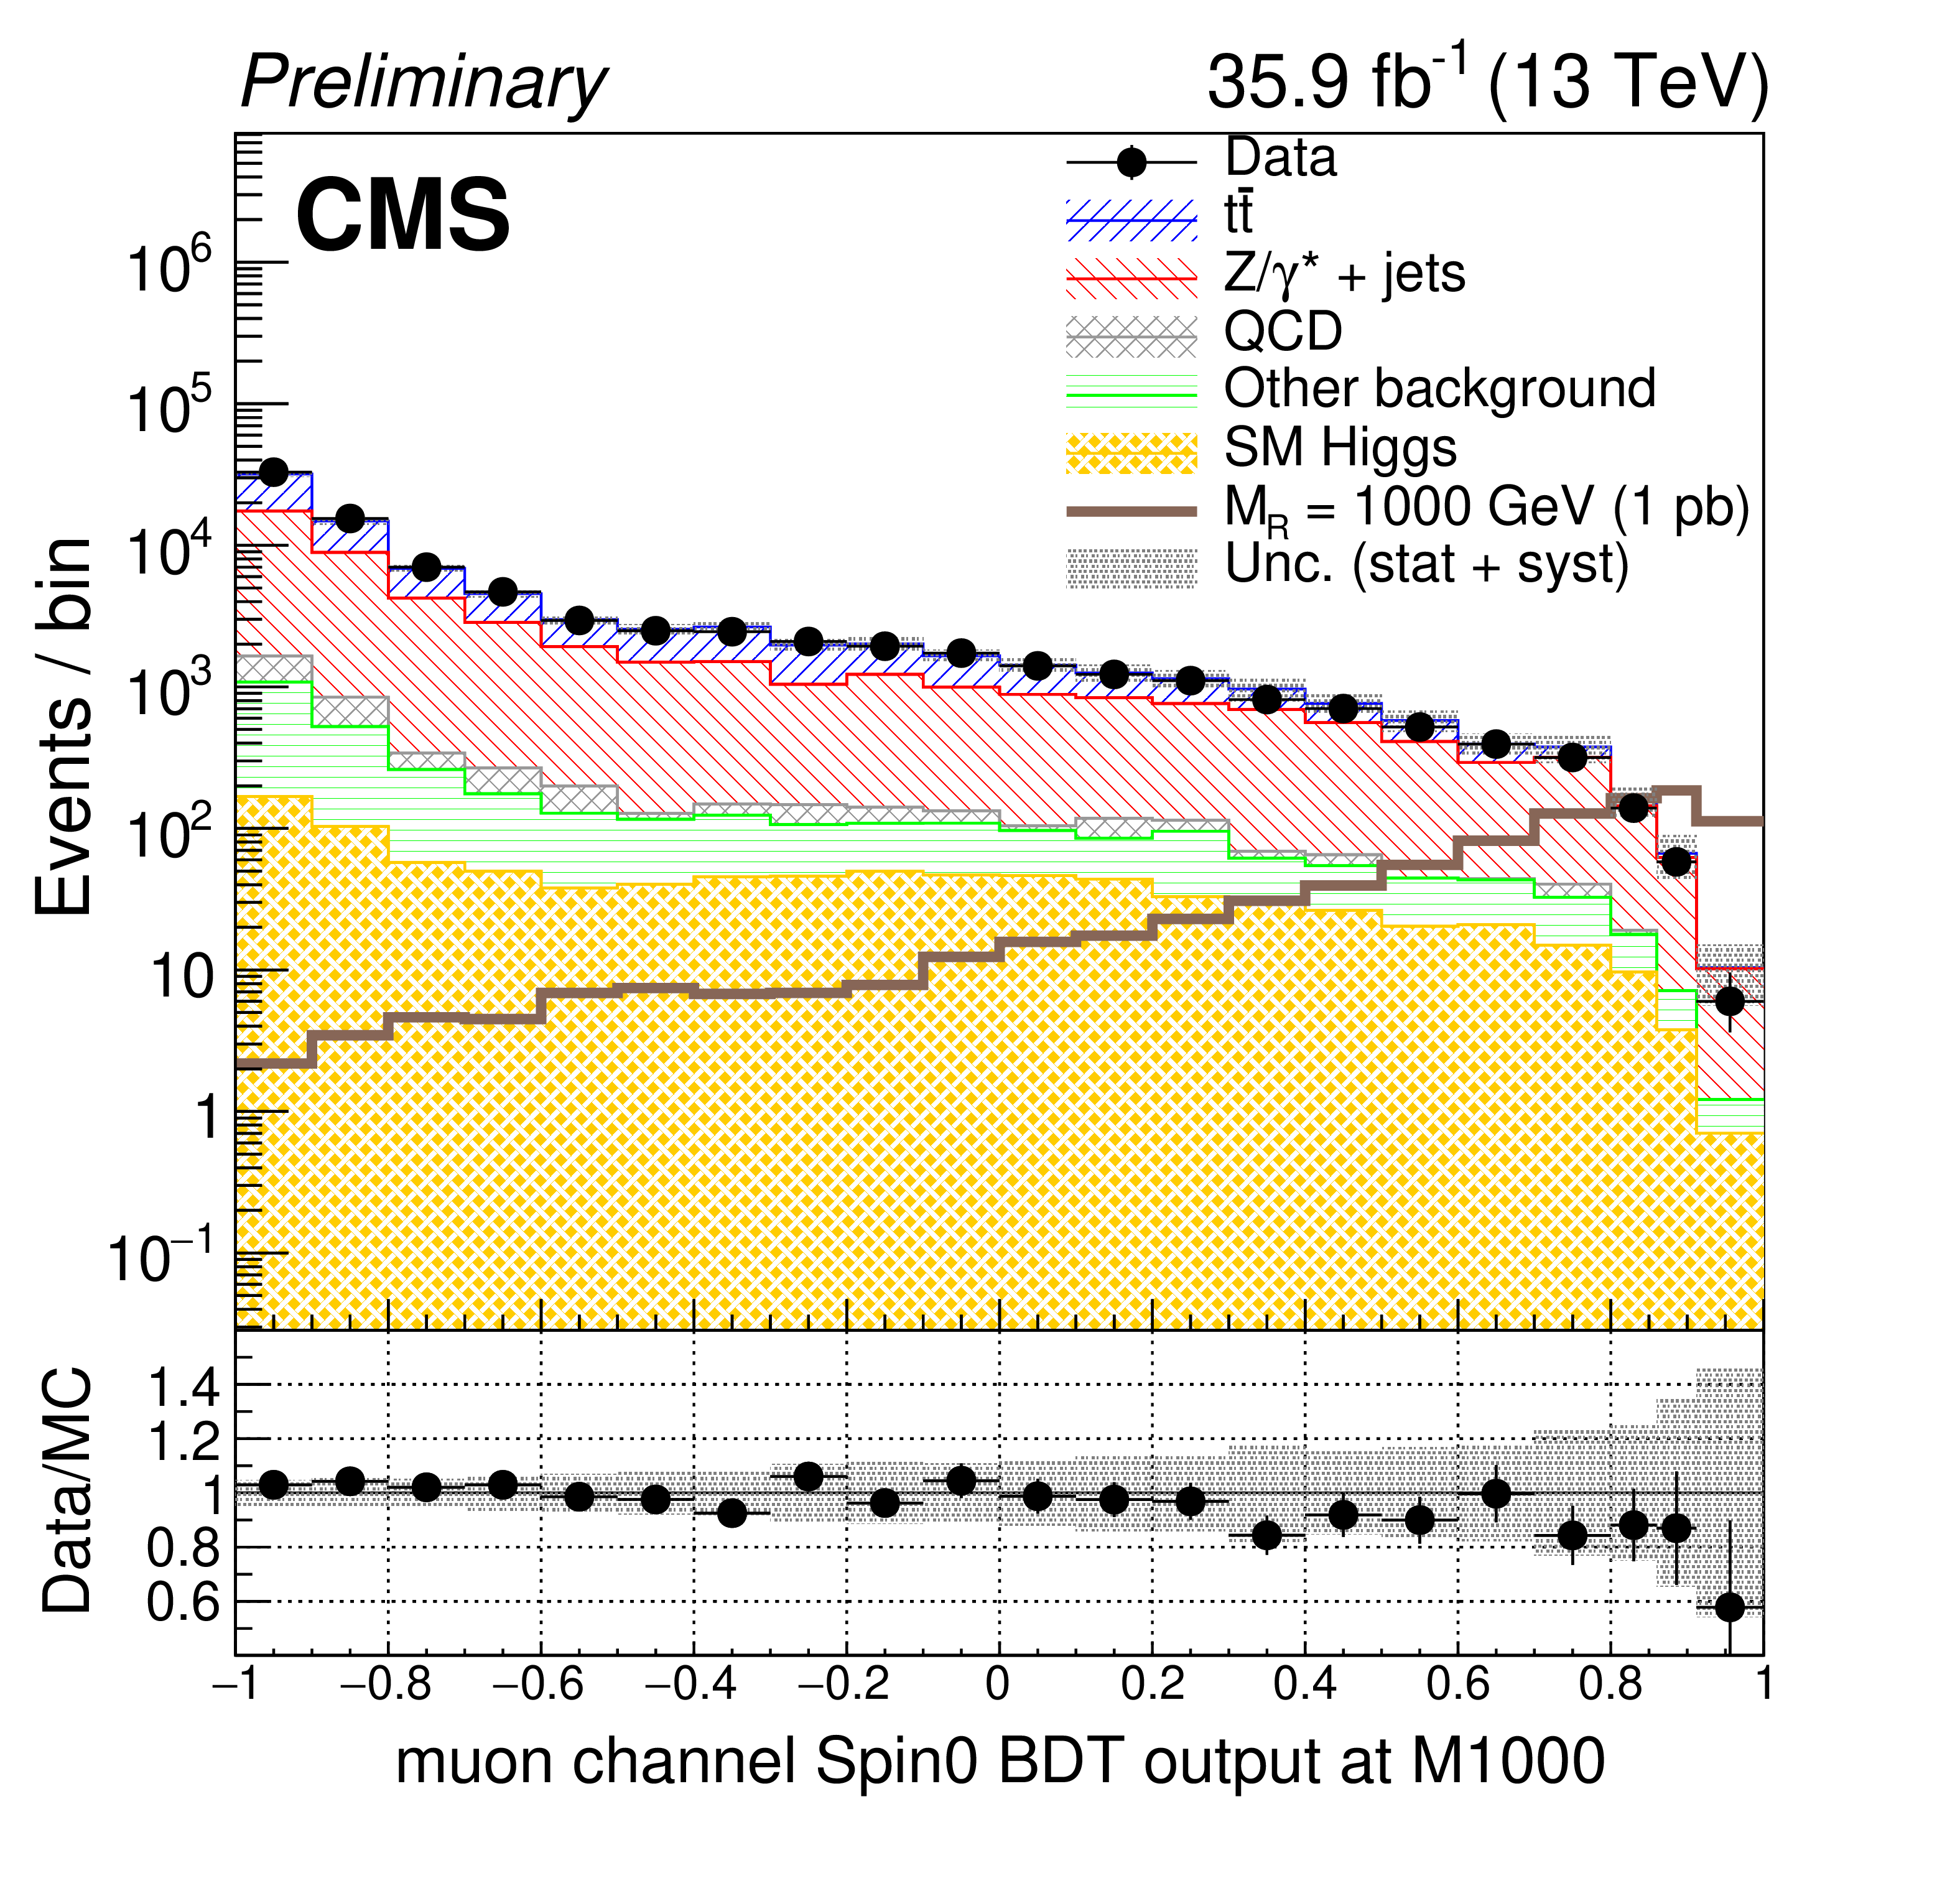
Figure 1-b:
Comparison of the BDT discriminant for $m_{\mathrm{X}} = $ 500 GeV and $m_{\mathrm{X}} = $ 1000 GeV at final selection level in the muon channel of the $\mathrm{b\bar{b}}\ell \ell {\mathrm{jj}}$ channel. The signals of an RS1 radion with mass of 1000 GeV are normalized to 1 pb for the $ \mathrm{HH} \to \mathrm{b\bar{b}}\mathrm{Z} \mathrm{Z} \to \mathrm{b\bar{b}}\ell \ell {\mathrm{jj}}$ process. The shaded area represents the combined statistical and systematic uncertainties. |
png pdf |
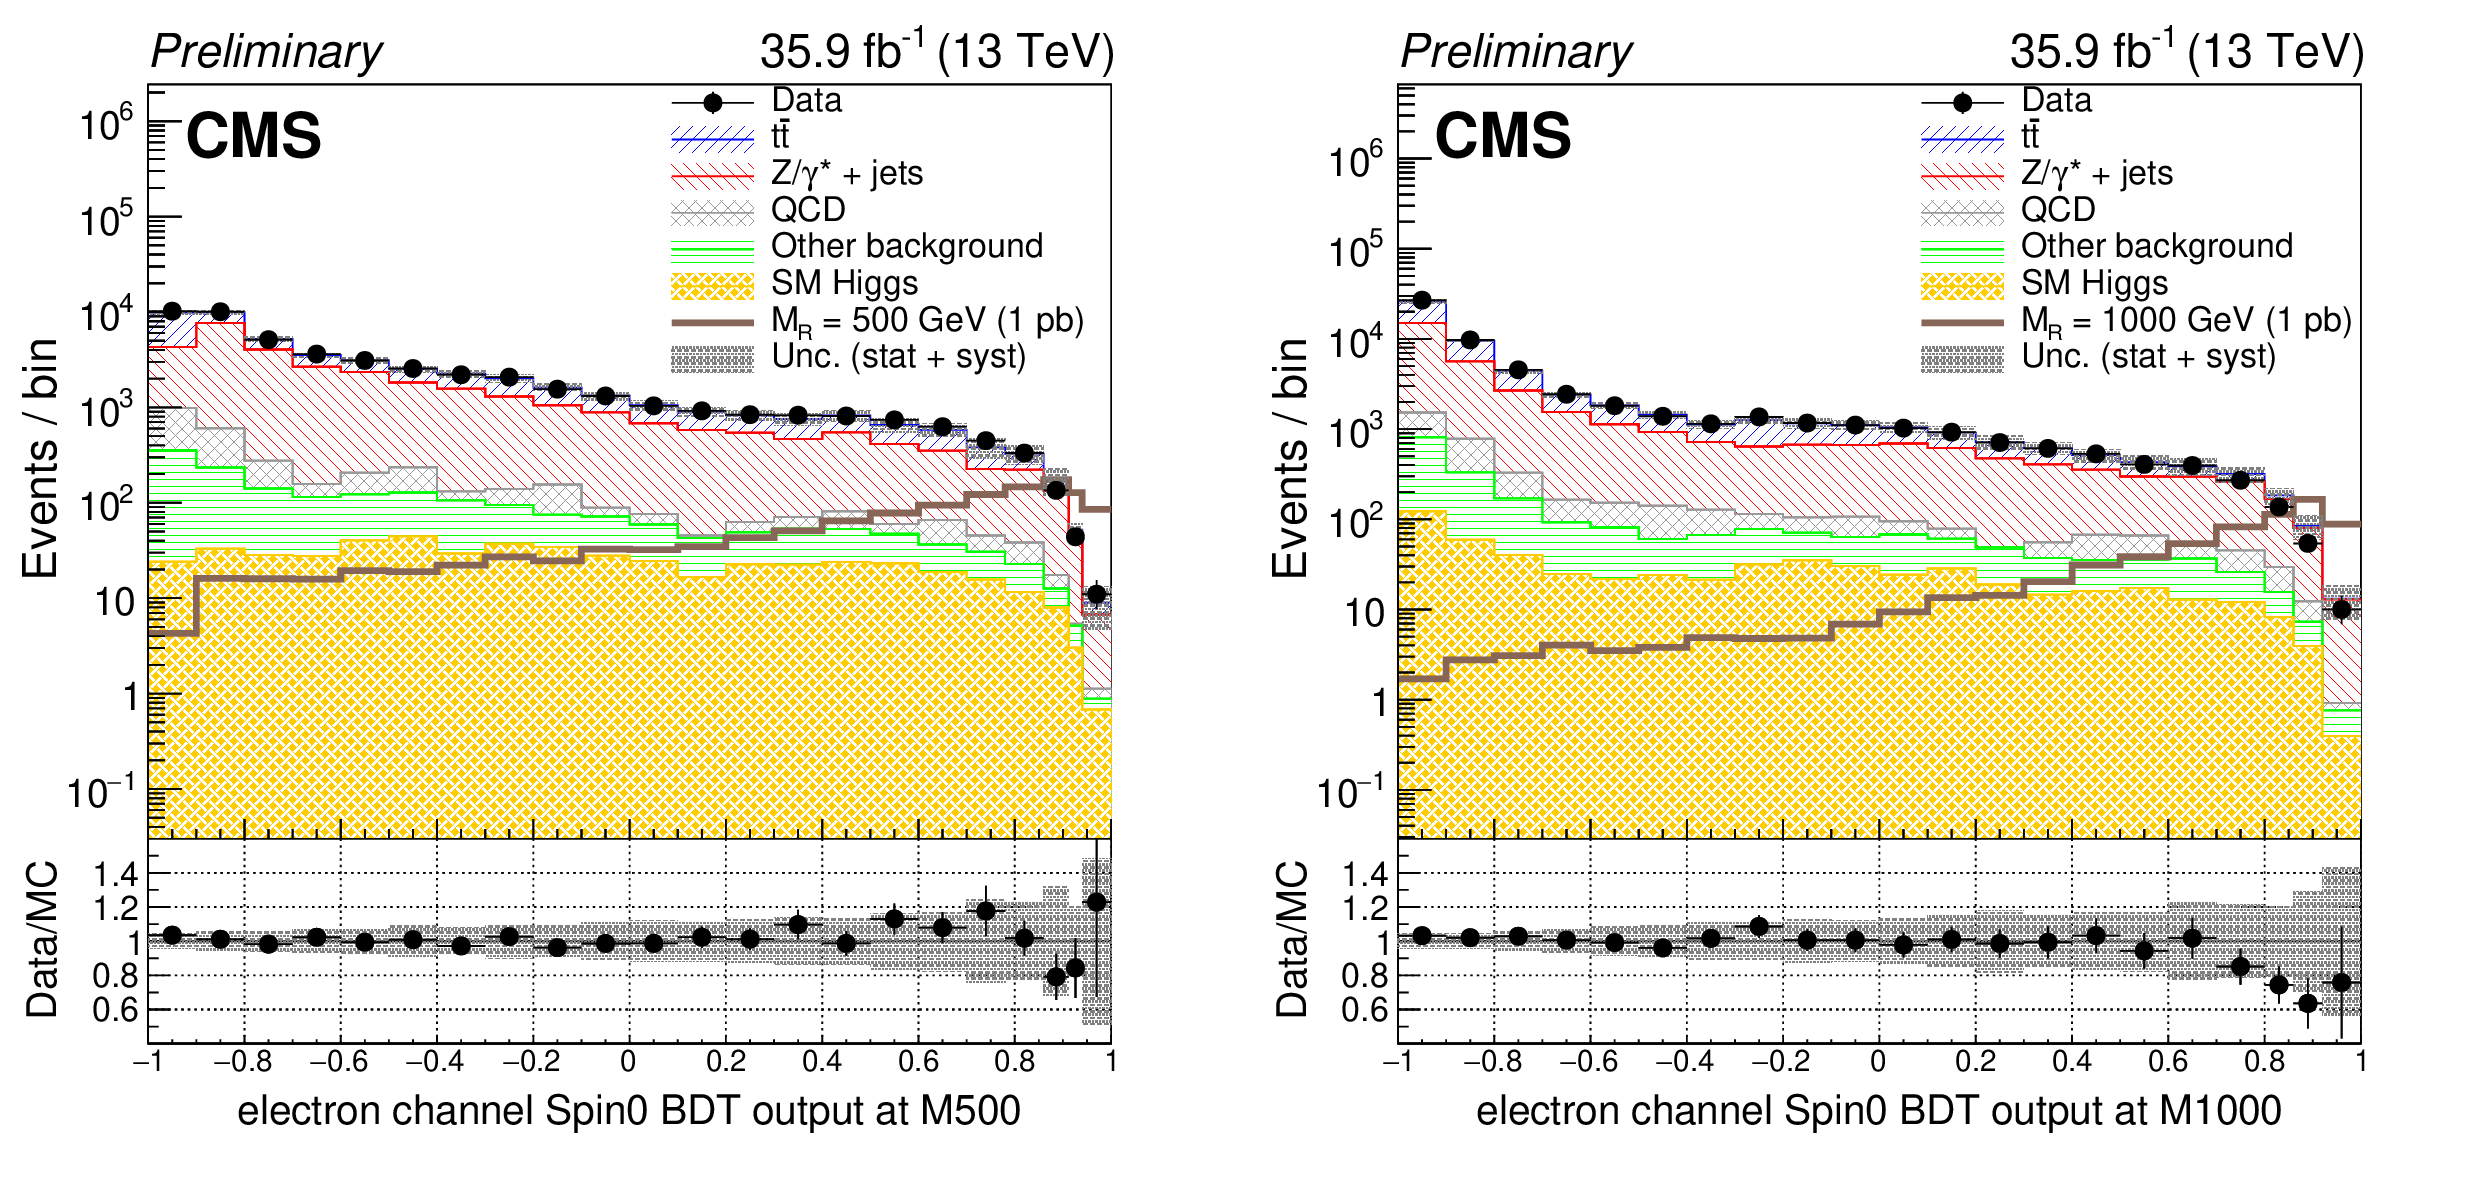
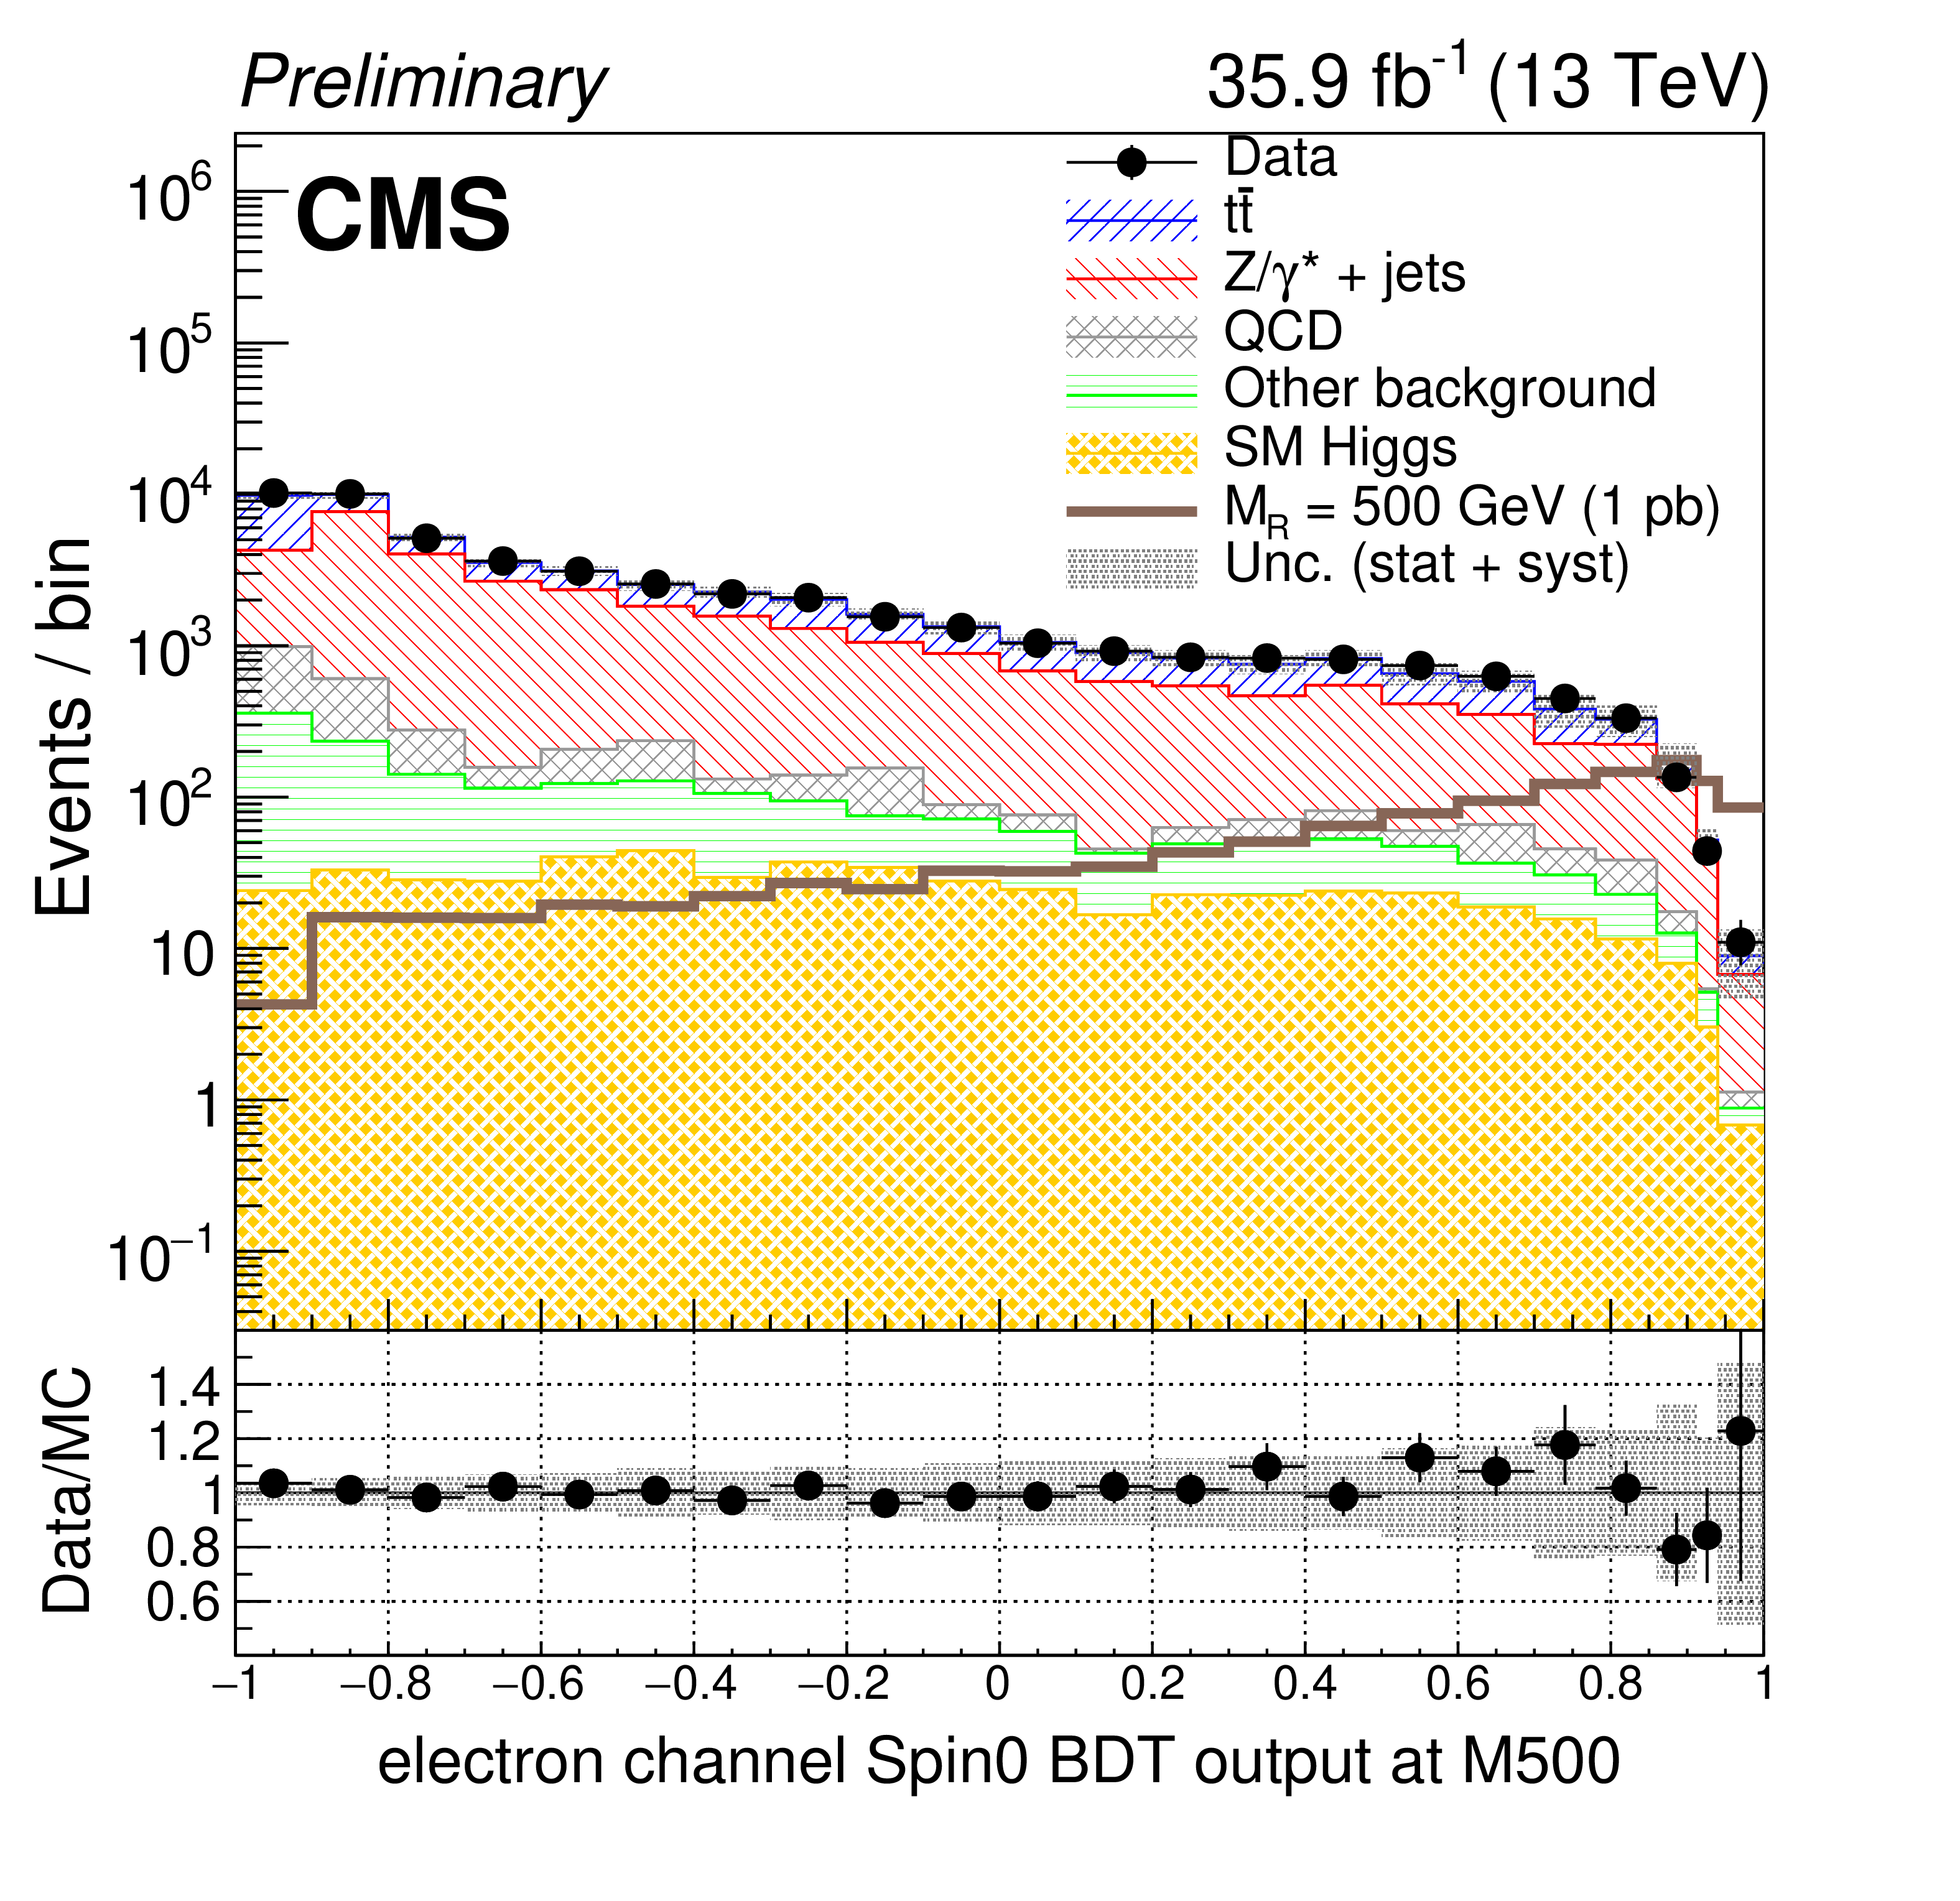
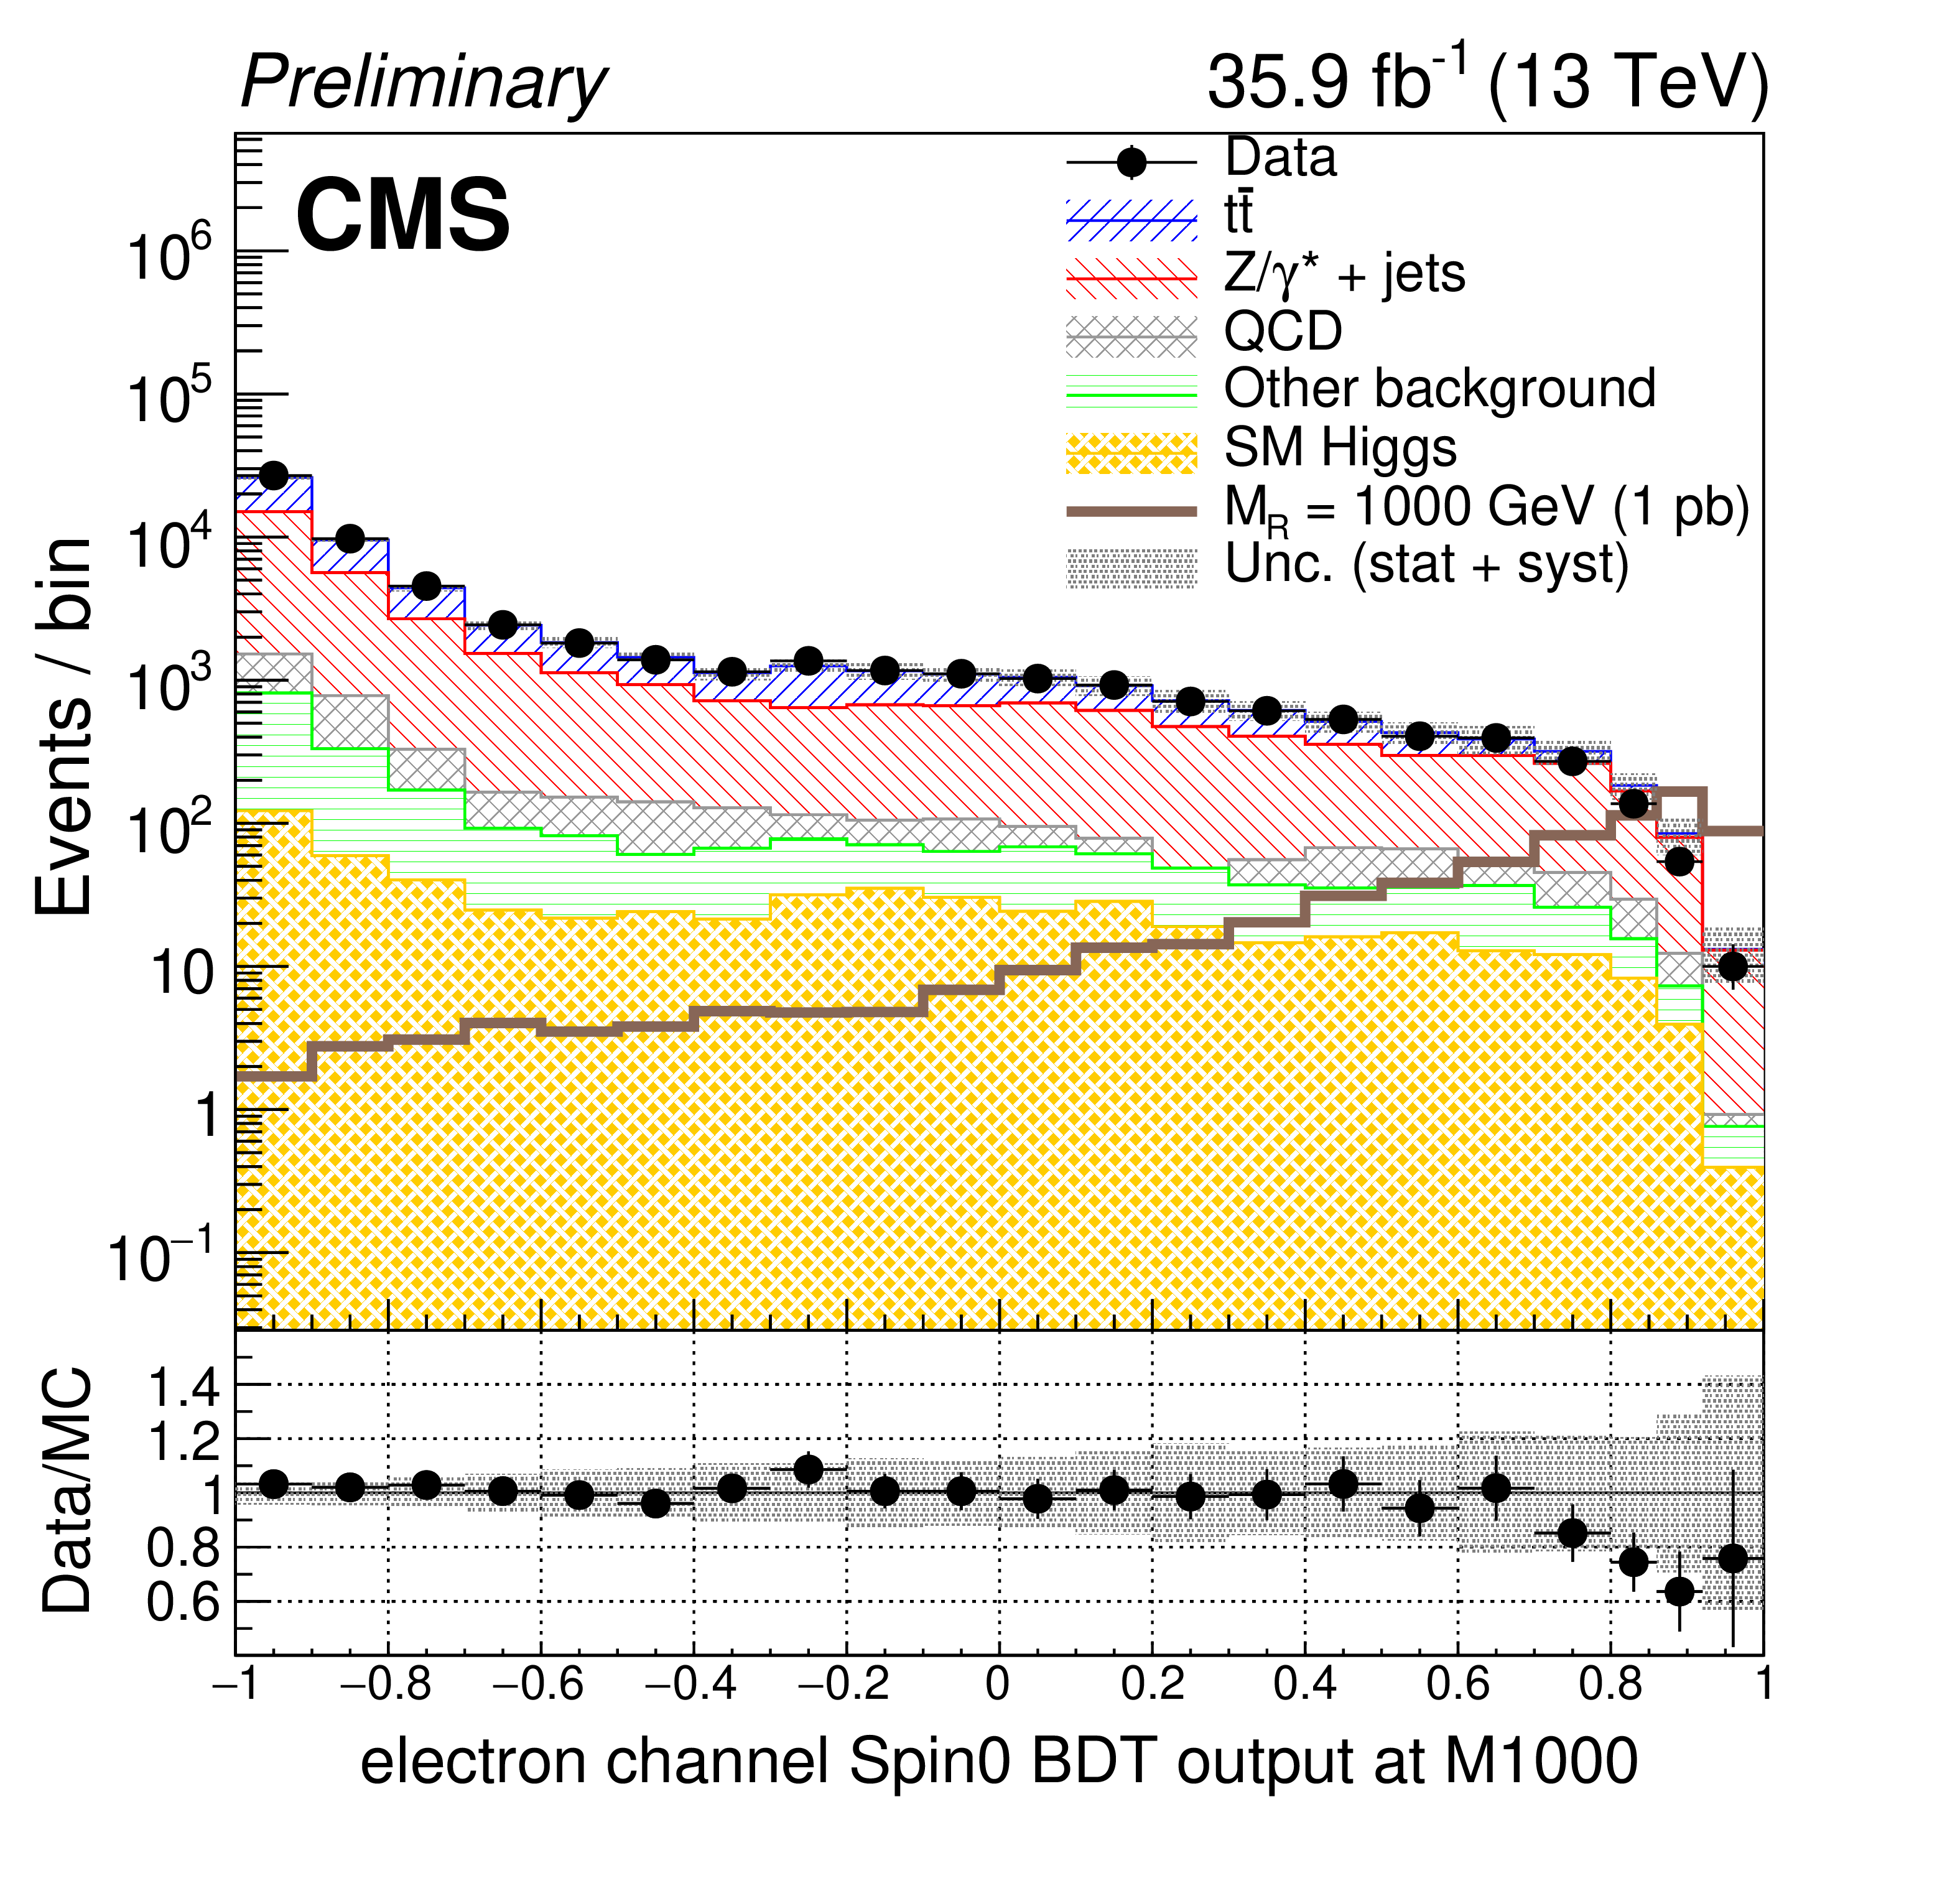
Figure 2:
Comparison of the BDT discriminant for $m_{\mathrm{X}} = $ 500 GeV and $m_{\mathrm{X}} = $ 1000 GeV at final selection level in the electron channel of the $\mathrm{b\bar{b}}\ell \ell {\mathrm{jj}}$ channel. The signals of an RS1 radion with mass of 500 (left) and 1000 GeV (right) are normalized to 1 pb for the $ \mathrm{HH} \to \mathrm{b\bar{b}}\mathrm{Z} \mathrm{Z} \to \mathrm{b\bar{b}}\ell \ell {\mathrm{jj}}$ process. The shaded area represents the combined statistical and systematic uncertainties. |
png pdf |
Figure 2-a:
Comparison of the BDT discriminant for $m_{\mathrm{X}} = $ 500 GeV and $m_{\mathrm{X}} = $ 1000 GeV at final selection level in the electron channel of the $\mathrm{b\bar{b}}\ell \ell {\mathrm{jj}}$ channel. The signals of an RS1 radion with mass of 500 GeV are normalized to 1 pb for the $ \mathrm{HH} \to \mathrm{b\bar{b}}\mathrm{Z} \mathrm{Z} \to \mathrm{b\bar{b}}\ell \ell {\mathrm{jj}}$ process. The shaded area represents the combined statistical and systematic uncertainties. |
png pdf |
Figure 2-b:
Comparison of the BDT discriminant for $m_{\mathrm{X}} = $ 500 GeV and $m_{\mathrm{X}} = $ 1000 GeV at final selection level in the electron channel of the $\mathrm{b\bar{b}}\ell \ell {\mathrm{jj}}$ channel. The signals of an RS1 radion with mass of 1000 GeV are normalized to 1 pb for the $ \mathrm{HH} \to \mathrm{b\bar{b}}\mathrm{Z} \mathrm{Z} \to \mathrm{b\bar{b}}\ell \ell {\mathrm{jj}}$ process. The shaded area represents the combined statistical and systematic uncertainties. |
png pdf |
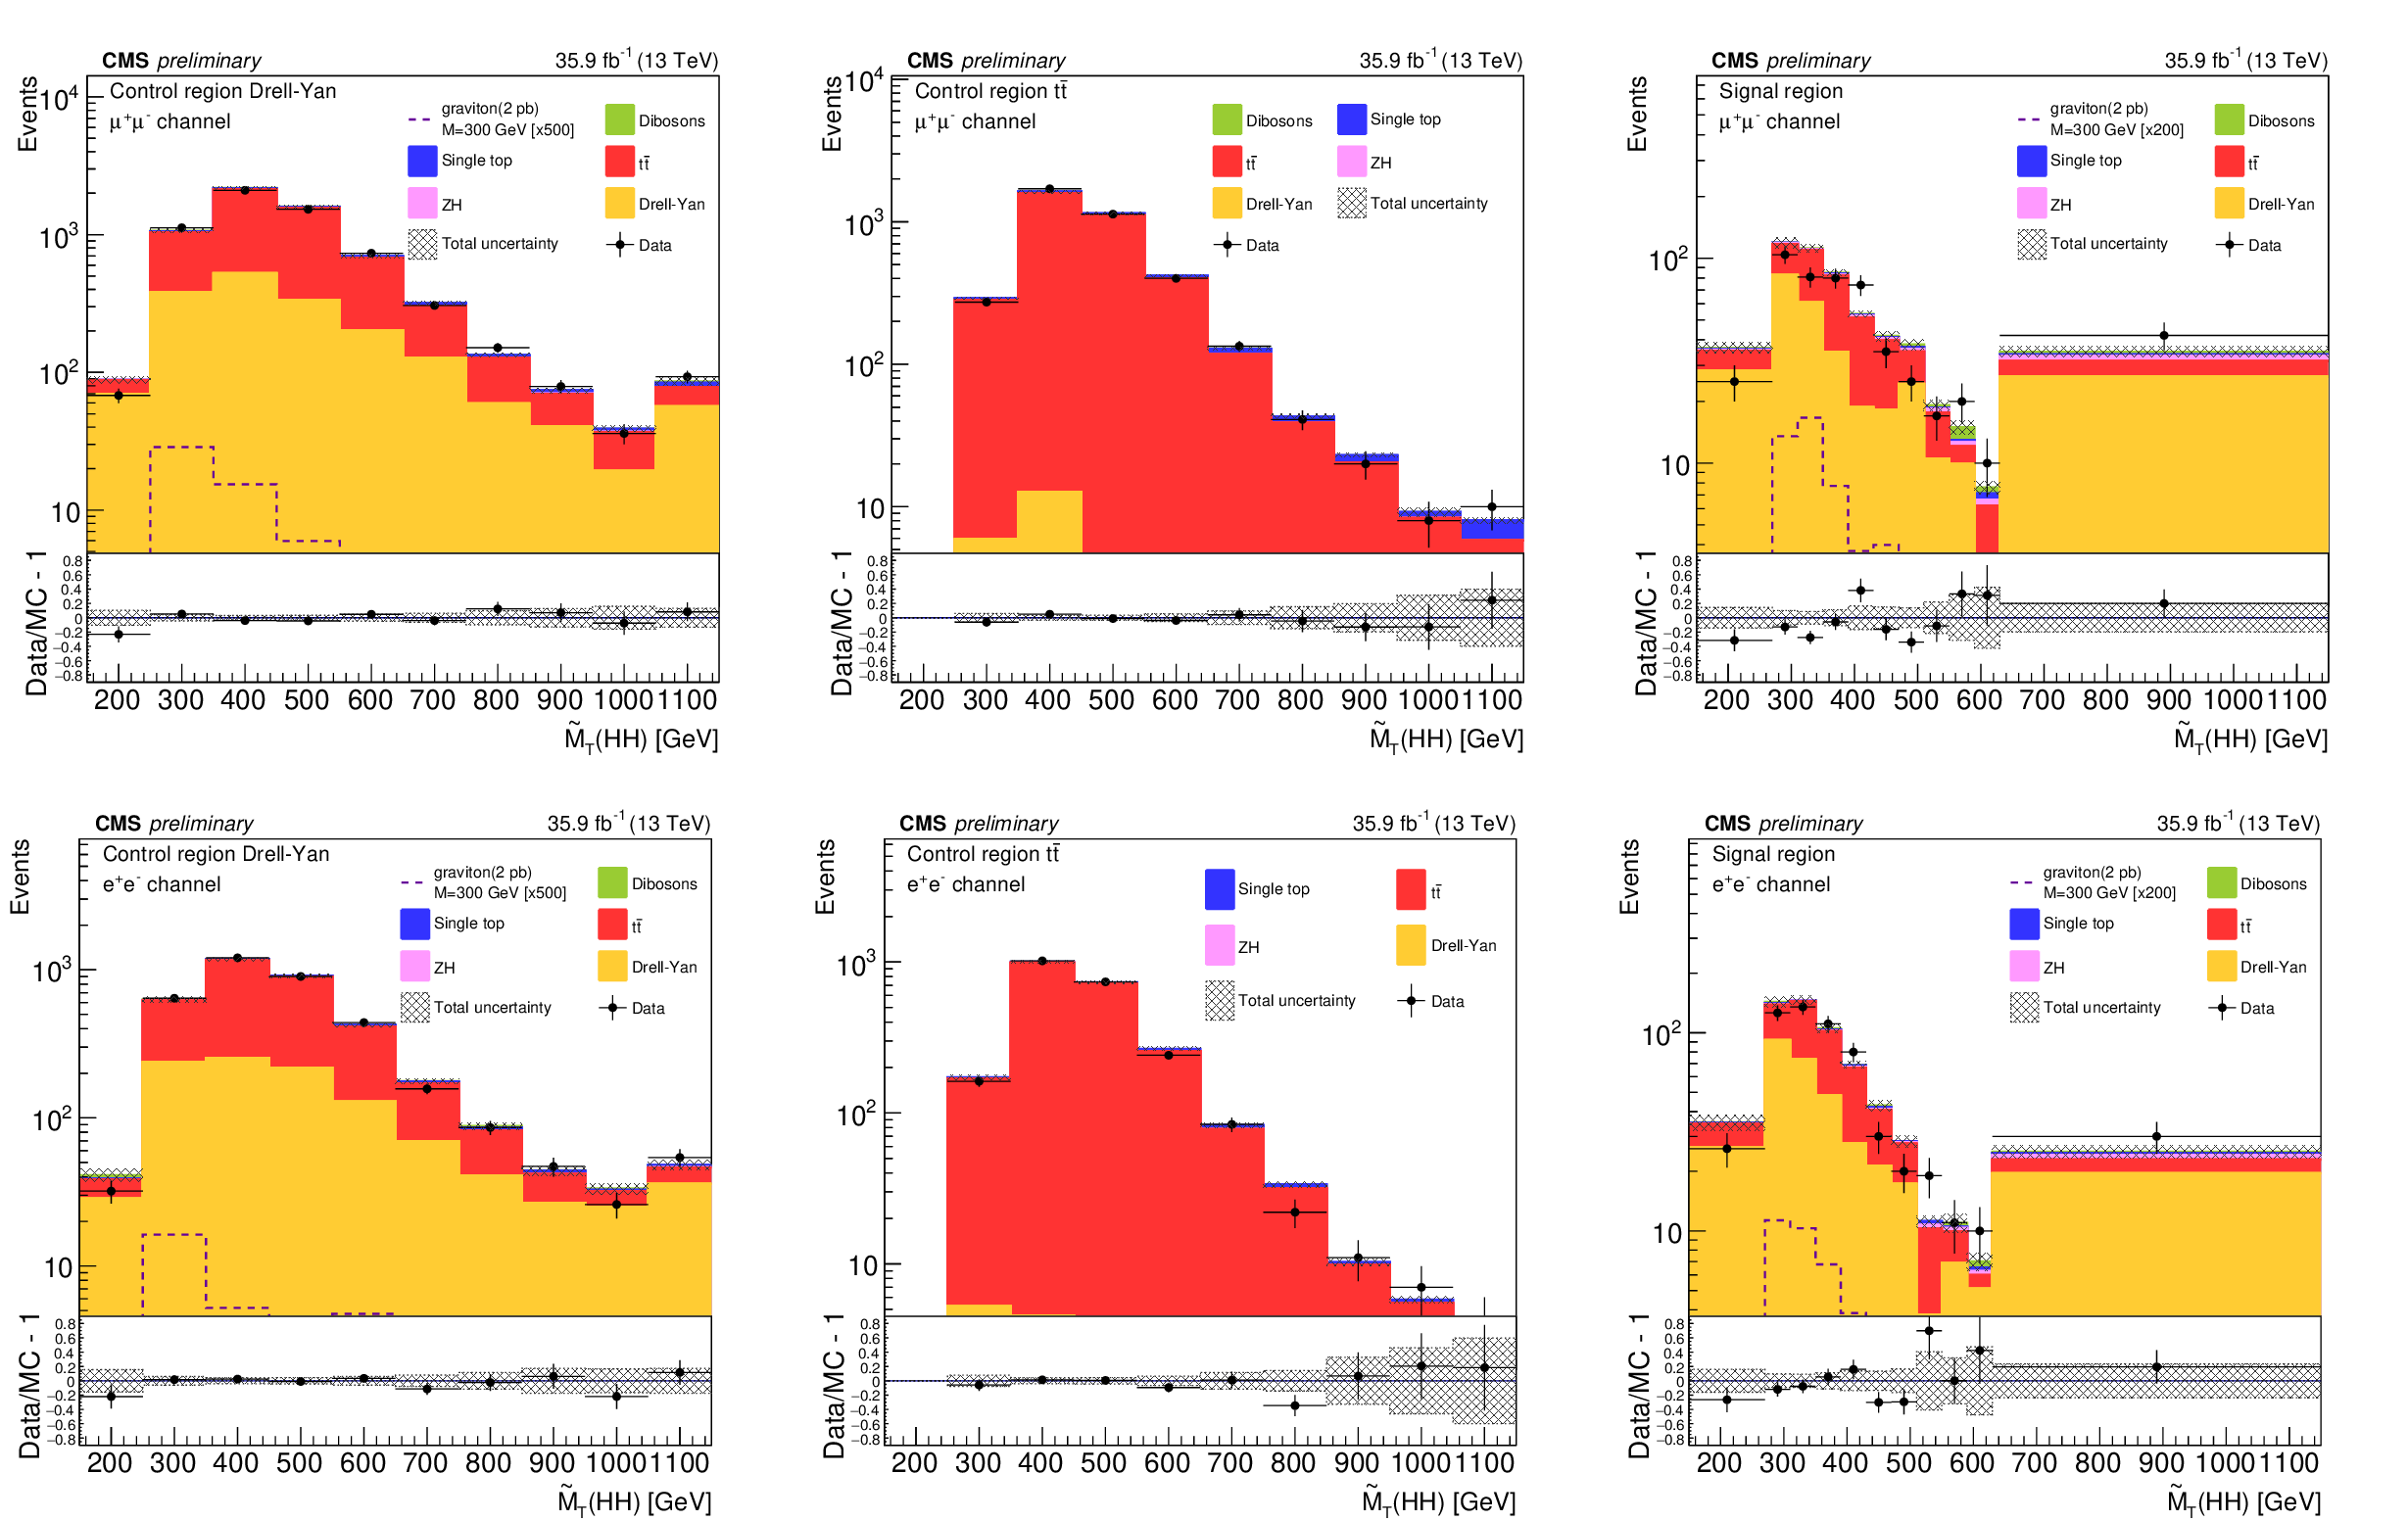
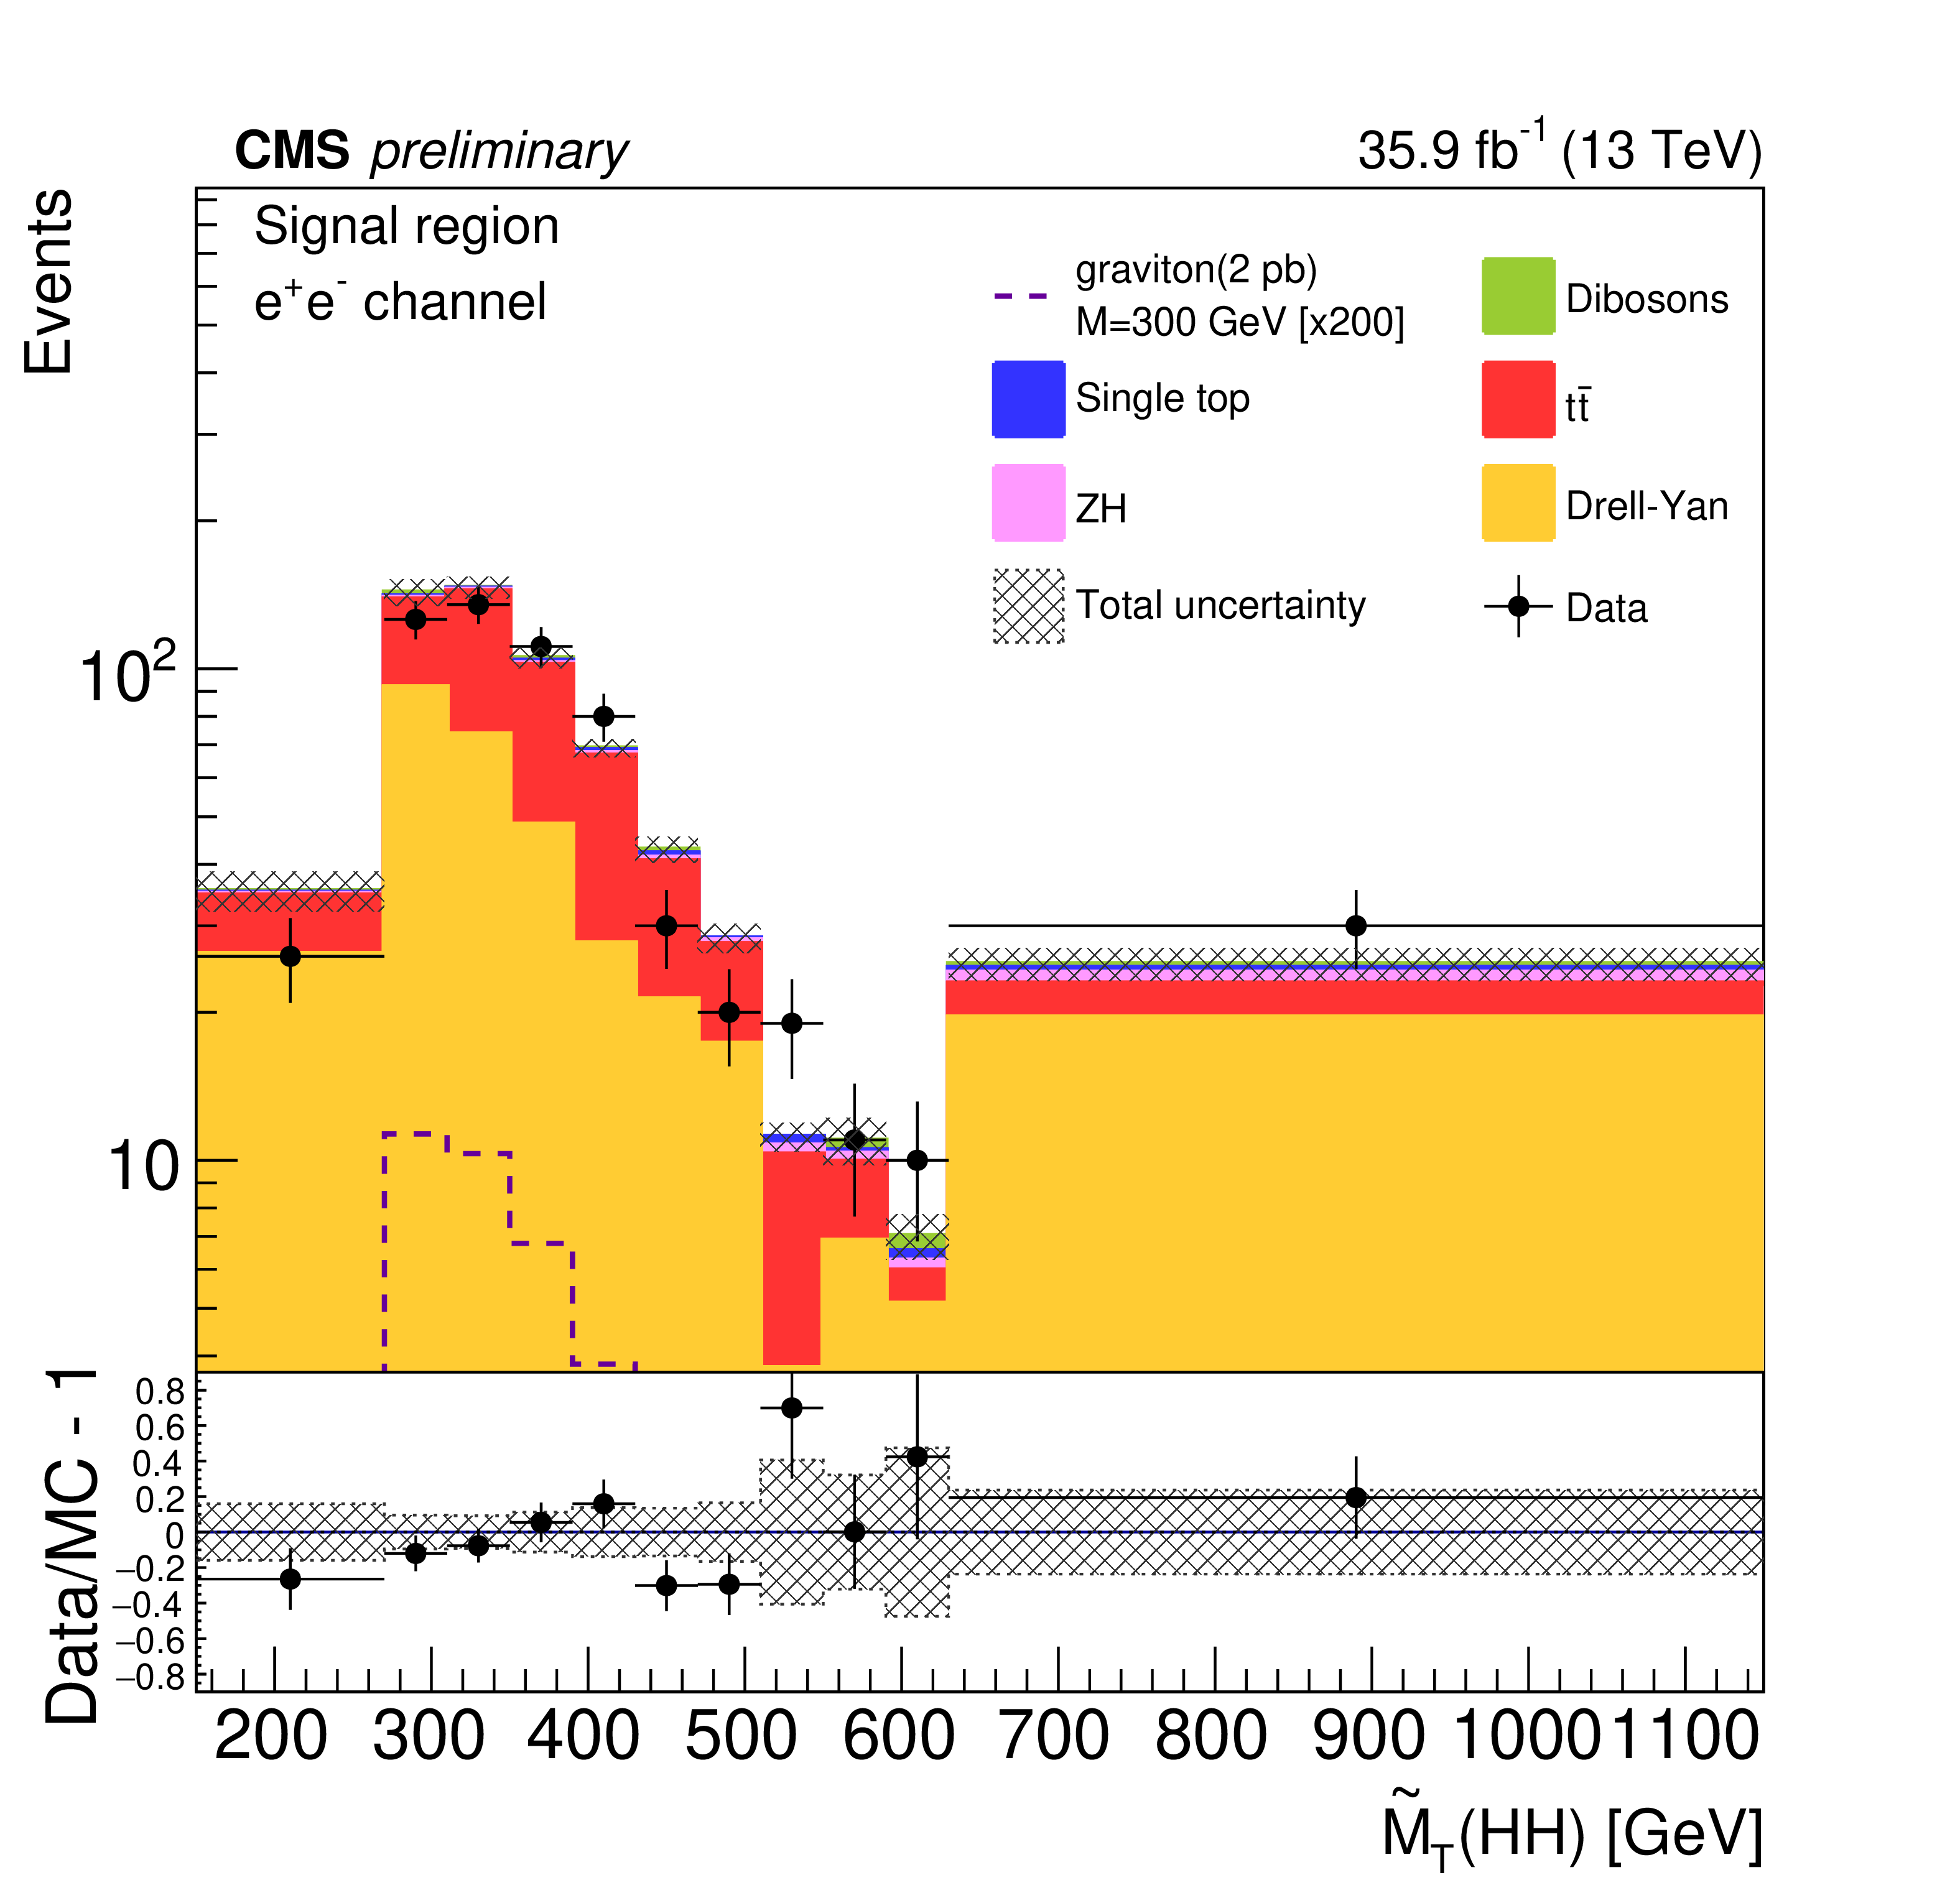
Figure 3:
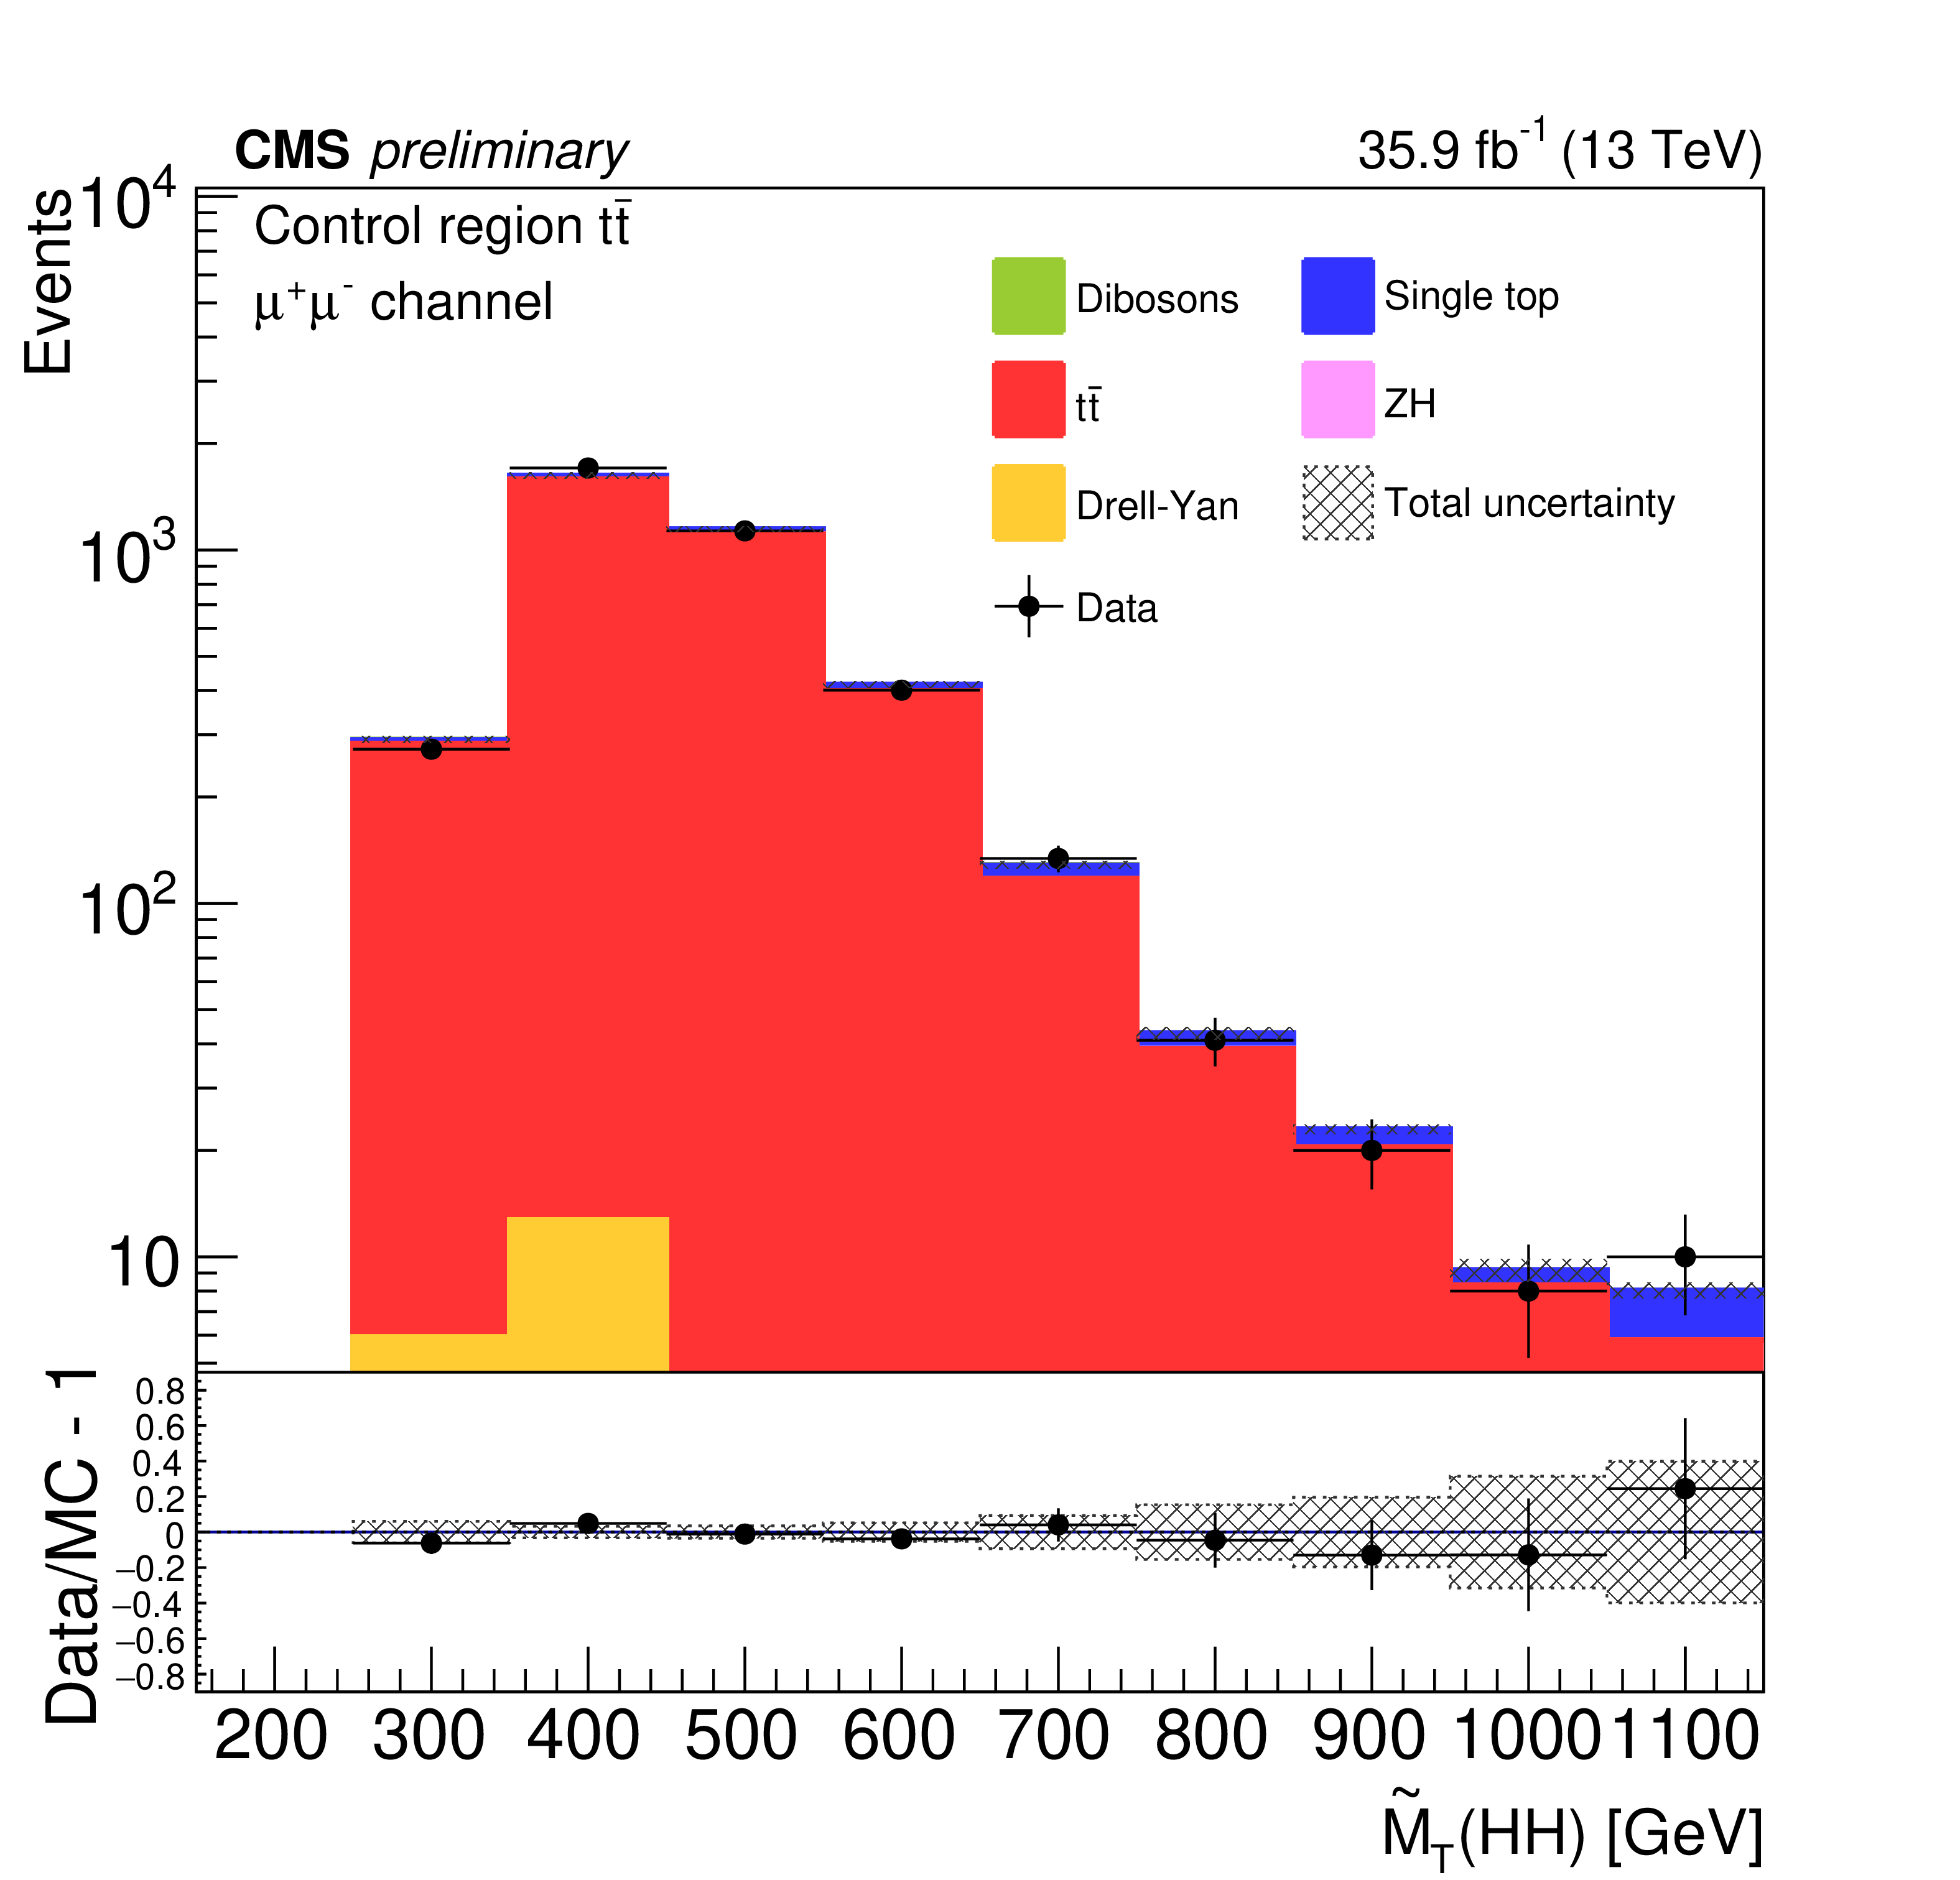
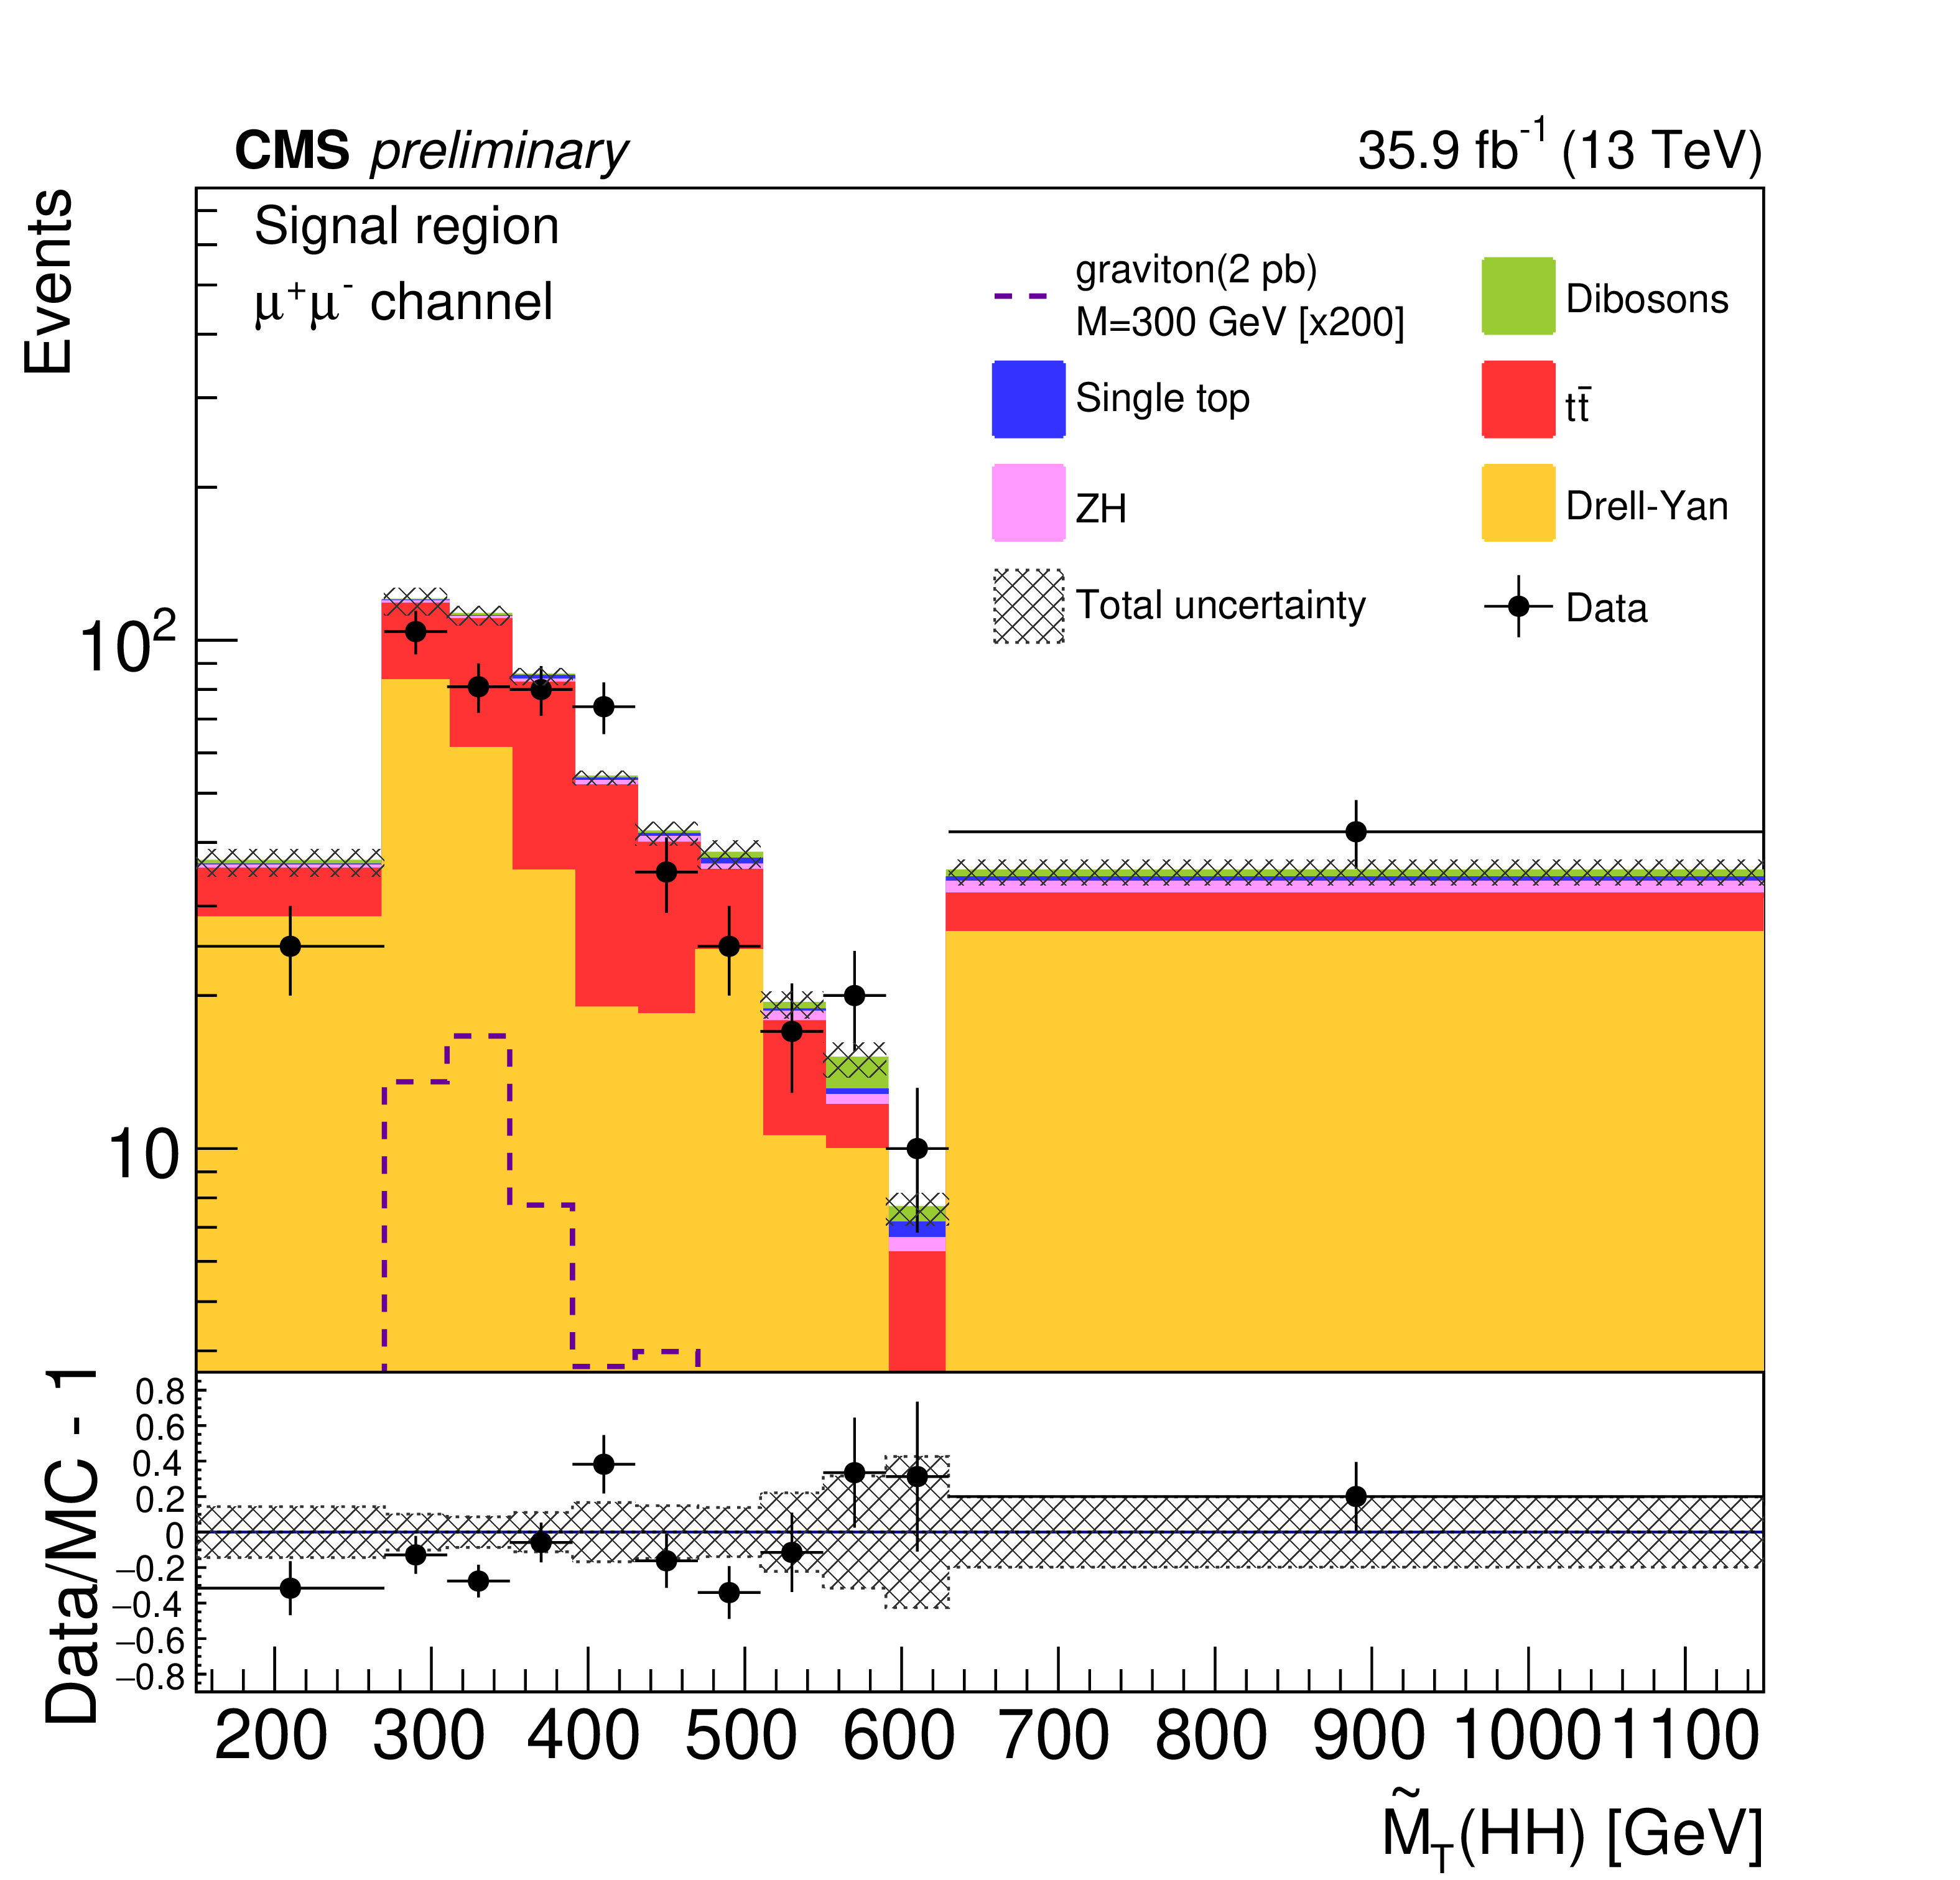
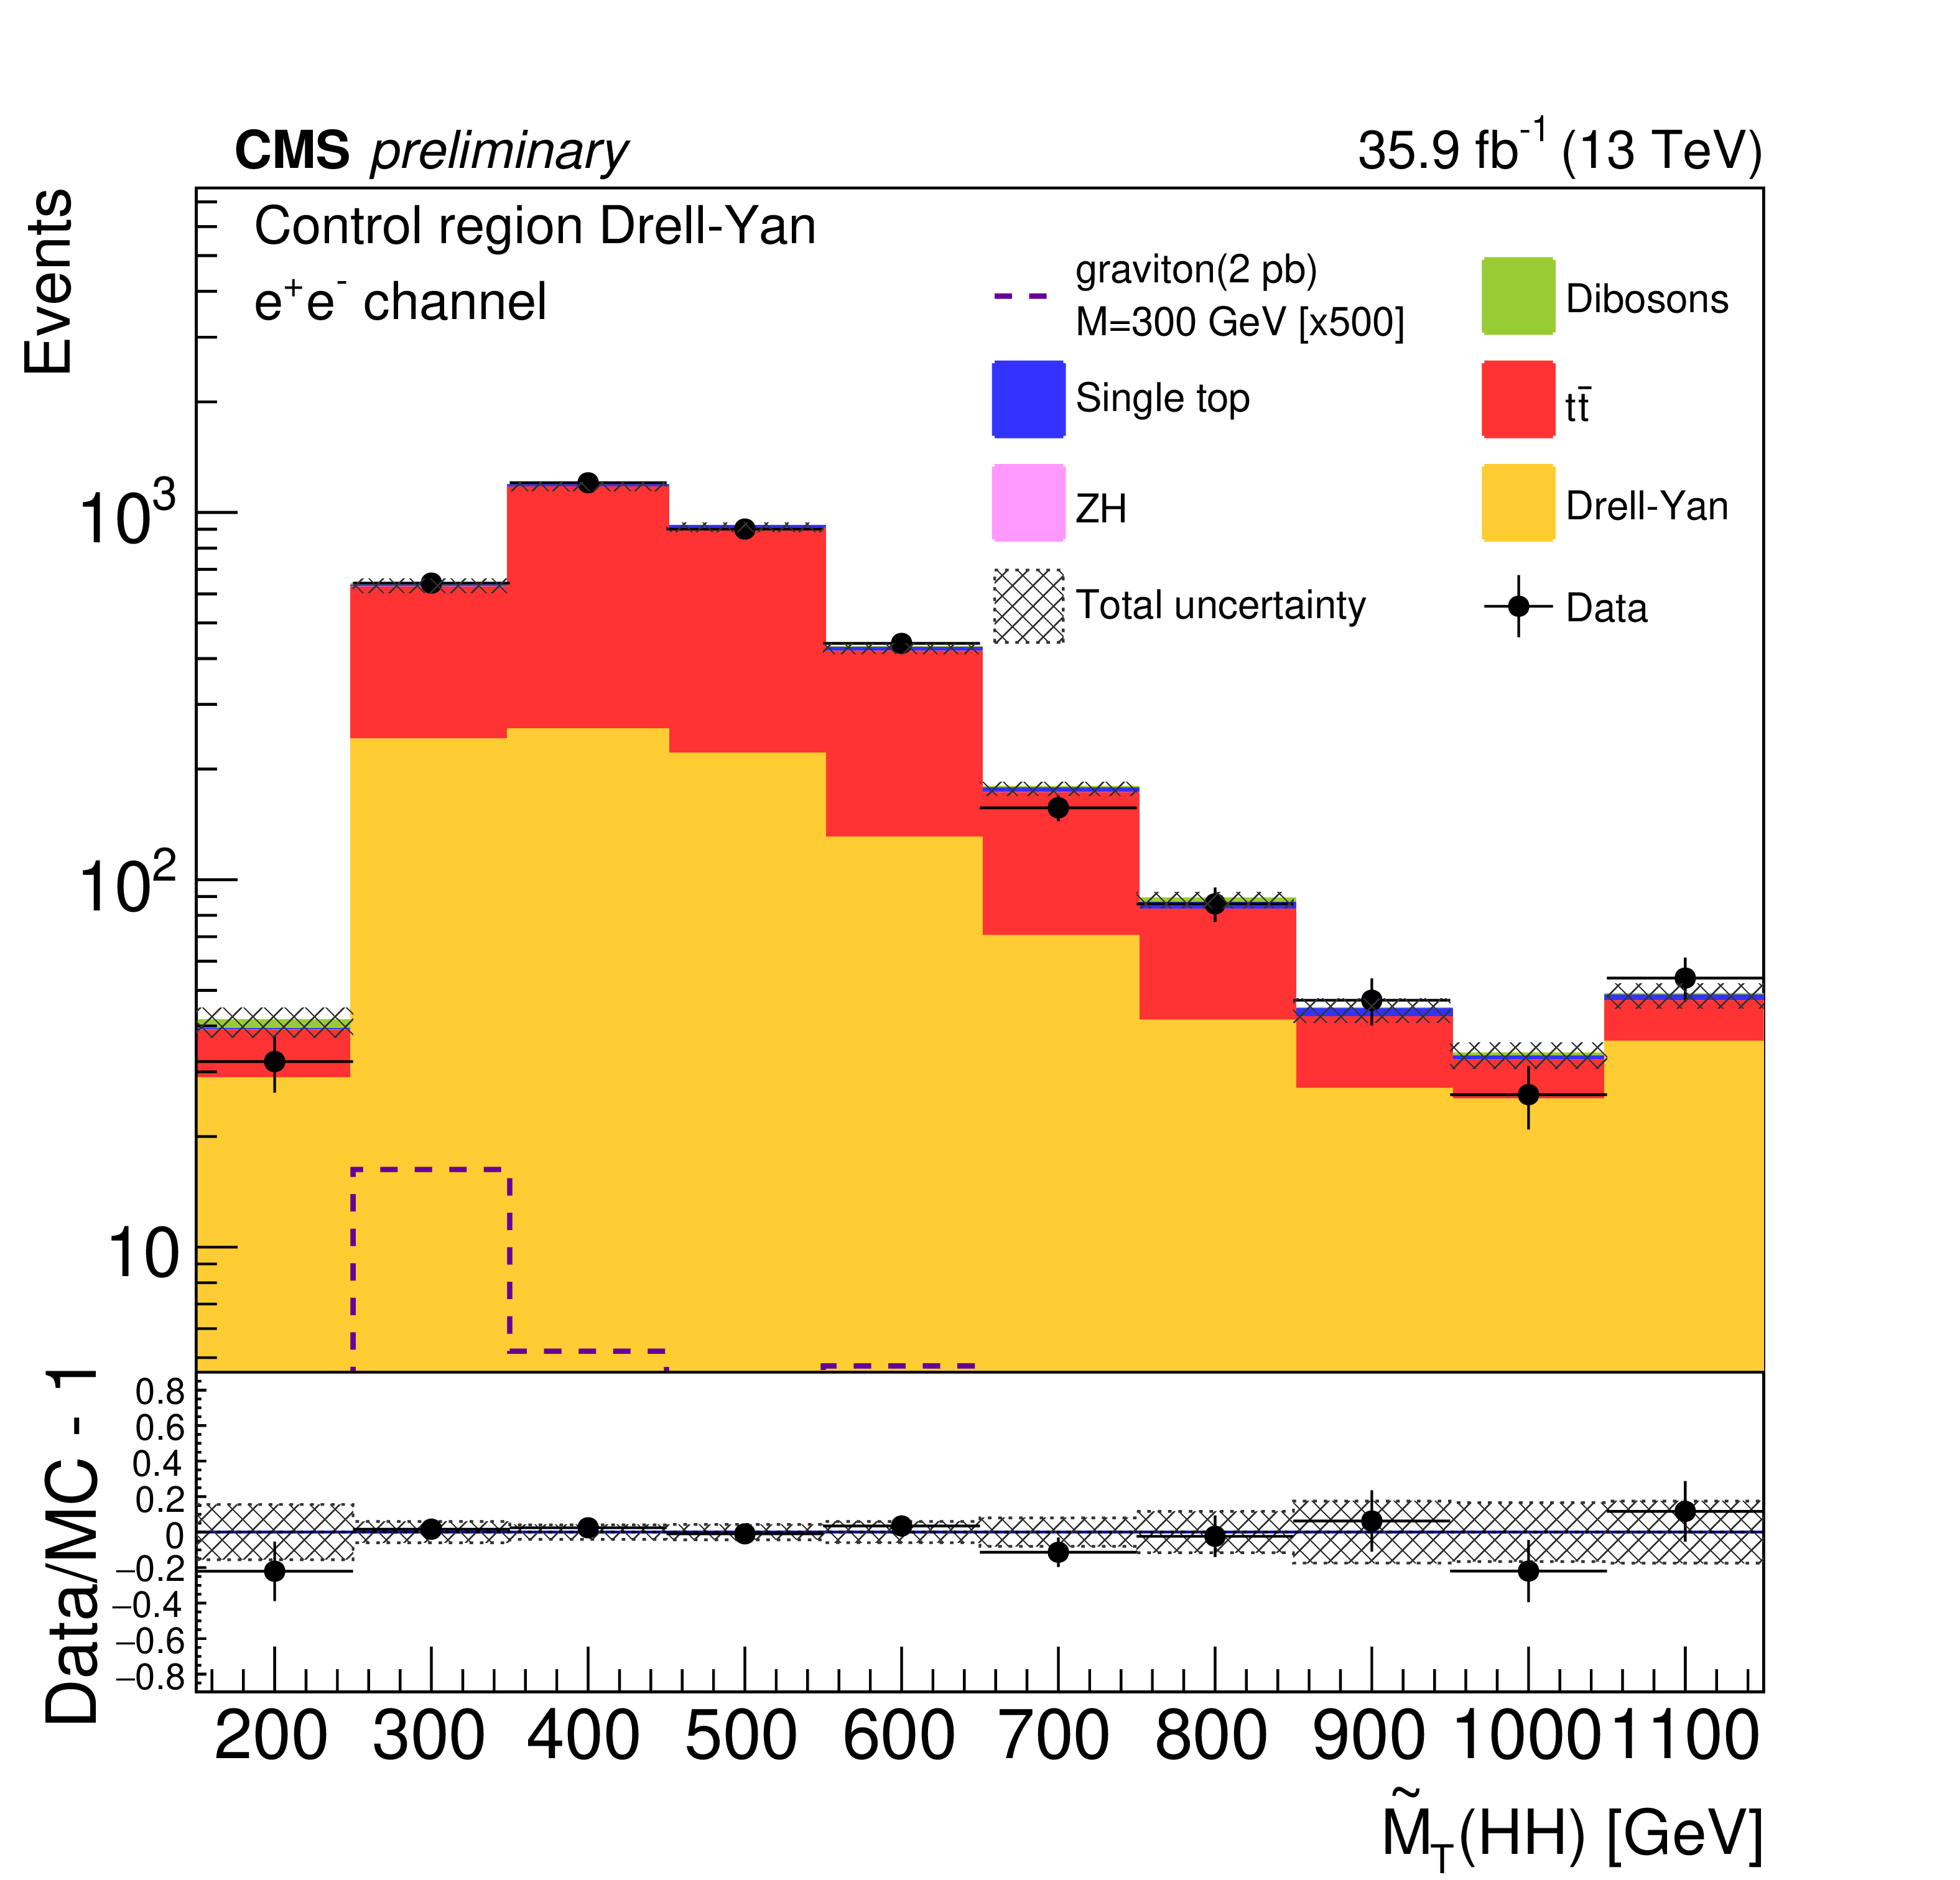
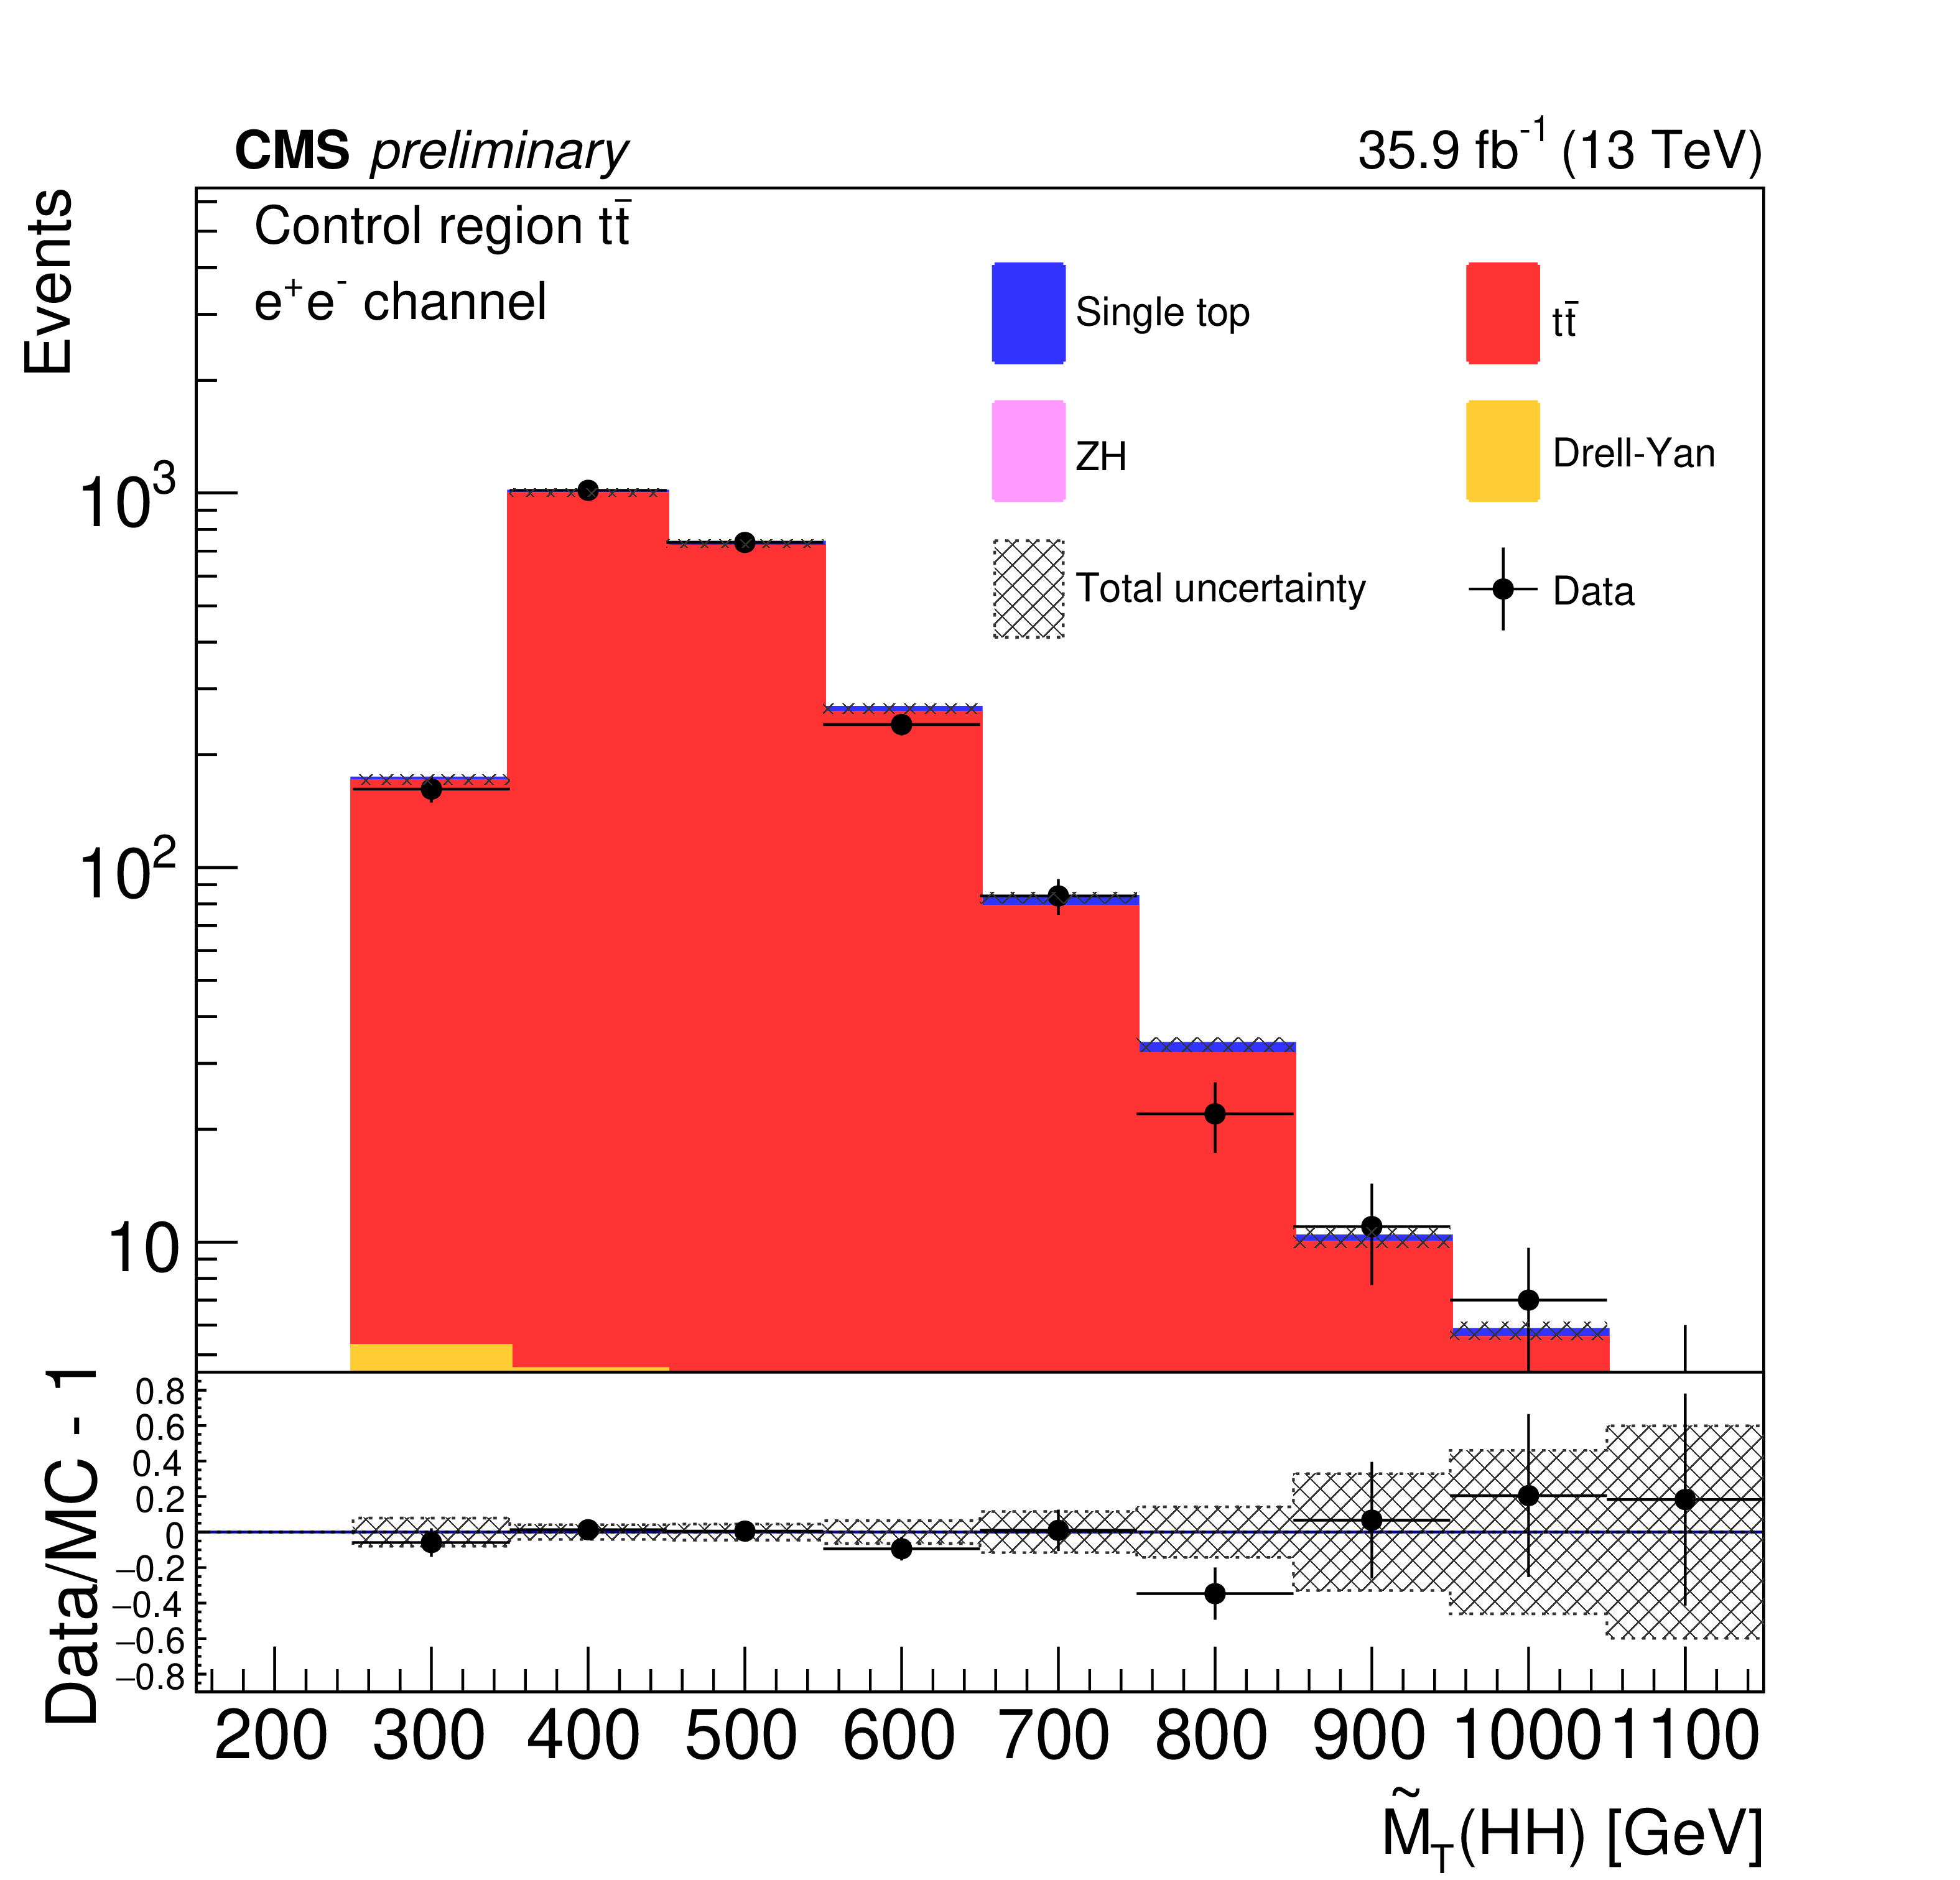
Transverse mass of the reconstructed HH candidates, in the $\mathrm{b\bar{b}}\ell \ell \nu \nu $ channel, for data, the simulated signal spin-2 RS1 graviton sample for the 300 GeV mass hypothesis, and simulated backgrounds scaled according to the fit results. The top row shows the figures for the muon channel while the bottom row is for the electron channel. For each row, the left plot is for the $\mathrm{Z} /\gamma ^{*}$+jets control region, the middle is for the ${\mathrm{t} \mathrm{\bar{t}}}$ control region, and the right is for the signal region. The signals are normalized to 2 pb for the $ \mathrm{pp}\to \mathrm{X} \to \mathrm{HH} $ process. The shaded area represents the combined statistical and systematic uncertainties. |
png pdf |
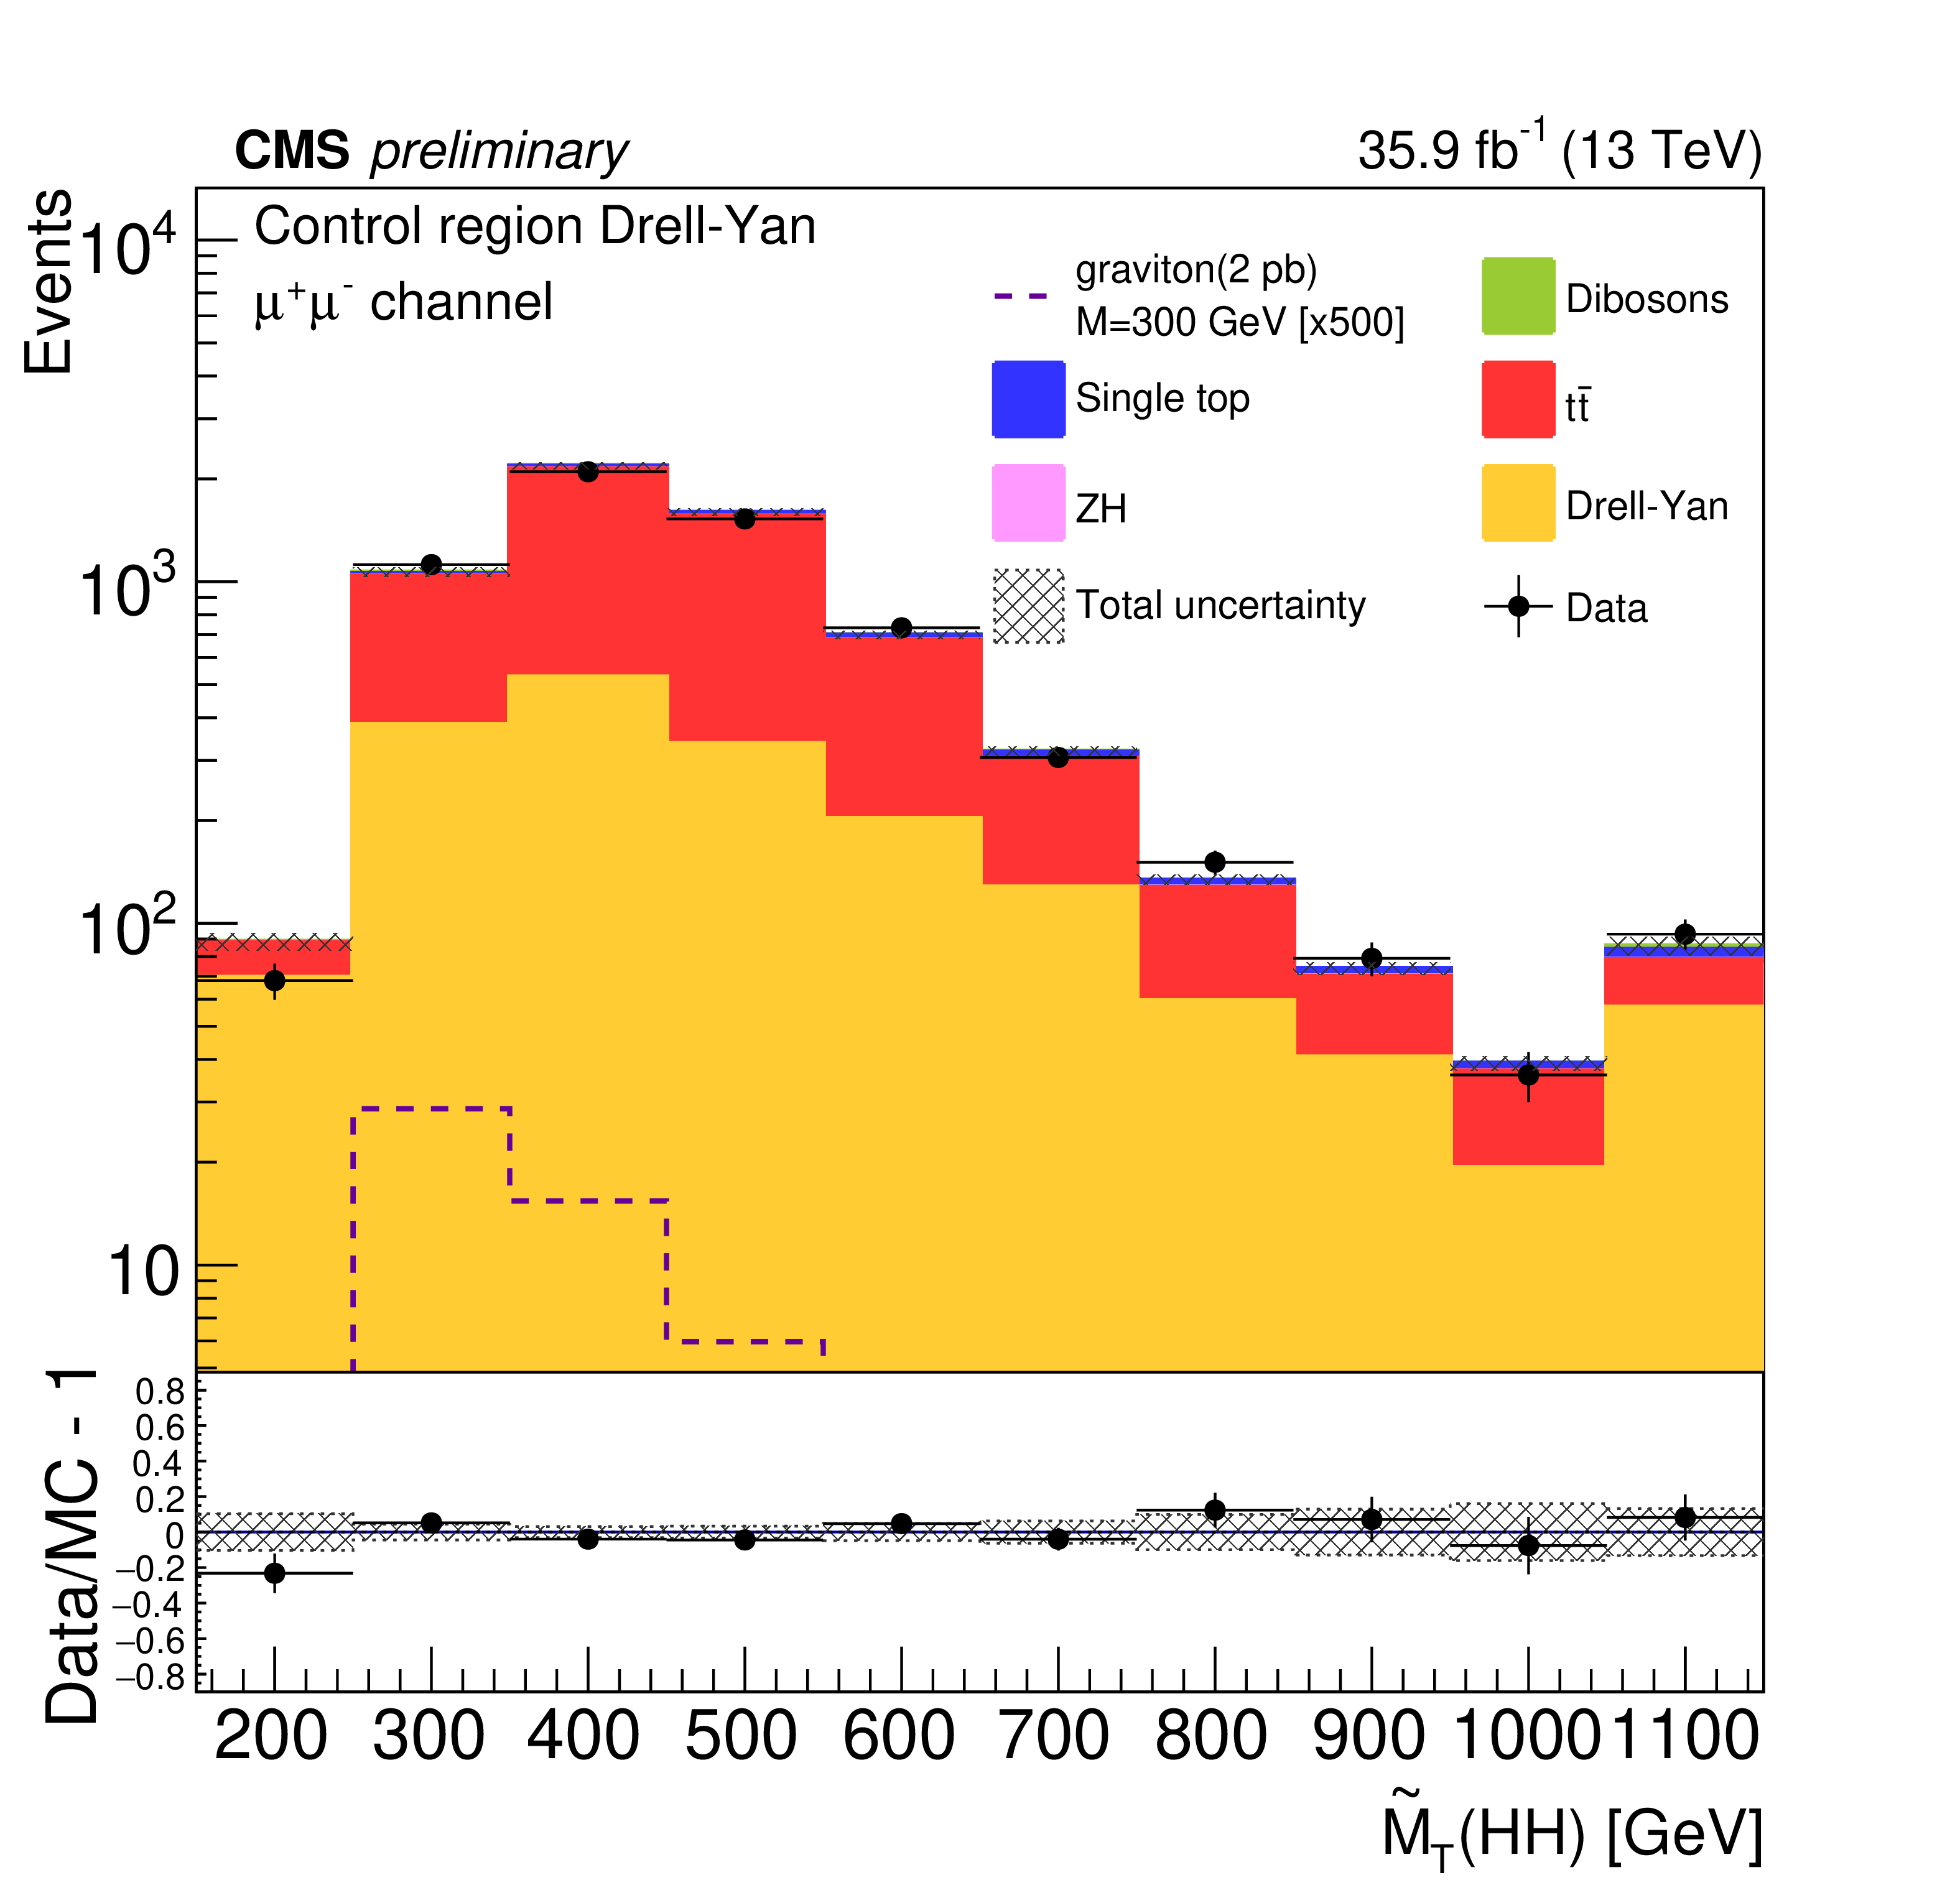
Figure 3-a:
Transverse mass of the reconstructed HH candidates, in the $\mathrm{b\bar{b}}\ell \ell \nu \nu $ channel, for data, the simulated signal spin-2 RS1 graviton sample for the 300 GeV mass hypothesis, and simulated backgrounds scaled according to the fit results. The plot is for the $\mathrm{Z} /\gamma ^{*}$+jets control region, in the muon channel. The signals are normalized to 2 pb for the $ \mathrm{pp}\to \mathrm{X} \to \mathrm{HH} $ process. The shaded area represents the combined statistical and systematic uncertainties. |
png pdf |
Figure 3-b:
Transverse mass of the reconstructed HH candidates, in the $\mathrm{b\bar{b}}\ell \ell \nu \nu $ channel, for data, the simulated signal spin-2 RS1 graviton sample for the 300 GeV mass hypothesis, and simulated backgrounds scaled according to the fit results. The plot is for the ${\mathrm{t} \mathrm{\bar{t}}}$ control region, in the muon channel. The signals are normalized to 2 pb for the $ \mathrm{pp}\to \mathrm{X} \to \mathrm{HH} $ process. The shaded area represents the combined statistical and systematic uncertainties. |
png pdf |
Figure 3-c:
Transverse mass of the reconstructed HH candidates, in the $\mathrm{b\bar{b}}\ell \ell \nu \nu $ channel, for data, the simulated signal spin-2 RS1 graviton sample for the 300 GeV mass hypothesis, and simulated backgrounds scaled according to the fit results. The plot is for the signal region, in the muon channel. The signals are normalized to 2 pb for the $ \mathrm{pp}\to \mathrm{X} \to \mathrm{HH} $ process. The shaded area represents the combined statistical and systematic uncertainties. |
png pdf |
Figure 3-d:
Transverse mass of the reconstructed HH candidates, in the $\mathrm{b\bar{b}}\ell \ell \nu \nu $ channel, for data, the simulated signal spin-2 RS1 graviton sample for the 300 GeV mass hypothesis, and simulated backgrounds scaled according to the fit results. The plot is for the $\mathrm{Z} /\gamma ^{*}$+jets control region, in the electron channel. The signals are normalized to 2 pb for the $ \mathrm{pp}\to \mathrm{X} \to \mathrm{HH} $ process. The shaded area represents the combined statistical and systematic uncertainties. |
png pdf |
Figure 3-e:
Transverse mass of the reconstructed HH candidates, in the $\mathrm{b\bar{b}}\ell \ell \nu \nu $ channel, for data, the simulated signal spin-2 RS1 graviton sample for the 300 GeV mass hypothesis, and simulated backgrounds scaled according to the fit results. The plot is for the ${\mathrm{t} \mathrm{\bar{t}}}$ control region, in the electron channel. The signals are normalized to 2 pb for the $ \mathrm{pp}\to \mathrm{X} \to \mathrm{HH} $ process. The shaded area represents the combined statistical and systematic uncertainties. |
png pdf |
Figure 3-f:
Transverse mass of the reconstructed HH candidates, in the $\mathrm{b\bar{b}}\ell \ell \nu \nu $ channel, for data, the simulated signal spin-2 RS1 graviton sample for the 300 GeV mass hypothesis, and simulated backgrounds scaled according to the fit results. The plot is for the signal region, in the electron channel. The signals are normalized to 2 pb for the $ \mathrm{pp}\to \mathrm{X} \to \mathrm{HH} $ process. The shaded area represents the combined statistical and systematic uncertainties. |
png pdf |
Figure 4:
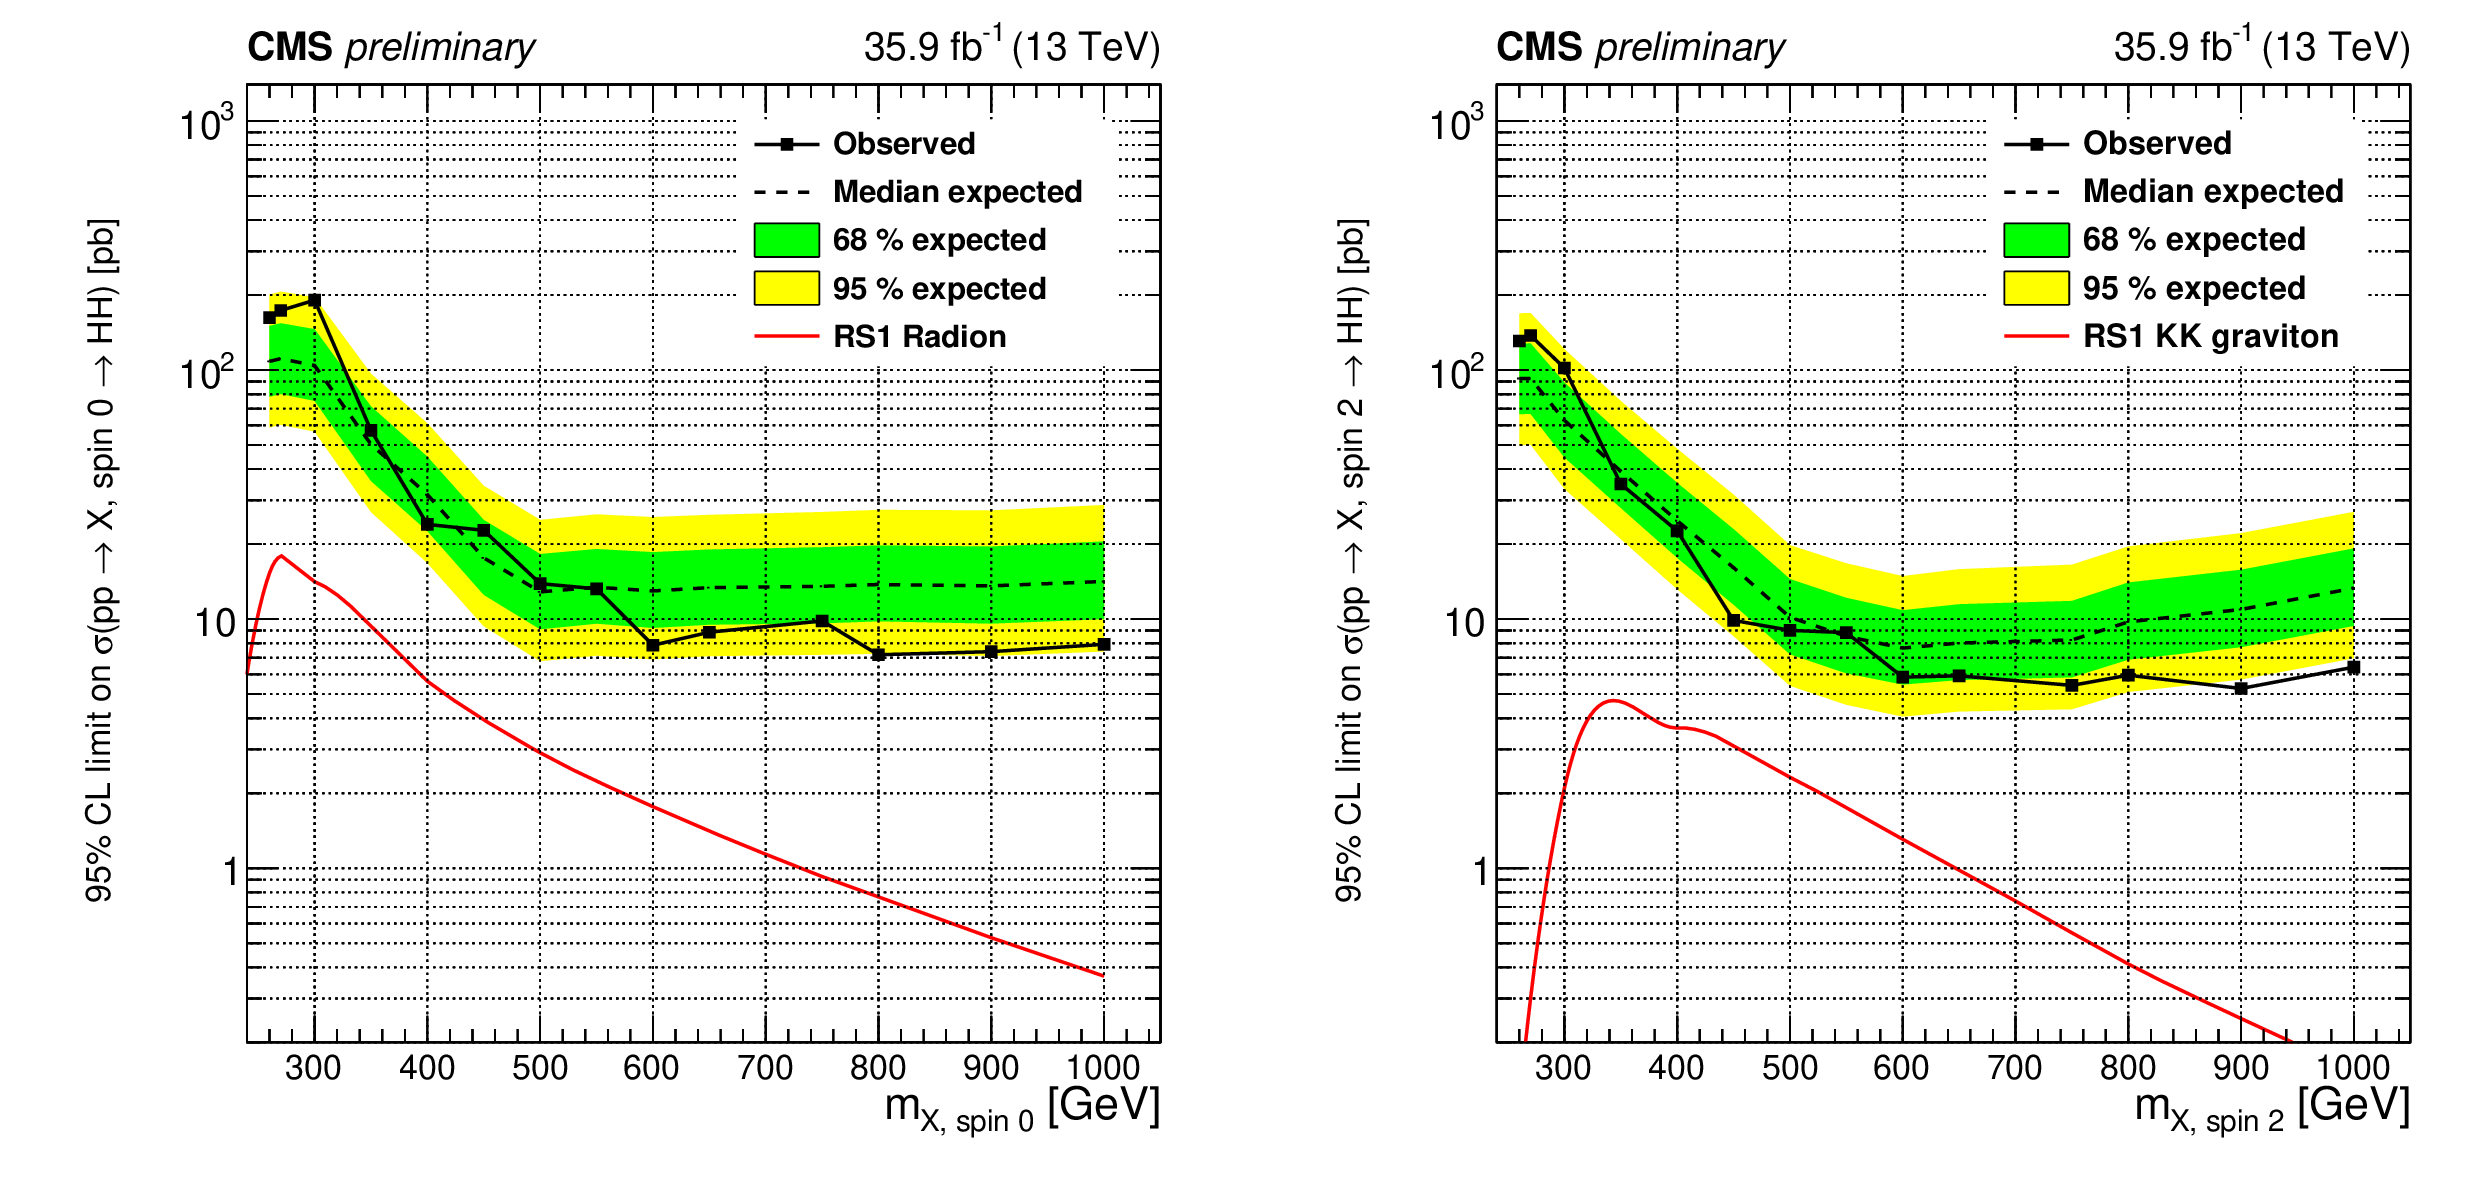
Expected (black dashed line) and observed (black solid line) limits on the cross section of resonant HH production as a function of the mass of the resonance for the $\mathrm{b\bar{b}}\ell \ell {\mathrm{jj}}$ channel. The RS1 radion case is shown on the left and the RS1 KK graviton case is shown on the right. The red solid lines show the theoretical prediction for the cross section of an RS1 radion with $\lambda _R = $ 1 TeV and $kL=$ 35 (left) and an RS1 KK graviton with $\tilde{k} = $ 0.1 (right). |
png pdf |
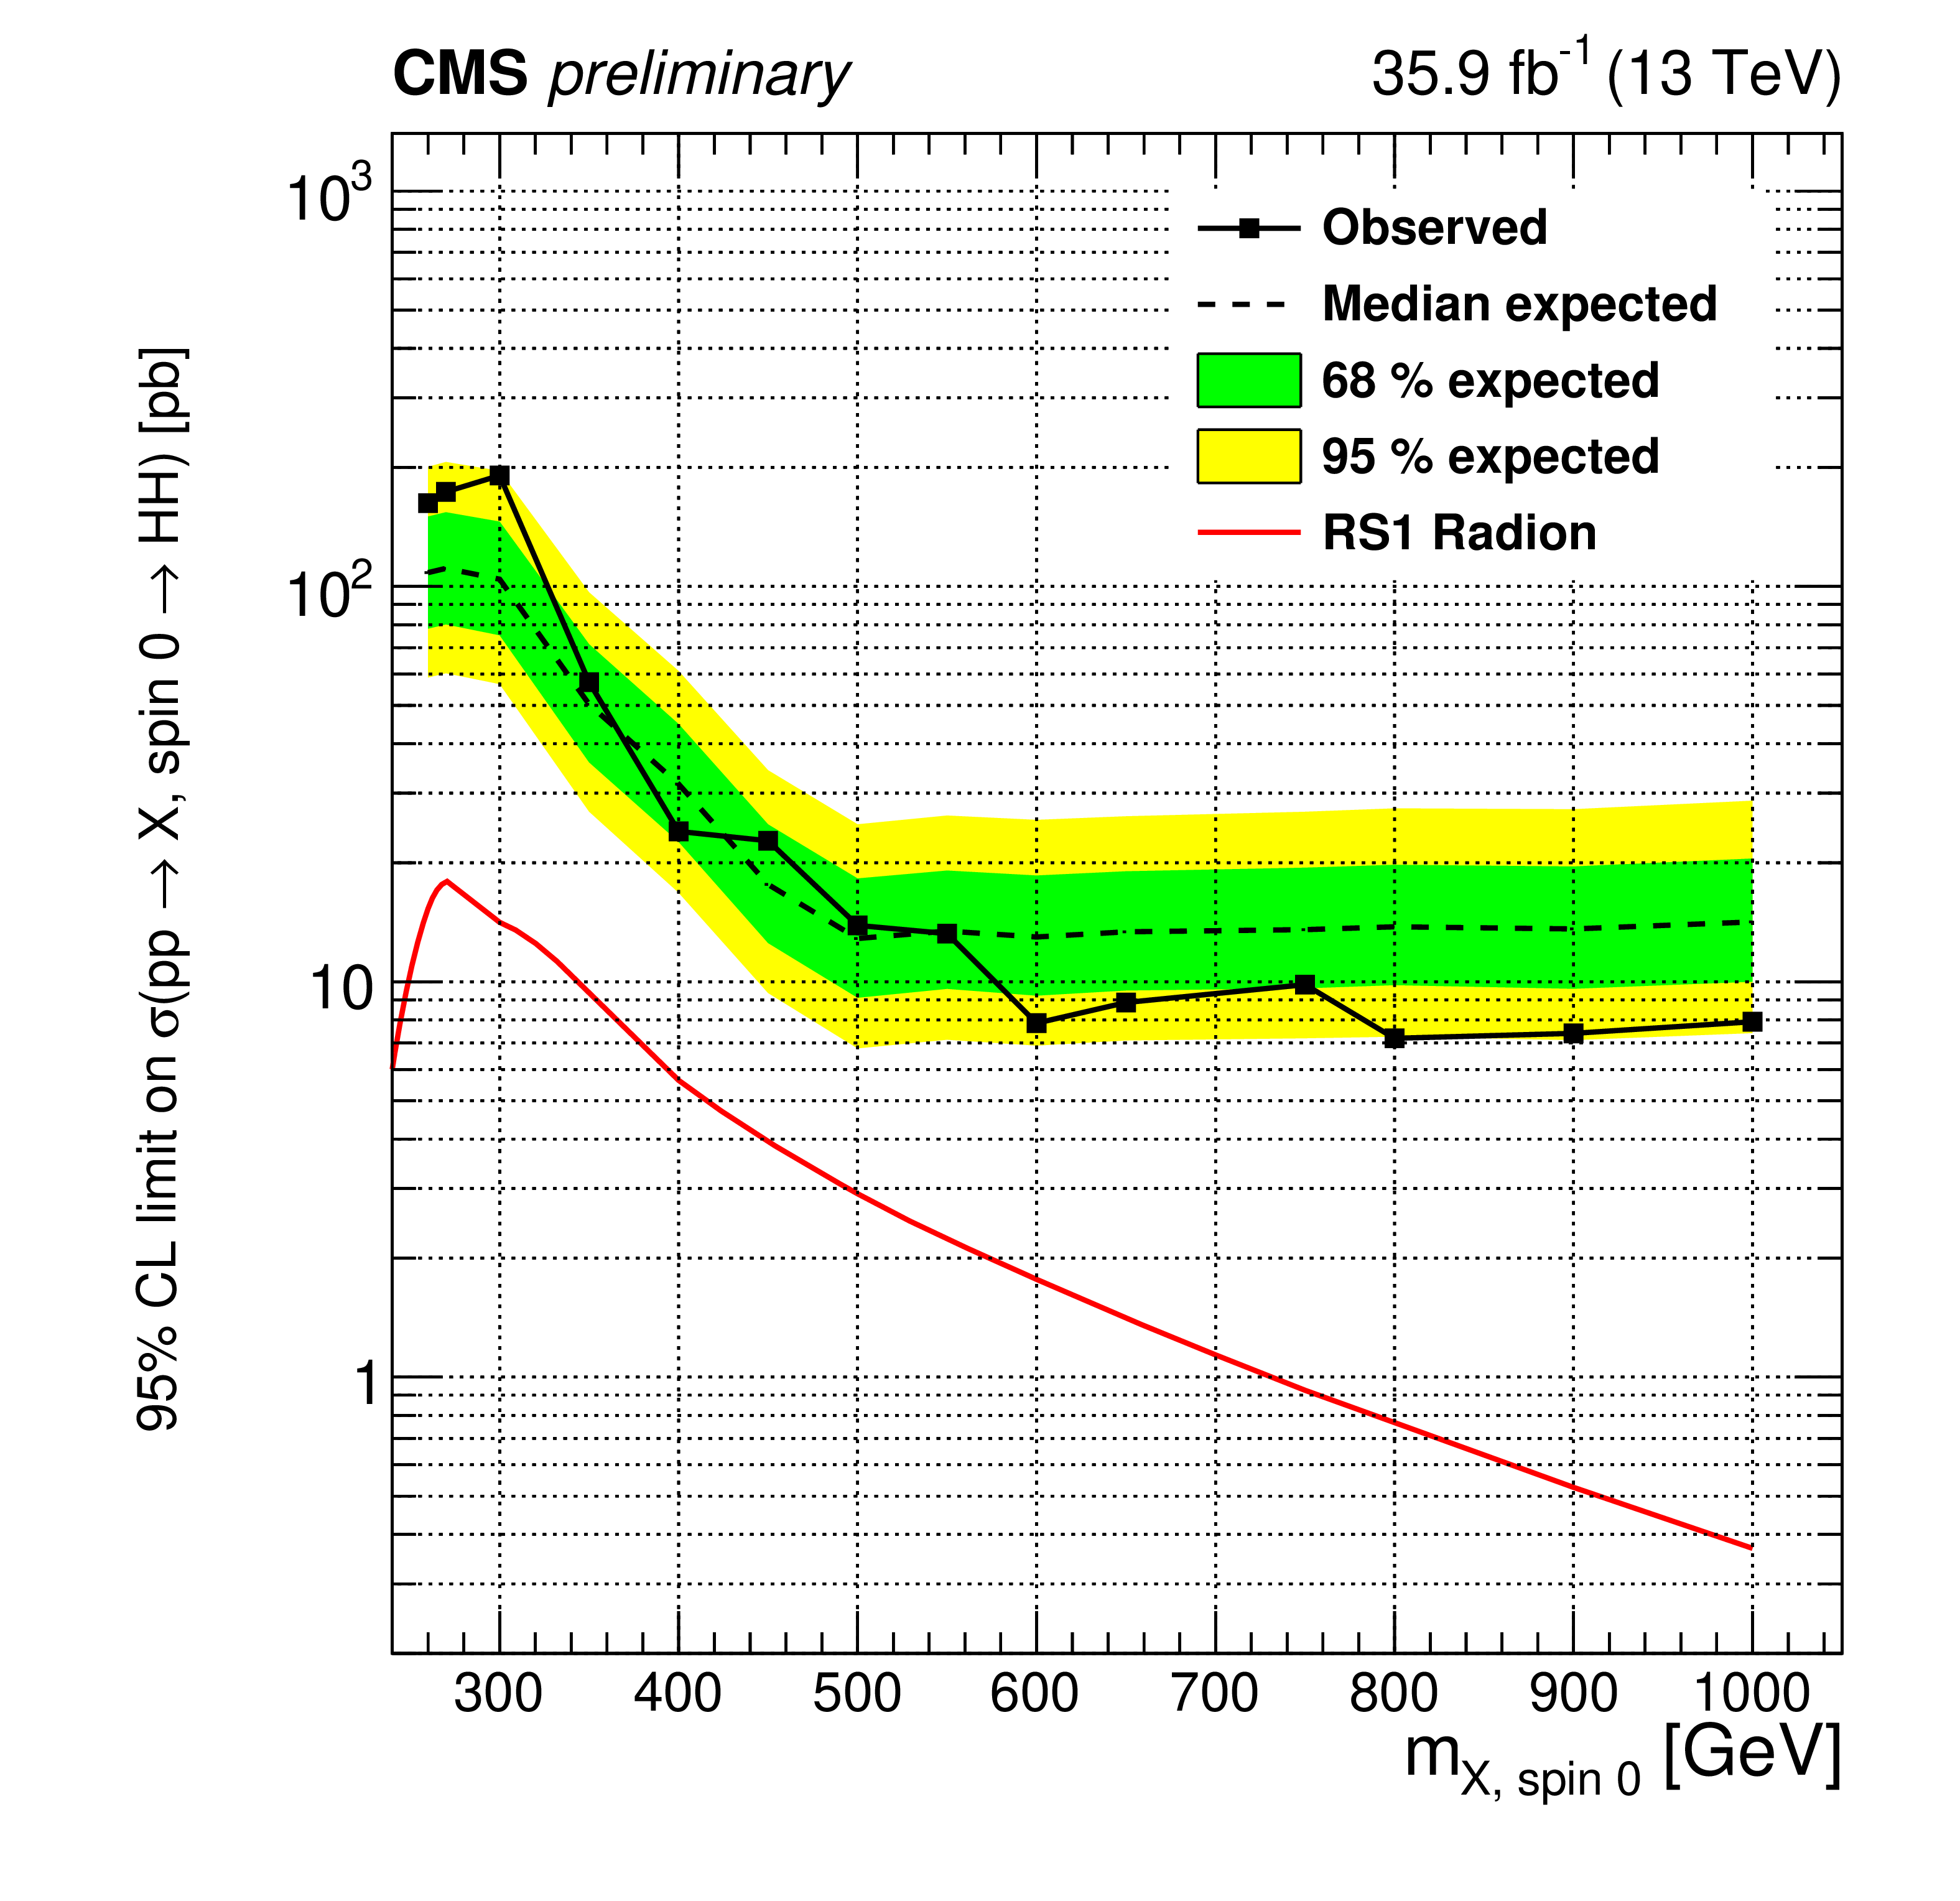
Figure 4-a:
Expected (black dashed line) and observed (black solid line) limits on the cross section of resonant HH production as a function of the mass of the resonance for the $\mathrm{b\bar{b}}\ell \ell {\mathrm{jj}}$ channel. The RS1 radion case is shown. The red solid lines show the theoretical prediction for the cross section of an RS1 radion with $\lambda _R = $ 1 TeV and $kL=$ 35. |
png pdf |
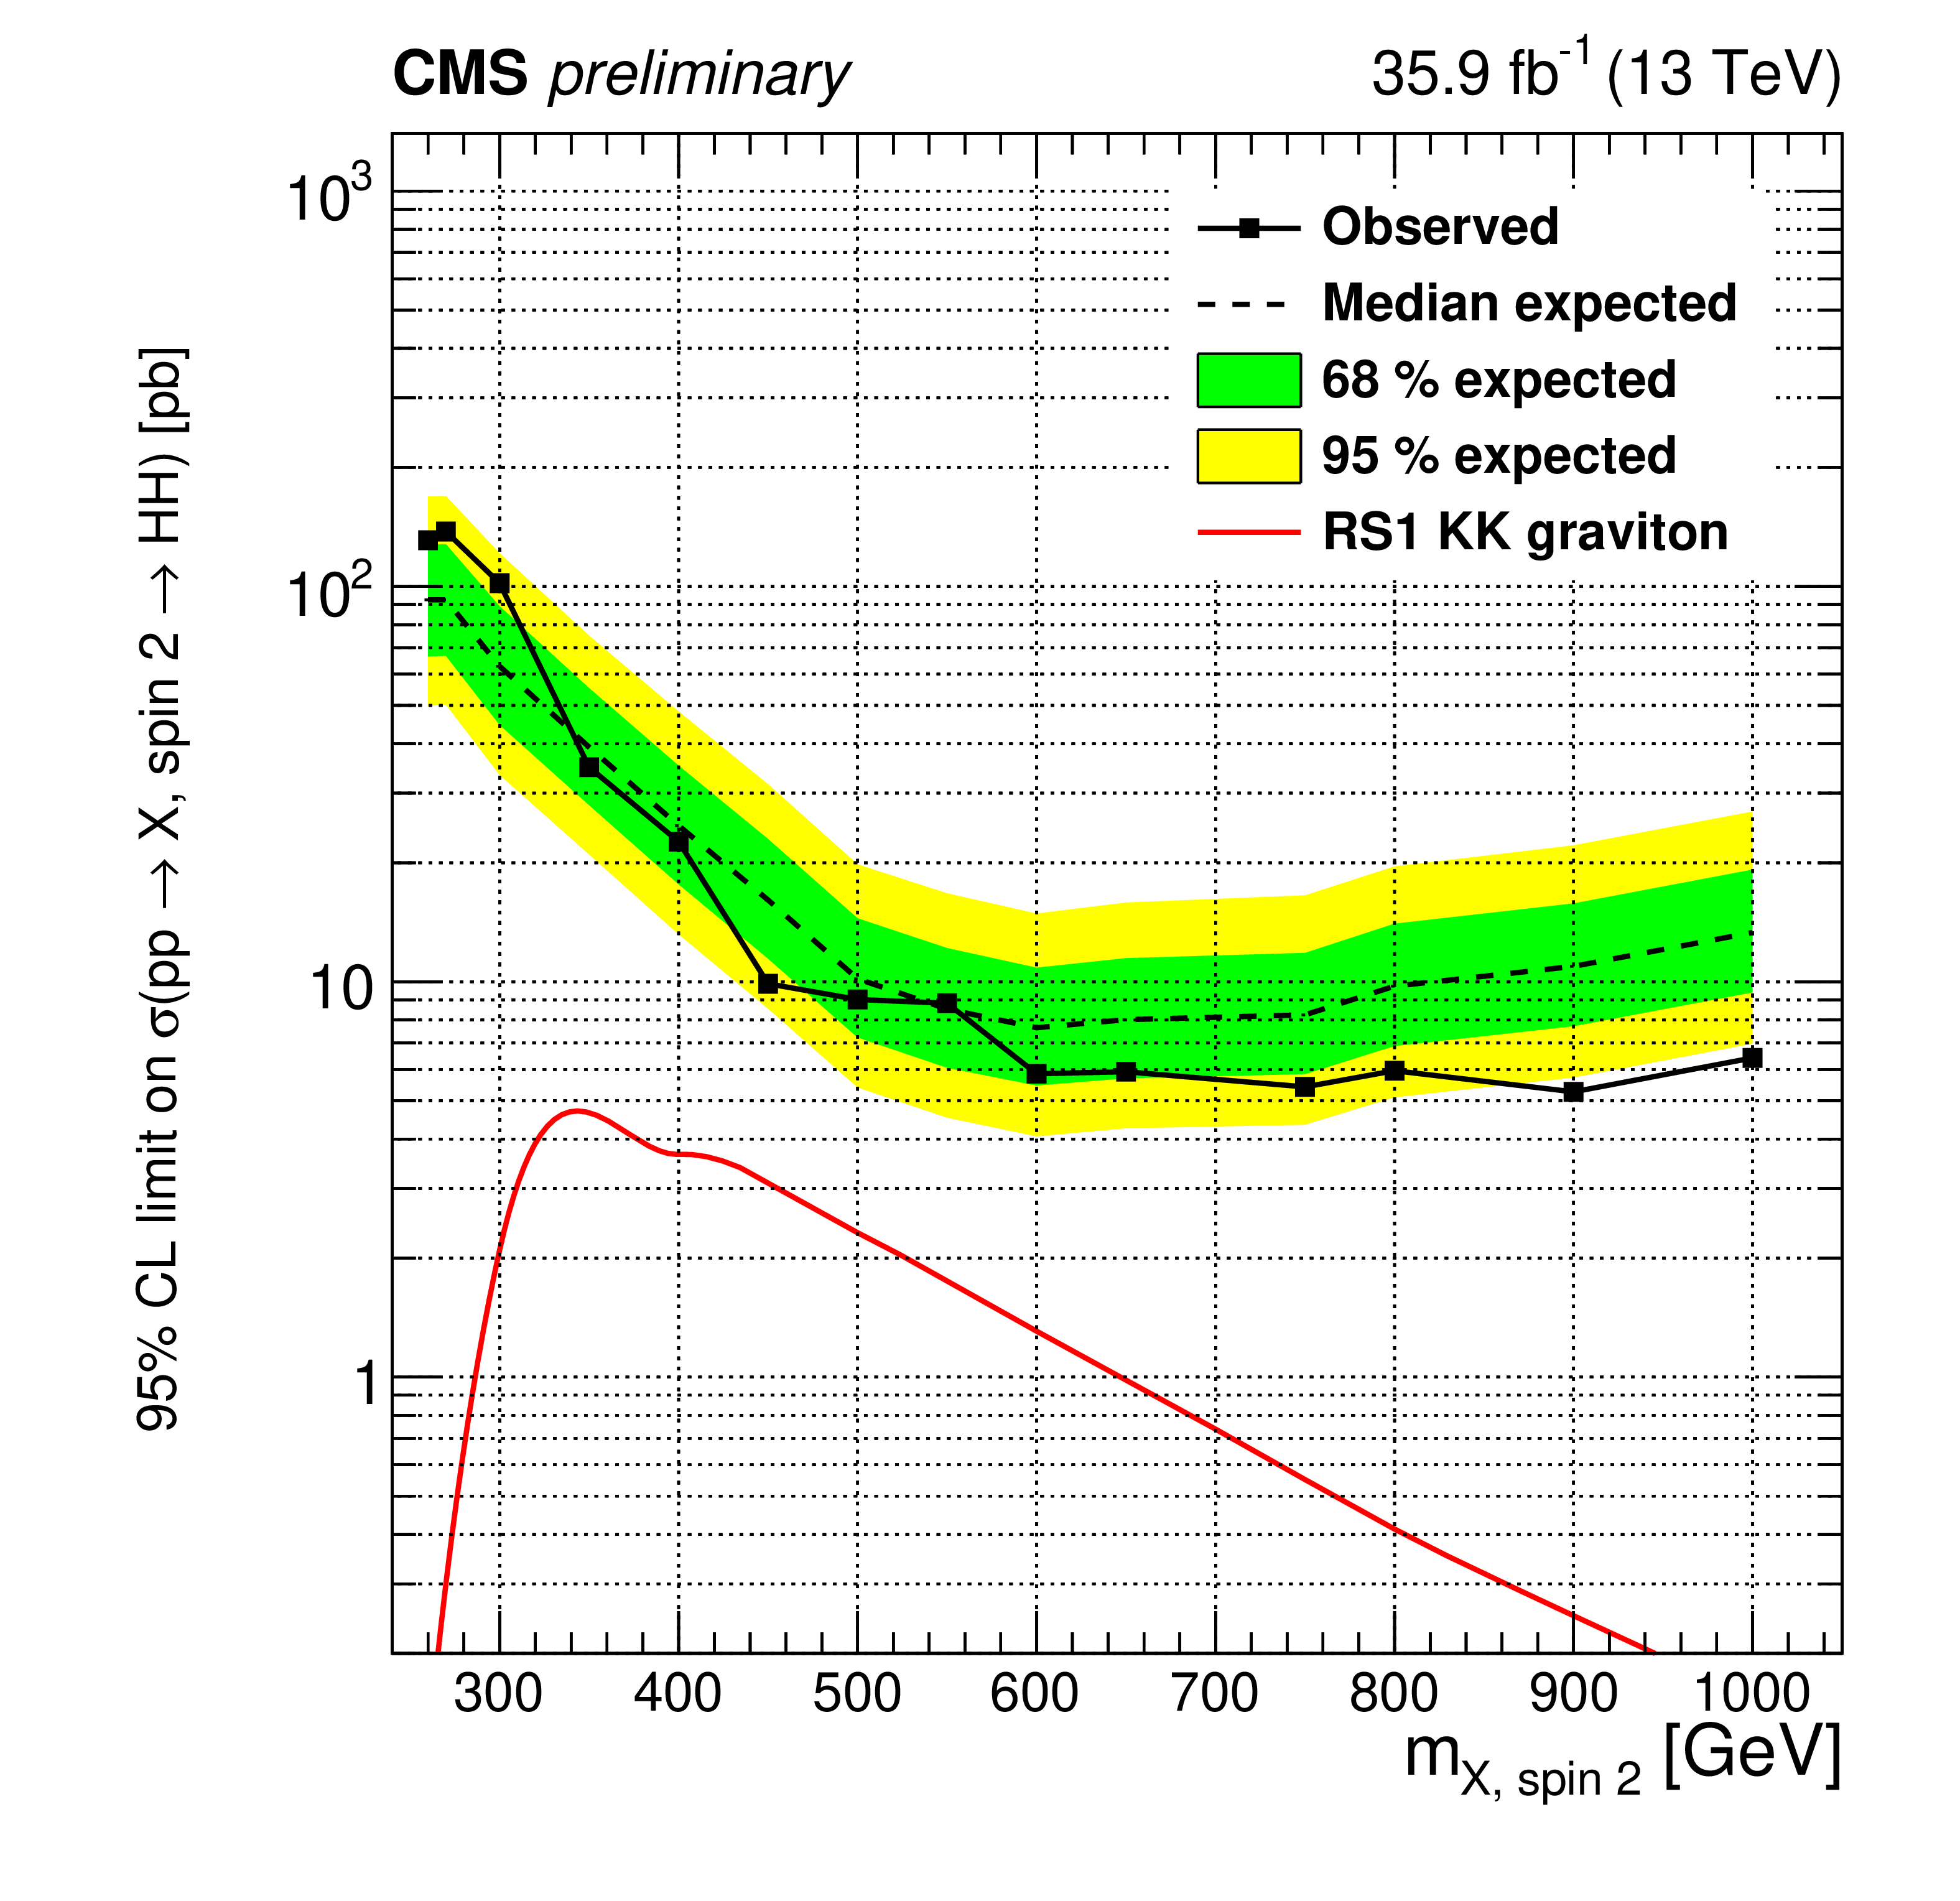
Figure 4-b:
Expected (black dashed line) and observed (black solid line) limits on the cross section of resonant HH production as a function of the mass of the resonance for the $\mathrm{b\bar{b}}\ell \ell {\mathrm{jj}}$ channel. The RS1 KK graviton case is shown. The red solid lines show the theoretical prediction for the cross section of an RS1 KK graviton with $\tilde{k} = $ 0.1. |
png pdf |
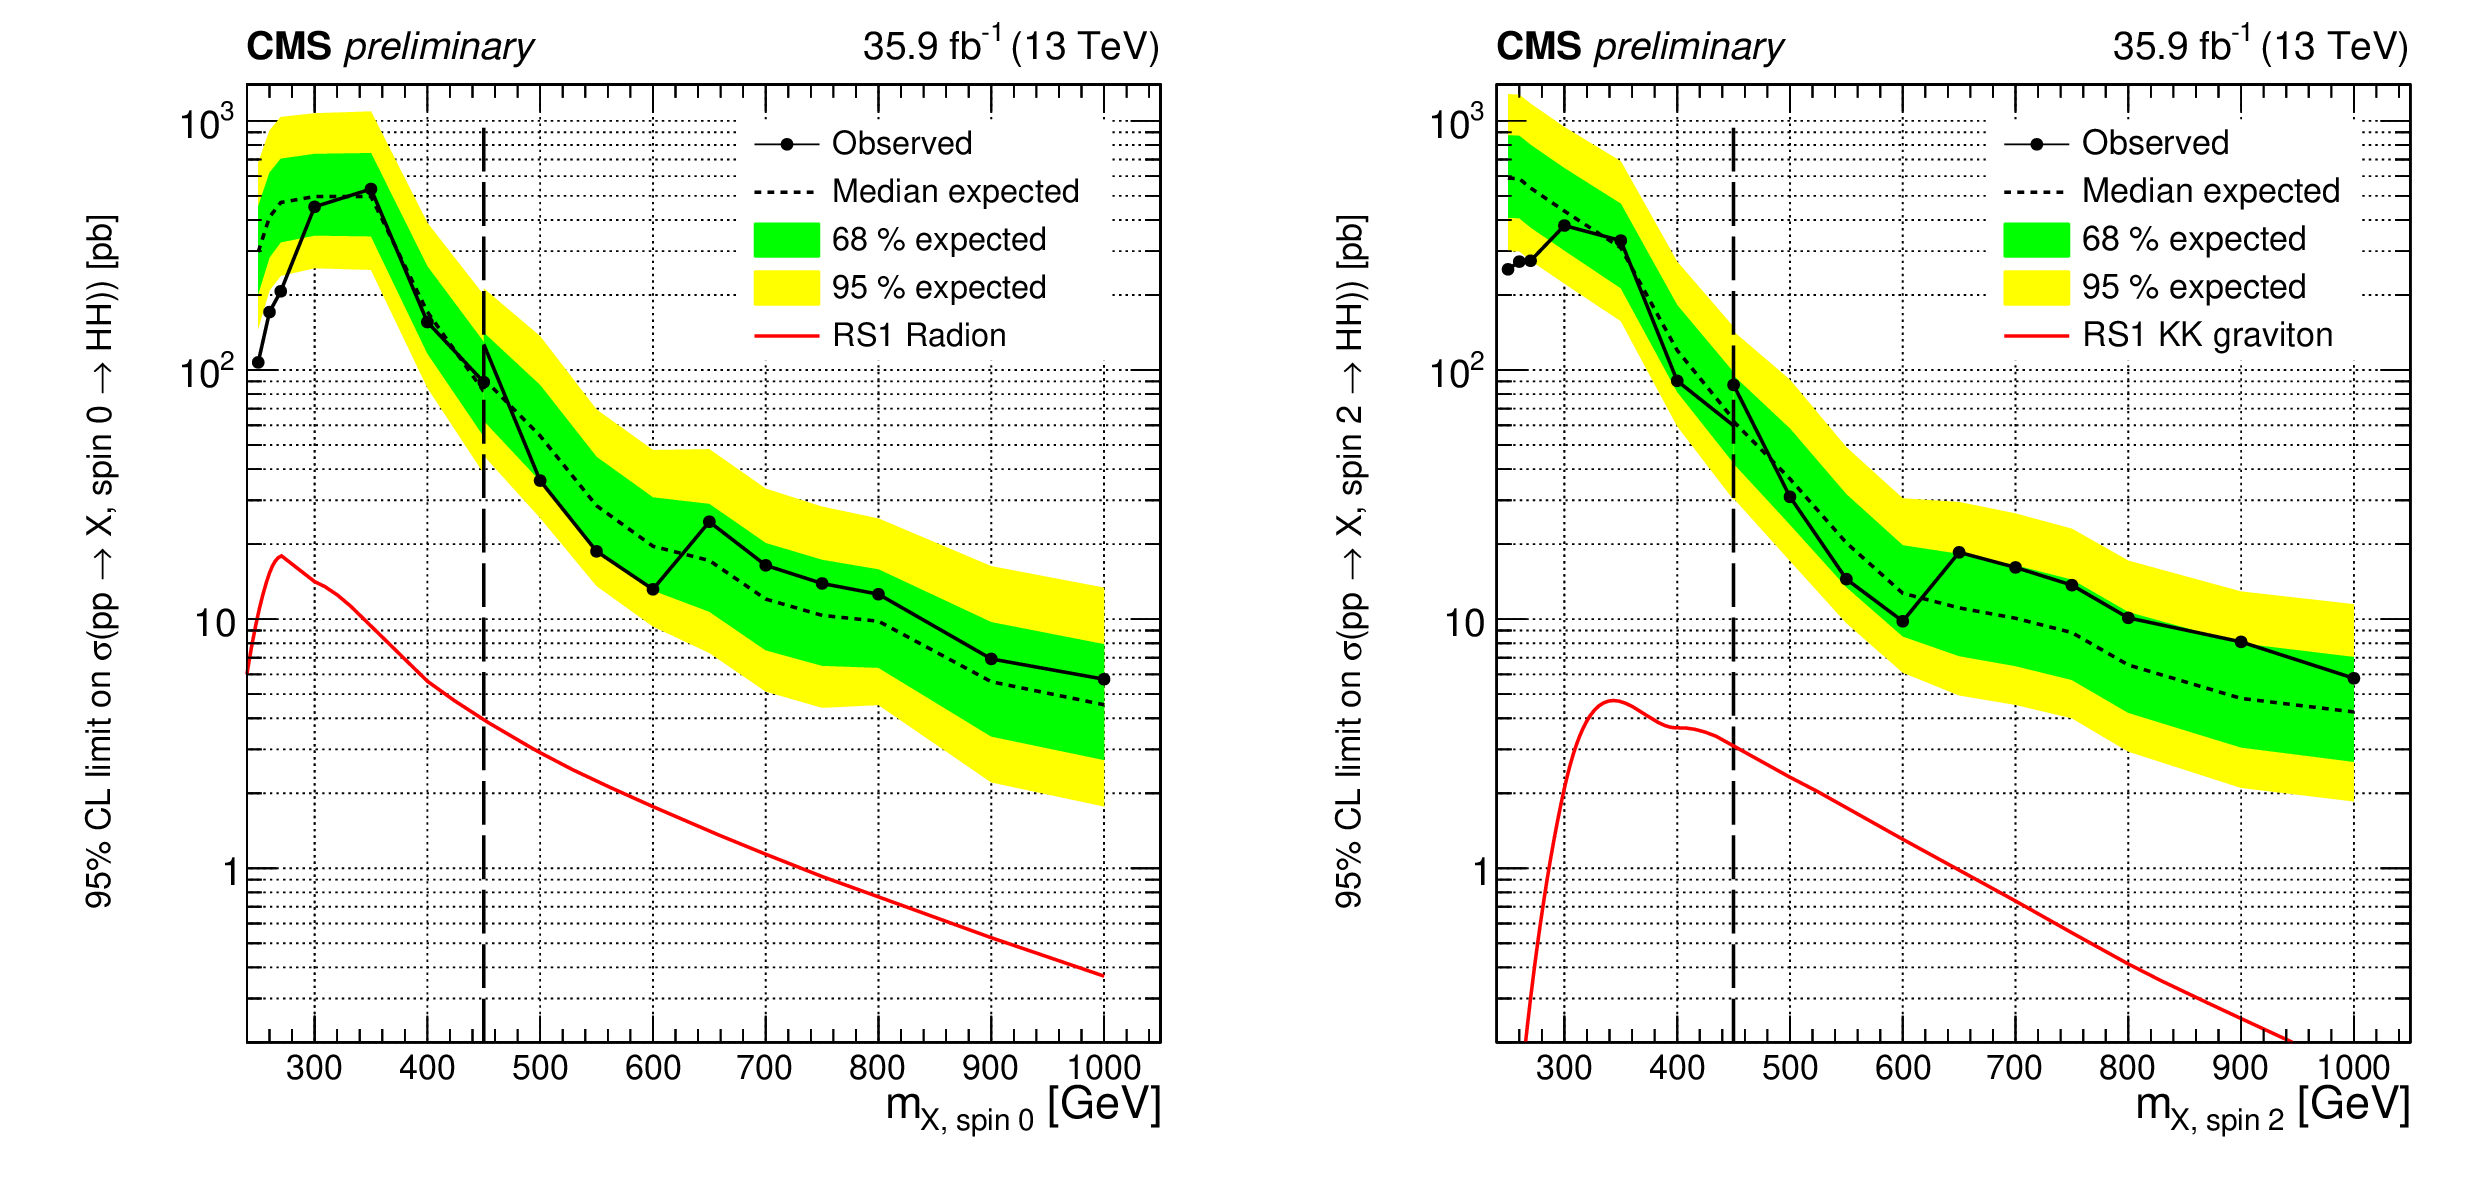
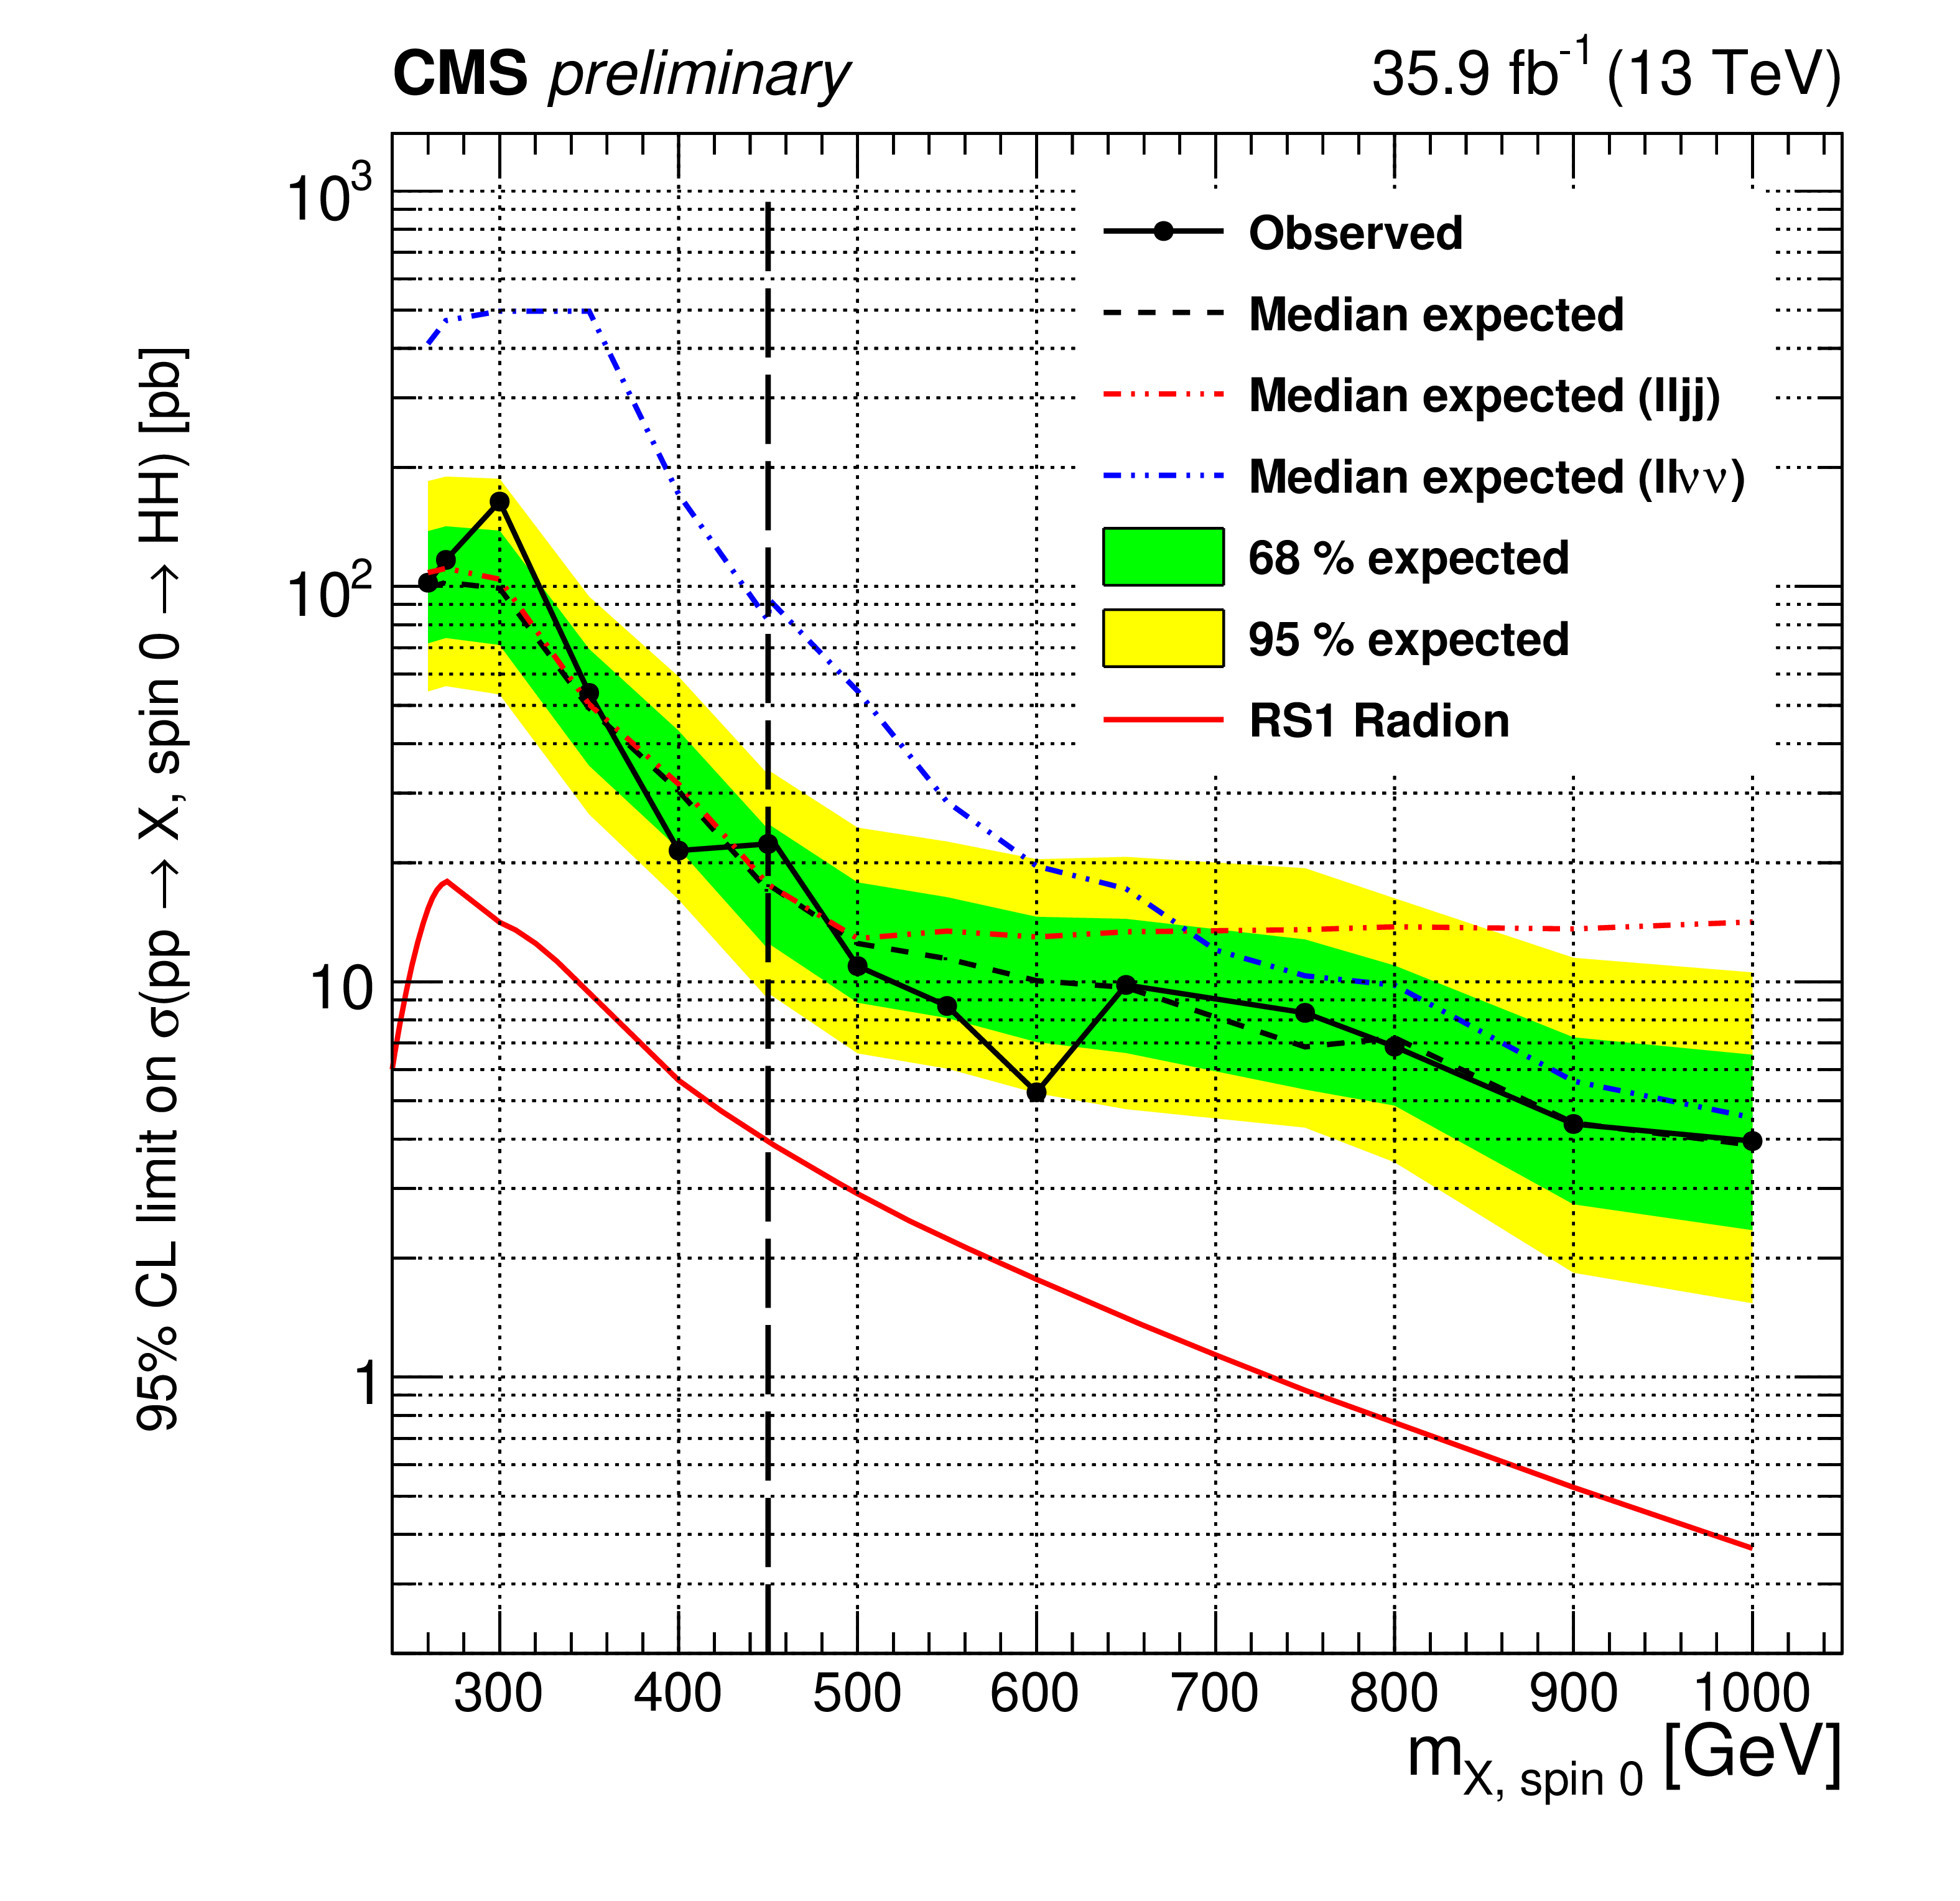
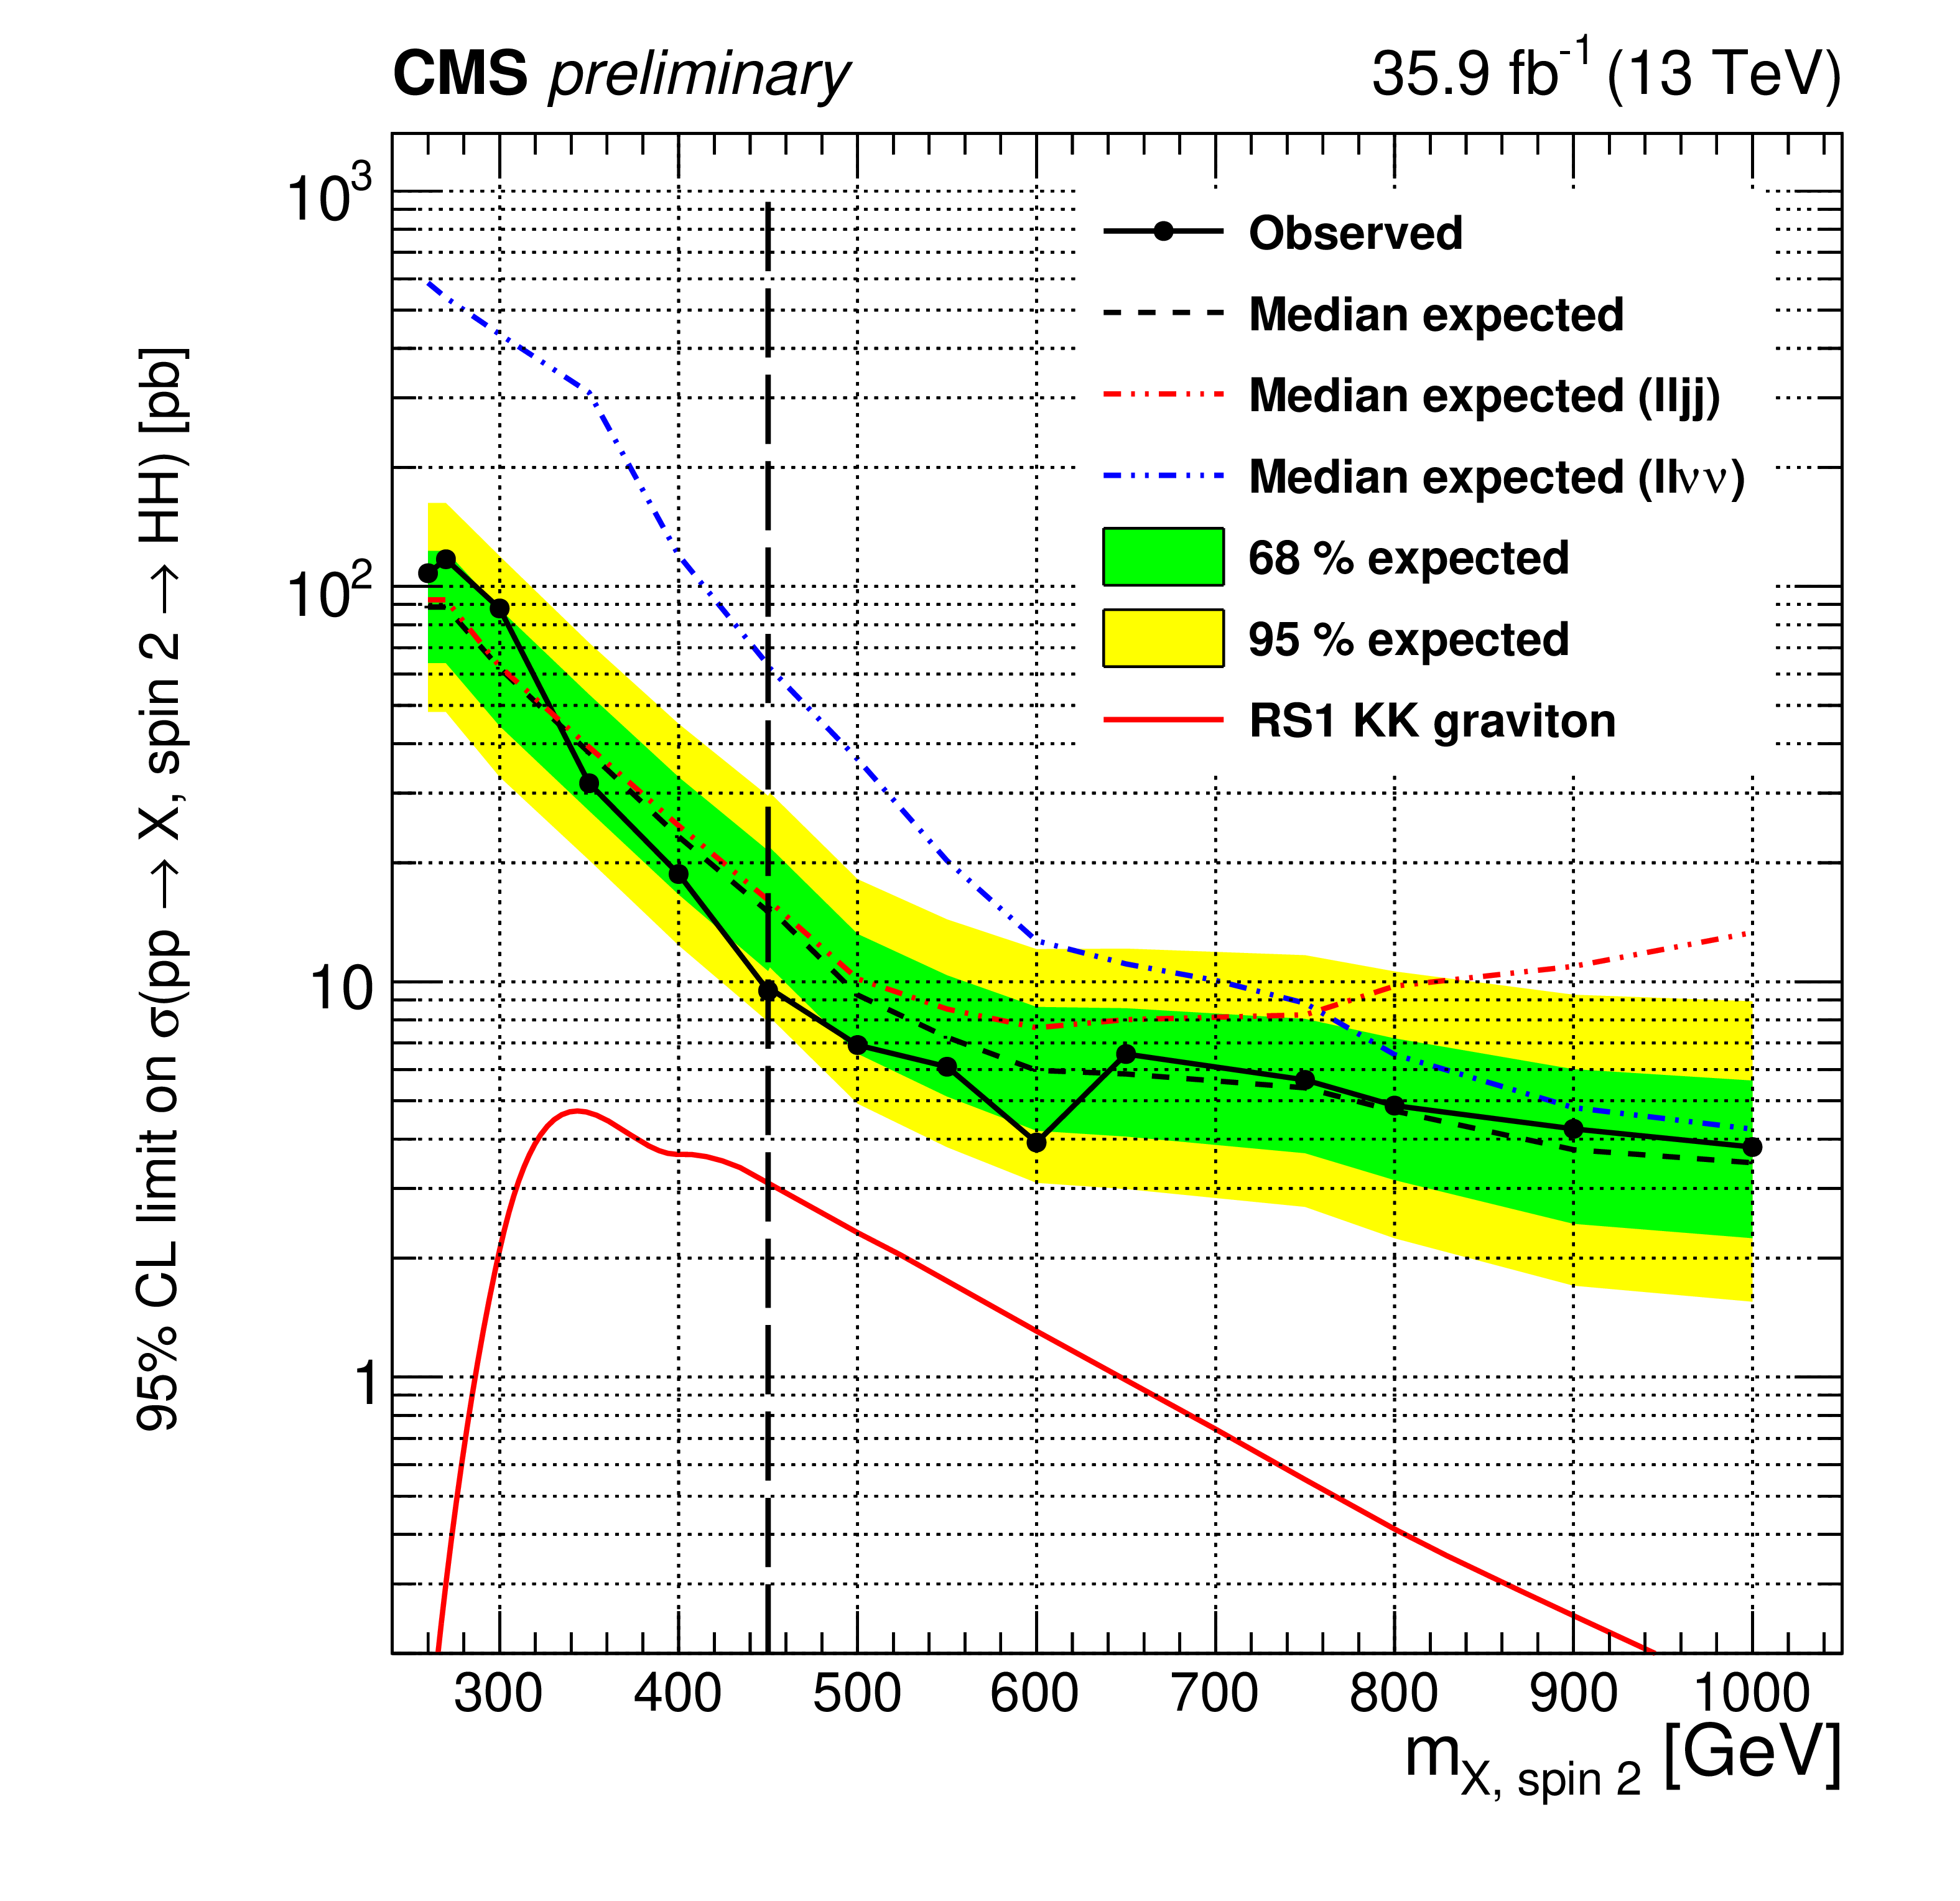
Figure 5:
Expected (black dashed line) and observed (black solid line) limits on the cross section of resonant HH production as a function of the mass of the resonance for the $\mathrm{b\bar{b}}\ell \ell \nu \nu $ channel. The RS1 radion case is shown on the left and the RS1 KK graviton case is shown on the right. The red solid lines show the theoretical prediction for the cross section of an RS1 radion with $\lambda _R = $ 1 TeV and $kL=$ 35 (left) and an RS1 KK graviton with $\tilde{k} = $ 0.1 (right). The vertical black dashed line indicates the resonance mass of 450 GeV, a mass point where the BDT used in the analysis is switched from the one trained for low mass resonance to the one trained for high mass resonance. |
png pdf |
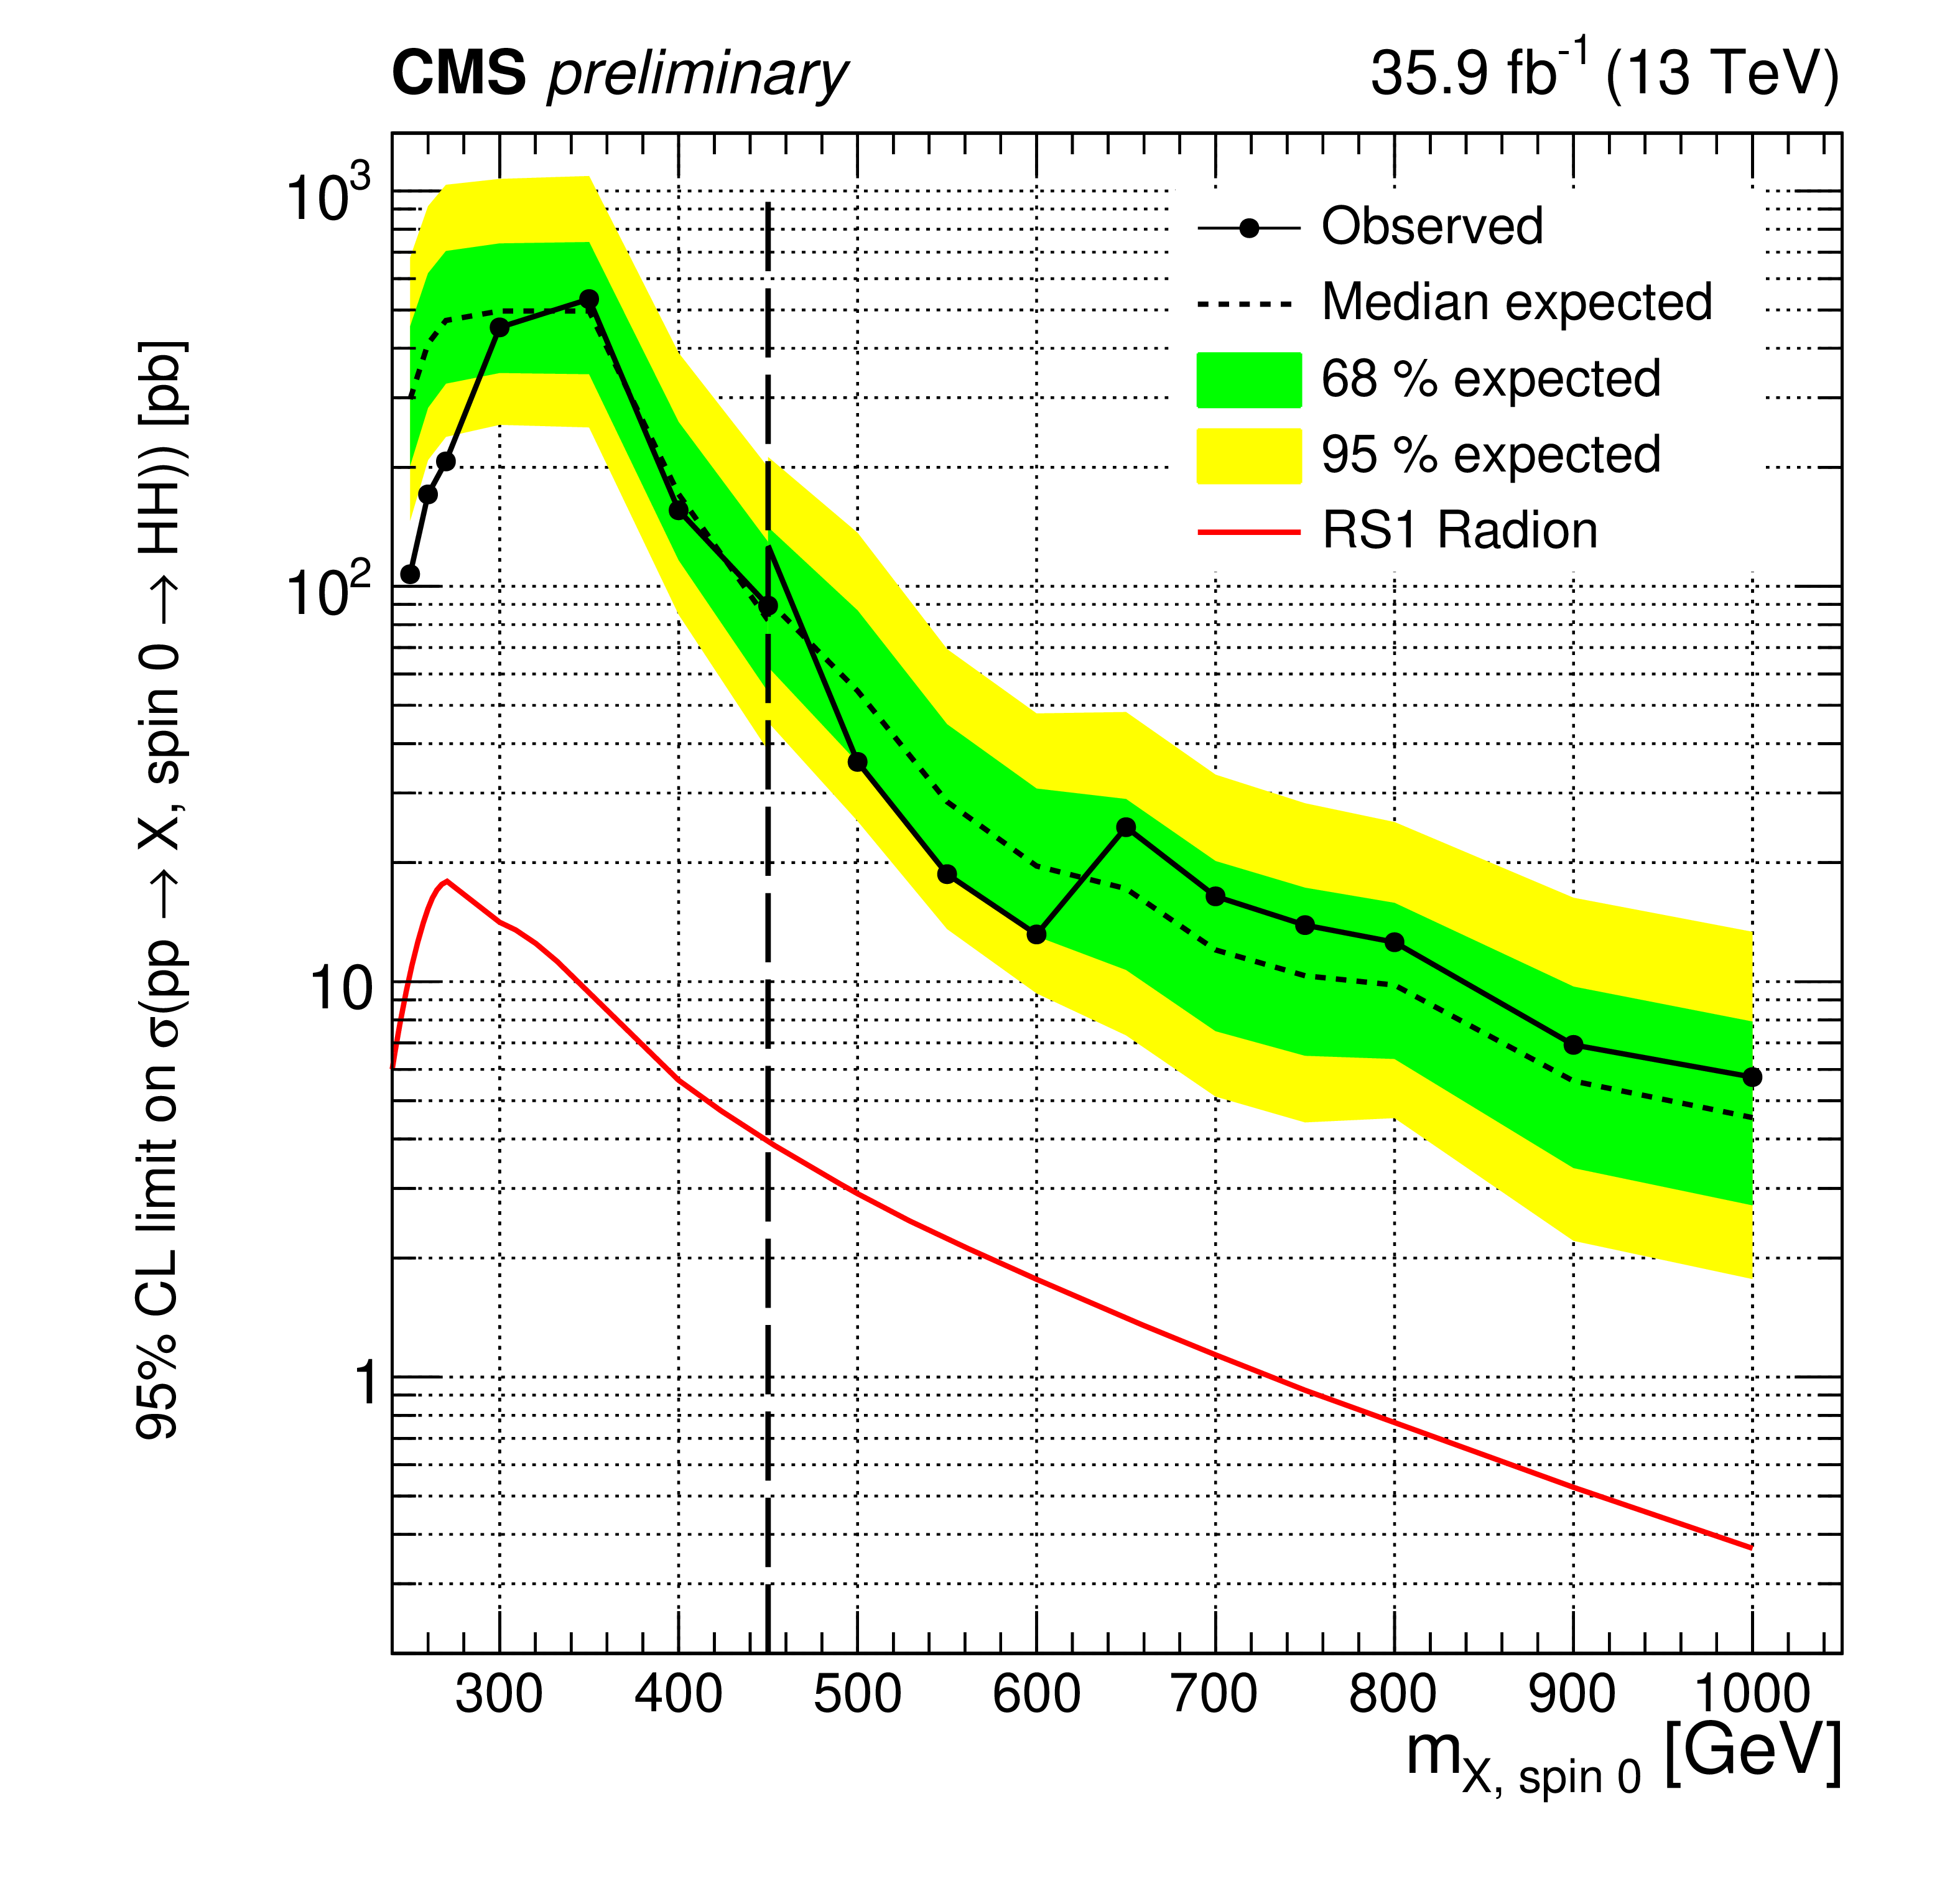
Figure 5-a:
Expected (black dashed line) and observed (black solid line) limits on the cross section of resonant HH production as a function of the mass of the resonance for the $\mathrm{b\bar{b}}\ell \ell \nu \nu $ channel. The RS1 radion case is shown. The red solid lines show the theoretical prediction for the cross section of an RS1 radion with $\lambda _R = $ 1 TeV and $kL=$ 35. The vertical black dashed line indicates the resonance mass of 450 GeV, a mass point where the BDT used in the analysis is switched from the one trained for low mass resonance to the one trained for high mass resonance. |
png pdf |
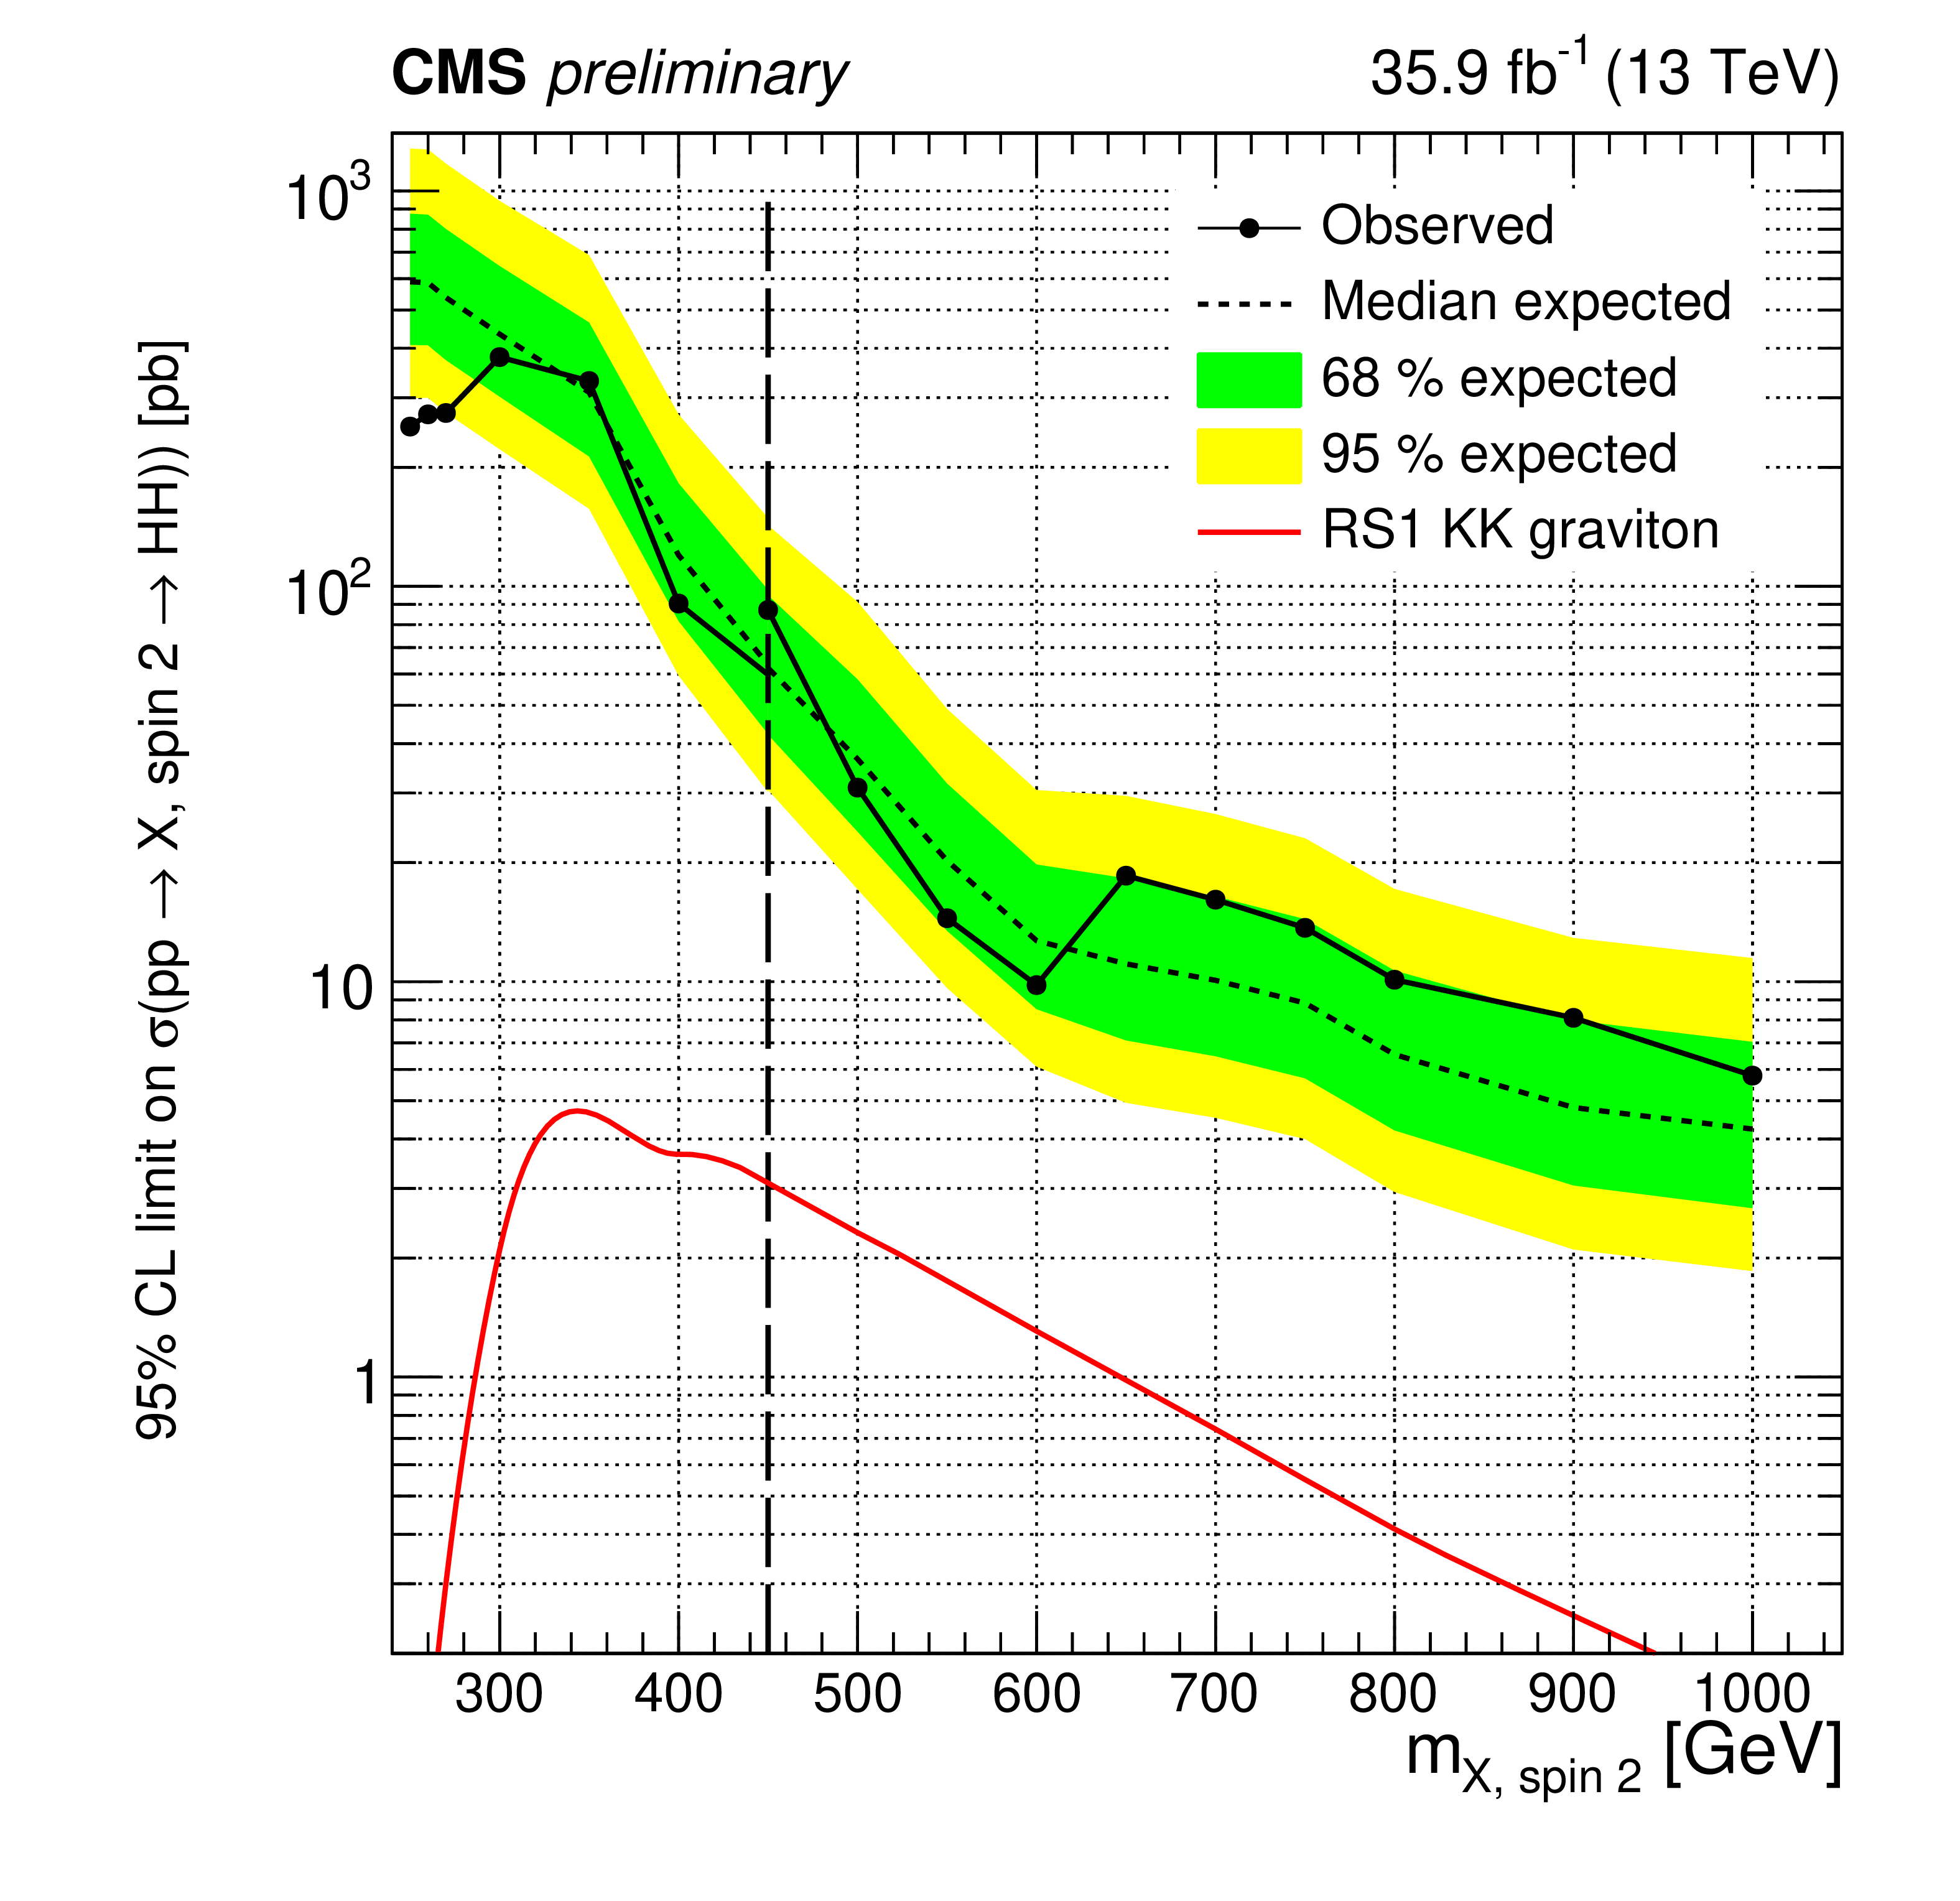
Figure 5-b:
Expected (black dashed line) and observed (black solid line) limits on the cross section of resonant HH production as a function of the mass of the resonance for the $\mathrm{b\bar{b}}\ell \ell \nu \nu $ channel. The RS1 KK graviton case is shown. The red solid lines show the theoretical prediction for the cross section of an RS1 KK graviton with $\tilde{k} = $ 0.1. The vertical black dashed line indicates the resonance mass of 450 GeV, a mass point where the BDT used in the analysis is switched from the one trained for low mass resonance to the one trained for high mass resonance. |
png pdf |
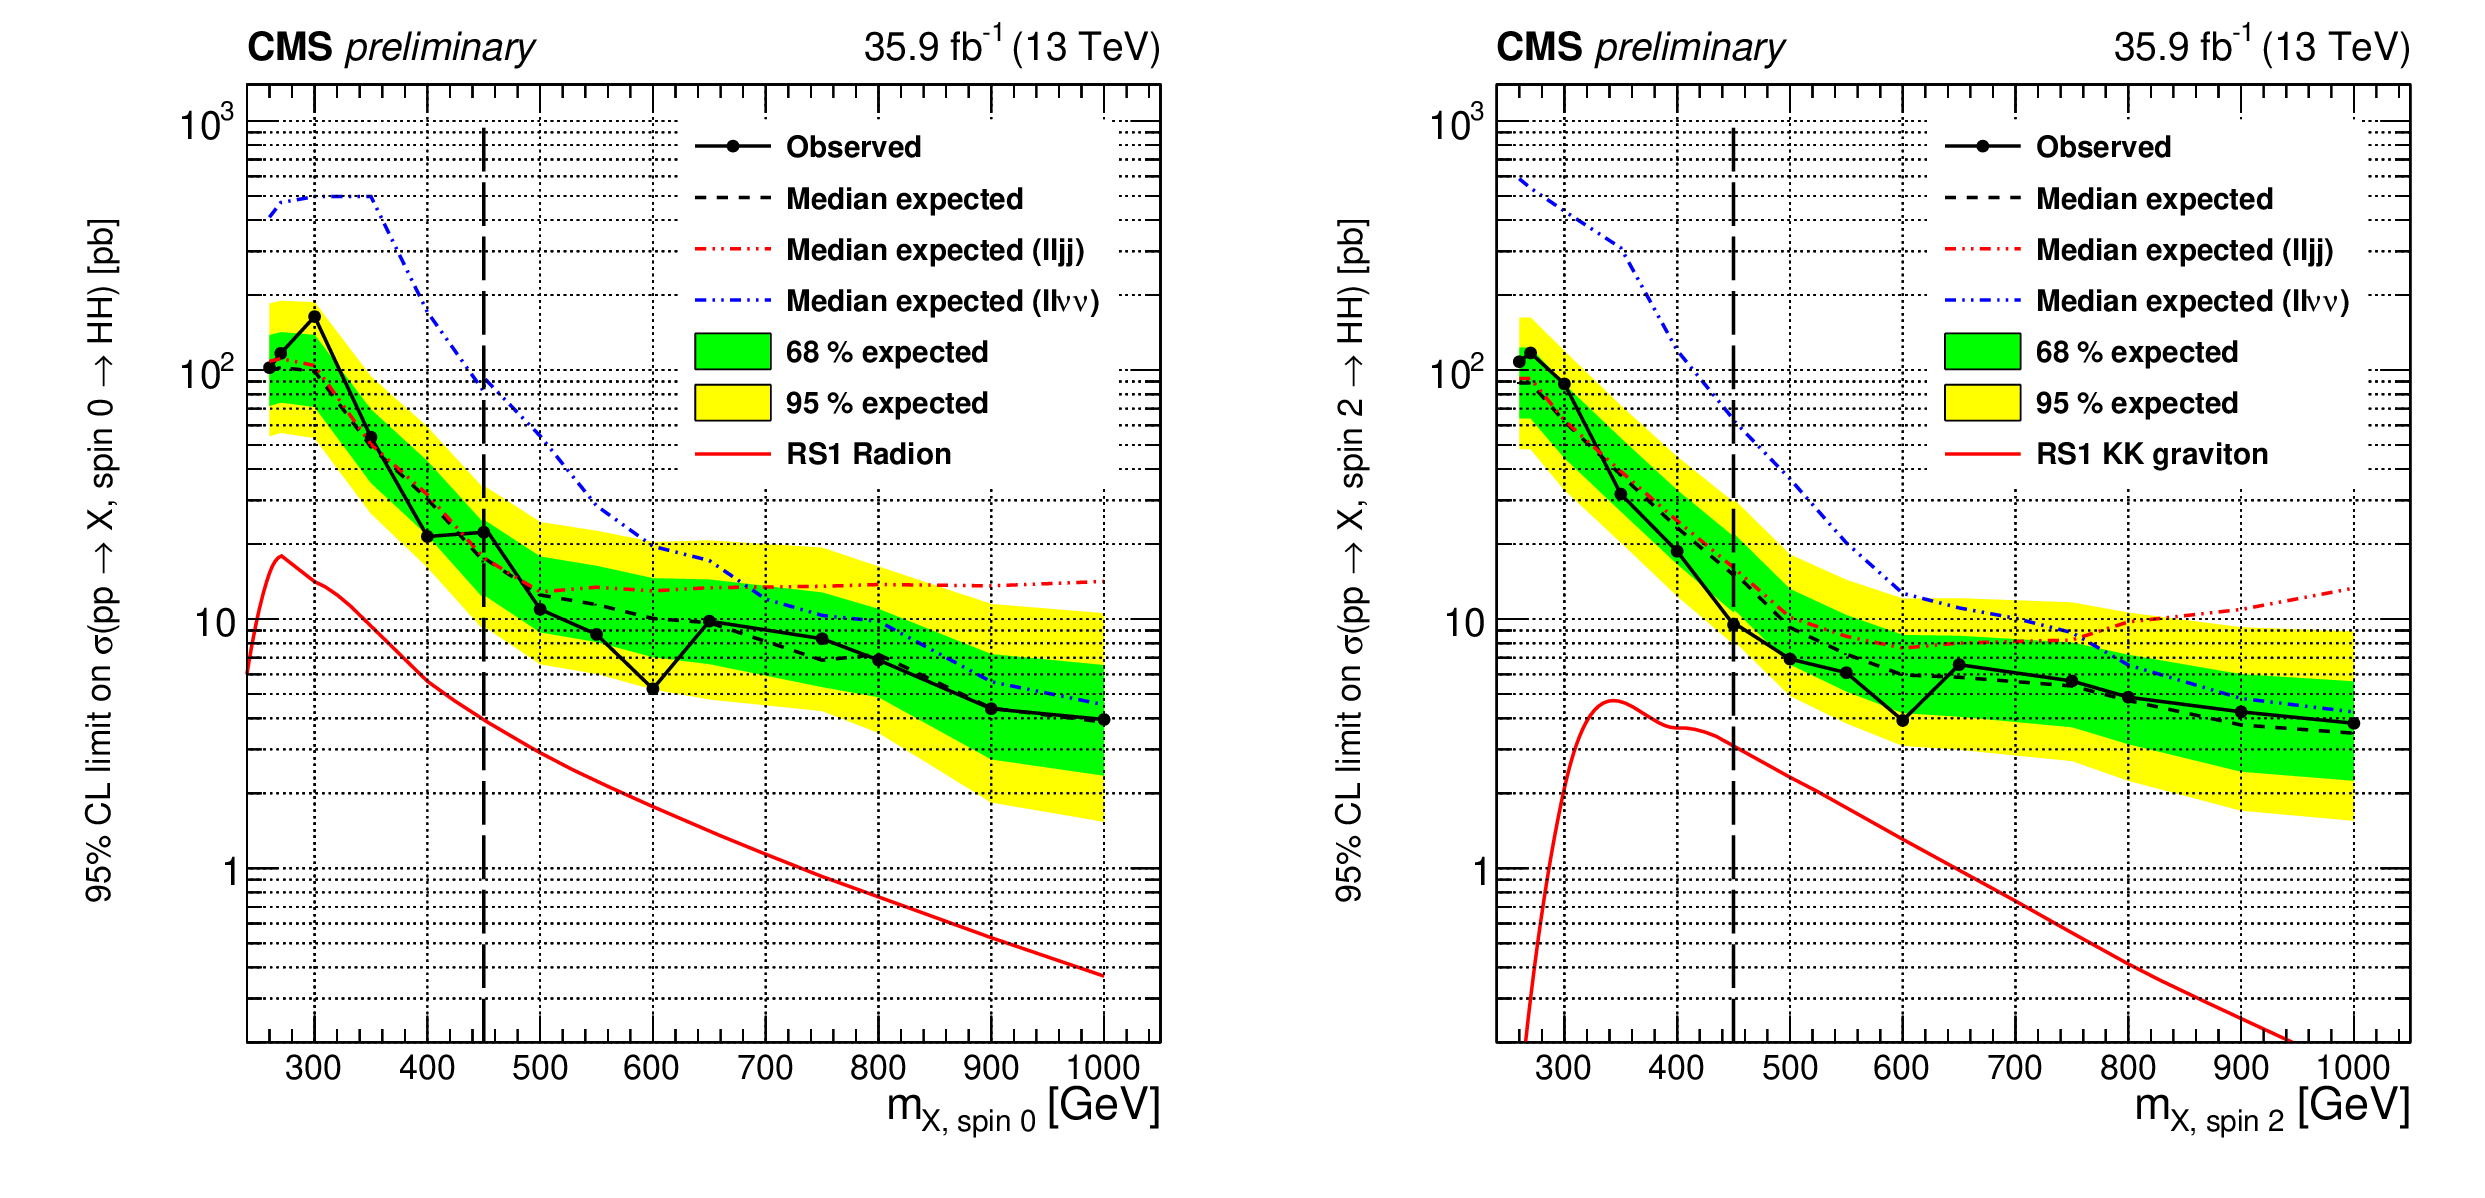
Figure 6:
Expected (black dashed line) and observed (black solid line) limits on the cross section of resonant HH production as a function of the mass of the resonance for the combination of the $\mathrm{b\bar{b}}\ell \ell {\mathrm{jj}}$ and $\mathrm{b\bar{b}}\ell \ell \nu \nu $ channels. The RS1 radion case is shown on the left and the RS1 KK graviton case is shown on the right. The red solid lines show the theoretical prediction for the cross section of an RS1 radion with $\lambda _R = $ 1 TeV and $kL=$ 35 (left) and an RS1 KK graviton with $\tilde{k} = $ 0.1 (right). The expected limits for each individual channel are also shown with red dashed line for the $\mathrm{b\bar{b}}\ell \ell {\mathrm{jj}}$ channel and blue dashed line for the $\mathrm{b\bar{b}}\ell \ell \nu \nu $ channel. |
png pdf |
Figure 6-a:
Expected (black dashed line) and observed (black solid line) limits on the cross section of resonant HH production as a function of the mass of the resonance for the combination of the $\mathrm{b\bar{b}}\ell \ell {\mathrm{jj}}$ and $\mathrm{b\bar{b}}\ell \ell \nu \nu $ channels. The RS1 radion case is shown. The red solid lines show the theoretical prediction for the cross section of an RS1 radion with $\lambda _R = $ 1 TeV and $kL=$ 35. The expected limits for each individual channel are also shown with red dashed line for the $\mathrm{b\bar{b}}\ell \ell {\mathrm{jj}}$ channel and blue dashed line for the $\mathrm{b\bar{b}}\ell \ell \nu \nu $ channel. |
png pdf |
Figure 6-b:
Expected (black dashed line) and observed (black solid line) limits on the cross section of resonant HH production as a function of the mass of the resonance for the combination of the $\mathrm{b\bar{b}}\ell \ell {\mathrm{jj}}$ and $\mathrm{b\bar{b}}\ell \ell \nu \nu $ channels. The RS1 KK graviton case is shown. The red solid lines show the theoretical prediction for the cross section of an RS1 KK graviton with $\tilde{k} = $ 0.1. The expected limits for each individual channel are also shown with red dashed line for the $\mathrm{b\bar{b}}\ell \ell {\mathrm{jj}}$ channel and blue dashed line for the $\mathrm{b\bar{b}}\ell \ell \nu \nu $ channel. |
| Summary |
| In summary, a search for the resonant production of two Higgs bosons decaying to two bottom quarks and two Z bosons was performed, where one of the Z bosons decays to two leptons and the other decays to two quarks of any flavor or to two neutrinos. The search used 13 TeV proton-proton collision data recorded by the CMS detector and corresponding to an integrated luminosity of 35.9 fb$^{-1}$. The results are in agreement with SM predictions and 95% CL upper limits are set on the resonant, narrow width, spin-0 radion and spin-2 Kaluza-Klein graviton production cross sections in the range of resonance masses between 260 GeV and 1000 GeV. These are the first limits to date for Higgs boson resonant pair production in the final state where the other Z boson decays hadronically into two or more jets. |
| References | ||||
| 1 | ATLAS Collaboration | Observation of a new particle in the search for the Standard Model Higgs boson with the ATLAS detector at the LHC | PLB716 (2012) 1--29 | 1207.7214 |
| 2 | CMS Collaboration | Observation of a new boson at a mass of 125 GeV with the CMS experiment at the LHC | PLB716 (2012) 30--61 | CMS-HIG-12-028 1207.7235 |
| 3 | Y. Tang | Implications of LHC Searches for Massive Graviton | JHEP 08 (2012) 078 | 1206.6949 |
| 4 | K. Cheung | Phenomenology of the radion in the randall-sundrum scenario | PRD 63 (Feb, 2001) 056007 | |
| 5 | N. Kumar and S. P. Martin | Lhc search for di-higgs decays of stoponium and other scalars in events with two photons and two bottom jets | PRD 90 (Sep, 2014) 055007 | |
| 6 | CMS Collaboration | Search for resonant double Higgs production with $ \mathrm{b\bar{b}}\mathrm{Z}\mathrm{Z} $ decays in the $ \mathrm{b\bar{b}}\ell\ell\nu\nu $ final state | CMS-PAS-HIG-17-032 | CMS-PAS-HIG-17-032 |
| 7 | L. Randall and R. Sundrum | A Large mass hierarchy from a small extra dimension | PRL 83 (1999) 3370--3373 | hep-ph/9905221 |
| 8 | O. DeWolfe and M. B. Wise | Modulus stabilization with bulk fields | PRL 83 (1999) 4922--4925 | |
| 9 | W. D. Goldberg, D. Freedman, S. Gubser, and A. Karch | Modeling the fifth dimension with scalars and gravity | PRD 62 (2000) 046008 | |
| 10 | C. Csaki, M. Graesser, L. Randall, and J. Terning | Cosmology of brane models with radion stabilization | PRD 62 (1999) 045015 | |
| 11 | C. Csaki, J. Hubisz, and S. J. Lee | Radion phenomenology in realistic warped space models | PRD 76 (2007) 125015 | |
| 12 | A. Oliveira | Gravity particles from Warped Extra Dimensions, predictions for LHC | 1404.0102 | |
| 13 | CMS Collaboration | The CMS experiment at the CERN LHC | JINST 3 (2008) S08004 | CMS-00-001 |
| 14 | J. Alwall et al. | The automated computation of tree-level and next-to-leading order differential cross sections, and their matching to parton shower simulations | JHEP 07 (2014) 079 | 1405.0301 |
| 15 | R. Frederix and S. Frixione | Merging meets matching in MC@NLO | JHEP 12 (2012) 061 | 1209.6215 |
| 16 | J. Alwall et al. | Comparative study of various algorithms for the merging of parton showers and matrix elements in hadronic collisions | EPJC 53 (2008) 473 | 0706.2569 |
| 17 | S. Kallweit et al. | NLO QCD+EW predictions for V + jets including off-shell vector-boson decays and multijet merging | JHEP 04 (2016) 021 | 1511.08692 |
| 18 | P. Nason | A new method for combining NLO QCD with shower Monte Carlo algorithms | JHEP 11 (2004) 040 | hep-ph/0409146 |
| 19 | S. Frixione, P. Nason, and C. Oleari | Matching NLO QCD computations with Parton Shower simulations: the POWHEG method | JHEP 11 (2007) 070 | 0709.2092 |
| 20 | S. Alioli, P. Nason, C. Oleari, and E. Re | A general framework for implementing NLO calculations in shower Monte Carlo programs: the POWHEG BOX | JHEP 06 (2010) 043 | 1002.2581 |
| 21 | J. M. Campbell and R. K. Ellis | MCFM for the Tevatron and the LHC | NPPS 205 (2010) 10--15 | 1007.3492 |
| 22 | R. Gavin, Y. Li, F. Petriello, and S. Quackenbush | W physics at the LHC with FEWZ 2.1 | CPC 184 (2013) 208 | 1201.5896 |
| 23 | T. Sjostrand, S. Mrenna, and P. Z. Skands | A Brief Introduction to PYTHIA 8.1 | CPC 178 (2008) 852--867 | 0710.3820 |
| 24 | CMS Collaboration | Event generator tunes obtained from underlying event and multiparton scattering measurements | EPJC 76 (2016) 155 | CMS-GEN-14-001 1512.00815 |
| 25 | NNPDF Collaboration | Parton distributions for the LHC Run II | JHEP 04 (2015) 040 | 1410.8849 |
| 26 | GEANT4 Collaboration | GEANT4---a simulation toolkit | NIMA 506 (2003) 250 | |
| 27 | CMS Collaboration | Particle-flow reconstruction and global event description with the CMS detector | JINST 12 (2017) 10003 | CMS-PRF-14-001 1706.04965 |
| 28 | CMS Collaboration | Muon Reconstruction and Identification Improvements for Run-2 and First Results with 2015 Run Data | CDS | |
| 29 | CMS Collaboration | Performance of CMS muon reconstruction in pp collision events at $ \sqrt{s} = $ 7 TeV | JINST 7 (2012) P10002 | CMS-MUO-10-004 1206.4071 |
| 30 | CMS Collaboration | Performance of electron reconstruction and selection with the CMS detector in proton-proton collisions at $ \sqrt{s} = $ 8 TeV | JINST 10 (2015) 06 P06005 | |
| 31 | M. Cacciari and G. P. Salam | Pileup subtraction using jet areas | PLB 659 (2008) 119 | 0707.1378 |
| 32 | CMS Collaboration | Commissioning of the particle flow reconstruction in minimum-bias and jet events from pp collisions at 7 TeV | CDS | |
| 33 | M. Cacciari, G. P. Salam, and G. Soyez | The anti-$ k_t $ jet clustering algorithm | JHEP 04 (2008) 063 | 0802.1189 |
| 34 | M. Cacciari, G. P. Salam, and G. Soyez | FastJet user manual | EPJC 72 (2012) 1896 | 1111.6097 |
| 35 | CMS Collaboration | Jet algorithms performance in 13 TeV data | CMS-PAS-JME-16-003 | CMS-PAS-JME-16-003 |
| 36 | CMS Collaboration | Jet energy scale and resolution in the CMS experiment in pp collisions at 8 TeV | JINST 12 (2017) P02014 | CMS-JME-13-004 1607.03663 |
| 37 | CMS Collaboration | Identification of b quark jets at the CMS Experiment in the LHC Run 2 | CMS-PAS-BTV-15-001 | CMS-PAS-BTV-15-001 |
| 38 | CMS Collaboration | Identification of heavy-flavour jets with the CMS detector in pp collisions at 13 TeV | JINST 13 (2018), no. 05, P05011 | CMS-BTV-16-002 1712.07158 |
| 39 | CMS Collaboration | Search for resonant and nonresonant Higgs boson pair production in the $ bb\ell\nu\ell\nu $ final state in proton-proton collisions at sqrt(s) = 13 TeV | JHEP (01, 2018) 054 | CMS-HIG-15-002 1606.02266 |
| 40 | CMS | Search for new physics in l+met channel with 2016 data | CMS Note 2016/204 | |
| 41 | J. Butterworth et al. | PDF4LHC recommendations for LHC Run II | JPG43 (2016) 023001 | 1510.03865 |
| 42 | CMS Collaboration | Current recommendations for luminosity estimations | link | |
| 43 | T. Junk | Confidence Level Computation for Combining Searches with Small Statistics | NIMA 434 (1999) 435 | hep-ex/9902006 |
| 44 | A. L. Read | Modified frequentist analysis of search results (the $ cl_{s} $ method) | CERN-OPEN 2000-205, 1st Workshop on Confidence Limits, CERN 2000 | |
| 45 | R. Barlow and C. Beeston | Fitting using finite Monte Carlo samples | CPC 77 (1993) 219 | |
| 46 | J. S. Conway | Incorporating nuisance parameters in likelihoods for multisource spectra | in Proceedings, PHYSTAT 2011 workshop on statistical issues related to discovery claims in search experiments and unfolding, CERN 2011 | 1103.0354 |
|
|
Compact Muon Solenoid LHC, CERN |
|

|

|

|

|

|