

Compact Muon Solenoid
LHC, CERN
| CMS-PAS-GEN-22-001 | ||
| Energy scaling behavior of intrinsic transverse momentum in Drell-Yan events | ||
| CMS Collaboration | ||
| 11 April 2024 | ||
| Abstract: We present an analysis of intrinsic transverse momentum by studying the dilepton transverse momentum in Drell-Yan events. Utilizing widely adopted event generators and data from fixed-target experiments, the Tevatron, and the LHC, our investigation spans three orders of magnitude in center-of-mass energy and two orders of magnitude in dilepton invariant mass. The results show an energy-scaling behaviour of the intrinsic transverse momentum. The value is independent of the dilepton invariant mass. | ||
|
Links:
CDS record (PDF) ;
CADI line (restricted) ;
These preliminary results are superseded in this paper, Submitted to PRL. The superseded preliminary plots can be found here. |
||
| Figures & Tables | Summary | Additional Figures & Tables | References | CMS Publications |
|---|
| Figures | |
png pdf |
Figure 1:
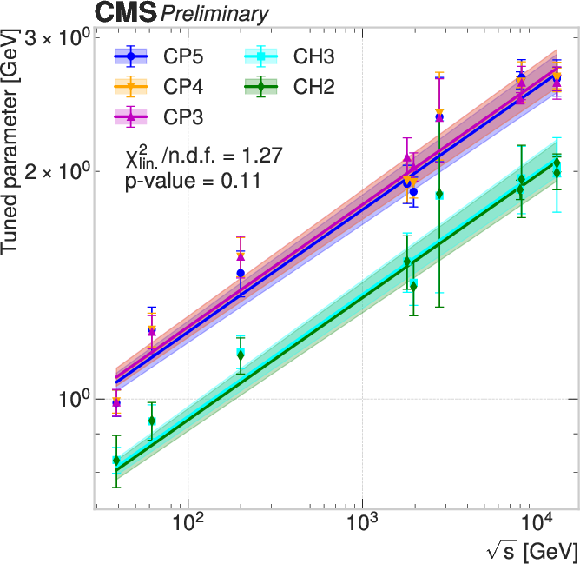
Tuned parameter values for DY measurements at different center-of-mass energies (points) for different generator setups (colors). For each generator setup, the function $ b \sqrt{s}^a $ is fitted to the points and shown as a line. The uncertainty in each fit is shown as a colored band and corresponds to the up and down variations of the fit parameters, propagated from the tune uncertainties. |
png pdf |
Figure 2:
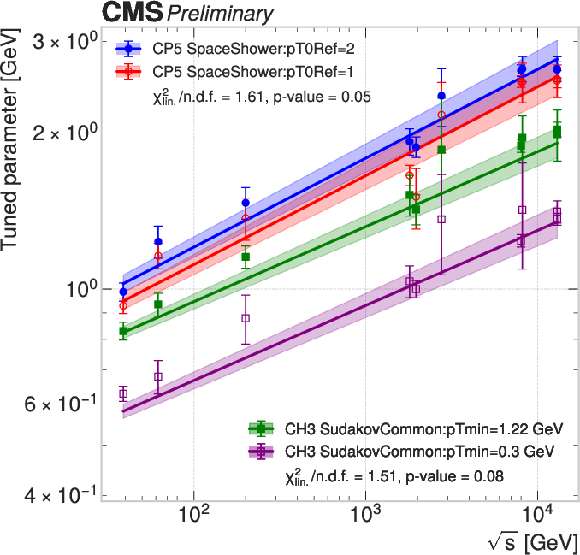
Tuned parameter values for DY measurements at different center-of-mass energies (points) for different generator settings (colors). For the PYTHIA CP5 setup, the parameter SpaceShower:pT0Ref is set to 1 GeV (red) or its default value of 2 GeV (blue). For the HERWIG CH3 setup, the parameter SudakovCommon:pTmin is set to 0.3 GeV (purple) or its default value of 1.2 GeV (green). For each generator setting, the function $ b \sqrt{s}^a $ is fitted to the points and shown as a line. The uncertainty in each fit is shown as a colored band and corresponds to the up and down variations of the fit parameters, propagated from the tune uncertainties. |
png pdf |
Figure 3:
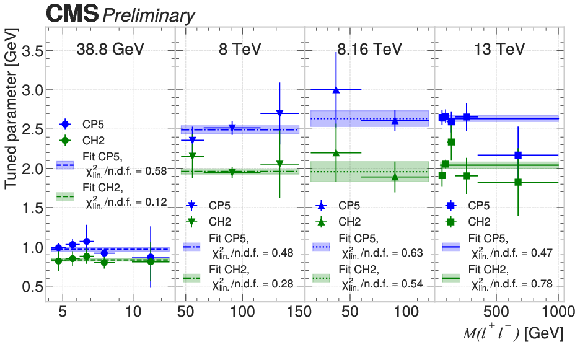
Tuned parameter values (points) for DY measurements at four different center-of-mass energies (panels) for the PYTHIA CP5 (blue) and HERWIG CH3 (green) setups. For each generator setup, a constant is fitted to the points and shown as a line. The uncertainty in each fit, propagated from the tune uncertainties, is shown as a colored band. |
| Tables | |

png pdf |
Table 1:
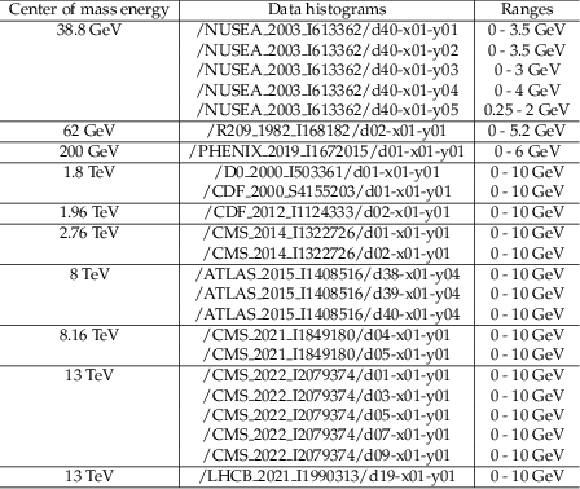
Measurements of the Drell-Yan cross section differential in $ p_{\mathrm{T}}(\ell^+\ell^-) $ at various center-of-mass energies from different hadron-collision processes used as inputs for the intrinsic $ k_{\mathrm{T}} $ tunes. The variable $ Q $ represents the hard-scattering scales of the measurements. |
| Summary |
| In summary, generator tunes of the intrinsic transverse momentum $ k_{\mathrm{T}} $ were used as metadata of existing measurements to explore model-independent features of non-perturbative quantum chromodynamics (QCD). The tunes were performed for various underlying-event setups in PYTHIA and HERWIG using the Drell-Yan cross section differential in the dilepton transverse momentum measured in multiple types of hadron-collision experiments with $ \sqrt{s} $ ranging from 38.8 GeV to 13 TeV. The results show a linear relation between the logarithm of the intrinsic $ k_{\mathrm{T}} $ and $ \log(\sqrt{s}) $ for all generator setups, the intercepts altered by generator-dependent perturbative QCD models such as choices of parton distribution functions or parton shower parameters. The slope was found to be 0.162 $ \pm $ 0.005, independently of the generator setups, and related to pure non-perturbative QCD effects such as non-resolvable low-energy gluon emissions in parton showers. The tunes were also performed to measurements in different dilepton invariant mass regions and demonstrated stable intrinsic $ k_{\mathrm{T}} $ under varying hard-scattering scales at a fixed $ \sqrt{s} $, which indicates the independence of the intrinsic $ k_{\mathrm{T}} $ of the momentum fractions of the quarks in colliding hadrons in Drell-Yan processes. |
| Additional Figures | |
png pdf |
Additional Figure 1:
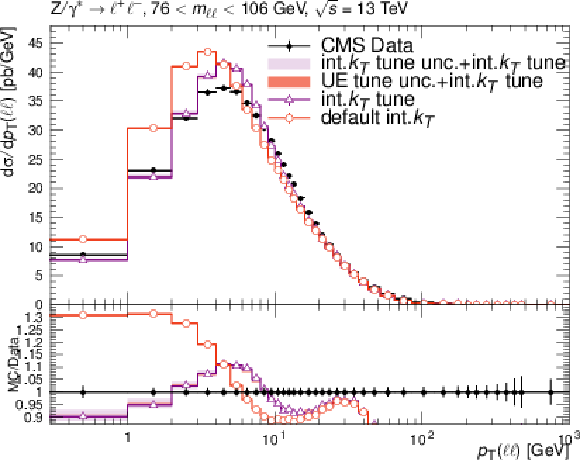
Effects of the variation of the PYTHIA CP5 UE parameters on the DY $ p_{\mathrm{T}} $ spectrum. The red and violet error bands represent the predictions from the up and down variations of the UE tune and the intrinsic $ k_{\mathrm{T}} $ tune, respectively, for the "int.$ k_{\mathrm{T}} $" tune prediction. |
png pdf |
Additional Figure 2:
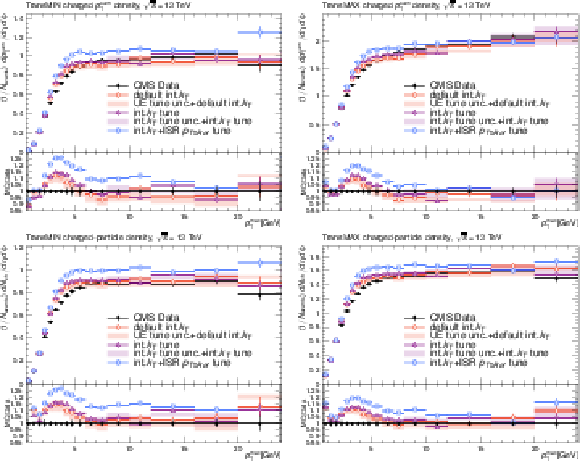
Effects of the variation of the intrinsic $ k_{\mathrm{T}} $ parameter on the observables of minimum bias (MB) events used for underlying-event tuning: charge particle $ p_{\mathrm{T}}^{sum} $ density in the transMIN region (upper left); charge particle $ p_{\mathrm{T}}^{sum} $ density in the transMAX region (upper right); charge particle density in the transMIN region (lower left); charge particle density in the transMAX region (lower right) as a function of the transverse momentum of the leading charged particle. The red and violet error bands represent the predictions from the up and down variations of the CP5 UE tune and the intrinsic $ k_{\mathrm{T}} $ tune, respectively. The red error band is based on the "CP5+default int.kT" prediction and the violet error band is based on the "CP5+int-kT tune" prediction. The error bars represent the statistical uncertainty of the MC events. The plot also includes the UE prediction of a combined tune of the int-kT and the ISR cutoff scale to the DY $ p_{\mathrm{T}} $ (int-kT+pT0Ref). |
png pdf |
Additional Figure 2-a:
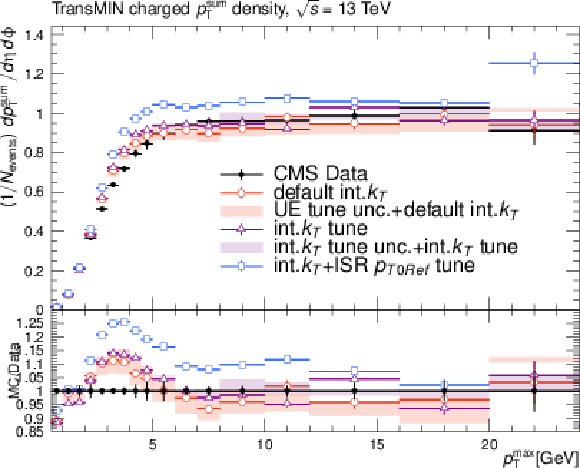
Effects of the variation of the intrinsic $ k_{\mathrm{T}} $ parameter on the observables of minimum bias (MB) events used for underlying-event tuning: charge particle $ p_{\mathrm{T}}^{sum} $ density in the transMIN region (upper left); charge particle $ p_{\mathrm{T}}^{sum} $ density in the transMAX region (upper right); charge particle density in the transMIN region (lower left); charge particle density in the transMAX region (lower right) as a function of the transverse momentum of the leading charged particle. The red and violet error bands represent the predictions from the up and down variations of the CP5 UE tune and the intrinsic $ k_{\mathrm{T}} $ tune, respectively. The red error band is based on the "CP5+default int.kT" prediction and the violet error band is based on the "CP5+int-kT tune" prediction. The error bars represent the statistical uncertainty of the MC events. The plot also includes the UE prediction of a combined tune of the int-kT and the ISR cutoff scale to the DY $ p_{\mathrm{T}} $ (int-kT+pT0Ref). |
png pdf |
Additional Figure 2-b:
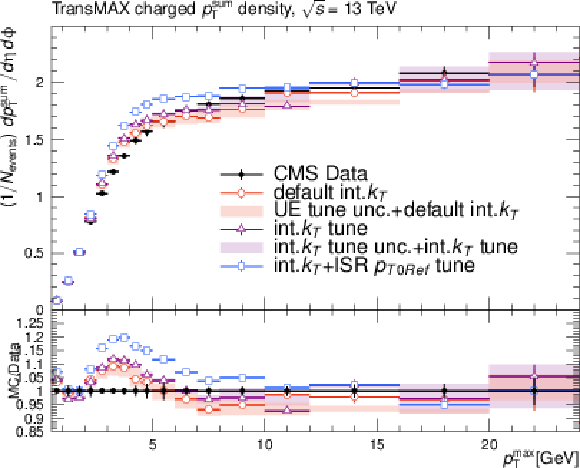
Effects of the variation of the intrinsic $ k_{\mathrm{T}} $ parameter on the observables of minimum bias (MB) events used for underlying-event tuning: charge particle $ p_{\mathrm{T}}^{sum} $ density in the transMIN region (upper left); charge particle $ p_{\mathrm{T}}^{sum} $ density in the transMAX region (upper right); charge particle density in the transMIN region (lower left); charge particle density in the transMAX region (lower right) as a function of the transverse momentum of the leading charged particle. The red and violet error bands represent the predictions from the up and down variations of the CP5 UE tune and the intrinsic $ k_{\mathrm{T}} $ tune, respectively. The red error band is based on the "CP5+default int.kT" prediction and the violet error band is based on the "CP5+int-kT tune" prediction. The error bars represent the statistical uncertainty of the MC events. The plot also includes the UE prediction of a combined tune of the int-kT and the ISR cutoff scale to the DY $ p_{\mathrm{T}} $ (int-kT+pT0Ref). |
png pdf |
Additional Figure 2-c:
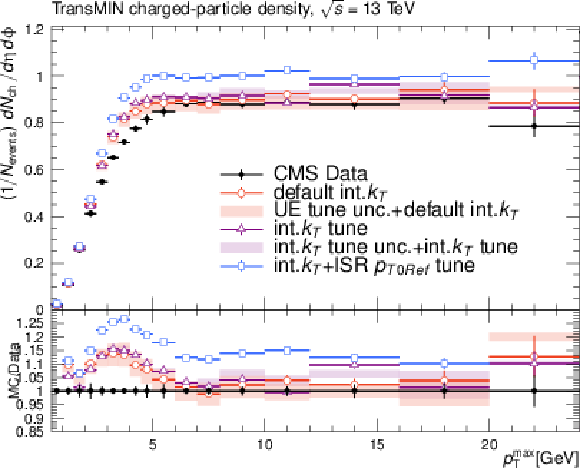
Effects of the variation of the intrinsic $ k_{\mathrm{T}} $ parameter on the observables of minimum bias (MB) events used for underlying-event tuning: charge particle $ p_{\mathrm{T}}^{sum} $ density in the transMIN region (upper left); charge particle $ p_{\mathrm{T}}^{sum} $ density in the transMAX region (upper right); charge particle density in the transMIN region (lower left); charge particle density in the transMAX region (lower right) as a function of the transverse momentum of the leading charged particle. The red and violet error bands represent the predictions from the up and down variations of the CP5 UE tune and the intrinsic $ k_{\mathrm{T}} $ tune, respectively. The red error band is based on the "CP5+default int.kT" prediction and the violet error band is based on the "CP5+int-kT tune" prediction. The error bars represent the statistical uncertainty of the MC events. The plot also includes the UE prediction of a combined tune of the int-kT and the ISR cutoff scale to the DY $ p_{\mathrm{T}} $ (int-kT+pT0Ref). |
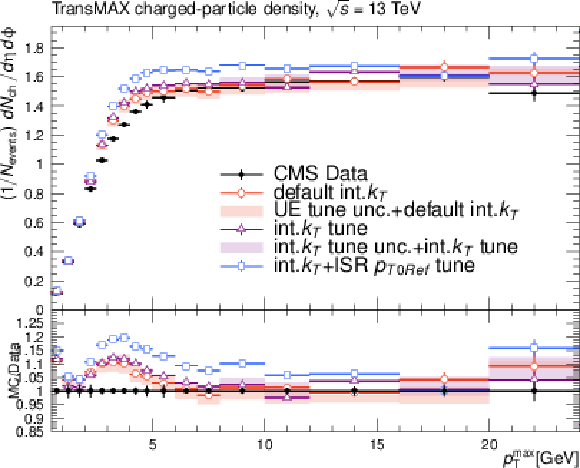
png pdf |
Additional Figure 2-d:
Effects of the variation of the intrinsic $ k_{\mathrm{T}} $ parameter on the observables of minimum bias (MB) events used for underlying-event tuning: charge particle $ p_{\mathrm{T}}^{sum} $ density in the transMIN region (upper left); charge particle $ p_{\mathrm{T}}^{sum} $ density in the transMAX region (upper right); charge particle density in the transMIN region (lower left); charge particle density in the transMAX region (lower right) as a function of the transverse momentum of the leading charged particle. The red and violet error bands represent the predictions from the up and down variations of the CP5 UE tune and the intrinsic $ k_{\mathrm{T}} $ tune, respectively. The red error band is based on the "CP5+default int.kT" prediction and the violet error band is based on the "CP5+int-kT tune" prediction. The error bars represent the statistical uncertainty of the MC events. The plot also includes the UE prediction of a combined tune of the int-kT and the ISR cutoff scale to the DY $ p_{\mathrm{T}} $ (int-kT+pT0Ref). |
png pdf |
Additional Figure 3:
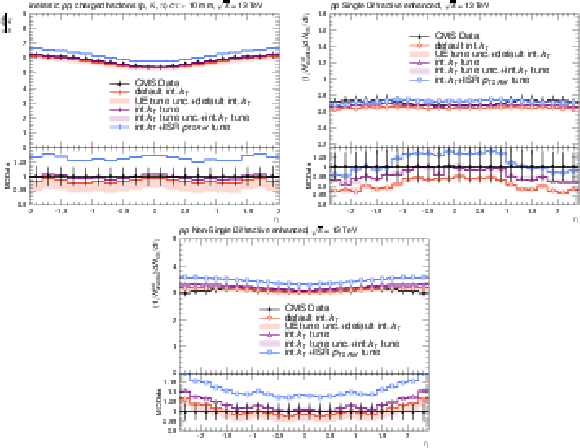
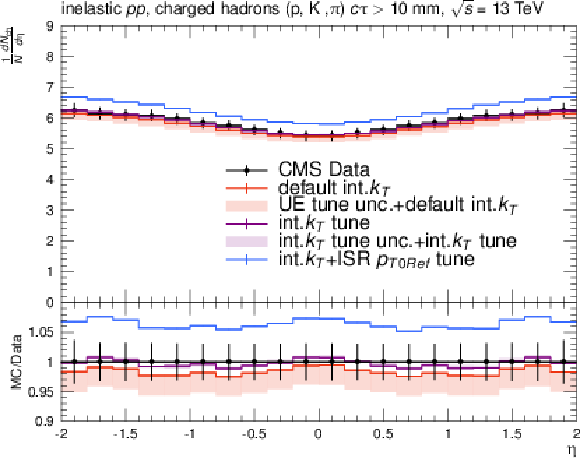
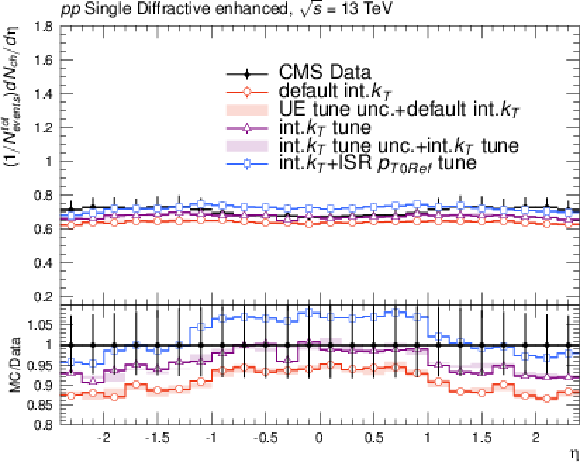
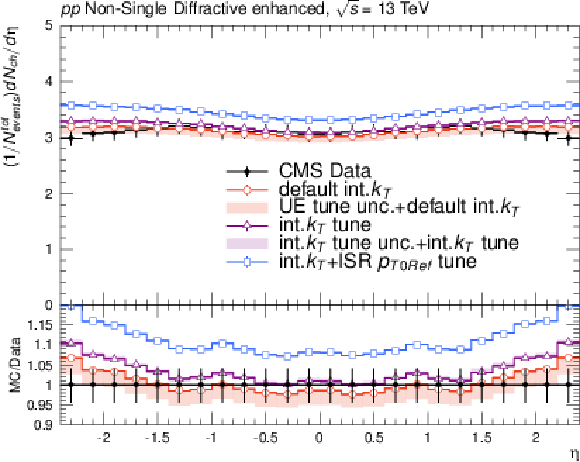
Effects of the variation of the intrinsic $ k_{\mathrm{T}} $ parameter on the observables of minimum bias (MB) events used for underlying-event tuning: charged hadron multiplicity (upper left); charged particle multiplicity in the single-diffractive-enchanced events of MB process (upper right); charged particle multiplicity in the non-single-diffractive-enchanced events MB process (lower center) as a function of rapidity. The red and violet error bands represent the predictions from the up and down variations of the CP5 UE tune and the intrinsic $ k_{\mathrm{T}} $ tune, respectively. The red error band is based on the "CP5+default int.kT" prediction and the violet error band is based on the "CP5+int-kT tune" prediction. The error bars represent the statistical uncertainty of the MC events. The plot also includes the UE prediction of a combined tune of the int-kT and the ISR cutoff scale to the DY $ p_{\mathrm{T}} $ (int-kT+pT0Ref). |
png pdf |
Additional Figure 3-a:
Effects of the variation of the intrinsic $ k_{\mathrm{T}} $ parameter on the observables of minimum bias (MB) events used for underlying-event tuning: charged hadron multiplicity (upper left); charged particle multiplicity in the single-diffractive-enchanced events of MB process (upper right); charged particle multiplicity in the non-single-diffractive-enchanced events MB process (lower center) as a function of rapidity. The red and violet error bands represent the predictions from the up and down variations of the CP5 UE tune and the intrinsic $ k_{\mathrm{T}} $ tune, respectively. The red error band is based on the "CP5+default int.kT" prediction and the violet error band is based on the "CP5+int-kT tune" prediction. The error bars represent the statistical uncertainty of the MC events. The plot also includes the UE prediction of a combined tune of the int-kT and the ISR cutoff scale to the DY $ p_{\mathrm{T}} $ (int-kT+pT0Ref). |
png pdf |
Additional Figure 3-b:
Effects of the variation of the intrinsic $ k_{\mathrm{T}} $ parameter on the observables of minimum bias (MB) events used for underlying-event tuning: charged hadron multiplicity (upper left); charged particle multiplicity in the single-diffractive-enchanced events of MB process (upper right); charged particle multiplicity in the non-single-diffractive-enchanced events MB process (lower center) as a function of rapidity. The red and violet error bands represent the predictions from the up and down variations of the CP5 UE tune and the intrinsic $ k_{\mathrm{T}} $ tune, respectively. The red error band is based on the "CP5+default int.kT" prediction and the violet error band is based on the "CP5+int-kT tune" prediction. The error bars represent the statistical uncertainty of the MC events. The plot also includes the UE prediction of a combined tune of the int-kT and the ISR cutoff scale to the DY $ p_{\mathrm{T}} $ (int-kT+pT0Ref). |
png pdf |
Additional Figure 3-c:
Effects of the variation of the intrinsic $ k_{\mathrm{T}} $ parameter on the observables of minimum bias (MB) events used for underlying-event tuning: charged hadron multiplicity (upper left); charged particle multiplicity in the single-diffractive-enchanced events of MB process (upper right); charged particle multiplicity in the non-single-diffractive-enchanced events MB process (lower center) as a function of rapidity. The red and violet error bands represent the predictions from the up and down variations of the CP5 UE tune and the intrinsic $ k_{\mathrm{T}} $ tune, respectively. The red error band is based on the "CP5+default int.kT" prediction and the violet error band is based on the "CP5+int-kT tune" prediction. The error bars represent the statistical uncertainty of the MC events. The plot also includes the UE prediction of a combined tune of the int-kT and the ISR cutoff scale to the DY $ p_{\mathrm{T}} $ (int-kT+pT0Ref). |
png pdf |
Additional Figure 4:
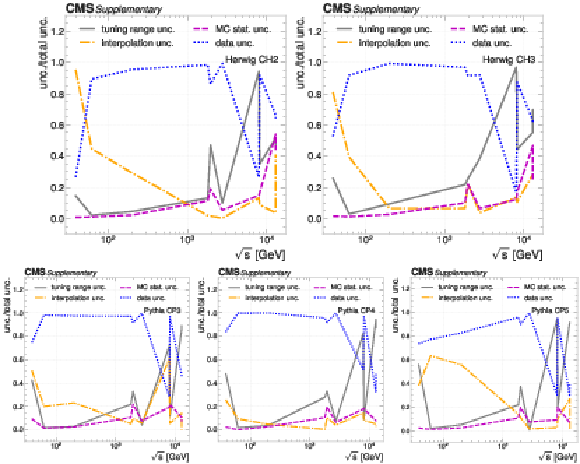
The ratio between the contributions from individual uncertainty sources to the total tuning uncertainties in the intrinsic $ k_{\mathrm{T}} $ tunings under the UE tunes: HERWIG CH2 (upper left); HERWIG CH3 (upper right); PYTHIA CP3 (lower left); PYTHIA CP4 (lower center); PYTHIA CP5 (lower right). |
png pdf |
Additional Figure 4-a:
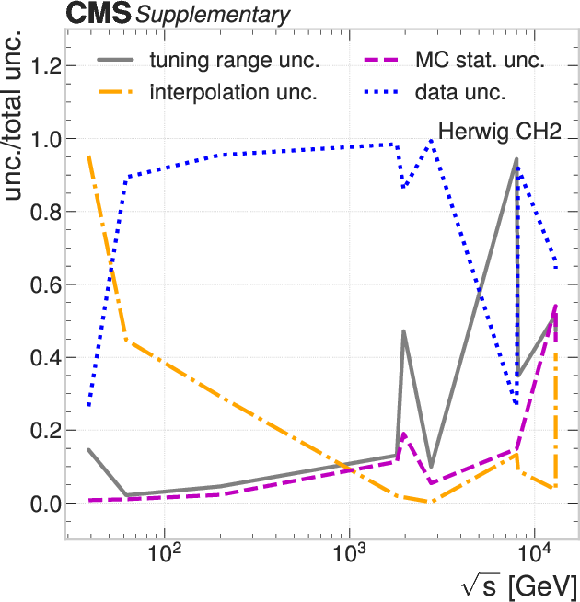
The ratio between the contributions from individual uncertainty sources to the total tuning uncertainties in the intrinsic $ k_{\mathrm{T}} $ tunings under the UE tunes: HERWIG CH2 (upper left); HERWIG CH3 (upper right); PYTHIA CP3 (lower left); PYTHIA CP4 (lower center); PYTHIA CP5 (lower right). |
png pdf |
Additional Figure 4-b:
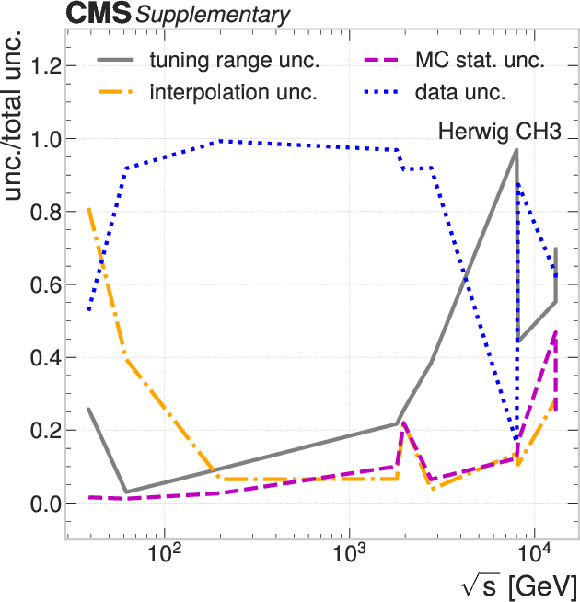
The ratio between the contributions from individual uncertainty sources to the total tuning uncertainties in the intrinsic $ k_{\mathrm{T}} $ tunings under the UE tunes: HERWIG CH2 (upper left); HERWIG CH3 (upper right); PYTHIA CP3 (lower left); PYTHIA CP4 (lower center); PYTHIA CP5 (lower right). |
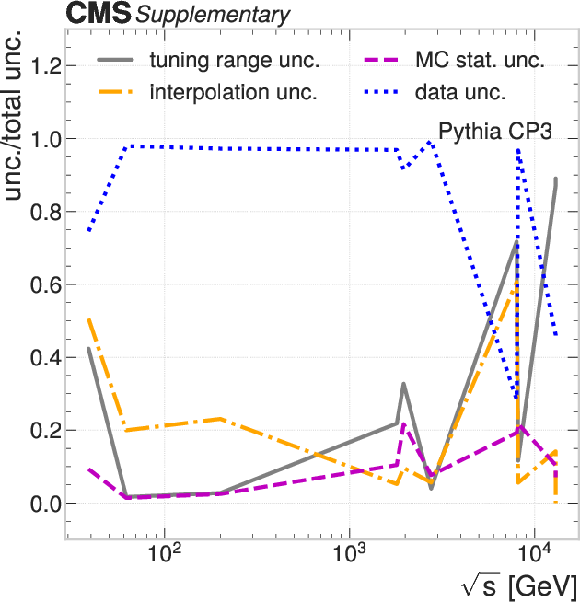
png pdf |
Additional Figure 4-c:
The ratio between the contributions from individual uncertainty sources to the total tuning uncertainties in the intrinsic $ k_{\mathrm{T}} $ tunings under the UE tunes: HERWIG CH2 (upper left); HERWIG CH3 (upper right); PYTHIA CP3 (lower left); PYTHIA CP4 (lower center); PYTHIA CP5 (lower right). |
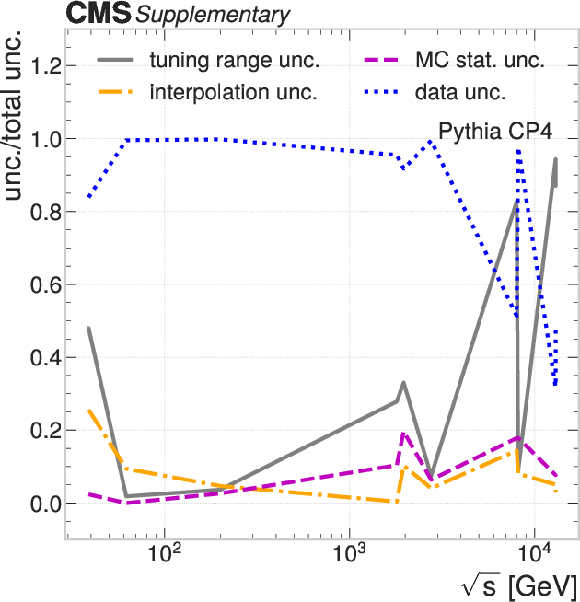
png pdf |
Additional Figure 4-d:
The ratio between the contributions from individual uncertainty sources to the total tuning uncertainties in the intrinsic $ k_{\mathrm{T}} $ tunings under the UE tunes: HERWIG CH2 (upper left); HERWIG CH3 (upper right); PYTHIA CP3 (lower left); PYTHIA CP4 (lower center); PYTHIA CP5 (lower right). |
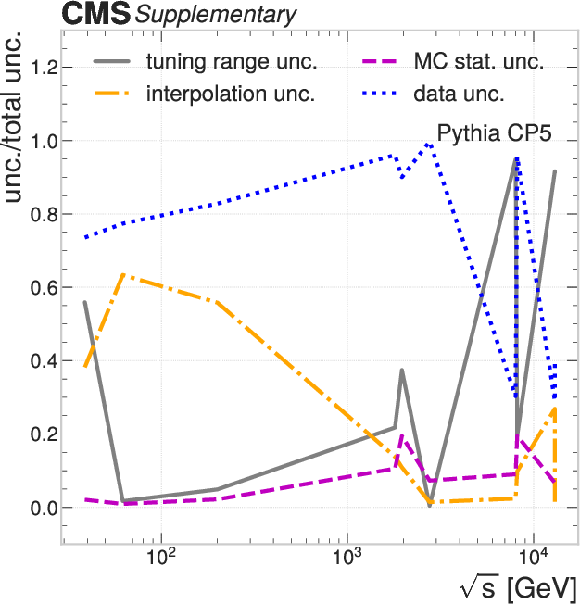
png pdf |
Additional Figure 4-e:
The ratio between the contributions from individual uncertainty sources to the total tuning uncertainties in the intrinsic $ k_{\mathrm{T}} $ tunings under the UE tunes: HERWIG CH2 (upper left); HERWIG CH3 (upper right); PYTHIA CP3 (lower left); PYTHIA CP4 (lower center); PYTHIA CP5 (lower right). |
png pdf |
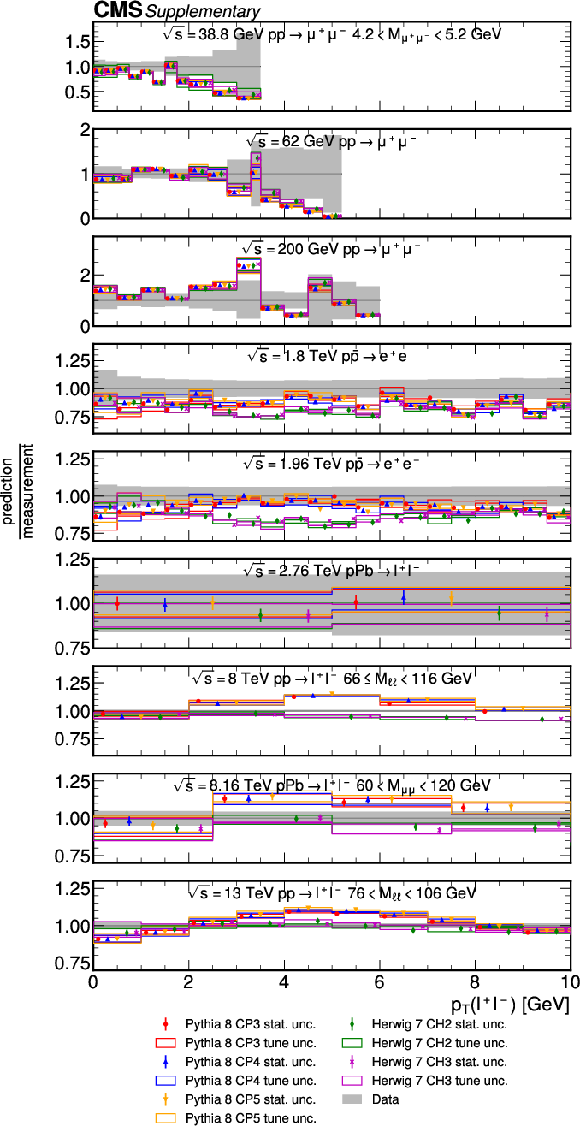
Additional Figure 5:
MC and data comparison for the intrinsic $ k_{\mathrm{T}} $ after tuning. The tune uncertainty comes from the choice of $ p_{\mathrm{T}} $ range and the interpolation function in the tune. The last panel corresponds to MC prediction compared to the CMS data measured at 13 TeV. |
png pdf |
Additional Figure 6:
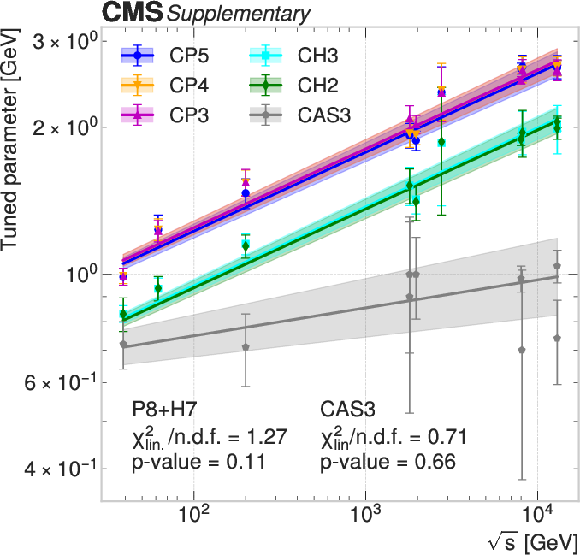
The tune results to the DY measurements at various center-of-mass energies and the fit for all the generator setups for PYTHIA and HERWIG, compared to the intrinsic $ k_{\mathrm{T}} $ tunes in CASCADE, in which more soft gluon emissions are included using the Parton Branching method in describing the transverse-momentum-dependent parton distributions, and weaker dependence of the intrinsic $ k_{\mathrm{T}} $ on the $ \sqrt{s} $ is observed. |
| Additional Tables | |
png pdf |
Additional Table 1:
The RIVET plugins corresponding to the data histograms used in the tune, as well as the ranges for calculating and minimizing the goodness of fit. |
png pdf |
Additional Table 2:
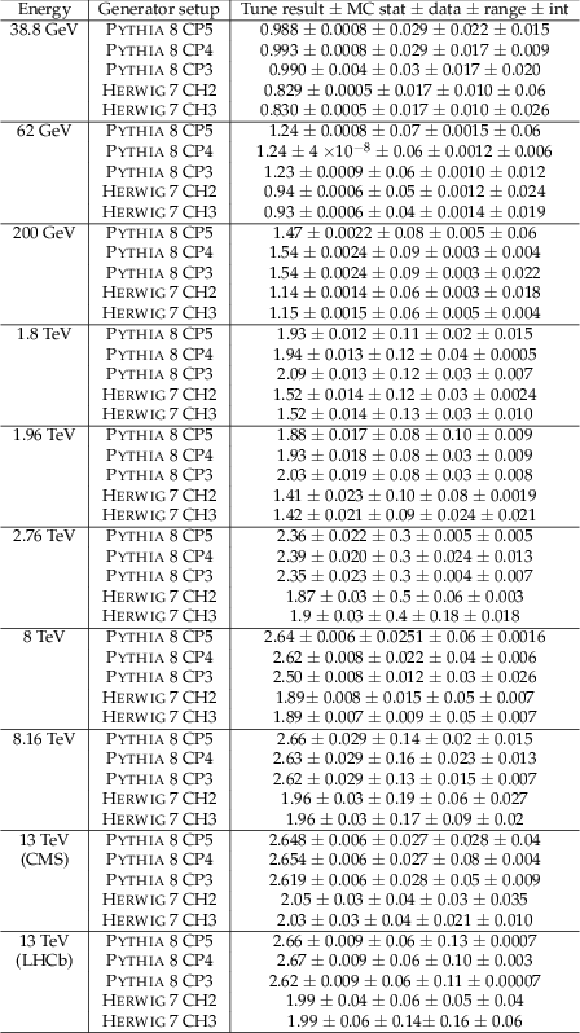
The tune results for the BeamRemnants:primordialkThard parameter in Pythia 8 and the ShowerHandler:IntrinsicPtGaussian parameter in Herwig 7, taking into account the uncertainty from tune ranges (range) and the functions for interpolation (int). |

png pdf |
Additional Table 3:
Tune results to the $ p_{\mathrm{T}}(\ell^+\ell^-) $ in various dilepton ranges for the 38.8 GeV, 8 TeV, 8.16 TeV and 13 TeV collisions. |
| References | ||||
| 1 | A. Bermudez Martinez et al. | The transverse momentum spectrum of low mass Drell-Yan production at next-to-leading order in the parton branching method | EPJC 80 (2020) 598 | 2001.06488 |
| 2 | I. Bubanja et al. | The small $ k_{\textrm{t}} $ region in Drell-Yan production at next-to-leading order with the parton branching method | EPJC 84 (2024) 154 | 2312.08655 |
| 3 | M. Mendizabal, F. Guzman, H. Jung, and S. Taheri Monfared | On the role of soft gluons in collinear parton densities | Unpublished, 2023 link |
2309.11802 |
| 4 | P. Hagler, B. U. Musch, J. W. Negele, and A. Schafer | Intrinsic quark transverse momentum in the nucleon from lattice QCD | EPL 88 (2009) 61001 | 0908.1283 |
| 5 | LHPC Collaboration | Transverse momentum distributions of quarks in the nucleon from lattice QCD | PoS LC2008 (2008) 053 | 0811.1536 |
| 6 | B. U. Musch, P. Hagler, J. W. Negele, and A. Schafer | Exploring quark transverse momentum distributions with lattice QCD | PRD 83 (2011) 094507 | 1011.1213 |
| 7 | C. Bierlich et al. | A comprehensive guide to the physics and usage of PYTHIA 8.3 | SciPost Phys. Codeb. 2022 (2022) 8 | 2203.11601 |
| 8 | T. Sjostrand and P. Z. Skands | Multiple interactions and the structure of beam remnants | JHEP 03 (2004) 053 | hep-ph/0402078 |
| 9 | J. Bellm et al. | Herwig 7.0/Herwig++ 3.0 release note | EPJC 76 (2016) 196 | 1512.01178 |
| 10 | Sherpa Collaboration | Event generation with Sherpa 2.2 | SciPost Phys. 7 (2019) 034 | 1905.09127 |
| 11 | NuSea Collaboration | Absolute Drell-Yan dimuon cross-sections in 800 GeV/$ c $ pp and pd collisions | Unpublished, 2003 link |
hep-ex/0302019 |
| 12 | J. C. Webb | Measurement of continuum dimuon production in 800-GeV/$c$ proton nucleon collisions | PhD thesis, New Mexico State U, 2003 link |
hep-ex/0301031 |
| 13 | D. Antreasyan et al. | Dimuon scaling comparison at 44-GeV and 62-GeV | PRL 48 (1982) 302 | |
| 14 | PHENIX Collaboration | Measurements of $ \mu\mu $ pairs from open heavy flavor and Drell-Yan in $ \text{p}+\text{p} $ collisions at $ \sqrt{s}= $ 200 GeV | PRD 99 (2019) 072003 | 1805.02448 |
| 15 | D0 Collaboration | Measurement of the inclusive differential cross section for Z bosons as a function of transverse momentum in $ \overline{\text{p}}\text{p} $ collisions at $ \sqrt{s}= $ 1.8 TeV | PRD 61 (2000) 032004 | hep-ex/9907009 |
| 16 | CDF Collaboration | The transverse momentum and total cross section of $ \text{e}^+\text{e}^- $ pairs in the Z boson region from $ \text{p}\overline{\text{p}} $ collisions at $ \sqrt{s}= $ 1.8 TeV | PRL 84 (2000) 845 | hep-ex/0001021 |
| 17 | D0 Collaboration | Measurement of the normalized Z/$ \gamma^* \rightarrow \mu^+\mu^- $ transverse momentum distribution in $ \text{p}\overline{\text{p}} $ collisions at $ \sqrt{s}= $ 1.96 TeV | PLB 693 (2010) 522 | 1006.0618 |
| 18 | CDF Collaboration | Transverse momentum cross section of $ \text{e}^+\text{e}^- $ pairs in the Z-boson region from $ \text{p}\overline{\text{p}} $ collisions at $ \sqrt{s}= $ 1.96 TeV | PRD 86 (2012) 052010 | 1207.7138 |
| 19 | CMS Collaboration | Study of Z production in PbPb and pp collisions at $ \sqrt{s_{\mathrm{NN}}}= $ 2.76 TeV in the dimuon and dielectron decay channels | JHEP 03 (2015) 022 | CMS-HIN-13-004 1410.4825 |
| 20 | ATLAS Collaboration | Measurement of the transverse momentum and $ \phi^*_{\eta} $ distributions of Drell-Yan lepton pairs in proton--proton collisions at $ \sqrt{s}= $ 8 TeV with the ATLAS detector | EPJC 76 (2016) 291 | 1512.02192 |
| 21 | CMS Collaboration | Study of Drell-Yan dimuon production in proton-lead collisions at $ \sqrt {\smash [b]{s_{_{\mathrm {NN}}}}} = $ 8.16 TeV | JHEP 05 (2021) 182 | CMS-HIN-18-003 2102.13648 |
| 22 | CMS Collaboration | Measurement of the mass dependence of the transverse momentum of lepton pairs in Drell-Yan production in proton-proton collisions at $ \sqrt{s}= $ 13 TeV | EPJC 83 (2023) 628 | CMS-SMP-20-003 2205.04897 |
| 23 | LHCb Collaboration | Precision measurement of forward Z boson production in proton-proton collisions at $ \sqrt{s}= $ 13 TeV | JHEP 07 (2022) 026 | 2112.07458 |
| 24 | C. T. H. Davies, B. R. Webber, and W. J. Stirling | Drell-Yan cross-sections at small transverse momentum | NPB 256 (1985) 413 | |
| 25 | M. Guzzi, P. M. Nadolsky, and B. Wang | Nonperturbative contributions to a resummed leptonic angular distribution in inclusive neutral vector boson production | PRD 90 (2014) 014030 | 1309.1393 |
| 26 | S.-Y. Wei | Exploring the non-perturbative Sudakov factor via $ \text{Z}^0 $-boson production in pp collisions | PLB 817 (2021) 136356 | 2009.06514 |
| 27 | CMS Collaboration | Extraction and validation of a new set of CMS PYTHIA8 tunes from underlying-event measurements | EPJC 80 (2020) 4 | CMS-GEN-17-001 1903.12179 |
| 28 | CMS Collaboration | Development and validation of HERWIG 7 tunes from CMS underlying-event measurements | EPJC 81 (2021) 312 | CMS-GEN-19-001 2011.03422 |
| 29 | J. Alwall et al. | The automated computation of tree-level and next-to-leading order differential cross sections, and their matching to parton shower simulations | JHEP 07 (2014) 079 | 1405.0301 |
| 30 | A. Buckley et al. | Systematic event generator tuning for the LHC | EPJC 65 (2010) 331 | 0907.2973 |
| 31 | P. Skands, S. Carrazza, and J. Rojo | Tuning PYTHIA 8.1: the Monash 2013 tune | EPJC 74 (2014) 3024 | 1404.5630 |
| 32 | S. Baranov et al. | CASCADE3 A Monte Carlo event generator based on TMDs | EPJC 81 (2021) 425 | 2101.10221 |
| 33 | C. Balazs and C. P. Yuan | Soft gluon effects on lepton pairs at hadron colliders | PRD 56 (1997) 5558 | hep-ph/9704258 |

|
Compact Muon Solenoid LHC, CERN |

|

|

|

|

|

|