

Compact Muon Solenoid
LHC, CERN
| CMS-PAS-EXO-23-002 | ||
| Search for soft unclustered energy patterns in proton-proton collisions at 13 TeV | ||
| CMS Collaboration | ||
| 5 December 2023 | ||
| Abstract: The first dedicated search for soft unclustered energy patterns (SUEPs) is performed in proton-proton collisions at $ \sqrt{s}= $ 13 TeV, using data collected by the CMS detector at the LHC. SUEPs are predicted by Hidden Valley models that include a new, confining force with a large 't Hooft coupling and are characterized by a large multiplicity of low-momentum, diffuse, charged particles in the final state. The data, which correspond to a total integrated luminosity of 138 fb$ ^{-1} $, were collected in 2016-2018 using hadronic triggers, whose high energy thresholds preferentially select a boosted event topology. The track multiplicity and the sphericity of clustered tracks are used to discriminate against the large multijet background from standard model quantum chromodynamics interactions. No significant excess of events over the standard model expectation is observed. Limits are set on the production cross section of a scalar mediator produced via gluon fusion with SUEP-like decays. | ||
|
Links:
CDS record (PDF) ;
CADI line (restricted) ;
These preliminary results are superseded in this paper, PRL 133 (2024) 191902. The superseded preliminary plots can be found here. |
||
| Figures | Summary | Additional Figures & Tables | References | CMS Publications |
|---|
| Figures | |
png pdf |
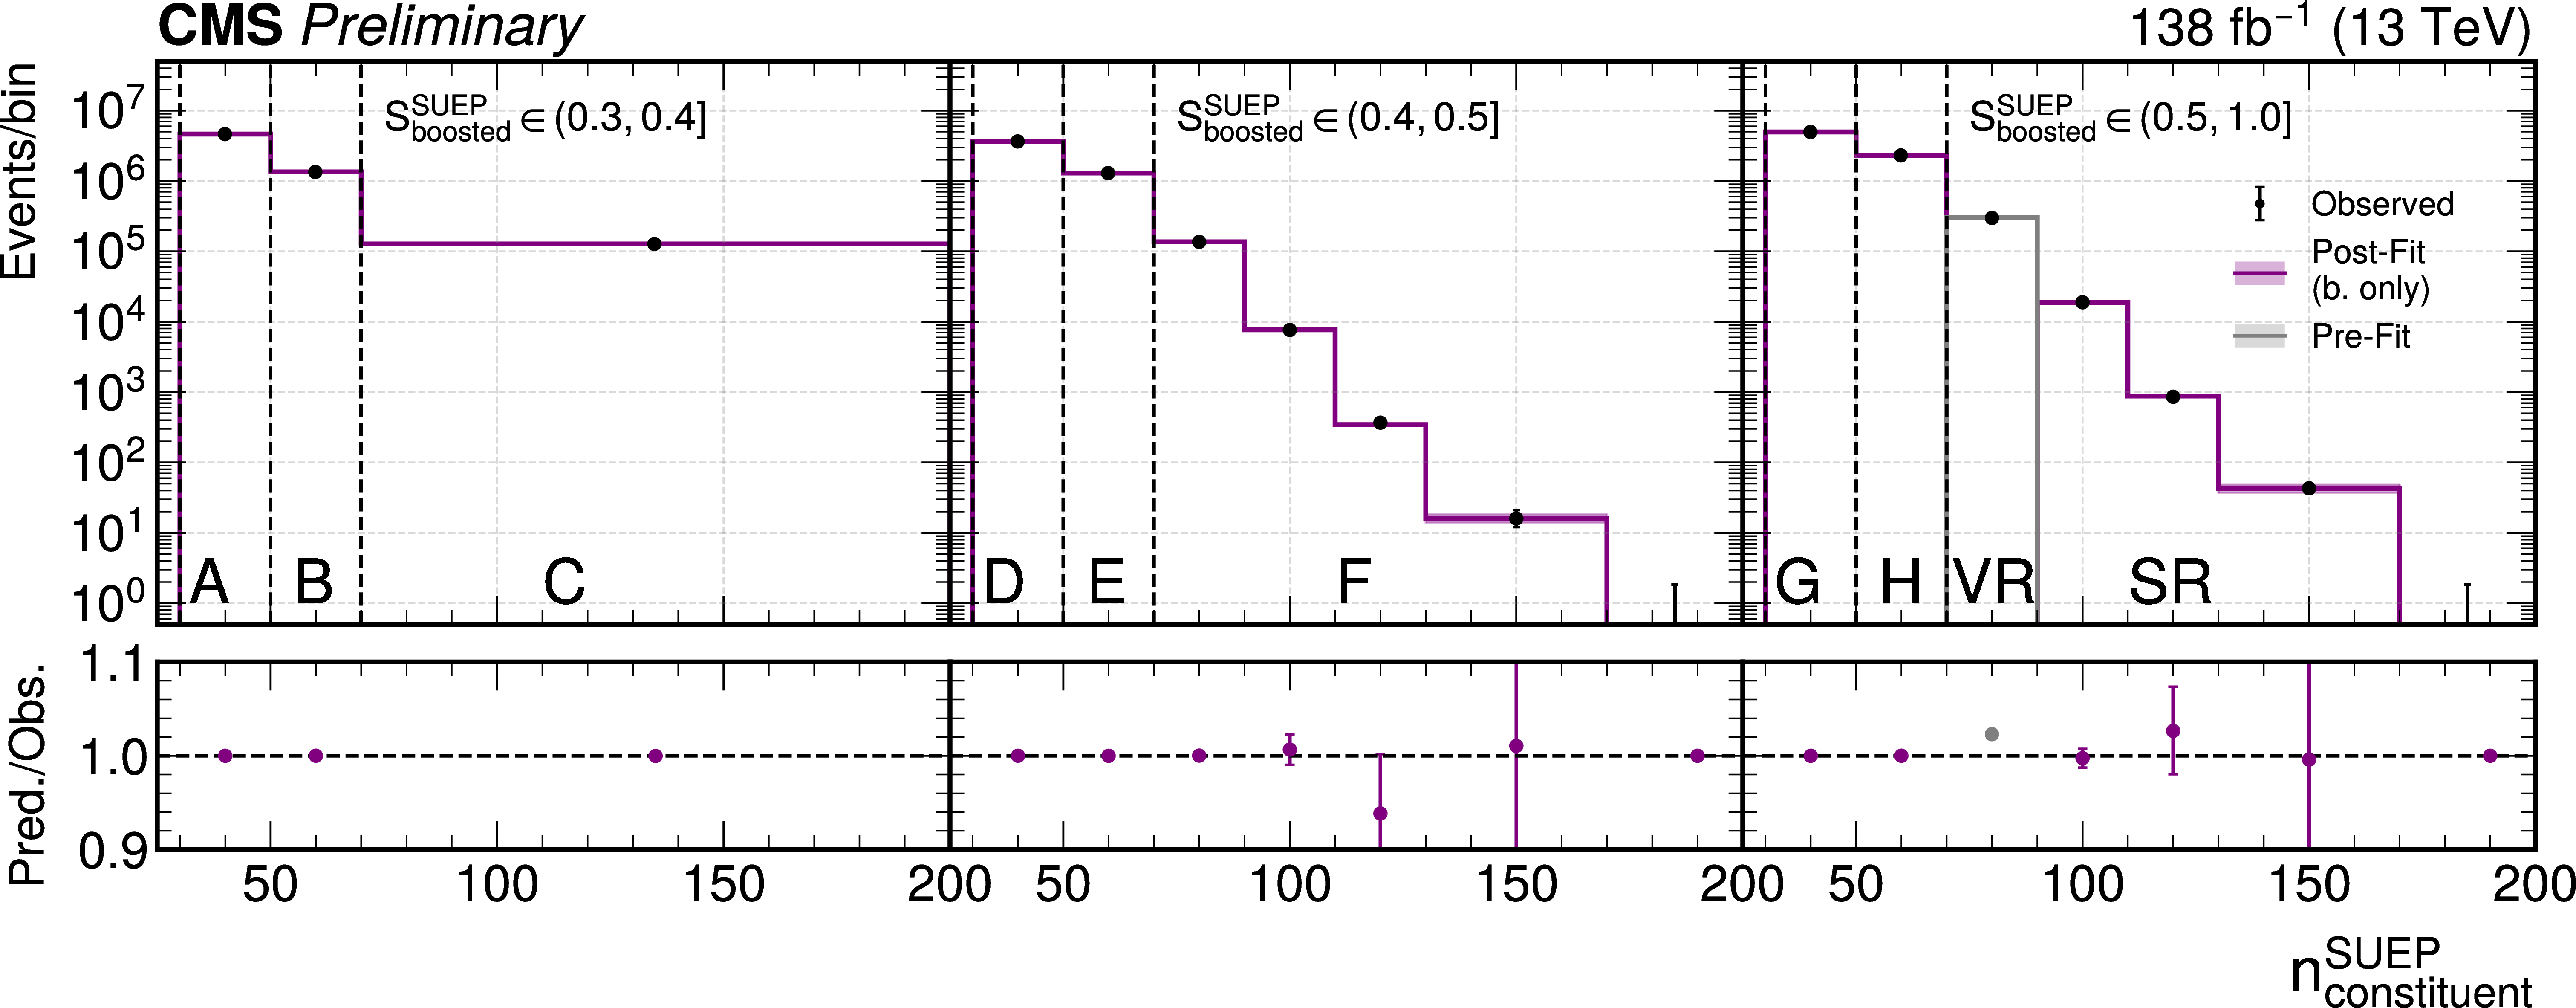
Figure 1:
The observed events as a function of the number of tracks in the SUEP candidate, for all CRs A--H and the SR. The pre-fit predicted background distribution is shown in the VR. Finally, the post-fit values for a background-only fit are shown for all regions and bins, except for the VR. The post-fit predictions for the F and SR bins with the highest $ n_{\text{constituent}}^{\text{SUEP}} $ range are 3.5 $ \times$ 10$^{-6}$ $\pm$ 8.4 $\times$ 10$^{-4} $ and 1.2 $ \times$ 10$^{-5}$ $\pm$ 2.9 $\times$ 10$^{-3} $, respectively. |
png pdf |
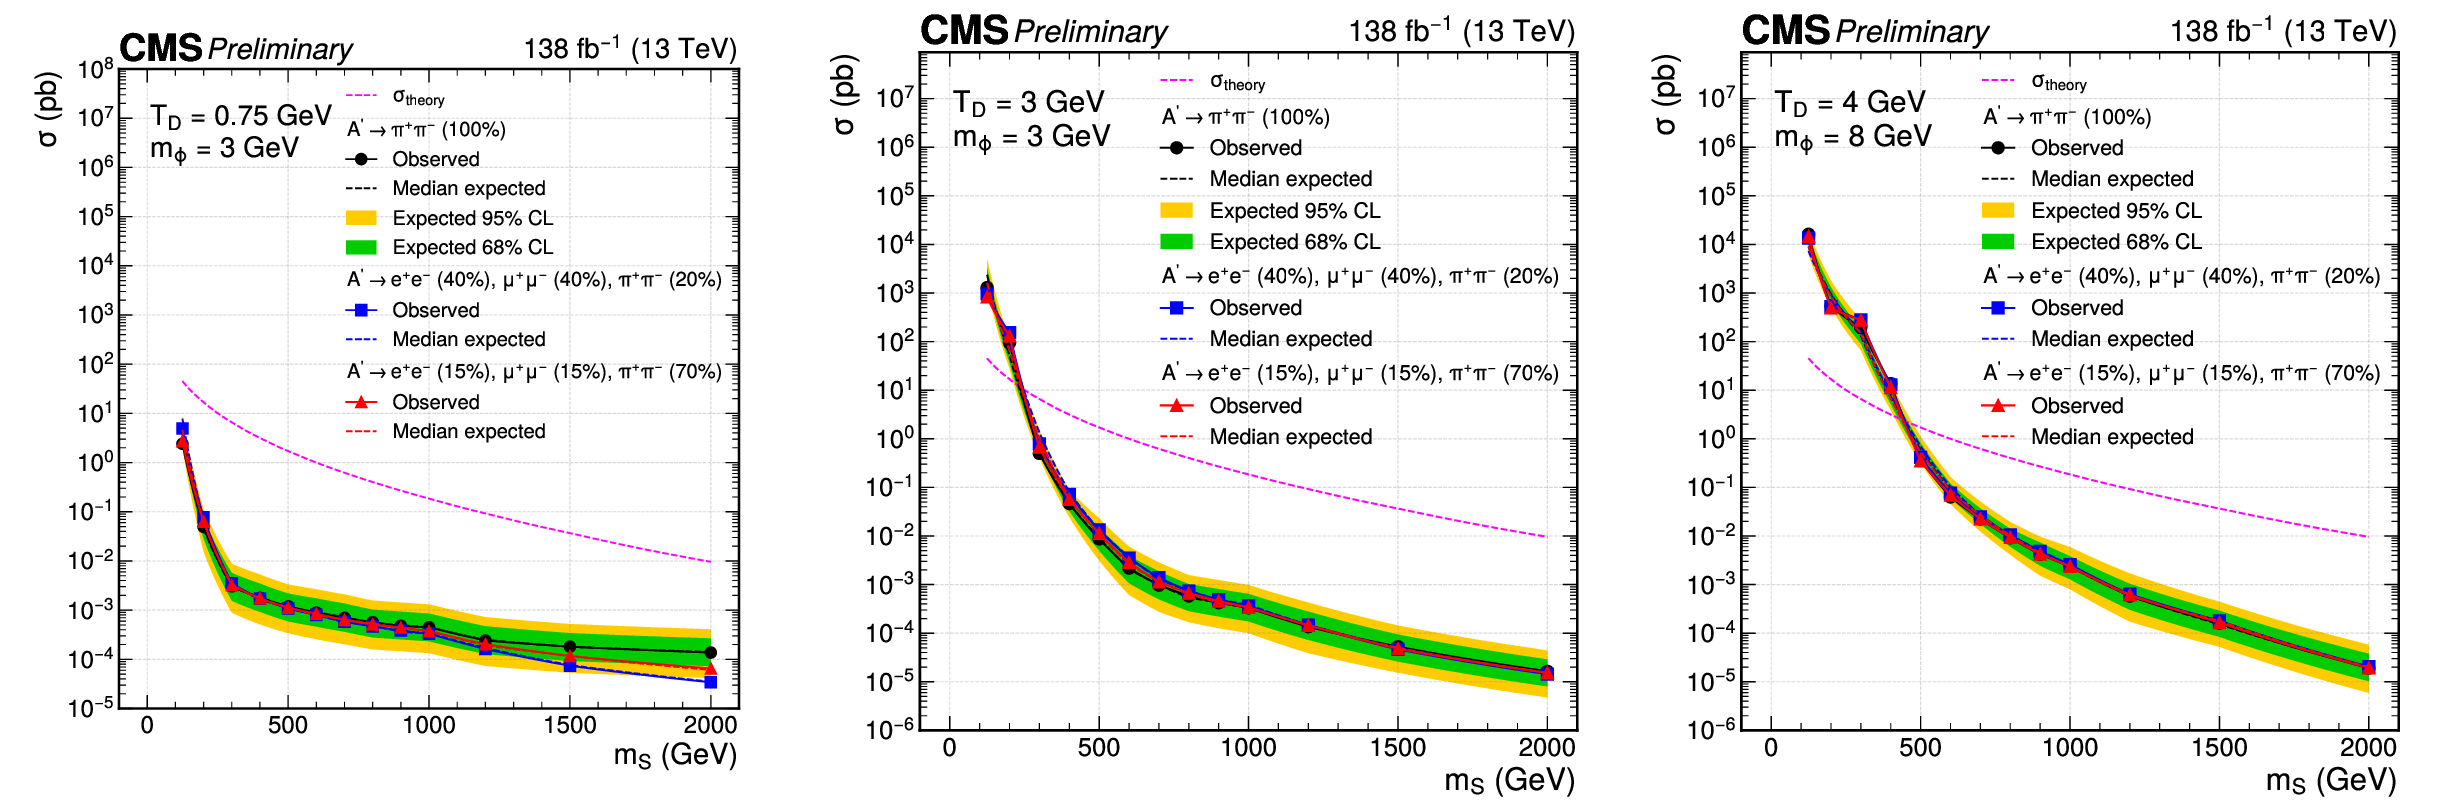
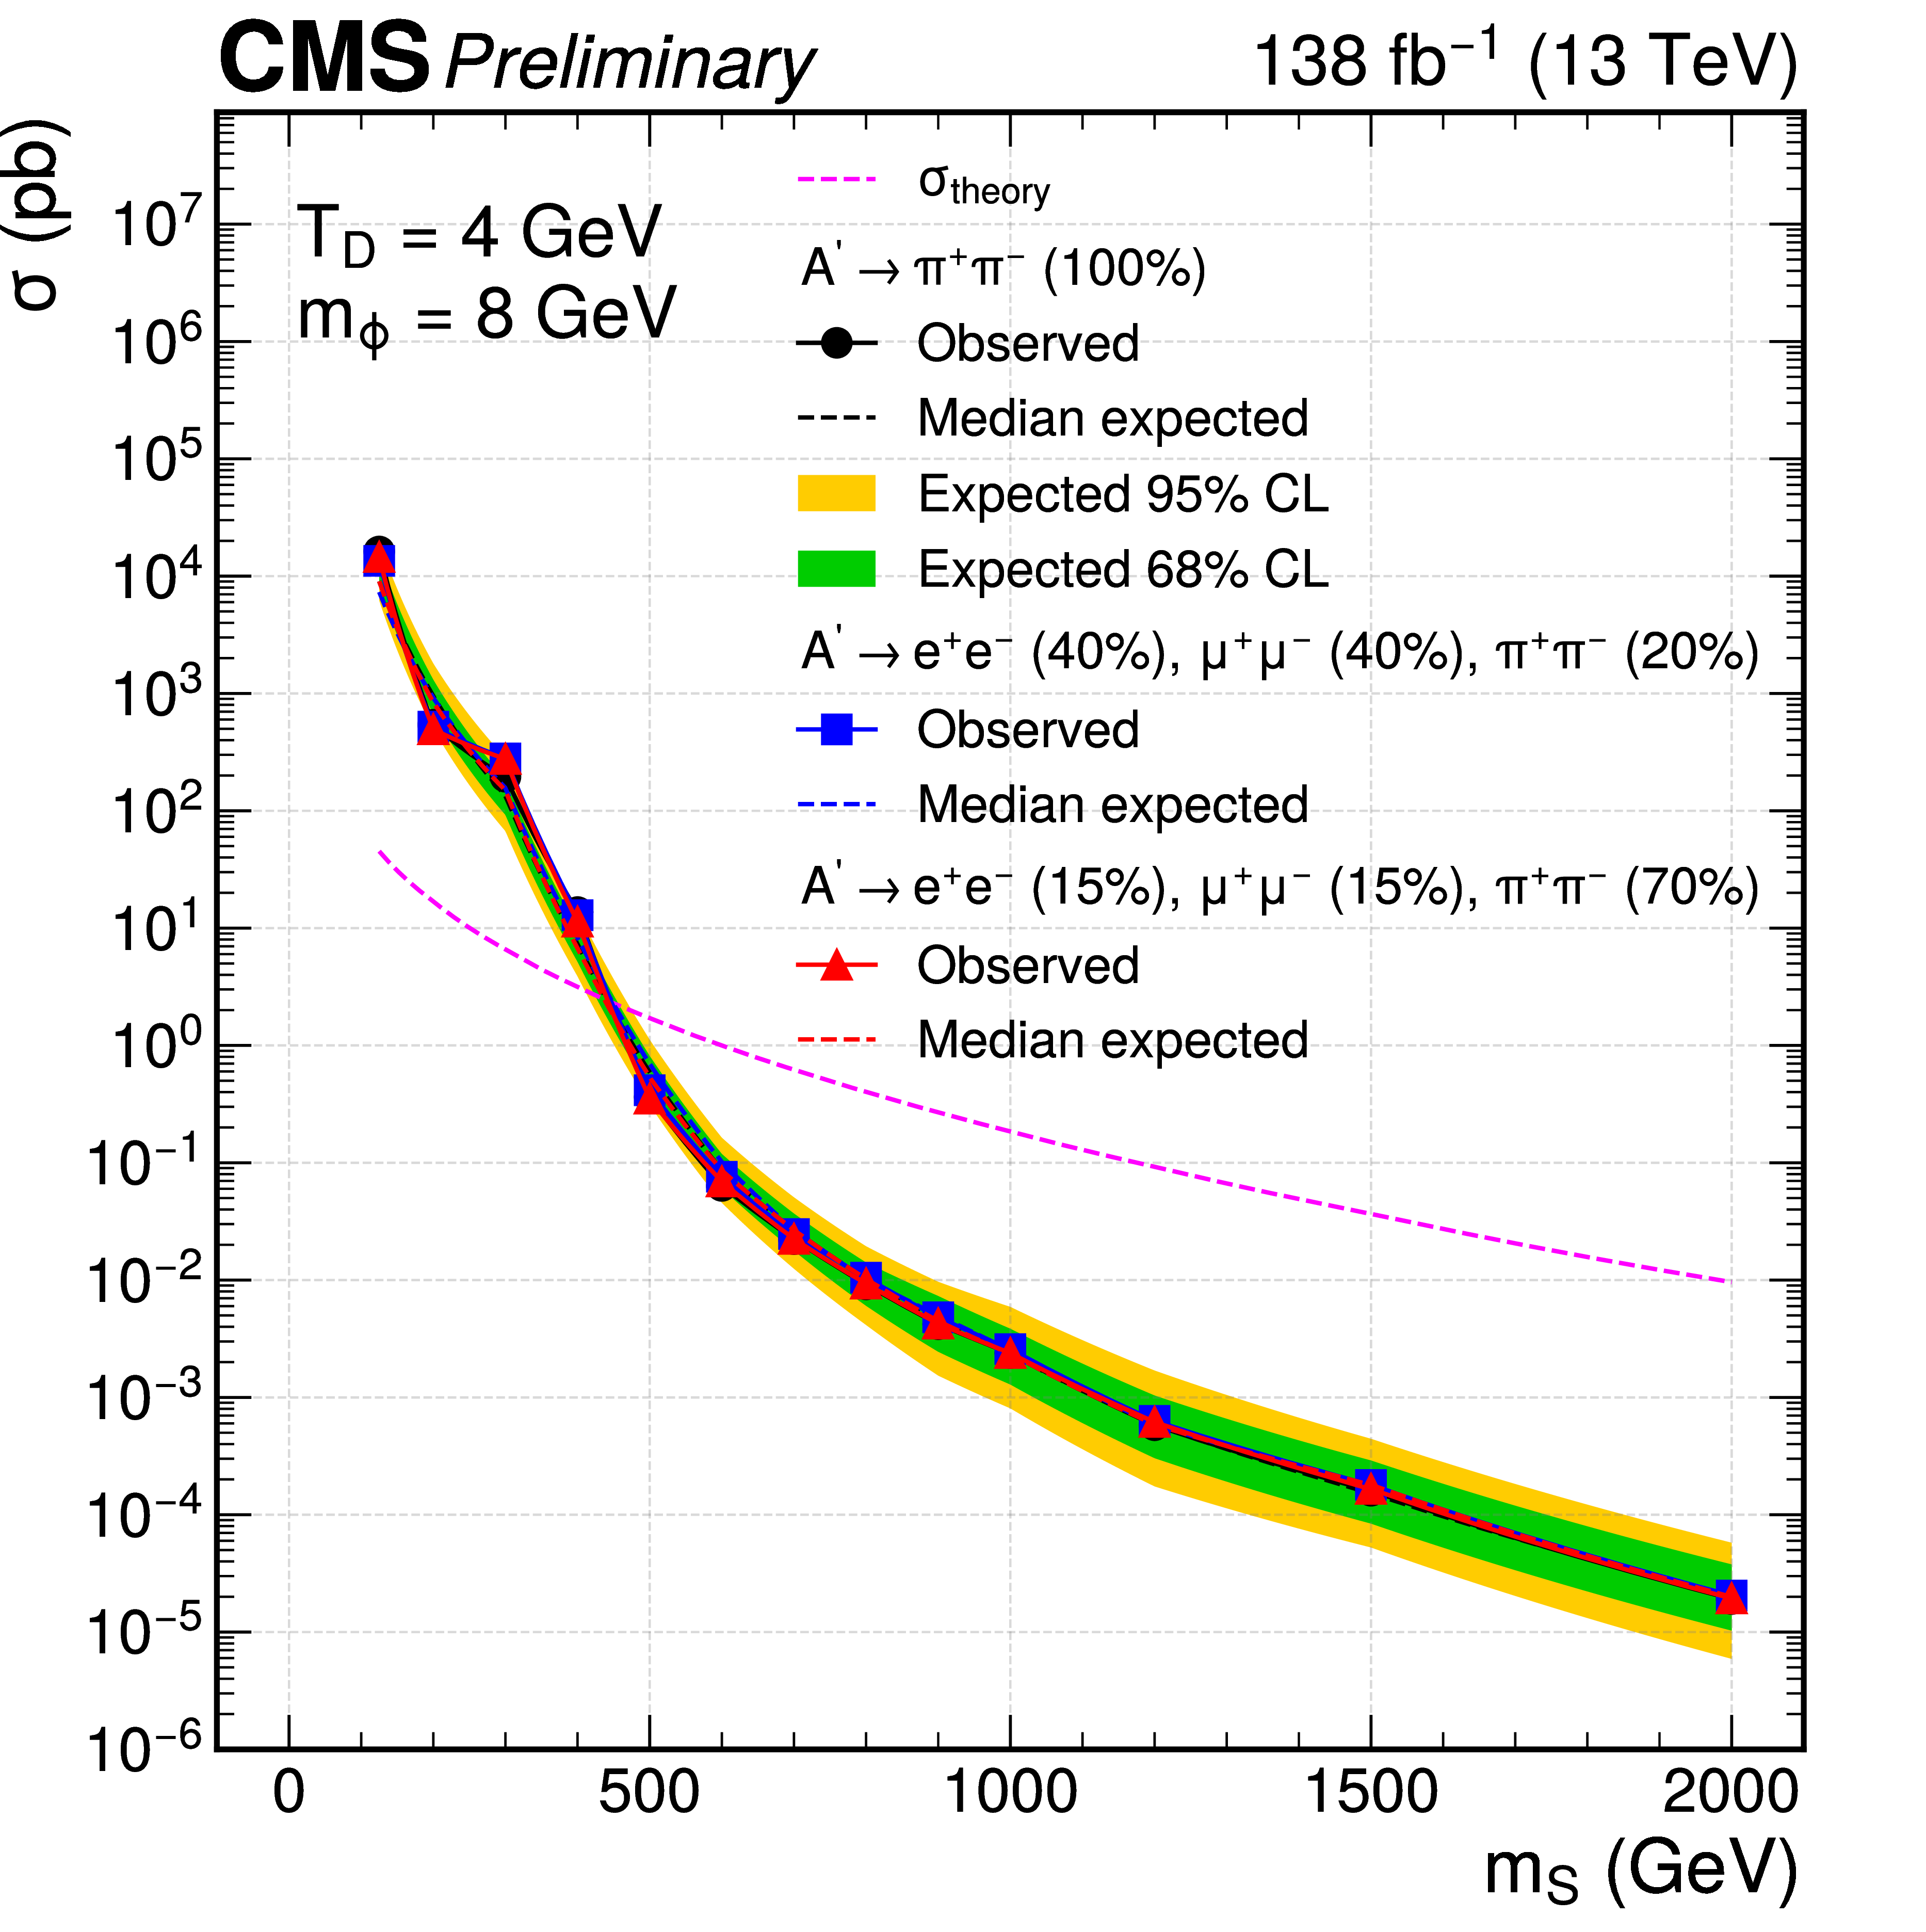
Figure 2:
The 95% CL exclusion limits on the production cross section $ \sigma $ are shown as a function of $ m_{\text{S}} $ for various $ m_{\phi} $ and $ T_{\text{D}} $ values, and all decay modes. |

png pdf |
Figure 2-a:
The 95% CL exclusion limits on the production cross section $ \sigma $ are shown as a function of $ m_{\text{S}} $ for various $ m_{\phi} $ and $ T_{\text{D}} $ values, and all decay modes. |

png pdf |
Figure 2-b:
The 95% CL exclusion limits on the production cross section $ \sigma $ are shown as a function of $ m_{\text{S}} $ for various $ m_{\phi} $ and $ T_{\text{D}} $ values, and all decay modes. |
png pdf |
Figure 2-c:
The 95% CL exclusion limits on the production cross section $ \sigma $ are shown as a function of $ m_{\text{S}} $ for various $ m_{\phi} $ and $ T_{\text{D}} $ values, and all decay modes. |
png pdf |
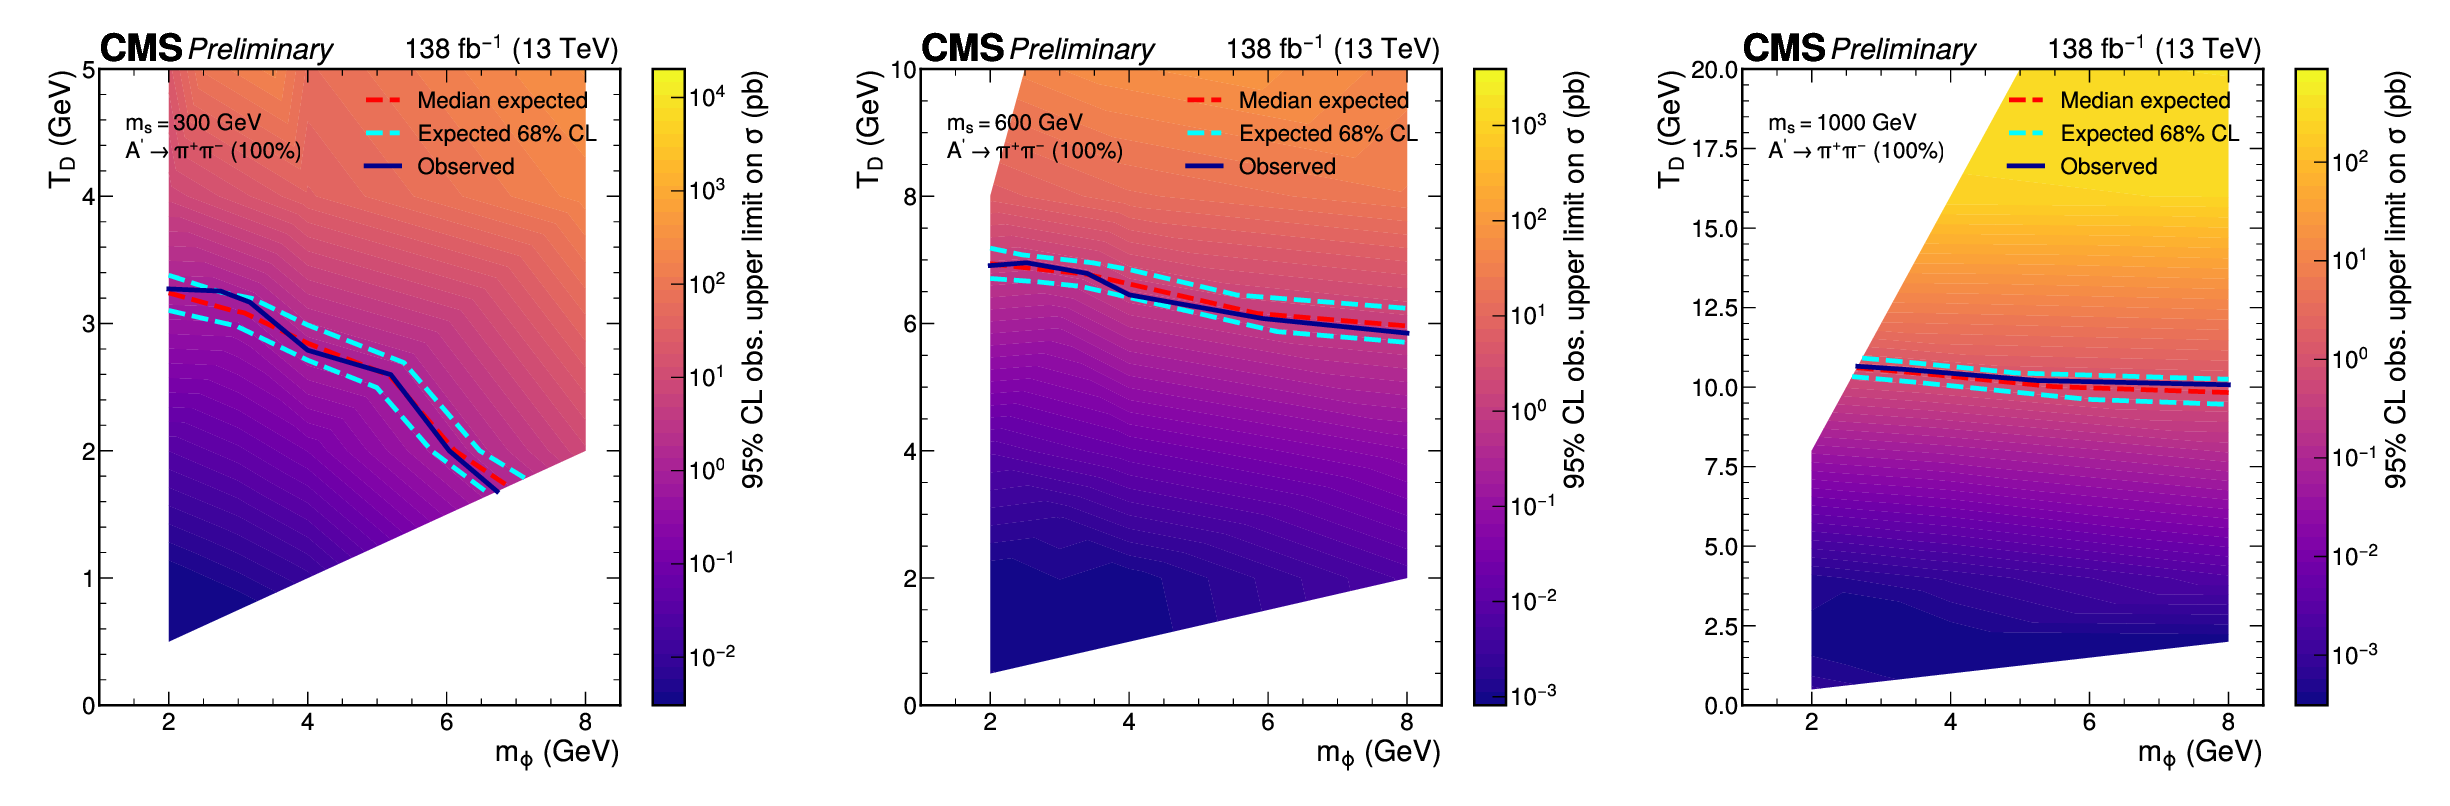
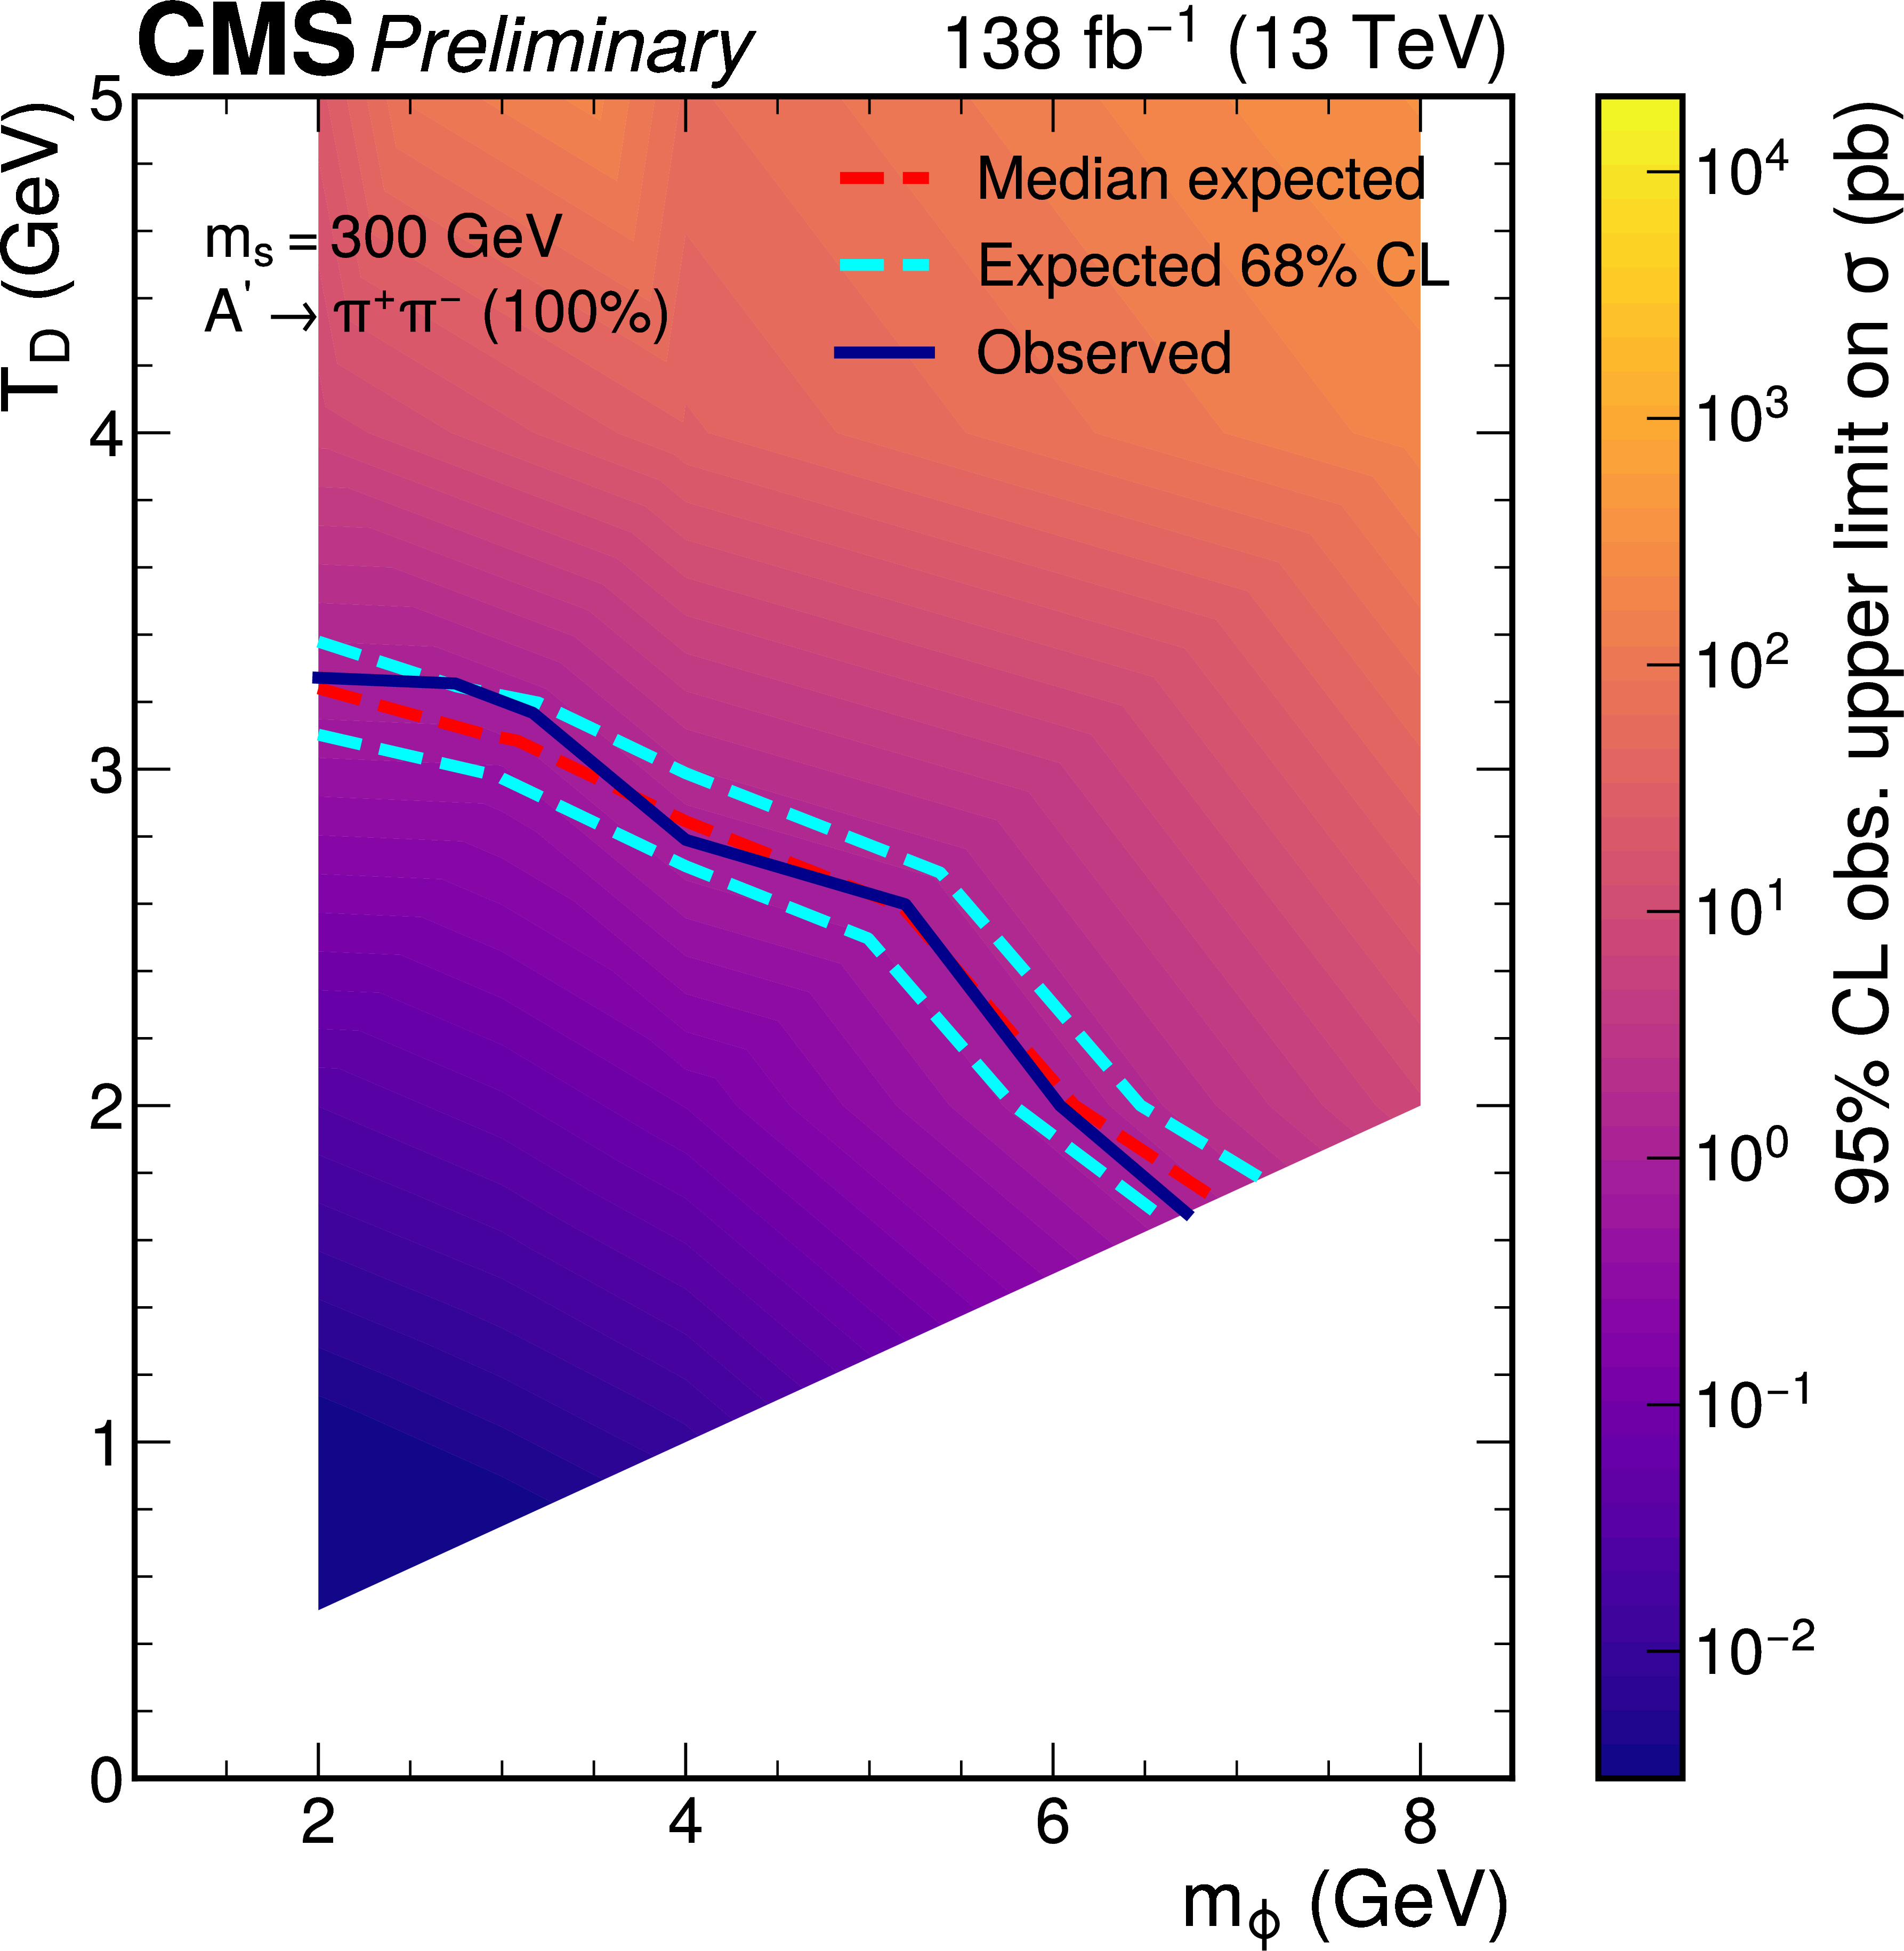
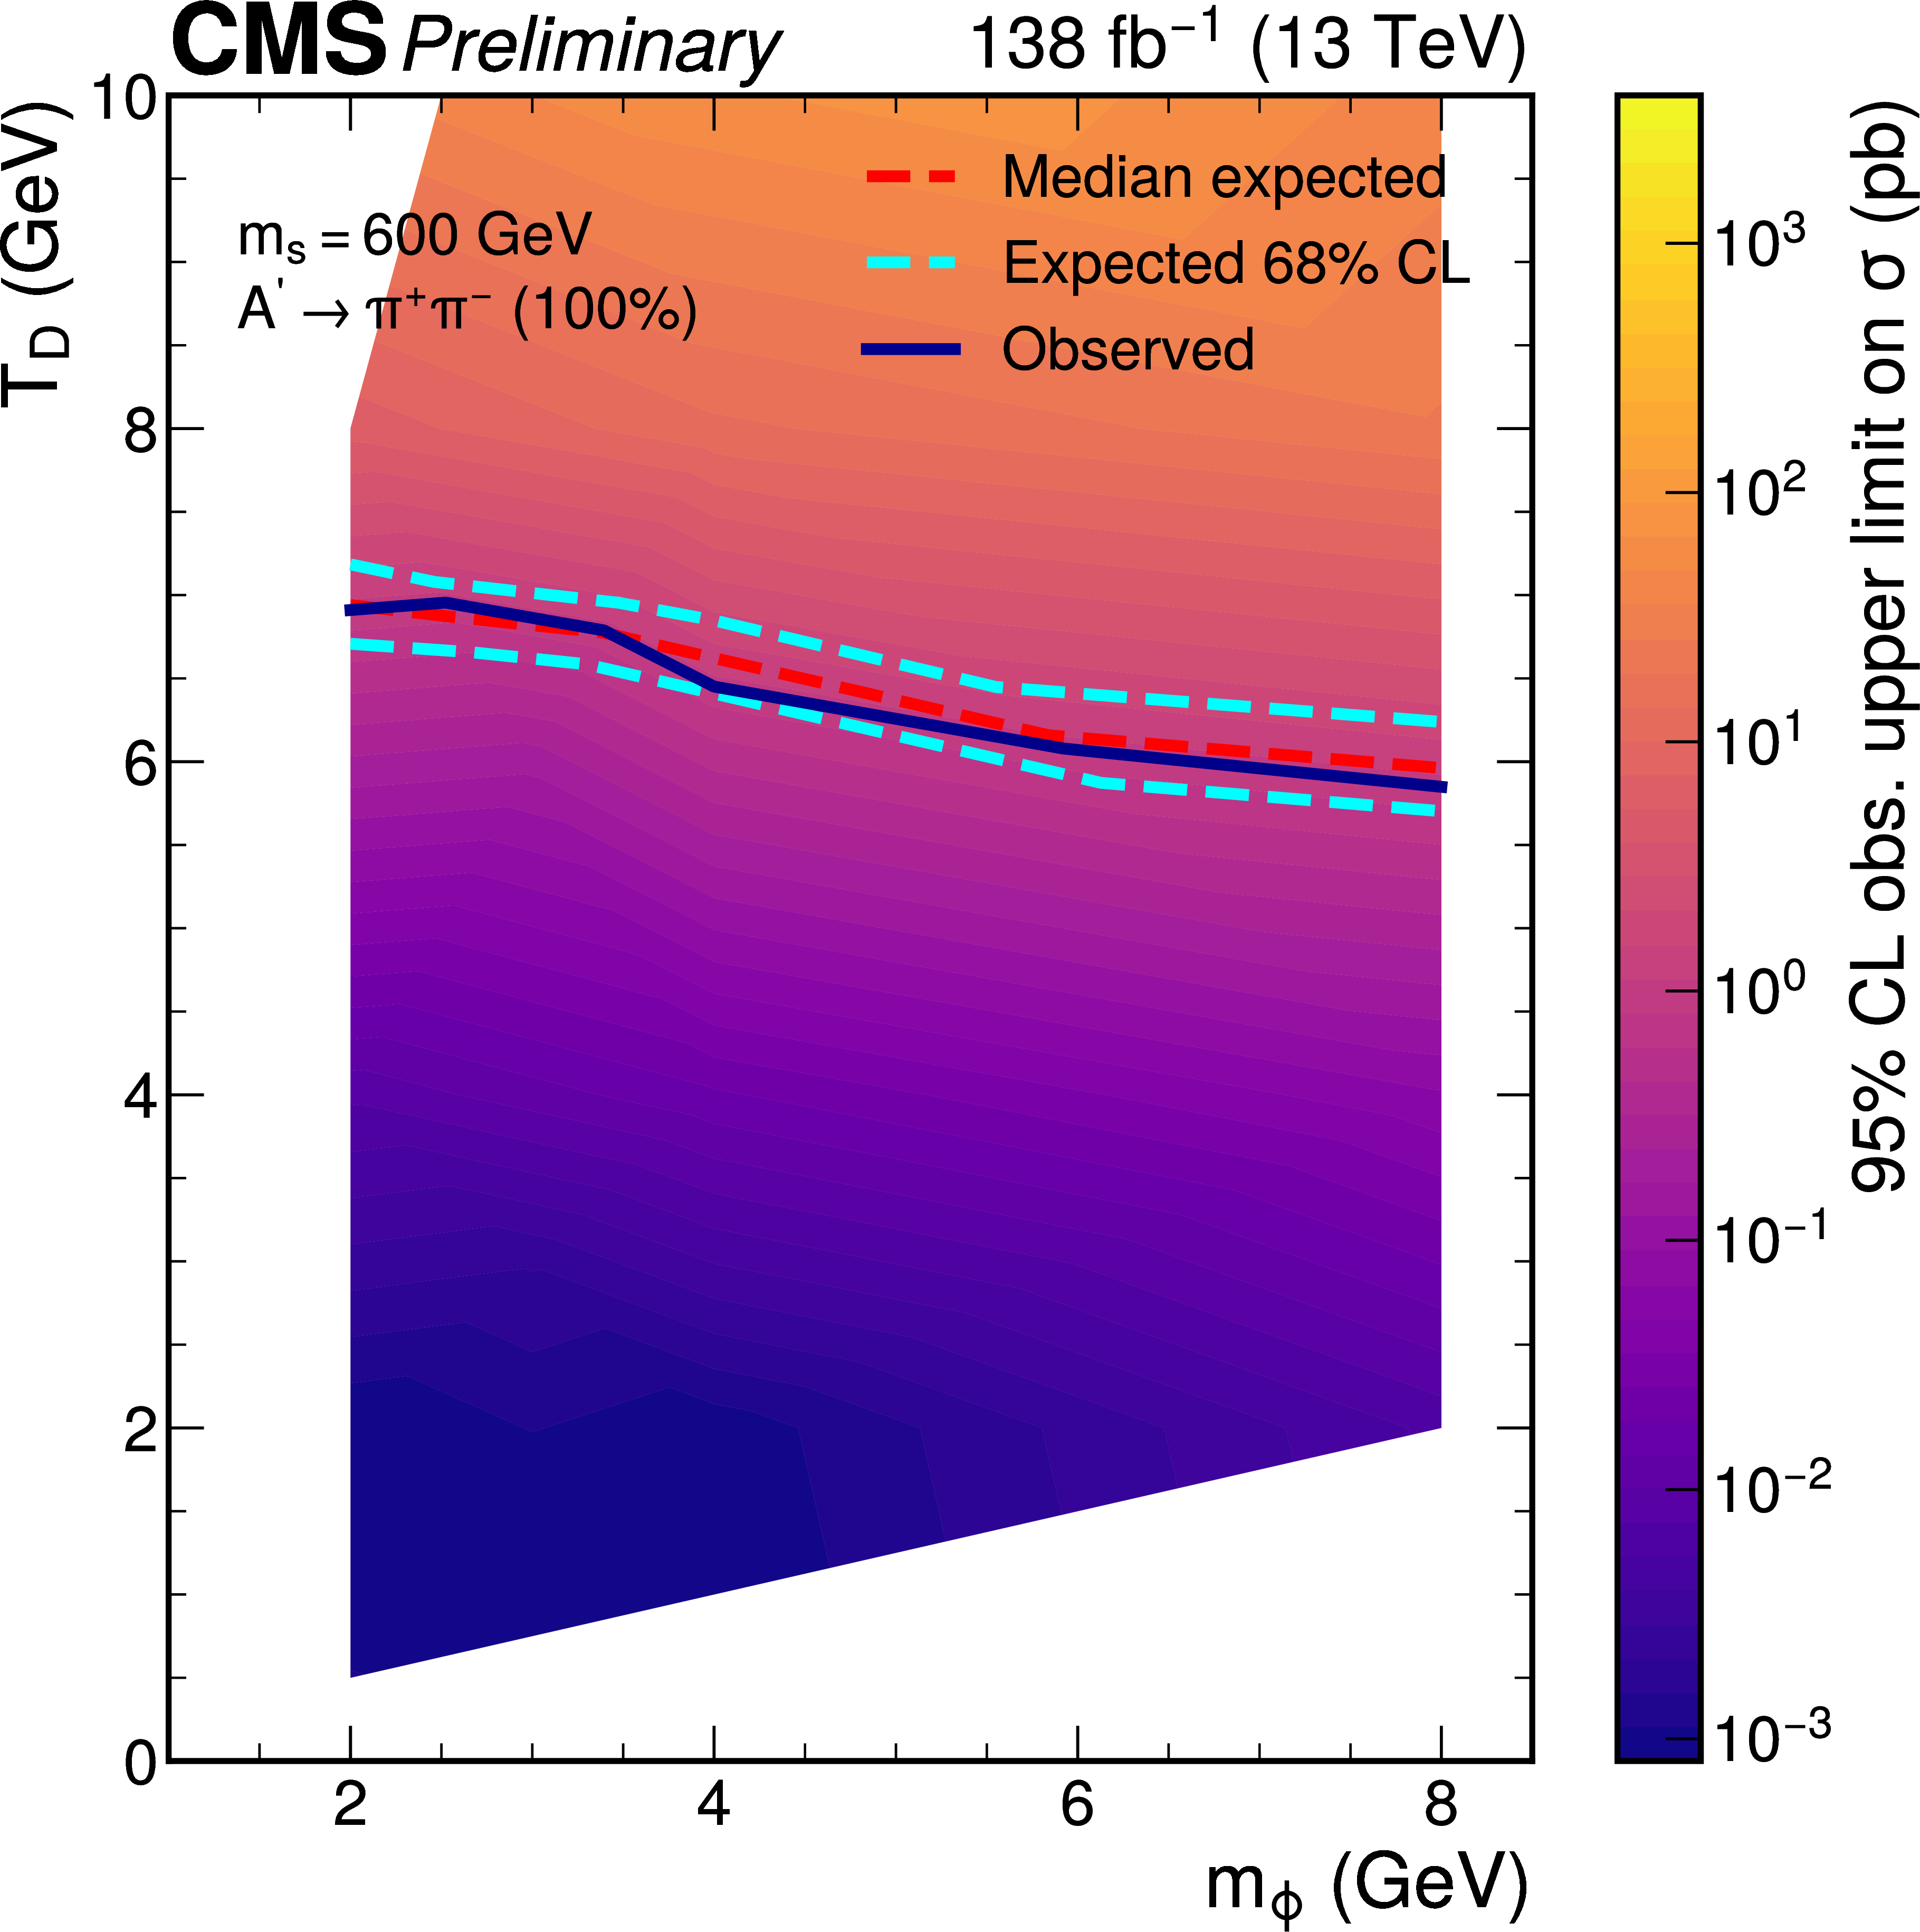
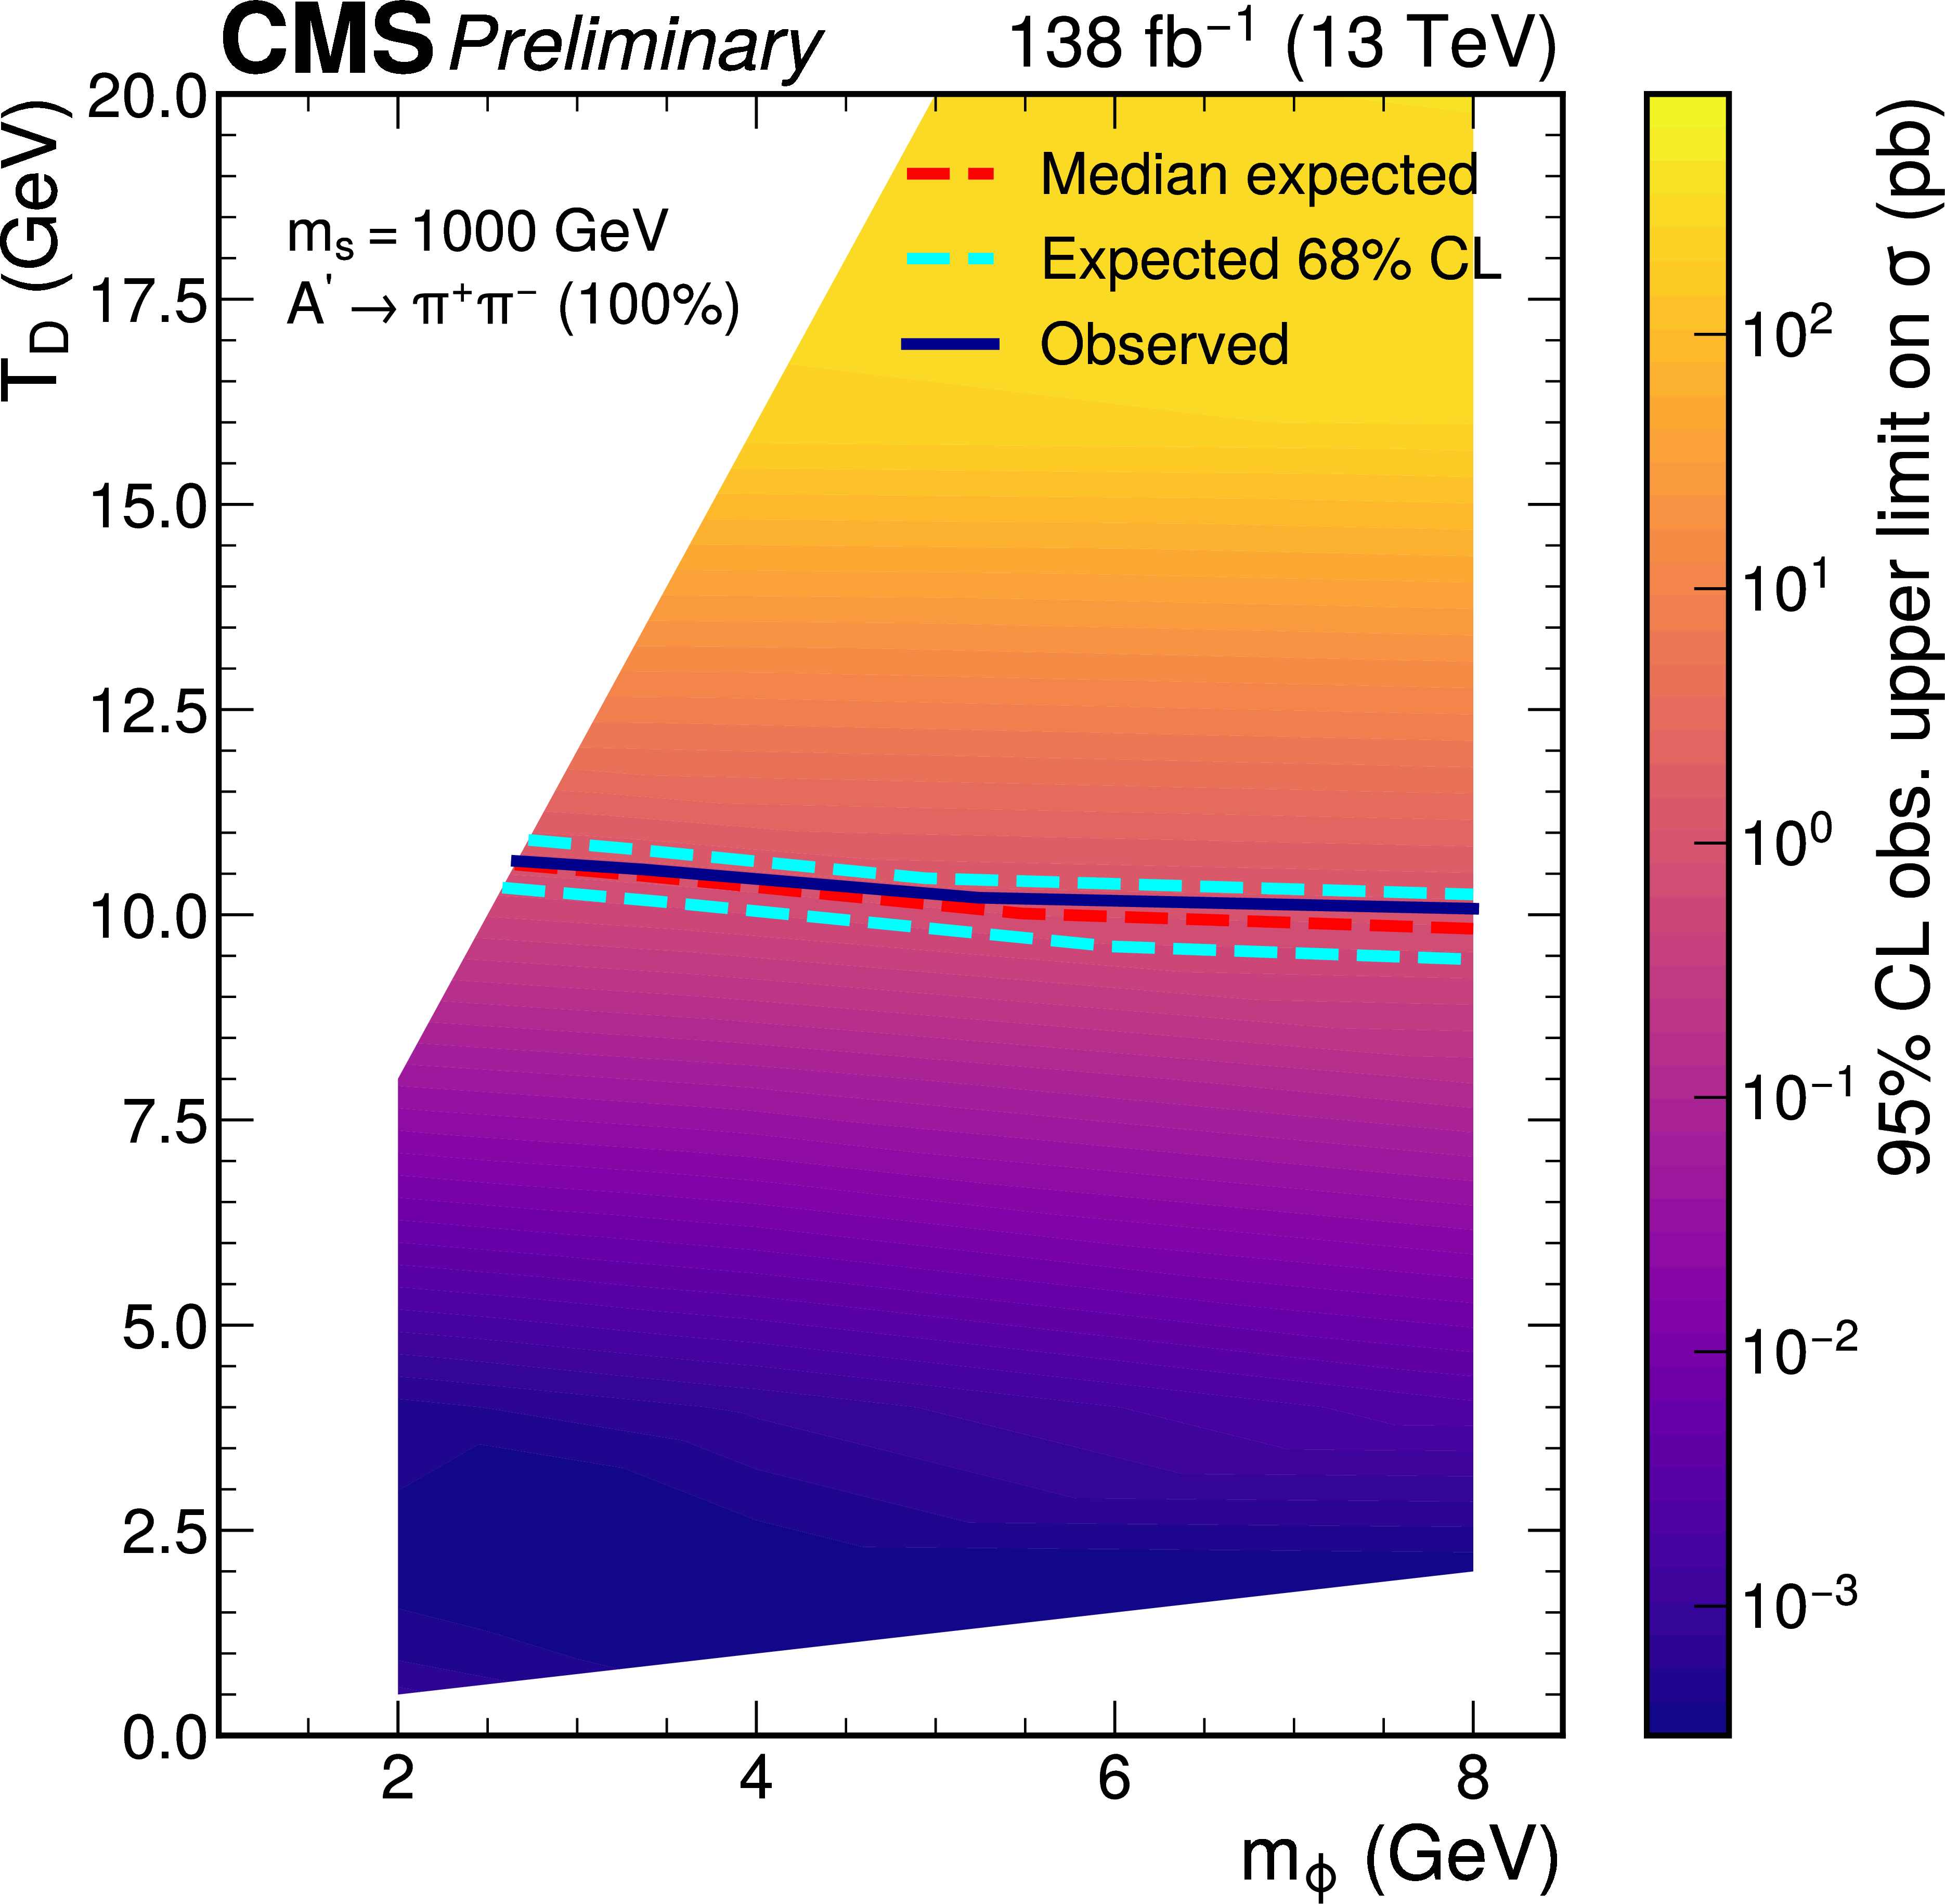
Figure 3:
The 95% CL observed upper limits on the cross section shown as a function of $ T_{\text{D}} $ and the pseudoscalar mass $ m_{\phi} $ for $ m_{\text{S}} $ values of 125 GeV (left), 400 GeV (center), 1000 GeV (right), in the $ m_{\text{A}^{\prime}}= $ 1.0 GeV ($ \text{A}^{\prime} \to \pi^{+}\pi^{-} $ with $ \mathcal{B}=$ 100%) case. The solid dark blue curves indicate the observed exclusions for the nominal $ \text{S} $ cross section, while the dashed red curves indicate the expected exclusions, and the dashed light blue curves indicate the region containing 68% of the distributions of expected exclusions. The regions below the lines are excluded. |
png pdf |
Figure 3-a:
The 95% CL observed upper limits on the cross section shown as a function of $ T_{\text{D}} $ and the pseudoscalar mass $ m_{\phi} $ for $ m_{\text{S}} $ values of 125 GeV (left), 400 GeV (center), 1000 GeV (right), in the $ m_{\text{A}^{\prime}}= $ 1.0 GeV ($ \text{A}^{\prime} \to \pi^{+}\pi^{-} $ with $ \mathcal{B}=$ 100%) case. The solid dark blue curves indicate the observed exclusions for the nominal $ \text{S} $ cross section, while the dashed red curves indicate the expected exclusions, and the dashed light blue curves indicate the region containing 68% of the distributions of expected exclusions. The regions below the lines are excluded. |
png pdf |
Figure 3-b:
The 95% CL observed upper limits on the cross section shown as a function of $ T_{\text{D}} $ and the pseudoscalar mass $ m_{\phi} $ for $ m_{\text{S}} $ values of 125 GeV (left), 400 GeV (center), 1000 GeV (right), in the $ m_{\text{A}^{\prime}}= $ 1.0 GeV ($ \text{A}^{\prime} \to \pi^{+}\pi^{-} $ with $ \mathcal{B}=$ 100%) case. The solid dark blue curves indicate the observed exclusions for the nominal $ \text{S} $ cross section, while the dashed red curves indicate the expected exclusions, and the dashed light blue curves indicate the region containing 68% of the distributions of expected exclusions. The regions below the lines are excluded. |
png pdf |
Figure 3-c:
The 95% CL observed upper limits on the cross section shown as a function of $ T_{\text{D}} $ and the pseudoscalar mass $ m_{\phi} $ for $ m_{\text{S}} $ values of 125 GeV (left), 400 GeV (center), 1000 GeV (right), in the $ m_{\text{A}^{\prime}}= $ 1.0 GeV ($ \text{A}^{\prime} \to \pi^{+}\pi^{-} $ with $ \mathcal{B}=$ 100%) case. The solid dark blue curves indicate the observed exclusions for the nominal $ \text{S} $ cross section, while the dashed red curves indicate the expected exclusions, and the dashed light blue curves indicate the region containing 68% of the distributions of expected exclusions. The regions below the lines are excluded. |
png pdf |
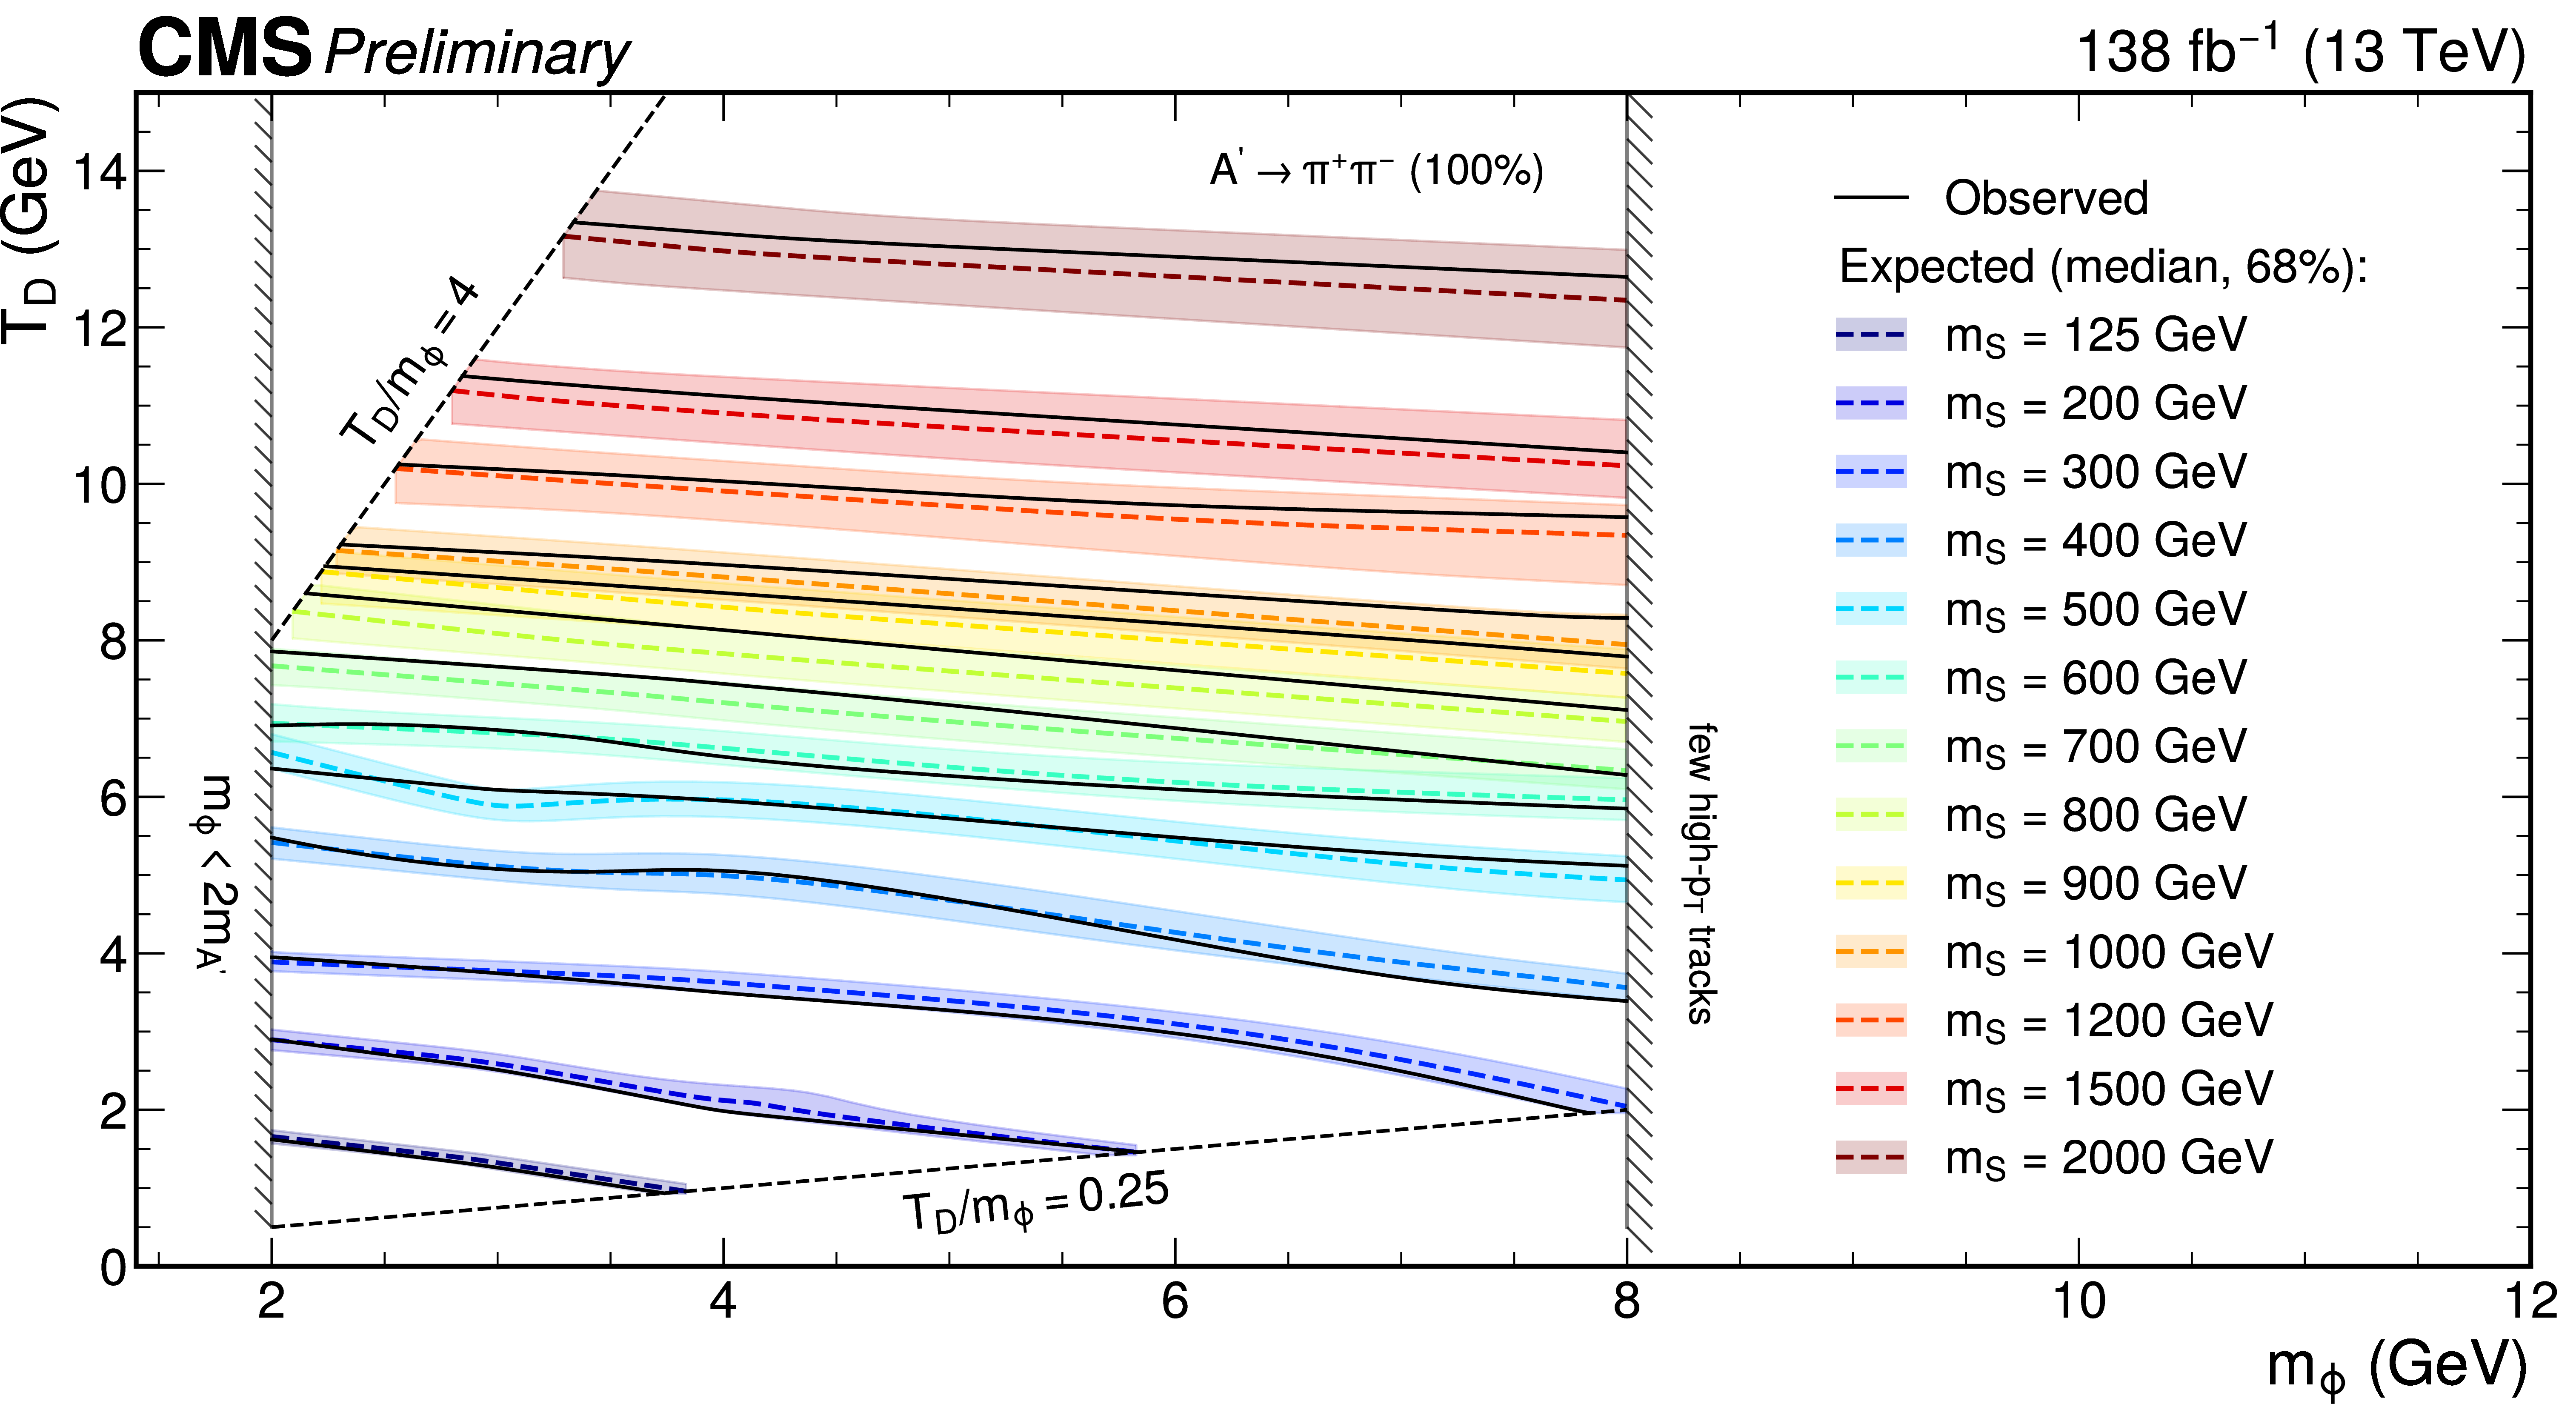
Figure 4:
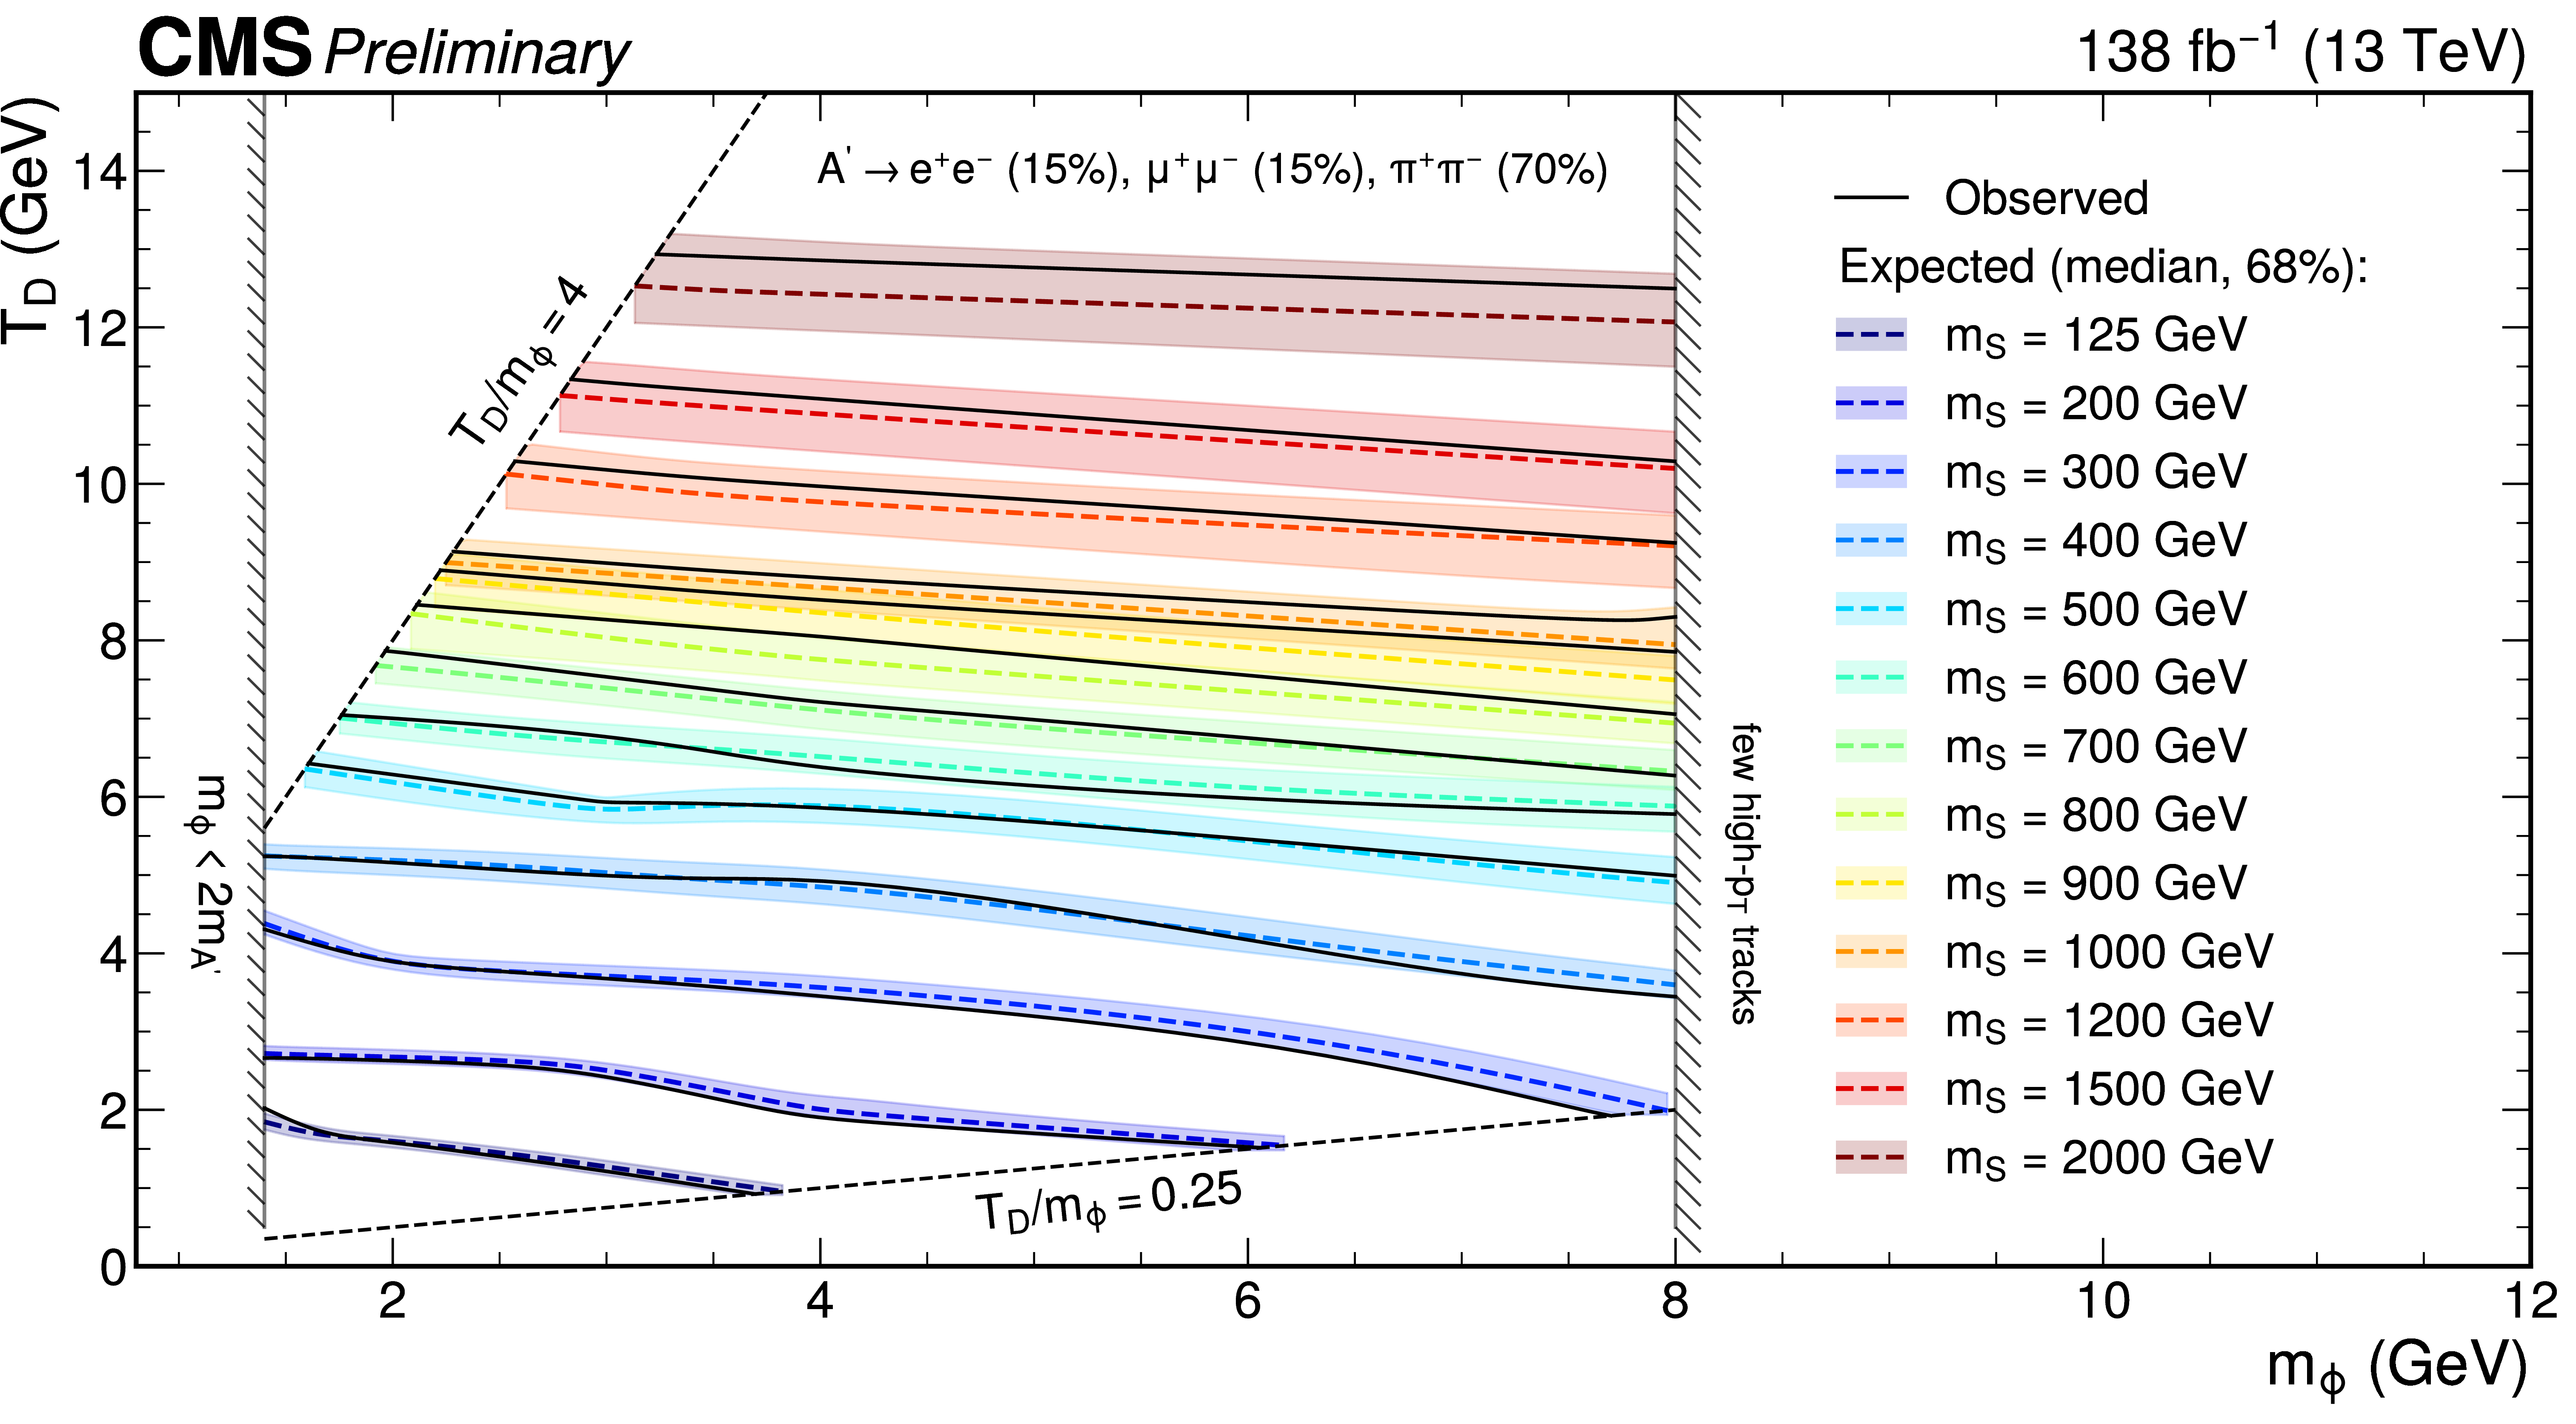
The observed and expected exclusions for the nominal $ \text{S} $ cross section for all $ m_{\text{S}} $ values, for the $ m_{\text{A}^{\prime}}= $ 1.0 GeV ($ \text{A}^{\prime} \rightarrow \pi^{+}\pi^{-} $ with $ \mathcal{B}= $ 100%) case, in a plane of $ m_{\phi} $ and $ T_{\text{D}} $. The regions below the lines are excluded. |
| Summary |
| This note presents the first search for soft unclustered energy patterns (SUEPs) at the LHC. Data corresponding to an integrated luminosity of 138 fb$ ^{-1} $ are used, collected with a trigger requiring a high scalar sum of jet transverse momenta and reconstructed with the full offline processing. This strategy preferentially selects events with initial state radiation (ISR); the characteristic isotropic event shape of the SUEPs is recovered by boosting into the scalar mediator rest frame and removing the ISR particles. The number of tracks in the SUEP candidate is used to discriminate between the signal and the background from standard model quantum chromodynamics, which is estimated from data control regions. Stringent limits are placed on a hidden valley model for the most SUEP-like scenarios, where $ m_{\text{S}}/T_{\text{D}} \sim $ 100. |
| Additional Figures | |

png pdf |
Additional Figure 1:
The observed and expected exclusions for the nominal $ \text{S} $ cross section for all $ m_{\text{S}} $ values, for the $ m_{\text{A}^{\prime}} = $ 0.5 GeV ($ \text{A}^{\prime} \to \mathrm{e}^+\mathrm{e}^-$, $\mu^{+}\mu^{-}$, $\pi^{+}\pi^{-} $ with $ \mathcal{B} $ = 40, 40, 20%) case, in a plane of $ m_{\phi} $ and $ T_{\text{D}} $. The regions below the lines are excluded. |
png pdf |
Additional Figure 2:
The observed and expected exclusions for the nominal $ \text{S} $ cross section for all $ m_{\text{S}} $ values, for the $ m_{\text{A}^{\prime}} = $ 0.7 GeV ($ \text{A}^{\prime} \to \mathrm{e}^+\mathrm{e}^-$, $\mu^{+}\mu^{-}$, $\pi^{+}\pi^{-} $ with $ \mathcal{B} = $ 15, 15, 70%) case, in a plane of $ m_{\phi} $ and $ T_{\text{D}} $. The regions below the lines are excluded. |
png pdf |
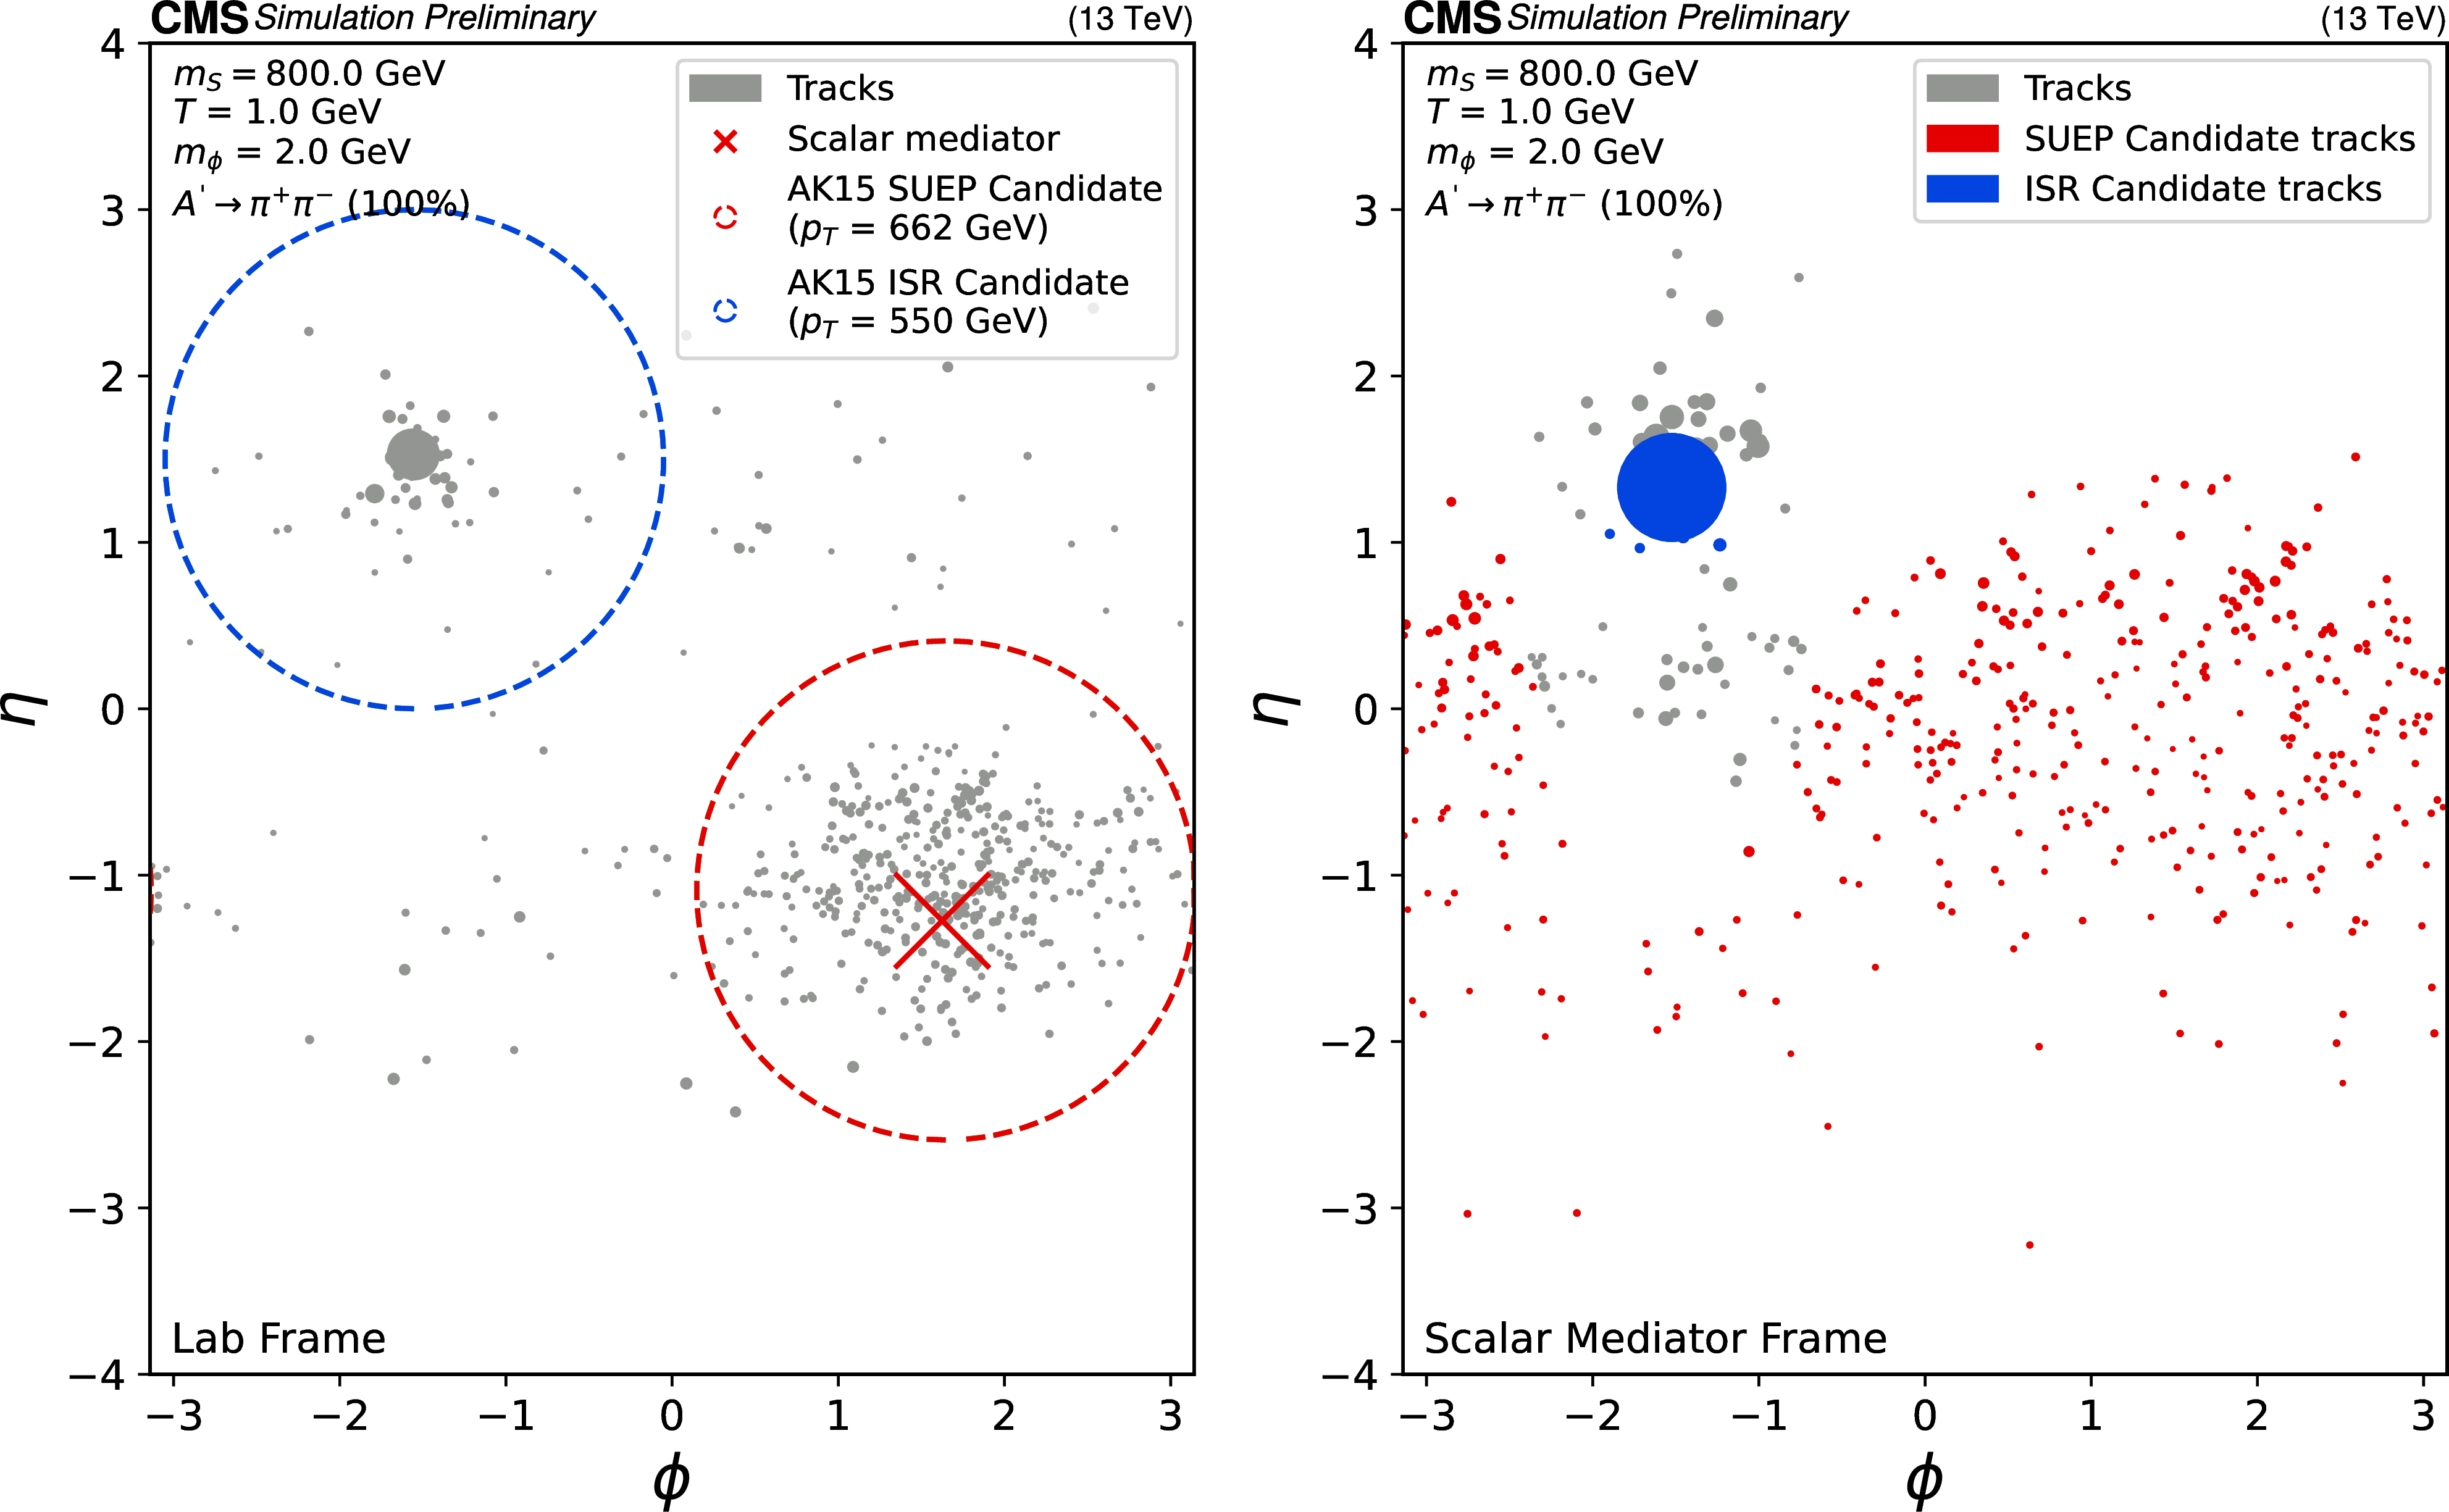
Additional Figure 3:
An example signal event from a representative model with $ m_{\text{S}}= $ 800 GeV in the lab frame (left) and the generator-level $ \text{S} $ mediator frame (right). The jets are clustered from charged particle tracks associated with the primary vertex using the anti-$ k_{\mathrm{T}} $ algorithm with $ R= $ 1.5. The size of each dot is scaled based on the $ p_{\mathrm{T}} $ of the corresponding track. |
| Additional Tables | |

png pdf |
Additional Table 1:
The observed and predicted yields in the SR, applying the extended ABCD method to the ISR candidate. Only statistical uncertainties are shown. The deviation of the ratio from unity, averaged across all years, is taken as a systematic uncertainty in the final SR prediction to address higher-order correlations between the variables used in the extended ABCD method. |

png pdf |
Additional Table 2:
The observed and predicted yields in the VR, which corresponds to the first bin in the SR, applying the extended ABCD method to the SUEP candidate. The statistical and systematic uncertainties are shown separately. (The VR is not used in the final fit.) |
png pdf |
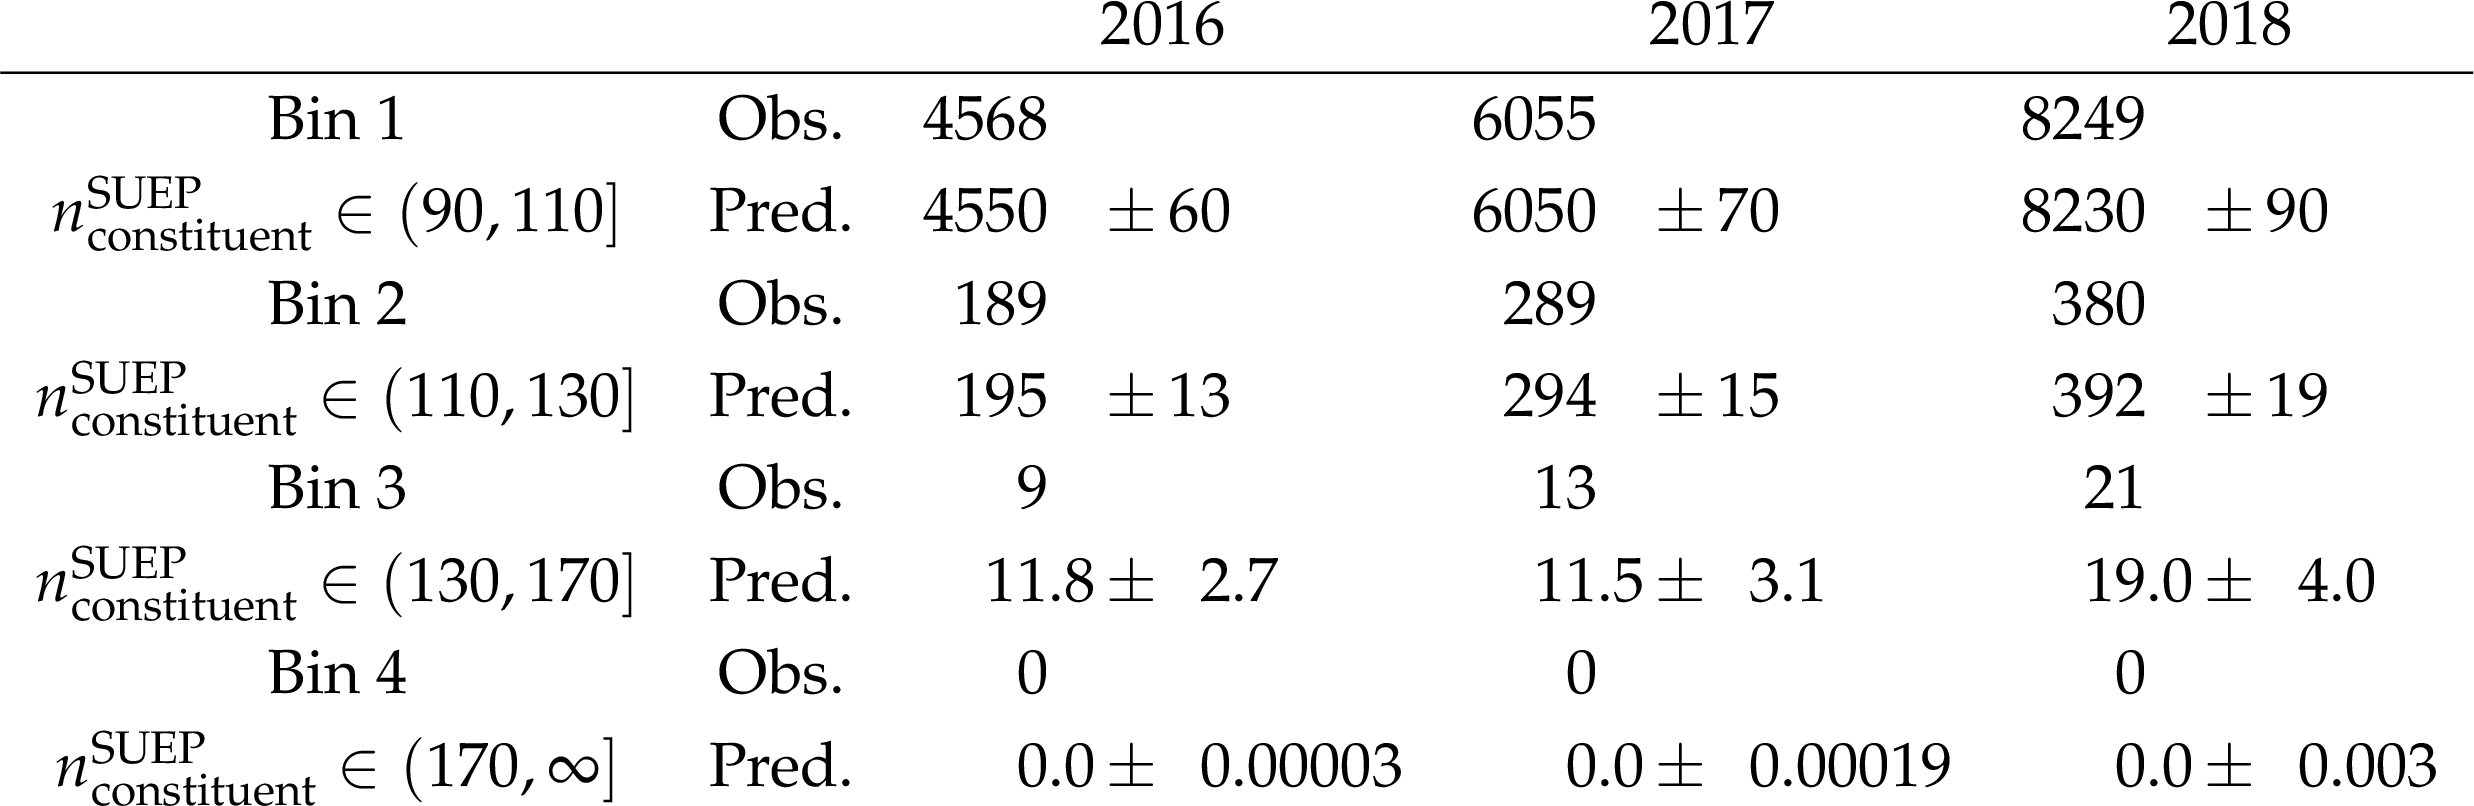
Additional Table 3:
The numbers of observed and predicted (post-fit) events for each SR bin. |
| References | ||||
| 1 | M. Cvetic, P. Langacker, and G. Shiu | Phenomenology of a three family standard like string model | PRD 66 (2002) 066004 | hep-ph/0205252 |
| 2 | Z. Chacko, H.-S. Goh, and R. Harnik | The twin Higgs: Natural electroweak breaking from mirror symmetry | PRL 96 (2006) 231802 | hep-ph/0506256 |
| 3 | T. Hur, D.-W. Jung, P. Ko, and J. Y. Lee | Electroweak symmetry breaking and cold dark matter from strongly interacting hidden sector | PLB 696 (2011) 262 | 0709.1218 |
| 4 | S. A. Abel et al. | Kinetic mixing of the photon with hidden U(1)s in string phenomenology | JHEP 07 (2008) 124 | 0803.1449 |
| 5 | Y. Bai and P. Schwaller | Scale of dark QCD | PRD 89 (2014) 063522 | 1306.4676 |
| 6 | M. J. Strassler and K. M. Zurek | Echoes of a hidden valley at hadron colliders | PLB 651 (2007) 374 | hep-ph/0604261 |
| 7 | J. Barron et al. | Unsupervised hadronic SUEP at the LHC | JHEP 12 (2021) 129 | 2107.12379 |
| 8 | S. Knapen, S. Pagan Griso, M. Papucci, and D. J. Robinson | Triggering soft bombs at the LHC | JHEP 08 (2017) 076 | 1612.00850 |
| 9 | T. Sjöstrand et al. | An introduction to PYTHIA 8.2 | Comput. Phys. Commun. 191 (2015) 159 | 1410.3012 |
| 10 | CMS Collaboration | Extraction and validation of a new set of CMS PYTHIA8 tunes from underlying-event measurements | EPJC 80 (2020) 4 | CMS-GEN-17-001 1903.12179 |
| 11 | NNPDF Collaboration | Parton distributions from high-precision collider data | EPJC 77 (2017) 663 | 1706.00428 |
| 12 | GEANT4 Collaboration | GEANT4--a simulation toolkit | NIM A 506 (2003) 250 | |
| 13 | CMS Collaboration | The CMS experiment at the CERN LHC | JINST 3 (2008) S08004 | |
| 14 | CMS Collaboration | Performance of the CMS Level-1 trigger in proton-proton collisions at $ \sqrt{s} = $ 13 TeV | JINST 15 (2020) P10017 | CMS-TRG-17-001 2006.10165 |
| 15 | CMS Collaboration | The CMS trigger system | JINST 12 (2017) P01020 | CMS-TRG-12-001 1609.02366 |
| 16 | CMS Collaboration | Electron and photon reconstruction and identification with the CMS experiment at the CERN LHC | JINST 16 (2021) P05014 | CMS-EGM-17-001 2012.06888 |
| 17 | CMS Collaboration | Performance of the CMS muon detector and muon reconstruction with proton-proton collisions at $ \sqrt{s}= $ 13 TeV | JINST 13 (2018) P06015 | CMS-MUO-16-001 1804.04528 |
| 18 | CMS Collaboration | Description and performance of track and primary-vertex reconstruction with the CMS tracker | JINST 9 (2014) P10009 | CMS-TRK-11-001 1405.6569 |
| 19 | CMS Collaboration | Particle-flow reconstruction and global event description with the CMS detector | JINST 12 (2017) P10003 | CMS-PRF-14-001 1706.04965 |
| 20 | CMS Collaboration | Technical proposal for the Phase-II upgrade of the Compact Muon Solenoid | CMS Technical Proposal CERN-LHCC-2015-010, CMS-TDR-15-02, 2015 CDS |
|
| 21 | M. Cacciari, G. P. Salam, and G. Soyez | The anti-$ k_{\mathrm{T}} $ jet clustering algorithm | JHEP 04 (2008) 063 | 0802.1189 |
| 22 | M. Cacciari, G. P. Salam, and G. Soyez | FastJet user manual | EPJC 72 (2012) 1896 | 1111.6097 |
| 23 | J. F. Donoghue, F. E. Low, and S.-Y. Pi | Tensor analysis of hadronic jets in quantum chromodynamics | PRD 20 (1979) 2759 | |
| 24 | R. K. Ellis, D. A. Ross, and A. E. Terrano | The perturbative calculation of jet structure in $ \mathrm{e}^+\mathrm{e}^- $ annihilation | NPB 178 (1981) 421 | |
| 25 | C. Cesarotti, M. Reece, and M. J. Strassler | The efficacy of event isotropy as an event shape observable | JHEP 07 (2021) 215 | 2011.06599 |
| 26 | S. Choi and H. Oh | Improved extrapolation methods of data-driven background estimations in high energy physics | EPJC 81 (2021) 643 | 1906.10831 |
| 27 | CMS Collaboration | Precision luminosity measurement in proton-proton collisions at $ \sqrt{s} = $ 13 TeV in 2015 and 2016 at CMS | EPJC 81 (2021) 800 | CMS-LUM-17-003 2104.01927 |
| 28 | CMS Collaboration | CMS luminosity measurement for the 2017 data-taking period at $ \sqrt{s} = $ 13 TeV | CMS Physics Analysis Summary, 2018 CMS-PAS-LUM-17-004 |
CMS-PAS-LUM-17-004 |
| 29 | CMS Collaboration | CMS luminosity measurement for the 2018 data-taking period at $ \sqrt{s}= $ 13 TeV | CMS Physics Analysis Summary, 2019 CMS-PAS-LUM-18-002 |
CMS-PAS-LUM-18-002 |
| 30 | CMS Collaboration | Measurement of the primary Lund jet plane density in proton-proton collisions at $ \sqrt{s}= $ 13 TeV | CMS Physics Analysis Summary, 2023 CMS-PAS-SMP-22-007 |
CMS-PAS-SMP-22-007 |
| 31 | K. Becker et al. | Precise predictions for boosted Higgs production | 2005.07762 | |
| 32 | A. L. Read | Presentation of search results: The $ \text{CL}_\text{s} $ technique | JPG 28 (2002) 2693 | |
| 33 | T. Junk | Confidence level computation for combining searches with small statistics | NIM A 434 (1999) 435 | hep-ex/9902006 |
| 34 | G. Cowan, K. Cranmer, E. Gross, and O. Vitells | Asymptotic formulae for likelihood-based tests of new physics | EPJC 71 (2011) 1554 | 1007.1727 |
|
|
Compact Muon Solenoid LHC, CERN |
|

|

|

|

|

|